clinical commissioning group governing body paper … · clinical commissioning group governing...
TRANSCRIPT
1
Clinical Commissioning Group Governing Body Paper Summary Sheet
Date of Meeting: 25 June 2013
For: PUBLIC session PRIVATE Session
For: Decision Discussion Noting
Agenda Item and title:
GOV/13/06/09 Integrated Performance Report June 2013
Author: Susannah Long, Governance & Risk Manager
Lead Director/GP from CCG:
David Noyes, Director of Planning, Performance and Corporate Services
Executive summary:
The Integrated Performance Report assesses the performance of the CCG for quality, financial management, patient access and project management. The report pulls together all available information in these areas to give a transparent and comprehensive assessment of overall CCG performance. The Integrated Performance Report for June 2013 reports using available data for April 2013 and May 2013. Appendix 1 of the report is the CCG Assurance Framework issued by NHS England. This will form the basis of the NHS England assessments of CCG performance.
Evidence in support of arguments:
The Integrated Performance Report provides a comprehensive single document for performance review.
Who has been involved/contributed:
The CCG Executive Team have been involved in the creation of this report..
Cross Reference to Strategic Objectives:
The report contributes to all strategic objectives.
Engagement and Involvement:
This Policy is an internal document and has not received further engagement or involvement at this time.
Communications Issues:
The Integrated Performance Report will be made available for all staff.
2
Financial Implications:
There are no direct financial implications.
Review arrangements:
The Integrated Performance Report will be updated on a monthly basis.
Risk Management: The report contributes to risk management arrangements.
National Policy/ Legislation:
The report incorporates the CCG Assurance Framework from NHS England.
Equality & Diversity: The policy has no negative E&D impact.
Other External Assessment:
This report would contribute to external assessments.
Next steps:

Execu
Director
Almothe bareastrateaddrGrouordearea in im Qualworkmatu The partnto becollaCareAssochan The ProjethougoutcoAs oable ensuobjec
NHS
utive Ove
r of Planning
ost 90 daysbest possibs of significegic level tess this ar
ups are wor to alleviawide Rect
mproving th
lity is firmlyk to do regauring rapidl
Communitnership wite part of a boration b
e, NHS Leaociation annge through
rigour and ect Manageght about tome and sur organisato identify
ure consistectives.
WiltshiInteg
erview
, Performanc
s after formble healthccant pressthe CCG hrea in a lonorking closeate short tetification Te delivery
y at the forarding publy.
ty Transforh Wiltshirenational Syetween Pu
adership Ad the Leadh leadersh
systematiement Offithe deliver
should enaation matuareas with
ent deliver
re Clinigrated P
Ju
ce and Corpo
mally takingcare for thesure within has led in fong term sysely with ourm performask Force of the NHS
refront of ablic/patient
rmation proe Council wystem Leaublic Health
Academy, Vdership Ceip collabor
c approachce has (so
ry of our Opble us to p
ures, alonghin that keyry of the se
1
ical Com
Performune 201
orate Service
g on our ste people of
the systemorming a Wstem wide r providers
mance showhich has
S111 Serv
all that we dengageme
ogramme cwe were readership prh England,
Virtual Stafentre, that eration and
h being driomewhat cperational
proceed on with our cy relationservice supp
mmissioance Re13
es
tatutory resf Wiltshire, m, notably Wiltshire wmanner. I
s and partnrtfalls. Els
s succeedevice.
do and strivent, althou
continues tcently suc
rogramme., National Sff College, enables ardevelopme
iven since counter intu
Plan, but tn a much firclose partnhip where port we req
oning Geport
sponsibilitiethis periodregarding ide UrgentIn the shorner CCGs sewhere, wed in workin
ve to achiegh our plan
to move ahcessful in a This is a Skills AcadLocal Goveas to creaent.
the introduuitively) cauthis is acturmer footiners in the Cwe need to
quire to ach
Group
es for delivd has seenA&E. At a
t Care forurter term, oas approp
we are chang with ou
eve; we hans in this a
head, and a bid to beground-br
demy for Svernment ate system
uction of thused us pa
ually a posing hereon. CSU, we ao focus in hieve our
vering n some a um to our riate in iring the r partner
ave some area are
in e selected eaking
Social
m wide
he ause for itive
are better order to
2
CONTENTS Title Page Chapter 1 Quality 3 Chapter 2 Finance 14 Chapter 3 Access 24 Chapter 4 Project Management 26 Appendix 1 CCG Assurance Framework 29 Appendix 2 Patient Safety & Experience Dashboard 33 Appendix 3 Safety Thermometer 34
Introduction The NHS Wiltshire Clinical Commissioning Group (CCG) Integrated Performance Report details the position of the CCG drawing on all the data available at the end of May 2013. The Report is separated into chapters reflecting performance for quality and patient safety, financial management, access to care and project management. Each chapter includes an assessment by the relevant CCG Director to identify key issues and actions. NHS England has recently issued an outline proposal and interim arrangements for a CCG Assurance Framework for 2013/14. This will be a supporting mechanism by which NHS England will periodically assess CCG performance. Our intent is to include this framework within our enduring performance management data collection regime, where available, to form part of this report; it is at Appendix 1. The information contained within the Assurance Framework will be referred to and supports the information contained within the chapters of this report. This approach supports our aspiration to “write once/read many” and ensure that we are routinely assessing our performance in a manner coherent with what external assurance authorities will focus upon.

3
Chapter 1: Quality The key quality indicators to which NHS Wiltshire CCG will be expected to adhere come from Everyone Counts: Planning for Patients 2013/14. The targets split into the following five domains. Domain 1 – Preventing people from dying prematurely Domain 2 – Enhancing quality of life for people with long term conditions Domain 3 – Helping people to recover from episodes of ill health or following injury Domain 4 – Ensuring that people have a positive experience of care Domain 5 – Treating and caring for people in a safe environment and protecting them from avoidable harm We will be reporting on the CCG Assurance Framework and on selected outcome measures as agreed in our High level strategy to demonstrate progress against our key aims http://www.wiltshireccg.nhs.uk/wp-content/uploads/2013/03/Part1-High-Level-Strategic-Plan-2012_13.pdf. The summary of performance against the CCG Assurance Framework is found in Appendix 1. Director of Quality and Patient Safety’s Risk Assessment
During April and May 2013 NHS Wiltshire CCG have had two MRSA blood stream infections assigned to the CCG as part of the Post Infection Review Process. There has been significant learning in both cases and, as an outcome, improvements in care. The Governing Body need to be aware that this will have an impact on our ability to achieve our Quality Premium in 2013/14. The Safety Thermometer is now in its second year. Appendix 3 shows the performance for April 2013, the May data not being available at the time of writing this report. There is an upward trend with reported pressure ulcers which could, in part, be attributed to the one day snapshot methodology. Data might include undiagnosed moisture lesions which are not pressure ulcers. We are monitoring the harm free care data with all providers and starting to include grade 1 pressure ulcers. We are working closely with the Commissioning Support Unit to develop our complaints management and reporting. A Complaints Management Report is separately being presented to the Governing Body in June 2013.

4
Purpose The Quality and Patient Safety Outcomes section of this report includes highlights from National and Local publications and hotspots from our providers raised in the Clinical Quality Review Group meetings (by exception). We will be reporting on selected outcome measures as agreed in our High Level Strategy to demonstrate progress against our key aims http://www.wiltshireccg.nhs.uk/wp-content/uploads/2013/03/Part1-High-Level-Strategic-Plan-2012_13.pdf . Content:
Section 1 :Patient Story Section 2: Highlights Section 3: Hotspots Section 4: Contributors Appendix 1: CCG Assurance Framework Appendix 2: Patient Safety & Experience Dashboard Appendix 3: Safety Thermometer
1. Patient Story The Governing Body will receive a verbal case study. 2. Highlights The highlights section includes national and local publications of importance and specific actions locally, which are nationally led. In this month the areas identified are:
a) CCG Assurance Framework ( section 2.1) b) MRSA Post Infection Review (section 2.2) c) Patient Safety Thermometer ( section 2.3) d) Guide to good handling of complaints ( section 2.4) e) Enabling data flows for commissioning ( section 2.5) f) CQUINS (section 2.6) g) Quality & Clinical Governance Committee (section 2.7)
2.1 CCG Assurance Framework On 7 May NHS England published proposals for the CCG Assurance Framework 2013/14. These draft proposals cover the interim arrangements for assurance in Q1 and Q2, and an outline of what elements of assurance will be covered on an annual basis. The framework is aimed to help NHS England, patients and the public identify how well clinical commissioning groups are performing in their role as the commissioners of local health services. The publication of the interim framework starts an engagement process with CCG staff, patient groups and other key stakeholders which will inform a final framework to be published in the autumn. Appendix 1 shows the Framework.

5
Action The Assurance Framework will be updated each month and included in the
integrated Governing Body report. Wiltshire CCG needs to confirm the engagement process with staff and
patient groups. Presentation at the next Stakeholders event in September (date to be
confirmed). 2.2 Health Care Acquired Infection NHS England planning guidance for 2013/14, Everyone counts: Planning for patients 2013/14, sets a zero tolerance approach to MRSA bloodstream infections. This means that each organisation is expected to achieve zero MRSA bloodstream infections. The NHS planning guidance explains that in the case of an MRSA bloodstream infection, a post infection review will identify why an infection occurred and how future cases can be avoided. The Post Infection Review Guidance has now been published to help organisations conduct such reviews. The year end MRSA and Clostridium difficile infection data for 2012 – 13 is shown in the table below along with the targets and year to date performance for 2013-14. The table shows the results per provider. Table 1 MRSA bacteraemia and Clostridium dDifficile infection (CDI) trajectory and actual 2013-14 compared with 2012-13. Provider MRSA
12‐13
Plan
MRSA
12 ‐13
actual
CDI 12 – 13 Plan
CDI 12 ‐13
actual
MRSA
13‐14
Plan
MRSA Actual YTD
CDI 13‐14 Plan
CDI Actual YTD
Salisbury 1 3 25 25 0 0 21 1
GWH* 2 1 21 34* 0 1 20 1
RUH 1 3 31 41 0 0 29 4
Wiltshire CCG
9 7 139 155 0 2 127
NHS Wiltshire CCG monitors provider performance of MRSA bacteraemia and Clostridium difficile on a monthly basis, we also monitor MSSA and E. coli ( see table 2 below).

6
Table 2 April 2013 performance.
April (May 2013 not yet available )
Trust
MRSA non acute
MRSA acute apportioned
CDI non acute apportioned
CDI acute apportioned
MSSA non acute apportioned
MSSA acute apportioned
E coli - non apportioned
RUH 2 0 13 4 4 0 16
SFT 0 0 2 1 2 0 2 GWH 2 1 3 1 2 0 8
Action
A meeting with the RUH on 17 June 2013 to understand the MRSA apportioned case to Wiltshire CCG in April 2013 and further learning.
Further understanding of the MRSA case in a Wiltshire Care home in May 2013 will be reviewed jointly with Wiltshire Public Health Team.
Establish Monthly meetings with Wiltshire Public Health to ensure learning and planning in supporting the C.diff objectives for 2013/14.
2.3 Patient Safety Thermometer Participation in data collection using the NHS Safety Thermometer is an important preparatory step for NHS-funded provider organisations in reducing harm. Use of the NHS Safety Thermometer will establish a national baseline of performance on the four harms and provide information on the range of performance. These harms are:
Falls UTIs in patients with catheters VTE Pressure ulcers.
The Harm Free Care programme produces organisational level report that allows assessment of the main drivers of harm in an organisation and a breakdown of the mix of harms that affect patients with multiple harms. Royal United Hospital Bath NHS Trust (RUH), Great Western Hospital FT (GWHFT) and Salisbury NHS FT all participate in this national exercise. Data concerning the four harms is collected on one day every month. Appendix 3 shows the Safety Thermometer data provided by provider. In addition Avon Wiltshire Partnership Mental Health Trust are taking part in the National Pilot for Safe Care, Like all other care sectors, mental health has its share of harmful events which could, or should, have been avoided. Everyone involved in providing mental health services can help to reduce harm and improve patient safety. The vulnerable nature of many service users means mental health staff can play a particularly active and important role in safeguarding and improving safety. The Safe Care Pilot will monitor Medication, Omissions and Delays, Self-Harm, Violence and Aggression, Slip Trips and Falls.

7
Action Quarterly review of Safety Thermometer data will be incorporated into the
Quality Contract meetings with each provider, the Safety Thermometer is also a National CQUIN for 2013/14.
The Mental Health Safe Care Pilot will be reviewed at both the local and regional Clinical Quality Review Meetings.
Acute trust will have a further CQUIN trajectory for 50% reduction of grade 2, 3 and 4 pressure ulcers for 2013/14, during the year we anticipate trajectory will be reviewed for Falls, VTE and CAUTI.
2.4 Guide to good handling of complaints During transition many CCGs asked for support and advice on handling complaints. In response NHS England has worked in partnership with the Health Service Ombudsman, and with input from CCGs, to develop a Guide to good handling of complaints. This final part of support to CCGs as they set up, has now concluded and NHS England has this week published a guide to support CCGs to develop good processes for handling of and responding to complaints. Ensuring good handling of complaints and learning from them are ways in which CCGs can improve quality for their patients. All NHS organisations, including CCGs, need to comply with the 2009 complaints regulations. ‘Guide to good handling of complaints for CCGs’ provides advice and top tips to CCGs on responding to complaints about the services they commission on behalf of their populations, or about the exercise of any of their own functions. It is intended as a helpful guide to good practice and will help CCGs to ensure they comply with the legal requirements of the 2009 complaints regulations. The document also highlights the importance of monitoring trends and learning from complaints and makes suggestions for CCGs on how to do this. For further information and to Download the Guide from the CCG Resources page of the NHS England website. Action
On the 6 and 13 June 2013 we have planned a short presentations to the GP learning event, to share the update guidance and primary care complaints management process post April 2013.
NHS Wiltshire are working with Central Southern CSU to develop a reporting structure for complaints management, reflecting the good handling guidance.
An agreed matrix of responsibility and complaints management be confirmed.
8
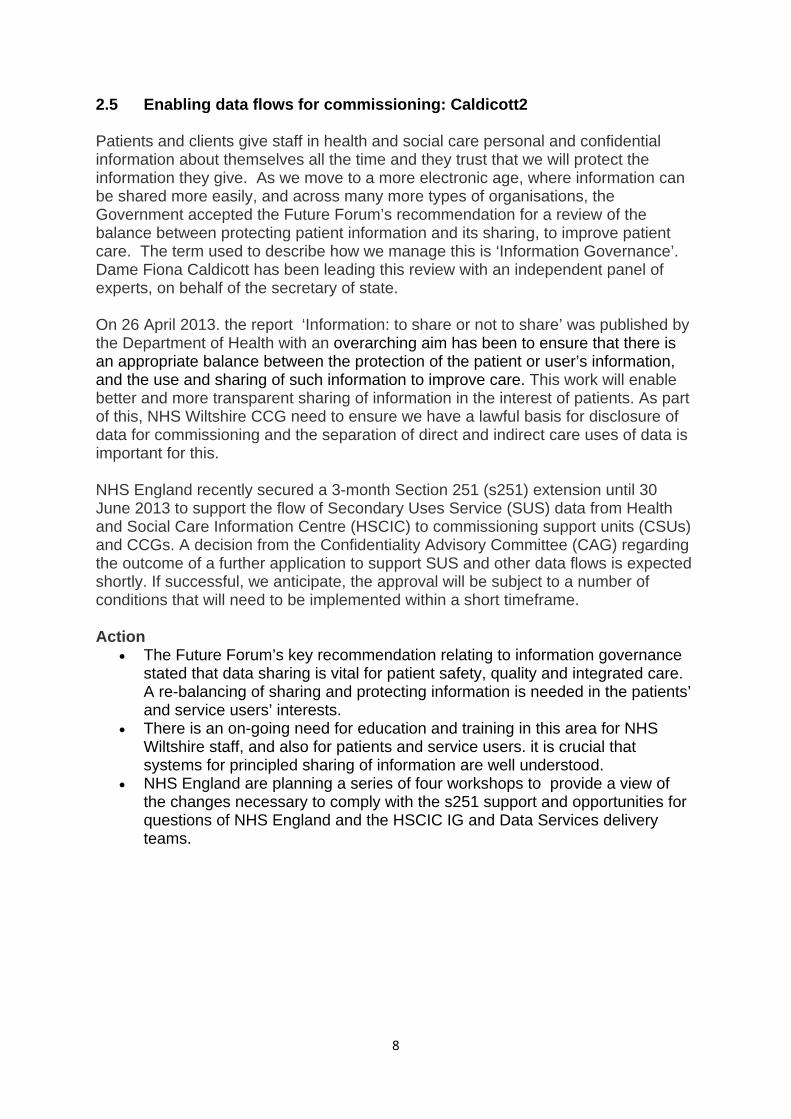
2.5 Enabling data flows for commissioning: Caldicott2 Patients and clients give staff in health and social care personal and confidential information about themselves all the time and they trust that we will protect the information they give. As we move to a more electronic age, where information can be shared more easily, and across many more types of organisations, the Government accepted the Future Forum’s recommendation for a review of the balance between protecting patient information and its sharing, to improve patient care. The term used to describe how we manage this is ‘Information Governance’. Dame Fiona Caldicott has been leading this review with an independent panel of experts, on behalf of the secretary of state. On 26 April 2013. the report ‘Information: to share or not to share’ was published by the Department of Health with an overarching aim has been to ensure that there is an appropriate balance between the protection of the patient or user’s information, and the use and sharing of such information to improve care. This work will enable better and more transparent sharing of information in the interest of patients. As part of this, NHS Wiltshire CCG need to ensure we have a lawful basis for disclosure of data for commissioning and the separation of direct and indirect care uses of data is important for this. NHS England recently secured a 3-month Section 251 (s251) extension until 30 June 2013 to support the flow of Secondary Uses Service (SUS) data from Health and Social Care Information Centre (HSCIC) to commissioning support units (CSUs) and CCGs. A decision from the Confidentiality Advisory Committee (CAG) regarding the outcome of a further application to support SUS and other data flows is expected shortly. If successful, we anticipate, the approval will be subject to a number of conditions that will need to be implemented within a short timeframe. Action
The Future Forum’s key recommendation relating to information governance stated that data sharing is vital for patient safety, quality and integrated care. A re-balancing of sharing and protecting information is needed in the patients’ and service users’ interests.
There is an on-going need for education and training in this area for NHS Wiltshire staff, and also for patients and service users. it is crucial that systems for principled sharing of information are well understood.
NHS England are planning a series of four workshops to provide a view of the changes necessary to comply with the s251 support and opportunities for questions of NHS England and the HSCIC IG and Data Services delivery teams.

9
2.6 Commissioning for Quality and Innovation (CQUIN) The CQUIN payment framework enables commissioners to reward excellence, by linking a percentage of providers’ income to the achievement of quality improvement goals. The guidance on the national CQUIN goals for 2012/13 set out in the NHS Operating Framework for 2012/13 and linked 2.5% of the providers’ outturn to CQUINS, there were four nationally mandated CQUIN goals for 2012/13 plus recommendations from the NHS South of England Operating Plan. The table below highlights the achievement of 2012/ 2013 Commissioning for Quality and Innovations for NHS Wiltshire providers. Table 3: CQUIN achievement
Name of organisation % CQUIN achievement
2012/13 Salisbury Foundation Trust 99% Great Western Community ( adults) 83%
Great Western Maternity
86% Great Western Hospital 71% Royal United Hospital 65% GWAS 100% AWP 70%
CQUIN for 2013/14 continue to be set at a level of 2.5 per cent value for all healthcare services commissioned through the NHS Standard Contract. One fifth of this value (0.5 per cent of overall contract value) is to be linked to the national CQUIN goals, where these apply. The full year financial value of a CQUIN scheme will be calculated as a percentage of the full year value for all healthcare services commissioned through the NHS Standard Contract. Providers will only be paid where they have achieved the agreed CQUIN goals. CQUIN monies remain non-recurrent.
Innovation Health and Wealth, Accelerating Adoption and Diffusion in the NHS1 set
out that from April 2013 compliance with high impact innovations would become a prequalification requirement for CQUIN. By 31 March 2013, providers have put in place measures to meet the criteria set out in order to qualify for the release of any 2013/14 CQUIN funding. Whilst the minimum requirements for providers are set nationally, providers have worked with commissioners to ensure that plans are aligned with local commissioning strategies. For further information on the prequalification criteria: https://www.supply2health.nhs.uk/eContracts/Documents/cquin-guidance.pdf

10
There are four national CQUIN goals for 2013/14, which are: Friends and Family Test – where commissioners will be empowered to
incentivise high performing Trusts; improvement against the NHS Safety Thermometer (excluding VTE),
particularly pressure sores; improving dementia care, including sustained improvement in Finding people
with dementia, Assessing and Investigating their symptoms and Referring for support (FAIR); and
Venous thromboembolism (VTE) – 95 per cent of patients being risk assessed and achievement of a locally agreed goal for the number of VTE admissions that are reviewed through root cause analysis.
In addition to the four National CQUINs, NHS Wiltshire have agreed four local CQUINS in all our contracts, they include:
Reduction in Non elective admissions ( an Integrated community acute trust
CQUIN); Increase Functional Movement in hospital for elderly care patients To
improve the quality of care for elderly patients by reducing functional decline whilst in hospital through increased mobilisation;
Improved same day and appointments within 48 hrs for GP referrals; To improve the support of vulnerable families through monthly liaison
meetings between community midwives and health visitors during the antenatal period and timely written discharge in the postnatal period.
Action
All the 2013/14 CQUINS have now been agreed with Providers, the next step is the performance management. We have developed a framework for the monitoring which has been shared with providers the first quarter’s data will be shared in August 2013.
2.7 Quality and Clinical Governance Committee The Inaugural meeting of the NHS Wiltshire CCG Quality and Clinical Governance Committee was held on 7 May 2013 at Southgate House, Devizes. The Chair, Mary Monnington, Registered Nurse for NHS Wiltshire CCG Governing Body reinforced the development work for the committee and the responsibility to strengthen Quality & Patient Safety performance management for NHS Wiltshire CCG. The minutes of the meeting will be shared after they have been approved at the next meeting on the 2 July 2013.

11
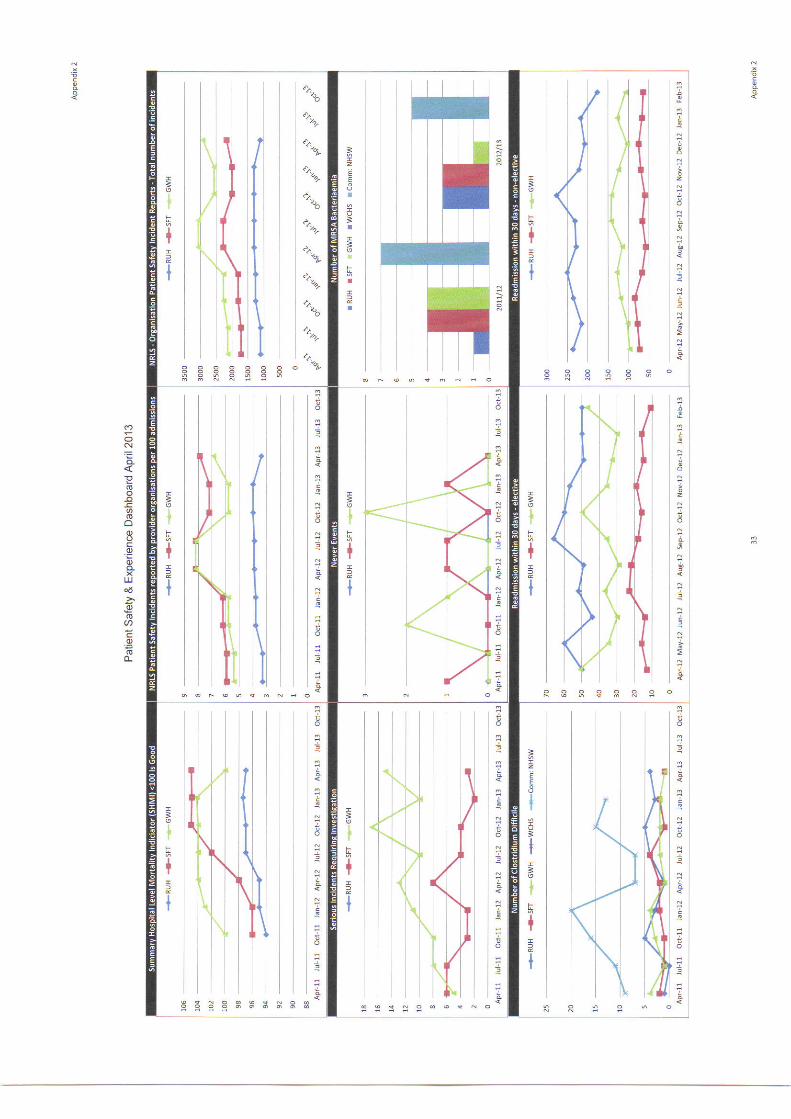
3 Hotspots from Clinical Quality Review Groups
The quality reports from providers are reviewed at Clinical Quality Review Meetings (CQRM) and form the basis of the hotspots report. This section reports by provider, in addition 10 key quality indicators have been selected to monitor during the year to identify the trends relating to improvements and challenges for patient safety and patient experience. Appendix 2 shows the quality and patient safety indicators which are monitored. This information has been taken from the provider Patient Safety and Quality Dashboards.
SARUM Group Lead 3.1 SFT
Staff vacancy rate 8% trust target less than10% TIA performance 100% Dementia Audit of Patients aged 75+ Performance in diagnostic assessment
actual 80% target 90% Named midwife for safeguarding
WWYKD Lead 3.2 RUH
Stroke patients spending 90% of their time on a stroke unit March (one month lag) 44.2% (80%)
TIA treated within 24 hours 31.6% (target 60%) Cancelled Operations 4.2% (target <1%) Cancelled operations not rebooked within 28 days 33.9% (target
<5%) CDiff 4 cases in April against a trajectory of 2 Falls assessment within 24 hours 90% (target 100%) VTE: Percentage of patients who require prophylaxis are given it
75.05% (target 100%) Number of medical outliers 23 (target <10) Outpatient wait in weeks average for surgery 6.21 (target <4.7)
3.3 AWP
Delayed Transfers of Care Target 7.6% Actual 9.6%& No. of Crisis Resolution Home Treatment episodes (cumulative) target 606 actual 524 Median length of stay (days) target 54 Actual 70
% of carers with an assessed need who have a care plan within 4 weeks of assessment Target 98% actual 91%
% of service user review within 4 weeks target 98% actual 88% 3.4 GWAS No data quality meeting planned 25 June 2013

12
NEW Lead 3.5.1 GWH acute
Emergency readmissions rate within 30 days of discharge (target <7.1%). This indicator has constantly underperformed this contract year
Stroke patients spending 90% of time on stroke unit and % high risk of stroke who experience a TIA are assessed and treated within 24 hrs (targets >80% & > 60%). Both indicators have missed target for the majority of the year
% Ambulance handover within 20 minutes (target >95%). For the first time this year this indicator has underachieved at 93.6%
Inpatient discharge summaries to be with GPs within 1 working day of discharge – EDS reports’ (target 95%). The target has not been achieved all year and YTD the trust are reporting 63.5%
3.5.2 GWH Community Please see below for M12 GWH Community hotspot review. This has been taken from the PSQ Dashboard attached at Appendix 2.
93W ‘Average LoS’ (target <17 days). M12 data shows an average LoS of 23.9 days. This is slightly higher than the YTD at 23.5 days
95W ‘Increase the total number of people who are discharged from a community hospital to their original residence’ (target >75%) M12 data shows an improvement from the previous 2 months at 78%. This is higher than the YTD of 76.4%
105W ‘CHC 1st review seen within week 12’ (target >90%). M12 information shows a record of 75%. Although below the target this exceeds the YTD figure at 50%
138W ‘Health Visitor Numbers’ (target 67.2 wte). This indictor continues to fall under target at 62.36 wte for M12. In addition, if the 1.8 wte named nurse is included, this indicator is still below target of 64.16
3.5.3 Maternity (Wilts specific) M11 update for Wiltshire patients: 90% of mothers booked <12 completed weeks (target 90.4%). YTD this
indicator has reached 91.5%, however M11 falls below target at 89.8% Normal births as a percentage of all births (target 77%). M11 is at 68.5%, this
is higher than the YTD average of 66.2% C-sections as a percentage of total births (target 23%). M11 is at 19.1%, with
the YTD hitting 19.5% % of mothers recorded as smoking at the time of delivery (target 12%). M11
is at 13.1%, lower than the YTD of 13.4% % of relevant mothers initiating breastfeeding (target 83%). M11 failed to
reach target at 77.8% Interestingly, an indicator that does not have a target but thought I would
highlight as a point of note: ‘100% of women having elective c-sections and high risk cases to be screened for MRSA’ M11 data is at 86.7%

13
4 Contributors Thanks are noted to the following colleagues for contributions to this report:
• Public Health Infection Control NHS Wiltshire; • Information Team NHS Wiltshire • Information Team CSU

14
Chapter 2: Finance The key indicators for NHS Wiltshire CCG for Financial Management are drawn from the NHS Operating Framework as follows:
Achievement of a 1% surplus Achievement of the CCG Cash limit Payment of invoices within 30 days Achievement of the Notified Capital Resource Limit
The summary of performance against the CCG Assurance Framework is found in Appendix 1. Chief Financial Officer’s Risk Assessment
NHS Wiltshire CCG is planning on delivering a surplus of £5.0m against an anticipated resource limit of £519.1m in 2013/14. At the end of May 2013 the CCG is reporting a year to date surplus of £0.8m which is in line with plan. To support the delivery of this financial position an in year QIPP programme of £9.3m has been developed with engagement by each group. This will be monitored through the year in partnership with the groups and the project management office to ensure delivery against target and to identify mitigating actions. Further work is required with NHS providers to develop the informatics flows in response to the new NHS commissioning architecture to ensure and with the Area Team to finalise the impact of any baseline funding changes. Emerging financial pressures will need to be mitigated through a combination of application of contingent reserves, identifying additional QIPP schemes and through a review of planned investment commitments.

15
NHS Wiltshire CCG (WCCG) has planned to deliver a surplus of £5.0m against an anticipated revenue resource limit of £519.1m. Annex 1 shows the summary income and expenditure position for year at month 2. The income and expenditure year to date position at the 31st May 2013 is a surplus of £0.8m – this is in line with the planned surplus position of £5.0m. Table 4 below outlines the summary position at month 2:
Year to date / £'m
Resources Expenditure Variance
Programme 82.32 81.48 ‐0.84
Running costs 1.83 1.83 0.00
84.15 83.31 ‐0.84
Forecast outturn / £'m
Resources Expenditure Variance
Programme 507.40 502.36 ‐5.04
Running costs 11.66 11.66 0.00
519.06 514.02 ‐5.04
The CCG is currently forecasting operating within its cash limit. At month 2 there has been a lower than plan drawdown against the anticipated cash limit – this in respect to the timing impact of the prescribing cash adjustments which have yet to be notified.
The residual cash balance (£8.5m) represents cash contingencies in quarter one of the CCG’s establishment to ensure that funding is available to pay service providers.
At the end of May 2013 the CCG is showing year to date achievement against its better payment performance target for both NHS and non NHS suppliers, both by value and number of invoices.
The CCG’s summary statement of financial position, cash position and better payment practice performance can be found within the annexes 2, 3 and 4 respectively.
Resource limit and budget updates
At the request of NHS England WCCG has recently included reductions to its anticipated revenue resource limit in respect of:
£'m
Capital grants ‐4.50
Health and social care funding ‐6.53
Specialist Commissioning ‐3.54
‐14.57

16
CCGs have been asked to remove anticipated capital grant funding whilst the Department of Health (DoH) clarifies the funding regime and overall level of funds available. WCCG has recently been notified that capital funding will be made available; however this is not currently confirmed as an anticipated allocation.
The anticipated allocation for health and social care funding, which is passed to Wiltshire County Council, has been removed from the CCG resource limit whilst the DoH finalises the funding route which may involve a direct transfer of funds to the Council.
NHS England has requested that CCGs include an adjustment to their resources for the updated impact of specialised services transfers. For WCCG this equates to a reduction in resources of £3.5m which covers both minimum and maximum take transfers. WCCG has raised concerns with NHS England over this adjustment as the minimum take element of this adjustment relates to a reduction in CCG resources which were not included in the calculation of CCG allocations. It is estimated that this will result in a cost pressure of c£1.6m to WCCG.
Annex 5 outlines the summary movements to the CCG budgets in respect of these adjustments and following updates to reflect contract values.
Wiltshire CCG financial performance by providers
The month 2 reported financial position represents the first month of receiving information from providers following the NHS architecture changes. Further work is required by providers to develop the information received by WCCG to ensure that it accurately reflects our new commissioning responsibilities – at this time no major outturn and activity issues are reported.
At the end of month 2 the CCG is forecasting operating within its running cost allowance.
Highlighted below are the key variances within individual commissioned service areas at month 2 along with any mitigating actions identified.
Provider / Commissioned service area
Ytd / £'m FOT variance / £'mResource Expenditure Variance
LD 0.3 0.4 0.1 0.1
SPP 0.4 0.5 0.1 0.2
S117 0.3 0.3 0.0 0.2
TOTAL 1.0 1.2 0.2 0.5
Learning Disabilities ‐ two short term placements have been extended. A discharge plan is in place for one of these and assessments are underway to allow this to take place. Specialist Placements Panel ‐ currently forecasting full year costs for a new placement until the outcome of a tribunal, scheduled in June, to decide if care can transfer to the community.

17
S117 ‐ new patients and an increase in the cost of placements brokered on behalf of the CCG by Wiltshire Council are contributing to this FOT overspend. Placement recharges to be shared between the CCG and Council on a regular basis to ensure costs are closely monitored.
Provider / Commissioned service area
Ytd / £'m FOT variance / £'mResource Expenditure Variance
Out of Hours 1.16 1.24 0.08 0.00
A year to date overspend is reported in respect of additional charges raised to the CCG by Wiltshire Medical services to WCCG to support the implementation of NHS 111. A full year breakeven position is forecast based on the assumption that these additional costs are rechargeable to Harmoni, the provider of NHS 111 services for WCCG.
Financial risks
As outlined above information that has been received from providers requires additional analysis to support financial positions. There is a risk to the CCG that delays in receiving robust information for the new NHS architecture arrangements may mask any underlying activity issues and delay any CCG response. In future reports, activity will be shown as part of the CCG Assurance Framework at Appendix 1.
WCCG has planned to deliver a QIPP programme in 2013/14 which will lead to service redesign savings of £9.3m, with recurrent benefits of £11.8m. Underachievement against this programme will require the application of contingent reserves and a review of additional measures including moving further faster with other QIPP schemes.
Further work is being undertaken with the Local Area Team in respect to identifying and resolving outstanding baseline funding issues – the impact on these to the CCG is still to be finalised.
Annexes
‐ Annex 1 summary I&E position ‐ Annex 2 balance sheet position ‐ Annex 3 cash position ‐ Annex 4 better payment practice code position ‐ Annex 5 movement between budgets and resources

18
Annex 1 - summary I&E position at month 2 2013/14
£'m £'m
Ytd Annual budget
FOT variance Budget Actual Variance
Acute care 41.55 41.58 0.03 249.31 0.00
Exceptions 0.04 0.04 0.00 0.25 0.00
Non acute care 20.42 20.71 0.29 122.49 0.00
Other commissioning 4.33 4.18 ‐0.14 25.95 0.54
66.33 66.52 0.18 398.00 0.54
Out of hours 1.16 1.24 0.08 6.97 0.00
Local enhanced services 0.50 0.49 ‐0.01 6.68 0.00
Prescribing 11.38 11.38 0.00 69.53 0.00
13.04 13.11 0.07 83.18 0.00
Running costs 1.83 1.83 0.00 11.66 0.00
Uncommitted headroom 0.00 0.00 0.00 10.07 0.00
Surplus 0.84 0.00 ‐0.84 5.04 ‐5.04
Contingency 0.40 0.00 ‐0.40 2.52 ‐0.54
Earmarked reserves 1.71 1.85 0.14 8.59 0.00
2.94 1.85 ‐1.09 26.21 ‐5.57
CCG total 84.15 83.31 ‐0.84 519.06 ‐5.04

19
Annex 2 - balance sheet position at month 2 2013/14
SUMMARY Statement of Financial Position
£'m
Opening position at
1st April 2013
Current position at 31st May
2013
Forecast position at 31st March
2013
Non Current Assets:
Premises, Plant, Fixtures & Fittings
IM&T
Other
Long‐term Receivables
TOTAL Non Current Assets 0.00 0.00 0.00
Current Assets:
Inventories
Trade and Other Receivables 8.83 4.00
Cash and Cash Equivalents 5.04 0.05
TOTAL Current Assets 0.00 13.86 4.05
TOTAL ASSETS 0.00 13.86 4.05
Non Current Liabilities:
Long‐term payables
Provisions
Borrowings
TOTAL Non Current Liabilities 0.00 0.00 0.00
Current Liabilities:
Trade and Other Payables 24.86 14.88
Other Liabilities
Provisions
Borrowings
Total Current Liabilities 0.00 24.86 14.88
TOTAL LIABILITIES 0.00 24.86 14.88
ASSETS LESS LIABILITIES (Total Assets Employed) 0.00 ‐10.99 ‐10.83

20
Annex 3 – cash position at month 2 2013/14
£'m
Year to date FOT
Assumed revenue resource limit / £'m 87.00 519.06
Assumed revenue cash limit / £'m 86.00 514.02
Cash drawn down / £'m 74.00 514.02
Cash drawn down as % 14.40% 100.00%
Expected cash draw down as % 16.67% 100.00%
Cash utilised / £'m 65.48 514.02
Balance in account / £'m 8.53 0.05
Balance in account as % of cash limit 1.66% 0.01%

21
Annex 4 – Better payment practice code position at month 2 2013/14
Performance vs 30 days BPP
Month YTD
Nos. £'m Nos. £'m
NHS
Total bills paid 37 25.13 44 25.13
Total bills paid within time 37 25.13 44 25.13
% of bills paid within target 100.0% 100.0% 100.0% 100.0%
Non‐NHS
Total bills paid 456 4.72 465 2.68
Total bills paid within time 453 4.72 462 2.67
% of bills paid within target 99.3% 100.0% 99.4% 99.7%
ALL
Total bills paid 493 29.85 509 27.81
Total bills paid within time 490 29.85 506 27.80
% of bills paid within target 99.4% 100.0% 99.4% 100.0%
98.00%
98.50%
99.00%
99.50%
100.00%
Apr May Jun Jul Aug Sep Oct Nov Dec Jan Feb Mar
BPP Performance by value
NHS Non NHS
98.50%
99.00%
99.50%
100.00%
Apr May Jun Jul Aug Sep Oct Nov Dec Jan Feb Mar
BPP Performance by volume
NHS Non NHS

22
Annex 5 – movements between budgets and resources
£'m Comment
£'m Comment
Budget setting
M1 update Movement M2 update
Movement from M1
Acute care 248.50 248.50 0.00 249.31 0.81
Net Impact of SCG movements ‐ some adjustments already accounted for within earmarked reserves at M1. Includes impact of contract updates
Exceptions 0.25 0.25 0.00 0.25 0.00
Non acute care 138.62 134.13 ‐4.49
Removal of funding above requirements and developments not yet commenced vs reserves
122.80 ‐11.33Removal of capital grant funding, health and social care funding and contract updates
Other commissioning
25.64 25.64 0.00 25.64 0.00
413.01 408.52 ‐4.49 398.00 ‐10.52
Out of hours 6.86 6.97 0.11Inclusion of OOHs prescribing
6.97 0.00
Local enhanced services
6.68 6.68 0.00 6.68 0.00
Prescribing 69.64 69.53 ‐0.11Movement of OOHs prescribing
69.53 0.00
83.18 83.18 0.00 83.18 0.00 Running costs 11.66 11.66 0.00 11.66 0.00 0.00 Uncommitted headroom
10.07 10.07 0.00 10.07 0.00
Surplus 5.04 5.04 0.00 5.04 0.00
23
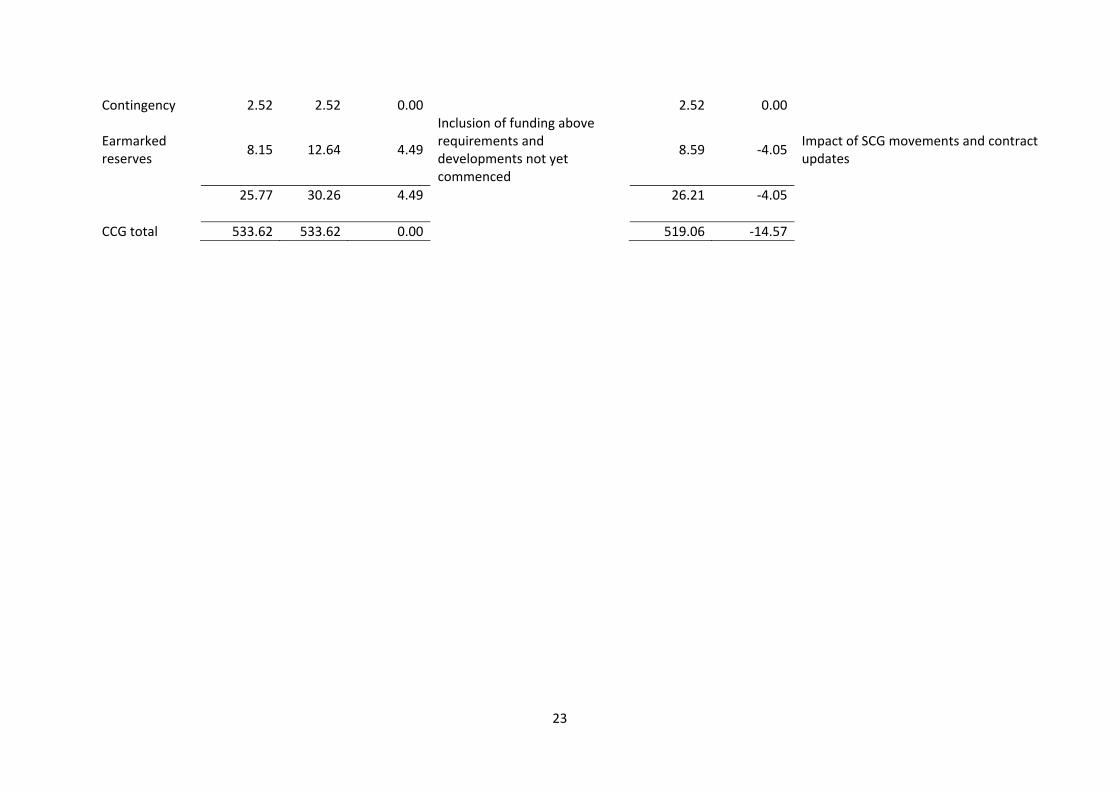
Contingency 2.52 2.52 0.00 2.52 0.00
Earmarked reserves
8.15 12.64 4.49
Inclusion of funding above requirements and developments not yet commenced
8.59 ‐4.05Impact of SCG movements and contract updates
25.77 30.26 4.49 26.21 ‐4.05
CCG total 533.62 533.62 0.00 519.06 ‐14.57
24
Chapter 3: Access NHS Wiltshire CCG has identified three local priorities and associated targets to be monitored by NHS England. These priorities are:
Impact of Care Coordination – number of non-elective spells avoided Delivery of Primary Care Dementia Service – number of primary care
dementia diagnosis Decrease in average length of stay for non-elective admission patients –
average length of stay Director of Planning, Performance and Corporate Services’ Risk Assessment:
Activity Date Reported Provider performance data does not currently reflect the new commissioning landscape. The information has included data relating to Specialist and Area Team commissioned activity. The CCG Finance and Information teams are working with the Commissioning Support Unit and Providers to split activity data for future reports. This data would be detailed in part of the CCG Assurance Framework document but it has been decided not to report for this report against a number of measures as this would provide a miss-leading picture of performance. Providers are likely to be able to back-populate early year reporting in the coming months.
After a difficult start of the year in A&E, we have seen improvement in waiting times at both RUH and SFT. However, we remain concerned about the achievement at GWH, which in conjunction with a larger than expected number of handover delays from Ambulance to A&E, has prompted us to engage with GWH, in partnership with Swindon CCG, and develop an A&E improvement plan. This dialogue has included interaction with the Clinical Director and General Manager. Furthermore, a joint workshop is planned for July to look at further developing a facilitated discharge model (to clear bed spaces and improve flow rates through the hospital), and GWH are examining the lessons identified during the successful RUK Spring to Green evolution to see what practice they might adopt.
It is also noteworthy that SWAST are below target for responding to Cat A calls within 8 minutes across their region, and that the performance in Wiltshire is below the regional average.

25
NHS Constitution Accident and Emergency Departments (A&E) have been extremely busy during this period with particularly high attendance numbers in the first half of April 2013. This has led to deterioration in A&E access with the 4 hour standard being breached at all three CCG commissioned acute providers. The situation has improved especially at Royal United Hospitals, Bath and Salisbury Foundation Trust. The Ambulance service has seen increased patient numbers that has led to poorer access rates. NHS Outcomes Framework Many of the data items included in the CCG Assurance Framework are only available on an annual basis. The Assurance Framework report, attached at Appendix 1, focuses on data reported during last financial year. It has been noted that there are some pressures seen in hospital infection rates.

26
Chapter 4: Project Management NHS Wiltshire CCG has identified initiatives in the CCG Operating Plan. The initiatives have been developed into projects by the CCG Locality Groups who are responsible for the delivery of target outputs. The Programme Management Office (PMO) tracks progress of delivery through meetings with project managers and escalates any concerns through the project governance structure which includes the Project Governance Group, the Clinical Executive meeting and the Governing Body. All new initiatives will require agreement on clear outputs that must be delivered in order that progress can be monitored and successful delivery evidenced. In future reports detailed performance against project delivery will be shown as an Annex to this chapter. Director of Planning, Performance and Corporate Services’ Risk Assessment:
We are not quite where we would want to be at this stage in terms of the execution of our Operational Plan following some further discussion regarding the overall allocation and profiling of QIPP targets. Furthermore, the implementation of projects and plans has not been possible to achieve in line with the originally envisaged timelines due to some further debate regarding the direction of travel, which was required as the introduction of greater rigour delivered by the PMO brought more clarity to the likely outcomes. The allocations and profiling have now been re-cast and agreed; our next step is to drill down into the detail of what each project will be able to deliver in order to provide us with the transparency we require to implement the Operational Plan. This work is on-going across the Groups. The project management framework and stewardship of the PMO should enable us to close with this issue in short order.

27
The Programme Management Office (PMO) was launched in April and has been active in supporting Project Managers in Groups to produce project plans. Project plans, using the PMO templates, are in the final stages of development for the delivery of:
Care Co-ordination – all Groups lead by NEW Risk Stratification – all Groups Wiltshire Discharge Team at the RUH – WWYKD only
These early priority projects will contribute to the reduction in unplanned care activity that forms part of the Operational Plan. The 2013/14 Operational Plan was developed at the time the CCG was focused on Authorisation in December 2012. It was agreed by the Governing Body in February 2013 and was used to inform the QIPP submissions required by NHS England in early 2013. The table below sets out the QIPP target and the profiling for the CCG. The majority of QIPP savings for which Groups are responsible are profiled to be delivered from Q2.
The amounts identified are calculated according to the providers for which each Group has responsibility and span the areas of Planned Care, Unplanned Care and Mental Health. To ensure delivery of QIPP, other projects identified across the Groups from the Operating Plan will be prioritised to receive attention from the Project Managers with support from the PMO. The Programme Governance Group will meet for the first time on 19 June and will identify not just the priorities but also the project sponsors who will lead the work required which delivers the desired outcomes. The intention is that the Governing Body receives a project register with a RAG rating describing the status of each project that is being monitored through the PMO. There has been significant learning from the experience of operating a PMO across the organisation and the three project areas identified above. This has led to revisions to templates and the approach taken to the production of project plans. To fully reap the benefit of having a PMO there is also a real need to recognise and adopt disciplines whereby there is clarity on agreed outcomes to support implementation.
Group April May June July August Sept. Oct. Nov. Dec. Jan. Feb. March TOTAL
All 0 27 27 40 64 64 71 71 79 91 100 136 770
NEW 0 34 34 77 101 101 128 128 155 167 175 252 1,352
SARUM 0 64 64 131 178 178 220 220 261 286 303 431 2,337
WWYKD 0 55 55 127 163 163 208 208 253 271 284 412 2,199
Meds mgt 220 220 220 220 220 220 220 220 220 220 220 221 2,641
220 401 401 595 726 726 847 847 969 1,034 1,081 1,452 9,300
All £'000

28
Authorisation The CCG has no outstanding conditions of authorisation relating to clinical governance. There are two conditions relating to operational and financial planning. NHS England have indicated that there is no further action required by the CCG to clear these conditions because the necessary submissions were made in February 2013 and the conditions were a formality of the authorisation timetable set by NHS England. This is reflected in the CCG Assurance Framework at Appendix 1.

Appendix 1NHS WILTSHIRE CCGAre local people getting good quality care?
SFT RUHGWH Acute
GWH Community
GWH Maternity
N N N N N
N N N N N
N N N N N
N N N N N
N Y N N N
N N Y N N
N N N N N
N N N N N
N Y N Y Y
N N N N Y
Does the CCG have any outstanding conditions of authorisation in place on clinical governance? NHas the CCG self-assessed and identified any risks associated with the following:Concerns around quality issues being discussed regulary by the CCG governing body N
Concerns around the arrangements in place to proactively identify early warnings of a failing service NConcerns around the arrangements in place to deal with and learn from serious untoward incidents and never events N
Concerns around being an active participant in its Quality Surveillance Group N
If there was an emergency event in the last quarter, has the CCG self-assessed and identified any areas of concern on the arrangements in place for dealing with such an event? N
Has the CCG self-assessed and identifed any risk to progess against its Winterbourne View action plan? N
the provider has reported more C difficile cases than trajectory
Has the provider been identified as a 'negative outlier' on SHMI or HSMR?Do provider level indicators from the National Quality Dashboard show that:
OutcomeIndicator
MRSA cases are above zero
Amber-Red – One or more 'YES' responses and no action plan in place / plan does not successfully mitigate patient riskRed – Enforcement action is being undertaken by the CQC, Monitor or TDA and the CCG is not engaged in proportionate action planning to address patient risk.
Green – all 'NO' responses
Providers
CCG: WiltshireClinical Governance
EPRR
Winterbourne View
Amber/Green – One or more 'YES' responses but action plan in place that successfully mitigates patient risk
MSA breaches are above zeroDoes the provider currently have any unclosed Serious Untoward Incidents (SUIs)?Has the provider experienced any 'Never Events' during the last quarter?
Has local provider been subject to enforcement action by the CQC? Has local provider been flagged as as a 'quality compliance risk' by Monitor and/or are requirements in place around breaches of provider licence conditions?Has local provider been been subject to enforcement action by the NHS TDA based on 'quality' risk?
Does feedback from the Friends and Family test (or any other patient feedback) indicate any causes for concern?
29 App1 Page 1 of 4

Appendix 1
NHS WILTSHIRE CCGAre patient rights under the NHS Constitution being promoted?IndicatorReferral To Treatment waiting times for non-urgent consultant-led treatment Prov Target Apr-13 May-13 Jun-13 Jul-13 Aug-13 Sep-13 Oct-13 Nov-13 Dec-13 Jan-14 Feb-14 Mar-14 FOTAdmitted patients to start treatment within a maximum of 18 weeks from referral 94.4% ≥90% 94.7% GNon-admitted patients to start treatment within a maximum of 18 weeks from referral 97.8% ≥95% 97.0% GPatients on incomplete non-emergency pathways (yet to start treatment) should have been waiting no more than 18 weeks from referral 93.8% ≥92% 93.2% G
Number of patients waiting more than 52 weeks 0 0 0 ADiagnostic test waiting timesPatients waiting for a diagnostic test should have been waiting less than 6 weeks from referral 0.5% ≤1% 0.5% G
A&E waitsRUH 91.9% 76.9% ASFT 96.9% 91.3% G
GWH 95.6% 89.9% ACancer waits – 2 week waitMaximum two-week wait for first outpatient appointment for patients referred urgently with suspected cancer by a GP 94.7% ≥93% nya G
Maximum two-week wait for first outpatient appointment for patients referred urgently with breast symptoms (where cancer was not initially suspected) 98.0% ≥93% nya G
Cancer waits – 31 daysMaximum one month (31-day) wait from diagnosis to first definitive treatment for all cancers 98.5% ≥96% nya G
Maximum 31-day wait for subsequent treatment where that treatment is surgery 97.2% ≥94% nya GMaximum 31-day wait for subsequent treatment where that treatment is an anti-cancer drug regimen 100.0% ≥98% nya G
Maximum 31-day wait for subsequent treatment where the treatment is a course of radiotherapy 96.9% ≥94% nya G
Cancer waits – 62 daysMaximum two month (62-day) wait from urgent GP referral to first definitive treatment for cancer 89.4% ≥85% nya G
Maximum 62-day wait from referral from an NHS screening service to first definitive treatment for all cancers 98.2% ≥90% nya G
Maximum 62-day wait for first definitive treatment following a consultant’s decision to upgrade the priority of the patient (all cancers) nya
Category A ambulance callsCategory A calls resulting in an emergency response arriving within 8 minutes– (75% standard to be met for both Red 1 and Red 2 calls separately)
Wilts 68.7% ≥75% 65.8% R
Category A calls resulting in an emergency response arriving within 8 minutes (Red 1) SWAST 73.0% ≥75% 70.2% R
Category A calls resulting in an emergency response arriving within 8 minutes (Red 2) SWAST 75.9% ≥75% 74.7% A
Category A calls resulting in an ambulance arriving at the scene within 19 minutes SWAST 92.7% ≥95% 95.1% ARUH 44 RSFT 10 A
GWH 149 RMixed Sex Accommodation Breaches
RUH 77 0 ASFT 8 0 A
GWH 0 0 GCancelled Operations
RUH 24 RSFT 4 A
GWH 0 AMental HealthCare Programme Approach (CPA): The proportion of people under adult mental illness specialties on CPA who were followed up within 7 days of discharge from psychiatric in-patient care during the period.
99.2% ≥95% G
All patients who have operations cancelled, on or after the day of admission (including the day of surgery), for non-clinical reasons to be offered another binding date within 28 days.
0
Handover delays between ambulance at A&E greater than 30 minutes (Local Standard) 0
2013/142012/13
Patients should be admitted, transferred or discharged within 4 hours of their arrival at an A&E department ≥95%
Minimise breaches 0
30 App1 Page 2 of 4

Appendix 1
NHS WILTSHIRE CCG
Indicator
1. Preventing people from dying prematurelyMeasurement
type
CCG
Performance
National
AverageBenchmark period
Relative performance(against England median)
April
Under 75 mortality rate from cardiovascular disease Annual 54.7 67.6 2011 Much better than average nyaUnder 75 mortality rate from respiratory disease Annual 18.5 28.5 2011 Much better than average nyaUnder 75 mortality rate from liver disease Annual 12.3 25.3 2010/11 & 2011/12 Much better than average nyaUnder 75 mortality rate from cancer Annual 111.8 122 2011 Much better than average nya2. Enhancing quality of life for people with long term conditionsHealth-related quality of life for people with long-term conditions Annual 76.5% 73% Jul-2011 to Mar-12 Much better than average nyaProportion of people feeling supported to manage their condition Annual 55.0% 52% Jul-2011 to Mar-12 Much better than average nyaDementia Diagnosis Rates Annual N/A 46% N/A N/A nyaUnplanned hospitalisation for chronic ambulatory care sensitive conditions (adults) - (DSR per 100,000) In year & Annual 705 929 2011/12 Much better than average nyaUnplanned hospitalisation for asthma, diabetes and epilepsy in under 19s (DSR per 100,000) In year & Annual 206 319 2011/12 Much better than average nya3. Helping people to recover from episodes of ill health or following injury
Emergency admissions for acute conditions that should not usually require hospital admission (DSR per 100,000) In year & Annual 834.4 1036 2011/12 Much better than average nya
Emergency readmissions within 30 days of discharge from hospital (indirectly standardised percentage) In year & Annual 10.80% 11.80% 2010/11 Much better than average nyaEmergency admissions for children with Lower Respiratory Tract Infections (LRTI) (DSR per 100,000) In year & Annual 301 366 2011/12 Much better than average nya
i) Hip replacement Annual 0.44 0.41 2010/11 & 2011/12 N/A nyaii) Knee replacement Annual 0.31 0.41 2010/11 & 2011/12 N/A nyaiii) Groin hernia Annual 0.09 0.41 2010/11 & 2011/12 N/A nyaiv) Varicose Veins Annual 0.10 N/A N/A N/A nya4. Ensuring that people have a positive experience of carePatient experience of primary care i) GP Services In year & Annual 91% 88% Jul-2011 to Mar-12 Much better than average nyaPatient experience of primary care ii) GP Out of Hours services In year & Annual 73% 70% Jul-2011 to Mar-12 Much better than average nyaPatient experience of hospital care - RUH Annual 77% 2012 N/APatient experience of hospital care - SFT Annual 78% 2012 N/APatient experience of hospital care - GWH Annual 75% 2012 N/ACare Services Annual N/A N/A N/AFriends and family test In year & Annual N/A N/A N/A5. Treating and caring for people in a safe environment and protecting them from avoidable harmIncidence of healthcare associated infection (HCAI) i) MRSAHealth Community 1 2 10/2011-09/2012 Much better than averageRUH Trust apportioned - HPA 5 2012/13 0SFT Trust apportioned - HPA 3 2012/13 0GWH Trust apportioned - HPA 1 2012/13 1Incidence of healthcare associated infection (HCAI) ii) C.difficile Health Community 35 28 10/2011-09/2012 Much worse than averageRUH Trust apportioned - HPA 41 2012/13 4SFT Trust apportioned - HPA 25 2012/13 1GWH Trust apportioned - HPA 34 2012/13 16. Targets included within planning guidance locally set
i) The proportion of people who have depression and/or anxiety disorders who receive psychological therapies: To March 2013 23% nya
ii) IAPT recovery rate To March 2013 36% nyaiii) Diagnosis rate for people with dementia To March 2013 37% nyaiv) Appointment of Care Co-ordinators as the first major step towards integrated care provision across health & social care - Wiltshire CCG & Wiltshire Council Target is to reduce nonlective spells by 6.8% In year monthly To March 2013 nya
v) Decrease in Length of Stay for Non-Elective Admissions - All acutes in Wiltshire In year monthly To March 2013 nya
In-year quarterly work towards In-year quarterly 55%
In-year quarterly 22%
Measures (PROMs) for elective procedures: (EQ-5D Index casemix adjusted health gain - some CCG results have not been included due to small numbers)
2163 Much better than average
NHS Outcomes Framework measures which NHS England and CCGs will use in annual assurance (as described in Annex A of Everyone Counts)
In year &Annual
In year &Annual
nya
Data from CCG Benchmarking packs
Potential years of life lost (PYLL) from causes considered amendable to healthcare 2009 & 2010Annual 1805
31 App1 Page 3 of 4

Appendix 1
NHS WILTSHIRE CCG
No IndicatorPrimary/Supporting Indicator Target Apr-13 May-13 Jun-13 Jul-13 Aug-13 Sep-13 Oct-13 Nov-13 Dec-13 Jan-14 Feb-14 Mar-14 YTD FOT
1 Underlying recurrent surplus Primary >=2%2 Surplus - year to date performance Primary >=1%3 Surplus - full year forecast Primary >=1%
4 Management of 2% NR funds within agreed processes Supporting Yes
5 QIPP ** - year to date delivery Primary >+95% of plan6 QIPP ** - full year forecast Primary >+95% of plan7 Activity trends - year to date Supporting <101% of plan8 Activity trends - full year forecast Supporting <101% ofp lan9 Running costs Primary <=RCA
10 Clear identification of risks against financial delivery and mitigations Primary Indicator met in
full
No IndicatorPrimary/Supporting Indicator
11This covers Internal and external audit opinions, and an assessment of the timeliness and quality of returns.
Supporting TBC nationally
12 Balance sheet indicators including cash management and BPCC Supporting TBC nationally
Overall rating (subject to over-riding rule
Green Amber/Green Amber/Red Red
Over-riding ruleQualified audit opinon would lead to an overall RED rating
To be defined. However, an overall green rating can only be achieved if all primary indicators are individually rated green. 2 or more red primary indicators would lead to an overall red rating
2013/142012/13
Are CCGs commissioning services within their financial allocations?
Financial performance
** QIPP to include transactional and transformational schemes
Financial performance
32 App1 Page 4 of 4

Safety Thermometer Appendix 3
Total Number of
patients with harm
National
Median Out turn
2012/13 2012/13
% % No %
RUH 8.10% 9.38% 90 15.05%
SFT 10.16% 42 9.40%
GWH 9.70% 62 4.78%
Number of patients with
1 & 2 harm
National
Median Out turn
2012/13 2012/13
% % No %
RUH harm 1 0.70% 8.74% 86 14.38%
RUH harm 2 0.30% 0.62% 4 0.67%
SFT harm 1 9.56% 39 8.72%
SFT harm 2 0.61% 3 0.67%
GWH harm 1 9.36% 61 4.71%
GWH harm 2 0.34% 1 0.08%
Pressure Ulcers (new &
Old)
National
Median Out turn
2012/13 2012/13
% % No %
RUH 5.50% 4.66% 34 5.69%
SFT 6.40% 23 5.15%
GWH 5.83% 33 2.55%
Falls (with harm)
National
Median Out turn
2012/13 2012/13
% % No %
RUH 1.10% 0.70% 1 0.17%
SFT 0.79% 1 0.22%
GWH 1.86% 9 0.69%
Catheter & treated for
UTI
National
Median Out turn
2012/13 2012/13
% % No %
RUH 1.10% 2.89% 14 2.34%
SFT 1.99% 9 2.01%
GWH 1.62% 16 1.23%
VTE (new)
National
Median Out turn
2012/13 2012/13
% % No %
RUH 1.20% 1.79% 44 7.36%
SFT 1.59% 12 2.68%
GWH 0.74% 5 0.39%
Apr‐13
Apr‐13
Apr‐13
Apr‐13
Apr‐13
Apr‐13
34