clinical & community collaboration to combat obesity cindy wolff, phd, mpa, rd nutrition and...
Post on 20-Dec-2015
213 views
TRANSCRIPT

Clinical & Community Collaboration to Combat Obesity
Cindy Wolff, PhD, MPA, RD Nutrition and Food Sciences, CSUCOPT for Fit KidsDirector

Clinical & Community Collaboration to Combat Obesity
• Cindy Wolff, PhD, MPA, RD • Carol Lams MA, RD Director Outreach Coordinator
• Faye Johnson, EdD, RD • Michele Buran Awareness Campaign Director Exercise Physiologist
• Kristin Gruneisen, MS, RD • Regina Munster, MS Clinical Dietitian Nutritionist

The obesity problem in the US is gaining attention

Obesity is Changing Human Shape1980: Male - 73 kg (162#); Female - 62 kg (136#) 2000: Male - 82 kg (180#); Female - 69 kg (152#)
>33% of US Adults Are Obese
In 1983, only 15% were obese.

80%?! Are Now Overweight
We are not only fat, but we are getting fatter fast:
1983: 58% were overweight 1990: 64% 1995: 71% 2002: 80%

Meet
Generation
Xcess

School-Age Children
In 2000, 26% were either:
–Obese (11%) or
–Overweight (15%)
When today’s 50 year olds were 10, only 4% of kids were overweight vs 26% today.

Rate of Overweight (% Obesity) in Low-Income Butte County Children
Ethnic Group
24-35 mo. 36-59 mo. 5-9 yr.
White 6.2 8.3 11.4
Hispanic 10.0 13.4 19.8
Asian 11.3 12.8 15.2
*PedNSS data for years 1995, 1996, 1998, & 1999 were used to calculate mean rates.

1012141618202224
1995 1996 1997 1998 1999
% >
95th
White Hipanic Asian
Butte County PedNSS DataAges 5-9 yrs.


CA Fitnessgram Results, 2001
0%
5%
10%
15%
20%
25%
30%
35%
40%
45%
Overwt Unfit
3rd ADCA26th AD
Butte County WIC Study
N = 131 mothers and preschoolers45% of moms had some college (or
more)Half of mothers of overweight
children indicated that their children were normal weight
Overweight among preschoolers was associated with more frequent fast food

BMI category - Mothers
underweight6%
normal 34%
overweight27%
obese33%
underweight
normal
overweight
obese

BMI-for-age percentile - Boys
normal or underweight
69%
at risk of overweight
11%
overweight20%
normal or underweight
at risk of overweight
overweight

BMI-for-age percentile - Girls
normal or underweight
62%
at risk of overweight
23%
overweight15%
normal or underweight
at risk of overweight
overweight

Gridley Schools Data (n=554)
Mean age = 9 yrs
> 85% BMI-for-age = 52%
> 95% BMI-for-age = 30%
Double the national average


“Acanthosis Nigricans” signals high insulin levels & can help identify persons who run the risk of developing diabetes

Acanthosis Nigricans
12% are positive for acanthosis
1 out of 8 kids
22% if >85% BMI-for-age
36% if > 95% BMI-for-age
>90% of these kids are Hispanic
MNT for Aganthosis Nigricans
Dietitians can conduct 2 evaluations and 4 intervention sessions with the child and family under CPT code 701.2 “Acquired Acanthosis Nigricans”
0
5
10
15
20
25
30
35
BMI
1985 2000
Pima inMexicoPima inUS
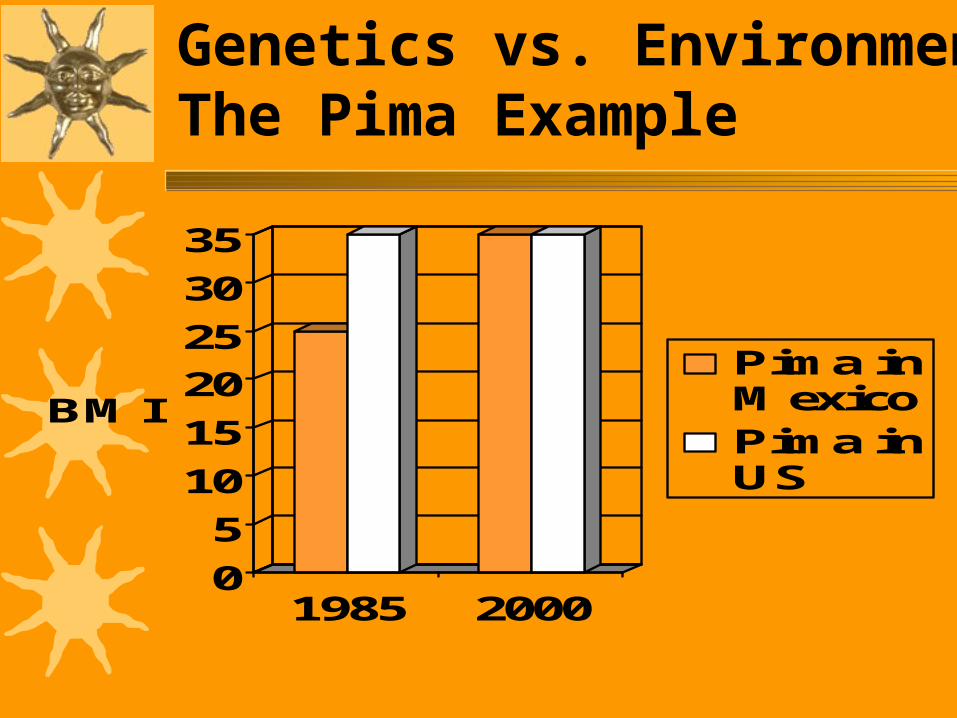
Genetics vs. EnvironmentThe Pima Example

The 4th Law of Thermodynamicsor
Life Isn’t FairThe Theory
Dietary Intake -
Energy Expenditure =
Energy Stores Including Adipose Tissue
The Truth
(Dietary Intake x Genetic Modifier) -
(Energy Expenditure x Genetic Modifier) =
Energy Stores Including Adipose Tissue

FAST FOOD: An Attractive Nuisance
Americans spend more money on fast food than they do on:higher education, computers & software, or new cars
And more on fast food than on movies, books, magazines, newspapers, videos and recorded music - combined.

July 28, 2002 California’s Official Drive-Through Day!!!
Jack in the Box lobbied heavily for this state declaration.
Gov Davis agreed
With 24 hr service at drive-throughs, there’s no time that fast food is out of reach.

Healthy People 2010
The Leading Health Indicators are:
1. Physical Activity 2. Overweight & Obesity 3. Tobacco Use 4. Substance Abuse 5. Responsible Sexual Behavior 6. Mental Health 7. Injury and Violence 8. Environmental Quality 9. Immunization 10. Access to Health Care

Childhood ObesityThe ProblemChildhood ObesityThe ProblemConsidering childhood obesity is a new
conceptLittle to no mention in textbooksPhysicians don’t always address the issueWhy address the issue if there is no
effective treatment?
CA Obesity Prevention Initiative survey results:90% of medical directors indicated a
need for provider resources, e.g. a toolkit & training for obesity prevention & treatment
100% reported a need for patient resources for teens & children
- Jan. 2003
OPT for Fit Kids: A Community Network Approach to Child Obesity
• Cindy Wolff, PhD, MPA, RD • Carol Lams MA, RD Director Outreach Coordinator
• Faye Johnson, EdD, RD • Michele Buran Awareness Campaign Director Exercise Physiologist
• Kristin Gruneisen, MS, RD • Regina Munster, MS Clinical Dietitian Nutritionist

OPT Mission
To reduce the incidence of
pediatric overweight through:
– increased public awareness of
the severity of the problem, &
– by providing nutrition
education prevention and
treatment services.

OPT for Fit Kids Program Components
1. Medical Nutrition Therapy:
Nutrition assessment and
counseling services for
overweight children and
their families.

OPT for Fit Kids Program Components
2. A multi-media campaign to
increase awareness of the
prevalence and severity of
pediatric overweight and
lifestyle practices for its
prevention and treatment.

OPT for Fit Kids Program Components
3. Early childhood nutrition education for Head Start children, parents, and teachers.
Fitness is the FOCUS
Not Weight

OPT Clinical Services
Medical nutrition therapy:Group classes
(L.E.A.P.)Family
counselingThe focus is on
fitness and quality of life, not weight.
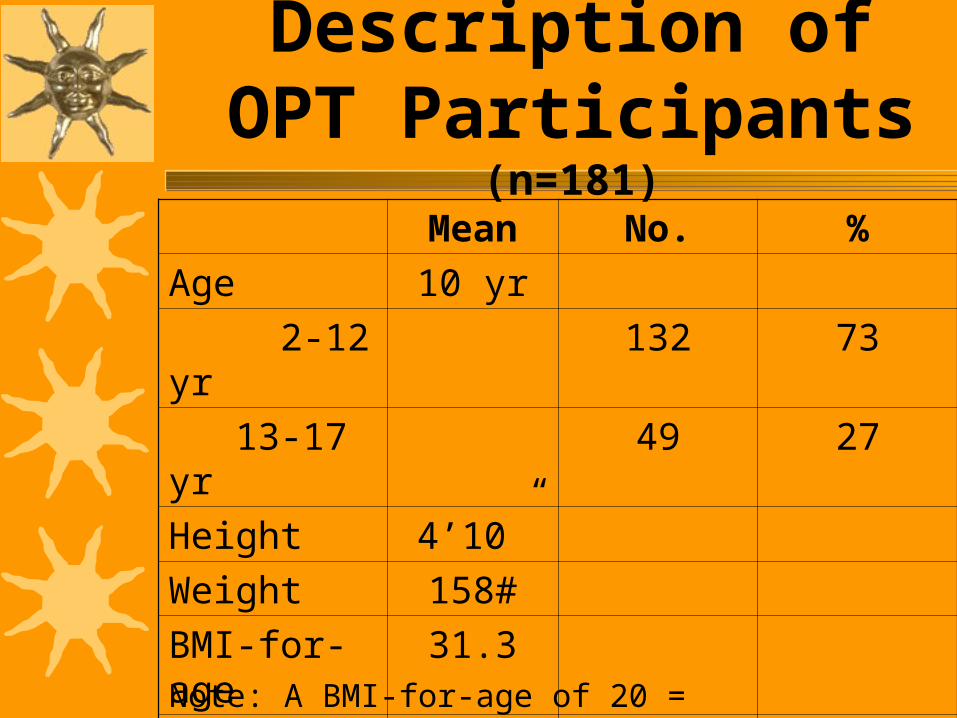
Description of OPT Participants (n=181)
Mean No. %
Age 10 yr
2-12 yr 132 73
13-17 yr 49 27
Height 4’10”
Weight 158#
BMI-for-age 31.3
% Body fat 42%
Note: A BMI-for-age of 20 = 85th %tile

Description of OPT Participants, cont. (n=181)
No. %
Insurance:
Medi-Cal 97 72
Healthy Families 14 8
Private 46 25
Uninsured 24 13
Ethnicity:
White 93 72
Hispanic 13 19
Other 12 9

Description of OPT Participants, cont.Biochemical Values Baseline S.D.
Total Cholesterol 180 mg/dL 37
HDL-Cholesterol 42 9
LDL-Cholesterol 114 32
Triglycerides 137 81
Total Chol/HDL ratio 4.4 1.1

Blood Lipids
60% have elevated cholesterol
42% low HDL
51% high LDL
33% high triglycerides
48% had a total cholesterol/HDL ratio 4.5
0
10
20
30
40
50
60
Chol LDL Chol/HDL
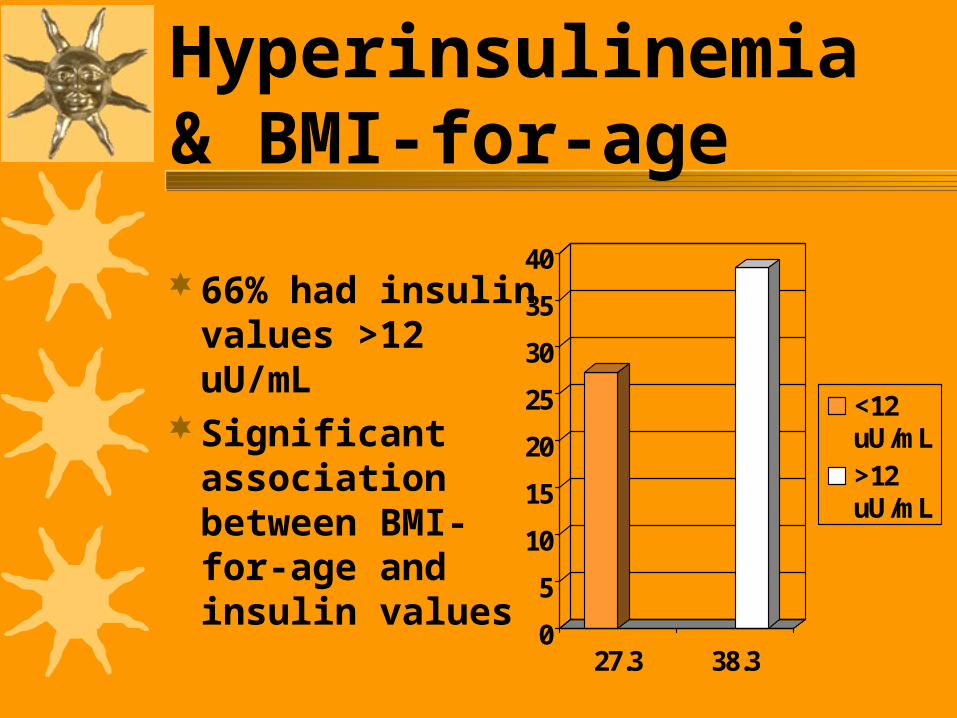
Hyperinsulinemia & BMI-for-age
66% had insulin values >12 uU/mL
Significant association between BMI-for-age and insulin values
0
5
10
15
20
25
30
35
40
27.3 38.3
<12uU/mL>12uU/mL
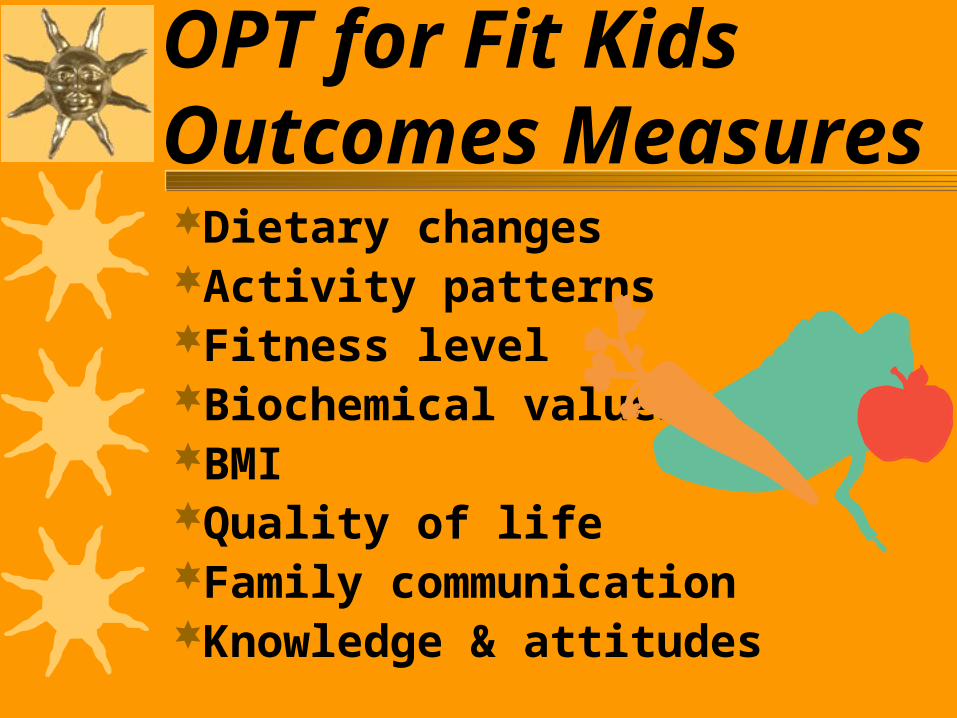
OPT for Fit Kids Outcomes MeasuresDietary changesActivity patternsFitness levelBiochemical valuesBMIQuality of lifeFamily communicationKnowledge & attitudes

Outcomes for OPT Weight Management Participants
82% had a decrease in BMI
Mean decrease was 1 BMI unit
2# weight loss with ½” gain in height
31.4
31.6
31.8
32
32.2
32.4
32.6
32.8
Pre BMIPost BM

Decrease in Body Fat
% body fat decreased from 42.0% to 40.0%
39
39.5
40
40.5
41
41.5
42
42% 40%
PREPOST

Parents reported significant improvements:My child eats more fruits & vegetables/dayOur family watches less television My child is more likely to eat until he/she
is “just satisfied” rather than very full or still hungry
Our family eats less fast foodI provide more physically active activities
for my childMy child drinks less sweet beverages
(juice, juice drinks, soda, Kool-Aid)
Children reported significant improvements:
I eat mainly low-fat (green light) foodsI exercise at least 60 minutes most days of
the weekI eat when I’m hungry and stop when I’m
satisfiedI accept my natural body-build

Needed changes:Health care providersHealth care providers need to assess
BMI-for-age for at risk children Talk to parents and child if > 85%
BMI-for-age Assess child for weight related co-
morbiditiesRefer for weight management services
if > 95% BMI-for-age
Steps to using BMI-for-age
Obtain accurate weight and height measurements
Calculate BMI or look up on chart
Plot measurements
Interpret plotted measurements

Case Study: “Sam”
Name: SamWeight: 43 lb 4 oz Height: 41.5 inches DOB (date of birth): 1/10/1998DOV (date of visit): 4/18/2003

Calculating BMI
Example: Weight = 43 pounds, 4 oz. Height = 41 1/2 inches
(convert fractions to decimal value)
BMI = [43.25 lb / 41.5 in / 41.5 in] x 703
= 17.7
Calculation: [weight (lb)/height (in)/height (in)] x 703

Sam’s BMI Plotted on Boy’s BMI-for-Age Chart
Interpretation:
• Sam’s BMI is slightly above the 90th %tileso it falls in the ‘risk for overweight’ range.
Boys: 2 to 20 years
BMI BMI
BMI BMI

Interpreting the BMI-for-age Chart
BMI-for-age indicates a child’s weight in relation to his/her height for a specific age and gender.
Need a series of BMI plots to
determine the growth trend.
If indices deviate from normal growth patterns, further assessment may be needed.

www.cdc.gov/growth/charts
Use this web site to download the new BMI-for-Age Growth Charts

Medical Evaluation of Childhood ObesityBMI 85-95%:
no risk factor
Fasting lipid profile
BMI 85-95%:
with risk factors
Fasting lipids, insulin, & glucose
HgA1CComp. chemistry panelThyroid function
BMI > 95% All of above


Appropriate Weight Loss Rate?
One pound per month

Needed Changes - Schools should provide:Fitnessgram results to parents with
interpretive informationBMI-for-age & interpretive
informationA food environment supportive of
healthy life habitsThe state mandated minutes of P.E.Nutrition education as part of the
curriculum
Limit Liquid Sugar (Sodas)
As soda intake increases, weight increases.
Kids used to drink 2 glasses of milk for every soda. Now they drink 2 sodas for every glass of milk.
The chances of children becoming obese increases 1.6 x for EACH can or glass of sugary beverage/day. (Source: Experts Say Skip the Soda, Better Nutrition, May 2001)

Funding Sources for OPT
California Nutrition Network (USDA)
Butte County Commission on Children and Families (Prop 10)

OPT Community Partners
Butte County Head StartNutrition & Food Sciences, CSUC Butte County WICButte County Dept. of Public HealthUC Coop. ExtensionPediatric Health PractitionersValley Oaks Children ServicesAmerican Cancer Society
OPT for Fit Kids: Overweight Prevention & Treatment