clinical features and treatment outcomes in ms · onset sx: optic neuritis, sensory onset sxs:...
TRANSCRIPT

Clinical Features and Treatment
Outcomes in MS An Update from Contemporary Cohorts
PVA Summit –August 2013 Orlando, FL
Mitchell T. Wallin, MD, MPH Clinical Associate Director
VA MS Center of Excellence East-Baltimore
Associate Professor of Neurology
Georgetown University School of Medicine
University of Maryland School of Medicine

Disclosures
This continuing education activity is managed and accredited
by Professional Education Services Group in cooperation
with the Paralyzed Veterans of America. Neither PESG
nor PVA nor any accrediting organization supports or
endorses any product or service mentioned in this activity.
PESG Staff and the Program Planning Committee have no
financial interest to disclose.
Commercial Support was not received for this activity.

Disclosures (cont.)
M. Wallin, MD, MPH has the following disclosures:
Biogen-Idec, Inc. Investigator Initiated Grant Support

Learning Objectives:
Understand the clinical course of MS in recent
population-based cohort studies
Discuss optimal models to study MS therapy
outcomes in representative patient populations
Provide an overview of current MS disease
modifying therapy use and the associated clinical
impact in large patient populations

Topical Outline
MS morbidity overview Relapses
Progressive disability
Gulf War Era MS Cohort
Clinical & research tools for MS outcomes

MS Disease Morbidity Timeline (Lublin F, Neurol in Clin Pract, 2008)
Relapses
EDSS, PDDS
MSFC
Imaging outcomes

Study population issues
Representative
Adequate size
Disease status
Controls
Follow-up time

*In 224 placebo patients from the NMSS task force on clinical outcome assessment.
Relapses Can Result in
Residual Long-Term Disability Lublin FD, et al. Neurology. 2003;61:1528-1532
Net Change in EDSS Score from before a Relapse to after a Relapse*
42% of patients had a residual deficit ≥0.5 point
28% had a residual deficit ≥1.0 point
42.4% increase 0.5 or more
28.1% increase 1 or more
Nu
mb
er
of
Subje
cts
1 3 7 4
8
20
86
32 33
14 8 5
1 2
0
20
40
60
80
100
-3.5 -2.5 -2.0 -1.5 -1.0 -0.5 0.0 0.5 1.0 1.5 2.0 2.5 3.5 4.0

Low (0-1 attacks in 2 years)
Intermediate (2-4 attacks in 2 years)
High (> 5 in 2 years)
Long-Term Disability Effect of Early Relapses
(Weinshenker, Brain 1989)
50 40 30 20 10
20
0
0
40
60
80
100
Time from onset of MS (years)
Per
cent
Pts
DS
S =
6
p < 0.0001

Risk of Permanent Disability from an
MS Relapse (Bejaoui K, Neurology 2010)
1,078 patients with RR MS
mean EDSS 3.4
mean of 2.4 relapses/patient (range: 1-11)
mean follow-up time 7.4 yrs
7 patients with relapse resulting in EDSS > 6
2 on INF beta at time of relapse
Initial sx onset in 2
156 reached EDSS > 6 by secondary progression

Relapses and Progression in MS (Kremenchutzky, 2006)
Three subgroups defined:
PP MS (N=219)
SP MS (N=146)
Single attack before onset of progression (SAP; N=140)
PP had the worse outcome vs. SP and SAP based on time from onset of MS
No difference in time to reach DSS 6, 8 and 10 from onset of progression
Progressive course independent of relapses

Initial Course of MS and Time to EDSS 4 and
EDSS 6 (Confavreux, 2000)
Median time to EDSS 4
RR Onset: 11.4 yrs
Progressive Onset: 0 yrs
Median time EDSS 4 to 6
RR Onset: 5.7 yrs
Progressive Onset: 5.4 yrs
EDSS 4 Threshold: once EDSS
4 is reached, progression in MS
is not affected by relapses

Influence of Initial Course on Age to
Reach EDSS End-Points (Confavreux, 2006 )
RR MS were older than PP MS to reach EDSS 4 (Graph A) & EDSS 6 (Graph B); 95% CI overlap
Age to reach EDSS 7 between groups similar (Graph C)

Age and Disability Progression (Confavreux, Brain 2006)

Clinical & Demographic Predictors
of Progressive Disability in MS (Langer-Gould, 2007)
Favorable Risk Factors Unfavorable Risk Factors
Young age at onset Older age at onset
Female Sex Male sex
Race: White Race: African American
Onset sx: optic neuritis, sensory Onset sxs: motor, cerebellar, sphincter
RR disease onset Severe disability after first attack
Short interval between first-second
attack
High frequency of attacks in first 5 yrs
Progressive disease from onset

African Americans and MS Progression (Cree, et al 2004)
Large retrospective cohort
of AA (N=375) vs. CA
(N=427)
Median time to EDSS 6
(16 yrs vs. 22 yrs
p=0.0001)
Median time to EDSS 7
(30 yrs vs. 38 yrs)
Adjusted Cox Hazard
Ratio: 1.67 for walking
with cane (p < 0.001)

Longitudinal Follow-up of Benign MS at 10
years (Sayao, 2007)
200 MS pts with EDSS
< 3 at 10 yrs from onset from British Columbia Database
Conversion to SP MS in 23%
10 -year EDSS score was only significant predictor of
progression

Time to EDSS 6 from first onset
symptoms of MS
Study Location (n) Mean Disease
Duration
(yrs)
Median Time to
EDSS 6
(yrs)
Weinshenker, 1989 Ontario (1,099) 12 15
Confavreux, 2000 Europe (1,844) 11 20
Pittock, 2004 Rochester, MN (166) 19 29
Tremlett, 2006 British Columbia (2,319) 20 28

Gulf War-Era MS Cohort (n=2,691)
3,499 veterans with MS/CIS SC dx and active duty
service between1990-2007
2,478 with diagnosis of MS/Possible
116 with diagnosis of optic
neuritis
97 with diagnosis of transverse
myelitis/other/CIS NMO
561 Not MS/CIS
247 with dx < 1990

Risk of MS by Sex and Race Groups (Kurtzke, 1979; Wallin, 2004 & 2012)
Group WWII & KC Adjusted CC Ratios
Vietnam & Later Adjusted CC Ratios
Gulf War Era Relative Risk (95%CI)
White-Male 1.00 1.00 1.00
Black-Male 0.44 0.67 1.16 (1.03-1.30)
Other-Male 0.22 0.30 0.77 (0.65-0.92)
White Female 1.79 2.99 3.54 (3.20-3.91)
Black Female 1.28 2.86 3.62 (3.18-4.11)
Other Female --- 3.51 1.98 (1.52-2.58)

2000 - 2007
Total Black White Other Hisp AsPac NatAm
AN
NU
AL
RA
TE
PE
R 1
00,0
00
0
2
4
6
8
10
12
14
1990 - 2007TOTAL BLACK WHITE OTHER HISPANIC
AN
NU
AL
RA
TE
PE
R 1
00
,00
0
0
2
4
6
8
10
12
14
16
18
20
22
24
26
28
30
32
Male
Female
GW MS Cohort: Average Annual
MS Incidence Rates (Wallin, Brain 2012)

TOTAL ARMY NAVY MARINES AF CG
AN
NU
AL
RA
TE
PE
R 1
00
,00
0
0
2
4
6
8
10
12
14
GW MS Cohort: Average Annual
MS Incidence Rates (Wallin, Brain 2012)
TOTAL ARMY NAVY MARINES AF CG
AN
NU
AL
RA
TE
PE
R 1
00,0
00
0
5
10
15
20
25
30
35Male
Female

MS Incidence in Active
Component, US Armed Forces
2000-2009 (Duessing, et al 2011 & 2012)

MS Incidence
Southern California HMO Population

Clinical Features of the GW-Era
MS Cohort (n=2,478)
Onset subtype: relapsing (94%),
progressive (6%) with no single
presenting DSS functional system
being significantly different between
groups
Significantly more males and AA had
progressive onset MS
Optico-spinal MS presentation:
Asian > NA/Alaska native >
Hispanic > AA>Whites
NMO confirmed cases: n=6 (AA:
66%, White: 33%)
Visual
Brainstem
Pyramidal
Cerebellar
Sensory
Bladder/Bowel
Mental
Spinal CordMultip
le OTH
Perc
en
tag
e o
f P
ati
en
ts
0
10
20
30
40
50
White (n=1,833)
Black (n=656)
Hispanic (n=153)
Asian/Hawaiin/Pacific Islander (n=26)
Am In/Alk Nat (n = 7)
Unknown (n = 14)

Clinical Features of the GW-Era
MS Cohort
DSS Score
0-2 3-4 5-6 7-9
Pe
rce
nta
ge
of
Pa
tie
nts
0
10
20
30
40
50
60
Male (n = 1,603)
Female (n = 845)
Total (N = 2,448)
DSS Score
0-2 3-4 5-6 7-9
Pe
rce
nta
ge
of
Pa
tie
nts
0
10
20
30
40
50
60
White (n = 1,684)
Black (n = 600)
Hispanic (n = 135)
Asian/Hawaiin/Pac Isl (n = 20)
Am In / Alk Nat (n = 5)
Unknown (n = 4)
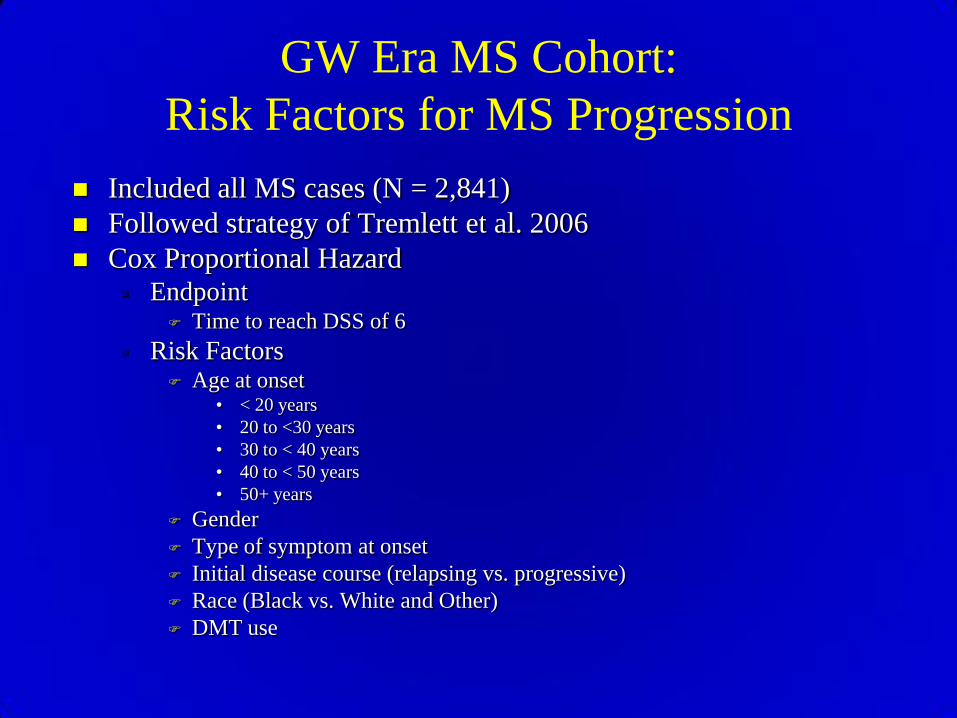
GW Era MS Cohort:
Risk Factors for MS Progression
Included all MS cases (N = 2,841)
Followed strategy of Tremlett et al. 2006
Cox Proportional Hazard Endpoint
Time to reach DSS of 6
Risk Factors Age at onset
• < 20 years
• 20 to <30 years
• 30 to < 40 years
• 40 to < 50 years
• 50+ years
Gender
Type of symptom at onset
Initial disease course (relapsing vs. progressive)
Race (Black vs. White and Other)
DMT use

GWEMSC - Morbidity Risk Factor N Hazard Ratio 95%CI
Gender
Female
Male
943
1,898
1
1.36
1.18 – 1.58
Age @ Onset
< 20
20 to <30
30 to <40
40 to <50
50+
72
1,361
1,046
321
33
1
1.76
2.04
2.17
3.55
1.09 – 2.83
1.23 – 3.28
1.31 – 3.59
1.78 – 7.08
Type of Symptom at onset
Motor
Sensory
Visual/ON
Cerebellar/Brain Stem
762
1,226
800
962
1.21
0.96
1.05
1.23
1.05 – 1.39
0.84 – 1.10
0.89 – 1.23
1.08 – 1.39
Initial Disease Course (progressive) 172 4.54 3.77 – 5.48
Race (Black) 660 1.54 1.33 – 1.77
DMT use (ever used) 2,265 0.69 0.58 – 0.83
28

GWEMSC - Morbidity Figure 1. Cumulative probability of reaching DSS 6 from birth in years by Age at Onset. Control variables were: gender,race, disease course at onset, type of symptom at onset, and DMT use (see Table 6 for results).
Years from Birth to DSS 6
0 5 10 15 20 25 30 35 40 45 50 55 60 65 70 75 80 85
Cu
mu
lati
ve S
urv
ival
0.0
0.2
0.4
0.6
0.8
1.0
< 20
20 -< 30
30 -< 40
40 -< 50
50+
p < 0.001

MS Assessment Tool & Database
CPRS-based annual assessment
of all VA-users with MS (MS
Policy Handbook-2009)
Core demographic & clinical
information captured/stored
Pilot in VISN 5 & 20 (n=200)
Goals:
Improved real-time surveillance of
MS population
Efficient monitoring of DMT use
& untoward effects
Optimize management of patients
Data for epidemiology and policy
decisions

CPRS Template: Baseline Assessment

MS Assmt Tool: EDMUS Scale

MS Assmt Tool: Relapse History

MSCoE MS Registry Main Page
• Data updated daily
• Main page allows for filtered cohort selection based on individual search preferences

Expanded Diagnosis & DMT Medication
Filter Options

Clinician Dashboard Display
• Current meds pulled from the Corporate Data Warehouse – updated daily

MS Risk Assessment Through the Lifespan
MS Disease Course
fewer relapses with full recovery (RRMS)
shorter disease history
DMT
Vitamin-D supplements (UVB exposure) ??
frequent relapses without full recovery (SPMS)
primary progressive disease course
longer disease history
comorbidities
smoking ??
OUTCOMESClinical
QOL
Disability
ADLs
MSSymptoms
Survival
Infections - Decubiti - UTI - Pneumonia
DVT / PE
Pro
tecti
ve
Exacerb
ati
ng
Ris
k F
acto
rs
Environmental
EBV, HHV-6
other viruses &toxin(s)
smoking ??vaccines ??
Equitorial Latitude
Vitamin-D (diet)
UVB exposure
Prognosticators@ onset of MS
Female
younger age
sensory symptoms
relapsing MS
Male
older age
motor symptoms
progressive MS
family HX of MS
NOTE: Items displayed in BLUE are EFFECT MODIFIERS that can varry naturally (e.g., living at a southern latitude) or are modifiable (e.g., smoking, DMT use). A '??" is placed next to those items that have been suggested, but not conclusively demonstrated, to impact MS risk or outcomes.
Birth ~10 ~20 ~40 Death
+
-

Clinical Features and Treatment
Outcomes in MS Conclusions
Relapses rarely associated with significant sustained disability progression in population-based studies
MS disease morbidity progression is more benign in recent population-based cohorts
MS clinical phenotype and course are age dependent and relatively uniform
US DoD/VA MS population-based cohort studies offer opportunity to evaluate: Incident MS (service-connection)
Real time disability & DMT outcomes: MS Assmt Tool & Databases

MSCoE Epidemiology Research Group
VA MSCoE
Joel Culpepper, PhD
Parisa Coffman, MPH
Heidi Maloni, PhD
Jodie Haselkorn, MD, MPH
John Kurtzke, MD
NW Innovation Center Staff
VA Environmental Epidemiology
Han Kang, PhD
Clare Mahan, PhD
NIH-NINDS
Steve Jacobson, PhD
DoD Serum Repository &
WRAMC/DoD Neurology
Mark Rubertone, MD
Angie Eick, PhD
Johns Hopkins University/Welch Ct
Joseph Finkelstein, MD, PhD
Funding: VA Merit Review, VA MSCoE, NMSS