clinical pathways to disability - the national bureau of ... · clinical pathways to disability...
TRANSCRIPT
NBER WORKING PAPER SERIES
CLINICAL PATHWAYS TO DISABILITY
Mary Beth LandrumKate A. StewartDavid M. Cutler
Working Paper 13304http://www.nber.org/papers/w13304
NATIONAL BUREAU OF ECONOMIC RESEARCH1050 Massachusetts Avenue
Cambridge, MA 02138August 2007
This work was funded by the National Institute of Aging (P30 AG12810 and R01AG019805) andthe Mary Woodard Lasker Charitable Trust and Michael E. DeBakey Foundation. The views expressedherein are those of the author(s) and do not necessarily reflect the views of the National Bureau ofEconomic Research.
© 2007 by Mary Beth Landrum, Kate A. Stewart, and David M. Cutler. All rights reserved. Shortsections of text, not to exceed two paragraphs, may be quoted without explicit permission providedthat full credit, including © notice, is given to the source.

Clinical Pathways to DisabilityMary Beth Landrum, Kate A. Stewart, and David M. CutlerNBER Working Paper No. 13304August 2007JEL No. I10,I12
ABSTRACT
This paper examines the pathways by which individuals transition from healthy to disabled. Becauseof the high prevalence and costs associated with disability, understanding these pathways is criticalto developing interventions to prevent or minimize disability. We compare two estimates of disablingconditions: those observed in medical claims and conditions indicated by the disabled individual. A small number of conditions explain about half of incident disability: arthritis, infectious disease,dementia, heart failure, diabetes, and stroke. These conditions show up in medical claims and selfreports. A large number of elderly also attribute disability to old age and various symptoms. Becauseso many of the most disabling conditions do not have clear medical treatments, the outlook for majorreductions in disability might be limited.
Mary Beth LandrumHarvard Medical SchoolDepartment of Health Care Policy180 Longwood AvenueBoston, MA [email protected]
Kate A. StewartDepartment of Health Care Policy180 Longwood Ave, Suite 301Boston, MA [email protected]
David M. CutlerDepartment of EconomicsHarvard University1875 Cambridge StreetCambridge, MA 02138and [email protected]

3
Introduction
While disability declined over the course of the 1980’s and 1990’s (Crimmins,
Saito et al. 1997; Freedman and Martin 1998; Waidmann and Liu 2000; Cutler 2001;
Manton and Gu 2001; Schoeni, Freedman et al. 2001; Freedman, Martin et al. 2002;
Freedman, Crimmons et al. 2004; Spillman 2004), the prevalence of disability among the
elderly remains high (Waidmann and Liu 2000; Schoeni, Freedman et al. 2001; Manton,
Gu et al. 2006). Moreover, disability is associated with poor quality of life (Lamb 1996),
high medical spending (Komisar, Hunt-McCool et al. 1997; Liu, Wall et al. 1997; Fried,
Bradley et al. 2001; Guralnik, Alecxih et al. 2002; Chernew, Goldman et al. 2005) and
increased mortality (Manton 1988; Guralnik, LaCroix et al. 1991; Ferrucci, Guralnik et
al. 1996). Thus it is critical to understand the major clinical pathways through which the
health of the elderly declines to be able to develop effective interventions to prevent or
minimize disability in the elderly population.
In this paper, we analyze data from the National Long Term Care Survey
(NLTCS), a longitudinal survey on a nationally representative sample of Medicare
beneficiaries that has been linked to Medicare administrative data, to identify the major
pathways through which the elderly become disabled. We compare two methods of
identifying disabling conditions. First, using administrative billing data, we evaluate 31
potentially disabling clinical conditions and estimate the proportion of incident disability
attributable to each condition. In order to better understand the association between
medical conditions and disability we consider both simple binary measure of any
disability in addition to measures that reflect severity (i.e. the total number of ADL and
IADL disabilities) and types of limitations (i.e. mobility-related, cognitive or self-care).

4
We also examine the relationship between medical conditions and the use of supportive
and medical services. We hypothesize that different medical conditions lead to disability
of varying severity and type and need for assistance. Identifying these differences may
help to prioritize medical conditions for interventions to prevent or delay disability and to
help design appropriate interventions for different types of disability.
In the second part of the paper, we compare these empirical results to
respondents’ self reported causes. We find that an important subset of newly disabled
elderly did not report a chronic condition or an acute medical event when asked to
identify the cause of their disability; rather, they cited symptoms or simply attributed
their disability to old age. We explore whether respondents who attributed their disability
to old age or symptoms differed from respondents who cited chronic or acute medical
conditions in both patterns of disablement and health care utilization to better understand
whether old age and symptom causes represent pathways to disability independent of
diseases and conditions.
Our paper is structured as follows. First we discuss prior literature relevant to our
analyses. We then describe our data and analytic methods and present our results.
Finally we summarize our conclusions and discuss implications of our findings.
Background:
Heterogeneity in the Disablement Process
5
Disability in an elderly, non-working population is typically defined as the need
for assistance1 with one or more or self care tasks, such as bathing or eating, called
activities of daily living (ADLs), or tasks required to live independently, such as grocery
shopping or preparing meals, called instrumental activities of daily living (IADLs).
National surveys measuring disability in the elderly typically ask respondents about their
ability to perform a set of ADL and IADL tasks, and often also ask respondents about
physical limitations, such as difficulty walking long distances, going up stairs or grasping
small objects.
Previous research has demonstrated that disability may develop as the result of a
catastrophic event such as a stroke or a hip fracture, or as a progressive process
associated with chronic and sometimes degenerative conditions such as arthritis or
dementia (Ferrucci, Guralnik et al. 1996; Ferrucci, Guralnik et al. 1997; Wolff, Boult et
al. 2005). Depending on the cause of disability, many elderly may recover from
disability (Gill, Robison et al. 1997; Gill, Allore et al. 2006; Gill, Gahbauer et al. 2006)
or they may progress to more severe states of disability. Among those who do not recover
from disability, both theoretical and empirical work (Katz, Ford et al. 1963; Kempen and
Suurmeijer 1990; Verbrugge and Jette 1994; Ferrucci, Guralnik et al. 1998) has suggested
a hierarchy in physical limitations, and ADL and IADL tasks where an elderly person
typically progresses from first having physical limitations to needing assistance with
complex tasks (such as cooking, grocery shopping or managing money), progressing to
needing assistance with some personal care needs such as getting out of bed and bathing,
and then finally needing assistance with the most basic personal tasks such as toileting
and feeding. However, there is disagreement across studies about the exact nature of the
1 Some surveys ask respondents about the level of difficulty without assistance.

6
disablement process (Siu, D.B. et al. 1990; Lazaridis, Rudberg et al. 1994; Dunlop,
Hughes et al. 1997; Jagger, Arthur et al. 2001), which may be attributable to differing
patterns of onset (i.e. catastrophic versus progressive) and likelihood of recovery.
Researchers have also demonstrated that disability, regardless of its cause, may be
characterized as a continuum of difficulty and dependency (Fried, Herdman et al. 1991;
Fried, Bandeen-Roche et al. 1996; Gill, Robinson et al. 1998; Fried, Bandeen-Roche et
al. 2000; Fried, Young et al. 2001). For example, Gill et al. (1998) examined the
relationship between difficulty and dependence in specific tasks and demonstrated that
separate questions about the use of assistance and difficulty could be used to classify
respondents into 3 ordered categories: independent without difficulty, independent with
difficulty, and dependent. Similarly the work by Fried et al. (2000, 2001) identified a
state of pre-clinical disability where respondents denied difficulty with a task, but
nevertheless reported having modified their performance of the task because of health of
physical problems. Respondents with pre-clinical disability were found to have
intermediate levels of physical functioning between that of respondents who reported
difficulty with tasks and those who reported neither difficulty nor modification,
suggesting that modification without reported difficulty represents early manifestations of
functional declines and a less severe form of disability.
Other empirical studies have conducted factor analyses to identify the number and
types of underlying dimensions of disability (Fried, Ettinger et al. 1994; Spector and
Fleishman 1998). For example, Spector and Fleishman (1998) found a great deal of
correlation among 7 ADL and 9 IADL measures in approximately 3000 disabled
respondents to the 1989 National Long Term Care Survey, so that a single factor that

7
combined 15 of the 16 items adequately described the observed patterns. Fried et al
(1994) examined 17 physical limitations, ADL and IADL items in 5,201 community-
based elderly adults living in one of four US communities; they found that self-reported
difficulty with these 17 items could be partitioned into 4 factors representing mobility
problems, difficulty with complex tasks, difficulty with self-care and upper extremity
limitations. These four factors explained 48% of the total variance in the 17 items.
Researchers have also used Grade of Membership models, an extension of latent class
models that hypothesize different underlying types of respondents with different patterns
of disability, to examine profiles of disability (Lamb 1996; Manton, Stallard et al. 1998).
Prior research has also documented specificity in the associations between
conditions and specific types of limitations. Arthritis has generally been found to be
strongly associated with functional limitations and moderate ADL limitations
(Verbrugge, Lepkowski et al. 1991; Fried, Ettinger et al. 1994; Guccione, Felson et al.
1994; Manton, Stallard et al. 1998) while stroke and dementia have been consistently
linked with both IADL limitations and more severe disability in self-care tasks (Fried,
Ettinger et al. 1994; Guccione, Felson et al. 1994; Manton, Stallard et al. 1998). Similar
patterns are found in respondents self-reports of the causes of their limitations (Ford,
Folmar et al. 1988; Ettinger, Fried et al. 1994; Valderrama-Gama, Damian et al. 2002).
Arthritis was most often cited as the cause of limitations in mobility related tasks,
including getting out of bed and getting around inside; heart and lung diseases were the
most often cited causes for aerobic tasks, such as walking half a mile, while stroke and
dementia were most often associated with cognitive and self care tasks.

8
In this paper, we evaluate the association of specific diseases and conditions with
varying types and severity of disability to better understand the association between
medical conditions and the disablement process. We also use the total number of
limitations as a proxy for severity of disability, and evaluate whether severity varies
across conditions. We further examine reported medical care and assistive services used
by disabled respondents, hypothesizing that greater use of medical care and assistive
services may reflect more severe disability.
Chronic Conditions Leading to Disability
A large body of research has demonstrated the importance of chronic disease as
the primary contributor to disability (Kosorok, Omenn et al. 1992; Guccione, Felson et al.
1994; Boult, Altmann et al. 1996; Ferrucci, Guralnik et al. 1997; Aguero-Torres,
Fratiglioni et al. 1998; Dunlop, Manheim et al. 2002; Wolff, Boult et al. 2005; Song J,
Chang RW et al. 2006). However, these studies often limit attention to the non-
institutionalized elderly population, thus omitting important conditions such as dementia,
or focus on a small number of conditions. Further, studies were often conducted on non-
representative samples. In this paper, we extend these prior results by examining the
share of disability attributable to a wide range of clinical conditions in a nationally
representative sample.
Characteristics of Disabled Respondents Attributing Disability to Symptoms or Old age
The prior literature provides conflicting evidence on whether chronic disease is
responsible for the majority of disability attributed to “old age” or symptoms by elderly
respondents, or whether these respondents are identifying a pathway to disability that is
largely independent of chronic disease. Research supporting the idea that the elderly may

9
attribute declines in health related to chronic conditions to old age or symptoms include a
study of 230 community dwelling elderly that found that those who attributed their
disability to old age were similar to those not reporting old age as the cause of their
disability in terms of age, gender and race, but were more likely to have chronic
conditions, such as arthritis, heart disease or hearing difficulties (Williamson and Fried
1996). In addition, several regional studies (Ettinger, Fried et al. 1994; Williamson and
Fried 1996; Leveille, Fried et al. 2002; Leveille, Fried et al. 2004) demonstrated strong
relationships between specific diseases and symptoms. For example, elderly who cited
pain as a primary cause of their disability were also likely to cite arthritis when asked for
a condition cause, and they had a high prevalence of arthritis confirmed by clinical
examination; disability attributed to fatigue and shortness of breath was associated with
lung and heart disease.
In contrast, Leveille et al. (2002) found that women who were unable to cite
specific chronic conditions causing their disability were often better able to name
symptom causes. They also found little association between certain symptoms, such as
fear of falling and general weakness, and chronic conditions, suggesting that at least
some of the disability attributed to symptoms or old age is not directly related to common
disabling chronic conditions. The literature on frailty generally supports the notion of a
pathway to disability that is not a direct result of chronic disease, but instead is associated
with age-related loss of physical condition and reserve. For example, Guralnik et al.
(1995) found that objective measures of physical functioning among non-disabled elderly
predicted subsequent disability even after controlling for chronic conditions (Guralnik,
Ferrucci et al. 1995). Other authors have argued for the importance of frailty as a

10
separate concept from comorbidity and have found that frailty is associated with
disability independently of chronic disease (Ferrucci, Guralnik et al. 1996; Lunney, Lynn
et al. 2003; Fried, Ferrucci et al. 2004).
In this paper, we seek to resolve some of this conflict by further analyzing the
characteristics of respondents who attribute disability to either old age or symptom causes
as opposed to chronic or acute medical conditions. In particular, we compare severity of
disability and use of medical and assistive services to identify systematic differences
across these populations that may suggest a pathway to disability independent of diseases
and conditions.
Data and Methods
We used data from the National Long Term Care Survey. The NLTCS is a
longitudinal, nationally representative survey of the Medicare population that was
designed to study changes in the health and functional status of elderly Americans.
Starting in 1982, a random sample of approximately 20,000 Medicare beneficiaries
completed a screening interview. Those found to have a chronic disability2 were then
asked to complete a detailed survey. Follow-up surveys were conducted in 1984, 1989,
1994 and 1999. Chronically disabled respondents who survived until the next survey
2Defined as residence in a long term care facility, the inability to perform one of 9 ADLs (eating, getting in
or out of bed, getting in or out of chairs, walking around inside, going outside, dressing, bathing, getting to
the bathroom or using the toilet, controlling bowel movements or urination) without personal assistance or
special equipment or one of 7 IADLs (preparing meals, laundry, light housework, shop for groceries,
manage money, take medicines, use the telephone) without help because of disability or health problem for
at least 90 days.

11
were automatically contacted for detailed follow-up surveys. In addition, at each
subsequent wave of the survey, a sub-sample of non-disabled respondents from the
previous wave were contacted for a new screener interview and those found to be
chronically disabled were asked to complete the detailed survey. Finally, at each wave a
random sample of approximately 5,000 Medicare beneficiaries who reached age 65
between waves of the survey were screened in order to maintain a nationally
representative sample of the Medicare population. Over the 5 waves of the survey more
than 90,000 screening interviews were performed, leading to over 32,000 detailed
interviews (Manton and Gu 2001). Approximately 20% of 1994 and 1999 surveys were
completed by proxy respondents (Freedman, Crimmons et al. 2004).
The NLTCS has several important strengths. First, the longitudinal design with
age-in cohorts allows us to obtain national estimates. Second, response rates for both
screener interviews and detailed surveys were over 95% in each wave. In addition,
survey data has been linked to Medicare administrative data, providing detailed
information on the existence of clinical conditions for which respondents were receiving
care.
Study Cohorts:
Our analyses are based on non-disabled respondents from the 1994 survey whose
disability and vital status is known in 1999. From the cohort of 12,366 participants in the
1994 survey who were not chronically disabled, we excluded a) 1,568 participants who
were not 65 years old on January 1, 1992, in order to assure complete claims data in the
baseline period prior to 1994, b) 10 participants who could not be matched to Medicare
data, c) 1,231 respondents whose disability status was unknown in 1999 because they

12
were not re-sampled (n=752) or lost to follow-up (n=479), and d) 1,830 participants
enrolled in an HMO for 6 months or longer, leaving an analytic cohort of 7,727
participants.
Disability Measures:
Subjects were considered newly disabled if they reported any ADL or IADL
limitations in the 1999 detailed survey3 or if they were institutionalized at the time of the
1999 survey. Limitations on 6 specific ADL tasks (eating, getting in and out of bed,
getting around inside, dressing, bathing, toileting) were obtained from the detailed
interviews of both community based and institutionalized respondents. Limitations on 8
specific IADL tasks (light housework, laundry, preparing meals, shopping for groceries,
getting around outside, managing money, taking medications, using the telephone) and 9
functional limitations (difficulty climbing a flight of stairs, walking across a room,
bending to put on socks, lifting a 10-lb object, reaching above the head, using fingers to
grasp and handle small objects, seeing well enough to read newsprint, speaking, and
hearing) were also obtained from the detailed interviews with community-based
respondents.
We grouped the 14 individual ADL and IADL tasks into categories for several
analyses. To explore the empirical relationships among the specific tasks, we fit a
principal component model to the 5,787 non-disabled respondents in the 1994 NLTCS
who survived to 1999 and completed a screener interview. We found that 3 factors could
3 Respondents were classified as disabled on an ADL task if they reported that someone helped them
perform the task, if someone stayed nearby in case they needed help, or if they used special equipment to
perform the task. Respondents were classified as disabled on an IADL task if they report that they cannot
do the task because of disability or health problem.

13
explain 85% of the total variance in the 14 items. Similar to Fried et al. (1994), one of
these factors was strongly associated with more complex IADL tasks requiring cognitive
abilities (cooking, laundry, light housekeeping, grocery shopping, managing money and
using the telephone). Also as in the Fried et al. analysis, difficulty getting around outside
(typically considered an IADL) was more strongly related to mobility-related ADL tasks
than the other IADL tasks. Thus, we used the aggregation of tasks employed by Fried et
al (1994) to summarize our 14 ADL and IADL measures into three major types of
disability: 1) mobility disability (getting out of bed, walking inside, walking outside the
home), 2) disability in complex tasks (cooking, laundry, light housework, grocery
shopping, managing money and using the telephone) and 3) disability in self-care tasks
(eating, dressing, toileting and bathing). Following theoretical and empirical work
suggesting hierarchies in the disablement process, we consider disability in basic self-
care tasks to represent the most severe type of disability and mobility disability to
represent early manifestations of loss of functional abilities.
Detailed interviews of the community-based disabled also asked respondents to
report the heath conditions they believed were the cause of their disability. Respondents
were able to list up to 10 conditions, and eighty-nine percent of the community-based
respondents (n-892) provided at least one response. We developed a coding scheme that
summarized free text responses into: a) chronic conditions b) acute events c) physical
symptoms that were not directly linked to clinical condition (such as weakness, lack of
balance, or pain) or d) old age. These categories were not mutually exclusive, as
respondents often reported multiple causes. We also coded a set of binary indicators of
specific chronic conditions and acute events, and modified a recently validated taxonomy

14
of self-reported symptom causes to classify symptom causes as pain, balance, weakness,
endurance or other symptom.(Leveille, Fried et al. 2004) Both authors independently
coded the free-text responses. Agreement was high, with kappas ranging from 0.7 to 1.0
for chronic and acute conditions. Agreement was slightly lower for symptom causes
(ranging from 0.3 for upper extremity pain to 1.0 for hearing). Final coding was based on
consensus when there was disagreement.
Other Variables:
Mortality and information about the existence of 31 chronic conditions4 were
obtained from Medicare administrative data. We examined the prevalence of chronic
conditions over two time frames. Participants were coded as having the clinical condition
at baseline if there was at least one inpatient claim or 2 non-hospital claims (outpatient,
home health, SNF or hospice) with a primary or secondary diagnosis of interest between
January 1, 1992 and December 31, 19945. Similarly, participants were coded as
4 These mutually exclusive categories were previously defined on the basis of prevalence of ICD-9
diagnosis and their observed relationship with disability (McClellan, M. and L. Yan (2000). Understanding
disability trends in the U.S. elderly population: The role of disease management and disease prevention.
Department of Economics. Stanford University, Cutler, D. M. (2005). Intensive medical technology and the
reduction in disability. Analyses in the Economics of Aging. D. A. Wise. Chicago, The University of
Chicago Press: 161-184. See Table A1 in the Appendix for list of clinical conditions and associated ICD-9
codes.
5 We examined several alternative coding schemes for clinical conditions. First we considered rules that
considered a respondent to have the condition if there were any claims for the condition (inpatient,
outpatient, SNF, home health or hospice). In addition, we examined a two-year window (Jan 1 1993-Dec
31 1994) for conditions existing prior to baseline. Based on examination of the prevalence of conditions,
the persistence of conditions across time frames and the association with self-reported conditions, in

15
developing the condition between surveys if they had at least one inpatient claim or 2
non-hospital claims with a primary or secondary diagnosis of interest between January 1,
1995 and December 31, 1999. We then combined these two timeframes and examined
the impact of having the condition either at baseline or developing the condition between
the surveys on the likelihood of developing disability6.
Demographic variables (age, gender, race and marital status) were obtained from
the screener surveys. Detailed interviews with community-based disabled respondents
provided information on the use of health care and assistive services, including any
nursing home stays, hospitalizations in the past year, visits in the past month to the
emergency room, physicians, and physical, occupational, speech or hearing therapists, as
well as home health services in the past month, and the number of prescription
medications obtained in the previous month. The detailed survey also asked respondents
about their living arrangements, including whether they were living in an assistive living
setting with board and/or personal care services available.
Analyses:
addition to an examination of prior literature, we determined that a 3 year look-back for the baseline period
and the requirement of at least 2 non-inpatient diagnoses provided the best compromise between sensitivity
and specificity for a majority of the conditions.
6 We included conditions developed between the surveys in order to study conditions such as dementia that
may be disabling over a short time frame. The associations between conditions and disability should be
interpreted cautiously as we do not know when the participant became disabled and thus some of the new
conditions may follow or even be a result of declining functional status (for example, a fracture may be the
result of weakness and/or loss of balance). However, for a majority of these conditions, the more likely
scenario is that the condition led to functional limitations and resulting disability.

16
Empirical Pathways to Disability
We fit multinomial regression models to estimate the relative importance of the
31 clinical factors in explaining any disability and differing types of disability. We fit
four separate models for any disability, mobility disability, disability in complex tasks
and disability in self-care tasks. In each case, the dependent variable was a categorical
variable with three levels: disabled in at least one specific task in the group, alive and not
disabled in at least one task in the group, or died before the 1999 survey. All regression
models included age (in 5 year categories), gender, marital status in 1994, race (coded as
white, black or other), the set of 31 indicators variables for each of the clinical conditions
and a binary variable equal to 1 if the respondent did not have any medical claims during
the study period. In addition, we examined interaction terms to understand the extent to
which combinations of diseases have synergistic effects on disability. To focus the
exploration of interactive effects, we included all pair-wise interactions of conditions that
were each estimated to cause at least 5% of incident of any type disability as measured by
the adjusted attributable fraction.
We used results from the multinomial regression models to compute adjusted
attributable fractions (Greenland and Drescher 1993). Attributable fractions estimate the
importance of the condition from a population perspective by combining the prevalence
of the factor with the strength of the association between the factor and future disability
status. Specifically, for each condition we estimated the reduction in each type of
disability that could be achieved by preventing the condition as the average predicted
probability of becoming disabled if none of the participants had the condition, holding all
other covariates at their observed values. A few clinical conditions were found to be
17
protective for mortality, disability, or both. As these effects are likely markers for either
improved access to treatments or relative health that allows for treatment of milder
chronic conditions (Jencks, Williams et al. 1988; Iezzoni, Foley et al. 1992), we did not
estimate attributable fractions for conditions that were protective of both disability and
death. In cases where a condition was estimated to be protective for death but positively
associated with disability, we computed attributable fractions for disability by setting all
negative mortality coefficients equal to zero and rescaling the intercept terms to match
observed overall proportions in our data.
Characteristics of pathways
We examined how the empirical pathways differed in terms number of limitations
and use of medical and assistive services to understand whether various pathways are
associated with more intensive medical and social service needs. We focused on the
conditions that were each responsible for at least 5% of incident disability. Note these
groups are not mutually exclusive, and in fact, there is a great deal of co-occurrence of
disabling diseases in this population. In these descriptive analyses, for each of the major
pathways, we compared disabled respondents with the condition to those without
evidence of the condition in their medical claims.
Self-reported causes of disability
Our second set of analyses describes self-reported causes of disability in the
newly disabled community-dwelling cohort (institutionalized respondents were not asked
to report the cause of their disability). We also examined the distribution of the number
of functional limitations and limitations in IADL and ADL tasks and described reported
use of medical and assistive services. In all analyses, we compared newly disabled

18
community dwelling respondents reporting old age or symptom causes to those who
reported only medical conditions as the cause of their disability.
Analytic weights that account for complex sampling scheme were used in all
analyses to provide estimates that reflect the national population of non-disabled
Medicare beneficiaries aged 67 and older in 1994. Specifically, cross-sectional weights
that accounted for complex sampling scheme and non-response to the 1994 survey were
augmented to account for sub-sampling of healthy respondents for a screener interview in
1999, non-response to the 1999 screener interview, and exclusion of patients enrolled in
an HMO by redistributing weights for healthy respondents in 1994 who were excluded
from our analyses to the respondents in our sample within cells defined by age and sex.
Statistical tests and standard errors were also corrected for the complex survey design
using approximations based on Taylor-series linearizations.
Results
Empirical Pathways to Disability
Sixty-six percent of non-disabled respondents in 1994 survived and remained
non-disabled to 1999, while 15.1% became disabled over the 5 year period and 18.9%
died between survey waves. Twelve, ten, and eleven percent of non-disabled
respondents to the 1994 survey developed one or more mobility-related, complex task or
self-care disabilities respectively between survey waves. Death and incident cases of
disability were more common among older, African American, and unmarried
respondents (Table 1). Females were more likely to become disabled but less likely to
have died compared to males. Hip and pelvic fractures, dementia, Parkinson’s and

19
related diseases, depression, and stroke had the strongest association with new cases of
disability. Most disabling conditions were also associated with death.
Regression models with main effects for the 31 conditions identified six clinical
conditions – arthritis, infectious disease, dementia, heart failure, diabetes and stroke –
that contributed to at least 5% of new cases of disability. Only 17% of elderly
respondents did not have one of these six conditions and a majority (54%) had two or
more.
Our final regression models included 15 pairwise interactions between the 6
largest contributors to overall disability. Regression results are presented in Table 2.
Several interactions were found to be important in these analyses. For any disability, the
interaction between diabetes and arthritis was positive, suggesting that these two
conditions have synergistic effects such that having both conditions was more disabling
than would be expected by the effects of each individual condition. In contrast, two
interactions with dementia were negative (stroke*dementia and heart failure*dementia),
suggesting that in the presence of a highly disabling condition like dementia, other
conditions have effects that are dampened relative to what would be expected when the
disease occurs in isolation. These general patterns were found in the analysis of each type
of disability, although the strength of the interactions (and their statistical significance)
varied some across the three types. In addition, several new interactions were important
for disability in complex tasks. In particular, stroke exacerbated the effects of both
diabetes and heart failure in disability in complex tasks.
Dementia in the absence of heart failure, stroke, arthritis, infectious disease or
diabetes had the strongest association with new disability of all types in multinomial

20
regression models (OR for any disability relative to remaining alive and health=8.0; 95%
CI=[4.6,13.8]). Other conditions with strong relationships with incident disability
included Parkinson’s and related disorders (OR for any disability =2.3 [1.8,3.0]), hip and
pelvic fractures (OR for any disability =2.1 [1.6,2.9]), colorectal and lung cancer (OR for
any disability =1.9 [1.4,2.4]), acute renal failure (OR for any disability =1.7 [1.1,2.7])
and heart failure in the absence of stroke, arthritis, infectious disease, diabetes or
dementia (OR for any disability =1.6 [1.1,2.4]). While many conditions were strongly
related to all three types of disability, the strength of the association varied for many of
these conditions. For example, infectious disease, heart failure and arthritis had the
strongest relationship with complex task disability, while hip and pelvic fractions were
strongly associated with mobility and self-care disability.
In adjusted models, divorced, separated or never married respondents and females
were more likely to become disabled. Race was not significantly associated with future
status after controlling for the other factors. We found some differences in the effect of
demographic characteristics on disability. In particular, women were more likely than
men to report new disabilities in mobility and self-care tasks but not with complex tasks.
Age, even after adjusting for a set of 31 clinical conditions and interactions
among the top six contributors, was strongly associated with disability. For example, the
adjusted odds of becoming disabled relative to remaining alive and non-disabled was 3.7
(95% CI=[2.7,5.1]) times higher for 80-84 year olds compared to 67-70 year olds. This
represents a 23% decline in the effect of age relative to a model that controlled only for
demographic factors.
Largest Contributors to Disability

21
Figures 1-4 display adjusted attributable fractions for each type of disability based
on regression results. Attributable fractions, a combination of the prevalence of the
conditions and their association with disability, estimate the proportion of disability that
was explained by each condition, holding all other characteristics of the respondents
constant. Although arthritis was only moderately associated with incident disability (OR
for any new disability=1.5 [1.1,2.1]), because it is common condition it was the largest
contributor, accounting for 13% of any new disability. Five other conditions --
infectious diseases, dementia, heart failure and arrhythmia, diabetes and stroke –
contributed to at least 5 percent of new cases of disability and these six top conditions
together explained almost half (48%) of new cases.
We observed some heterogeneity in these pathways across the different types of
disability (Figures 2-4). Arthritis was the largest contributor to impairments in mobility
(explaining 17% of this type of disability), but played a much less prominent role in
disability in complex tasks. Similarly, stroke contributed most to less severe forms of
disability and explained only 4% of disability associated with self-care tasks. Dementia
was a large contributor to overall disability, was responsible for almost a quarter of
disability in completing complex tasks and was also the largest contributor to the most
severe form of disability, dependence in self-care tasks. Ischemic heart disease, which
was not found to be a prominent contributor to overall disability, explained more than
one in 20 cases of new disability in self-care tasks. Not all diseases, however,
demonstrated such specificity. For example, heart failure and infectious disease played a
prominent role in all three types of disability, each explaining between 10 and 15% of
each type of disability.

22
Characteristics of pathways
Almost all (96%) of newly disabled respondents had at least one of the top six
conditions leading to disability – dementia, stroke, heart failure, infectious diseases,
arthritis, or diabetes. Moreover there was substantial overlap among the six pathways:
only 12% of the newly disabled cohort had only one of the six conditions and two thirds
had three or more.
Figure 5 displays the average number of functional limitation, IADL limitations,
and ADL limitations in newly disabled respondents according to diagnoses in their
medical claims (Table A2 in the appendix provides information on specific limitations).
The newly disabled cohort had a large number of each type of limitation. Physical
limitations in particular were quite prevalent with community-dwelling respondents
reporting 3.3 limitations on average. Even the most severe forms of disability, inability
to perform ADL tasks, were prevalent, with respondents reporting on average 2.6 ADL
limitations. Newly disabled respondents with dementia reported the largest number of
limitations of each type, including more than 4 IADLs on average. Newly disabled
respondents with each of the top six conditions were more likely to report functional
limitations compared to those not reporting the condition and most of the conditions
(dementia, stroke, heart failure and infectious diseases) were associated with higher
number of limitations of each type. However, neither arthritis nor diabetes was
associated with higher numbers of IADL limitations and diabetes was not associated with
a higher number of ADL limitations.
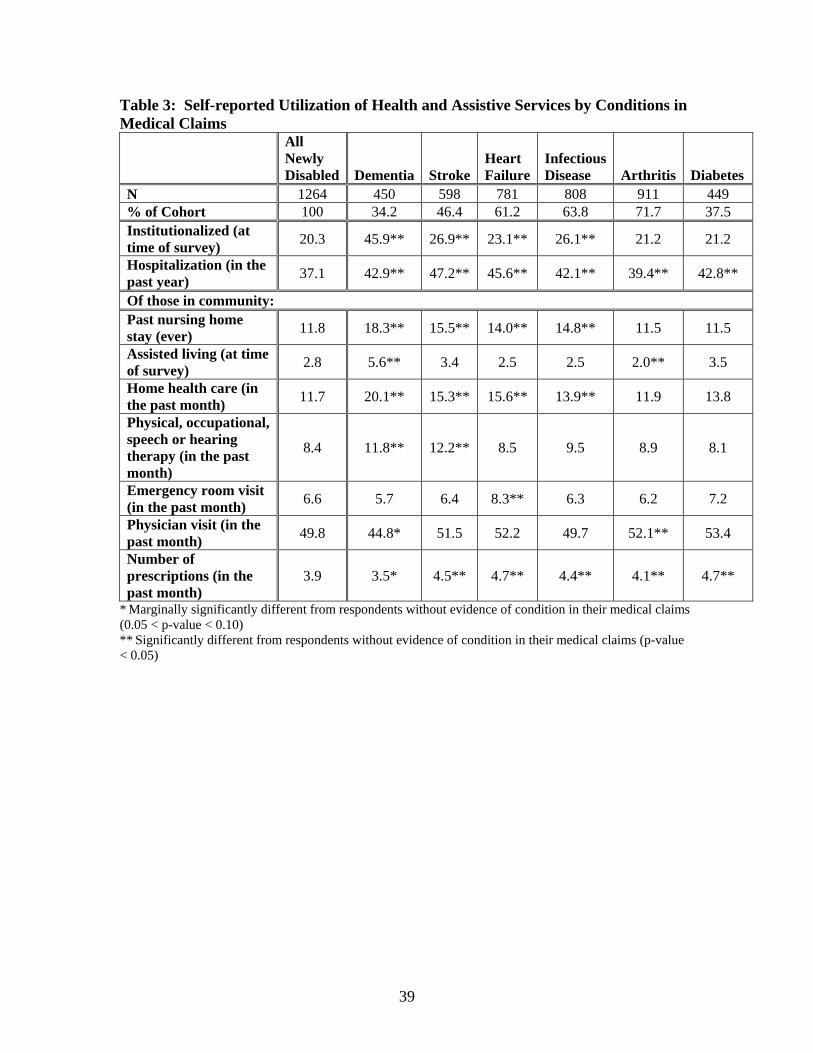
We present self-reported utilization of health care and assistive services in Table
3. Approximately 20% of the newly disabled cohort was institutionalized, of those living

23
in the community 12% reported past nursing home stays; however, only a small number
reported living in assistive living facilities Institutionalization and nursing home stays
were most likely among newly disabled respondents with dementia, stroke, heart failure
or infectious diseases. Those with dementia were also most likely to receive supportive
services, including physical and occupational therapy and home health services. In
addition, health care use was high among this cohort. Approximately half of newly
disabled respondents reported a physician visit in the prior month, over a third reported a
hospitalization in the prior year, and they reported filling an average of 4 prescriptions in
the past month. Health care utilization was highest among respondents with stroke, heart
failure and diabetes, and lowest among respondents with dementia and arthritis.
Self-reported causes of disability
Over half of the newly disabled community-dwelling respondents reported a
chronic condition was a factor in their limitations, while 30% reported an acute event
(Table 4). Musculoskeletal problems and cardiovascular diseases were the most common
reported cause of disability. Dementia, lung diseases, diabetes, eye diseases, surgeries,
fractures and falls were also commonly cited causes of disability. While a majority of
respondents reported chronic or acute medical conditions as the cause of their disability,
30% reported symptoms that were not directly linked to a chronic or acute health
problem, and 14% of respondents reported that old age contributed to their disability.
Respondents often cited multiple causes and those citing symptoms and old age
often cited specific acute and chronic conditions as well. We report conditions cited by
these respondents in Table 5. Among respondents reporting symptoms, 44% and 21%
reported at least 1 chronic or acute condition, respectively, while the remaining 41%

24
reported only symptoms. Heart disease was the most frequently reported condition
among those citing symptom causes. Only 8% of those reporting symptom causes also
cited old age as a contributor. Old age was the only reported cause for forty-six percent
of respondents attributing their disability to old age. About a third of respondents citing
old age as a cause of their disability also cited a chronic condition and 13% cited acute
causes. Arthritis was the most commonly cited condition among those attributing
disability to old age.
Table 6 reports characteristics of newly disabled respondents according to self-
reported cause of disability. Respondents citing old age were more likely to be female,
African American and widowed at the time of the 1999 survey and were approximately 4
years older (80.2 versus 75.8 years old) than those citing only medical causes. However,
they were no more likely to have any of most disabling clinical conditions, and in fact
were less likely to have diagnoses of arthritis, diabetes, Parkinson’s and related diseases
and respiratory diseases compared to respondents who did not cite old age as a cause of
their disability. Respondents reporting symptoms were also often less likely to have
disabling conditions compared to those reporting chronic condition or acute event.
However, patients reporting pain/discomfort or weakness as a cause of their disability
were more likely to have evidence of arthritis. Respondents citing weakness were more
likely to be female. However, the sample sizes were small in several of these categories
making precise inference difficult.
Types and Severity of Limitations
We report the number of functional limitations, IADL limitations and ADL
limitations according to self-reported cause of disability in Figure 6 (Table A3 in the
25
appendix provides information on specific limitations). Newly disabled respondents
reporting only chronic or acute conditions reported more functional limitations than
respondents who reported old age, and significantly more ADLs and IADLs then
respondents who reported symptoms.
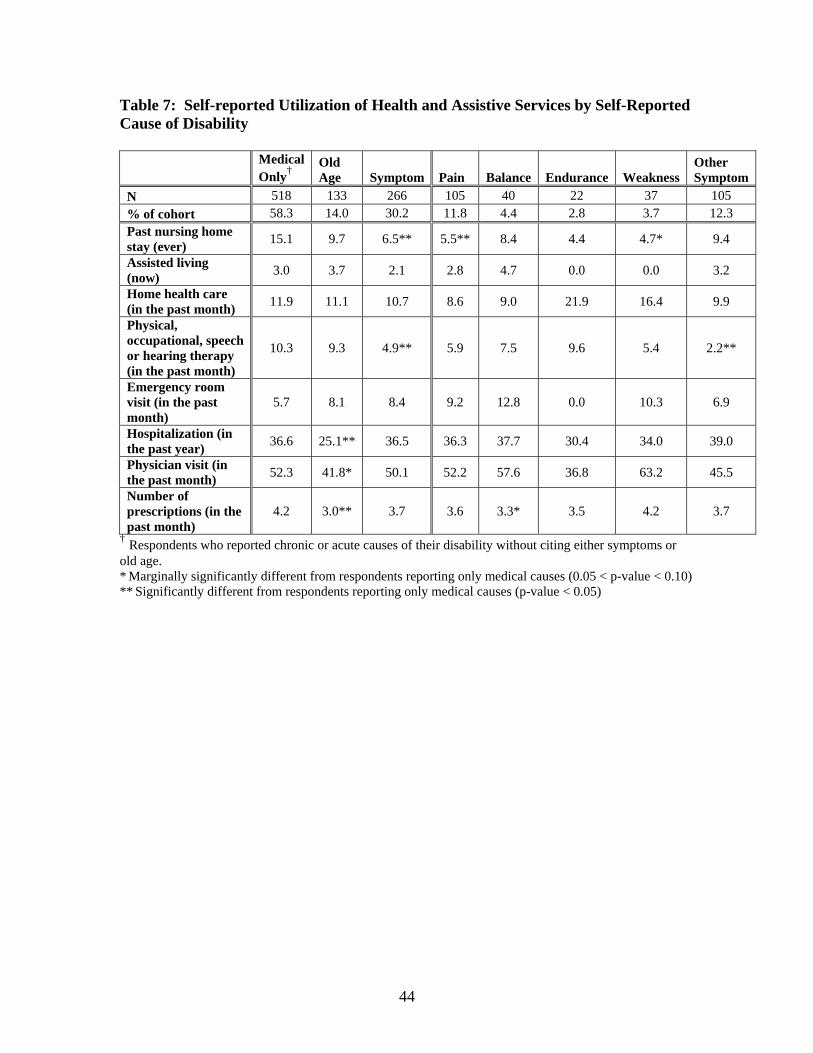
Medical and Assistive Services
We present self-reported utilization of health care and assistive services in Table
7. Past nursing home stays were highest among those who reported clinical causes and
lowest among those citing symptoms. Respondents citing symptom causes were also less
likely to report use of physical or occupational therapy services. Consistent with the
observation that respondents citing old age or symptoms were less likely to have
evidence of clinical conditions in their medical claims, these respondents have lower
levels of health care utilization (physician visits, medications, and hospitalizations).
However, health care use was high in all groups. Forty percent of respondents citing old
age reporting a physician visit in the past month and a quarter reported being hospitalized
in the previous year, suggesting sufficient contact with the health care system to receive
care for chronic conditions.
Discussion
Analyzing 31 clinical conditions, we estimated that arthritis, dementia, infectious
diseases, heart failure, diabetes and stroke each explained at least 5% of incident
disability. These top 6 conditions together explained almost half of new disability
(48%). Consistent with these findings, arthritis, stroke, dementia and heart disease were
the conditions most often mentioned among respondents who reported an acute or
chronic condition as a cause of their limitation.

26
We also found that newly disabled respondents with these six conditions typically
experience problems in multiple categories of functional limitations, ADL and IADL
tasks. Elderly patients with any of these six conditions were also more likely to have
been hospitalized in the past year and had a greater average number of prescription drugs
in the past month compared to the average newly disabled patient. However, there were
differences across these pathways in the types of disability experienced and in the use of
services. For example, dementia represents the pathway most strongly associated with the
most severe types of disability and the largest number of reported limitations. Newly
disabled respondents with dementia were also the heaviest users of supportive services,
including nursing home residence. In contrast, arthritis, while being the largest
contributor to overall disability, was associated most strongly with mobility limitations
and newly disabled respondents with arthritis used relatively few supportive and medical
services.
Our comparison of newly disabled respondents who attributed their disability to
old age or symptoms to those citing chronic or acute medical conditions also
demonstrated important differences. First, we found that those who reported age as a
cause of their disability had similar or lower levels of disabling conditions compared to
those who reported a clinical condition. In addition, newly disabled respondents
attributing disability to symptom causes or old age tended to have less severe disability
and use fewer supportive services. While those citing old-age had lower use of health
care, there were sufficient interactions with clinicians (42% report visit with a physician
in prior month) to have had chronic disease diagnosed. These results suggest those
reporting old age or symptoms represent a different “pathway”, i.e. frailty or “pre-

27
clinical” disease that leads to their disability. The importance of infectious diseases in
our empirical models also suggests a role for heightened vulnerability in the elderly as
past diagnoses of infectious diseases may be a marker for frailty.
We found that self-reported causes and empirical analyses of claims-based
measures provided complimentary information. Claims-based diagnoses were available
on all respondents and empirical models allowed us to estimate the fraction of disability
attributable to each condition independently of the other conditions. However, binary
measures of diagnoses from medical claims may not adequately capture disease severity.
In addition, claims-based analyses did not capture most visual and hearing impairments,
which have been shown to be important correlates of disability here and in other studies
(Kosorok, Omenn et al. 1992; Dunlop, Manheim et al. 2002). Analyses based on self-
reported causes, which were only collected from community-based respondents, may
underestimate the effect of highly disabling conditions like dementia. Given the differing
strengths and weaknesses of clinical data and self-reports, future attempts to measure
causes of disability should combine the two approaches.
These analyses have important implications. First, an understanding of the major
contributors to disability in the late 1990’s, provides insight into potential future trends in
the health of the elderly. We found that conditions without effective medical treatments
– in particular dementia – were major contributors to disability in older persons.
Alzheimer’s and other forms of dementia are highly disabling progressive diseases with
few effective interventions to slow their progression,(Cummings and Cole 2002) Until
effective treatments are found, dementia-related disability is likely to increase in
importance. In contrast, many conditions, in particular stroke, heart disease and arthritis,

28
are amenable to both medical and lifestyle interventions, suggesting that increased use of
effective medical therapies and control of risk factors could lead to continued
improvement in the health of the elderly.(Manton 1989; Boult, Altmann et al. 1996;
Singer and Manton 1998) However, obesity rates continue to rise and obesity is a risk
factor for four of the six most important pathways in our analysis (arthritis, heart failure,
stroke and diabetes). The increase in obesity rates in the elderly and non-elderly
population, coupled with increases in disability rates in younger populations, have led
others to suggest that disability rates in older persons will increase in the
future.(Lakdawalla, Bhattacharya et al. 2004; Leveille, Wee et al. 2005) Moreover, a
recent study found that obesity contributed to an increasing number of cases of arthritis
between 1971 and 2002.(Leveille, Wee et al. 2005)
Second, our results suggest potential avenues for medical and other interventions
to alleviate dependence in the elderly. We found that various diseases and conditions are
specific to different types of disability. This suggests that interventions to prevent or
reduce disability may be targeted to different types of tasks, depending on the medical
condition experienced by the patient. Interventions likely need to be targeted to multiple
ADL and IADL tasks within a category of disability, as the six diseases and conditions
were associated with limitations in multiple tasks.
In addition, medical care and assistive service utilization varied across conditions,
suggesting that there may be variation in opportunities to intervene through medical and
non-medical services. For example, while respondents with dementia had relatively low
rates of hospitalizations and physician visits, almost half were institutionalized and 20%
were using home health services. Until effective medical interventions are available for
29
dementia patients, current interventions may be best targeted through supportive care
services and within their living environment. In contrast, newly disabled respondents
with arthritis were relatively infrequent users of intensive inpatient or nursing home care,
but had higher than average use of medications and physician visits, suggesting that
interventions for disability assessment and prevention services among these patients may
be most effectively conducted by physicians. For all diseases and conditions studied,
improved medical care in the future may help to reduce disability.
Our analyses of newly disabled respondents attributing their disability to old age
or symptoms suggest a greater focus on physician-based assessment of preclinical disease
and treatment of symptoms in order to prevent disability. The large number of disabled
respondents in the community who cited old age as a cause of disability may also imply
that elderly respondents have low expectations for interventions, either medical or
otherwise, to help them function independently. Physician-based interventions may help
to educate patients about expectations for functioning and additional medical care
treatments and interventions to minimize disability.
In conclusion, we identified 6 major clinical pathways to disability that account
for almost half incident disability, but differ in the types of disability experienced and use
of medical and assistive services. These results have important implications for future
trends in the health of the elderly population, highlighting substantial challenges to
continued improvement in disability.

30
Table 1. Health status at follow-up according to demographic and clinical characteristics of study cohort
Status at 1999 Interview (%) % of
Cohort (N=7727)
Newly Disabled
Deceased
Alive and Non-
Disabled P value
All respondents 100 15.1 18.9 65.9 Age in 1994 <0.001 67-69 22.5 8.8 11.1 80.2 70-74 34.3 10.5 13.9 75.6 75-79 23.6 18.6 20.9 60.5 80-84 13.0 25.6 28.5 45.9 85-89 5.3 29.4 43.4 27.2 90 and over 1.3 21.5 57.5 21.0 Race 0.008 White 91.7 15.1 18.7 66.2 Black 6.6 16.3 24.1 59.7 Other 1.7 9.6 12.3 78.2 Gender <0.001 Female 56.7 17.7 15.6 66.7 Male 43.3 11.7 23.3 65.0 Marital Status in 1994 <0.001 Married 56.5 12.4 16.3 71.3 Widowed 32.0 19.4 21.6 59.0 Divorced/separated/ never married 9.0 18.2 21.2 60.5
Unknown 2.5 11.5 36.2 52.3 Clinical Conditions†
Hip & pelvic fracture 6.1 34.6 28.8 36.6 <0.001 Dementia & organic brain diseases 15.3 33.9 36.5 29.6 <0.001
Paralysis, Parkinson’s and related diseases 10.7 30.3 34.8 34.9 <0.001
Depression 13.3 27.1 22.7 50.3 <0.001 Stroke 29.9 23.5 25.7 50.9 <0.001 Other mental disorders 24.2 22.3 24.6 53.1 <0.001 Chronic renal failure 6.9 22.1 44.3 33.6 <0.001 Peripheral vascular disease 32.5 21.9 23.6 54.5 <0.001
Heart failure & arrhythmia 44.2 20.9 29.9 49.2 <0.001
Diabetes 28.0 20.3 21.8 58.0 <0.001 Infectious diseases‡ 47.9 20.2 22.5 57.3 <0.001 Respiratory failure 23.1 20.0 37.6 42.4 <0.001

31
Anemia 42.1 19.6 24.2 56.3 <0.001 Other blood diseases 16.3 19.1 29.5 51.4 <0.001 Thyroid disorders 30.6 18.9 17.4 63.7 <0.001 Arthritis & arthropathy 58.6 18.5 16.4 65.1 <0.001 Ischemic heart disease 49.8 18.5 23.0 58.6 <0.001 Back/neck pain 50.9 18.2 16.3 65.5 <0.001 COPD & related diseases 49.6 17.4 21.7 61.0 <0.001 Hypertension 75.2 17.0 18.8 64.2 <0.001 Respiratory diseases 71.8 16.9 21.4 61.7 <0.001 Other circulatory diseases 76.1 16.8 20.9 62.3 <0.001
Acute renal failure & insufficiency
4.7 16.8 60.8 22.5 <0.001
Other metabolic & immunity disorders
70.7 16.6 19.5 64.0 <0.001
Musculoskeletal disorders
84.5 16.5 18.8 65.8 <0.001
Gastrointestinal diseases 73.1 16.3 20.1 63.7 <0.001 Colorectal & lung cancer 7.7 16.3 43.7 40.0 <0.001 Glaucoma & cataract 70.9 16.2 15.5 68.4 <0.001 Genitourinary diseases 77.2 16.1 18.8 65.1 <0.001 Other cancers 60.7 14.8 19.6 65.6 0.14 Breast & prostate cancer 13.0 13.4 22.4 64.2 0.006
No Condition (no claims) 5.4 9.0 16.1 74.9 0.001 †Respondents are consider to have the condition if there was at least one inpatient claim or 2 non-hospital claims (outpatient, home health, SNF or hospice) with a primary or secondary diagnosis of interest between Jan 1, 1992 to December 31, 1999 ‡Not including pneumonia, acute respiratory infections or influenza All percentages based on weighted sample size. Statistical tests account for complex survey design. Conditions are ordered based on strength of their relationship with disability. COPD=chronic obstructive pulmonary disease

32
Table 2. Multinomial Regression Estimates of the Association between Clinical Conditions and Any, Mobility, Complex Task and Self-Care Disability
Variable
Any Disability vs. Health Coefficient (SE)
Mobility Disabled vs. Healthy Coefficient (SE)
Complex Task Disabled vs. Healthy Coefficient (SE)
Self-care Disabled vs. Healthy Coefficient (SE)
Diseases/Conditions Dementia & organic brain diseases 2.08 (0.28)** 2.00 (0.28)** 2.67 (0.29)** 1.79 (0.28)**
Paralysis, Parkinson’s and related diseases 0.84 (0.14)** 0.98 (0.15)** 1.14 (0.14)** 1.07 (0.13)**
Hip & pelvic fracture 0.76 (0.15)** 0.75 (0.16)** 0.58 (0.17)** 0.90 (0.17)** Colorectal &/or lung cancer 0.62 (0.14)** 0.61 (0.16)** 0.63 (0.18)** 0.53 (0.17)** Acute renal failure & insufficiency 0.54 (0.24)** 0.58 (0.26)** 0.74 (0.25)** 0.47 (0.24)** Heart failure & arrhythmia 0.48 (0.19)** 0.41 (0.20)** 0.99 (0.27)** 0.44 (0.23)* Arthritis & arthropathy 0.40 (0.18)** 0.44 (0.19)** 0.71 (0.24)** 0.56 (0.22)** Respiratory failure 0.38 (0.09)** 0.37 (0.11)** 0.43 (0.12)** 0.56 (0.11)** Chronic renal failure 0.32 (0.16)** 0.43 (0.17)** 0.31 (0.18)* 0.34 (0.17)* Depression 0.30 (0.11)** 0.39 (0.12)** 0.38 (0.12)** 0.33 (0.12)** Other mental disorders 0.27 (0.10)** 0.30 (0.11)** 0.31 (0.13)** 0.23 (0.11)** Infectious diseases 0.22 (0.21) 0.41 (0.27) 0.65 (0.24)** 0.33 (0.24) Peripheral vascular disease 0.14 (0.08)* 0.22 (0.09)** 0.20 (0.11)* 0.14 (0.09) Respiratory diseases 0.14 (0.10) -0.04 (0.12) 0.17 (0.13) 0.11 (0.12) Stroke 0.13 (0.22) 0.02 (0.25) -0.10 (0.27) 0.39 (0.25) Anemia 0.12 (0.10) 0.11 (0.11) 0.00 (0.11) 0.03 (0.12) Other blood disease 0.10 (0.11) 0.17 (0.12) 0.28 (0.13)** 0.04 (0.11) COPD & related diseases 0.05 (0.09) 0.09 (0.09) 0.06 (0.10) 0.02 (0.10) Back/neck pain 0.05 (0.10) -0.01 (0.09) -0.02 (0.10) 0.02 (0.10) Hypertension 0.05 (0.12) 0.18 (0.13) 0.04 (0.14) 0.02 (0.12) Ischemic heart disease 0.04 (0.09) 0.02 (0.10) -0.02 (0.11) 0.12 (0.11) Musculoskeletal disorders -0.01 (0.18) -0.01 (0.20) -0.11 (0.21) 0.09 (0.21) Diabetes -0.02 (0.22) 0.03 (0.25) 0.30 (0.28) -0.06 (0.28) Genitourinary diseases -0.04 (0.11) -0.12 (0.12) -0.15 (0.14) 0.03 (0.13) Thyroid Disorders -0.04 (0.09) -0.13 (0.09) -0.11 (0.10) 0.01 (0.09) Breast &/or prostate cancer -0.06 (0.13) 0.04 (0.13) -0.16 (0.15) -0.12 (0.13) Other metabolic & immunity disorders -0.11 (0.13) -0.20 (0.14) -0.18 (0.13) -0.10 (0.13)
Other circulatory diseases -0.13 (0.11) 0.07 (0.12) -0.27 (0.15)* -0.18 (0.15) Gastrointestinal diseases -0.20 (0.10)** -0.30 (0.10)** -0.15 (0.12) -0.14 (0.11) Glaucoma & cataract -0.24 (0.11)** -0.40 (0.12)** -0.17 (0.13) -0.23 (0.11)** Other cancers -0.26 (0.08)** -0.20 (0.09)** -0.30 (0.10)** -0.19 (0.09)** No diseases or conditions 0.12 (0.26) 0.05 (0.32) 0.37 (0.28) 0.23 (0.29) Interactions Infectious diseases and diabetes 0.22 (0.19) 0.21 (0.19) 0.03 (0.22) 0.26 (0.22) Infectious diseases and dementia -0.02 (0.19) -0.06 (0.21) 0.02 (0.23) 0.21 (0.22) Infectious diseases and heart failure 0.24 (0.19) 0.27 (0.20) -0.02 (0.23) 0.21 (0.21)
Infectious disease and arthritis -0.20 (0.19) -0.28 (0.21) -0.45 (0.22)** -0.25 (0.23)

33
Diabetes and dementia -0.23 (0.19) -0.22 (0.22) -0.58 (0.21)** -0.28 (0.24) Diabetes and heart failure -0.11 (0.19) -0.09 (0.22) -0.28 (0.26) 0.09 (0.24) Diabetes and arthritis 0.43 (0.19)** 0.47 (0.21)** 0.24 (0.24) 0.33 (0.27) Dementia and heart failure -0.50 (0.22)** -0.48 (0.22)** -0.60 (0.22)** -0.22 (0.24) Dementia and arthritis -0.38 (0.24) -0.25 (0.27) -0.38 (0.26) -0.18 (0.24) Arthritis and heart failure -0.07 (0.21) -0.03 (0.22) -0.35 (0.27) -0.14 (0.23) Stroke and infectious disease 0.15 (0.20) 0.07 (0.22) 0.11 (0.25) -0.13 (0.22) Stroke and diabetes 0.07 (0.19) 0.09 (0.21) 0.44 (0.24)* -0.09 (0.23) Stroke and dementia -0.41 (0.20)** -0.33 (0.21) -0.31 (0.20) -0.44 (0.20)** Stroke and heart failure 0.28 (0.18) 0.29 (0.21) 0.44 (0.22)** 0.29 (0.22) Stroke and arthritis -0.14 (0.18) 0.01 (0.20) -0.16 (0.20) -0.28 (0.20) Demographic Characteristics in 1994^
Age70 – 74 0.09 (0.15) -0.01 (0.17) 0.11 (0.19) 0.28 (0.17) Age75 – 79 0.77 (0.15)** 0.77 (0.16)** 0.84 (0.18)** 0.87 (0.19)** Age80 – 84 1.31 (0.16)** 1.33 (0.18)** 1.46 (0.19)** 1.44 (0.21)** Age85 – 89 1.74 (0.19)** 1.75 (0.20)** 1.97 (0.23)** 1.76 (0.22)** Age90 + 1.78 (0.37)** 2.02 (0.39)** 2.12 (0.40)** 2.06 (0.42)** Widowed 0.10 (0.09) 0.15 (0.10) 0.06 (0.10) 0.13 (0.11) Divorced, Separated or Single 0.45 (0.15)** 0.47 (0.16)** 0.24 (0.18) 0.35 (0.15)** Missing marital status -0.41 (0.28) -0.30 (0.28) -0.33 (0.34) -0.24 (0.27) Black 0.04 (0.21) 0.10 (0.20) 0.28 (0.22) -0.10 (0.20) Otherrace -0.29 (0.28) -0.48 (0.38) 0.11 (0.40) -0.08 (0.31) Female 0.28 (0.09)** 0.31 (0.10)** 0.06 (0.11) 0.22 (0.11)**
^Reference groups were individuals “age 65 – 69” for age categories, “married” for marital status indicators, and “white” for race variables. Conditions are ordered based on strength of their relationship with overall disability. Standard errors account for complex survey design. * 0.05 < p-value < 0.10 ** p-value < 0.05

34
Figure 1: Estimated Percentage of Any New Disability Attributable to Each Condition
0.0 2.0 4.0 6.0 8.0 10.0 12.0 14.0
Chronic renal failure
Ischemic heart disease
COPD & related diseases
Back/neck pain
Anemia
Hypertension
Hip & pelvic fracture
Respiratory diseases
Depression
Other mental disorders
Parkinson’s and relateddiseases
Peripheral vasculardisease
Stroke
Diabetes
Heart failure & arrhythmia
Dementia
Infectious diseases
Arthritis
Adjusted Attributable Fraction (%)

35
Figure 2: Estimated Percentage of Mobility Disability Attributable to Each Condition
0.0 5.0 10.0 15.0 20.0 25.0
Chronic renal failure
Ischemic heart disease
COPD & related diseases
Anemia
Hypertension
Hip & pelvic fracture
Respiratory diseases
Depression
Other mental disorders
Paralysis, Parkinson’s andrelated diseases
Peripheral vascular disease
Stroke
Diabetes
Heart failure & arrhythmia
Dementia & organic braindiseases
Infectious diseases
Arthritis & arthropathy

36
Figure 3: Estimated Percentage of Disability in Complex Tasks Attributable to Each Condition
0.0 5.0 10.0 15.0 20.0 25.0
Chronic renal failure
Ischemic heart disease
Other blood diseases
Hypertension
COPD & related diseases
Hip & pelvic fracture
Other mental disorders
Respiratory diseases
Depression
Peripheral vascular disease
Stroke
Diabetes
Arthritis & arthropathy
Paralysis, Parkinson’s andrelated diseases
Infectious diseases
Heart failure & arrhythmia
Dementia & organic braindiseases
Adjusted Attributable Fraction (%)

37
Figure 4: Estimated Percentage of Disability in Self-Care Tasks Attributable to Each Condition
0.0 5.0 10.0 15.0 20.0 25.0
Chronic renal failure
Back and neck pain
COPD & related diseases
Hypertension
Respiratory failure &insufficiency
Respiratory diseases
Other mental disorders
Stroke
Peripheral vascular disease
Depression
Hip & pelvic fracture
Ischemic heart disease
Diabetes
Paralysis, Parkinson’s andrelated diseases
Heart failure & arrhythmia
Infectious diseases
Arthritis
Dementia & organic braindiseases

38
Figure 5: Number of Limitations among Newly Disabled Respondents by Conditions in Medical Claims
0
0.5
1
1.5
2
2.5
3
3.5
4
4.5
5
Dementia Stroke HeartFailure
InfectiousDisease
Arthritis Diabetes
# of functionallimitations # IADLs
# ADLs
****
** **
******
******
****
**
** **
* Marginally significantly different from respondents without evidence of condition in their medical claims (0.05< p-value < 0.10) ** Significantly different from respondents without evidence of condition in their medical claims (p-value < 0.05) Institutionalized respondents are excluded from calculations of average numbers of functional limitations and IADLs tasks.
39
Table 3: Self-reported Utilization of Health and Assistive Services by Conditions in Medical Claims
All Newly Disabled Dementia Stroke
Heart Failure
Infectious Disease Arthritis Diabetes
N 1264 450 598 781 808 911 449 % of Cohort 100 34.2 46.4 61.2 63.8 71.7 37.5 Institutionalized (at time of survey) 20.3 45.9** 26.9** 23.1** 26.1** 21.2 21.2
Hospitalization (in the past year) 37.1 42.9** 47.2** 45.6** 42.1** 39.4** 42.8**
Of those in community: Past nursing home stay (ever) 11.8 18.3** 15.5** 14.0** 14.8** 11.5 11.5
Assisted living (at time of survey) 2.8 5.6** 3.4 2.5 2.5 2.0** 3.5
Home health care (in the past month) 11.7 20.1** 15.3** 15.6** 13.9** 11.9 13.8
Physical, occupational, speech or hearing therapy (in the past month)
8.4 11.8** 12.2** 8.5 9.5 8.9 8.1
Emergency room visit (in the past month) 6.6 5.7 6.4 8.3** 6.3 6.2 7.2
Physician visit (in the past month) 49.8 44.8* 51.5 52.2 49.7 52.1** 53.4
Number of prescriptions (in the past month)
3.9 3.5* 4.5** 4.7** 4.4** 4.1** 4.7**
* Marginally significantly different from respondents without evidence of condition in their medical claims (0.05 < p-value < 0.10) ** Significantly different from respondents without evidence of condition in their medical claims (p-value < 0.05)

40
Table 4. Self-reported causes of disability among the newly disabled cohort residing in the community (N=892) Cause N† %
Chronic Condition 489 54.8% Arthritis 186 22.2% Heart or circulatory disease (not including heart failure) 91 10.0% Dementia/memory problems 88 9.2% Lung disease (asthma, emphysema) 38 4.7% Diabetes 36 3.9% Eye disease (cataract, glaucoma, macular degeneration) 38 3.6% Cancer 30 3.4% Heart failure 23 2.8% Osteoporosis 19 2.4% Hypertension 21 2.4% Parkinson’s 14 1.7% Depression/other mental illness 6 0.7% Back disease 6 0.4% Other chronic condition 64 8.0% Acute Event 275 32.1% Stroke 83 10.1% AMI or bypass surgery 42 5.4% Hip/knee replacement 40 4.1% Other surgery 33 4.6% Hip fracture 36 3.6% Other fracture or fall 42 4.0% Amputation 7 1.0% Other acute event 34 3.9% Symptom not linked to condition 266 30.2% Pain/Discomfort (includes pain, swelling, stiffness and other problems) 105 11.8% Hips/knees 44 5.1% Back 30 3.4% Legs 25 3.0% Feet/ankle 13 1.5% Upper extremities 4 0.4% Other pain/discomfort 6 0.8% Balance 40 4.4% Unsteady/balance problems 31 3.4% Dizziness 12 1.5% Endurance 22 2.8% Shortness of breath 15 2.0% Fatigue 8 0.9% Weakness 37 3.7% General weakness 23 2.2% Lower body weakness 14 1.4% Other Symptoms 105 12.3% Vision/blindness 48 5.6% Hearing 16 2.0% Fear/security 9 1.1% Other symptom 38 4.3% Old Age 133 14.0% Respondents were able to list up to 10 causes for their disability. N represents the number of respondents who reported the condition or symptom as at least one cause of their disability. All percentages based on weighted sample size

41
Table 5: Chronic condition cited by Community-Dwelling Newly Disabled Respondents who also Cite Symptoms or Old Age as a Cause of Their Disability.
All Newly Disabled Old Age Symptom
N 892 133 266 % of Cohort 100 14.0 30.2 Chronic conditions 54.8 32.8 43.5 Arthritis 22.2 17.1 12.0 Heart disease 12.5 6.1 15.7 Lung disease 4.7 3.1 5.5 Dementia 9.2 6.2 4.8 Diabetes 3.9 1.5 5.4 Eye disease 3.6 0.0 2.6 Acute conditions 32.1 12.8 20.5 Hip fracture 3.6 0.9 2.5 Heart attack or open heart surgery 5.4 4.2 3.2 Stroke 10.1 4.6 5.9 Old Age 14.0 100.0 8.4 Old age only 6.5 46.0 0.0 Symptom 30.2 18.1 100.0 Symptom only 12.5 0.0 41.4 Pain 11.8 2.0 39.2 Balance 4.4 1.4 15.5 Endurance 2.8 5.0 9.1 Weakness 3.7 5.4 12.1 Other Symptom 12.3 7.2 40.8

42
Table 6: Characteristics of Newly Disabled Cohort According to Self-Reported Cause of Disability.
Medical
only† Old Age Symptom Pain Balance Endurance Weakness
N 518 133 266 105 40 22 37 % of cohort 58.3 14.0 30.2 11.8 4.4 2.8 3.7 Average Age 75.8 80.2** 76.4 76.3 76.2 77.2 77.0 Female 63.5 71.5* 67.2 68.2 55.4 61.2 88.7** Race * White 92.9 87.3 95.0 96.3 90.7 96.1 85.0 Black 6.0 9.6 4.4 3.2 9.3 3.9 11.3 Other 1.1 3.1 0.6 0.4 0.0 0.0 3.8 Marital Status (1994) Married 51.5 45.1 50.9 43.7 55.8 55.8 34.1 Widowed 37.2 43.0 36.3 44.5 30.5 28.4 44.1 Not Married 10.1 10.5 11.1 11.8 10.3 7.2 21.7 Missing 1.3 1.5 1.6 0.0 3.4 8.6 0.0 Marital Status (1999) ** Married 39.6 26.6 39.1 33.0 49.9 47.0 30.4 Widowed 51.8 68.8 52.1 57.3 44.1 37.3 63.4 Not Married 8.6 3.7 8.7 9.7 5.9 15.8 6.3 % with conditions/diseases‡: Arthritis & arthropathy 74.5 61.6** 69.9 80.9** 59.8 67.4 71.9
Infectious disease 61.1 51.1 58.1 63.7 47.4 54.2 42.4
Dementia & organic brain diseases
25.3 23.8 16.4** 13.2** 16.5 22.4 7.0†
Heart failure & arrhythmia 58.4 58.5 63.2 61.5 61.1 72.9 61.2
Diabetes 37.3 24.8** 40.8 41.7 39.2 24.6 38.0 Stroke 43.6 40.9 42.9 44.6 50.3 43.8 39.1 Peripheral vascular disease 44.6 41.1 44.0 39.3 35.7 45.2 52.7
Paralysis, Parkinson’s 22.5 9.3** 12.4** 12.5 15.5 16.2 3.6†
Depression 21.8 19.2 12.8** 10.9** 6.6 20.4 5.6 Other mental disorders 31.7 32.1 28.7 23.6 39.3 18.3 28.6
Respiratory diseases 80.5 72.2** 82.1 84.9 84.9 77.0 80.7
Hip & pelvic fracture 14.0 11.5 9.4 9.4 6.0 14.6 7.2
† Respondents who reported chronic or acute causes of their disability without citing either symptoms or old age. * Marginally significantly different from respondents reporting only medical causes (0.05 < p-value < 0.10) ** Significantly different from respondents reporting only medical causes (p-value < 0.05) ‡ Based on diagnoses in respondents medical claims.

43
Figure 6: Number of Limitations among Newly Disabled Respondents by Self-reported Cause of Disability
0
0.5
1
1.5
2
2.5
3
3.5
4
Medical Old Age Symptom
# of functional limitations # IADLs # ADLs
**
****
* Marginally significantly different from respondents reporting only medical causes (0.05< p-value < 0.10) ** Significantly different from respondents reporting only medical causes (p-value < 0.05)
44
Table 7: Self-reported Utilization of Health and Assistive Services by Self-Reported Cause of Disability
Medical Only†
Old Age Symptom Pain Balance Endurance Weakness
Other Symptom
N 518 133 266 105 40 22 37 105 % of cohort 58.3 14.0 30.2 11.8 4.4 2.8 3.7 12.3 Past nursing home stay (ever) 15.1 9.7 6.5** 5.5** 8.4 4.4 4.7* 9.4
Assisted living (now) 3.0 3.7 2.1 2.8 4.7 0.0 0.0 3.2
Home health care (in the past month) 11.9 11.1 10.7 8.6 9.0 21.9 16.4 9.9
Physical, occupational, speech or hearing therapy (in the past month)
10.3 9.3 4.9** 5.9 7.5 9.6 5.4 2.2**
Emergency room visit (in the past month)
5.7 8.1 8.4 9.2 12.8 0.0 10.3 6.9
Hospitalization (in the past year) 36.6 25.1** 36.5 36.3 37.7 30.4 34.0 39.0
Physician visit (in the past month) 52.3 41.8* 50.1 52.2 57.6 36.8 63.2 45.5
Number of prescriptions (in the past month)
4.2 3.0** 3.7 3.6 3.3* 3.5 4.2 3.7
† Respondents who reported chronic or acute causes of their disability without citing either symptoms or old age. * Marginally significantly different from respondents reporting only medical causes (0.05 < p-value < 0.10) ** Significantly different from respondents reporting only medical causes (p-value < 0.05)

45
Appendix
Table A1. Clinical Conditions
No. Condition ICD-9-CM Codes 1 Infectious diseases 001.*-139.*, 320.*-323.*, V09.* 2 Colorectal & lung cancer 153.*, 154.*, 162.* 3 Breast & prostate cancer 174.*-175.*, 185.* 4 Other cancers 140.*-239.* (~#2,#3), 611.72, V10 5 Diabetes 250.*, 251.3 6 Thyroid disorders 240.*-259.* (~#5) 7 Other metabolic &
immunity disorders 270.*-273.*, 275.*-279.*
8 Anemia 280.*-285.* 9 Other blood diseases 285.*-289.*
10 Dementia & organic brain diseases
290.*, 294.*, 310.*, 330.*, 331.*
11 Depression 296.* (~296.9), 298.0, 300.4, 311.* 12 Other mental disorders 290.*-319.* (~#10,#11), 797.* 13 Paralysis, Parkinsons's and
related diseases 332.*, 340.*-344.*, 438.*
14 Stroke 362.34, 430.*, 431.*, 432.9, 433.*-436.* 15 Glaucoma & cataract 365.*-366.*, 743.2-743.3 16 Chronic renal failure 403.01, 403.11, 403.91, 404.02, 404.12, 404.92, 585.*-586.*, V45.1,
V56.* 17 Hypertension 401.*-405.* (~#16), 437.0, 437.9 18 Ischemic heart disease 410.*-414.* (~414.11, 414.19), 429.5-429.7 19 Heart failure & arrhythmia 425.*, 427.1, 427.3-427.5, 428.*, 429.1, 429.3 20 Peripheral vascular disease 440.*, 442.*, 443.* (~443.2), 444.*, 446.*, 447.* (~447.6), 451.*,
453.1 21 Other circulatory diseases 391.*-459.* (~#13,#14,#16,#17,#18,#19,#20), 786.5, V717.*
22 Chronic obstructive pulmonary diseases & related diseases
466.*, 490.*-496.*, 518.12
23 Respiratory failure 518.*, 799.1
24 Respiratory diseases 460.*-519.* (~#22,#23), 786.0, 786.1, 786.52, 793.1 25 Gastrointestinal disease 530.*-579.*, 789.0, 787.0, 787.7 26 Acute renal failure &
insufficiency 584.*, 587.*, 588.*
27 Genitourinary diseases 580.*-629.* (~#4,#16,#25,#26), 788.* (~788.3,788.4), 793.8, V44.5-V44.6, V55.5-V55.6
28 Arthritis & arthropathy 274.*, 390.*, 710.*-716.* 29 Back/neck pain 720.*-724.*, 839.0-839.5, 846.*, 847.* 30 Hip & pelvic fracture 808.*, 820.* 31 Musculoskeletal disorders 717.*-739.* (~#29), 800.*-999.* (~#29,#30)

46
Table A2: Self-reported Limitations in Newly Disabled Cohort according to Conditions in their Medical Claims
All Newly
DisabledDementia Stroke Heart
FailureInfectious
Disease Arthritis Diabetes
(n=1264) (n=450) (n=598) (n=781) (n=808) (n=911) (n=449)Functional limitations (among non-institutionalized) Going up stairs 78.9 84.1 82.2 84.4 81.5 81.5 85.3 Walking across room 41.1 51.0 46.1 45.1 43.8 42.7 46.6 Bending 52.9 59.1 59.4 56.7 56.2 56.7 58.7 Lifting 10-lb package 62.4 72.8 70.3 67.7 67.0 64.0 67.0 Reaching above head 36.6 43.9 44.0 40.9 39.7 38.4 39.3 Grasping small objects 32.7 38.9 36.5 34.8 35.1 33.3 34.9 Seeing to read newsprint 20.2 25.7 24.7 21.9 22.5 20.9 22.5 Speaking 2.0 3.4 3.8 2.4 2.6 1.7 1.8 Hearing 6.5 14.2 6.5 6.1 6.6 7.1 8.3 IADLs (among non-institutionalized) Light housework 22.4 40.9 30.9 27.0 25.2 22.1 25.9 Laundry 27.9 51.6 37.0 32.6 31.1 28.7 29.8 Cooking 24.3 52.6 32.2 28.9 26.8 24.1 25.8 Grocery shopping 42.6 63.4 52.3 48.5 45.9 41.3 45.7 Managing money 23.1 54.6 30.1 24.9 23.4 22.0 22.0 Taking medications 28.6 57.1 38.1 33.7 30.6 27.1 31.9 Using telephone 12.7 32.2 15.7 14.1 12.3 11.9 10.3 Getting around outside 72.9 76.6 78.2 76.3 76.9 75.4 79.8 ADLs (all respondents) Eating 18.4 37.3 25.6 22.0 22.6 17.7 17.6 Getting out of bed 45.2 65.8 55.8 50.8 50.8 47.6 50.6 Getting around inside 55.3 69.7 65.2 62.0 60.8 59.1 59.0 Dressing 33.4 62.2 43.6 39.8 40.5 35.2 37.9 Bathing 67.2 81.5 74.0 72.5 71.7 69.0 69.0 Toileting 42.8 63.6 50.4 48.7 50.1 45.8 43.7

47
Table A3: Self-reported Limitations in Community Dwelling Newly Disabled Cohort according to Self-Reported Cause of Disability
All Newly
Disabled
Medical only
Old Age Symptom Pain Balance Endurance Weakness Other
Symptom
(n=892) (n=518) (n=133) (n=266) (n=105) (n=40) (n=22) (n=37) (n=105) Functional limitations Going up stairs 79.8 80.3 69.5 82.6 92.2 81.3 70.6 87.4 78.8
Walking across room 40.1 41.4 38.9 37.8 44.5 45.6 45.7 22.5 31.5
Bending 52.9 55.9 40.6 51.4 62.9 47.4 24.8 49.7 51.6 Lifing 10-lb package 62.0 62.6 56.8 62.6 68.3 47.1 69.8 77.3 61.3
Reaching above head 35.9 38.7 31.7 32.0 32.5 25.2 19.9 30.0 37.6
Grasping small objects
32.7 34.3 29.9 29.1 29.8 33.8 20.2 14.8 33.7
Seeing to read newsprint
20.4 20.0 16.9 24.1 12.0 18.0 16.7 16.9 41.5
Speaking 1.7 2.5 0.0 0.8 0.0 0.0 0.0 0.0 2.0 Hearing 6.7 6.8 4.1 7.2 5.5 4.0 0.0 1.9 14.8 IADLs Light housework 20.5 22.3 21.8 14.5 13.1 10.5 23.7 9.2 17.2
Laundry 26.3 28.4 27.9 21.5 20.3 18.3 41.2 16.4 21.9 Cooking 22.5 24.4 25.6 17.8 16.9 20.4 23.2 11.2 20.0 Grocery shopping 41.4 44.1 39.7 38.5 35.0 39.5 53.0 37.1 41.2
Managing money 22.3 25.5 24.1 14.3 6.0 13.3 24.1 10.6 24.8
Taking medications 27.2 28.5 26.6 24.5 22.3 22.6 16.4 12.5 34.0
Using telephone 11.9 12.2 9.9 11.8 4.5 12.0 6.5 7.3 21.9
Getting around outside
71.7 71.1 70.8 73.5 82.4 86.2 79.9 71.1 66.8
ADLs Eating 12.2 13.1 12.8 10.6 11.2 5.0 7.3 1.6 17.3 Getting out of bed 33.6 35.1 34.9 30.0 37.9 29.2 36.0 13.3 27.8
Getting around inside
47.0 48.4 48.2 44.1 51.3 44.3 38.3 59.0 40.1
Dressing 20.3 23.5 17.6 15.1 11.5 12.4 11.4 11.3 22.6 Bathing 60.0 64.7 60.0 52.2 49.5 42.3 52.2 57.8 57.2 Toileting 33.9 35.3 32.3 31.6 37.0 30.2 18.4 19.8 34.6

48
References
Aguero-Torres, H., L. Fratiglioni, et al. (1998). "Dementia is the major cause of functional dependence in the elderly: 3-year follow-up data from a population-based study." American Journal of Public Health 88(10): 1452-1456.
Boult, C., M. Altmann, et al. (1996). "Decreasing disability in the 21st century: the future effects of controlling six fatal and nonfatal conditions." American Journal of Public Health 86(10): 1388-93.
Chernew, M. E., D. P. Goldman, et al. (2005). "Disability and health care spending among Medicare beneficiaries." Health Affairs 24(2): W5R42-W5R51.
Crimmins, E. M., Y. Saito, et al. (1997). "Further evidence on recent trends in the prevalence and incidence of disability among older Americans from two sources: the LSOA and the NHIS." J Gerontol B Psychol Sci Soc Sci 52(2): S59-71.
Cummings, J. L. and G. Cole (2002). "Alzheimer Disease." Journal of the America Medical Association 287(18): 2335-2338.
Cutler, D. M. (2001). "Declining disability among the elderly." Health Affairs 20(6): 11-27.
Cutler, D. M. (2005). Intensive medical technology and the reduction in disability. Analyses in the Economics of Aging. D. A. Wise. Chicago, The University of Chicago Press: 161-184.
Dunlop, D. D., S. L. Hughes, et al. (1997). "Disability in activities of daily living: Patterns of change and a hierarchy of disability." American Journal of Public Health 87(3): 378-383.
Dunlop, D. D., L. M. Manheim, et al. (2002). "Incidence of functional limitations in older adults: The impact of gender, race, and chronic conditions." Archives of Physical Medicine and Rehabilitation 83(7): 964-971.
Ettinger, W. H., Jr., L. P. Fried, et al. (1994). "Self-reported causes of physical disability in older people: the Cardiovascular Health Study. CHS Collaborative Research Group." Journal of the American Geriatrics Society 42(10): 1035-44.
Ettinger, W. H., Jr., L. P. Fried, et al. (1994). "Self-reported causes of physical disability in older people: the Cardiovascular Health Study. CHS Collaborative Research Group." J Am Geriatr Soc 42(10): 1035-44.
Ferrucci, L., J. M. Guralnik, et al. (1998). "Constant hierarchic patterns of physical functioning across seven populations in five countries." Gerontologist 38(3): 286-294.
Ferrucci, L., J. M. Guralnik, et al. (1997). "Hospital diagnosis, medicare charges, and nursing home admissions in the year when older persons become severly disabled." Journal of the American Medical Association 277(9): 728-734.
Ferrucci, L., J. M. Guralnik, et al. (1996). "Progressive versus catastrophic disability: a longitudinal view of the disablement process." Journals of Gerontology. Series A, Biological Sciences and Medical Sciences 51(3): M123-30.
Ford, A. B., S. J. Folmar, et al. (1988). "Health and function in the old and very old." Journal of the American Geriatric Society 36: 187-197.
Freedman, V. A., E. M. Crimmons, et al. (2004). "Resolving inconsistencies in trends in old-age disability: report from a technical working group." Demography 41(3): 417-441.

49
Freedman, V. A. and L. G. Martin (1998). "Understanding trends in functional limitations among older Americans." American Journal of Public Health 88(10): 1457-1462.
Freedman, V. A., L. G. Martin, et al. (2002). "Recent trends in disability and functioning among older adults in the United States: A systematic review." Journal of the American Medical Association 288(24): 3137-3146.
Fried, L. P., K. Bandeen-Roche, et al. (2000). "Preclinical mobility disability predicts incident mobility disability in older women." J Gerontol Med Sci 55: M43-52.
Fried, L. P., K. Bandeen-Roche, et al. (1996). "Functional decline in older adults: expanding methods of ascertainment." J Gerontol A Biol Sci Med Sci 51(5): M206-M214.
Fried, L. P., W. H. Ettinger, et al. (1994). "Physical disability in older adults: A physiological approach." Journal of Clinical Epidemiology 47(7): 747-760.
Fried, L. P., L. Ferrucci, et al. (2004). "Untangling the concepts of disability, frailty, and comorbidity: Implications for improved targeting and care." Journals of Gerontology. Series A, Biological Sciences and Medical Sciences 59(3): M255-263.
Fried, L. P., S. J. Herdman, et al. (1991). "Preclinical disability: hypotheses about the bottom of the iceberg." J Aging Health 3: 285-300.
Fried, L. P., Y. Young, et al. (2001). "Self-reported preclinical disability identifies older women with early declines in performance and early disease." J Clin Epidemiol 54: 889-901.
Fried, T. R., E. H. Bradley, et al. (2001). "Functional disability and health care expenditures for older persons." Archives of Internal Medicine 161: 2602-2607.
Gill, T. M., H. G. Allore, et al. (2006). "The dynamic nature of mobility disability in older persons." Journal of the American Geriatrics Society 54(2): 248-254.
Gill, T. M., E. A. Gahbauer, et al. (2006). "Transitions between frailty states among community-living older persons." Arch Intern Med 166(4): 418-23.
Gill, T. M., J. T. Robinson, et al. (1998). "Difficulty and dependence: Two components of the disability continuum among community-living older persons." Annals of Internal Medicine 128(2): 96-101.
Gill, T. M., J. T. Robison, et al. (1997). "Predictors of recovery in activities of daily living among disabled older persons living in the community." J Gen Intern Med 12(12): 757-762.
Greenland, S. and K. Drescher (1993). "Maximum likelihood estimation of the attributable fraction from logistic models." Biometrics 49(3): 865-72.
Guccione, A. A., D. T. Felson, et al. (1994). "The effects of specific medical conditions on the functional limitations of elders in the Framingham Study." American Journal of Public Health 84(3): 351-8.
Guralnik, J. M., L. Alecxih, et al. (2002). "Medical and long-term care costs when older persons become more dependent." American Journal of Public Health 92(8): 1244-1245.
Guralnik, J. M., L. Ferrucci, et al. (1995). "Lower-extremity function in persons over the age of 70 years as a predictor of subsequent disability." N Engl J Med 332: 556-561.
Guralnik, J. M., A. Z. LaCroix, et al. (1991). "Morbidity and disability in older persons in the years prior to death." American Journal of Public Health 81: 443-447.

50
Iezzoni, L. I., S. M. Foley, et al. (1992). "Comorbidities, complications and coding bias: Does the number of diagnosis codes matter in predicting in-hospital mortality?" Journal of the American Medical Association 267(16): 2197-2203.
Jagger, C., A. J. Arthur, et al. (2001). "Patterns of onset of disability in activities of daily living with age." J Am Geriatr Soc 49: 404-409.
Jencks, S. F., D. K. Williams, et al. (1988). "Assessing hospital-associated deaths from discharge data: the role of length of stay and comorbidities." Journal of the American Medical Association 260: 2240-2246.
Katz, S., A. B. Ford, et al. (1963). "Studies of illness in the aged. The index of ADL: A standardized measure of biological and psychosocial function." Journal of the America Medical Association 185(914-919).
Kempen, G. I. and T. P. Suurmeijer (1990). "The development of a hierarchical polychotomous ADL-IADL scale for noninstitutionalized elders." Gerontologist 30(4): 497-502.
Komisar, H. L., J. Hunt-McCool, et al. (1997). "Medicare spending for elderly beneficiaries who need long-term care." Inquiry 34(4): 302-10.
Kosorok, M. R., G. S. Omenn, et al. (1992). "Restricted activity days among older adults." American Journal of Public Health 82: 1263-1267.
Lakdawalla, D. N., J. Bhattacharya, et al. (2004). "Are the young becoming more disabled?" Health Affairs 23(1): 168-176.
Lamb, V. L. (1996). "A cross-national study of quality of life factors associated with patterns of elderly disablement." Social Science and Medicine 42(3): 363-77.
Lazaridis, E. N., M. A. Rudberg, et al. (1994). "Do activities of daily living have a hierarchical structure? An analysis using the longitudinal study of aging." Journal of Gerontology 49(2): M47-M51.
Leveille, S. G., L. P. Fried, et al. (2002). "Disabling symptoms: What do older women report?" Journal of General Internal Medicine 17: 766-773.
Leveille, S. G., L. P. Fried, et al. (2004). "Advancing the taxonomy of disability in older adults." Journals of Gerontology. Series A, Biological Sciences and Medical Sciences 59A(1): 86-93.
Leveille, S. G., L. P. Fried, et al. (2004). "Advancing the taxonomy of disability in older adults." J Gerontol A Biol Sci Med Sci 59A(1): 86-93.
Leveille, S. G., C. C. Wee, et al. (2005). "Trends in obesity and arthritis among baby boomers and their predecessors, 1971-2002." American Journal of Public Health 95(9): 1607.
Liu, K., S. Wall, et al. (1997). "Disability and Medicare costs of elderly persons." Milbank Q 75(4): 461-493.
Lunney, J. R., J. Lynn, et al. (2003). "Patterns of functional decline at the end of life." Journal of the American Medical Association 289(18): 2387-2392.
Manton, K. G. (1988). "A longitudinal study of functional change and mortality in the United States." Journal of Gerontology 43(5): S153-S161.
Manton, K. G. (1989). "Epidemiological, demographic, and social correlates of disability among the elderly." Milbank Quarterly 67 Suppl 2 Pt 1: 13-58.
Manton, K. G. and X. Gu (2001). "Changes in the prevalence of chronic disability in the United States black and nonblack population above age 65 from 1982 to 1999."

51
Proceedings of the National Academy of Sciences of the United States of America 98(11): 6354-6359.
Manton, K. G., X. Gu, et al. (2006). "Change in chronic disability from 1982 to 2004/2005 as measured by long-term changes in function and health in the U.S. elderly population." Proceedings of the National Academy of Sciences of the United States of America 103(48): 18374-9.
Manton, K. G., E. Stallard, et al. (1998). "The dynamics of dimensions of age-related disability 1982 to 1994 in the U.S. elderly population." J Gerontol A Biol Sci Med Sci 53(1): B59-70.
McClellan, M. and L. Yan (2000). Understanding disability trends in the U.S. elderly population: The role of disease management and disease prevention. Department of Economics. Stanford University.
Schoeni, R. F., V. A. Freedman, et al. (2001). "Persistent, consistent, widespread, and robust? Another look at recent trends in old-age disability." Journal of Gerontology 56B(4): S206-S218.
Singer, B. H. and K. G. Manton (1998). "The effects of health changes on projections of health service needs for the elderly population of the United States." Proceedings of the National Academy of Sciences of the United States of America 95(26): 15618-22.
Siu, A. L., R. D.B., et al. (1990). "Hierarchical measures of physical functioning in ambulatory geriatrics." Journal of the American Geriatrics Society 38(10): 1113-1119.
Song J, Chang RW, et al. (2006). "Population impact of arthritis on disability in older adults." Arthritis and Rheumatism 55(2): 248-255.
Spector, W. D. and J. A. Fleishman (1998). "Combining activities of daily living with instrumental activities of daily living to measure functional disabiltiy." Journal of Gerontology 53B(1): S46-S57.
Spillman, B. C. (2004). "Changes in elderly disability rates and the implications for health care utilization and cost." Milbank Quarterly 82(1): 157-194.
Valderrama-Gama, E., J. Damian, et al. (2002). "Chronic disease, functional status, and self-ascribed causes of disability among noninstitutionalized older people in Spain." Journal of Gerontology 57A(11): M716-M721.
Verbrugge, L. M., J. M. Lepkowski, et al. (1991). "Levels of disability among U.S. adults with arthritis." Journal of Gerontology 46(2): S71-S83.
Verbrugge, M. and A. M. Jette (1994). "The disablement process." Soc Sci Med 38(1): 1-14.
Waidmann, T. A. and K. Liu (2000). "Disability trends among elderly persons and implications for the future." Journal of Gerontology 55B(5): S298-S307.
Williamson, J. D. and L. P. Fried (1996). "Characterization of older adults who attribute functional decrements to "Old Age"." Journal of the American Geriatrics Society 44(12).
Williamson, J. D. and L. P. Fried (1996). "Characterization of older adults who attribute functional decrements to "Old Age"." J Am Geriatr Soc 44(12).
Wolff, J. L., C. Boult, et al. (2005). "Newly reported chornic conditions and onset of functional dependency." Journal of the American Geriatrics Society 53(5): 851-855.