clinical pharmacology & biopharmaceutics review … · clinical pharmacology &...
TRANSCRIPT

Clinical Pharmacology Review NDA 19-962 Toprol XL 10182006
CLINICAL PHARMACOLOGY amp BIOPHARMACEUTICS REVIEW sNDA 19-962 SE5 033
Submission Dates PDUFA Goal Date
Brand Name
Generic Name
Priority Designation
Applicant
Submission
Therapeutic Class
Dosage Form amp Strength
Indication (proposed)
Proposed Dosing Regimen
Intended Population
OCP Division
OND Division
Primary Reviewer
Team Leader
Secondary Pharmacometrics Reviewer
Pharmacometrics Team Leader
0515 0616 and 07102006 11152006
Toprol-XL
Metoprolol succinate
P
Astra Zeneca
Pediatric Supplement
Beta Blocker
Extended release tablets 25 50 100 and 200 mg
Hypertension
10 mgkg daily (initial) followed by titration
Pediatric patients
DCPI
Cardiovascular and Renal Drug Products
Robert O Kumi PhD
Patrick Marroum PhD
Yaning Wang PhD
Jogarao Gobburu PhD
Briefing Date 10132006 Briefing Attendees Peter Hinderling Christine Garnett Elena Mishina Avi Karkowsky Arzu Selen Sandra Chow Joga Gobburu Atik Rahman Dennis Bashaw John Lazor and Chandra Sahajwalla
Page 1 of 98
Clinical Pharmacology Review NDA 19-962 Toprol XL 10182006
Table of Contents
1 EXECUTIVE SUMMARY4
11 RECOMMENDATIONS4 12 PHASE IV COMMITMENTS 4 13 SUMMARY OF IMPORTANT CLINICAL PHARMACOLOGY FINDINGS 5
2 QUESTION BASED REVIEW 6
21 WHAT ARE THE GENERAL ATTRIBUTES OF METOPROLOL 6 22 WHAT ARE THE GENERAL CLINICAL PHARMACOLOGY CHARACTERISTICS OF METOPROLOL SUCCINATE7 23 WHAT INTRINSIC FACTORS AFFECT METOPROLOL EXPOSURE-RESPONSE 16 24 WHAT EXTRINSIC FACTORS AFFECT METOPROLOL EXPOSURE-RESPONSE 18 25 WHAT ANALYTICAL METHOD WAS USED IN PEDIATRIC STUDIES 307 A AND 307B 18
3 DETAILED LABELING RECOMMENDATIONS 19
LABELING 19
4 APPENDICES 22
41 SPONSORrsquoS PROPOSED LABEL 22 42 PHARMACOMETRICS REVIEW 40 STUDY1 307A 60 STUDY2 307B61 DATA61 MODELS 65 MODEL SELECTION 70 SOFTWARE71 DESIGN ADEQUACY 73 DATA INTEGRITY 73 MODEL AND MODEL SELECTION 73 PKPD MODEL AND MODEL SELECTION 82 DISCUSSION 85 LABELING 87 COMMENTS TO SPONSOR89 COMMENTS TO MEDICAL REVIEWER 89 APPENDIX 90
List of Tables Table 1 Snapshot of metoprolol clinical pharmacology and biopharmaceutic information 7 Table 2 Study Designs 7 Table 3 Number and proportion of responders (ITT population) 11 Table 4 PKPD Comparisons- Pediatric Patients vs Adults 14 Table 5 Metoprolol population PK parameter estimates (SE ) obtained using final population
PK model 15 Table 6 Comparative PK (children vs adults) 15 Table 7 Bayesian estimates of metoprolol PK exposure for those patients included in the PKPD
analysis (N=65) 16 Table 8 Metoprolol exposure in adults following administration of Toprol XL 16
Page 2 of 98
Clinical Pharmacology Review NDA 19-962 Toprol XL 10182006
List of Figures Figure 1 Dose response for placebo-corrected change from baseline to Week4LOCF for sitting
SBP (ITT population) 9 Figure 2 Placebo corrected changes in SBP (chg_pc) as a function of dose ratio (relative to 02
mgkg) 9 Figure 3 Mean changes (actual and placebo-corrected) from baseline to Week 4LOCF for
sitting DBP (ITT population) 10 Figure 4 Mean changes over time for sitting SBP and DBP (ITT population) 11 Figure 5 Change in SBP vs log (AUC) ndash per Sponsor Figure 6 Change in HR vs AUC 12 Figure 7 Variation of CLF with weight obtained in population PK analysis 17 Figure 8 Variation of QF with age obtained in population PK analysis 17
Page 3 of 98
Clinical Pharmacology Review NDA 19-962 Toprol-XL 10182006
1 EXECUTIVE SUMMARY
Astra Zeneca submitted NDA 19-962 SE5 033 (pediatric supplement) to fulfill a FDA pediatric written request for TOPROL-XL metoprolol succinate extended release tablets Metoprolol a beta blocker is approved for hypertension angina and heart failure in adults In adults with hypertension the usual initial dosage is 25 to 100 mg daily (single dose) as monotherapy or in combination with a diuretic this dosage is titrated at weekly intervals until optimum blood pressure reduction or control is achieved The current application focuses on Toprol-XL use in pediatric patients six years and older The initial proposed dosing in children six and older is 10 mgkg subsequently the dose is titrated based on clinical response
Two clinical trials Studies 307A (dose-response) and 307B (safety extension of 307A) were conducted in pediatric patients with hypertension to support the proposed labeling changes The applicant conducted dose-response (n = 140 patients) population PK (n = 120 patients) and PKPD (n = 65 patients) analyses using data from pediatric hypertensive patients receiving Toprol-XL in the mentioned studies PK and PD measures estimated in the analyses or determined during the trials included Ctrough Cmax AUC0ndash24 CLF Tlag (lag time) ka (first order absorption rate constant) V2F (volume of distribution in central compartment) QF (intershycompartmental clearance) ∆DBP (change in diastolic blood pressure ∆SBP (change in systolic blood pressure) and ∆HR (change in heart rate) Selected covariates including age body weight gender race and Toprol-XL dose were evaluated for their potential impact upon PK parameters
11 RECOMMENDATIONS
The Office of Clinical Pharmacology has reviewed the information submitted to NDA 19-962 SE5 033 The clinical pharmacology and biopharmaceutics information provided in the current submission is acceptable However the sponsor should note the following
Comments to sponsor A In future studies with pharmacometric components you should consider the following
1 Collect sufficient (multiple) samples from individual subjects to allow assessment of inter-occasion variability and estimation of inter-individual variability (eta) for all relevant parameters
2 Placebo groups should be identically matched across all dose groups (eg same titration schedule and number of tablets) to minimize potential bias or apparent differences in the placebo effect
B Please address labeling changes and comments in the attached revised label (Page 19)
12 Phase IV Commitments
None
Page 4 of 98
Clinical Pharmacology Review NDA 19-962 Toprol-XL 10182006
13 Summary of Important Clinical Pharmacology Findings
1 Dose-Response A statistically significant dose-response did not exist for placebo (pooled)ndash corrected ∆SBP from baseline however the relationship was evident when placebo (specific-group) ndashcorrected data were used
2 Proposed Pediatric Dosage Overall information from the dose-response study suggests that Toprol XL is effective in the pediatric population The optimal initial dose in mgkg or the maximum safe and effective dose cannot be determined from the information provided However the 10 mgkg (proposed by applicant) appears to be a reasonable initial dose subsequent titration based on clinical response is acceptable Relative to adults (assuming average adult weighs 70 kg) the proposed initial pediatric dose is in the range but closer to the high end of the usual initial adult dose 036 ndash 143 (25 to 100 mg)
3 Metoprolol Pharmacokinetics in Pediatric Patients Metoprolol PK in children (6 ndash 16 years old) were adequately characterized by a 2-compartment model with flip-flop first-order absorption and an absorption lag time using a population PK approach The population PK model yielded precise parameter estimates Estimated PK Measures (median values) were CLF = 2275 Lhr V2F = 961 L QF = 675 Lhr V3F = 620 L ka = 00467 hrndash1 and Tlag = 0853 hr Overall the PK measures in children are of a similar magnitude as that in adults reported in the literature
4 Metoprolol Exposure in Children At the proposed pediatric initial dose 10 mgkg average Cmin was ~ 122 ngml and average Cmin was ~ 246 ngmL at the 20 mgkg dose however data were highly variable with CV gt 100 The majority of samples were below the lower limit of quantitation at the lowest studied dose 02 mgkg In adults (literature reports) average Cmin following 50 mg (~071 mgkg) was ~ 85 ngmL and ~ 226 ngmL following 100 mg (~143 mgkg)
5 Covariates Sex age race body weight and Toprol-XL dose did not have a clinically significant effect on metoprolol PK
6 Population PKPD Model Using a log-linear model or linear model there were statistically significant relationships (p lt 0005) between the changes in SBP and DBP from baseline and measures of metoprolol plasma exposure (Ctrough AUC(0ndash24 and Cmax) However the goodness-of-fit of the PKPD models were generally poor and parameters were not precisely estimated in most models due to a high degree of variability in the blood pressure data Based on the PKPD analysis plasma exposure (AUC) explains lt 10 of the response (reduction in systolic blood pressure) However the PKPD relationship suggests that there is a trend for increased response with increased exposure (dose driven) thus supporting dose titration
Robert O Kumi Ph D Date Clinical Pharmacology Reviewer Concurrence Patrick Marroum Ph D Date Cardiovascular and Renal Team Leader
Page 5 of 98
Clinical Pharmacology Review NDA 19-962 Toprol-XL 10182006
2 Question Based Review
21 What are the general attributes of metoprolol
211 Regulatory Background An original pediatric written request to support pediatric exclusivity was issued in October 1999 Subsequently amendments were made to the original request and a final written request was submitted in October 2004 Key elements of the request follow
1 Dose ranging trial in pediatric patients with hypertension ( 6 ndash 16 years old) 2 Pharmacokinetic sampling in the same range as those studied for effectiveness 3 Safety data from a controlled trial and 1-year open label treatment phase following the
effectiveness trial 4 Summary of all available information on the safety of the drug in hypertensive patients
The pediatric decision tree is depicted below this decision paradigm is used to support the rationale for choosing which studies had to be conducted
Pediatric Decision Tree (CDER MaPP 40004)
Disease Process Cause of Hypertension in Children Most children between 1 and 17 years old tend to have secondary forms of hypertension In infants and younger children underlying renal or reno-vascular disease is frequently the cause for hypertension (80) whereas essential hypertension is predominant in adolescents and adults Therefore the disease progression and response to the treatment in children and adults are not similar Based on the Pediatric Decision Tree Guidelines safety and efficacy studies are required in the target population to establish the indication in the pediatric patient population
Page 6 of 98
10182006 Clinical Pharmacology Review NDA 19-962 Toprol-XL
212 Selected background information on metoprolol Background on Metoprolol in Hypertension
Table 1 Snapshot of metoprolol clinical pharmacology and biopharmaceutic information
Drug Class Metoprolol is a szlig1-selective (cardio selective) adrenergic receptor-blocking agent Mechanism of Action (antihypertensive effect)
Multiple putative mechanisms competitive antagonism of catecholamine at peripheral sites reduction of sympathetic outflow to the periphery or suppression of renin activity
Approved Indications Hypertension Heart Failure and Angina Pectoris Approved Formulations 1 Immediate Release (IR) ndash metoprolol tartrate
2 Toprol-XL is extended-release tablet of metoprolol as the succinate salt it is also referred to as metoprolol in literature as controlled release (CRZ0K)
Metabolism Via CYP2D6 primarily Absorption Absolute oral bioavailability ~ 50 following IR Food does not affect metoprolol
absorption using ER formulation Distribution Protein binding to albumin is about 12 Elimination For IR t12 from 3 ndash 7 hours Less than 5 dose excreted unchanged in urine No
t12 values for ER this may be due to difficulty in separating absorption and elimination phases
Variability Plasma levels are highly variable among subjects after oral administration PKPD in children Limited information in children information obtained following administration of
metoprolol tartrate (IR) Please refer to NDA 19-962 for additional background information
213 Proposed Formulation Administration Route and Dosage The formulation proposed for pediatric use is Toprol-XL this formulation will be given orally at an initial dosage of 10 mgkg once daily (QD) Subsequently the dosage will be titrated depending on clinical response The maximum dosage studied was 200 mg QD Toprol-XL is available as a 25 (scored tablet) 50 100 and 200 mg tablet (b) (4)
22 What are the general clinical pharmacology characteristics of metoprolol succinate
221 Design features of clinical studies used to support dosing in the target population Two studies were conducted in hypertensive pediatric studies Study 307A and 307B the design features of these studies are summarized in Table 2 Table 2 Study Designs
Study Name Study 307A (D4020C00033) Study 307B (D4020C00001)
Objective Determine dose-response in children Determine long-term safety Doses Toprol XL 02 10 and 20 mgkg QD (maximum
200 mg QD) and Placebo Initial 25 mg QD then titrated to optimal clinical response (maximum 200 mg QD)
Design Feature bull 1-2 week placebo run-in period bull Patients in 10 and 20 mgkg groups dosed
over 2 week period but 02 mgkg group received dose for 4 weeks
Patients continuing from 307A or new enrollees
PK Features Ctrough (week 4) Ctrough (last study visit) and serial PK in subset (n = 31)
Primary Measures Outcome
Change in placebo-corrected trough sitting BP from baseline at week 4
Long-term safety using effective Toprol dose
LOCF approach followed
Page 7 of 98
Clinical Pharmacology Review NDA 19-962 Toprol-XL 10182006
222 Clinical response (efficacy) endpoints
Pharmacodynamics bull Primary variable Sitting SBP determined at trough (24plusmn4 hours Visit 7) served as the primary efficacy assessment The primary measure of effect was the placebo-corrected change from baseline to the end of treatment (Week 4) in trough sitting SBP Each BP determination represented the mean of 3 readings with less than 7 mmHg between the highest and lowest value bull Secondary variables Secondary variables included trough sitting DBP and percentage of responders at Week 4
223 Idenitifcation and measurement of metoprolol concentrations in plasma Metoprolol appeared to be adequately identified and measured in Study 307A and 307B A validated HPLC with tandem mass spectrometry method was used to quantify metoprolol Key features of the assay were bull limit of quantitation (LOQ) = 1 ngmL bull linear range = 1 to 1000 ngmL bull Precision measured by CV () le 109 bull Accuracy measured by relative bias ranged from ndash 6 to + 13 Overall the assay performance was acceptable
224 Metoprolol exposure-response The exposure-response evaluation revealed that
bull There was no clear dose-response relationship for effectiveness (primary variable change in sitting SBP) in the target patient population using the planned analysis (Sponsorrsquos) but there was a dose-response for the secondary efficacy variable (Sponsorrsquos)
bull There was a dose-response relationship for effectiveness when group-specific placebo correction was employed (Reviewerrsquos)
bull The proposed initial dosage regimen and subsequent titration are supported by 1) Existence of an exposure-response relationship for Ctrough and AUC and SBP
reduction 2) Overall Toprol XL being more effective than placebo at reducing SBP and DBP 3) For a given dose maximal efficacy occurring between 1 and 4 weeks after
treatment initiation bull There was no clear dose-response relationship for safety
2241 Dose-Response Assessment using Primary Variable and Analyses
Sponsors Analyses Primary Variable The dose-response relationship for Study 307A is depicted in Figure 1 When pooled placebo data were used for correcting change in SBP the slope of the curve is not different form zero (p = 05371 for dose ratio) suggesting that there is no dose response By visual inspection it appears the lack of observed dose-response is mainly driven by a lower than expected response at the 20 mgkg level Patients assigned to the 10 mg and 20 mgkg dose received drug for only 2 weeks whereas dose in the 02 mgkg received the same dose for 4 weeks It is unclear if this difference in titration schedule influenced the outcome
Page 8 of 98
Clinical Pharmacology Review NDA 19-962 Toprol-XL 10182006
Figure 1 Dose response for placebo-corrected change from baseline to Week4LOCF for sitting SBP (ITT population)
Reviewerrsquos Analysis Primary Variable When group-specific placebo corrected data were used for correcting change in SBP there was a statistically significant dose-response (Figure 2) Figure 2 Placebo corrected changes in SBP (chg_pc) as a function of dose ratio (relative to 02 mgkg)
In this procedure data for subjects assigned to a given active group (eg 02 mgkg) were corrected with placebo data (02 mgkg) It should be noted that the group-specific placebo data appeared to follow a consistent trend where the placebo effect decreased with increasing number of tablets It is unclear if this titrationtablet-dependent placebo effect is valid or random Overall the apparent differential placebo effects suggest that the placebo group may have overly influenced the outcome of the dose-response analysis Two potential limitations of this Reviewerrsquos supplemental analyses are
1 Typically placebo effects are constant if randomization is appropriate thus it is unclear if sub-setting the placebo group is reasonable and did not increase bias
2 Additionally sub-setting the placebo group leads to a reduced number of placebo subjects per dose group that may decrease the robustness of the regression findings
Page 9 of 98
Clinical Pharmacology Review NDA 19-962 Toprol-XL 10182006
2242 Dose-Response Assessment using Secondary Variable and Analyses
Treatment Group Effects and Pairwise Comparisons for sitting SBP and DBP Key findings from the group and pair-wise comparisons are 1 All active groups produced statistically significant reductions from baseline (p lt 002) in
sitting SBP (|∆ SBP| gt 5 mmHg) and DBP (|∆ DBP| gt 3 mmHg) at the Week 4LOCF visit whereas placebo (p = 03133) did not
2 Overall the mean change from baseline in sitting SBP (|∆ SBP| = 4256) at Week 4LOCF for the TOPROL-XL groups pooled was statistically significantly larger (p=00351) than that for the placebo group
3 Pairwise comparisons between individual TOPROL-XL dose groups and placebo also revealed a statistically significant difference for the 10 and 20 mgkg groups (p=00270 and p=00492 respectively) the 02 mgkg group was not different from placebo
Sponsorrsquos Analyses Secondary variable A dose-response relationship was observed for the secondary efficacy variable (delta DBP) as depicted in Figure 3 Figure 3 Mean changes (actual and placebo-corrected) from baseline to Week 4LOCF for sitting DBP (ITT population)
2243 Dose-Response assessment based on subgroup analyses (per Sponsor) and time course
Subgroup Analyses The sponsor conducted several exploratory subgroup analyses however these analyses were not reviewed critically and are not presented in this review as
1 they do no impact the primary outcome or study objective 2 they are unlikely to be clinically useful due to the small number of patients per subgroup
However one potentially useful group analyses involved the percentage of responders as defined in Table 3 The responder analyses shows
1) greater percentage of responders in active dose group relative to placebo 2) comparable response rates for all active dose groups suggesting similar efficacy across
dose groups despite different exposure (doses)
Page 10 of 98
Clinical Pharmacology Review NDA 19-962 Toprol-XL 10182006
Table 3 Number and proportion of responders (ITT population)
Time course of effect (2- to 4-week treatment period) Consistent with findings from other studies with metoprolol and some beta-blockers apparent maximal reduction in blood pressure occurred between 1 and 4 weeks of treatment The mean changes over time in sitting SBP and DBP are depicted in Figure 4 Figure 4 Mean changes over time for sitting SBP and DBP (ITT population)
Data points in plot are from absolute values (not taking baseline into account) and subjects in 10 and 20 mgkg received drug after two weeks on 02 mgkg
2244 PKPD Assessments Overall there were statistically significant relationships between metoprolol exposure particularly AUC and SBP reduction as shown in Figure 5 Similar findings were observed for heart rate reduction Figure 6
Page 11 of 98
Clinical Pharmacology Review NDA 19-962 Toprol-XL 10182006
Change in SBP Figure 5 Change in SBP vs log (AUC) ndash per Sponsor Figure 6 Change in HR vs AUC
The population PKPD assessment evaluated the effect of PK exposure measures (AUC Cmax and Ctrough) on various PD measures (change in SBP change in DBP However only the AUC was considered reliably estimated It is noted that AUC is a derived measure that may not bear as direct a relationship as Ctrough (observed value) on a given PD measure However Ctrough is related to AUC particularly at steady-state The equation relating AUC to change in SBP was
E = E0 ndash 221 x m logAUC
Where E = change in SBP E0 = baseline SBP m = slope and AUC = area under plasma concentration-time curve
The regression analyses yielded the following p lt 005 for slope and R2 lt 01 The relatively low R2 value suggests that the SBP data were highly variable and changes in SBP could not be accounted for entirely by AUC (exposure) Nevertheless there is a relationship between effectiveness and AUC that indicates that increasing exposure potentially increases effectiveness this finding supports dose titration
Change in Heart Rate The change in heart rate was defined as follows (Reviewerrsquos regression analysis)
E = I ndash 221 x m logAUC Where E = change in HR I = intercept and m =and AUC are as previously defined
The regression analyses yielded the following p lt 001 for slope and R2 = 011 The heart rate findings support metoprololrsquos known activity as a beta blocker
Page 12 of 98
Clinical Pharmacology Review NDA 19-962 Toprol-XL 10182006
Reviewer Note PKPD modeling with various hemodynamic measures The modeling exercises indicated that there was no difference in the PKPD modeling results using different hemodynamic data formats such as change in the measurements percent change in the measurements or actual BP measurements
2245 Exposure-Safety Highlights (per Applicant) According to the applicant Toprol XL was generally well tolerated in the pediatric population and there did not appear to be a clear dose-dependent effect in terms of severity or frequency of adverse events (tabulated below)
2246 Acceptability of sponsorrsquos proposed regimen The proposed initial dosage 10 mgkg QD followed by titration according to clinical response appears reasonable based on the dose-response information time course of maximal effect and exposure-response (AUC and SBP reduction) information It is unclear if the proposed initial dose is optimal since a dose-response relationship was not established for the primary efficacy variable and response rates were comparable across dose groups One should note that the proposed initial pediatric dosage is within the range of usual adult initial dosage 25 ndash 100 mg (assuming 70 kg adult ~ 036 ndash 143 mgkg)
The major unresolved issues are bull Absence of a clear dose-response relationship for the primary efficacy variable bull Unknown maximal dose in mg for initial therapy and titrationmaintenance therapy bull Unknown optimal titration frequency
Although these major issues are not completely resolved information provided in the submission provides adequate information to support the proposed dosage In brief these limitations are addressed in part by adopting the following approaches
bull Therapy will be initiated at a dose that was more effective than placebo yet was not the highest dose thus providing a safety window
bull Initial dosage (dose in mg) will be limited to a dose that produces exposure that is likely to be effective but does not exceed the highest studied dose (200 mg)
bull Titration will be allowed at a frequency no greater than once a week which is consistent with data obtained (time to peak activity) and previous information form metoprolol and other beta-blockers used in hypertension treatments
Page 13 of 98
Clinical Pharmacology Review NDA 19-962 Toprol-XL 10182006
2247 PKPD comparisons Pediatric patients vs adults A priori PKPD relationships are expected to differ between adults and children because the two populations have different disease processes (secondary hypertension in children vs essential or primary hypertension in adults) Results of the pediatric modeling exercise showed that a log-linear model appeared to work better than other models for the relationship between SBP and DBP and exposure (AUC) In adults the Sigmoid Emax model has been successfully applied in PKPD modeling exercises It should be noted that the adult data were not reanalyzed for this review so it is unclear if log-linear or linear models would be adequate
As illustrated in Table 4 Toprol XL is effective in adults as well as in children and appears to be effective across a similar concentration range Table 4 PKPD Comparisons- Pediatric Patients vs Adults
Pediatric Patients Adults Population hypertensive Typically healthy Model Log-linear Sigmoid Emax PD Markers Placebo corrected SBP DBP changes
at trough bull Reduction in exercise heart rate (betashy
blockade measure) bull Placebo corrected SBP DBP changes at
trough EffectiveTherapeutic metoprolol concentrations
Most concentrations lt 107 ngmL bull EC50 = 105 nmolL (281 ngmL) bull Emax achieved at concentrations above 400
nmolL (107 ngmL) bull Range between 80 and 300 nM
Maximal mean BP Reduction at Studied Doses
bull SBP reduction -6 bull DBP reduction -5
bull SBP reduction -10 bull DBP reduction -4
Effectiveness of metoprolol relative to placebo
Generally more effective over the course of treatment
Generally more effective over the course of
Time course of effect Maximal effect observed within 1 to 4 weeks after initiation of therapy
Maximal effect observed within 1 to 4 weeks after initiation of therapy
Utility in Poor CYP2D6 metabolizers (PMs)
Not evaluated Poor metabolizers have a higher plasma concentration and a greater duration or degree of beta blockade thus PMs may not need extended release formulations
Proposed Initial Dosage 10 mgkg ~ 70 mg QD 25 to 100 mg QD
Overall it appears the studied pediatric doses produce comparable changes in diastolic pressure but lower changes in systolic pressure However in pediatric patients it is unlikely that the maximal possible activity was achieved at the doses studied thus conceivably pediatric patients can achieve maximal effects comparable to adults at optimized pediatric doses Three challenges in making definitive PKPD comparisons between the pediatric (studied in this NDA) and adult population are as follows
1 Study conditions differ- typically in adult studies HR is measured during exercise and not at rest
2 Results are obtained in healthy adult subjects rather than hypertensive patients 3 Insufficient numbers of studies have been reported in the literature that attempt to
identify the relationship between metoprolol exposure and SBP or DBP effect in adults
Page 14 of 98
10182006 Clinical Pharmacology Review NDA 19-962 Toprol-XL
225 Pharmacokinetic characteristics of metoprolol
2251 Metoprolol pharmacokinetics in pediatric patients Metoprolol PK parameters obtained from the population PK analyses are summarized in Table 5 Table 5 Metoprolol population PK parameter estimates (SE ) obtained using final population PK model
PK Parameter Value CLF (Lhr) 2275 ( 114 ) V2F (L) 961 (203 ) V3F (L) 620 (255 ) QF (Lh) 675 (204) Ka (hrndash1) 00467 (192 ) Tlag1 (hr) 0853 (297)
The data in Table 5 are derived from a 2-compartment linear PK model with first-order elimination and flip-flop first-order absorption and lag time
2252 Metoprolol pharmacokinetic comparisons pediatric patients vs adults PK Parameter Comparison Overall pediatric PK parameters obtained following administration of Toprol-XL are comparable (similar magnitude) to those in adults receiving IR metoprolol Potential limitations of the stated comparison and finding include the use of different modeling approaches populations number of samples and number of subjects in the trials (Table 6) Table 6 Comparative PK (children vs adults)
Source NDA 19962 Luzier et al Taguchi et al Plosker and Cissold and other sources
Model 2 Comp 1st Order absorption
1 Comp
Formulation Toprol XL IR IR IR Population Pediatric Hypertension Healthy adults Japanese geriatric Sampling Intense and Ctrough Intensive Sparse intensive CLF (Lhrkg) 338 116 ndash 340 094 -V2F (Lkg) 128 270 ndash 398 452 -V3F 851 333 ndash 809 - -QF (Lhr) 899 282 ndash 694 - -T12 (h) 351 - - 3 - 6 Covariate Effects Based on CLF Age None - Yes YesNo Gender Effect None Yes - -Race None - - - The applicant noted that pediatric data were compared to adult data from IR where CLF is dominated by the disposition function of metoprolol therefore it may be complicated to compare adult data to pediatric data (Toprol XL) where CLF is under a considerable influence from the release rate (input function) of the device This appears to be a valid caveat Using AUC and dosing information (Table 8) adult CLF for Toprol-XL ~ 17 ndash 25 Lhrkg
Exposure Comparison Following administration of Toprol XL at comparable doses in mg pediatric patients and adults generally had similar metoprolol exposure Adult data from literature and archived clinical pharmacology and biopharmaceutics reviews are presented in Table 8 and pediatric data from
Page 15 of 98
Clinical Pharmacology Review NDA 19-962 Toprol-XL 10182006
population PK modeling (Study 307A) are presented in Table 7 The main limitations of the cross-population comparison is the pediatric doses are over the 125 to 200 mg dose range whereas adult data is for specific doses However reasonable comparisons can be made at the 100 mg dose level assuming the meanmedian values in pediatric patients offer an acceptable approximation of exposure values and are representative of the central tendency of the data In this case the adult and pediatric data have comparable
1 exposure at 100 mg 2 degree of variability
Table 7 Bayesian estimates of metoprolol PK exposure for those patients included in the PKPD analysis (N=65)
includes only data where concentration gt LOQ
Table 8 Metoprolol exposure in adults following administration of Toprol XL
Cmax Cmin AUC Literature References 50 179 ndash 190 86 ndash 104 286 - 351 100 96 ndash 759 107 ndash 305 533 - 1192 200 778 ndash 1139 310 ndash 447 1392 - 1892 FDA Archived Information 50 179 plusmn 182 85 plusmn 138 286 plusmn 346 100 544 plusmn 436 226 plusmn 234 827 plusmn 766
2253 Inter and intra-subject variability in metoprolol pharmacokinetic Based on the values of the standard error () associated with PK parameters (Table 5) metoprolol PK exhibited low variability (SE lt 30) However this estimate may not be reliable (under predicted) because concentrations lt LOQ were not included in the analysis Several subjects particularly those receiving 02 mgkg had concentrations lt LOQ In adults exposure is highly variable (CV gt 70 ) as reflected in exposure estimates and wide exposure ranges Table 8
Potential sources of variability following metoprolol administration (Toprol XL) in children include regio-selective absorption incomplete gastric emptying variable gastric motility varying metabolic activity (CYP2D6) and inconsistent absorption Some of these factors are also applicable to adults
23 What Intrinsic Factors Affect Metoprolol Exposure-Response
Based on the population pharmacokinetic model weight was the only potentially clinically meaningful intrinsic factor that affected metoprolol exposure and hence response Other intrinsic
Page 16 of 98
Clinical Pharmacology Review NDA 19-962 Toprol-XL 10182006
factors such as age height gender race and sex did not affect metoprolol exposure
231 Effect of weight The effect of weight on metoprolol CLF are illustrated in Figure 7 Figure 7 Variation of CLF with weight obtained in population PK analysis
CLF increased linearly with body weight relative to a 70 kg individual the CL of a 22 kg individual is 30 lower This decreased CL will result in an increased exposure (maximum 30 ) that does not pose additional safety concerns or appear clinically significant (tolerated in studies) It should be noted that exposure (AUC) accounted for an insignificant portion of the hemodynamic effect (poor correlation) thus the clinical implications of the impact of body weight on CLF of metoprolol identified in the population PK modeling are limited Consequently dose adjustment is not required based on body weight Furthermore the maximum initial dose is 50 mg thus subjects with weight gt 50 kg will receive a maximum dose of 50 mg diminishing the impact if any of weight-dependent clearance
232 Effect of Age The effect of age on QF the inter-compartmental clearance is illustrated in Figure 8 Figure 8 Variation of QF with age obtained in population PK analysis
Page 17 of 98
Clinical Pharmacology Review NDA 19-962 Toprol-XL 10182006
QF does not contribute significantly to overall clearance therefore the reported finding does not appear clinically relevant It should be noted that the observed QF-age relationship is atypical
233 Effect of intrinsic factors on exposure-response pediatrics vs adults As mentioned previously the only evaluated intrinsic factor that affected metoprolol exposure was body weight In adults age and gender effects have been reported although there are conflicting reports on the age effect The exposure in adult and pediatric population are both potentially affected by the CYP2D6 metabolizing status of the subject Metoprolol is metabolized primarily in the liver by CYP2D6 The scientific literature reports several instances in adults of varying metoprolol exposure by poor and extensive CYP 2D6 metabolizers In the pediatric studies (307A and 307B) there was one suspected poor metabolizer (Trough concentration was 2330 ngmL) but the metabolic status (PM or EM) of this individual was not confirmed
24 What extrinsic factors affect metoprolol exposure-response
The role of extrinsic factors were not specifically evaluated in the pediatric population however one anticipates that extrinsic factors that affect adults should be applicable to children
25 What analytical method was used in pediatric studies 307 A and 307B
Please refer to section 223
Page 18 of 98
Clinical Pharmacology Review NDA 19-962 Toprol-XL 10182006
(b) (4)
TOPROL-XL is not recommended in pediatric patients lt 6 years of age (see CLINICAL PHARMACOLOGY Pharmacokinetics and PRECAUTIONS Pediatric Use)
Page 21 of 98
Clinical Pharmacology Review NDA 19-962 Toprol-XL 10182006
4 APPENDICES
41 Sponsorrsquos Proposed Label
17 Page(s) of Draft Labeling has been Withheld in Full as B4 (CCITS) immediately following this page
Page 22 of 98
Clinical Pharmacology Review NDA 19-962 Toprol-XL 10182006
42 Pharmacometrics Review
Page 40 of 98
Clinical Pharmacology Review NDA 19-962 Toprol-XL 10182006
Office of Clinical Pharmacology Pharmacometrics Review
NDAIND 19-962 Volume Not applicable submitted electronically POP PK Report in Section 5335 (Network Path Cdsesub1n19962N_0002006-05-15hpbiohupharm) Compound Metoprolol succinate Submission Dates 05152006 Sponsor Astra Zeneca Pharmacometrics Reviewer Robert Kumi PhD Secondary Reviewer Yaning Wang PhD
TABLE OF CONTENTS
OFICE OF CLINICAL PHARMACOLOGY PHARMACOMETRICS REVIEW 41
EXECUTIVE SUMMARY 42
OVERALL CONCLUSIONS 43
INTRODUCTION 46
OBJECTIVES OF THE ANALYSIS 48
DOSE-RESPONSE ANALYSIS 49
METHODS (POPULATION PKPD) 60
RESULTS AND DISCUSSION 73
RECOMMENDATIONS 87
APPENDIX 90
DCP1PM Page 41 10182006
Clinical Pharmacology Review NDA 19-962 Toprol-XL 10182006
Executive Summary In NDA SE5 033 the applicant Astra Zeneca has proposed changes to the currently approved labeling for TOPROL-XL metoprolol succinate extended release
(b) (4)
tablets Metoprolol a beta blocker is approved for hypertension angina and heart failure in adults In adults with hypertension the usual initial dosage is 25 to 100 mg daily (single dose) as monotherapy or in combination with a diuretic this dosage is titrated at weekly intervals until optimum blood pressure reduction is achieved The current application focuses on Toprol-XL use in pediatric patients ge six years old The initial proposed dosing in children six and older is 10 mgkg subsequently the dose is titrated based on clinical response
Two clinical trials Studies 307A (dose-response) and 307B (safety extension of 307A) were conducted in pediatric patients with hypertension to support the proposed labeling changes The applicant conducted dose-response population PK (n = 120 patients) and PKPD (n = 65 patients) analyses using data from pediatric hypertensive patients receiving Toprol-XL in the mentioned studies
Key Findings from the Dose-Response and Population PKPD analyses follow 1 Dose-Response A statistically significant dose-response did not exist for placebo
(pooled)ndashcorrected ∆SBP from baseline however the relationship was evident when placebo (specific-group) ndashcorrected data were used
2 PK Model Metoprolol PK in children were well characterized by a 2shycompartment model with flip-flop first-order absorption and an absorption lag time The model yielded precise parameter estimates
3 Covariates Sex age race body weight and Toprol-XL dose had no clinically significant effect on metoprolol PK
4 PKPD Model Using a log-linear model or linear model there were weak but statistically significant relationships between the changes in DBP and SBP and measures of metoprolol plasma exposure (Ctrough AUC0ndash24 and Cmax) Overall parameters were not precisely estimated in most models due to a high degree of variability in the blood pressure data
DCP1PM Page 42 10182006
Clinical Pharmacology Review NDA 19-962 Toprol-XL 10182006
Overall Conclusions 1 Were metoprolol PK adequately characterized in the pediatric population Metoprolol PK in pediatric patients (n = 120 Age 6 to 17) were adequately characterized using a population pharmacokinetic approach The population model was validated and qualified and comprised a 2-compartment open model with first order absorption and absorption lag time
2 Are there any covariates that influence metoprolol PK in pediatric patients with hypertension The two covariates that influenced metoprolol PK were weight and age apparent oral clearance increased linearly with body weight and inter-compartmental clearance increased with age according to a power function Other covariates including race sex and metoprolol dose did not impact metoprolol kinetics
3 Was a PKPD relationship established between metoprolol dose or plasma exposure( AUC Ctrough or Cmax) and hemodynamic measures (blood pressure) Using a simple linear regression model no dose-response (reduction in placebo corrected systolic blood pressure the primary outcome variable) was observed although a weak (R2 lt 01) but statistically significant (p lt 005) PKPD relationship was observed between metoprolol exposure measures and reduction in systolic blood pressure The small R2 value indicates metoprolol exposure could account for only a small portion of the hemodynamic effect According to the model as exposure increased there was greater reduction in blood pressure However only the relationship with AUC was considered reliable as AUC was estimated with good precision (PK modeling) whereas Cmax was not
4 Is there sufficient evidence to support effectiveness of Toprol XL in pediatrics and the initial proposed pediatric dosage Yes Although dose-response was not established with SBP reduction (primary variable) suggesting that the effectiveness of the individual tested Toprol-XL doses could not be differentiated the following information provides evidence to suggest that some Toprol-XL doses were more effective than placebo
bull Analysis of treatment group effects and pairwise comparisons suggested that overall Toprol-XL demonstrated effectiveness in pediatric patients with hypertension pooled Toprol groups vs placebo (p = 00351) and relative to baseline each active Toprol-XL dose group decreased SBP whereas placebo did not
bull There was a dose-response relationship for reduction in diastolic blood pressure typically systolic and diastolic blood pressure effects mirror each other
bull PKPD findings (reduction in SBP and heart rate as a function of AUC) support metoprolol effectiveness (increased exposure led to increased effectiveness) The heart rate effect supports metoprololrsquos known beta blocking activity
bull Generally Toprol-XL was effective in pediatric patients and adult patients at similar metoprolol exposure levels 02 mgkg in pediatrics was minimally effective because this dose yielded exposures lower than that obtained in adults at the lowest effect adult dose 25 mg
DCP1PM Page 43 10182006
Clinical Pharmacology Review NDA 19-962 Toprol-XL 10182006
bull The proposed pediatric dosage 10 mgkg is supported by the results from the dose-response study Visual inspection and pairwise comparisons indicated that 10 mgkg (placebo corrected) was statistically the most effective dose (greater efficacy than 02 mgkg and 20 mgkg) and was more effective than placebo (p = 0027)
5 Will initial dosage adjustment be required for any pediatric patients prior to titration No dosage adjustment does not appear necessary prior to titration (typically one week after treatment begins) Based on the population PK model the only potentially relevant factor that could affect PK was body weight CLF increased linearly with body weight relative to a 70 kg individual the CL of a 22 kg individual is 30 lower This decreased CL will result in an increased exposure (maximum 30 ) that does not pose additional safety concerns or appear clinically significant (tolerated in studies) The proposed starting dose 10 mgkg and doses up to 20 mgkg (maximum 200 mg) were tolerated in the clinical trials (307A and 307B) Furthermore exposure accounted for an insignificant portion of the hemodynamic effect (poor correlation) thus the clinical implications of the impact of body weight on CLF of metoprolol identified in the population PK modeling are limited
to a higher and tolerable dose until optimum BP reduction is achieved is reasonable This
(b) (4)The proposal to start Toprol-XL at a low dose and titrate
is consistent with labeling for adults
6 Was the PKPD relationship influenced by covariates Insufficient data were available to make this assessment
7 Are the PK and PKPD of metoprolol in children comparable to that in adults PK values obtained in pediatric patients were generally in the same range as those reported in adults Potential limitations of the comparison are the different modeling approaches populations number of samples and number of subjects in the trials (Table B)
It is difficult to make definitive PKPD comparisons between the pediatric (studied in this NDA) and adult population because
1 Study conditions differ- typically in adult studies HR is measured during exercise and not at rest
2 Results are obtained in healthy adult subjects rather than hypertensive patients 3 Insufficient number of studies have been reported in the literature that attempt to
identify the relationship between metoprolol exposure and SBP or DBP effect in adults
DCP1PM Page 44 10182006
Clinical Pharmacology Review NDA 19-962 Toprol-XL 10182006
Table B PK Comparisons (Pediatrics vs Adults) Source NDA 19962 Luzier et al Taguchi et al Plosker and Cissold
and other sources Model 2 Comp 1st
Order absorption 1 Comp
Formulation Toprol XL IR IR PK Analyses Population StandardNCA Population Standard Population Pediatric Healthy adults Japanese geriatric Sampling Intense and
Ctrough Intensive Sparse intensive
CLF (Lhrkg) 338 116 ndash 340 094 V2F (Lkg) 128 270 ndash 398 452 V3F 851 333 ndash 809 QF (Lhr) 899 282 ndash 694 Ka (h-1) 00467 Tlag (h) 0853 T12 (h) 351 3 - 6 Tmax (h) 25 ndash 73 Covariate Effects on CLF Age None Yes YesNo Gender Effect None Yes Race None The applicant noted that pediatric data were compared to adult data from IR where CLF is dominated by the disposition function of metoprolol therefore it may be complicated to compare adult data to pediatric data (Toprol XL) where CLF is under a considerable influence from the release rate (input function) of the device This appears to be a valid caveat
It should be noted that the cause of hypertension in adults differs from that in children Results of the pediatric modeling exercise showed that a log-linear model appeared to work better than other models for both SBP and DBP In adults the Sigmoidal Emax model has been successfully applied Using the Hill Equation (Sigmoidal Emax model) with EHR reduction (measure of beta blockade) as the PD marker in adults EC50 = 105 nmolL (281 ngmL) and Emax is achieved at metoprolol plasma concentrations gt 400 nmolL (107 ngmL) Placebo-corrected mean blood pressure changes (standing) associated with concentrations producing maximal blockade are -10 for systolic and ndash 4 for diastolic In the pediatric study the observed maximal mean reductions (placebo corrected) at the studied doses were approximately -6 for systolic and -5 for diastolic Hence it appears the studied pediatric doses produce comparable changes in diastolic pressure but lower changes in systolic pressure It should be noted that in the pediatric studies only a few metoprolol plasma concentrations were gt than 107 ngmL It is unlikely that the maximal activity was achieved at the doses studied yet the Toprol doses appeared effective The differential maximal effects may also be due to the difference in initial SBP (adults patients with hypertension tend to have higher initial BPs) in adult and pediatric studies there was a dependence of change in SBP on initial SBP
DCP1PM Page 45 10182006
Clinical Pharmacology Review NDA 19-962 Toprol-XL 10182006
Introduction Summary
(b) (4)NDA SE5 033 was submitted to seek approval of labeling changes to the currently approved labeling for TOPROL-XL This labeling translates to a new Toprol-XL indication for pediatric patients (6 years and older) with hypertension
Background on Metoprolol in Hypertension The majority of the following information was obtained form a Review article (sponsor provided) by Plosker and Clissold [Drugs 43(3) 382-414 1992)]
Table 1 Snapshot of Metoprolol Clinical Pharmacology and Biopharmaceutics Drug Class Metoprolol is a szlig1-selective (cardio selective) adrenergic receptor-
blocking agent Mechanism of Action (antihypertensive effect)
Multiple putative mechanisms competitive antagonism of catecholamine at peripheral sites reduction of sympathetic outflow to the periphery or suppression of renin activity
Approved Indications Hypertension Heart Failure and Angina Pectoris Approved Formulations Immediate Release (IR) ndash metoprolol tartrate
Controlled Release (CRZ0K) Toprol-XL is extended-release tablet of metoprolol as the succinate salt
Metabolism Via CYP2D6 primarily Absorption Absolute oral bioavailability ~ 50 following IR Food does not affect
metoprolol absorption using ER formulation Distribution Protein binding to albumin is about 12 Elimination For IR t12 from 3 ndash 7 hours Less than 5 dose excreted unchanged
in urine No t12 values for ER this may be due to difficulty in separating absorption and elimination phases
Variability Plasma levels are highly variable among subjects after oral administration
Age Effects PK of metoprolol not affected by age (20 to 65 years) but concentration of active metabolite in subjects gt 65 years about twice as high as those in younger although metoprolol concentrations similar in two groups (Regardh et al)
PKPD in children Limited information in children and provided mainly after administration of metoprolol tartrate
Summarized PK and PKPD Information in Adults Table 2 Reported PK Values in Adults (multiple references)
References include Abrahamsson et al Sandberg et al Wieselgren et al
DCP1PM Page 46 10182006
Clinical Pharmacology Review NDA 19-962 Toprol-XL 10182006
Table 3 PKPD Information Reference Key Findings Abrahamsson et al Therapeutic level of szlig1blockade (model- reduction in exercise heart
rate or EHR) is between 80 and 300 nM Sandberg et al Toprol XL is designed to deliver metoprolol succinate at a near
constant rate for about 20 hr Wieselgren et al In healthy males maximal EHR ~ 14 and minimum reduction ~ 9
with 50 mg Activity greater than placebo over 24 hour period Dayer et al Lennard et al Jonkers et al
Poor metabolizers have a higher plasma concentration and a greater duration or degree of beta blockade Potential implications for use of extended release as may not be needed in PMs
Various sources Toprol XL produces clinically and statistically significant reductions in blood pressure values compared to baseline values The maximal blood pressure lowering effect for a given dose in adults is observed between 1 and 4 weeks of treatment In 4 week trials with Toprol XL the maximum decrease in supine BP was 209 and standing was 129 (unclear if at trough) At trough following 4 weeks of 50 mg QD Toprol XL relative to placebo the reduction in supine BP was 112 and 103 in Standing
Summary of sponsorrsquos current analysis relevant to pharmacometrics and resulting claims
Dose-Response Analysis A dose-response analysis was conducted using a simple linear regression model where metoprolol dose in mgkg was the independent variable Week 4 placebo corrected change in blood pressure (diastolic or systolic) from baseline was the dependent variable (response)
Sponsorrsquos Analysis Claims (Dose-Response Study) Following administration of TOPROL-XL at doses of 125 to 200 mg once daily for up to 4 weeks metoprolol
bull Exhibited a significant dose-response relationship for DBP but none for SBP bull Produced statistically significant and clinically meaningful reductions in SBP and
DBP for some individual andor pooled target dose groups (02 10 and 20 mgkg)
Population PK and PKPD Analyses The sponsorrsquos population PK and PKPD analyses involved the use of typical population PK approaches Primarily SAS and NONMEM were used to run the analyses In brief the sponsor pooled plasma concentration time data from patients in Study 307A (trough samples) and 307B (trough samples in most subjects and serial samples in a subset of patients) for the PK modeling PKPD (PD measured primarily as changes in blood pressure) data were from patients in Study 307A These collective data were used in the population PK and PKPD analyses
Initially the sponsor identified the best PK structural population model by testing several pharmacokinetic models This model was further refined by eliminating error terms (etas) that were not statistically significant Subsequently the sponsor evaluated the effect of DCP1PM Page 47 10182006
Clinical Pharmacology Review NDA 19-962 Toprol-XL 10182006
covariates on the PK model and developed a final PK model The goodness of the fit of the model was assessed with standard procedures The final population model was used to simulate individual plasma concentration-time profiles and Bayesian estimates for Cmax and AUC for all patients These simulated AUC and Cmax values and actual (observed) Ctrough were used in the PKPD model The PKPD model was developed in a similar manner as the population PK model Initially the best PKPD base model was identified and the model refined until a final PKPD model was identified
Sponsorrsquos Analysis Claims (Population PK and PD Modeling) 1 A 2-compartment PK model with first-order elimination and flip-flop first-order
absorption and lag time best fit metoprolol concentration-time data obtained from the studied pediatric hypertensive patients
2 The following tabulated parameter estimates were obtained using the final population PK model CLF 2275 Lhr V2F 961 L V3F 620 L QF 675 Lh Ka 00467 hrndash1 Tlag1 0853 hr
These PK values were generally in the same range as those reported in adults
3 Sex race ideal body weight and Toprol-XL dose have no significant effect on metoprolol pharmacokinetics No covariate impacts V2F V3F Ka or the Tlag of metoprolol Age has no effect on metoprolol CLF and body weight has no effect on QF Metoprolol CLF increases linearly with body weight however no dose adjustment based upon body weight is necessary because dosage is titrated based on clinical response QF is proportional to age however the increase in QF with age is not clinically relevant
4 Weak but statistically significant relationships existed between DBP SBP and HR and some measures of metoprolol exposure (trough plasma levels Cmax and AUC(0ndash 24)) Because of high variability in the hemodynamic data goodness-of-fit of the PKPD models was generally poor and the resulting parameter estimates were not considered reliable Extrapolation of these model parameters in the clinic for dose adjustment is not recommended
5 No covariates had an impact on the parameters delineating the PKPD relationship between metoprolol exposure and DBP SBP and HR
Objectives of the analysis There are three specific goals of the PM analysis
1 To evaluate the adequacy of the sponsorrsquos dose-response analysis 2 To evaluate sponsorrsquos population PK analysis and determine if PK labeling claims
are acceptable DCP1PM Page 48 10182006
Clinical Pharmacology Review NDA 19-962 Toprol-XL 10182006
3 To evaluate sponsorrsquos population PKPD analyses and determine if the findings support the proposed dosing recommendation
Dose Response Analysis (Study 307A) Title Dose Ranging Safety and Tolerability of TOPROL-XLreg
(metoprolol succinate) Extended-release Tablets (metoprolol CRXL) in Hypertensive Pediatric Subjects A Multicenter Double-blind Placebo-controlled Randomized Parallel-group Study
Study Duration 30 May 2002 - 9 June 2004 Investigators (primary) Bonita E Falkner MD and Jonathan Sorof MD 1800 Sites Multiple locations (36 in US and 1 in Dominican Republic)
Table 1 Objectives and Outcomes for Study 307A
Study Design (FDA-approved Type A design) This was a multi-center international double-blind placebo-controlled randomized parallel-group study The study included a screening visit a 1- to 2-week single-blind placebo run-in period during which all previous antihypertensive medications were discontinued and a 4-week double-blind treatment period At the end of the placebo run-in period eligible patients with blood pressure (BP) measurements in the qualifying range were randomized in a 1212 ratio to receive once daily oral doses of placebo TOPROL-XL 02 mgkg TOPROL-XL 10 mgkg or TOPROL-XL 20 mgkg TOPROL-XL doses of 125 25 375 50 75 100 150 or 200 mg were used to approximate the target doses Patients in the placebo and TOPROL-XL 02 mgkg groups received the target dose for 4 weeks while patients in the TOPROL-XL 10 mgkg and
DCP1PM Page 49 10182006
Clinical Pharmacology Review NDA 19-962 Toprol-XL 10182006
20 mgkg groups had their dose up-titrated (based on weight) to the target dose over the first 1 to 2 weeks of double-blind treatment
Reviewer Note Rationale on Study design The inclusion of more patients in the TOPROL-XL 02 mgkg and 20 mgkg groups allowed better estimation of the dose response at the low and high ends of the dose range The TOPROL-XL 10 mgkg group with fewer patients provided a middle estimate that helped to describe the shape of the dose-response curve However having a fewer number of subjects may have contributed to variability Inclusion of a placebo control group allowed for the quantification of treatment-related BP reductions after adjusting for placebo effect It should be noted that the placebo groups were not identical as they followed different titration schedules and had a different number of tablets
The 02 mgkg dose is lower than the lowest approved adult dose on a mgkg basis (assuming 70 kg adult weight) but the highest studied pediatric dose 20 mgkg (200 mg limit was placed) is lower than the highest studied adult dosage 400 mg
Table 2 Toprol Dosing Scheme for Study 307A
Table 3 Formulations used in 307A
DCP1PM Page 50 10182006
Clinical Pharmacology Review NDA 19-962 Toprol-XL 10182006
SPONSORrsquoS STATISTICAL ANALYSIS PLAN HIGHLIGHTS bull The primary analysis used an intention-to-treat (ITT) population which included
all patients who received at least 1 dose of study medication and had baseline and at least 1 post baseline measurement For this analysis missing data were imputed using a last observation carried forward (LOCF) approach
bull A simple linear regression analysis was performed on the placebo-corrected change from baseline to Week 4LOCF in sitting SBP and sitting DBP with dose ratio as the explanatory variable
bull The placebo correction for placebo-corrected changes from baseline to Week 4 LOCF in sitting SBP and sitting DBP was performed by subtracting the mean change from baseline for the placebo group from the individual patient changes in the other treatment groups
bull ANOVA was performed with treatment group as the main factor for the changes from baseline to each post baseline visit in sitting SBP and DBP This ANOVA model was used to construct pairwise comparisons of each active treatment versus placebo and the active treatment groups combined versus placebo
bull The percentage of responders at Week 4 was summarized by frequency counts percentages and 95 confidence intervals (CI) for each treatment group
bull Subgroup analyses were also performed on the changes from baseline at Week 4 in sitting SBP and DBP and the influence of heart rate and baseline body mass index (BMI) on the mean changes from baseline to Week 4LOCF in sitting SBP and DBP were examined using linear regressions
bull Trough plasma concentrations of metoprolol were summarized descriptively and the lower limit of quantitation (LLQ) was 1 ngmL
bull Safety data were summarized using the safety population defined as all patients who received at least 1 dose of study medication and were not lost to follow-up No statistical analyses were performed on the safety data in this study
DCP1PM Page 51 10182006
Clinical Pharmacology Review NDA 19-962 Toprol-XL 10182006
Results Patient Disposition Per applicant patients recruited into this study were representative of a pediatric population with hypertension The four treatment groups were balanced with respect to demographic and baseline characteristics (Tables 4 and 5) About 80 percent of the patients were considered 90 compliant
Table 4 Baseline Characteristics in Study 307A
Table 5 Sitting SBP and DBP measurements at baseline
Sitting and standing BP measurement were comparable (eg mean SBP for all patients- sitting = 1319 and standing 1306 with similar CVs ~ 9 )
Primary Efficacy Variable The results for the primary efficacy variable are illustrated in Figure 1 Figure Dose response for placebo-corrected change from baseline to Week4LOCF for sitting SBP (ITT population)
DCP1PM Page 52 10182006
Clinical Pharmacology Review NDA 19-962 Toprol-XL 10182006
Figure 1 Change in SBP from baseline as a function of Toprol XL dose
Table 6 Linear regressions statistics used to assess Dose-Response
The results indicate that bull The slope of the curve is not different form zero (p = 05371 for dose ratio)
suggesting that there is no dose-response relationship bull Most active treatment groups are more effective than placebo in reducing SBP
By visual inspection it appears the lack of observed dose-response is mainly driven by a lower than expected response at the 20 mgkg level
Potential issues affecting efficacy and pharmacokinetic results bull LOCF was required for eight patients however the LOCF approach did not
greatly impact the outcome of the trial bull Patients assigned to the 10 mg and 20 mgkg dose received drug for only 2
weeks whereas dose in the 02 mgkg received the same dose for 4 weeks
DCP1PM Page 53 10182006
Clinical Pharmacology Review NDA 19-962 Toprol-XL 10182006
Reviewerrsquos Supplemental Dose-Response Analyses The sponsorrsquos dose-response analysis was successfully reproduced by this Reviewer using pooled placebo corrected data A supplemental analysis was conducted using group-specific placebo corrected data In this procedure data for subjects assigned to a given Active Group (eg 02 mgkg) were corrected with Placebo data (02 mgkg) Group specific placebo data are presented in Table 7
Table 7 Placebo-group specific data Placebo Group Frequency Delta SBP 02 mgkg 8 -567 10 mgkg 6 -300 20 mgkg 9 230
It should be noted that the group-specific placebo data appeared to follow a consistent trend where the placebo effect decreased with increasing number of tablets It is unclear if this titrationtablet-dependent placebo effect is valid or random Overall the apparent differential placebo effects suggest that the placebo group may have overly influenced the outcome of the dose-response analysis
When active groups are corrected using group-matched placebo data there is a statistically significant dose-response The dose response using group-specific placebo data is illustrated in Table 8 and Figure 2
Figure 2 Placebo corrected changes in SBP (chg_pc on y axis) as a function of dose ratio
Potential Limitations of Supplemental Analyses Typically placebo effects are constant if randomization is correct thus it is unclear if subsetting the placebo group is acceptable and did not increase bias Additionally subsetting the placebo group leads to a reduced number of placebo subjects per dose group that may impact the regression analyses
DCP1PM Page 54 10182006
Clinical Pharmacology Review NDA 19-962 Toprol-XL 10182006
Table 8 SAS output for regression analyses using group-specific placebo corrections The REG Procedure
Model MODEL1
Dependent Variable chg_pc
Number of Observations Read 117
Number of Observations Used 117
Analysis of Variance
Sum of Mean
Source DF Squares Square F Value Pr gt F
Model 1 191083177 191083177 2663 lt0001
Error 115 825109481 7174865
Corrected Total 116 10162
Root MSE 847046 R-Square 01880
Dependent Mean -430358 Adj R-Sq 01810
Coeff Var -19682365
Parameter Estimates
Parameter Standard
Variable Label DF Estimate Error t Value Pr gt |t|
Intercept Intercept 1 125480 133166 094 03480
DOSRATIO Dose Ratio 1 -100051 019387 -516 lt0001
Secondary variables
bull Placebo-corrected change from baseline in sitting DBP The mean plusmn SD change (Week 4LOCF) in sitting DBP is illustrated in Figure 3 and Table 9
Figure 3 Mean changes (actual and placebo-corrected) from baseline to Week 4LOCF for sitting DBP (ITT population)
DCP1PM Page 55 10182006
Clinical Pharmacology Review NDA 19-962 Toprol-XL 10182006
Table 9 SAS output for regression analyses for DBP with pooled placebo correction
Treatment group effects and pairwise comparisons for sitting SBP and DBP Results of the treatment group effects at the Week 4LOCF visit and the pairwise comparisons between each TOPROL-XL group and placebo for the change from baseline in sitting SBP and DBP are shown for the ITT population in Table 10
Table 10 Treatment group effects for change in baseline to Week 4LOCF for sitting SBP and DBP (ITT population)
Some key findings from the pair-wise comparison are as follows (Table 10) 1 All active groups produced statistically significant reductions from baseline in sitting
SBP and DBP at the Week 4LOCF visit whereas placebo did not
DCP1PM Page 56 10182006
Clinical Pharmacology Review NDA 19-962 Toprol-XL 10182006
2 Overall the mean change from baseline in sitting SBP at Week 4LOCF for the TOPROL-XL groups pooled was statistically significantly larger than that for the placebo group (p=00351)
3 Results of pairwise comparisons between individual TOPROL-XL dose groups and placebo also revealed a statistically significant difference for the 10 and 20 mgkg groups (p=00270 and p=00492 respectively)
bull Mean changes over time in sitting SBP and DBP Consistent with findings from other studies with beta-blockers apparent maximal reduction in blood pressure occurred between 1 and 4 weeks of treatment
Figure 4 Mean changes over time for sitting SBP and DBP (ITT population)
Data points in plot are from absolute values (not taking baseline into account)
Subgroup Analyses The sponsor conducted several exploratory subgroup analyses however these analyses were not reviewed critically and are not presented in this review as
1 they do no impact the primary outcome or study objective 2 they are unlikely to be clinically useful due to the small number of patients per
subgroup One potentially useful some group analyses involved the percentage of responders as defined in Table 11
The responder analyses shows comparable response rates for all active dose groups suggesting similar efficacy across dose groups despite different exposure (doses)
DCP1PM Page 57 10182006
Clinical Pharmacology Review NDA 19-962 Toprol-XL 10182006
Table 11 Number and proportion of responders (ITT population)
Pharmacokinetic Results The Ctrough information obtained in the trial are summarized in Figure 6 and Tables 12 and 13
Table 12 Summary of Ctrough data (per applicant)
Sixteen patients across the 3 TOPROL-XL groups did not have blood samples obtained for analysis of metoprolol concentrations Based on the number of samples BLQ there appeared to be very low concentrations in the lowest dose group It appeared that Ctrough increased with dose According to the applicant these values are similar to those obtained previously in adults especially at the 2 higher doses Variability was high in all treatment groups (CV gt 60 )
Table 12 Summary of Ctrough (Reviewer Generated) from all patients (samples lt LOQ given value = 0) Toprol XL Dose Number of subjects Concentration (ngmL) (mgkg) Mean plusmn SD Median Range 02 39 137 plusmn 294 000 0 ndash 157 10 17 1224 plusmn 1416 845 0 ndash 571 20 46 2462 plusmn 3352 1140 0 ndash 1670
DCP1PM Page 58 10182006
Clinical Pharmacology Review NDA 19-962 Toprol-XL 10182006
Reviewer Note Overall the plasma concentrations (exposure) for the 02 mgkg dose group appear too low to be effective (close to LOQ) It is noted that adults typically have concentrations gt LOQ at the lowest therapeutic dose 25 mg (~ 4 ngmL)
Figure 6 Boxplot of metoprolol Ctrough using samples gt LLQ (per applicant)
Safety Results According to the applicant Toprol XL was well tolerated in the pediatric population as tabulated below
Main Analyses Conclusions bull No dose response was observed for corrected SBP using pooled placebo data
however using group-matched placebo data demonstrated a dose response bull Ctrough increased with dose bull Toprol 10 and 20 mg kg doses were more effective than placebo in reducing
SBP bull The responder rate was comparable across all active dose groups and this rate was
greater than that of placebo
DCP1PM Page 59 10182006
Clinical Pharmacology Review NDA 19-962 Toprol-XL 10182006
Methods Reviewerrsquos Methods Generally this reviewer conducted the analyses in a manner similar to that of the sponsor to confirm the sponsorrsquos findings
Sponsorrsquos Methods
Design Study1 307A
Reviewer Note This study was described in the Dose-Response Assessment (please refer to Page 7 Dose Response Analyses) Consequently only highlights relevant to the population analyses will be included in this section
Study 307A was a 4-week multi-center double-blind placebo-controlled randomized parallel-group study TOPROL-XL (metoprolol succinate) extended-release tablets were given to hypertensive pediatric patients Patients were randomized to double-treatment with a once daily oral dose of placebo or Toprol-XL at 1 of 3 target doses 02 or 20 mgkg The dose range for this study was 125 to 200 mg daily Patients on placebo followed the same schedule as that for their active group comparators
Study Flow Chart
Key Inclusion Criteria School age and adolescent children with reproducible SBP or DBP at or above the 95th percentile using height-adjusted charts for age and weight were eligible
DCP1PM Page 60 10182006
Clinical Pharmacology Review NDA 19-962 Toprol-XL 10182006
Study2 307B
Study 307B was a 52-week multi-center open-label study to determine the safety and pharmacokinetics of TOPROL-XL (metoprolol succinate) extended-release tablets (metoprolol CRXL) in hypertensive pediatric patients The starting dose was 25 mg daily The dose was increased every 2 weeks in increments of 25 mg or 50 mg based on tolerability until BP was controlled or the dose reached 200 mg
Table 1 Study Assessments
At the end of the 52-treatment period all patients had BP measured and a trough plasma level taken 24 hours the last dose of Toprol-XL with the exception of those patients who completed the serial portion at the final visit Among the participants a subgroup of approximately 30 patients was to participate in PK assessments of metoprolol requiring serial blood sampling at any time during the 52 weeks A single dose of 25 mg of Toprol-XL was given orally to those participating patients after a 48-hour washout period After the PK assessments they returned to the main study protocol Data
Study1 307A
4111 Pharmacokinetics A blood sample was to be collected at Visit 7 into a heparinized Vacutainer tube and obtained at 24 hours (plusmn2 hour) following the last dose of study medication (ie trough measurement) for determination of plasma metoprolol concentrations
Study Disposition Chart
DCP1PM Page 61 10182006
Clinical Pharmacology Review NDA 19-962 Toprol-XL 10182006
Table 2 Study Demographics
4112 Pharmacodynamics Primary variable
Sitting SBP determined at trough (24plusmn4 hours Visit 7) served as the primary efficacy assessment The primary measure of effect was the placebo-corrected change from baseline to the end of treatment (Week 4) in trough sitting SBP Each BP determination represented the mean of 3 readings with less than 7 mmHg between the highest and lowest value Blood pressure was measured using a mercury sphygmomanometer with an appropriate size cuff positioned approximately at the level of the heart Every effort was made to have the same individual measure the patientrsquos BP throughout the study if possible At all post randomization visits BP measurements were to be made at trough defined as 24 hours (plusmn4 hours) after receiving study medication All measurements were to be determined prior to the patient taking the scheduled dose of study medication In the
DCP1PM Page 62 10182006
Clinical Pharmacology Review NDA 19-962 Toprol-XL 10182006
event that the patient accidentally took study medication on the day of the scheduled visit the visit was to be rescheduled within 24 to 48 hours
Study2 307B
4113 Pharmacokinetics A 48-hour washout period prior to sampling was required for all patients including patients who entered the 52-week study and then decided to participate in the serial PK portion of the study All patients were to have a 15-mL blood sample collected into a heparinized Vacutainer tube 24 hours (plusmn2 hour) following the last dose of TOPROL-XL (ie trough measurement) at Visit 18 (or a the time of premature discontinuation) except for patients who participated in the serial PK portion of the study and had blood sampling performed at Visit 18 For patients participating in the serial PK portion of the study blood samples (15 mL) were to be collected into heparinized Vacutainer tubes and obtained at Hour 0 (predose) and at 1 2 3 4 6 8 10 and 24 hours after administration of a single 25 mg dose of TOPROL-XL following a 48-hour washout period After the last blood sample was obtained the patient was to startresume the prescribed dose of TOPROL-XL heshe was receiving prior to PK sampling
Patient Disposition Chart (completion or discontinuation)
Overall a total of 31 patients at 8 centers were enrolled in the serial PK portion of the study Of these 31 patients 27 had plasma concentration data available and were included in the analyses Four patients were excluded from the analyses because their plasma concentrations were not quantifiable (Nos 047-009 and 047-021) or because only whole blood samples were analyzed (Nos 005-002 005-003)
DCP1PM Page 63 10182006
Clinical Pharmacology Review NDA 19-962 Toprol-XL 10182006
Table 3 Subject Demographics for Patients Providing Serial Blood Samples
Missing Data Twenty-six patients did not have blood samples obtained for analysis of metoprolol concentrations in either the 16-week (n=7) or 52-week (n=19) studies Among patients with plasma samples 14 (14) in the 52-week study and 13 (13) in the 16-week study had trough plasma metoprolol concentrations that were below the LLQ Therefore data from a total of 99 patients were included in this analysis
Assay Metoprolol plasma levels were assayed using high-performance liquid chromatography tandem mass spectrometric detection methods having limit of quantitation (LOQ) of 1 ngmL The method was validated in the linear range 1 to 1000 ngmL Precision was less than or equal to 109 Accuracy ranged from 940 to 1013 Pharmacodynamics Not applicable
Data Checking SAS was used to format and check data Additionally visual inspection of several randomly selected subject data was carried out
DCP1PM Page 64 10182006
Clinical Pharmacology Review NDA 19-962 Toprol-XL 10182006
Models
Overview The sponsorrsquos stated assumptions underlying this modeling analysis are
1 Rich sampling data collected from 30 subjects in 307B Study can be used to adequately characterize the structural pharmacokinetic model of metoprolol
2 Structural pharmacokinetic models of metoprolol at other dose strength are identical to that at 25 mg
3 Metoprolol exhibits a linear pharmacokinetics in the dose ranges studied 4 Steady-state pharmacokinetics of metoprolol has been reached at the time of blood
sampling in Study 307A 5 Metoprolol accounts for the blood pressure effect in the study 6 Existing various disease states in the patients have no impact on the pharmacokinetics
of metoprolol and pharmacodynamics of the blood pressure reduction in the study 7 Concomitant medications if existed do not have any effects on the pharmacokinetics
of metoprolol and pharmacodynamics of the blood pressure reduction in the study
Reviewer Comment The sponsorrsquos assumptions appear reasonable based on existing metoprolol PKPD information
Pharmacokinetics
4114 PK Structural Model Several PK models were tested to identify the structural model Flip-flop absorption was taken into consideration based on general PK characteristics following administration of sustained release tablets and observed data in the current study (serial PK samples)
The models tested included linear 1- and 2-compartment PK models with the following characteristics (focused on flip-flop models)
bull first-order absorption with and without absorption lag time (NONMEM subroutines ADVAN2 and ADVAN4)
bull zero-order absorption with and without absorption lag time (NONMEM subroutines ADVAN1 and ADVAN3)
bull simultaneous zero- and first-order absorption from the absorption compartment The models were parameterized in terms of CLF and VF
Ultimately the 2-compartment model with first order flip-flop absorption an absorption lag time and 2 residual error terms was selected as the structural model of metoprolol The model scheme is presented in the following Figure 1 Figure 1 PK Compartmental Model
DCP1PM Page 65 10182006
Clinical Pharmacology Review NDA 19-962 Toprol-XL 10182006
4115 PK Covariate Model Covariate models were developed to account for the potential impact of the following covariates and derived covariates on metoprolol PK
Continuous variables bull Age (AGE years) bull Body weight (WT kg) bull Body surface area (BSA m2) calculated from WT and HT (cm) using the height
weight formula BSA=0024265 x WT 05378 x HT03964 bull Ideal body weight (IBW kg) calculated as - Males IBW=50+(HTndash150)25 and
for Females IBW=45+(HTndash150)25 bull Dose (DOSE mg of Toprol-XL)
Categorical variables bull Gender (SEX) - Male 0 - Female 1 bull Race (RACE) - Caucasian 0 - Black 1 - Asian 2 - Other 3
PK covariate effects were modeled as follows
Effects of continuous covariates (AGE WT BSA IBW and DOSE) were normalized to the corresponding median value across a dataset such that continuous covariates were related to structural PK parameters in a power function as described below
where Θ is the fixed-effect parameter of a covariate estimated by the NONMEM program covariate value is the observed covariate value and PK typical value is the typical value of the PK parameter estimated by NONMEM Effects of categorical covariates (SEX and RACE) are related to structural PK parameters by fractional changes of dummy variables
DCP1PM Page 66 10182006
Clinical Pharmacology Review NDA 19-962 Toprol-XL 10182006
Where Θ is the fixed-effect parameter of a covariate estimated by the NONMEM program covariate is the dummy variable value and modified in the control streams and PK typical value is the typical value of this PK parameter as estimated by NONMEM
Median values of all covariates in the dataset for population PK analysis are presented in Table A
Table A Summary of patient covariates and Toprol-XL doses in the data for population PK analysis
Two Steps were included in the modeling of covariates
Step 1 Forward Addition The covariates were subjected to a stepwise forward selection algorithm using a likelihood ratio test based on a change in MOF values from the base model A significant covariate reduced the MOF more than 660 (chi-square distribution plt001 degrees of freedom [df]=1)
Step 2 Backward deletion (Excluding procedures for covariate effect) The covariates in the full model acquired in Step 1 were subjected to a backward deletion algorithm 1 covariate was deleted at a time using a likelihood ratio test based on a change in MOF values A covariate was determined to be statistically significant if the change in MOF after its deletion from the breakdown model was increased by more than 1083 (chi-square distribution plt0001 df=1)
4116 PK Random Variance Models An exponential error model was used to characterize inter-patient variability based upon the assumption that random effects for PK parameters were not correlated among PK parameters No other error models for eta were evaluated by the applicant or by this Reviewer The retention of ETA values for each PK parameter in the structural model was confirmed by sequentially fixing each ETA value at zero and comparing each resultant MOF with the MOF obtained when all ETA values were retained in the model (see Table 6)
DCP1PM Page 67 10182006
Clinical Pharmacology Review NDA 19-962 Toprol-XL 10182006
The residual model was modeled by an additive model two error terms were used one for error associated with trough samples and the other with serial samples
Reviewer Note Use of an exponential model appears reasonable
Pharmacodynamics
4117 PKPD Structural Model The equations for the structural models are shown below
1 Metoprolol Ctrough The relationships between the observed metoprolol concentrations (Ctrough) and hemodynamic changes were investigated using 4 direct-link models namely a linear model a log-linear model and Hillrsquos sigmoid Emax PKPD model with and without a baseline
2 The relationships between Cmax or AUC0ndash24 and hemodynamic changes were investigated using 2 direct-link models a linear model and a log-linear model
4118 PKPD Covariate Model The inclusion and exclusion procedures of covariate effect on the selected PKPD base model to obtain a selected final PKPD model were identical to those in the covariate evaluation in the population PK models as described previously in PK Covariate Model DCP1PM Page 68 10182006
Clinical Pharmacology Review NDA 19-962 Toprol-XL 10182006
Table B Baseline demographic and covariate characteristics
4119 PKPD Random Variance Models An exponential error model was used by the applicant to model inter-individual variability The retention of a random effect parameter ETA in each selected PKPD structural model was then evaluated by sequentially fixing each ETA value at zero and comparing each resultant MOF with the MOF obtained when all ETA values were retained in the model (plt005) This step reduced over-parameterization by deleting unnecessary random-effect parameters from the structural model to obtain the base model
Reviewer Note The study design precludes assessment of inter-individual variability or random error because only one dose record was available per patient Consequently the model should not have included eta terms It is noted that the sponsor ultimately dropped the eta term in the final model
DCP1PM Page 69 10182006
Clinical Pharmacology Review NDA 19-962 Toprol-XL 10182006
Model Selection
PK Initial Model Selection
PK Base Model to Final Model The selection of the most appropriate PK base model for a metoprolol PK was based upon the following criteria a significant reduction in MOF as compared to the baseline model and asymptotic chi-square distribution based on the likelihood ratio test or AIC (plt005) as compared to the other structural models This selected PK base model was then subject to a covariate evaluation The population PK model bearing all surviving covariate parameters with statistical significance became the penultimate final model If 1 of the body size parameters (WT BSA and HT) was not in the model the penultimate final model became the final model If body size parameters were in the model they were sequentially replaced by other body size parameters in the regression submodel for each PK parameter The best body size parameter was then selected on the basis of lowest MOF to form the final model
PK Final Model Selection Simulations and visual inspections based on goodness of fit plots were used to qualify and validate the model The goodness-of-fit of the final model was evaluated graphically by comparing population and individual predictions of metoprolol concentrations with observed metoprolol concentrations along the line of unity and by visual inspection of the following plots of population-weighted residuals (WRES) for the final population model 1 Population-weighted residuals (WRES) versus population-predicted concentrations (PRED) 2 WRES versus time after first drug administration in each patient 3 WRES versus all covariates evaluated WRES were generally expected to be distributed homogenously around zero for PRED time after administration and covariates For those 27 patients with serial samples goodness-of-fit of the plasma concentration-time profile for each individual was visually inspected The linear relationship between their AUClast values from the observed data and those from the simulated data (final model) was examined
The predictive performance of the final population PK model including covariates was evaluated by comparing typical values of PK parameters with the mean of individual Bayesian estimates or individual values of PK parameters with the results from non-compartmental analysis for patients with serial samples Steady-state metoprolol plasma concentration-time profiles from 0ndash24 hours at the interval of 15 minutes (025 hour) were calculated using the post hoc Bayesian estimated PK parameter obtained for 65 patients included in the PKPD relationship using the following equation
DCP1PM Page 70 10182006
Clinical Pharmacology Review NDA 19-962 Toprol-XL 10182006
PKPD Initial and Final Model Selection A similar approach to that of PK model selection was adopted for PKPD Each of the above-mentioned PKPD models with random effects was identified by curve-fitting the dataset Initial selection of the PKPD structural model was based upon a significant reduction in MOF (plt005) as compared to the baseline model and reasonable PKPD parameter estimates Software
Nonlinear mixed-effect modeling (NONMEM) software (Version V level 11 Globomax Hanover MD) was used in the population PK analysis PK model fitting was accomplished using first-order (FO) approximation methods For PKPD model fitting the first-order conditional estimation (FOCE) with eta-epsilon interaction method in NONMEM was used for all model runs
SAS software (Version VIII Cary NC) was employed to prepare datasets according to the format required by the NONMEM program (Boeckmann et al 1991) Microsoftreg Excel 2000 (Redmond WA) and S-PLUS 2000 (Professional Release 2 MathSoft Inc Cambridge MA) were used to perform exploratory graphical exposure calculation and statistical analyses according to the format required by the NONMEM program (Boeckmann et al 1991) SAS command files logs and listings pertaining to data file conversion and merging were reviewed by an independent analyst Datasets were stored in SAS data frames combined and exported to Excel and then to ASCII files before fitting to the model
Datasets were prepared and pooled in a NONMEM-compliant format using SAS software by the Programming Group Clinical Information Sciences at AstraZeneca Wilmington Delaware SAS command files logs and listings pertaining to file conversion and merging were provided and found to be acceptable The contents of both datasets (toprolkatcsv for PK modeling and cppd2csv for PKPD modeling) were included
DCP1PM Page 71 10182006
Clinical Pharmacology Review NDA 19-962 Toprol-XL 10182006
toprolkatcsv was not provided electronically in a SAS format however this reviewer generated a similar dataset using the applicantrsquos criteria
Reviewer Comment The software and data assembly methods appeared adequate
DCP1PM Page 72 10182006
Clinical Pharmacology Review NDA 19-962 Toprol-XL 10182006
Results and Discussion Design Adequacy
Overall the trial designs appeared adequate to evaluate metoprolol population PK and PKPD in pediatric patients receiving Toprol XL However the design could have been further optimized by increasing the sampling points particularly in the absorption phase Due to the limited number of samples in the absorption phase it was not possible to accurately characterize the absorption model first order vs zero order or mixed first and zero order Additionally collection of mainly trough samples limits the ability to accurately estimate measures such as Cmax that are not directly related to Ctrough particularly if multiple compartments are present Consequently Cmax estimations are unlikely to be accurate Finally most patients provided only one trough sample thus inter-individual variability could not be adequately captured and may have limited the utility of the modeling exercise particularly in PKPD where the random effect could not be accurately characterized Ultimately there was no random variable in the final PKPD model (ie eta was set to zero) Data Integrity
This reviewer checked the data visually by randomly selecting data from patients included in the population modeling and comparing to data in the study report (source data) Overall the data integrity appeared acceptable The applicant observed the following guidelines that appeared acceptable No datum from any study participant with a protocol violation that was thought to materially impact the analysis was included The dataset contained data from only those study participants who could be evaluated ie with all the last dosing datetime blood sampling datetime plasma drug concentrations and demographic covariates
Data that were excluded (n = 62 samples) from the model were as follows One sample from an apparent poor metabolizer Two samples collected gt 96 hours post dose From 307B 10 trough samples lt LOQ From 307A 17 samples lt LOQ Thirty-samples from serial data that were lt LOQ or whole blood samples Model and Model Selection
Base Model
41110 Pharmacokinetic Model description The base PK model was a standard two compartment model that incorporated lag time and flip-flop kinetics The key features of the model were flip-flop was insured by making the value of ke gt ka in the clearance equation Additionally lag time was restricted to a value of 2 hours or less and concentrations were log transformed consequently all concentrations (F) = 0 were given individual predicted concentrations of zero Finally there were two residual error terms one for serial samples and the other for trough samples DCP1PM Page 73 10182006
Clinical Pharmacology Review NDA 19-962 Toprol-XL 10182006
Key equations were as follows
KA = THETA(1)EXP(ETA(1)) V2 = THETA(2)EXP(ETA(2)) CL = (THETA(1)THETA(2)+THETA(3))EXP(ETA(3)) Q = THETA(4)EXP(ETA(4)) V3 = THETA(5)EXP(ETA(5)) ALAG1=THETA(6)EXP(ETA(6))
41111 PK Parameter estimation results Table 1 Summary of PK parameters in the metoprolol population PK base model (per applicant)
41112 Goodness of fit The applicant provided the following goodness-of-fit plots (Figure 1)
Reviewer Note The goodness-of-fit plots were reproduced by this Reviewer (see Appendix) with minor modifications
Figure 1 Goodness of fit plots for Base Model
DCP1PM Page 74 10182006
Clinical Pharmacology Review NDA 19-962 Toprol-XL 10182006
Base PK Model Selection The MOF values of all structural model candidates tested are presented in Table 2 Model selection was based primarily on MOF values the lower MOF the better the model The applicant reports that in general MOF values generated by a conventional absorption model (ie absorption rate is faster than elimination rate) and a flip-flop absorption model (ie absorption rate is slower than elimination rate) were identical
Reviewer Comment The existence of flip-flop kinetics appears plausible based on data provided and general patterns for sustained release formulations Consequently the use of flip-flop kinetics for the bulk of the modeling exercise appears reasonable
General conclusions from the information in Table 2 are First order input is better than zero order input Two compartment model is better than one compartment model Lag time presence is better than lack of lag time Two residual error terms are better than one residual error term It should also be noted that several other models led to unsatisfactory completion of the run and were not considered further
DCP1PM Page 75 10182006
Clinical Pharmacology Review NDA 19-962 Toprol-XL 10182006
Table 2 Comparison of Structural PK Models
Reviewer Comment The selected structural model appears appropriate based on the data
Base Model The deletion of ETA for V2 did not change the MOF value suggesting that ETA for V2 should be deleted to avoid an over-parameterized warning (Table 3) This was consistent with the estimated parameter value of ETA for V2 being 648 x 10ndash9 a very small value Therefore the base model was selected by deleting the ETA for V2 from the structural model
Reviewer Comment on Eta deletion for V2 Deletion of eta for V2 is acceptable based on the empirical data however from a physiological perspective deletion of eta is problematic Generally one anticipates inter-individual differences in volume of distribution In this case it appears that the error associated with V2 may have been randomly shifted to V3 and or Q terms as the three DCP1PM Page 76 10182006
Clinical Pharmacology Review NDA 19-962 Toprol-XL 10182006
terms are interrelated This potential shift in error is supported by the fact that the V2 eta value increases significantly (by several orders of magnitude- 10-5 vs 100) when eta for Q and or V3 is fixed However when Q or V3 are fixed minimization is successful but Q and V3 are not accurately estimated Accounting for the possible error shift is a complex process and goes beyond the scope of this reviewer thus deletion of eta associated with V2 was considered acceptable for the remainder of the modeling evaluation
Table 3 Structural elements tested in the metoprolol population PK structural model (p lt 0005)
Final PK Model
41113 Model description The key feature of the final model is the inclusion of the covariate effects of age on Q and weight on CL in the population PK model
Key Equations CL = (THETA(1)THETA(2)+THETA(3)+EWT)EXP(ETA(2)) Q = THETA(4)EAGEEXP(ETA(3))
Including Covariate Effects As previously described covariate effects were assessed by forward addition and backward deletion Most covariates did not significantly change MOF however BSA significantly affected CL and Age affected Q Consequently these covariates were included in the penultimate final model
DCP1PM Page 77 10182006
Clinical Pharmacology Review NDA 19-962 Toprol-XL 10182006
Reviewer Note BSA is derived form WT and HT covariates implying BSA is highly correlated to these two covariates (Figure 2) weight is the most suitable (practical covariate) as it is readily measured Furthermore weight and BSA produced the same MOF (Table 4) whereas MOF with height was more positive (less significant)
Figure 2 Plot of BSA vs Body Weight
The data in Table 4 support selection of the final model
Table 4 Covariate elements tested in the metoprolol population PK penultimate final model (plt0005)
The applicant acknowledges that mechanism(s) accounting for the impact of age on QF are not clear However since distribution clearance has little effect on metoprolol plasma exposure further investigation is not needed
41114 PK Parameter estimation results As shown in Table 5 PK parameters were estimated fairly precisely by the final model
Table 5 PK Parameter Estimates using Final Model
DCP1PM Page 78 10182006
Clinical Pharmacology Review NDA 19-962 Toprol-XL 10182006
41115 Goodness of fit The goodness-of-fit plots provided by the applicant show good precision Figure 5 Goodness of fit plots for final PK model
DCP1PM Page 79 10182006
Clinical Pharmacology Review NDA 19-962 Toprol-XL 10182006
PK Model Qualification The post hoc Bayesian-estimated AUC (simulated) obtained for the 27 patients with serial plasma samples are plotted against the observed (AUCt) The correlation was high (R2 gt 099) Figure 6 AUClast from observed data versus AUCt from model simulation in the 27 patients providing serial plasma samples
Regression line Y= 4514 + 08976 X R2 = 09957
The graphical validation of the final metoprolol population PK model validation against covariates evaluated is presented in Figure 6
Figure 7 Graphical validation of covariates
DCP1PM Page 80 10182006
Clinical Pharmacology Review NDA 19-962 Toprol-XL 10182006
There was no systematic bias in weighted residuals for any covariates evaluated suggesting that the final model included all appreciable effects of available covariates (Figure)
The effects of weight on metoprolol CLF are illustrated in Figure 8 where Bayesian post hoc estimates of CLF are plotted against weight and overlaid by the model-predicted line Overall the model appeared to fit the data well
Figure 8 Plot of CLF vs Body weight
The effects of AGE on metoprolol QF are illustrated in Figure 9 where Bayesian post hoc estimates of QF are plotted against AGE and overlaid by the model-predicted line Figure 9 Plot of QF vs Age
DCP1PM Page 81 10182006
Clinical Pharmacology Review NDA 19-962 Toprol-XL 10182006
Reviewer Note The applicant indicated that attempts to run the final model using the first-order conditional estimation method resulted in termination errors Therefore the parameter estimates obtained by the FO method were reported as the final parameter estimates
Conclusion Regarding Population PK Modeling Overall the sponsorrsquos population PK modeling is acceptable
PKPD Model and Model Selection
PKPD Base Model PharmacokineticPharmacodynamic Model description The key feature of the model was a lack of random variance term for the slope (since only single data points were available per subject) and inclusion of baseline effect
Key equations were as follows E0 = THETA(1)EXP(ETA(1)) M = THETA(2) Y = E0 + MLOG(AUC) + EPS(1)
The control stream provided in the appendix is that for DBP (provided by sponsor) The control stream for SBP is comparable with appropriate substitution for BP type
It should be noted that only the log-linear and linear PKPD models were considered suitable for AUC and Cmax For this review only AUC estimates were considered reliable as Cmax estimates could not be accurately determined based on the sampling scheme Consequently the remainder of this review focuses on AUC information although Ctrough and Cmax data are displayed for reference
Bayesian estimates from PK modeling are summarized in Table 1
Table 1 Bayesian estimates of metoprolol PK exposure for those patients included in the PKPD analysis (N=65)
DCP1PM Page 82 10182006
Clinical Pharmacology Review NDA 19-962 Toprol-XL 10182006
PKPD Model Selection (initial and final) The log-linear model was adopted as the base model for this PKPD relationship since it improved the MOF significantly (Table 2) The ETA parameter for the slope was pre-eliminated for the purpose of model parsimony The intercept and slope in this log-linear model for AUC(0-24) did not bear ETA parameter therefore no covariates had impact on either parameter in the model
Reviewer Note The intercept should not have borne an eta term because individual subjects provided only one data point Consequently fixing eta to zero or deleting eta in the final model is appropriate No further model development was required after eta was eliminated and the base model was equivalent to the final model
Table 2 Base population PKPD models tested for the change in SBP
41116 PKPD Parameter estimation results The final PKPD parameter estimates are presented in Table 3
Table 3 Summary parameters in the final PKPD model for the change in SBP using trough plasma level Parameter Explanation Estimate SE ()b
DCP1PM Page 83 10182006
Clinical Pharmacology Review NDA 19-962 Toprol-XL 10182006
Model Qualification Based on the relatively low R2 value and as shown in Figure there is a poor correlation between change in SBP and log AUC
Figure 1 Relationship between change in SBP and AUC (line generated from modeling)
Overall goodness-of-fit of the model was considered to be poor probably due to the high variability in the measurements Consequently the precision of the model parameter estimates was not considered to be very reliable These parameters have little clinical usefulness and can be treated only as an indication of trends ie more hemodynamic effects can be potentially achieved when high Toprol-XL doses are given Clinical dose adjustment based on these PKPD parameters is not recommended
Reviewerrsquos Supplemental Analyses A supplemental PKPD analyses was conducted using simple linear regression since the population model did not improve the fit Overall eta made an insignificant contribution to the overall model The results of the analyses were similar to the population analyses A series of regression analyses were conducted and are presented in Table 4
The applicant notes that the preliminary modeling exercise found that there was no difference in the PKPD modeling results using different hemodynamic data formats (ie change in the measurements percent change in the measurements or actual BP measurements) This finding was confirmed by this reviewer (see Table 4)
DCP1PM Page 84 10182006
Clinical Pharmacology Review NDA 19-962 Toprol-XL 10182006
Table 4 Supplemental PKPD Regression Analyses Conducted by Reviewer Model (liner regression) Intercept (I) Slope (m) R2 Probability RSBP = mISBP + I 3957 -035 01626 0009 PSBP = mISBP + I 2524 -023 01252 00038 PSBP = mRSBP + I 0005 074 09891 lt 00001 RSBP = mlogAUC + I 651 -221 0060 00493 RSBP = mDose + I -751 0006 00026 06878 RSBP = mDose^ + I -312 -111 004 02711 RSBP = mlogAUC + nISBP + I 5303 -221 (m)
-035 (n) 02230 0001
RSBPplc = mAUC + I -667 -0003 00458 00871 RSBPplc = mlogAUC + I 461 -2208 00600 00493 RPUL = mlogAUC + I 1868 -405 01102 00069 Symbols in table similar to population PK model without eta term RSBP- change of SBP without placebo correction ISBP- initial (baseline) SBP RPUL- change in HR without placebo correction Dose- in mg where placebo is included as 0 mg PSBP- percentage change of SBP without placebo correction
Conclusion Regarding Population PKPD Modeling Overall the sponsorrsquos population PKPD modeling is acceptable No dose adjustment conclusion can be made from this modeling however an exposure-response relationship was established for AUC and reduction in SBP
Discussion
The significance of the results 1 Provide estimates of PK measures and plasma exposure in pediatric population These data can be compared to adult exposure to determine if exposure differences impact drug effectiveness The main challenge in comparing pediatric data to adult data is different modeling schemes formulations and methods were used in the two populations
2 PKPD findings are not sufficiently precise to provide a dose adjustment algorithm however the PKPD analyses provides rationale for proposed titration as increasing exposure (doses) may improve efficacy (reduction in SBP) Ultimately the risk-benefit analyses overrides PKPD assessment for dose adjustment drug will be titrated thus reliance on PKPD information is not critical The proposed dose 10 mgkg appears suitable based on available information It is unclear from the studies if there should be an initial maximum dose although the sponsor has proposed 50 mg as the maximum initial dose The proposed pediatric starting dose on a mgkg basis is within the range of starting adult doses (25 ndash 100 mg) assuming an adult weighs 70 kg
3 Cumulative information form dose-response study indicates that Toprol XL has effectiveness in children however the most effective dose is unclear Since the drug can be titrated determining the initial optimal dose does not appear critical As proposed by the applicant dosing is started at a ldquolowrdquo dose that can be up-titrated if needed
DCP1PM Page 85 10182006
Clinical Pharmacology Review NDA 19-962 Toprol-XL 10182006
4 The results did not adequately address the potential impact of CYP2D6 metabolic status for pediatric patients taking Toprol XL There were an insufficient number of patients to make this assessment
5 Covariate effects do not appear significant only body weight significantly affects clearance However a worst case scenario can occur with a person that has a low body weight and is a poor metabolizer this will result in very high possibly supra-therapeutic exposure Age does not impact apparent oral clearance so an age-dependent dose adjustment is not needed for children over 6 years old In essence all children over six years old can initiate therapy at 10 mgkg
The validity of the results Overall the results produced by the sponsor appear valid and the sponsor used a sound modeling approach However alternative approaches that could have been adopted may have improved the outcome of the analyses Three of these approaches are presented below 1 Additional PK samples should have been collected during the absorption phase and
throughout the dosing interval to improve the modelrsquos performance Specifically additional samples collected during the absorption phase may have unambiguously identified the actual absorption input function (eg first order zero order mixed first and zero order) First order input was selected for the analyses although the dosage form is reported to exhibit zero order kinetics in adults It is possible that the input rate in children differs from that in adults but unlikely It should be noted that absorption kinetics in children is often erratic due to multiple factors (eg regioshyselective absorption incomplete gastric emptying and inconsistent absorption) so it is unclear if additional samples would have definitively identified the absorption function However additional non-trough samples may have helped in estimating key PK measures such as V and Cmax The final model did not have an eta associated with V which is atypical Collection of additional samples on different visits may have helped estimate potential inter-occasion variability It should be noted that AUC was estimated precisely for subjects providing serial samples but these subjects were not necessarily included in the PKPD analyses Ideally the PKPD modeling should have been conducted primarily in subjects who had accurate PK measures
2 The PKPD design could have been modified to potentially improve the utility of the analyses Specifically there should have been better placebo matching procedures to minimize the potential impact of the placebo effect This matching could have been improved by ensuring all patients on placebo had the same titration schedule and number of tablets It is noted that the model had a poor predictive performance that was mainly attributed to the high degree of variability in the PD measures Potentially other PD markers could have been explored that have less inherent variability One such marker is the degree of beta blockade using exercise heart rate (EHR) reduction this marker has been used extensively for metoprolol in adult subjects However use of EHR in the pediatric setting may be challenging
DCP1PM Page 86 10182006
Clinical Pharmacology Review NDA 19-962 Toprol-XL 10182006
Comments to sponsor
In future pharmacometric studies you should consider the following 1 collect sufficient (multiple) samples from individual subjects to allow assessment
of inter-occasion variability and estimation of inter-individual variability (eta) for all relevant parameters
2 placebo groups should be identically matched across all dose groups (eg same titration schedule and number tablets) to minimize potential bias or differences in the placebo effect
Comments to medical reviewer
1 The sponsor has adequately characterized metoprolol PK in the studied pediatric population The PK characterization could have been further optimized by obtaining additional samples over the entire dosing interval (eg during the absorption phase and elimination phase) on multiple occasions rather than on one occasion primarily at trough
2 A dose-response relationship could not be established using the protocol specified analysis approach The outcome of the dose-response relationship appeared highly dependent on the ldquoplacebo effectrdquo suggesting that the placebo group may not have been appropriate One should consider re-evaluating the dose-response precisely matched placebo groups (eg all placebo patients have identical number of tablets and titration schedule)
3 Based on the PKPD analysis plasma exposure (AUC) explains lt 10 of the response (reduction in systolic blood pressure) thus has limited clinical utility However the PKPD relationship suggests that there is a trend for increased response with increased exposure (dose driven)
4 Overall information from the dose-response study suggests that Toprol- XL is effective in the pediatric population The optimal initial dose 02 10 or 20 mgkg or the maximum safe and effective dose cannot be determined from the information provided It is noted that the 02 mgkg dose is unlikely to be effective as plasma concentrations achieved at this dose are unlikely to be effective (most concentrations lt LOQ and lower than effective adult concentrations) The 10 mgkg (proposed by applicant) appears to be a reasonable initial dose The labeling should reflect the regimens studied
DCP1PM Page 89 10182006
Clinical Pharmacology Review NDA 19-962 Toprol-XL 10182006
Appendix
DCP1PM Page 90 10182006
Clinical Pharmacology Review NDA 19-962 Toprol-XL 10182006
DCP1PM Page 91 10182006
Clinical Pharmacology Review NDA 19-962 Toprol-XL 10182006
DCP1PM Page 92 10182006
Clinical Pharmacology Review NDA 19-962 Toprol-XL 10182006
DCP1PM Page 93 10182006
Clinical Pharmacology Review NDA 19-962 Toprol-XL 10182006
DCP1PM Page 94 10182006
Clinical Pharmacology Review NDA 19-962 Toprol-XL 10182006
DCP1PM Page 95 10182006
Clinical Pharmacology Review NDA 19-962 Toprol-XL 10182006
Table 15 Control streams for final log-linear PKPD model for the change in DBP using metoprolol Cmax as the measure of exposure
Truncated NONMEM reports for base model identification for PKPD relationship in change of SBP (per sponsor)
DCP1PM Page 96 10182006
Clinical Pharmacology Review NDA 19-962 Toprol-XL 10182006
Reported PD information^
^ Under metoprolol regimen CRZ0K is Toprol XL
DCP1PM Page 97 10182006
Clinical Pharmacology Review NDA 19-962 Toprol-XL 10182006
Table Results of randomised double-blind comparative trials evaluating antihypertensive efficacy of metoprolol formulations or other antihypertensives
DCP1PM Page 98 10182006
---------------------------------------------------------------------------------------------------------------------
---------------------------------------------------------------------------------------------------------------------
---------------------
This is a representation of an electronic record that was signed electronically and this page is the manifestation of the electronic signature
s
Robert Kumi 10182006 045635 PM BIOPHARMACEUTICS
Patrick Marroum 10192006 050811 PM BIOPHARMACEUTICS
Clinical Pharmacology Review NDA 19-962 Toprol XL 10182006
Table of Contents
1 EXECUTIVE SUMMARY4
11 RECOMMENDATIONS4 12 PHASE IV COMMITMENTS 4 13 SUMMARY OF IMPORTANT CLINICAL PHARMACOLOGY FINDINGS 5
2 QUESTION BASED REVIEW 6
21 WHAT ARE THE GENERAL ATTRIBUTES OF METOPROLOL 6 22 WHAT ARE THE GENERAL CLINICAL PHARMACOLOGY CHARACTERISTICS OF METOPROLOL SUCCINATE7 23 WHAT INTRINSIC FACTORS AFFECT METOPROLOL EXPOSURE-RESPONSE 16 24 WHAT EXTRINSIC FACTORS AFFECT METOPROLOL EXPOSURE-RESPONSE 18 25 WHAT ANALYTICAL METHOD WAS USED IN PEDIATRIC STUDIES 307 A AND 307B 18
3 DETAILED LABELING RECOMMENDATIONS 19
LABELING 19
4 APPENDICES 22
41 SPONSORrsquoS PROPOSED LABEL 22 42 PHARMACOMETRICS REVIEW 40 STUDY1 307A 60 STUDY2 307B61 DATA61 MODELS 65 MODEL SELECTION 70 SOFTWARE71 DESIGN ADEQUACY 73 DATA INTEGRITY 73 MODEL AND MODEL SELECTION 73 PKPD MODEL AND MODEL SELECTION 82 DISCUSSION 85 LABELING 87 COMMENTS TO SPONSOR89 COMMENTS TO MEDICAL REVIEWER 89 APPENDIX 90
List of Tables Table 1 Snapshot of metoprolol clinical pharmacology and biopharmaceutic information 7 Table 2 Study Designs 7 Table 3 Number and proportion of responders (ITT population) 11 Table 4 PKPD Comparisons- Pediatric Patients vs Adults 14 Table 5 Metoprolol population PK parameter estimates (SE ) obtained using final population
PK model 15 Table 6 Comparative PK (children vs adults) 15 Table 7 Bayesian estimates of metoprolol PK exposure for those patients included in the PKPD
analysis (N=65) 16 Table 8 Metoprolol exposure in adults following administration of Toprol XL 16
Page 2 of 98
Clinical Pharmacology Review NDA 19-962 Toprol XL 10182006
List of Figures Figure 1 Dose response for placebo-corrected change from baseline to Week4LOCF for sitting
SBP (ITT population) 9 Figure 2 Placebo corrected changes in SBP (chg_pc) as a function of dose ratio (relative to 02
mgkg) 9 Figure 3 Mean changes (actual and placebo-corrected) from baseline to Week 4LOCF for
sitting DBP (ITT population) 10 Figure 4 Mean changes over time for sitting SBP and DBP (ITT population) 11 Figure 5 Change in SBP vs log (AUC) ndash per Sponsor Figure 6 Change in HR vs AUC 12 Figure 7 Variation of CLF with weight obtained in population PK analysis 17 Figure 8 Variation of QF with age obtained in population PK analysis 17
Page 3 of 98
Clinical Pharmacology Review NDA 19-962 Toprol-XL 10182006
1 EXECUTIVE SUMMARY
Astra Zeneca submitted NDA 19-962 SE5 033 (pediatric supplement) to fulfill a FDA pediatric written request for TOPROL-XL metoprolol succinate extended release tablets Metoprolol a beta blocker is approved for hypertension angina and heart failure in adults In adults with hypertension the usual initial dosage is 25 to 100 mg daily (single dose) as monotherapy or in combination with a diuretic this dosage is titrated at weekly intervals until optimum blood pressure reduction or control is achieved The current application focuses on Toprol-XL use in pediatric patients six years and older The initial proposed dosing in children six and older is 10 mgkg subsequently the dose is titrated based on clinical response
Two clinical trials Studies 307A (dose-response) and 307B (safety extension of 307A) were conducted in pediatric patients with hypertension to support the proposed labeling changes The applicant conducted dose-response (n = 140 patients) population PK (n = 120 patients) and PKPD (n = 65 patients) analyses using data from pediatric hypertensive patients receiving Toprol-XL in the mentioned studies PK and PD measures estimated in the analyses or determined during the trials included Ctrough Cmax AUC0ndash24 CLF Tlag (lag time) ka (first order absorption rate constant) V2F (volume of distribution in central compartment) QF (intershycompartmental clearance) ∆DBP (change in diastolic blood pressure ∆SBP (change in systolic blood pressure) and ∆HR (change in heart rate) Selected covariates including age body weight gender race and Toprol-XL dose were evaluated for their potential impact upon PK parameters
11 RECOMMENDATIONS
The Office of Clinical Pharmacology has reviewed the information submitted to NDA 19-962 SE5 033 The clinical pharmacology and biopharmaceutics information provided in the current submission is acceptable However the sponsor should note the following
Comments to sponsor A In future studies with pharmacometric components you should consider the following
1 Collect sufficient (multiple) samples from individual subjects to allow assessment of inter-occasion variability and estimation of inter-individual variability (eta) for all relevant parameters
2 Placebo groups should be identically matched across all dose groups (eg same titration schedule and number of tablets) to minimize potential bias or apparent differences in the placebo effect
B Please address labeling changes and comments in the attached revised label (Page 19)
12 Phase IV Commitments
None
Page 4 of 98
Clinical Pharmacology Review NDA 19-962 Toprol-XL 10182006
13 Summary of Important Clinical Pharmacology Findings
1 Dose-Response A statistically significant dose-response did not exist for placebo (pooled)ndash corrected ∆SBP from baseline however the relationship was evident when placebo (specific-group) ndashcorrected data were used
2 Proposed Pediatric Dosage Overall information from the dose-response study suggests that Toprol XL is effective in the pediatric population The optimal initial dose in mgkg or the maximum safe and effective dose cannot be determined from the information provided However the 10 mgkg (proposed by applicant) appears to be a reasonable initial dose subsequent titration based on clinical response is acceptable Relative to adults (assuming average adult weighs 70 kg) the proposed initial pediatric dose is in the range but closer to the high end of the usual initial adult dose 036 ndash 143 (25 to 100 mg)
3 Metoprolol Pharmacokinetics in Pediatric Patients Metoprolol PK in children (6 ndash 16 years old) were adequately characterized by a 2-compartment model with flip-flop first-order absorption and an absorption lag time using a population PK approach The population PK model yielded precise parameter estimates Estimated PK Measures (median values) were CLF = 2275 Lhr V2F = 961 L QF = 675 Lhr V3F = 620 L ka = 00467 hrndash1 and Tlag = 0853 hr Overall the PK measures in children are of a similar magnitude as that in adults reported in the literature
4 Metoprolol Exposure in Children At the proposed pediatric initial dose 10 mgkg average Cmin was ~ 122 ngml and average Cmin was ~ 246 ngmL at the 20 mgkg dose however data were highly variable with CV gt 100 The majority of samples were below the lower limit of quantitation at the lowest studied dose 02 mgkg In adults (literature reports) average Cmin following 50 mg (~071 mgkg) was ~ 85 ngmL and ~ 226 ngmL following 100 mg (~143 mgkg)
5 Covariates Sex age race body weight and Toprol-XL dose did not have a clinically significant effect on metoprolol PK
6 Population PKPD Model Using a log-linear model or linear model there were statistically significant relationships (p lt 0005) between the changes in SBP and DBP from baseline and measures of metoprolol plasma exposure (Ctrough AUC(0ndash24 and Cmax) However the goodness-of-fit of the PKPD models were generally poor and parameters were not precisely estimated in most models due to a high degree of variability in the blood pressure data Based on the PKPD analysis plasma exposure (AUC) explains lt 10 of the response (reduction in systolic blood pressure) However the PKPD relationship suggests that there is a trend for increased response with increased exposure (dose driven) thus supporting dose titration
Robert O Kumi Ph D Date Clinical Pharmacology Reviewer Concurrence Patrick Marroum Ph D Date Cardiovascular and Renal Team Leader
Page 5 of 98
Clinical Pharmacology Review NDA 19-962 Toprol-XL 10182006
2 Question Based Review
21 What are the general attributes of metoprolol
211 Regulatory Background An original pediatric written request to support pediatric exclusivity was issued in October 1999 Subsequently amendments were made to the original request and a final written request was submitted in October 2004 Key elements of the request follow
1 Dose ranging trial in pediatric patients with hypertension ( 6 ndash 16 years old) 2 Pharmacokinetic sampling in the same range as those studied for effectiveness 3 Safety data from a controlled trial and 1-year open label treatment phase following the
effectiveness trial 4 Summary of all available information on the safety of the drug in hypertensive patients
The pediatric decision tree is depicted below this decision paradigm is used to support the rationale for choosing which studies had to be conducted
Pediatric Decision Tree (CDER MaPP 40004)
Disease Process Cause of Hypertension in Children Most children between 1 and 17 years old tend to have secondary forms of hypertension In infants and younger children underlying renal or reno-vascular disease is frequently the cause for hypertension (80) whereas essential hypertension is predominant in adolescents and adults Therefore the disease progression and response to the treatment in children and adults are not similar Based on the Pediatric Decision Tree Guidelines safety and efficacy studies are required in the target population to establish the indication in the pediatric patient population
Page 6 of 98
10182006 Clinical Pharmacology Review NDA 19-962 Toprol-XL
212 Selected background information on metoprolol Background on Metoprolol in Hypertension
Table 1 Snapshot of metoprolol clinical pharmacology and biopharmaceutic information
Drug Class Metoprolol is a szlig1-selective (cardio selective) adrenergic receptor-blocking agent Mechanism of Action (antihypertensive effect)
Multiple putative mechanisms competitive antagonism of catecholamine at peripheral sites reduction of sympathetic outflow to the periphery or suppression of renin activity
Approved Indications Hypertension Heart Failure and Angina Pectoris Approved Formulations 1 Immediate Release (IR) ndash metoprolol tartrate
2 Toprol-XL is extended-release tablet of metoprolol as the succinate salt it is also referred to as metoprolol in literature as controlled release (CRZ0K)
Metabolism Via CYP2D6 primarily Absorption Absolute oral bioavailability ~ 50 following IR Food does not affect metoprolol
absorption using ER formulation Distribution Protein binding to albumin is about 12 Elimination For IR t12 from 3 ndash 7 hours Less than 5 dose excreted unchanged in urine No
t12 values for ER this may be due to difficulty in separating absorption and elimination phases
Variability Plasma levels are highly variable among subjects after oral administration PKPD in children Limited information in children information obtained following administration of
metoprolol tartrate (IR) Please refer to NDA 19-962 for additional background information
213 Proposed Formulation Administration Route and Dosage The formulation proposed for pediatric use is Toprol-XL this formulation will be given orally at an initial dosage of 10 mgkg once daily (QD) Subsequently the dosage will be titrated depending on clinical response The maximum dosage studied was 200 mg QD Toprol-XL is available as a 25 (scored tablet) 50 100 and 200 mg tablet (b) (4)
22 What are the general clinical pharmacology characteristics of metoprolol succinate
221 Design features of clinical studies used to support dosing in the target population Two studies were conducted in hypertensive pediatric studies Study 307A and 307B the design features of these studies are summarized in Table 2 Table 2 Study Designs
Study Name Study 307A (D4020C00033) Study 307B (D4020C00001)
Objective Determine dose-response in children Determine long-term safety Doses Toprol XL 02 10 and 20 mgkg QD (maximum
200 mg QD) and Placebo Initial 25 mg QD then titrated to optimal clinical response (maximum 200 mg QD)
Design Feature bull 1-2 week placebo run-in period bull Patients in 10 and 20 mgkg groups dosed
over 2 week period but 02 mgkg group received dose for 4 weeks
Patients continuing from 307A or new enrollees
PK Features Ctrough (week 4) Ctrough (last study visit) and serial PK in subset (n = 31)
Primary Measures Outcome
Change in placebo-corrected trough sitting BP from baseline at week 4
Long-term safety using effective Toprol dose
LOCF approach followed
Page 7 of 98
Clinical Pharmacology Review NDA 19-962 Toprol-XL 10182006
222 Clinical response (efficacy) endpoints
Pharmacodynamics bull Primary variable Sitting SBP determined at trough (24plusmn4 hours Visit 7) served as the primary efficacy assessment The primary measure of effect was the placebo-corrected change from baseline to the end of treatment (Week 4) in trough sitting SBP Each BP determination represented the mean of 3 readings with less than 7 mmHg between the highest and lowest value bull Secondary variables Secondary variables included trough sitting DBP and percentage of responders at Week 4
223 Idenitifcation and measurement of metoprolol concentrations in plasma Metoprolol appeared to be adequately identified and measured in Study 307A and 307B A validated HPLC with tandem mass spectrometry method was used to quantify metoprolol Key features of the assay were bull limit of quantitation (LOQ) = 1 ngmL bull linear range = 1 to 1000 ngmL bull Precision measured by CV () le 109 bull Accuracy measured by relative bias ranged from ndash 6 to + 13 Overall the assay performance was acceptable
224 Metoprolol exposure-response The exposure-response evaluation revealed that
bull There was no clear dose-response relationship for effectiveness (primary variable change in sitting SBP) in the target patient population using the planned analysis (Sponsorrsquos) but there was a dose-response for the secondary efficacy variable (Sponsorrsquos)
bull There was a dose-response relationship for effectiveness when group-specific placebo correction was employed (Reviewerrsquos)
bull The proposed initial dosage regimen and subsequent titration are supported by 1) Existence of an exposure-response relationship for Ctrough and AUC and SBP
reduction 2) Overall Toprol XL being more effective than placebo at reducing SBP and DBP 3) For a given dose maximal efficacy occurring between 1 and 4 weeks after
treatment initiation bull There was no clear dose-response relationship for safety
2241 Dose-Response Assessment using Primary Variable and Analyses
Sponsors Analyses Primary Variable The dose-response relationship for Study 307A is depicted in Figure 1 When pooled placebo data were used for correcting change in SBP the slope of the curve is not different form zero (p = 05371 for dose ratio) suggesting that there is no dose response By visual inspection it appears the lack of observed dose-response is mainly driven by a lower than expected response at the 20 mgkg level Patients assigned to the 10 mg and 20 mgkg dose received drug for only 2 weeks whereas dose in the 02 mgkg received the same dose for 4 weeks It is unclear if this difference in titration schedule influenced the outcome
Page 8 of 98
Clinical Pharmacology Review NDA 19-962 Toprol-XL 10182006
Figure 1 Dose response for placebo-corrected change from baseline to Week4LOCF for sitting SBP (ITT population)
Reviewerrsquos Analysis Primary Variable When group-specific placebo corrected data were used for correcting change in SBP there was a statistically significant dose-response (Figure 2) Figure 2 Placebo corrected changes in SBP (chg_pc) as a function of dose ratio (relative to 02 mgkg)
In this procedure data for subjects assigned to a given active group (eg 02 mgkg) were corrected with placebo data (02 mgkg) It should be noted that the group-specific placebo data appeared to follow a consistent trend where the placebo effect decreased with increasing number of tablets It is unclear if this titrationtablet-dependent placebo effect is valid or random Overall the apparent differential placebo effects suggest that the placebo group may have overly influenced the outcome of the dose-response analysis Two potential limitations of this Reviewerrsquos supplemental analyses are
1 Typically placebo effects are constant if randomization is appropriate thus it is unclear if sub-setting the placebo group is reasonable and did not increase bias
2 Additionally sub-setting the placebo group leads to a reduced number of placebo subjects per dose group that may decrease the robustness of the regression findings
Page 9 of 98
Clinical Pharmacology Review NDA 19-962 Toprol-XL 10182006
2242 Dose-Response Assessment using Secondary Variable and Analyses
Treatment Group Effects and Pairwise Comparisons for sitting SBP and DBP Key findings from the group and pair-wise comparisons are 1 All active groups produced statistically significant reductions from baseline (p lt 002) in
sitting SBP (|∆ SBP| gt 5 mmHg) and DBP (|∆ DBP| gt 3 mmHg) at the Week 4LOCF visit whereas placebo (p = 03133) did not
2 Overall the mean change from baseline in sitting SBP (|∆ SBP| = 4256) at Week 4LOCF for the TOPROL-XL groups pooled was statistically significantly larger (p=00351) than that for the placebo group
3 Pairwise comparisons between individual TOPROL-XL dose groups and placebo also revealed a statistically significant difference for the 10 and 20 mgkg groups (p=00270 and p=00492 respectively) the 02 mgkg group was not different from placebo
Sponsorrsquos Analyses Secondary variable A dose-response relationship was observed for the secondary efficacy variable (delta DBP) as depicted in Figure 3 Figure 3 Mean changes (actual and placebo-corrected) from baseline to Week 4LOCF for sitting DBP (ITT population)
2243 Dose-Response assessment based on subgroup analyses (per Sponsor) and time course
Subgroup Analyses The sponsor conducted several exploratory subgroup analyses however these analyses were not reviewed critically and are not presented in this review as
1 they do no impact the primary outcome or study objective 2 they are unlikely to be clinically useful due to the small number of patients per subgroup
However one potentially useful group analyses involved the percentage of responders as defined in Table 3 The responder analyses shows
1) greater percentage of responders in active dose group relative to placebo 2) comparable response rates for all active dose groups suggesting similar efficacy across
dose groups despite different exposure (doses)
Page 10 of 98
Clinical Pharmacology Review NDA 19-962 Toprol-XL 10182006
Table 3 Number and proportion of responders (ITT population)
Time course of effect (2- to 4-week treatment period) Consistent with findings from other studies with metoprolol and some beta-blockers apparent maximal reduction in blood pressure occurred between 1 and 4 weeks of treatment The mean changes over time in sitting SBP and DBP are depicted in Figure 4 Figure 4 Mean changes over time for sitting SBP and DBP (ITT population)
Data points in plot are from absolute values (not taking baseline into account) and subjects in 10 and 20 mgkg received drug after two weeks on 02 mgkg
2244 PKPD Assessments Overall there were statistically significant relationships between metoprolol exposure particularly AUC and SBP reduction as shown in Figure 5 Similar findings were observed for heart rate reduction Figure 6
Page 11 of 98
Clinical Pharmacology Review NDA 19-962 Toprol-XL 10182006
Change in SBP Figure 5 Change in SBP vs log (AUC) ndash per Sponsor Figure 6 Change in HR vs AUC
The population PKPD assessment evaluated the effect of PK exposure measures (AUC Cmax and Ctrough) on various PD measures (change in SBP change in DBP However only the AUC was considered reliably estimated It is noted that AUC is a derived measure that may not bear as direct a relationship as Ctrough (observed value) on a given PD measure However Ctrough is related to AUC particularly at steady-state The equation relating AUC to change in SBP was
E = E0 ndash 221 x m logAUC
Where E = change in SBP E0 = baseline SBP m = slope and AUC = area under plasma concentration-time curve
The regression analyses yielded the following p lt 005 for slope and R2 lt 01 The relatively low R2 value suggests that the SBP data were highly variable and changes in SBP could not be accounted for entirely by AUC (exposure) Nevertheless there is a relationship between effectiveness and AUC that indicates that increasing exposure potentially increases effectiveness this finding supports dose titration
Change in Heart Rate The change in heart rate was defined as follows (Reviewerrsquos regression analysis)
E = I ndash 221 x m logAUC Where E = change in HR I = intercept and m =and AUC are as previously defined
The regression analyses yielded the following p lt 001 for slope and R2 = 011 The heart rate findings support metoprololrsquos known activity as a beta blocker
Page 12 of 98
Clinical Pharmacology Review NDA 19-962 Toprol-XL 10182006
Reviewer Note PKPD modeling with various hemodynamic measures The modeling exercises indicated that there was no difference in the PKPD modeling results using different hemodynamic data formats such as change in the measurements percent change in the measurements or actual BP measurements
2245 Exposure-Safety Highlights (per Applicant) According to the applicant Toprol XL was generally well tolerated in the pediatric population and there did not appear to be a clear dose-dependent effect in terms of severity or frequency of adverse events (tabulated below)
2246 Acceptability of sponsorrsquos proposed regimen The proposed initial dosage 10 mgkg QD followed by titration according to clinical response appears reasonable based on the dose-response information time course of maximal effect and exposure-response (AUC and SBP reduction) information It is unclear if the proposed initial dose is optimal since a dose-response relationship was not established for the primary efficacy variable and response rates were comparable across dose groups One should note that the proposed initial pediatric dosage is within the range of usual adult initial dosage 25 ndash 100 mg (assuming 70 kg adult ~ 036 ndash 143 mgkg)
The major unresolved issues are bull Absence of a clear dose-response relationship for the primary efficacy variable bull Unknown maximal dose in mg for initial therapy and titrationmaintenance therapy bull Unknown optimal titration frequency
Although these major issues are not completely resolved information provided in the submission provides adequate information to support the proposed dosage In brief these limitations are addressed in part by adopting the following approaches
bull Therapy will be initiated at a dose that was more effective than placebo yet was not the highest dose thus providing a safety window
bull Initial dosage (dose in mg) will be limited to a dose that produces exposure that is likely to be effective but does not exceed the highest studied dose (200 mg)
bull Titration will be allowed at a frequency no greater than once a week which is consistent with data obtained (time to peak activity) and previous information form metoprolol and other beta-blockers used in hypertension treatments
Page 13 of 98
Clinical Pharmacology Review NDA 19-962 Toprol-XL 10182006
2247 PKPD comparisons Pediatric patients vs adults A priori PKPD relationships are expected to differ between adults and children because the two populations have different disease processes (secondary hypertension in children vs essential or primary hypertension in adults) Results of the pediatric modeling exercise showed that a log-linear model appeared to work better than other models for the relationship between SBP and DBP and exposure (AUC) In adults the Sigmoid Emax model has been successfully applied in PKPD modeling exercises It should be noted that the adult data were not reanalyzed for this review so it is unclear if log-linear or linear models would be adequate
As illustrated in Table 4 Toprol XL is effective in adults as well as in children and appears to be effective across a similar concentration range Table 4 PKPD Comparisons- Pediatric Patients vs Adults
Pediatric Patients Adults Population hypertensive Typically healthy Model Log-linear Sigmoid Emax PD Markers Placebo corrected SBP DBP changes
at trough bull Reduction in exercise heart rate (betashy
blockade measure) bull Placebo corrected SBP DBP changes at
trough EffectiveTherapeutic metoprolol concentrations
Most concentrations lt 107 ngmL bull EC50 = 105 nmolL (281 ngmL) bull Emax achieved at concentrations above 400
nmolL (107 ngmL) bull Range between 80 and 300 nM
Maximal mean BP Reduction at Studied Doses
bull SBP reduction -6 bull DBP reduction -5
bull SBP reduction -10 bull DBP reduction -4
Effectiveness of metoprolol relative to placebo
Generally more effective over the course of treatment
Generally more effective over the course of
Time course of effect Maximal effect observed within 1 to 4 weeks after initiation of therapy
Maximal effect observed within 1 to 4 weeks after initiation of therapy
Utility in Poor CYP2D6 metabolizers (PMs)
Not evaluated Poor metabolizers have a higher plasma concentration and a greater duration or degree of beta blockade thus PMs may not need extended release formulations
Proposed Initial Dosage 10 mgkg ~ 70 mg QD 25 to 100 mg QD
Overall it appears the studied pediatric doses produce comparable changes in diastolic pressure but lower changes in systolic pressure However in pediatric patients it is unlikely that the maximal possible activity was achieved at the doses studied thus conceivably pediatric patients can achieve maximal effects comparable to adults at optimized pediatric doses Three challenges in making definitive PKPD comparisons between the pediatric (studied in this NDA) and adult population are as follows
1 Study conditions differ- typically in adult studies HR is measured during exercise and not at rest
2 Results are obtained in healthy adult subjects rather than hypertensive patients 3 Insufficient numbers of studies have been reported in the literature that attempt to
identify the relationship between metoprolol exposure and SBP or DBP effect in adults
Page 14 of 98
10182006 Clinical Pharmacology Review NDA 19-962 Toprol-XL
225 Pharmacokinetic characteristics of metoprolol
2251 Metoprolol pharmacokinetics in pediatric patients Metoprolol PK parameters obtained from the population PK analyses are summarized in Table 5 Table 5 Metoprolol population PK parameter estimates (SE ) obtained using final population PK model
PK Parameter Value CLF (Lhr) 2275 ( 114 ) V2F (L) 961 (203 ) V3F (L) 620 (255 ) QF (Lh) 675 (204) Ka (hrndash1) 00467 (192 ) Tlag1 (hr) 0853 (297)
The data in Table 5 are derived from a 2-compartment linear PK model with first-order elimination and flip-flop first-order absorption and lag time
2252 Metoprolol pharmacokinetic comparisons pediatric patients vs adults PK Parameter Comparison Overall pediatric PK parameters obtained following administration of Toprol-XL are comparable (similar magnitude) to those in adults receiving IR metoprolol Potential limitations of the stated comparison and finding include the use of different modeling approaches populations number of samples and number of subjects in the trials (Table 6) Table 6 Comparative PK (children vs adults)
Source NDA 19962 Luzier et al Taguchi et al Plosker and Cissold and other sources
Model 2 Comp 1st Order absorption
1 Comp
Formulation Toprol XL IR IR IR Population Pediatric Hypertension Healthy adults Japanese geriatric Sampling Intense and Ctrough Intensive Sparse intensive CLF (Lhrkg) 338 116 ndash 340 094 -V2F (Lkg) 128 270 ndash 398 452 -V3F 851 333 ndash 809 - -QF (Lhr) 899 282 ndash 694 - -T12 (h) 351 - - 3 - 6 Covariate Effects Based on CLF Age None - Yes YesNo Gender Effect None Yes - -Race None - - - The applicant noted that pediatric data were compared to adult data from IR where CLF is dominated by the disposition function of metoprolol therefore it may be complicated to compare adult data to pediatric data (Toprol XL) where CLF is under a considerable influence from the release rate (input function) of the device This appears to be a valid caveat Using AUC and dosing information (Table 8) adult CLF for Toprol-XL ~ 17 ndash 25 Lhrkg
Exposure Comparison Following administration of Toprol XL at comparable doses in mg pediatric patients and adults generally had similar metoprolol exposure Adult data from literature and archived clinical pharmacology and biopharmaceutics reviews are presented in Table 8 and pediatric data from
Page 15 of 98
Clinical Pharmacology Review NDA 19-962 Toprol-XL 10182006
population PK modeling (Study 307A) are presented in Table 7 The main limitations of the cross-population comparison is the pediatric doses are over the 125 to 200 mg dose range whereas adult data is for specific doses However reasonable comparisons can be made at the 100 mg dose level assuming the meanmedian values in pediatric patients offer an acceptable approximation of exposure values and are representative of the central tendency of the data In this case the adult and pediatric data have comparable
1 exposure at 100 mg 2 degree of variability
Table 7 Bayesian estimates of metoprolol PK exposure for those patients included in the PKPD analysis (N=65)
includes only data where concentration gt LOQ
Table 8 Metoprolol exposure in adults following administration of Toprol XL
Cmax Cmin AUC Literature References 50 179 ndash 190 86 ndash 104 286 - 351 100 96 ndash 759 107 ndash 305 533 - 1192 200 778 ndash 1139 310 ndash 447 1392 - 1892 FDA Archived Information 50 179 plusmn 182 85 plusmn 138 286 plusmn 346 100 544 plusmn 436 226 plusmn 234 827 plusmn 766
2253 Inter and intra-subject variability in metoprolol pharmacokinetic Based on the values of the standard error () associated with PK parameters (Table 5) metoprolol PK exhibited low variability (SE lt 30) However this estimate may not be reliable (under predicted) because concentrations lt LOQ were not included in the analysis Several subjects particularly those receiving 02 mgkg had concentrations lt LOQ In adults exposure is highly variable (CV gt 70 ) as reflected in exposure estimates and wide exposure ranges Table 8
Potential sources of variability following metoprolol administration (Toprol XL) in children include regio-selective absorption incomplete gastric emptying variable gastric motility varying metabolic activity (CYP2D6) and inconsistent absorption Some of these factors are also applicable to adults
23 What Intrinsic Factors Affect Metoprolol Exposure-Response
Based on the population pharmacokinetic model weight was the only potentially clinically meaningful intrinsic factor that affected metoprolol exposure and hence response Other intrinsic
Page 16 of 98
Clinical Pharmacology Review NDA 19-962 Toprol-XL 10182006
factors such as age height gender race and sex did not affect metoprolol exposure
231 Effect of weight The effect of weight on metoprolol CLF are illustrated in Figure 7 Figure 7 Variation of CLF with weight obtained in population PK analysis
CLF increased linearly with body weight relative to a 70 kg individual the CL of a 22 kg individual is 30 lower This decreased CL will result in an increased exposure (maximum 30 ) that does not pose additional safety concerns or appear clinically significant (tolerated in studies) It should be noted that exposure (AUC) accounted for an insignificant portion of the hemodynamic effect (poor correlation) thus the clinical implications of the impact of body weight on CLF of metoprolol identified in the population PK modeling are limited Consequently dose adjustment is not required based on body weight Furthermore the maximum initial dose is 50 mg thus subjects with weight gt 50 kg will receive a maximum dose of 50 mg diminishing the impact if any of weight-dependent clearance
232 Effect of Age The effect of age on QF the inter-compartmental clearance is illustrated in Figure 8 Figure 8 Variation of QF with age obtained in population PK analysis
Page 17 of 98
Clinical Pharmacology Review NDA 19-962 Toprol-XL 10182006
QF does not contribute significantly to overall clearance therefore the reported finding does not appear clinically relevant It should be noted that the observed QF-age relationship is atypical
233 Effect of intrinsic factors on exposure-response pediatrics vs adults As mentioned previously the only evaluated intrinsic factor that affected metoprolol exposure was body weight In adults age and gender effects have been reported although there are conflicting reports on the age effect The exposure in adult and pediatric population are both potentially affected by the CYP2D6 metabolizing status of the subject Metoprolol is metabolized primarily in the liver by CYP2D6 The scientific literature reports several instances in adults of varying metoprolol exposure by poor and extensive CYP 2D6 metabolizers In the pediatric studies (307A and 307B) there was one suspected poor metabolizer (Trough concentration was 2330 ngmL) but the metabolic status (PM or EM) of this individual was not confirmed
24 What extrinsic factors affect metoprolol exposure-response
The role of extrinsic factors were not specifically evaluated in the pediatric population however one anticipates that extrinsic factors that affect adults should be applicable to children
25 What analytical method was used in pediatric studies 307 A and 307B
Please refer to section 223
Page 18 of 98
Clinical Pharmacology Review NDA 19-962 Toprol-XL 10182006
(b) (4)
TOPROL-XL is not recommended in pediatric patients lt 6 years of age (see CLINICAL PHARMACOLOGY Pharmacokinetics and PRECAUTIONS Pediatric Use)
Page 21 of 98
Clinical Pharmacology Review NDA 19-962 Toprol-XL 10182006
4 APPENDICES
41 Sponsorrsquos Proposed Label
17 Page(s) of Draft Labeling has been Withheld in Full as B4 (CCITS) immediately following this page
Page 22 of 98
Clinical Pharmacology Review NDA 19-962 Toprol-XL 10182006
42 Pharmacometrics Review
Page 40 of 98
Clinical Pharmacology Review NDA 19-962 Toprol-XL 10182006
Office of Clinical Pharmacology Pharmacometrics Review
NDAIND 19-962 Volume Not applicable submitted electronically POP PK Report in Section 5335 (Network Path Cdsesub1n19962N_0002006-05-15hpbiohupharm) Compound Metoprolol succinate Submission Dates 05152006 Sponsor Astra Zeneca Pharmacometrics Reviewer Robert Kumi PhD Secondary Reviewer Yaning Wang PhD
TABLE OF CONTENTS
OFICE OF CLINICAL PHARMACOLOGY PHARMACOMETRICS REVIEW 41
EXECUTIVE SUMMARY 42
OVERALL CONCLUSIONS 43
INTRODUCTION 46
OBJECTIVES OF THE ANALYSIS 48
DOSE-RESPONSE ANALYSIS 49
METHODS (POPULATION PKPD) 60
RESULTS AND DISCUSSION 73
RECOMMENDATIONS 87
APPENDIX 90
DCP1PM Page 41 10182006
Clinical Pharmacology Review NDA 19-962 Toprol-XL 10182006
Executive Summary In NDA SE5 033 the applicant Astra Zeneca has proposed changes to the currently approved labeling for TOPROL-XL metoprolol succinate extended release
(b) (4)
tablets Metoprolol a beta blocker is approved for hypertension angina and heart failure in adults In adults with hypertension the usual initial dosage is 25 to 100 mg daily (single dose) as monotherapy or in combination with a diuretic this dosage is titrated at weekly intervals until optimum blood pressure reduction is achieved The current application focuses on Toprol-XL use in pediatric patients ge six years old The initial proposed dosing in children six and older is 10 mgkg subsequently the dose is titrated based on clinical response
Two clinical trials Studies 307A (dose-response) and 307B (safety extension of 307A) were conducted in pediatric patients with hypertension to support the proposed labeling changes The applicant conducted dose-response population PK (n = 120 patients) and PKPD (n = 65 patients) analyses using data from pediatric hypertensive patients receiving Toprol-XL in the mentioned studies
Key Findings from the Dose-Response and Population PKPD analyses follow 1 Dose-Response A statistically significant dose-response did not exist for placebo
(pooled)ndashcorrected ∆SBP from baseline however the relationship was evident when placebo (specific-group) ndashcorrected data were used
2 PK Model Metoprolol PK in children were well characterized by a 2shycompartment model with flip-flop first-order absorption and an absorption lag time The model yielded precise parameter estimates
3 Covariates Sex age race body weight and Toprol-XL dose had no clinically significant effect on metoprolol PK
4 PKPD Model Using a log-linear model or linear model there were weak but statistically significant relationships between the changes in DBP and SBP and measures of metoprolol plasma exposure (Ctrough AUC0ndash24 and Cmax) Overall parameters were not precisely estimated in most models due to a high degree of variability in the blood pressure data
DCP1PM Page 42 10182006
Clinical Pharmacology Review NDA 19-962 Toprol-XL 10182006
Overall Conclusions 1 Were metoprolol PK adequately characterized in the pediatric population Metoprolol PK in pediatric patients (n = 120 Age 6 to 17) were adequately characterized using a population pharmacokinetic approach The population model was validated and qualified and comprised a 2-compartment open model with first order absorption and absorption lag time
2 Are there any covariates that influence metoprolol PK in pediatric patients with hypertension The two covariates that influenced metoprolol PK were weight and age apparent oral clearance increased linearly with body weight and inter-compartmental clearance increased with age according to a power function Other covariates including race sex and metoprolol dose did not impact metoprolol kinetics
3 Was a PKPD relationship established between metoprolol dose or plasma exposure( AUC Ctrough or Cmax) and hemodynamic measures (blood pressure) Using a simple linear regression model no dose-response (reduction in placebo corrected systolic blood pressure the primary outcome variable) was observed although a weak (R2 lt 01) but statistically significant (p lt 005) PKPD relationship was observed between metoprolol exposure measures and reduction in systolic blood pressure The small R2 value indicates metoprolol exposure could account for only a small portion of the hemodynamic effect According to the model as exposure increased there was greater reduction in blood pressure However only the relationship with AUC was considered reliable as AUC was estimated with good precision (PK modeling) whereas Cmax was not
4 Is there sufficient evidence to support effectiveness of Toprol XL in pediatrics and the initial proposed pediatric dosage Yes Although dose-response was not established with SBP reduction (primary variable) suggesting that the effectiveness of the individual tested Toprol-XL doses could not be differentiated the following information provides evidence to suggest that some Toprol-XL doses were more effective than placebo
bull Analysis of treatment group effects and pairwise comparisons suggested that overall Toprol-XL demonstrated effectiveness in pediatric patients with hypertension pooled Toprol groups vs placebo (p = 00351) and relative to baseline each active Toprol-XL dose group decreased SBP whereas placebo did not
bull There was a dose-response relationship for reduction in diastolic blood pressure typically systolic and diastolic blood pressure effects mirror each other
bull PKPD findings (reduction in SBP and heart rate as a function of AUC) support metoprolol effectiveness (increased exposure led to increased effectiveness) The heart rate effect supports metoprololrsquos known beta blocking activity
bull Generally Toprol-XL was effective in pediatric patients and adult patients at similar metoprolol exposure levels 02 mgkg in pediatrics was minimally effective because this dose yielded exposures lower than that obtained in adults at the lowest effect adult dose 25 mg
DCP1PM Page 43 10182006
Clinical Pharmacology Review NDA 19-962 Toprol-XL 10182006
bull The proposed pediatric dosage 10 mgkg is supported by the results from the dose-response study Visual inspection and pairwise comparisons indicated that 10 mgkg (placebo corrected) was statistically the most effective dose (greater efficacy than 02 mgkg and 20 mgkg) and was more effective than placebo (p = 0027)
5 Will initial dosage adjustment be required for any pediatric patients prior to titration No dosage adjustment does not appear necessary prior to titration (typically one week after treatment begins) Based on the population PK model the only potentially relevant factor that could affect PK was body weight CLF increased linearly with body weight relative to a 70 kg individual the CL of a 22 kg individual is 30 lower This decreased CL will result in an increased exposure (maximum 30 ) that does not pose additional safety concerns or appear clinically significant (tolerated in studies) The proposed starting dose 10 mgkg and doses up to 20 mgkg (maximum 200 mg) were tolerated in the clinical trials (307A and 307B) Furthermore exposure accounted for an insignificant portion of the hemodynamic effect (poor correlation) thus the clinical implications of the impact of body weight on CLF of metoprolol identified in the population PK modeling are limited
to a higher and tolerable dose until optimum BP reduction is achieved is reasonable This
(b) (4)The proposal to start Toprol-XL at a low dose and titrate
is consistent with labeling for adults
6 Was the PKPD relationship influenced by covariates Insufficient data were available to make this assessment
7 Are the PK and PKPD of metoprolol in children comparable to that in adults PK values obtained in pediatric patients were generally in the same range as those reported in adults Potential limitations of the comparison are the different modeling approaches populations number of samples and number of subjects in the trials (Table B)
It is difficult to make definitive PKPD comparisons between the pediatric (studied in this NDA) and adult population because
1 Study conditions differ- typically in adult studies HR is measured during exercise and not at rest
2 Results are obtained in healthy adult subjects rather than hypertensive patients 3 Insufficient number of studies have been reported in the literature that attempt to
identify the relationship between metoprolol exposure and SBP or DBP effect in adults
DCP1PM Page 44 10182006
Clinical Pharmacology Review NDA 19-962 Toprol-XL 10182006
Table B PK Comparisons (Pediatrics vs Adults) Source NDA 19962 Luzier et al Taguchi et al Plosker and Cissold
and other sources Model 2 Comp 1st
Order absorption 1 Comp
Formulation Toprol XL IR IR PK Analyses Population StandardNCA Population Standard Population Pediatric Healthy adults Japanese geriatric Sampling Intense and
Ctrough Intensive Sparse intensive
CLF (Lhrkg) 338 116 ndash 340 094 V2F (Lkg) 128 270 ndash 398 452 V3F 851 333 ndash 809 QF (Lhr) 899 282 ndash 694 Ka (h-1) 00467 Tlag (h) 0853 T12 (h) 351 3 - 6 Tmax (h) 25 ndash 73 Covariate Effects on CLF Age None Yes YesNo Gender Effect None Yes Race None The applicant noted that pediatric data were compared to adult data from IR where CLF is dominated by the disposition function of metoprolol therefore it may be complicated to compare adult data to pediatric data (Toprol XL) where CLF is under a considerable influence from the release rate (input function) of the device This appears to be a valid caveat
It should be noted that the cause of hypertension in adults differs from that in children Results of the pediatric modeling exercise showed that a log-linear model appeared to work better than other models for both SBP and DBP In adults the Sigmoidal Emax model has been successfully applied Using the Hill Equation (Sigmoidal Emax model) with EHR reduction (measure of beta blockade) as the PD marker in adults EC50 = 105 nmolL (281 ngmL) and Emax is achieved at metoprolol plasma concentrations gt 400 nmolL (107 ngmL) Placebo-corrected mean blood pressure changes (standing) associated with concentrations producing maximal blockade are -10 for systolic and ndash 4 for diastolic In the pediatric study the observed maximal mean reductions (placebo corrected) at the studied doses were approximately -6 for systolic and -5 for diastolic Hence it appears the studied pediatric doses produce comparable changes in diastolic pressure but lower changes in systolic pressure It should be noted that in the pediatric studies only a few metoprolol plasma concentrations were gt than 107 ngmL It is unlikely that the maximal activity was achieved at the doses studied yet the Toprol doses appeared effective The differential maximal effects may also be due to the difference in initial SBP (adults patients with hypertension tend to have higher initial BPs) in adult and pediatric studies there was a dependence of change in SBP on initial SBP
DCP1PM Page 45 10182006
Clinical Pharmacology Review NDA 19-962 Toprol-XL 10182006
Introduction Summary
(b) (4)NDA SE5 033 was submitted to seek approval of labeling changes to the currently approved labeling for TOPROL-XL This labeling translates to a new Toprol-XL indication for pediatric patients (6 years and older) with hypertension
Background on Metoprolol in Hypertension The majority of the following information was obtained form a Review article (sponsor provided) by Plosker and Clissold [Drugs 43(3) 382-414 1992)]
Table 1 Snapshot of Metoprolol Clinical Pharmacology and Biopharmaceutics Drug Class Metoprolol is a szlig1-selective (cardio selective) adrenergic receptor-
blocking agent Mechanism of Action (antihypertensive effect)
Multiple putative mechanisms competitive antagonism of catecholamine at peripheral sites reduction of sympathetic outflow to the periphery or suppression of renin activity
Approved Indications Hypertension Heart Failure and Angina Pectoris Approved Formulations Immediate Release (IR) ndash metoprolol tartrate
Controlled Release (CRZ0K) Toprol-XL is extended-release tablet of metoprolol as the succinate salt
Metabolism Via CYP2D6 primarily Absorption Absolute oral bioavailability ~ 50 following IR Food does not affect
metoprolol absorption using ER formulation Distribution Protein binding to albumin is about 12 Elimination For IR t12 from 3 ndash 7 hours Less than 5 dose excreted unchanged
in urine No t12 values for ER this may be due to difficulty in separating absorption and elimination phases
Variability Plasma levels are highly variable among subjects after oral administration
Age Effects PK of metoprolol not affected by age (20 to 65 years) but concentration of active metabolite in subjects gt 65 years about twice as high as those in younger although metoprolol concentrations similar in two groups (Regardh et al)
PKPD in children Limited information in children and provided mainly after administration of metoprolol tartrate
Summarized PK and PKPD Information in Adults Table 2 Reported PK Values in Adults (multiple references)
References include Abrahamsson et al Sandberg et al Wieselgren et al
DCP1PM Page 46 10182006
Clinical Pharmacology Review NDA 19-962 Toprol-XL 10182006
Table 3 PKPD Information Reference Key Findings Abrahamsson et al Therapeutic level of szlig1blockade (model- reduction in exercise heart
rate or EHR) is between 80 and 300 nM Sandberg et al Toprol XL is designed to deliver metoprolol succinate at a near
constant rate for about 20 hr Wieselgren et al In healthy males maximal EHR ~ 14 and minimum reduction ~ 9
with 50 mg Activity greater than placebo over 24 hour period Dayer et al Lennard et al Jonkers et al
Poor metabolizers have a higher plasma concentration and a greater duration or degree of beta blockade Potential implications for use of extended release as may not be needed in PMs
Various sources Toprol XL produces clinically and statistically significant reductions in blood pressure values compared to baseline values The maximal blood pressure lowering effect for a given dose in adults is observed between 1 and 4 weeks of treatment In 4 week trials with Toprol XL the maximum decrease in supine BP was 209 and standing was 129 (unclear if at trough) At trough following 4 weeks of 50 mg QD Toprol XL relative to placebo the reduction in supine BP was 112 and 103 in Standing
Summary of sponsorrsquos current analysis relevant to pharmacometrics and resulting claims
Dose-Response Analysis A dose-response analysis was conducted using a simple linear regression model where metoprolol dose in mgkg was the independent variable Week 4 placebo corrected change in blood pressure (diastolic or systolic) from baseline was the dependent variable (response)
Sponsorrsquos Analysis Claims (Dose-Response Study) Following administration of TOPROL-XL at doses of 125 to 200 mg once daily for up to 4 weeks metoprolol
bull Exhibited a significant dose-response relationship for DBP but none for SBP bull Produced statistically significant and clinically meaningful reductions in SBP and
DBP for some individual andor pooled target dose groups (02 10 and 20 mgkg)
Population PK and PKPD Analyses The sponsorrsquos population PK and PKPD analyses involved the use of typical population PK approaches Primarily SAS and NONMEM were used to run the analyses In brief the sponsor pooled plasma concentration time data from patients in Study 307A (trough samples) and 307B (trough samples in most subjects and serial samples in a subset of patients) for the PK modeling PKPD (PD measured primarily as changes in blood pressure) data were from patients in Study 307A These collective data were used in the population PK and PKPD analyses
Initially the sponsor identified the best PK structural population model by testing several pharmacokinetic models This model was further refined by eliminating error terms (etas) that were not statistically significant Subsequently the sponsor evaluated the effect of DCP1PM Page 47 10182006
Clinical Pharmacology Review NDA 19-962 Toprol-XL 10182006
covariates on the PK model and developed a final PK model The goodness of the fit of the model was assessed with standard procedures The final population model was used to simulate individual plasma concentration-time profiles and Bayesian estimates for Cmax and AUC for all patients These simulated AUC and Cmax values and actual (observed) Ctrough were used in the PKPD model The PKPD model was developed in a similar manner as the population PK model Initially the best PKPD base model was identified and the model refined until a final PKPD model was identified
Sponsorrsquos Analysis Claims (Population PK and PD Modeling) 1 A 2-compartment PK model with first-order elimination and flip-flop first-order
absorption and lag time best fit metoprolol concentration-time data obtained from the studied pediatric hypertensive patients
2 The following tabulated parameter estimates were obtained using the final population PK model CLF 2275 Lhr V2F 961 L V3F 620 L QF 675 Lh Ka 00467 hrndash1 Tlag1 0853 hr
These PK values were generally in the same range as those reported in adults
3 Sex race ideal body weight and Toprol-XL dose have no significant effect on metoprolol pharmacokinetics No covariate impacts V2F V3F Ka or the Tlag of metoprolol Age has no effect on metoprolol CLF and body weight has no effect on QF Metoprolol CLF increases linearly with body weight however no dose adjustment based upon body weight is necessary because dosage is titrated based on clinical response QF is proportional to age however the increase in QF with age is not clinically relevant
4 Weak but statistically significant relationships existed between DBP SBP and HR and some measures of metoprolol exposure (trough plasma levels Cmax and AUC(0ndash 24)) Because of high variability in the hemodynamic data goodness-of-fit of the PKPD models was generally poor and the resulting parameter estimates were not considered reliable Extrapolation of these model parameters in the clinic for dose adjustment is not recommended
5 No covariates had an impact on the parameters delineating the PKPD relationship between metoprolol exposure and DBP SBP and HR
Objectives of the analysis There are three specific goals of the PM analysis
1 To evaluate the adequacy of the sponsorrsquos dose-response analysis 2 To evaluate sponsorrsquos population PK analysis and determine if PK labeling claims
are acceptable DCP1PM Page 48 10182006
Clinical Pharmacology Review NDA 19-962 Toprol-XL 10182006
3 To evaluate sponsorrsquos population PKPD analyses and determine if the findings support the proposed dosing recommendation
Dose Response Analysis (Study 307A) Title Dose Ranging Safety and Tolerability of TOPROL-XLreg
(metoprolol succinate) Extended-release Tablets (metoprolol CRXL) in Hypertensive Pediatric Subjects A Multicenter Double-blind Placebo-controlled Randomized Parallel-group Study
Study Duration 30 May 2002 - 9 June 2004 Investigators (primary) Bonita E Falkner MD and Jonathan Sorof MD 1800 Sites Multiple locations (36 in US and 1 in Dominican Republic)
Table 1 Objectives and Outcomes for Study 307A
Study Design (FDA-approved Type A design) This was a multi-center international double-blind placebo-controlled randomized parallel-group study The study included a screening visit a 1- to 2-week single-blind placebo run-in period during which all previous antihypertensive medications were discontinued and a 4-week double-blind treatment period At the end of the placebo run-in period eligible patients with blood pressure (BP) measurements in the qualifying range were randomized in a 1212 ratio to receive once daily oral doses of placebo TOPROL-XL 02 mgkg TOPROL-XL 10 mgkg or TOPROL-XL 20 mgkg TOPROL-XL doses of 125 25 375 50 75 100 150 or 200 mg were used to approximate the target doses Patients in the placebo and TOPROL-XL 02 mgkg groups received the target dose for 4 weeks while patients in the TOPROL-XL 10 mgkg and
DCP1PM Page 49 10182006
Clinical Pharmacology Review NDA 19-962 Toprol-XL 10182006
20 mgkg groups had their dose up-titrated (based on weight) to the target dose over the first 1 to 2 weeks of double-blind treatment
Reviewer Note Rationale on Study design The inclusion of more patients in the TOPROL-XL 02 mgkg and 20 mgkg groups allowed better estimation of the dose response at the low and high ends of the dose range The TOPROL-XL 10 mgkg group with fewer patients provided a middle estimate that helped to describe the shape of the dose-response curve However having a fewer number of subjects may have contributed to variability Inclusion of a placebo control group allowed for the quantification of treatment-related BP reductions after adjusting for placebo effect It should be noted that the placebo groups were not identical as they followed different titration schedules and had a different number of tablets
The 02 mgkg dose is lower than the lowest approved adult dose on a mgkg basis (assuming 70 kg adult weight) but the highest studied pediatric dose 20 mgkg (200 mg limit was placed) is lower than the highest studied adult dosage 400 mg
Table 2 Toprol Dosing Scheme for Study 307A
Table 3 Formulations used in 307A
DCP1PM Page 50 10182006
Clinical Pharmacology Review NDA 19-962 Toprol-XL 10182006
SPONSORrsquoS STATISTICAL ANALYSIS PLAN HIGHLIGHTS bull The primary analysis used an intention-to-treat (ITT) population which included
all patients who received at least 1 dose of study medication and had baseline and at least 1 post baseline measurement For this analysis missing data were imputed using a last observation carried forward (LOCF) approach
bull A simple linear regression analysis was performed on the placebo-corrected change from baseline to Week 4LOCF in sitting SBP and sitting DBP with dose ratio as the explanatory variable
bull The placebo correction for placebo-corrected changes from baseline to Week 4 LOCF in sitting SBP and sitting DBP was performed by subtracting the mean change from baseline for the placebo group from the individual patient changes in the other treatment groups
bull ANOVA was performed with treatment group as the main factor for the changes from baseline to each post baseline visit in sitting SBP and DBP This ANOVA model was used to construct pairwise comparisons of each active treatment versus placebo and the active treatment groups combined versus placebo
bull The percentage of responders at Week 4 was summarized by frequency counts percentages and 95 confidence intervals (CI) for each treatment group
bull Subgroup analyses were also performed on the changes from baseline at Week 4 in sitting SBP and DBP and the influence of heart rate and baseline body mass index (BMI) on the mean changes from baseline to Week 4LOCF in sitting SBP and DBP were examined using linear regressions
bull Trough plasma concentrations of metoprolol were summarized descriptively and the lower limit of quantitation (LLQ) was 1 ngmL
bull Safety data were summarized using the safety population defined as all patients who received at least 1 dose of study medication and were not lost to follow-up No statistical analyses were performed on the safety data in this study
DCP1PM Page 51 10182006
Clinical Pharmacology Review NDA 19-962 Toprol-XL 10182006
Results Patient Disposition Per applicant patients recruited into this study were representative of a pediatric population with hypertension The four treatment groups were balanced with respect to demographic and baseline characteristics (Tables 4 and 5) About 80 percent of the patients were considered 90 compliant
Table 4 Baseline Characteristics in Study 307A
Table 5 Sitting SBP and DBP measurements at baseline
Sitting and standing BP measurement were comparable (eg mean SBP for all patients- sitting = 1319 and standing 1306 with similar CVs ~ 9 )
Primary Efficacy Variable The results for the primary efficacy variable are illustrated in Figure 1 Figure Dose response for placebo-corrected change from baseline to Week4LOCF for sitting SBP (ITT population)
DCP1PM Page 52 10182006
Clinical Pharmacology Review NDA 19-962 Toprol-XL 10182006
Figure 1 Change in SBP from baseline as a function of Toprol XL dose
Table 6 Linear regressions statistics used to assess Dose-Response
The results indicate that bull The slope of the curve is not different form zero (p = 05371 for dose ratio)
suggesting that there is no dose-response relationship bull Most active treatment groups are more effective than placebo in reducing SBP
By visual inspection it appears the lack of observed dose-response is mainly driven by a lower than expected response at the 20 mgkg level
Potential issues affecting efficacy and pharmacokinetic results bull LOCF was required for eight patients however the LOCF approach did not
greatly impact the outcome of the trial bull Patients assigned to the 10 mg and 20 mgkg dose received drug for only 2
weeks whereas dose in the 02 mgkg received the same dose for 4 weeks
DCP1PM Page 53 10182006
Clinical Pharmacology Review NDA 19-962 Toprol-XL 10182006
Reviewerrsquos Supplemental Dose-Response Analyses The sponsorrsquos dose-response analysis was successfully reproduced by this Reviewer using pooled placebo corrected data A supplemental analysis was conducted using group-specific placebo corrected data In this procedure data for subjects assigned to a given Active Group (eg 02 mgkg) were corrected with Placebo data (02 mgkg) Group specific placebo data are presented in Table 7
Table 7 Placebo-group specific data Placebo Group Frequency Delta SBP 02 mgkg 8 -567 10 mgkg 6 -300 20 mgkg 9 230
It should be noted that the group-specific placebo data appeared to follow a consistent trend where the placebo effect decreased with increasing number of tablets It is unclear if this titrationtablet-dependent placebo effect is valid or random Overall the apparent differential placebo effects suggest that the placebo group may have overly influenced the outcome of the dose-response analysis
When active groups are corrected using group-matched placebo data there is a statistically significant dose-response The dose response using group-specific placebo data is illustrated in Table 8 and Figure 2
Figure 2 Placebo corrected changes in SBP (chg_pc on y axis) as a function of dose ratio
Potential Limitations of Supplemental Analyses Typically placebo effects are constant if randomization is correct thus it is unclear if subsetting the placebo group is acceptable and did not increase bias Additionally subsetting the placebo group leads to a reduced number of placebo subjects per dose group that may impact the regression analyses
DCP1PM Page 54 10182006
Clinical Pharmacology Review NDA 19-962 Toprol-XL 10182006
Table 8 SAS output for regression analyses using group-specific placebo corrections The REG Procedure
Model MODEL1
Dependent Variable chg_pc
Number of Observations Read 117
Number of Observations Used 117
Analysis of Variance
Sum of Mean
Source DF Squares Square F Value Pr gt F
Model 1 191083177 191083177 2663 lt0001
Error 115 825109481 7174865
Corrected Total 116 10162
Root MSE 847046 R-Square 01880
Dependent Mean -430358 Adj R-Sq 01810
Coeff Var -19682365
Parameter Estimates
Parameter Standard
Variable Label DF Estimate Error t Value Pr gt |t|
Intercept Intercept 1 125480 133166 094 03480
DOSRATIO Dose Ratio 1 -100051 019387 -516 lt0001
Secondary variables
bull Placebo-corrected change from baseline in sitting DBP The mean plusmn SD change (Week 4LOCF) in sitting DBP is illustrated in Figure 3 and Table 9
Figure 3 Mean changes (actual and placebo-corrected) from baseline to Week 4LOCF for sitting DBP (ITT population)
DCP1PM Page 55 10182006
Clinical Pharmacology Review NDA 19-962 Toprol-XL 10182006
Table 9 SAS output for regression analyses for DBP with pooled placebo correction
Treatment group effects and pairwise comparisons for sitting SBP and DBP Results of the treatment group effects at the Week 4LOCF visit and the pairwise comparisons between each TOPROL-XL group and placebo for the change from baseline in sitting SBP and DBP are shown for the ITT population in Table 10
Table 10 Treatment group effects for change in baseline to Week 4LOCF for sitting SBP and DBP (ITT population)
Some key findings from the pair-wise comparison are as follows (Table 10) 1 All active groups produced statistically significant reductions from baseline in sitting
SBP and DBP at the Week 4LOCF visit whereas placebo did not
DCP1PM Page 56 10182006
Clinical Pharmacology Review NDA 19-962 Toprol-XL 10182006
2 Overall the mean change from baseline in sitting SBP at Week 4LOCF for the TOPROL-XL groups pooled was statistically significantly larger than that for the placebo group (p=00351)
3 Results of pairwise comparisons between individual TOPROL-XL dose groups and placebo also revealed a statistically significant difference for the 10 and 20 mgkg groups (p=00270 and p=00492 respectively)
bull Mean changes over time in sitting SBP and DBP Consistent with findings from other studies with beta-blockers apparent maximal reduction in blood pressure occurred between 1 and 4 weeks of treatment
Figure 4 Mean changes over time for sitting SBP and DBP (ITT population)
Data points in plot are from absolute values (not taking baseline into account)
Subgroup Analyses The sponsor conducted several exploratory subgroup analyses however these analyses were not reviewed critically and are not presented in this review as
1 they do no impact the primary outcome or study objective 2 they are unlikely to be clinically useful due to the small number of patients per
subgroup One potentially useful some group analyses involved the percentage of responders as defined in Table 11
The responder analyses shows comparable response rates for all active dose groups suggesting similar efficacy across dose groups despite different exposure (doses)
DCP1PM Page 57 10182006
Clinical Pharmacology Review NDA 19-962 Toprol-XL 10182006
Table 11 Number and proportion of responders (ITT population)
Pharmacokinetic Results The Ctrough information obtained in the trial are summarized in Figure 6 and Tables 12 and 13
Table 12 Summary of Ctrough data (per applicant)
Sixteen patients across the 3 TOPROL-XL groups did not have blood samples obtained for analysis of metoprolol concentrations Based on the number of samples BLQ there appeared to be very low concentrations in the lowest dose group It appeared that Ctrough increased with dose According to the applicant these values are similar to those obtained previously in adults especially at the 2 higher doses Variability was high in all treatment groups (CV gt 60 )
Table 12 Summary of Ctrough (Reviewer Generated) from all patients (samples lt LOQ given value = 0) Toprol XL Dose Number of subjects Concentration (ngmL) (mgkg) Mean plusmn SD Median Range 02 39 137 plusmn 294 000 0 ndash 157 10 17 1224 plusmn 1416 845 0 ndash 571 20 46 2462 plusmn 3352 1140 0 ndash 1670
DCP1PM Page 58 10182006
Clinical Pharmacology Review NDA 19-962 Toprol-XL 10182006
Reviewer Note Overall the plasma concentrations (exposure) for the 02 mgkg dose group appear too low to be effective (close to LOQ) It is noted that adults typically have concentrations gt LOQ at the lowest therapeutic dose 25 mg (~ 4 ngmL)
Figure 6 Boxplot of metoprolol Ctrough using samples gt LLQ (per applicant)
Safety Results According to the applicant Toprol XL was well tolerated in the pediatric population as tabulated below
Main Analyses Conclusions bull No dose response was observed for corrected SBP using pooled placebo data
however using group-matched placebo data demonstrated a dose response bull Ctrough increased with dose bull Toprol 10 and 20 mg kg doses were more effective than placebo in reducing
SBP bull The responder rate was comparable across all active dose groups and this rate was
greater than that of placebo
DCP1PM Page 59 10182006
Clinical Pharmacology Review NDA 19-962 Toprol-XL 10182006
Methods Reviewerrsquos Methods Generally this reviewer conducted the analyses in a manner similar to that of the sponsor to confirm the sponsorrsquos findings
Sponsorrsquos Methods
Design Study1 307A
Reviewer Note This study was described in the Dose-Response Assessment (please refer to Page 7 Dose Response Analyses) Consequently only highlights relevant to the population analyses will be included in this section
Study 307A was a 4-week multi-center double-blind placebo-controlled randomized parallel-group study TOPROL-XL (metoprolol succinate) extended-release tablets were given to hypertensive pediatric patients Patients were randomized to double-treatment with a once daily oral dose of placebo or Toprol-XL at 1 of 3 target doses 02 or 20 mgkg The dose range for this study was 125 to 200 mg daily Patients on placebo followed the same schedule as that for their active group comparators
Study Flow Chart
Key Inclusion Criteria School age and adolescent children with reproducible SBP or DBP at or above the 95th percentile using height-adjusted charts for age and weight were eligible
DCP1PM Page 60 10182006
Clinical Pharmacology Review NDA 19-962 Toprol-XL 10182006
Study2 307B
Study 307B was a 52-week multi-center open-label study to determine the safety and pharmacokinetics of TOPROL-XL (metoprolol succinate) extended-release tablets (metoprolol CRXL) in hypertensive pediatric patients The starting dose was 25 mg daily The dose was increased every 2 weeks in increments of 25 mg or 50 mg based on tolerability until BP was controlled or the dose reached 200 mg
Table 1 Study Assessments
At the end of the 52-treatment period all patients had BP measured and a trough plasma level taken 24 hours the last dose of Toprol-XL with the exception of those patients who completed the serial portion at the final visit Among the participants a subgroup of approximately 30 patients was to participate in PK assessments of metoprolol requiring serial blood sampling at any time during the 52 weeks A single dose of 25 mg of Toprol-XL was given orally to those participating patients after a 48-hour washout period After the PK assessments they returned to the main study protocol Data
Study1 307A
4111 Pharmacokinetics A blood sample was to be collected at Visit 7 into a heparinized Vacutainer tube and obtained at 24 hours (plusmn2 hour) following the last dose of study medication (ie trough measurement) for determination of plasma metoprolol concentrations
Study Disposition Chart
DCP1PM Page 61 10182006
Clinical Pharmacology Review NDA 19-962 Toprol-XL 10182006
Table 2 Study Demographics
4112 Pharmacodynamics Primary variable
Sitting SBP determined at trough (24plusmn4 hours Visit 7) served as the primary efficacy assessment The primary measure of effect was the placebo-corrected change from baseline to the end of treatment (Week 4) in trough sitting SBP Each BP determination represented the mean of 3 readings with less than 7 mmHg between the highest and lowest value Blood pressure was measured using a mercury sphygmomanometer with an appropriate size cuff positioned approximately at the level of the heart Every effort was made to have the same individual measure the patientrsquos BP throughout the study if possible At all post randomization visits BP measurements were to be made at trough defined as 24 hours (plusmn4 hours) after receiving study medication All measurements were to be determined prior to the patient taking the scheduled dose of study medication In the
DCP1PM Page 62 10182006
Clinical Pharmacology Review NDA 19-962 Toprol-XL 10182006
event that the patient accidentally took study medication on the day of the scheduled visit the visit was to be rescheduled within 24 to 48 hours
Study2 307B
4113 Pharmacokinetics A 48-hour washout period prior to sampling was required for all patients including patients who entered the 52-week study and then decided to participate in the serial PK portion of the study All patients were to have a 15-mL blood sample collected into a heparinized Vacutainer tube 24 hours (plusmn2 hour) following the last dose of TOPROL-XL (ie trough measurement) at Visit 18 (or a the time of premature discontinuation) except for patients who participated in the serial PK portion of the study and had blood sampling performed at Visit 18 For patients participating in the serial PK portion of the study blood samples (15 mL) were to be collected into heparinized Vacutainer tubes and obtained at Hour 0 (predose) and at 1 2 3 4 6 8 10 and 24 hours after administration of a single 25 mg dose of TOPROL-XL following a 48-hour washout period After the last blood sample was obtained the patient was to startresume the prescribed dose of TOPROL-XL heshe was receiving prior to PK sampling
Patient Disposition Chart (completion or discontinuation)
Overall a total of 31 patients at 8 centers were enrolled in the serial PK portion of the study Of these 31 patients 27 had plasma concentration data available and were included in the analyses Four patients were excluded from the analyses because their plasma concentrations were not quantifiable (Nos 047-009 and 047-021) or because only whole blood samples were analyzed (Nos 005-002 005-003)
DCP1PM Page 63 10182006
Clinical Pharmacology Review NDA 19-962 Toprol-XL 10182006
Table 3 Subject Demographics for Patients Providing Serial Blood Samples
Missing Data Twenty-six patients did not have blood samples obtained for analysis of metoprolol concentrations in either the 16-week (n=7) or 52-week (n=19) studies Among patients with plasma samples 14 (14) in the 52-week study and 13 (13) in the 16-week study had trough plasma metoprolol concentrations that were below the LLQ Therefore data from a total of 99 patients were included in this analysis
Assay Metoprolol plasma levels were assayed using high-performance liquid chromatography tandem mass spectrometric detection methods having limit of quantitation (LOQ) of 1 ngmL The method was validated in the linear range 1 to 1000 ngmL Precision was less than or equal to 109 Accuracy ranged from 940 to 1013 Pharmacodynamics Not applicable
Data Checking SAS was used to format and check data Additionally visual inspection of several randomly selected subject data was carried out
DCP1PM Page 64 10182006
Clinical Pharmacology Review NDA 19-962 Toprol-XL 10182006
Models
Overview The sponsorrsquos stated assumptions underlying this modeling analysis are
1 Rich sampling data collected from 30 subjects in 307B Study can be used to adequately characterize the structural pharmacokinetic model of metoprolol
2 Structural pharmacokinetic models of metoprolol at other dose strength are identical to that at 25 mg
3 Metoprolol exhibits a linear pharmacokinetics in the dose ranges studied 4 Steady-state pharmacokinetics of metoprolol has been reached at the time of blood
sampling in Study 307A 5 Metoprolol accounts for the blood pressure effect in the study 6 Existing various disease states in the patients have no impact on the pharmacokinetics
of metoprolol and pharmacodynamics of the blood pressure reduction in the study 7 Concomitant medications if existed do not have any effects on the pharmacokinetics
of metoprolol and pharmacodynamics of the blood pressure reduction in the study
Reviewer Comment The sponsorrsquos assumptions appear reasonable based on existing metoprolol PKPD information
Pharmacokinetics
4114 PK Structural Model Several PK models were tested to identify the structural model Flip-flop absorption was taken into consideration based on general PK characteristics following administration of sustained release tablets and observed data in the current study (serial PK samples)
The models tested included linear 1- and 2-compartment PK models with the following characteristics (focused on flip-flop models)
bull first-order absorption with and without absorption lag time (NONMEM subroutines ADVAN2 and ADVAN4)
bull zero-order absorption with and without absorption lag time (NONMEM subroutines ADVAN1 and ADVAN3)
bull simultaneous zero- and first-order absorption from the absorption compartment The models were parameterized in terms of CLF and VF
Ultimately the 2-compartment model with first order flip-flop absorption an absorption lag time and 2 residual error terms was selected as the structural model of metoprolol The model scheme is presented in the following Figure 1 Figure 1 PK Compartmental Model
DCP1PM Page 65 10182006
Clinical Pharmacology Review NDA 19-962 Toprol-XL 10182006
4115 PK Covariate Model Covariate models were developed to account for the potential impact of the following covariates and derived covariates on metoprolol PK
Continuous variables bull Age (AGE years) bull Body weight (WT kg) bull Body surface area (BSA m2) calculated from WT and HT (cm) using the height
weight formula BSA=0024265 x WT 05378 x HT03964 bull Ideal body weight (IBW kg) calculated as - Males IBW=50+(HTndash150)25 and
for Females IBW=45+(HTndash150)25 bull Dose (DOSE mg of Toprol-XL)
Categorical variables bull Gender (SEX) - Male 0 - Female 1 bull Race (RACE) - Caucasian 0 - Black 1 - Asian 2 - Other 3
PK covariate effects were modeled as follows
Effects of continuous covariates (AGE WT BSA IBW and DOSE) were normalized to the corresponding median value across a dataset such that continuous covariates were related to structural PK parameters in a power function as described below
where Θ is the fixed-effect parameter of a covariate estimated by the NONMEM program covariate value is the observed covariate value and PK typical value is the typical value of the PK parameter estimated by NONMEM Effects of categorical covariates (SEX and RACE) are related to structural PK parameters by fractional changes of dummy variables
DCP1PM Page 66 10182006
Clinical Pharmacology Review NDA 19-962 Toprol-XL 10182006
Where Θ is the fixed-effect parameter of a covariate estimated by the NONMEM program covariate is the dummy variable value and modified in the control streams and PK typical value is the typical value of this PK parameter as estimated by NONMEM
Median values of all covariates in the dataset for population PK analysis are presented in Table A
Table A Summary of patient covariates and Toprol-XL doses in the data for population PK analysis
Two Steps were included in the modeling of covariates
Step 1 Forward Addition The covariates were subjected to a stepwise forward selection algorithm using a likelihood ratio test based on a change in MOF values from the base model A significant covariate reduced the MOF more than 660 (chi-square distribution plt001 degrees of freedom [df]=1)
Step 2 Backward deletion (Excluding procedures for covariate effect) The covariates in the full model acquired in Step 1 were subjected to a backward deletion algorithm 1 covariate was deleted at a time using a likelihood ratio test based on a change in MOF values A covariate was determined to be statistically significant if the change in MOF after its deletion from the breakdown model was increased by more than 1083 (chi-square distribution plt0001 df=1)
4116 PK Random Variance Models An exponential error model was used to characterize inter-patient variability based upon the assumption that random effects for PK parameters were not correlated among PK parameters No other error models for eta were evaluated by the applicant or by this Reviewer The retention of ETA values for each PK parameter in the structural model was confirmed by sequentially fixing each ETA value at zero and comparing each resultant MOF with the MOF obtained when all ETA values were retained in the model (see Table 6)
DCP1PM Page 67 10182006
Clinical Pharmacology Review NDA 19-962 Toprol-XL 10182006
The residual model was modeled by an additive model two error terms were used one for error associated with trough samples and the other with serial samples
Reviewer Note Use of an exponential model appears reasonable
Pharmacodynamics
4117 PKPD Structural Model The equations for the structural models are shown below
1 Metoprolol Ctrough The relationships between the observed metoprolol concentrations (Ctrough) and hemodynamic changes were investigated using 4 direct-link models namely a linear model a log-linear model and Hillrsquos sigmoid Emax PKPD model with and without a baseline
2 The relationships between Cmax or AUC0ndash24 and hemodynamic changes were investigated using 2 direct-link models a linear model and a log-linear model
4118 PKPD Covariate Model The inclusion and exclusion procedures of covariate effect on the selected PKPD base model to obtain a selected final PKPD model were identical to those in the covariate evaluation in the population PK models as described previously in PK Covariate Model DCP1PM Page 68 10182006
Clinical Pharmacology Review NDA 19-962 Toprol-XL 10182006
Table B Baseline demographic and covariate characteristics
4119 PKPD Random Variance Models An exponential error model was used by the applicant to model inter-individual variability The retention of a random effect parameter ETA in each selected PKPD structural model was then evaluated by sequentially fixing each ETA value at zero and comparing each resultant MOF with the MOF obtained when all ETA values were retained in the model (plt005) This step reduced over-parameterization by deleting unnecessary random-effect parameters from the structural model to obtain the base model
Reviewer Note The study design precludes assessment of inter-individual variability or random error because only one dose record was available per patient Consequently the model should not have included eta terms It is noted that the sponsor ultimately dropped the eta term in the final model
DCP1PM Page 69 10182006
Clinical Pharmacology Review NDA 19-962 Toprol-XL 10182006
Model Selection
PK Initial Model Selection
PK Base Model to Final Model The selection of the most appropriate PK base model for a metoprolol PK was based upon the following criteria a significant reduction in MOF as compared to the baseline model and asymptotic chi-square distribution based on the likelihood ratio test or AIC (plt005) as compared to the other structural models This selected PK base model was then subject to a covariate evaluation The population PK model bearing all surviving covariate parameters with statistical significance became the penultimate final model If 1 of the body size parameters (WT BSA and HT) was not in the model the penultimate final model became the final model If body size parameters were in the model they were sequentially replaced by other body size parameters in the regression submodel for each PK parameter The best body size parameter was then selected on the basis of lowest MOF to form the final model
PK Final Model Selection Simulations and visual inspections based on goodness of fit plots were used to qualify and validate the model The goodness-of-fit of the final model was evaluated graphically by comparing population and individual predictions of metoprolol concentrations with observed metoprolol concentrations along the line of unity and by visual inspection of the following plots of population-weighted residuals (WRES) for the final population model 1 Population-weighted residuals (WRES) versus population-predicted concentrations (PRED) 2 WRES versus time after first drug administration in each patient 3 WRES versus all covariates evaluated WRES were generally expected to be distributed homogenously around zero for PRED time after administration and covariates For those 27 patients with serial samples goodness-of-fit of the plasma concentration-time profile for each individual was visually inspected The linear relationship between their AUClast values from the observed data and those from the simulated data (final model) was examined
The predictive performance of the final population PK model including covariates was evaluated by comparing typical values of PK parameters with the mean of individual Bayesian estimates or individual values of PK parameters with the results from non-compartmental analysis for patients with serial samples Steady-state metoprolol plasma concentration-time profiles from 0ndash24 hours at the interval of 15 minutes (025 hour) were calculated using the post hoc Bayesian estimated PK parameter obtained for 65 patients included in the PKPD relationship using the following equation
DCP1PM Page 70 10182006
Clinical Pharmacology Review NDA 19-962 Toprol-XL 10182006
PKPD Initial and Final Model Selection A similar approach to that of PK model selection was adopted for PKPD Each of the above-mentioned PKPD models with random effects was identified by curve-fitting the dataset Initial selection of the PKPD structural model was based upon a significant reduction in MOF (plt005) as compared to the baseline model and reasonable PKPD parameter estimates Software
Nonlinear mixed-effect modeling (NONMEM) software (Version V level 11 Globomax Hanover MD) was used in the population PK analysis PK model fitting was accomplished using first-order (FO) approximation methods For PKPD model fitting the first-order conditional estimation (FOCE) with eta-epsilon interaction method in NONMEM was used for all model runs
SAS software (Version VIII Cary NC) was employed to prepare datasets according to the format required by the NONMEM program (Boeckmann et al 1991) Microsoftreg Excel 2000 (Redmond WA) and S-PLUS 2000 (Professional Release 2 MathSoft Inc Cambridge MA) were used to perform exploratory graphical exposure calculation and statistical analyses according to the format required by the NONMEM program (Boeckmann et al 1991) SAS command files logs and listings pertaining to data file conversion and merging were reviewed by an independent analyst Datasets were stored in SAS data frames combined and exported to Excel and then to ASCII files before fitting to the model
Datasets were prepared and pooled in a NONMEM-compliant format using SAS software by the Programming Group Clinical Information Sciences at AstraZeneca Wilmington Delaware SAS command files logs and listings pertaining to file conversion and merging were provided and found to be acceptable The contents of both datasets (toprolkatcsv for PK modeling and cppd2csv for PKPD modeling) were included
DCP1PM Page 71 10182006
Clinical Pharmacology Review NDA 19-962 Toprol-XL 10182006
toprolkatcsv was not provided electronically in a SAS format however this reviewer generated a similar dataset using the applicantrsquos criteria
Reviewer Comment The software and data assembly methods appeared adequate
DCP1PM Page 72 10182006
Clinical Pharmacology Review NDA 19-962 Toprol-XL 10182006
Results and Discussion Design Adequacy
Overall the trial designs appeared adequate to evaluate metoprolol population PK and PKPD in pediatric patients receiving Toprol XL However the design could have been further optimized by increasing the sampling points particularly in the absorption phase Due to the limited number of samples in the absorption phase it was not possible to accurately characterize the absorption model first order vs zero order or mixed first and zero order Additionally collection of mainly trough samples limits the ability to accurately estimate measures such as Cmax that are not directly related to Ctrough particularly if multiple compartments are present Consequently Cmax estimations are unlikely to be accurate Finally most patients provided only one trough sample thus inter-individual variability could not be adequately captured and may have limited the utility of the modeling exercise particularly in PKPD where the random effect could not be accurately characterized Ultimately there was no random variable in the final PKPD model (ie eta was set to zero) Data Integrity
This reviewer checked the data visually by randomly selecting data from patients included in the population modeling and comparing to data in the study report (source data) Overall the data integrity appeared acceptable The applicant observed the following guidelines that appeared acceptable No datum from any study participant with a protocol violation that was thought to materially impact the analysis was included The dataset contained data from only those study participants who could be evaluated ie with all the last dosing datetime blood sampling datetime plasma drug concentrations and demographic covariates
Data that were excluded (n = 62 samples) from the model were as follows One sample from an apparent poor metabolizer Two samples collected gt 96 hours post dose From 307B 10 trough samples lt LOQ From 307A 17 samples lt LOQ Thirty-samples from serial data that were lt LOQ or whole blood samples Model and Model Selection
Base Model
41110 Pharmacokinetic Model description The base PK model was a standard two compartment model that incorporated lag time and flip-flop kinetics The key features of the model were flip-flop was insured by making the value of ke gt ka in the clearance equation Additionally lag time was restricted to a value of 2 hours or less and concentrations were log transformed consequently all concentrations (F) = 0 were given individual predicted concentrations of zero Finally there were two residual error terms one for serial samples and the other for trough samples DCP1PM Page 73 10182006
Clinical Pharmacology Review NDA 19-962 Toprol-XL 10182006
Key equations were as follows
KA = THETA(1)EXP(ETA(1)) V2 = THETA(2)EXP(ETA(2)) CL = (THETA(1)THETA(2)+THETA(3))EXP(ETA(3)) Q = THETA(4)EXP(ETA(4)) V3 = THETA(5)EXP(ETA(5)) ALAG1=THETA(6)EXP(ETA(6))
41111 PK Parameter estimation results Table 1 Summary of PK parameters in the metoprolol population PK base model (per applicant)
41112 Goodness of fit The applicant provided the following goodness-of-fit plots (Figure 1)
Reviewer Note The goodness-of-fit plots were reproduced by this Reviewer (see Appendix) with minor modifications
Figure 1 Goodness of fit plots for Base Model
DCP1PM Page 74 10182006
Clinical Pharmacology Review NDA 19-962 Toprol-XL 10182006
Base PK Model Selection The MOF values of all structural model candidates tested are presented in Table 2 Model selection was based primarily on MOF values the lower MOF the better the model The applicant reports that in general MOF values generated by a conventional absorption model (ie absorption rate is faster than elimination rate) and a flip-flop absorption model (ie absorption rate is slower than elimination rate) were identical
Reviewer Comment The existence of flip-flop kinetics appears plausible based on data provided and general patterns for sustained release formulations Consequently the use of flip-flop kinetics for the bulk of the modeling exercise appears reasonable
General conclusions from the information in Table 2 are First order input is better than zero order input Two compartment model is better than one compartment model Lag time presence is better than lack of lag time Two residual error terms are better than one residual error term It should also be noted that several other models led to unsatisfactory completion of the run and were not considered further
DCP1PM Page 75 10182006
Clinical Pharmacology Review NDA 19-962 Toprol-XL 10182006
Table 2 Comparison of Structural PK Models
Reviewer Comment The selected structural model appears appropriate based on the data
Base Model The deletion of ETA for V2 did not change the MOF value suggesting that ETA for V2 should be deleted to avoid an over-parameterized warning (Table 3) This was consistent with the estimated parameter value of ETA for V2 being 648 x 10ndash9 a very small value Therefore the base model was selected by deleting the ETA for V2 from the structural model
Reviewer Comment on Eta deletion for V2 Deletion of eta for V2 is acceptable based on the empirical data however from a physiological perspective deletion of eta is problematic Generally one anticipates inter-individual differences in volume of distribution In this case it appears that the error associated with V2 may have been randomly shifted to V3 and or Q terms as the three DCP1PM Page 76 10182006
Clinical Pharmacology Review NDA 19-962 Toprol-XL 10182006
terms are interrelated This potential shift in error is supported by the fact that the V2 eta value increases significantly (by several orders of magnitude- 10-5 vs 100) when eta for Q and or V3 is fixed However when Q or V3 are fixed minimization is successful but Q and V3 are not accurately estimated Accounting for the possible error shift is a complex process and goes beyond the scope of this reviewer thus deletion of eta associated with V2 was considered acceptable for the remainder of the modeling evaluation
Table 3 Structural elements tested in the metoprolol population PK structural model (p lt 0005)
Final PK Model
41113 Model description The key feature of the final model is the inclusion of the covariate effects of age on Q and weight on CL in the population PK model
Key Equations CL = (THETA(1)THETA(2)+THETA(3)+EWT)EXP(ETA(2)) Q = THETA(4)EAGEEXP(ETA(3))
Including Covariate Effects As previously described covariate effects were assessed by forward addition and backward deletion Most covariates did not significantly change MOF however BSA significantly affected CL and Age affected Q Consequently these covariates were included in the penultimate final model
DCP1PM Page 77 10182006
Clinical Pharmacology Review NDA 19-962 Toprol-XL 10182006
Reviewer Note BSA is derived form WT and HT covariates implying BSA is highly correlated to these two covariates (Figure 2) weight is the most suitable (practical covariate) as it is readily measured Furthermore weight and BSA produced the same MOF (Table 4) whereas MOF with height was more positive (less significant)
Figure 2 Plot of BSA vs Body Weight
The data in Table 4 support selection of the final model
Table 4 Covariate elements tested in the metoprolol population PK penultimate final model (plt0005)
The applicant acknowledges that mechanism(s) accounting for the impact of age on QF are not clear However since distribution clearance has little effect on metoprolol plasma exposure further investigation is not needed
41114 PK Parameter estimation results As shown in Table 5 PK parameters were estimated fairly precisely by the final model
Table 5 PK Parameter Estimates using Final Model
DCP1PM Page 78 10182006
Clinical Pharmacology Review NDA 19-962 Toprol-XL 10182006
41115 Goodness of fit The goodness-of-fit plots provided by the applicant show good precision Figure 5 Goodness of fit plots for final PK model
DCP1PM Page 79 10182006
Clinical Pharmacology Review NDA 19-962 Toprol-XL 10182006
PK Model Qualification The post hoc Bayesian-estimated AUC (simulated) obtained for the 27 patients with serial plasma samples are plotted against the observed (AUCt) The correlation was high (R2 gt 099) Figure 6 AUClast from observed data versus AUCt from model simulation in the 27 patients providing serial plasma samples
Regression line Y= 4514 + 08976 X R2 = 09957
The graphical validation of the final metoprolol population PK model validation against covariates evaluated is presented in Figure 6
Figure 7 Graphical validation of covariates
DCP1PM Page 80 10182006
Clinical Pharmacology Review NDA 19-962 Toprol-XL 10182006
There was no systematic bias in weighted residuals for any covariates evaluated suggesting that the final model included all appreciable effects of available covariates (Figure)
The effects of weight on metoprolol CLF are illustrated in Figure 8 where Bayesian post hoc estimates of CLF are plotted against weight and overlaid by the model-predicted line Overall the model appeared to fit the data well
Figure 8 Plot of CLF vs Body weight
The effects of AGE on metoprolol QF are illustrated in Figure 9 where Bayesian post hoc estimates of QF are plotted against AGE and overlaid by the model-predicted line Figure 9 Plot of QF vs Age
DCP1PM Page 81 10182006
Clinical Pharmacology Review NDA 19-962 Toprol-XL 10182006
Reviewer Note The applicant indicated that attempts to run the final model using the first-order conditional estimation method resulted in termination errors Therefore the parameter estimates obtained by the FO method were reported as the final parameter estimates
Conclusion Regarding Population PK Modeling Overall the sponsorrsquos population PK modeling is acceptable
PKPD Model and Model Selection
PKPD Base Model PharmacokineticPharmacodynamic Model description The key feature of the model was a lack of random variance term for the slope (since only single data points were available per subject) and inclusion of baseline effect
Key equations were as follows E0 = THETA(1)EXP(ETA(1)) M = THETA(2) Y = E0 + MLOG(AUC) + EPS(1)
The control stream provided in the appendix is that for DBP (provided by sponsor) The control stream for SBP is comparable with appropriate substitution for BP type
It should be noted that only the log-linear and linear PKPD models were considered suitable for AUC and Cmax For this review only AUC estimates were considered reliable as Cmax estimates could not be accurately determined based on the sampling scheme Consequently the remainder of this review focuses on AUC information although Ctrough and Cmax data are displayed for reference
Bayesian estimates from PK modeling are summarized in Table 1
Table 1 Bayesian estimates of metoprolol PK exposure for those patients included in the PKPD analysis (N=65)
DCP1PM Page 82 10182006
Clinical Pharmacology Review NDA 19-962 Toprol-XL 10182006
PKPD Model Selection (initial and final) The log-linear model was adopted as the base model for this PKPD relationship since it improved the MOF significantly (Table 2) The ETA parameter for the slope was pre-eliminated for the purpose of model parsimony The intercept and slope in this log-linear model for AUC(0-24) did not bear ETA parameter therefore no covariates had impact on either parameter in the model
Reviewer Note The intercept should not have borne an eta term because individual subjects provided only one data point Consequently fixing eta to zero or deleting eta in the final model is appropriate No further model development was required after eta was eliminated and the base model was equivalent to the final model
Table 2 Base population PKPD models tested for the change in SBP
41116 PKPD Parameter estimation results The final PKPD parameter estimates are presented in Table 3
Table 3 Summary parameters in the final PKPD model for the change in SBP using trough plasma level Parameter Explanation Estimate SE ()b
DCP1PM Page 83 10182006
Clinical Pharmacology Review NDA 19-962 Toprol-XL 10182006
Model Qualification Based on the relatively low R2 value and as shown in Figure there is a poor correlation between change in SBP and log AUC
Figure 1 Relationship between change in SBP and AUC (line generated from modeling)
Overall goodness-of-fit of the model was considered to be poor probably due to the high variability in the measurements Consequently the precision of the model parameter estimates was not considered to be very reliable These parameters have little clinical usefulness and can be treated only as an indication of trends ie more hemodynamic effects can be potentially achieved when high Toprol-XL doses are given Clinical dose adjustment based on these PKPD parameters is not recommended
Reviewerrsquos Supplemental Analyses A supplemental PKPD analyses was conducted using simple linear regression since the population model did not improve the fit Overall eta made an insignificant contribution to the overall model The results of the analyses were similar to the population analyses A series of regression analyses were conducted and are presented in Table 4
The applicant notes that the preliminary modeling exercise found that there was no difference in the PKPD modeling results using different hemodynamic data formats (ie change in the measurements percent change in the measurements or actual BP measurements) This finding was confirmed by this reviewer (see Table 4)
DCP1PM Page 84 10182006
Clinical Pharmacology Review NDA 19-962 Toprol-XL 10182006
Table 4 Supplemental PKPD Regression Analyses Conducted by Reviewer Model (liner regression) Intercept (I) Slope (m) R2 Probability RSBP = mISBP + I 3957 -035 01626 0009 PSBP = mISBP + I 2524 -023 01252 00038 PSBP = mRSBP + I 0005 074 09891 lt 00001 RSBP = mlogAUC + I 651 -221 0060 00493 RSBP = mDose + I -751 0006 00026 06878 RSBP = mDose^ + I -312 -111 004 02711 RSBP = mlogAUC + nISBP + I 5303 -221 (m)
-035 (n) 02230 0001
RSBPplc = mAUC + I -667 -0003 00458 00871 RSBPplc = mlogAUC + I 461 -2208 00600 00493 RPUL = mlogAUC + I 1868 -405 01102 00069 Symbols in table similar to population PK model without eta term RSBP- change of SBP without placebo correction ISBP- initial (baseline) SBP RPUL- change in HR without placebo correction Dose- in mg where placebo is included as 0 mg PSBP- percentage change of SBP without placebo correction
Conclusion Regarding Population PKPD Modeling Overall the sponsorrsquos population PKPD modeling is acceptable No dose adjustment conclusion can be made from this modeling however an exposure-response relationship was established for AUC and reduction in SBP
Discussion
The significance of the results 1 Provide estimates of PK measures and plasma exposure in pediatric population These data can be compared to adult exposure to determine if exposure differences impact drug effectiveness The main challenge in comparing pediatric data to adult data is different modeling schemes formulations and methods were used in the two populations
2 PKPD findings are not sufficiently precise to provide a dose adjustment algorithm however the PKPD analyses provides rationale for proposed titration as increasing exposure (doses) may improve efficacy (reduction in SBP) Ultimately the risk-benefit analyses overrides PKPD assessment for dose adjustment drug will be titrated thus reliance on PKPD information is not critical The proposed dose 10 mgkg appears suitable based on available information It is unclear from the studies if there should be an initial maximum dose although the sponsor has proposed 50 mg as the maximum initial dose The proposed pediatric starting dose on a mgkg basis is within the range of starting adult doses (25 ndash 100 mg) assuming an adult weighs 70 kg
3 Cumulative information form dose-response study indicates that Toprol XL has effectiveness in children however the most effective dose is unclear Since the drug can be titrated determining the initial optimal dose does not appear critical As proposed by the applicant dosing is started at a ldquolowrdquo dose that can be up-titrated if needed
DCP1PM Page 85 10182006
Clinical Pharmacology Review NDA 19-962 Toprol-XL 10182006
4 The results did not adequately address the potential impact of CYP2D6 metabolic status for pediatric patients taking Toprol XL There were an insufficient number of patients to make this assessment
5 Covariate effects do not appear significant only body weight significantly affects clearance However a worst case scenario can occur with a person that has a low body weight and is a poor metabolizer this will result in very high possibly supra-therapeutic exposure Age does not impact apparent oral clearance so an age-dependent dose adjustment is not needed for children over 6 years old In essence all children over six years old can initiate therapy at 10 mgkg
The validity of the results Overall the results produced by the sponsor appear valid and the sponsor used a sound modeling approach However alternative approaches that could have been adopted may have improved the outcome of the analyses Three of these approaches are presented below 1 Additional PK samples should have been collected during the absorption phase and
throughout the dosing interval to improve the modelrsquos performance Specifically additional samples collected during the absorption phase may have unambiguously identified the actual absorption input function (eg first order zero order mixed first and zero order) First order input was selected for the analyses although the dosage form is reported to exhibit zero order kinetics in adults It is possible that the input rate in children differs from that in adults but unlikely It should be noted that absorption kinetics in children is often erratic due to multiple factors (eg regioshyselective absorption incomplete gastric emptying and inconsistent absorption) so it is unclear if additional samples would have definitively identified the absorption function However additional non-trough samples may have helped in estimating key PK measures such as V and Cmax The final model did not have an eta associated with V which is atypical Collection of additional samples on different visits may have helped estimate potential inter-occasion variability It should be noted that AUC was estimated precisely for subjects providing serial samples but these subjects were not necessarily included in the PKPD analyses Ideally the PKPD modeling should have been conducted primarily in subjects who had accurate PK measures
2 The PKPD design could have been modified to potentially improve the utility of the analyses Specifically there should have been better placebo matching procedures to minimize the potential impact of the placebo effect This matching could have been improved by ensuring all patients on placebo had the same titration schedule and number of tablets It is noted that the model had a poor predictive performance that was mainly attributed to the high degree of variability in the PD measures Potentially other PD markers could have been explored that have less inherent variability One such marker is the degree of beta blockade using exercise heart rate (EHR) reduction this marker has been used extensively for metoprolol in adult subjects However use of EHR in the pediatric setting may be challenging
DCP1PM Page 86 10182006
Clinical Pharmacology Review NDA 19-962 Toprol-XL 10182006
Comments to sponsor
In future pharmacometric studies you should consider the following 1 collect sufficient (multiple) samples from individual subjects to allow assessment
of inter-occasion variability and estimation of inter-individual variability (eta) for all relevant parameters
2 placebo groups should be identically matched across all dose groups (eg same titration schedule and number tablets) to minimize potential bias or differences in the placebo effect
Comments to medical reviewer
1 The sponsor has adequately characterized metoprolol PK in the studied pediatric population The PK characterization could have been further optimized by obtaining additional samples over the entire dosing interval (eg during the absorption phase and elimination phase) on multiple occasions rather than on one occasion primarily at trough
2 A dose-response relationship could not be established using the protocol specified analysis approach The outcome of the dose-response relationship appeared highly dependent on the ldquoplacebo effectrdquo suggesting that the placebo group may not have been appropriate One should consider re-evaluating the dose-response precisely matched placebo groups (eg all placebo patients have identical number of tablets and titration schedule)
3 Based on the PKPD analysis plasma exposure (AUC) explains lt 10 of the response (reduction in systolic blood pressure) thus has limited clinical utility However the PKPD relationship suggests that there is a trend for increased response with increased exposure (dose driven)
4 Overall information from the dose-response study suggests that Toprol- XL is effective in the pediatric population The optimal initial dose 02 10 or 20 mgkg or the maximum safe and effective dose cannot be determined from the information provided It is noted that the 02 mgkg dose is unlikely to be effective as plasma concentrations achieved at this dose are unlikely to be effective (most concentrations lt LOQ and lower than effective adult concentrations) The 10 mgkg (proposed by applicant) appears to be a reasonable initial dose The labeling should reflect the regimens studied
DCP1PM Page 89 10182006
Clinical Pharmacology Review NDA 19-962 Toprol-XL 10182006
Appendix
DCP1PM Page 90 10182006
Clinical Pharmacology Review NDA 19-962 Toprol-XL 10182006
DCP1PM Page 91 10182006
Clinical Pharmacology Review NDA 19-962 Toprol-XL 10182006
DCP1PM Page 92 10182006
Clinical Pharmacology Review NDA 19-962 Toprol-XL 10182006
DCP1PM Page 93 10182006
Clinical Pharmacology Review NDA 19-962 Toprol-XL 10182006
DCP1PM Page 94 10182006
Clinical Pharmacology Review NDA 19-962 Toprol-XL 10182006
DCP1PM Page 95 10182006
Clinical Pharmacology Review NDA 19-962 Toprol-XL 10182006
Table 15 Control streams for final log-linear PKPD model for the change in DBP using metoprolol Cmax as the measure of exposure
Truncated NONMEM reports for base model identification for PKPD relationship in change of SBP (per sponsor)
DCP1PM Page 96 10182006
Clinical Pharmacology Review NDA 19-962 Toprol-XL 10182006
Reported PD information^
^ Under metoprolol regimen CRZ0K is Toprol XL
DCP1PM Page 97 10182006
Clinical Pharmacology Review NDA 19-962 Toprol-XL 10182006
Table Results of randomised double-blind comparative trials evaluating antihypertensive efficacy of metoprolol formulations or other antihypertensives
DCP1PM Page 98 10182006
---------------------------------------------------------------------------------------------------------------------
---------------------------------------------------------------------------------------------------------------------
---------------------
This is a representation of an electronic record that was signed electronically and this page is the manifestation of the electronic signature
s
Robert Kumi 10182006 045635 PM BIOPHARMACEUTICS
Patrick Marroum 10192006 050811 PM BIOPHARMACEUTICS
Clinical Pharmacology Review NDA 19-962 Toprol-XL 10182006
1 EXECUTIVE SUMMARY
Astra Zeneca submitted NDA 19-962 SE5 033 (pediatric supplement) to fulfill a FDA pediatric written request for TOPROL-XL metoprolol succinate extended release tablets Metoprolol a beta blocker is approved for hypertension angina and heart failure in adults In adults with hypertension the usual initial dosage is 25 to 100 mg daily (single dose) as monotherapy or in combination with a diuretic this dosage is titrated at weekly intervals until optimum blood pressure reduction or control is achieved The current application focuses on Toprol-XL use in pediatric patients six years and older The initial proposed dosing in children six and older is 10 mgkg subsequently the dose is titrated based on clinical response
Two clinical trials Studies 307A (dose-response) and 307B (safety extension of 307A) were conducted in pediatric patients with hypertension to support the proposed labeling changes The applicant conducted dose-response (n = 140 patients) population PK (n = 120 patients) and PKPD (n = 65 patients) analyses using data from pediatric hypertensive patients receiving Toprol-XL in the mentioned studies PK and PD measures estimated in the analyses or determined during the trials included Ctrough Cmax AUC0ndash24 CLF Tlag (lag time) ka (first order absorption rate constant) V2F (volume of distribution in central compartment) QF (intershycompartmental clearance) ∆DBP (change in diastolic blood pressure ∆SBP (change in systolic blood pressure) and ∆HR (change in heart rate) Selected covariates including age body weight gender race and Toprol-XL dose were evaluated for their potential impact upon PK parameters
11 RECOMMENDATIONS
The Office of Clinical Pharmacology has reviewed the information submitted to NDA 19-962 SE5 033 The clinical pharmacology and biopharmaceutics information provided in the current submission is acceptable However the sponsor should note the following
Comments to sponsor A In future studies with pharmacometric components you should consider the following
1 Collect sufficient (multiple) samples from individual subjects to allow assessment of inter-occasion variability and estimation of inter-individual variability (eta) for all relevant parameters
2 Placebo groups should be identically matched across all dose groups (eg same titration schedule and number of tablets) to minimize potential bias or apparent differences in the placebo effect
B Please address labeling changes and comments in the attached revised label (Page 19)
12 Phase IV Commitments
None
Page 4 of 98
Clinical Pharmacology Review NDA 19-962 Toprol-XL 10182006
13 Summary of Important Clinical Pharmacology Findings
1 Dose-Response A statistically significant dose-response did not exist for placebo (pooled)ndash corrected ∆SBP from baseline however the relationship was evident when placebo (specific-group) ndashcorrected data were used
2 Proposed Pediatric Dosage Overall information from the dose-response study suggests that Toprol XL is effective in the pediatric population The optimal initial dose in mgkg or the maximum safe and effective dose cannot be determined from the information provided However the 10 mgkg (proposed by applicant) appears to be a reasonable initial dose subsequent titration based on clinical response is acceptable Relative to adults (assuming average adult weighs 70 kg) the proposed initial pediatric dose is in the range but closer to the high end of the usual initial adult dose 036 ndash 143 (25 to 100 mg)
3 Metoprolol Pharmacokinetics in Pediatric Patients Metoprolol PK in children (6 ndash 16 years old) were adequately characterized by a 2-compartment model with flip-flop first-order absorption and an absorption lag time using a population PK approach The population PK model yielded precise parameter estimates Estimated PK Measures (median values) were CLF = 2275 Lhr V2F = 961 L QF = 675 Lhr V3F = 620 L ka = 00467 hrndash1 and Tlag = 0853 hr Overall the PK measures in children are of a similar magnitude as that in adults reported in the literature
4 Metoprolol Exposure in Children At the proposed pediatric initial dose 10 mgkg average Cmin was ~ 122 ngml and average Cmin was ~ 246 ngmL at the 20 mgkg dose however data were highly variable with CV gt 100 The majority of samples were below the lower limit of quantitation at the lowest studied dose 02 mgkg In adults (literature reports) average Cmin following 50 mg (~071 mgkg) was ~ 85 ngmL and ~ 226 ngmL following 100 mg (~143 mgkg)
5 Covariates Sex age race body weight and Toprol-XL dose did not have a clinically significant effect on metoprolol PK
6 Population PKPD Model Using a log-linear model or linear model there were statistically significant relationships (p lt 0005) between the changes in SBP and DBP from baseline and measures of metoprolol plasma exposure (Ctrough AUC(0ndash24 and Cmax) However the goodness-of-fit of the PKPD models were generally poor and parameters were not precisely estimated in most models due to a high degree of variability in the blood pressure data Based on the PKPD analysis plasma exposure (AUC) explains lt 10 of the response (reduction in systolic blood pressure) However the PKPD relationship suggests that there is a trend for increased response with increased exposure (dose driven) thus supporting dose titration
Robert O Kumi Ph D Date Clinical Pharmacology Reviewer Concurrence Patrick Marroum Ph D Date Cardiovascular and Renal Team Leader
Page 5 of 98
Clinical Pharmacology Review NDA 19-962 Toprol-XL 10182006
2 Question Based Review
21 What are the general attributes of metoprolol
211 Regulatory Background An original pediatric written request to support pediatric exclusivity was issued in October 1999 Subsequently amendments were made to the original request and a final written request was submitted in October 2004 Key elements of the request follow
1 Dose ranging trial in pediatric patients with hypertension ( 6 ndash 16 years old) 2 Pharmacokinetic sampling in the same range as those studied for effectiveness 3 Safety data from a controlled trial and 1-year open label treatment phase following the
effectiveness trial 4 Summary of all available information on the safety of the drug in hypertensive patients
The pediatric decision tree is depicted below this decision paradigm is used to support the rationale for choosing which studies had to be conducted
Pediatric Decision Tree (CDER MaPP 40004)
Disease Process Cause of Hypertension in Children Most children between 1 and 17 years old tend to have secondary forms of hypertension In infants and younger children underlying renal or reno-vascular disease is frequently the cause for hypertension (80) whereas essential hypertension is predominant in adolescents and adults Therefore the disease progression and response to the treatment in children and adults are not similar Based on the Pediatric Decision Tree Guidelines safety and efficacy studies are required in the target population to establish the indication in the pediatric patient population
Page 6 of 98
10182006 Clinical Pharmacology Review NDA 19-962 Toprol-XL
212 Selected background information on metoprolol Background on Metoprolol in Hypertension
Table 1 Snapshot of metoprolol clinical pharmacology and biopharmaceutic information
Drug Class Metoprolol is a szlig1-selective (cardio selective) adrenergic receptor-blocking agent Mechanism of Action (antihypertensive effect)
Multiple putative mechanisms competitive antagonism of catecholamine at peripheral sites reduction of sympathetic outflow to the periphery or suppression of renin activity
Approved Indications Hypertension Heart Failure and Angina Pectoris Approved Formulations 1 Immediate Release (IR) ndash metoprolol tartrate
2 Toprol-XL is extended-release tablet of metoprolol as the succinate salt it is also referred to as metoprolol in literature as controlled release (CRZ0K)
Metabolism Via CYP2D6 primarily Absorption Absolute oral bioavailability ~ 50 following IR Food does not affect metoprolol
absorption using ER formulation Distribution Protein binding to albumin is about 12 Elimination For IR t12 from 3 ndash 7 hours Less than 5 dose excreted unchanged in urine No
t12 values for ER this may be due to difficulty in separating absorption and elimination phases
Variability Plasma levels are highly variable among subjects after oral administration PKPD in children Limited information in children information obtained following administration of
metoprolol tartrate (IR) Please refer to NDA 19-962 for additional background information
213 Proposed Formulation Administration Route and Dosage The formulation proposed for pediatric use is Toprol-XL this formulation will be given orally at an initial dosage of 10 mgkg once daily (QD) Subsequently the dosage will be titrated depending on clinical response The maximum dosage studied was 200 mg QD Toprol-XL is available as a 25 (scored tablet) 50 100 and 200 mg tablet (b) (4)
22 What are the general clinical pharmacology characteristics of metoprolol succinate
221 Design features of clinical studies used to support dosing in the target population Two studies were conducted in hypertensive pediatric studies Study 307A and 307B the design features of these studies are summarized in Table 2 Table 2 Study Designs
Study Name Study 307A (D4020C00033) Study 307B (D4020C00001)
Objective Determine dose-response in children Determine long-term safety Doses Toprol XL 02 10 and 20 mgkg QD (maximum
200 mg QD) and Placebo Initial 25 mg QD then titrated to optimal clinical response (maximum 200 mg QD)
Design Feature bull 1-2 week placebo run-in period bull Patients in 10 and 20 mgkg groups dosed
over 2 week period but 02 mgkg group received dose for 4 weeks
Patients continuing from 307A or new enrollees
PK Features Ctrough (week 4) Ctrough (last study visit) and serial PK in subset (n = 31)
Primary Measures Outcome
Change in placebo-corrected trough sitting BP from baseline at week 4
Long-term safety using effective Toprol dose
LOCF approach followed
Page 7 of 98
Clinical Pharmacology Review NDA 19-962 Toprol-XL 10182006
222 Clinical response (efficacy) endpoints
Pharmacodynamics bull Primary variable Sitting SBP determined at trough (24plusmn4 hours Visit 7) served as the primary efficacy assessment The primary measure of effect was the placebo-corrected change from baseline to the end of treatment (Week 4) in trough sitting SBP Each BP determination represented the mean of 3 readings with less than 7 mmHg between the highest and lowest value bull Secondary variables Secondary variables included trough sitting DBP and percentage of responders at Week 4
223 Idenitifcation and measurement of metoprolol concentrations in plasma Metoprolol appeared to be adequately identified and measured in Study 307A and 307B A validated HPLC with tandem mass spectrometry method was used to quantify metoprolol Key features of the assay were bull limit of quantitation (LOQ) = 1 ngmL bull linear range = 1 to 1000 ngmL bull Precision measured by CV () le 109 bull Accuracy measured by relative bias ranged from ndash 6 to + 13 Overall the assay performance was acceptable
224 Metoprolol exposure-response The exposure-response evaluation revealed that
bull There was no clear dose-response relationship for effectiveness (primary variable change in sitting SBP) in the target patient population using the planned analysis (Sponsorrsquos) but there was a dose-response for the secondary efficacy variable (Sponsorrsquos)
bull There was a dose-response relationship for effectiveness when group-specific placebo correction was employed (Reviewerrsquos)
bull The proposed initial dosage regimen and subsequent titration are supported by 1) Existence of an exposure-response relationship for Ctrough and AUC and SBP
reduction 2) Overall Toprol XL being more effective than placebo at reducing SBP and DBP 3) For a given dose maximal efficacy occurring between 1 and 4 weeks after
treatment initiation bull There was no clear dose-response relationship for safety
2241 Dose-Response Assessment using Primary Variable and Analyses
Sponsors Analyses Primary Variable The dose-response relationship for Study 307A is depicted in Figure 1 When pooled placebo data were used for correcting change in SBP the slope of the curve is not different form zero (p = 05371 for dose ratio) suggesting that there is no dose response By visual inspection it appears the lack of observed dose-response is mainly driven by a lower than expected response at the 20 mgkg level Patients assigned to the 10 mg and 20 mgkg dose received drug for only 2 weeks whereas dose in the 02 mgkg received the same dose for 4 weeks It is unclear if this difference in titration schedule influenced the outcome
Page 8 of 98
Clinical Pharmacology Review NDA 19-962 Toprol-XL 10182006
Figure 1 Dose response for placebo-corrected change from baseline to Week4LOCF for sitting SBP (ITT population)
Reviewerrsquos Analysis Primary Variable When group-specific placebo corrected data were used for correcting change in SBP there was a statistically significant dose-response (Figure 2) Figure 2 Placebo corrected changes in SBP (chg_pc) as a function of dose ratio (relative to 02 mgkg)
In this procedure data for subjects assigned to a given active group (eg 02 mgkg) were corrected with placebo data (02 mgkg) It should be noted that the group-specific placebo data appeared to follow a consistent trend where the placebo effect decreased with increasing number of tablets It is unclear if this titrationtablet-dependent placebo effect is valid or random Overall the apparent differential placebo effects suggest that the placebo group may have overly influenced the outcome of the dose-response analysis Two potential limitations of this Reviewerrsquos supplemental analyses are
1 Typically placebo effects are constant if randomization is appropriate thus it is unclear if sub-setting the placebo group is reasonable and did not increase bias
2 Additionally sub-setting the placebo group leads to a reduced number of placebo subjects per dose group that may decrease the robustness of the regression findings
Page 9 of 98
Clinical Pharmacology Review NDA 19-962 Toprol-XL 10182006
2242 Dose-Response Assessment using Secondary Variable and Analyses
Treatment Group Effects and Pairwise Comparisons for sitting SBP and DBP Key findings from the group and pair-wise comparisons are 1 All active groups produced statistically significant reductions from baseline (p lt 002) in
sitting SBP (|∆ SBP| gt 5 mmHg) and DBP (|∆ DBP| gt 3 mmHg) at the Week 4LOCF visit whereas placebo (p = 03133) did not
2 Overall the mean change from baseline in sitting SBP (|∆ SBP| = 4256) at Week 4LOCF for the TOPROL-XL groups pooled was statistically significantly larger (p=00351) than that for the placebo group
3 Pairwise comparisons between individual TOPROL-XL dose groups and placebo also revealed a statistically significant difference for the 10 and 20 mgkg groups (p=00270 and p=00492 respectively) the 02 mgkg group was not different from placebo
Sponsorrsquos Analyses Secondary variable A dose-response relationship was observed for the secondary efficacy variable (delta DBP) as depicted in Figure 3 Figure 3 Mean changes (actual and placebo-corrected) from baseline to Week 4LOCF for sitting DBP (ITT population)
2243 Dose-Response assessment based on subgroup analyses (per Sponsor) and time course
Subgroup Analyses The sponsor conducted several exploratory subgroup analyses however these analyses were not reviewed critically and are not presented in this review as
1 they do no impact the primary outcome or study objective 2 they are unlikely to be clinically useful due to the small number of patients per subgroup
However one potentially useful group analyses involved the percentage of responders as defined in Table 3 The responder analyses shows
1) greater percentage of responders in active dose group relative to placebo 2) comparable response rates for all active dose groups suggesting similar efficacy across
dose groups despite different exposure (doses)
Page 10 of 98
Clinical Pharmacology Review NDA 19-962 Toprol-XL 10182006
Table 3 Number and proportion of responders (ITT population)
Time course of effect (2- to 4-week treatment period) Consistent with findings from other studies with metoprolol and some beta-blockers apparent maximal reduction in blood pressure occurred between 1 and 4 weeks of treatment The mean changes over time in sitting SBP and DBP are depicted in Figure 4 Figure 4 Mean changes over time for sitting SBP and DBP (ITT population)
Data points in plot are from absolute values (not taking baseline into account) and subjects in 10 and 20 mgkg received drug after two weeks on 02 mgkg
2244 PKPD Assessments Overall there were statistically significant relationships between metoprolol exposure particularly AUC and SBP reduction as shown in Figure 5 Similar findings were observed for heart rate reduction Figure 6
Page 11 of 98
Clinical Pharmacology Review NDA 19-962 Toprol-XL 10182006
Change in SBP Figure 5 Change in SBP vs log (AUC) ndash per Sponsor Figure 6 Change in HR vs AUC
The population PKPD assessment evaluated the effect of PK exposure measures (AUC Cmax and Ctrough) on various PD measures (change in SBP change in DBP However only the AUC was considered reliably estimated It is noted that AUC is a derived measure that may not bear as direct a relationship as Ctrough (observed value) on a given PD measure However Ctrough is related to AUC particularly at steady-state The equation relating AUC to change in SBP was
E = E0 ndash 221 x m logAUC
Where E = change in SBP E0 = baseline SBP m = slope and AUC = area under plasma concentration-time curve
The regression analyses yielded the following p lt 005 for slope and R2 lt 01 The relatively low R2 value suggests that the SBP data were highly variable and changes in SBP could not be accounted for entirely by AUC (exposure) Nevertheless there is a relationship between effectiveness and AUC that indicates that increasing exposure potentially increases effectiveness this finding supports dose titration
Change in Heart Rate The change in heart rate was defined as follows (Reviewerrsquos regression analysis)
E = I ndash 221 x m logAUC Where E = change in HR I = intercept and m =and AUC are as previously defined
The regression analyses yielded the following p lt 001 for slope and R2 = 011 The heart rate findings support metoprololrsquos known activity as a beta blocker
Page 12 of 98
Clinical Pharmacology Review NDA 19-962 Toprol-XL 10182006
Reviewer Note PKPD modeling with various hemodynamic measures The modeling exercises indicated that there was no difference in the PKPD modeling results using different hemodynamic data formats such as change in the measurements percent change in the measurements or actual BP measurements
2245 Exposure-Safety Highlights (per Applicant) According to the applicant Toprol XL was generally well tolerated in the pediatric population and there did not appear to be a clear dose-dependent effect in terms of severity or frequency of adverse events (tabulated below)
2246 Acceptability of sponsorrsquos proposed regimen The proposed initial dosage 10 mgkg QD followed by titration according to clinical response appears reasonable based on the dose-response information time course of maximal effect and exposure-response (AUC and SBP reduction) information It is unclear if the proposed initial dose is optimal since a dose-response relationship was not established for the primary efficacy variable and response rates were comparable across dose groups One should note that the proposed initial pediatric dosage is within the range of usual adult initial dosage 25 ndash 100 mg (assuming 70 kg adult ~ 036 ndash 143 mgkg)
The major unresolved issues are bull Absence of a clear dose-response relationship for the primary efficacy variable bull Unknown maximal dose in mg for initial therapy and titrationmaintenance therapy bull Unknown optimal titration frequency
Although these major issues are not completely resolved information provided in the submission provides adequate information to support the proposed dosage In brief these limitations are addressed in part by adopting the following approaches
bull Therapy will be initiated at a dose that was more effective than placebo yet was not the highest dose thus providing a safety window
bull Initial dosage (dose in mg) will be limited to a dose that produces exposure that is likely to be effective but does not exceed the highest studied dose (200 mg)
bull Titration will be allowed at a frequency no greater than once a week which is consistent with data obtained (time to peak activity) and previous information form metoprolol and other beta-blockers used in hypertension treatments
Page 13 of 98
Clinical Pharmacology Review NDA 19-962 Toprol-XL 10182006
2247 PKPD comparisons Pediatric patients vs adults A priori PKPD relationships are expected to differ between adults and children because the two populations have different disease processes (secondary hypertension in children vs essential or primary hypertension in adults) Results of the pediatric modeling exercise showed that a log-linear model appeared to work better than other models for the relationship between SBP and DBP and exposure (AUC) In adults the Sigmoid Emax model has been successfully applied in PKPD modeling exercises It should be noted that the adult data were not reanalyzed for this review so it is unclear if log-linear or linear models would be adequate
As illustrated in Table 4 Toprol XL is effective in adults as well as in children and appears to be effective across a similar concentration range Table 4 PKPD Comparisons- Pediatric Patients vs Adults
Pediatric Patients Adults Population hypertensive Typically healthy Model Log-linear Sigmoid Emax PD Markers Placebo corrected SBP DBP changes
at trough bull Reduction in exercise heart rate (betashy
blockade measure) bull Placebo corrected SBP DBP changes at
trough EffectiveTherapeutic metoprolol concentrations
Most concentrations lt 107 ngmL bull EC50 = 105 nmolL (281 ngmL) bull Emax achieved at concentrations above 400
nmolL (107 ngmL) bull Range between 80 and 300 nM
Maximal mean BP Reduction at Studied Doses
bull SBP reduction -6 bull DBP reduction -5
bull SBP reduction -10 bull DBP reduction -4
Effectiveness of metoprolol relative to placebo
Generally more effective over the course of treatment
Generally more effective over the course of
Time course of effect Maximal effect observed within 1 to 4 weeks after initiation of therapy
Maximal effect observed within 1 to 4 weeks after initiation of therapy
Utility in Poor CYP2D6 metabolizers (PMs)
Not evaluated Poor metabolizers have a higher plasma concentration and a greater duration or degree of beta blockade thus PMs may not need extended release formulations
Proposed Initial Dosage 10 mgkg ~ 70 mg QD 25 to 100 mg QD
Overall it appears the studied pediatric doses produce comparable changes in diastolic pressure but lower changes in systolic pressure However in pediatric patients it is unlikely that the maximal possible activity was achieved at the doses studied thus conceivably pediatric patients can achieve maximal effects comparable to adults at optimized pediatric doses Three challenges in making definitive PKPD comparisons between the pediatric (studied in this NDA) and adult population are as follows
1 Study conditions differ- typically in adult studies HR is measured during exercise and not at rest
2 Results are obtained in healthy adult subjects rather than hypertensive patients 3 Insufficient numbers of studies have been reported in the literature that attempt to
identify the relationship between metoprolol exposure and SBP or DBP effect in adults
Page 14 of 98
10182006 Clinical Pharmacology Review NDA 19-962 Toprol-XL
225 Pharmacokinetic characteristics of metoprolol
2251 Metoprolol pharmacokinetics in pediatric patients Metoprolol PK parameters obtained from the population PK analyses are summarized in Table 5 Table 5 Metoprolol population PK parameter estimates (SE ) obtained using final population PK model
PK Parameter Value CLF (Lhr) 2275 ( 114 ) V2F (L) 961 (203 ) V3F (L) 620 (255 ) QF (Lh) 675 (204) Ka (hrndash1) 00467 (192 ) Tlag1 (hr) 0853 (297)
The data in Table 5 are derived from a 2-compartment linear PK model with first-order elimination and flip-flop first-order absorption and lag time
2252 Metoprolol pharmacokinetic comparisons pediatric patients vs adults PK Parameter Comparison Overall pediatric PK parameters obtained following administration of Toprol-XL are comparable (similar magnitude) to those in adults receiving IR metoprolol Potential limitations of the stated comparison and finding include the use of different modeling approaches populations number of samples and number of subjects in the trials (Table 6) Table 6 Comparative PK (children vs adults)
Source NDA 19962 Luzier et al Taguchi et al Plosker and Cissold and other sources
Model 2 Comp 1st Order absorption
1 Comp
Formulation Toprol XL IR IR IR Population Pediatric Hypertension Healthy adults Japanese geriatric Sampling Intense and Ctrough Intensive Sparse intensive CLF (Lhrkg) 338 116 ndash 340 094 -V2F (Lkg) 128 270 ndash 398 452 -V3F 851 333 ndash 809 - -QF (Lhr) 899 282 ndash 694 - -T12 (h) 351 - - 3 - 6 Covariate Effects Based on CLF Age None - Yes YesNo Gender Effect None Yes - -Race None - - - The applicant noted that pediatric data were compared to adult data from IR where CLF is dominated by the disposition function of metoprolol therefore it may be complicated to compare adult data to pediatric data (Toprol XL) where CLF is under a considerable influence from the release rate (input function) of the device This appears to be a valid caveat Using AUC and dosing information (Table 8) adult CLF for Toprol-XL ~ 17 ndash 25 Lhrkg
Exposure Comparison Following administration of Toprol XL at comparable doses in mg pediatric patients and adults generally had similar metoprolol exposure Adult data from literature and archived clinical pharmacology and biopharmaceutics reviews are presented in Table 8 and pediatric data from
Page 15 of 98
Clinical Pharmacology Review NDA 19-962 Toprol-XL 10182006
population PK modeling (Study 307A) are presented in Table 7 The main limitations of the cross-population comparison is the pediatric doses are over the 125 to 200 mg dose range whereas adult data is for specific doses However reasonable comparisons can be made at the 100 mg dose level assuming the meanmedian values in pediatric patients offer an acceptable approximation of exposure values and are representative of the central tendency of the data In this case the adult and pediatric data have comparable
1 exposure at 100 mg 2 degree of variability
Table 7 Bayesian estimates of metoprolol PK exposure for those patients included in the PKPD analysis (N=65)
includes only data where concentration gt LOQ
Table 8 Metoprolol exposure in adults following administration of Toprol XL
Cmax Cmin AUC Literature References 50 179 ndash 190 86 ndash 104 286 - 351 100 96 ndash 759 107 ndash 305 533 - 1192 200 778 ndash 1139 310 ndash 447 1392 - 1892 FDA Archived Information 50 179 plusmn 182 85 plusmn 138 286 plusmn 346 100 544 plusmn 436 226 plusmn 234 827 plusmn 766
2253 Inter and intra-subject variability in metoprolol pharmacokinetic Based on the values of the standard error () associated with PK parameters (Table 5) metoprolol PK exhibited low variability (SE lt 30) However this estimate may not be reliable (under predicted) because concentrations lt LOQ were not included in the analysis Several subjects particularly those receiving 02 mgkg had concentrations lt LOQ In adults exposure is highly variable (CV gt 70 ) as reflected in exposure estimates and wide exposure ranges Table 8
Potential sources of variability following metoprolol administration (Toprol XL) in children include regio-selective absorption incomplete gastric emptying variable gastric motility varying metabolic activity (CYP2D6) and inconsistent absorption Some of these factors are also applicable to adults
23 What Intrinsic Factors Affect Metoprolol Exposure-Response
Based on the population pharmacokinetic model weight was the only potentially clinically meaningful intrinsic factor that affected metoprolol exposure and hence response Other intrinsic
Page 16 of 98
Clinical Pharmacology Review NDA 19-962 Toprol-XL 10182006
factors such as age height gender race and sex did not affect metoprolol exposure
231 Effect of weight The effect of weight on metoprolol CLF are illustrated in Figure 7 Figure 7 Variation of CLF with weight obtained in population PK analysis
CLF increased linearly with body weight relative to a 70 kg individual the CL of a 22 kg individual is 30 lower This decreased CL will result in an increased exposure (maximum 30 ) that does not pose additional safety concerns or appear clinically significant (tolerated in studies) It should be noted that exposure (AUC) accounted for an insignificant portion of the hemodynamic effect (poor correlation) thus the clinical implications of the impact of body weight on CLF of metoprolol identified in the population PK modeling are limited Consequently dose adjustment is not required based on body weight Furthermore the maximum initial dose is 50 mg thus subjects with weight gt 50 kg will receive a maximum dose of 50 mg diminishing the impact if any of weight-dependent clearance
232 Effect of Age The effect of age on QF the inter-compartmental clearance is illustrated in Figure 8 Figure 8 Variation of QF with age obtained in population PK analysis
Page 17 of 98
Clinical Pharmacology Review NDA 19-962 Toprol-XL 10182006
QF does not contribute significantly to overall clearance therefore the reported finding does not appear clinically relevant It should be noted that the observed QF-age relationship is atypical
233 Effect of intrinsic factors on exposure-response pediatrics vs adults As mentioned previously the only evaluated intrinsic factor that affected metoprolol exposure was body weight In adults age and gender effects have been reported although there are conflicting reports on the age effect The exposure in adult and pediatric population are both potentially affected by the CYP2D6 metabolizing status of the subject Metoprolol is metabolized primarily in the liver by CYP2D6 The scientific literature reports several instances in adults of varying metoprolol exposure by poor and extensive CYP 2D6 metabolizers In the pediatric studies (307A and 307B) there was one suspected poor metabolizer (Trough concentration was 2330 ngmL) but the metabolic status (PM or EM) of this individual was not confirmed
24 What extrinsic factors affect metoprolol exposure-response
The role of extrinsic factors were not specifically evaluated in the pediatric population however one anticipates that extrinsic factors that affect adults should be applicable to children
25 What analytical method was used in pediatric studies 307 A and 307B
Please refer to section 223
Page 18 of 98
Clinical Pharmacology Review NDA 19-962 Toprol-XL 10182006
(b) (4)
TOPROL-XL is not recommended in pediatric patients lt 6 years of age (see CLINICAL PHARMACOLOGY Pharmacokinetics and PRECAUTIONS Pediatric Use)
Page 21 of 98
Clinical Pharmacology Review NDA 19-962 Toprol-XL 10182006
4 APPENDICES
41 Sponsorrsquos Proposed Label
17 Page(s) of Draft Labeling has been Withheld in Full as B4 (CCITS) immediately following this page
Page 22 of 98
Clinical Pharmacology Review NDA 19-962 Toprol-XL 10182006
42 Pharmacometrics Review
Page 40 of 98
Clinical Pharmacology Review NDA 19-962 Toprol-XL 10182006
Office of Clinical Pharmacology Pharmacometrics Review
NDAIND 19-962 Volume Not applicable submitted electronically POP PK Report in Section 5335 (Network Path Cdsesub1n19962N_0002006-05-15hpbiohupharm) Compound Metoprolol succinate Submission Dates 05152006 Sponsor Astra Zeneca Pharmacometrics Reviewer Robert Kumi PhD Secondary Reviewer Yaning Wang PhD
TABLE OF CONTENTS
OFICE OF CLINICAL PHARMACOLOGY PHARMACOMETRICS REVIEW 41
EXECUTIVE SUMMARY 42
OVERALL CONCLUSIONS 43
INTRODUCTION 46
OBJECTIVES OF THE ANALYSIS 48
DOSE-RESPONSE ANALYSIS 49
METHODS (POPULATION PKPD) 60
RESULTS AND DISCUSSION 73
RECOMMENDATIONS 87
APPENDIX 90
DCP1PM Page 41 10182006
Clinical Pharmacology Review NDA 19-962 Toprol-XL 10182006
Executive Summary In NDA SE5 033 the applicant Astra Zeneca has proposed changes to the currently approved labeling for TOPROL-XL metoprolol succinate extended release
(b) (4)
tablets Metoprolol a beta blocker is approved for hypertension angina and heart failure in adults In adults with hypertension the usual initial dosage is 25 to 100 mg daily (single dose) as monotherapy or in combination with a diuretic this dosage is titrated at weekly intervals until optimum blood pressure reduction is achieved The current application focuses on Toprol-XL use in pediatric patients ge six years old The initial proposed dosing in children six and older is 10 mgkg subsequently the dose is titrated based on clinical response
Two clinical trials Studies 307A (dose-response) and 307B (safety extension of 307A) were conducted in pediatric patients with hypertension to support the proposed labeling changes The applicant conducted dose-response population PK (n = 120 patients) and PKPD (n = 65 patients) analyses using data from pediatric hypertensive patients receiving Toprol-XL in the mentioned studies
Key Findings from the Dose-Response and Population PKPD analyses follow 1 Dose-Response A statistically significant dose-response did not exist for placebo
(pooled)ndashcorrected ∆SBP from baseline however the relationship was evident when placebo (specific-group) ndashcorrected data were used
2 PK Model Metoprolol PK in children were well characterized by a 2shycompartment model with flip-flop first-order absorption and an absorption lag time The model yielded precise parameter estimates
3 Covariates Sex age race body weight and Toprol-XL dose had no clinically significant effect on metoprolol PK
4 PKPD Model Using a log-linear model or linear model there were weak but statistically significant relationships between the changes in DBP and SBP and measures of metoprolol plasma exposure (Ctrough AUC0ndash24 and Cmax) Overall parameters were not precisely estimated in most models due to a high degree of variability in the blood pressure data
DCP1PM Page 42 10182006
Clinical Pharmacology Review NDA 19-962 Toprol-XL 10182006
Overall Conclusions 1 Were metoprolol PK adequately characterized in the pediatric population Metoprolol PK in pediatric patients (n = 120 Age 6 to 17) were adequately characterized using a population pharmacokinetic approach The population model was validated and qualified and comprised a 2-compartment open model with first order absorption and absorption lag time
2 Are there any covariates that influence metoprolol PK in pediatric patients with hypertension The two covariates that influenced metoprolol PK were weight and age apparent oral clearance increased linearly with body weight and inter-compartmental clearance increased with age according to a power function Other covariates including race sex and metoprolol dose did not impact metoprolol kinetics
3 Was a PKPD relationship established between metoprolol dose or plasma exposure( AUC Ctrough or Cmax) and hemodynamic measures (blood pressure) Using a simple linear regression model no dose-response (reduction in placebo corrected systolic blood pressure the primary outcome variable) was observed although a weak (R2 lt 01) but statistically significant (p lt 005) PKPD relationship was observed between metoprolol exposure measures and reduction in systolic blood pressure The small R2 value indicates metoprolol exposure could account for only a small portion of the hemodynamic effect According to the model as exposure increased there was greater reduction in blood pressure However only the relationship with AUC was considered reliable as AUC was estimated with good precision (PK modeling) whereas Cmax was not
4 Is there sufficient evidence to support effectiveness of Toprol XL in pediatrics and the initial proposed pediatric dosage Yes Although dose-response was not established with SBP reduction (primary variable) suggesting that the effectiveness of the individual tested Toprol-XL doses could not be differentiated the following information provides evidence to suggest that some Toprol-XL doses were more effective than placebo
bull Analysis of treatment group effects and pairwise comparisons suggested that overall Toprol-XL demonstrated effectiveness in pediatric patients with hypertension pooled Toprol groups vs placebo (p = 00351) and relative to baseline each active Toprol-XL dose group decreased SBP whereas placebo did not
bull There was a dose-response relationship for reduction in diastolic blood pressure typically systolic and diastolic blood pressure effects mirror each other
bull PKPD findings (reduction in SBP and heart rate as a function of AUC) support metoprolol effectiveness (increased exposure led to increased effectiveness) The heart rate effect supports metoprololrsquos known beta blocking activity
bull Generally Toprol-XL was effective in pediatric patients and adult patients at similar metoprolol exposure levels 02 mgkg in pediatrics was minimally effective because this dose yielded exposures lower than that obtained in adults at the lowest effect adult dose 25 mg
DCP1PM Page 43 10182006
Clinical Pharmacology Review NDA 19-962 Toprol-XL 10182006
bull The proposed pediatric dosage 10 mgkg is supported by the results from the dose-response study Visual inspection and pairwise comparisons indicated that 10 mgkg (placebo corrected) was statistically the most effective dose (greater efficacy than 02 mgkg and 20 mgkg) and was more effective than placebo (p = 0027)
5 Will initial dosage adjustment be required for any pediatric patients prior to titration No dosage adjustment does not appear necessary prior to titration (typically one week after treatment begins) Based on the population PK model the only potentially relevant factor that could affect PK was body weight CLF increased linearly with body weight relative to a 70 kg individual the CL of a 22 kg individual is 30 lower This decreased CL will result in an increased exposure (maximum 30 ) that does not pose additional safety concerns or appear clinically significant (tolerated in studies) The proposed starting dose 10 mgkg and doses up to 20 mgkg (maximum 200 mg) were tolerated in the clinical trials (307A and 307B) Furthermore exposure accounted for an insignificant portion of the hemodynamic effect (poor correlation) thus the clinical implications of the impact of body weight on CLF of metoprolol identified in the population PK modeling are limited
to a higher and tolerable dose until optimum BP reduction is achieved is reasonable This
(b) (4)The proposal to start Toprol-XL at a low dose and titrate
is consistent with labeling for adults
6 Was the PKPD relationship influenced by covariates Insufficient data were available to make this assessment
7 Are the PK and PKPD of metoprolol in children comparable to that in adults PK values obtained in pediatric patients were generally in the same range as those reported in adults Potential limitations of the comparison are the different modeling approaches populations number of samples and number of subjects in the trials (Table B)
It is difficult to make definitive PKPD comparisons between the pediatric (studied in this NDA) and adult population because
1 Study conditions differ- typically in adult studies HR is measured during exercise and not at rest
2 Results are obtained in healthy adult subjects rather than hypertensive patients 3 Insufficient number of studies have been reported in the literature that attempt to
identify the relationship between metoprolol exposure and SBP or DBP effect in adults
DCP1PM Page 44 10182006
Clinical Pharmacology Review NDA 19-962 Toprol-XL 10182006
Table B PK Comparisons (Pediatrics vs Adults) Source NDA 19962 Luzier et al Taguchi et al Plosker and Cissold
and other sources Model 2 Comp 1st
Order absorption 1 Comp
Formulation Toprol XL IR IR PK Analyses Population StandardNCA Population Standard Population Pediatric Healthy adults Japanese geriatric Sampling Intense and
Ctrough Intensive Sparse intensive
CLF (Lhrkg) 338 116 ndash 340 094 V2F (Lkg) 128 270 ndash 398 452 V3F 851 333 ndash 809 QF (Lhr) 899 282 ndash 694 Ka (h-1) 00467 Tlag (h) 0853 T12 (h) 351 3 - 6 Tmax (h) 25 ndash 73 Covariate Effects on CLF Age None Yes YesNo Gender Effect None Yes Race None The applicant noted that pediatric data were compared to adult data from IR where CLF is dominated by the disposition function of metoprolol therefore it may be complicated to compare adult data to pediatric data (Toprol XL) where CLF is under a considerable influence from the release rate (input function) of the device This appears to be a valid caveat
It should be noted that the cause of hypertension in adults differs from that in children Results of the pediatric modeling exercise showed that a log-linear model appeared to work better than other models for both SBP and DBP In adults the Sigmoidal Emax model has been successfully applied Using the Hill Equation (Sigmoidal Emax model) with EHR reduction (measure of beta blockade) as the PD marker in adults EC50 = 105 nmolL (281 ngmL) and Emax is achieved at metoprolol plasma concentrations gt 400 nmolL (107 ngmL) Placebo-corrected mean blood pressure changes (standing) associated with concentrations producing maximal blockade are -10 for systolic and ndash 4 for diastolic In the pediatric study the observed maximal mean reductions (placebo corrected) at the studied doses were approximately -6 for systolic and -5 for diastolic Hence it appears the studied pediatric doses produce comparable changes in diastolic pressure but lower changes in systolic pressure It should be noted that in the pediatric studies only a few metoprolol plasma concentrations were gt than 107 ngmL It is unlikely that the maximal activity was achieved at the doses studied yet the Toprol doses appeared effective The differential maximal effects may also be due to the difference in initial SBP (adults patients with hypertension tend to have higher initial BPs) in adult and pediatric studies there was a dependence of change in SBP on initial SBP
DCP1PM Page 45 10182006
Clinical Pharmacology Review NDA 19-962 Toprol-XL 10182006
Introduction Summary
(b) (4)NDA SE5 033 was submitted to seek approval of labeling changes to the currently approved labeling for TOPROL-XL This labeling translates to a new Toprol-XL indication for pediatric patients (6 years and older) with hypertension
Background on Metoprolol in Hypertension The majority of the following information was obtained form a Review article (sponsor provided) by Plosker and Clissold [Drugs 43(3) 382-414 1992)]
Table 1 Snapshot of Metoprolol Clinical Pharmacology and Biopharmaceutics Drug Class Metoprolol is a szlig1-selective (cardio selective) adrenergic receptor-
blocking agent Mechanism of Action (antihypertensive effect)
Multiple putative mechanisms competitive antagonism of catecholamine at peripheral sites reduction of sympathetic outflow to the periphery or suppression of renin activity
Approved Indications Hypertension Heart Failure and Angina Pectoris Approved Formulations Immediate Release (IR) ndash metoprolol tartrate
Controlled Release (CRZ0K) Toprol-XL is extended-release tablet of metoprolol as the succinate salt
Metabolism Via CYP2D6 primarily Absorption Absolute oral bioavailability ~ 50 following IR Food does not affect
metoprolol absorption using ER formulation Distribution Protein binding to albumin is about 12 Elimination For IR t12 from 3 ndash 7 hours Less than 5 dose excreted unchanged
in urine No t12 values for ER this may be due to difficulty in separating absorption and elimination phases
Variability Plasma levels are highly variable among subjects after oral administration
Age Effects PK of metoprolol not affected by age (20 to 65 years) but concentration of active metabolite in subjects gt 65 years about twice as high as those in younger although metoprolol concentrations similar in two groups (Regardh et al)
PKPD in children Limited information in children and provided mainly after administration of metoprolol tartrate
Summarized PK and PKPD Information in Adults Table 2 Reported PK Values in Adults (multiple references)
References include Abrahamsson et al Sandberg et al Wieselgren et al
DCP1PM Page 46 10182006
Clinical Pharmacology Review NDA 19-962 Toprol-XL 10182006
Table 3 PKPD Information Reference Key Findings Abrahamsson et al Therapeutic level of szlig1blockade (model- reduction in exercise heart
rate or EHR) is between 80 and 300 nM Sandberg et al Toprol XL is designed to deliver metoprolol succinate at a near
constant rate for about 20 hr Wieselgren et al In healthy males maximal EHR ~ 14 and minimum reduction ~ 9
with 50 mg Activity greater than placebo over 24 hour period Dayer et al Lennard et al Jonkers et al
Poor metabolizers have a higher plasma concentration and a greater duration or degree of beta blockade Potential implications for use of extended release as may not be needed in PMs
Various sources Toprol XL produces clinically and statistically significant reductions in blood pressure values compared to baseline values The maximal blood pressure lowering effect for a given dose in adults is observed between 1 and 4 weeks of treatment In 4 week trials with Toprol XL the maximum decrease in supine BP was 209 and standing was 129 (unclear if at trough) At trough following 4 weeks of 50 mg QD Toprol XL relative to placebo the reduction in supine BP was 112 and 103 in Standing
Summary of sponsorrsquos current analysis relevant to pharmacometrics and resulting claims
Dose-Response Analysis A dose-response analysis was conducted using a simple linear regression model where metoprolol dose in mgkg was the independent variable Week 4 placebo corrected change in blood pressure (diastolic or systolic) from baseline was the dependent variable (response)
Sponsorrsquos Analysis Claims (Dose-Response Study) Following administration of TOPROL-XL at doses of 125 to 200 mg once daily for up to 4 weeks metoprolol
bull Exhibited a significant dose-response relationship for DBP but none for SBP bull Produced statistically significant and clinically meaningful reductions in SBP and
DBP for some individual andor pooled target dose groups (02 10 and 20 mgkg)
Population PK and PKPD Analyses The sponsorrsquos population PK and PKPD analyses involved the use of typical population PK approaches Primarily SAS and NONMEM were used to run the analyses In brief the sponsor pooled plasma concentration time data from patients in Study 307A (trough samples) and 307B (trough samples in most subjects and serial samples in a subset of patients) for the PK modeling PKPD (PD measured primarily as changes in blood pressure) data were from patients in Study 307A These collective data were used in the population PK and PKPD analyses
Initially the sponsor identified the best PK structural population model by testing several pharmacokinetic models This model was further refined by eliminating error terms (etas) that were not statistically significant Subsequently the sponsor evaluated the effect of DCP1PM Page 47 10182006
Clinical Pharmacology Review NDA 19-962 Toprol-XL 10182006
covariates on the PK model and developed a final PK model The goodness of the fit of the model was assessed with standard procedures The final population model was used to simulate individual plasma concentration-time profiles and Bayesian estimates for Cmax and AUC for all patients These simulated AUC and Cmax values and actual (observed) Ctrough were used in the PKPD model The PKPD model was developed in a similar manner as the population PK model Initially the best PKPD base model was identified and the model refined until a final PKPD model was identified
Sponsorrsquos Analysis Claims (Population PK and PD Modeling) 1 A 2-compartment PK model with first-order elimination and flip-flop first-order
absorption and lag time best fit metoprolol concentration-time data obtained from the studied pediatric hypertensive patients
2 The following tabulated parameter estimates were obtained using the final population PK model CLF 2275 Lhr V2F 961 L V3F 620 L QF 675 Lh Ka 00467 hrndash1 Tlag1 0853 hr
These PK values were generally in the same range as those reported in adults
3 Sex race ideal body weight and Toprol-XL dose have no significant effect on metoprolol pharmacokinetics No covariate impacts V2F V3F Ka or the Tlag of metoprolol Age has no effect on metoprolol CLF and body weight has no effect on QF Metoprolol CLF increases linearly with body weight however no dose adjustment based upon body weight is necessary because dosage is titrated based on clinical response QF is proportional to age however the increase in QF with age is not clinically relevant
4 Weak but statistically significant relationships existed between DBP SBP and HR and some measures of metoprolol exposure (trough plasma levels Cmax and AUC(0ndash 24)) Because of high variability in the hemodynamic data goodness-of-fit of the PKPD models was generally poor and the resulting parameter estimates were not considered reliable Extrapolation of these model parameters in the clinic for dose adjustment is not recommended
5 No covariates had an impact on the parameters delineating the PKPD relationship between metoprolol exposure and DBP SBP and HR
Objectives of the analysis There are three specific goals of the PM analysis
1 To evaluate the adequacy of the sponsorrsquos dose-response analysis 2 To evaluate sponsorrsquos population PK analysis and determine if PK labeling claims
are acceptable DCP1PM Page 48 10182006
Clinical Pharmacology Review NDA 19-962 Toprol-XL 10182006
3 To evaluate sponsorrsquos population PKPD analyses and determine if the findings support the proposed dosing recommendation
Dose Response Analysis (Study 307A) Title Dose Ranging Safety and Tolerability of TOPROL-XLreg
(metoprolol succinate) Extended-release Tablets (metoprolol CRXL) in Hypertensive Pediatric Subjects A Multicenter Double-blind Placebo-controlled Randomized Parallel-group Study
Study Duration 30 May 2002 - 9 June 2004 Investigators (primary) Bonita E Falkner MD and Jonathan Sorof MD 1800 Sites Multiple locations (36 in US and 1 in Dominican Republic)
Table 1 Objectives and Outcomes for Study 307A
Study Design (FDA-approved Type A design) This was a multi-center international double-blind placebo-controlled randomized parallel-group study The study included a screening visit a 1- to 2-week single-blind placebo run-in period during which all previous antihypertensive medications were discontinued and a 4-week double-blind treatment period At the end of the placebo run-in period eligible patients with blood pressure (BP) measurements in the qualifying range were randomized in a 1212 ratio to receive once daily oral doses of placebo TOPROL-XL 02 mgkg TOPROL-XL 10 mgkg or TOPROL-XL 20 mgkg TOPROL-XL doses of 125 25 375 50 75 100 150 or 200 mg were used to approximate the target doses Patients in the placebo and TOPROL-XL 02 mgkg groups received the target dose for 4 weeks while patients in the TOPROL-XL 10 mgkg and
DCP1PM Page 49 10182006
Clinical Pharmacology Review NDA 19-962 Toprol-XL 10182006
20 mgkg groups had their dose up-titrated (based on weight) to the target dose over the first 1 to 2 weeks of double-blind treatment
Reviewer Note Rationale on Study design The inclusion of more patients in the TOPROL-XL 02 mgkg and 20 mgkg groups allowed better estimation of the dose response at the low and high ends of the dose range The TOPROL-XL 10 mgkg group with fewer patients provided a middle estimate that helped to describe the shape of the dose-response curve However having a fewer number of subjects may have contributed to variability Inclusion of a placebo control group allowed for the quantification of treatment-related BP reductions after adjusting for placebo effect It should be noted that the placebo groups were not identical as they followed different titration schedules and had a different number of tablets
The 02 mgkg dose is lower than the lowest approved adult dose on a mgkg basis (assuming 70 kg adult weight) but the highest studied pediatric dose 20 mgkg (200 mg limit was placed) is lower than the highest studied adult dosage 400 mg
Table 2 Toprol Dosing Scheme for Study 307A
Table 3 Formulations used in 307A
DCP1PM Page 50 10182006
Clinical Pharmacology Review NDA 19-962 Toprol-XL 10182006
SPONSORrsquoS STATISTICAL ANALYSIS PLAN HIGHLIGHTS bull The primary analysis used an intention-to-treat (ITT) population which included
all patients who received at least 1 dose of study medication and had baseline and at least 1 post baseline measurement For this analysis missing data were imputed using a last observation carried forward (LOCF) approach
bull A simple linear regression analysis was performed on the placebo-corrected change from baseline to Week 4LOCF in sitting SBP and sitting DBP with dose ratio as the explanatory variable
bull The placebo correction for placebo-corrected changes from baseline to Week 4 LOCF in sitting SBP and sitting DBP was performed by subtracting the mean change from baseline for the placebo group from the individual patient changes in the other treatment groups
bull ANOVA was performed with treatment group as the main factor for the changes from baseline to each post baseline visit in sitting SBP and DBP This ANOVA model was used to construct pairwise comparisons of each active treatment versus placebo and the active treatment groups combined versus placebo
bull The percentage of responders at Week 4 was summarized by frequency counts percentages and 95 confidence intervals (CI) for each treatment group
bull Subgroup analyses were also performed on the changes from baseline at Week 4 in sitting SBP and DBP and the influence of heart rate and baseline body mass index (BMI) on the mean changes from baseline to Week 4LOCF in sitting SBP and DBP were examined using linear regressions
bull Trough plasma concentrations of metoprolol were summarized descriptively and the lower limit of quantitation (LLQ) was 1 ngmL
bull Safety data were summarized using the safety population defined as all patients who received at least 1 dose of study medication and were not lost to follow-up No statistical analyses were performed on the safety data in this study
DCP1PM Page 51 10182006
Clinical Pharmacology Review NDA 19-962 Toprol-XL 10182006
Results Patient Disposition Per applicant patients recruited into this study were representative of a pediatric population with hypertension The four treatment groups were balanced with respect to demographic and baseline characteristics (Tables 4 and 5) About 80 percent of the patients were considered 90 compliant
Table 4 Baseline Characteristics in Study 307A
Table 5 Sitting SBP and DBP measurements at baseline
Sitting and standing BP measurement were comparable (eg mean SBP for all patients- sitting = 1319 and standing 1306 with similar CVs ~ 9 )
Primary Efficacy Variable The results for the primary efficacy variable are illustrated in Figure 1 Figure Dose response for placebo-corrected change from baseline to Week4LOCF for sitting SBP (ITT population)
DCP1PM Page 52 10182006
Clinical Pharmacology Review NDA 19-962 Toprol-XL 10182006
Figure 1 Change in SBP from baseline as a function of Toprol XL dose
Table 6 Linear regressions statistics used to assess Dose-Response
The results indicate that bull The slope of the curve is not different form zero (p = 05371 for dose ratio)
suggesting that there is no dose-response relationship bull Most active treatment groups are more effective than placebo in reducing SBP
By visual inspection it appears the lack of observed dose-response is mainly driven by a lower than expected response at the 20 mgkg level
Potential issues affecting efficacy and pharmacokinetic results bull LOCF was required for eight patients however the LOCF approach did not
greatly impact the outcome of the trial bull Patients assigned to the 10 mg and 20 mgkg dose received drug for only 2
weeks whereas dose in the 02 mgkg received the same dose for 4 weeks
DCP1PM Page 53 10182006
Clinical Pharmacology Review NDA 19-962 Toprol-XL 10182006
Reviewerrsquos Supplemental Dose-Response Analyses The sponsorrsquos dose-response analysis was successfully reproduced by this Reviewer using pooled placebo corrected data A supplemental analysis was conducted using group-specific placebo corrected data In this procedure data for subjects assigned to a given Active Group (eg 02 mgkg) were corrected with Placebo data (02 mgkg) Group specific placebo data are presented in Table 7
Table 7 Placebo-group specific data Placebo Group Frequency Delta SBP 02 mgkg 8 -567 10 mgkg 6 -300 20 mgkg 9 230
It should be noted that the group-specific placebo data appeared to follow a consistent trend where the placebo effect decreased with increasing number of tablets It is unclear if this titrationtablet-dependent placebo effect is valid or random Overall the apparent differential placebo effects suggest that the placebo group may have overly influenced the outcome of the dose-response analysis
When active groups are corrected using group-matched placebo data there is a statistically significant dose-response The dose response using group-specific placebo data is illustrated in Table 8 and Figure 2
Figure 2 Placebo corrected changes in SBP (chg_pc on y axis) as a function of dose ratio
Potential Limitations of Supplemental Analyses Typically placebo effects are constant if randomization is correct thus it is unclear if subsetting the placebo group is acceptable and did not increase bias Additionally subsetting the placebo group leads to a reduced number of placebo subjects per dose group that may impact the regression analyses
DCP1PM Page 54 10182006
Clinical Pharmacology Review NDA 19-962 Toprol-XL 10182006
Table 8 SAS output for regression analyses using group-specific placebo corrections The REG Procedure
Model MODEL1
Dependent Variable chg_pc
Number of Observations Read 117
Number of Observations Used 117
Analysis of Variance
Sum of Mean
Source DF Squares Square F Value Pr gt F
Model 1 191083177 191083177 2663 lt0001
Error 115 825109481 7174865
Corrected Total 116 10162
Root MSE 847046 R-Square 01880
Dependent Mean -430358 Adj R-Sq 01810
Coeff Var -19682365
Parameter Estimates
Parameter Standard
Variable Label DF Estimate Error t Value Pr gt |t|
Intercept Intercept 1 125480 133166 094 03480
DOSRATIO Dose Ratio 1 -100051 019387 -516 lt0001
Secondary variables
bull Placebo-corrected change from baseline in sitting DBP The mean plusmn SD change (Week 4LOCF) in sitting DBP is illustrated in Figure 3 and Table 9
Figure 3 Mean changes (actual and placebo-corrected) from baseline to Week 4LOCF for sitting DBP (ITT population)
DCP1PM Page 55 10182006
Clinical Pharmacology Review NDA 19-962 Toprol-XL 10182006
Table 9 SAS output for regression analyses for DBP with pooled placebo correction
Treatment group effects and pairwise comparisons for sitting SBP and DBP Results of the treatment group effects at the Week 4LOCF visit and the pairwise comparisons between each TOPROL-XL group and placebo for the change from baseline in sitting SBP and DBP are shown for the ITT population in Table 10
Table 10 Treatment group effects for change in baseline to Week 4LOCF for sitting SBP and DBP (ITT population)
Some key findings from the pair-wise comparison are as follows (Table 10) 1 All active groups produced statistically significant reductions from baseline in sitting
SBP and DBP at the Week 4LOCF visit whereas placebo did not
DCP1PM Page 56 10182006
Clinical Pharmacology Review NDA 19-962 Toprol-XL 10182006
2 Overall the mean change from baseline in sitting SBP at Week 4LOCF for the TOPROL-XL groups pooled was statistically significantly larger than that for the placebo group (p=00351)
3 Results of pairwise comparisons between individual TOPROL-XL dose groups and placebo also revealed a statistically significant difference for the 10 and 20 mgkg groups (p=00270 and p=00492 respectively)
bull Mean changes over time in sitting SBP and DBP Consistent with findings from other studies with beta-blockers apparent maximal reduction in blood pressure occurred between 1 and 4 weeks of treatment
Figure 4 Mean changes over time for sitting SBP and DBP (ITT population)
Data points in plot are from absolute values (not taking baseline into account)
Subgroup Analyses The sponsor conducted several exploratory subgroup analyses however these analyses were not reviewed critically and are not presented in this review as
1 they do no impact the primary outcome or study objective 2 they are unlikely to be clinically useful due to the small number of patients per
subgroup One potentially useful some group analyses involved the percentage of responders as defined in Table 11
The responder analyses shows comparable response rates for all active dose groups suggesting similar efficacy across dose groups despite different exposure (doses)
DCP1PM Page 57 10182006
Clinical Pharmacology Review NDA 19-962 Toprol-XL 10182006
Table 11 Number and proportion of responders (ITT population)
Pharmacokinetic Results The Ctrough information obtained in the trial are summarized in Figure 6 and Tables 12 and 13
Table 12 Summary of Ctrough data (per applicant)
Sixteen patients across the 3 TOPROL-XL groups did not have blood samples obtained for analysis of metoprolol concentrations Based on the number of samples BLQ there appeared to be very low concentrations in the lowest dose group It appeared that Ctrough increased with dose According to the applicant these values are similar to those obtained previously in adults especially at the 2 higher doses Variability was high in all treatment groups (CV gt 60 )
Table 12 Summary of Ctrough (Reviewer Generated) from all patients (samples lt LOQ given value = 0) Toprol XL Dose Number of subjects Concentration (ngmL) (mgkg) Mean plusmn SD Median Range 02 39 137 plusmn 294 000 0 ndash 157 10 17 1224 plusmn 1416 845 0 ndash 571 20 46 2462 plusmn 3352 1140 0 ndash 1670
DCP1PM Page 58 10182006
Clinical Pharmacology Review NDA 19-962 Toprol-XL 10182006
Reviewer Note Overall the plasma concentrations (exposure) for the 02 mgkg dose group appear too low to be effective (close to LOQ) It is noted that adults typically have concentrations gt LOQ at the lowest therapeutic dose 25 mg (~ 4 ngmL)
Figure 6 Boxplot of metoprolol Ctrough using samples gt LLQ (per applicant)
Safety Results According to the applicant Toprol XL was well tolerated in the pediatric population as tabulated below
Main Analyses Conclusions bull No dose response was observed for corrected SBP using pooled placebo data
however using group-matched placebo data demonstrated a dose response bull Ctrough increased with dose bull Toprol 10 and 20 mg kg doses were more effective than placebo in reducing
SBP bull The responder rate was comparable across all active dose groups and this rate was
greater than that of placebo
DCP1PM Page 59 10182006
Clinical Pharmacology Review NDA 19-962 Toprol-XL 10182006
Methods Reviewerrsquos Methods Generally this reviewer conducted the analyses in a manner similar to that of the sponsor to confirm the sponsorrsquos findings
Sponsorrsquos Methods
Design Study1 307A
Reviewer Note This study was described in the Dose-Response Assessment (please refer to Page 7 Dose Response Analyses) Consequently only highlights relevant to the population analyses will be included in this section
Study 307A was a 4-week multi-center double-blind placebo-controlled randomized parallel-group study TOPROL-XL (metoprolol succinate) extended-release tablets were given to hypertensive pediatric patients Patients were randomized to double-treatment with a once daily oral dose of placebo or Toprol-XL at 1 of 3 target doses 02 or 20 mgkg The dose range for this study was 125 to 200 mg daily Patients on placebo followed the same schedule as that for their active group comparators
Study Flow Chart
Key Inclusion Criteria School age and adolescent children with reproducible SBP or DBP at or above the 95th percentile using height-adjusted charts for age and weight were eligible
DCP1PM Page 60 10182006
Clinical Pharmacology Review NDA 19-962 Toprol-XL 10182006
Study2 307B
Study 307B was a 52-week multi-center open-label study to determine the safety and pharmacokinetics of TOPROL-XL (metoprolol succinate) extended-release tablets (metoprolol CRXL) in hypertensive pediatric patients The starting dose was 25 mg daily The dose was increased every 2 weeks in increments of 25 mg or 50 mg based on tolerability until BP was controlled or the dose reached 200 mg
Table 1 Study Assessments
At the end of the 52-treatment period all patients had BP measured and a trough plasma level taken 24 hours the last dose of Toprol-XL with the exception of those patients who completed the serial portion at the final visit Among the participants a subgroup of approximately 30 patients was to participate in PK assessments of metoprolol requiring serial blood sampling at any time during the 52 weeks A single dose of 25 mg of Toprol-XL was given orally to those participating patients after a 48-hour washout period After the PK assessments they returned to the main study protocol Data
Study1 307A
4111 Pharmacokinetics A blood sample was to be collected at Visit 7 into a heparinized Vacutainer tube and obtained at 24 hours (plusmn2 hour) following the last dose of study medication (ie trough measurement) for determination of plasma metoprolol concentrations
Study Disposition Chart
DCP1PM Page 61 10182006
Clinical Pharmacology Review NDA 19-962 Toprol-XL 10182006
Table 2 Study Demographics
4112 Pharmacodynamics Primary variable
Sitting SBP determined at trough (24plusmn4 hours Visit 7) served as the primary efficacy assessment The primary measure of effect was the placebo-corrected change from baseline to the end of treatment (Week 4) in trough sitting SBP Each BP determination represented the mean of 3 readings with less than 7 mmHg between the highest and lowest value Blood pressure was measured using a mercury sphygmomanometer with an appropriate size cuff positioned approximately at the level of the heart Every effort was made to have the same individual measure the patientrsquos BP throughout the study if possible At all post randomization visits BP measurements were to be made at trough defined as 24 hours (plusmn4 hours) after receiving study medication All measurements were to be determined prior to the patient taking the scheduled dose of study medication In the
DCP1PM Page 62 10182006
Clinical Pharmacology Review NDA 19-962 Toprol-XL 10182006
event that the patient accidentally took study medication on the day of the scheduled visit the visit was to be rescheduled within 24 to 48 hours
Study2 307B
4113 Pharmacokinetics A 48-hour washout period prior to sampling was required for all patients including patients who entered the 52-week study and then decided to participate in the serial PK portion of the study All patients were to have a 15-mL blood sample collected into a heparinized Vacutainer tube 24 hours (plusmn2 hour) following the last dose of TOPROL-XL (ie trough measurement) at Visit 18 (or a the time of premature discontinuation) except for patients who participated in the serial PK portion of the study and had blood sampling performed at Visit 18 For patients participating in the serial PK portion of the study blood samples (15 mL) were to be collected into heparinized Vacutainer tubes and obtained at Hour 0 (predose) and at 1 2 3 4 6 8 10 and 24 hours after administration of a single 25 mg dose of TOPROL-XL following a 48-hour washout period After the last blood sample was obtained the patient was to startresume the prescribed dose of TOPROL-XL heshe was receiving prior to PK sampling
Patient Disposition Chart (completion or discontinuation)
Overall a total of 31 patients at 8 centers were enrolled in the serial PK portion of the study Of these 31 patients 27 had plasma concentration data available and were included in the analyses Four patients were excluded from the analyses because their plasma concentrations were not quantifiable (Nos 047-009 and 047-021) or because only whole blood samples were analyzed (Nos 005-002 005-003)
DCP1PM Page 63 10182006
Clinical Pharmacology Review NDA 19-962 Toprol-XL 10182006
Table 3 Subject Demographics for Patients Providing Serial Blood Samples
Missing Data Twenty-six patients did not have blood samples obtained for analysis of metoprolol concentrations in either the 16-week (n=7) or 52-week (n=19) studies Among patients with plasma samples 14 (14) in the 52-week study and 13 (13) in the 16-week study had trough plasma metoprolol concentrations that were below the LLQ Therefore data from a total of 99 patients were included in this analysis
Assay Metoprolol plasma levels were assayed using high-performance liquid chromatography tandem mass spectrometric detection methods having limit of quantitation (LOQ) of 1 ngmL The method was validated in the linear range 1 to 1000 ngmL Precision was less than or equal to 109 Accuracy ranged from 940 to 1013 Pharmacodynamics Not applicable
Data Checking SAS was used to format and check data Additionally visual inspection of several randomly selected subject data was carried out
DCP1PM Page 64 10182006
Clinical Pharmacology Review NDA 19-962 Toprol-XL 10182006
Models
Overview The sponsorrsquos stated assumptions underlying this modeling analysis are
1 Rich sampling data collected from 30 subjects in 307B Study can be used to adequately characterize the structural pharmacokinetic model of metoprolol
2 Structural pharmacokinetic models of metoprolol at other dose strength are identical to that at 25 mg
3 Metoprolol exhibits a linear pharmacokinetics in the dose ranges studied 4 Steady-state pharmacokinetics of metoprolol has been reached at the time of blood
sampling in Study 307A 5 Metoprolol accounts for the blood pressure effect in the study 6 Existing various disease states in the patients have no impact on the pharmacokinetics
of metoprolol and pharmacodynamics of the blood pressure reduction in the study 7 Concomitant medications if existed do not have any effects on the pharmacokinetics
of metoprolol and pharmacodynamics of the blood pressure reduction in the study
Reviewer Comment The sponsorrsquos assumptions appear reasonable based on existing metoprolol PKPD information
Pharmacokinetics
4114 PK Structural Model Several PK models were tested to identify the structural model Flip-flop absorption was taken into consideration based on general PK characteristics following administration of sustained release tablets and observed data in the current study (serial PK samples)
The models tested included linear 1- and 2-compartment PK models with the following characteristics (focused on flip-flop models)
bull first-order absorption with and without absorption lag time (NONMEM subroutines ADVAN2 and ADVAN4)
bull zero-order absorption with and without absorption lag time (NONMEM subroutines ADVAN1 and ADVAN3)
bull simultaneous zero- and first-order absorption from the absorption compartment The models were parameterized in terms of CLF and VF
Ultimately the 2-compartment model with first order flip-flop absorption an absorption lag time and 2 residual error terms was selected as the structural model of metoprolol The model scheme is presented in the following Figure 1 Figure 1 PK Compartmental Model
DCP1PM Page 65 10182006
Clinical Pharmacology Review NDA 19-962 Toprol-XL 10182006
4115 PK Covariate Model Covariate models were developed to account for the potential impact of the following covariates and derived covariates on metoprolol PK
Continuous variables bull Age (AGE years) bull Body weight (WT kg) bull Body surface area (BSA m2) calculated from WT and HT (cm) using the height
weight formula BSA=0024265 x WT 05378 x HT03964 bull Ideal body weight (IBW kg) calculated as - Males IBW=50+(HTndash150)25 and
for Females IBW=45+(HTndash150)25 bull Dose (DOSE mg of Toprol-XL)
Categorical variables bull Gender (SEX) - Male 0 - Female 1 bull Race (RACE) - Caucasian 0 - Black 1 - Asian 2 - Other 3
PK covariate effects were modeled as follows
Effects of continuous covariates (AGE WT BSA IBW and DOSE) were normalized to the corresponding median value across a dataset such that continuous covariates were related to structural PK parameters in a power function as described below
where Θ is the fixed-effect parameter of a covariate estimated by the NONMEM program covariate value is the observed covariate value and PK typical value is the typical value of the PK parameter estimated by NONMEM Effects of categorical covariates (SEX and RACE) are related to structural PK parameters by fractional changes of dummy variables
DCP1PM Page 66 10182006
Clinical Pharmacology Review NDA 19-962 Toprol-XL 10182006
Where Θ is the fixed-effect parameter of a covariate estimated by the NONMEM program covariate is the dummy variable value and modified in the control streams and PK typical value is the typical value of this PK parameter as estimated by NONMEM
Median values of all covariates in the dataset for population PK analysis are presented in Table A
Table A Summary of patient covariates and Toprol-XL doses in the data for population PK analysis
Two Steps were included in the modeling of covariates
Step 1 Forward Addition The covariates were subjected to a stepwise forward selection algorithm using a likelihood ratio test based on a change in MOF values from the base model A significant covariate reduced the MOF more than 660 (chi-square distribution plt001 degrees of freedom [df]=1)
Step 2 Backward deletion (Excluding procedures for covariate effect) The covariates in the full model acquired in Step 1 were subjected to a backward deletion algorithm 1 covariate was deleted at a time using a likelihood ratio test based on a change in MOF values A covariate was determined to be statistically significant if the change in MOF after its deletion from the breakdown model was increased by more than 1083 (chi-square distribution plt0001 df=1)
4116 PK Random Variance Models An exponential error model was used to characterize inter-patient variability based upon the assumption that random effects for PK parameters were not correlated among PK parameters No other error models for eta were evaluated by the applicant or by this Reviewer The retention of ETA values for each PK parameter in the structural model was confirmed by sequentially fixing each ETA value at zero and comparing each resultant MOF with the MOF obtained when all ETA values were retained in the model (see Table 6)
DCP1PM Page 67 10182006
Clinical Pharmacology Review NDA 19-962 Toprol-XL 10182006
The residual model was modeled by an additive model two error terms were used one for error associated with trough samples and the other with serial samples
Reviewer Note Use of an exponential model appears reasonable
Pharmacodynamics
4117 PKPD Structural Model The equations for the structural models are shown below
1 Metoprolol Ctrough The relationships between the observed metoprolol concentrations (Ctrough) and hemodynamic changes were investigated using 4 direct-link models namely a linear model a log-linear model and Hillrsquos sigmoid Emax PKPD model with and without a baseline
2 The relationships between Cmax or AUC0ndash24 and hemodynamic changes were investigated using 2 direct-link models a linear model and a log-linear model
4118 PKPD Covariate Model The inclusion and exclusion procedures of covariate effect on the selected PKPD base model to obtain a selected final PKPD model were identical to those in the covariate evaluation in the population PK models as described previously in PK Covariate Model DCP1PM Page 68 10182006
Clinical Pharmacology Review NDA 19-962 Toprol-XL 10182006
Table B Baseline demographic and covariate characteristics
4119 PKPD Random Variance Models An exponential error model was used by the applicant to model inter-individual variability The retention of a random effect parameter ETA in each selected PKPD structural model was then evaluated by sequentially fixing each ETA value at zero and comparing each resultant MOF with the MOF obtained when all ETA values were retained in the model (plt005) This step reduced over-parameterization by deleting unnecessary random-effect parameters from the structural model to obtain the base model
Reviewer Note The study design precludes assessment of inter-individual variability or random error because only one dose record was available per patient Consequently the model should not have included eta terms It is noted that the sponsor ultimately dropped the eta term in the final model
DCP1PM Page 69 10182006
Clinical Pharmacology Review NDA 19-962 Toprol-XL 10182006
Model Selection
PK Initial Model Selection
PK Base Model to Final Model The selection of the most appropriate PK base model for a metoprolol PK was based upon the following criteria a significant reduction in MOF as compared to the baseline model and asymptotic chi-square distribution based on the likelihood ratio test or AIC (plt005) as compared to the other structural models This selected PK base model was then subject to a covariate evaluation The population PK model bearing all surviving covariate parameters with statistical significance became the penultimate final model If 1 of the body size parameters (WT BSA and HT) was not in the model the penultimate final model became the final model If body size parameters were in the model they were sequentially replaced by other body size parameters in the regression submodel for each PK parameter The best body size parameter was then selected on the basis of lowest MOF to form the final model
PK Final Model Selection Simulations and visual inspections based on goodness of fit plots were used to qualify and validate the model The goodness-of-fit of the final model was evaluated graphically by comparing population and individual predictions of metoprolol concentrations with observed metoprolol concentrations along the line of unity and by visual inspection of the following plots of population-weighted residuals (WRES) for the final population model 1 Population-weighted residuals (WRES) versus population-predicted concentrations (PRED) 2 WRES versus time after first drug administration in each patient 3 WRES versus all covariates evaluated WRES were generally expected to be distributed homogenously around zero for PRED time after administration and covariates For those 27 patients with serial samples goodness-of-fit of the plasma concentration-time profile for each individual was visually inspected The linear relationship between their AUClast values from the observed data and those from the simulated data (final model) was examined
The predictive performance of the final population PK model including covariates was evaluated by comparing typical values of PK parameters with the mean of individual Bayesian estimates or individual values of PK parameters with the results from non-compartmental analysis for patients with serial samples Steady-state metoprolol plasma concentration-time profiles from 0ndash24 hours at the interval of 15 minutes (025 hour) were calculated using the post hoc Bayesian estimated PK parameter obtained for 65 patients included in the PKPD relationship using the following equation
DCP1PM Page 70 10182006
Clinical Pharmacology Review NDA 19-962 Toprol-XL 10182006
PKPD Initial and Final Model Selection A similar approach to that of PK model selection was adopted for PKPD Each of the above-mentioned PKPD models with random effects was identified by curve-fitting the dataset Initial selection of the PKPD structural model was based upon a significant reduction in MOF (plt005) as compared to the baseline model and reasonable PKPD parameter estimates Software
Nonlinear mixed-effect modeling (NONMEM) software (Version V level 11 Globomax Hanover MD) was used in the population PK analysis PK model fitting was accomplished using first-order (FO) approximation methods For PKPD model fitting the first-order conditional estimation (FOCE) with eta-epsilon interaction method in NONMEM was used for all model runs
SAS software (Version VIII Cary NC) was employed to prepare datasets according to the format required by the NONMEM program (Boeckmann et al 1991) Microsoftreg Excel 2000 (Redmond WA) and S-PLUS 2000 (Professional Release 2 MathSoft Inc Cambridge MA) were used to perform exploratory graphical exposure calculation and statistical analyses according to the format required by the NONMEM program (Boeckmann et al 1991) SAS command files logs and listings pertaining to data file conversion and merging were reviewed by an independent analyst Datasets were stored in SAS data frames combined and exported to Excel and then to ASCII files before fitting to the model
Datasets were prepared and pooled in a NONMEM-compliant format using SAS software by the Programming Group Clinical Information Sciences at AstraZeneca Wilmington Delaware SAS command files logs and listings pertaining to file conversion and merging were provided and found to be acceptable The contents of both datasets (toprolkatcsv for PK modeling and cppd2csv for PKPD modeling) were included
DCP1PM Page 71 10182006
Clinical Pharmacology Review NDA 19-962 Toprol-XL 10182006
toprolkatcsv was not provided electronically in a SAS format however this reviewer generated a similar dataset using the applicantrsquos criteria
Reviewer Comment The software and data assembly methods appeared adequate
DCP1PM Page 72 10182006
Clinical Pharmacology Review NDA 19-962 Toprol-XL 10182006
Results and Discussion Design Adequacy
Overall the trial designs appeared adequate to evaluate metoprolol population PK and PKPD in pediatric patients receiving Toprol XL However the design could have been further optimized by increasing the sampling points particularly in the absorption phase Due to the limited number of samples in the absorption phase it was not possible to accurately characterize the absorption model first order vs zero order or mixed first and zero order Additionally collection of mainly trough samples limits the ability to accurately estimate measures such as Cmax that are not directly related to Ctrough particularly if multiple compartments are present Consequently Cmax estimations are unlikely to be accurate Finally most patients provided only one trough sample thus inter-individual variability could not be adequately captured and may have limited the utility of the modeling exercise particularly in PKPD where the random effect could not be accurately characterized Ultimately there was no random variable in the final PKPD model (ie eta was set to zero) Data Integrity
This reviewer checked the data visually by randomly selecting data from patients included in the population modeling and comparing to data in the study report (source data) Overall the data integrity appeared acceptable The applicant observed the following guidelines that appeared acceptable No datum from any study participant with a protocol violation that was thought to materially impact the analysis was included The dataset contained data from only those study participants who could be evaluated ie with all the last dosing datetime blood sampling datetime plasma drug concentrations and demographic covariates
Data that were excluded (n = 62 samples) from the model were as follows One sample from an apparent poor metabolizer Two samples collected gt 96 hours post dose From 307B 10 trough samples lt LOQ From 307A 17 samples lt LOQ Thirty-samples from serial data that were lt LOQ or whole blood samples Model and Model Selection
Base Model
41110 Pharmacokinetic Model description The base PK model was a standard two compartment model that incorporated lag time and flip-flop kinetics The key features of the model were flip-flop was insured by making the value of ke gt ka in the clearance equation Additionally lag time was restricted to a value of 2 hours or less and concentrations were log transformed consequently all concentrations (F) = 0 were given individual predicted concentrations of zero Finally there were two residual error terms one for serial samples and the other for trough samples DCP1PM Page 73 10182006
Clinical Pharmacology Review NDA 19-962 Toprol-XL 10182006
Key equations were as follows
KA = THETA(1)EXP(ETA(1)) V2 = THETA(2)EXP(ETA(2)) CL = (THETA(1)THETA(2)+THETA(3))EXP(ETA(3)) Q = THETA(4)EXP(ETA(4)) V3 = THETA(5)EXP(ETA(5)) ALAG1=THETA(6)EXP(ETA(6))
41111 PK Parameter estimation results Table 1 Summary of PK parameters in the metoprolol population PK base model (per applicant)
41112 Goodness of fit The applicant provided the following goodness-of-fit plots (Figure 1)
Reviewer Note The goodness-of-fit plots were reproduced by this Reviewer (see Appendix) with minor modifications
Figure 1 Goodness of fit plots for Base Model
DCP1PM Page 74 10182006
Clinical Pharmacology Review NDA 19-962 Toprol-XL 10182006
Base PK Model Selection The MOF values of all structural model candidates tested are presented in Table 2 Model selection was based primarily on MOF values the lower MOF the better the model The applicant reports that in general MOF values generated by a conventional absorption model (ie absorption rate is faster than elimination rate) and a flip-flop absorption model (ie absorption rate is slower than elimination rate) were identical
Reviewer Comment The existence of flip-flop kinetics appears plausible based on data provided and general patterns for sustained release formulations Consequently the use of flip-flop kinetics for the bulk of the modeling exercise appears reasonable
General conclusions from the information in Table 2 are First order input is better than zero order input Two compartment model is better than one compartment model Lag time presence is better than lack of lag time Two residual error terms are better than one residual error term It should also be noted that several other models led to unsatisfactory completion of the run and were not considered further
DCP1PM Page 75 10182006
Clinical Pharmacology Review NDA 19-962 Toprol-XL 10182006
Table 2 Comparison of Structural PK Models
Reviewer Comment The selected structural model appears appropriate based on the data
Base Model The deletion of ETA for V2 did not change the MOF value suggesting that ETA for V2 should be deleted to avoid an over-parameterized warning (Table 3) This was consistent with the estimated parameter value of ETA for V2 being 648 x 10ndash9 a very small value Therefore the base model was selected by deleting the ETA for V2 from the structural model
Reviewer Comment on Eta deletion for V2 Deletion of eta for V2 is acceptable based on the empirical data however from a physiological perspective deletion of eta is problematic Generally one anticipates inter-individual differences in volume of distribution In this case it appears that the error associated with V2 may have been randomly shifted to V3 and or Q terms as the three DCP1PM Page 76 10182006
Clinical Pharmacology Review NDA 19-962 Toprol-XL 10182006
terms are interrelated This potential shift in error is supported by the fact that the V2 eta value increases significantly (by several orders of magnitude- 10-5 vs 100) when eta for Q and or V3 is fixed However when Q or V3 are fixed minimization is successful but Q and V3 are not accurately estimated Accounting for the possible error shift is a complex process and goes beyond the scope of this reviewer thus deletion of eta associated with V2 was considered acceptable for the remainder of the modeling evaluation
Table 3 Structural elements tested in the metoprolol population PK structural model (p lt 0005)
Final PK Model
41113 Model description The key feature of the final model is the inclusion of the covariate effects of age on Q and weight on CL in the population PK model
Key Equations CL = (THETA(1)THETA(2)+THETA(3)+EWT)EXP(ETA(2)) Q = THETA(4)EAGEEXP(ETA(3))
Including Covariate Effects As previously described covariate effects were assessed by forward addition and backward deletion Most covariates did not significantly change MOF however BSA significantly affected CL and Age affected Q Consequently these covariates were included in the penultimate final model
DCP1PM Page 77 10182006
Clinical Pharmacology Review NDA 19-962 Toprol-XL 10182006
Reviewer Note BSA is derived form WT and HT covariates implying BSA is highly correlated to these two covariates (Figure 2) weight is the most suitable (practical covariate) as it is readily measured Furthermore weight and BSA produced the same MOF (Table 4) whereas MOF with height was more positive (less significant)
Figure 2 Plot of BSA vs Body Weight
The data in Table 4 support selection of the final model
Table 4 Covariate elements tested in the metoprolol population PK penultimate final model (plt0005)
The applicant acknowledges that mechanism(s) accounting for the impact of age on QF are not clear However since distribution clearance has little effect on metoprolol plasma exposure further investigation is not needed
41114 PK Parameter estimation results As shown in Table 5 PK parameters were estimated fairly precisely by the final model
Table 5 PK Parameter Estimates using Final Model
DCP1PM Page 78 10182006
Clinical Pharmacology Review NDA 19-962 Toprol-XL 10182006
41115 Goodness of fit The goodness-of-fit plots provided by the applicant show good precision Figure 5 Goodness of fit plots for final PK model
DCP1PM Page 79 10182006
Clinical Pharmacology Review NDA 19-962 Toprol-XL 10182006
PK Model Qualification The post hoc Bayesian-estimated AUC (simulated) obtained for the 27 patients with serial plasma samples are plotted against the observed (AUCt) The correlation was high (R2 gt 099) Figure 6 AUClast from observed data versus AUCt from model simulation in the 27 patients providing serial plasma samples
Regression line Y= 4514 + 08976 X R2 = 09957
The graphical validation of the final metoprolol population PK model validation against covariates evaluated is presented in Figure 6
Figure 7 Graphical validation of covariates
DCP1PM Page 80 10182006
Clinical Pharmacology Review NDA 19-962 Toprol-XL 10182006
There was no systematic bias in weighted residuals for any covariates evaluated suggesting that the final model included all appreciable effects of available covariates (Figure)
The effects of weight on metoprolol CLF are illustrated in Figure 8 where Bayesian post hoc estimates of CLF are plotted against weight and overlaid by the model-predicted line Overall the model appeared to fit the data well
Figure 8 Plot of CLF vs Body weight
The effects of AGE on metoprolol QF are illustrated in Figure 9 where Bayesian post hoc estimates of QF are plotted against AGE and overlaid by the model-predicted line Figure 9 Plot of QF vs Age
DCP1PM Page 81 10182006
Clinical Pharmacology Review NDA 19-962 Toprol-XL 10182006
Reviewer Note The applicant indicated that attempts to run the final model using the first-order conditional estimation method resulted in termination errors Therefore the parameter estimates obtained by the FO method were reported as the final parameter estimates
Conclusion Regarding Population PK Modeling Overall the sponsorrsquos population PK modeling is acceptable
PKPD Model and Model Selection
PKPD Base Model PharmacokineticPharmacodynamic Model description The key feature of the model was a lack of random variance term for the slope (since only single data points were available per subject) and inclusion of baseline effect
Key equations were as follows E0 = THETA(1)EXP(ETA(1)) M = THETA(2) Y = E0 + MLOG(AUC) + EPS(1)
The control stream provided in the appendix is that for DBP (provided by sponsor) The control stream for SBP is comparable with appropriate substitution for BP type
It should be noted that only the log-linear and linear PKPD models were considered suitable for AUC and Cmax For this review only AUC estimates were considered reliable as Cmax estimates could not be accurately determined based on the sampling scheme Consequently the remainder of this review focuses on AUC information although Ctrough and Cmax data are displayed for reference
Bayesian estimates from PK modeling are summarized in Table 1
Table 1 Bayesian estimates of metoprolol PK exposure for those patients included in the PKPD analysis (N=65)
DCP1PM Page 82 10182006
Clinical Pharmacology Review NDA 19-962 Toprol-XL 10182006
PKPD Model Selection (initial and final) The log-linear model was adopted as the base model for this PKPD relationship since it improved the MOF significantly (Table 2) The ETA parameter for the slope was pre-eliminated for the purpose of model parsimony The intercept and slope in this log-linear model for AUC(0-24) did not bear ETA parameter therefore no covariates had impact on either parameter in the model
Reviewer Note The intercept should not have borne an eta term because individual subjects provided only one data point Consequently fixing eta to zero or deleting eta in the final model is appropriate No further model development was required after eta was eliminated and the base model was equivalent to the final model
Table 2 Base population PKPD models tested for the change in SBP
41116 PKPD Parameter estimation results The final PKPD parameter estimates are presented in Table 3
Table 3 Summary parameters in the final PKPD model for the change in SBP using trough plasma level Parameter Explanation Estimate SE ()b
DCP1PM Page 83 10182006
Clinical Pharmacology Review NDA 19-962 Toprol-XL 10182006
Model Qualification Based on the relatively low R2 value and as shown in Figure there is a poor correlation between change in SBP and log AUC
Figure 1 Relationship between change in SBP and AUC (line generated from modeling)
Overall goodness-of-fit of the model was considered to be poor probably due to the high variability in the measurements Consequently the precision of the model parameter estimates was not considered to be very reliable These parameters have little clinical usefulness and can be treated only as an indication of trends ie more hemodynamic effects can be potentially achieved when high Toprol-XL doses are given Clinical dose adjustment based on these PKPD parameters is not recommended
Reviewerrsquos Supplemental Analyses A supplemental PKPD analyses was conducted using simple linear regression since the population model did not improve the fit Overall eta made an insignificant contribution to the overall model The results of the analyses were similar to the population analyses A series of regression analyses were conducted and are presented in Table 4
The applicant notes that the preliminary modeling exercise found that there was no difference in the PKPD modeling results using different hemodynamic data formats (ie change in the measurements percent change in the measurements or actual BP measurements) This finding was confirmed by this reviewer (see Table 4)
DCP1PM Page 84 10182006
Clinical Pharmacology Review NDA 19-962 Toprol-XL 10182006
Table 4 Supplemental PKPD Regression Analyses Conducted by Reviewer Model (liner regression) Intercept (I) Slope (m) R2 Probability RSBP = mISBP + I 3957 -035 01626 0009 PSBP = mISBP + I 2524 -023 01252 00038 PSBP = mRSBP + I 0005 074 09891 lt 00001 RSBP = mlogAUC + I 651 -221 0060 00493 RSBP = mDose + I -751 0006 00026 06878 RSBP = mDose^ + I -312 -111 004 02711 RSBP = mlogAUC + nISBP + I 5303 -221 (m)
-035 (n) 02230 0001
RSBPplc = mAUC + I -667 -0003 00458 00871 RSBPplc = mlogAUC + I 461 -2208 00600 00493 RPUL = mlogAUC + I 1868 -405 01102 00069 Symbols in table similar to population PK model without eta term RSBP- change of SBP without placebo correction ISBP- initial (baseline) SBP RPUL- change in HR without placebo correction Dose- in mg where placebo is included as 0 mg PSBP- percentage change of SBP without placebo correction
Conclusion Regarding Population PKPD Modeling Overall the sponsorrsquos population PKPD modeling is acceptable No dose adjustment conclusion can be made from this modeling however an exposure-response relationship was established for AUC and reduction in SBP
Discussion
The significance of the results 1 Provide estimates of PK measures and plasma exposure in pediatric population These data can be compared to adult exposure to determine if exposure differences impact drug effectiveness The main challenge in comparing pediatric data to adult data is different modeling schemes formulations and methods were used in the two populations
2 PKPD findings are not sufficiently precise to provide a dose adjustment algorithm however the PKPD analyses provides rationale for proposed titration as increasing exposure (doses) may improve efficacy (reduction in SBP) Ultimately the risk-benefit analyses overrides PKPD assessment for dose adjustment drug will be titrated thus reliance on PKPD information is not critical The proposed dose 10 mgkg appears suitable based on available information It is unclear from the studies if there should be an initial maximum dose although the sponsor has proposed 50 mg as the maximum initial dose The proposed pediatric starting dose on a mgkg basis is within the range of starting adult doses (25 ndash 100 mg) assuming an adult weighs 70 kg
3 Cumulative information form dose-response study indicates that Toprol XL has effectiveness in children however the most effective dose is unclear Since the drug can be titrated determining the initial optimal dose does not appear critical As proposed by the applicant dosing is started at a ldquolowrdquo dose that can be up-titrated if needed
DCP1PM Page 85 10182006
Clinical Pharmacology Review NDA 19-962 Toprol-XL 10182006
4 The results did not adequately address the potential impact of CYP2D6 metabolic status for pediatric patients taking Toprol XL There were an insufficient number of patients to make this assessment
5 Covariate effects do not appear significant only body weight significantly affects clearance However a worst case scenario can occur with a person that has a low body weight and is a poor metabolizer this will result in very high possibly supra-therapeutic exposure Age does not impact apparent oral clearance so an age-dependent dose adjustment is not needed for children over 6 years old In essence all children over six years old can initiate therapy at 10 mgkg
The validity of the results Overall the results produced by the sponsor appear valid and the sponsor used a sound modeling approach However alternative approaches that could have been adopted may have improved the outcome of the analyses Three of these approaches are presented below 1 Additional PK samples should have been collected during the absorption phase and
throughout the dosing interval to improve the modelrsquos performance Specifically additional samples collected during the absorption phase may have unambiguously identified the actual absorption input function (eg first order zero order mixed first and zero order) First order input was selected for the analyses although the dosage form is reported to exhibit zero order kinetics in adults It is possible that the input rate in children differs from that in adults but unlikely It should be noted that absorption kinetics in children is often erratic due to multiple factors (eg regioshyselective absorption incomplete gastric emptying and inconsistent absorption) so it is unclear if additional samples would have definitively identified the absorption function However additional non-trough samples may have helped in estimating key PK measures such as V and Cmax The final model did not have an eta associated with V which is atypical Collection of additional samples on different visits may have helped estimate potential inter-occasion variability It should be noted that AUC was estimated precisely for subjects providing serial samples but these subjects were not necessarily included in the PKPD analyses Ideally the PKPD modeling should have been conducted primarily in subjects who had accurate PK measures
2 The PKPD design could have been modified to potentially improve the utility of the analyses Specifically there should have been better placebo matching procedures to minimize the potential impact of the placebo effect This matching could have been improved by ensuring all patients on placebo had the same titration schedule and number of tablets It is noted that the model had a poor predictive performance that was mainly attributed to the high degree of variability in the PD measures Potentially other PD markers could have been explored that have less inherent variability One such marker is the degree of beta blockade using exercise heart rate (EHR) reduction this marker has been used extensively for metoprolol in adult subjects However use of EHR in the pediatric setting may be challenging
DCP1PM Page 86 10182006
Clinical Pharmacology Review NDA 19-962 Toprol-XL 10182006
Comments to sponsor
In future pharmacometric studies you should consider the following 1 collect sufficient (multiple) samples from individual subjects to allow assessment
of inter-occasion variability and estimation of inter-individual variability (eta) for all relevant parameters
2 placebo groups should be identically matched across all dose groups (eg same titration schedule and number tablets) to minimize potential bias or differences in the placebo effect
Comments to medical reviewer
1 The sponsor has adequately characterized metoprolol PK in the studied pediatric population The PK characterization could have been further optimized by obtaining additional samples over the entire dosing interval (eg during the absorption phase and elimination phase) on multiple occasions rather than on one occasion primarily at trough
2 A dose-response relationship could not be established using the protocol specified analysis approach The outcome of the dose-response relationship appeared highly dependent on the ldquoplacebo effectrdquo suggesting that the placebo group may not have been appropriate One should consider re-evaluating the dose-response precisely matched placebo groups (eg all placebo patients have identical number of tablets and titration schedule)
3 Based on the PKPD analysis plasma exposure (AUC) explains lt 10 of the response (reduction in systolic blood pressure) thus has limited clinical utility However the PKPD relationship suggests that there is a trend for increased response with increased exposure (dose driven)
4 Overall information from the dose-response study suggests that Toprol- XL is effective in the pediatric population The optimal initial dose 02 10 or 20 mgkg or the maximum safe and effective dose cannot be determined from the information provided It is noted that the 02 mgkg dose is unlikely to be effective as plasma concentrations achieved at this dose are unlikely to be effective (most concentrations lt LOQ and lower than effective adult concentrations) The 10 mgkg (proposed by applicant) appears to be a reasonable initial dose The labeling should reflect the regimens studied
DCP1PM Page 89 10182006
Clinical Pharmacology Review NDA 19-962 Toprol-XL 10182006
Appendix
DCP1PM Page 90 10182006
Clinical Pharmacology Review NDA 19-962 Toprol-XL 10182006
DCP1PM Page 91 10182006
Clinical Pharmacology Review NDA 19-962 Toprol-XL 10182006
DCP1PM Page 92 10182006
Clinical Pharmacology Review NDA 19-962 Toprol-XL 10182006
DCP1PM Page 93 10182006
Clinical Pharmacology Review NDA 19-962 Toprol-XL 10182006
DCP1PM Page 94 10182006
Clinical Pharmacology Review NDA 19-962 Toprol-XL 10182006
DCP1PM Page 95 10182006
Clinical Pharmacology Review NDA 19-962 Toprol-XL 10182006
Table 15 Control streams for final log-linear PKPD model for the change in DBP using metoprolol Cmax as the measure of exposure
Truncated NONMEM reports for base model identification for PKPD relationship in change of SBP (per sponsor)
DCP1PM Page 96 10182006
Clinical Pharmacology Review NDA 19-962 Toprol-XL 10182006
Reported PD information^
^ Under metoprolol regimen CRZ0K is Toprol XL
DCP1PM Page 97 10182006
Clinical Pharmacology Review NDA 19-962 Toprol-XL 10182006
Table Results of randomised double-blind comparative trials evaluating antihypertensive efficacy of metoprolol formulations or other antihypertensives
DCP1PM Page 98 10182006
---------------------------------------------------------------------------------------------------------------------
---------------------------------------------------------------------------------------------------------------------
---------------------
This is a representation of an electronic record that was signed electronically and this page is the manifestation of the electronic signature
s
Robert Kumi 10182006 045635 PM BIOPHARMACEUTICS
Patrick Marroum 10192006 050811 PM BIOPHARMACEUTICS

Clinical Pharmacology Review NDA 19-962 Toprol-XL 10182006
13 Summary of Important Clinical Pharmacology Findings
1 Dose-Response A statistically significant dose-response did not exist for placebo (pooled)ndash corrected ∆SBP from baseline however the relationship was evident when placebo (specific-group) ndashcorrected data were used
2 Proposed Pediatric Dosage Overall information from the dose-response study suggests that Toprol XL is effective in the pediatric population The optimal initial dose in mgkg or the maximum safe and effective dose cannot be determined from the information provided However the 10 mgkg (proposed by applicant) appears to be a reasonable initial dose subsequent titration based on clinical response is acceptable Relative to adults (assuming average adult weighs 70 kg) the proposed initial pediatric dose is in the range but closer to the high end of the usual initial adult dose 036 ndash 143 (25 to 100 mg)
3 Metoprolol Pharmacokinetics in Pediatric Patients Metoprolol PK in children (6 ndash 16 years old) were adequately characterized by a 2-compartment model with flip-flop first-order absorption and an absorption lag time using a population PK approach The population PK model yielded precise parameter estimates Estimated PK Measures (median values) were CLF = 2275 Lhr V2F = 961 L QF = 675 Lhr V3F = 620 L ka = 00467 hrndash1 and Tlag = 0853 hr Overall the PK measures in children are of a similar magnitude as that in adults reported in the literature
4 Metoprolol Exposure in Children At the proposed pediatric initial dose 10 mgkg average Cmin was ~ 122 ngml and average Cmin was ~ 246 ngmL at the 20 mgkg dose however data were highly variable with CV gt 100 The majority of samples were below the lower limit of quantitation at the lowest studied dose 02 mgkg In adults (literature reports) average Cmin following 50 mg (~071 mgkg) was ~ 85 ngmL and ~ 226 ngmL following 100 mg (~143 mgkg)
5 Covariates Sex age race body weight and Toprol-XL dose did not have a clinically significant effect on metoprolol PK
6 Population PKPD Model Using a log-linear model or linear model there were statistically significant relationships (p lt 0005) between the changes in SBP and DBP from baseline and measures of metoprolol plasma exposure (Ctrough AUC(0ndash24 and Cmax) However the goodness-of-fit of the PKPD models were generally poor and parameters were not precisely estimated in most models due to a high degree of variability in the blood pressure data Based on the PKPD analysis plasma exposure (AUC) explains lt 10 of the response (reduction in systolic blood pressure) However the PKPD relationship suggests that there is a trend for increased response with increased exposure (dose driven) thus supporting dose titration
Robert O Kumi Ph D Date Clinical Pharmacology Reviewer Concurrence Patrick Marroum Ph D Date Cardiovascular and Renal Team Leader
Page 5 of 98
Clinical Pharmacology Review NDA 19-962 Toprol-XL 10182006
2 Question Based Review
21 What are the general attributes of metoprolol
211 Regulatory Background An original pediatric written request to support pediatric exclusivity was issued in October 1999 Subsequently amendments were made to the original request and a final written request was submitted in October 2004 Key elements of the request follow
1 Dose ranging trial in pediatric patients with hypertension ( 6 ndash 16 years old) 2 Pharmacokinetic sampling in the same range as those studied for effectiveness 3 Safety data from a controlled trial and 1-year open label treatment phase following the
effectiveness trial 4 Summary of all available information on the safety of the drug in hypertensive patients
The pediatric decision tree is depicted below this decision paradigm is used to support the rationale for choosing which studies had to be conducted
Pediatric Decision Tree (CDER MaPP 40004)
Disease Process Cause of Hypertension in Children Most children between 1 and 17 years old tend to have secondary forms of hypertension In infants and younger children underlying renal or reno-vascular disease is frequently the cause for hypertension (80) whereas essential hypertension is predominant in adolescents and adults Therefore the disease progression and response to the treatment in children and adults are not similar Based on the Pediatric Decision Tree Guidelines safety and efficacy studies are required in the target population to establish the indication in the pediatric patient population
Page 6 of 98
10182006 Clinical Pharmacology Review NDA 19-962 Toprol-XL
212 Selected background information on metoprolol Background on Metoprolol in Hypertension
Table 1 Snapshot of metoprolol clinical pharmacology and biopharmaceutic information
Drug Class Metoprolol is a szlig1-selective (cardio selective) adrenergic receptor-blocking agent Mechanism of Action (antihypertensive effect)
Multiple putative mechanisms competitive antagonism of catecholamine at peripheral sites reduction of sympathetic outflow to the periphery or suppression of renin activity
Approved Indications Hypertension Heart Failure and Angina Pectoris Approved Formulations 1 Immediate Release (IR) ndash metoprolol tartrate
2 Toprol-XL is extended-release tablet of metoprolol as the succinate salt it is also referred to as metoprolol in literature as controlled release (CRZ0K)
Metabolism Via CYP2D6 primarily Absorption Absolute oral bioavailability ~ 50 following IR Food does not affect metoprolol
absorption using ER formulation Distribution Protein binding to albumin is about 12 Elimination For IR t12 from 3 ndash 7 hours Less than 5 dose excreted unchanged in urine No
t12 values for ER this may be due to difficulty in separating absorption and elimination phases
Variability Plasma levels are highly variable among subjects after oral administration PKPD in children Limited information in children information obtained following administration of
metoprolol tartrate (IR) Please refer to NDA 19-962 for additional background information
213 Proposed Formulation Administration Route and Dosage The formulation proposed for pediatric use is Toprol-XL this formulation will be given orally at an initial dosage of 10 mgkg once daily (QD) Subsequently the dosage will be titrated depending on clinical response The maximum dosage studied was 200 mg QD Toprol-XL is available as a 25 (scored tablet) 50 100 and 200 mg tablet (b) (4)
22 What are the general clinical pharmacology characteristics of metoprolol succinate
221 Design features of clinical studies used to support dosing in the target population Two studies were conducted in hypertensive pediatric studies Study 307A and 307B the design features of these studies are summarized in Table 2 Table 2 Study Designs
Study Name Study 307A (D4020C00033) Study 307B (D4020C00001)
Objective Determine dose-response in children Determine long-term safety Doses Toprol XL 02 10 and 20 mgkg QD (maximum
200 mg QD) and Placebo Initial 25 mg QD then titrated to optimal clinical response (maximum 200 mg QD)
Design Feature bull 1-2 week placebo run-in period bull Patients in 10 and 20 mgkg groups dosed
over 2 week period but 02 mgkg group received dose for 4 weeks
Patients continuing from 307A or new enrollees
PK Features Ctrough (week 4) Ctrough (last study visit) and serial PK in subset (n = 31)
Primary Measures Outcome
Change in placebo-corrected trough sitting BP from baseline at week 4
Long-term safety using effective Toprol dose
LOCF approach followed
Page 7 of 98
Clinical Pharmacology Review NDA 19-962 Toprol-XL 10182006
222 Clinical response (efficacy) endpoints
Pharmacodynamics bull Primary variable Sitting SBP determined at trough (24plusmn4 hours Visit 7) served as the primary efficacy assessment The primary measure of effect was the placebo-corrected change from baseline to the end of treatment (Week 4) in trough sitting SBP Each BP determination represented the mean of 3 readings with less than 7 mmHg between the highest and lowest value bull Secondary variables Secondary variables included trough sitting DBP and percentage of responders at Week 4
223 Idenitifcation and measurement of metoprolol concentrations in plasma Metoprolol appeared to be adequately identified and measured in Study 307A and 307B A validated HPLC with tandem mass spectrometry method was used to quantify metoprolol Key features of the assay were bull limit of quantitation (LOQ) = 1 ngmL bull linear range = 1 to 1000 ngmL bull Precision measured by CV () le 109 bull Accuracy measured by relative bias ranged from ndash 6 to + 13 Overall the assay performance was acceptable
224 Metoprolol exposure-response The exposure-response evaluation revealed that
bull There was no clear dose-response relationship for effectiveness (primary variable change in sitting SBP) in the target patient population using the planned analysis (Sponsorrsquos) but there was a dose-response for the secondary efficacy variable (Sponsorrsquos)
bull There was a dose-response relationship for effectiveness when group-specific placebo correction was employed (Reviewerrsquos)
bull The proposed initial dosage regimen and subsequent titration are supported by 1) Existence of an exposure-response relationship for Ctrough and AUC and SBP
reduction 2) Overall Toprol XL being more effective than placebo at reducing SBP and DBP 3) For a given dose maximal efficacy occurring between 1 and 4 weeks after
treatment initiation bull There was no clear dose-response relationship for safety
2241 Dose-Response Assessment using Primary Variable and Analyses
Sponsors Analyses Primary Variable The dose-response relationship for Study 307A is depicted in Figure 1 When pooled placebo data were used for correcting change in SBP the slope of the curve is not different form zero (p = 05371 for dose ratio) suggesting that there is no dose response By visual inspection it appears the lack of observed dose-response is mainly driven by a lower than expected response at the 20 mgkg level Patients assigned to the 10 mg and 20 mgkg dose received drug for only 2 weeks whereas dose in the 02 mgkg received the same dose for 4 weeks It is unclear if this difference in titration schedule influenced the outcome
Page 8 of 98
Clinical Pharmacology Review NDA 19-962 Toprol-XL 10182006
Figure 1 Dose response for placebo-corrected change from baseline to Week4LOCF for sitting SBP (ITT population)
Reviewerrsquos Analysis Primary Variable When group-specific placebo corrected data were used for correcting change in SBP there was a statistically significant dose-response (Figure 2) Figure 2 Placebo corrected changes in SBP (chg_pc) as a function of dose ratio (relative to 02 mgkg)
In this procedure data for subjects assigned to a given active group (eg 02 mgkg) were corrected with placebo data (02 mgkg) It should be noted that the group-specific placebo data appeared to follow a consistent trend where the placebo effect decreased with increasing number of tablets It is unclear if this titrationtablet-dependent placebo effect is valid or random Overall the apparent differential placebo effects suggest that the placebo group may have overly influenced the outcome of the dose-response analysis Two potential limitations of this Reviewerrsquos supplemental analyses are
1 Typically placebo effects are constant if randomization is appropriate thus it is unclear if sub-setting the placebo group is reasonable and did not increase bias
2 Additionally sub-setting the placebo group leads to a reduced number of placebo subjects per dose group that may decrease the robustness of the regression findings
Page 9 of 98
Clinical Pharmacology Review NDA 19-962 Toprol-XL 10182006
2242 Dose-Response Assessment using Secondary Variable and Analyses
Treatment Group Effects and Pairwise Comparisons for sitting SBP and DBP Key findings from the group and pair-wise comparisons are 1 All active groups produced statistically significant reductions from baseline (p lt 002) in
sitting SBP (|∆ SBP| gt 5 mmHg) and DBP (|∆ DBP| gt 3 mmHg) at the Week 4LOCF visit whereas placebo (p = 03133) did not
2 Overall the mean change from baseline in sitting SBP (|∆ SBP| = 4256) at Week 4LOCF for the TOPROL-XL groups pooled was statistically significantly larger (p=00351) than that for the placebo group
3 Pairwise comparisons between individual TOPROL-XL dose groups and placebo also revealed a statistically significant difference for the 10 and 20 mgkg groups (p=00270 and p=00492 respectively) the 02 mgkg group was not different from placebo
Sponsorrsquos Analyses Secondary variable A dose-response relationship was observed for the secondary efficacy variable (delta DBP) as depicted in Figure 3 Figure 3 Mean changes (actual and placebo-corrected) from baseline to Week 4LOCF for sitting DBP (ITT population)
2243 Dose-Response assessment based on subgroup analyses (per Sponsor) and time course
Subgroup Analyses The sponsor conducted several exploratory subgroup analyses however these analyses were not reviewed critically and are not presented in this review as
1 they do no impact the primary outcome or study objective 2 they are unlikely to be clinically useful due to the small number of patients per subgroup
However one potentially useful group analyses involved the percentage of responders as defined in Table 3 The responder analyses shows
1) greater percentage of responders in active dose group relative to placebo 2) comparable response rates for all active dose groups suggesting similar efficacy across
dose groups despite different exposure (doses)
Page 10 of 98
Clinical Pharmacology Review NDA 19-962 Toprol-XL 10182006
Table 3 Number and proportion of responders (ITT population)
Time course of effect (2- to 4-week treatment period) Consistent with findings from other studies with metoprolol and some beta-blockers apparent maximal reduction in blood pressure occurred between 1 and 4 weeks of treatment The mean changes over time in sitting SBP and DBP are depicted in Figure 4 Figure 4 Mean changes over time for sitting SBP and DBP (ITT population)
Data points in plot are from absolute values (not taking baseline into account) and subjects in 10 and 20 mgkg received drug after two weeks on 02 mgkg
2244 PKPD Assessments Overall there were statistically significant relationships between metoprolol exposure particularly AUC and SBP reduction as shown in Figure 5 Similar findings were observed for heart rate reduction Figure 6
Page 11 of 98
Clinical Pharmacology Review NDA 19-962 Toprol-XL 10182006
Change in SBP Figure 5 Change in SBP vs log (AUC) ndash per Sponsor Figure 6 Change in HR vs AUC
The population PKPD assessment evaluated the effect of PK exposure measures (AUC Cmax and Ctrough) on various PD measures (change in SBP change in DBP However only the AUC was considered reliably estimated It is noted that AUC is a derived measure that may not bear as direct a relationship as Ctrough (observed value) on a given PD measure However Ctrough is related to AUC particularly at steady-state The equation relating AUC to change in SBP was
E = E0 ndash 221 x m logAUC
Where E = change in SBP E0 = baseline SBP m = slope and AUC = area under plasma concentration-time curve
The regression analyses yielded the following p lt 005 for slope and R2 lt 01 The relatively low R2 value suggests that the SBP data were highly variable and changes in SBP could not be accounted for entirely by AUC (exposure) Nevertheless there is a relationship between effectiveness and AUC that indicates that increasing exposure potentially increases effectiveness this finding supports dose titration
Change in Heart Rate The change in heart rate was defined as follows (Reviewerrsquos regression analysis)
E = I ndash 221 x m logAUC Where E = change in HR I = intercept and m =and AUC are as previously defined
The regression analyses yielded the following p lt 001 for slope and R2 = 011 The heart rate findings support metoprololrsquos known activity as a beta blocker
Page 12 of 98
Clinical Pharmacology Review NDA 19-962 Toprol-XL 10182006
Reviewer Note PKPD modeling with various hemodynamic measures The modeling exercises indicated that there was no difference in the PKPD modeling results using different hemodynamic data formats such as change in the measurements percent change in the measurements or actual BP measurements
2245 Exposure-Safety Highlights (per Applicant) According to the applicant Toprol XL was generally well tolerated in the pediatric population and there did not appear to be a clear dose-dependent effect in terms of severity or frequency of adverse events (tabulated below)
2246 Acceptability of sponsorrsquos proposed regimen The proposed initial dosage 10 mgkg QD followed by titration according to clinical response appears reasonable based on the dose-response information time course of maximal effect and exposure-response (AUC and SBP reduction) information It is unclear if the proposed initial dose is optimal since a dose-response relationship was not established for the primary efficacy variable and response rates were comparable across dose groups One should note that the proposed initial pediatric dosage is within the range of usual adult initial dosage 25 ndash 100 mg (assuming 70 kg adult ~ 036 ndash 143 mgkg)
The major unresolved issues are bull Absence of a clear dose-response relationship for the primary efficacy variable bull Unknown maximal dose in mg for initial therapy and titrationmaintenance therapy bull Unknown optimal titration frequency
Although these major issues are not completely resolved information provided in the submission provides adequate information to support the proposed dosage In brief these limitations are addressed in part by adopting the following approaches
bull Therapy will be initiated at a dose that was more effective than placebo yet was not the highest dose thus providing a safety window
bull Initial dosage (dose in mg) will be limited to a dose that produces exposure that is likely to be effective but does not exceed the highest studied dose (200 mg)
bull Titration will be allowed at a frequency no greater than once a week which is consistent with data obtained (time to peak activity) and previous information form metoprolol and other beta-blockers used in hypertension treatments
Page 13 of 98
Clinical Pharmacology Review NDA 19-962 Toprol-XL 10182006
2247 PKPD comparisons Pediatric patients vs adults A priori PKPD relationships are expected to differ between adults and children because the two populations have different disease processes (secondary hypertension in children vs essential or primary hypertension in adults) Results of the pediatric modeling exercise showed that a log-linear model appeared to work better than other models for the relationship between SBP and DBP and exposure (AUC) In adults the Sigmoid Emax model has been successfully applied in PKPD modeling exercises It should be noted that the adult data were not reanalyzed for this review so it is unclear if log-linear or linear models would be adequate
As illustrated in Table 4 Toprol XL is effective in adults as well as in children and appears to be effective across a similar concentration range Table 4 PKPD Comparisons- Pediatric Patients vs Adults
Pediatric Patients Adults Population hypertensive Typically healthy Model Log-linear Sigmoid Emax PD Markers Placebo corrected SBP DBP changes
at trough bull Reduction in exercise heart rate (betashy
blockade measure) bull Placebo corrected SBP DBP changes at
trough EffectiveTherapeutic metoprolol concentrations
Most concentrations lt 107 ngmL bull EC50 = 105 nmolL (281 ngmL) bull Emax achieved at concentrations above 400
nmolL (107 ngmL) bull Range between 80 and 300 nM
Maximal mean BP Reduction at Studied Doses
bull SBP reduction -6 bull DBP reduction -5
bull SBP reduction -10 bull DBP reduction -4
Effectiveness of metoprolol relative to placebo
Generally more effective over the course of treatment
Generally more effective over the course of
Time course of effect Maximal effect observed within 1 to 4 weeks after initiation of therapy
Maximal effect observed within 1 to 4 weeks after initiation of therapy
Utility in Poor CYP2D6 metabolizers (PMs)
Not evaluated Poor metabolizers have a higher plasma concentration and a greater duration or degree of beta blockade thus PMs may not need extended release formulations
Proposed Initial Dosage 10 mgkg ~ 70 mg QD 25 to 100 mg QD
Overall it appears the studied pediatric doses produce comparable changes in diastolic pressure but lower changes in systolic pressure However in pediatric patients it is unlikely that the maximal possible activity was achieved at the doses studied thus conceivably pediatric patients can achieve maximal effects comparable to adults at optimized pediatric doses Three challenges in making definitive PKPD comparisons between the pediatric (studied in this NDA) and adult population are as follows
1 Study conditions differ- typically in adult studies HR is measured during exercise and not at rest
2 Results are obtained in healthy adult subjects rather than hypertensive patients 3 Insufficient numbers of studies have been reported in the literature that attempt to
identify the relationship between metoprolol exposure and SBP or DBP effect in adults
Page 14 of 98
10182006 Clinical Pharmacology Review NDA 19-962 Toprol-XL
225 Pharmacokinetic characteristics of metoprolol
2251 Metoprolol pharmacokinetics in pediatric patients Metoprolol PK parameters obtained from the population PK analyses are summarized in Table 5 Table 5 Metoprolol population PK parameter estimates (SE ) obtained using final population PK model
PK Parameter Value CLF (Lhr) 2275 ( 114 ) V2F (L) 961 (203 ) V3F (L) 620 (255 ) QF (Lh) 675 (204) Ka (hrndash1) 00467 (192 ) Tlag1 (hr) 0853 (297)
The data in Table 5 are derived from a 2-compartment linear PK model with first-order elimination and flip-flop first-order absorption and lag time
2252 Metoprolol pharmacokinetic comparisons pediatric patients vs adults PK Parameter Comparison Overall pediatric PK parameters obtained following administration of Toprol-XL are comparable (similar magnitude) to those in adults receiving IR metoprolol Potential limitations of the stated comparison and finding include the use of different modeling approaches populations number of samples and number of subjects in the trials (Table 6) Table 6 Comparative PK (children vs adults)
Source NDA 19962 Luzier et al Taguchi et al Plosker and Cissold and other sources
Model 2 Comp 1st Order absorption
1 Comp
Formulation Toprol XL IR IR IR Population Pediatric Hypertension Healthy adults Japanese geriatric Sampling Intense and Ctrough Intensive Sparse intensive CLF (Lhrkg) 338 116 ndash 340 094 -V2F (Lkg) 128 270 ndash 398 452 -V3F 851 333 ndash 809 - -QF (Lhr) 899 282 ndash 694 - -T12 (h) 351 - - 3 - 6 Covariate Effects Based on CLF Age None - Yes YesNo Gender Effect None Yes - -Race None - - - The applicant noted that pediatric data were compared to adult data from IR where CLF is dominated by the disposition function of metoprolol therefore it may be complicated to compare adult data to pediatric data (Toprol XL) where CLF is under a considerable influence from the release rate (input function) of the device This appears to be a valid caveat Using AUC and dosing information (Table 8) adult CLF for Toprol-XL ~ 17 ndash 25 Lhrkg
Exposure Comparison Following administration of Toprol XL at comparable doses in mg pediatric patients and adults generally had similar metoprolol exposure Adult data from literature and archived clinical pharmacology and biopharmaceutics reviews are presented in Table 8 and pediatric data from
Page 15 of 98
Clinical Pharmacology Review NDA 19-962 Toprol-XL 10182006
population PK modeling (Study 307A) are presented in Table 7 The main limitations of the cross-population comparison is the pediatric doses are over the 125 to 200 mg dose range whereas adult data is for specific doses However reasonable comparisons can be made at the 100 mg dose level assuming the meanmedian values in pediatric patients offer an acceptable approximation of exposure values and are representative of the central tendency of the data In this case the adult and pediatric data have comparable
1 exposure at 100 mg 2 degree of variability
Table 7 Bayesian estimates of metoprolol PK exposure for those patients included in the PKPD analysis (N=65)
includes only data where concentration gt LOQ
Table 8 Metoprolol exposure in adults following administration of Toprol XL
Cmax Cmin AUC Literature References 50 179 ndash 190 86 ndash 104 286 - 351 100 96 ndash 759 107 ndash 305 533 - 1192 200 778 ndash 1139 310 ndash 447 1392 - 1892 FDA Archived Information 50 179 plusmn 182 85 plusmn 138 286 plusmn 346 100 544 plusmn 436 226 plusmn 234 827 plusmn 766
2253 Inter and intra-subject variability in metoprolol pharmacokinetic Based on the values of the standard error () associated with PK parameters (Table 5) metoprolol PK exhibited low variability (SE lt 30) However this estimate may not be reliable (under predicted) because concentrations lt LOQ were not included in the analysis Several subjects particularly those receiving 02 mgkg had concentrations lt LOQ In adults exposure is highly variable (CV gt 70 ) as reflected in exposure estimates and wide exposure ranges Table 8
Potential sources of variability following metoprolol administration (Toprol XL) in children include regio-selective absorption incomplete gastric emptying variable gastric motility varying metabolic activity (CYP2D6) and inconsistent absorption Some of these factors are also applicable to adults
23 What Intrinsic Factors Affect Metoprolol Exposure-Response
Based on the population pharmacokinetic model weight was the only potentially clinically meaningful intrinsic factor that affected metoprolol exposure and hence response Other intrinsic
Page 16 of 98
Clinical Pharmacology Review NDA 19-962 Toprol-XL 10182006
factors such as age height gender race and sex did not affect metoprolol exposure
231 Effect of weight The effect of weight on metoprolol CLF are illustrated in Figure 7 Figure 7 Variation of CLF with weight obtained in population PK analysis
CLF increased linearly with body weight relative to a 70 kg individual the CL of a 22 kg individual is 30 lower This decreased CL will result in an increased exposure (maximum 30 ) that does not pose additional safety concerns or appear clinically significant (tolerated in studies) It should be noted that exposure (AUC) accounted for an insignificant portion of the hemodynamic effect (poor correlation) thus the clinical implications of the impact of body weight on CLF of metoprolol identified in the population PK modeling are limited Consequently dose adjustment is not required based on body weight Furthermore the maximum initial dose is 50 mg thus subjects with weight gt 50 kg will receive a maximum dose of 50 mg diminishing the impact if any of weight-dependent clearance
232 Effect of Age The effect of age on QF the inter-compartmental clearance is illustrated in Figure 8 Figure 8 Variation of QF with age obtained in population PK analysis
Page 17 of 98
Clinical Pharmacology Review NDA 19-962 Toprol-XL 10182006
QF does not contribute significantly to overall clearance therefore the reported finding does not appear clinically relevant It should be noted that the observed QF-age relationship is atypical
233 Effect of intrinsic factors on exposure-response pediatrics vs adults As mentioned previously the only evaluated intrinsic factor that affected metoprolol exposure was body weight In adults age and gender effects have been reported although there are conflicting reports on the age effect The exposure in adult and pediatric population are both potentially affected by the CYP2D6 metabolizing status of the subject Metoprolol is metabolized primarily in the liver by CYP2D6 The scientific literature reports several instances in adults of varying metoprolol exposure by poor and extensive CYP 2D6 metabolizers In the pediatric studies (307A and 307B) there was one suspected poor metabolizer (Trough concentration was 2330 ngmL) but the metabolic status (PM or EM) of this individual was not confirmed
24 What extrinsic factors affect metoprolol exposure-response
The role of extrinsic factors were not specifically evaluated in the pediatric population however one anticipates that extrinsic factors that affect adults should be applicable to children
25 What analytical method was used in pediatric studies 307 A and 307B
Please refer to section 223
Page 18 of 98
Clinical Pharmacology Review NDA 19-962 Toprol-XL 10182006
(b) (4)
TOPROL-XL is not recommended in pediatric patients lt 6 years of age (see CLINICAL PHARMACOLOGY Pharmacokinetics and PRECAUTIONS Pediatric Use)
Page 21 of 98
Clinical Pharmacology Review NDA 19-962 Toprol-XL 10182006
4 APPENDICES
41 Sponsorrsquos Proposed Label
17 Page(s) of Draft Labeling has been Withheld in Full as B4 (CCITS) immediately following this page
Page 22 of 98
Clinical Pharmacology Review NDA 19-962 Toprol-XL 10182006
42 Pharmacometrics Review
Page 40 of 98
Clinical Pharmacology Review NDA 19-962 Toprol-XL 10182006
Office of Clinical Pharmacology Pharmacometrics Review
NDAIND 19-962 Volume Not applicable submitted electronically POP PK Report in Section 5335 (Network Path Cdsesub1n19962N_0002006-05-15hpbiohupharm) Compound Metoprolol succinate Submission Dates 05152006 Sponsor Astra Zeneca Pharmacometrics Reviewer Robert Kumi PhD Secondary Reviewer Yaning Wang PhD
TABLE OF CONTENTS
OFICE OF CLINICAL PHARMACOLOGY PHARMACOMETRICS REVIEW 41
EXECUTIVE SUMMARY 42
OVERALL CONCLUSIONS 43
INTRODUCTION 46
OBJECTIVES OF THE ANALYSIS 48
DOSE-RESPONSE ANALYSIS 49
METHODS (POPULATION PKPD) 60
RESULTS AND DISCUSSION 73
RECOMMENDATIONS 87
APPENDIX 90
DCP1PM Page 41 10182006
Clinical Pharmacology Review NDA 19-962 Toprol-XL 10182006
Executive Summary In NDA SE5 033 the applicant Astra Zeneca has proposed changes to the currently approved labeling for TOPROL-XL metoprolol succinate extended release
(b) (4)
tablets Metoprolol a beta blocker is approved for hypertension angina and heart failure in adults In adults with hypertension the usual initial dosage is 25 to 100 mg daily (single dose) as monotherapy or in combination with a diuretic this dosage is titrated at weekly intervals until optimum blood pressure reduction is achieved The current application focuses on Toprol-XL use in pediatric patients ge six years old The initial proposed dosing in children six and older is 10 mgkg subsequently the dose is titrated based on clinical response
Two clinical trials Studies 307A (dose-response) and 307B (safety extension of 307A) were conducted in pediatric patients with hypertension to support the proposed labeling changes The applicant conducted dose-response population PK (n = 120 patients) and PKPD (n = 65 patients) analyses using data from pediatric hypertensive patients receiving Toprol-XL in the mentioned studies
Key Findings from the Dose-Response and Population PKPD analyses follow 1 Dose-Response A statistically significant dose-response did not exist for placebo
(pooled)ndashcorrected ∆SBP from baseline however the relationship was evident when placebo (specific-group) ndashcorrected data were used
2 PK Model Metoprolol PK in children were well characterized by a 2shycompartment model with flip-flop first-order absorption and an absorption lag time The model yielded precise parameter estimates
3 Covariates Sex age race body weight and Toprol-XL dose had no clinically significant effect on metoprolol PK
4 PKPD Model Using a log-linear model or linear model there were weak but statistically significant relationships between the changes in DBP and SBP and measures of metoprolol plasma exposure (Ctrough AUC0ndash24 and Cmax) Overall parameters were not precisely estimated in most models due to a high degree of variability in the blood pressure data
DCP1PM Page 42 10182006
Clinical Pharmacology Review NDA 19-962 Toprol-XL 10182006
Overall Conclusions 1 Were metoprolol PK adequately characterized in the pediatric population Metoprolol PK in pediatric patients (n = 120 Age 6 to 17) were adequately characterized using a population pharmacokinetic approach The population model was validated and qualified and comprised a 2-compartment open model with first order absorption and absorption lag time
2 Are there any covariates that influence metoprolol PK in pediatric patients with hypertension The two covariates that influenced metoprolol PK were weight and age apparent oral clearance increased linearly with body weight and inter-compartmental clearance increased with age according to a power function Other covariates including race sex and metoprolol dose did not impact metoprolol kinetics
3 Was a PKPD relationship established between metoprolol dose or plasma exposure( AUC Ctrough or Cmax) and hemodynamic measures (blood pressure) Using a simple linear regression model no dose-response (reduction in placebo corrected systolic blood pressure the primary outcome variable) was observed although a weak (R2 lt 01) but statistically significant (p lt 005) PKPD relationship was observed between metoprolol exposure measures and reduction in systolic blood pressure The small R2 value indicates metoprolol exposure could account for only a small portion of the hemodynamic effect According to the model as exposure increased there was greater reduction in blood pressure However only the relationship with AUC was considered reliable as AUC was estimated with good precision (PK modeling) whereas Cmax was not
4 Is there sufficient evidence to support effectiveness of Toprol XL in pediatrics and the initial proposed pediatric dosage Yes Although dose-response was not established with SBP reduction (primary variable) suggesting that the effectiveness of the individual tested Toprol-XL doses could not be differentiated the following information provides evidence to suggest that some Toprol-XL doses were more effective than placebo
bull Analysis of treatment group effects and pairwise comparisons suggested that overall Toprol-XL demonstrated effectiveness in pediatric patients with hypertension pooled Toprol groups vs placebo (p = 00351) and relative to baseline each active Toprol-XL dose group decreased SBP whereas placebo did not
bull There was a dose-response relationship for reduction in diastolic blood pressure typically systolic and diastolic blood pressure effects mirror each other
bull PKPD findings (reduction in SBP and heart rate as a function of AUC) support metoprolol effectiveness (increased exposure led to increased effectiveness) The heart rate effect supports metoprololrsquos known beta blocking activity
bull Generally Toprol-XL was effective in pediatric patients and adult patients at similar metoprolol exposure levels 02 mgkg in pediatrics was minimally effective because this dose yielded exposures lower than that obtained in adults at the lowest effect adult dose 25 mg
DCP1PM Page 43 10182006
Clinical Pharmacology Review NDA 19-962 Toprol-XL 10182006
bull The proposed pediatric dosage 10 mgkg is supported by the results from the dose-response study Visual inspection and pairwise comparisons indicated that 10 mgkg (placebo corrected) was statistically the most effective dose (greater efficacy than 02 mgkg and 20 mgkg) and was more effective than placebo (p = 0027)
5 Will initial dosage adjustment be required for any pediatric patients prior to titration No dosage adjustment does not appear necessary prior to titration (typically one week after treatment begins) Based on the population PK model the only potentially relevant factor that could affect PK was body weight CLF increased linearly with body weight relative to a 70 kg individual the CL of a 22 kg individual is 30 lower This decreased CL will result in an increased exposure (maximum 30 ) that does not pose additional safety concerns or appear clinically significant (tolerated in studies) The proposed starting dose 10 mgkg and doses up to 20 mgkg (maximum 200 mg) were tolerated in the clinical trials (307A and 307B) Furthermore exposure accounted for an insignificant portion of the hemodynamic effect (poor correlation) thus the clinical implications of the impact of body weight on CLF of metoprolol identified in the population PK modeling are limited
to a higher and tolerable dose until optimum BP reduction is achieved is reasonable This
(b) (4)The proposal to start Toprol-XL at a low dose and titrate
is consistent with labeling for adults
6 Was the PKPD relationship influenced by covariates Insufficient data were available to make this assessment
7 Are the PK and PKPD of metoprolol in children comparable to that in adults PK values obtained in pediatric patients were generally in the same range as those reported in adults Potential limitations of the comparison are the different modeling approaches populations number of samples and number of subjects in the trials (Table B)
It is difficult to make definitive PKPD comparisons between the pediatric (studied in this NDA) and adult population because
1 Study conditions differ- typically in adult studies HR is measured during exercise and not at rest
2 Results are obtained in healthy adult subjects rather than hypertensive patients 3 Insufficient number of studies have been reported in the literature that attempt to
identify the relationship between metoprolol exposure and SBP or DBP effect in adults
DCP1PM Page 44 10182006
Clinical Pharmacology Review NDA 19-962 Toprol-XL 10182006
Table B PK Comparisons (Pediatrics vs Adults) Source NDA 19962 Luzier et al Taguchi et al Plosker and Cissold
and other sources Model 2 Comp 1st
Order absorption 1 Comp
Formulation Toprol XL IR IR PK Analyses Population StandardNCA Population Standard Population Pediatric Healthy adults Japanese geriatric Sampling Intense and
Ctrough Intensive Sparse intensive
CLF (Lhrkg) 338 116 ndash 340 094 V2F (Lkg) 128 270 ndash 398 452 V3F 851 333 ndash 809 QF (Lhr) 899 282 ndash 694 Ka (h-1) 00467 Tlag (h) 0853 T12 (h) 351 3 - 6 Tmax (h) 25 ndash 73 Covariate Effects on CLF Age None Yes YesNo Gender Effect None Yes Race None The applicant noted that pediatric data were compared to adult data from IR where CLF is dominated by the disposition function of metoprolol therefore it may be complicated to compare adult data to pediatric data (Toprol XL) where CLF is under a considerable influence from the release rate (input function) of the device This appears to be a valid caveat
It should be noted that the cause of hypertension in adults differs from that in children Results of the pediatric modeling exercise showed that a log-linear model appeared to work better than other models for both SBP and DBP In adults the Sigmoidal Emax model has been successfully applied Using the Hill Equation (Sigmoidal Emax model) with EHR reduction (measure of beta blockade) as the PD marker in adults EC50 = 105 nmolL (281 ngmL) and Emax is achieved at metoprolol plasma concentrations gt 400 nmolL (107 ngmL) Placebo-corrected mean blood pressure changes (standing) associated with concentrations producing maximal blockade are -10 for systolic and ndash 4 for diastolic In the pediatric study the observed maximal mean reductions (placebo corrected) at the studied doses were approximately -6 for systolic and -5 for diastolic Hence it appears the studied pediatric doses produce comparable changes in diastolic pressure but lower changes in systolic pressure It should be noted that in the pediatric studies only a few metoprolol plasma concentrations were gt than 107 ngmL It is unlikely that the maximal activity was achieved at the doses studied yet the Toprol doses appeared effective The differential maximal effects may also be due to the difference in initial SBP (adults patients with hypertension tend to have higher initial BPs) in adult and pediatric studies there was a dependence of change in SBP on initial SBP
DCP1PM Page 45 10182006
Clinical Pharmacology Review NDA 19-962 Toprol-XL 10182006
Introduction Summary
(b) (4)NDA SE5 033 was submitted to seek approval of labeling changes to the currently approved labeling for TOPROL-XL This labeling translates to a new Toprol-XL indication for pediatric patients (6 years and older) with hypertension
Background on Metoprolol in Hypertension The majority of the following information was obtained form a Review article (sponsor provided) by Plosker and Clissold [Drugs 43(3) 382-414 1992)]
Table 1 Snapshot of Metoprolol Clinical Pharmacology and Biopharmaceutics Drug Class Metoprolol is a szlig1-selective (cardio selective) adrenergic receptor-
blocking agent Mechanism of Action (antihypertensive effect)
Multiple putative mechanisms competitive antagonism of catecholamine at peripheral sites reduction of sympathetic outflow to the periphery or suppression of renin activity
Approved Indications Hypertension Heart Failure and Angina Pectoris Approved Formulations Immediate Release (IR) ndash metoprolol tartrate
Controlled Release (CRZ0K) Toprol-XL is extended-release tablet of metoprolol as the succinate salt
Metabolism Via CYP2D6 primarily Absorption Absolute oral bioavailability ~ 50 following IR Food does not affect
metoprolol absorption using ER formulation Distribution Protein binding to albumin is about 12 Elimination For IR t12 from 3 ndash 7 hours Less than 5 dose excreted unchanged
in urine No t12 values for ER this may be due to difficulty in separating absorption and elimination phases
Variability Plasma levels are highly variable among subjects after oral administration
Age Effects PK of metoprolol not affected by age (20 to 65 years) but concentration of active metabolite in subjects gt 65 years about twice as high as those in younger although metoprolol concentrations similar in two groups (Regardh et al)
PKPD in children Limited information in children and provided mainly after administration of metoprolol tartrate
Summarized PK and PKPD Information in Adults Table 2 Reported PK Values in Adults (multiple references)
References include Abrahamsson et al Sandberg et al Wieselgren et al
DCP1PM Page 46 10182006
Clinical Pharmacology Review NDA 19-962 Toprol-XL 10182006
Table 3 PKPD Information Reference Key Findings Abrahamsson et al Therapeutic level of szlig1blockade (model- reduction in exercise heart
rate or EHR) is between 80 and 300 nM Sandberg et al Toprol XL is designed to deliver metoprolol succinate at a near
constant rate for about 20 hr Wieselgren et al In healthy males maximal EHR ~ 14 and minimum reduction ~ 9
with 50 mg Activity greater than placebo over 24 hour period Dayer et al Lennard et al Jonkers et al
Poor metabolizers have a higher plasma concentration and a greater duration or degree of beta blockade Potential implications for use of extended release as may not be needed in PMs
Various sources Toprol XL produces clinically and statistically significant reductions in blood pressure values compared to baseline values The maximal blood pressure lowering effect for a given dose in adults is observed between 1 and 4 weeks of treatment In 4 week trials with Toprol XL the maximum decrease in supine BP was 209 and standing was 129 (unclear if at trough) At trough following 4 weeks of 50 mg QD Toprol XL relative to placebo the reduction in supine BP was 112 and 103 in Standing
Summary of sponsorrsquos current analysis relevant to pharmacometrics and resulting claims
Dose-Response Analysis A dose-response analysis was conducted using a simple linear regression model where metoprolol dose in mgkg was the independent variable Week 4 placebo corrected change in blood pressure (diastolic or systolic) from baseline was the dependent variable (response)
Sponsorrsquos Analysis Claims (Dose-Response Study) Following administration of TOPROL-XL at doses of 125 to 200 mg once daily for up to 4 weeks metoprolol
bull Exhibited a significant dose-response relationship for DBP but none for SBP bull Produced statistically significant and clinically meaningful reductions in SBP and
DBP for some individual andor pooled target dose groups (02 10 and 20 mgkg)
Population PK and PKPD Analyses The sponsorrsquos population PK and PKPD analyses involved the use of typical population PK approaches Primarily SAS and NONMEM were used to run the analyses In brief the sponsor pooled plasma concentration time data from patients in Study 307A (trough samples) and 307B (trough samples in most subjects and serial samples in a subset of patients) for the PK modeling PKPD (PD measured primarily as changes in blood pressure) data were from patients in Study 307A These collective data were used in the population PK and PKPD analyses
Initially the sponsor identified the best PK structural population model by testing several pharmacokinetic models This model was further refined by eliminating error terms (etas) that were not statistically significant Subsequently the sponsor evaluated the effect of DCP1PM Page 47 10182006
Clinical Pharmacology Review NDA 19-962 Toprol-XL 10182006
covariates on the PK model and developed a final PK model The goodness of the fit of the model was assessed with standard procedures The final population model was used to simulate individual plasma concentration-time profiles and Bayesian estimates for Cmax and AUC for all patients These simulated AUC and Cmax values and actual (observed) Ctrough were used in the PKPD model The PKPD model was developed in a similar manner as the population PK model Initially the best PKPD base model was identified and the model refined until a final PKPD model was identified
Sponsorrsquos Analysis Claims (Population PK and PD Modeling) 1 A 2-compartment PK model with first-order elimination and flip-flop first-order
absorption and lag time best fit metoprolol concentration-time data obtained from the studied pediatric hypertensive patients
2 The following tabulated parameter estimates were obtained using the final population PK model CLF 2275 Lhr V2F 961 L V3F 620 L QF 675 Lh Ka 00467 hrndash1 Tlag1 0853 hr
These PK values were generally in the same range as those reported in adults
3 Sex race ideal body weight and Toprol-XL dose have no significant effect on metoprolol pharmacokinetics No covariate impacts V2F V3F Ka or the Tlag of metoprolol Age has no effect on metoprolol CLF and body weight has no effect on QF Metoprolol CLF increases linearly with body weight however no dose adjustment based upon body weight is necessary because dosage is titrated based on clinical response QF is proportional to age however the increase in QF with age is not clinically relevant
4 Weak but statistically significant relationships existed between DBP SBP and HR and some measures of metoprolol exposure (trough plasma levels Cmax and AUC(0ndash 24)) Because of high variability in the hemodynamic data goodness-of-fit of the PKPD models was generally poor and the resulting parameter estimates were not considered reliable Extrapolation of these model parameters in the clinic for dose adjustment is not recommended
5 No covariates had an impact on the parameters delineating the PKPD relationship between metoprolol exposure and DBP SBP and HR
Objectives of the analysis There are three specific goals of the PM analysis
1 To evaluate the adequacy of the sponsorrsquos dose-response analysis 2 To evaluate sponsorrsquos population PK analysis and determine if PK labeling claims
are acceptable DCP1PM Page 48 10182006
Clinical Pharmacology Review NDA 19-962 Toprol-XL 10182006
3 To evaluate sponsorrsquos population PKPD analyses and determine if the findings support the proposed dosing recommendation
Dose Response Analysis (Study 307A) Title Dose Ranging Safety and Tolerability of TOPROL-XLreg
(metoprolol succinate) Extended-release Tablets (metoprolol CRXL) in Hypertensive Pediatric Subjects A Multicenter Double-blind Placebo-controlled Randomized Parallel-group Study
Study Duration 30 May 2002 - 9 June 2004 Investigators (primary) Bonita E Falkner MD and Jonathan Sorof MD 1800 Sites Multiple locations (36 in US and 1 in Dominican Republic)
Table 1 Objectives and Outcomes for Study 307A
Study Design (FDA-approved Type A design) This was a multi-center international double-blind placebo-controlled randomized parallel-group study The study included a screening visit a 1- to 2-week single-blind placebo run-in period during which all previous antihypertensive medications were discontinued and a 4-week double-blind treatment period At the end of the placebo run-in period eligible patients with blood pressure (BP) measurements in the qualifying range were randomized in a 1212 ratio to receive once daily oral doses of placebo TOPROL-XL 02 mgkg TOPROL-XL 10 mgkg or TOPROL-XL 20 mgkg TOPROL-XL doses of 125 25 375 50 75 100 150 or 200 mg were used to approximate the target doses Patients in the placebo and TOPROL-XL 02 mgkg groups received the target dose for 4 weeks while patients in the TOPROL-XL 10 mgkg and
DCP1PM Page 49 10182006
Clinical Pharmacology Review NDA 19-962 Toprol-XL 10182006
20 mgkg groups had their dose up-titrated (based on weight) to the target dose over the first 1 to 2 weeks of double-blind treatment
Reviewer Note Rationale on Study design The inclusion of more patients in the TOPROL-XL 02 mgkg and 20 mgkg groups allowed better estimation of the dose response at the low and high ends of the dose range The TOPROL-XL 10 mgkg group with fewer patients provided a middle estimate that helped to describe the shape of the dose-response curve However having a fewer number of subjects may have contributed to variability Inclusion of a placebo control group allowed for the quantification of treatment-related BP reductions after adjusting for placebo effect It should be noted that the placebo groups were not identical as they followed different titration schedules and had a different number of tablets
The 02 mgkg dose is lower than the lowest approved adult dose on a mgkg basis (assuming 70 kg adult weight) but the highest studied pediatric dose 20 mgkg (200 mg limit was placed) is lower than the highest studied adult dosage 400 mg
Table 2 Toprol Dosing Scheme for Study 307A
Table 3 Formulations used in 307A
DCP1PM Page 50 10182006
Clinical Pharmacology Review NDA 19-962 Toprol-XL 10182006
SPONSORrsquoS STATISTICAL ANALYSIS PLAN HIGHLIGHTS bull The primary analysis used an intention-to-treat (ITT) population which included
all patients who received at least 1 dose of study medication and had baseline and at least 1 post baseline measurement For this analysis missing data were imputed using a last observation carried forward (LOCF) approach
bull A simple linear regression analysis was performed on the placebo-corrected change from baseline to Week 4LOCF in sitting SBP and sitting DBP with dose ratio as the explanatory variable
bull The placebo correction for placebo-corrected changes from baseline to Week 4 LOCF in sitting SBP and sitting DBP was performed by subtracting the mean change from baseline for the placebo group from the individual patient changes in the other treatment groups
bull ANOVA was performed with treatment group as the main factor for the changes from baseline to each post baseline visit in sitting SBP and DBP This ANOVA model was used to construct pairwise comparisons of each active treatment versus placebo and the active treatment groups combined versus placebo
bull The percentage of responders at Week 4 was summarized by frequency counts percentages and 95 confidence intervals (CI) for each treatment group
bull Subgroup analyses were also performed on the changes from baseline at Week 4 in sitting SBP and DBP and the influence of heart rate and baseline body mass index (BMI) on the mean changes from baseline to Week 4LOCF in sitting SBP and DBP were examined using linear regressions
bull Trough plasma concentrations of metoprolol were summarized descriptively and the lower limit of quantitation (LLQ) was 1 ngmL
bull Safety data were summarized using the safety population defined as all patients who received at least 1 dose of study medication and were not lost to follow-up No statistical analyses were performed on the safety data in this study
DCP1PM Page 51 10182006
Clinical Pharmacology Review NDA 19-962 Toprol-XL 10182006
Results Patient Disposition Per applicant patients recruited into this study were representative of a pediatric population with hypertension The four treatment groups were balanced with respect to demographic and baseline characteristics (Tables 4 and 5) About 80 percent of the patients were considered 90 compliant
Table 4 Baseline Characteristics in Study 307A
Table 5 Sitting SBP and DBP measurements at baseline
Sitting and standing BP measurement were comparable (eg mean SBP for all patients- sitting = 1319 and standing 1306 with similar CVs ~ 9 )
Primary Efficacy Variable The results for the primary efficacy variable are illustrated in Figure 1 Figure Dose response for placebo-corrected change from baseline to Week4LOCF for sitting SBP (ITT population)
DCP1PM Page 52 10182006
Clinical Pharmacology Review NDA 19-962 Toprol-XL 10182006
Figure 1 Change in SBP from baseline as a function of Toprol XL dose
Table 6 Linear regressions statistics used to assess Dose-Response
The results indicate that bull The slope of the curve is not different form zero (p = 05371 for dose ratio)
suggesting that there is no dose-response relationship bull Most active treatment groups are more effective than placebo in reducing SBP
By visual inspection it appears the lack of observed dose-response is mainly driven by a lower than expected response at the 20 mgkg level
Potential issues affecting efficacy and pharmacokinetic results bull LOCF was required for eight patients however the LOCF approach did not
greatly impact the outcome of the trial bull Patients assigned to the 10 mg and 20 mgkg dose received drug for only 2
weeks whereas dose in the 02 mgkg received the same dose for 4 weeks
DCP1PM Page 53 10182006
Clinical Pharmacology Review NDA 19-962 Toprol-XL 10182006
Reviewerrsquos Supplemental Dose-Response Analyses The sponsorrsquos dose-response analysis was successfully reproduced by this Reviewer using pooled placebo corrected data A supplemental analysis was conducted using group-specific placebo corrected data In this procedure data for subjects assigned to a given Active Group (eg 02 mgkg) were corrected with Placebo data (02 mgkg) Group specific placebo data are presented in Table 7
Table 7 Placebo-group specific data Placebo Group Frequency Delta SBP 02 mgkg 8 -567 10 mgkg 6 -300 20 mgkg 9 230
It should be noted that the group-specific placebo data appeared to follow a consistent trend where the placebo effect decreased with increasing number of tablets It is unclear if this titrationtablet-dependent placebo effect is valid or random Overall the apparent differential placebo effects suggest that the placebo group may have overly influenced the outcome of the dose-response analysis
When active groups are corrected using group-matched placebo data there is a statistically significant dose-response The dose response using group-specific placebo data is illustrated in Table 8 and Figure 2
Figure 2 Placebo corrected changes in SBP (chg_pc on y axis) as a function of dose ratio
Potential Limitations of Supplemental Analyses Typically placebo effects are constant if randomization is correct thus it is unclear if subsetting the placebo group is acceptable and did not increase bias Additionally subsetting the placebo group leads to a reduced number of placebo subjects per dose group that may impact the regression analyses
DCP1PM Page 54 10182006
Clinical Pharmacology Review NDA 19-962 Toprol-XL 10182006
Table 8 SAS output for regression analyses using group-specific placebo corrections The REG Procedure
Model MODEL1
Dependent Variable chg_pc
Number of Observations Read 117
Number of Observations Used 117
Analysis of Variance
Sum of Mean
Source DF Squares Square F Value Pr gt F
Model 1 191083177 191083177 2663 lt0001
Error 115 825109481 7174865
Corrected Total 116 10162
Root MSE 847046 R-Square 01880
Dependent Mean -430358 Adj R-Sq 01810
Coeff Var -19682365
Parameter Estimates
Parameter Standard
Variable Label DF Estimate Error t Value Pr gt |t|
Intercept Intercept 1 125480 133166 094 03480
DOSRATIO Dose Ratio 1 -100051 019387 -516 lt0001
Secondary variables
bull Placebo-corrected change from baseline in sitting DBP The mean plusmn SD change (Week 4LOCF) in sitting DBP is illustrated in Figure 3 and Table 9
Figure 3 Mean changes (actual and placebo-corrected) from baseline to Week 4LOCF for sitting DBP (ITT population)
DCP1PM Page 55 10182006
Clinical Pharmacology Review NDA 19-962 Toprol-XL 10182006
Table 9 SAS output for regression analyses for DBP with pooled placebo correction
Treatment group effects and pairwise comparisons for sitting SBP and DBP Results of the treatment group effects at the Week 4LOCF visit and the pairwise comparisons between each TOPROL-XL group and placebo for the change from baseline in sitting SBP and DBP are shown for the ITT population in Table 10
Table 10 Treatment group effects for change in baseline to Week 4LOCF for sitting SBP and DBP (ITT population)
Some key findings from the pair-wise comparison are as follows (Table 10) 1 All active groups produced statistically significant reductions from baseline in sitting
SBP and DBP at the Week 4LOCF visit whereas placebo did not
DCP1PM Page 56 10182006
Clinical Pharmacology Review NDA 19-962 Toprol-XL 10182006
2 Overall the mean change from baseline in sitting SBP at Week 4LOCF for the TOPROL-XL groups pooled was statistically significantly larger than that for the placebo group (p=00351)
3 Results of pairwise comparisons between individual TOPROL-XL dose groups and placebo also revealed a statistically significant difference for the 10 and 20 mgkg groups (p=00270 and p=00492 respectively)
bull Mean changes over time in sitting SBP and DBP Consistent with findings from other studies with beta-blockers apparent maximal reduction in blood pressure occurred between 1 and 4 weeks of treatment
Figure 4 Mean changes over time for sitting SBP and DBP (ITT population)
Data points in plot are from absolute values (not taking baseline into account)
Subgroup Analyses The sponsor conducted several exploratory subgroup analyses however these analyses were not reviewed critically and are not presented in this review as
1 they do no impact the primary outcome or study objective 2 they are unlikely to be clinically useful due to the small number of patients per
subgroup One potentially useful some group analyses involved the percentage of responders as defined in Table 11
The responder analyses shows comparable response rates for all active dose groups suggesting similar efficacy across dose groups despite different exposure (doses)
DCP1PM Page 57 10182006
Clinical Pharmacology Review NDA 19-962 Toprol-XL 10182006
Table 11 Number and proportion of responders (ITT population)
Pharmacokinetic Results The Ctrough information obtained in the trial are summarized in Figure 6 and Tables 12 and 13
Table 12 Summary of Ctrough data (per applicant)
Sixteen patients across the 3 TOPROL-XL groups did not have blood samples obtained for analysis of metoprolol concentrations Based on the number of samples BLQ there appeared to be very low concentrations in the lowest dose group It appeared that Ctrough increased with dose According to the applicant these values are similar to those obtained previously in adults especially at the 2 higher doses Variability was high in all treatment groups (CV gt 60 )
Table 12 Summary of Ctrough (Reviewer Generated) from all patients (samples lt LOQ given value = 0) Toprol XL Dose Number of subjects Concentration (ngmL) (mgkg) Mean plusmn SD Median Range 02 39 137 plusmn 294 000 0 ndash 157 10 17 1224 plusmn 1416 845 0 ndash 571 20 46 2462 plusmn 3352 1140 0 ndash 1670
DCP1PM Page 58 10182006
Clinical Pharmacology Review NDA 19-962 Toprol-XL 10182006
Reviewer Note Overall the plasma concentrations (exposure) for the 02 mgkg dose group appear too low to be effective (close to LOQ) It is noted that adults typically have concentrations gt LOQ at the lowest therapeutic dose 25 mg (~ 4 ngmL)
Figure 6 Boxplot of metoprolol Ctrough using samples gt LLQ (per applicant)
Safety Results According to the applicant Toprol XL was well tolerated in the pediatric population as tabulated below
Main Analyses Conclusions bull No dose response was observed for corrected SBP using pooled placebo data
however using group-matched placebo data demonstrated a dose response bull Ctrough increased with dose bull Toprol 10 and 20 mg kg doses were more effective than placebo in reducing
SBP bull The responder rate was comparable across all active dose groups and this rate was
greater than that of placebo
DCP1PM Page 59 10182006
Clinical Pharmacology Review NDA 19-962 Toprol-XL 10182006
Methods Reviewerrsquos Methods Generally this reviewer conducted the analyses in a manner similar to that of the sponsor to confirm the sponsorrsquos findings
Sponsorrsquos Methods
Design Study1 307A
Reviewer Note This study was described in the Dose-Response Assessment (please refer to Page 7 Dose Response Analyses) Consequently only highlights relevant to the population analyses will be included in this section
Study 307A was a 4-week multi-center double-blind placebo-controlled randomized parallel-group study TOPROL-XL (metoprolol succinate) extended-release tablets were given to hypertensive pediatric patients Patients were randomized to double-treatment with a once daily oral dose of placebo or Toprol-XL at 1 of 3 target doses 02 or 20 mgkg The dose range for this study was 125 to 200 mg daily Patients on placebo followed the same schedule as that for their active group comparators
Study Flow Chart
Key Inclusion Criteria School age and adolescent children with reproducible SBP or DBP at or above the 95th percentile using height-adjusted charts for age and weight were eligible
DCP1PM Page 60 10182006
Clinical Pharmacology Review NDA 19-962 Toprol-XL 10182006
Study2 307B
Study 307B was a 52-week multi-center open-label study to determine the safety and pharmacokinetics of TOPROL-XL (metoprolol succinate) extended-release tablets (metoprolol CRXL) in hypertensive pediatric patients The starting dose was 25 mg daily The dose was increased every 2 weeks in increments of 25 mg or 50 mg based on tolerability until BP was controlled or the dose reached 200 mg
Table 1 Study Assessments
At the end of the 52-treatment period all patients had BP measured and a trough plasma level taken 24 hours the last dose of Toprol-XL with the exception of those patients who completed the serial portion at the final visit Among the participants a subgroup of approximately 30 patients was to participate in PK assessments of metoprolol requiring serial blood sampling at any time during the 52 weeks A single dose of 25 mg of Toprol-XL was given orally to those participating patients after a 48-hour washout period After the PK assessments they returned to the main study protocol Data
Study1 307A
4111 Pharmacokinetics A blood sample was to be collected at Visit 7 into a heparinized Vacutainer tube and obtained at 24 hours (plusmn2 hour) following the last dose of study medication (ie trough measurement) for determination of plasma metoprolol concentrations
Study Disposition Chart
DCP1PM Page 61 10182006
Clinical Pharmacology Review NDA 19-962 Toprol-XL 10182006
Table 2 Study Demographics
4112 Pharmacodynamics Primary variable
Sitting SBP determined at trough (24plusmn4 hours Visit 7) served as the primary efficacy assessment The primary measure of effect was the placebo-corrected change from baseline to the end of treatment (Week 4) in trough sitting SBP Each BP determination represented the mean of 3 readings with less than 7 mmHg between the highest and lowest value Blood pressure was measured using a mercury sphygmomanometer with an appropriate size cuff positioned approximately at the level of the heart Every effort was made to have the same individual measure the patientrsquos BP throughout the study if possible At all post randomization visits BP measurements were to be made at trough defined as 24 hours (plusmn4 hours) after receiving study medication All measurements were to be determined prior to the patient taking the scheduled dose of study medication In the
DCP1PM Page 62 10182006
Clinical Pharmacology Review NDA 19-962 Toprol-XL 10182006
event that the patient accidentally took study medication on the day of the scheduled visit the visit was to be rescheduled within 24 to 48 hours
Study2 307B
4113 Pharmacokinetics A 48-hour washout period prior to sampling was required for all patients including patients who entered the 52-week study and then decided to participate in the serial PK portion of the study All patients were to have a 15-mL blood sample collected into a heparinized Vacutainer tube 24 hours (plusmn2 hour) following the last dose of TOPROL-XL (ie trough measurement) at Visit 18 (or a the time of premature discontinuation) except for patients who participated in the serial PK portion of the study and had blood sampling performed at Visit 18 For patients participating in the serial PK portion of the study blood samples (15 mL) were to be collected into heparinized Vacutainer tubes and obtained at Hour 0 (predose) and at 1 2 3 4 6 8 10 and 24 hours after administration of a single 25 mg dose of TOPROL-XL following a 48-hour washout period After the last blood sample was obtained the patient was to startresume the prescribed dose of TOPROL-XL heshe was receiving prior to PK sampling
Patient Disposition Chart (completion or discontinuation)
Overall a total of 31 patients at 8 centers were enrolled in the serial PK portion of the study Of these 31 patients 27 had plasma concentration data available and were included in the analyses Four patients were excluded from the analyses because their plasma concentrations were not quantifiable (Nos 047-009 and 047-021) or because only whole blood samples were analyzed (Nos 005-002 005-003)
DCP1PM Page 63 10182006
Clinical Pharmacology Review NDA 19-962 Toprol-XL 10182006
Table 3 Subject Demographics for Patients Providing Serial Blood Samples
Missing Data Twenty-six patients did not have blood samples obtained for analysis of metoprolol concentrations in either the 16-week (n=7) or 52-week (n=19) studies Among patients with plasma samples 14 (14) in the 52-week study and 13 (13) in the 16-week study had trough plasma metoprolol concentrations that were below the LLQ Therefore data from a total of 99 patients were included in this analysis
Assay Metoprolol plasma levels were assayed using high-performance liquid chromatography tandem mass spectrometric detection methods having limit of quantitation (LOQ) of 1 ngmL The method was validated in the linear range 1 to 1000 ngmL Precision was less than or equal to 109 Accuracy ranged from 940 to 1013 Pharmacodynamics Not applicable
Data Checking SAS was used to format and check data Additionally visual inspection of several randomly selected subject data was carried out
DCP1PM Page 64 10182006
Clinical Pharmacology Review NDA 19-962 Toprol-XL 10182006
Models
Overview The sponsorrsquos stated assumptions underlying this modeling analysis are
1 Rich sampling data collected from 30 subjects in 307B Study can be used to adequately characterize the structural pharmacokinetic model of metoprolol
2 Structural pharmacokinetic models of metoprolol at other dose strength are identical to that at 25 mg
3 Metoprolol exhibits a linear pharmacokinetics in the dose ranges studied 4 Steady-state pharmacokinetics of metoprolol has been reached at the time of blood
sampling in Study 307A 5 Metoprolol accounts for the blood pressure effect in the study 6 Existing various disease states in the patients have no impact on the pharmacokinetics
of metoprolol and pharmacodynamics of the blood pressure reduction in the study 7 Concomitant medications if existed do not have any effects on the pharmacokinetics
of metoprolol and pharmacodynamics of the blood pressure reduction in the study
Reviewer Comment The sponsorrsquos assumptions appear reasonable based on existing metoprolol PKPD information
Pharmacokinetics
4114 PK Structural Model Several PK models were tested to identify the structural model Flip-flop absorption was taken into consideration based on general PK characteristics following administration of sustained release tablets and observed data in the current study (serial PK samples)
The models tested included linear 1- and 2-compartment PK models with the following characteristics (focused on flip-flop models)
bull first-order absorption with and without absorption lag time (NONMEM subroutines ADVAN2 and ADVAN4)
bull zero-order absorption with and without absorption lag time (NONMEM subroutines ADVAN1 and ADVAN3)
bull simultaneous zero- and first-order absorption from the absorption compartment The models were parameterized in terms of CLF and VF
Ultimately the 2-compartment model with first order flip-flop absorption an absorption lag time and 2 residual error terms was selected as the structural model of metoprolol The model scheme is presented in the following Figure 1 Figure 1 PK Compartmental Model
DCP1PM Page 65 10182006
Clinical Pharmacology Review NDA 19-962 Toprol-XL 10182006
4115 PK Covariate Model Covariate models were developed to account for the potential impact of the following covariates and derived covariates on metoprolol PK
Continuous variables bull Age (AGE years) bull Body weight (WT kg) bull Body surface area (BSA m2) calculated from WT and HT (cm) using the height
weight formula BSA=0024265 x WT 05378 x HT03964 bull Ideal body weight (IBW kg) calculated as - Males IBW=50+(HTndash150)25 and
for Females IBW=45+(HTndash150)25 bull Dose (DOSE mg of Toprol-XL)
Categorical variables bull Gender (SEX) - Male 0 - Female 1 bull Race (RACE) - Caucasian 0 - Black 1 - Asian 2 - Other 3
PK covariate effects were modeled as follows
Effects of continuous covariates (AGE WT BSA IBW and DOSE) were normalized to the corresponding median value across a dataset such that continuous covariates were related to structural PK parameters in a power function as described below
where Θ is the fixed-effect parameter of a covariate estimated by the NONMEM program covariate value is the observed covariate value and PK typical value is the typical value of the PK parameter estimated by NONMEM Effects of categorical covariates (SEX and RACE) are related to structural PK parameters by fractional changes of dummy variables
DCP1PM Page 66 10182006
Clinical Pharmacology Review NDA 19-962 Toprol-XL 10182006
Where Θ is the fixed-effect parameter of a covariate estimated by the NONMEM program covariate is the dummy variable value and modified in the control streams and PK typical value is the typical value of this PK parameter as estimated by NONMEM
Median values of all covariates in the dataset for population PK analysis are presented in Table A
Table A Summary of patient covariates and Toprol-XL doses in the data for population PK analysis
Two Steps were included in the modeling of covariates
Step 1 Forward Addition The covariates were subjected to a stepwise forward selection algorithm using a likelihood ratio test based on a change in MOF values from the base model A significant covariate reduced the MOF more than 660 (chi-square distribution plt001 degrees of freedom [df]=1)
Step 2 Backward deletion (Excluding procedures for covariate effect) The covariates in the full model acquired in Step 1 were subjected to a backward deletion algorithm 1 covariate was deleted at a time using a likelihood ratio test based on a change in MOF values A covariate was determined to be statistically significant if the change in MOF after its deletion from the breakdown model was increased by more than 1083 (chi-square distribution plt0001 df=1)
4116 PK Random Variance Models An exponential error model was used to characterize inter-patient variability based upon the assumption that random effects for PK parameters were not correlated among PK parameters No other error models for eta were evaluated by the applicant or by this Reviewer The retention of ETA values for each PK parameter in the structural model was confirmed by sequentially fixing each ETA value at zero and comparing each resultant MOF with the MOF obtained when all ETA values were retained in the model (see Table 6)
DCP1PM Page 67 10182006
Clinical Pharmacology Review NDA 19-962 Toprol-XL 10182006
The residual model was modeled by an additive model two error terms were used one for error associated with trough samples and the other with serial samples
Reviewer Note Use of an exponential model appears reasonable
Pharmacodynamics
4117 PKPD Structural Model The equations for the structural models are shown below
1 Metoprolol Ctrough The relationships between the observed metoprolol concentrations (Ctrough) and hemodynamic changes were investigated using 4 direct-link models namely a linear model a log-linear model and Hillrsquos sigmoid Emax PKPD model with and without a baseline
2 The relationships between Cmax or AUC0ndash24 and hemodynamic changes were investigated using 2 direct-link models a linear model and a log-linear model
4118 PKPD Covariate Model The inclusion and exclusion procedures of covariate effect on the selected PKPD base model to obtain a selected final PKPD model were identical to those in the covariate evaluation in the population PK models as described previously in PK Covariate Model DCP1PM Page 68 10182006
Clinical Pharmacology Review NDA 19-962 Toprol-XL 10182006
Table B Baseline demographic and covariate characteristics
4119 PKPD Random Variance Models An exponential error model was used by the applicant to model inter-individual variability The retention of a random effect parameter ETA in each selected PKPD structural model was then evaluated by sequentially fixing each ETA value at zero and comparing each resultant MOF with the MOF obtained when all ETA values were retained in the model (plt005) This step reduced over-parameterization by deleting unnecessary random-effect parameters from the structural model to obtain the base model
Reviewer Note The study design precludes assessment of inter-individual variability or random error because only one dose record was available per patient Consequently the model should not have included eta terms It is noted that the sponsor ultimately dropped the eta term in the final model
DCP1PM Page 69 10182006
Clinical Pharmacology Review NDA 19-962 Toprol-XL 10182006
Model Selection
PK Initial Model Selection
PK Base Model to Final Model The selection of the most appropriate PK base model for a metoprolol PK was based upon the following criteria a significant reduction in MOF as compared to the baseline model and asymptotic chi-square distribution based on the likelihood ratio test or AIC (plt005) as compared to the other structural models This selected PK base model was then subject to a covariate evaluation The population PK model bearing all surviving covariate parameters with statistical significance became the penultimate final model If 1 of the body size parameters (WT BSA and HT) was not in the model the penultimate final model became the final model If body size parameters were in the model they were sequentially replaced by other body size parameters in the regression submodel for each PK parameter The best body size parameter was then selected on the basis of lowest MOF to form the final model
PK Final Model Selection Simulations and visual inspections based on goodness of fit plots were used to qualify and validate the model The goodness-of-fit of the final model was evaluated graphically by comparing population and individual predictions of metoprolol concentrations with observed metoprolol concentrations along the line of unity and by visual inspection of the following plots of population-weighted residuals (WRES) for the final population model 1 Population-weighted residuals (WRES) versus population-predicted concentrations (PRED) 2 WRES versus time after first drug administration in each patient 3 WRES versus all covariates evaluated WRES were generally expected to be distributed homogenously around zero for PRED time after administration and covariates For those 27 patients with serial samples goodness-of-fit of the plasma concentration-time profile for each individual was visually inspected The linear relationship between their AUClast values from the observed data and those from the simulated data (final model) was examined
The predictive performance of the final population PK model including covariates was evaluated by comparing typical values of PK parameters with the mean of individual Bayesian estimates or individual values of PK parameters with the results from non-compartmental analysis for patients with serial samples Steady-state metoprolol plasma concentration-time profiles from 0ndash24 hours at the interval of 15 minutes (025 hour) were calculated using the post hoc Bayesian estimated PK parameter obtained for 65 patients included in the PKPD relationship using the following equation
DCP1PM Page 70 10182006
Clinical Pharmacology Review NDA 19-962 Toprol-XL 10182006
PKPD Initial and Final Model Selection A similar approach to that of PK model selection was adopted for PKPD Each of the above-mentioned PKPD models with random effects was identified by curve-fitting the dataset Initial selection of the PKPD structural model was based upon a significant reduction in MOF (plt005) as compared to the baseline model and reasonable PKPD parameter estimates Software
Nonlinear mixed-effect modeling (NONMEM) software (Version V level 11 Globomax Hanover MD) was used in the population PK analysis PK model fitting was accomplished using first-order (FO) approximation methods For PKPD model fitting the first-order conditional estimation (FOCE) with eta-epsilon interaction method in NONMEM was used for all model runs
SAS software (Version VIII Cary NC) was employed to prepare datasets according to the format required by the NONMEM program (Boeckmann et al 1991) Microsoftreg Excel 2000 (Redmond WA) and S-PLUS 2000 (Professional Release 2 MathSoft Inc Cambridge MA) were used to perform exploratory graphical exposure calculation and statistical analyses according to the format required by the NONMEM program (Boeckmann et al 1991) SAS command files logs and listings pertaining to data file conversion and merging were reviewed by an independent analyst Datasets were stored in SAS data frames combined and exported to Excel and then to ASCII files before fitting to the model
Datasets were prepared and pooled in a NONMEM-compliant format using SAS software by the Programming Group Clinical Information Sciences at AstraZeneca Wilmington Delaware SAS command files logs and listings pertaining to file conversion and merging were provided and found to be acceptable The contents of both datasets (toprolkatcsv for PK modeling and cppd2csv for PKPD modeling) were included
DCP1PM Page 71 10182006
Clinical Pharmacology Review NDA 19-962 Toprol-XL 10182006
toprolkatcsv was not provided electronically in a SAS format however this reviewer generated a similar dataset using the applicantrsquos criteria
Reviewer Comment The software and data assembly methods appeared adequate
DCP1PM Page 72 10182006
Clinical Pharmacology Review NDA 19-962 Toprol-XL 10182006
Results and Discussion Design Adequacy
Overall the trial designs appeared adequate to evaluate metoprolol population PK and PKPD in pediatric patients receiving Toprol XL However the design could have been further optimized by increasing the sampling points particularly in the absorption phase Due to the limited number of samples in the absorption phase it was not possible to accurately characterize the absorption model first order vs zero order or mixed first and zero order Additionally collection of mainly trough samples limits the ability to accurately estimate measures such as Cmax that are not directly related to Ctrough particularly if multiple compartments are present Consequently Cmax estimations are unlikely to be accurate Finally most patients provided only one trough sample thus inter-individual variability could not be adequately captured and may have limited the utility of the modeling exercise particularly in PKPD where the random effect could not be accurately characterized Ultimately there was no random variable in the final PKPD model (ie eta was set to zero) Data Integrity
This reviewer checked the data visually by randomly selecting data from patients included in the population modeling and comparing to data in the study report (source data) Overall the data integrity appeared acceptable The applicant observed the following guidelines that appeared acceptable No datum from any study participant with a protocol violation that was thought to materially impact the analysis was included The dataset contained data from only those study participants who could be evaluated ie with all the last dosing datetime blood sampling datetime plasma drug concentrations and demographic covariates
Data that were excluded (n = 62 samples) from the model were as follows One sample from an apparent poor metabolizer Two samples collected gt 96 hours post dose From 307B 10 trough samples lt LOQ From 307A 17 samples lt LOQ Thirty-samples from serial data that were lt LOQ or whole blood samples Model and Model Selection
Base Model
41110 Pharmacokinetic Model description The base PK model was a standard two compartment model that incorporated lag time and flip-flop kinetics The key features of the model were flip-flop was insured by making the value of ke gt ka in the clearance equation Additionally lag time was restricted to a value of 2 hours or less and concentrations were log transformed consequently all concentrations (F) = 0 were given individual predicted concentrations of zero Finally there were two residual error terms one for serial samples and the other for trough samples DCP1PM Page 73 10182006
Clinical Pharmacology Review NDA 19-962 Toprol-XL 10182006
Key equations were as follows
KA = THETA(1)EXP(ETA(1)) V2 = THETA(2)EXP(ETA(2)) CL = (THETA(1)THETA(2)+THETA(3))EXP(ETA(3)) Q = THETA(4)EXP(ETA(4)) V3 = THETA(5)EXP(ETA(5)) ALAG1=THETA(6)EXP(ETA(6))
41111 PK Parameter estimation results Table 1 Summary of PK parameters in the metoprolol population PK base model (per applicant)
41112 Goodness of fit The applicant provided the following goodness-of-fit plots (Figure 1)
Reviewer Note The goodness-of-fit plots were reproduced by this Reviewer (see Appendix) with minor modifications
Figure 1 Goodness of fit plots for Base Model
DCP1PM Page 74 10182006
Clinical Pharmacology Review NDA 19-962 Toprol-XL 10182006
Base PK Model Selection The MOF values of all structural model candidates tested are presented in Table 2 Model selection was based primarily on MOF values the lower MOF the better the model The applicant reports that in general MOF values generated by a conventional absorption model (ie absorption rate is faster than elimination rate) and a flip-flop absorption model (ie absorption rate is slower than elimination rate) were identical
Reviewer Comment The existence of flip-flop kinetics appears plausible based on data provided and general patterns for sustained release formulations Consequently the use of flip-flop kinetics for the bulk of the modeling exercise appears reasonable
General conclusions from the information in Table 2 are First order input is better than zero order input Two compartment model is better than one compartment model Lag time presence is better than lack of lag time Two residual error terms are better than one residual error term It should also be noted that several other models led to unsatisfactory completion of the run and were not considered further
DCP1PM Page 75 10182006
Clinical Pharmacology Review NDA 19-962 Toprol-XL 10182006
Table 2 Comparison of Structural PK Models
Reviewer Comment The selected structural model appears appropriate based on the data
Base Model The deletion of ETA for V2 did not change the MOF value suggesting that ETA for V2 should be deleted to avoid an over-parameterized warning (Table 3) This was consistent with the estimated parameter value of ETA for V2 being 648 x 10ndash9 a very small value Therefore the base model was selected by deleting the ETA for V2 from the structural model
Reviewer Comment on Eta deletion for V2 Deletion of eta for V2 is acceptable based on the empirical data however from a physiological perspective deletion of eta is problematic Generally one anticipates inter-individual differences in volume of distribution In this case it appears that the error associated with V2 may have been randomly shifted to V3 and or Q terms as the three DCP1PM Page 76 10182006
Clinical Pharmacology Review NDA 19-962 Toprol-XL 10182006
terms are interrelated This potential shift in error is supported by the fact that the V2 eta value increases significantly (by several orders of magnitude- 10-5 vs 100) when eta for Q and or V3 is fixed However when Q or V3 are fixed minimization is successful but Q and V3 are not accurately estimated Accounting for the possible error shift is a complex process and goes beyond the scope of this reviewer thus deletion of eta associated with V2 was considered acceptable for the remainder of the modeling evaluation
Table 3 Structural elements tested in the metoprolol population PK structural model (p lt 0005)
Final PK Model
41113 Model description The key feature of the final model is the inclusion of the covariate effects of age on Q and weight on CL in the population PK model
Key Equations CL = (THETA(1)THETA(2)+THETA(3)+EWT)EXP(ETA(2)) Q = THETA(4)EAGEEXP(ETA(3))
Including Covariate Effects As previously described covariate effects were assessed by forward addition and backward deletion Most covariates did not significantly change MOF however BSA significantly affected CL and Age affected Q Consequently these covariates were included in the penultimate final model
DCP1PM Page 77 10182006
Clinical Pharmacology Review NDA 19-962 Toprol-XL 10182006
Reviewer Note BSA is derived form WT and HT covariates implying BSA is highly correlated to these two covariates (Figure 2) weight is the most suitable (practical covariate) as it is readily measured Furthermore weight and BSA produced the same MOF (Table 4) whereas MOF with height was more positive (less significant)
Figure 2 Plot of BSA vs Body Weight
The data in Table 4 support selection of the final model
Table 4 Covariate elements tested in the metoprolol population PK penultimate final model (plt0005)
The applicant acknowledges that mechanism(s) accounting for the impact of age on QF are not clear However since distribution clearance has little effect on metoprolol plasma exposure further investigation is not needed
41114 PK Parameter estimation results As shown in Table 5 PK parameters were estimated fairly precisely by the final model
Table 5 PK Parameter Estimates using Final Model
DCP1PM Page 78 10182006
Clinical Pharmacology Review NDA 19-962 Toprol-XL 10182006
41115 Goodness of fit The goodness-of-fit plots provided by the applicant show good precision Figure 5 Goodness of fit plots for final PK model
DCP1PM Page 79 10182006
Clinical Pharmacology Review NDA 19-962 Toprol-XL 10182006
PK Model Qualification The post hoc Bayesian-estimated AUC (simulated) obtained for the 27 patients with serial plasma samples are plotted against the observed (AUCt) The correlation was high (R2 gt 099) Figure 6 AUClast from observed data versus AUCt from model simulation in the 27 patients providing serial plasma samples
Regression line Y= 4514 + 08976 X R2 = 09957
The graphical validation of the final metoprolol population PK model validation against covariates evaluated is presented in Figure 6
Figure 7 Graphical validation of covariates
DCP1PM Page 80 10182006
Clinical Pharmacology Review NDA 19-962 Toprol-XL 10182006
There was no systematic bias in weighted residuals for any covariates evaluated suggesting that the final model included all appreciable effects of available covariates (Figure)
The effects of weight on metoprolol CLF are illustrated in Figure 8 where Bayesian post hoc estimates of CLF are plotted against weight and overlaid by the model-predicted line Overall the model appeared to fit the data well
Figure 8 Plot of CLF vs Body weight
The effects of AGE on metoprolol QF are illustrated in Figure 9 where Bayesian post hoc estimates of QF are plotted against AGE and overlaid by the model-predicted line Figure 9 Plot of QF vs Age
DCP1PM Page 81 10182006
Clinical Pharmacology Review NDA 19-962 Toprol-XL 10182006
Reviewer Note The applicant indicated that attempts to run the final model using the first-order conditional estimation method resulted in termination errors Therefore the parameter estimates obtained by the FO method were reported as the final parameter estimates
Conclusion Regarding Population PK Modeling Overall the sponsorrsquos population PK modeling is acceptable
PKPD Model and Model Selection
PKPD Base Model PharmacokineticPharmacodynamic Model description The key feature of the model was a lack of random variance term for the slope (since only single data points were available per subject) and inclusion of baseline effect
Key equations were as follows E0 = THETA(1)EXP(ETA(1)) M = THETA(2) Y = E0 + MLOG(AUC) + EPS(1)
The control stream provided in the appendix is that for DBP (provided by sponsor) The control stream for SBP is comparable with appropriate substitution for BP type
It should be noted that only the log-linear and linear PKPD models were considered suitable for AUC and Cmax For this review only AUC estimates were considered reliable as Cmax estimates could not be accurately determined based on the sampling scheme Consequently the remainder of this review focuses on AUC information although Ctrough and Cmax data are displayed for reference
Bayesian estimates from PK modeling are summarized in Table 1
Table 1 Bayesian estimates of metoprolol PK exposure for those patients included in the PKPD analysis (N=65)
DCP1PM Page 82 10182006
Clinical Pharmacology Review NDA 19-962 Toprol-XL 10182006
PKPD Model Selection (initial and final) The log-linear model was adopted as the base model for this PKPD relationship since it improved the MOF significantly (Table 2) The ETA parameter for the slope was pre-eliminated for the purpose of model parsimony The intercept and slope in this log-linear model for AUC(0-24) did not bear ETA parameter therefore no covariates had impact on either parameter in the model
Reviewer Note The intercept should not have borne an eta term because individual subjects provided only one data point Consequently fixing eta to zero or deleting eta in the final model is appropriate No further model development was required after eta was eliminated and the base model was equivalent to the final model
Table 2 Base population PKPD models tested for the change in SBP
41116 PKPD Parameter estimation results The final PKPD parameter estimates are presented in Table 3
Table 3 Summary parameters in the final PKPD model for the change in SBP using trough plasma level Parameter Explanation Estimate SE ()b
DCP1PM Page 83 10182006
Clinical Pharmacology Review NDA 19-962 Toprol-XL 10182006
Model Qualification Based on the relatively low R2 value and as shown in Figure there is a poor correlation between change in SBP and log AUC
Figure 1 Relationship between change in SBP and AUC (line generated from modeling)
Overall goodness-of-fit of the model was considered to be poor probably due to the high variability in the measurements Consequently the precision of the model parameter estimates was not considered to be very reliable These parameters have little clinical usefulness and can be treated only as an indication of trends ie more hemodynamic effects can be potentially achieved when high Toprol-XL doses are given Clinical dose adjustment based on these PKPD parameters is not recommended
Reviewerrsquos Supplemental Analyses A supplemental PKPD analyses was conducted using simple linear regression since the population model did not improve the fit Overall eta made an insignificant contribution to the overall model The results of the analyses were similar to the population analyses A series of regression analyses were conducted and are presented in Table 4
The applicant notes that the preliminary modeling exercise found that there was no difference in the PKPD modeling results using different hemodynamic data formats (ie change in the measurements percent change in the measurements or actual BP measurements) This finding was confirmed by this reviewer (see Table 4)
DCP1PM Page 84 10182006
Clinical Pharmacology Review NDA 19-962 Toprol-XL 10182006
Table 4 Supplemental PKPD Regression Analyses Conducted by Reviewer Model (liner regression) Intercept (I) Slope (m) R2 Probability RSBP = mISBP + I 3957 -035 01626 0009 PSBP = mISBP + I 2524 -023 01252 00038 PSBP = mRSBP + I 0005 074 09891 lt 00001 RSBP = mlogAUC + I 651 -221 0060 00493 RSBP = mDose + I -751 0006 00026 06878 RSBP = mDose^ + I -312 -111 004 02711 RSBP = mlogAUC + nISBP + I 5303 -221 (m)
-035 (n) 02230 0001
RSBPplc = mAUC + I -667 -0003 00458 00871 RSBPplc = mlogAUC + I 461 -2208 00600 00493 RPUL = mlogAUC + I 1868 -405 01102 00069 Symbols in table similar to population PK model without eta term RSBP- change of SBP without placebo correction ISBP- initial (baseline) SBP RPUL- change in HR without placebo correction Dose- in mg where placebo is included as 0 mg PSBP- percentage change of SBP without placebo correction
Conclusion Regarding Population PKPD Modeling Overall the sponsorrsquos population PKPD modeling is acceptable No dose adjustment conclusion can be made from this modeling however an exposure-response relationship was established for AUC and reduction in SBP
Discussion
The significance of the results 1 Provide estimates of PK measures and plasma exposure in pediatric population These data can be compared to adult exposure to determine if exposure differences impact drug effectiveness The main challenge in comparing pediatric data to adult data is different modeling schemes formulations and methods were used in the two populations
2 PKPD findings are not sufficiently precise to provide a dose adjustment algorithm however the PKPD analyses provides rationale for proposed titration as increasing exposure (doses) may improve efficacy (reduction in SBP) Ultimately the risk-benefit analyses overrides PKPD assessment for dose adjustment drug will be titrated thus reliance on PKPD information is not critical The proposed dose 10 mgkg appears suitable based on available information It is unclear from the studies if there should be an initial maximum dose although the sponsor has proposed 50 mg as the maximum initial dose The proposed pediatric starting dose on a mgkg basis is within the range of starting adult doses (25 ndash 100 mg) assuming an adult weighs 70 kg
3 Cumulative information form dose-response study indicates that Toprol XL has effectiveness in children however the most effective dose is unclear Since the drug can be titrated determining the initial optimal dose does not appear critical As proposed by the applicant dosing is started at a ldquolowrdquo dose that can be up-titrated if needed
DCP1PM Page 85 10182006
Clinical Pharmacology Review NDA 19-962 Toprol-XL 10182006
4 The results did not adequately address the potential impact of CYP2D6 metabolic status for pediatric patients taking Toprol XL There were an insufficient number of patients to make this assessment
5 Covariate effects do not appear significant only body weight significantly affects clearance However a worst case scenario can occur with a person that has a low body weight and is a poor metabolizer this will result in very high possibly supra-therapeutic exposure Age does not impact apparent oral clearance so an age-dependent dose adjustment is not needed for children over 6 years old In essence all children over six years old can initiate therapy at 10 mgkg
The validity of the results Overall the results produced by the sponsor appear valid and the sponsor used a sound modeling approach However alternative approaches that could have been adopted may have improved the outcome of the analyses Three of these approaches are presented below 1 Additional PK samples should have been collected during the absorption phase and
throughout the dosing interval to improve the modelrsquos performance Specifically additional samples collected during the absorption phase may have unambiguously identified the actual absorption input function (eg first order zero order mixed first and zero order) First order input was selected for the analyses although the dosage form is reported to exhibit zero order kinetics in adults It is possible that the input rate in children differs from that in adults but unlikely It should be noted that absorption kinetics in children is often erratic due to multiple factors (eg regioshyselective absorption incomplete gastric emptying and inconsistent absorption) so it is unclear if additional samples would have definitively identified the absorption function However additional non-trough samples may have helped in estimating key PK measures such as V and Cmax The final model did not have an eta associated with V which is atypical Collection of additional samples on different visits may have helped estimate potential inter-occasion variability It should be noted that AUC was estimated precisely for subjects providing serial samples but these subjects were not necessarily included in the PKPD analyses Ideally the PKPD modeling should have been conducted primarily in subjects who had accurate PK measures
2 The PKPD design could have been modified to potentially improve the utility of the analyses Specifically there should have been better placebo matching procedures to minimize the potential impact of the placebo effect This matching could have been improved by ensuring all patients on placebo had the same titration schedule and number of tablets It is noted that the model had a poor predictive performance that was mainly attributed to the high degree of variability in the PD measures Potentially other PD markers could have been explored that have less inherent variability One such marker is the degree of beta blockade using exercise heart rate (EHR) reduction this marker has been used extensively for metoprolol in adult subjects However use of EHR in the pediatric setting may be challenging
DCP1PM Page 86 10182006
Clinical Pharmacology Review NDA 19-962 Toprol-XL 10182006
Comments to sponsor
In future pharmacometric studies you should consider the following 1 collect sufficient (multiple) samples from individual subjects to allow assessment
of inter-occasion variability and estimation of inter-individual variability (eta) for all relevant parameters
2 placebo groups should be identically matched across all dose groups (eg same titration schedule and number tablets) to minimize potential bias or differences in the placebo effect
Comments to medical reviewer
1 The sponsor has adequately characterized metoprolol PK in the studied pediatric population The PK characterization could have been further optimized by obtaining additional samples over the entire dosing interval (eg during the absorption phase and elimination phase) on multiple occasions rather than on one occasion primarily at trough
2 A dose-response relationship could not be established using the protocol specified analysis approach The outcome of the dose-response relationship appeared highly dependent on the ldquoplacebo effectrdquo suggesting that the placebo group may not have been appropriate One should consider re-evaluating the dose-response precisely matched placebo groups (eg all placebo patients have identical number of tablets and titration schedule)
3 Based on the PKPD analysis plasma exposure (AUC) explains lt 10 of the response (reduction in systolic blood pressure) thus has limited clinical utility However the PKPD relationship suggests that there is a trend for increased response with increased exposure (dose driven)
4 Overall information from the dose-response study suggests that Toprol- XL is effective in the pediatric population The optimal initial dose 02 10 or 20 mgkg or the maximum safe and effective dose cannot be determined from the information provided It is noted that the 02 mgkg dose is unlikely to be effective as plasma concentrations achieved at this dose are unlikely to be effective (most concentrations lt LOQ and lower than effective adult concentrations) The 10 mgkg (proposed by applicant) appears to be a reasonable initial dose The labeling should reflect the regimens studied
DCP1PM Page 89 10182006
Clinical Pharmacology Review NDA 19-962 Toprol-XL 10182006
Appendix
DCP1PM Page 90 10182006
Clinical Pharmacology Review NDA 19-962 Toprol-XL 10182006
DCP1PM Page 91 10182006
Clinical Pharmacology Review NDA 19-962 Toprol-XL 10182006
DCP1PM Page 92 10182006
Clinical Pharmacology Review NDA 19-962 Toprol-XL 10182006
DCP1PM Page 93 10182006
Clinical Pharmacology Review NDA 19-962 Toprol-XL 10182006
DCP1PM Page 94 10182006
Clinical Pharmacology Review NDA 19-962 Toprol-XL 10182006
DCP1PM Page 95 10182006
Clinical Pharmacology Review NDA 19-962 Toprol-XL 10182006
Table 15 Control streams for final log-linear PKPD model for the change in DBP using metoprolol Cmax as the measure of exposure
Truncated NONMEM reports for base model identification for PKPD relationship in change of SBP (per sponsor)
DCP1PM Page 96 10182006
Clinical Pharmacology Review NDA 19-962 Toprol-XL 10182006
Reported PD information^
^ Under metoprolol regimen CRZ0K is Toprol XL
DCP1PM Page 97 10182006
Clinical Pharmacology Review NDA 19-962 Toprol-XL 10182006
Table Results of randomised double-blind comparative trials evaluating antihypertensive efficacy of metoprolol formulations or other antihypertensives
DCP1PM Page 98 10182006
---------------------------------------------------------------------------------------------------------------------
---------------------------------------------------------------------------------------------------------------------
---------------------
This is a representation of an electronic record that was signed electronically and this page is the manifestation of the electronic signature
s
Robert Kumi 10182006 045635 PM BIOPHARMACEUTICS
Patrick Marroum 10192006 050811 PM BIOPHARMACEUTICS
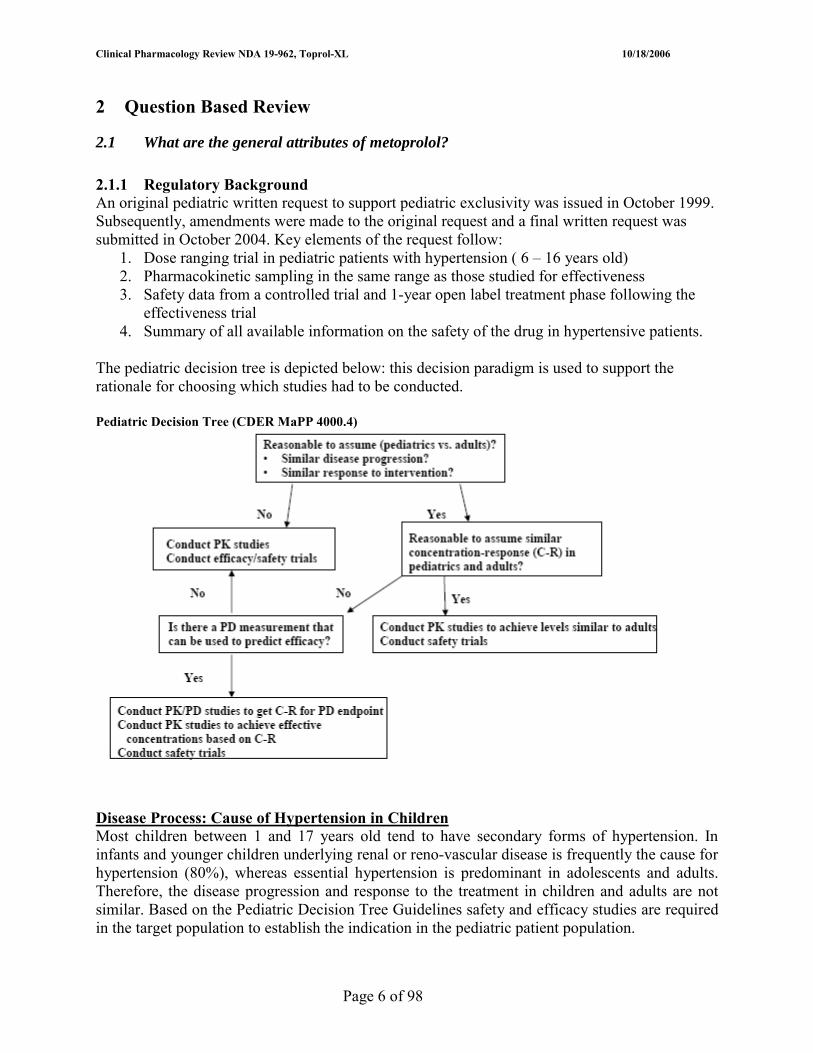
Clinical Pharmacology Review NDA 19-962 Toprol-XL 10182006
2 Question Based Review
21 What are the general attributes of metoprolol
211 Regulatory Background An original pediatric written request to support pediatric exclusivity was issued in October 1999 Subsequently amendments were made to the original request and a final written request was submitted in October 2004 Key elements of the request follow
1 Dose ranging trial in pediatric patients with hypertension ( 6 ndash 16 years old) 2 Pharmacokinetic sampling in the same range as those studied for effectiveness 3 Safety data from a controlled trial and 1-year open label treatment phase following the
effectiveness trial 4 Summary of all available information on the safety of the drug in hypertensive patients
The pediatric decision tree is depicted below this decision paradigm is used to support the rationale for choosing which studies had to be conducted
Pediatric Decision Tree (CDER MaPP 40004)
Disease Process Cause of Hypertension in Children Most children between 1 and 17 years old tend to have secondary forms of hypertension In infants and younger children underlying renal or reno-vascular disease is frequently the cause for hypertension (80) whereas essential hypertension is predominant in adolescents and adults Therefore the disease progression and response to the treatment in children and adults are not similar Based on the Pediatric Decision Tree Guidelines safety and efficacy studies are required in the target population to establish the indication in the pediatric patient population
Page 6 of 98
10182006 Clinical Pharmacology Review NDA 19-962 Toprol-XL
212 Selected background information on metoprolol Background on Metoprolol in Hypertension
Table 1 Snapshot of metoprolol clinical pharmacology and biopharmaceutic information
Drug Class Metoprolol is a szlig1-selective (cardio selective) adrenergic receptor-blocking agent Mechanism of Action (antihypertensive effect)
Multiple putative mechanisms competitive antagonism of catecholamine at peripheral sites reduction of sympathetic outflow to the periphery or suppression of renin activity
Approved Indications Hypertension Heart Failure and Angina Pectoris Approved Formulations 1 Immediate Release (IR) ndash metoprolol tartrate
2 Toprol-XL is extended-release tablet of metoprolol as the succinate salt it is also referred to as metoprolol in literature as controlled release (CRZ0K)
Metabolism Via CYP2D6 primarily Absorption Absolute oral bioavailability ~ 50 following IR Food does not affect metoprolol
absorption using ER formulation Distribution Protein binding to albumin is about 12 Elimination For IR t12 from 3 ndash 7 hours Less than 5 dose excreted unchanged in urine No
t12 values for ER this may be due to difficulty in separating absorption and elimination phases
Variability Plasma levels are highly variable among subjects after oral administration PKPD in children Limited information in children information obtained following administration of
metoprolol tartrate (IR) Please refer to NDA 19-962 for additional background information
213 Proposed Formulation Administration Route and Dosage The formulation proposed for pediatric use is Toprol-XL this formulation will be given orally at an initial dosage of 10 mgkg once daily (QD) Subsequently the dosage will be titrated depending on clinical response The maximum dosage studied was 200 mg QD Toprol-XL is available as a 25 (scored tablet) 50 100 and 200 mg tablet (b) (4)
22 What are the general clinical pharmacology characteristics of metoprolol succinate
221 Design features of clinical studies used to support dosing in the target population Two studies were conducted in hypertensive pediatric studies Study 307A and 307B the design features of these studies are summarized in Table 2 Table 2 Study Designs
Study Name Study 307A (D4020C00033) Study 307B (D4020C00001)
Objective Determine dose-response in children Determine long-term safety Doses Toprol XL 02 10 and 20 mgkg QD (maximum
200 mg QD) and Placebo Initial 25 mg QD then titrated to optimal clinical response (maximum 200 mg QD)
Design Feature bull 1-2 week placebo run-in period bull Patients in 10 and 20 mgkg groups dosed
over 2 week period but 02 mgkg group received dose for 4 weeks
Patients continuing from 307A or new enrollees
PK Features Ctrough (week 4) Ctrough (last study visit) and serial PK in subset (n = 31)
Primary Measures Outcome
Change in placebo-corrected trough sitting BP from baseline at week 4
Long-term safety using effective Toprol dose
LOCF approach followed
Page 7 of 98
Clinical Pharmacology Review NDA 19-962 Toprol-XL 10182006
222 Clinical response (efficacy) endpoints
Pharmacodynamics bull Primary variable Sitting SBP determined at trough (24plusmn4 hours Visit 7) served as the primary efficacy assessment The primary measure of effect was the placebo-corrected change from baseline to the end of treatment (Week 4) in trough sitting SBP Each BP determination represented the mean of 3 readings with less than 7 mmHg between the highest and lowest value bull Secondary variables Secondary variables included trough sitting DBP and percentage of responders at Week 4
223 Idenitifcation and measurement of metoprolol concentrations in plasma Metoprolol appeared to be adequately identified and measured in Study 307A and 307B A validated HPLC with tandem mass spectrometry method was used to quantify metoprolol Key features of the assay were bull limit of quantitation (LOQ) = 1 ngmL bull linear range = 1 to 1000 ngmL bull Precision measured by CV () le 109 bull Accuracy measured by relative bias ranged from ndash 6 to + 13 Overall the assay performance was acceptable
224 Metoprolol exposure-response The exposure-response evaluation revealed that
bull There was no clear dose-response relationship for effectiveness (primary variable change in sitting SBP) in the target patient population using the planned analysis (Sponsorrsquos) but there was a dose-response for the secondary efficacy variable (Sponsorrsquos)
bull There was a dose-response relationship for effectiveness when group-specific placebo correction was employed (Reviewerrsquos)
bull The proposed initial dosage regimen and subsequent titration are supported by 1) Existence of an exposure-response relationship for Ctrough and AUC and SBP
reduction 2) Overall Toprol XL being more effective than placebo at reducing SBP and DBP 3) For a given dose maximal efficacy occurring between 1 and 4 weeks after
treatment initiation bull There was no clear dose-response relationship for safety
2241 Dose-Response Assessment using Primary Variable and Analyses
Sponsors Analyses Primary Variable The dose-response relationship for Study 307A is depicted in Figure 1 When pooled placebo data were used for correcting change in SBP the slope of the curve is not different form zero (p = 05371 for dose ratio) suggesting that there is no dose response By visual inspection it appears the lack of observed dose-response is mainly driven by a lower than expected response at the 20 mgkg level Patients assigned to the 10 mg and 20 mgkg dose received drug for only 2 weeks whereas dose in the 02 mgkg received the same dose for 4 weeks It is unclear if this difference in titration schedule influenced the outcome
Page 8 of 98
Clinical Pharmacology Review NDA 19-962 Toprol-XL 10182006
Figure 1 Dose response for placebo-corrected change from baseline to Week4LOCF for sitting SBP (ITT population)
Reviewerrsquos Analysis Primary Variable When group-specific placebo corrected data were used for correcting change in SBP there was a statistically significant dose-response (Figure 2) Figure 2 Placebo corrected changes in SBP (chg_pc) as a function of dose ratio (relative to 02 mgkg)
In this procedure data for subjects assigned to a given active group (eg 02 mgkg) were corrected with placebo data (02 mgkg) It should be noted that the group-specific placebo data appeared to follow a consistent trend where the placebo effect decreased with increasing number of tablets It is unclear if this titrationtablet-dependent placebo effect is valid or random Overall the apparent differential placebo effects suggest that the placebo group may have overly influenced the outcome of the dose-response analysis Two potential limitations of this Reviewerrsquos supplemental analyses are
1 Typically placebo effects are constant if randomization is appropriate thus it is unclear if sub-setting the placebo group is reasonable and did not increase bias
2 Additionally sub-setting the placebo group leads to a reduced number of placebo subjects per dose group that may decrease the robustness of the regression findings
Page 9 of 98
Clinical Pharmacology Review NDA 19-962 Toprol-XL 10182006
2242 Dose-Response Assessment using Secondary Variable and Analyses
Treatment Group Effects and Pairwise Comparisons for sitting SBP and DBP Key findings from the group and pair-wise comparisons are 1 All active groups produced statistically significant reductions from baseline (p lt 002) in
sitting SBP (|∆ SBP| gt 5 mmHg) and DBP (|∆ DBP| gt 3 mmHg) at the Week 4LOCF visit whereas placebo (p = 03133) did not
2 Overall the mean change from baseline in sitting SBP (|∆ SBP| = 4256) at Week 4LOCF for the TOPROL-XL groups pooled was statistically significantly larger (p=00351) than that for the placebo group
3 Pairwise comparisons between individual TOPROL-XL dose groups and placebo also revealed a statistically significant difference for the 10 and 20 mgkg groups (p=00270 and p=00492 respectively) the 02 mgkg group was not different from placebo
Sponsorrsquos Analyses Secondary variable A dose-response relationship was observed for the secondary efficacy variable (delta DBP) as depicted in Figure 3 Figure 3 Mean changes (actual and placebo-corrected) from baseline to Week 4LOCF for sitting DBP (ITT population)
2243 Dose-Response assessment based on subgroup analyses (per Sponsor) and time course
Subgroup Analyses The sponsor conducted several exploratory subgroup analyses however these analyses were not reviewed critically and are not presented in this review as
1 they do no impact the primary outcome or study objective 2 they are unlikely to be clinically useful due to the small number of patients per subgroup
However one potentially useful group analyses involved the percentage of responders as defined in Table 3 The responder analyses shows
1) greater percentage of responders in active dose group relative to placebo 2) comparable response rates for all active dose groups suggesting similar efficacy across
dose groups despite different exposure (doses)
Page 10 of 98
Clinical Pharmacology Review NDA 19-962 Toprol-XL 10182006
Table 3 Number and proportion of responders (ITT population)
Time course of effect (2- to 4-week treatment period) Consistent with findings from other studies with metoprolol and some beta-blockers apparent maximal reduction in blood pressure occurred between 1 and 4 weeks of treatment The mean changes over time in sitting SBP and DBP are depicted in Figure 4 Figure 4 Mean changes over time for sitting SBP and DBP (ITT population)
Data points in plot are from absolute values (not taking baseline into account) and subjects in 10 and 20 mgkg received drug after two weeks on 02 mgkg
2244 PKPD Assessments Overall there were statistically significant relationships between metoprolol exposure particularly AUC and SBP reduction as shown in Figure 5 Similar findings were observed for heart rate reduction Figure 6
Page 11 of 98
Clinical Pharmacology Review NDA 19-962 Toprol-XL 10182006
Change in SBP Figure 5 Change in SBP vs log (AUC) ndash per Sponsor Figure 6 Change in HR vs AUC
The population PKPD assessment evaluated the effect of PK exposure measures (AUC Cmax and Ctrough) on various PD measures (change in SBP change in DBP However only the AUC was considered reliably estimated It is noted that AUC is a derived measure that may not bear as direct a relationship as Ctrough (observed value) on a given PD measure However Ctrough is related to AUC particularly at steady-state The equation relating AUC to change in SBP was
E = E0 ndash 221 x m logAUC
Where E = change in SBP E0 = baseline SBP m = slope and AUC = area under plasma concentration-time curve
The regression analyses yielded the following p lt 005 for slope and R2 lt 01 The relatively low R2 value suggests that the SBP data were highly variable and changes in SBP could not be accounted for entirely by AUC (exposure) Nevertheless there is a relationship between effectiveness and AUC that indicates that increasing exposure potentially increases effectiveness this finding supports dose titration
Change in Heart Rate The change in heart rate was defined as follows (Reviewerrsquos regression analysis)
E = I ndash 221 x m logAUC Where E = change in HR I = intercept and m =and AUC are as previously defined
The regression analyses yielded the following p lt 001 for slope and R2 = 011 The heart rate findings support metoprololrsquos known activity as a beta blocker
Page 12 of 98
Clinical Pharmacology Review NDA 19-962 Toprol-XL 10182006
Reviewer Note PKPD modeling with various hemodynamic measures The modeling exercises indicated that there was no difference in the PKPD modeling results using different hemodynamic data formats such as change in the measurements percent change in the measurements or actual BP measurements
2245 Exposure-Safety Highlights (per Applicant) According to the applicant Toprol XL was generally well tolerated in the pediatric population and there did not appear to be a clear dose-dependent effect in terms of severity or frequency of adverse events (tabulated below)
2246 Acceptability of sponsorrsquos proposed regimen The proposed initial dosage 10 mgkg QD followed by titration according to clinical response appears reasonable based on the dose-response information time course of maximal effect and exposure-response (AUC and SBP reduction) information It is unclear if the proposed initial dose is optimal since a dose-response relationship was not established for the primary efficacy variable and response rates were comparable across dose groups One should note that the proposed initial pediatric dosage is within the range of usual adult initial dosage 25 ndash 100 mg (assuming 70 kg adult ~ 036 ndash 143 mgkg)
The major unresolved issues are bull Absence of a clear dose-response relationship for the primary efficacy variable bull Unknown maximal dose in mg for initial therapy and titrationmaintenance therapy bull Unknown optimal titration frequency
Although these major issues are not completely resolved information provided in the submission provides adequate information to support the proposed dosage In brief these limitations are addressed in part by adopting the following approaches
bull Therapy will be initiated at a dose that was more effective than placebo yet was not the highest dose thus providing a safety window
bull Initial dosage (dose in mg) will be limited to a dose that produces exposure that is likely to be effective but does not exceed the highest studied dose (200 mg)
bull Titration will be allowed at a frequency no greater than once a week which is consistent with data obtained (time to peak activity) and previous information form metoprolol and other beta-blockers used in hypertension treatments
Page 13 of 98
Clinical Pharmacology Review NDA 19-962 Toprol-XL 10182006
2247 PKPD comparisons Pediatric patients vs adults A priori PKPD relationships are expected to differ between adults and children because the two populations have different disease processes (secondary hypertension in children vs essential or primary hypertension in adults) Results of the pediatric modeling exercise showed that a log-linear model appeared to work better than other models for the relationship between SBP and DBP and exposure (AUC) In adults the Sigmoid Emax model has been successfully applied in PKPD modeling exercises It should be noted that the adult data were not reanalyzed for this review so it is unclear if log-linear or linear models would be adequate
As illustrated in Table 4 Toprol XL is effective in adults as well as in children and appears to be effective across a similar concentration range Table 4 PKPD Comparisons- Pediatric Patients vs Adults
Pediatric Patients Adults Population hypertensive Typically healthy Model Log-linear Sigmoid Emax PD Markers Placebo corrected SBP DBP changes
at trough bull Reduction in exercise heart rate (betashy
blockade measure) bull Placebo corrected SBP DBP changes at
trough EffectiveTherapeutic metoprolol concentrations
Most concentrations lt 107 ngmL bull EC50 = 105 nmolL (281 ngmL) bull Emax achieved at concentrations above 400
nmolL (107 ngmL) bull Range between 80 and 300 nM
Maximal mean BP Reduction at Studied Doses
bull SBP reduction -6 bull DBP reduction -5
bull SBP reduction -10 bull DBP reduction -4
Effectiveness of metoprolol relative to placebo
Generally more effective over the course of treatment
Generally more effective over the course of
Time course of effect Maximal effect observed within 1 to 4 weeks after initiation of therapy
Maximal effect observed within 1 to 4 weeks after initiation of therapy
Utility in Poor CYP2D6 metabolizers (PMs)
Not evaluated Poor metabolizers have a higher plasma concentration and a greater duration or degree of beta blockade thus PMs may not need extended release formulations
Proposed Initial Dosage 10 mgkg ~ 70 mg QD 25 to 100 mg QD
Overall it appears the studied pediatric doses produce comparable changes in diastolic pressure but lower changes in systolic pressure However in pediatric patients it is unlikely that the maximal possible activity was achieved at the doses studied thus conceivably pediatric patients can achieve maximal effects comparable to adults at optimized pediatric doses Three challenges in making definitive PKPD comparisons between the pediatric (studied in this NDA) and adult population are as follows
1 Study conditions differ- typically in adult studies HR is measured during exercise and not at rest
2 Results are obtained in healthy adult subjects rather than hypertensive patients 3 Insufficient numbers of studies have been reported in the literature that attempt to
identify the relationship between metoprolol exposure and SBP or DBP effect in adults
Page 14 of 98
10182006 Clinical Pharmacology Review NDA 19-962 Toprol-XL
225 Pharmacokinetic characteristics of metoprolol
2251 Metoprolol pharmacokinetics in pediatric patients Metoprolol PK parameters obtained from the population PK analyses are summarized in Table 5 Table 5 Metoprolol population PK parameter estimates (SE ) obtained using final population PK model
PK Parameter Value CLF (Lhr) 2275 ( 114 ) V2F (L) 961 (203 ) V3F (L) 620 (255 ) QF (Lh) 675 (204) Ka (hrndash1) 00467 (192 ) Tlag1 (hr) 0853 (297)
The data in Table 5 are derived from a 2-compartment linear PK model with first-order elimination and flip-flop first-order absorption and lag time
2252 Metoprolol pharmacokinetic comparisons pediatric patients vs adults PK Parameter Comparison Overall pediatric PK parameters obtained following administration of Toprol-XL are comparable (similar magnitude) to those in adults receiving IR metoprolol Potential limitations of the stated comparison and finding include the use of different modeling approaches populations number of samples and number of subjects in the trials (Table 6) Table 6 Comparative PK (children vs adults)
Source NDA 19962 Luzier et al Taguchi et al Plosker and Cissold and other sources
Model 2 Comp 1st Order absorption
1 Comp
Formulation Toprol XL IR IR IR Population Pediatric Hypertension Healthy adults Japanese geriatric Sampling Intense and Ctrough Intensive Sparse intensive CLF (Lhrkg) 338 116 ndash 340 094 -V2F (Lkg) 128 270 ndash 398 452 -V3F 851 333 ndash 809 - -QF (Lhr) 899 282 ndash 694 - -T12 (h) 351 - - 3 - 6 Covariate Effects Based on CLF Age None - Yes YesNo Gender Effect None Yes - -Race None - - - The applicant noted that pediatric data were compared to adult data from IR where CLF is dominated by the disposition function of metoprolol therefore it may be complicated to compare adult data to pediatric data (Toprol XL) where CLF is under a considerable influence from the release rate (input function) of the device This appears to be a valid caveat Using AUC and dosing information (Table 8) adult CLF for Toprol-XL ~ 17 ndash 25 Lhrkg
Exposure Comparison Following administration of Toprol XL at comparable doses in mg pediatric patients and adults generally had similar metoprolol exposure Adult data from literature and archived clinical pharmacology and biopharmaceutics reviews are presented in Table 8 and pediatric data from
Page 15 of 98
Clinical Pharmacology Review NDA 19-962 Toprol-XL 10182006
population PK modeling (Study 307A) are presented in Table 7 The main limitations of the cross-population comparison is the pediatric doses are over the 125 to 200 mg dose range whereas adult data is for specific doses However reasonable comparisons can be made at the 100 mg dose level assuming the meanmedian values in pediatric patients offer an acceptable approximation of exposure values and are representative of the central tendency of the data In this case the adult and pediatric data have comparable
1 exposure at 100 mg 2 degree of variability
Table 7 Bayesian estimates of metoprolol PK exposure for those patients included in the PKPD analysis (N=65)
includes only data where concentration gt LOQ
Table 8 Metoprolol exposure in adults following administration of Toprol XL
Cmax Cmin AUC Literature References 50 179 ndash 190 86 ndash 104 286 - 351 100 96 ndash 759 107 ndash 305 533 - 1192 200 778 ndash 1139 310 ndash 447 1392 - 1892 FDA Archived Information 50 179 plusmn 182 85 plusmn 138 286 plusmn 346 100 544 plusmn 436 226 plusmn 234 827 plusmn 766
2253 Inter and intra-subject variability in metoprolol pharmacokinetic Based on the values of the standard error () associated with PK parameters (Table 5) metoprolol PK exhibited low variability (SE lt 30) However this estimate may not be reliable (under predicted) because concentrations lt LOQ were not included in the analysis Several subjects particularly those receiving 02 mgkg had concentrations lt LOQ In adults exposure is highly variable (CV gt 70 ) as reflected in exposure estimates and wide exposure ranges Table 8
Potential sources of variability following metoprolol administration (Toprol XL) in children include regio-selective absorption incomplete gastric emptying variable gastric motility varying metabolic activity (CYP2D6) and inconsistent absorption Some of these factors are also applicable to adults
23 What Intrinsic Factors Affect Metoprolol Exposure-Response
Based on the population pharmacokinetic model weight was the only potentially clinically meaningful intrinsic factor that affected metoprolol exposure and hence response Other intrinsic
Page 16 of 98
Clinical Pharmacology Review NDA 19-962 Toprol-XL 10182006
factors such as age height gender race and sex did not affect metoprolol exposure
231 Effect of weight The effect of weight on metoprolol CLF are illustrated in Figure 7 Figure 7 Variation of CLF with weight obtained in population PK analysis
CLF increased linearly with body weight relative to a 70 kg individual the CL of a 22 kg individual is 30 lower This decreased CL will result in an increased exposure (maximum 30 ) that does not pose additional safety concerns or appear clinically significant (tolerated in studies) It should be noted that exposure (AUC) accounted for an insignificant portion of the hemodynamic effect (poor correlation) thus the clinical implications of the impact of body weight on CLF of metoprolol identified in the population PK modeling are limited Consequently dose adjustment is not required based on body weight Furthermore the maximum initial dose is 50 mg thus subjects with weight gt 50 kg will receive a maximum dose of 50 mg diminishing the impact if any of weight-dependent clearance
232 Effect of Age The effect of age on QF the inter-compartmental clearance is illustrated in Figure 8 Figure 8 Variation of QF with age obtained in population PK analysis
Page 17 of 98
Clinical Pharmacology Review NDA 19-962 Toprol-XL 10182006
QF does not contribute significantly to overall clearance therefore the reported finding does not appear clinically relevant It should be noted that the observed QF-age relationship is atypical
233 Effect of intrinsic factors on exposure-response pediatrics vs adults As mentioned previously the only evaluated intrinsic factor that affected metoprolol exposure was body weight In adults age and gender effects have been reported although there are conflicting reports on the age effect The exposure in adult and pediatric population are both potentially affected by the CYP2D6 metabolizing status of the subject Metoprolol is metabolized primarily in the liver by CYP2D6 The scientific literature reports several instances in adults of varying metoprolol exposure by poor and extensive CYP 2D6 metabolizers In the pediatric studies (307A and 307B) there was one suspected poor metabolizer (Trough concentration was 2330 ngmL) but the metabolic status (PM or EM) of this individual was not confirmed
24 What extrinsic factors affect metoprolol exposure-response
The role of extrinsic factors were not specifically evaluated in the pediatric population however one anticipates that extrinsic factors that affect adults should be applicable to children
25 What analytical method was used in pediatric studies 307 A and 307B
Please refer to section 223
Page 18 of 98
Clinical Pharmacology Review NDA 19-962 Toprol-XL 10182006
(b) (4)
TOPROL-XL is not recommended in pediatric patients lt 6 years of age (see CLINICAL PHARMACOLOGY Pharmacokinetics and PRECAUTIONS Pediatric Use)
Page 21 of 98
Clinical Pharmacology Review NDA 19-962 Toprol-XL 10182006
4 APPENDICES
41 Sponsorrsquos Proposed Label
17 Page(s) of Draft Labeling has been Withheld in Full as B4 (CCITS) immediately following this page
Page 22 of 98
Clinical Pharmacology Review NDA 19-962 Toprol-XL 10182006
42 Pharmacometrics Review
Page 40 of 98
Clinical Pharmacology Review NDA 19-962 Toprol-XL 10182006
Office of Clinical Pharmacology Pharmacometrics Review
NDAIND 19-962 Volume Not applicable submitted electronically POP PK Report in Section 5335 (Network Path Cdsesub1n19962N_0002006-05-15hpbiohupharm) Compound Metoprolol succinate Submission Dates 05152006 Sponsor Astra Zeneca Pharmacometrics Reviewer Robert Kumi PhD Secondary Reviewer Yaning Wang PhD
TABLE OF CONTENTS
OFICE OF CLINICAL PHARMACOLOGY PHARMACOMETRICS REVIEW 41
EXECUTIVE SUMMARY 42
OVERALL CONCLUSIONS 43
INTRODUCTION 46
OBJECTIVES OF THE ANALYSIS 48
DOSE-RESPONSE ANALYSIS 49
METHODS (POPULATION PKPD) 60
RESULTS AND DISCUSSION 73
RECOMMENDATIONS 87
APPENDIX 90
DCP1PM Page 41 10182006
Clinical Pharmacology Review NDA 19-962 Toprol-XL 10182006
Executive Summary In NDA SE5 033 the applicant Astra Zeneca has proposed changes to the currently approved labeling for TOPROL-XL metoprolol succinate extended release
(b) (4)
tablets Metoprolol a beta blocker is approved for hypertension angina and heart failure in adults In adults with hypertension the usual initial dosage is 25 to 100 mg daily (single dose) as monotherapy or in combination with a diuretic this dosage is titrated at weekly intervals until optimum blood pressure reduction is achieved The current application focuses on Toprol-XL use in pediatric patients ge six years old The initial proposed dosing in children six and older is 10 mgkg subsequently the dose is titrated based on clinical response
Two clinical trials Studies 307A (dose-response) and 307B (safety extension of 307A) were conducted in pediatric patients with hypertension to support the proposed labeling changes The applicant conducted dose-response population PK (n = 120 patients) and PKPD (n = 65 patients) analyses using data from pediatric hypertensive patients receiving Toprol-XL in the mentioned studies
Key Findings from the Dose-Response and Population PKPD analyses follow 1 Dose-Response A statistically significant dose-response did not exist for placebo
(pooled)ndashcorrected ∆SBP from baseline however the relationship was evident when placebo (specific-group) ndashcorrected data were used
2 PK Model Metoprolol PK in children were well characterized by a 2shycompartment model with flip-flop first-order absorption and an absorption lag time The model yielded precise parameter estimates
3 Covariates Sex age race body weight and Toprol-XL dose had no clinically significant effect on metoprolol PK
4 PKPD Model Using a log-linear model or linear model there were weak but statistically significant relationships between the changes in DBP and SBP and measures of metoprolol plasma exposure (Ctrough AUC0ndash24 and Cmax) Overall parameters were not precisely estimated in most models due to a high degree of variability in the blood pressure data
DCP1PM Page 42 10182006
Clinical Pharmacology Review NDA 19-962 Toprol-XL 10182006
Overall Conclusions 1 Were metoprolol PK adequately characterized in the pediatric population Metoprolol PK in pediatric patients (n = 120 Age 6 to 17) were adequately characterized using a population pharmacokinetic approach The population model was validated and qualified and comprised a 2-compartment open model with first order absorption and absorption lag time
2 Are there any covariates that influence metoprolol PK in pediatric patients with hypertension The two covariates that influenced metoprolol PK were weight and age apparent oral clearance increased linearly with body weight and inter-compartmental clearance increased with age according to a power function Other covariates including race sex and metoprolol dose did not impact metoprolol kinetics
3 Was a PKPD relationship established between metoprolol dose or plasma exposure( AUC Ctrough or Cmax) and hemodynamic measures (blood pressure) Using a simple linear regression model no dose-response (reduction in placebo corrected systolic blood pressure the primary outcome variable) was observed although a weak (R2 lt 01) but statistically significant (p lt 005) PKPD relationship was observed between metoprolol exposure measures and reduction in systolic blood pressure The small R2 value indicates metoprolol exposure could account for only a small portion of the hemodynamic effect According to the model as exposure increased there was greater reduction in blood pressure However only the relationship with AUC was considered reliable as AUC was estimated with good precision (PK modeling) whereas Cmax was not
4 Is there sufficient evidence to support effectiveness of Toprol XL in pediatrics and the initial proposed pediatric dosage Yes Although dose-response was not established with SBP reduction (primary variable) suggesting that the effectiveness of the individual tested Toprol-XL doses could not be differentiated the following information provides evidence to suggest that some Toprol-XL doses were more effective than placebo
bull Analysis of treatment group effects and pairwise comparisons suggested that overall Toprol-XL demonstrated effectiveness in pediatric patients with hypertension pooled Toprol groups vs placebo (p = 00351) and relative to baseline each active Toprol-XL dose group decreased SBP whereas placebo did not
bull There was a dose-response relationship for reduction in diastolic blood pressure typically systolic and diastolic blood pressure effects mirror each other
bull PKPD findings (reduction in SBP and heart rate as a function of AUC) support metoprolol effectiveness (increased exposure led to increased effectiveness) The heart rate effect supports metoprololrsquos known beta blocking activity
bull Generally Toprol-XL was effective in pediatric patients and adult patients at similar metoprolol exposure levels 02 mgkg in pediatrics was minimally effective because this dose yielded exposures lower than that obtained in adults at the lowest effect adult dose 25 mg
DCP1PM Page 43 10182006
Clinical Pharmacology Review NDA 19-962 Toprol-XL 10182006
bull The proposed pediatric dosage 10 mgkg is supported by the results from the dose-response study Visual inspection and pairwise comparisons indicated that 10 mgkg (placebo corrected) was statistically the most effective dose (greater efficacy than 02 mgkg and 20 mgkg) and was more effective than placebo (p = 0027)
5 Will initial dosage adjustment be required for any pediatric patients prior to titration No dosage adjustment does not appear necessary prior to titration (typically one week after treatment begins) Based on the population PK model the only potentially relevant factor that could affect PK was body weight CLF increased linearly with body weight relative to a 70 kg individual the CL of a 22 kg individual is 30 lower This decreased CL will result in an increased exposure (maximum 30 ) that does not pose additional safety concerns or appear clinically significant (tolerated in studies) The proposed starting dose 10 mgkg and doses up to 20 mgkg (maximum 200 mg) were tolerated in the clinical trials (307A and 307B) Furthermore exposure accounted for an insignificant portion of the hemodynamic effect (poor correlation) thus the clinical implications of the impact of body weight on CLF of metoprolol identified in the population PK modeling are limited
to a higher and tolerable dose until optimum BP reduction is achieved is reasonable This
(b) (4)The proposal to start Toprol-XL at a low dose and titrate
is consistent with labeling for adults
6 Was the PKPD relationship influenced by covariates Insufficient data were available to make this assessment
7 Are the PK and PKPD of metoprolol in children comparable to that in adults PK values obtained in pediatric patients were generally in the same range as those reported in adults Potential limitations of the comparison are the different modeling approaches populations number of samples and number of subjects in the trials (Table B)
It is difficult to make definitive PKPD comparisons between the pediatric (studied in this NDA) and adult population because
1 Study conditions differ- typically in adult studies HR is measured during exercise and not at rest
2 Results are obtained in healthy adult subjects rather than hypertensive patients 3 Insufficient number of studies have been reported in the literature that attempt to
identify the relationship between metoprolol exposure and SBP or DBP effect in adults
DCP1PM Page 44 10182006
Clinical Pharmacology Review NDA 19-962 Toprol-XL 10182006
Table B PK Comparisons (Pediatrics vs Adults) Source NDA 19962 Luzier et al Taguchi et al Plosker and Cissold
and other sources Model 2 Comp 1st
Order absorption 1 Comp
Formulation Toprol XL IR IR PK Analyses Population StandardNCA Population Standard Population Pediatric Healthy adults Japanese geriatric Sampling Intense and
Ctrough Intensive Sparse intensive
CLF (Lhrkg) 338 116 ndash 340 094 V2F (Lkg) 128 270 ndash 398 452 V3F 851 333 ndash 809 QF (Lhr) 899 282 ndash 694 Ka (h-1) 00467 Tlag (h) 0853 T12 (h) 351 3 - 6 Tmax (h) 25 ndash 73 Covariate Effects on CLF Age None Yes YesNo Gender Effect None Yes Race None The applicant noted that pediatric data were compared to adult data from IR where CLF is dominated by the disposition function of metoprolol therefore it may be complicated to compare adult data to pediatric data (Toprol XL) where CLF is under a considerable influence from the release rate (input function) of the device This appears to be a valid caveat
It should be noted that the cause of hypertension in adults differs from that in children Results of the pediatric modeling exercise showed that a log-linear model appeared to work better than other models for both SBP and DBP In adults the Sigmoidal Emax model has been successfully applied Using the Hill Equation (Sigmoidal Emax model) with EHR reduction (measure of beta blockade) as the PD marker in adults EC50 = 105 nmolL (281 ngmL) and Emax is achieved at metoprolol plasma concentrations gt 400 nmolL (107 ngmL) Placebo-corrected mean blood pressure changes (standing) associated with concentrations producing maximal blockade are -10 for systolic and ndash 4 for diastolic In the pediatric study the observed maximal mean reductions (placebo corrected) at the studied doses were approximately -6 for systolic and -5 for diastolic Hence it appears the studied pediatric doses produce comparable changes in diastolic pressure but lower changes in systolic pressure It should be noted that in the pediatric studies only a few metoprolol plasma concentrations were gt than 107 ngmL It is unlikely that the maximal activity was achieved at the doses studied yet the Toprol doses appeared effective The differential maximal effects may also be due to the difference in initial SBP (adults patients with hypertension tend to have higher initial BPs) in adult and pediatric studies there was a dependence of change in SBP on initial SBP
DCP1PM Page 45 10182006
Clinical Pharmacology Review NDA 19-962 Toprol-XL 10182006
Introduction Summary
(b) (4)NDA SE5 033 was submitted to seek approval of labeling changes to the currently approved labeling for TOPROL-XL This labeling translates to a new Toprol-XL indication for pediatric patients (6 years and older) with hypertension
Background on Metoprolol in Hypertension The majority of the following information was obtained form a Review article (sponsor provided) by Plosker and Clissold [Drugs 43(3) 382-414 1992)]
Table 1 Snapshot of Metoprolol Clinical Pharmacology and Biopharmaceutics Drug Class Metoprolol is a szlig1-selective (cardio selective) adrenergic receptor-
blocking agent Mechanism of Action (antihypertensive effect)
Multiple putative mechanisms competitive antagonism of catecholamine at peripheral sites reduction of sympathetic outflow to the periphery or suppression of renin activity
Approved Indications Hypertension Heart Failure and Angina Pectoris Approved Formulations Immediate Release (IR) ndash metoprolol tartrate
Controlled Release (CRZ0K) Toprol-XL is extended-release tablet of metoprolol as the succinate salt
Metabolism Via CYP2D6 primarily Absorption Absolute oral bioavailability ~ 50 following IR Food does not affect
metoprolol absorption using ER formulation Distribution Protein binding to albumin is about 12 Elimination For IR t12 from 3 ndash 7 hours Less than 5 dose excreted unchanged
in urine No t12 values for ER this may be due to difficulty in separating absorption and elimination phases
Variability Plasma levels are highly variable among subjects after oral administration
Age Effects PK of metoprolol not affected by age (20 to 65 years) but concentration of active metabolite in subjects gt 65 years about twice as high as those in younger although metoprolol concentrations similar in two groups (Regardh et al)
PKPD in children Limited information in children and provided mainly after administration of metoprolol tartrate
Summarized PK and PKPD Information in Adults Table 2 Reported PK Values in Adults (multiple references)
References include Abrahamsson et al Sandberg et al Wieselgren et al
DCP1PM Page 46 10182006
Clinical Pharmacology Review NDA 19-962 Toprol-XL 10182006
Table 3 PKPD Information Reference Key Findings Abrahamsson et al Therapeutic level of szlig1blockade (model- reduction in exercise heart
rate or EHR) is between 80 and 300 nM Sandberg et al Toprol XL is designed to deliver metoprolol succinate at a near
constant rate for about 20 hr Wieselgren et al In healthy males maximal EHR ~ 14 and minimum reduction ~ 9
with 50 mg Activity greater than placebo over 24 hour period Dayer et al Lennard et al Jonkers et al
Poor metabolizers have a higher plasma concentration and a greater duration or degree of beta blockade Potential implications for use of extended release as may not be needed in PMs
Various sources Toprol XL produces clinically and statistically significant reductions in blood pressure values compared to baseline values The maximal blood pressure lowering effect for a given dose in adults is observed between 1 and 4 weeks of treatment In 4 week trials with Toprol XL the maximum decrease in supine BP was 209 and standing was 129 (unclear if at trough) At trough following 4 weeks of 50 mg QD Toprol XL relative to placebo the reduction in supine BP was 112 and 103 in Standing
Summary of sponsorrsquos current analysis relevant to pharmacometrics and resulting claims
Dose-Response Analysis A dose-response analysis was conducted using a simple linear regression model where metoprolol dose in mgkg was the independent variable Week 4 placebo corrected change in blood pressure (diastolic or systolic) from baseline was the dependent variable (response)
Sponsorrsquos Analysis Claims (Dose-Response Study) Following administration of TOPROL-XL at doses of 125 to 200 mg once daily for up to 4 weeks metoprolol
bull Exhibited a significant dose-response relationship for DBP but none for SBP bull Produced statistically significant and clinically meaningful reductions in SBP and
DBP for some individual andor pooled target dose groups (02 10 and 20 mgkg)
Population PK and PKPD Analyses The sponsorrsquos population PK and PKPD analyses involved the use of typical population PK approaches Primarily SAS and NONMEM were used to run the analyses In brief the sponsor pooled plasma concentration time data from patients in Study 307A (trough samples) and 307B (trough samples in most subjects and serial samples in a subset of patients) for the PK modeling PKPD (PD measured primarily as changes in blood pressure) data were from patients in Study 307A These collective data were used in the population PK and PKPD analyses
Initially the sponsor identified the best PK structural population model by testing several pharmacokinetic models This model was further refined by eliminating error terms (etas) that were not statistically significant Subsequently the sponsor evaluated the effect of DCP1PM Page 47 10182006
Clinical Pharmacology Review NDA 19-962 Toprol-XL 10182006
covariates on the PK model and developed a final PK model The goodness of the fit of the model was assessed with standard procedures The final population model was used to simulate individual plasma concentration-time profiles and Bayesian estimates for Cmax and AUC for all patients These simulated AUC and Cmax values and actual (observed) Ctrough were used in the PKPD model The PKPD model was developed in a similar manner as the population PK model Initially the best PKPD base model was identified and the model refined until a final PKPD model was identified
Sponsorrsquos Analysis Claims (Population PK and PD Modeling) 1 A 2-compartment PK model with first-order elimination and flip-flop first-order
absorption and lag time best fit metoprolol concentration-time data obtained from the studied pediatric hypertensive patients
2 The following tabulated parameter estimates were obtained using the final population PK model CLF 2275 Lhr V2F 961 L V3F 620 L QF 675 Lh Ka 00467 hrndash1 Tlag1 0853 hr
These PK values were generally in the same range as those reported in adults
3 Sex race ideal body weight and Toprol-XL dose have no significant effect on metoprolol pharmacokinetics No covariate impacts V2F V3F Ka or the Tlag of metoprolol Age has no effect on metoprolol CLF and body weight has no effect on QF Metoprolol CLF increases linearly with body weight however no dose adjustment based upon body weight is necessary because dosage is titrated based on clinical response QF is proportional to age however the increase in QF with age is not clinically relevant
4 Weak but statistically significant relationships existed between DBP SBP and HR and some measures of metoprolol exposure (trough plasma levels Cmax and AUC(0ndash 24)) Because of high variability in the hemodynamic data goodness-of-fit of the PKPD models was generally poor and the resulting parameter estimates were not considered reliable Extrapolation of these model parameters in the clinic for dose adjustment is not recommended
5 No covariates had an impact on the parameters delineating the PKPD relationship between metoprolol exposure and DBP SBP and HR
Objectives of the analysis There are three specific goals of the PM analysis
1 To evaluate the adequacy of the sponsorrsquos dose-response analysis 2 To evaluate sponsorrsquos population PK analysis and determine if PK labeling claims
are acceptable DCP1PM Page 48 10182006
Clinical Pharmacology Review NDA 19-962 Toprol-XL 10182006
3 To evaluate sponsorrsquos population PKPD analyses and determine if the findings support the proposed dosing recommendation
Dose Response Analysis (Study 307A) Title Dose Ranging Safety and Tolerability of TOPROL-XLreg
(metoprolol succinate) Extended-release Tablets (metoprolol CRXL) in Hypertensive Pediatric Subjects A Multicenter Double-blind Placebo-controlled Randomized Parallel-group Study
Study Duration 30 May 2002 - 9 June 2004 Investigators (primary) Bonita E Falkner MD and Jonathan Sorof MD 1800 Sites Multiple locations (36 in US and 1 in Dominican Republic)
Table 1 Objectives and Outcomes for Study 307A
Study Design (FDA-approved Type A design) This was a multi-center international double-blind placebo-controlled randomized parallel-group study The study included a screening visit a 1- to 2-week single-blind placebo run-in period during which all previous antihypertensive medications were discontinued and a 4-week double-blind treatment period At the end of the placebo run-in period eligible patients with blood pressure (BP) measurements in the qualifying range were randomized in a 1212 ratio to receive once daily oral doses of placebo TOPROL-XL 02 mgkg TOPROL-XL 10 mgkg or TOPROL-XL 20 mgkg TOPROL-XL doses of 125 25 375 50 75 100 150 or 200 mg were used to approximate the target doses Patients in the placebo and TOPROL-XL 02 mgkg groups received the target dose for 4 weeks while patients in the TOPROL-XL 10 mgkg and
DCP1PM Page 49 10182006
Clinical Pharmacology Review NDA 19-962 Toprol-XL 10182006
20 mgkg groups had their dose up-titrated (based on weight) to the target dose over the first 1 to 2 weeks of double-blind treatment
Reviewer Note Rationale on Study design The inclusion of more patients in the TOPROL-XL 02 mgkg and 20 mgkg groups allowed better estimation of the dose response at the low and high ends of the dose range The TOPROL-XL 10 mgkg group with fewer patients provided a middle estimate that helped to describe the shape of the dose-response curve However having a fewer number of subjects may have contributed to variability Inclusion of a placebo control group allowed for the quantification of treatment-related BP reductions after adjusting for placebo effect It should be noted that the placebo groups were not identical as they followed different titration schedules and had a different number of tablets
The 02 mgkg dose is lower than the lowest approved adult dose on a mgkg basis (assuming 70 kg adult weight) but the highest studied pediatric dose 20 mgkg (200 mg limit was placed) is lower than the highest studied adult dosage 400 mg
Table 2 Toprol Dosing Scheme for Study 307A
Table 3 Formulations used in 307A
DCP1PM Page 50 10182006
Clinical Pharmacology Review NDA 19-962 Toprol-XL 10182006
SPONSORrsquoS STATISTICAL ANALYSIS PLAN HIGHLIGHTS bull The primary analysis used an intention-to-treat (ITT) population which included
all patients who received at least 1 dose of study medication and had baseline and at least 1 post baseline measurement For this analysis missing data were imputed using a last observation carried forward (LOCF) approach
bull A simple linear regression analysis was performed on the placebo-corrected change from baseline to Week 4LOCF in sitting SBP and sitting DBP with dose ratio as the explanatory variable
bull The placebo correction for placebo-corrected changes from baseline to Week 4 LOCF in sitting SBP and sitting DBP was performed by subtracting the mean change from baseline for the placebo group from the individual patient changes in the other treatment groups
bull ANOVA was performed with treatment group as the main factor for the changes from baseline to each post baseline visit in sitting SBP and DBP This ANOVA model was used to construct pairwise comparisons of each active treatment versus placebo and the active treatment groups combined versus placebo
bull The percentage of responders at Week 4 was summarized by frequency counts percentages and 95 confidence intervals (CI) for each treatment group
bull Subgroup analyses were also performed on the changes from baseline at Week 4 in sitting SBP and DBP and the influence of heart rate and baseline body mass index (BMI) on the mean changes from baseline to Week 4LOCF in sitting SBP and DBP were examined using linear regressions
bull Trough plasma concentrations of metoprolol were summarized descriptively and the lower limit of quantitation (LLQ) was 1 ngmL
bull Safety data were summarized using the safety population defined as all patients who received at least 1 dose of study medication and were not lost to follow-up No statistical analyses were performed on the safety data in this study
DCP1PM Page 51 10182006
Clinical Pharmacology Review NDA 19-962 Toprol-XL 10182006
Results Patient Disposition Per applicant patients recruited into this study were representative of a pediatric population with hypertension The four treatment groups were balanced with respect to demographic and baseline characteristics (Tables 4 and 5) About 80 percent of the patients were considered 90 compliant
Table 4 Baseline Characteristics in Study 307A
Table 5 Sitting SBP and DBP measurements at baseline
Sitting and standing BP measurement were comparable (eg mean SBP for all patients- sitting = 1319 and standing 1306 with similar CVs ~ 9 )
Primary Efficacy Variable The results for the primary efficacy variable are illustrated in Figure 1 Figure Dose response for placebo-corrected change from baseline to Week4LOCF for sitting SBP (ITT population)
DCP1PM Page 52 10182006
Clinical Pharmacology Review NDA 19-962 Toprol-XL 10182006
Figure 1 Change in SBP from baseline as a function of Toprol XL dose
Table 6 Linear regressions statistics used to assess Dose-Response
The results indicate that bull The slope of the curve is not different form zero (p = 05371 for dose ratio)
suggesting that there is no dose-response relationship bull Most active treatment groups are more effective than placebo in reducing SBP
By visual inspection it appears the lack of observed dose-response is mainly driven by a lower than expected response at the 20 mgkg level
Potential issues affecting efficacy and pharmacokinetic results bull LOCF was required for eight patients however the LOCF approach did not
greatly impact the outcome of the trial bull Patients assigned to the 10 mg and 20 mgkg dose received drug for only 2
weeks whereas dose in the 02 mgkg received the same dose for 4 weeks
DCP1PM Page 53 10182006
Clinical Pharmacology Review NDA 19-962 Toprol-XL 10182006
Reviewerrsquos Supplemental Dose-Response Analyses The sponsorrsquos dose-response analysis was successfully reproduced by this Reviewer using pooled placebo corrected data A supplemental analysis was conducted using group-specific placebo corrected data In this procedure data for subjects assigned to a given Active Group (eg 02 mgkg) were corrected with Placebo data (02 mgkg) Group specific placebo data are presented in Table 7
Table 7 Placebo-group specific data Placebo Group Frequency Delta SBP 02 mgkg 8 -567 10 mgkg 6 -300 20 mgkg 9 230
It should be noted that the group-specific placebo data appeared to follow a consistent trend where the placebo effect decreased with increasing number of tablets It is unclear if this titrationtablet-dependent placebo effect is valid or random Overall the apparent differential placebo effects suggest that the placebo group may have overly influenced the outcome of the dose-response analysis
When active groups are corrected using group-matched placebo data there is a statistically significant dose-response The dose response using group-specific placebo data is illustrated in Table 8 and Figure 2
Figure 2 Placebo corrected changes in SBP (chg_pc on y axis) as a function of dose ratio
Potential Limitations of Supplemental Analyses Typically placebo effects are constant if randomization is correct thus it is unclear if subsetting the placebo group is acceptable and did not increase bias Additionally subsetting the placebo group leads to a reduced number of placebo subjects per dose group that may impact the regression analyses
DCP1PM Page 54 10182006
Clinical Pharmacology Review NDA 19-962 Toprol-XL 10182006
Table 8 SAS output for regression analyses using group-specific placebo corrections The REG Procedure
Model MODEL1
Dependent Variable chg_pc
Number of Observations Read 117
Number of Observations Used 117
Analysis of Variance
Sum of Mean
Source DF Squares Square F Value Pr gt F
Model 1 191083177 191083177 2663 lt0001
Error 115 825109481 7174865
Corrected Total 116 10162
Root MSE 847046 R-Square 01880
Dependent Mean -430358 Adj R-Sq 01810
Coeff Var -19682365
Parameter Estimates
Parameter Standard
Variable Label DF Estimate Error t Value Pr gt |t|
Intercept Intercept 1 125480 133166 094 03480
DOSRATIO Dose Ratio 1 -100051 019387 -516 lt0001
Secondary variables
bull Placebo-corrected change from baseline in sitting DBP The mean plusmn SD change (Week 4LOCF) in sitting DBP is illustrated in Figure 3 and Table 9
Figure 3 Mean changes (actual and placebo-corrected) from baseline to Week 4LOCF for sitting DBP (ITT population)
DCP1PM Page 55 10182006
Clinical Pharmacology Review NDA 19-962 Toprol-XL 10182006
Table 9 SAS output for regression analyses for DBP with pooled placebo correction
Treatment group effects and pairwise comparisons for sitting SBP and DBP Results of the treatment group effects at the Week 4LOCF visit and the pairwise comparisons between each TOPROL-XL group and placebo for the change from baseline in sitting SBP and DBP are shown for the ITT population in Table 10
Table 10 Treatment group effects for change in baseline to Week 4LOCF for sitting SBP and DBP (ITT population)
Some key findings from the pair-wise comparison are as follows (Table 10) 1 All active groups produced statistically significant reductions from baseline in sitting
SBP and DBP at the Week 4LOCF visit whereas placebo did not
DCP1PM Page 56 10182006
Clinical Pharmacology Review NDA 19-962 Toprol-XL 10182006
2 Overall the mean change from baseline in sitting SBP at Week 4LOCF for the TOPROL-XL groups pooled was statistically significantly larger than that for the placebo group (p=00351)
3 Results of pairwise comparisons between individual TOPROL-XL dose groups and placebo also revealed a statistically significant difference for the 10 and 20 mgkg groups (p=00270 and p=00492 respectively)
bull Mean changes over time in sitting SBP and DBP Consistent with findings from other studies with beta-blockers apparent maximal reduction in blood pressure occurred between 1 and 4 weeks of treatment
Figure 4 Mean changes over time for sitting SBP and DBP (ITT population)
Data points in plot are from absolute values (not taking baseline into account)
Subgroup Analyses The sponsor conducted several exploratory subgroup analyses however these analyses were not reviewed critically and are not presented in this review as
1 they do no impact the primary outcome or study objective 2 they are unlikely to be clinically useful due to the small number of patients per
subgroup One potentially useful some group analyses involved the percentage of responders as defined in Table 11
The responder analyses shows comparable response rates for all active dose groups suggesting similar efficacy across dose groups despite different exposure (doses)
DCP1PM Page 57 10182006
Clinical Pharmacology Review NDA 19-962 Toprol-XL 10182006
Table 11 Number and proportion of responders (ITT population)
Pharmacokinetic Results The Ctrough information obtained in the trial are summarized in Figure 6 and Tables 12 and 13
Table 12 Summary of Ctrough data (per applicant)
Sixteen patients across the 3 TOPROL-XL groups did not have blood samples obtained for analysis of metoprolol concentrations Based on the number of samples BLQ there appeared to be very low concentrations in the lowest dose group It appeared that Ctrough increased with dose According to the applicant these values are similar to those obtained previously in adults especially at the 2 higher doses Variability was high in all treatment groups (CV gt 60 )
Table 12 Summary of Ctrough (Reviewer Generated) from all patients (samples lt LOQ given value = 0) Toprol XL Dose Number of subjects Concentration (ngmL) (mgkg) Mean plusmn SD Median Range 02 39 137 plusmn 294 000 0 ndash 157 10 17 1224 plusmn 1416 845 0 ndash 571 20 46 2462 plusmn 3352 1140 0 ndash 1670
DCP1PM Page 58 10182006
Clinical Pharmacology Review NDA 19-962 Toprol-XL 10182006
Reviewer Note Overall the plasma concentrations (exposure) for the 02 mgkg dose group appear too low to be effective (close to LOQ) It is noted that adults typically have concentrations gt LOQ at the lowest therapeutic dose 25 mg (~ 4 ngmL)
Figure 6 Boxplot of metoprolol Ctrough using samples gt LLQ (per applicant)
Safety Results According to the applicant Toprol XL was well tolerated in the pediatric population as tabulated below
Main Analyses Conclusions bull No dose response was observed for corrected SBP using pooled placebo data
however using group-matched placebo data demonstrated a dose response bull Ctrough increased with dose bull Toprol 10 and 20 mg kg doses were more effective than placebo in reducing
SBP bull The responder rate was comparable across all active dose groups and this rate was
greater than that of placebo
DCP1PM Page 59 10182006
Clinical Pharmacology Review NDA 19-962 Toprol-XL 10182006
Methods Reviewerrsquos Methods Generally this reviewer conducted the analyses in a manner similar to that of the sponsor to confirm the sponsorrsquos findings
Sponsorrsquos Methods
Design Study1 307A
Reviewer Note This study was described in the Dose-Response Assessment (please refer to Page 7 Dose Response Analyses) Consequently only highlights relevant to the population analyses will be included in this section
Study 307A was a 4-week multi-center double-blind placebo-controlled randomized parallel-group study TOPROL-XL (metoprolol succinate) extended-release tablets were given to hypertensive pediatric patients Patients were randomized to double-treatment with a once daily oral dose of placebo or Toprol-XL at 1 of 3 target doses 02 or 20 mgkg The dose range for this study was 125 to 200 mg daily Patients on placebo followed the same schedule as that for their active group comparators
Study Flow Chart
Key Inclusion Criteria School age and adolescent children with reproducible SBP or DBP at or above the 95th percentile using height-adjusted charts for age and weight were eligible
DCP1PM Page 60 10182006
Clinical Pharmacology Review NDA 19-962 Toprol-XL 10182006
Study2 307B
Study 307B was a 52-week multi-center open-label study to determine the safety and pharmacokinetics of TOPROL-XL (metoprolol succinate) extended-release tablets (metoprolol CRXL) in hypertensive pediatric patients The starting dose was 25 mg daily The dose was increased every 2 weeks in increments of 25 mg or 50 mg based on tolerability until BP was controlled or the dose reached 200 mg
Table 1 Study Assessments
At the end of the 52-treatment period all patients had BP measured and a trough plasma level taken 24 hours the last dose of Toprol-XL with the exception of those patients who completed the serial portion at the final visit Among the participants a subgroup of approximately 30 patients was to participate in PK assessments of metoprolol requiring serial blood sampling at any time during the 52 weeks A single dose of 25 mg of Toprol-XL was given orally to those participating patients after a 48-hour washout period After the PK assessments they returned to the main study protocol Data
Study1 307A
4111 Pharmacokinetics A blood sample was to be collected at Visit 7 into a heparinized Vacutainer tube and obtained at 24 hours (plusmn2 hour) following the last dose of study medication (ie trough measurement) for determination of plasma metoprolol concentrations
Study Disposition Chart
DCP1PM Page 61 10182006
Clinical Pharmacology Review NDA 19-962 Toprol-XL 10182006
Table 2 Study Demographics
4112 Pharmacodynamics Primary variable
Sitting SBP determined at trough (24plusmn4 hours Visit 7) served as the primary efficacy assessment The primary measure of effect was the placebo-corrected change from baseline to the end of treatment (Week 4) in trough sitting SBP Each BP determination represented the mean of 3 readings with less than 7 mmHg between the highest and lowest value Blood pressure was measured using a mercury sphygmomanometer with an appropriate size cuff positioned approximately at the level of the heart Every effort was made to have the same individual measure the patientrsquos BP throughout the study if possible At all post randomization visits BP measurements were to be made at trough defined as 24 hours (plusmn4 hours) after receiving study medication All measurements were to be determined prior to the patient taking the scheduled dose of study medication In the
DCP1PM Page 62 10182006
Clinical Pharmacology Review NDA 19-962 Toprol-XL 10182006
event that the patient accidentally took study medication on the day of the scheduled visit the visit was to be rescheduled within 24 to 48 hours
Study2 307B
4113 Pharmacokinetics A 48-hour washout period prior to sampling was required for all patients including patients who entered the 52-week study and then decided to participate in the serial PK portion of the study All patients were to have a 15-mL blood sample collected into a heparinized Vacutainer tube 24 hours (plusmn2 hour) following the last dose of TOPROL-XL (ie trough measurement) at Visit 18 (or a the time of premature discontinuation) except for patients who participated in the serial PK portion of the study and had blood sampling performed at Visit 18 For patients participating in the serial PK portion of the study blood samples (15 mL) were to be collected into heparinized Vacutainer tubes and obtained at Hour 0 (predose) and at 1 2 3 4 6 8 10 and 24 hours after administration of a single 25 mg dose of TOPROL-XL following a 48-hour washout period After the last blood sample was obtained the patient was to startresume the prescribed dose of TOPROL-XL heshe was receiving prior to PK sampling
Patient Disposition Chart (completion or discontinuation)
Overall a total of 31 patients at 8 centers were enrolled in the serial PK portion of the study Of these 31 patients 27 had plasma concentration data available and were included in the analyses Four patients were excluded from the analyses because their plasma concentrations were not quantifiable (Nos 047-009 and 047-021) or because only whole blood samples were analyzed (Nos 005-002 005-003)
DCP1PM Page 63 10182006
Clinical Pharmacology Review NDA 19-962 Toprol-XL 10182006
Table 3 Subject Demographics for Patients Providing Serial Blood Samples
Missing Data Twenty-six patients did not have blood samples obtained for analysis of metoprolol concentrations in either the 16-week (n=7) or 52-week (n=19) studies Among patients with plasma samples 14 (14) in the 52-week study and 13 (13) in the 16-week study had trough plasma metoprolol concentrations that were below the LLQ Therefore data from a total of 99 patients were included in this analysis
Assay Metoprolol plasma levels were assayed using high-performance liquid chromatography tandem mass spectrometric detection methods having limit of quantitation (LOQ) of 1 ngmL The method was validated in the linear range 1 to 1000 ngmL Precision was less than or equal to 109 Accuracy ranged from 940 to 1013 Pharmacodynamics Not applicable
Data Checking SAS was used to format and check data Additionally visual inspection of several randomly selected subject data was carried out
DCP1PM Page 64 10182006
Clinical Pharmacology Review NDA 19-962 Toprol-XL 10182006
Models
Overview The sponsorrsquos stated assumptions underlying this modeling analysis are
1 Rich sampling data collected from 30 subjects in 307B Study can be used to adequately characterize the structural pharmacokinetic model of metoprolol
2 Structural pharmacokinetic models of metoprolol at other dose strength are identical to that at 25 mg
3 Metoprolol exhibits a linear pharmacokinetics in the dose ranges studied 4 Steady-state pharmacokinetics of metoprolol has been reached at the time of blood
sampling in Study 307A 5 Metoprolol accounts for the blood pressure effect in the study 6 Existing various disease states in the patients have no impact on the pharmacokinetics
of metoprolol and pharmacodynamics of the blood pressure reduction in the study 7 Concomitant medications if existed do not have any effects on the pharmacokinetics
of metoprolol and pharmacodynamics of the blood pressure reduction in the study
Reviewer Comment The sponsorrsquos assumptions appear reasonable based on existing metoprolol PKPD information
Pharmacokinetics
4114 PK Structural Model Several PK models were tested to identify the structural model Flip-flop absorption was taken into consideration based on general PK characteristics following administration of sustained release tablets and observed data in the current study (serial PK samples)
The models tested included linear 1- and 2-compartment PK models with the following characteristics (focused on flip-flop models)
bull first-order absorption with and without absorption lag time (NONMEM subroutines ADVAN2 and ADVAN4)
bull zero-order absorption with and without absorption lag time (NONMEM subroutines ADVAN1 and ADVAN3)
bull simultaneous zero- and first-order absorption from the absorption compartment The models were parameterized in terms of CLF and VF
Ultimately the 2-compartment model with first order flip-flop absorption an absorption lag time and 2 residual error terms was selected as the structural model of metoprolol The model scheme is presented in the following Figure 1 Figure 1 PK Compartmental Model
DCP1PM Page 65 10182006
Clinical Pharmacology Review NDA 19-962 Toprol-XL 10182006
4115 PK Covariate Model Covariate models were developed to account for the potential impact of the following covariates and derived covariates on metoprolol PK
Continuous variables bull Age (AGE years) bull Body weight (WT kg) bull Body surface area (BSA m2) calculated from WT and HT (cm) using the height
weight formula BSA=0024265 x WT 05378 x HT03964 bull Ideal body weight (IBW kg) calculated as - Males IBW=50+(HTndash150)25 and
for Females IBW=45+(HTndash150)25 bull Dose (DOSE mg of Toprol-XL)
Categorical variables bull Gender (SEX) - Male 0 - Female 1 bull Race (RACE) - Caucasian 0 - Black 1 - Asian 2 - Other 3
PK covariate effects were modeled as follows
Effects of continuous covariates (AGE WT BSA IBW and DOSE) were normalized to the corresponding median value across a dataset such that continuous covariates were related to structural PK parameters in a power function as described below
where Θ is the fixed-effect parameter of a covariate estimated by the NONMEM program covariate value is the observed covariate value and PK typical value is the typical value of the PK parameter estimated by NONMEM Effects of categorical covariates (SEX and RACE) are related to structural PK parameters by fractional changes of dummy variables
DCP1PM Page 66 10182006
Clinical Pharmacology Review NDA 19-962 Toprol-XL 10182006
Where Θ is the fixed-effect parameter of a covariate estimated by the NONMEM program covariate is the dummy variable value and modified in the control streams and PK typical value is the typical value of this PK parameter as estimated by NONMEM
Median values of all covariates in the dataset for population PK analysis are presented in Table A
Table A Summary of patient covariates and Toprol-XL doses in the data for population PK analysis
Two Steps were included in the modeling of covariates
Step 1 Forward Addition The covariates were subjected to a stepwise forward selection algorithm using a likelihood ratio test based on a change in MOF values from the base model A significant covariate reduced the MOF more than 660 (chi-square distribution plt001 degrees of freedom [df]=1)
Step 2 Backward deletion (Excluding procedures for covariate effect) The covariates in the full model acquired in Step 1 were subjected to a backward deletion algorithm 1 covariate was deleted at a time using a likelihood ratio test based on a change in MOF values A covariate was determined to be statistically significant if the change in MOF after its deletion from the breakdown model was increased by more than 1083 (chi-square distribution plt0001 df=1)
4116 PK Random Variance Models An exponential error model was used to characterize inter-patient variability based upon the assumption that random effects for PK parameters were not correlated among PK parameters No other error models for eta were evaluated by the applicant or by this Reviewer The retention of ETA values for each PK parameter in the structural model was confirmed by sequentially fixing each ETA value at zero and comparing each resultant MOF with the MOF obtained when all ETA values were retained in the model (see Table 6)
DCP1PM Page 67 10182006
Clinical Pharmacology Review NDA 19-962 Toprol-XL 10182006
The residual model was modeled by an additive model two error terms were used one for error associated with trough samples and the other with serial samples
Reviewer Note Use of an exponential model appears reasonable
Pharmacodynamics
4117 PKPD Structural Model The equations for the structural models are shown below
1 Metoprolol Ctrough The relationships between the observed metoprolol concentrations (Ctrough) and hemodynamic changes were investigated using 4 direct-link models namely a linear model a log-linear model and Hillrsquos sigmoid Emax PKPD model with and without a baseline
2 The relationships between Cmax or AUC0ndash24 and hemodynamic changes were investigated using 2 direct-link models a linear model and a log-linear model
4118 PKPD Covariate Model The inclusion and exclusion procedures of covariate effect on the selected PKPD base model to obtain a selected final PKPD model were identical to those in the covariate evaluation in the population PK models as described previously in PK Covariate Model DCP1PM Page 68 10182006
Clinical Pharmacology Review NDA 19-962 Toprol-XL 10182006
Table B Baseline demographic and covariate characteristics
4119 PKPD Random Variance Models An exponential error model was used by the applicant to model inter-individual variability The retention of a random effect parameter ETA in each selected PKPD structural model was then evaluated by sequentially fixing each ETA value at zero and comparing each resultant MOF with the MOF obtained when all ETA values were retained in the model (plt005) This step reduced over-parameterization by deleting unnecessary random-effect parameters from the structural model to obtain the base model
Reviewer Note The study design precludes assessment of inter-individual variability or random error because only one dose record was available per patient Consequently the model should not have included eta terms It is noted that the sponsor ultimately dropped the eta term in the final model
DCP1PM Page 69 10182006
Clinical Pharmacology Review NDA 19-962 Toprol-XL 10182006
Model Selection
PK Initial Model Selection
PK Base Model to Final Model The selection of the most appropriate PK base model for a metoprolol PK was based upon the following criteria a significant reduction in MOF as compared to the baseline model and asymptotic chi-square distribution based on the likelihood ratio test or AIC (plt005) as compared to the other structural models This selected PK base model was then subject to a covariate evaluation The population PK model bearing all surviving covariate parameters with statistical significance became the penultimate final model If 1 of the body size parameters (WT BSA and HT) was not in the model the penultimate final model became the final model If body size parameters were in the model they were sequentially replaced by other body size parameters in the regression submodel for each PK parameter The best body size parameter was then selected on the basis of lowest MOF to form the final model
PK Final Model Selection Simulations and visual inspections based on goodness of fit plots were used to qualify and validate the model The goodness-of-fit of the final model was evaluated graphically by comparing population and individual predictions of metoprolol concentrations with observed metoprolol concentrations along the line of unity and by visual inspection of the following plots of population-weighted residuals (WRES) for the final population model 1 Population-weighted residuals (WRES) versus population-predicted concentrations (PRED) 2 WRES versus time after first drug administration in each patient 3 WRES versus all covariates evaluated WRES were generally expected to be distributed homogenously around zero for PRED time after administration and covariates For those 27 patients with serial samples goodness-of-fit of the plasma concentration-time profile for each individual was visually inspected The linear relationship between their AUClast values from the observed data and those from the simulated data (final model) was examined
The predictive performance of the final population PK model including covariates was evaluated by comparing typical values of PK parameters with the mean of individual Bayesian estimates or individual values of PK parameters with the results from non-compartmental analysis for patients with serial samples Steady-state metoprolol plasma concentration-time profiles from 0ndash24 hours at the interval of 15 minutes (025 hour) were calculated using the post hoc Bayesian estimated PK parameter obtained for 65 patients included in the PKPD relationship using the following equation
DCP1PM Page 70 10182006
Clinical Pharmacology Review NDA 19-962 Toprol-XL 10182006
PKPD Initial and Final Model Selection A similar approach to that of PK model selection was adopted for PKPD Each of the above-mentioned PKPD models with random effects was identified by curve-fitting the dataset Initial selection of the PKPD structural model was based upon a significant reduction in MOF (plt005) as compared to the baseline model and reasonable PKPD parameter estimates Software
Nonlinear mixed-effect modeling (NONMEM) software (Version V level 11 Globomax Hanover MD) was used in the population PK analysis PK model fitting was accomplished using first-order (FO) approximation methods For PKPD model fitting the first-order conditional estimation (FOCE) with eta-epsilon interaction method in NONMEM was used for all model runs
SAS software (Version VIII Cary NC) was employed to prepare datasets according to the format required by the NONMEM program (Boeckmann et al 1991) Microsoftreg Excel 2000 (Redmond WA) and S-PLUS 2000 (Professional Release 2 MathSoft Inc Cambridge MA) were used to perform exploratory graphical exposure calculation and statistical analyses according to the format required by the NONMEM program (Boeckmann et al 1991) SAS command files logs and listings pertaining to data file conversion and merging were reviewed by an independent analyst Datasets were stored in SAS data frames combined and exported to Excel and then to ASCII files before fitting to the model
Datasets were prepared and pooled in a NONMEM-compliant format using SAS software by the Programming Group Clinical Information Sciences at AstraZeneca Wilmington Delaware SAS command files logs and listings pertaining to file conversion and merging were provided and found to be acceptable The contents of both datasets (toprolkatcsv for PK modeling and cppd2csv for PKPD modeling) were included
DCP1PM Page 71 10182006
Clinical Pharmacology Review NDA 19-962 Toprol-XL 10182006
toprolkatcsv was not provided electronically in a SAS format however this reviewer generated a similar dataset using the applicantrsquos criteria
Reviewer Comment The software and data assembly methods appeared adequate
DCP1PM Page 72 10182006
Clinical Pharmacology Review NDA 19-962 Toprol-XL 10182006
Results and Discussion Design Adequacy
Overall the trial designs appeared adequate to evaluate metoprolol population PK and PKPD in pediatric patients receiving Toprol XL However the design could have been further optimized by increasing the sampling points particularly in the absorption phase Due to the limited number of samples in the absorption phase it was not possible to accurately characterize the absorption model first order vs zero order or mixed first and zero order Additionally collection of mainly trough samples limits the ability to accurately estimate measures such as Cmax that are not directly related to Ctrough particularly if multiple compartments are present Consequently Cmax estimations are unlikely to be accurate Finally most patients provided only one trough sample thus inter-individual variability could not be adequately captured and may have limited the utility of the modeling exercise particularly in PKPD where the random effect could not be accurately characterized Ultimately there was no random variable in the final PKPD model (ie eta was set to zero) Data Integrity
This reviewer checked the data visually by randomly selecting data from patients included in the population modeling and comparing to data in the study report (source data) Overall the data integrity appeared acceptable The applicant observed the following guidelines that appeared acceptable No datum from any study participant with a protocol violation that was thought to materially impact the analysis was included The dataset contained data from only those study participants who could be evaluated ie with all the last dosing datetime blood sampling datetime plasma drug concentrations and demographic covariates
Data that were excluded (n = 62 samples) from the model were as follows One sample from an apparent poor metabolizer Two samples collected gt 96 hours post dose From 307B 10 trough samples lt LOQ From 307A 17 samples lt LOQ Thirty-samples from serial data that were lt LOQ or whole blood samples Model and Model Selection
Base Model
41110 Pharmacokinetic Model description The base PK model was a standard two compartment model that incorporated lag time and flip-flop kinetics The key features of the model were flip-flop was insured by making the value of ke gt ka in the clearance equation Additionally lag time was restricted to a value of 2 hours or less and concentrations were log transformed consequently all concentrations (F) = 0 were given individual predicted concentrations of zero Finally there were two residual error terms one for serial samples and the other for trough samples DCP1PM Page 73 10182006
Clinical Pharmacology Review NDA 19-962 Toprol-XL 10182006
Key equations were as follows
KA = THETA(1)EXP(ETA(1)) V2 = THETA(2)EXP(ETA(2)) CL = (THETA(1)THETA(2)+THETA(3))EXP(ETA(3)) Q = THETA(4)EXP(ETA(4)) V3 = THETA(5)EXP(ETA(5)) ALAG1=THETA(6)EXP(ETA(6))
41111 PK Parameter estimation results Table 1 Summary of PK parameters in the metoprolol population PK base model (per applicant)
41112 Goodness of fit The applicant provided the following goodness-of-fit plots (Figure 1)
Reviewer Note The goodness-of-fit plots were reproduced by this Reviewer (see Appendix) with minor modifications
Figure 1 Goodness of fit plots for Base Model
DCP1PM Page 74 10182006
Clinical Pharmacology Review NDA 19-962 Toprol-XL 10182006
Base PK Model Selection The MOF values of all structural model candidates tested are presented in Table 2 Model selection was based primarily on MOF values the lower MOF the better the model The applicant reports that in general MOF values generated by a conventional absorption model (ie absorption rate is faster than elimination rate) and a flip-flop absorption model (ie absorption rate is slower than elimination rate) were identical
Reviewer Comment The existence of flip-flop kinetics appears plausible based on data provided and general patterns for sustained release formulations Consequently the use of flip-flop kinetics for the bulk of the modeling exercise appears reasonable
General conclusions from the information in Table 2 are First order input is better than zero order input Two compartment model is better than one compartment model Lag time presence is better than lack of lag time Two residual error terms are better than one residual error term It should also be noted that several other models led to unsatisfactory completion of the run and were not considered further
DCP1PM Page 75 10182006
Clinical Pharmacology Review NDA 19-962 Toprol-XL 10182006
Table 2 Comparison of Structural PK Models
Reviewer Comment The selected structural model appears appropriate based on the data
Base Model The deletion of ETA for V2 did not change the MOF value suggesting that ETA for V2 should be deleted to avoid an over-parameterized warning (Table 3) This was consistent with the estimated parameter value of ETA for V2 being 648 x 10ndash9 a very small value Therefore the base model was selected by deleting the ETA for V2 from the structural model
Reviewer Comment on Eta deletion for V2 Deletion of eta for V2 is acceptable based on the empirical data however from a physiological perspective deletion of eta is problematic Generally one anticipates inter-individual differences in volume of distribution In this case it appears that the error associated with V2 may have been randomly shifted to V3 and or Q terms as the three DCP1PM Page 76 10182006
Clinical Pharmacology Review NDA 19-962 Toprol-XL 10182006
terms are interrelated This potential shift in error is supported by the fact that the V2 eta value increases significantly (by several orders of magnitude- 10-5 vs 100) when eta for Q and or V3 is fixed However when Q or V3 are fixed minimization is successful but Q and V3 are not accurately estimated Accounting for the possible error shift is a complex process and goes beyond the scope of this reviewer thus deletion of eta associated with V2 was considered acceptable for the remainder of the modeling evaluation
Table 3 Structural elements tested in the metoprolol population PK structural model (p lt 0005)
Final PK Model
41113 Model description The key feature of the final model is the inclusion of the covariate effects of age on Q and weight on CL in the population PK model
Key Equations CL = (THETA(1)THETA(2)+THETA(3)+EWT)EXP(ETA(2)) Q = THETA(4)EAGEEXP(ETA(3))
Including Covariate Effects As previously described covariate effects were assessed by forward addition and backward deletion Most covariates did not significantly change MOF however BSA significantly affected CL and Age affected Q Consequently these covariates were included in the penultimate final model
DCP1PM Page 77 10182006
Clinical Pharmacology Review NDA 19-962 Toprol-XL 10182006
Reviewer Note BSA is derived form WT and HT covariates implying BSA is highly correlated to these two covariates (Figure 2) weight is the most suitable (practical covariate) as it is readily measured Furthermore weight and BSA produced the same MOF (Table 4) whereas MOF with height was more positive (less significant)
Figure 2 Plot of BSA vs Body Weight
The data in Table 4 support selection of the final model
Table 4 Covariate elements tested in the metoprolol population PK penultimate final model (plt0005)
The applicant acknowledges that mechanism(s) accounting for the impact of age on QF are not clear However since distribution clearance has little effect on metoprolol plasma exposure further investigation is not needed
41114 PK Parameter estimation results As shown in Table 5 PK parameters were estimated fairly precisely by the final model
Table 5 PK Parameter Estimates using Final Model
DCP1PM Page 78 10182006
Clinical Pharmacology Review NDA 19-962 Toprol-XL 10182006
41115 Goodness of fit The goodness-of-fit plots provided by the applicant show good precision Figure 5 Goodness of fit plots for final PK model
DCP1PM Page 79 10182006
Clinical Pharmacology Review NDA 19-962 Toprol-XL 10182006
PK Model Qualification The post hoc Bayesian-estimated AUC (simulated) obtained for the 27 patients with serial plasma samples are plotted against the observed (AUCt) The correlation was high (R2 gt 099) Figure 6 AUClast from observed data versus AUCt from model simulation in the 27 patients providing serial plasma samples
Regression line Y= 4514 + 08976 X R2 = 09957
The graphical validation of the final metoprolol population PK model validation against covariates evaluated is presented in Figure 6
Figure 7 Graphical validation of covariates
DCP1PM Page 80 10182006
Clinical Pharmacology Review NDA 19-962 Toprol-XL 10182006
There was no systematic bias in weighted residuals for any covariates evaluated suggesting that the final model included all appreciable effects of available covariates (Figure)
The effects of weight on metoprolol CLF are illustrated in Figure 8 where Bayesian post hoc estimates of CLF are plotted against weight and overlaid by the model-predicted line Overall the model appeared to fit the data well
Figure 8 Plot of CLF vs Body weight
The effects of AGE on metoprolol QF are illustrated in Figure 9 where Bayesian post hoc estimates of QF are plotted against AGE and overlaid by the model-predicted line Figure 9 Plot of QF vs Age
DCP1PM Page 81 10182006
Clinical Pharmacology Review NDA 19-962 Toprol-XL 10182006
Reviewer Note The applicant indicated that attempts to run the final model using the first-order conditional estimation method resulted in termination errors Therefore the parameter estimates obtained by the FO method were reported as the final parameter estimates
Conclusion Regarding Population PK Modeling Overall the sponsorrsquos population PK modeling is acceptable
PKPD Model and Model Selection
PKPD Base Model PharmacokineticPharmacodynamic Model description The key feature of the model was a lack of random variance term for the slope (since only single data points were available per subject) and inclusion of baseline effect
Key equations were as follows E0 = THETA(1)EXP(ETA(1)) M = THETA(2) Y = E0 + MLOG(AUC) + EPS(1)
The control stream provided in the appendix is that for DBP (provided by sponsor) The control stream for SBP is comparable with appropriate substitution for BP type
It should be noted that only the log-linear and linear PKPD models were considered suitable for AUC and Cmax For this review only AUC estimates were considered reliable as Cmax estimates could not be accurately determined based on the sampling scheme Consequently the remainder of this review focuses on AUC information although Ctrough and Cmax data are displayed for reference
Bayesian estimates from PK modeling are summarized in Table 1
Table 1 Bayesian estimates of metoprolol PK exposure for those patients included in the PKPD analysis (N=65)
DCP1PM Page 82 10182006
Clinical Pharmacology Review NDA 19-962 Toprol-XL 10182006
PKPD Model Selection (initial and final) The log-linear model was adopted as the base model for this PKPD relationship since it improved the MOF significantly (Table 2) The ETA parameter for the slope was pre-eliminated for the purpose of model parsimony The intercept and slope in this log-linear model for AUC(0-24) did not bear ETA parameter therefore no covariates had impact on either parameter in the model
Reviewer Note The intercept should not have borne an eta term because individual subjects provided only one data point Consequently fixing eta to zero or deleting eta in the final model is appropriate No further model development was required after eta was eliminated and the base model was equivalent to the final model
Table 2 Base population PKPD models tested for the change in SBP
41116 PKPD Parameter estimation results The final PKPD parameter estimates are presented in Table 3
Table 3 Summary parameters in the final PKPD model for the change in SBP using trough plasma level Parameter Explanation Estimate SE ()b
DCP1PM Page 83 10182006
Clinical Pharmacology Review NDA 19-962 Toprol-XL 10182006
Model Qualification Based on the relatively low R2 value and as shown in Figure there is a poor correlation between change in SBP and log AUC
Figure 1 Relationship between change in SBP and AUC (line generated from modeling)
Overall goodness-of-fit of the model was considered to be poor probably due to the high variability in the measurements Consequently the precision of the model parameter estimates was not considered to be very reliable These parameters have little clinical usefulness and can be treated only as an indication of trends ie more hemodynamic effects can be potentially achieved when high Toprol-XL doses are given Clinical dose adjustment based on these PKPD parameters is not recommended
Reviewerrsquos Supplemental Analyses A supplemental PKPD analyses was conducted using simple linear regression since the population model did not improve the fit Overall eta made an insignificant contribution to the overall model The results of the analyses were similar to the population analyses A series of regression analyses were conducted and are presented in Table 4
The applicant notes that the preliminary modeling exercise found that there was no difference in the PKPD modeling results using different hemodynamic data formats (ie change in the measurements percent change in the measurements or actual BP measurements) This finding was confirmed by this reviewer (see Table 4)
DCP1PM Page 84 10182006
Clinical Pharmacology Review NDA 19-962 Toprol-XL 10182006
Table 4 Supplemental PKPD Regression Analyses Conducted by Reviewer Model (liner regression) Intercept (I) Slope (m) R2 Probability RSBP = mISBP + I 3957 -035 01626 0009 PSBP = mISBP + I 2524 -023 01252 00038 PSBP = mRSBP + I 0005 074 09891 lt 00001 RSBP = mlogAUC + I 651 -221 0060 00493 RSBP = mDose + I -751 0006 00026 06878 RSBP = mDose^ + I -312 -111 004 02711 RSBP = mlogAUC + nISBP + I 5303 -221 (m)
-035 (n) 02230 0001
RSBPplc = mAUC + I -667 -0003 00458 00871 RSBPplc = mlogAUC + I 461 -2208 00600 00493 RPUL = mlogAUC + I 1868 -405 01102 00069 Symbols in table similar to population PK model without eta term RSBP- change of SBP without placebo correction ISBP- initial (baseline) SBP RPUL- change in HR without placebo correction Dose- in mg where placebo is included as 0 mg PSBP- percentage change of SBP without placebo correction
Conclusion Regarding Population PKPD Modeling Overall the sponsorrsquos population PKPD modeling is acceptable No dose adjustment conclusion can be made from this modeling however an exposure-response relationship was established for AUC and reduction in SBP
Discussion
The significance of the results 1 Provide estimates of PK measures and plasma exposure in pediatric population These data can be compared to adult exposure to determine if exposure differences impact drug effectiveness The main challenge in comparing pediatric data to adult data is different modeling schemes formulations and methods were used in the two populations
2 PKPD findings are not sufficiently precise to provide a dose adjustment algorithm however the PKPD analyses provides rationale for proposed titration as increasing exposure (doses) may improve efficacy (reduction in SBP) Ultimately the risk-benefit analyses overrides PKPD assessment for dose adjustment drug will be titrated thus reliance on PKPD information is not critical The proposed dose 10 mgkg appears suitable based on available information It is unclear from the studies if there should be an initial maximum dose although the sponsor has proposed 50 mg as the maximum initial dose The proposed pediatric starting dose on a mgkg basis is within the range of starting adult doses (25 ndash 100 mg) assuming an adult weighs 70 kg
3 Cumulative information form dose-response study indicates that Toprol XL has effectiveness in children however the most effective dose is unclear Since the drug can be titrated determining the initial optimal dose does not appear critical As proposed by the applicant dosing is started at a ldquolowrdquo dose that can be up-titrated if needed
DCP1PM Page 85 10182006
Clinical Pharmacology Review NDA 19-962 Toprol-XL 10182006
4 The results did not adequately address the potential impact of CYP2D6 metabolic status for pediatric patients taking Toprol XL There were an insufficient number of patients to make this assessment
5 Covariate effects do not appear significant only body weight significantly affects clearance However a worst case scenario can occur with a person that has a low body weight and is a poor metabolizer this will result in very high possibly supra-therapeutic exposure Age does not impact apparent oral clearance so an age-dependent dose adjustment is not needed for children over 6 years old In essence all children over six years old can initiate therapy at 10 mgkg
The validity of the results Overall the results produced by the sponsor appear valid and the sponsor used a sound modeling approach However alternative approaches that could have been adopted may have improved the outcome of the analyses Three of these approaches are presented below 1 Additional PK samples should have been collected during the absorption phase and
throughout the dosing interval to improve the modelrsquos performance Specifically additional samples collected during the absorption phase may have unambiguously identified the actual absorption input function (eg first order zero order mixed first and zero order) First order input was selected for the analyses although the dosage form is reported to exhibit zero order kinetics in adults It is possible that the input rate in children differs from that in adults but unlikely It should be noted that absorption kinetics in children is often erratic due to multiple factors (eg regioshyselective absorption incomplete gastric emptying and inconsistent absorption) so it is unclear if additional samples would have definitively identified the absorption function However additional non-trough samples may have helped in estimating key PK measures such as V and Cmax The final model did not have an eta associated with V which is atypical Collection of additional samples on different visits may have helped estimate potential inter-occasion variability It should be noted that AUC was estimated precisely for subjects providing serial samples but these subjects were not necessarily included in the PKPD analyses Ideally the PKPD modeling should have been conducted primarily in subjects who had accurate PK measures
2 The PKPD design could have been modified to potentially improve the utility of the analyses Specifically there should have been better placebo matching procedures to minimize the potential impact of the placebo effect This matching could have been improved by ensuring all patients on placebo had the same titration schedule and number of tablets It is noted that the model had a poor predictive performance that was mainly attributed to the high degree of variability in the PD measures Potentially other PD markers could have been explored that have less inherent variability One such marker is the degree of beta blockade using exercise heart rate (EHR) reduction this marker has been used extensively for metoprolol in adult subjects However use of EHR in the pediatric setting may be challenging
DCP1PM Page 86 10182006
Clinical Pharmacology Review NDA 19-962 Toprol-XL 10182006
Comments to sponsor
In future pharmacometric studies you should consider the following 1 collect sufficient (multiple) samples from individual subjects to allow assessment
of inter-occasion variability and estimation of inter-individual variability (eta) for all relevant parameters
2 placebo groups should be identically matched across all dose groups (eg same titration schedule and number tablets) to minimize potential bias or differences in the placebo effect
Comments to medical reviewer
1 The sponsor has adequately characterized metoprolol PK in the studied pediatric population The PK characterization could have been further optimized by obtaining additional samples over the entire dosing interval (eg during the absorption phase and elimination phase) on multiple occasions rather than on one occasion primarily at trough
2 A dose-response relationship could not be established using the protocol specified analysis approach The outcome of the dose-response relationship appeared highly dependent on the ldquoplacebo effectrdquo suggesting that the placebo group may not have been appropriate One should consider re-evaluating the dose-response precisely matched placebo groups (eg all placebo patients have identical number of tablets and titration schedule)
3 Based on the PKPD analysis plasma exposure (AUC) explains lt 10 of the response (reduction in systolic blood pressure) thus has limited clinical utility However the PKPD relationship suggests that there is a trend for increased response with increased exposure (dose driven)
4 Overall information from the dose-response study suggests that Toprol- XL is effective in the pediatric population The optimal initial dose 02 10 or 20 mgkg or the maximum safe and effective dose cannot be determined from the information provided It is noted that the 02 mgkg dose is unlikely to be effective as plasma concentrations achieved at this dose are unlikely to be effective (most concentrations lt LOQ and lower than effective adult concentrations) The 10 mgkg (proposed by applicant) appears to be a reasonable initial dose The labeling should reflect the regimens studied
DCP1PM Page 89 10182006
Clinical Pharmacology Review NDA 19-962 Toprol-XL 10182006
Appendix
DCP1PM Page 90 10182006
Clinical Pharmacology Review NDA 19-962 Toprol-XL 10182006
DCP1PM Page 91 10182006
Clinical Pharmacology Review NDA 19-962 Toprol-XL 10182006
DCP1PM Page 92 10182006
Clinical Pharmacology Review NDA 19-962 Toprol-XL 10182006
DCP1PM Page 93 10182006
Clinical Pharmacology Review NDA 19-962 Toprol-XL 10182006
DCP1PM Page 94 10182006
Clinical Pharmacology Review NDA 19-962 Toprol-XL 10182006
DCP1PM Page 95 10182006
Clinical Pharmacology Review NDA 19-962 Toprol-XL 10182006
Table 15 Control streams for final log-linear PKPD model for the change in DBP using metoprolol Cmax as the measure of exposure
Truncated NONMEM reports for base model identification for PKPD relationship in change of SBP (per sponsor)
DCP1PM Page 96 10182006
Clinical Pharmacology Review NDA 19-962 Toprol-XL 10182006
Reported PD information^
^ Under metoprolol regimen CRZ0K is Toprol XL
DCP1PM Page 97 10182006
Clinical Pharmacology Review NDA 19-962 Toprol-XL 10182006
Table Results of randomised double-blind comparative trials evaluating antihypertensive efficacy of metoprolol formulations or other antihypertensives
DCP1PM Page 98 10182006
---------------------------------------------------------------------------------------------------------------------
---------------------------------------------------------------------------------------------------------------------
---------------------
This is a representation of an electronic record that was signed electronically and this page is the manifestation of the electronic signature
s
Robert Kumi 10182006 045635 PM BIOPHARMACEUTICS
Patrick Marroum 10192006 050811 PM BIOPHARMACEUTICS

10182006 Clinical Pharmacology Review NDA 19-962 Toprol-XL
212 Selected background information on metoprolol Background on Metoprolol in Hypertension
Table 1 Snapshot of metoprolol clinical pharmacology and biopharmaceutic information
Drug Class Metoprolol is a szlig1-selective (cardio selective) adrenergic receptor-blocking agent Mechanism of Action (antihypertensive effect)
Multiple putative mechanisms competitive antagonism of catecholamine at peripheral sites reduction of sympathetic outflow to the periphery or suppression of renin activity
Approved Indications Hypertension Heart Failure and Angina Pectoris Approved Formulations 1 Immediate Release (IR) ndash metoprolol tartrate
2 Toprol-XL is extended-release tablet of metoprolol as the succinate salt it is also referred to as metoprolol in literature as controlled release (CRZ0K)
Metabolism Via CYP2D6 primarily Absorption Absolute oral bioavailability ~ 50 following IR Food does not affect metoprolol
absorption using ER formulation Distribution Protein binding to albumin is about 12 Elimination For IR t12 from 3 ndash 7 hours Less than 5 dose excreted unchanged in urine No
t12 values for ER this may be due to difficulty in separating absorption and elimination phases
Variability Plasma levels are highly variable among subjects after oral administration PKPD in children Limited information in children information obtained following administration of
metoprolol tartrate (IR) Please refer to NDA 19-962 for additional background information
213 Proposed Formulation Administration Route and Dosage The formulation proposed for pediatric use is Toprol-XL this formulation will be given orally at an initial dosage of 10 mgkg once daily (QD) Subsequently the dosage will be titrated depending on clinical response The maximum dosage studied was 200 mg QD Toprol-XL is available as a 25 (scored tablet) 50 100 and 200 mg tablet (b) (4)
22 What are the general clinical pharmacology characteristics of metoprolol succinate
221 Design features of clinical studies used to support dosing in the target population Two studies were conducted in hypertensive pediatric studies Study 307A and 307B the design features of these studies are summarized in Table 2 Table 2 Study Designs
Study Name Study 307A (D4020C00033) Study 307B (D4020C00001)
Objective Determine dose-response in children Determine long-term safety Doses Toprol XL 02 10 and 20 mgkg QD (maximum
200 mg QD) and Placebo Initial 25 mg QD then titrated to optimal clinical response (maximum 200 mg QD)
Design Feature bull 1-2 week placebo run-in period bull Patients in 10 and 20 mgkg groups dosed
over 2 week period but 02 mgkg group received dose for 4 weeks
Patients continuing from 307A or new enrollees
PK Features Ctrough (week 4) Ctrough (last study visit) and serial PK in subset (n = 31)
Primary Measures Outcome
Change in placebo-corrected trough sitting BP from baseline at week 4
Long-term safety using effective Toprol dose
LOCF approach followed
Page 7 of 98
Clinical Pharmacology Review NDA 19-962 Toprol-XL 10182006
222 Clinical response (efficacy) endpoints
Pharmacodynamics bull Primary variable Sitting SBP determined at trough (24plusmn4 hours Visit 7) served as the primary efficacy assessment The primary measure of effect was the placebo-corrected change from baseline to the end of treatment (Week 4) in trough sitting SBP Each BP determination represented the mean of 3 readings with less than 7 mmHg between the highest and lowest value bull Secondary variables Secondary variables included trough sitting DBP and percentage of responders at Week 4
223 Idenitifcation and measurement of metoprolol concentrations in plasma Metoprolol appeared to be adequately identified and measured in Study 307A and 307B A validated HPLC with tandem mass spectrometry method was used to quantify metoprolol Key features of the assay were bull limit of quantitation (LOQ) = 1 ngmL bull linear range = 1 to 1000 ngmL bull Precision measured by CV () le 109 bull Accuracy measured by relative bias ranged from ndash 6 to + 13 Overall the assay performance was acceptable
224 Metoprolol exposure-response The exposure-response evaluation revealed that
bull There was no clear dose-response relationship for effectiveness (primary variable change in sitting SBP) in the target patient population using the planned analysis (Sponsorrsquos) but there was a dose-response for the secondary efficacy variable (Sponsorrsquos)
bull There was a dose-response relationship for effectiveness when group-specific placebo correction was employed (Reviewerrsquos)
bull The proposed initial dosage regimen and subsequent titration are supported by 1) Existence of an exposure-response relationship for Ctrough and AUC and SBP
reduction 2) Overall Toprol XL being more effective than placebo at reducing SBP and DBP 3) For a given dose maximal efficacy occurring between 1 and 4 weeks after
treatment initiation bull There was no clear dose-response relationship for safety
2241 Dose-Response Assessment using Primary Variable and Analyses
Sponsors Analyses Primary Variable The dose-response relationship for Study 307A is depicted in Figure 1 When pooled placebo data were used for correcting change in SBP the slope of the curve is not different form zero (p = 05371 for dose ratio) suggesting that there is no dose response By visual inspection it appears the lack of observed dose-response is mainly driven by a lower than expected response at the 20 mgkg level Patients assigned to the 10 mg and 20 mgkg dose received drug for only 2 weeks whereas dose in the 02 mgkg received the same dose for 4 weeks It is unclear if this difference in titration schedule influenced the outcome
Page 8 of 98
Clinical Pharmacology Review NDA 19-962 Toprol-XL 10182006
Figure 1 Dose response for placebo-corrected change from baseline to Week4LOCF for sitting SBP (ITT population)
Reviewerrsquos Analysis Primary Variable When group-specific placebo corrected data were used for correcting change in SBP there was a statistically significant dose-response (Figure 2) Figure 2 Placebo corrected changes in SBP (chg_pc) as a function of dose ratio (relative to 02 mgkg)
In this procedure data for subjects assigned to a given active group (eg 02 mgkg) were corrected with placebo data (02 mgkg) It should be noted that the group-specific placebo data appeared to follow a consistent trend where the placebo effect decreased with increasing number of tablets It is unclear if this titrationtablet-dependent placebo effect is valid or random Overall the apparent differential placebo effects suggest that the placebo group may have overly influenced the outcome of the dose-response analysis Two potential limitations of this Reviewerrsquos supplemental analyses are
1 Typically placebo effects are constant if randomization is appropriate thus it is unclear if sub-setting the placebo group is reasonable and did not increase bias
2 Additionally sub-setting the placebo group leads to a reduced number of placebo subjects per dose group that may decrease the robustness of the regression findings
Page 9 of 98
Clinical Pharmacology Review NDA 19-962 Toprol-XL 10182006
2242 Dose-Response Assessment using Secondary Variable and Analyses
Treatment Group Effects and Pairwise Comparisons for sitting SBP and DBP Key findings from the group and pair-wise comparisons are 1 All active groups produced statistically significant reductions from baseline (p lt 002) in
sitting SBP (|∆ SBP| gt 5 mmHg) and DBP (|∆ DBP| gt 3 mmHg) at the Week 4LOCF visit whereas placebo (p = 03133) did not
2 Overall the mean change from baseline in sitting SBP (|∆ SBP| = 4256) at Week 4LOCF for the TOPROL-XL groups pooled was statistically significantly larger (p=00351) than that for the placebo group
3 Pairwise comparisons between individual TOPROL-XL dose groups and placebo also revealed a statistically significant difference for the 10 and 20 mgkg groups (p=00270 and p=00492 respectively) the 02 mgkg group was not different from placebo
Sponsorrsquos Analyses Secondary variable A dose-response relationship was observed for the secondary efficacy variable (delta DBP) as depicted in Figure 3 Figure 3 Mean changes (actual and placebo-corrected) from baseline to Week 4LOCF for sitting DBP (ITT population)
2243 Dose-Response assessment based on subgroup analyses (per Sponsor) and time course
Subgroup Analyses The sponsor conducted several exploratory subgroup analyses however these analyses were not reviewed critically and are not presented in this review as
1 they do no impact the primary outcome or study objective 2 they are unlikely to be clinically useful due to the small number of patients per subgroup
However one potentially useful group analyses involved the percentage of responders as defined in Table 3 The responder analyses shows
1) greater percentage of responders in active dose group relative to placebo 2) comparable response rates for all active dose groups suggesting similar efficacy across
dose groups despite different exposure (doses)
Page 10 of 98
Clinical Pharmacology Review NDA 19-962 Toprol-XL 10182006
Table 3 Number and proportion of responders (ITT population)
Time course of effect (2- to 4-week treatment period) Consistent with findings from other studies with metoprolol and some beta-blockers apparent maximal reduction in blood pressure occurred between 1 and 4 weeks of treatment The mean changes over time in sitting SBP and DBP are depicted in Figure 4 Figure 4 Mean changes over time for sitting SBP and DBP (ITT population)
Data points in plot are from absolute values (not taking baseline into account) and subjects in 10 and 20 mgkg received drug after two weeks on 02 mgkg
2244 PKPD Assessments Overall there were statistically significant relationships between metoprolol exposure particularly AUC and SBP reduction as shown in Figure 5 Similar findings were observed for heart rate reduction Figure 6
Page 11 of 98
Clinical Pharmacology Review NDA 19-962 Toprol-XL 10182006
Change in SBP Figure 5 Change in SBP vs log (AUC) ndash per Sponsor Figure 6 Change in HR vs AUC
The population PKPD assessment evaluated the effect of PK exposure measures (AUC Cmax and Ctrough) on various PD measures (change in SBP change in DBP However only the AUC was considered reliably estimated It is noted that AUC is a derived measure that may not bear as direct a relationship as Ctrough (observed value) on a given PD measure However Ctrough is related to AUC particularly at steady-state The equation relating AUC to change in SBP was
E = E0 ndash 221 x m logAUC
Where E = change in SBP E0 = baseline SBP m = slope and AUC = area under plasma concentration-time curve
The regression analyses yielded the following p lt 005 for slope and R2 lt 01 The relatively low R2 value suggests that the SBP data were highly variable and changes in SBP could not be accounted for entirely by AUC (exposure) Nevertheless there is a relationship between effectiveness and AUC that indicates that increasing exposure potentially increases effectiveness this finding supports dose titration
Change in Heart Rate The change in heart rate was defined as follows (Reviewerrsquos regression analysis)
E = I ndash 221 x m logAUC Where E = change in HR I = intercept and m =and AUC are as previously defined
The regression analyses yielded the following p lt 001 for slope and R2 = 011 The heart rate findings support metoprololrsquos known activity as a beta blocker
Page 12 of 98
Clinical Pharmacology Review NDA 19-962 Toprol-XL 10182006
Reviewer Note PKPD modeling with various hemodynamic measures The modeling exercises indicated that there was no difference in the PKPD modeling results using different hemodynamic data formats such as change in the measurements percent change in the measurements or actual BP measurements
2245 Exposure-Safety Highlights (per Applicant) According to the applicant Toprol XL was generally well tolerated in the pediatric population and there did not appear to be a clear dose-dependent effect in terms of severity or frequency of adverse events (tabulated below)
2246 Acceptability of sponsorrsquos proposed regimen The proposed initial dosage 10 mgkg QD followed by titration according to clinical response appears reasonable based on the dose-response information time course of maximal effect and exposure-response (AUC and SBP reduction) information It is unclear if the proposed initial dose is optimal since a dose-response relationship was not established for the primary efficacy variable and response rates were comparable across dose groups One should note that the proposed initial pediatric dosage is within the range of usual adult initial dosage 25 ndash 100 mg (assuming 70 kg adult ~ 036 ndash 143 mgkg)
The major unresolved issues are bull Absence of a clear dose-response relationship for the primary efficacy variable bull Unknown maximal dose in mg for initial therapy and titrationmaintenance therapy bull Unknown optimal titration frequency
Although these major issues are not completely resolved information provided in the submission provides adequate information to support the proposed dosage In brief these limitations are addressed in part by adopting the following approaches
bull Therapy will be initiated at a dose that was more effective than placebo yet was not the highest dose thus providing a safety window
bull Initial dosage (dose in mg) will be limited to a dose that produces exposure that is likely to be effective but does not exceed the highest studied dose (200 mg)
bull Titration will be allowed at a frequency no greater than once a week which is consistent with data obtained (time to peak activity) and previous information form metoprolol and other beta-blockers used in hypertension treatments
Page 13 of 98
Clinical Pharmacology Review NDA 19-962 Toprol-XL 10182006
2247 PKPD comparisons Pediatric patients vs adults A priori PKPD relationships are expected to differ between adults and children because the two populations have different disease processes (secondary hypertension in children vs essential or primary hypertension in adults) Results of the pediatric modeling exercise showed that a log-linear model appeared to work better than other models for the relationship between SBP and DBP and exposure (AUC) In adults the Sigmoid Emax model has been successfully applied in PKPD modeling exercises It should be noted that the adult data were not reanalyzed for this review so it is unclear if log-linear or linear models would be adequate
As illustrated in Table 4 Toprol XL is effective in adults as well as in children and appears to be effective across a similar concentration range Table 4 PKPD Comparisons- Pediatric Patients vs Adults
Pediatric Patients Adults Population hypertensive Typically healthy Model Log-linear Sigmoid Emax PD Markers Placebo corrected SBP DBP changes
at trough bull Reduction in exercise heart rate (betashy
blockade measure) bull Placebo corrected SBP DBP changes at
trough EffectiveTherapeutic metoprolol concentrations
Most concentrations lt 107 ngmL bull EC50 = 105 nmolL (281 ngmL) bull Emax achieved at concentrations above 400
nmolL (107 ngmL) bull Range between 80 and 300 nM
Maximal mean BP Reduction at Studied Doses
bull SBP reduction -6 bull DBP reduction -5
bull SBP reduction -10 bull DBP reduction -4
Effectiveness of metoprolol relative to placebo
Generally more effective over the course of treatment
Generally more effective over the course of
Time course of effect Maximal effect observed within 1 to 4 weeks after initiation of therapy
Maximal effect observed within 1 to 4 weeks after initiation of therapy
Utility in Poor CYP2D6 metabolizers (PMs)
Not evaluated Poor metabolizers have a higher plasma concentration and a greater duration or degree of beta blockade thus PMs may not need extended release formulations
Proposed Initial Dosage 10 mgkg ~ 70 mg QD 25 to 100 mg QD
Overall it appears the studied pediatric doses produce comparable changes in diastolic pressure but lower changes in systolic pressure However in pediatric patients it is unlikely that the maximal possible activity was achieved at the doses studied thus conceivably pediatric patients can achieve maximal effects comparable to adults at optimized pediatric doses Three challenges in making definitive PKPD comparisons between the pediatric (studied in this NDA) and adult population are as follows
1 Study conditions differ- typically in adult studies HR is measured during exercise and not at rest
2 Results are obtained in healthy adult subjects rather than hypertensive patients 3 Insufficient numbers of studies have been reported in the literature that attempt to
identify the relationship between metoprolol exposure and SBP or DBP effect in adults
Page 14 of 98
10182006 Clinical Pharmacology Review NDA 19-962 Toprol-XL
225 Pharmacokinetic characteristics of metoprolol
2251 Metoprolol pharmacokinetics in pediatric patients Metoprolol PK parameters obtained from the population PK analyses are summarized in Table 5 Table 5 Metoprolol population PK parameter estimates (SE ) obtained using final population PK model
PK Parameter Value CLF (Lhr) 2275 ( 114 ) V2F (L) 961 (203 ) V3F (L) 620 (255 ) QF (Lh) 675 (204) Ka (hrndash1) 00467 (192 ) Tlag1 (hr) 0853 (297)
The data in Table 5 are derived from a 2-compartment linear PK model with first-order elimination and flip-flop first-order absorption and lag time
2252 Metoprolol pharmacokinetic comparisons pediatric patients vs adults PK Parameter Comparison Overall pediatric PK parameters obtained following administration of Toprol-XL are comparable (similar magnitude) to those in adults receiving IR metoprolol Potential limitations of the stated comparison and finding include the use of different modeling approaches populations number of samples and number of subjects in the trials (Table 6) Table 6 Comparative PK (children vs adults)
Source NDA 19962 Luzier et al Taguchi et al Plosker and Cissold and other sources
Model 2 Comp 1st Order absorption
1 Comp
Formulation Toprol XL IR IR IR Population Pediatric Hypertension Healthy adults Japanese geriatric Sampling Intense and Ctrough Intensive Sparse intensive CLF (Lhrkg) 338 116 ndash 340 094 -V2F (Lkg) 128 270 ndash 398 452 -V3F 851 333 ndash 809 - -QF (Lhr) 899 282 ndash 694 - -T12 (h) 351 - - 3 - 6 Covariate Effects Based on CLF Age None - Yes YesNo Gender Effect None Yes - -Race None - - - The applicant noted that pediatric data were compared to adult data from IR where CLF is dominated by the disposition function of metoprolol therefore it may be complicated to compare adult data to pediatric data (Toprol XL) where CLF is under a considerable influence from the release rate (input function) of the device This appears to be a valid caveat Using AUC and dosing information (Table 8) adult CLF for Toprol-XL ~ 17 ndash 25 Lhrkg
Exposure Comparison Following administration of Toprol XL at comparable doses in mg pediatric patients and adults generally had similar metoprolol exposure Adult data from literature and archived clinical pharmacology and biopharmaceutics reviews are presented in Table 8 and pediatric data from
Page 15 of 98
Clinical Pharmacology Review NDA 19-962 Toprol-XL 10182006
population PK modeling (Study 307A) are presented in Table 7 The main limitations of the cross-population comparison is the pediatric doses are over the 125 to 200 mg dose range whereas adult data is for specific doses However reasonable comparisons can be made at the 100 mg dose level assuming the meanmedian values in pediatric patients offer an acceptable approximation of exposure values and are representative of the central tendency of the data In this case the adult and pediatric data have comparable
1 exposure at 100 mg 2 degree of variability
Table 7 Bayesian estimates of metoprolol PK exposure for those patients included in the PKPD analysis (N=65)
includes only data where concentration gt LOQ
Table 8 Metoprolol exposure in adults following administration of Toprol XL
Cmax Cmin AUC Literature References 50 179 ndash 190 86 ndash 104 286 - 351 100 96 ndash 759 107 ndash 305 533 - 1192 200 778 ndash 1139 310 ndash 447 1392 - 1892 FDA Archived Information 50 179 plusmn 182 85 plusmn 138 286 plusmn 346 100 544 plusmn 436 226 plusmn 234 827 plusmn 766
2253 Inter and intra-subject variability in metoprolol pharmacokinetic Based on the values of the standard error () associated with PK parameters (Table 5) metoprolol PK exhibited low variability (SE lt 30) However this estimate may not be reliable (under predicted) because concentrations lt LOQ were not included in the analysis Several subjects particularly those receiving 02 mgkg had concentrations lt LOQ In adults exposure is highly variable (CV gt 70 ) as reflected in exposure estimates and wide exposure ranges Table 8
Potential sources of variability following metoprolol administration (Toprol XL) in children include regio-selective absorption incomplete gastric emptying variable gastric motility varying metabolic activity (CYP2D6) and inconsistent absorption Some of these factors are also applicable to adults
23 What Intrinsic Factors Affect Metoprolol Exposure-Response
Based on the population pharmacokinetic model weight was the only potentially clinically meaningful intrinsic factor that affected metoprolol exposure and hence response Other intrinsic
Page 16 of 98
Clinical Pharmacology Review NDA 19-962 Toprol-XL 10182006
factors such as age height gender race and sex did not affect metoprolol exposure
231 Effect of weight The effect of weight on metoprolol CLF are illustrated in Figure 7 Figure 7 Variation of CLF with weight obtained in population PK analysis
CLF increased linearly with body weight relative to a 70 kg individual the CL of a 22 kg individual is 30 lower This decreased CL will result in an increased exposure (maximum 30 ) that does not pose additional safety concerns or appear clinically significant (tolerated in studies) It should be noted that exposure (AUC) accounted for an insignificant portion of the hemodynamic effect (poor correlation) thus the clinical implications of the impact of body weight on CLF of metoprolol identified in the population PK modeling are limited Consequently dose adjustment is not required based on body weight Furthermore the maximum initial dose is 50 mg thus subjects with weight gt 50 kg will receive a maximum dose of 50 mg diminishing the impact if any of weight-dependent clearance
232 Effect of Age The effect of age on QF the inter-compartmental clearance is illustrated in Figure 8 Figure 8 Variation of QF with age obtained in population PK analysis
Page 17 of 98
Clinical Pharmacology Review NDA 19-962 Toprol-XL 10182006
QF does not contribute significantly to overall clearance therefore the reported finding does not appear clinically relevant It should be noted that the observed QF-age relationship is atypical
233 Effect of intrinsic factors on exposure-response pediatrics vs adults As mentioned previously the only evaluated intrinsic factor that affected metoprolol exposure was body weight In adults age and gender effects have been reported although there are conflicting reports on the age effect The exposure in adult and pediatric population are both potentially affected by the CYP2D6 metabolizing status of the subject Metoprolol is metabolized primarily in the liver by CYP2D6 The scientific literature reports several instances in adults of varying metoprolol exposure by poor and extensive CYP 2D6 metabolizers In the pediatric studies (307A and 307B) there was one suspected poor metabolizer (Trough concentration was 2330 ngmL) but the metabolic status (PM or EM) of this individual was not confirmed
24 What extrinsic factors affect metoprolol exposure-response
The role of extrinsic factors were not specifically evaluated in the pediatric population however one anticipates that extrinsic factors that affect adults should be applicable to children
25 What analytical method was used in pediatric studies 307 A and 307B
Please refer to section 223
Page 18 of 98
Clinical Pharmacology Review NDA 19-962 Toprol-XL 10182006
(b) (4)
TOPROL-XL is not recommended in pediatric patients lt 6 years of age (see CLINICAL PHARMACOLOGY Pharmacokinetics and PRECAUTIONS Pediatric Use)
Page 21 of 98
Clinical Pharmacology Review NDA 19-962 Toprol-XL 10182006
4 APPENDICES
41 Sponsorrsquos Proposed Label
17 Page(s) of Draft Labeling has been Withheld in Full as B4 (CCITS) immediately following this page
Page 22 of 98
Clinical Pharmacology Review NDA 19-962 Toprol-XL 10182006
42 Pharmacometrics Review
Page 40 of 98
Clinical Pharmacology Review NDA 19-962 Toprol-XL 10182006
Office of Clinical Pharmacology Pharmacometrics Review
NDAIND 19-962 Volume Not applicable submitted electronically POP PK Report in Section 5335 (Network Path Cdsesub1n19962N_0002006-05-15hpbiohupharm) Compound Metoprolol succinate Submission Dates 05152006 Sponsor Astra Zeneca Pharmacometrics Reviewer Robert Kumi PhD Secondary Reviewer Yaning Wang PhD
TABLE OF CONTENTS
OFICE OF CLINICAL PHARMACOLOGY PHARMACOMETRICS REVIEW 41
EXECUTIVE SUMMARY 42
OVERALL CONCLUSIONS 43
INTRODUCTION 46
OBJECTIVES OF THE ANALYSIS 48
DOSE-RESPONSE ANALYSIS 49
METHODS (POPULATION PKPD) 60
RESULTS AND DISCUSSION 73
RECOMMENDATIONS 87
APPENDIX 90
DCP1PM Page 41 10182006
Clinical Pharmacology Review NDA 19-962 Toprol-XL 10182006
Executive Summary In NDA SE5 033 the applicant Astra Zeneca has proposed changes to the currently approved labeling for TOPROL-XL metoprolol succinate extended release
(b) (4)
tablets Metoprolol a beta blocker is approved for hypertension angina and heart failure in adults In adults with hypertension the usual initial dosage is 25 to 100 mg daily (single dose) as monotherapy or in combination with a diuretic this dosage is titrated at weekly intervals until optimum blood pressure reduction is achieved The current application focuses on Toprol-XL use in pediatric patients ge six years old The initial proposed dosing in children six and older is 10 mgkg subsequently the dose is titrated based on clinical response
Two clinical trials Studies 307A (dose-response) and 307B (safety extension of 307A) were conducted in pediatric patients with hypertension to support the proposed labeling changes The applicant conducted dose-response population PK (n = 120 patients) and PKPD (n = 65 patients) analyses using data from pediatric hypertensive patients receiving Toprol-XL in the mentioned studies
Key Findings from the Dose-Response and Population PKPD analyses follow 1 Dose-Response A statistically significant dose-response did not exist for placebo
(pooled)ndashcorrected ∆SBP from baseline however the relationship was evident when placebo (specific-group) ndashcorrected data were used
2 PK Model Metoprolol PK in children were well characterized by a 2shycompartment model with flip-flop first-order absorption and an absorption lag time The model yielded precise parameter estimates
3 Covariates Sex age race body weight and Toprol-XL dose had no clinically significant effect on metoprolol PK
4 PKPD Model Using a log-linear model or linear model there were weak but statistically significant relationships between the changes in DBP and SBP and measures of metoprolol plasma exposure (Ctrough AUC0ndash24 and Cmax) Overall parameters were not precisely estimated in most models due to a high degree of variability in the blood pressure data
DCP1PM Page 42 10182006
Clinical Pharmacology Review NDA 19-962 Toprol-XL 10182006
Overall Conclusions 1 Were metoprolol PK adequately characterized in the pediatric population Metoprolol PK in pediatric patients (n = 120 Age 6 to 17) were adequately characterized using a population pharmacokinetic approach The population model was validated and qualified and comprised a 2-compartment open model with first order absorption and absorption lag time
2 Are there any covariates that influence metoprolol PK in pediatric patients with hypertension The two covariates that influenced metoprolol PK were weight and age apparent oral clearance increased linearly with body weight and inter-compartmental clearance increased with age according to a power function Other covariates including race sex and metoprolol dose did not impact metoprolol kinetics
3 Was a PKPD relationship established between metoprolol dose or plasma exposure( AUC Ctrough or Cmax) and hemodynamic measures (blood pressure) Using a simple linear regression model no dose-response (reduction in placebo corrected systolic blood pressure the primary outcome variable) was observed although a weak (R2 lt 01) but statistically significant (p lt 005) PKPD relationship was observed between metoprolol exposure measures and reduction in systolic blood pressure The small R2 value indicates metoprolol exposure could account for only a small portion of the hemodynamic effect According to the model as exposure increased there was greater reduction in blood pressure However only the relationship with AUC was considered reliable as AUC was estimated with good precision (PK modeling) whereas Cmax was not
4 Is there sufficient evidence to support effectiveness of Toprol XL in pediatrics and the initial proposed pediatric dosage Yes Although dose-response was not established with SBP reduction (primary variable) suggesting that the effectiveness of the individual tested Toprol-XL doses could not be differentiated the following information provides evidence to suggest that some Toprol-XL doses were more effective than placebo
bull Analysis of treatment group effects and pairwise comparisons suggested that overall Toprol-XL demonstrated effectiveness in pediatric patients with hypertension pooled Toprol groups vs placebo (p = 00351) and relative to baseline each active Toprol-XL dose group decreased SBP whereas placebo did not
bull There was a dose-response relationship for reduction in diastolic blood pressure typically systolic and diastolic blood pressure effects mirror each other
bull PKPD findings (reduction in SBP and heart rate as a function of AUC) support metoprolol effectiveness (increased exposure led to increased effectiveness) The heart rate effect supports metoprololrsquos known beta blocking activity
bull Generally Toprol-XL was effective in pediatric patients and adult patients at similar metoprolol exposure levels 02 mgkg in pediatrics was minimally effective because this dose yielded exposures lower than that obtained in adults at the lowest effect adult dose 25 mg
DCP1PM Page 43 10182006
Clinical Pharmacology Review NDA 19-962 Toprol-XL 10182006
bull The proposed pediatric dosage 10 mgkg is supported by the results from the dose-response study Visual inspection and pairwise comparisons indicated that 10 mgkg (placebo corrected) was statistically the most effective dose (greater efficacy than 02 mgkg and 20 mgkg) and was more effective than placebo (p = 0027)
5 Will initial dosage adjustment be required for any pediatric patients prior to titration No dosage adjustment does not appear necessary prior to titration (typically one week after treatment begins) Based on the population PK model the only potentially relevant factor that could affect PK was body weight CLF increased linearly with body weight relative to a 70 kg individual the CL of a 22 kg individual is 30 lower This decreased CL will result in an increased exposure (maximum 30 ) that does not pose additional safety concerns or appear clinically significant (tolerated in studies) The proposed starting dose 10 mgkg and doses up to 20 mgkg (maximum 200 mg) were tolerated in the clinical trials (307A and 307B) Furthermore exposure accounted for an insignificant portion of the hemodynamic effect (poor correlation) thus the clinical implications of the impact of body weight on CLF of metoprolol identified in the population PK modeling are limited
to a higher and tolerable dose until optimum BP reduction is achieved is reasonable This
(b) (4)The proposal to start Toprol-XL at a low dose and titrate
is consistent with labeling for adults
6 Was the PKPD relationship influenced by covariates Insufficient data were available to make this assessment
7 Are the PK and PKPD of metoprolol in children comparable to that in adults PK values obtained in pediatric patients were generally in the same range as those reported in adults Potential limitations of the comparison are the different modeling approaches populations number of samples and number of subjects in the trials (Table B)
It is difficult to make definitive PKPD comparisons between the pediatric (studied in this NDA) and adult population because
1 Study conditions differ- typically in adult studies HR is measured during exercise and not at rest
2 Results are obtained in healthy adult subjects rather than hypertensive patients 3 Insufficient number of studies have been reported in the literature that attempt to
identify the relationship between metoprolol exposure and SBP or DBP effect in adults
DCP1PM Page 44 10182006
Clinical Pharmacology Review NDA 19-962 Toprol-XL 10182006
Table B PK Comparisons (Pediatrics vs Adults) Source NDA 19962 Luzier et al Taguchi et al Plosker and Cissold
and other sources Model 2 Comp 1st
Order absorption 1 Comp
Formulation Toprol XL IR IR PK Analyses Population StandardNCA Population Standard Population Pediatric Healthy adults Japanese geriatric Sampling Intense and
Ctrough Intensive Sparse intensive
CLF (Lhrkg) 338 116 ndash 340 094 V2F (Lkg) 128 270 ndash 398 452 V3F 851 333 ndash 809 QF (Lhr) 899 282 ndash 694 Ka (h-1) 00467 Tlag (h) 0853 T12 (h) 351 3 - 6 Tmax (h) 25 ndash 73 Covariate Effects on CLF Age None Yes YesNo Gender Effect None Yes Race None The applicant noted that pediatric data were compared to adult data from IR where CLF is dominated by the disposition function of metoprolol therefore it may be complicated to compare adult data to pediatric data (Toprol XL) where CLF is under a considerable influence from the release rate (input function) of the device This appears to be a valid caveat
It should be noted that the cause of hypertension in adults differs from that in children Results of the pediatric modeling exercise showed that a log-linear model appeared to work better than other models for both SBP and DBP In adults the Sigmoidal Emax model has been successfully applied Using the Hill Equation (Sigmoidal Emax model) with EHR reduction (measure of beta blockade) as the PD marker in adults EC50 = 105 nmolL (281 ngmL) and Emax is achieved at metoprolol plasma concentrations gt 400 nmolL (107 ngmL) Placebo-corrected mean blood pressure changes (standing) associated with concentrations producing maximal blockade are -10 for systolic and ndash 4 for diastolic In the pediatric study the observed maximal mean reductions (placebo corrected) at the studied doses were approximately -6 for systolic and -5 for diastolic Hence it appears the studied pediatric doses produce comparable changes in diastolic pressure but lower changes in systolic pressure It should be noted that in the pediatric studies only a few metoprolol plasma concentrations were gt than 107 ngmL It is unlikely that the maximal activity was achieved at the doses studied yet the Toprol doses appeared effective The differential maximal effects may also be due to the difference in initial SBP (adults patients with hypertension tend to have higher initial BPs) in adult and pediatric studies there was a dependence of change in SBP on initial SBP
DCP1PM Page 45 10182006
Clinical Pharmacology Review NDA 19-962 Toprol-XL 10182006
Introduction Summary
(b) (4)NDA SE5 033 was submitted to seek approval of labeling changes to the currently approved labeling for TOPROL-XL This labeling translates to a new Toprol-XL indication for pediatric patients (6 years and older) with hypertension
Background on Metoprolol in Hypertension The majority of the following information was obtained form a Review article (sponsor provided) by Plosker and Clissold [Drugs 43(3) 382-414 1992)]
Table 1 Snapshot of Metoprolol Clinical Pharmacology and Biopharmaceutics Drug Class Metoprolol is a szlig1-selective (cardio selective) adrenergic receptor-
blocking agent Mechanism of Action (antihypertensive effect)
Multiple putative mechanisms competitive antagonism of catecholamine at peripheral sites reduction of sympathetic outflow to the periphery or suppression of renin activity
Approved Indications Hypertension Heart Failure and Angina Pectoris Approved Formulations Immediate Release (IR) ndash metoprolol tartrate
Controlled Release (CRZ0K) Toprol-XL is extended-release tablet of metoprolol as the succinate salt
Metabolism Via CYP2D6 primarily Absorption Absolute oral bioavailability ~ 50 following IR Food does not affect
metoprolol absorption using ER formulation Distribution Protein binding to albumin is about 12 Elimination For IR t12 from 3 ndash 7 hours Less than 5 dose excreted unchanged
in urine No t12 values for ER this may be due to difficulty in separating absorption and elimination phases
Variability Plasma levels are highly variable among subjects after oral administration
Age Effects PK of metoprolol not affected by age (20 to 65 years) but concentration of active metabolite in subjects gt 65 years about twice as high as those in younger although metoprolol concentrations similar in two groups (Regardh et al)
PKPD in children Limited information in children and provided mainly after administration of metoprolol tartrate
Summarized PK and PKPD Information in Adults Table 2 Reported PK Values in Adults (multiple references)
References include Abrahamsson et al Sandberg et al Wieselgren et al
DCP1PM Page 46 10182006
Clinical Pharmacology Review NDA 19-962 Toprol-XL 10182006
Table 3 PKPD Information Reference Key Findings Abrahamsson et al Therapeutic level of szlig1blockade (model- reduction in exercise heart
rate or EHR) is between 80 and 300 nM Sandberg et al Toprol XL is designed to deliver metoprolol succinate at a near
constant rate for about 20 hr Wieselgren et al In healthy males maximal EHR ~ 14 and minimum reduction ~ 9
with 50 mg Activity greater than placebo over 24 hour period Dayer et al Lennard et al Jonkers et al
Poor metabolizers have a higher plasma concentration and a greater duration or degree of beta blockade Potential implications for use of extended release as may not be needed in PMs
Various sources Toprol XL produces clinically and statistically significant reductions in blood pressure values compared to baseline values The maximal blood pressure lowering effect for a given dose in adults is observed between 1 and 4 weeks of treatment In 4 week trials with Toprol XL the maximum decrease in supine BP was 209 and standing was 129 (unclear if at trough) At trough following 4 weeks of 50 mg QD Toprol XL relative to placebo the reduction in supine BP was 112 and 103 in Standing
Summary of sponsorrsquos current analysis relevant to pharmacometrics and resulting claims
Dose-Response Analysis A dose-response analysis was conducted using a simple linear regression model where metoprolol dose in mgkg was the independent variable Week 4 placebo corrected change in blood pressure (diastolic or systolic) from baseline was the dependent variable (response)
Sponsorrsquos Analysis Claims (Dose-Response Study) Following administration of TOPROL-XL at doses of 125 to 200 mg once daily for up to 4 weeks metoprolol
bull Exhibited a significant dose-response relationship for DBP but none for SBP bull Produced statistically significant and clinically meaningful reductions in SBP and
DBP for some individual andor pooled target dose groups (02 10 and 20 mgkg)
Population PK and PKPD Analyses The sponsorrsquos population PK and PKPD analyses involved the use of typical population PK approaches Primarily SAS and NONMEM were used to run the analyses In brief the sponsor pooled plasma concentration time data from patients in Study 307A (trough samples) and 307B (trough samples in most subjects and serial samples in a subset of patients) for the PK modeling PKPD (PD measured primarily as changes in blood pressure) data were from patients in Study 307A These collective data were used in the population PK and PKPD analyses
Initially the sponsor identified the best PK structural population model by testing several pharmacokinetic models This model was further refined by eliminating error terms (etas) that were not statistically significant Subsequently the sponsor evaluated the effect of DCP1PM Page 47 10182006
Clinical Pharmacology Review NDA 19-962 Toprol-XL 10182006
covariates on the PK model and developed a final PK model The goodness of the fit of the model was assessed with standard procedures The final population model was used to simulate individual plasma concentration-time profiles and Bayesian estimates for Cmax and AUC for all patients These simulated AUC and Cmax values and actual (observed) Ctrough were used in the PKPD model The PKPD model was developed in a similar manner as the population PK model Initially the best PKPD base model was identified and the model refined until a final PKPD model was identified
Sponsorrsquos Analysis Claims (Population PK and PD Modeling) 1 A 2-compartment PK model with first-order elimination and flip-flop first-order
absorption and lag time best fit metoprolol concentration-time data obtained from the studied pediatric hypertensive patients
2 The following tabulated parameter estimates were obtained using the final population PK model CLF 2275 Lhr V2F 961 L V3F 620 L QF 675 Lh Ka 00467 hrndash1 Tlag1 0853 hr
These PK values were generally in the same range as those reported in adults
3 Sex race ideal body weight and Toprol-XL dose have no significant effect on metoprolol pharmacokinetics No covariate impacts V2F V3F Ka or the Tlag of metoprolol Age has no effect on metoprolol CLF and body weight has no effect on QF Metoprolol CLF increases linearly with body weight however no dose adjustment based upon body weight is necessary because dosage is titrated based on clinical response QF is proportional to age however the increase in QF with age is not clinically relevant
4 Weak but statistically significant relationships existed between DBP SBP and HR and some measures of metoprolol exposure (trough plasma levels Cmax and AUC(0ndash 24)) Because of high variability in the hemodynamic data goodness-of-fit of the PKPD models was generally poor and the resulting parameter estimates were not considered reliable Extrapolation of these model parameters in the clinic for dose adjustment is not recommended
5 No covariates had an impact on the parameters delineating the PKPD relationship between metoprolol exposure and DBP SBP and HR
Objectives of the analysis There are three specific goals of the PM analysis
1 To evaluate the adequacy of the sponsorrsquos dose-response analysis 2 To evaluate sponsorrsquos population PK analysis and determine if PK labeling claims
are acceptable DCP1PM Page 48 10182006
Clinical Pharmacology Review NDA 19-962 Toprol-XL 10182006
3 To evaluate sponsorrsquos population PKPD analyses and determine if the findings support the proposed dosing recommendation
Dose Response Analysis (Study 307A) Title Dose Ranging Safety and Tolerability of TOPROL-XLreg
(metoprolol succinate) Extended-release Tablets (metoprolol CRXL) in Hypertensive Pediatric Subjects A Multicenter Double-blind Placebo-controlled Randomized Parallel-group Study
Study Duration 30 May 2002 - 9 June 2004 Investigators (primary) Bonita E Falkner MD and Jonathan Sorof MD 1800 Sites Multiple locations (36 in US and 1 in Dominican Republic)
Table 1 Objectives and Outcomes for Study 307A
Study Design (FDA-approved Type A design) This was a multi-center international double-blind placebo-controlled randomized parallel-group study The study included a screening visit a 1- to 2-week single-blind placebo run-in period during which all previous antihypertensive medications were discontinued and a 4-week double-blind treatment period At the end of the placebo run-in period eligible patients with blood pressure (BP) measurements in the qualifying range were randomized in a 1212 ratio to receive once daily oral doses of placebo TOPROL-XL 02 mgkg TOPROL-XL 10 mgkg or TOPROL-XL 20 mgkg TOPROL-XL doses of 125 25 375 50 75 100 150 or 200 mg were used to approximate the target doses Patients in the placebo and TOPROL-XL 02 mgkg groups received the target dose for 4 weeks while patients in the TOPROL-XL 10 mgkg and
DCP1PM Page 49 10182006
Clinical Pharmacology Review NDA 19-962 Toprol-XL 10182006
20 mgkg groups had their dose up-titrated (based on weight) to the target dose over the first 1 to 2 weeks of double-blind treatment
Reviewer Note Rationale on Study design The inclusion of more patients in the TOPROL-XL 02 mgkg and 20 mgkg groups allowed better estimation of the dose response at the low and high ends of the dose range The TOPROL-XL 10 mgkg group with fewer patients provided a middle estimate that helped to describe the shape of the dose-response curve However having a fewer number of subjects may have contributed to variability Inclusion of a placebo control group allowed for the quantification of treatment-related BP reductions after adjusting for placebo effect It should be noted that the placebo groups were not identical as they followed different titration schedules and had a different number of tablets
The 02 mgkg dose is lower than the lowest approved adult dose on a mgkg basis (assuming 70 kg adult weight) but the highest studied pediatric dose 20 mgkg (200 mg limit was placed) is lower than the highest studied adult dosage 400 mg
Table 2 Toprol Dosing Scheme for Study 307A
Table 3 Formulations used in 307A
DCP1PM Page 50 10182006
Clinical Pharmacology Review NDA 19-962 Toprol-XL 10182006
SPONSORrsquoS STATISTICAL ANALYSIS PLAN HIGHLIGHTS bull The primary analysis used an intention-to-treat (ITT) population which included
all patients who received at least 1 dose of study medication and had baseline and at least 1 post baseline measurement For this analysis missing data were imputed using a last observation carried forward (LOCF) approach
bull A simple linear regression analysis was performed on the placebo-corrected change from baseline to Week 4LOCF in sitting SBP and sitting DBP with dose ratio as the explanatory variable
bull The placebo correction for placebo-corrected changes from baseline to Week 4 LOCF in sitting SBP and sitting DBP was performed by subtracting the mean change from baseline for the placebo group from the individual patient changes in the other treatment groups
bull ANOVA was performed with treatment group as the main factor for the changes from baseline to each post baseline visit in sitting SBP and DBP This ANOVA model was used to construct pairwise comparisons of each active treatment versus placebo and the active treatment groups combined versus placebo
bull The percentage of responders at Week 4 was summarized by frequency counts percentages and 95 confidence intervals (CI) for each treatment group
bull Subgroup analyses were also performed on the changes from baseline at Week 4 in sitting SBP and DBP and the influence of heart rate and baseline body mass index (BMI) on the mean changes from baseline to Week 4LOCF in sitting SBP and DBP were examined using linear regressions
bull Trough plasma concentrations of metoprolol were summarized descriptively and the lower limit of quantitation (LLQ) was 1 ngmL
bull Safety data were summarized using the safety population defined as all patients who received at least 1 dose of study medication and were not lost to follow-up No statistical analyses were performed on the safety data in this study
DCP1PM Page 51 10182006
Clinical Pharmacology Review NDA 19-962 Toprol-XL 10182006
Results Patient Disposition Per applicant patients recruited into this study were representative of a pediatric population with hypertension The four treatment groups were balanced with respect to demographic and baseline characteristics (Tables 4 and 5) About 80 percent of the patients were considered 90 compliant
Table 4 Baseline Characteristics in Study 307A
Table 5 Sitting SBP and DBP measurements at baseline
Sitting and standing BP measurement were comparable (eg mean SBP for all patients- sitting = 1319 and standing 1306 with similar CVs ~ 9 )
Primary Efficacy Variable The results for the primary efficacy variable are illustrated in Figure 1 Figure Dose response for placebo-corrected change from baseline to Week4LOCF for sitting SBP (ITT population)
DCP1PM Page 52 10182006
Clinical Pharmacology Review NDA 19-962 Toprol-XL 10182006
Figure 1 Change in SBP from baseline as a function of Toprol XL dose
Table 6 Linear regressions statistics used to assess Dose-Response
The results indicate that bull The slope of the curve is not different form zero (p = 05371 for dose ratio)
suggesting that there is no dose-response relationship bull Most active treatment groups are more effective than placebo in reducing SBP
By visual inspection it appears the lack of observed dose-response is mainly driven by a lower than expected response at the 20 mgkg level
Potential issues affecting efficacy and pharmacokinetic results bull LOCF was required for eight patients however the LOCF approach did not
greatly impact the outcome of the trial bull Patients assigned to the 10 mg and 20 mgkg dose received drug for only 2
weeks whereas dose in the 02 mgkg received the same dose for 4 weeks
DCP1PM Page 53 10182006
Clinical Pharmacology Review NDA 19-962 Toprol-XL 10182006
Reviewerrsquos Supplemental Dose-Response Analyses The sponsorrsquos dose-response analysis was successfully reproduced by this Reviewer using pooled placebo corrected data A supplemental analysis was conducted using group-specific placebo corrected data In this procedure data for subjects assigned to a given Active Group (eg 02 mgkg) were corrected with Placebo data (02 mgkg) Group specific placebo data are presented in Table 7
Table 7 Placebo-group specific data Placebo Group Frequency Delta SBP 02 mgkg 8 -567 10 mgkg 6 -300 20 mgkg 9 230
It should be noted that the group-specific placebo data appeared to follow a consistent trend where the placebo effect decreased with increasing number of tablets It is unclear if this titrationtablet-dependent placebo effect is valid or random Overall the apparent differential placebo effects suggest that the placebo group may have overly influenced the outcome of the dose-response analysis
When active groups are corrected using group-matched placebo data there is a statistically significant dose-response The dose response using group-specific placebo data is illustrated in Table 8 and Figure 2
Figure 2 Placebo corrected changes in SBP (chg_pc on y axis) as a function of dose ratio
Potential Limitations of Supplemental Analyses Typically placebo effects are constant if randomization is correct thus it is unclear if subsetting the placebo group is acceptable and did not increase bias Additionally subsetting the placebo group leads to a reduced number of placebo subjects per dose group that may impact the regression analyses
DCP1PM Page 54 10182006
Clinical Pharmacology Review NDA 19-962 Toprol-XL 10182006
Table 8 SAS output for regression analyses using group-specific placebo corrections The REG Procedure
Model MODEL1
Dependent Variable chg_pc
Number of Observations Read 117
Number of Observations Used 117
Analysis of Variance
Sum of Mean
Source DF Squares Square F Value Pr gt F
Model 1 191083177 191083177 2663 lt0001
Error 115 825109481 7174865
Corrected Total 116 10162
Root MSE 847046 R-Square 01880
Dependent Mean -430358 Adj R-Sq 01810
Coeff Var -19682365
Parameter Estimates
Parameter Standard
Variable Label DF Estimate Error t Value Pr gt |t|
Intercept Intercept 1 125480 133166 094 03480
DOSRATIO Dose Ratio 1 -100051 019387 -516 lt0001
Secondary variables
bull Placebo-corrected change from baseline in sitting DBP The mean plusmn SD change (Week 4LOCF) in sitting DBP is illustrated in Figure 3 and Table 9
Figure 3 Mean changes (actual and placebo-corrected) from baseline to Week 4LOCF for sitting DBP (ITT population)
DCP1PM Page 55 10182006
Clinical Pharmacology Review NDA 19-962 Toprol-XL 10182006
Table 9 SAS output for regression analyses for DBP with pooled placebo correction
Treatment group effects and pairwise comparisons for sitting SBP and DBP Results of the treatment group effects at the Week 4LOCF visit and the pairwise comparisons between each TOPROL-XL group and placebo for the change from baseline in sitting SBP and DBP are shown for the ITT population in Table 10
Table 10 Treatment group effects for change in baseline to Week 4LOCF for sitting SBP and DBP (ITT population)
Some key findings from the pair-wise comparison are as follows (Table 10) 1 All active groups produced statistically significant reductions from baseline in sitting
SBP and DBP at the Week 4LOCF visit whereas placebo did not
DCP1PM Page 56 10182006
Clinical Pharmacology Review NDA 19-962 Toprol-XL 10182006
2 Overall the mean change from baseline in sitting SBP at Week 4LOCF for the TOPROL-XL groups pooled was statistically significantly larger than that for the placebo group (p=00351)
3 Results of pairwise comparisons between individual TOPROL-XL dose groups and placebo also revealed a statistically significant difference for the 10 and 20 mgkg groups (p=00270 and p=00492 respectively)
bull Mean changes over time in sitting SBP and DBP Consistent with findings from other studies with beta-blockers apparent maximal reduction in blood pressure occurred between 1 and 4 weeks of treatment
Figure 4 Mean changes over time for sitting SBP and DBP (ITT population)
Data points in plot are from absolute values (not taking baseline into account)
Subgroup Analyses The sponsor conducted several exploratory subgroup analyses however these analyses were not reviewed critically and are not presented in this review as
1 they do no impact the primary outcome or study objective 2 they are unlikely to be clinically useful due to the small number of patients per
subgroup One potentially useful some group analyses involved the percentage of responders as defined in Table 11
The responder analyses shows comparable response rates for all active dose groups suggesting similar efficacy across dose groups despite different exposure (doses)
DCP1PM Page 57 10182006
Clinical Pharmacology Review NDA 19-962 Toprol-XL 10182006
Table 11 Number and proportion of responders (ITT population)
Pharmacokinetic Results The Ctrough information obtained in the trial are summarized in Figure 6 and Tables 12 and 13
Table 12 Summary of Ctrough data (per applicant)
Sixteen patients across the 3 TOPROL-XL groups did not have blood samples obtained for analysis of metoprolol concentrations Based on the number of samples BLQ there appeared to be very low concentrations in the lowest dose group It appeared that Ctrough increased with dose According to the applicant these values are similar to those obtained previously in adults especially at the 2 higher doses Variability was high in all treatment groups (CV gt 60 )
Table 12 Summary of Ctrough (Reviewer Generated) from all patients (samples lt LOQ given value = 0) Toprol XL Dose Number of subjects Concentration (ngmL) (mgkg) Mean plusmn SD Median Range 02 39 137 plusmn 294 000 0 ndash 157 10 17 1224 plusmn 1416 845 0 ndash 571 20 46 2462 plusmn 3352 1140 0 ndash 1670
DCP1PM Page 58 10182006
Clinical Pharmacology Review NDA 19-962 Toprol-XL 10182006
Reviewer Note Overall the plasma concentrations (exposure) for the 02 mgkg dose group appear too low to be effective (close to LOQ) It is noted that adults typically have concentrations gt LOQ at the lowest therapeutic dose 25 mg (~ 4 ngmL)
Figure 6 Boxplot of metoprolol Ctrough using samples gt LLQ (per applicant)
Safety Results According to the applicant Toprol XL was well tolerated in the pediatric population as tabulated below
Main Analyses Conclusions bull No dose response was observed for corrected SBP using pooled placebo data
however using group-matched placebo data demonstrated a dose response bull Ctrough increased with dose bull Toprol 10 and 20 mg kg doses were more effective than placebo in reducing
SBP bull The responder rate was comparable across all active dose groups and this rate was
greater than that of placebo
DCP1PM Page 59 10182006
Clinical Pharmacology Review NDA 19-962 Toprol-XL 10182006
Methods Reviewerrsquos Methods Generally this reviewer conducted the analyses in a manner similar to that of the sponsor to confirm the sponsorrsquos findings
Sponsorrsquos Methods
Design Study1 307A
Reviewer Note This study was described in the Dose-Response Assessment (please refer to Page 7 Dose Response Analyses) Consequently only highlights relevant to the population analyses will be included in this section
Study 307A was a 4-week multi-center double-blind placebo-controlled randomized parallel-group study TOPROL-XL (metoprolol succinate) extended-release tablets were given to hypertensive pediatric patients Patients were randomized to double-treatment with a once daily oral dose of placebo or Toprol-XL at 1 of 3 target doses 02 or 20 mgkg The dose range for this study was 125 to 200 mg daily Patients on placebo followed the same schedule as that for their active group comparators
Study Flow Chart
Key Inclusion Criteria School age and adolescent children with reproducible SBP or DBP at or above the 95th percentile using height-adjusted charts for age and weight were eligible
DCP1PM Page 60 10182006
Clinical Pharmacology Review NDA 19-962 Toprol-XL 10182006
Study2 307B
Study 307B was a 52-week multi-center open-label study to determine the safety and pharmacokinetics of TOPROL-XL (metoprolol succinate) extended-release tablets (metoprolol CRXL) in hypertensive pediatric patients The starting dose was 25 mg daily The dose was increased every 2 weeks in increments of 25 mg or 50 mg based on tolerability until BP was controlled or the dose reached 200 mg
Table 1 Study Assessments
At the end of the 52-treatment period all patients had BP measured and a trough plasma level taken 24 hours the last dose of Toprol-XL with the exception of those patients who completed the serial portion at the final visit Among the participants a subgroup of approximately 30 patients was to participate in PK assessments of metoprolol requiring serial blood sampling at any time during the 52 weeks A single dose of 25 mg of Toprol-XL was given orally to those participating patients after a 48-hour washout period After the PK assessments they returned to the main study protocol Data
Study1 307A
4111 Pharmacokinetics A blood sample was to be collected at Visit 7 into a heparinized Vacutainer tube and obtained at 24 hours (plusmn2 hour) following the last dose of study medication (ie trough measurement) for determination of plasma metoprolol concentrations
Study Disposition Chart
DCP1PM Page 61 10182006
Clinical Pharmacology Review NDA 19-962 Toprol-XL 10182006
Table 2 Study Demographics
4112 Pharmacodynamics Primary variable
Sitting SBP determined at trough (24plusmn4 hours Visit 7) served as the primary efficacy assessment The primary measure of effect was the placebo-corrected change from baseline to the end of treatment (Week 4) in trough sitting SBP Each BP determination represented the mean of 3 readings with less than 7 mmHg between the highest and lowest value Blood pressure was measured using a mercury sphygmomanometer with an appropriate size cuff positioned approximately at the level of the heart Every effort was made to have the same individual measure the patientrsquos BP throughout the study if possible At all post randomization visits BP measurements were to be made at trough defined as 24 hours (plusmn4 hours) after receiving study medication All measurements were to be determined prior to the patient taking the scheduled dose of study medication In the
DCP1PM Page 62 10182006
Clinical Pharmacology Review NDA 19-962 Toprol-XL 10182006
event that the patient accidentally took study medication on the day of the scheduled visit the visit was to be rescheduled within 24 to 48 hours
Study2 307B
4113 Pharmacokinetics A 48-hour washout period prior to sampling was required for all patients including patients who entered the 52-week study and then decided to participate in the serial PK portion of the study All patients were to have a 15-mL blood sample collected into a heparinized Vacutainer tube 24 hours (plusmn2 hour) following the last dose of TOPROL-XL (ie trough measurement) at Visit 18 (or a the time of premature discontinuation) except for patients who participated in the serial PK portion of the study and had blood sampling performed at Visit 18 For patients participating in the serial PK portion of the study blood samples (15 mL) were to be collected into heparinized Vacutainer tubes and obtained at Hour 0 (predose) and at 1 2 3 4 6 8 10 and 24 hours after administration of a single 25 mg dose of TOPROL-XL following a 48-hour washout period After the last blood sample was obtained the patient was to startresume the prescribed dose of TOPROL-XL heshe was receiving prior to PK sampling
Patient Disposition Chart (completion or discontinuation)
Overall a total of 31 patients at 8 centers were enrolled in the serial PK portion of the study Of these 31 patients 27 had plasma concentration data available and were included in the analyses Four patients were excluded from the analyses because their plasma concentrations were not quantifiable (Nos 047-009 and 047-021) or because only whole blood samples were analyzed (Nos 005-002 005-003)
DCP1PM Page 63 10182006
Clinical Pharmacology Review NDA 19-962 Toprol-XL 10182006
Table 3 Subject Demographics for Patients Providing Serial Blood Samples
Missing Data Twenty-six patients did not have blood samples obtained for analysis of metoprolol concentrations in either the 16-week (n=7) or 52-week (n=19) studies Among patients with plasma samples 14 (14) in the 52-week study and 13 (13) in the 16-week study had trough plasma metoprolol concentrations that were below the LLQ Therefore data from a total of 99 patients were included in this analysis
Assay Metoprolol plasma levels were assayed using high-performance liquid chromatography tandem mass spectrometric detection methods having limit of quantitation (LOQ) of 1 ngmL The method was validated in the linear range 1 to 1000 ngmL Precision was less than or equal to 109 Accuracy ranged from 940 to 1013 Pharmacodynamics Not applicable
Data Checking SAS was used to format and check data Additionally visual inspection of several randomly selected subject data was carried out
DCP1PM Page 64 10182006
Clinical Pharmacology Review NDA 19-962 Toprol-XL 10182006
Models
Overview The sponsorrsquos stated assumptions underlying this modeling analysis are
1 Rich sampling data collected from 30 subjects in 307B Study can be used to adequately characterize the structural pharmacokinetic model of metoprolol
2 Structural pharmacokinetic models of metoprolol at other dose strength are identical to that at 25 mg
3 Metoprolol exhibits a linear pharmacokinetics in the dose ranges studied 4 Steady-state pharmacokinetics of metoprolol has been reached at the time of blood
sampling in Study 307A 5 Metoprolol accounts for the blood pressure effect in the study 6 Existing various disease states in the patients have no impact on the pharmacokinetics
of metoprolol and pharmacodynamics of the blood pressure reduction in the study 7 Concomitant medications if existed do not have any effects on the pharmacokinetics
of metoprolol and pharmacodynamics of the blood pressure reduction in the study
Reviewer Comment The sponsorrsquos assumptions appear reasonable based on existing metoprolol PKPD information
Pharmacokinetics
4114 PK Structural Model Several PK models were tested to identify the structural model Flip-flop absorption was taken into consideration based on general PK characteristics following administration of sustained release tablets and observed data in the current study (serial PK samples)
The models tested included linear 1- and 2-compartment PK models with the following characteristics (focused on flip-flop models)
bull first-order absorption with and without absorption lag time (NONMEM subroutines ADVAN2 and ADVAN4)
bull zero-order absorption with and without absorption lag time (NONMEM subroutines ADVAN1 and ADVAN3)
bull simultaneous zero- and first-order absorption from the absorption compartment The models were parameterized in terms of CLF and VF
Ultimately the 2-compartment model with first order flip-flop absorption an absorption lag time and 2 residual error terms was selected as the structural model of metoprolol The model scheme is presented in the following Figure 1 Figure 1 PK Compartmental Model
DCP1PM Page 65 10182006
Clinical Pharmacology Review NDA 19-962 Toprol-XL 10182006
4115 PK Covariate Model Covariate models were developed to account for the potential impact of the following covariates and derived covariates on metoprolol PK
Continuous variables bull Age (AGE years) bull Body weight (WT kg) bull Body surface area (BSA m2) calculated from WT and HT (cm) using the height
weight formula BSA=0024265 x WT 05378 x HT03964 bull Ideal body weight (IBW kg) calculated as - Males IBW=50+(HTndash150)25 and
for Females IBW=45+(HTndash150)25 bull Dose (DOSE mg of Toprol-XL)
Categorical variables bull Gender (SEX) - Male 0 - Female 1 bull Race (RACE) - Caucasian 0 - Black 1 - Asian 2 - Other 3
PK covariate effects were modeled as follows
Effects of continuous covariates (AGE WT BSA IBW and DOSE) were normalized to the corresponding median value across a dataset such that continuous covariates were related to structural PK parameters in a power function as described below
where Θ is the fixed-effect parameter of a covariate estimated by the NONMEM program covariate value is the observed covariate value and PK typical value is the typical value of the PK parameter estimated by NONMEM Effects of categorical covariates (SEX and RACE) are related to structural PK parameters by fractional changes of dummy variables
DCP1PM Page 66 10182006
Clinical Pharmacology Review NDA 19-962 Toprol-XL 10182006
Where Θ is the fixed-effect parameter of a covariate estimated by the NONMEM program covariate is the dummy variable value and modified in the control streams and PK typical value is the typical value of this PK parameter as estimated by NONMEM
Median values of all covariates in the dataset for population PK analysis are presented in Table A
Table A Summary of patient covariates and Toprol-XL doses in the data for population PK analysis
Two Steps were included in the modeling of covariates
Step 1 Forward Addition The covariates were subjected to a stepwise forward selection algorithm using a likelihood ratio test based on a change in MOF values from the base model A significant covariate reduced the MOF more than 660 (chi-square distribution plt001 degrees of freedom [df]=1)
Step 2 Backward deletion (Excluding procedures for covariate effect) The covariates in the full model acquired in Step 1 were subjected to a backward deletion algorithm 1 covariate was deleted at a time using a likelihood ratio test based on a change in MOF values A covariate was determined to be statistically significant if the change in MOF after its deletion from the breakdown model was increased by more than 1083 (chi-square distribution plt0001 df=1)
4116 PK Random Variance Models An exponential error model was used to characterize inter-patient variability based upon the assumption that random effects for PK parameters were not correlated among PK parameters No other error models for eta were evaluated by the applicant or by this Reviewer The retention of ETA values for each PK parameter in the structural model was confirmed by sequentially fixing each ETA value at zero and comparing each resultant MOF with the MOF obtained when all ETA values were retained in the model (see Table 6)
DCP1PM Page 67 10182006
Clinical Pharmacology Review NDA 19-962 Toprol-XL 10182006
The residual model was modeled by an additive model two error terms were used one for error associated with trough samples and the other with serial samples
Reviewer Note Use of an exponential model appears reasonable
Pharmacodynamics
4117 PKPD Structural Model The equations for the structural models are shown below
1 Metoprolol Ctrough The relationships between the observed metoprolol concentrations (Ctrough) and hemodynamic changes were investigated using 4 direct-link models namely a linear model a log-linear model and Hillrsquos sigmoid Emax PKPD model with and without a baseline
2 The relationships between Cmax or AUC0ndash24 and hemodynamic changes were investigated using 2 direct-link models a linear model and a log-linear model
4118 PKPD Covariate Model The inclusion and exclusion procedures of covariate effect on the selected PKPD base model to obtain a selected final PKPD model were identical to those in the covariate evaluation in the population PK models as described previously in PK Covariate Model DCP1PM Page 68 10182006
Clinical Pharmacology Review NDA 19-962 Toprol-XL 10182006
Table B Baseline demographic and covariate characteristics
4119 PKPD Random Variance Models An exponential error model was used by the applicant to model inter-individual variability The retention of a random effect parameter ETA in each selected PKPD structural model was then evaluated by sequentially fixing each ETA value at zero and comparing each resultant MOF with the MOF obtained when all ETA values were retained in the model (plt005) This step reduced over-parameterization by deleting unnecessary random-effect parameters from the structural model to obtain the base model
Reviewer Note The study design precludes assessment of inter-individual variability or random error because only one dose record was available per patient Consequently the model should not have included eta terms It is noted that the sponsor ultimately dropped the eta term in the final model
DCP1PM Page 69 10182006
Clinical Pharmacology Review NDA 19-962 Toprol-XL 10182006
Model Selection
PK Initial Model Selection
PK Base Model to Final Model The selection of the most appropriate PK base model for a metoprolol PK was based upon the following criteria a significant reduction in MOF as compared to the baseline model and asymptotic chi-square distribution based on the likelihood ratio test or AIC (plt005) as compared to the other structural models This selected PK base model was then subject to a covariate evaluation The population PK model bearing all surviving covariate parameters with statistical significance became the penultimate final model If 1 of the body size parameters (WT BSA and HT) was not in the model the penultimate final model became the final model If body size parameters were in the model they were sequentially replaced by other body size parameters in the regression submodel for each PK parameter The best body size parameter was then selected on the basis of lowest MOF to form the final model
PK Final Model Selection Simulations and visual inspections based on goodness of fit plots were used to qualify and validate the model The goodness-of-fit of the final model was evaluated graphically by comparing population and individual predictions of metoprolol concentrations with observed metoprolol concentrations along the line of unity and by visual inspection of the following plots of population-weighted residuals (WRES) for the final population model 1 Population-weighted residuals (WRES) versus population-predicted concentrations (PRED) 2 WRES versus time after first drug administration in each patient 3 WRES versus all covariates evaluated WRES were generally expected to be distributed homogenously around zero for PRED time after administration and covariates For those 27 patients with serial samples goodness-of-fit of the plasma concentration-time profile for each individual was visually inspected The linear relationship between their AUClast values from the observed data and those from the simulated data (final model) was examined
The predictive performance of the final population PK model including covariates was evaluated by comparing typical values of PK parameters with the mean of individual Bayesian estimates or individual values of PK parameters with the results from non-compartmental analysis for patients with serial samples Steady-state metoprolol plasma concentration-time profiles from 0ndash24 hours at the interval of 15 minutes (025 hour) were calculated using the post hoc Bayesian estimated PK parameter obtained for 65 patients included in the PKPD relationship using the following equation
DCP1PM Page 70 10182006
Clinical Pharmacology Review NDA 19-962 Toprol-XL 10182006
PKPD Initial and Final Model Selection A similar approach to that of PK model selection was adopted for PKPD Each of the above-mentioned PKPD models with random effects was identified by curve-fitting the dataset Initial selection of the PKPD structural model was based upon a significant reduction in MOF (plt005) as compared to the baseline model and reasonable PKPD parameter estimates Software
Nonlinear mixed-effect modeling (NONMEM) software (Version V level 11 Globomax Hanover MD) was used in the population PK analysis PK model fitting was accomplished using first-order (FO) approximation methods For PKPD model fitting the first-order conditional estimation (FOCE) with eta-epsilon interaction method in NONMEM was used for all model runs
SAS software (Version VIII Cary NC) was employed to prepare datasets according to the format required by the NONMEM program (Boeckmann et al 1991) Microsoftreg Excel 2000 (Redmond WA) and S-PLUS 2000 (Professional Release 2 MathSoft Inc Cambridge MA) were used to perform exploratory graphical exposure calculation and statistical analyses according to the format required by the NONMEM program (Boeckmann et al 1991) SAS command files logs and listings pertaining to data file conversion and merging were reviewed by an independent analyst Datasets were stored in SAS data frames combined and exported to Excel and then to ASCII files before fitting to the model
Datasets were prepared and pooled in a NONMEM-compliant format using SAS software by the Programming Group Clinical Information Sciences at AstraZeneca Wilmington Delaware SAS command files logs and listings pertaining to file conversion and merging were provided and found to be acceptable The contents of both datasets (toprolkatcsv for PK modeling and cppd2csv for PKPD modeling) were included
DCP1PM Page 71 10182006
Clinical Pharmacology Review NDA 19-962 Toprol-XL 10182006
toprolkatcsv was not provided electronically in a SAS format however this reviewer generated a similar dataset using the applicantrsquos criteria
Reviewer Comment The software and data assembly methods appeared adequate
DCP1PM Page 72 10182006
Clinical Pharmacology Review NDA 19-962 Toprol-XL 10182006
Results and Discussion Design Adequacy
Overall the trial designs appeared adequate to evaluate metoprolol population PK and PKPD in pediatric patients receiving Toprol XL However the design could have been further optimized by increasing the sampling points particularly in the absorption phase Due to the limited number of samples in the absorption phase it was not possible to accurately characterize the absorption model first order vs zero order or mixed first and zero order Additionally collection of mainly trough samples limits the ability to accurately estimate measures such as Cmax that are not directly related to Ctrough particularly if multiple compartments are present Consequently Cmax estimations are unlikely to be accurate Finally most patients provided only one trough sample thus inter-individual variability could not be adequately captured and may have limited the utility of the modeling exercise particularly in PKPD where the random effect could not be accurately characterized Ultimately there was no random variable in the final PKPD model (ie eta was set to zero) Data Integrity
This reviewer checked the data visually by randomly selecting data from patients included in the population modeling and comparing to data in the study report (source data) Overall the data integrity appeared acceptable The applicant observed the following guidelines that appeared acceptable No datum from any study participant with a protocol violation that was thought to materially impact the analysis was included The dataset contained data from only those study participants who could be evaluated ie with all the last dosing datetime blood sampling datetime plasma drug concentrations and demographic covariates
Data that were excluded (n = 62 samples) from the model were as follows One sample from an apparent poor metabolizer Two samples collected gt 96 hours post dose From 307B 10 trough samples lt LOQ From 307A 17 samples lt LOQ Thirty-samples from serial data that were lt LOQ or whole blood samples Model and Model Selection
Base Model
41110 Pharmacokinetic Model description The base PK model was a standard two compartment model that incorporated lag time and flip-flop kinetics The key features of the model were flip-flop was insured by making the value of ke gt ka in the clearance equation Additionally lag time was restricted to a value of 2 hours or less and concentrations were log transformed consequently all concentrations (F) = 0 were given individual predicted concentrations of zero Finally there were two residual error terms one for serial samples and the other for trough samples DCP1PM Page 73 10182006
Clinical Pharmacology Review NDA 19-962 Toprol-XL 10182006
Key equations were as follows
KA = THETA(1)EXP(ETA(1)) V2 = THETA(2)EXP(ETA(2)) CL = (THETA(1)THETA(2)+THETA(3))EXP(ETA(3)) Q = THETA(4)EXP(ETA(4)) V3 = THETA(5)EXP(ETA(5)) ALAG1=THETA(6)EXP(ETA(6))
41111 PK Parameter estimation results Table 1 Summary of PK parameters in the metoprolol population PK base model (per applicant)
41112 Goodness of fit The applicant provided the following goodness-of-fit plots (Figure 1)
Reviewer Note The goodness-of-fit plots were reproduced by this Reviewer (see Appendix) with minor modifications
Figure 1 Goodness of fit plots for Base Model
DCP1PM Page 74 10182006
Clinical Pharmacology Review NDA 19-962 Toprol-XL 10182006
Base PK Model Selection The MOF values of all structural model candidates tested are presented in Table 2 Model selection was based primarily on MOF values the lower MOF the better the model The applicant reports that in general MOF values generated by a conventional absorption model (ie absorption rate is faster than elimination rate) and a flip-flop absorption model (ie absorption rate is slower than elimination rate) were identical
Reviewer Comment The existence of flip-flop kinetics appears plausible based on data provided and general patterns for sustained release formulations Consequently the use of flip-flop kinetics for the bulk of the modeling exercise appears reasonable
General conclusions from the information in Table 2 are First order input is better than zero order input Two compartment model is better than one compartment model Lag time presence is better than lack of lag time Two residual error terms are better than one residual error term It should also be noted that several other models led to unsatisfactory completion of the run and were not considered further
DCP1PM Page 75 10182006
Clinical Pharmacology Review NDA 19-962 Toprol-XL 10182006
Table 2 Comparison of Structural PK Models
Reviewer Comment The selected structural model appears appropriate based on the data
Base Model The deletion of ETA for V2 did not change the MOF value suggesting that ETA for V2 should be deleted to avoid an over-parameterized warning (Table 3) This was consistent with the estimated parameter value of ETA for V2 being 648 x 10ndash9 a very small value Therefore the base model was selected by deleting the ETA for V2 from the structural model
Reviewer Comment on Eta deletion for V2 Deletion of eta for V2 is acceptable based on the empirical data however from a physiological perspective deletion of eta is problematic Generally one anticipates inter-individual differences in volume of distribution In this case it appears that the error associated with V2 may have been randomly shifted to V3 and or Q terms as the three DCP1PM Page 76 10182006
Clinical Pharmacology Review NDA 19-962 Toprol-XL 10182006
terms are interrelated This potential shift in error is supported by the fact that the V2 eta value increases significantly (by several orders of magnitude- 10-5 vs 100) when eta for Q and or V3 is fixed However when Q or V3 are fixed minimization is successful but Q and V3 are not accurately estimated Accounting for the possible error shift is a complex process and goes beyond the scope of this reviewer thus deletion of eta associated with V2 was considered acceptable for the remainder of the modeling evaluation
Table 3 Structural elements tested in the metoprolol population PK structural model (p lt 0005)
Final PK Model
41113 Model description The key feature of the final model is the inclusion of the covariate effects of age on Q and weight on CL in the population PK model
Key Equations CL = (THETA(1)THETA(2)+THETA(3)+EWT)EXP(ETA(2)) Q = THETA(4)EAGEEXP(ETA(3))
Including Covariate Effects As previously described covariate effects were assessed by forward addition and backward deletion Most covariates did not significantly change MOF however BSA significantly affected CL and Age affected Q Consequently these covariates were included in the penultimate final model
DCP1PM Page 77 10182006
Clinical Pharmacology Review NDA 19-962 Toprol-XL 10182006
Reviewer Note BSA is derived form WT and HT covariates implying BSA is highly correlated to these two covariates (Figure 2) weight is the most suitable (practical covariate) as it is readily measured Furthermore weight and BSA produced the same MOF (Table 4) whereas MOF with height was more positive (less significant)
Figure 2 Plot of BSA vs Body Weight
The data in Table 4 support selection of the final model
Table 4 Covariate elements tested in the metoprolol population PK penultimate final model (plt0005)
The applicant acknowledges that mechanism(s) accounting for the impact of age on QF are not clear However since distribution clearance has little effect on metoprolol plasma exposure further investigation is not needed
41114 PK Parameter estimation results As shown in Table 5 PK parameters were estimated fairly precisely by the final model
Table 5 PK Parameter Estimates using Final Model
DCP1PM Page 78 10182006
Clinical Pharmacology Review NDA 19-962 Toprol-XL 10182006
41115 Goodness of fit The goodness-of-fit plots provided by the applicant show good precision Figure 5 Goodness of fit plots for final PK model
DCP1PM Page 79 10182006
Clinical Pharmacology Review NDA 19-962 Toprol-XL 10182006
PK Model Qualification The post hoc Bayesian-estimated AUC (simulated) obtained for the 27 patients with serial plasma samples are plotted against the observed (AUCt) The correlation was high (R2 gt 099) Figure 6 AUClast from observed data versus AUCt from model simulation in the 27 patients providing serial plasma samples
Regression line Y= 4514 + 08976 X R2 = 09957
The graphical validation of the final metoprolol population PK model validation against covariates evaluated is presented in Figure 6
Figure 7 Graphical validation of covariates
DCP1PM Page 80 10182006
Clinical Pharmacology Review NDA 19-962 Toprol-XL 10182006
There was no systematic bias in weighted residuals for any covariates evaluated suggesting that the final model included all appreciable effects of available covariates (Figure)
The effects of weight on metoprolol CLF are illustrated in Figure 8 where Bayesian post hoc estimates of CLF are plotted against weight and overlaid by the model-predicted line Overall the model appeared to fit the data well
Figure 8 Plot of CLF vs Body weight
The effects of AGE on metoprolol QF are illustrated in Figure 9 where Bayesian post hoc estimates of QF are plotted against AGE and overlaid by the model-predicted line Figure 9 Plot of QF vs Age
DCP1PM Page 81 10182006
Clinical Pharmacology Review NDA 19-962 Toprol-XL 10182006
Reviewer Note The applicant indicated that attempts to run the final model using the first-order conditional estimation method resulted in termination errors Therefore the parameter estimates obtained by the FO method were reported as the final parameter estimates
Conclusion Regarding Population PK Modeling Overall the sponsorrsquos population PK modeling is acceptable
PKPD Model and Model Selection
PKPD Base Model PharmacokineticPharmacodynamic Model description The key feature of the model was a lack of random variance term for the slope (since only single data points were available per subject) and inclusion of baseline effect
Key equations were as follows E0 = THETA(1)EXP(ETA(1)) M = THETA(2) Y = E0 + MLOG(AUC) + EPS(1)
The control stream provided in the appendix is that for DBP (provided by sponsor) The control stream for SBP is comparable with appropriate substitution for BP type
It should be noted that only the log-linear and linear PKPD models were considered suitable for AUC and Cmax For this review only AUC estimates were considered reliable as Cmax estimates could not be accurately determined based on the sampling scheme Consequently the remainder of this review focuses on AUC information although Ctrough and Cmax data are displayed for reference
Bayesian estimates from PK modeling are summarized in Table 1
Table 1 Bayesian estimates of metoprolol PK exposure for those patients included in the PKPD analysis (N=65)
DCP1PM Page 82 10182006
Clinical Pharmacology Review NDA 19-962 Toprol-XL 10182006
PKPD Model Selection (initial and final) The log-linear model was adopted as the base model for this PKPD relationship since it improved the MOF significantly (Table 2) The ETA parameter for the slope was pre-eliminated for the purpose of model parsimony The intercept and slope in this log-linear model for AUC(0-24) did not bear ETA parameter therefore no covariates had impact on either parameter in the model
Reviewer Note The intercept should not have borne an eta term because individual subjects provided only one data point Consequently fixing eta to zero or deleting eta in the final model is appropriate No further model development was required after eta was eliminated and the base model was equivalent to the final model
Table 2 Base population PKPD models tested for the change in SBP
41116 PKPD Parameter estimation results The final PKPD parameter estimates are presented in Table 3
Table 3 Summary parameters in the final PKPD model for the change in SBP using trough plasma level Parameter Explanation Estimate SE ()b
DCP1PM Page 83 10182006
Clinical Pharmacology Review NDA 19-962 Toprol-XL 10182006
Model Qualification Based on the relatively low R2 value and as shown in Figure there is a poor correlation between change in SBP and log AUC
Figure 1 Relationship between change in SBP and AUC (line generated from modeling)
Overall goodness-of-fit of the model was considered to be poor probably due to the high variability in the measurements Consequently the precision of the model parameter estimates was not considered to be very reliable These parameters have little clinical usefulness and can be treated only as an indication of trends ie more hemodynamic effects can be potentially achieved when high Toprol-XL doses are given Clinical dose adjustment based on these PKPD parameters is not recommended
Reviewerrsquos Supplemental Analyses A supplemental PKPD analyses was conducted using simple linear regression since the population model did not improve the fit Overall eta made an insignificant contribution to the overall model The results of the analyses were similar to the population analyses A series of regression analyses were conducted and are presented in Table 4
The applicant notes that the preliminary modeling exercise found that there was no difference in the PKPD modeling results using different hemodynamic data formats (ie change in the measurements percent change in the measurements or actual BP measurements) This finding was confirmed by this reviewer (see Table 4)
DCP1PM Page 84 10182006
Clinical Pharmacology Review NDA 19-962 Toprol-XL 10182006
Table 4 Supplemental PKPD Regression Analyses Conducted by Reviewer Model (liner regression) Intercept (I) Slope (m) R2 Probability RSBP = mISBP + I 3957 -035 01626 0009 PSBP = mISBP + I 2524 -023 01252 00038 PSBP = mRSBP + I 0005 074 09891 lt 00001 RSBP = mlogAUC + I 651 -221 0060 00493 RSBP = mDose + I -751 0006 00026 06878 RSBP = mDose^ + I -312 -111 004 02711 RSBP = mlogAUC + nISBP + I 5303 -221 (m)
-035 (n) 02230 0001
RSBPplc = mAUC + I -667 -0003 00458 00871 RSBPplc = mlogAUC + I 461 -2208 00600 00493 RPUL = mlogAUC + I 1868 -405 01102 00069 Symbols in table similar to population PK model without eta term RSBP- change of SBP without placebo correction ISBP- initial (baseline) SBP RPUL- change in HR without placebo correction Dose- in mg where placebo is included as 0 mg PSBP- percentage change of SBP without placebo correction
Conclusion Regarding Population PKPD Modeling Overall the sponsorrsquos population PKPD modeling is acceptable No dose adjustment conclusion can be made from this modeling however an exposure-response relationship was established for AUC and reduction in SBP
Discussion
The significance of the results 1 Provide estimates of PK measures and plasma exposure in pediatric population These data can be compared to adult exposure to determine if exposure differences impact drug effectiveness The main challenge in comparing pediatric data to adult data is different modeling schemes formulations and methods were used in the two populations
2 PKPD findings are not sufficiently precise to provide a dose adjustment algorithm however the PKPD analyses provides rationale for proposed titration as increasing exposure (doses) may improve efficacy (reduction in SBP) Ultimately the risk-benefit analyses overrides PKPD assessment for dose adjustment drug will be titrated thus reliance on PKPD information is not critical The proposed dose 10 mgkg appears suitable based on available information It is unclear from the studies if there should be an initial maximum dose although the sponsor has proposed 50 mg as the maximum initial dose The proposed pediatric starting dose on a mgkg basis is within the range of starting adult doses (25 ndash 100 mg) assuming an adult weighs 70 kg
3 Cumulative information form dose-response study indicates that Toprol XL has effectiveness in children however the most effective dose is unclear Since the drug can be titrated determining the initial optimal dose does not appear critical As proposed by the applicant dosing is started at a ldquolowrdquo dose that can be up-titrated if needed
DCP1PM Page 85 10182006
Clinical Pharmacology Review NDA 19-962 Toprol-XL 10182006
4 The results did not adequately address the potential impact of CYP2D6 metabolic status for pediatric patients taking Toprol XL There were an insufficient number of patients to make this assessment
5 Covariate effects do not appear significant only body weight significantly affects clearance However a worst case scenario can occur with a person that has a low body weight and is a poor metabolizer this will result in very high possibly supra-therapeutic exposure Age does not impact apparent oral clearance so an age-dependent dose adjustment is not needed for children over 6 years old In essence all children over six years old can initiate therapy at 10 mgkg
The validity of the results Overall the results produced by the sponsor appear valid and the sponsor used a sound modeling approach However alternative approaches that could have been adopted may have improved the outcome of the analyses Three of these approaches are presented below 1 Additional PK samples should have been collected during the absorption phase and
throughout the dosing interval to improve the modelrsquos performance Specifically additional samples collected during the absorption phase may have unambiguously identified the actual absorption input function (eg first order zero order mixed first and zero order) First order input was selected for the analyses although the dosage form is reported to exhibit zero order kinetics in adults It is possible that the input rate in children differs from that in adults but unlikely It should be noted that absorption kinetics in children is often erratic due to multiple factors (eg regioshyselective absorption incomplete gastric emptying and inconsistent absorption) so it is unclear if additional samples would have definitively identified the absorption function However additional non-trough samples may have helped in estimating key PK measures such as V and Cmax The final model did not have an eta associated with V which is atypical Collection of additional samples on different visits may have helped estimate potential inter-occasion variability It should be noted that AUC was estimated precisely for subjects providing serial samples but these subjects were not necessarily included in the PKPD analyses Ideally the PKPD modeling should have been conducted primarily in subjects who had accurate PK measures
2 The PKPD design could have been modified to potentially improve the utility of the analyses Specifically there should have been better placebo matching procedures to minimize the potential impact of the placebo effect This matching could have been improved by ensuring all patients on placebo had the same titration schedule and number of tablets It is noted that the model had a poor predictive performance that was mainly attributed to the high degree of variability in the PD measures Potentially other PD markers could have been explored that have less inherent variability One such marker is the degree of beta blockade using exercise heart rate (EHR) reduction this marker has been used extensively for metoprolol in adult subjects However use of EHR in the pediatric setting may be challenging
DCP1PM Page 86 10182006
Clinical Pharmacology Review NDA 19-962 Toprol-XL 10182006
Comments to sponsor
In future pharmacometric studies you should consider the following 1 collect sufficient (multiple) samples from individual subjects to allow assessment
of inter-occasion variability and estimation of inter-individual variability (eta) for all relevant parameters
2 placebo groups should be identically matched across all dose groups (eg same titration schedule and number tablets) to minimize potential bias or differences in the placebo effect
Comments to medical reviewer
1 The sponsor has adequately characterized metoprolol PK in the studied pediatric population The PK characterization could have been further optimized by obtaining additional samples over the entire dosing interval (eg during the absorption phase and elimination phase) on multiple occasions rather than on one occasion primarily at trough
2 A dose-response relationship could not be established using the protocol specified analysis approach The outcome of the dose-response relationship appeared highly dependent on the ldquoplacebo effectrdquo suggesting that the placebo group may not have been appropriate One should consider re-evaluating the dose-response precisely matched placebo groups (eg all placebo patients have identical number of tablets and titration schedule)
3 Based on the PKPD analysis plasma exposure (AUC) explains lt 10 of the response (reduction in systolic blood pressure) thus has limited clinical utility However the PKPD relationship suggests that there is a trend for increased response with increased exposure (dose driven)
4 Overall information from the dose-response study suggests that Toprol- XL is effective in the pediatric population The optimal initial dose 02 10 or 20 mgkg or the maximum safe and effective dose cannot be determined from the information provided It is noted that the 02 mgkg dose is unlikely to be effective as plasma concentrations achieved at this dose are unlikely to be effective (most concentrations lt LOQ and lower than effective adult concentrations) The 10 mgkg (proposed by applicant) appears to be a reasonable initial dose The labeling should reflect the regimens studied
DCP1PM Page 89 10182006
Clinical Pharmacology Review NDA 19-962 Toprol-XL 10182006
Appendix
DCP1PM Page 90 10182006
Clinical Pharmacology Review NDA 19-962 Toprol-XL 10182006
DCP1PM Page 91 10182006
Clinical Pharmacology Review NDA 19-962 Toprol-XL 10182006
DCP1PM Page 92 10182006
Clinical Pharmacology Review NDA 19-962 Toprol-XL 10182006
DCP1PM Page 93 10182006
Clinical Pharmacology Review NDA 19-962 Toprol-XL 10182006
DCP1PM Page 94 10182006
Clinical Pharmacology Review NDA 19-962 Toprol-XL 10182006
DCP1PM Page 95 10182006
Clinical Pharmacology Review NDA 19-962 Toprol-XL 10182006
Table 15 Control streams for final log-linear PKPD model for the change in DBP using metoprolol Cmax as the measure of exposure
Truncated NONMEM reports for base model identification for PKPD relationship in change of SBP (per sponsor)
DCP1PM Page 96 10182006
Clinical Pharmacology Review NDA 19-962 Toprol-XL 10182006
Reported PD information^
^ Under metoprolol regimen CRZ0K is Toprol XL
DCP1PM Page 97 10182006
Clinical Pharmacology Review NDA 19-962 Toprol-XL 10182006
Table Results of randomised double-blind comparative trials evaluating antihypertensive efficacy of metoprolol formulations or other antihypertensives
DCP1PM Page 98 10182006
---------------------------------------------------------------------------------------------------------------------
---------------------------------------------------------------------------------------------------------------------
---------------------
This is a representation of an electronic record that was signed electronically and this page is the manifestation of the electronic signature
s
Robert Kumi 10182006 045635 PM BIOPHARMACEUTICS
Patrick Marroum 10192006 050811 PM BIOPHARMACEUTICS

Clinical Pharmacology Review NDA 19-962 Toprol-XL 10182006
Figure 1 Dose response for placebo-corrected change from baseline to Week4LOCF for sitting SBP (ITT population)
Reviewerrsquos Analysis Primary Variable When group-specific placebo corrected data were used for correcting change in SBP there was a statistically significant dose-response (Figure 2) Figure 2 Placebo corrected changes in SBP (chg_pc) as a function of dose ratio (relative to 02 mgkg)
In this procedure data for subjects assigned to a given active group (eg 02 mgkg) were corrected with placebo data (02 mgkg) It should be noted that the group-specific placebo data appeared to follow a consistent trend where the placebo effect decreased with increasing number of tablets It is unclear if this titrationtablet-dependent placebo effect is valid or random Overall the apparent differential placebo effects suggest that the placebo group may have overly influenced the outcome of the dose-response analysis Two potential limitations of this Reviewerrsquos supplemental analyses are
1 Typically placebo effects are constant if randomization is appropriate thus it is unclear if sub-setting the placebo group is reasonable and did not increase bias
2 Additionally sub-setting the placebo group leads to a reduced number of placebo subjects per dose group that may decrease the robustness of the regression findings
Page 9 of 98
Clinical Pharmacology Review NDA 19-962 Toprol-XL 10182006
2242 Dose-Response Assessment using Secondary Variable and Analyses
Treatment Group Effects and Pairwise Comparisons for sitting SBP and DBP Key findings from the group and pair-wise comparisons are 1 All active groups produced statistically significant reductions from baseline (p lt 002) in
sitting SBP (|∆ SBP| gt 5 mmHg) and DBP (|∆ DBP| gt 3 mmHg) at the Week 4LOCF visit whereas placebo (p = 03133) did not
2 Overall the mean change from baseline in sitting SBP (|∆ SBP| = 4256) at Week 4LOCF for the TOPROL-XL groups pooled was statistically significantly larger (p=00351) than that for the placebo group
3 Pairwise comparisons between individual TOPROL-XL dose groups and placebo also revealed a statistically significant difference for the 10 and 20 mgkg groups (p=00270 and p=00492 respectively) the 02 mgkg group was not different from placebo
Sponsorrsquos Analyses Secondary variable A dose-response relationship was observed for the secondary efficacy variable (delta DBP) as depicted in Figure 3 Figure 3 Mean changes (actual and placebo-corrected) from baseline to Week 4LOCF for sitting DBP (ITT population)
2243 Dose-Response assessment based on subgroup analyses (per Sponsor) and time course
Subgroup Analyses The sponsor conducted several exploratory subgroup analyses however these analyses were not reviewed critically and are not presented in this review as
1 they do no impact the primary outcome or study objective 2 they are unlikely to be clinically useful due to the small number of patients per subgroup
However one potentially useful group analyses involved the percentage of responders as defined in Table 3 The responder analyses shows
1) greater percentage of responders in active dose group relative to placebo 2) comparable response rates for all active dose groups suggesting similar efficacy across
dose groups despite different exposure (doses)
Page 10 of 98
Clinical Pharmacology Review NDA 19-962 Toprol-XL 10182006
Table 3 Number and proportion of responders (ITT population)
Time course of effect (2- to 4-week treatment period) Consistent with findings from other studies with metoprolol and some beta-blockers apparent maximal reduction in blood pressure occurred between 1 and 4 weeks of treatment The mean changes over time in sitting SBP and DBP are depicted in Figure 4 Figure 4 Mean changes over time for sitting SBP and DBP (ITT population)
Data points in plot are from absolute values (not taking baseline into account) and subjects in 10 and 20 mgkg received drug after two weeks on 02 mgkg
2244 PKPD Assessments Overall there were statistically significant relationships between metoprolol exposure particularly AUC and SBP reduction as shown in Figure 5 Similar findings were observed for heart rate reduction Figure 6
Page 11 of 98
Clinical Pharmacology Review NDA 19-962 Toprol-XL 10182006
Change in SBP Figure 5 Change in SBP vs log (AUC) ndash per Sponsor Figure 6 Change in HR vs AUC
The population PKPD assessment evaluated the effect of PK exposure measures (AUC Cmax and Ctrough) on various PD measures (change in SBP change in DBP However only the AUC was considered reliably estimated It is noted that AUC is a derived measure that may not bear as direct a relationship as Ctrough (observed value) on a given PD measure However Ctrough is related to AUC particularly at steady-state The equation relating AUC to change in SBP was
E = E0 ndash 221 x m logAUC
Where E = change in SBP E0 = baseline SBP m = slope and AUC = area under plasma concentration-time curve
The regression analyses yielded the following p lt 005 for slope and R2 lt 01 The relatively low R2 value suggests that the SBP data were highly variable and changes in SBP could not be accounted for entirely by AUC (exposure) Nevertheless there is a relationship between effectiveness and AUC that indicates that increasing exposure potentially increases effectiveness this finding supports dose titration
Change in Heart Rate The change in heart rate was defined as follows (Reviewerrsquos regression analysis)
E = I ndash 221 x m logAUC Where E = change in HR I = intercept and m =and AUC are as previously defined
The regression analyses yielded the following p lt 001 for slope and R2 = 011 The heart rate findings support metoprololrsquos known activity as a beta blocker
Page 12 of 98
Clinical Pharmacology Review NDA 19-962 Toprol-XL 10182006
Reviewer Note PKPD modeling with various hemodynamic measures The modeling exercises indicated that there was no difference in the PKPD modeling results using different hemodynamic data formats such as change in the measurements percent change in the measurements or actual BP measurements
2245 Exposure-Safety Highlights (per Applicant) According to the applicant Toprol XL was generally well tolerated in the pediatric population and there did not appear to be a clear dose-dependent effect in terms of severity or frequency of adverse events (tabulated below)
2246 Acceptability of sponsorrsquos proposed regimen The proposed initial dosage 10 mgkg QD followed by titration according to clinical response appears reasonable based on the dose-response information time course of maximal effect and exposure-response (AUC and SBP reduction) information It is unclear if the proposed initial dose is optimal since a dose-response relationship was not established for the primary efficacy variable and response rates were comparable across dose groups One should note that the proposed initial pediatric dosage is within the range of usual adult initial dosage 25 ndash 100 mg (assuming 70 kg adult ~ 036 ndash 143 mgkg)
The major unresolved issues are bull Absence of a clear dose-response relationship for the primary efficacy variable bull Unknown maximal dose in mg for initial therapy and titrationmaintenance therapy bull Unknown optimal titration frequency
Although these major issues are not completely resolved information provided in the submission provides adequate information to support the proposed dosage In brief these limitations are addressed in part by adopting the following approaches
bull Therapy will be initiated at a dose that was more effective than placebo yet was not the highest dose thus providing a safety window
bull Initial dosage (dose in mg) will be limited to a dose that produces exposure that is likely to be effective but does not exceed the highest studied dose (200 mg)
bull Titration will be allowed at a frequency no greater than once a week which is consistent with data obtained (time to peak activity) and previous information form metoprolol and other beta-blockers used in hypertension treatments
Page 13 of 98
Clinical Pharmacology Review NDA 19-962 Toprol-XL 10182006
2247 PKPD comparisons Pediatric patients vs adults A priori PKPD relationships are expected to differ between adults and children because the two populations have different disease processes (secondary hypertension in children vs essential or primary hypertension in adults) Results of the pediatric modeling exercise showed that a log-linear model appeared to work better than other models for the relationship between SBP and DBP and exposure (AUC) In adults the Sigmoid Emax model has been successfully applied in PKPD modeling exercises It should be noted that the adult data were not reanalyzed for this review so it is unclear if log-linear or linear models would be adequate
As illustrated in Table 4 Toprol XL is effective in adults as well as in children and appears to be effective across a similar concentration range Table 4 PKPD Comparisons- Pediatric Patients vs Adults
Pediatric Patients Adults Population hypertensive Typically healthy Model Log-linear Sigmoid Emax PD Markers Placebo corrected SBP DBP changes
at trough bull Reduction in exercise heart rate (betashy
blockade measure) bull Placebo corrected SBP DBP changes at
trough EffectiveTherapeutic metoprolol concentrations
Most concentrations lt 107 ngmL bull EC50 = 105 nmolL (281 ngmL) bull Emax achieved at concentrations above 400
nmolL (107 ngmL) bull Range between 80 and 300 nM
Maximal mean BP Reduction at Studied Doses
bull SBP reduction -6 bull DBP reduction -5
bull SBP reduction -10 bull DBP reduction -4
Effectiveness of metoprolol relative to placebo
Generally more effective over the course of treatment
Generally more effective over the course of
Time course of effect Maximal effect observed within 1 to 4 weeks after initiation of therapy
Maximal effect observed within 1 to 4 weeks after initiation of therapy
Utility in Poor CYP2D6 metabolizers (PMs)
Not evaluated Poor metabolizers have a higher plasma concentration and a greater duration or degree of beta blockade thus PMs may not need extended release formulations
Proposed Initial Dosage 10 mgkg ~ 70 mg QD 25 to 100 mg QD
Overall it appears the studied pediatric doses produce comparable changes in diastolic pressure but lower changes in systolic pressure However in pediatric patients it is unlikely that the maximal possible activity was achieved at the doses studied thus conceivably pediatric patients can achieve maximal effects comparable to adults at optimized pediatric doses Three challenges in making definitive PKPD comparisons between the pediatric (studied in this NDA) and adult population are as follows
1 Study conditions differ- typically in adult studies HR is measured during exercise and not at rest
2 Results are obtained in healthy adult subjects rather than hypertensive patients 3 Insufficient numbers of studies have been reported in the literature that attempt to
identify the relationship between metoprolol exposure and SBP or DBP effect in adults
Page 14 of 98
10182006 Clinical Pharmacology Review NDA 19-962 Toprol-XL
225 Pharmacokinetic characteristics of metoprolol
2251 Metoprolol pharmacokinetics in pediatric patients Metoprolol PK parameters obtained from the population PK analyses are summarized in Table 5 Table 5 Metoprolol population PK parameter estimates (SE ) obtained using final population PK model
PK Parameter Value CLF (Lhr) 2275 ( 114 ) V2F (L) 961 (203 ) V3F (L) 620 (255 ) QF (Lh) 675 (204) Ka (hrndash1) 00467 (192 ) Tlag1 (hr) 0853 (297)
The data in Table 5 are derived from a 2-compartment linear PK model with first-order elimination and flip-flop first-order absorption and lag time
2252 Metoprolol pharmacokinetic comparisons pediatric patients vs adults PK Parameter Comparison Overall pediatric PK parameters obtained following administration of Toprol-XL are comparable (similar magnitude) to those in adults receiving IR metoprolol Potential limitations of the stated comparison and finding include the use of different modeling approaches populations number of samples and number of subjects in the trials (Table 6) Table 6 Comparative PK (children vs adults)
Source NDA 19962 Luzier et al Taguchi et al Plosker and Cissold and other sources
Model 2 Comp 1st Order absorption
1 Comp
Formulation Toprol XL IR IR IR Population Pediatric Hypertension Healthy adults Japanese geriatric Sampling Intense and Ctrough Intensive Sparse intensive CLF (Lhrkg) 338 116 ndash 340 094 -V2F (Lkg) 128 270 ndash 398 452 -V3F 851 333 ndash 809 - -QF (Lhr) 899 282 ndash 694 - -T12 (h) 351 - - 3 - 6 Covariate Effects Based on CLF Age None - Yes YesNo Gender Effect None Yes - -Race None - - - The applicant noted that pediatric data were compared to adult data from IR where CLF is dominated by the disposition function of metoprolol therefore it may be complicated to compare adult data to pediatric data (Toprol XL) where CLF is under a considerable influence from the release rate (input function) of the device This appears to be a valid caveat Using AUC and dosing information (Table 8) adult CLF for Toprol-XL ~ 17 ndash 25 Lhrkg
Exposure Comparison Following administration of Toprol XL at comparable doses in mg pediatric patients and adults generally had similar metoprolol exposure Adult data from literature and archived clinical pharmacology and biopharmaceutics reviews are presented in Table 8 and pediatric data from
Page 15 of 98
Clinical Pharmacology Review NDA 19-962 Toprol-XL 10182006
population PK modeling (Study 307A) are presented in Table 7 The main limitations of the cross-population comparison is the pediatric doses are over the 125 to 200 mg dose range whereas adult data is for specific doses However reasonable comparisons can be made at the 100 mg dose level assuming the meanmedian values in pediatric patients offer an acceptable approximation of exposure values and are representative of the central tendency of the data In this case the adult and pediatric data have comparable
1 exposure at 100 mg 2 degree of variability
Table 7 Bayesian estimates of metoprolol PK exposure for those patients included in the PKPD analysis (N=65)
includes only data where concentration gt LOQ
Table 8 Metoprolol exposure in adults following administration of Toprol XL
Cmax Cmin AUC Literature References 50 179 ndash 190 86 ndash 104 286 - 351 100 96 ndash 759 107 ndash 305 533 - 1192 200 778 ndash 1139 310 ndash 447 1392 - 1892 FDA Archived Information 50 179 plusmn 182 85 plusmn 138 286 plusmn 346 100 544 plusmn 436 226 plusmn 234 827 plusmn 766
2253 Inter and intra-subject variability in metoprolol pharmacokinetic Based on the values of the standard error () associated with PK parameters (Table 5) metoprolol PK exhibited low variability (SE lt 30) However this estimate may not be reliable (under predicted) because concentrations lt LOQ were not included in the analysis Several subjects particularly those receiving 02 mgkg had concentrations lt LOQ In adults exposure is highly variable (CV gt 70 ) as reflected in exposure estimates and wide exposure ranges Table 8
Potential sources of variability following metoprolol administration (Toprol XL) in children include regio-selective absorption incomplete gastric emptying variable gastric motility varying metabolic activity (CYP2D6) and inconsistent absorption Some of these factors are also applicable to adults
23 What Intrinsic Factors Affect Metoprolol Exposure-Response
Based on the population pharmacokinetic model weight was the only potentially clinically meaningful intrinsic factor that affected metoprolol exposure and hence response Other intrinsic
Page 16 of 98
Clinical Pharmacology Review NDA 19-962 Toprol-XL 10182006
factors such as age height gender race and sex did not affect metoprolol exposure
231 Effect of weight The effect of weight on metoprolol CLF are illustrated in Figure 7 Figure 7 Variation of CLF with weight obtained in population PK analysis
CLF increased linearly with body weight relative to a 70 kg individual the CL of a 22 kg individual is 30 lower This decreased CL will result in an increased exposure (maximum 30 ) that does not pose additional safety concerns or appear clinically significant (tolerated in studies) It should be noted that exposure (AUC) accounted for an insignificant portion of the hemodynamic effect (poor correlation) thus the clinical implications of the impact of body weight on CLF of metoprolol identified in the population PK modeling are limited Consequently dose adjustment is not required based on body weight Furthermore the maximum initial dose is 50 mg thus subjects with weight gt 50 kg will receive a maximum dose of 50 mg diminishing the impact if any of weight-dependent clearance
232 Effect of Age The effect of age on QF the inter-compartmental clearance is illustrated in Figure 8 Figure 8 Variation of QF with age obtained in population PK analysis
Page 17 of 98
Clinical Pharmacology Review NDA 19-962 Toprol-XL 10182006
QF does not contribute significantly to overall clearance therefore the reported finding does not appear clinically relevant It should be noted that the observed QF-age relationship is atypical
233 Effect of intrinsic factors on exposure-response pediatrics vs adults As mentioned previously the only evaluated intrinsic factor that affected metoprolol exposure was body weight In adults age and gender effects have been reported although there are conflicting reports on the age effect The exposure in adult and pediatric population are both potentially affected by the CYP2D6 metabolizing status of the subject Metoprolol is metabolized primarily in the liver by CYP2D6 The scientific literature reports several instances in adults of varying metoprolol exposure by poor and extensive CYP 2D6 metabolizers In the pediatric studies (307A and 307B) there was one suspected poor metabolizer (Trough concentration was 2330 ngmL) but the metabolic status (PM or EM) of this individual was not confirmed
24 What extrinsic factors affect metoprolol exposure-response
The role of extrinsic factors were not specifically evaluated in the pediatric population however one anticipates that extrinsic factors that affect adults should be applicable to children
25 What analytical method was used in pediatric studies 307 A and 307B
Please refer to section 223
Page 18 of 98
Clinical Pharmacology Review NDA 19-962 Toprol-XL 10182006
(b) (4)
TOPROL-XL is not recommended in pediatric patients lt 6 years of age (see CLINICAL PHARMACOLOGY Pharmacokinetics and PRECAUTIONS Pediatric Use)
Page 21 of 98
Clinical Pharmacology Review NDA 19-962 Toprol-XL 10182006
4 APPENDICES
41 Sponsorrsquos Proposed Label
17 Page(s) of Draft Labeling has been Withheld in Full as B4 (CCITS) immediately following this page
Page 22 of 98
Clinical Pharmacology Review NDA 19-962 Toprol-XL 10182006
42 Pharmacometrics Review
Page 40 of 98
Clinical Pharmacology Review NDA 19-962 Toprol-XL 10182006
Office of Clinical Pharmacology Pharmacometrics Review
NDAIND 19-962 Volume Not applicable submitted electronically POP PK Report in Section 5335 (Network Path Cdsesub1n19962N_0002006-05-15hpbiohupharm) Compound Metoprolol succinate Submission Dates 05152006 Sponsor Astra Zeneca Pharmacometrics Reviewer Robert Kumi PhD Secondary Reviewer Yaning Wang PhD
TABLE OF CONTENTS
OFICE OF CLINICAL PHARMACOLOGY PHARMACOMETRICS REVIEW 41
EXECUTIVE SUMMARY 42
OVERALL CONCLUSIONS 43
INTRODUCTION 46
OBJECTIVES OF THE ANALYSIS 48
DOSE-RESPONSE ANALYSIS 49
METHODS (POPULATION PKPD) 60
RESULTS AND DISCUSSION 73
RECOMMENDATIONS 87
APPENDIX 90
DCP1PM Page 41 10182006
Clinical Pharmacology Review NDA 19-962 Toprol-XL 10182006
Executive Summary In NDA SE5 033 the applicant Astra Zeneca has proposed changes to the currently approved labeling for TOPROL-XL metoprolol succinate extended release
(b) (4)
tablets Metoprolol a beta blocker is approved for hypertension angina and heart failure in adults In adults with hypertension the usual initial dosage is 25 to 100 mg daily (single dose) as monotherapy or in combination with a diuretic this dosage is titrated at weekly intervals until optimum blood pressure reduction is achieved The current application focuses on Toprol-XL use in pediatric patients ge six years old The initial proposed dosing in children six and older is 10 mgkg subsequently the dose is titrated based on clinical response
Two clinical trials Studies 307A (dose-response) and 307B (safety extension of 307A) were conducted in pediatric patients with hypertension to support the proposed labeling changes The applicant conducted dose-response population PK (n = 120 patients) and PKPD (n = 65 patients) analyses using data from pediatric hypertensive patients receiving Toprol-XL in the mentioned studies
Key Findings from the Dose-Response and Population PKPD analyses follow 1 Dose-Response A statistically significant dose-response did not exist for placebo
(pooled)ndashcorrected ∆SBP from baseline however the relationship was evident when placebo (specific-group) ndashcorrected data were used
2 PK Model Metoprolol PK in children were well characterized by a 2shycompartment model with flip-flop first-order absorption and an absorption lag time The model yielded precise parameter estimates
3 Covariates Sex age race body weight and Toprol-XL dose had no clinically significant effect on metoprolol PK
4 PKPD Model Using a log-linear model or linear model there were weak but statistically significant relationships between the changes in DBP and SBP and measures of metoprolol plasma exposure (Ctrough AUC0ndash24 and Cmax) Overall parameters were not precisely estimated in most models due to a high degree of variability in the blood pressure data
DCP1PM Page 42 10182006
Clinical Pharmacology Review NDA 19-962 Toprol-XL 10182006
Overall Conclusions 1 Were metoprolol PK adequately characterized in the pediatric population Metoprolol PK in pediatric patients (n = 120 Age 6 to 17) were adequately characterized using a population pharmacokinetic approach The population model was validated and qualified and comprised a 2-compartment open model with first order absorption and absorption lag time
2 Are there any covariates that influence metoprolol PK in pediatric patients with hypertension The two covariates that influenced metoprolol PK were weight and age apparent oral clearance increased linearly with body weight and inter-compartmental clearance increased with age according to a power function Other covariates including race sex and metoprolol dose did not impact metoprolol kinetics
3 Was a PKPD relationship established between metoprolol dose or plasma exposure( AUC Ctrough or Cmax) and hemodynamic measures (blood pressure) Using a simple linear regression model no dose-response (reduction in placebo corrected systolic blood pressure the primary outcome variable) was observed although a weak (R2 lt 01) but statistically significant (p lt 005) PKPD relationship was observed between metoprolol exposure measures and reduction in systolic blood pressure The small R2 value indicates metoprolol exposure could account for only a small portion of the hemodynamic effect According to the model as exposure increased there was greater reduction in blood pressure However only the relationship with AUC was considered reliable as AUC was estimated with good precision (PK modeling) whereas Cmax was not
4 Is there sufficient evidence to support effectiveness of Toprol XL in pediatrics and the initial proposed pediatric dosage Yes Although dose-response was not established with SBP reduction (primary variable) suggesting that the effectiveness of the individual tested Toprol-XL doses could not be differentiated the following information provides evidence to suggest that some Toprol-XL doses were more effective than placebo
bull Analysis of treatment group effects and pairwise comparisons suggested that overall Toprol-XL demonstrated effectiveness in pediatric patients with hypertension pooled Toprol groups vs placebo (p = 00351) and relative to baseline each active Toprol-XL dose group decreased SBP whereas placebo did not
bull There was a dose-response relationship for reduction in diastolic blood pressure typically systolic and diastolic blood pressure effects mirror each other
bull PKPD findings (reduction in SBP and heart rate as a function of AUC) support metoprolol effectiveness (increased exposure led to increased effectiveness) The heart rate effect supports metoprololrsquos known beta blocking activity
bull Generally Toprol-XL was effective in pediatric patients and adult patients at similar metoprolol exposure levels 02 mgkg in pediatrics was minimally effective because this dose yielded exposures lower than that obtained in adults at the lowest effect adult dose 25 mg
DCP1PM Page 43 10182006
Clinical Pharmacology Review NDA 19-962 Toprol-XL 10182006
bull The proposed pediatric dosage 10 mgkg is supported by the results from the dose-response study Visual inspection and pairwise comparisons indicated that 10 mgkg (placebo corrected) was statistically the most effective dose (greater efficacy than 02 mgkg and 20 mgkg) and was more effective than placebo (p = 0027)
5 Will initial dosage adjustment be required for any pediatric patients prior to titration No dosage adjustment does not appear necessary prior to titration (typically one week after treatment begins) Based on the population PK model the only potentially relevant factor that could affect PK was body weight CLF increased linearly with body weight relative to a 70 kg individual the CL of a 22 kg individual is 30 lower This decreased CL will result in an increased exposure (maximum 30 ) that does not pose additional safety concerns or appear clinically significant (tolerated in studies) The proposed starting dose 10 mgkg and doses up to 20 mgkg (maximum 200 mg) were tolerated in the clinical trials (307A and 307B) Furthermore exposure accounted for an insignificant portion of the hemodynamic effect (poor correlation) thus the clinical implications of the impact of body weight on CLF of metoprolol identified in the population PK modeling are limited
to a higher and tolerable dose until optimum BP reduction is achieved is reasonable This
(b) (4)The proposal to start Toprol-XL at a low dose and titrate
is consistent with labeling for adults
6 Was the PKPD relationship influenced by covariates Insufficient data were available to make this assessment
7 Are the PK and PKPD of metoprolol in children comparable to that in adults PK values obtained in pediatric patients were generally in the same range as those reported in adults Potential limitations of the comparison are the different modeling approaches populations number of samples and number of subjects in the trials (Table B)
It is difficult to make definitive PKPD comparisons between the pediatric (studied in this NDA) and adult population because
1 Study conditions differ- typically in adult studies HR is measured during exercise and not at rest
2 Results are obtained in healthy adult subjects rather than hypertensive patients 3 Insufficient number of studies have been reported in the literature that attempt to
identify the relationship between metoprolol exposure and SBP or DBP effect in adults
DCP1PM Page 44 10182006
Clinical Pharmacology Review NDA 19-962 Toprol-XL 10182006
Table B PK Comparisons (Pediatrics vs Adults) Source NDA 19962 Luzier et al Taguchi et al Plosker and Cissold
and other sources Model 2 Comp 1st
Order absorption 1 Comp
Formulation Toprol XL IR IR PK Analyses Population StandardNCA Population Standard Population Pediatric Healthy adults Japanese geriatric Sampling Intense and
Ctrough Intensive Sparse intensive
CLF (Lhrkg) 338 116 ndash 340 094 V2F (Lkg) 128 270 ndash 398 452 V3F 851 333 ndash 809 QF (Lhr) 899 282 ndash 694 Ka (h-1) 00467 Tlag (h) 0853 T12 (h) 351 3 - 6 Tmax (h) 25 ndash 73 Covariate Effects on CLF Age None Yes YesNo Gender Effect None Yes Race None The applicant noted that pediatric data were compared to adult data from IR where CLF is dominated by the disposition function of metoprolol therefore it may be complicated to compare adult data to pediatric data (Toprol XL) where CLF is under a considerable influence from the release rate (input function) of the device This appears to be a valid caveat
It should be noted that the cause of hypertension in adults differs from that in children Results of the pediatric modeling exercise showed that a log-linear model appeared to work better than other models for both SBP and DBP In adults the Sigmoidal Emax model has been successfully applied Using the Hill Equation (Sigmoidal Emax model) with EHR reduction (measure of beta blockade) as the PD marker in adults EC50 = 105 nmolL (281 ngmL) and Emax is achieved at metoprolol plasma concentrations gt 400 nmolL (107 ngmL) Placebo-corrected mean blood pressure changes (standing) associated with concentrations producing maximal blockade are -10 for systolic and ndash 4 for diastolic In the pediatric study the observed maximal mean reductions (placebo corrected) at the studied doses were approximately -6 for systolic and -5 for diastolic Hence it appears the studied pediatric doses produce comparable changes in diastolic pressure but lower changes in systolic pressure It should be noted that in the pediatric studies only a few metoprolol plasma concentrations were gt than 107 ngmL It is unlikely that the maximal activity was achieved at the doses studied yet the Toprol doses appeared effective The differential maximal effects may also be due to the difference in initial SBP (adults patients with hypertension tend to have higher initial BPs) in adult and pediatric studies there was a dependence of change in SBP on initial SBP
DCP1PM Page 45 10182006
Clinical Pharmacology Review NDA 19-962 Toprol-XL 10182006
Introduction Summary
(b) (4)NDA SE5 033 was submitted to seek approval of labeling changes to the currently approved labeling for TOPROL-XL This labeling translates to a new Toprol-XL indication for pediatric patients (6 years and older) with hypertension
Background on Metoprolol in Hypertension The majority of the following information was obtained form a Review article (sponsor provided) by Plosker and Clissold [Drugs 43(3) 382-414 1992)]
Table 1 Snapshot of Metoprolol Clinical Pharmacology and Biopharmaceutics Drug Class Metoprolol is a szlig1-selective (cardio selective) adrenergic receptor-
blocking agent Mechanism of Action (antihypertensive effect)
Multiple putative mechanisms competitive antagonism of catecholamine at peripheral sites reduction of sympathetic outflow to the periphery or suppression of renin activity
Approved Indications Hypertension Heart Failure and Angina Pectoris Approved Formulations Immediate Release (IR) ndash metoprolol tartrate
Controlled Release (CRZ0K) Toprol-XL is extended-release tablet of metoprolol as the succinate salt
Metabolism Via CYP2D6 primarily Absorption Absolute oral bioavailability ~ 50 following IR Food does not affect
metoprolol absorption using ER formulation Distribution Protein binding to albumin is about 12 Elimination For IR t12 from 3 ndash 7 hours Less than 5 dose excreted unchanged
in urine No t12 values for ER this may be due to difficulty in separating absorption and elimination phases
Variability Plasma levels are highly variable among subjects after oral administration
Age Effects PK of metoprolol not affected by age (20 to 65 years) but concentration of active metabolite in subjects gt 65 years about twice as high as those in younger although metoprolol concentrations similar in two groups (Regardh et al)
PKPD in children Limited information in children and provided mainly after administration of metoprolol tartrate
Summarized PK and PKPD Information in Adults Table 2 Reported PK Values in Adults (multiple references)
References include Abrahamsson et al Sandberg et al Wieselgren et al
DCP1PM Page 46 10182006
Clinical Pharmacology Review NDA 19-962 Toprol-XL 10182006
Table 3 PKPD Information Reference Key Findings Abrahamsson et al Therapeutic level of szlig1blockade (model- reduction in exercise heart
rate or EHR) is between 80 and 300 nM Sandberg et al Toprol XL is designed to deliver metoprolol succinate at a near
constant rate for about 20 hr Wieselgren et al In healthy males maximal EHR ~ 14 and minimum reduction ~ 9
with 50 mg Activity greater than placebo over 24 hour period Dayer et al Lennard et al Jonkers et al
Poor metabolizers have a higher plasma concentration and a greater duration or degree of beta blockade Potential implications for use of extended release as may not be needed in PMs
Various sources Toprol XL produces clinically and statistically significant reductions in blood pressure values compared to baseline values The maximal blood pressure lowering effect for a given dose in adults is observed between 1 and 4 weeks of treatment In 4 week trials with Toprol XL the maximum decrease in supine BP was 209 and standing was 129 (unclear if at trough) At trough following 4 weeks of 50 mg QD Toprol XL relative to placebo the reduction in supine BP was 112 and 103 in Standing
Summary of sponsorrsquos current analysis relevant to pharmacometrics and resulting claims
Dose-Response Analysis A dose-response analysis was conducted using a simple linear regression model where metoprolol dose in mgkg was the independent variable Week 4 placebo corrected change in blood pressure (diastolic or systolic) from baseline was the dependent variable (response)
Sponsorrsquos Analysis Claims (Dose-Response Study) Following administration of TOPROL-XL at doses of 125 to 200 mg once daily for up to 4 weeks metoprolol
bull Exhibited a significant dose-response relationship for DBP but none for SBP bull Produced statistically significant and clinically meaningful reductions in SBP and
DBP for some individual andor pooled target dose groups (02 10 and 20 mgkg)
Population PK and PKPD Analyses The sponsorrsquos population PK and PKPD analyses involved the use of typical population PK approaches Primarily SAS and NONMEM were used to run the analyses In brief the sponsor pooled plasma concentration time data from patients in Study 307A (trough samples) and 307B (trough samples in most subjects and serial samples in a subset of patients) for the PK modeling PKPD (PD measured primarily as changes in blood pressure) data were from patients in Study 307A These collective data were used in the population PK and PKPD analyses
Initially the sponsor identified the best PK structural population model by testing several pharmacokinetic models This model was further refined by eliminating error terms (etas) that were not statistically significant Subsequently the sponsor evaluated the effect of DCP1PM Page 47 10182006
Clinical Pharmacology Review NDA 19-962 Toprol-XL 10182006
covariates on the PK model and developed a final PK model The goodness of the fit of the model was assessed with standard procedures The final population model was used to simulate individual plasma concentration-time profiles and Bayesian estimates for Cmax and AUC for all patients These simulated AUC and Cmax values and actual (observed) Ctrough were used in the PKPD model The PKPD model was developed in a similar manner as the population PK model Initially the best PKPD base model was identified and the model refined until a final PKPD model was identified
Sponsorrsquos Analysis Claims (Population PK and PD Modeling) 1 A 2-compartment PK model with first-order elimination and flip-flop first-order
absorption and lag time best fit metoprolol concentration-time data obtained from the studied pediatric hypertensive patients
2 The following tabulated parameter estimates were obtained using the final population PK model CLF 2275 Lhr V2F 961 L V3F 620 L QF 675 Lh Ka 00467 hrndash1 Tlag1 0853 hr
These PK values were generally in the same range as those reported in adults
3 Sex race ideal body weight and Toprol-XL dose have no significant effect on metoprolol pharmacokinetics No covariate impacts V2F V3F Ka or the Tlag of metoprolol Age has no effect on metoprolol CLF and body weight has no effect on QF Metoprolol CLF increases linearly with body weight however no dose adjustment based upon body weight is necessary because dosage is titrated based on clinical response QF is proportional to age however the increase in QF with age is not clinically relevant
4 Weak but statistically significant relationships existed between DBP SBP and HR and some measures of metoprolol exposure (trough plasma levels Cmax and AUC(0ndash 24)) Because of high variability in the hemodynamic data goodness-of-fit of the PKPD models was generally poor and the resulting parameter estimates were not considered reliable Extrapolation of these model parameters in the clinic for dose adjustment is not recommended
5 No covariates had an impact on the parameters delineating the PKPD relationship between metoprolol exposure and DBP SBP and HR
Objectives of the analysis There are three specific goals of the PM analysis
1 To evaluate the adequacy of the sponsorrsquos dose-response analysis 2 To evaluate sponsorrsquos population PK analysis and determine if PK labeling claims
are acceptable DCP1PM Page 48 10182006
Clinical Pharmacology Review NDA 19-962 Toprol-XL 10182006
3 To evaluate sponsorrsquos population PKPD analyses and determine if the findings support the proposed dosing recommendation
Dose Response Analysis (Study 307A) Title Dose Ranging Safety and Tolerability of TOPROL-XLreg
(metoprolol succinate) Extended-release Tablets (metoprolol CRXL) in Hypertensive Pediatric Subjects A Multicenter Double-blind Placebo-controlled Randomized Parallel-group Study
Study Duration 30 May 2002 - 9 June 2004 Investigators (primary) Bonita E Falkner MD and Jonathan Sorof MD 1800 Sites Multiple locations (36 in US and 1 in Dominican Republic)
Table 1 Objectives and Outcomes for Study 307A
Study Design (FDA-approved Type A design) This was a multi-center international double-blind placebo-controlled randomized parallel-group study The study included a screening visit a 1- to 2-week single-blind placebo run-in period during which all previous antihypertensive medications were discontinued and a 4-week double-blind treatment period At the end of the placebo run-in period eligible patients with blood pressure (BP) measurements in the qualifying range were randomized in a 1212 ratio to receive once daily oral doses of placebo TOPROL-XL 02 mgkg TOPROL-XL 10 mgkg or TOPROL-XL 20 mgkg TOPROL-XL doses of 125 25 375 50 75 100 150 or 200 mg were used to approximate the target doses Patients in the placebo and TOPROL-XL 02 mgkg groups received the target dose for 4 weeks while patients in the TOPROL-XL 10 mgkg and
DCP1PM Page 49 10182006
Clinical Pharmacology Review NDA 19-962 Toprol-XL 10182006
20 mgkg groups had their dose up-titrated (based on weight) to the target dose over the first 1 to 2 weeks of double-blind treatment
Reviewer Note Rationale on Study design The inclusion of more patients in the TOPROL-XL 02 mgkg and 20 mgkg groups allowed better estimation of the dose response at the low and high ends of the dose range The TOPROL-XL 10 mgkg group with fewer patients provided a middle estimate that helped to describe the shape of the dose-response curve However having a fewer number of subjects may have contributed to variability Inclusion of a placebo control group allowed for the quantification of treatment-related BP reductions after adjusting for placebo effect It should be noted that the placebo groups were not identical as they followed different titration schedules and had a different number of tablets
The 02 mgkg dose is lower than the lowest approved adult dose on a mgkg basis (assuming 70 kg adult weight) but the highest studied pediatric dose 20 mgkg (200 mg limit was placed) is lower than the highest studied adult dosage 400 mg
Table 2 Toprol Dosing Scheme for Study 307A
Table 3 Formulations used in 307A
DCP1PM Page 50 10182006
Clinical Pharmacology Review NDA 19-962 Toprol-XL 10182006
SPONSORrsquoS STATISTICAL ANALYSIS PLAN HIGHLIGHTS bull The primary analysis used an intention-to-treat (ITT) population which included
all patients who received at least 1 dose of study medication and had baseline and at least 1 post baseline measurement For this analysis missing data were imputed using a last observation carried forward (LOCF) approach
bull A simple linear regression analysis was performed on the placebo-corrected change from baseline to Week 4LOCF in sitting SBP and sitting DBP with dose ratio as the explanatory variable
bull The placebo correction for placebo-corrected changes from baseline to Week 4 LOCF in sitting SBP and sitting DBP was performed by subtracting the mean change from baseline for the placebo group from the individual patient changes in the other treatment groups
bull ANOVA was performed with treatment group as the main factor for the changes from baseline to each post baseline visit in sitting SBP and DBP This ANOVA model was used to construct pairwise comparisons of each active treatment versus placebo and the active treatment groups combined versus placebo
bull The percentage of responders at Week 4 was summarized by frequency counts percentages and 95 confidence intervals (CI) for each treatment group
bull Subgroup analyses were also performed on the changes from baseline at Week 4 in sitting SBP and DBP and the influence of heart rate and baseline body mass index (BMI) on the mean changes from baseline to Week 4LOCF in sitting SBP and DBP were examined using linear regressions
bull Trough plasma concentrations of metoprolol were summarized descriptively and the lower limit of quantitation (LLQ) was 1 ngmL
bull Safety data were summarized using the safety population defined as all patients who received at least 1 dose of study medication and were not lost to follow-up No statistical analyses were performed on the safety data in this study
DCP1PM Page 51 10182006
Clinical Pharmacology Review NDA 19-962 Toprol-XL 10182006
Results Patient Disposition Per applicant patients recruited into this study were representative of a pediatric population with hypertension The four treatment groups were balanced with respect to demographic and baseline characteristics (Tables 4 and 5) About 80 percent of the patients were considered 90 compliant
Table 4 Baseline Characteristics in Study 307A
Table 5 Sitting SBP and DBP measurements at baseline
Sitting and standing BP measurement were comparable (eg mean SBP for all patients- sitting = 1319 and standing 1306 with similar CVs ~ 9 )
Primary Efficacy Variable The results for the primary efficacy variable are illustrated in Figure 1 Figure Dose response for placebo-corrected change from baseline to Week4LOCF for sitting SBP (ITT population)
DCP1PM Page 52 10182006
Clinical Pharmacology Review NDA 19-962 Toprol-XL 10182006
Figure 1 Change in SBP from baseline as a function of Toprol XL dose
Table 6 Linear regressions statistics used to assess Dose-Response
The results indicate that bull The slope of the curve is not different form zero (p = 05371 for dose ratio)
suggesting that there is no dose-response relationship bull Most active treatment groups are more effective than placebo in reducing SBP
By visual inspection it appears the lack of observed dose-response is mainly driven by a lower than expected response at the 20 mgkg level
Potential issues affecting efficacy and pharmacokinetic results bull LOCF was required for eight patients however the LOCF approach did not
greatly impact the outcome of the trial bull Patients assigned to the 10 mg and 20 mgkg dose received drug for only 2
weeks whereas dose in the 02 mgkg received the same dose for 4 weeks
DCP1PM Page 53 10182006
Clinical Pharmacology Review NDA 19-962 Toprol-XL 10182006
Reviewerrsquos Supplemental Dose-Response Analyses The sponsorrsquos dose-response analysis was successfully reproduced by this Reviewer using pooled placebo corrected data A supplemental analysis was conducted using group-specific placebo corrected data In this procedure data for subjects assigned to a given Active Group (eg 02 mgkg) were corrected with Placebo data (02 mgkg) Group specific placebo data are presented in Table 7
Table 7 Placebo-group specific data Placebo Group Frequency Delta SBP 02 mgkg 8 -567 10 mgkg 6 -300 20 mgkg 9 230
It should be noted that the group-specific placebo data appeared to follow a consistent trend where the placebo effect decreased with increasing number of tablets It is unclear if this titrationtablet-dependent placebo effect is valid or random Overall the apparent differential placebo effects suggest that the placebo group may have overly influenced the outcome of the dose-response analysis
When active groups are corrected using group-matched placebo data there is a statistically significant dose-response The dose response using group-specific placebo data is illustrated in Table 8 and Figure 2
Figure 2 Placebo corrected changes in SBP (chg_pc on y axis) as a function of dose ratio
Potential Limitations of Supplemental Analyses Typically placebo effects are constant if randomization is correct thus it is unclear if subsetting the placebo group is acceptable and did not increase bias Additionally subsetting the placebo group leads to a reduced number of placebo subjects per dose group that may impact the regression analyses
DCP1PM Page 54 10182006
Clinical Pharmacology Review NDA 19-962 Toprol-XL 10182006
Table 8 SAS output for regression analyses using group-specific placebo corrections The REG Procedure
Model MODEL1
Dependent Variable chg_pc
Number of Observations Read 117
Number of Observations Used 117
Analysis of Variance
Sum of Mean
Source DF Squares Square F Value Pr gt F
Model 1 191083177 191083177 2663 lt0001
Error 115 825109481 7174865
Corrected Total 116 10162
Root MSE 847046 R-Square 01880
Dependent Mean -430358 Adj R-Sq 01810
Coeff Var -19682365
Parameter Estimates
Parameter Standard
Variable Label DF Estimate Error t Value Pr gt |t|
Intercept Intercept 1 125480 133166 094 03480
DOSRATIO Dose Ratio 1 -100051 019387 -516 lt0001
Secondary variables
bull Placebo-corrected change from baseline in sitting DBP The mean plusmn SD change (Week 4LOCF) in sitting DBP is illustrated in Figure 3 and Table 9
Figure 3 Mean changes (actual and placebo-corrected) from baseline to Week 4LOCF for sitting DBP (ITT population)
DCP1PM Page 55 10182006
Clinical Pharmacology Review NDA 19-962 Toprol-XL 10182006
Table 9 SAS output for regression analyses for DBP with pooled placebo correction
Treatment group effects and pairwise comparisons for sitting SBP and DBP Results of the treatment group effects at the Week 4LOCF visit and the pairwise comparisons between each TOPROL-XL group and placebo for the change from baseline in sitting SBP and DBP are shown for the ITT population in Table 10
Table 10 Treatment group effects for change in baseline to Week 4LOCF for sitting SBP and DBP (ITT population)
Some key findings from the pair-wise comparison are as follows (Table 10) 1 All active groups produced statistically significant reductions from baseline in sitting
SBP and DBP at the Week 4LOCF visit whereas placebo did not
DCP1PM Page 56 10182006
Clinical Pharmacology Review NDA 19-962 Toprol-XL 10182006
2 Overall the mean change from baseline in sitting SBP at Week 4LOCF for the TOPROL-XL groups pooled was statistically significantly larger than that for the placebo group (p=00351)
3 Results of pairwise comparisons between individual TOPROL-XL dose groups and placebo also revealed a statistically significant difference for the 10 and 20 mgkg groups (p=00270 and p=00492 respectively)
bull Mean changes over time in sitting SBP and DBP Consistent with findings from other studies with beta-blockers apparent maximal reduction in blood pressure occurred between 1 and 4 weeks of treatment
Figure 4 Mean changes over time for sitting SBP and DBP (ITT population)
Data points in plot are from absolute values (not taking baseline into account)
Subgroup Analyses The sponsor conducted several exploratory subgroup analyses however these analyses were not reviewed critically and are not presented in this review as
1 they do no impact the primary outcome or study objective 2 they are unlikely to be clinically useful due to the small number of patients per
subgroup One potentially useful some group analyses involved the percentage of responders as defined in Table 11
The responder analyses shows comparable response rates for all active dose groups suggesting similar efficacy across dose groups despite different exposure (doses)
DCP1PM Page 57 10182006
Clinical Pharmacology Review NDA 19-962 Toprol-XL 10182006
Table 11 Number and proportion of responders (ITT population)
Pharmacokinetic Results The Ctrough information obtained in the trial are summarized in Figure 6 and Tables 12 and 13
Table 12 Summary of Ctrough data (per applicant)
Sixteen patients across the 3 TOPROL-XL groups did not have blood samples obtained for analysis of metoprolol concentrations Based on the number of samples BLQ there appeared to be very low concentrations in the lowest dose group It appeared that Ctrough increased with dose According to the applicant these values are similar to those obtained previously in adults especially at the 2 higher doses Variability was high in all treatment groups (CV gt 60 )
Table 12 Summary of Ctrough (Reviewer Generated) from all patients (samples lt LOQ given value = 0) Toprol XL Dose Number of subjects Concentration (ngmL) (mgkg) Mean plusmn SD Median Range 02 39 137 plusmn 294 000 0 ndash 157 10 17 1224 plusmn 1416 845 0 ndash 571 20 46 2462 plusmn 3352 1140 0 ndash 1670
DCP1PM Page 58 10182006
Clinical Pharmacology Review NDA 19-962 Toprol-XL 10182006
Reviewer Note Overall the plasma concentrations (exposure) for the 02 mgkg dose group appear too low to be effective (close to LOQ) It is noted that adults typically have concentrations gt LOQ at the lowest therapeutic dose 25 mg (~ 4 ngmL)
Figure 6 Boxplot of metoprolol Ctrough using samples gt LLQ (per applicant)
Safety Results According to the applicant Toprol XL was well tolerated in the pediatric population as tabulated below
Main Analyses Conclusions bull No dose response was observed for corrected SBP using pooled placebo data
however using group-matched placebo data demonstrated a dose response bull Ctrough increased with dose bull Toprol 10 and 20 mg kg doses were more effective than placebo in reducing
SBP bull The responder rate was comparable across all active dose groups and this rate was
greater than that of placebo
DCP1PM Page 59 10182006
Clinical Pharmacology Review NDA 19-962 Toprol-XL 10182006
Methods Reviewerrsquos Methods Generally this reviewer conducted the analyses in a manner similar to that of the sponsor to confirm the sponsorrsquos findings
Sponsorrsquos Methods
Design Study1 307A
Reviewer Note This study was described in the Dose-Response Assessment (please refer to Page 7 Dose Response Analyses) Consequently only highlights relevant to the population analyses will be included in this section
Study 307A was a 4-week multi-center double-blind placebo-controlled randomized parallel-group study TOPROL-XL (metoprolol succinate) extended-release tablets were given to hypertensive pediatric patients Patients were randomized to double-treatment with a once daily oral dose of placebo or Toprol-XL at 1 of 3 target doses 02 or 20 mgkg The dose range for this study was 125 to 200 mg daily Patients on placebo followed the same schedule as that for their active group comparators
Study Flow Chart
Key Inclusion Criteria School age and adolescent children with reproducible SBP or DBP at or above the 95th percentile using height-adjusted charts for age and weight were eligible
DCP1PM Page 60 10182006
Clinical Pharmacology Review NDA 19-962 Toprol-XL 10182006
Study2 307B
Study 307B was a 52-week multi-center open-label study to determine the safety and pharmacokinetics of TOPROL-XL (metoprolol succinate) extended-release tablets (metoprolol CRXL) in hypertensive pediatric patients The starting dose was 25 mg daily The dose was increased every 2 weeks in increments of 25 mg or 50 mg based on tolerability until BP was controlled or the dose reached 200 mg
Table 1 Study Assessments
At the end of the 52-treatment period all patients had BP measured and a trough plasma level taken 24 hours the last dose of Toprol-XL with the exception of those patients who completed the serial portion at the final visit Among the participants a subgroup of approximately 30 patients was to participate in PK assessments of metoprolol requiring serial blood sampling at any time during the 52 weeks A single dose of 25 mg of Toprol-XL was given orally to those participating patients after a 48-hour washout period After the PK assessments they returned to the main study protocol Data
Study1 307A
4111 Pharmacokinetics A blood sample was to be collected at Visit 7 into a heparinized Vacutainer tube and obtained at 24 hours (plusmn2 hour) following the last dose of study medication (ie trough measurement) for determination of plasma metoprolol concentrations
Study Disposition Chart
DCP1PM Page 61 10182006
Clinical Pharmacology Review NDA 19-962 Toprol-XL 10182006
Table 2 Study Demographics
4112 Pharmacodynamics Primary variable
Sitting SBP determined at trough (24plusmn4 hours Visit 7) served as the primary efficacy assessment The primary measure of effect was the placebo-corrected change from baseline to the end of treatment (Week 4) in trough sitting SBP Each BP determination represented the mean of 3 readings with less than 7 mmHg between the highest and lowest value Blood pressure was measured using a mercury sphygmomanometer with an appropriate size cuff positioned approximately at the level of the heart Every effort was made to have the same individual measure the patientrsquos BP throughout the study if possible At all post randomization visits BP measurements were to be made at trough defined as 24 hours (plusmn4 hours) after receiving study medication All measurements were to be determined prior to the patient taking the scheduled dose of study medication In the
DCP1PM Page 62 10182006
Clinical Pharmacology Review NDA 19-962 Toprol-XL 10182006
event that the patient accidentally took study medication on the day of the scheduled visit the visit was to be rescheduled within 24 to 48 hours
Study2 307B
4113 Pharmacokinetics A 48-hour washout period prior to sampling was required for all patients including patients who entered the 52-week study and then decided to participate in the serial PK portion of the study All patients were to have a 15-mL blood sample collected into a heparinized Vacutainer tube 24 hours (plusmn2 hour) following the last dose of TOPROL-XL (ie trough measurement) at Visit 18 (or a the time of premature discontinuation) except for patients who participated in the serial PK portion of the study and had blood sampling performed at Visit 18 For patients participating in the serial PK portion of the study blood samples (15 mL) were to be collected into heparinized Vacutainer tubes and obtained at Hour 0 (predose) and at 1 2 3 4 6 8 10 and 24 hours after administration of a single 25 mg dose of TOPROL-XL following a 48-hour washout period After the last blood sample was obtained the patient was to startresume the prescribed dose of TOPROL-XL heshe was receiving prior to PK sampling
Patient Disposition Chart (completion or discontinuation)
Overall a total of 31 patients at 8 centers were enrolled in the serial PK portion of the study Of these 31 patients 27 had plasma concentration data available and were included in the analyses Four patients were excluded from the analyses because their plasma concentrations were not quantifiable (Nos 047-009 and 047-021) or because only whole blood samples were analyzed (Nos 005-002 005-003)
DCP1PM Page 63 10182006
Clinical Pharmacology Review NDA 19-962 Toprol-XL 10182006
Table 3 Subject Demographics for Patients Providing Serial Blood Samples
Missing Data Twenty-six patients did not have blood samples obtained for analysis of metoprolol concentrations in either the 16-week (n=7) or 52-week (n=19) studies Among patients with plasma samples 14 (14) in the 52-week study and 13 (13) in the 16-week study had trough plasma metoprolol concentrations that were below the LLQ Therefore data from a total of 99 patients were included in this analysis
Assay Metoprolol plasma levels were assayed using high-performance liquid chromatography tandem mass spectrometric detection methods having limit of quantitation (LOQ) of 1 ngmL The method was validated in the linear range 1 to 1000 ngmL Precision was less than or equal to 109 Accuracy ranged from 940 to 1013 Pharmacodynamics Not applicable
Data Checking SAS was used to format and check data Additionally visual inspection of several randomly selected subject data was carried out
DCP1PM Page 64 10182006
Clinical Pharmacology Review NDA 19-962 Toprol-XL 10182006
Models
Overview The sponsorrsquos stated assumptions underlying this modeling analysis are
1 Rich sampling data collected from 30 subjects in 307B Study can be used to adequately characterize the structural pharmacokinetic model of metoprolol
2 Structural pharmacokinetic models of metoprolol at other dose strength are identical to that at 25 mg
3 Metoprolol exhibits a linear pharmacokinetics in the dose ranges studied 4 Steady-state pharmacokinetics of metoprolol has been reached at the time of blood
sampling in Study 307A 5 Metoprolol accounts for the blood pressure effect in the study 6 Existing various disease states in the patients have no impact on the pharmacokinetics
of metoprolol and pharmacodynamics of the blood pressure reduction in the study 7 Concomitant medications if existed do not have any effects on the pharmacokinetics
of metoprolol and pharmacodynamics of the blood pressure reduction in the study
Reviewer Comment The sponsorrsquos assumptions appear reasonable based on existing metoprolol PKPD information
Pharmacokinetics
4114 PK Structural Model Several PK models were tested to identify the structural model Flip-flop absorption was taken into consideration based on general PK characteristics following administration of sustained release tablets and observed data in the current study (serial PK samples)
The models tested included linear 1- and 2-compartment PK models with the following characteristics (focused on flip-flop models)
bull first-order absorption with and without absorption lag time (NONMEM subroutines ADVAN2 and ADVAN4)
bull zero-order absorption with and without absorption lag time (NONMEM subroutines ADVAN1 and ADVAN3)
bull simultaneous zero- and first-order absorption from the absorption compartment The models were parameterized in terms of CLF and VF
Ultimately the 2-compartment model with first order flip-flop absorption an absorption lag time and 2 residual error terms was selected as the structural model of metoprolol The model scheme is presented in the following Figure 1 Figure 1 PK Compartmental Model
DCP1PM Page 65 10182006
Clinical Pharmacology Review NDA 19-962 Toprol-XL 10182006
4115 PK Covariate Model Covariate models were developed to account for the potential impact of the following covariates and derived covariates on metoprolol PK
Continuous variables bull Age (AGE years) bull Body weight (WT kg) bull Body surface area (BSA m2) calculated from WT and HT (cm) using the height
weight formula BSA=0024265 x WT 05378 x HT03964 bull Ideal body weight (IBW kg) calculated as - Males IBW=50+(HTndash150)25 and
for Females IBW=45+(HTndash150)25 bull Dose (DOSE mg of Toprol-XL)
Categorical variables bull Gender (SEX) - Male 0 - Female 1 bull Race (RACE) - Caucasian 0 - Black 1 - Asian 2 - Other 3
PK covariate effects were modeled as follows
Effects of continuous covariates (AGE WT BSA IBW and DOSE) were normalized to the corresponding median value across a dataset such that continuous covariates were related to structural PK parameters in a power function as described below
where Θ is the fixed-effect parameter of a covariate estimated by the NONMEM program covariate value is the observed covariate value and PK typical value is the typical value of the PK parameter estimated by NONMEM Effects of categorical covariates (SEX and RACE) are related to structural PK parameters by fractional changes of dummy variables
DCP1PM Page 66 10182006
Clinical Pharmacology Review NDA 19-962 Toprol-XL 10182006
Where Θ is the fixed-effect parameter of a covariate estimated by the NONMEM program covariate is the dummy variable value and modified in the control streams and PK typical value is the typical value of this PK parameter as estimated by NONMEM
Median values of all covariates in the dataset for population PK analysis are presented in Table A
Table A Summary of patient covariates and Toprol-XL doses in the data for population PK analysis
Two Steps were included in the modeling of covariates
Step 1 Forward Addition The covariates were subjected to a stepwise forward selection algorithm using a likelihood ratio test based on a change in MOF values from the base model A significant covariate reduced the MOF more than 660 (chi-square distribution plt001 degrees of freedom [df]=1)
Step 2 Backward deletion (Excluding procedures for covariate effect) The covariates in the full model acquired in Step 1 were subjected to a backward deletion algorithm 1 covariate was deleted at a time using a likelihood ratio test based on a change in MOF values A covariate was determined to be statistically significant if the change in MOF after its deletion from the breakdown model was increased by more than 1083 (chi-square distribution plt0001 df=1)
4116 PK Random Variance Models An exponential error model was used to characterize inter-patient variability based upon the assumption that random effects for PK parameters were not correlated among PK parameters No other error models for eta were evaluated by the applicant or by this Reviewer The retention of ETA values for each PK parameter in the structural model was confirmed by sequentially fixing each ETA value at zero and comparing each resultant MOF with the MOF obtained when all ETA values were retained in the model (see Table 6)
DCP1PM Page 67 10182006
Clinical Pharmacology Review NDA 19-962 Toprol-XL 10182006
The residual model was modeled by an additive model two error terms were used one for error associated with trough samples and the other with serial samples
Reviewer Note Use of an exponential model appears reasonable
Pharmacodynamics
4117 PKPD Structural Model The equations for the structural models are shown below
1 Metoprolol Ctrough The relationships between the observed metoprolol concentrations (Ctrough) and hemodynamic changes were investigated using 4 direct-link models namely a linear model a log-linear model and Hillrsquos sigmoid Emax PKPD model with and without a baseline
2 The relationships between Cmax or AUC0ndash24 and hemodynamic changes were investigated using 2 direct-link models a linear model and a log-linear model
4118 PKPD Covariate Model The inclusion and exclusion procedures of covariate effect on the selected PKPD base model to obtain a selected final PKPD model were identical to those in the covariate evaluation in the population PK models as described previously in PK Covariate Model DCP1PM Page 68 10182006
Clinical Pharmacology Review NDA 19-962 Toprol-XL 10182006
Table B Baseline demographic and covariate characteristics
4119 PKPD Random Variance Models An exponential error model was used by the applicant to model inter-individual variability The retention of a random effect parameter ETA in each selected PKPD structural model was then evaluated by sequentially fixing each ETA value at zero and comparing each resultant MOF with the MOF obtained when all ETA values were retained in the model (plt005) This step reduced over-parameterization by deleting unnecessary random-effect parameters from the structural model to obtain the base model
Reviewer Note The study design precludes assessment of inter-individual variability or random error because only one dose record was available per patient Consequently the model should not have included eta terms It is noted that the sponsor ultimately dropped the eta term in the final model
DCP1PM Page 69 10182006
Clinical Pharmacology Review NDA 19-962 Toprol-XL 10182006
Model Selection
PK Initial Model Selection
PK Base Model to Final Model The selection of the most appropriate PK base model for a metoprolol PK was based upon the following criteria a significant reduction in MOF as compared to the baseline model and asymptotic chi-square distribution based on the likelihood ratio test or AIC (plt005) as compared to the other structural models This selected PK base model was then subject to a covariate evaluation The population PK model bearing all surviving covariate parameters with statistical significance became the penultimate final model If 1 of the body size parameters (WT BSA and HT) was not in the model the penultimate final model became the final model If body size parameters were in the model they were sequentially replaced by other body size parameters in the regression submodel for each PK parameter The best body size parameter was then selected on the basis of lowest MOF to form the final model
PK Final Model Selection Simulations and visual inspections based on goodness of fit plots were used to qualify and validate the model The goodness-of-fit of the final model was evaluated graphically by comparing population and individual predictions of metoprolol concentrations with observed metoprolol concentrations along the line of unity and by visual inspection of the following plots of population-weighted residuals (WRES) for the final population model 1 Population-weighted residuals (WRES) versus population-predicted concentrations (PRED) 2 WRES versus time after first drug administration in each patient 3 WRES versus all covariates evaluated WRES were generally expected to be distributed homogenously around zero for PRED time after administration and covariates For those 27 patients with serial samples goodness-of-fit of the plasma concentration-time profile for each individual was visually inspected The linear relationship between their AUClast values from the observed data and those from the simulated data (final model) was examined
The predictive performance of the final population PK model including covariates was evaluated by comparing typical values of PK parameters with the mean of individual Bayesian estimates or individual values of PK parameters with the results from non-compartmental analysis for patients with serial samples Steady-state metoprolol plasma concentration-time profiles from 0ndash24 hours at the interval of 15 minutes (025 hour) were calculated using the post hoc Bayesian estimated PK parameter obtained for 65 patients included in the PKPD relationship using the following equation
DCP1PM Page 70 10182006
Clinical Pharmacology Review NDA 19-962 Toprol-XL 10182006
PKPD Initial and Final Model Selection A similar approach to that of PK model selection was adopted for PKPD Each of the above-mentioned PKPD models with random effects was identified by curve-fitting the dataset Initial selection of the PKPD structural model was based upon a significant reduction in MOF (plt005) as compared to the baseline model and reasonable PKPD parameter estimates Software
Nonlinear mixed-effect modeling (NONMEM) software (Version V level 11 Globomax Hanover MD) was used in the population PK analysis PK model fitting was accomplished using first-order (FO) approximation methods For PKPD model fitting the first-order conditional estimation (FOCE) with eta-epsilon interaction method in NONMEM was used for all model runs
SAS software (Version VIII Cary NC) was employed to prepare datasets according to the format required by the NONMEM program (Boeckmann et al 1991) Microsoftreg Excel 2000 (Redmond WA) and S-PLUS 2000 (Professional Release 2 MathSoft Inc Cambridge MA) were used to perform exploratory graphical exposure calculation and statistical analyses according to the format required by the NONMEM program (Boeckmann et al 1991) SAS command files logs and listings pertaining to data file conversion and merging were reviewed by an independent analyst Datasets were stored in SAS data frames combined and exported to Excel and then to ASCII files before fitting to the model
Datasets were prepared and pooled in a NONMEM-compliant format using SAS software by the Programming Group Clinical Information Sciences at AstraZeneca Wilmington Delaware SAS command files logs and listings pertaining to file conversion and merging were provided and found to be acceptable The contents of both datasets (toprolkatcsv for PK modeling and cppd2csv for PKPD modeling) were included
DCP1PM Page 71 10182006
Clinical Pharmacology Review NDA 19-962 Toprol-XL 10182006
toprolkatcsv was not provided electronically in a SAS format however this reviewer generated a similar dataset using the applicantrsquos criteria
Reviewer Comment The software and data assembly methods appeared adequate
DCP1PM Page 72 10182006
Clinical Pharmacology Review NDA 19-962 Toprol-XL 10182006
Results and Discussion Design Adequacy
Overall the trial designs appeared adequate to evaluate metoprolol population PK and PKPD in pediatric patients receiving Toprol XL However the design could have been further optimized by increasing the sampling points particularly in the absorption phase Due to the limited number of samples in the absorption phase it was not possible to accurately characterize the absorption model first order vs zero order or mixed first and zero order Additionally collection of mainly trough samples limits the ability to accurately estimate measures such as Cmax that are not directly related to Ctrough particularly if multiple compartments are present Consequently Cmax estimations are unlikely to be accurate Finally most patients provided only one trough sample thus inter-individual variability could not be adequately captured and may have limited the utility of the modeling exercise particularly in PKPD where the random effect could not be accurately characterized Ultimately there was no random variable in the final PKPD model (ie eta was set to zero) Data Integrity
This reviewer checked the data visually by randomly selecting data from patients included in the population modeling and comparing to data in the study report (source data) Overall the data integrity appeared acceptable The applicant observed the following guidelines that appeared acceptable No datum from any study participant with a protocol violation that was thought to materially impact the analysis was included The dataset contained data from only those study participants who could be evaluated ie with all the last dosing datetime blood sampling datetime plasma drug concentrations and demographic covariates
Data that were excluded (n = 62 samples) from the model were as follows One sample from an apparent poor metabolizer Two samples collected gt 96 hours post dose From 307B 10 trough samples lt LOQ From 307A 17 samples lt LOQ Thirty-samples from serial data that were lt LOQ or whole blood samples Model and Model Selection
Base Model
41110 Pharmacokinetic Model description The base PK model was a standard two compartment model that incorporated lag time and flip-flop kinetics The key features of the model were flip-flop was insured by making the value of ke gt ka in the clearance equation Additionally lag time was restricted to a value of 2 hours or less and concentrations were log transformed consequently all concentrations (F) = 0 were given individual predicted concentrations of zero Finally there were two residual error terms one for serial samples and the other for trough samples DCP1PM Page 73 10182006
Clinical Pharmacology Review NDA 19-962 Toprol-XL 10182006
Key equations were as follows
KA = THETA(1)EXP(ETA(1)) V2 = THETA(2)EXP(ETA(2)) CL = (THETA(1)THETA(2)+THETA(3))EXP(ETA(3)) Q = THETA(4)EXP(ETA(4)) V3 = THETA(5)EXP(ETA(5)) ALAG1=THETA(6)EXP(ETA(6))
41111 PK Parameter estimation results Table 1 Summary of PK parameters in the metoprolol population PK base model (per applicant)
41112 Goodness of fit The applicant provided the following goodness-of-fit plots (Figure 1)
Reviewer Note The goodness-of-fit plots were reproduced by this Reviewer (see Appendix) with minor modifications
Figure 1 Goodness of fit plots for Base Model
DCP1PM Page 74 10182006
Clinical Pharmacology Review NDA 19-962 Toprol-XL 10182006
Base PK Model Selection The MOF values of all structural model candidates tested are presented in Table 2 Model selection was based primarily on MOF values the lower MOF the better the model The applicant reports that in general MOF values generated by a conventional absorption model (ie absorption rate is faster than elimination rate) and a flip-flop absorption model (ie absorption rate is slower than elimination rate) were identical
Reviewer Comment The existence of flip-flop kinetics appears plausible based on data provided and general patterns for sustained release formulations Consequently the use of flip-flop kinetics for the bulk of the modeling exercise appears reasonable
General conclusions from the information in Table 2 are First order input is better than zero order input Two compartment model is better than one compartment model Lag time presence is better than lack of lag time Two residual error terms are better than one residual error term It should also be noted that several other models led to unsatisfactory completion of the run and were not considered further
DCP1PM Page 75 10182006
Clinical Pharmacology Review NDA 19-962 Toprol-XL 10182006
Table 2 Comparison of Structural PK Models
Reviewer Comment The selected structural model appears appropriate based on the data
Base Model The deletion of ETA for V2 did not change the MOF value suggesting that ETA for V2 should be deleted to avoid an over-parameterized warning (Table 3) This was consistent with the estimated parameter value of ETA for V2 being 648 x 10ndash9 a very small value Therefore the base model was selected by deleting the ETA for V2 from the structural model
Reviewer Comment on Eta deletion for V2 Deletion of eta for V2 is acceptable based on the empirical data however from a physiological perspective deletion of eta is problematic Generally one anticipates inter-individual differences in volume of distribution In this case it appears that the error associated with V2 may have been randomly shifted to V3 and or Q terms as the three DCP1PM Page 76 10182006
Clinical Pharmacology Review NDA 19-962 Toprol-XL 10182006
terms are interrelated This potential shift in error is supported by the fact that the V2 eta value increases significantly (by several orders of magnitude- 10-5 vs 100) when eta for Q and or V3 is fixed However when Q or V3 are fixed minimization is successful but Q and V3 are not accurately estimated Accounting for the possible error shift is a complex process and goes beyond the scope of this reviewer thus deletion of eta associated with V2 was considered acceptable for the remainder of the modeling evaluation
Table 3 Structural elements tested in the metoprolol population PK structural model (p lt 0005)
Final PK Model
41113 Model description The key feature of the final model is the inclusion of the covariate effects of age on Q and weight on CL in the population PK model
Key Equations CL = (THETA(1)THETA(2)+THETA(3)+EWT)EXP(ETA(2)) Q = THETA(4)EAGEEXP(ETA(3))
Including Covariate Effects As previously described covariate effects were assessed by forward addition and backward deletion Most covariates did not significantly change MOF however BSA significantly affected CL and Age affected Q Consequently these covariates were included in the penultimate final model
DCP1PM Page 77 10182006
Clinical Pharmacology Review NDA 19-962 Toprol-XL 10182006
Reviewer Note BSA is derived form WT and HT covariates implying BSA is highly correlated to these two covariates (Figure 2) weight is the most suitable (practical covariate) as it is readily measured Furthermore weight and BSA produced the same MOF (Table 4) whereas MOF with height was more positive (less significant)
Figure 2 Plot of BSA vs Body Weight
The data in Table 4 support selection of the final model
Table 4 Covariate elements tested in the metoprolol population PK penultimate final model (plt0005)
The applicant acknowledges that mechanism(s) accounting for the impact of age on QF are not clear However since distribution clearance has little effect on metoprolol plasma exposure further investigation is not needed
41114 PK Parameter estimation results As shown in Table 5 PK parameters were estimated fairly precisely by the final model
Table 5 PK Parameter Estimates using Final Model
DCP1PM Page 78 10182006
Clinical Pharmacology Review NDA 19-962 Toprol-XL 10182006
41115 Goodness of fit The goodness-of-fit plots provided by the applicant show good precision Figure 5 Goodness of fit plots for final PK model
DCP1PM Page 79 10182006
Clinical Pharmacology Review NDA 19-962 Toprol-XL 10182006
PK Model Qualification The post hoc Bayesian-estimated AUC (simulated) obtained for the 27 patients with serial plasma samples are plotted against the observed (AUCt) The correlation was high (R2 gt 099) Figure 6 AUClast from observed data versus AUCt from model simulation in the 27 patients providing serial plasma samples
Regression line Y= 4514 + 08976 X R2 = 09957
The graphical validation of the final metoprolol population PK model validation against covariates evaluated is presented in Figure 6
Figure 7 Graphical validation of covariates
DCP1PM Page 80 10182006
Clinical Pharmacology Review NDA 19-962 Toprol-XL 10182006
There was no systematic bias in weighted residuals for any covariates evaluated suggesting that the final model included all appreciable effects of available covariates (Figure)
The effects of weight on metoprolol CLF are illustrated in Figure 8 where Bayesian post hoc estimates of CLF are plotted against weight and overlaid by the model-predicted line Overall the model appeared to fit the data well
Figure 8 Plot of CLF vs Body weight
The effects of AGE on metoprolol QF are illustrated in Figure 9 where Bayesian post hoc estimates of QF are plotted against AGE and overlaid by the model-predicted line Figure 9 Plot of QF vs Age
DCP1PM Page 81 10182006
Clinical Pharmacology Review NDA 19-962 Toprol-XL 10182006
Reviewer Note The applicant indicated that attempts to run the final model using the first-order conditional estimation method resulted in termination errors Therefore the parameter estimates obtained by the FO method were reported as the final parameter estimates
Conclusion Regarding Population PK Modeling Overall the sponsorrsquos population PK modeling is acceptable
PKPD Model and Model Selection
PKPD Base Model PharmacokineticPharmacodynamic Model description The key feature of the model was a lack of random variance term for the slope (since only single data points were available per subject) and inclusion of baseline effect
Key equations were as follows E0 = THETA(1)EXP(ETA(1)) M = THETA(2) Y = E0 + MLOG(AUC) + EPS(1)
The control stream provided in the appendix is that for DBP (provided by sponsor) The control stream for SBP is comparable with appropriate substitution for BP type
It should be noted that only the log-linear and linear PKPD models were considered suitable for AUC and Cmax For this review only AUC estimates were considered reliable as Cmax estimates could not be accurately determined based on the sampling scheme Consequently the remainder of this review focuses on AUC information although Ctrough and Cmax data are displayed for reference
Bayesian estimates from PK modeling are summarized in Table 1
Table 1 Bayesian estimates of metoprolol PK exposure for those patients included in the PKPD analysis (N=65)
DCP1PM Page 82 10182006
Clinical Pharmacology Review NDA 19-962 Toprol-XL 10182006
PKPD Model Selection (initial and final) The log-linear model was adopted as the base model for this PKPD relationship since it improved the MOF significantly (Table 2) The ETA parameter for the slope was pre-eliminated for the purpose of model parsimony The intercept and slope in this log-linear model for AUC(0-24) did not bear ETA parameter therefore no covariates had impact on either parameter in the model
Reviewer Note The intercept should not have borne an eta term because individual subjects provided only one data point Consequently fixing eta to zero or deleting eta in the final model is appropriate No further model development was required after eta was eliminated and the base model was equivalent to the final model
Table 2 Base population PKPD models tested for the change in SBP
41116 PKPD Parameter estimation results The final PKPD parameter estimates are presented in Table 3
Table 3 Summary parameters in the final PKPD model for the change in SBP using trough plasma level Parameter Explanation Estimate SE ()b
DCP1PM Page 83 10182006
Clinical Pharmacology Review NDA 19-962 Toprol-XL 10182006
Model Qualification Based on the relatively low R2 value and as shown in Figure there is a poor correlation between change in SBP and log AUC
Figure 1 Relationship between change in SBP and AUC (line generated from modeling)
Overall goodness-of-fit of the model was considered to be poor probably due to the high variability in the measurements Consequently the precision of the model parameter estimates was not considered to be very reliable These parameters have little clinical usefulness and can be treated only as an indication of trends ie more hemodynamic effects can be potentially achieved when high Toprol-XL doses are given Clinical dose adjustment based on these PKPD parameters is not recommended
Reviewerrsquos Supplemental Analyses A supplemental PKPD analyses was conducted using simple linear regression since the population model did not improve the fit Overall eta made an insignificant contribution to the overall model The results of the analyses were similar to the population analyses A series of regression analyses were conducted and are presented in Table 4
The applicant notes that the preliminary modeling exercise found that there was no difference in the PKPD modeling results using different hemodynamic data formats (ie change in the measurements percent change in the measurements or actual BP measurements) This finding was confirmed by this reviewer (see Table 4)
DCP1PM Page 84 10182006
Clinical Pharmacology Review NDA 19-962 Toprol-XL 10182006
Table 4 Supplemental PKPD Regression Analyses Conducted by Reviewer Model (liner regression) Intercept (I) Slope (m) R2 Probability RSBP = mISBP + I 3957 -035 01626 0009 PSBP = mISBP + I 2524 -023 01252 00038 PSBP = mRSBP + I 0005 074 09891 lt 00001 RSBP = mlogAUC + I 651 -221 0060 00493 RSBP = mDose + I -751 0006 00026 06878 RSBP = mDose^ + I -312 -111 004 02711 RSBP = mlogAUC + nISBP + I 5303 -221 (m)
-035 (n) 02230 0001
RSBPplc = mAUC + I -667 -0003 00458 00871 RSBPplc = mlogAUC + I 461 -2208 00600 00493 RPUL = mlogAUC + I 1868 -405 01102 00069 Symbols in table similar to population PK model without eta term RSBP- change of SBP without placebo correction ISBP- initial (baseline) SBP RPUL- change in HR without placebo correction Dose- in mg where placebo is included as 0 mg PSBP- percentage change of SBP without placebo correction
Conclusion Regarding Population PKPD Modeling Overall the sponsorrsquos population PKPD modeling is acceptable No dose adjustment conclusion can be made from this modeling however an exposure-response relationship was established for AUC and reduction in SBP
Discussion
The significance of the results 1 Provide estimates of PK measures and plasma exposure in pediatric population These data can be compared to adult exposure to determine if exposure differences impact drug effectiveness The main challenge in comparing pediatric data to adult data is different modeling schemes formulations and methods were used in the two populations
2 PKPD findings are not sufficiently precise to provide a dose adjustment algorithm however the PKPD analyses provides rationale for proposed titration as increasing exposure (doses) may improve efficacy (reduction in SBP) Ultimately the risk-benefit analyses overrides PKPD assessment for dose adjustment drug will be titrated thus reliance on PKPD information is not critical The proposed dose 10 mgkg appears suitable based on available information It is unclear from the studies if there should be an initial maximum dose although the sponsor has proposed 50 mg as the maximum initial dose The proposed pediatric starting dose on a mgkg basis is within the range of starting adult doses (25 ndash 100 mg) assuming an adult weighs 70 kg
3 Cumulative information form dose-response study indicates that Toprol XL has effectiveness in children however the most effective dose is unclear Since the drug can be titrated determining the initial optimal dose does not appear critical As proposed by the applicant dosing is started at a ldquolowrdquo dose that can be up-titrated if needed
DCP1PM Page 85 10182006
Clinical Pharmacology Review NDA 19-962 Toprol-XL 10182006
4 The results did not adequately address the potential impact of CYP2D6 metabolic status for pediatric patients taking Toprol XL There were an insufficient number of patients to make this assessment
5 Covariate effects do not appear significant only body weight significantly affects clearance However a worst case scenario can occur with a person that has a low body weight and is a poor metabolizer this will result in very high possibly supra-therapeutic exposure Age does not impact apparent oral clearance so an age-dependent dose adjustment is not needed for children over 6 years old In essence all children over six years old can initiate therapy at 10 mgkg
The validity of the results Overall the results produced by the sponsor appear valid and the sponsor used a sound modeling approach However alternative approaches that could have been adopted may have improved the outcome of the analyses Three of these approaches are presented below 1 Additional PK samples should have been collected during the absorption phase and
throughout the dosing interval to improve the modelrsquos performance Specifically additional samples collected during the absorption phase may have unambiguously identified the actual absorption input function (eg first order zero order mixed first and zero order) First order input was selected for the analyses although the dosage form is reported to exhibit zero order kinetics in adults It is possible that the input rate in children differs from that in adults but unlikely It should be noted that absorption kinetics in children is often erratic due to multiple factors (eg regioshyselective absorption incomplete gastric emptying and inconsistent absorption) so it is unclear if additional samples would have definitively identified the absorption function However additional non-trough samples may have helped in estimating key PK measures such as V and Cmax The final model did not have an eta associated with V which is atypical Collection of additional samples on different visits may have helped estimate potential inter-occasion variability It should be noted that AUC was estimated precisely for subjects providing serial samples but these subjects were not necessarily included in the PKPD analyses Ideally the PKPD modeling should have been conducted primarily in subjects who had accurate PK measures
2 The PKPD design could have been modified to potentially improve the utility of the analyses Specifically there should have been better placebo matching procedures to minimize the potential impact of the placebo effect This matching could have been improved by ensuring all patients on placebo had the same titration schedule and number of tablets It is noted that the model had a poor predictive performance that was mainly attributed to the high degree of variability in the PD measures Potentially other PD markers could have been explored that have less inherent variability One such marker is the degree of beta blockade using exercise heart rate (EHR) reduction this marker has been used extensively for metoprolol in adult subjects However use of EHR in the pediatric setting may be challenging
DCP1PM Page 86 10182006
Clinical Pharmacology Review NDA 19-962 Toprol-XL 10182006
Comments to sponsor
In future pharmacometric studies you should consider the following 1 collect sufficient (multiple) samples from individual subjects to allow assessment
of inter-occasion variability and estimation of inter-individual variability (eta) for all relevant parameters
2 placebo groups should be identically matched across all dose groups (eg same titration schedule and number tablets) to minimize potential bias or differences in the placebo effect
Comments to medical reviewer
1 The sponsor has adequately characterized metoprolol PK in the studied pediatric population The PK characterization could have been further optimized by obtaining additional samples over the entire dosing interval (eg during the absorption phase and elimination phase) on multiple occasions rather than on one occasion primarily at trough
2 A dose-response relationship could not be established using the protocol specified analysis approach The outcome of the dose-response relationship appeared highly dependent on the ldquoplacebo effectrdquo suggesting that the placebo group may not have been appropriate One should consider re-evaluating the dose-response precisely matched placebo groups (eg all placebo patients have identical number of tablets and titration schedule)
3 Based on the PKPD analysis plasma exposure (AUC) explains lt 10 of the response (reduction in systolic blood pressure) thus has limited clinical utility However the PKPD relationship suggests that there is a trend for increased response with increased exposure (dose driven)
4 Overall information from the dose-response study suggests that Toprol- XL is effective in the pediatric population The optimal initial dose 02 10 or 20 mgkg or the maximum safe and effective dose cannot be determined from the information provided It is noted that the 02 mgkg dose is unlikely to be effective as plasma concentrations achieved at this dose are unlikely to be effective (most concentrations lt LOQ and lower than effective adult concentrations) The 10 mgkg (proposed by applicant) appears to be a reasonable initial dose The labeling should reflect the regimens studied
DCP1PM Page 89 10182006
Clinical Pharmacology Review NDA 19-962 Toprol-XL 10182006
Appendix
DCP1PM Page 90 10182006
Clinical Pharmacology Review NDA 19-962 Toprol-XL 10182006
DCP1PM Page 91 10182006
Clinical Pharmacology Review NDA 19-962 Toprol-XL 10182006
DCP1PM Page 92 10182006
Clinical Pharmacology Review NDA 19-962 Toprol-XL 10182006
DCP1PM Page 93 10182006
Clinical Pharmacology Review NDA 19-962 Toprol-XL 10182006
DCP1PM Page 94 10182006
Clinical Pharmacology Review NDA 19-962 Toprol-XL 10182006
DCP1PM Page 95 10182006
Clinical Pharmacology Review NDA 19-962 Toprol-XL 10182006
Table 15 Control streams for final log-linear PKPD model for the change in DBP using metoprolol Cmax as the measure of exposure
Truncated NONMEM reports for base model identification for PKPD relationship in change of SBP (per sponsor)
DCP1PM Page 96 10182006
Clinical Pharmacology Review NDA 19-962 Toprol-XL 10182006
Reported PD information^
^ Under metoprolol regimen CRZ0K is Toprol XL
DCP1PM Page 97 10182006
Clinical Pharmacology Review NDA 19-962 Toprol-XL 10182006
Table Results of randomised double-blind comparative trials evaluating antihypertensive efficacy of metoprolol formulations or other antihypertensives
DCP1PM Page 98 10182006
---------------------------------------------------------------------------------------------------------------------
---------------------------------------------------------------------------------------------------------------------
---------------------
This is a representation of an electronic record that was signed electronically and this page is the manifestation of the electronic signature
s
Robert Kumi 10182006 045635 PM BIOPHARMACEUTICS
Patrick Marroum 10192006 050811 PM BIOPHARMACEUTICS
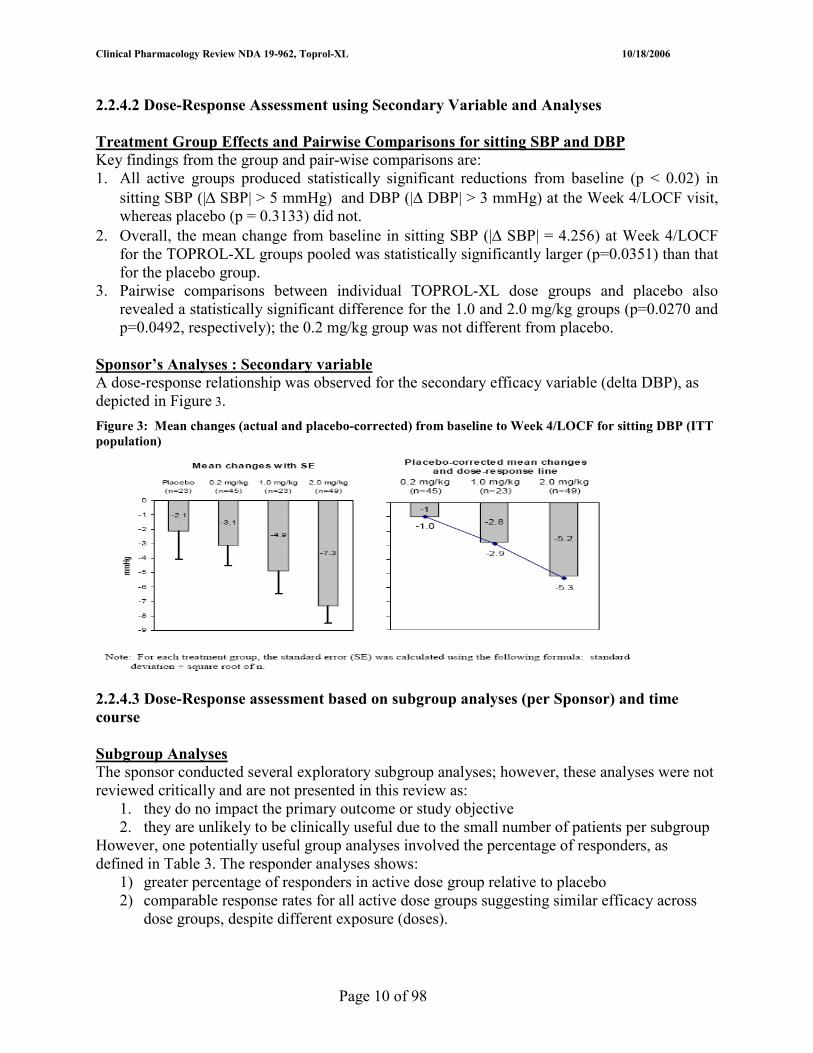
Clinical Pharmacology Review NDA 19-962 Toprol-XL 10182006
2247 PKPD comparisons Pediatric patients vs adults A priori PKPD relationships are expected to differ between adults and children because the two populations have different disease processes (secondary hypertension in children vs essential or primary hypertension in adults) Results of the pediatric modeling exercise showed that a log-linear model appeared to work better than other models for the relationship between SBP and DBP and exposure (AUC) In adults the Sigmoid Emax model has been successfully applied in PKPD modeling exercises It should be noted that the adult data were not reanalyzed for this review so it is unclear if log-linear or linear models would be adequate
As illustrated in Table 4 Toprol XL is effective in adults as well as in children and appears to be effective across a similar concentration range Table 4 PKPD Comparisons- Pediatric Patients vs Adults
Pediatric Patients Adults Population hypertensive Typically healthy Model Log-linear Sigmoid Emax PD Markers Placebo corrected SBP DBP changes
at trough bull Reduction in exercise heart rate (betashy
blockade measure) bull Placebo corrected SBP DBP changes at
trough EffectiveTherapeutic metoprolol concentrations
Most concentrations lt 107 ngmL bull EC50 = 105 nmolL (281 ngmL) bull Emax achieved at concentrations above 400
nmolL (107 ngmL) bull Range between 80 and 300 nM
Maximal mean BP Reduction at Studied Doses
bull SBP reduction -6 bull DBP reduction -5
bull SBP reduction -10 bull DBP reduction -4
Effectiveness of metoprolol relative to placebo
Generally more effective over the course of treatment
Generally more effective over the course of
Time course of effect Maximal effect observed within 1 to 4 weeks after initiation of therapy
Maximal effect observed within 1 to 4 weeks after initiation of therapy
Utility in Poor CYP2D6 metabolizers (PMs)
Not evaluated Poor metabolizers have a higher plasma concentration and a greater duration or degree of beta blockade thus PMs may not need extended release formulations
Proposed Initial Dosage 10 mgkg ~ 70 mg QD 25 to 100 mg QD
Overall it appears the studied pediatric doses produce comparable changes in diastolic pressure but lower changes in systolic pressure However in pediatric patients it is unlikely that the maximal possible activity was achieved at the doses studied thus conceivably pediatric patients can achieve maximal effects comparable to adults at optimized pediatric doses Three challenges in making definitive PKPD comparisons between the pediatric (studied in this NDA) and adult population are as follows
1 Study conditions differ- typically in adult studies HR is measured during exercise and not at rest
2 Results are obtained in healthy adult subjects rather than hypertensive patients 3 Insufficient numbers of studies have been reported in the literature that attempt to
identify the relationship between metoprolol exposure and SBP or DBP effect in adults
Page 14 of 98
10182006 Clinical Pharmacology Review NDA 19-962 Toprol-XL
225 Pharmacokinetic characteristics of metoprolol
2251 Metoprolol pharmacokinetics in pediatric patients Metoprolol PK parameters obtained from the population PK analyses are summarized in Table 5 Table 5 Metoprolol population PK parameter estimates (SE ) obtained using final population PK model
PK Parameter Value CLF (Lhr) 2275 ( 114 ) V2F (L) 961 (203 ) V3F (L) 620 (255 ) QF (Lh) 675 (204) Ka (hrndash1) 00467 (192 ) Tlag1 (hr) 0853 (297)
The data in Table 5 are derived from a 2-compartment linear PK model with first-order elimination and flip-flop first-order absorption and lag time
2252 Metoprolol pharmacokinetic comparisons pediatric patients vs adults PK Parameter Comparison Overall pediatric PK parameters obtained following administration of Toprol-XL are comparable (similar magnitude) to those in adults receiving IR metoprolol Potential limitations of the stated comparison and finding include the use of different modeling approaches populations number of samples and number of subjects in the trials (Table 6) Table 6 Comparative PK (children vs adults)
Source NDA 19962 Luzier et al Taguchi et al Plosker and Cissold and other sources
Model 2 Comp 1st Order absorption
1 Comp
Formulation Toprol XL IR IR IR Population Pediatric Hypertension Healthy adults Japanese geriatric Sampling Intense and Ctrough Intensive Sparse intensive CLF (Lhrkg) 338 116 ndash 340 094 -V2F (Lkg) 128 270 ndash 398 452 -V3F 851 333 ndash 809 - -QF (Lhr) 899 282 ndash 694 - -T12 (h) 351 - - 3 - 6 Covariate Effects Based on CLF Age None - Yes YesNo Gender Effect None Yes - -Race None - - - The applicant noted that pediatric data were compared to adult data from IR where CLF is dominated by the disposition function of metoprolol therefore it may be complicated to compare adult data to pediatric data (Toprol XL) where CLF is under a considerable influence from the release rate (input function) of the device This appears to be a valid caveat Using AUC and dosing information (Table 8) adult CLF for Toprol-XL ~ 17 ndash 25 Lhrkg
Exposure Comparison Following administration of Toprol XL at comparable doses in mg pediatric patients and adults generally had similar metoprolol exposure Adult data from literature and archived clinical pharmacology and biopharmaceutics reviews are presented in Table 8 and pediatric data from
Page 15 of 98
Clinical Pharmacology Review NDA 19-962 Toprol-XL 10182006
population PK modeling (Study 307A) are presented in Table 7 The main limitations of the cross-population comparison is the pediatric doses are over the 125 to 200 mg dose range whereas adult data is for specific doses However reasonable comparisons can be made at the 100 mg dose level assuming the meanmedian values in pediatric patients offer an acceptable approximation of exposure values and are representative of the central tendency of the data In this case the adult and pediatric data have comparable
1 exposure at 100 mg 2 degree of variability
Table 7 Bayesian estimates of metoprolol PK exposure for those patients included in the PKPD analysis (N=65)
includes only data where concentration gt LOQ
Table 8 Metoprolol exposure in adults following administration of Toprol XL
Cmax Cmin AUC Literature References 50 179 ndash 190 86 ndash 104 286 - 351 100 96 ndash 759 107 ndash 305 533 - 1192 200 778 ndash 1139 310 ndash 447 1392 - 1892 FDA Archived Information 50 179 plusmn 182 85 plusmn 138 286 plusmn 346 100 544 plusmn 436 226 plusmn 234 827 plusmn 766
2253 Inter and intra-subject variability in metoprolol pharmacokinetic Based on the values of the standard error () associated with PK parameters (Table 5) metoprolol PK exhibited low variability (SE lt 30) However this estimate may not be reliable (under predicted) because concentrations lt LOQ were not included in the analysis Several subjects particularly those receiving 02 mgkg had concentrations lt LOQ In adults exposure is highly variable (CV gt 70 ) as reflected in exposure estimates and wide exposure ranges Table 8
Potential sources of variability following metoprolol administration (Toprol XL) in children include regio-selective absorption incomplete gastric emptying variable gastric motility varying metabolic activity (CYP2D6) and inconsistent absorption Some of these factors are also applicable to adults
23 What Intrinsic Factors Affect Metoprolol Exposure-Response
Based on the population pharmacokinetic model weight was the only potentially clinically meaningful intrinsic factor that affected metoprolol exposure and hence response Other intrinsic
Page 16 of 98
Clinical Pharmacology Review NDA 19-962 Toprol-XL 10182006
factors such as age height gender race and sex did not affect metoprolol exposure
231 Effect of weight The effect of weight on metoprolol CLF are illustrated in Figure 7 Figure 7 Variation of CLF with weight obtained in population PK analysis
CLF increased linearly with body weight relative to a 70 kg individual the CL of a 22 kg individual is 30 lower This decreased CL will result in an increased exposure (maximum 30 ) that does not pose additional safety concerns or appear clinically significant (tolerated in studies) It should be noted that exposure (AUC) accounted for an insignificant portion of the hemodynamic effect (poor correlation) thus the clinical implications of the impact of body weight on CLF of metoprolol identified in the population PK modeling are limited Consequently dose adjustment is not required based on body weight Furthermore the maximum initial dose is 50 mg thus subjects with weight gt 50 kg will receive a maximum dose of 50 mg diminishing the impact if any of weight-dependent clearance
232 Effect of Age The effect of age on QF the inter-compartmental clearance is illustrated in Figure 8 Figure 8 Variation of QF with age obtained in population PK analysis
Page 17 of 98
Clinical Pharmacology Review NDA 19-962 Toprol-XL 10182006
QF does not contribute significantly to overall clearance therefore the reported finding does not appear clinically relevant It should be noted that the observed QF-age relationship is atypical
233 Effect of intrinsic factors on exposure-response pediatrics vs adults As mentioned previously the only evaluated intrinsic factor that affected metoprolol exposure was body weight In adults age and gender effects have been reported although there are conflicting reports on the age effect The exposure in adult and pediatric population are both potentially affected by the CYP2D6 metabolizing status of the subject Metoprolol is metabolized primarily in the liver by CYP2D6 The scientific literature reports several instances in adults of varying metoprolol exposure by poor and extensive CYP 2D6 metabolizers In the pediatric studies (307A and 307B) there was one suspected poor metabolizer (Trough concentration was 2330 ngmL) but the metabolic status (PM or EM) of this individual was not confirmed
24 What extrinsic factors affect metoprolol exposure-response
The role of extrinsic factors were not specifically evaluated in the pediatric population however one anticipates that extrinsic factors that affect adults should be applicable to children
25 What analytical method was used in pediatric studies 307 A and 307B
Please refer to section 223
Page 18 of 98
Clinical Pharmacology Review NDA 19-962 Toprol-XL 10182006
(b) (4)
TOPROL-XL is not recommended in pediatric patients lt 6 years of age (see CLINICAL PHARMACOLOGY Pharmacokinetics and PRECAUTIONS Pediatric Use)
Page 21 of 98
Clinical Pharmacology Review NDA 19-962 Toprol-XL 10182006
4 APPENDICES
41 Sponsorrsquos Proposed Label
17 Page(s) of Draft Labeling has been Withheld in Full as B4 (CCITS) immediately following this page
Page 22 of 98
Clinical Pharmacology Review NDA 19-962 Toprol-XL 10182006
42 Pharmacometrics Review
Page 40 of 98
Clinical Pharmacology Review NDA 19-962 Toprol-XL 10182006
Office of Clinical Pharmacology Pharmacometrics Review
NDAIND 19-962 Volume Not applicable submitted electronically POP PK Report in Section 5335 (Network Path Cdsesub1n19962N_0002006-05-15hpbiohupharm) Compound Metoprolol succinate Submission Dates 05152006 Sponsor Astra Zeneca Pharmacometrics Reviewer Robert Kumi PhD Secondary Reviewer Yaning Wang PhD
TABLE OF CONTENTS
OFICE OF CLINICAL PHARMACOLOGY PHARMACOMETRICS REVIEW 41
EXECUTIVE SUMMARY 42
OVERALL CONCLUSIONS 43
INTRODUCTION 46
OBJECTIVES OF THE ANALYSIS 48
DOSE-RESPONSE ANALYSIS 49
METHODS (POPULATION PKPD) 60
RESULTS AND DISCUSSION 73
RECOMMENDATIONS 87
APPENDIX 90
DCP1PM Page 41 10182006
Clinical Pharmacology Review NDA 19-962 Toprol-XL 10182006
Executive Summary In NDA SE5 033 the applicant Astra Zeneca has proposed changes to the currently approved labeling for TOPROL-XL metoprolol succinate extended release
(b) (4)
tablets Metoprolol a beta blocker is approved for hypertension angina and heart failure in adults In adults with hypertension the usual initial dosage is 25 to 100 mg daily (single dose) as monotherapy or in combination with a diuretic this dosage is titrated at weekly intervals until optimum blood pressure reduction is achieved The current application focuses on Toprol-XL use in pediatric patients ge six years old The initial proposed dosing in children six and older is 10 mgkg subsequently the dose is titrated based on clinical response
Two clinical trials Studies 307A (dose-response) and 307B (safety extension of 307A) were conducted in pediatric patients with hypertension to support the proposed labeling changes The applicant conducted dose-response population PK (n = 120 patients) and PKPD (n = 65 patients) analyses using data from pediatric hypertensive patients receiving Toprol-XL in the mentioned studies
Key Findings from the Dose-Response and Population PKPD analyses follow 1 Dose-Response A statistically significant dose-response did not exist for placebo
(pooled)ndashcorrected ∆SBP from baseline however the relationship was evident when placebo (specific-group) ndashcorrected data were used
2 PK Model Metoprolol PK in children were well characterized by a 2shycompartment model with flip-flop first-order absorption and an absorption lag time The model yielded precise parameter estimates
3 Covariates Sex age race body weight and Toprol-XL dose had no clinically significant effect on metoprolol PK
4 PKPD Model Using a log-linear model or linear model there were weak but statistically significant relationships between the changes in DBP and SBP and measures of metoprolol plasma exposure (Ctrough AUC0ndash24 and Cmax) Overall parameters were not precisely estimated in most models due to a high degree of variability in the blood pressure data
DCP1PM Page 42 10182006
Clinical Pharmacology Review NDA 19-962 Toprol-XL 10182006
Overall Conclusions 1 Were metoprolol PK adequately characterized in the pediatric population Metoprolol PK in pediatric patients (n = 120 Age 6 to 17) were adequately characterized using a population pharmacokinetic approach The population model was validated and qualified and comprised a 2-compartment open model with first order absorption and absorption lag time
2 Are there any covariates that influence metoprolol PK in pediatric patients with hypertension The two covariates that influenced metoprolol PK were weight and age apparent oral clearance increased linearly with body weight and inter-compartmental clearance increased with age according to a power function Other covariates including race sex and metoprolol dose did not impact metoprolol kinetics
3 Was a PKPD relationship established between metoprolol dose or plasma exposure( AUC Ctrough or Cmax) and hemodynamic measures (blood pressure) Using a simple linear regression model no dose-response (reduction in placebo corrected systolic blood pressure the primary outcome variable) was observed although a weak (R2 lt 01) but statistically significant (p lt 005) PKPD relationship was observed between metoprolol exposure measures and reduction in systolic blood pressure The small R2 value indicates metoprolol exposure could account for only a small portion of the hemodynamic effect According to the model as exposure increased there was greater reduction in blood pressure However only the relationship with AUC was considered reliable as AUC was estimated with good precision (PK modeling) whereas Cmax was not
4 Is there sufficient evidence to support effectiveness of Toprol XL in pediatrics and the initial proposed pediatric dosage Yes Although dose-response was not established with SBP reduction (primary variable) suggesting that the effectiveness of the individual tested Toprol-XL doses could not be differentiated the following information provides evidence to suggest that some Toprol-XL doses were more effective than placebo
bull Analysis of treatment group effects and pairwise comparisons suggested that overall Toprol-XL demonstrated effectiveness in pediatric patients with hypertension pooled Toprol groups vs placebo (p = 00351) and relative to baseline each active Toprol-XL dose group decreased SBP whereas placebo did not
bull There was a dose-response relationship for reduction in diastolic blood pressure typically systolic and diastolic blood pressure effects mirror each other
bull PKPD findings (reduction in SBP and heart rate as a function of AUC) support metoprolol effectiveness (increased exposure led to increased effectiveness) The heart rate effect supports metoprololrsquos known beta blocking activity
bull Generally Toprol-XL was effective in pediatric patients and adult patients at similar metoprolol exposure levels 02 mgkg in pediatrics was minimally effective because this dose yielded exposures lower than that obtained in adults at the lowest effect adult dose 25 mg
DCP1PM Page 43 10182006
Clinical Pharmacology Review NDA 19-962 Toprol-XL 10182006
bull The proposed pediatric dosage 10 mgkg is supported by the results from the dose-response study Visual inspection and pairwise comparisons indicated that 10 mgkg (placebo corrected) was statistically the most effective dose (greater efficacy than 02 mgkg and 20 mgkg) and was more effective than placebo (p = 0027)
5 Will initial dosage adjustment be required for any pediatric patients prior to titration No dosage adjustment does not appear necessary prior to titration (typically one week after treatment begins) Based on the population PK model the only potentially relevant factor that could affect PK was body weight CLF increased linearly with body weight relative to a 70 kg individual the CL of a 22 kg individual is 30 lower This decreased CL will result in an increased exposure (maximum 30 ) that does not pose additional safety concerns or appear clinically significant (tolerated in studies) The proposed starting dose 10 mgkg and doses up to 20 mgkg (maximum 200 mg) were tolerated in the clinical trials (307A and 307B) Furthermore exposure accounted for an insignificant portion of the hemodynamic effect (poor correlation) thus the clinical implications of the impact of body weight on CLF of metoprolol identified in the population PK modeling are limited
to a higher and tolerable dose until optimum BP reduction is achieved is reasonable This
(b) (4)The proposal to start Toprol-XL at a low dose and titrate
is consistent with labeling for adults
6 Was the PKPD relationship influenced by covariates Insufficient data were available to make this assessment
7 Are the PK and PKPD of metoprolol in children comparable to that in adults PK values obtained in pediatric patients were generally in the same range as those reported in adults Potential limitations of the comparison are the different modeling approaches populations number of samples and number of subjects in the trials (Table B)
It is difficult to make definitive PKPD comparisons between the pediatric (studied in this NDA) and adult population because
1 Study conditions differ- typically in adult studies HR is measured during exercise and not at rest
2 Results are obtained in healthy adult subjects rather than hypertensive patients 3 Insufficient number of studies have been reported in the literature that attempt to
identify the relationship between metoprolol exposure and SBP or DBP effect in adults
DCP1PM Page 44 10182006
Clinical Pharmacology Review NDA 19-962 Toprol-XL 10182006
Table B PK Comparisons (Pediatrics vs Adults) Source NDA 19962 Luzier et al Taguchi et al Plosker and Cissold
and other sources Model 2 Comp 1st
Order absorption 1 Comp
Formulation Toprol XL IR IR PK Analyses Population StandardNCA Population Standard Population Pediatric Healthy adults Japanese geriatric Sampling Intense and
Ctrough Intensive Sparse intensive
CLF (Lhrkg) 338 116 ndash 340 094 V2F (Lkg) 128 270 ndash 398 452 V3F 851 333 ndash 809 QF (Lhr) 899 282 ndash 694 Ka (h-1) 00467 Tlag (h) 0853 T12 (h) 351 3 - 6 Tmax (h) 25 ndash 73 Covariate Effects on CLF Age None Yes YesNo Gender Effect None Yes Race None The applicant noted that pediatric data were compared to adult data from IR where CLF is dominated by the disposition function of metoprolol therefore it may be complicated to compare adult data to pediatric data (Toprol XL) where CLF is under a considerable influence from the release rate (input function) of the device This appears to be a valid caveat
It should be noted that the cause of hypertension in adults differs from that in children Results of the pediatric modeling exercise showed that a log-linear model appeared to work better than other models for both SBP and DBP In adults the Sigmoidal Emax model has been successfully applied Using the Hill Equation (Sigmoidal Emax model) with EHR reduction (measure of beta blockade) as the PD marker in adults EC50 = 105 nmolL (281 ngmL) and Emax is achieved at metoprolol plasma concentrations gt 400 nmolL (107 ngmL) Placebo-corrected mean blood pressure changes (standing) associated with concentrations producing maximal blockade are -10 for systolic and ndash 4 for diastolic In the pediatric study the observed maximal mean reductions (placebo corrected) at the studied doses were approximately -6 for systolic and -5 for diastolic Hence it appears the studied pediatric doses produce comparable changes in diastolic pressure but lower changes in systolic pressure It should be noted that in the pediatric studies only a few metoprolol plasma concentrations were gt than 107 ngmL It is unlikely that the maximal activity was achieved at the doses studied yet the Toprol doses appeared effective The differential maximal effects may also be due to the difference in initial SBP (adults patients with hypertension tend to have higher initial BPs) in adult and pediatric studies there was a dependence of change in SBP on initial SBP
DCP1PM Page 45 10182006
Clinical Pharmacology Review NDA 19-962 Toprol-XL 10182006
Introduction Summary
(b) (4)NDA SE5 033 was submitted to seek approval of labeling changes to the currently approved labeling for TOPROL-XL This labeling translates to a new Toprol-XL indication for pediatric patients (6 years and older) with hypertension
Background on Metoprolol in Hypertension The majority of the following information was obtained form a Review article (sponsor provided) by Plosker and Clissold [Drugs 43(3) 382-414 1992)]
Table 1 Snapshot of Metoprolol Clinical Pharmacology and Biopharmaceutics Drug Class Metoprolol is a szlig1-selective (cardio selective) adrenergic receptor-
blocking agent Mechanism of Action (antihypertensive effect)
Multiple putative mechanisms competitive antagonism of catecholamine at peripheral sites reduction of sympathetic outflow to the periphery or suppression of renin activity
Approved Indications Hypertension Heart Failure and Angina Pectoris Approved Formulations Immediate Release (IR) ndash metoprolol tartrate
Controlled Release (CRZ0K) Toprol-XL is extended-release tablet of metoprolol as the succinate salt
Metabolism Via CYP2D6 primarily Absorption Absolute oral bioavailability ~ 50 following IR Food does not affect
metoprolol absorption using ER formulation Distribution Protein binding to albumin is about 12 Elimination For IR t12 from 3 ndash 7 hours Less than 5 dose excreted unchanged
in urine No t12 values for ER this may be due to difficulty in separating absorption and elimination phases
Variability Plasma levels are highly variable among subjects after oral administration
Age Effects PK of metoprolol not affected by age (20 to 65 years) but concentration of active metabolite in subjects gt 65 years about twice as high as those in younger although metoprolol concentrations similar in two groups (Regardh et al)
PKPD in children Limited information in children and provided mainly after administration of metoprolol tartrate
Summarized PK and PKPD Information in Adults Table 2 Reported PK Values in Adults (multiple references)
References include Abrahamsson et al Sandberg et al Wieselgren et al
DCP1PM Page 46 10182006
Clinical Pharmacology Review NDA 19-962 Toprol-XL 10182006
Table 3 PKPD Information Reference Key Findings Abrahamsson et al Therapeutic level of szlig1blockade (model- reduction in exercise heart
rate or EHR) is between 80 and 300 nM Sandberg et al Toprol XL is designed to deliver metoprolol succinate at a near
constant rate for about 20 hr Wieselgren et al In healthy males maximal EHR ~ 14 and minimum reduction ~ 9
with 50 mg Activity greater than placebo over 24 hour period Dayer et al Lennard et al Jonkers et al
Poor metabolizers have a higher plasma concentration and a greater duration or degree of beta blockade Potential implications for use of extended release as may not be needed in PMs
Various sources Toprol XL produces clinically and statistically significant reductions in blood pressure values compared to baseline values The maximal blood pressure lowering effect for a given dose in adults is observed between 1 and 4 weeks of treatment In 4 week trials with Toprol XL the maximum decrease in supine BP was 209 and standing was 129 (unclear if at trough) At trough following 4 weeks of 50 mg QD Toprol XL relative to placebo the reduction in supine BP was 112 and 103 in Standing
Summary of sponsorrsquos current analysis relevant to pharmacometrics and resulting claims
Dose-Response Analysis A dose-response analysis was conducted using a simple linear regression model where metoprolol dose in mgkg was the independent variable Week 4 placebo corrected change in blood pressure (diastolic or systolic) from baseline was the dependent variable (response)
Sponsorrsquos Analysis Claims (Dose-Response Study) Following administration of TOPROL-XL at doses of 125 to 200 mg once daily for up to 4 weeks metoprolol
bull Exhibited a significant dose-response relationship for DBP but none for SBP bull Produced statistically significant and clinically meaningful reductions in SBP and
DBP for some individual andor pooled target dose groups (02 10 and 20 mgkg)
Population PK and PKPD Analyses The sponsorrsquos population PK and PKPD analyses involved the use of typical population PK approaches Primarily SAS and NONMEM were used to run the analyses In brief the sponsor pooled plasma concentration time data from patients in Study 307A (trough samples) and 307B (trough samples in most subjects and serial samples in a subset of patients) for the PK modeling PKPD (PD measured primarily as changes in blood pressure) data were from patients in Study 307A These collective data were used in the population PK and PKPD analyses
Initially the sponsor identified the best PK structural population model by testing several pharmacokinetic models This model was further refined by eliminating error terms (etas) that were not statistically significant Subsequently the sponsor evaluated the effect of DCP1PM Page 47 10182006
Clinical Pharmacology Review NDA 19-962 Toprol-XL 10182006
covariates on the PK model and developed a final PK model The goodness of the fit of the model was assessed with standard procedures The final population model was used to simulate individual plasma concentration-time profiles and Bayesian estimates for Cmax and AUC for all patients These simulated AUC and Cmax values and actual (observed) Ctrough were used in the PKPD model The PKPD model was developed in a similar manner as the population PK model Initially the best PKPD base model was identified and the model refined until a final PKPD model was identified
Sponsorrsquos Analysis Claims (Population PK and PD Modeling) 1 A 2-compartment PK model with first-order elimination and flip-flop first-order
absorption and lag time best fit metoprolol concentration-time data obtained from the studied pediatric hypertensive patients
2 The following tabulated parameter estimates were obtained using the final population PK model CLF 2275 Lhr V2F 961 L V3F 620 L QF 675 Lh Ka 00467 hrndash1 Tlag1 0853 hr
These PK values were generally in the same range as those reported in adults
3 Sex race ideal body weight and Toprol-XL dose have no significant effect on metoprolol pharmacokinetics No covariate impacts V2F V3F Ka or the Tlag of metoprolol Age has no effect on metoprolol CLF and body weight has no effect on QF Metoprolol CLF increases linearly with body weight however no dose adjustment based upon body weight is necessary because dosage is titrated based on clinical response QF is proportional to age however the increase in QF with age is not clinically relevant
4 Weak but statistically significant relationships existed between DBP SBP and HR and some measures of metoprolol exposure (trough plasma levels Cmax and AUC(0ndash 24)) Because of high variability in the hemodynamic data goodness-of-fit of the PKPD models was generally poor and the resulting parameter estimates were not considered reliable Extrapolation of these model parameters in the clinic for dose adjustment is not recommended
5 No covariates had an impact on the parameters delineating the PKPD relationship between metoprolol exposure and DBP SBP and HR
Objectives of the analysis There are three specific goals of the PM analysis
1 To evaluate the adequacy of the sponsorrsquos dose-response analysis 2 To evaluate sponsorrsquos population PK analysis and determine if PK labeling claims
are acceptable DCP1PM Page 48 10182006
Clinical Pharmacology Review NDA 19-962 Toprol-XL 10182006
3 To evaluate sponsorrsquos population PKPD analyses and determine if the findings support the proposed dosing recommendation
Dose Response Analysis (Study 307A) Title Dose Ranging Safety and Tolerability of TOPROL-XLreg
(metoprolol succinate) Extended-release Tablets (metoprolol CRXL) in Hypertensive Pediatric Subjects A Multicenter Double-blind Placebo-controlled Randomized Parallel-group Study
Study Duration 30 May 2002 - 9 June 2004 Investigators (primary) Bonita E Falkner MD and Jonathan Sorof MD 1800 Sites Multiple locations (36 in US and 1 in Dominican Republic)
Table 1 Objectives and Outcomes for Study 307A
Study Design (FDA-approved Type A design) This was a multi-center international double-blind placebo-controlled randomized parallel-group study The study included a screening visit a 1- to 2-week single-blind placebo run-in period during which all previous antihypertensive medications were discontinued and a 4-week double-blind treatment period At the end of the placebo run-in period eligible patients with blood pressure (BP) measurements in the qualifying range were randomized in a 1212 ratio to receive once daily oral doses of placebo TOPROL-XL 02 mgkg TOPROL-XL 10 mgkg or TOPROL-XL 20 mgkg TOPROL-XL doses of 125 25 375 50 75 100 150 or 200 mg were used to approximate the target doses Patients in the placebo and TOPROL-XL 02 mgkg groups received the target dose for 4 weeks while patients in the TOPROL-XL 10 mgkg and
DCP1PM Page 49 10182006
Clinical Pharmacology Review NDA 19-962 Toprol-XL 10182006
20 mgkg groups had their dose up-titrated (based on weight) to the target dose over the first 1 to 2 weeks of double-blind treatment
Reviewer Note Rationale on Study design The inclusion of more patients in the TOPROL-XL 02 mgkg and 20 mgkg groups allowed better estimation of the dose response at the low and high ends of the dose range The TOPROL-XL 10 mgkg group with fewer patients provided a middle estimate that helped to describe the shape of the dose-response curve However having a fewer number of subjects may have contributed to variability Inclusion of a placebo control group allowed for the quantification of treatment-related BP reductions after adjusting for placebo effect It should be noted that the placebo groups were not identical as they followed different titration schedules and had a different number of tablets
The 02 mgkg dose is lower than the lowest approved adult dose on a mgkg basis (assuming 70 kg adult weight) but the highest studied pediatric dose 20 mgkg (200 mg limit was placed) is lower than the highest studied adult dosage 400 mg
Table 2 Toprol Dosing Scheme for Study 307A
Table 3 Formulations used in 307A
DCP1PM Page 50 10182006
Clinical Pharmacology Review NDA 19-962 Toprol-XL 10182006
SPONSORrsquoS STATISTICAL ANALYSIS PLAN HIGHLIGHTS bull The primary analysis used an intention-to-treat (ITT) population which included
all patients who received at least 1 dose of study medication and had baseline and at least 1 post baseline measurement For this analysis missing data were imputed using a last observation carried forward (LOCF) approach
bull A simple linear regression analysis was performed on the placebo-corrected change from baseline to Week 4LOCF in sitting SBP and sitting DBP with dose ratio as the explanatory variable
bull The placebo correction for placebo-corrected changes from baseline to Week 4 LOCF in sitting SBP and sitting DBP was performed by subtracting the mean change from baseline for the placebo group from the individual patient changes in the other treatment groups
bull ANOVA was performed with treatment group as the main factor for the changes from baseline to each post baseline visit in sitting SBP and DBP This ANOVA model was used to construct pairwise comparisons of each active treatment versus placebo and the active treatment groups combined versus placebo
bull The percentage of responders at Week 4 was summarized by frequency counts percentages and 95 confidence intervals (CI) for each treatment group
bull Subgroup analyses were also performed on the changes from baseline at Week 4 in sitting SBP and DBP and the influence of heart rate and baseline body mass index (BMI) on the mean changes from baseline to Week 4LOCF in sitting SBP and DBP were examined using linear regressions
bull Trough plasma concentrations of metoprolol were summarized descriptively and the lower limit of quantitation (LLQ) was 1 ngmL
bull Safety data were summarized using the safety population defined as all patients who received at least 1 dose of study medication and were not lost to follow-up No statistical analyses were performed on the safety data in this study
DCP1PM Page 51 10182006
Clinical Pharmacology Review NDA 19-962 Toprol-XL 10182006
Results Patient Disposition Per applicant patients recruited into this study were representative of a pediatric population with hypertension The four treatment groups were balanced with respect to demographic and baseline characteristics (Tables 4 and 5) About 80 percent of the patients were considered 90 compliant
Table 4 Baseline Characteristics in Study 307A
Table 5 Sitting SBP and DBP measurements at baseline
Sitting and standing BP measurement were comparable (eg mean SBP for all patients- sitting = 1319 and standing 1306 with similar CVs ~ 9 )
Primary Efficacy Variable The results for the primary efficacy variable are illustrated in Figure 1 Figure Dose response for placebo-corrected change from baseline to Week4LOCF for sitting SBP (ITT population)
DCP1PM Page 52 10182006
Clinical Pharmacology Review NDA 19-962 Toprol-XL 10182006
Figure 1 Change in SBP from baseline as a function of Toprol XL dose
Table 6 Linear regressions statistics used to assess Dose-Response
The results indicate that bull The slope of the curve is not different form zero (p = 05371 for dose ratio)
suggesting that there is no dose-response relationship bull Most active treatment groups are more effective than placebo in reducing SBP
By visual inspection it appears the lack of observed dose-response is mainly driven by a lower than expected response at the 20 mgkg level
Potential issues affecting efficacy and pharmacokinetic results bull LOCF was required for eight patients however the LOCF approach did not
greatly impact the outcome of the trial bull Patients assigned to the 10 mg and 20 mgkg dose received drug for only 2
weeks whereas dose in the 02 mgkg received the same dose for 4 weeks
DCP1PM Page 53 10182006
Clinical Pharmacology Review NDA 19-962 Toprol-XL 10182006
Reviewerrsquos Supplemental Dose-Response Analyses The sponsorrsquos dose-response analysis was successfully reproduced by this Reviewer using pooled placebo corrected data A supplemental analysis was conducted using group-specific placebo corrected data In this procedure data for subjects assigned to a given Active Group (eg 02 mgkg) were corrected with Placebo data (02 mgkg) Group specific placebo data are presented in Table 7
Table 7 Placebo-group specific data Placebo Group Frequency Delta SBP 02 mgkg 8 -567 10 mgkg 6 -300 20 mgkg 9 230
It should be noted that the group-specific placebo data appeared to follow a consistent trend where the placebo effect decreased with increasing number of tablets It is unclear if this titrationtablet-dependent placebo effect is valid or random Overall the apparent differential placebo effects suggest that the placebo group may have overly influenced the outcome of the dose-response analysis
When active groups are corrected using group-matched placebo data there is a statistically significant dose-response The dose response using group-specific placebo data is illustrated in Table 8 and Figure 2
Figure 2 Placebo corrected changes in SBP (chg_pc on y axis) as a function of dose ratio
Potential Limitations of Supplemental Analyses Typically placebo effects are constant if randomization is correct thus it is unclear if subsetting the placebo group is acceptable and did not increase bias Additionally subsetting the placebo group leads to a reduced number of placebo subjects per dose group that may impact the regression analyses
DCP1PM Page 54 10182006
Clinical Pharmacology Review NDA 19-962 Toprol-XL 10182006
Table 8 SAS output for regression analyses using group-specific placebo corrections The REG Procedure
Model MODEL1
Dependent Variable chg_pc
Number of Observations Read 117
Number of Observations Used 117
Analysis of Variance
Sum of Mean
Source DF Squares Square F Value Pr gt F
Model 1 191083177 191083177 2663 lt0001
Error 115 825109481 7174865
Corrected Total 116 10162
Root MSE 847046 R-Square 01880
Dependent Mean -430358 Adj R-Sq 01810
Coeff Var -19682365
Parameter Estimates
Parameter Standard
Variable Label DF Estimate Error t Value Pr gt |t|
Intercept Intercept 1 125480 133166 094 03480
DOSRATIO Dose Ratio 1 -100051 019387 -516 lt0001
Secondary variables
bull Placebo-corrected change from baseline in sitting DBP The mean plusmn SD change (Week 4LOCF) in sitting DBP is illustrated in Figure 3 and Table 9
Figure 3 Mean changes (actual and placebo-corrected) from baseline to Week 4LOCF for sitting DBP (ITT population)
DCP1PM Page 55 10182006
Clinical Pharmacology Review NDA 19-962 Toprol-XL 10182006
Table 9 SAS output for regression analyses for DBP with pooled placebo correction
Treatment group effects and pairwise comparisons for sitting SBP and DBP Results of the treatment group effects at the Week 4LOCF visit and the pairwise comparisons between each TOPROL-XL group and placebo for the change from baseline in sitting SBP and DBP are shown for the ITT population in Table 10
Table 10 Treatment group effects for change in baseline to Week 4LOCF for sitting SBP and DBP (ITT population)
Some key findings from the pair-wise comparison are as follows (Table 10) 1 All active groups produced statistically significant reductions from baseline in sitting
SBP and DBP at the Week 4LOCF visit whereas placebo did not
DCP1PM Page 56 10182006
Clinical Pharmacology Review NDA 19-962 Toprol-XL 10182006
2 Overall the mean change from baseline in sitting SBP at Week 4LOCF for the TOPROL-XL groups pooled was statistically significantly larger than that for the placebo group (p=00351)
3 Results of pairwise comparisons between individual TOPROL-XL dose groups and placebo also revealed a statistically significant difference for the 10 and 20 mgkg groups (p=00270 and p=00492 respectively)
bull Mean changes over time in sitting SBP and DBP Consistent with findings from other studies with beta-blockers apparent maximal reduction in blood pressure occurred between 1 and 4 weeks of treatment
Figure 4 Mean changes over time for sitting SBP and DBP (ITT population)
Data points in plot are from absolute values (not taking baseline into account)
Subgroup Analyses The sponsor conducted several exploratory subgroup analyses however these analyses were not reviewed critically and are not presented in this review as
1 they do no impact the primary outcome or study objective 2 they are unlikely to be clinically useful due to the small number of patients per
subgroup One potentially useful some group analyses involved the percentage of responders as defined in Table 11
The responder analyses shows comparable response rates for all active dose groups suggesting similar efficacy across dose groups despite different exposure (doses)
DCP1PM Page 57 10182006
Clinical Pharmacology Review NDA 19-962 Toprol-XL 10182006
Table 11 Number and proportion of responders (ITT population)
Pharmacokinetic Results The Ctrough information obtained in the trial are summarized in Figure 6 and Tables 12 and 13
Table 12 Summary of Ctrough data (per applicant)
Sixteen patients across the 3 TOPROL-XL groups did not have blood samples obtained for analysis of metoprolol concentrations Based on the number of samples BLQ there appeared to be very low concentrations in the lowest dose group It appeared that Ctrough increased with dose According to the applicant these values are similar to those obtained previously in adults especially at the 2 higher doses Variability was high in all treatment groups (CV gt 60 )
Table 12 Summary of Ctrough (Reviewer Generated) from all patients (samples lt LOQ given value = 0) Toprol XL Dose Number of subjects Concentration (ngmL) (mgkg) Mean plusmn SD Median Range 02 39 137 plusmn 294 000 0 ndash 157 10 17 1224 plusmn 1416 845 0 ndash 571 20 46 2462 plusmn 3352 1140 0 ndash 1670
DCP1PM Page 58 10182006
Clinical Pharmacology Review NDA 19-962 Toprol-XL 10182006
Reviewer Note Overall the plasma concentrations (exposure) for the 02 mgkg dose group appear too low to be effective (close to LOQ) It is noted that adults typically have concentrations gt LOQ at the lowest therapeutic dose 25 mg (~ 4 ngmL)
Figure 6 Boxplot of metoprolol Ctrough using samples gt LLQ (per applicant)
Safety Results According to the applicant Toprol XL was well tolerated in the pediatric population as tabulated below
Main Analyses Conclusions bull No dose response was observed for corrected SBP using pooled placebo data
however using group-matched placebo data demonstrated a dose response bull Ctrough increased with dose bull Toprol 10 and 20 mg kg doses were more effective than placebo in reducing
SBP bull The responder rate was comparable across all active dose groups and this rate was
greater than that of placebo
DCP1PM Page 59 10182006
Clinical Pharmacology Review NDA 19-962 Toprol-XL 10182006
Methods Reviewerrsquos Methods Generally this reviewer conducted the analyses in a manner similar to that of the sponsor to confirm the sponsorrsquos findings
Sponsorrsquos Methods
Design Study1 307A
Reviewer Note This study was described in the Dose-Response Assessment (please refer to Page 7 Dose Response Analyses) Consequently only highlights relevant to the population analyses will be included in this section
Study 307A was a 4-week multi-center double-blind placebo-controlled randomized parallel-group study TOPROL-XL (metoprolol succinate) extended-release tablets were given to hypertensive pediatric patients Patients were randomized to double-treatment with a once daily oral dose of placebo or Toprol-XL at 1 of 3 target doses 02 or 20 mgkg The dose range for this study was 125 to 200 mg daily Patients on placebo followed the same schedule as that for their active group comparators
Study Flow Chart
Key Inclusion Criteria School age and adolescent children with reproducible SBP or DBP at or above the 95th percentile using height-adjusted charts for age and weight were eligible
DCP1PM Page 60 10182006
Clinical Pharmacology Review NDA 19-962 Toprol-XL 10182006
Study2 307B
Study 307B was a 52-week multi-center open-label study to determine the safety and pharmacokinetics of TOPROL-XL (metoprolol succinate) extended-release tablets (metoprolol CRXL) in hypertensive pediatric patients The starting dose was 25 mg daily The dose was increased every 2 weeks in increments of 25 mg or 50 mg based on tolerability until BP was controlled or the dose reached 200 mg
Table 1 Study Assessments
At the end of the 52-treatment period all patients had BP measured and a trough plasma level taken 24 hours the last dose of Toprol-XL with the exception of those patients who completed the serial portion at the final visit Among the participants a subgroup of approximately 30 patients was to participate in PK assessments of metoprolol requiring serial blood sampling at any time during the 52 weeks A single dose of 25 mg of Toprol-XL was given orally to those participating patients after a 48-hour washout period After the PK assessments they returned to the main study protocol Data
Study1 307A
4111 Pharmacokinetics A blood sample was to be collected at Visit 7 into a heparinized Vacutainer tube and obtained at 24 hours (plusmn2 hour) following the last dose of study medication (ie trough measurement) for determination of plasma metoprolol concentrations
Study Disposition Chart
DCP1PM Page 61 10182006
Clinical Pharmacology Review NDA 19-962 Toprol-XL 10182006
Table 2 Study Demographics
4112 Pharmacodynamics Primary variable
Sitting SBP determined at trough (24plusmn4 hours Visit 7) served as the primary efficacy assessment The primary measure of effect was the placebo-corrected change from baseline to the end of treatment (Week 4) in trough sitting SBP Each BP determination represented the mean of 3 readings with less than 7 mmHg between the highest and lowest value Blood pressure was measured using a mercury sphygmomanometer with an appropriate size cuff positioned approximately at the level of the heart Every effort was made to have the same individual measure the patientrsquos BP throughout the study if possible At all post randomization visits BP measurements were to be made at trough defined as 24 hours (plusmn4 hours) after receiving study medication All measurements were to be determined prior to the patient taking the scheduled dose of study medication In the
DCP1PM Page 62 10182006
Clinical Pharmacology Review NDA 19-962 Toprol-XL 10182006
event that the patient accidentally took study medication on the day of the scheduled visit the visit was to be rescheduled within 24 to 48 hours
Study2 307B
4113 Pharmacokinetics A 48-hour washout period prior to sampling was required for all patients including patients who entered the 52-week study and then decided to participate in the serial PK portion of the study All patients were to have a 15-mL blood sample collected into a heparinized Vacutainer tube 24 hours (plusmn2 hour) following the last dose of TOPROL-XL (ie trough measurement) at Visit 18 (or a the time of premature discontinuation) except for patients who participated in the serial PK portion of the study and had blood sampling performed at Visit 18 For patients participating in the serial PK portion of the study blood samples (15 mL) were to be collected into heparinized Vacutainer tubes and obtained at Hour 0 (predose) and at 1 2 3 4 6 8 10 and 24 hours after administration of a single 25 mg dose of TOPROL-XL following a 48-hour washout period After the last blood sample was obtained the patient was to startresume the prescribed dose of TOPROL-XL heshe was receiving prior to PK sampling
Patient Disposition Chart (completion or discontinuation)
Overall a total of 31 patients at 8 centers were enrolled in the serial PK portion of the study Of these 31 patients 27 had plasma concentration data available and were included in the analyses Four patients were excluded from the analyses because their plasma concentrations were not quantifiable (Nos 047-009 and 047-021) or because only whole blood samples were analyzed (Nos 005-002 005-003)
DCP1PM Page 63 10182006
Clinical Pharmacology Review NDA 19-962 Toprol-XL 10182006
Table 3 Subject Demographics for Patients Providing Serial Blood Samples
Missing Data Twenty-six patients did not have blood samples obtained for analysis of metoprolol concentrations in either the 16-week (n=7) or 52-week (n=19) studies Among patients with plasma samples 14 (14) in the 52-week study and 13 (13) in the 16-week study had trough plasma metoprolol concentrations that were below the LLQ Therefore data from a total of 99 patients were included in this analysis
Assay Metoprolol plasma levels were assayed using high-performance liquid chromatography tandem mass spectrometric detection methods having limit of quantitation (LOQ) of 1 ngmL The method was validated in the linear range 1 to 1000 ngmL Precision was less than or equal to 109 Accuracy ranged from 940 to 1013 Pharmacodynamics Not applicable
Data Checking SAS was used to format and check data Additionally visual inspection of several randomly selected subject data was carried out
DCP1PM Page 64 10182006
Clinical Pharmacology Review NDA 19-962 Toprol-XL 10182006
Models
Overview The sponsorrsquos stated assumptions underlying this modeling analysis are
1 Rich sampling data collected from 30 subjects in 307B Study can be used to adequately characterize the structural pharmacokinetic model of metoprolol
2 Structural pharmacokinetic models of metoprolol at other dose strength are identical to that at 25 mg
3 Metoprolol exhibits a linear pharmacokinetics in the dose ranges studied 4 Steady-state pharmacokinetics of metoprolol has been reached at the time of blood
sampling in Study 307A 5 Metoprolol accounts for the blood pressure effect in the study 6 Existing various disease states in the patients have no impact on the pharmacokinetics
of metoprolol and pharmacodynamics of the blood pressure reduction in the study 7 Concomitant medications if existed do not have any effects on the pharmacokinetics
of metoprolol and pharmacodynamics of the blood pressure reduction in the study
Reviewer Comment The sponsorrsquos assumptions appear reasonable based on existing metoprolol PKPD information
Pharmacokinetics
4114 PK Structural Model Several PK models were tested to identify the structural model Flip-flop absorption was taken into consideration based on general PK characteristics following administration of sustained release tablets and observed data in the current study (serial PK samples)
The models tested included linear 1- and 2-compartment PK models with the following characteristics (focused on flip-flop models)
bull first-order absorption with and without absorption lag time (NONMEM subroutines ADVAN2 and ADVAN4)
bull zero-order absorption with and without absorption lag time (NONMEM subroutines ADVAN1 and ADVAN3)
bull simultaneous zero- and first-order absorption from the absorption compartment The models were parameterized in terms of CLF and VF
Ultimately the 2-compartment model with first order flip-flop absorption an absorption lag time and 2 residual error terms was selected as the structural model of metoprolol The model scheme is presented in the following Figure 1 Figure 1 PK Compartmental Model
DCP1PM Page 65 10182006
Clinical Pharmacology Review NDA 19-962 Toprol-XL 10182006
4115 PK Covariate Model Covariate models were developed to account for the potential impact of the following covariates and derived covariates on metoprolol PK
Continuous variables bull Age (AGE years) bull Body weight (WT kg) bull Body surface area (BSA m2) calculated from WT and HT (cm) using the height
weight formula BSA=0024265 x WT 05378 x HT03964 bull Ideal body weight (IBW kg) calculated as - Males IBW=50+(HTndash150)25 and
for Females IBW=45+(HTndash150)25 bull Dose (DOSE mg of Toprol-XL)
Categorical variables bull Gender (SEX) - Male 0 - Female 1 bull Race (RACE) - Caucasian 0 - Black 1 - Asian 2 - Other 3
PK covariate effects were modeled as follows
Effects of continuous covariates (AGE WT BSA IBW and DOSE) were normalized to the corresponding median value across a dataset such that continuous covariates were related to structural PK parameters in a power function as described below
where Θ is the fixed-effect parameter of a covariate estimated by the NONMEM program covariate value is the observed covariate value and PK typical value is the typical value of the PK parameter estimated by NONMEM Effects of categorical covariates (SEX and RACE) are related to structural PK parameters by fractional changes of dummy variables
DCP1PM Page 66 10182006
Clinical Pharmacology Review NDA 19-962 Toprol-XL 10182006
Where Θ is the fixed-effect parameter of a covariate estimated by the NONMEM program covariate is the dummy variable value and modified in the control streams and PK typical value is the typical value of this PK parameter as estimated by NONMEM
Median values of all covariates in the dataset for population PK analysis are presented in Table A
Table A Summary of patient covariates and Toprol-XL doses in the data for population PK analysis
Two Steps were included in the modeling of covariates
Step 1 Forward Addition The covariates were subjected to a stepwise forward selection algorithm using a likelihood ratio test based on a change in MOF values from the base model A significant covariate reduced the MOF more than 660 (chi-square distribution plt001 degrees of freedom [df]=1)
Step 2 Backward deletion (Excluding procedures for covariate effect) The covariates in the full model acquired in Step 1 were subjected to a backward deletion algorithm 1 covariate was deleted at a time using a likelihood ratio test based on a change in MOF values A covariate was determined to be statistically significant if the change in MOF after its deletion from the breakdown model was increased by more than 1083 (chi-square distribution plt0001 df=1)
4116 PK Random Variance Models An exponential error model was used to characterize inter-patient variability based upon the assumption that random effects for PK parameters were not correlated among PK parameters No other error models for eta were evaluated by the applicant or by this Reviewer The retention of ETA values for each PK parameter in the structural model was confirmed by sequentially fixing each ETA value at zero and comparing each resultant MOF with the MOF obtained when all ETA values were retained in the model (see Table 6)
DCP1PM Page 67 10182006
Clinical Pharmacology Review NDA 19-962 Toprol-XL 10182006
The residual model was modeled by an additive model two error terms were used one for error associated with trough samples and the other with serial samples
Reviewer Note Use of an exponential model appears reasonable
Pharmacodynamics
4117 PKPD Structural Model The equations for the structural models are shown below
1 Metoprolol Ctrough The relationships between the observed metoprolol concentrations (Ctrough) and hemodynamic changes were investigated using 4 direct-link models namely a linear model a log-linear model and Hillrsquos sigmoid Emax PKPD model with and without a baseline
2 The relationships between Cmax or AUC0ndash24 and hemodynamic changes were investigated using 2 direct-link models a linear model and a log-linear model
4118 PKPD Covariate Model The inclusion and exclusion procedures of covariate effect on the selected PKPD base model to obtain a selected final PKPD model were identical to those in the covariate evaluation in the population PK models as described previously in PK Covariate Model DCP1PM Page 68 10182006
Clinical Pharmacology Review NDA 19-962 Toprol-XL 10182006
Table B Baseline demographic and covariate characteristics
4119 PKPD Random Variance Models An exponential error model was used by the applicant to model inter-individual variability The retention of a random effect parameter ETA in each selected PKPD structural model was then evaluated by sequentially fixing each ETA value at zero and comparing each resultant MOF with the MOF obtained when all ETA values were retained in the model (plt005) This step reduced over-parameterization by deleting unnecessary random-effect parameters from the structural model to obtain the base model
Reviewer Note The study design precludes assessment of inter-individual variability or random error because only one dose record was available per patient Consequently the model should not have included eta terms It is noted that the sponsor ultimately dropped the eta term in the final model
DCP1PM Page 69 10182006
Clinical Pharmacology Review NDA 19-962 Toprol-XL 10182006
Model Selection
PK Initial Model Selection
PK Base Model to Final Model The selection of the most appropriate PK base model for a metoprolol PK was based upon the following criteria a significant reduction in MOF as compared to the baseline model and asymptotic chi-square distribution based on the likelihood ratio test or AIC (plt005) as compared to the other structural models This selected PK base model was then subject to a covariate evaluation The population PK model bearing all surviving covariate parameters with statistical significance became the penultimate final model If 1 of the body size parameters (WT BSA and HT) was not in the model the penultimate final model became the final model If body size parameters were in the model they were sequentially replaced by other body size parameters in the regression submodel for each PK parameter The best body size parameter was then selected on the basis of lowest MOF to form the final model
PK Final Model Selection Simulations and visual inspections based on goodness of fit plots were used to qualify and validate the model The goodness-of-fit of the final model was evaluated graphically by comparing population and individual predictions of metoprolol concentrations with observed metoprolol concentrations along the line of unity and by visual inspection of the following plots of population-weighted residuals (WRES) for the final population model 1 Population-weighted residuals (WRES) versus population-predicted concentrations (PRED) 2 WRES versus time after first drug administration in each patient 3 WRES versus all covariates evaluated WRES were generally expected to be distributed homogenously around zero for PRED time after administration and covariates For those 27 patients with serial samples goodness-of-fit of the plasma concentration-time profile for each individual was visually inspected The linear relationship between their AUClast values from the observed data and those from the simulated data (final model) was examined
The predictive performance of the final population PK model including covariates was evaluated by comparing typical values of PK parameters with the mean of individual Bayesian estimates or individual values of PK parameters with the results from non-compartmental analysis for patients with serial samples Steady-state metoprolol plasma concentration-time profiles from 0ndash24 hours at the interval of 15 minutes (025 hour) were calculated using the post hoc Bayesian estimated PK parameter obtained for 65 patients included in the PKPD relationship using the following equation
DCP1PM Page 70 10182006
Clinical Pharmacology Review NDA 19-962 Toprol-XL 10182006
PKPD Initial and Final Model Selection A similar approach to that of PK model selection was adopted for PKPD Each of the above-mentioned PKPD models with random effects was identified by curve-fitting the dataset Initial selection of the PKPD structural model was based upon a significant reduction in MOF (plt005) as compared to the baseline model and reasonable PKPD parameter estimates Software
Nonlinear mixed-effect modeling (NONMEM) software (Version V level 11 Globomax Hanover MD) was used in the population PK analysis PK model fitting was accomplished using first-order (FO) approximation methods For PKPD model fitting the first-order conditional estimation (FOCE) with eta-epsilon interaction method in NONMEM was used for all model runs
SAS software (Version VIII Cary NC) was employed to prepare datasets according to the format required by the NONMEM program (Boeckmann et al 1991) Microsoftreg Excel 2000 (Redmond WA) and S-PLUS 2000 (Professional Release 2 MathSoft Inc Cambridge MA) were used to perform exploratory graphical exposure calculation and statistical analyses according to the format required by the NONMEM program (Boeckmann et al 1991) SAS command files logs and listings pertaining to data file conversion and merging were reviewed by an independent analyst Datasets were stored in SAS data frames combined and exported to Excel and then to ASCII files before fitting to the model
Datasets were prepared and pooled in a NONMEM-compliant format using SAS software by the Programming Group Clinical Information Sciences at AstraZeneca Wilmington Delaware SAS command files logs and listings pertaining to file conversion and merging were provided and found to be acceptable The contents of both datasets (toprolkatcsv for PK modeling and cppd2csv for PKPD modeling) were included
DCP1PM Page 71 10182006
Clinical Pharmacology Review NDA 19-962 Toprol-XL 10182006
toprolkatcsv was not provided electronically in a SAS format however this reviewer generated a similar dataset using the applicantrsquos criteria
Reviewer Comment The software and data assembly methods appeared adequate
DCP1PM Page 72 10182006
Clinical Pharmacology Review NDA 19-962 Toprol-XL 10182006
Results and Discussion Design Adequacy
Overall the trial designs appeared adequate to evaluate metoprolol population PK and PKPD in pediatric patients receiving Toprol XL However the design could have been further optimized by increasing the sampling points particularly in the absorption phase Due to the limited number of samples in the absorption phase it was not possible to accurately characterize the absorption model first order vs zero order or mixed first and zero order Additionally collection of mainly trough samples limits the ability to accurately estimate measures such as Cmax that are not directly related to Ctrough particularly if multiple compartments are present Consequently Cmax estimations are unlikely to be accurate Finally most patients provided only one trough sample thus inter-individual variability could not be adequately captured and may have limited the utility of the modeling exercise particularly in PKPD where the random effect could not be accurately characterized Ultimately there was no random variable in the final PKPD model (ie eta was set to zero) Data Integrity
This reviewer checked the data visually by randomly selecting data from patients included in the population modeling and comparing to data in the study report (source data) Overall the data integrity appeared acceptable The applicant observed the following guidelines that appeared acceptable No datum from any study participant with a protocol violation that was thought to materially impact the analysis was included The dataset contained data from only those study participants who could be evaluated ie with all the last dosing datetime blood sampling datetime plasma drug concentrations and demographic covariates
Data that were excluded (n = 62 samples) from the model were as follows One sample from an apparent poor metabolizer Two samples collected gt 96 hours post dose From 307B 10 trough samples lt LOQ From 307A 17 samples lt LOQ Thirty-samples from serial data that were lt LOQ or whole blood samples Model and Model Selection
Base Model
41110 Pharmacokinetic Model description The base PK model was a standard two compartment model that incorporated lag time and flip-flop kinetics The key features of the model were flip-flop was insured by making the value of ke gt ka in the clearance equation Additionally lag time was restricted to a value of 2 hours or less and concentrations were log transformed consequently all concentrations (F) = 0 were given individual predicted concentrations of zero Finally there were two residual error terms one for serial samples and the other for trough samples DCP1PM Page 73 10182006
Clinical Pharmacology Review NDA 19-962 Toprol-XL 10182006
Key equations were as follows
KA = THETA(1)EXP(ETA(1)) V2 = THETA(2)EXP(ETA(2)) CL = (THETA(1)THETA(2)+THETA(3))EXP(ETA(3)) Q = THETA(4)EXP(ETA(4)) V3 = THETA(5)EXP(ETA(5)) ALAG1=THETA(6)EXP(ETA(6))
41111 PK Parameter estimation results Table 1 Summary of PK parameters in the metoprolol population PK base model (per applicant)
41112 Goodness of fit The applicant provided the following goodness-of-fit plots (Figure 1)
Reviewer Note The goodness-of-fit plots were reproduced by this Reviewer (see Appendix) with minor modifications
Figure 1 Goodness of fit plots for Base Model
DCP1PM Page 74 10182006
Clinical Pharmacology Review NDA 19-962 Toprol-XL 10182006
Base PK Model Selection The MOF values of all structural model candidates tested are presented in Table 2 Model selection was based primarily on MOF values the lower MOF the better the model The applicant reports that in general MOF values generated by a conventional absorption model (ie absorption rate is faster than elimination rate) and a flip-flop absorption model (ie absorption rate is slower than elimination rate) were identical
Reviewer Comment The existence of flip-flop kinetics appears plausible based on data provided and general patterns for sustained release formulations Consequently the use of flip-flop kinetics for the bulk of the modeling exercise appears reasonable
General conclusions from the information in Table 2 are First order input is better than zero order input Two compartment model is better than one compartment model Lag time presence is better than lack of lag time Two residual error terms are better than one residual error term It should also be noted that several other models led to unsatisfactory completion of the run and were not considered further
DCP1PM Page 75 10182006
Clinical Pharmacology Review NDA 19-962 Toprol-XL 10182006
Table 2 Comparison of Structural PK Models
Reviewer Comment The selected structural model appears appropriate based on the data
Base Model The deletion of ETA for V2 did not change the MOF value suggesting that ETA for V2 should be deleted to avoid an over-parameterized warning (Table 3) This was consistent with the estimated parameter value of ETA for V2 being 648 x 10ndash9 a very small value Therefore the base model was selected by deleting the ETA for V2 from the structural model
Reviewer Comment on Eta deletion for V2 Deletion of eta for V2 is acceptable based on the empirical data however from a physiological perspective deletion of eta is problematic Generally one anticipates inter-individual differences in volume of distribution In this case it appears that the error associated with V2 may have been randomly shifted to V3 and or Q terms as the three DCP1PM Page 76 10182006
Clinical Pharmacology Review NDA 19-962 Toprol-XL 10182006
terms are interrelated This potential shift in error is supported by the fact that the V2 eta value increases significantly (by several orders of magnitude- 10-5 vs 100) when eta for Q and or V3 is fixed However when Q or V3 are fixed minimization is successful but Q and V3 are not accurately estimated Accounting for the possible error shift is a complex process and goes beyond the scope of this reviewer thus deletion of eta associated with V2 was considered acceptable for the remainder of the modeling evaluation
Table 3 Structural elements tested in the metoprolol population PK structural model (p lt 0005)
Final PK Model
41113 Model description The key feature of the final model is the inclusion of the covariate effects of age on Q and weight on CL in the population PK model
Key Equations CL = (THETA(1)THETA(2)+THETA(3)+EWT)EXP(ETA(2)) Q = THETA(4)EAGEEXP(ETA(3))
Including Covariate Effects As previously described covariate effects were assessed by forward addition and backward deletion Most covariates did not significantly change MOF however BSA significantly affected CL and Age affected Q Consequently these covariates were included in the penultimate final model
DCP1PM Page 77 10182006
Clinical Pharmacology Review NDA 19-962 Toprol-XL 10182006
Reviewer Note BSA is derived form WT and HT covariates implying BSA is highly correlated to these two covariates (Figure 2) weight is the most suitable (practical covariate) as it is readily measured Furthermore weight and BSA produced the same MOF (Table 4) whereas MOF with height was more positive (less significant)
Figure 2 Plot of BSA vs Body Weight
The data in Table 4 support selection of the final model
Table 4 Covariate elements tested in the metoprolol population PK penultimate final model (plt0005)
The applicant acknowledges that mechanism(s) accounting for the impact of age on QF are not clear However since distribution clearance has little effect on metoprolol plasma exposure further investigation is not needed
41114 PK Parameter estimation results As shown in Table 5 PK parameters were estimated fairly precisely by the final model
Table 5 PK Parameter Estimates using Final Model
DCP1PM Page 78 10182006
Clinical Pharmacology Review NDA 19-962 Toprol-XL 10182006
41115 Goodness of fit The goodness-of-fit plots provided by the applicant show good precision Figure 5 Goodness of fit plots for final PK model
DCP1PM Page 79 10182006
Clinical Pharmacology Review NDA 19-962 Toprol-XL 10182006
PK Model Qualification The post hoc Bayesian-estimated AUC (simulated) obtained for the 27 patients with serial plasma samples are plotted against the observed (AUCt) The correlation was high (R2 gt 099) Figure 6 AUClast from observed data versus AUCt from model simulation in the 27 patients providing serial plasma samples
Regression line Y= 4514 + 08976 X R2 = 09957
The graphical validation of the final metoprolol population PK model validation against covariates evaluated is presented in Figure 6
Figure 7 Graphical validation of covariates
DCP1PM Page 80 10182006
Clinical Pharmacology Review NDA 19-962 Toprol-XL 10182006
There was no systematic bias in weighted residuals for any covariates evaluated suggesting that the final model included all appreciable effects of available covariates (Figure)
The effects of weight on metoprolol CLF are illustrated in Figure 8 where Bayesian post hoc estimates of CLF are plotted against weight and overlaid by the model-predicted line Overall the model appeared to fit the data well
Figure 8 Plot of CLF vs Body weight
The effects of AGE on metoprolol QF are illustrated in Figure 9 where Bayesian post hoc estimates of QF are plotted against AGE and overlaid by the model-predicted line Figure 9 Plot of QF vs Age
DCP1PM Page 81 10182006
Clinical Pharmacology Review NDA 19-962 Toprol-XL 10182006
Reviewer Note The applicant indicated that attempts to run the final model using the first-order conditional estimation method resulted in termination errors Therefore the parameter estimates obtained by the FO method were reported as the final parameter estimates
Conclusion Regarding Population PK Modeling Overall the sponsorrsquos population PK modeling is acceptable
PKPD Model and Model Selection
PKPD Base Model PharmacokineticPharmacodynamic Model description The key feature of the model was a lack of random variance term for the slope (since only single data points were available per subject) and inclusion of baseline effect
Key equations were as follows E0 = THETA(1)EXP(ETA(1)) M = THETA(2) Y = E0 + MLOG(AUC) + EPS(1)
The control stream provided in the appendix is that for DBP (provided by sponsor) The control stream for SBP is comparable with appropriate substitution for BP type
It should be noted that only the log-linear and linear PKPD models were considered suitable for AUC and Cmax For this review only AUC estimates were considered reliable as Cmax estimates could not be accurately determined based on the sampling scheme Consequently the remainder of this review focuses on AUC information although Ctrough and Cmax data are displayed for reference
Bayesian estimates from PK modeling are summarized in Table 1
Table 1 Bayesian estimates of metoprolol PK exposure for those patients included in the PKPD analysis (N=65)
DCP1PM Page 82 10182006
Clinical Pharmacology Review NDA 19-962 Toprol-XL 10182006
PKPD Model Selection (initial and final) The log-linear model was adopted as the base model for this PKPD relationship since it improved the MOF significantly (Table 2) The ETA parameter for the slope was pre-eliminated for the purpose of model parsimony The intercept and slope in this log-linear model for AUC(0-24) did not bear ETA parameter therefore no covariates had impact on either parameter in the model
Reviewer Note The intercept should not have borne an eta term because individual subjects provided only one data point Consequently fixing eta to zero or deleting eta in the final model is appropriate No further model development was required after eta was eliminated and the base model was equivalent to the final model
Table 2 Base population PKPD models tested for the change in SBP
41116 PKPD Parameter estimation results The final PKPD parameter estimates are presented in Table 3
Table 3 Summary parameters in the final PKPD model for the change in SBP using trough plasma level Parameter Explanation Estimate SE ()b
DCP1PM Page 83 10182006
Clinical Pharmacology Review NDA 19-962 Toprol-XL 10182006
Model Qualification Based on the relatively low R2 value and as shown in Figure there is a poor correlation between change in SBP and log AUC
Figure 1 Relationship between change in SBP and AUC (line generated from modeling)
Overall goodness-of-fit of the model was considered to be poor probably due to the high variability in the measurements Consequently the precision of the model parameter estimates was not considered to be very reliable These parameters have little clinical usefulness and can be treated only as an indication of trends ie more hemodynamic effects can be potentially achieved when high Toprol-XL doses are given Clinical dose adjustment based on these PKPD parameters is not recommended
Reviewerrsquos Supplemental Analyses A supplemental PKPD analyses was conducted using simple linear regression since the population model did not improve the fit Overall eta made an insignificant contribution to the overall model The results of the analyses were similar to the population analyses A series of regression analyses were conducted and are presented in Table 4
The applicant notes that the preliminary modeling exercise found that there was no difference in the PKPD modeling results using different hemodynamic data formats (ie change in the measurements percent change in the measurements or actual BP measurements) This finding was confirmed by this reviewer (see Table 4)
DCP1PM Page 84 10182006
Clinical Pharmacology Review NDA 19-962 Toprol-XL 10182006
Table 4 Supplemental PKPD Regression Analyses Conducted by Reviewer Model (liner regression) Intercept (I) Slope (m) R2 Probability RSBP = mISBP + I 3957 -035 01626 0009 PSBP = mISBP + I 2524 -023 01252 00038 PSBP = mRSBP + I 0005 074 09891 lt 00001 RSBP = mlogAUC + I 651 -221 0060 00493 RSBP = mDose + I -751 0006 00026 06878 RSBP = mDose^ + I -312 -111 004 02711 RSBP = mlogAUC + nISBP + I 5303 -221 (m)
-035 (n) 02230 0001
RSBPplc = mAUC + I -667 -0003 00458 00871 RSBPplc = mlogAUC + I 461 -2208 00600 00493 RPUL = mlogAUC + I 1868 -405 01102 00069 Symbols in table similar to population PK model without eta term RSBP- change of SBP without placebo correction ISBP- initial (baseline) SBP RPUL- change in HR without placebo correction Dose- in mg where placebo is included as 0 mg PSBP- percentage change of SBP without placebo correction
Conclusion Regarding Population PKPD Modeling Overall the sponsorrsquos population PKPD modeling is acceptable No dose adjustment conclusion can be made from this modeling however an exposure-response relationship was established for AUC and reduction in SBP
Discussion
The significance of the results 1 Provide estimates of PK measures and plasma exposure in pediatric population These data can be compared to adult exposure to determine if exposure differences impact drug effectiveness The main challenge in comparing pediatric data to adult data is different modeling schemes formulations and methods were used in the two populations
2 PKPD findings are not sufficiently precise to provide a dose adjustment algorithm however the PKPD analyses provides rationale for proposed titration as increasing exposure (doses) may improve efficacy (reduction in SBP) Ultimately the risk-benefit analyses overrides PKPD assessment for dose adjustment drug will be titrated thus reliance on PKPD information is not critical The proposed dose 10 mgkg appears suitable based on available information It is unclear from the studies if there should be an initial maximum dose although the sponsor has proposed 50 mg as the maximum initial dose The proposed pediatric starting dose on a mgkg basis is within the range of starting adult doses (25 ndash 100 mg) assuming an adult weighs 70 kg
3 Cumulative information form dose-response study indicates that Toprol XL has effectiveness in children however the most effective dose is unclear Since the drug can be titrated determining the initial optimal dose does not appear critical As proposed by the applicant dosing is started at a ldquolowrdquo dose that can be up-titrated if needed
DCP1PM Page 85 10182006
Clinical Pharmacology Review NDA 19-962 Toprol-XL 10182006
4 The results did not adequately address the potential impact of CYP2D6 metabolic status for pediatric patients taking Toprol XL There were an insufficient number of patients to make this assessment
5 Covariate effects do not appear significant only body weight significantly affects clearance However a worst case scenario can occur with a person that has a low body weight and is a poor metabolizer this will result in very high possibly supra-therapeutic exposure Age does not impact apparent oral clearance so an age-dependent dose adjustment is not needed for children over 6 years old In essence all children over six years old can initiate therapy at 10 mgkg
The validity of the results Overall the results produced by the sponsor appear valid and the sponsor used a sound modeling approach However alternative approaches that could have been adopted may have improved the outcome of the analyses Three of these approaches are presented below 1 Additional PK samples should have been collected during the absorption phase and
throughout the dosing interval to improve the modelrsquos performance Specifically additional samples collected during the absorption phase may have unambiguously identified the actual absorption input function (eg first order zero order mixed first and zero order) First order input was selected for the analyses although the dosage form is reported to exhibit zero order kinetics in adults It is possible that the input rate in children differs from that in adults but unlikely It should be noted that absorption kinetics in children is often erratic due to multiple factors (eg regioshyselective absorption incomplete gastric emptying and inconsistent absorption) so it is unclear if additional samples would have definitively identified the absorption function However additional non-trough samples may have helped in estimating key PK measures such as V and Cmax The final model did not have an eta associated with V which is atypical Collection of additional samples on different visits may have helped estimate potential inter-occasion variability It should be noted that AUC was estimated precisely for subjects providing serial samples but these subjects were not necessarily included in the PKPD analyses Ideally the PKPD modeling should have been conducted primarily in subjects who had accurate PK measures
2 The PKPD design could have been modified to potentially improve the utility of the analyses Specifically there should have been better placebo matching procedures to minimize the potential impact of the placebo effect This matching could have been improved by ensuring all patients on placebo had the same titration schedule and number of tablets It is noted that the model had a poor predictive performance that was mainly attributed to the high degree of variability in the PD measures Potentially other PD markers could have been explored that have less inherent variability One such marker is the degree of beta blockade using exercise heart rate (EHR) reduction this marker has been used extensively for metoprolol in adult subjects However use of EHR in the pediatric setting may be challenging
DCP1PM Page 86 10182006
Clinical Pharmacology Review NDA 19-962 Toprol-XL 10182006
Comments to sponsor
In future pharmacometric studies you should consider the following 1 collect sufficient (multiple) samples from individual subjects to allow assessment
of inter-occasion variability and estimation of inter-individual variability (eta) for all relevant parameters
2 placebo groups should be identically matched across all dose groups (eg same titration schedule and number tablets) to minimize potential bias or differences in the placebo effect
Comments to medical reviewer
1 The sponsor has adequately characterized metoprolol PK in the studied pediatric population The PK characterization could have been further optimized by obtaining additional samples over the entire dosing interval (eg during the absorption phase and elimination phase) on multiple occasions rather than on one occasion primarily at trough
2 A dose-response relationship could not be established using the protocol specified analysis approach The outcome of the dose-response relationship appeared highly dependent on the ldquoplacebo effectrdquo suggesting that the placebo group may not have been appropriate One should consider re-evaluating the dose-response precisely matched placebo groups (eg all placebo patients have identical number of tablets and titration schedule)
3 Based on the PKPD analysis plasma exposure (AUC) explains lt 10 of the response (reduction in systolic blood pressure) thus has limited clinical utility However the PKPD relationship suggests that there is a trend for increased response with increased exposure (dose driven)
4 Overall information from the dose-response study suggests that Toprol- XL is effective in the pediatric population The optimal initial dose 02 10 or 20 mgkg or the maximum safe and effective dose cannot be determined from the information provided It is noted that the 02 mgkg dose is unlikely to be effective as plasma concentrations achieved at this dose are unlikely to be effective (most concentrations lt LOQ and lower than effective adult concentrations) The 10 mgkg (proposed by applicant) appears to be a reasonable initial dose The labeling should reflect the regimens studied
DCP1PM Page 89 10182006
Clinical Pharmacology Review NDA 19-962 Toprol-XL 10182006
Appendix
DCP1PM Page 90 10182006
Clinical Pharmacology Review NDA 19-962 Toprol-XL 10182006
DCP1PM Page 91 10182006
Clinical Pharmacology Review NDA 19-962 Toprol-XL 10182006
DCP1PM Page 92 10182006
Clinical Pharmacology Review NDA 19-962 Toprol-XL 10182006
DCP1PM Page 93 10182006
Clinical Pharmacology Review NDA 19-962 Toprol-XL 10182006
DCP1PM Page 94 10182006
Clinical Pharmacology Review NDA 19-962 Toprol-XL 10182006
DCP1PM Page 95 10182006
Clinical Pharmacology Review NDA 19-962 Toprol-XL 10182006
Table 15 Control streams for final log-linear PKPD model for the change in DBP using metoprolol Cmax as the measure of exposure
Truncated NONMEM reports for base model identification for PKPD relationship in change of SBP (per sponsor)
DCP1PM Page 96 10182006
Clinical Pharmacology Review NDA 19-962 Toprol-XL 10182006
Reported PD information^
^ Under metoprolol regimen CRZ0K is Toprol XL
DCP1PM Page 97 10182006
Clinical Pharmacology Review NDA 19-962 Toprol-XL 10182006
Table Results of randomised double-blind comparative trials evaluating antihypertensive efficacy of metoprolol formulations or other antihypertensives
DCP1PM Page 98 10182006
---------------------------------------------------------------------------------------------------------------------
---------------------------------------------------------------------------------------------------------------------
---------------------
This is a representation of an electronic record that was signed electronically and this page is the manifestation of the electronic signature
s
Robert Kumi 10182006 045635 PM BIOPHARMACEUTICS
Patrick Marroum 10192006 050811 PM BIOPHARMACEUTICS
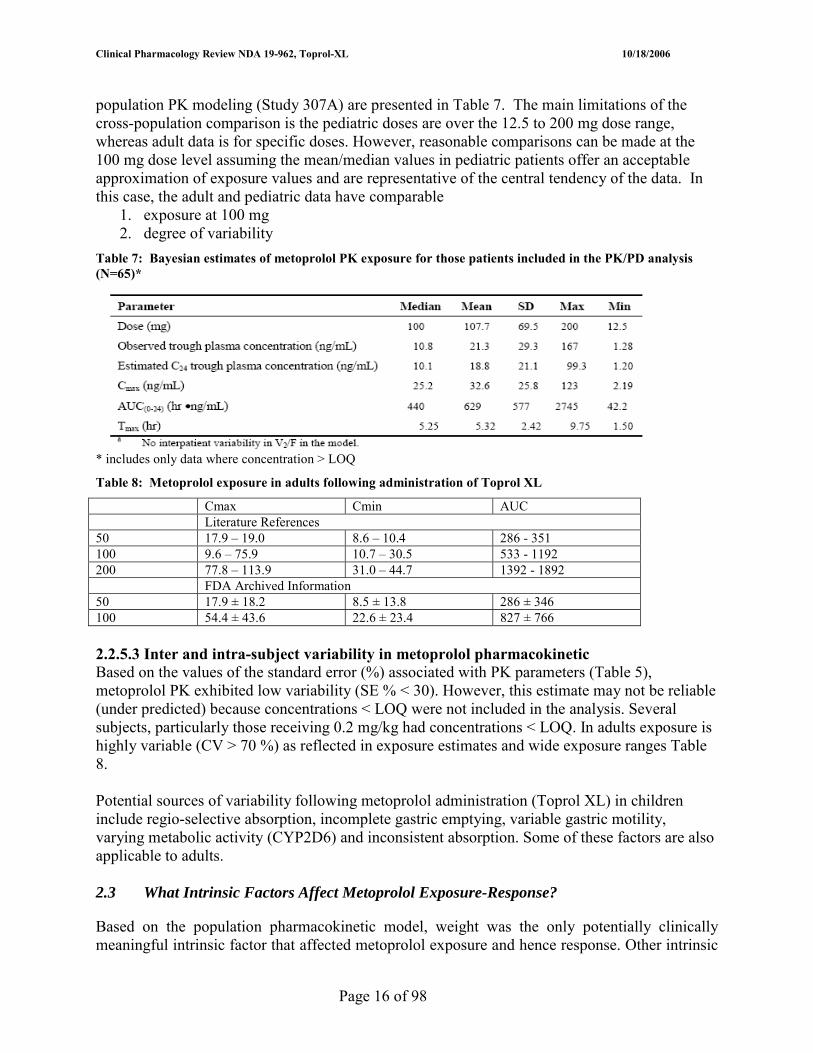
Clinical Pharmacology Review NDA 19-962 Toprol-XL 10182006
population PK modeling (Study 307A) are presented in Table 7 The main limitations of the cross-population comparison is the pediatric doses are over the 125 to 200 mg dose range whereas adult data is for specific doses However reasonable comparisons can be made at the 100 mg dose level assuming the meanmedian values in pediatric patients offer an acceptable approximation of exposure values and are representative of the central tendency of the data In this case the adult and pediatric data have comparable
1 exposure at 100 mg 2 degree of variability
Table 7 Bayesian estimates of metoprolol PK exposure for those patients included in the PKPD analysis (N=65)
includes only data where concentration gt LOQ
Table 8 Metoprolol exposure in adults following administration of Toprol XL
Cmax Cmin AUC Literature References 50 179 ndash 190 86 ndash 104 286 - 351 100 96 ndash 759 107 ndash 305 533 - 1192 200 778 ndash 1139 310 ndash 447 1392 - 1892 FDA Archived Information 50 179 plusmn 182 85 plusmn 138 286 plusmn 346 100 544 plusmn 436 226 plusmn 234 827 plusmn 766
2253 Inter and intra-subject variability in metoprolol pharmacokinetic Based on the values of the standard error () associated with PK parameters (Table 5) metoprolol PK exhibited low variability (SE lt 30) However this estimate may not be reliable (under predicted) because concentrations lt LOQ were not included in the analysis Several subjects particularly those receiving 02 mgkg had concentrations lt LOQ In adults exposure is highly variable (CV gt 70 ) as reflected in exposure estimates and wide exposure ranges Table 8
Potential sources of variability following metoprolol administration (Toprol XL) in children include regio-selective absorption incomplete gastric emptying variable gastric motility varying metabolic activity (CYP2D6) and inconsistent absorption Some of these factors are also applicable to adults
23 What Intrinsic Factors Affect Metoprolol Exposure-Response
Based on the population pharmacokinetic model weight was the only potentially clinically meaningful intrinsic factor that affected metoprolol exposure and hence response Other intrinsic
Page 16 of 98
Clinical Pharmacology Review NDA 19-962 Toprol-XL 10182006
factors such as age height gender race and sex did not affect metoprolol exposure
231 Effect of weight The effect of weight on metoprolol CLF are illustrated in Figure 7 Figure 7 Variation of CLF with weight obtained in population PK analysis
CLF increased linearly with body weight relative to a 70 kg individual the CL of a 22 kg individual is 30 lower This decreased CL will result in an increased exposure (maximum 30 ) that does not pose additional safety concerns or appear clinically significant (tolerated in studies) It should be noted that exposure (AUC) accounted for an insignificant portion of the hemodynamic effect (poor correlation) thus the clinical implications of the impact of body weight on CLF of metoprolol identified in the population PK modeling are limited Consequently dose adjustment is not required based on body weight Furthermore the maximum initial dose is 50 mg thus subjects with weight gt 50 kg will receive a maximum dose of 50 mg diminishing the impact if any of weight-dependent clearance
232 Effect of Age The effect of age on QF the inter-compartmental clearance is illustrated in Figure 8 Figure 8 Variation of QF with age obtained in population PK analysis
Page 17 of 98
Clinical Pharmacology Review NDA 19-962 Toprol-XL 10182006
QF does not contribute significantly to overall clearance therefore the reported finding does not appear clinically relevant It should be noted that the observed QF-age relationship is atypical
233 Effect of intrinsic factors on exposure-response pediatrics vs adults As mentioned previously the only evaluated intrinsic factor that affected metoprolol exposure was body weight In adults age and gender effects have been reported although there are conflicting reports on the age effect The exposure in adult and pediatric population are both potentially affected by the CYP2D6 metabolizing status of the subject Metoprolol is metabolized primarily in the liver by CYP2D6 The scientific literature reports several instances in adults of varying metoprolol exposure by poor and extensive CYP 2D6 metabolizers In the pediatric studies (307A and 307B) there was one suspected poor metabolizer (Trough concentration was 2330 ngmL) but the metabolic status (PM or EM) of this individual was not confirmed
24 What extrinsic factors affect metoprolol exposure-response
The role of extrinsic factors were not specifically evaluated in the pediatric population however one anticipates that extrinsic factors that affect adults should be applicable to children
25 What analytical method was used in pediatric studies 307 A and 307B
Please refer to section 223
Page 18 of 98
Clinical Pharmacology Review NDA 19-962 Toprol-XL 10182006
(b) (4)
TOPROL-XL is not recommended in pediatric patients lt 6 years of age (see CLINICAL PHARMACOLOGY Pharmacokinetics and PRECAUTIONS Pediatric Use)
Page 21 of 98
Clinical Pharmacology Review NDA 19-962 Toprol-XL 10182006
4 APPENDICES
41 Sponsorrsquos Proposed Label
17 Page(s) of Draft Labeling has been Withheld in Full as B4 (CCITS) immediately following this page
Page 22 of 98
Clinical Pharmacology Review NDA 19-962 Toprol-XL 10182006
42 Pharmacometrics Review
Page 40 of 98
Clinical Pharmacology Review NDA 19-962 Toprol-XL 10182006
Office of Clinical Pharmacology Pharmacometrics Review
NDAIND 19-962 Volume Not applicable submitted electronically POP PK Report in Section 5335 (Network Path Cdsesub1n19962N_0002006-05-15hpbiohupharm) Compound Metoprolol succinate Submission Dates 05152006 Sponsor Astra Zeneca Pharmacometrics Reviewer Robert Kumi PhD Secondary Reviewer Yaning Wang PhD
TABLE OF CONTENTS
OFICE OF CLINICAL PHARMACOLOGY PHARMACOMETRICS REVIEW 41
EXECUTIVE SUMMARY 42
OVERALL CONCLUSIONS 43
INTRODUCTION 46
OBJECTIVES OF THE ANALYSIS 48
DOSE-RESPONSE ANALYSIS 49
METHODS (POPULATION PKPD) 60
RESULTS AND DISCUSSION 73
RECOMMENDATIONS 87
APPENDIX 90
DCP1PM Page 41 10182006
Clinical Pharmacology Review NDA 19-962 Toprol-XL 10182006
Executive Summary In NDA SE5 033 the applicant Astra Zeneca has proposed changes to the currently approved labeling for TOPROL-XL metoprolol succinate extended release
(b) (4)
tablets Metoprolol a beta blocker is approved for hypertension angina and heart failure in adults In adults with hypertension the usual initial dosage is 25 to 100 mg daily (single dose) as monotherapy or in combination with a diuretic this dosage is titrated at weekly intervals until optimum blood pressure reduction is achieved The current application focuses on Toprol-XL use in pediatric patients ge six years old The initial proposed dosing in children six and older is 10 mgkg subsequently the dose is titrated based on clinical response
Two clinical trials Studies 307A (dose-response) and 307B (safety extension of 307A) were conducted in pediatric patients with hypertension to support the proposed labeling changes The applicant conducted dose-response population PK (n = 120 patients) and PKPD (n = 65 patients) analyses using data from pediatric hypertensive patients receiving Toprol-XL in the mentioned studies
Key Findings from the Dose-Response and Population PKPD analyses follow 1 Dose-Response A statistically significant dose-response did not exist for placebo
(pooled)ndashcorrected ∆SBP from baseline however the relationship was evident when placebo (specific-group) ndashcorrected data were used
2 PK Model Metoprolol PK in children were well characterized by a 2shycompartment model with flip-flop first-order absorption and an absorption lag time The model yielded precise parameter estimates
3 Covariates Sex age race body weight and Toprol-XL dose had no clinically significant effect on metoprolol PK
4 PKPD Model Using a log-linear model or linear model there were weak but statistically significant relationships between the changes in DBP and SBP and measures of metoprolol plasma exposure (Ctrough AUC0ndash24 and Cmax) Overall parameters were not precisely estimated in most models due to a high degree of variability in the blood pressure data
DCP1PM Page 42 10182006
Clinical Pharmacology Review NDA 19-962 Toprol-XL 10182006
Overall Conclusions 1 Were metoprolol PK adequately characterized in the pediatric population Metoprolol PK in pediatric patients (n = 120 Age 6 to 17) were adequately characterized using a population pharmacokinetic approach The population model was validated and qualified and comprised a 2-compartment open model with first order absorption and absorption lag time
2 Are there any covariates that influence metoprolol PK in pediatric patients with hypertension The two covariates that influenced metoprolol PK were weight and age apparent oral clearance increased linearly with body weight and inter-compartmental clearance increased with age according to a power function Other covariates including race sex and metoprolol dose did not impact metoprolol kinetics
3 Was a PKPD relationship established between metoprolol dose or plasma exposure( AUC Ctrough or Cmax) and hemodynamic measures (blood pressure) Using a simple linear regression model no dose-response (reduction in placebo corrected systolic blood pressure the primary outcome variable) was observed although a weak (R2 lt 01) but statistically significant (p lt 005) PKPD relationship was observed between metoprolol exposure measures and reduction in systolic blood pressure The small R2 value indicates metoprolol exposure could account for only a small portion of the hemodynamic effect According to the model as exposure increased there was greater reduction in blood pressure However only the relationship with AUC was considered reliable as AUC was estimated with good precision (PK modeling) whereas Cmax was not
4 Is there sufficient evidence to support effectiveness of Toprol XL in pediatrics and the initial proposed pediatric dosage Yes Although dose-response was not established with SBP reduction (primary variable) suggesting that the effectiveness of the individual tested Toprol-XL doses could not be differentiated the following information provides evidence to suggest that some Toprol-XL doses were more effective than placebo
bull Analysis of treatment group effects and pairwise comparisons suggested that overall Toprol-XL demonstrated effectiveness in pediatric patients with hypertension pooled Toprol groups vs placebo (p = 00351) and relative to baseline each active Toprol-XL dose group decreased SBP whereas placebo did not
bull There was a dose-response relationship for reduction in diastolic blood pressure typically systolic and diastolic blood pressure effects mirror each other
bull PKPD findings (reduction in SBP and heart rate as a function of AUC) support metoprolol effectiveness (increased exposure led to increased effectiveness) The heart rate effect supports metoprololrsquos known beta blocking activity
bull Generally Toprol-XL was effective in pediatric patients and adult patients at similar metoprolol exposure levels 02 mgkg in pediatrics was minimally effective because this dose yielded exposures lower than that obtained in adults at the lowest effect adult dose 25 mg
DCP1PM Page 43 10182006
Clinical Pharmacology Review NDA 19-962 Toprol-XL 10182006
bull The proposed pediatric dosage 10 mgkg is supported by the results from the dose-response study Visual inspection and pairwise comparisons indicated that 10 mgkg (placebo corrected) was statistically the most effective dose (greater efficacy than 02 mgkg and 20 mgkg) and was more effective than placebo (p = 0027)
5 Will initial dosage adjustment be required for any pediatric patients prior to titration No dosage adjustment does not appear necessary prior to titration (typically one week after treatment begins) Based on the population PK model the only potentially relevant factor that could affect PK was body weight CLF increased linearly with body weight relative to a 70 kg individual the CL of a 22 kg individual is 30 lower This decreased CL will result in an increased exposure (maximum 30 ) that does not pose additional safety concerns or appear clinically significant (tolerated in studies) The proposed starting dose 10 mgkg and doses up to 20 mgkg (maximum 200 mg) were tolerated in the clinical trials (307A and 307B) Furthermore exposure accounted for an insignificant portion of the hemodynamic effect (poor correlation) thus the clinical implications of the impact of body weight on CLF of metoprolol identified in the population PK modeling are limited
to a higher and tolerable dose until optimum BP reduction is achieved is reasonable This
(b) (4)The proposal to start Toprol-XL at a low dose and titrate
is consistent with labeling for adults
6 Was the PKPD relationship influenced by covariates Insufficient data were available to make this assessment
7 Are the PK and PKPD of metoprolol in children comparable to that in adults PK values obtained in pediatric patients were generally in the same range as those reported in adults Potential limitations of the comparison are the different modeling approaches populations number of samples and number of subjects in the trials (Table B)
It is difficult to make definitive PKPD comparisons between the pediatric (studied in this NDA) and adult population because
1 Study conditions differ- typically in adult studies HR is measured during exercise and not at rest
2 Results are obtained in healthy adult subjects rather than hypertensive patients 3 Insufficient number of studies have been reported in the literature that attempt to
identify the relationship between metoprolol exposure and SBP or DBP effect in adults
DCP1PM Page 44 10182006
Clinical Pharmacology Review NDA 19-962 Toprol-XL 10182006
Table B PK Comparisons (Pediatrics vs Adults) Source NDA 19962 Luzier et al Taguchi et al Plosker and Cissold
and other sources Model 2 Comp 1st
Order absorption 1 Comp
Formulation Toprol XL IR IR PK Analyses Population StandardNCA Population Standard Population Pediatric Healthy adults Japanese geriatric Sampling Intense and
Ctrough Intensive Sparse intensive
CLF (Lhrkg) 338 116 ndash 340 094 V2F (Lkg) 128 270 ndash 398 452 V3F 851 333 ndash 809 QF (Lhr) 899 282 ndash 694 Ka (h-1) 00467 Tlag (h) 0853 T12 (h) 351 3 - 6 Tmax (h) 25 ndash 73 Covariate Effects on CLF Age None Yes YesNo Gender Effect None Yes Race None The applicant noted that pediatric data were compared to adult data from IR where CLF is dominated by the disposition function of metoprolol therefore it may be complicated to compare adult data to pediatric data (Toprol XL) where CLF is under a considerable influence from the release rate (input function) of the device This appears to be a valid caveat
It should be noted that the cause of hypertension in adults differs from that in children Results of the pediatric modeling exercise showed that a log-linear model appeared to work better than other models for both SBP and DBP In adults the Sigmoidal Emax model has been successfully applied Using the Hill Equation (Sigmoidal Emax model) with EHR reduction (measure of beta blockade) as the PD marker in adults EC50 = 105 nmolL (281 ngmL) and Emax is achieved at metoprolol plasma concentrations gt 400 nmolL (107 ngmL) Placebo-corrected mean blood pressure changes (standing) associated with concentrations producing maximal blockade are -10 for systolic and ndash 4 for diastolic In the pediatric study the observed maximal mean reductions (placebo corrected) at the studied doses were approximately -6 for systolic and -5 for diastolic Hence it appears the studied pediatric doses produce comparable changes in diastolic pressure but lower changes in systolic pressure It should be noted that in the pediatric studies only a few metoprolol plasma concentrations were gt than 107 ngmL It is unlikely that the maximal activity was achieved at the doses studied yet the Toprol doses appeared effective The differential maximal effects may also be due to the difference in initial SBP (adults patients with hypertension tend to have higher initial BPs) in adult and pediatric studies there was a dependence of change in SBP on initial SBP
DCP1PM Page 45 10182006
Clinical Pharmacology Review NDA 19-962 Toprol-XL 10182006
Introduction Summary
(b) (4)NDA SE5 033 was submitted to seek approval of labeling changes to the currently approved labeling for TOPROL-XL This labeling translates to a new Toprol-XL indication for pediatric patients (6 years and older) with hypertension
Background on Metoprolol in Hypertension The majority of the following information was obtained form a Review article (sponsor provided) by Plosker and Clissold [Drugs 43(3) 382-414 1992)]
Table 1 Snapshot of Metoprolol Clinical Pharmacology and Biopharmaceutics Drug Class Metoprolol is a szlig1-selective (cardio selective) adrenergic receptor-
blocking agent Mechanism of Action (antihypertensive effect)
Multiple putative mechanisms competitive antagonism of catecholamine at peripheral sites reduction of sympathetic outflow to the periphery or suppression of renin activity
Approved Indications Hypertension Heart Failure and Angina Pectoris Approved Formulations Immediate Release (IR) ndash metoprolol tartrate
Controlled Release (CRZ0K) Toprol-XL is extended-release tablet of metoprolol as the succinate salt
Metabolism Via CYP2D6 primarily Absorption Absolute oral bioavailability ~ 50 following IR Food does not affect
metoprolol absorption using ER formulation Distribution Protein binding to albumin is about 12 Elimination For IR t12 from 3 ndash 7 hours Less than 5 dose excreted unchanged
in urine No t12 values for ER this may be due to difficulty in separating absorption and elimination phases
Variability Plasma levels are highly variable among subjects after oral administration
Age Effects PK of metoprolol not affected by age (20 to 65 years) but concentration of active metabolite in subjects gt 65 years about twice as high as those in younger although metoprolol concentrations similar in two groups (Regardh et al)
PKPD in children Limited information in children and provided mainly after administration of metoprolol tartrate
Summarized PK and PKPD Information in Adults Table 2 Reported PK Values in Adults (multiple references)
References include Abrahamsson et al Sandberg et al Wieselgren et al
DCP1PM Page 46 10182006
Clinical Pharmacology Review NDA 19-962 Toprol-XL 10182006
Table 3 PKPD Information Reference Key Findings Abrahamsson et al Therapeutic level of szlig1blockade (model- reduction in exercise heart
rate or EHR) is between 80 and 300 nM Sandberg et al Toprol XL is designed to deliver metoprolol succinate at a near
constant rate for about 20 hr Wieselgren et al In healthy males maximal EHR ~ 14 and minimum reduction ~ 9
with 50 mg Activity greater than placebo over 24 hour period Dayer et al Lennard et al Jonkers et al
Poor metabolizers have a higher plasma concentration and a greater duration or degree of beta blockade Potential implications for use of extended release as may not be needed in PMs
Various sources Toprol XL produces clinically and statistically significant reductions in blood pressure values compared to baseline values The maximal blood pressure lowering effect for a given dose in adults is observed between 1 and 4 weeks of treatment In 4 week trials with Toprol XL the maximum decrease in supine BP was 209 and standing was 129 (unclear if at trough) At trough following 4 weeks of 50 mg QD Toprol XL relative to placebo the reduction in supine BP was 112 and 103 in Standing
Summary of sponsorrsquos current analysis relevant to pharmacometrics and resulting claims
Dose-Response Analysis A dose-response analysis was conducted using a simple linear regression model where metoprolol dose in mgkg was the independent variable Week 4 placebo corrected change in blood pressure (diastolic or systolic) from baseline was the dependent variable (response)
Sponsorrsquos Analysis Claims (Dose-Response Study) Following administration of TOPROL-XL at doses of 125 to 200 mg once daily for up to 4 weeks metoprolol
bull Exhibited a significant dose-response relationship for DBP but none for SBP bull Produced statistically significant and clinically meaningful reductions in SBP and
DBP for some individual andor pooled target dose groups (02 10 and 20 mgkg)
Population PK and PKPD Analyses The sponsorrsquos population PK and PKPD analyses involved the use of typical population PK approaches Primarily SAS and NONMEM were used to run the analyses In brief the sponsor pooled plasma concentration time data from patients in Study 307A (trough samples) and 307B (trough samples in most subjects and serial samples in a subset of patients) for the PK modeling PKPD (PD measured primarily as changes in blood pressure) data were from patients in Study 307A These collective data were used in the population PK and PKPD analyses
Initially the sponsor identified the best PK structural population model by testing several pharmacokinetic models This model was further refined by eliminating error terms (etas) that were not statistically significant Subsequently the sponsor evaluated the effect of DCP1PM Page 47 10182006
Clinical Pharmacology Review NDA 19-962 Toprol-XL 10182006
covariates on the PK model and developed a final PK model The goodness of the fit of the model was assessed with standard procedures The final population model was used to simulate individual plasma concentration-time profiles and Bayesian estimates for Cmax and AUC for all patients These simulated AUC and Cmax values and actual (observed) Ctrough were used in the PKPD model The PKPD model was developed in a similar manner as the population PK model Initially the best PKPD base model was identified and the model refined until a final PKPD model was identified
Sponsorrsquos Analysis Claims (Population PK and PD Modeling) 1 A 2-compartment PK model with first-order elimination and flip-flop first-order
absorption and lag time best fit metoprolol concentration-time data obtained from the studied pediatric hypertensive patients
2 The following tabulated parameter estimates were obtained using the final population PK model CLF 2275 Lhr V2F 961 L V3F 620 L QF 675 Lh Ka 00467 hrndash1 Tlag1 0853 hr
These PK values were generally in the same range as those reported in adults
3 Sex race ideal body weight and Toprol-XL dose have no significant effect on metoprolol pharmacokinetics No covariate impacts V2F V3F Ka or the Tlag of metoprolol Age has no effect on metoprolol CLF and body weight has no effect on QF Metoprolol CLF increases linearly with body weight however no dose adjustment based upon body weight is necessary because dosage is titrated based on clinical response QF is proportional to age however the increase in QF with age is not clinically relevant
4 Weak but statistically significant relationships existed between DBP SBP and HR and some measures of metoprolol exposure (trough plasma levels Cmax and AUC(0ndash 24)) Because of high variability in the hemodynamic data goodness-of-fit of the PKPD models was generally poor and the resulting parameter estimates were not considered reliable Extrapolation of these model parameters in the clinic for dose adjustment is not recommended
5 No covariates had an impact on the parameters delineating the PKPD relationship between metoprolol exposure and DBP SBP and HR
Objectives of the analysis There are three specific goals of the PM analysis
1 To evaluate the adequacy of the sponsorrsquos dose-response analysis 2 To evaluate sponsorrsquos population PK analysis and determine if PK labeling claims
are acceptable DCP1PM Page 48 10182006
Clinical Pharmacology Review NDA 19-962 Toprol-XL 10182006
3 To evaluate sponsorrsquos population PKPD analyses and determine if the findings support the proposed dosing recommendation
Dose Response Analysis (Study 307A) Title Dose Ranging Safety and Tolerability of TOPROL-XLreg
(metoprolol succinate) Extended-release Tablets (metoprolol CRXL) in Hypertensive Pediatric Subjects A Multicenter Double-blind Placebo-controlled Randomized Parallel-group Study
Study Duration 30 May 2002 - 9 June 2004 Investigators (primary) Bonita E Falkner MD and Jonathan Sorof MD 1800 Sites Multiple locations (36 in US and 1 in Dominican Republic)
Table 1 Objectives and Outcomes for Study 307A
Study Design (FDA-approved Type A design) This was a multi-center international double-blind placebo-controlled randomized parallel-group study The study included a screening visit a 1- to 2-week single-blind placebo run-in period during which all previous antihypertensive medications were discontinued and a 4-week double-blind treatment period At the end of the placebo run-in period eligible patients with blood pressure (BP) measurements in the qualifying range were randomized in a 1212 ratio to receive once daily oral doses of placebo TOPROL-XL 02 mgkg TOPROL-XL 10 mgkg or TOPROL-XL 20 mgkg TOPROL-XL doses of 125 25 375 50 75 100 150 or 200 mg were used to approximate the target doses Patients in the placebo and TOPROL-XL 02 mgkg groups received the target dose for 4 weeks while patients in the TOPROL-XL 10 mgkg and
DCP1PM Page 49 10182006
Clinical Pharmacology Review NDA 19-962 Toprol-XL 10182006
20 mgkg groups had their dose up-titrated (based on weight) to the target dose over the first 1 to 2 weeks of double-blind treatment
Reviewer Note Rationale on Study design The inclusion of more patients in the TOPROL-XL 02 mgkg and 20 mgkg groups allowed better estimation of the dose response at the low and high ends of the dose range The TOPROL-XL 10 mgkg group with fewer patients provided a middle estimate that helped to describe the shape of the dose-response curve However having a fewer number of subjects may have contributed to variability Inclusion of a placebo control group allowed for the quantification of treatment-related BP reductions after adjusting for placebo effect It should be noted that the placebo groups were not identical as they followed different titration schedules and had a different number of tablets
The 02 mgkg dose is lower than the lowest approved adult dose on a mgkg basis (assuming 70 kg adult weight) but the highest studied pediatric dose 20 mgkg (200 mg limit was placed) is lower than the highest studied adult dosage 400 mg
Table 2 Toprol Dosing Scheme for Study 307A
Table 3 Formulations used in 307A
DCP1PM Page 50 10182006
Clinical Pharmacology Review NDA 19-962 Toprol-XL 10182006
SPONSORrsquoS STATISTICAL ANALYSIS PLAN HIGHLIGHTS bull The primary analysis used an intention-to-treat (ITT) population which included
all patients who received at least 1 dose of study medication and had baseline and at least 1 post baseline measurement For this analysis missing data were imputed using a last observation carried forward (LOCF) approach
bull A simple linear regression analysis was performed on the placebo-corrected change from baseline to Week 4LOCF in sitting SBP and sitting DBP with dose ratio as the explanatory variable
bull The placebo correction for placebo-corrected changes from baseline to Week 4 LOCF in sitting SBP and sitting DBP was performed by subtracting the mean change from baseline for the placebo group from the individual patient changes in the other treatment groups
bull ANOVA was performed with treatment group as the main factor for the changes from baseline to each post baseline visit in sitting SBP and DBP This ANOVA model was used to construct pairwise comparisons of each active treatment versus placebo and the active treatment groups combined versus placebo
bull The percentage of responders at Week 4 was summarized by frequency counts percentages and 95 confidence intervals (CI) for each treatment group
bull Subgroup analyses were also performed on the changes from baseline at Week 4 in sitting SBP and DBP and the influence of heart rate and baseline body mass index (BMI) on the mean changes from baseline to Week 4LOCF in sitting SBP and DBP were examined using linear regressions
bull Trough plasma concentrations of metoprolol were summarized descriptively and the lower limit of quantitation (LLQ) was 1 ngmL
bull Safety data were summarized using the safety population defined as all patients who received at least 1 dose of study medication and were not lost to follow-up No statistical analyses were performed on the safety data in this study
DCP1PM Page 51 10182006
Clinical Pharmacology Review NDA 19-962 Toprol-XL 10182006
Results Patient Disposition Per applicant patients recruited into this study were representative of a pediatric population with hypertension The four treatment groups were balanced with respect to demographic and baseline characteristics (Tables 4 and 5) About 80 percent of the patients were considered 90 compliant
Table 4 Baseline Characteristics in Study 307A
Table 5 Sitting SBP and DBP measurements at baseline
Sitting and standing BP measurement were comparable (eg mean SBP for all patients- sitting = 1319 and standing 1306 with similar CVs ~ 9 )
Primary Efficacy Variable The results for the primary efficacy variable are illustrated in Figure 1 Figure Dose response for placebo-corrected change from baseline to Week4LOCF for sitting SBP (ITT population)
DCP1PM Page 52 10182006
Clinical Pharmacology Review NDA 19-962 Toprol-XL 10182006
Figure 1 Change in SBP from baseline as a function of Toprol XL dose
Table 6 Linear regressions statistics used to assess Dose-Response
The results indicate that bull The slope of the curve is not different form zero (p = 05371 for dose ratio)
suggesting that there is no dose-response relationship bull Most active treatment groups are more effective than placebo in reducing SBP
By visual inspection it appears the lack of observed dose-response is mainly driven by a lower than expected response at the 20 mgkg level
Potential issues affecting efficacy and pharmacokinetic results bull LOCF was required for eight patients however the LOCF approach did not
greatly impact the outcome of the trial bull Patients assigned to the 10 mg and 20 mgkg dose received drug for only 2
weeks whereas dose in the 02 mgkg received the same dose for 4 weeks
DCP1PM Page 53 10182006
Clinical Pharmacology Review NDA 19-962 Toprol-XL 10182006
Reviewerrsquos Supplemental Dose-Response Analyses The sponsorrsquos dose-response analysis was successfully reproduced by this Reviewer using pooled placebo corrected data A supplemental analysis was conducted using group-specific placebo corrected data In this procedure data for subjects assigned to a given Active Group (eg 02 mgkg) were corrected with Placebo data (02 mgkg) Group specific placebo data are presented in Table 7
Table 7 Placebo-group specific data Placebo Group Frequency Delta SBP 02 mgkg 8 -567 10 mgkg 6 -300 20 mgkg 9 230
It should be noted that the group-specific placebo data appeared to follow a consistent trend where the placebo effect decreased with increasing number of tablets It is unclear if this titrationtablet-dependent placebo effect is valid or random Overall the apparent differential placebo effects suggest that the placebo group may have overly influenced the outcome of the dose-response analysis
When active groups are corrected using group-matched placebo data there is a statistically significant dose-response The dose response using group-specific placebo data is illustrated in Table 8 and Figure 2
Figure 2 Placebo corrected changes in SBP (chg_pc on y axis) as a function of dose ratio
Potential Limitations of Supplemental Analyses Typically placebo effects are constant if randomization is correct thus it is unclear if subsetting the placebo group is acceptable and did not increase bias Additionally subsetting the placebo group leads to a reduced number of placebo subjects per dose group that may impact the regression analyses
DCP1PM Page 54 10182006
Clinical Pharmacology Review NDA 19-962 Toprol-XL 10182006
Table 8 SAS output for regression analyses using group-specific placebo corrections The REG Procedure
Model MODEL1
Dependent Variable chg_pc
Number of Observations Read 117
Number of Observations Used 117
Analysis of Variance
Sum of Mean
Source DF Squares Square F Value Pr gt F
Model 1 191083177 191083177 2663 lt0001
Error 115 825109481 7174865
Corrected Total 116 10162
Root MSE 847046 R-Square 01880
Dependent Mean -430358 Adj R-Sq 01810
Coeff Var -19682365
Parameter Estimates
Parameter Standard
Variable Label DF Estimate Error t Value Pr gt |t|
Intercept Intercept 1 125480 133166 094 03480
DOSRATIO Dose Ratio 1 -100051 019387 -516 lt0001
Secondary variables
bull Placebo-corrected change from baseline in sitting DBP The mean plusmn SD change (Week 4LOCF) in sitting DBP is illustrated in Figure 3 and Table 9
Figure 3 Mean changes (actual and placebo-corrected) from baseline to Week 4LOCF for sitting DBP (ITT population)
DCP1PM Page 55 10182006
Clinical Pharmacology Review NDA 19-962 Toprol-XL 10182006
Table 9 SAS output for regression analyses for DBP with pooled placebo correction
Treatment group effects and pairwise comparisons for sitting SBP and DBP Results of the treatment group effects at the Week 4LOCF visit and the pairwise comparisons between each TOPROL-XL group and placebo for the change from baseline in sitting SBP and DBP are shown for the ITT population in Table 10
Table 10 Treatment group effects for change in baseline to Week 4LOCF for sitting SBP and DBP (ITT population)
Some key findings from the pair-wise comparison are as follows (Table 10) 1 All active groups produced statistically significant reductions from baseline in sitting
SBP and DBP at the Week 4LOCF visit whereas placebo did not
DCP1PM Page 56 10182006
Clinical Pharmacology Review NDA 19-962 Toprol-XL 10182006
2 Overall the mean change from baseline in sitting SBP at Week 4LOCF for the TOPROL-XL groups pooled was statistically significantly larger than that for the placebo group (p=00351)
3 Results of pairwise comparisons between individual TOPROL-XL dose groups and placebo also revealed a statistically significant difference for the 10 and 20 mgkg groups (p=00270 and p=00492 respectively)
bull Mean changes over time in sitting SBP and DBP Consistent with findings from other studies with beta-blockers apparent maximal reduction in blood pressure occurred between 1 and 4 weeks of treatment
Figure 4 Mean changes over time for sitting SBP and DBP (ITT population)
Data points in plot are from absolute values (not taking baseline into account)
Subgroup Analyses The sponsor conducted several exploratory subgroup analyses however these analyses were not reviewed critically and are not presented in this review as
1 they do no impact the primary outcome or study objective 2 they are unlikely to be clinically useful due to the small number of patients per
subgroup One potentially useful some group analyses involved the percentage of responders as defined in Table 11
The responder analyses shows comparable response rates for all active dose groups suggesting similar efficacy across dose groups despite different exposure (doses)
DCP1PM Page 57 10182006
Clinical Pharmacology Review NDA 19-962 Toprol-XL 10182006
Table 11 Number and proportion of responders (ITT population)
Pharmacokinetic Results The Ctrough information obtained in the trial are summarized in Figure 6 and Tables 12 and 13
Table 12 Summary of Ctrough data (per applicant)
Sixteen patients across the 3 TOPROL-XL groups did not have blood samples obtained for analysis of metoprolol concentrations Based on the number of samples BLQ there appeared to be very low concentrations in the lowest dose group It appeared that Ctrough increased with dose According to the applicant these values are similar to those obtained previously in adults especially at the 2 higher doses Variability was high in all treatment groups (CV gt 60 )
Table 12 Summary of Ctrough (Reviewer Generated) from all patients (samples lt LOQ given value = 0) Toprol XL Dose Number of subjects Concentration (ngmL) (mgkg) Mean plusmn SD Median Range 02 39 137 plusmn 294 000 0 ndash 157 10 17 1224 plusmn 1416 845 0 ndash 571 20 46 2462 plusmn 3352 1140 0 ndash 1670
DCP1PM Page 58 10182006
Clinical Pharmacology Review NDA 19-962 Toprol-XL 10182006
Reviewer Note Overall the plasma concentrations (exposure) for the 02 mgkg dose group appear too low to be effective (close to LOQ) It is noted that adults typically have concentrations gt LOQ at the lowest therapeutic dose 25 mg (~ 4 ngmL)
Figure 6 Boxplot of metoprolol Ctrough using samples gt LLQ (per applicant)
Safety Results According to the applicant Toprol XL was well tolerated in the pediatric population as tabulated below
Main Analyses Conclusions bull No dose response was observed for corrected SBP using pooled placebo data
however using group-matched placebo data demonstrated a dose response bull Ctrough increased with dose bull Toprol 10 and 20 mg kg doses were more effective than placebo in reducing
SBP bull The responder rate was comparable across all active dose groups and this rate was
greater than that of placebo
DCP1PM Page 59 10182006
Clinical Pharmacology Review NDA 19-962 Toprol-XL 10182006
Methods Reviewerrsquos Methods Generally this reviewer conducted the analyses in a manner similar to that of the sponsor to confirm the sponsorrsquos findings
Sponsorrsquos Methods
Design Study1 307A
Reviewer Note This study was described in the Dose-Response Assessment (please refer to Page 7 Dose Response Analyses) Consequently only highlights relevant to the population analyses will be included in this section
Study 307A was a 4-week multi-center double-blind placebo-controlled randomized parallel-group study TOPROL-XL (metoprolol succinate) extended-release tablets were given to hypertensive pediatric patients Patients were randomized to double-treatment with a once daily oral dose of placebo or Toprol-XL at 1 of 3 target doses 02 or 20 mgkg The dose range for this study was 125 to 200 mg daily Patients on placebo followed the same schedule as that for their active group comparators
Study Flow Chart
Key Inclusion Criteria School age and adolescent children with reproducible SBP or DBP at or above the 95th percentile using height-adjusted charts for age and weight were eligible
DCP1PM Page 60 10182006
Clinical Pharmacology Review NDA 19-962 Toprol-XL 10182006
Study2 307B
Study 307B was a 52-week multi-center open-label study to determine the safety and pharmacokinetics of TOPROL-XL (metoprolol succinate) extended-release tablets (metoprolol CRXL) in hypertensive pediatric patients The starting dose was 25 mg daily The dose was increased every 2 weeks in increments of 25 mg or 50 mg based on tolerability until BP was controlled or the dose reached 200 mg
Table 1 Study Assessments
At the end of the 52-treatment period all patients had BP measured and a trough plasma level taken 24 hours the last dose of Toprol-XL with the exception of those patients who completed the serial portion at the final visit Among the participants a subgroup of approximately 30 patients was to participate in PK assessments of metoprolol requiring serial blood sampling at any time during the 52 weeks A single dose of 25 mg of Toprol-XL was given orally to those participating patients after a 48-hour washout period After the PK assessments they returned to the main study protocol Data
Study1 307A
4111 Pharmacokinetics A blood sample was to be collected at Visit 7 into a heparinized Vacutainer tube and obtained at 24 hours (plusmn2 hour) following the last dose of study medication (ie trough measurement) for determination of plasma metoprolol concentrations
Study Disposition Chart
DCP1PM Page 61 10182006
Clinical Pharmacology Review NDA 19-962 Toprol-XL 10182006
Table 2 Study Demographics
4112 Pharmacodynamics Primary variable
Sitting SBP determined at trough (24plusmn4 hours Visit 7) served as the primary efficacy assessment The primary measure of effect was the placebo-corrected change from baseline to the end of treatment (Week 4) in trough sitting SBP Each BP determination represented the mean of 3 readings with less than 7 mmHg between the highest and lowest value Blood pressure was measured using a mercury sphygmomanometer with an appropriate size cuff positioned approximately at the level of the heart Every effort was made to have the same individual measure the patientrsquos BP throughout the study if possible At all post randomization visits BP measurements were to be made at trough defined as 24 hours (plusmn4 hours) after receiving study medication All measurements were to be determined prior to the patient taking the scheduled dose of study medication In the
DCP1PM Page 62 10182006
Clinical Pharmacology Review NDA 19-962 Toprol-XL 10182006
event that the patient accidentally took study medication on the day of the scheduled visit the visit was to be rescheduled within 24 to 48 hours
Study2 307B
4113 Pharmacokinetics A 48-hour washout period prior to sampling was required for all patients including patients who entered the 52-week study and then decided to participate in the serial PK portion of the study All patients were to have a 15-mL blood sample collected into a heparinized Vacutainer tube 24 hours (plusmn2 hour) following the last dose of TOPROL-XL (ie trough measurement) at Visit 18 (or a the time of premature discontinuation) except for patients who participated in the serial PK portion of the study and had blood sampling performed at Visit 18 For patients participating in the serial PK portion of the study blood samples (15 mL) were to be collected into heparinized Vacutainer tubes and obtained at Hour 0 (predose) and at 1 2 3 4 6 8 10 and 24 hours after administration of a single 25 mg dose of TOPROL-XL following a 48-hour washout period After the last blood sample was obtained the patient was to startresume the prescribed dose of TOPROL-XL heshe was receiving prior to PK sampling
Patient Disposition Chart (completion or discontinuation)
Overall a total of 31 patients at 8 centers were enrolled in the serial PK portion of the study Of these 31 patients 27 had plasma concentration data available and were included in the analyses Four patients were excluded from the analyses because their plasma concentrations were not quantifiable (Nos 047-009 and 047-021) or because only whole blood samples were analyzed (Nos 005-002 005-003)
DCP1PM Page 63 10182006
Clinical Pharmacology Review NDA 19-962 Toprol-XL 10182006
Table 3 Subject Demographics for Patients Providing Serial Blood Samples
Missing Data Twenty-six patients did not have blood samples obtained for analysis of metoprolol concentrations in either the 16-week (n=7) or 52-week (n=19) studies Among patients with plasma samples 14 (14) in the 52-week study and 13 (13) in the 16-week study had trough plasma metoprolol concentrations that were below the LLQ Therefore data from a total of 99 patients were included in this analysis
Assay Metoprolol plasma levels were assayed using high-performance liquid chromatography tandem mass spectrometric detection methods having limit of quantitation (LOQ) of 1 ngmL The method was validated in the linear range 1 to 1000 ngmL Precision was less than or equal to 109 Accuracy ranged from 940 to 1013 Pharmacodynamics Not applicable
Data Checking SAS was used to format and check data Additionally visual inspection of several randomly selected subject data was carried out
DCP1PM Page 64 10182006
Clinical Pharmacology Review NDA 19-962 Toprol-XL 10182006
Models
Overview The sponsorrsquos stated assumptions underlying this modeling analysis are
1 Rich sampling data collected from 30 subjects in 307B Study can be used to adequately characterize the structural pharmacokinetic model of metoprolol
2 Structural pharmacokinetic models of metoprolol at other dose strength are identical to that at 25 mg
3 Metoprolol exhibits a linear pharmacokinetics in the dose ranges studied 4 Steady-state pharmacokinetics of metoprolol has been reached at the time of blood
sampling in Study 307A 5 Metoprolol accounts for the blood pressure effect in the study 6 Existing various disease states in the patients have no impact on the pharmacokinetics
of metoprolol and pharmacodynamics of the blood pressure reduction in the study 7 Concomitant medications if existed do not have any effects on the pharmacokinetics
of metoprolol and pharmacodynamics of the blood pressure reduction in the study
Reviewer Comment The sponsorrsquos assumptions appear reasonable based on existing metoprolol PKPD information
Pharmacokinetics
4114 PK Structural Model Several PK models were tested to identify the structural model Flip-flop absorption was taken into consideration based on general PK characteristics following administration of sustained release tablets and observed data in the current study (serial PK samples)
The models tested included linear 1- and 2-compartment PK models with the following characteristics (focused on flip-flop models)
bull first-order absorption with and without absorption lag time (NONMEM subroutines ADVAN2 and ADVAN4)
bull zero-order absorption with and without absorption lag time (NONMEM subroutines ADVAN1 and ADVAN3)
bull simultaneous zero- and first-order absorption from the absorption compartment The models were parameterized in terms of CLF and VF
Ultimately the 2-compartment model with first order flip-flop absorption an absorption lag time and 2 residual error terms was selected as the structural model of metoprolol The model scheme is presented in the following Figure 1 Figure 1 PK Compartmental Model
DCP1PM Page 65 10182006
Clinical Pharmacology Review NDA 19-962 Toprol-XL 10182006
4115 PK Covariate Model Covariate models were developed to account for the potential impact of the following covariates and derived covariates on metoprolol PK
Continuous variables bull Age (AGE years) bull Body weight (WT kg) bull Body surface area (BSA m2) calculated from WT and HT (cm) using the height
weight formula BSA=0024265 x WT 05378 x HT03964 bull Ideal body weight (IBW kg) calculated as - Males IBW=50+(HTndash150)25 and
for Females IBW=45+(HTndash150)25 bull Dose (DOSE mg of Toprol-XL)
Categorical variables bull Gender (SEX) - Male 0 - Female 1 bull Race (RACE) - Caucasian 0 - Black 1 - Asian 2 - Other 3
PK covariate effects were modeled as follows
Effects of continuous covariates (AGE WT BSA IBW and DOSE) were normalized to the corresponding median value across a dataset such that continuous covariates were related to structural PK parameters in a power function as described below
where Θ is the fixed-effect parameter of a covariate estimated by the NONMEM program covariate value is the observed covariate value and PK typical value is the typical value of the PK parameter estimated by NONMEM Effects of categorical covariates (SEX and RACE) are related to structural PK parameters by fractional changes of dummy variables
DCP1PM Page 66 10182006
Clinical Pharmacology Review NDA 19-962 Toprol-XL 10182006
Where Θ is the fixed-effect parameter of a covariate estimated by the NONMEM program covariate is the dummy variable value and modified in the control streams and PK typical value is the typical value of this PK parameter as estimated by NONMEM
Median values of all covariates in the dataset for population PK analysis are presented in Table A
Table A Summary of patient covariates and Toprol-XL doses in the data for population PK analysis
Two Steps were included in the modeling of covariates
Step 1 Forward Addition The covariates were subjected to a stepwise forward selection algorithm using a likelihood ratio test based on a change in MOF values from the base model A significant covariate reduced the MOF more than 660 (chi-square distribution plt001 degrees of freedom [df]=1)
Step 2 Backward deletion (Excluding procedures for covariate effect) The covariates in the full model acquired in Step 1 were subjected to a backward deletion algorithm 1 covariate was deleted at a time using a likelihood ratio test based on a change in MOF values A covariate was determined to be statistically significant if the change in MOF after its deletion from the breakdown model was increased by more than 1083 (chi-square distribution plt0001 df=1)
4116 PK Random Variance Models An exponential error model was used to characterize inter-patient variability based upon the assumption that random effects for PK parameters were not correlated among PK parameters No other error models for eta were evaluated by the applicant or by this Reviewer The retention of ETA values for each PK parameter in the structural model was confirmed by sequentially fixing each ETA value at zero and comparing each resultant MOF with the MOF obtained when all ETA values were retained in the model (see Table 6)
DCP1PM Page 67 10182006
Clinical Pharmacology Review NDA 19-962 Toprol-XL 10182006
The residual model was modeled by an additive model two error terms were used one for error associated with trough samples and the other with serial samples
Reviewer Note Use of an exponential model appears reasonable
Pharmacodynamics
4117 PKPD Structural Model The equations for the structural models are shown below
1 Metoprolol Ctrough The relationships between the observed metoprolol concentrations (Ctrough) and hemodynamic changes were investigated using 4 direct-link models namely a linear model a log-linear model and Hillrsquos sigmoid Emax PKPD model with and without a baseline
2 The relationships between Cmax or AUC0ndash24 and hemodynamic changes were investigated using 2 direct-link models a linear model and a log-linear model
4118 PKPD Covariate Model The inclusion and exclusion procedures of covariate effect on the selected PKPD base model to obtain a selected final PKPD model were identical to those in the covariate evaluation in the population PK models as described previously in PK Covariate Model DCP1PM Page 68 10182006
Clinical Pharmacology Review NDA 19-962 Toprol-XL 10182006
Table B Baseline demographic and covariate characteristics
4119 PKPD Random Variance Models An exponential error model was used by the applicant to model inter-individual variability The retention of a random effect parameter ETA in each selected PKPD structural model was then evaluated by sequentially fixing each ETA value at zero and comparing each resultant MOF with the MOF obtained when all ETA values were retained in the model (plt005) This step reduced over-parameterization by deleting unnecessary random-effect parameters from the structural model to obtain the base model
Reviewer Note The study design precludes assessment of inter-individual variability or random error because only one dose record was available per patient Consequently the model should not have included eta terms It is noted that the sponsor ultimately dropped the eta term in the final model
DCP1PM Page 69 10182006
Clinical Pharmacology Review NDA 19-962 Toprol-XL 10182006
Model Selection
PK Initial Model Selection
PK Base Model to Final Model The selection of the most appropriate PK base model for a metoprolol PK was based upon the following criteria a significant reduction in MOF as compared to the baseline model and asymptotic chi-square distribution based on the likelihood ratio test or AIC (plt005) as compared to the other structural models This selected PK base model was then subject to a covariate evaluation The population PK model bearing all surviving covariate parameters with statistical significance became the penultimate final model If 1 of the body size parameters (WT BSA and HT) was not in the model the penultimate final model became the final model If body size parameters were in the model they were sequentially replaced by other body size parameters in the regression submodel for each PK parameter The best body size parameter was then selected on the basis of lowest MOF to form the final model
PK Final Model Selection Simulations and visual inspections based on goodness of fit plots were used to qualify and validate the model The goodness-of-fit of the final model was evaluated graphically by comparing population and individual predictions of metoprolol concentrations with observed metoprolol concentrations along the line of unity and by visual inspection of the following plots of population-weighted residuals (WRES) for the final population model 1 Population-weighted residuals (WRES) versus population-predicted concentrations (PRED) 2 WRES versus time after first drug administration in each patient 3 WRES versus all covariates evaluated WRES were generally expected to be distributed homogenously around zero for PRED time after administration and covariates For those 27 patients with serial samples goodness-of-fit of the plasma concentration-time profile for each individual was visually inspected The linear relationship between their AUClast values from the observed data and those from the simulated data (final model) was examined
The predictive performance of the final population PK model including covariates was evaluated by comparing typical values of PK parameters with the mean of individual Bayesian estimates or individual values of PK parameters with the results from non-compartmental analysis for patients with serial samples Steady-state metoprolol plasma concentration-time profiles from 0ndash24 hours at the interval of 15 minutes (025 hour) were calculated using the post hoc Bayesian estimated PK parameter obtained for 65 patients included in the PKPD relationship using the following equation
DCP1PM Page 70 10182006
Clinical Pharmacology Review NDA 19-962 Toprol-XL 10182006
PKPD Initial and Final Model Selection A similar approach to that of PK model selection was adopted for PKPD Each of the above-mentioned PKPD models with random effects was identified by curve-fitting the dataset Initial selection of the PKPD structural model was based upon a significant reduction in MOF (plt005) as compared to the baseline model and reasonable PKPD parameter estimates Software
Nonlinear mixed-effect modeling (NONMEM) software (Version V level 11 Globomax Hanover MD) was used in the population PK analysis PK model fitting was accomplished using first-order (FO) approximation methods For PKPD model fitting the first-order conditional estimation (FOCE) with eta-epsilon interaction method in NONMEM was used for all model runs
SAS software (Version VIII Cary NC) was employed to prepare datasets according to the format required by the NONMEM program (Boeckmann et al 1991) Microsoftreg Excel 2000 (Redmond WA) and S-PLUS 2000 (Professional Release 2 MathSoft Inc Cambridge MA) were used to perform exploratory graphical exposure calculation and statistical analyses according to the format required by the NONMEM program (Boeckmann et al 1991) SAS command files logs and listings pertaining to data file conversion and merging were reviewed by an independent analyst Datasets were stored in SAS data frames combined and exported to Excel and then to ASCII files before fitting to the model
Datasets were prepared and pooled in a NONMEM-compliant format using SAS software by the Programming Group Clinical Information Sciences at AstraZeneca Wilmington Delaware SAS command files logs and listings pertaining to file conversion and merging were provided and found to be acceptable The contents of both datasets (toprolkatcsv for PK modeling and cppd2csv for PKPD modeling) were included
DCP1PM Page 71 10182006
Clinical Pharmacology Review NDA 19-962 Toprol-XL 10182006
toprolkatcsv was not provided electronically in a SAS format however this reviewer generated a similar dataset using the applicantrsquos criteria
Reviewer Comment The software and data assembly methods appeared adequate
DCP1PM Page 72 10182006
Clinical Pharmacology Review NDA 19-962 Toprol-XL 10182006
Results and Discussion Design Adequacy
Overall the trial designs appeared adequate to evaluate metoprolol population PK and PKPD in pediatric patients receiving Toprol XL However the design could have been further optimized by increasing the sampling points particularly in the absorption phase Due to the limited number of samples in the absorption phase it was not possible to accurately characterize the absorption model first order vs zero order or mixed first and zero order Additionally collection of mainly trough samples limits the ability to accurately estimate measures such as Cmax that are not directly related to Ctrough particularly if multiple compartments are present Consequently Cmax estimations are unlikely to be accurate Finally most patients provided only one trough sample thus inter-individual variability could not be adequately captured and may have limited the utility of the modeling exercise particularly in PKPD where the random effect could not be accurately characterized Ultimately there was no random variable in the final PKPD model (ie eta was set to zero) Data Integrity
This reviewer checked the data visually by randomly selecting data from patients included in the population modeling and comparing to data in the study report (source data) Overall the data integrity appeared acceptable The applicant observed the following guidelines that appeared acceptable No datum from any study participant with a protocol violation that was thought to materially impact the analysis was included The dataset contained data from only those study participants who could be evaluated ie with all the last dosing datetime blood sampling datetime plasma drug concentrations and demographic covariates
Data that were excluded (n = 62 samples) from the model were as follows One sample from an apparent poor metabolizer Two samples collected gt 96 hours post dose From 307B 10 trough samples lt LOQ From 307A 17 samples lt LOQ Thirty-samples from serial data that were lt LOQ or whole blood samples Model and Model Selection
Base Model
41110 Pharmacokinetic Model description The base PK model was a standard two compartment model that incorporated lag time and flip-flop kinetics The key features of the model were flip-flop was insured by making the value of ke gt ka in the clearance equation Additionally lag time was restricted to a value of 2 hours or less and concentrations were log transformed consequently all concentrations (F) = 0 were given individual predicted concentrations of zero Finally there were two residual error terms one for serial samples and the other for trough samples DCP1PM Page 73 10182006
Clinical Pharmacology Review NDA 19-962 Toprol-XL 10182006
Key equations were as follows
KA = THETA(1)EXP(ETA(1)) V2 = THETA(2)EXP(ETA(2)) CL = (THETA(1)THETA(2)+THETA(3))EXP(ETA(3)) Q = THETA(4)EXP(ETA(4)) V3 = THETA(5)EXP(ETA(5)) ALAG1=THETA(6)EXP(ETA(6))
41111 PK Parameter estimation results Table 1 Summary of PK parameters in the metoprolol population PK base model (per applicant)
41112 Goodness of fit The applicant provided the following goodness-of-fit plots (Figure 1)
Reviewer Note The goodness-of-fit plots were reproduced by this Reviewer (see Appendix) with minor modifications
Figure 1 Goodness of fit plots for Base Model
DCP1PM Page 74 10182006
Clinical Pharmacology Review NDA 19-962 Toprol-XL 10182006
Base PK Model Selection The MOF values of all structural model candidates tested are presented in Table 2 Model selection was based primarily on MOF values the lower MOF the better the model The applicant reports that in general MOF values generated by a conventional absorption model (ie absorption rate is faster than elimination rate) and a flip-flop absorption model (ie absorption rate is slower than elimination rate) were identical
Reviewer Comment The existence of flip-flop kinetics appears plausible based on data provided and general patterns for sustained release formulations Consequently the use of flip-flop kinetics for the bulk of the modeling exercise appears reasonable
General conclusions from the information in Table 2 are First order input is better than zero order input Two compartment model is better than one compartment model Lag time presence is better than lack of lag time Two residual error terms are better than one residual error term It should also be noted that several other models led to unsatisfactory completion of the run and were not considered further
DCP1PM Page 75 10182006
Clinical Pharmacology Review NDA 19-962 Toprol-XL 10182006
Table 2 Comparison of Structural PK Models
Reviewer Comment The selected structural model appears appropriate based on the data
Base Model The deletion of ETA for V2 did not change the MOF value suggesting that ETA for V2 should be deleted to avoid an over-parameterized warning (Table 3) This was consistent with the estimated parameter value of ETA for V2 being 648 x 10ndash9 a very small value Therefore the base model was selected by deleting the ETA for V2 from the structural model
Reviewer Comment on Eta deletion for V2 Deletion of eta for V2 is acceptable based on the empirical data however from a physiological perspective deletion of eta is problematic Generally one anticipates inter-individual differences in volume of distribution In this case it appears that the error associated with V2 may have been randomly shifted to V3 and or Q terms as the three DCP1PM Page 76 10182006
Clinical Pharmacology Review NDA 19-962 Toprol-XL 10182006
terms are interrelated This potential shift in error is supported by the fact that the V2 eta value increases significantly (by several orders of magnitude- 10-5 vs 100) when eta for Q and or V3 is fixed However when Q or V3 are fixed minimization is successful but Q and V3 are not accurately estimated Accounting for the possible error shift is a complex process and goes beyond the scope of this reviewer thus deletion of eta associated with V2 was considered acceptable for the remainder of the modeling evaluation
Table 3 Structural elements tested in the metoprolol population PK structural model (p lt 0005)
Final PK Model
41113 Model description The key feature of the final model is the inclusion of the covariate effects of age on Q and weight on CL in the population PK model
Key Equations CL = (THETA(1)THETA(2)+THETA(3)+EWT)EXP(ETA(2)) Q = THETA(4)EAGEEXP(ETA(3))
Including Covariate Effects As previously described covariate effects were assessed by forward addition and backward deletion Most covariates did not significantly change MOF however BSA significantly affected CL and Age affected Q Consequently these covariates were included in the penultimate final model
DCP1PM Page 77 10182006
Clinical Pharmacology Review NDA 19-962 Toprol-XL 10182006
Reviewer Note BSA is derived form WT and HT covariates implying BSA is highly correlated to these two covariates (Figure 2) weight is the most suitable (practical covariate) as it is readily measured Furthermore weight and BSA produced the same MOF (Table 4) whereas MOF with height was more positive (less significant)
Figure 2 Plot of BSA vs Body Weight
The data in Table 4 support selection of the final model
Table 4 Covariate elements tested in the metoprolol population PK penultimate final model (plt0005)
The applicant acknowledges that mechanism(s) accounting for the impact of age on QF are not clear However since distribution clearance has little effect on metoprolol plasma exposure further investigation is not needed
41114 PK Parameter estimation results As shown in Table 5 PK parameters were estimated fairly precisely by the final model
Table 5 PK Parameter Estimates using Final Model
DCP1PM Page 78 10182006
Clinical Pharmacology Review NDA 19-962 Toprol-XL 10182006
41115 Goodness of fit The goodness-of-fit plots provided by the applicant show good precision Figure 5 Goodness of fit plots for final PK model
DCP1PM Page 79 10182006
Clinical Pharmacology Review NDA 19-962 Toprol-XL 10182006
PK Model Qualification The post hoc Bayesian-estimated AUC (simulated) obtained for the 27 patients with serial plasma samples are plotted against the observed (AUCt) The correlation was high (R2 gt 099) Figure 6 AUClast from observed data versus AUCt from model simulation in the 27 patients providing serial plasma samples
Regression line Y= 4514 + 08976 X R2 = 09957
The graphical validation of the final metoprolol population PK model validation against covariates evaluated is presented in Figure 6
Figure 7 Graphical validation of covariates
DCP1PM Page 80 10182006
Clinical Pharmacology Review NDA 19-962 Toprol-XL 10182006
There was no systematic bias in weighted residuals for any covariates evaluated suggesting that the final model included all appreciable effects of available covariates (Figure)
The effects of weight on metoprolol CLF are illustrated in Figure 8 where Bayesian post hoc estimates of CLF are plotted against weight and overlaid by the model-predicted line Overall the model appeared to fit the data well
Figure 8 Plot of CLF vs Body weight
The effects of AGE on metoprolol QF are illustrated in Figure 9 where Bayesian post hoc estimates of QF are plotted against AGE and overlaid by the model-predicted line Figure 9 Plot of QF vs Age
DCP1PM Page 81 10182006
Clinical Pharmacology Review NDA 19-962 Toprol-XL 10182006
Reviewer Note The applicant indicated that attempts to run the final model using the first-order conditional estimation method resulted in termination errors Therefore the parameter estimates obtained by the FO method were reported as the final parameter estimates
Conclusion Regarding Population PK Modeling Overall the sponsorrsquos population PK modeling is acceptable
PKPD Model and Model Selection
PKPD Base Model PharmacokineticPharmacodynamic Model description The key feature of the model was a lack of random variance term for the slope (since only single data points were available per subject) and inclusion of baseline effect
Key equations were as follows E0 = THETA(1)EXP(ETA(1)) M = THETA(2) Y = E0 + MLOG(AUC) + EPS(1)
The control stream provided in the appendix is that for DBP (provided by sponsor) The control stream for SBP is comparable with appropriate substitution for BP type
It should be noted that only the log-linear and linear PKPD models were considered suitable for AUC and Cmax For this review only AUC estimates were considered reliable as Cmax estimates could not be accurately determined based on the sampling scheme Consequently the remainder of this review focuses on AUC information although Ctrough and Cmax data are displayed for reference
Bayesian estimates from PK modeling are summarized in Table 1
Table 1 Bayesian estimates of metoprolol PK exposure for those patients included in the PKPD analysis (N=65)
DCP1PM Page 82 10182006
Clinical Pharmacology Review NDA 19-962 Toprol-XL 10182006
PKPD Model Selection (initial and final) The log-linear model was adopted as the base model for this PKPD relationship since it improved the MOF significantly (Table 2) The ETA parameter for the slope was pre-eliminated for the purpose of model parsimony The intercept and slope in this log-linear model for AUC(0-24) did not bear ETA parameter therefore no covariates had impact on either parameter in the model
Reviewer Note The intercept should not have borne an eta term because individual subjects provided only one data point Consequently fixing eta to zero or deleting eta in the final model is appropriate No further model development was required after eta was eliminated and the base model was equivalent to the final model
Table 2 Base population PKPD models tested for the change in SBP
41116 PKPD Parameter estimation results The final PKPD parameter estimates are presented in Table 3
Table 3 Summary parameters in the final PKPD model for the change in SBP using trough plasma level Parameter Explanation Estimate SE ()b
DCP1PM Page 83 10182006
Clinical Pharmacology Review NDA 19-962 Toprol-XL 10182006
Model Qualification Based on the relatively low R2 value and as shown in Figure there is a poor correlation between change in SBP and log AUC
Figure 1 Relationship between change in SBP and AUC (line generated from modeling)
Overall goodness-of-fit of the model was considered to be poor probably due to the high variability in the measurements Consequently the precision of the model parameter estimates was not considered to be very reliable These parameters have little clinical usefulness and can be treated only as an indication of trends ie more hemodynamic effects can be potentially achieved when high Toprol-XL doses are given Clinical dose adjustment based on these PKPD parameters is not recommended
Reviewerrsquos Supplemental Analyses A supplemental PKPD analyses was conducted using simple linear regression since the population model did not improve the fit Overall eta made an insignificant contribution to the overall model The results of the analyses were similar to the population analyses A series of regression analyses were conducted and are presented in Table 4
The applicant notes that the preliminary modeling exercise found that there was no difference in the PKPD modeling results using different hemodynamic data formats (ie change in the measurements percent change in the measurements or actual BP measurements) This finding was confirmed by this reviewer (see Table 4)
DCP1PM Page 84 10182006
Clinical Pharmacology Review NDA 19-962 Toprol-XL 10182006
Table 4 Supplemental PKPD Regression Analyses Conducted by Reviewer Model (liner regression) Intercept (I) Slope (m) R2 Probability RSBP = mISBP + I 3957 -035 01626 0009 PSBP = mISBP + I 2524 -023 01252 00038 PSBP = mRSBP + I 0005 074 09891 lt 00001 RSBP = mlogAUC + I 651 -221 0060 00493 RSBP = mDose + I -751 0006 00026 06878 RSBP = mDose^ + I -312 -111 004 02711 RSBP = mlogAUC + nISBP + I 5303 -221 (m)
-035 (n) 02230 0001
RSBPplc = mAUC + I -667 -0003 00458 00871 RSBPplc = mlogAUC + I 461 -2208 00600 00493 RPUL = mlogAUC + I 1868 -405 01102 00069 Symbols in table similar to population PK model without eta term RSBP- change of SBP without placebo correction ISBP- initial (baseline) SBP RPUL- change in HR without placebo correction Dose- in mg where placebo is included as 0 mg PSBP- percentage change of SBP without placebo correction
Conclusion Regarding Population PKPD Modeling Overall the sponsorrsquos population PKPD modeling is acceptable No dose adjustment conclusion can be made from this modeling however an exposure-response relationship was established for AUC and reduction in SBP
Discussion
The significance of the results 1 Provide estimates of PK measures and plasma exposure in pediatric population These data can be compared to adult exposure to determine if exposure differences impact drug effectiveness The main challenge in comparing pediatric data to adult data is different modeling schemes formulations and methods were used in the two populations
2 PKPD findings are not sufficiently precise to provide a dose adjustment algorithm however the PKPD analyses provides rationale for proposed titration as increasing exposure (doses) may improve efficacy (reduction in SBP) Ultimately the risk-benefit analyses overrides PKPD assessment for dose adjustment drug will be titrated thus reliance on PKPD information is not critical The proposed dose 10 mgkg appears suitable based on available information It is unclear from the studies if there should be an initial maximum dose although the sponsor has proposed 50 mg as the maximum initial dose The proposed pediatric starting dose on a mgkg basis is within the range of starting adult doses (25 ndash 100 mg) assuming an adult weighs 70 kg
3 Cumulative information form dose-response study indicates that Toprol XL has effectiveness in children however the most effective dose is unclear Since the drug can be titrated determining the initial optimal dose does not appear critical As proposed by the applicant dosing is started at a ldquolowrdquo dose that can be up-titrated if needed
DCP1PM Page 85 10182006
Clinical Pharmacology Review NDA 19-962 Toprol-XL 10182006
4 The results did not adequately address the potential impact of CYP2D6 metabolic status for pediatric patients taking Toprol XL There were an insufficient number of patients to make this assessment
5 Covariate effects do not appear significant only body weight significantly affects clearance However a worst case scenario can occur with a person that has a low body weight and is a poor metabolizer this will result in very high possibly supra-therapeutic exposure Age does not impact apparent oral clearance so an age-dependent dose adjustment is not needed for children over 6 years old In essence all children over six years old can initiate therapy at 10 mgkg
The validity of the results Overall the results produced by the sponsor appear valid and the sponsor used a sound modeling approach However alternative approaches that could have been adopted may have improved the outcome of the analyses Three of these approaches are presented below 1 Additional PK samples should have been collected during the absorption phase and
throughout the dosing interval to improve the modelrsquos performance Specifically additional samples collected during the absorption phase may have unambiguously identified the actual absorption input function (eg first order zero order mixed first and zero order) First order input was selected for the analyses although the dosage form is reported to exhibit zero order kinetics in adults It is possible that the input rate in children differs from that in adults but unlikely It should be noted that absorption kinetics in children is often erratic due to multiple factors (eg regioshyselective absorption incomplete gastric emptying and inconsistent absorption) so it is unclear if additional samples would have definitively identified the absorption function However additional non-trough samples may have helped in estimating key PK measures such as V and Cmax The final model did not have an eta associated with V which is atypical Collection of additional samples on different visits may have helped estimate potential inter-occasion variability It should be noted that AUC was estimated precisely for subjects providing serial samples but these subjects were not necessarily included in the PKPD analyses Ideally the PKPD modeling should have been conducted primarily in subjects who had accurate PK measures
2 The PKPD design could have been modified to potentially improve the utility of the analyses Specifically there should have been better placebo matching procedures to minimize the potential impact of the placebo effect This matching could have been improved by ensuring all patients on placebo had the same titration schedule and number of tablets It is noted that the model had a poor predictive performance that was mainly attributed to the high degree of variability in the PD measures Potentially other PD markers could have been explored that have less inherent variability One such marker is the degree of beta blockade using exercise heart rate (EHR) reduction this marker has been used extensively for metoprolol in adult subjects However use of EHR in the pediatric setting may be challenging
DCP1PM Page 86 10182006
Clinical Pharmacology Review NDA 19-962 Toprol-XL 10182006
Comments to sponsor
In future pharmacometric studies you should consider the following 1 collect sufficient (multiple) samples from individual subjects to allow assessment
of inter-occasion variability and estimation of inter-individual variability (eta) for all relevant parameters
2 placebo groups should be identically matched across all dose groups (eg same titration schedule and number tablets) to minimize potential bias or differences in the placebo effect
Comments to medical reviewer
1 The sponsor has adequately characterized metoprolol PK in the studied pediatric population The PK characterization could have been further optimized by obtaining additional samples over the entire dosing interval (eg during the absorption phase and elimination phase) on multiple occasions rather than on one occasion primarily at trough
2 A dose-response relationship could not be established using the protocol specified analysis approach The outcome of the dose-response relationship appeared highly dependent on the ldquoplacebo effectrdquo suggesting that the placebo group may not have been appropriate One should consider re-evaluating the dose-response precisely matched placebo groups (eg all placebo patients have identical number of tablets and titration schedule)
3 Based on the PKPD analysis plasma exposure (AUC) explains lt 10 of the response (reduction in systolic blood pressure) thus has limited clinical utility However the PKPD relationship suggests that there is a trend for increased response with increased exposure (dose driven)
4 Overall information from the dose-response study suggests that Toprol- XL is effective in the pediatric population The optimal initial dose 02 10 or 20 mgkg or the maximum safe and effective dose cannot be determined from the information provided It is noted that the 02 mgkg dose is unlikely to be effective as plasma concentrations achieved at this dose are unlikely to be effective (most concentrations lt LOQ and lower than effective adult concentrations) The 10 mgkg (proposed by applicant) appears to be a reasonable initial dose The labeling should reflect the regimens studied
DCP1PM Page 89 10182006
Clinical Pharmacology Review NDA 19-962 Toprol-XL 10182006
Appendix
DCP1PM Page 90 10182006
Clinical Pharmacology Review NDA 19-962 Toprol-XL 10182006
DCP1PM Page 91 10182006
Clinical Pharmacology Review NDA 19-962 Toprol-XL 10182006
DCP1PM Page 92 10182006
Clinical Pharmacology Review NDA 19-962 Toprol-XL 10182006
DCP1PM Page 93 10182006
Clinical Pharmacology Review NDA 19-962 Toprol-XL 10182006
DCP1PM Page 94 10182006
Clinical Pharmacology Review NDA 19-962 Toprol-XL 10182006
DCP1PM Page 95 10182006
Clinical Pharmacology Review NDA 19-962 Toprol-XL 10182006
Table 15 Control streams for final log-linear PKPD model for the change in DBP using metoprolol Cmax as the measure of exposure
Truncated NONMEM reports for base model identification for PKPD relationship in change of SBP (per sponsor)
DCP1PM Page 96 10182006
Clinical Pharmacology Review NDA 19-962 Toprol-XL 10182006
Reported PD information^
^ Under metoprolol regimen CRZ0K is Toprol XL
DCP1PM Page 97 10182006
Clinical Pharmacology Review NDA 19-962 Toprol-XL 10182006
Table Results of randomised double-blind comparative trials evaluating antihypertensive efficacy of metoprolol formulations or other antihypertensives
DCP1PM Page 98 10182006
---------------------------------------------------------------------------------------------------------------------
---------------------------------------------------------------------------------------------------------------------
---------------------
This is a representation of an electronic record that was signed electronically and this page is the manifestation of the electronic signature
s
Robert Kumi 10182006 045635 PM BIOPHARMACEUTICS
Patrick Marroum 10192006 050811 PM BIOPHARMACEUTICS
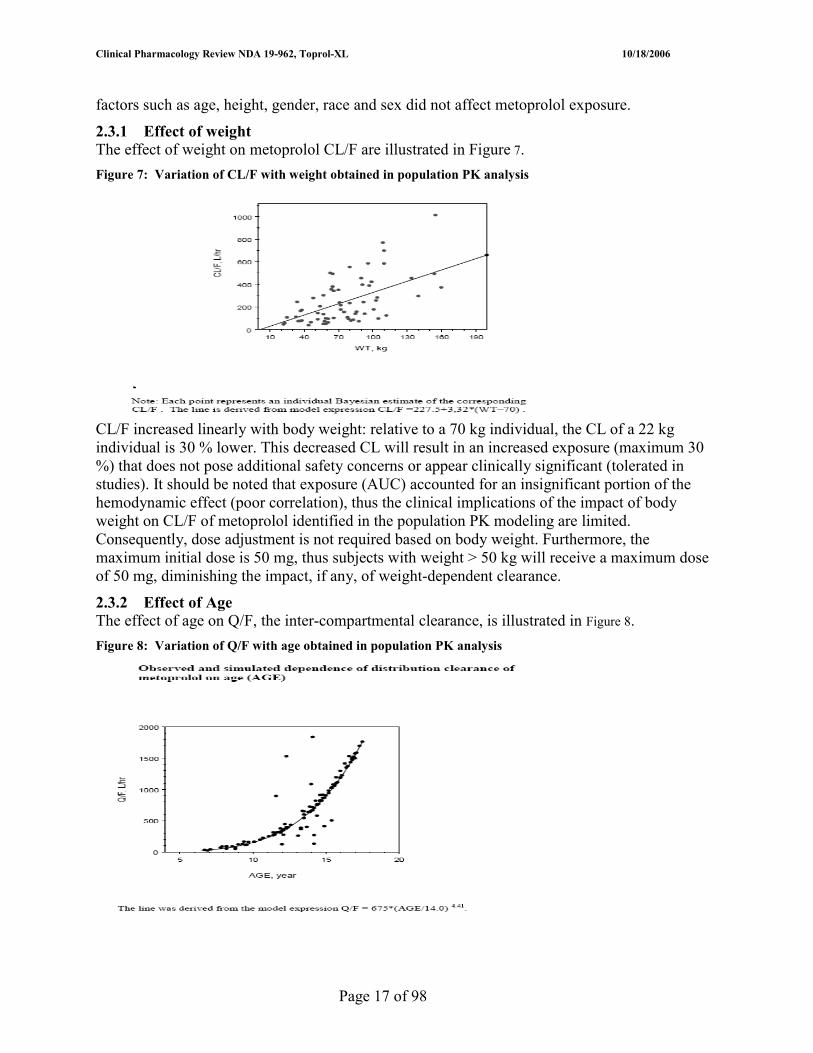
Clinical Pharmacology Review NDA 19-962 Toprol-XL 10182006
(b) (4)
TOPROL-XL is not recommended in pediatric patients lt 6 years of age (see CLINICAL PHARMACOLOGY Pharmacokinetics and PRECAUTIONS Pediatric Use)
Page 21 of 98
Clinical Pharmacology Review NDA 19-962 Toprol-XL 10182006
4 APPENDICES
41 Sponsorrsquos Proposed Label
17 Page(s) of Draft Labeling has been Withheld in Full as B4 (CCITS) immediately following this page
Page 22 of 98
Clinical Pharmacology Review NDA 19-962 Toprol-XL 10182006
42 Pharmacometrics Review
Page 40 of 98
Clinical Pharmacology Review NDA 19-962 Toprol-XL 10182006
Office of Clinical Pharmacology Pharmacometrics Review
NDAIND 19-962 Volume Not applicable submitted electronically POP PK Report in Section 5335 (Network Path Cdsesub1n19962N_0002006-05-15hpbiohupharm) Compound Metoprolol succinate Submission Dates 05152006 Sponsor Astra Zeneca Pharmacometrics Reviewer Robert Kumi PhD Secondary Reviewer Yaning Wang PhD
TABLE OF CONTENTS
OFICE OF CLINICAL PHARMACOLOGY PHARMACOMETRICS REVIEW 41
EXECUTIVE SUMMARY 42
OVERALL CONCLUSIONS 43
INTRODUCTION 46
OBJECTIVES OF THE ANALYSIS 48
DOSE-RESPONSE ANALYSIS 49
METHODS (POPULATION PKPD) 60
RESULTS AND DISCUSSION 73
RECOMMENDATIONS 87
APPENDIX 90
DCP1PM Page 41 10182006
Clinical Pharmacology Review NDA 19-962 Toprol-XL 10182006
Executive Summary In NDA SE5 033 the applicant Astra Zeneca has proposed changes to the currently approved labeling for TOPROL-XL metoprolol succinate extended release
(b) (4)
tablets Metoprolol a beta blocker is approved for hypertension angina and heart failure in adults In adults with hypertension the usual initial dosage is 25 to 100 mg daily (single dose) as monotherapy or in combination with a diuretic this dosage is titrated at weekly intervals until optimum blood pressure reduction is achieved The current application focuses on Toprol-XL use in pediatric patients ge six years old The initial proposed dosing in children six and older is 10 mgkg subsequently the dose is titrated based on clinical response
Two clinical trials Studies 307A (dose-response) and 307B (safety extension of 307A) were conducted in pediatric patients with hypertension to support the proposed labeling changes The applicant conducted dose-response population PK (n = 120 patients) and PKPD (n = 65 patients) analyses using data from pediatric hypertensive patients receiving Toprol-XL in the mentioned studies
Key Findings from the Dose-Response and Population PKPD analyses follow 1 Dose-Response A statistically significant dose-response did not exist for placebo
(pooled)ndashcorrected ∆SBP from baseline however the relationship was evident when placebo (specific-group) ndashcorrected data were used
2 PK Model Metoprolol PK in children were well characterized by a 2shycompartment model with flip-flop first-order absorption and an absorption lag time The model yielded precise parameter estimates
3 Covariates Sex age race body weight and Toprol-XL dose had no clinically significant effect on metoprolol PK
4 PKPD Model Using a log-linear model or linear model there were weak but statistically significant relationships between the changes in DBP and SBP and measures of metoprolol plasma exposure (Ctrough AUC0ndash24 and Cmax) Overall parameters were not precisely estimated in most models due to a high degree of variability in the blood pressure data
DCP1PM Page 42 10182006
Clinical Pharmacology Review NDA 19-962 Toprol-XL 10182006
Overall Conclusions 1 Were metoprolol PK adequately characterized in the pediatric population Metoprolol PK in pediatric patients (n = 120 Age 6 to 17) were adequately characterized using a population pharmacokinetic approach The population model was validated and qualified and comprised a 2-compartment open model with first order absorption and absorption lag time
2 Are there any covariates that influence metoprolol PK in pediatric patients with hypertension The two covariates that influenced metoprolol PK were weight and age apparent oral clearance increased linearly with body weight and inter-compartmental clearance increased with age according to a power function Other covariates including race sex and metoprolol dose did not impact metoprolol kinetics
3 Was a PKPD relationship established between metoprolol dose or plasma exposure( AUC Ctrough or Cmax) and hemodynamic measures (blood pressure) Using a simple linear regression model no dose-response (reduction in placebo corrected systolic blood pressure the primary outcome variable) was observed although a weak (R2 lt 01) but statistically significant (p lt 005) PKPD relationship was observed between metoprolol exposure measures and reduction in systolic blood pressure The small R2 value indicates metoprolol exposure could account for only a small portion of the hemodynamic effect According to the model as exposure increased there was greater reduction in blood pressure However only the relationship with AUC was considered reliable as AUC was estimated with good precision (PK modeling) whereas Cmax was not
4 Is there sufficient evidence to support effectiveness of Toprol XL in pediatrics and the initial proposed pediatric dosage Yes Although dose-response was not established with SBP reduction (primary variable) suggesting that the effectiveness of the individual tested Toprol-XL doses could not be differentiated the following information provides evidence to suggest that some Toprol-XL doses were more effective than placebo
bull Analysis of treatment group effects and pairwise comparisons suggested that overall Toprol-XL demonstrated effectiveness in pediatric patients with hypertension pooled Toprol groups vs placebo (p = 00351) and relative to baseline each active Toprol-XL dose group decreased SBP whereas placebo did not
bull There was a dose-response relationship for reduction in diastolic blood pressure typically systolic and diastolic blood pressure effects mirror each other
bull PKPD findings (reduction in SBP and heart rate as a function of AUC) support metoprolol effectiveness (increased exposure led to increased effectiveness) The heart rate effect supports metoprololrsquos known beta blocking activity
bull Generally Toprol-XL was effective in pediatric patients and adult patients at similar metoprolol exposure levels 02 mgkg in pediatrics was minimally effective because this dose yielded exposures lower than that obtained in adults at the lowest effect adult dose 25 mg
DCP1PM Page 43 10182006
Clinical Pharmacology Review NDA 19-962 Toprol-XL 10182006
bull The proposed pediatric dosage 10 mgkg is supported by the results from the dose-response study Visual inspection and pairwise comparisons indicated that 10 mgkg (placebo corrected) was statistically the most effective dose (greater efficacy than 02 mgkg and 20 mgkg) and was more effective than placebo (p = 0027)
5 Will initial dosage adjustment be required for any pediatric patients prior to titration No dosage adjustment does not appear necessary prior to titration (typically one week after treatment begins) Based on the population PK model the only potentially relevant factor that could affect PK was body weight CLF increased linearly with body weight relative to a 70 kg individual the CL of a 22 kg individual is 30 lower This decreased CL will result in an increased exposure (maximum 30 ) that does not pose additional safety concerns or appear clinically significant (tolerated in studies) The proposed starting dose 10 mgkg and doses up to 20 mgkg (maximum 200 mg) were tolerated in the clinical trials (307A and 307B) Furthermore exposure accounted for an insignificant portion of the hemodynamic effect (poor correlation) thus the clinical implications of the impact of body weight on CLF of metoprolol identified in the population PK modeling are limited
to a higher and tolerable dose until optimum BP reduction is achieved is reasonable This
(b) (4)The proposal to start Toprol-XL at a low dose and titrate
is consistent with labeling for adults
6 Was the PKPD relationship influenced by covariates Insufficient data were available to make this assessment
7 Are the PK and PKPD of metoprolol in children comparable to that in adults PK values obtained in pediatric patients were generally in the same range as those reported in adults Potential limitations of the comparison are the different modeling approaches populations number of samples and number of subjects in the trials (Table B)
It is difficult to make definitive PKPD comparisons between the pediatric (studied in this NDA) and adult population because
1 Study conditions differ- typically in adult studies HR is measured during exercise and not at rest
2 Results are obtained in healthy adult subjects rather than hypertensive patients 3 Insufficient number of studies have been reported in the literature that attempt to
identify the relationship between metoprolol exposure and SBP or DBP effect in adults
DCP1PM Page 44 10182006
Clinical Pharmacology Review NDA 19-962 Toprol-XL 10182006
Table B PK Comparisons (Pediatrics vs Adults) Source NDA 19962 Luzier et al Taguchi et al Plosker and Cissold
and other sources Model 2 Comp 1st
Order absorption 1 Comp
Formulation Toprol XL IR IR PK Analyses Population StandardNCA Population Standard Population Pediatric Healthy adults Japanese geriatric Sampling Intense and
Ctrough Intensive Sparse intensive
CLF (Lhrkg) 338 116 ndash 340 094 V2F (Lkg) 128 270 ndash 398 452 V3F 851 333 ndash 809 QF (Lhr) 899 282 ndash 694 Ka (h-1) 00467 Tlag (h) 0853 T12 (h) 351 3 - 6 Tmax (h) 25 ndash 73 Covariate Effects on CLF Age None Yes YesNo Gender Effect None Yes Race None The applicant noted that pediatric data were compared to adult data from IR where CLF is dominated by the disposition function of metoprolol therefore it may be complicated to compare adult data to pediatric data (Toprol XL) where CLF is under a considerable influence from the release rate (input function) of the device This appears to be a valid caveat
It should be noted that the cause of hypertension in adults differs from that in children Results of the pediatric modeling exercise showed that a log-linear model appeared to work better than other models for both SBP and DBP In adults the Sigmoidal Emax model has been successfully applied Using the Hill Equation (Sigmoidal Emax model) with EHR reduction (measure of beta blockade) as the PD marker in adults EC50 = 105 nmolL (281 ngmL) and Emax is achieved at metoprolol plasma concentrations gt 400 nmolL (107 ngmL) Placebo-corrected mean blood pressure changes (standing) associated with concentrations producing maximal blockade are -10 for systolic and ndash 4 for diastolic In the pediatric study the observed maximal mean reductions (placebo corrected) at the studied doses were approximately -6 for systolic and -5 for diastolic Hence it appears the studied pediatric doses produce comparable changes in diastolic pressure but lower changes in systolic pressure It should be noted that in the pediatric studies only a few metoprolol plasma concentrations were gt than 107 ngmL It is unlikely that the maximal activity was achieved at the doses studied yet the Toprol doses appeared effective The differential maximal effects may also be due to the difference in initial SBP (adults patients with hypertension tend to have higher initial BPs) in adult and pediatric studies there was a dependence of change in SBP on initial SBP
DCP1PM Page 45 10182006
Clinical Pharmacology Review NDA 19-962 Toprol-XL 10182006
Introduction Summary
(b) (4)NDA SE5 033 was submitted to seek approval of labeling changes to the currently approved labeling for TOPROL-XL This labeling translates to a new Toprol-XL indication for pediatric patients (6 years and older) with hypertension
Background on Metoprolol in Hypertension The majority of the following information was obtained form a Review article (sponsor provided) by Plosker and Clissold [Drugs 43(3) 382-414 1992)]
Table 1 Snapshot of Metoprolol Clinical Pharmacology and Biopharmaceutics Drug Class Metoprolol is a szlig1-selective (cardio selective) adrenergic receptor-
blocking agent Mechanism of Action (antihypertensive effect)
Multiple putative mechanisms competitive antagonism of catecholamine at peripheral sites reduction of sympathetic outflow to the periphery or suppression of renin activity
Approved Indications Hypertension Heart Failure and Angina Pectoris Approved Formulations Immediate Release (IR) ndash metoprolol tartrate
Controlled Release (CRZ0K) Toprol-XL is extended-release tablet of metoprolol as the succinate salt
Metabolism Via CYP2D6 primarily Absorption Absolute oral bioavailability ~ 50 following IR Food does not affect
metoprolol absorption using ER formulation Distribution Protein binding to albumin is about 12 Elimination For IR t12 from 3 ndash 7 hours Less than 5 dose excreted unchanged
in urine No t12 values for ER this may be due to difficulty in separating absorption and elimination phases
Variability Plasma levels are highly variable among subjects after oral administration
Age Effects PK of metoprolol not affected by age (20 to 65 years) but concentration of active metabolite in subjects gt 65 years about twice as high as those in younger although metoprolol concentrations similar in two groups (Regardh et al)
PKPD in children Limited information in children and provided mainly after administration of metoprolol tartrate
Summarized PK and PKPD Information in Adults Table 2 Reported PK Values in Adults (multiple references)
References include Abrahamsson et al Sandberg et al Wieselgren et al
DCP1PM Page 46 10182006
Clinical Pharmacology Review NDA 19-962 Toprol-XL 10182006
Table 3 PKPD Information Reference Key Findings Abrahamsson et al Therapeutic level of szlig1blockade (model- reduction in exercise heart
rate or EHR) is between 80 and 300 nM Sandberg et al Toprol XL is designed to deliver metoprolol succinate at a near
constant rate for about 20 hr Wieselgren et al In healthy males maximal EHR ~ 14 and minimum reduction ~ 9
with 50 mg Activity greater than placebo over 24 hour period Dayer et al Lennard et al Jonkers et al
Poor metabolizers have a higher plasma concentration and a greater duration or degree of beta blockade Potential implications for use of extended release as may not be needed in PMs
Various sources Toprol XL produces clinically and statistically significant reductions in blood pressure values compared to baseline values The maximal blood pressure lowering effect for a given dose in adults is observed between 1 and 4 weeks of treatment In 4 week trials with Toprol XL the maximum decrease in supine BP was 209 and standing was 129 (unclear if at trough) At trough following 4 weeks of 50 mg QD Toprol XL relative to placebo the reduction in supine BP was 112 and 103 in Standing
Summary of sponsorrsquos current analysis relevant to pharmacometrics and resulting claims
Dose-Response Analysis A dose-response analysis was conducted using a simple linear regression model where metoprolol dose in mgkg was the independent variable Week 4 placebo corrected change in blood pressure (diastolic or systolic) from baseline was the dependent variable (response)
Sponsorrsquos Analysis Claims (Dose-Response Study) Following administration of TOPROL-XL at doses of 125 to 200 mg once daily for up to 4 weeks metoprolol
bull Exhibited a significant dose-response relationship for DBP but none for SBP bull Produced statistically significant and clinically meaningful reductions in SBP and
DBP for some individual andor pooled target dose groups (02 10 and 20 mgkg)
Population PK and PKPD Analyses The sponsorrsquos population PK and PKPD analyses involved the use of typical population PK approaches Primarily SAS and NONMEM were used to run the analyses In brief the sponsor pooled plasma concentration time data from patients in Study 307A (trough samples) and 307B (trough samples in most subjects and serial samples in a subset of patients) for the PK modeling PKPD (PD measured primarily as changes in blood pressure) data were from patients in Study 307A These collective data were used in the population PK and PKPD analyses
Initially the sponsor identified the best PK structural population model by testing several pharmacokinetic models This model was further refined by eliminating error terms (etas) that were not statistically significant Subsequently the sponsor evaluated the effect of DCP1PM Page 47 10182006
Clinical Pharmacology Review NDA 19-962 Toprol-XL 10182006
covariates on the PK model and developed a final PK model The goodness of the fit of the model was assessed with standard procedures The final population model was used to simulate individual plasma concentration-time profiles and Bayesian estimates for Cmax and AUC for all patients These simulated AUC and Cmax values and actual (observed) Ctrough were used in the PKPD model The PKPD model was developed in a similar manner as the population PK model Initially the best PKPD base model was identified and the model refined until a final PKPD model was identified
Sponsorrsquos Analysis Claims (Population PK and PD Modeling) 1 A 2-compartment PK model with first-order elimination and flip-flop first-order
absorption and lag time best fit metoprolol concentration-time data obtained from the studied pediatric hypertensive patients
2 The following tabulated parameter estimates were obtained using the final population PK model CLF 2275 Lhr V2F 961 L V3F 620 L QF 675 Lh Ka 00467 hrndash1 Tlag1 0853 hr
These PK values were generally in the same range as those reported in adults
3 Sex race ideal body weight and Toprol-XL dose have no significant effect on metoprolol pharmacokinetics No covariate impacts V2F V3F Ka or the Tlag of metoprolol Age has no effect on metoprolol CLF and body weight has no effect on QF Metoprolol CLF increases linearly with body weight however no dose adjustment based upon body weight is necessary because dosage is titrated based on clinical response QF is proportional to age however the increase in QF with age is not clinically relevant
4 Weak but statistically significant relationships existed between DBP SBP and HR and some measures of metoprolol exposure (trough plasma levels Cmax and AUC(0ndash 24)) Because of high variability in the hemodynamic data goodness-of-fit of the PKPD models was generally poor and the resulting parameter estimates were not considered reliable Extrapolation of these model parameters in the clinic for dose adjustment is not recommended
5 No covariates had an impact on the parameters delineating the PKPD relationship between metoprolol exposure and DBP SBP and HR
Objectives of the analysis There are three specific goals of the PM analysis
1 To evaluate the adequacy of the sponsorrsquos dose-response analysis 2 To evaluate sponsorrsquos population PK analysis and determine if PK labeling claims
are acceptable DCP1PM Page 48 10182006
Clinical Pharmacology Review NDA 19-962 Toprol-XL 10182006
3 To evaluate sponsorrsquos population PKPD analyses and determine if the findings support the proposed dosing recommendation
Dose Response Analysis (Study 307A) Title Dose Ranging Safety and Tolerability of TOPROL-XLreg
(metoprolol succinate) Extended-release Tablets (metoprolol CRXL) in Hypertensive Pediatric Subjects A Multicenter Double-blind Placebo-controlled Randomized Parallel-group Study
Study Duration 30 May 2002 - 9 June 2004 Investigators (primary) Bonita E Falkner MD and Jonathan Sorof MD 1800 Sites Multiple locations (36 in US and 1 in Dominican Republic)
Table 1 Objectives and Outcomes for Study 307A
Study Design (FDA-approved Type A design) This was a multi-center international double-blind placebo-controlled randomized parallel-group study The study included a screening visit a 1- to 2-week single-blind placebo run-in period during which all previous antihypertensive medications were discontinued and a 4-week double-blind treatment period At the end of the placebo run-in period eligible patients with blood pressure (BP) measurements in the qualifying range were randomized in a 1212 ratio to receive once daily oral doses of placebo TOPROL-XL 02 mgkg TOPROL-XL 10 mgkg or TOPROL-XL 20 mgkg TOPROL-XL doses of 125 25 375 50 75 100 150 or 200 mg were used to approximate the target doses Patients in the placebo and TOPROL-XL 02 mgkg groups received the target dose for 4 weeks while patients in the TOPROL-XL 10 mgkg and
DCP1PM Page 49 10182006
Clinical Pharmacology Review NDA 19-962 Toprol-XL 10182006
20 mgkg groups had their dose up-titrated (based on weight) to the target dose over the first 1 to 2 weeks of double-blind treatment
Reviewer Note Rationale on Study design The inclusion of more patients in the TOPROL-XL 02 mgkg and 20 mgkg groups allowed better estimation of the dose response at the low and high ends of the dose range The TOPROL-XL 10 mgkg group with fewer patients provided a middle estimate that helped to describe the shape of the dose-response curve However having a fewer number of subjects may have contributed to variability Inclusion of a placebo control group allowed for the quantification of treatment-related BP reductions after adjusting for placebo effect It should be noted that the placebo groups were not identical as they followed different titration schedules and had a different number of tablets
The 02 mgkg dose is lower than the lowest approved adult dose on a mgkg basis (assuming 70 kg adult weight) but the highest studied pediatric dose 20 mgkg (200 mg limit was placed) is lower than the highest studied adult dosage 400 mg
Table 2 Toprol Dosing Scheme for Study 307A
Table 3 Formulations used in 307A
DCP1PM Page 50 10182006
Clinical Pharmacology Review NDA 19-962 Toprol-XL 10182006
SPONSORrsquoS STATISTICAL ANALYSIS PLAN HIGHLIGHTS bull The primary analysis used an intention-to-treat (ITT) population which included
all patients who received at least 1 dose of study medication and had baseline and at least 1 post baseline measurement For this analysis missing data were imputed using a last observation carried forward (LOCF) approach
bull A simple linear regression analysis was performed on the placebo-corrected change from baseline to Week 4LOCF in sitting SBP and sitting DBP with dose ratio as the explanatory variable
bull The placebo correction for placebo-corrected changes from baseline to Week 4 LOCF in sitting SBP and sitting DBP was performed by subtracting the mean change from baseline for the placebo group from the individual patient changes in the other treatment groups
bull ANOVA was performed with treatment group as the main factor for the changes from baseline to each post baseline visit in sitting SBP and DBP This ANOVA model was used to construct pairwise comparisons of each active treatment versus placebo and the active treatment groups combined versus placebo
bull The percentage of responders at Week 4 was summarized by frequency counts percentages and 95 confidence intervals (CI) for each treatment group
bull Subgroup analyses were also performed on the changes from baseline at Week 4 in sitting SBP and DBP and the influence of heart rate and baseline body mass index (BMI) on the mean changes from baseline to Week 4LOCF in sitting SBP and DBP were examined using linear regressions
bull Trough plasma concentrations of metoprolol were summarized descriptively and the lower limit of quantitation (LLQ) was 1 ngmL
bull Safety data were summarized using the safety population defined as all patients who received at least 1 dose of study medication and were not lost to follow-up No statistical analyses were performed on the safety data in this study
DCP1PM Page 51 10182006
Clinical Pharmacology Review NDA 19-962 Toprol-XL 10182006
Results Patient Disposition Per applicant patients recruited into this study were representative of a pediatric population with hypertension The four treatment groups were balanced with respect to demographic and baseline characteristics (Tables 4 and 5) About 80 percent of the patients were considered 90 compliant
Table 4 Baseline Characteristics in Study 307A
Table 5 Sitting SBP and DBP measurements at baseline
Sitting and standing BP measurement were comparable (eg mean SBP for all patients- sitting = 1319 and standing 1306 with similar CVs ~ 9 )
Primary Efficacy Variable The results for the primary efficacy variable are illustrated in Figure 1 Figure Dose response for placebo-corrected change from baseline to Week4LOCF for sitting SBP (ITT population)
DCP1PM Page 52 10182006
Clinical Pharmacology Review NDA 19-962 Toprol-XL 10182006
Figure 1 Change in SBP from baseline as a function of Toprol XL dose
Table 6 Linear regressions statistics used to assess Dose-Response
The results indicate that bull The slope of the curve is not different form zero (p = 05371 for dose ratio)
suggesting that there is no dose-response relationship bull Most active treatment groups are more effective than placebo in reducing SBP
By visual inspection it appears the lack of observed dose-response is mainly driven by a lower than expected response at the 20 mgkg level
Potential issues affecting efficacy and pharmacokinetic results bull LOCF was required for eight patients however the LOCF approach did not
greatly impact the outcome of the trial bull Patients assigned to the 10 mg and 20 mgkg dose received drug for only 2
weeks whereas dose in the 02 mgkg received the same dose for 4 weeks
DCP1PM Page 53 10182006
Clinical Pharmacology Review NDA 19-962 Toprol-XL 10182006
Reviewerrsquos Supplemental Dose-Response Analyses The sponsorrsquos dose-response analysis was successfully reproduced by this Reviewer using pooled placebo corrected data A supplemental analysis was conducted using group-specific placebo corrected data In this procedure data for subjects assigned to a given Active Group (eg 02 mgkg) were corrected with Placebo data (02 mgkg) Group specific placebo data are presented in Table 7
Table 7 Placebo-group specific data Placebo Group Frequency Delta SBP 02 mgkg 8 -567 10 mgkg 6 -300 20 mgkg 9 230
It should be noted that the group-specific placebo data appeared to follow a consistent trend where the placebo effect decreased with increasing number of tablets It is unclear if this titrationtablet-dependent placebo effect is valid or random Overall the apparent differential placebo effects suggest that the placebo group may have overly influenced the outcome of the dose-response analysis
When active groups are corrected using group-matched placebo data there is a statistically significant dose-response The dose response using group-specific placebo data is illustrated in Table 8 and Figure 2
Figure 2 Placebo corrected changes in SBP (chg_pc on y axis) as a function of dose ratio
Potential Limitations of Supplemental Analyses Typically placebo effects are constant if randomization is correct thus it is unclear if subsetting the placebo group is acceptable and did not increase bias Additionally subsetting the placebo group leads to a reduced number of placebo subjects per dose group that may impact the regression analyses
DCP1PM Page 54 10182006
Clinical Pharmacology Review NDA 19-962 Toprol-XL 10182006
Table 8 SAS output for regression analyses using group-specific placebo corrections The REG Procedure
Model MODEL1
Dependent Variable chg_pc
Number of Observations Read 117
Number of Observations Used 117
Analysis of Variance
Sum of Mean
Source DF Squares Square F Value Pr gt F
Model 1 191083177 191083177 2663 lt0001
Error 115 825109481 7174865
Corrected Total 116 10162
Root MSE 847046 R-Square 01880
Dependent Mean -430358 Adj R-Sq 01810
Coeff Var -19682365
Parameter Estimates
Parameter Standard
Variable Label DF Estimate Error t Value Pr gt |t|
Intercept Intercept 1 125480 133166 094 03480
DOSRATIO Dose Ratio 1 -100051 019387 -516 lt0001
Secondary variables
bull Placebo-corrected change from baseline in sitting DBP The mean plusmn SD change (Week 4LOCF) in sitting DBP is illustrated in Figure 3 and Table 9
Figure 3 Mean changes (actual and placebo-corrected) from baseline to Week 4LOCF for sitting DBP (ITT population)
DCP1PM Page 55 10182006
Clinical Pharmacology Review NDA 19-962 Toprol-XL 10182006
Table 9 SAS output for regression analyses for DBP with pooled placebo correction
Treatment group effects and pairwise comparisons for sitting SBP and DBP Results of the treatment group effects at the Week 4LOCF visit and the pairwise comparisons between each TOPROL-XL group and placebo for the change from baseline in sitting SBP and DBP are shown for the ITT population in Table 10
Table 10 Treatment group effects for change in baseline to Week 4LOCF for sitting SBP and DBP (ITT population)
Some key findings from the pair-wise comparison are as follows (Table 10) 1 All active groups produced statistically significant reductions from baseline in sitting
SBP and DBP at the Week 4LOCF visit whereas placebo did not
DCP1PM Page 56 10182006
Clinical Pharmacology Review NDA 19-962 Toprol-XL 10182006
2 Overall the mean change from baseline in sitting SBP at Week 4LOCF for the TOPROL-XL groups pooled was statistically significantly larger than that for the placebo group (p=00351)
3 Results of pairwise comparisons between individual TOPROL-XL dose groups and placebo also revealed a statistically significant difference for the 10 and 20 mgkg groups (p=00270 and p=00492 respectively)
bull Mean changes over time in sitting SBP and DBP Consistent with findings from other studies with beta-blockers apparent maximal reduction in blood pressure occurred between 1 and 4 weeks of treatment
Figure 4 Mean changes over time for sitting SBP and DBP (ITT population)
Data points in plot are from absolute values (not taking baseline into account)
Subgroup Analyses The sponsor conducted several exploratory subgroup analyses however these analyses were not reviewed critically and are not presented in this review as
1 they do no impact the primary outcome or study objective 2 they are unlikely to be clinically useful due to the small number of patients per
subgroup One potentially useful some group analyses involved the percentage of responders as defined in Table 11
The responder analyses shows comparable response rates for all active dose groups suggesting similar efficacy across dose groups despite different exposure (doses)
DCP1PM Page 57 10182006
Clinical Pharmacology Review NDA 19-962 Toprol-XL 10182006
Table 11 Number and proportion of responders (ITT population)
Pharmacokinetic Results The Ctrough information obtained in the trial are summarized in Figure 6 and Tables 12 and 13
Table 12 Summary of Ctrough data (per applicant)
Sixteen patients across the 3 TOPROL-XL groups did not have blood samples obtained for analysis of metoprolol concentrations Based on the number of samples BLQ there appeared to be very low concentrations in the lowest dose group It appeared that Ctrough increased with dose According to the applicant these values are similar to those obtained previously in adults especially at the 2 higher doses Variability was high in all treatment groups (CV gt 60 )
Table 12 Summary of Ctrough (Reviewer Generated) from all patients (samples lt LOQ given value = 0) Toprol XL Dose Number of subjects Concentration (ngmL) (mgkg) Mean plusmn SD Median Range 02 39 137 plusmn 294 000 0 ndash 157 10 17 1224 plusmn 1416 845 0 ndash 571 20 46 2462 plusmn 3352 1140 0 ndash 1670
DCP1PM Page 58 10182006
Clinical Pharmacology Review NDA 19-962 Toprol-XL 10182006
Reviewer Note Overall the plasma concentrations (exposure) for the 02 mgkg dose group appear too low to be effective (close to LOQ) It is noted that adults typically have concentrations gt LOQ at the lowest therapeutic dose 25 mg (~ 4 ngmL)
Figure 6 Boxplot of metoprolol Ctrough using samples gt LLQ (per applicant)
Safety Results According to the applicant Toprol XL was well tolerated in the pediatric population as tabulated below
Main Analyses Conclusions bull No dose response was observed for corrected SBP using pooled placebo data
however using group-matched placebo data demonstrated a dose response bull Ctrough increased with dose bull Toprol 10 and 20 mg kg doses were more effective than placebo in reducing
SBP bull The responder rate was comparable across all active dose groups and this rate was
greater than that of placebo
DCP1PM Page 59 10182006
Clinical Pharmacology Review NDA 19-962 Toprol-XL 10182006
Methods Reviewerrsquos Methods Generally this reviewer conducted the analyses in a manner similar to that of the sponsor to confirm the sponsorrsquos findings
Sponsorrsquos Methods
Design Study1 307A
Reviewer Note This study was described in the Dose-Response Assessment (please refer to Page 7 Dose Response Analyses) Consequently only highlights relevant to the population analyses will be included in this section
Study 307A was a 4-week multi-center double-blind placebo-controlled randomized parallel-group study TOPROL-XL (metoprolol succinate) extended-release tablets were given to hypertensive pediatric patients Patients were randomized to double-treatment with a once daily oral dose of placebo or Toprol-XL at 1 of 3 target doses 02 or 20 mgkg The dose range for this study was 125 to 200 mg daily Patients on placebo followed the same schedule as that for their active group comparators
Study Flow Chart
Key Inclusion Criteria School age and adolescent children with reproducible SBP or DBP at or above the 95th percentile using height-adjusted charts for age and weight were eligible
DCP1PM Page 60 10182006
Clinical Pharmacology Review NDA 19-962 Toprol-XL 10182006
Study2 307B
Study 307B was a 52-week multi-center open-label study to determine the safety and pharmacokinetics of TOPROL-XL (metoprolol succinate) extended-release tablets (metoprolol CRXL) in hypertensive pediatric patients The starting dose was 25 mg daily The dose was increased every 2 weeks in increments of 25 mg or 50 mg based on tolerability until BP was controlled or the dose reached 200 mg
Table 1 Study Assessments
At the end of the 52-treatment period all patients had BP measured and a trough plasma level taken 24 hours the last dose of Toprol-XL with the exception of those patients who completed the serial portion at the final visit Among the participants a subgroup of approximately 30 patients was to participate in PK assessments of metoprolol requiring serial blood sampling at any time during the 52 weeks A single dose of 25 mg of Toprol-XL was given orally to those participating patients after a 48-hour washout period After the PK assessments they returned to the main study protocol Data
Study1 307A
4111 Pharmacokinetics A blood sample was to be collected at Visit 7 into a heparinized Vacutainer tube and obtained at 24 hours (plusmn2 hour) following the last dose of study medication (ie trough measurement) for determination of plasma metoprolol concentrations
Study Disposition Chart
DCP1PM Page 61 10182006
Clinical Pharmacology Review NDA 19-962 Toprol-XL 10182006
Table 2 Study Demographics
4112 Pharmacodynamics Primary variable
Sitting SBP determined at trough (24plusmn4 hours Visit 7) served as the primary efficacy assessment The primary measure of effect was the placebo-corrected change from baseline to the end of treatment (Week 4) in trough sitting SBP Each BP determination represented the mean of 3 readings with less than 7 mmHg between the highest and lowest value Blood pressure was measured using a mercury sphygmomanometer with an appropriate size cuff positioned approximately at the level of the heart Every effort was made to have the same individual measure the patientrsquos BP throughout the study if possible At all post randomization visits BP measurements were to be made at trough defined as 24 hours (plusmn4 hours) after receiving study medication All measurements were to be determined prior to the patient taking the scheduled dose of study medication In the
DCP1PM Page 62 10182006
Clinical Pharmacology Review NDA 19-962 Toprol-XL 10182006
event that the patient accidentally took study medication on the day of the scheduled visit the visit was to be rescheduled within 24 to 48 hours
Study2 307B
4113 Pharmacokinetics A 48-hour washout period prior to sampling was required for all patients including patients who entered the 52-week study and then decided to participate in the serial PK portion of the study All patients were to have a 15-mL blood sample collected into a heparinized Vacutainer tube 24 hours (plusmn2 hour) following the last dose of TOPROL-XL (ie trough measurement) at Visit 18 (or a the time of premature discontinuation) except for patients who participated in the serial PK portion of the study and had blood sampling performed at Visit 18 For patients participating in the serial PK portion of the study blood samples (15 mL) were to be collected into heparinized Vacutainer tubes and obtained at Hour 0 (predose) and at 1 2 3 4 6 8 10 and 24 hours after administration of a single 25 mg dose of TOPROL-XL following a 48-hour washout period After the last blood sample was obtained the patient was to startresume the prescribed dose of TOPROL-XL heshe was receiving prior to PK sampling
Patient Disposition Chart (completion or discontinuation)
Overall a total of 31 patients at 8 centers were enrolled in the serial PK portion of the study Of these 31 patients 27 had plasma concentration data available and were included in the analyses Four patients were excluded from the analyses because their plasma concentrations were not quantifiable (Nos 047-009 and 047-021) or because only whole blood samples were analyzed (Nos 005-002 005-003)
DCP1PM Page 63 10182006
Clinical Pharmacology Review NDA 19-962 Toprol-XL 10182006
Table 3 Subject Demographics for Patients Providing Serial Blood Samples
Missing Data Twenty-six patients did not have blood samples obtained for analysis of metoprolol concentrations in either the 16-week (n=7) or 52-week (n=19) studies Among patients with plasma samples 14 (14) in the 52-week study and 13 (13) in the 16-week study had trough plasma metoprolol concentrations that were below the LLQ Therefore data from a total of 99 patients were included in this analysis
Assay Metoprolol plasma levels were assayed using high-performance liquid chromatography tandem mass spectrometric detection methods having limit of quantitation (LOQ) of 1 ngmL The method was validated in the linear range 1 to 1000 ngmL Precision was less than or equal to 109 Accuracy ranged from 940 to 1013 Pharmacodynamics Not applicable
Data Checking SAS was used to format and check data Additionally visual inspection of several randomly selected subject data was carried out
DCP1PM Page 64 10182006
Clinical Pharmacology Review NDA 19-962 Toprol-XL 10182006
Models
Overview The sponsorrsquos stated assumptions underlying this modeling analysis are
1 Rich sampling data collected from 30 subjects in 307B Study can be used to adequately characterize the structural pharmacokinetic model of metoprolol
2 Structural pharmacokinetic models of metoprolol at other dose strength are identical to that at 25 mg
3 Metoprolol exhibits a linear pharmacokinetics in the dose ranges studied 4 Steady-state pharmacokinetics of metoprolol has been reached at the time of blood
sampling in Study 307A 5 Metoprolol accounts for the blood pressure effect in the study 6 Existing various disease states in the patients have no impact on the pharmacokinetics
of metoprolol and pharmacodynamics of the blood pressure reduction in the study 7 Concomitant medications if existed do not have any effects on the pharmacokinetics
of metoprolol and pharmacodynamics of the blood pressure reduction in the study
Reviewer Comment The sponsorrsquos assumptions appear reasonable based on existing metoprolol PKPD information
Pharmacokinetics
4114 PK Structural Model Several PK models were tested to identify the structural model Flip-flop absorption was taken into consideration based on general PK characteristics following administration of sustained release tablets and observed data in the current study (serial PK samples)
The models tested included linear 1- and 2-compartment PK models with the following characteristics (focused on flip-flop models)
bull first-order absorption with and without absorption lag time (NONMEM subroutines ADVAN2 and ADVAN4)
bull zero-order absorption with and without absorption lag time (NONMEM subroutines ADVAN1 and ADVAN3)
bull simultaneous zero- and first-order absorption from the absorption compartment The models were parameterized in terms of CLF and VF
Ultimately the 2-compartment model with first order flip-flop absorption an absorption lag time and 2 residual error terms was selected as the structural model of metoprolol The model scheme is presented in the following Figure 1 Figure 1 PK Compartmental Model
DCP1PM Page 65 10182006
Clinical Pharmacology Review NDA 19-962 Toprol-XL 10182006
4115 PK Covariate Model Covariate models were developed to account for the potential impact of the following covariates and derived covariates on metoprolol PK
Continuous variables bull Age (AGE years) bull Body weight (WT kg) bull Body surface area (BSA m2) calculated from WT and HT (cm) using the height
weight formula BSA=0024265 x WT 05378 x HT03964 bull Ideal body weight (IBW kg) calculated as - Males IBW=50+(HTndash150)25 and
for Females IBW=45+(HTndash150)25 bull Dose (DOSE mg of Toprol-XL)
Categorical variables bull Gender (SEX) - Male 0 - Female 1 bull Race (RACE) - Caucasian 0 - Black 1 - Asian 2 - Other 3
PK covariate effects were modeled as follows
Effects of continuous covariates (AGE WT BSA IBW and DOSE) were normalized to the corresponding median value across a dataset such that continuous covariates were related to structural PK parameters in a power function as described below
where Θ is the fixed-effect parameter of a covariate estimated by the NONMEM program covariate value is the observed covariate value and PK typical value is the typical value of the PK parameter estimated by NONMEM Effects of categorical covariates (SEX and RACE) are related to structural PK parameters by fractional changes of dummy variables
DCP1PM Page 66 10182006
Clinical Pharmacology Review NDA 19-962 Toprol-XL 10182006
Where Θ is the fixed-effect parameter of a covariate estimated by the NONMEM program covariate is the dummy variable value and modified in the control streams and PK typical value is the typical value of this PK parameter as estimated by NONMEM
Median values of all covariates in the dataset for population PK analysis are presented in Table A
Table A Summary of patient covariates and Toprol-XL doses in the data for population PK analysis
Two Steps were included in the modeling of covariates
Step 1 Forward Addition The covariates were subjected to a stepwise forward selection algorithm using a likelihood ratio test based on a change in MOF values from the base model A significant covariate reduced the MOF more than 660 (chi-square distribution plt001 degrees of freedom [df]=1)
Step 2 Backward deletion (Excluding procedures for covariate effect) The covariates in the full model acquired in Step 1 were subjected to a backward deletion algorithm 1 covariate was deleted at a time using a likelihood ratio test based on a change in MOF values A covariate was determined to be statistically significant if the change in MOF after its deletion from the breakdown model was increased by more than 1083 (chi-square distribution plt0001 df=1)
4116 PK Random Variance Models An exponential error model was used to characterize inter-patient variability based upon the assumption that random effects for PK parameters were not correlated among PK parameters No other error models for eta were evaluated by the applicant or by this Reviewer The retention of ETA values for each PK parameter in the structural model was confirmed by sequentially fixing each ETA value at zero and comparing each resultant MOF with the MOF obtained when all ETA values were retained in the model (see Table 6)
DCP1PM Page 67 10182006
Clinical Pharmacology Review NDA 19-962 Toprol-XL 10182006
The residual model was modeled by an additive model two error terms were used one for error associated with trough samples and the other with serial samples
Reviewer Note Use of an exponential model appears reasonable
Pharmacodynamics
4117 PKPD Structural Model The equations for the structural models are shown below
1 Metoprolol Ctrough The relationships between the observed metoprolol concentrations (Ctrough) and hemodynamic changes were investigated using 4 direct-link models namely a linear model a log-linear model and Hillrsquos sigmoid Emax PKPD model with and without a baseline
2 The relationships between Cmax or AUC0ndash24 and hemodynamic changes were investigated using 2 direct-link models a linear model and a log-linear model
4118 PKPD Covariate Model The inclusion and exclusion procedures of covariate effect on the selected PKPD base model to obtain a selected final PKPD model were identical to those in the covariate evaluation in the population PK models as described previously in PK Covariate Model DCP1PM Page 68 10182006
Clinical Pharmacology Review NDA 19-962 Toprol-XL 10182006
Table B Baseline demographic and covariate characteristics
4119 PKPD Random Variance Models An exponential error model was used by the applicant to model inter-individual variability The retention of a random effect parameter ETA in each selected PKPD structural model was then evaluated by sequentially fixing each ETA value at zero and comparing each resultant MOF with the MOF obtained when all ETA values were retained in the model (plt005) This step reduced over-parameterization by deleting unnecessary random-effect parameters from the structural model to obtain the base model
Reviewer Note The study design precludes assessment of inter-individual variability or random error because only one dose record was available per patient Consequently the model should not have included eta terms It is noted that the sponsor ultimately dropped the eta term in the final model
DCP1PM Page 69 10182006
Clinical Pharmacology Review NDA 19-962 Toprol-XL 10182006
Model Selection
PK Initial Model Selection
PK Base Model to Final Model The selection of the most appropriate PK base model for a metoprolol PK was based upon the following criteria a significant reduction in MOF as compared to the baseline model and asymptotic chi-square distribution based on the likelihood ratio test or AIC (plt005) as compared to the other structural models This selected PK base model was then subject to a covariate evaluation The population PK model bearing all surviving covariate parameters with statistical significance became the penultimate final model If 1 of the body size parameters (WT BSA and HT) was not in the model the penultimate final model became the final model If body size parameters were in the model they were sequentially replaced by other body size parameters in the regression submodel for each PK parameter The best body size parameter was then selected on the basis of lowest MOF to form the final model
PK Final Model Selection Simulations and visual inspections based on goodness of fit plots were used to qualify and validate the model The goodness-of-fit of the final model was evaluated graphically by comparing population and individual predictions of metoprolol concentrations with observed metoprolol concentrations along the line of unity and by visual inspection of the following plots of population-weighted residuals (WRES) for the final population model 1 Population-weighted residuals (WRES) versus population-predicted concentrations (PRED) 2 WRES versus time after first drug administration in each patient 3 WRES versus all covariates evaluated WRES were generally expected to be distributed homogenously around zero for PRED time after administration and covariates For those 27 patients with serial samples goodness-of-fit of the plasma concentration-time profile for each individual was visually inspected The linear relationship between their AUClast values from the observed data and those from the simulated data (final model) was examined
The predictive performance of the final population PK model including covariates was evaluated by comparing typical values of PK parameters with the mean of individual Bayesian estimates or individual values of PK parameters with the results from non-compartmental analysis for patients with serial samples Steady-state metoprolol plasma concentration-time profiles from 0ndash24 hours at the interval of 15 minutes (025 hour) were calculated using the post hoc Bayesian estimated PK parameter obtained for 65 patients included in the PKPD relationship using the following equation
DCP1PM Page 70 10182006
Clinical Pharmacology Review NDA 19-962 Toprol-XL 10182006
PKPD Initial and Final Model Selection A similar approach to that of PK model selection was adopted for PKPD Each of the above-mentioned PKPD models with random effects was identified by curve-fitting the dataset Initial selection of the PKPD structural model was based upon a significant reduction in MOF (plt005) as compared to the baseline model and reasonable PKPD parameter estimates Software
Nonlinear mixed-effect modeling (NONMEM) software (Version V level 11 Globomax Hanover MD) was used in the population PK analysis PK model fitting was accomplished using first-order (FO) approximation methods For PKPD model fitting the first-order conditional estimation (FOCE) with eta-epsilon interaction method in NONMEM was used for all model runs
SAS software (Version VIII Cary NC) was employed to prepare datasets according to the format required by the NONMEM program (Boeckmann et al 1991) Microsoftreg Excel 2000 (Redmond WA) and S-PLUS 2000 (Professional Release 2 MathSoft Inc Cambridge MA) were used to perform exploratory graphical exposure calculation and statistical analyses according to the format required by the NONMEM program (Boeckmann et al 1991) SAS command files logs and listings pertaining to data file conversion and merging were reviewed by an independent analyst Datasets were stored in SAS data frames combined and exported to Excel and then to ASCII files before fitting to the model
Datasets were prepared and pooled in a NONMEM-compliant format using SAS software by the Programming Group Clinical Information Sciences at AstraZeneca Wilmington Delaware SAS command files logs and listings pertaining to file conversion and merging were provided and found to be acceptable The contents of both datasets (toprolkatcsv for PK modeling and cppd2csv for PKPD modeling) were included
DCP1PM Page 71 10182006
Clinical Pharmacology Review NDA 19-962 Toprol-XL 10182006
toprolkatcsv was not provided electronically in a SAS format however this reviewer generated a similar dataset using the applicantrsquos criteria
Reviewer Comment The software and data assembly methods appeared adequate
DCP1PM Page 72 10182006
Clinical Pharmacology Review NDA 19-962 Toprol-XL 10182006
Results and Discussion Design Adequacy
Overall the trial designs appeared adequate to evaluate metoprolol population PK and PKPD in pediatric patients receiving Toprol XL However the design could have been further optimized by increasing the sampling points particularly in the absorption phase Due to the limited number of samples in the absorption phase it was not possible to accurately characterize the absorption model first order vs zero order or mixed first and zero order Additionally collection of mainly trough samples limits the ability to accurately estimate measures such as Cmax that are not directly related to Ctrough particularly if multiple compartments are present Consequently Cmax estimations are unlikely to be accurate Finally most patients provided only one trough sample thus inter-individual variability could not be adequately captured and may have limited the utility of the modeling exercise particularly in PKPD where the random effect could not be accurately characterized Ultimately there was no random variable in the final PKPD model (ie eta was set to zero) Data Integrity
This reviewer checked the data visually by randomly selecting data from patients included in the population modeling and comparing to data in the study report (source data) Overall the data integrity appeared acceptable The applicant observed the following guidelines that appeared acceptable No datum from any study participant with a protocol violation that was thought to materially impact the analysis was included The dataset contained data from only those study participants who could be evaluated ie with all the last dosing datetime blood sampling datetime plasma drug concentrations and demographic covariates
Data that were excluded (n = 62 samples) from the model were as follows One sample from an apparent poor metabolizer Two samples collected gt 96 hours post dose From 307B 10 trough samples lt LOQ From 307A 17 samples lt LOQ Thirty-samples from serial data that were lt LOQ or whole blood samples Model and Model Selection
Base Model
41110 Pharmacokinetic Model description The base PK model was a standard two compartment model that incorporated lag time and flip-flop kinetics The key features of the model were flip-flop was insured by making the value of ke gt ka in the clearance equation Additionally lag time was restricted to a value of 2 hours or less and concentrations were log transformed consequently all concentrations (F) = 0 were given individual predicted concentrations of zero Finally there were two residual error terms one for serial samples and the other for trough samples DCP1PM Page 73 10182006
Clinical Pharmacology Review NDA 19-962 Toprol-XL 10182006
Key equations were as follows
KA = THETA(1)EXP(ETA(1)) V2 = THETA(2)EXP(ETA(2)) CL = (THETA(1)THETA(2)+THETA(3))EXP(ETA(3)) Q = THETA(4)EXP(ETA(4)) V3 = THETA(5)EXP(ETA(5)) ALAG1=THETA(6)EXP(ETA(6))
41111 PK Parameter estimation results Table 1 Summary of PK parameters in the metoprolol population PK base model (per applicant)
41112 Goodness of fit The applicant provided the following goodness-of-fit plots (Figure 1)
Reviewer Note The goodness-of-fit plots were reproduced by this Reviewer (see Appendix) with minor modifications
Figure 1 Goodness of fit plots for Base Model
DCP1PM Page 74 10182006
Clinical Pharmacology Review NDA 19-962 Toprol-XL 10182006
Base PK Model Selection The MOF values of all structural model candidates tested are presented in Table 2 Model selection was based primarily on MOF values the lower MOF the better the model The applicant reports that in general MOF values generated by a conventional absorption model (ie absorption rate is faster than elimination rate) and a flip-flop absorption model (ie absorption rate is slower than elimination rate) were identical
Reviewer Comment The existence of flip-flop kinetics appears plausible based on data provided and general patterns for sustained release formulations Consequently the use of flip-flop kinetics for the bulk of the modeling exercise appears reasonable
General conclusions from the information in Table 2 are First order input is better than zero order input Two compartment model is better than one compartment model Lag time presence is better than lack of lag time Two residual error terms are better than one residual error term It should also be noted that several other models led to unsatisfactory completion of the run and were not considered further
DCP1PM Page 75 10182006
Clinical Pharmacology Review NDA 19-962 Toprol-XL 10182006
Table 2 Comparison of Structural PK Models
Reviewer Comment The selected structural model appears appropriate based on the data
Base Model The deletion of ETA for V2 did not change the MOF value suggesting that ETA for V2 should be deleted to avoid an over-parameterized warning (Table 3) This was consistent with the estimated parameter value of ETA for V2 being 648 x 10ndash9 a very small value Therefore the base model was selected by deleting the ETA for V2 from the structural model
Reviewer Comment on Eta deletion for V2 Deletion of eta for V2 is acceptable based on the empirical data however from a physiological perspective deletion of eta is problematic Generally one anticipates inter-individual differences in volume of distribution In this case it appears that the error associated with V2 may have been randomly shifted to V3 and or Q terms as the three DCP1PM Page 76 10182006
Clinical Pharmacology Review NDA 19-962 Toprol-XL 10182006
terms are interrelated This potential shift in error is supported by the fact that the V2 eta value increases significantly (by several orders of magnitude- 10-5 vs 100) when eta for Q and or V3 is fixed However when Q or V3 are fixed minimization is successful but Q and V3 are not accurately estimated Accounting for the possible error shift is a complex process and goes beyond the scope of this reviewer thus deletion of eta associated with V2 was considered acceptable for the remainder of the modeling evaluation
Table 3 Structural elements tested in the metoprolol population PK structural model (p lt 0005)
Final PK Model
41113 Model description The key feature of the final model is the inclusion of the covariate effects of age on Q and weight on CL in the population PK model
Key Equations CL = (THETA(1)THETA(2)+THETA(3)+EWT)EXP(ETA(2)) Q = THETA(4)EAGEEXP(ETA(3))
Including Covariate Effects As previously described covariate effects were assessed by forward addition and backward deletion Most covariates did not significantly change MOF however BSA significantly affected CL and Age affected Q Consequently these covariates were included in the penultimate final model
DCP1PM Page 77 10182006
Clinical Pharmacology Review NDA 19-962 Toprol-XL 10182006
Reviewer Note BSA is derived form WT and HT covariates implying BSA is highly correlated to these two covariates (Figure 2) weight is the most suitable (practical covariate) as it is readily measured Furthermore weight and BSA produced the same MOF (Table 4) whereas MOF with height was more positive (less significant)
Figure 2 Plot of BSA vs Body Weight
The data in Table 4 support selection of the final model
Table 4 Covariate elements tested in the metoprolol population PK penultimate final model (plt0005)
The applicant acknowledges that mechanism(s) accounting for the impact of age on QF are not clear However since distribution clearance has little effect on metoprolol plasma exposure further investigation is not needed
41114 PK Parameter estimation results As shown in Table 5 PK parameters were estimated fairly precisely by the final model
Table 5 PK Parameter Estimates using Final Model
DCP1PM Page 78 10182006
Clinical Pharmacology Review NDA 19-962 Toprol-XL 10182006
41115 Goodness of fit The goodness-of-fit plots provided by the applicant show good precision Figure 5 Goodness of fit plots for final PK model
DCP1PM Page 79 10182006
Clinical Pharmacology Review NDA 19-962 Toprol-XL 10182006
PK Model Qualification The post hoc Bayesian-estimated AUC (simulated) obtained for the 27 patients with serial plasma samples are plotted against the observed (AUCt) The correlation was high (R2 gt 099) Figure 6 AUClast from observed data versus AUCt from model simulation in the 27 patients providing serial plasma samples
Regression line Y= 4514 + 08976 X R2 = 09957
The graphical validation of the final metoprolol population PK model validation against covariates evaluated is presented in Figure 6
Figure 7 Graphical validation of covariates
DCP1PM Page 80 10182006
Clinical Pharmacology Review NDA 19-962 Toprol-XL 10182006
There was no systematic bias in weighted residuals for any covariates evaluated suggesting that the final model included all appreciable effects of available covariates (Figure)
The effects of weight on metoprolol CLF are illustrated in Figure 8 where Bayesian post hoc estimates of CLF are plotted against weight and overlaid by the model-predicted line Overall the model appeared to fit the data well
Figure 8 Plot of CLF vs Body weight
The effects of AGE on metoprolol QF are illustrated in Figure 9 where Bayesian post hoc estimates of QF are plotted against AGE and overlaid by the model-predicted line Figure 9 Plot of QF vs Age
DCP1PM Page 81 10182006
Clinical Pharmacology Review NDA 19-962 Toprol-XL 10182006
Reviewer Note The applicant indicated that attempts to run the final model using the first-order conditional estimation method resulted in termination errors Therefore the parameter estimates obtained by the FO method were reported as the final parameter estimates
Conclusion Regarding Population PK Modeling Overall the sponsorrsquos population PK modeling is acceptable
PKPD Model and Model Selection
PKPD Base Model PharmacokineticPharmacodynamic Model description The key feature of the model was a lack of random variance term for the slope (since only single data points were available per subject) and inclusion of baseline effect
Key equations were as follows E0 = THETA(1)EXP(ETA(1)) M = THETA(2) Y = E0 + MLOG(AUC) + EPS(1)
The control stream provided in the appendix is that for DBP (provided by sponsor) The control stream for SBP is comparable with appropriate substitution for BP type
It should be noted that only the log-linear and linear PKPD models were considered suitable for AUC and Cmax For this review only AUC estimates were considered reliable as Cmax estimates could not be accurately determined based on the sampling scheme Consequently the remainder of this review focuses on AUC information although Ctrough and Cmax data are displayed for reference
Bayesian estimates from PK modeling are summarized in Table 1
Table 1 Bayesian estimates of metoprolol PK exposure for those patients included in the PKPD analysis (N=65)
DCP1PM Page 82 10182006
Clinical Pharmacology Review NDA 19-962 Toprol-XL 10182006
PKPD Model Selection (initial and final) The log-linear model was adopted as the base model for this PKPD relationship since it improved the MOF significantly (Table 2) The ETA parameter for the slope was pre-eliminated for the purpose of model parsimony The intercept and slope in this log-linear model for AUC(0-24) did not bear ETA parameter therefore no covariates had impact on either parameter in the model
Reviewer Note The intercept should not have borne an eta term because individual subjects provided only one data point Consequently fixing eta to zero or deleting eta in the final model is appropriate No further model development was required after eta was eliminated and the base model was equivalent to the final model
Table 2 Base population PKPD models tested for the change in SBP
41116 PKPD Parameter estimation results The final PKPD parameter estimates are presented in Table 3
Table 3 Summary parameters in the final PKPD model for the change in SBP using trough plasma level Parameter Explanation Estimate SE ()b
DCP1PM Page 83 10182006
Clinical Pharmacology Review NDA 19-962 Toprol-XL 10182006
Model Qualification Based on the relatively low R2 value and as shown in Figure there is a poor correlation between change in SBP and log AUC
Figure 1 Relationship between change in SBP and AUC (line generated from modeling)
Overall goodness-of-fit of the model was considered to be poor probably due to the high variability in the measurements Consequently the precision of the model parameter estimates was not considered to be very reliable These parameters have little clinical usefulness and can be treated only as an indication of trends ie more hemodynamic effects can be potentially achieved when high Toprol-XL doses are given Clinical dose adjustment based on these PKPD parameters is not recommended
Reviewerrsquos Supplemental Analyses A supplemental PKPD analyses was conducted using simple linear regression since the population model did not improve the fit Overall eta made an insignificant contribution to the overall model The results of the analyses were similar to the population analyses A series of regression analyses were conducted and are presented in Table 4
The applicant notes that the preliminary modeling exercise found that there was no difference in the PKPD modeling results using different hemodynamic data formats (ie change in the measurements percent change in the measurements or actual BP measurements) This finding was confirmed by this reviewer (see Table 4)
DCP1PM Page 84 10182006
Clinical Pharmacology Review NDA 19-962 Toprol-XL 10182006
Table 4 Supplemental PKPD Regression Analyses Conducted by Reviewer Model (liner regression) Intercept (I) Slope (m) R2 Probability RSBP = mISBP + I 3957 -035 01626 0009 PSBP = mISBP + I 2524 -023 01252 00038 PSBP = mRSBP + I 0005 074 09891 lt 00001 RSBP = mlogAUC + I 651 -221 0060 00493 RSBP = mDose + I -751 0006 00026 06878 RSBP = mDose^ + I -312 -111 004 02711 RSBP = mlogAUC + nISBP + I 5303 -221 (m)
-035 (n) 02230 0001
RSBPplc = mAUC + I -667 -0003 00458 00871 RSBPplc = mlogAUC + I 461 -2208 00600 00493 RPUL = mlogAUC + I 1868 -405 01102 00069 Symbols in table similar to population PK model without eta term RSBP- change of SBP without placebo correction ISBP- initial (baseline) SBP RPUL- change in HR without placebo correction Dose- in mg where placebo is included as 0 mg PSBP- percentage change of SBP without placebo correction
Conclusion Regarding Population PKPD Modeling Overall the sponsorrsquos population PKPD modeling is acceptable No dose adjustment conclusion can be made from this modeling however an exposure-response relationship was established for AUC and reduction in SBP
Discussion
The significance of the results 1 Provide estimates of PK measures and plasma exposure in pediatric population These data can be compared to adult exposure to determine if exposure differences impact drug effectiveness The main challenge in comparing pediatric data to adult data is different modeling schemes formulations and methods were used in the two populations
2 PKPD findings are not sufficiently precise to provide a dose adjustment algorithm however the PKPD analyses provides rationale for proposed titration as increasing exposure (doses) may improve efficacy (reduction in SBP) Ultimately the risk-benefit analyses overrides PKPD assessment for dose adjustment drug will be titrated thus reliance on PKPD information is not critical The proposed dose 10 mgkg appears suitable based on available information It is unclear from the studies if there should be an initial maximum dose although the sponsor has proposed 50 mg as the maximum initial dose The proposed pediatric starting dose on a mgkg basis is within the range of starting adult doses (25 ndash 100 mg) assuming an adult weighs 70 kg
3 Cumulative information form dose-response study indicates that Toprol XL has effectiveness in children however the most effective dose is unclear Since the drug can be titrated determining the initial optimal dose does not appear critical As proposed by the applicant dosing is started at a ldquolowrdquo dose that can be up-titrated if needed
DCP1PM Page 85 10182006
Clinical Pharmacology Review NDA 19-962 Toprol-XL 10182006
4 The results did not adequately address the potential impact of CYP2D6 metabolic status for pediatric patients taking Toprol XL There were an insufficient number of patients to make this assessment
5 Covariate effects do not appear significant only body weight significantly affects clearance However a worst case scenario can occur with a person that has a low body weight and is a poor metabolizer this will result in very high possibly supra-therapeutic exposure Age does not impact apparent oral clearance so an age-dependent dose adjustment is not needed for children over 6 years old In essence all children over six years old can initiate therapy at 10 mgkg
The validity of the results Overall the results produced by the sponsor appear valid and the sponsor used a sound modeling approach However alternative approaches that could have been adopted may have improved the outcome of the analyses Three of these approaches are presented below 1 Additional PK samples should have been collected during the absorption phase and
throughout the dosing interval to improve the modelrsquos performance Specifically additional samples collected during the absorption phase may have unambiguously identified the actual absorption input function (eg first order zero order mixed first and zero order) First order input was selected for the analyses although the dosage form is reported to exhibit zero order kinetics in adults It is possible that the input rate in children differs from that in adults but unlikely It should be noted that absorption kinetics in children is often erratic due to multiple factors (eg regioshyselective absorption incomplete gastric emptying and inconsistent absorption) so it is unclear if additional samples would have definitively identified the absorption function However additional non-trough samples may have helped in estimating key PK measures such as V and Cmax The final model did not have an eta associated with V which is atypical Collection of additional samples on different visits may have helped estimate potential inter-occasion variability It should be noted that AUC was estimated precisely for subjects providing serial samples but these subjects were not necessarily included in the PKPD analyses Ideally the PKPD modeling should have been conducted primarily in subjects who had accurate PK measures
2 The PKPD design could have been modified to potentially improve the utility of the analyses Specifically there should have been better placebo matching procedures to minimize the potential impact of the placebo effect This matching could have been improved by ensuring all patients on placebo had the same titration schedule and number of tablets It is noted that the model had a poor predictive performance that was mainly attributed to the high degree of variability in the PD measures Potentially other PD markers could have been explored that have less inherent variability One such marker is the degree of beta blockade using exercise heart rate (EHR) reduction this marker has been used extensively for metoprolol in adult subjects However use of EHR in the pediatric setting may be challenging
DCP1PM Page 86 10182006
Clinical Pharmacology Review NDA 19-962 Toprol-XL 10182006
Comments to sponsor
In future pharmacometric studies you should consider the following 1 collect sufficient (multiple) samples from individual subjects to allow assessment
of inter-occasion variability and estimation of inter-individual variability (eta) for all relevant parameters
2 placebo groups should be identically matched across all dose groups (eg same titration schedule and number tablets) to minimize potential bias or differences in the placebo effect
Comments to medical reviewer
1 The sponsor has adequately characterized metoprolol PK in the studied pediatric population The PK characterization could have been further optimized by obtaining additional samples over the entire dosing interval (eg during the absorption phase and elimination phase) on multiple occasions rather than on one occasion primarily at trough
2 A dose-response relationship could not be established using the protocol specified analysis approach The outcome of the dose-response relationship appeared highly dependent on the ldquoplacebo effectrdquo suggesting that the placebo group may not have been appropriate One should consider re-evaluating the dose-response precisely matched placebo groups (eg all placebo patients have identical number of tablets and titration schedule)
3 Based on the PKPD analysis plasma exposure (AUC) explains lt 10 of the response (reduction in systolic blood pressure) thus has limited clinical utility However the PKPD relationship suggests that there is a trend for increased response with increased exposure (dose driven)
4 Overall information from the dose-response study suggests that Toprol- XL is effective in the pediatric population The optimal initial dose 02 10 or 20 mgkg or the maximum safe and effective dose cannot be determined from the information provided It is noted that the 02 mgkg dose is unlikely to be effective as plasma concentrations achieved at this dose are unlikely to be effective (most concentrations lt LOQ and lower than effective adult concentrations) The 10 mgkg (proposed by applicant) appears to be a reasonable initial dose The labeling should reflect the regimens studied
DCP1PM Page 89 10182006
Clinical Pharmacology Review NDA 19-962 Toprol-XL 10182006
Appendix
DCP1PM Page 90 10182006
Clinical Pharmacology Review NDA 19-962 Toprol-XL 10182006
DCP1PM Page 91 10182006
Clinical Pharmacology Review NDA 19-962 Toprol-XL 10182006
DCP1PM Page 92 10182006
Clinical Pharmacology Review NDA 19-962 Toprol-XL 10182006
DCP1PM Page 93 10182006
Clinical Pharmacology Review NDA 19-962 Toprol-XL 10182006
DCP1PM Page 94 10182006
Clinical Pharmacology Review NDA 19-962 Toprol-XL 10182006
DCP1PM Page 95 10182006
Clinical Pharmacology Review NDA 19-962 Toprol-XL 10182006
Table 15 Control streams for final log-linear PKPD model for the change in DBP using metoprolol Cmax as the measure of exposure
Truncated NONMEM reports for base model identification for PKPD relationship in change of SBP (per sponsor)
DCP1PM Page 96 10182006
Clinical Pharmacology Review NDA 19-962 Toprol-XL 10182006
Reported PD information^
^ Under metoprolol regimen CRZ0K is Toprol XL
DCP1PM Page 97 10182006
Clinical Pharmacology Review NDA 19-962 Toprol-XL 10182006
Table Results of randomised double-blind comparative trials evaluating antihypertensive efficacy of metoprolol formulations or other antihypertensives
DCP1PM Page 98 10182006
---------------------------------------------------------------------------------------------------------------------
---------------------------------------------------------------------------------------------------------------------
---------------------
This is a representation of an electronic record that was signed electronically and this page is the manifestation of the electronic signature
s
Robert Kumi 10182006 045635 PM BIOPHARMACEUTICS
Patrick Marroum 10192006 050811 PM BIOPHARMACEUTICS

Clinical Pharmacology Review NDA 19-962 Toprol-XL 10182006
bull The proposed pediatric dosage 10 mgkg is supported by the results from the dose-response study Visual inspection and pairwise comparisons indicated that 10 mgkg (placebo corrected) was statistically the most effective dose (greater efficacy than 02 mgkg and 20 mgkg) and was more effective than placebo (p = 0027)
5 Will initial dosage adjustment be required for any pediatric patients prior to titration No dosage adjustment does not appear necessary prior to titration (typically one week after treatment begins) Based on the population PK model the only potentially relevant factor that could affect PK was body weight CLF increased linearly with body weight relative to a 70 kg individual the CL of a 22 kg individual is 30 lower This decreased CL will result in an increased exposure (maximum 30 ) that does not pose additional safety concerns or appear clinically significant (tolerated in studies) The proposed starting dose 10 mgkg and doses up to 20 mgkg (maximum 200 mg) were tolerated in the clinical trials (307A and 307B) Furthermore exposure accounted for an insignificant portion of the hemodynamic effect (poor correlation) thus the clinical implications of the impact of body weight on CLF of metoprolol identified in the population PK modeling are limited
to a higher and tolerable dose until optimum BP reduction is achieved is reasonable This
(b) (4)The proposal to start Toprol-XL at a low dose and titrate
is consistent with labeling for adults
6 Was the PKPD relationship influenced by covariates Insufficient data were available to make this assessment
7 Are the PK and PKPD of metoprolol in children comparable to that in adults PK values obtained in pediatric patients were generally in the same range as those reported in adults Potential limitations of the comparison are the different modeling approaches populations number of samples and number of subjects in the trials (Table B)
It is difficult to make definitive PKPD comparisons between the pediatric (studied in this NDA) and adult population because
1 Study conditions differ- typically in adult studies HR is measured during exercise and not at rest
2 Results are obtained in healthy adult subjects rather than hypertensive patients 3 Insufficient number of studies have been reported in the literature that attempt to
identify the relationship between metoprolol exposure and SBP or DBP effect in adults
DCP1PM Page 44 10182006
Clinical Pharmacology Review NDA 19-962 Toprol-XL 10182006
Table B PK Comparisons (Pediatrics vs Adults) Source NDA 19962 Luzier et al Taguchi et al Plosker and Cissold
and other sources Model 2 Comp 1st
Order absorption 1 Comp
Formulation Toprol XL IR IR PK Analyses Population StandardNCA Population Standard Population Pediatric Healthy adults Japanese geriatric Sampling Intense and
Ctrough Intensive Sparse intensive
CLF (Lhrkg) 338 116 ndash 340 094 V2F (Lkg) 128 270 ndash 398 452 V3F 851 333 ndash 809 QF (Lhr) 899 282 ndash 694 Ka (h-1) 00467 Tlag (h) 0853 T12 (h) 351 3 - 6 Tmax (h) 25 ndash 73 Covariate Effects on CLF Age None Yes YesNo Gender Effect None Yes Race None The applicant noted that pediatric data were compared to adult data from IR where CLF is dominated by the disposition function of metoprolol therefore it may be complicated to compare adult data to pediatric data (Toprol XL) where CLF is under a considerable influence from the release rate (input function) of the device This appears to be a valid caveat
It should be noted that the cause of hypertension in adults differs from that in children Results of the pediatric modeling exercise showed that a log-linear model appeared to work better than other models for both SBP and DBP In adults the Sigmoidal Emax model has been successfully applied Using the Hill Equation (Sigmoidal Emax model) with EHR reduction (measure of beta blockade) as the PD marker in adults EC50 = 105 nmolL (281 ngmL) and Emax is achieved at metoprolol plasma concentrations gt 400 nmolL (107 ngmL) Placebo-corrected mean blood pressure changes (standing) associated with concentrations producing maximal blockade are -10 for systolic and ndash 4 for diastolic In the pediatric study the observed maximal mean reductions (placebo corrected) at the studied doses were approximately -6 for systolic and -5 for diastolic Hence it appears the studied pediatric doses produce comparable changes in diastolic pressure but lower changes in systolic pressure It should be noted that in the pediatric studies only a few metoprolol plasma concentrations were gt than 107 ngmL It is unlikely that the maximal activity was achieved at the doses studied yet the Toprol doses appeared effective The differential maximal effects may also be due to the difference in initial SBP (adults patients with hypertension tend to have higher initial BPs) in adult and pediatric studies there was a dependence of change in SBP on initial SBP
DCP1PM Page 45 10182006
Clinical Pharmacology Review NDA 19-962 Toprol-XL 10182006
Introduction Summary
(b) (4)NDA SE5 033 was submitted to seek approval of labeling changes to the currently approved labeling for TOPROL-XL This labeling translates to a new Toprol-XL indication for pediatric patients (6 years and older) with hypertension
Background on Metoprolol in Hypertension The majority of the following information was obtained form a Review article (sponsor provided) by Plosker and Clissold [Drugs 43(3) 382-414 1992)]
Table 1 Snapshot of Metoprolol Clinical Pharmacology and Biopharmaceutics Drug Class Metoprolol is a szlig1-selective (cardio selective) adrenergic receptor-
blocking agent Mechanism of Action (antihypertensive effect)
Multiple putative mechanisms competitive antagonism of catecholamine at peripheral sites reduction of sympathetic outflow to the periphery or suppression of renin activity
Approved Indications Hypertension Heart Failure and Angina Pectoris Approved Formulations Immediate Release (IR) ndash metoprolol tartrate
Controlled Release (CRZ0K) Toprol-XL is extended-release tablet of metoprolol as the succinate salt
Metabolism Via CYP2D6 primarily Absorption Absolute oral bioavailability ~ 50 following IR Food does not affect
metoprolol absorption using ER formulation Distribution Protein binding to albumin is about 12 Elimination For IR t12 from 3 ndash 7 hours Less than 5 dose excreted unchanged
in urine No t12 values for ER this may be due to difficulty in separating absorption and elimination phases
Variability Plasma levels are highly variable among subjects after oral administration
Age Effects PK of metoprolol not affected by age (20 to 65 years) but concentration of active metabolite in subjects gt 65 years about twice as high as those in younger although metoprolol concentrations similar in two groups (Regardh et al)
PKPD in children Limited information in children and provided mainly after administration of metoprolol tartrate
Summarized PK and PKPD Information in Adults Table 2 Reported PK Values in Adults (multiple references)
References include Abrahamsson et al Sandberg et al Wieselgren et al
DCP1PM Page 46 10182006
Clinical Pharmacology Review NDA 19-962 Toprol-XL 10182006
Table 3 PKPD Information Reference Key Findings Abrahamsson et al Therapeutic level of szlig1blockade (model- reduction in exercise heart
rate or EHR) is between 80 and 300 nM Sandberg et al Toprol XL is designed to deliver metoprolol succinate at a near
constant rate for about 20 hr Wieselgren et al In healthy males maximal EHR ~ 14 and minimum reduction ~ 9
with 50 mg Activity greater than placebo over 24 hour period Dayer et al Lennard et al Jonkers et al
Poor metabolizers have a higher plasma concentration and a greater duration or degree of beta blockade Potential implications for use of extended release as may not be needed in PMs
Various sources Toprol XL produces clinically and statistically significant reductions in blood pressure values compared to baseline values The maximal blood pressure lowering effect for a given dose in adults is observed between 1 and 4 weeks of treatment In 4 week trials with Toprol XL the maximum decrease in supine BP was 209 and standing was 129 (unclear if at trough) At trough following 4 weeks of 50 mg QD Toprol XL relative to placebo the reduction in supine BP was 112 and 103 in Standing
Summary of sponsorrsquos current analysis relevant to pharmacometrics and resulting claims
Dose-Response Analysis A dose-response analysis was conducted using a simple linear regression model where metoprolol dose in mgkg was the independent variable Week 4 placebo corrected change in blood pressure (diastolic or systolic) from baseline was the dependent variable (response)
Sponsorrsquos Analysis Claims (Dose-Response Study) Following administration of TOPROL-XL at doses of 125 to 200 mg once daily for up to 4 weeks metoprolol
bull Exhibited a significant dose-response relationship for DBP but none for SBP bull Produced statistically significant and clinically meaningful reductions in SBP and
DBP for some individual andor pooled target dose groups (02 10 and 20 mgkg)
Population PK and PKPD Analyses The sponsorrsquos population PK and PKPD analyses involved the use of typical population PK approaches Primarily SAS and NONMEM were used to run the analyses In brief the sponsor pooled plasma concentration time data from patients in Study 307A (trough samples) and 307B (trough samples in most subjects and serial samples in a subset of patients) for the PK modeling PKPD (PD measured primarily as changes in blood pressure) data were from patients in Study 307A These collective data were used in the population PK and PKPD analyses
Initially the sponsor identified the best PK structural population model by testing several pharmacokinetic models This model was further refined by eliminating error terms (etas) that were not statistically significant Subsequently the sponsor evaluated the effect of DCP1PM Page 47 10182006
Clinical Pharmacology Review NDA 19-962 Toprol-XL 10182006
covariates on the PK model and developed a final PK model The goodness of the fit of the model was assessed with standard procedures The final population model was used to simulate individual plasma concentration-time profiles and Bayesian estimates for Cmax and AUC for all patients These simulated AUC and Cmax values and actual (observed) Ctrough were used in the PKPD model The PKPD model was developed in a similar manner as the population PK model Initially the best PKPD base model was identified and the model refined until a final PKPD model was identified
Sponsorrsquos Analysis Claims (Population PK and PD Modeling) 1 A 2-compartment PK model with first-order elimination and flip-flop first-order
absorption and lag time best fit metoprolol concentration-time data obtained from the studied pediatric hypertensive patients
2 The following tabulated parameter estimates were obtained using the final population PK model CLF 2275 Lhr V2F 961 L V3F 620 L QF 675 Lh Ka 00467 hrndash1 Tlag1 0853 hr
These PK values were generally in the same range as those reported in adults
3 Sex race ideal body weight and Toprol-XL dose have no significant effect on metoprolol pharmacokinetics No covariate impacts V2F V3F Ka or the Tlag of metoprolol Age has no effect on metoprolol CLF and body weight has no effect on QF Metoprolol CLF increases linearly with body weight however no dose adjustment based upon body weight is necessary because dosage is titrated based on clinical response QF is proportional to age however the increase in QF with age is not clinically relevant
4 Weak but statistically significant relationships existed between DBP SBP and HR and some measures of metoprolol exposure (trough plasma levels Cmax and AUC(0ndash 24)) Because of high variability in the hemodynamic data goodness-of-fit of the PKPD models was generally poor and the resulting parameter estimates were not considered reliable Extrapolation of these model parameters in the clinic for dose adjustment is not recommended
5 No covariates had an impact on the parameters delineating the PKPD relationship between metoprolol exposure and DBP SBP and HR
Objectives of the analysis There are three specific goals of the PM analysis
1 To evaluate the adequacy of the sponsorrsquos dose-response analysis 2 To evaluate sponsorrsquos population PK analysis and determine if PK labeling claims
are acceptable DCP1PM Page 48 10182006
Clinical Pharmacology Review NDA 19-962 Toprol-XL 10182006
3 To evaluate sponsorrsquos population PKPD analyses and determine if the findings support the proposed dosing recommendation
Dose Response Analysis (Study 307A) Title Dose Ranging Safety and Tolerability of TOPROL-XLreg
(metoprolol succinate) Extended-release Tablets (metoprolol CRXL) in Hypertensive Pediatric Subjects A Multicenter Double-blind Placebo-controlled Randomized Parallel-group Study
Study Duration 30 May 2002 - 9 June 2004 Investigators (primary) Bonita E Falkner MD and Jonathan Sorof MD 1800 Sites Multiple locations (36 in US and 1 in Dominican Republic)
Table 1 Objectives and Outcomes for Study 307A
Study Design (FDA-approved Type A design) This was a multi-center international double-blind placebo-controlled randomized parallel-group study The study included a screening visit a 1- to 2-week single-blind placebo run-in period during which all previous antihypertensive medications were discontinued and a 4-week double-blind treatment period At the end of the placebo run-in period eligible patients with blood pressure (BP) measurements in the qualifying range were randomized in a 1212 ratio to receive once daily oral doses of placebo TOPROL-XL 02 mgkg TOPROL-XL 10 mgkg or TOPROL-XL 20 mgkg TOPROL-XL doses of 125 25 375 50 75 100 150 or 200 mg were used to approximate the target doses Patients in the placebo and TOPROL-XL 02 mgkg groups received the target dose for 4 weeks while patients in the TOPROL-XL 10 mgkg and
DCP1PM Page 49 10182006
Clinical Pharmacology Review NDA 19-962 Toprol-XL 10182006
20 mgkg groups had their dose up-titrated (based on weight) to the target dose over the first 1 to 2 weeks of double-blind treatment
Reviewer Note Rationale on Study design The inclusion of more patients in the TOPROL-XL 02 mgkg and 20 mgkg groups allowed better estimation of the dose response at the low and high ends of the dose range The TOPROL-XL 10 mgkg group with fewer patients provided a middle estimate that helped to describe the shape of the dose-response curve However having a fewer number of subjects may have contributed to variability Inclusion of a placebo control group allowed for the quantification of treatment-related BP reductions after adjusting for placebo effect It should be noted that the placebo groups were not identical as they followed different titration schedules and had a different number of tablets
The 02 mgkg dose is lower than the lowest approved adult dose on a mgkg basis (assuming 70 kg adult weight) but the highest studied pediatric dose 20 mgkg (200 mg limit was placed) is lower than the highest studied adult dosage 400 mg
Table 2 Toprol Dosing Scheme for Study 307A
Table 3 Formulations used in 307A
DCP1PM Page 50 10182006
Clinical Pharmacology Review NDA 19-962 Toprol-XL 10182006
SPONSORrsquoS STATISTICAL ANALYSIS PLAN HIGHLIGHTS bull The primary analysis used an intention-to-treat (ITT) population which included
all patients who received at least 1 dose of study medication and had baseline and at least 1 post baseline measurement For this analysis missing data were imputed using a last observation carried forward (LOCF) approach
bull A simple linear regression analysis was performed on the placebo-corrected change from baseline to Week 4LOCF in sitting SBP and sitting DBP with dose ratio as the explanatory variable
bull The placebo correction for placebo-corrected changes from baseline to Week 4 LOCF in sitting SBP and sitting DBP was performed by subtracting the mean change from baseline for the placebo group from the individual patient changes in the other treatment groups
bull ANOVA was performed with treatment group as the main factor for the changes from baseline to each post baseline visit in sitting SBP and DBP This ANOVA model was used to construct pairwise comparisons of each active treatment versus placebo and the active treatment groups combined versus placebo
bull The percentage of responders at Week 4 was summarized by frequency counts percentages and 95 confidence intervals (CI) for each treatment group
bull Subgroup analyses were also performed on the changes from baseline at Week 4 in sitting SBP and DBP and the influence of heart rate and baseline body mass index (BMI) on the mean changes from baseline to Week 4LOCF in sitting SBP and DBP were examined using linear regressions
bull Trough plasma concentrations of metoprolol were summarized descriptively and the lower limit of quantitation (LLQ) was 1 ngmL
bull Safety data were summarized using the safety population defined as all patients who received at least 1 dose of study medication and were not lost to follow-up No statistical analyses were performed on the safety data in this study
DCP1PM Page 51 10182006
Clinical Pharmacology Review NDA 19-962 Toprol-XL 10182006
Results Patient Disposition Per applicant patients recruited into this study were representative of a pediatric population with hypertension The four treatment groups were balanced with respect to demographic and baseline characteristics (Tables 4 and 5) About 80 percent of the patients were considered 90 compliant
Table 4 Baseline Characteristics in Study 307A
Table 5 Sitting SBP and DBP measurements at baseline
Sitting and standing BP measurement were comparable (eg mean SBP for all patients- sitting = 1319 and standing 1306 with similar CVs ~ 9 )
Primary Efficacy Variable The results for the primary efficacy variable are illustrated in Figure 1 Figure Dose response for placebo-corrected change from baseline to Week4LOCF for sitting SBP (ITT population)
DCP1PM Page 52 10182006
Clinical Pharmacology Review NDA 19-962 Toprol-XL 10182006
Figure 1 Change in SBP from baseline as a function of Toprol XL dose
Table 6 Linear regressions statistics used to assess Dose-Response
The results indicate that bull The slope of the curve is not different form zero (p = 05371 for dose ratio)
suggesting that there is no dose-response relationship bull Most active treatment groups are more effective than placebo in reducing SBP
By visual inspection it appears the lack of observed dose-response is mainly driven by a lower than expected response at the 20 mgkg level
Potential issues affecting efficacy and pharmacokinetic results bull LOCF was required for eight patients however the LOCF approach did not
greatly impact the outcome of the trial bull Patients assigned to the 10 mg and 20 mgkg dose received drug for only 2
weeks whereas dose in the 02 mgkg received the same dose for 4 weeks
DCP1PM Page 53 10182006
Clinical Pharmacology Review NDA 19-962 Toprol-XL 10182006
Reviewerrsquos Supplemental Dose-Response Analyses The sponsorrsquos dose-response analysis was successfully reproduced by this Reviewer using pooled placebo corrected data A supplemental analysis was conducted using group-specific placebo corrected data In this procedure data for subjects assigned to a given Active Group (eg 02 mgkg) were corrected with Placebo data (02 mgkg) Group specific placebo data are presented in Table 7
Table 7 Placebo-group specific data Placebo Group Frequency Delta SBP 02 mgkg 8 -567 10 mgkg 6 -300 20 mgkg 9 230
It should be noted that the group-specific placebo data appeared to follow a consistent trend where the placebo effect decreased with increasing number of tablets It is unclear if this titrationtablet-dependent placebo effect is valid or random Overall the apparent differential placebo effects suggest that the placebo group may have overly influenced the outcome of the dose-response analysis
When active groups are corrected using group-matched placebo data there is a statistically significant dose-response The dose response using group-specific placebo data is illustrated in Table 8 and Figure 2
Figure 2 Placebo corrected changes in SBP (chg_pc on y axis) as a function of dose ratio
Potential Limitations of Supplemental Analyses Typically placebo effects are constant if randomization is correct thus it is unclear if subsetting the placebo group is acceptable and did not increase bias Additionally subsetting the placebo group leads to a reduced number of placebo subjects per dose group that may impact the regression analyses
DCP1PM Page 54 10182006
Clinical Pharmacology Review NDA 19-962 Toprol-XL 10182006
Table 8 SAS output for regression analyses using group-specific placebo corrections The REG Procedure
Model MODEL1
Dependent Variable chg_pc
Number of Observations Read 117
Number of Observations Used 117
Analysis of Variance
Sum of Mean
Source DF Squares Square F Value Pr gt F
Model 1 191083177 191083177 2663 lt0001
Error 115 825109481 7174865
Corrected Total 116 10162
Root MSE 847046 R-Square 01880
Dependent Mean -430358 Adj R-Sq 01810
Coeff Var -19682365
Parameter Estimates
Parameter Standard
Variable Label DF Estimate Error t Value Pr gt |t|
Intercept Intercept 1 125480 133166 094 03480
DOSRATIO Dose Ratio 1 -100051 019387 -516 lt0001
Secondary variables
bull Placebo-corrected change from baseline in sitting DBP The mean plusmn SD change (Week 4LOCF) in sitting DBP is illustrated in Figure 3 and Table 9
Figure 3 Mean changes (actual and placebo-corrected) from baseline to Week 4LOCF for sitting DBP (ITT population)
DCP1PM Page 55 10182006
Clinical Pharmacology Review NDA 19-962 Toprol-XL 10182006
Table 9 SAS output for regression analyses for DBP with pooled placebo correction
Treatment group effects and pairwise comparisons for sitting SBP and DBP Results of the treatment group effects at the Week 4LOCF visit and the pairwise comparisons between each TOPROL-XL group and placebo for the change from baseline in sitting SBP and DBP are shown for the ITT population in Table 10
Table 10 Treatment group effects for change in baseline to Week 4LOCF for sitting SBP and DBP (ITT population)
Some key findings from the pair-wise comparison are as follows (Table 10) 1 All active groups produced statistically significant reductions from baseline in sitting
SBP and DBP at the Week 4LOCF visit whereas placebo did not
DCP1PM Page 56 10182006
Clinical Pharmacology Review NDA 19-962 Toprol-XL 10182006
2 Overall the mean change from baseline in sitting SBP at Week 4LOCF for the TOPROL-XL groups pooled was statistically significantly larger than that for the placebo group (p=00351)
3 Results of pairwise comparisons between individual TOPROL-XL dose groups and placebo also revealed a statistically significant difference for the 10 and 20 mgkg groups (p=00270 and p=00492 respectively)
bull Mean changes over time in sitting SBP and DBP Consistent with findings from other studies with beta-blockers apparent maximal reduction in blood pressure occurred between 1 and 4 weeks of treatment
Figure 4 Mean changes over time for sitting SBP and DBP (ITT population)
Data points in plot are from absolute values (not taking baseline into account)
Subgroup Analyses The sponsor conducted several exploratory subgroup analyses however these analyses were not reviewed critically and are not presented in this review as
1 they do no impact the primary outcome or study objective 2 they are unlikely to be clinically useful due to the small number of patients per
subgroup One potentially useful some group analyses involved the percentage of responders as defined in Table 11
The responder analyses shows comparable response rates for all active dose groups suggesting similar efficacy across dose groups despite different exposure (doses)
DCP1PM Page 57 10182006
Clinical Pharmacology Review NDA 19-962 Toprol-XL 10182006
Table 11 Number and proportion of responders (ITT population)
Pharmacokinetic Results The Ctrough information obtained in the trial are summarized in Figure 6 and Tables 12 and 13
Table 12 Summary of Ctrough data (per applicant)
Sixteen patients across the 3 TOPROL-XL groups did not have blood samples obtained for analysis of metoprolol concentrations Based on the number of samples BLQ there appeared to be very low concentrations in the lowest dose group It appeared that Ctrough increased with dose According to the applicant these values are similar to those obtained previously in adults especially at the 2 higher doses Variability was high in all treatment groups (CV gt 60 )
Table 12 Summary of Ctrough (Reviewer Generated) from all patients (samples lt LOQ given value = 0) Toprol XL Dose Number of subjects Concentration (ngmL) (mgkg) Mean plusmn SD Median Range 02 39 137 plusmn 294 000 0 ndash 157 10 17 1224 plusmn 1416 845 0 ndash 571 20 46 2462 plusmn 3352 1140 0 ndash 1670
DCP1PM Page 58 10182006
Clinical Pharmacology Review NDA 19-962 Toprol-XL 10182006
Reviewer Note Overall the plasma concentrations (exposure) for the 02 mgkg dose group appear too low to be effective (close to LOQ) It is noted that adults typically have concentrations gt LOQ at the lowest therapeutic dose 25 mg (~ 4 ngmL)
Figure 6 Boxplot of metoprolol Ctrough using samples gt LLQ (per applicant)
Safety Results According to the applicant Toprol XL was well tolerated in the pediatric population as tabulated below
Main Analyses Conclusions bull No dose response was observed for corrected SBP using pooled placebo data
however using group-matched placebo data demonstrated a dose response bull Ctrough increased with dose bull Toprol 10 and 20 mg kg doses were more effective than placebo in reducing
SBP bull The responder rate was comparable across all active dose groups and this rate was
greater than that of placebo
DCP1PM Page 59 10182006
Clinical Pharmacology Review NDA 19-962 Toprol-XL 10182006
Methods Reviewerrsquos Methods Generally this reviewer conducted the analyses in a manner similar to that of the sponsor to confirm the sponsorrsquos findings
Sponsorrsquos Methods
Design Study1 307A
Reviewer Note This study was described in the Dose-Response Assessment (please refer to Page 7 Dose Response Analyses) Consequently only highlights relevant to the population analyses will be included in this section
Study 307A was a 4-week multi-center double-blind placebo-controlled randomized parallel-group study TOPROL-XL (metoprolol succinate) extended-release tablets were given to hypertensive pediatric patients Patients were randomized to double-treatment with a once daily oral dose of placebo or Toprol-XL at 1 of 3 target doses 02 or 20 mgkg The dose range for this study was 125 to 200 mg daily Patients on placebo followed the same schedule as that for their active group comparators
Study Flow Chart
Key Inclusion Criteria School age and adolescent children with reproducible SBP or DBP at or above the 95th percentile using height-adjusted charts for age and weight were eligible
DCP1PM Page 60 10182006
Clinical Pharmacology Review NDA 19-962 Toprol-XL 10182006
Study2 307B
Study 307B was a 52-week multi-center open-label study to determine the safety and pharmacokinetics of TOPROL-XL (metoprolol succinate) extended-release tablets (metoprolol CRXL) in hypertensive pediatric patients The starting dose was 25 mg daily The dose was increased every 2 weeks in increments of 25 mg or 50 mg based on tolerability until BP was controlled or the dose reached 200 mg
Table 1 Study Assessments
At the end of the 52-treatment period all patients had BP measured and a trough plasma level taken 24 hours the last dose of Toprol-XL with the exception of those patients who completed the serial portion at the final visit Among the participants a subgroup of approximately 30 patients was to participate in PK assessments of metoprolol requiring serial blood sampling at any time during the 52 weeks A single dose of 25 mg of Toprol-XL was given orally to those participating patients after a 48-hour washout period After the PK assessments they returned to the main study protocol Data
Study1 307A
4111 Pharmacokinetics A blood sample was to be collected at Visit 7 into a heparinized Vacutainer tube and obtained at 24 hours (plusmn2 hour) following the last dose of study medication (ie trough measurement) for determination of plasma metoprolol concentrations
Study Disposition Chart
DCP1PM Page 61 10182006
Clinical Pharmacology Review NDA 19-962 Toprol-XL 10182006
Table 2 Study Demographics
4112 Pharmacodynamics Primary variable
Sitting SBP determined at trough (24plusmn4 hours Visit 7) served as the primary efficacy assessment The primary measure of effect was the placebo-corrected change from baseline to the end of treatment (Week 4) in trough sitting SBP Each BP determination represented the mean of 3 readings with less than 7 mmHg between the highest and lowest value Blood pressure was measured using a mercury sphygmomanometer with an appropriate size cuff positioned approximately at the level of the heart Every effort was made to have the same individual measure the patientrsquos BP throughout the study if possible At all post randomization visits BP measurements were to be made at trough defined as 24 hours (plusmn4 hours) after receiving study medication All measurements were to be determined prior to the patient taking the scheduled dose of study medication In the
DCP1PM Page 62 10182006
Clinical Pharmacology Review NDA 19-962 Toprol-XL 10182006
event that the patient accidentally took study medication on the day of the scheduled visit the visit was to be rescheduled within 24 to 48 hours
Study2 307B
4113 Pharmacokinetics A 48-hour washout period prior to sampling was required for all patients including patients who entered the 52-week study and then decided to participate in the serial PK portion of the study All patients were to have a 15-mL blood sample collected into a heparinized Vacutainer tube 24 hours (plusmn2 hour) following the last dose of TOPROL-XL (ie trough measurement) at Visit 18 (or a the time of premature discontinuation) except for patients who participated in the serial PK portion of the study and had blood sampling performed at Visit 18 For patients participating in the serial PK portion of the study blood samples (15 mL) were to be collected into heparinized Vacutainer tubes and obtained at Hour 0 (predose) and at 1 2 3 4 6 8 10 and 24 hours after administration of a single 25 mg dose of TOPROL-XL following a 48-hour washout period After the last blood sample was obtained the patient was to startresume the prescribed dose of TOPROL-XL heshe was receiving prior to PK sampling
Patient Disposition Chart (completion or discontinuation)
Overall a total of 31 patients at 8 centers were enrolled in the serial PK portion of the study Of these 31 patients 27 had plasma concentration data available and were included in the analyses Four patients were excluded from the analyses because their plasma concentrations were not quantifiable (Nos 047-009 and 047-021) or because only whole blood samples were analyzed (Nos 005-002 005-003)
DCP1PM Page 63 10182006
Clinical Pharmacology Review NDA 19-962 Toprol-XL 10182006
Table 3 Subject Demographics for Patients Providing Serial Blood Samples
Missing Data Twenty-six patients did not have blood samples obtained for analysis of metoprolol concentrations in either the 16-week (n=7) or 52-week (n=19) studies Among patients with plasma samples 14 (14) in the 52-week study and 13 (13) in the 16-week study had trough plasma metoprolol concentrations that were below the LLQ Therefore data from a total of 99 patients were included in this analysis
Assay Metoprolol plasma levels were assayed using high-performance liquid chromatography tandem mass spectrometric detection methods having limit of quantitation (LOQ) of 1 ngmL The method was validated in the linear range 1 to 1000 ngmL Precision was less than or equal to 109 Accuracy ranged from 940 to 1013 Pharmacodynamics Not applicable
Data Checking SAS was used to format and check data Additionally visual inspection of several randomly selected subject data was carried out
DCP1PM Page 64 10182006
Clinical Pharmacology Review NDA 19-962 Toprol-XL 10182006
Models
Overview The sponsorrsquos stated assumptions underlying this modeling analysis are
1 Rich sampling data collected from 30 subjects in 307B Study can be used to adequately characterize the structural pharmacokinetic model of metoprolol
2 Structural pharmacokinetic models of metoprolol at other dose strength are identical to that at 25 mg
3 Metoprolol exhibits a linear pharmacokinetics in the dose ranges studied 4 Steady-state pharmacokinetics of metoprolol has been reached at the time of blood
sampling in Study 307A 5 Metoprolol accounts for the blood pressure effect in the study 6 Existing various disease states in the patients have no impact on the pharmacokinetics
of metoprolol and pharmacodynamics of the blood pressure reduction in the study 7 Concomitant medications if existed do not have any effects on the pharmacokinetics
of metoprolol and pharmacodynamics of the blood pressure reduction in the study
Reviewer Comment The sponsorrsquos assumptions appear reasonable based on existing metoprolol PKPD information
Pharmacokinetics
4114 PK Structural Model Several PK models were tested to identify the structural model Flip-flop absorption was taken into consideration based on general PK characteristics following administration of sustained release tablets and observed data in the current study (serial PK samples)
The models tested included linear 1- and 2-compartment PK models with the following characteristics (focused on flip-flop models)
bull first-order absorption with and without absorption lag time (NONMEM subroutines ADVAN2 and ADVAN4)
bull zero-order absorption with and without absorption lag time (NONMEM subroutines ADVAN1 and ADVAN3)
bull simultaneous zero- and first-order absorption from the absorption compartment The models were parameterized in terms of CLF and VF
Ultimately the 2-compartment model with first order flip-flop absorption an absorption lag time and 2 residual error terms was selected as the structural model of metoprolol The model scheme is presented in the following Figure 1 Figure 1 PK Compartmental Model
DCP1PM Page 65 10182006
Clinical Pharmacology Review NDA 19-962 Toprol-XL 10182006
4115 PK Covariate Model Covariate models were developed to account for the potential impact of the following covariates and derived covariates on metoprolol PK
Continuous variables bull Age (AGE years) bull Body weight (WT kg) bull Body surface area (BSA m2) calculated from WT and HT (cm) using the height
weight formula BSA=0024265 x WT 05378 x HT03964 bull Ideal body weight (IBW kg) calculated as - Males IBW=50+(HTndash150)25 and
for Females IBW=45+(HTndash150)25 bull Dose (DOSE mg of Toprol-XL)
Categorical variables bull Gender (SEX) - Male 0 - Female 1 bull Race (RACE) - Caucasian 0 - Black 1 - Asian 2 - Other 3
PK covariate effects were modeled as follows
Effects of continuous covariates (AGE WT BSA IBW and DOSE) were normalized to the corresponding median value across a dataset such that continuous covariates were related to structural PK parameters in a power function as described below
where Θ is the fixed-effect parameter of a covariate estimated by the NONMEM program covariate value is the observed covariate value and PK typical value is the typical value of the PK parameter estimated by NONMEM Effects of categorical covariates (SEX and RACE) are related to structural PK parameters by fractional changes of dummy variables
DCP1PM Page 66 10182006
Clinical Pharmacology Review NDA 19-962 Toprol-XL 10182006
Where Θ is the fixed-effect parameter of a covariate estimated by the NONMEM program covariate is the dummy variable value and modified in the control streams and PK typical value is the typical value of this PK parameter as estimated by NONMEM
Median values of all covariates in the dataset for population PK analysis are presented in Table A
Table A Summary of patient covariates and Toprol-XL doses in the data for population PK analysis
Two Steps were included in the modeling of covariates
Step 1 Forward Addition The covariates were subjected to a stepwise forward selection algorithm using a likelihood ratio test based on a change in MOF values from the base model A significant covariate reduced the MOF more than 660 (chi-square distribution plt001 degrees of freedom [df]=1)
Step 2 Backward deletion (Excluding procedures for covariate effect) The covariates in the full model acquired in Step 1 were subjected to a backward deletion algorithm 1 covariate was deleted at a time using a likelihood ratio test based on a change in MOF values A covariate was determined to be statistically significant if the change in MOF after its deletion from the breakdown model was increased by more than 1083 (chi-square distribution plt0001 df=1)
4116 PK Random Variance Models An exponential error model was used to characterize inter-patient variability based upon the assumption that random effects for PK parameters were not correlated among PK parameters No other error models for eta were evaluated by the applicant or by this Reviewer The retention of ETA values for each PK parameter in the structural model was confirmed by sequentially fixing each ETA value at zero and comparing each resultant MOF with the MOF obtained when all ETA values were retained in the model (see Table 6)
DCP1PM Page 67 10182006
Clinical Pharmacology Review NDA 19-962 Toprol-XL 10182006
The residual model was modeled by an additive model two error terms were used one for error associated with trough samples and the other with serial samples
Reviewer Note Use of an exponential model appears reasonable
Pharmacodynamics
4117 PKPD Structural Model The equations for the structural models are shown below
1 Metoprolol Ctrough The relationships between the observed metoprolol concentrations (Ctrough) and hemodynamic changes were investigated using 4 direct-link models namely a linear model a log-linear model and Hillrsquos sigmoid Emax PKPD model with and without a baseline
2 The relationships between Cmax or AUC0ndash24 and hemodynamic changes were investigated using 2 direct-link models a linear model and a log-linear model
4118 PKPD Covariate Model The inclusion and exclusion procedures of covariate effect on the selected PKPD base model to obtain a selected final PKPD model were identical to those in the covariate evaluation in the population PK models as described previously in PK Covariate Model DCP1PM Page 68 10182006
Clinical Pharmacology Review NDA 19-962 Toprol-XL 10182006
Table B Baseline demographic and covariate characteristics
4119 PKPD Random Variance Models An exponential error model was used by the applicant to model inter-individual variability The retention of a random effect parameter ETA in each selected PKPD structural model was then evaluated by sequentially fixing each ETA value at zero and comparing each resultant MOF with the MOF obtained when all ETA values were retained in the model (plt005) This step reduced over-parameterization by deleting unnecessary random-effect parameters from the structural model to obtain the base model
Reviewer Note The study design precludes assessment of inter-individual variability or random error because only one dose record was available per patient Consequently the model should not have included eta terms It is noted that the sponsor ultimately dropped the eta term in the final model
DCP1PM Page 69 10182006
Clinical Pharmacology Review NDA 19-962 Toprol-XL 10182006
Model Selection
PK Initial Model Selection
PK Base Model to Final Model The selection of the most appropriate PK base model for a metoprolol PK was based upon the following criteria a significant reduction in MOF as compared to the baseline model and asymptotic chi-square distribution based on the likelihood ratio test or AIC (plt005) as compared to the other structural models This selected PK base model was then subject to a covariate evaluation The population PK model bearing all surviving covariate parameters with statistical significance became the penultimate final model If 1 of the body size parameters (WT BSA and HT) was not in the model the penultimate final model became the final model If body size parameters were in the model they were sequentially replaced by other body size parameters in the regression submodel for each PK parameter The best body size parameter was then selected on the basis of lowest MOF to form the final model
PK Final Model Selection Simulations and visual inspections based on goodness of fit plots were used to qualify and validate the model The goodness-of-fit of the final model was evaluated graphically by comparing population and individual predictions of metoprolol concentrations with observed metoprolol concentrations along the line of unity and by visual inspection of the following plots of population-weighted residuals (WRES) for the final population model 1 Population-weighted residuals (WRES) versus population-predicted concentrations (PRED) 2 WRES versus time after first drug administration in each patient 3 WRES versus all covariates evaluated WRES were generally expected to be distributed homogenously around zero for PRED time after administration and covariates For those 27 patients with serial samples goodness-of-fit of the plasma concentration-time profile for each individual was visually inspected The linear relationship between their AUClast values from the observed data and those from the simulated data (final model) was examined
The predictive performance of the final population PK model including covariates was evaluated by comparing typical values of PK parameters with the mean of individual Bayesian estimates or individual values of PK parameters with the results from non-compartmental analysis for patients with serial samples Steady-state metoprolol plasma concentration-time profiles from 0ndash24 hours at the interval of 15 minutes (025 hour) were calculated using the post hoc Bayesian estimated PK parameter obtained for 65 patients included in the PKPD relationship using the following equation
DCP1PM Page 70 10182006
Clinical Pharmacology Review NDA 19-962 Toprol-XL 10182006
PKPD Initial and Final Model Selection A similar approach to that of PK model selection was adopted for PKPD Each of the above-mentioned PKPD models with random effects was identified by curve-fitting the dataset Initial selection of the PKPD structural model was based upon a significant reduction in MOF (plt005) as compared to the baseline model and reasonable PKPD parameter estimates Software
Nonlinear mixed-effect modeling (NONMEM) software (Version V level 11 Globomax Hanover MD) was used in the population PK analysis PK model fitting was accomplished using first-order (FO) approximation methods For PKPD model fitting the first-order conditional estimation (FOCE) with eta-epsilon interaction method in NONMEM was used for all model runs
SAS software (Version VIII Cary NC) was employed to prepare datasets according to the format required by the NONMEM program (Boeckmann et al 1991) Microsoftreg Excel 2000 (Redmond WA) and S-PLUS 2000 (Professional Release 2 MathSoft Inc Cambridge MA) were used to perform exploratory graphical exposure calculation and statistical analyses according to the format required by the NONMEM program (Boeckmann et al 1991) SAS command files logs and listings pertaining to data file conversion and merging were reviewed by an independent analyst Datasets were stored in SAS data frames combined and exported to Excel and then to ASCII files before fitting to the model
Datasets were prepared and pooled in a NONMEM-compliant format using SAS software by the Programming Group Clinical Information Sciences at AstraZeneca Wilmington Delaware SAS command files logs and listings pertaining to file conversion and merging were provided and found to be acceptable The contents of both datasets (toprolkatcsv for PK modeling and cppd2csv for PKPD modeling) were included
DCP1PM Page 71 10182006
Clinical Pharmacology Review NDA 19-962 Toprol-XL 10182006
toprolkatcsv was not provided electronically in a SAS format however this reviewer generated a similar dataset using the applicantrsquos criteria
Reviewer Comment The software and data assembly methods appeared adequate
DCP1PM Page 72 10182006
Clinical Pharmacology Review NDA 19-962 Toprol-XL 10182006
Results and Discussion Design Adequacy
Overall the trial designs appeared adequate to evaluate metoprolol population PK and PKPD in pediatric patients receiving Toprol XL However the design could have been further optimized by increasing the sampling points particularly in the absorption phase Due to the limited number of samples in the absorption phase it was not possible to accurately characterize the absorption model first order vs zero order or mixed first and zero order Additionally collection of mainly trough samples limits the ability to accurately estimate measures such as Cmax that are not directly related to Ctrough particularly if multiple compartments are present Consequently Cmax estimations are unlikely to be accurate Finally most patients provided only one trough sample thus inter-individual variability could not be adequately captured and may have limited the utility of the modeling exercise particularly in PKPD where the random effect could not be accurately characterized Ultimately there was no random variable in the final PKPD model (ie eta was set to zero) Data Integrity
This reviewer checked the data visually by randomly selecting data from patients included in the population modeling and comparing to data in the study report (source data) Overall the data integrity appeared acceptable The applicant observed the following guidelines that appeared acceptable No datum from any study participant with a protocol violation that was thought to materially impact the analysis was included The dataset contained data from only those study participants who could be evaluated ie with all the last dosing datetime blood sampling datetime plasma drug concentrations and demographic covariates
Data that were excluded (n = 62 samples) from the model were as follows One sample from an apparent poor metabolizer Two samples collected gt 96 hours post dose From 307B 10 trough samples lt LOQ From 307A 17 samples lt LOQ Thirty-samples from serial data that were lt LOQ or whole blood samples Model and Model Selection
Base Model
41110 Pharmacokinetic Model description The base PK model was a standard two compartment model that incorporated lag time and flip-flop kinetics The key features of the model were flip-flop was insured by making the value of ke gt ka in the clearance equation Additionally lag time was restricted to a value of 2 hours or less and concentrations were log transformed consequently all concentrations (F) = 0 were given individual predicted concentrations of zero Finally there were two residual error terms one for serial samples and the other for trough samples DCP1PM Page 73 10182006
Clinical Pharmacology Review NDA 19-962 Toprol-XL 10182006
Key equations were as follows
KA = THETA(1)EXP(ETA(1)) V2 = THETA(2)EXP(ETA(2)) CL = (THETA(1)THETA(2)+THETA(3))EXP(ETA(3)) Q = THETA(4)EXP(ETA(4)) V3 = THETA(5)EXP(ETA(5)) ALAG1=THETA(6)EXP(ETA(6))
41111 PK Parameter estimation results Table 1 Summary of PK parameters in the metoprolol population PK base model (per applicant)
41112 Goodness of fit The applicant provided the following goodness-of-fit plots (Figure 1)
Reviewer Note The goodness-of-fit plots were reproduced by this Reviewer (see Appendix) with minor modifications
Figure 1 Goodness of fit plots for Base Model
DCP1PM Page 74 10182006
Clinical Pharmacology Review NDA 19-962 Toprol-XL 10182006
Base PK Model Selection The MOF values of all structural model candidates tested are presented in Table 2 Model selection was based primarily on MOF values the lower MOF the better the model The applicant reports that in general MOF values generated by a conventional absorption model (ie absorption rate is faster than elimination rate) and a flip-flop absorption model (ie absorption rate is slower than elimination rate) were identical
Reviewer Comment The existence of flip-flop kinetics appears plausible based on data provided and general patterns for sustained release formulations Consequently the use of flip-flop kinetics for the bulk of the modeling exercise appears reasonable
General conclusions from the information in Table 2 are First order input is better than zero order input Two compartment model is better than one compartment model Lag time presence is better than lack of lag time Two residual error terms are better than one residual error term It should also be noted that several other models led to unsatisfactory completion of the run and were not considered further
DCP1PM Page 75 10182006
Clinical Pharmacology Review NDA 19-962 Toprol-XL 10182006
Table 2 Comparison of Structural PK Models
Reviewer Comment The selected structural model appears appropriate based on the data
Base Model The deletion of ETA for V2 did not change the MOF value suggesting that ETA for V2 should be deleted to avoid an over-parameterized warning (Table 3) This was consistent with the estimated parameter value of ETA for V2 being 648 x 10ndash9 a very small value Therefore the base model was selected by deleting the ETA for V2 from the structural model
Reviewer Comment on Eta deletion for V2 Deletion of eta for V2 is acceptable based on the empirical data however from a physiological perspective deletion of eta is problematic Generally one anticipates inter-individual differences in volume of distribution In this case it appears that the error associated with V2 may have been randomly shifted to V3 and or Q terms as the three DCP1PM Page 76 10182006
Clinical Pharmacology Review NDA 19-962 Toprol-XL 10182006
terms are interrelated This potential shift in error is supported by the fact that the V2 eta value increases significantly (by several orders of magnitude- 10-5 vs 100) when eta for Q and or V3 is fixed However when Q or V3 are fixed minimization is successful but Q and V3 are not accurately estimated Accounting for the possible error shift is a complex process and goes beyond the scope of this reviewer thus deletion of eta associated with V2 was considered acceptable for the remainder of the modeling evaluation
Table 3 Structural elements tested in the metoprolol population PK structural model (p lt 0005)
Final PK Model
41113 Model description The key feature of the final model is the inclusion of the covariate effects of age on Q and weight on CL in the population PK model
Key Equations CL = (THETA(1)THETA(2)+THETA(3)+EWT)EXP(ETA(2)) Q = THETA(4)EAGEEXP(ETA(3))
Including Covariate Effects As previously described covariate effects were assessed by forward addition and backward deletion Most covariates did not significantly change MOF however BSA significantly affected CL and Age affected Q Consequently these covariates were included in the penultimate final model
DCP1PM Page 77 10182006
Clinical Pharmacology Review NDA 19-962 Toprol-XL 10182006
Reviewer Note BSA is derived form WT and HT covariates implying BSA is highly correlated to these two covariates (Figure 2) weight is the most suitable (practical covariate) as it is readily measured Furthermore weight and BSA produced the same MOF (Table 4) whereas MOF with height was more positive (less significant)
Figure 2 Plot of BSA vs Body Weight
The data in Table 4 support selection of the final model
Table 4 Covariate elements tested in the metoprolol population PK penultimate final model (plt0005)
The applicant acknowledges that mechanism(s) accounting for the impact of age on QF are not clear However since distribution clearance has little effect on metoprolol plasma exposure further investigation is not needed
41114 PK Parameter estimation results As shown in Table 5 PK parameters were estimated fairly precisely by the final model
Table 5 PK Parameter Estimates using Final Model
DCP1PM Page 78 10182006
Clinical Pharmacology Review NDA 19-962 Toprol-XL 10182006
41115 Goodness of fit The goodness-of-fit plots provided by the applicant show good precision Figure 5 Goodness of fit plots for final PK model
DCP1PM Page 79 10182006
Clinical Pharmacology Review NDA 19-962 Toprol-XL 10182006
PK Model Qualification The post hoc Bayesian-estimated AUC (simulated) obtained for the 27 patients with serial plasma samples are plotted against the observed (AUCt) The correlation was high (R2 gt 099) Figure 6 AUClast from observed data versus AUCt from model simulation in the 27 patients providing serial plasma samples
Regression line Y= 4514 + 08976 X R2 = 09957
The graphical validation of the final metoprolol population PK model validation against covariates evaluated is presented in Figure 6
Figure 7 Graphical validation of covariates
DCP1PM Page 80 10182006
Clinical Pharmacology Review NDA 19-962 Toprol-XL 10182006
There was no systematic bias in weighted residuals for any covariates evaluated suggesting that the final model included all appreciable effects of available covariates (Figure)
The effects of weight on metoprolol CLF are illustrated in Figure 8 where Bayesian post hoc estimates of CLF are plotted against weight and overlaid by the model-predicted line Overall the model appeared to fit the data well
Figure 8 Plot of CLF vs Body weight
The effects of AGE on metoprolol QF are illustrated in Figure 9 where Bayesian post hoc estimates of QF are plotted against AGE and overlaid by the model-predicted line Figure 9 Plot of QF vs Age
DCP1PM Page 81 10182006
Clinical Pharmacology Review NDA 19-962 Toprol-XL 10182006
Reviewer Note The applicant indicated that attempts to run the final model using the first-order conditional estimation method resulted in termination errors Therefore the parameter estimates obtained by the FO method were reported as the final parameter estimates
Conclusion Regarding Population PK Modeling Overall the sponsorrsquos population PK modeling is acceptable
PKPD Model and Model Selection
PKPD Base Model PharmacokineticPharmacodynamic Model description The key feature of the model was a lack of random variance term for the slope (since only single data points were available per subject) and inclusion of baseline effect
Key equations were as follows E0 = THETA(1)EXP(ETA(1)) M = THETA(2) Y = E0 + MLOG(AUC) + EPS(1)
The control stream provided in the appendix is that for DBP (provided by sponsor) The control stream for SBP is comparable with appropriate substitution for BP type
It should be noted that only the log-linear and linear PKPD models were considered suitable for AUC and Cmax For this review only AUC estimates were considered reliable as Cmax estimates could not be accurately determined based on the sampling scheme Consequently the remainder of this review focuses on AUC information although Ctrough and Cmax data are displayed for reference
Bayesian estimates from PK modeling are summarized in Table 1
Table 1 Bayesian estimates of metoprolol PK exposure for those patients included in the PKPD analysis (N=65)
DCP1PM Page 82 10182006
Clinical Pharmacology Review NDA 19-962 Toprol-XL 10182006
PKPD Model Selection (initial and final) The log-linear model was adopted as the base model for this PKPD relationship since it improved the MOF significantly (Table 2) The ETA parameter for the slope was pre-eliminated for the purpose of model parsimony The intercept and slope in this log-linear model for AUC(0-24) did not bear ETA parameter therefore no covariates had impact on either parameter in the model
Reviewer Note The intercept should not have borne an eta term because individual subjects provided only one data point Consequently fixing eta to zero or deleting eta in the final model is appropriate No further model development was required after eta was eliminated and the base model was equivalent to the final model
Table 2 Base population PKPD models tested for the change in SBP
41116 PKPD Parameter estimation results The final PKPD parameter estimates are presented in Table 3
Table 3 Summary parameters in the final PKPD model for the change in SBP using trough plasma level Parameter Explanation Estimate SE ()b
DCP1PM Page 83 10182006
Clinical Pharmacology Review NDA 19-962 Toprol-XL 10182006
Model Qualification Based on the relatively low R2 value and as shown in Figure there is a poor correlation between change in SBP and log AUC
Figure 1 Relationship between change in SBP and AUC (line generated from modeling)
Overall goodness-of-fit of the model was considered to be poor probably due to the high variability in the measurements Consequently the precision of the model parameter estimates was not considered to be very reliable These parameters have little clinical usefulness and can be treated only as an indication of trends ie more hemodynamic effects can be potentially achieved when high Toprol-XL doses are given Clinical dose adjustment based on these PKPD parameters is not recommended
Reviewerrsquos Supplemental Analyses A supplemental PKPD analyses was conducted using simple linear regression since the population model did not improve the fit Overall eta made an insignificant contribution to the overall model The results of the analyses were similar to the population analyses A series of regression analyses were conducted and are presented in Table 4
The applicant notes that the preliminary modeling exercise found that there was no difference in the PKPD modeling results using different hemodynamic data formats (ie change in the measurements percent change in the measurements or actual BP measurements) This finding was confirmed by this reviewer (see Table 4)
DCP1PM Page 84 10182006
Clinical Pharmacology Review NDA 19-962 Toprol-XL 10182006
Table 4 Supplemental PKPD Regression Analyses Conducted by Reviewer Model (liner regression) Intercept (I) Slope (m) R2 Probability RSBP = mISBP + I 3957 -035 01626 0009 PSBP = mISBP + I 2524 -023 01252 00038 PSBP = mRSBP + I 0005 074 09891 lt 00001 RSBP = mlogAUC + I 651 -221 0060 00493 RSBP = mDose + I -751 0006 00026 06878 RSBP = mDose^ + I -312 -111 004 02711 RSBP = mlogAUC + nISBP + I 5303 -221 (m)
-035 (n) 02230 0001
RSBPplc = mAUC + I -667 -0003 00458 00871 RSBPplc = mlogAUC + I 461 -2208 00600 00493 RPUL = mlogAUC + I 1868 -405 01102 00069 Symbols in table similar to population PK model without eta term RSBP- change of SBP without placebo correction ISBP- initial (baseline) SBP RPUL- change in HR without placebo correction Dose- in mg where placebo is included as 0 mg PSBP- percentage change of SBP without placebo correction
Conclusion Regarding Population PKPD Modeling Overall the sponsorrsquos population PKPD modeling is acceptable No dose adjustment conclusion can be made from this modeling however an exposure-response relationship was established for AUC and reduction in SBP
Discussion
The significance of the results 1 Provide estimates of PK measures and plasma exposure in pediatric population These data can be compared to adult exposure to determine if exposure differences impact drug effectiveness The main challenge in comparing pediatric data to adult data is different modeling schemes formulations and methods were used in the two populations
2 PKPD findings are not sufficiently precise to provide a dose adjustment algorithm however the PKPD analyses provides rationale for proposed titration as increasing exposure (doses) may improve efficacy (reduction in SBP) Ultimately the risk-benefit analyses overrides PKPD assessment for dose adjustment drug will be titrated thus reliance on PKPD information is not critical The proposed dose 10 mgkg appears suitable based on available information It is unclear from the studies if there should be an initial maximum dose although the sponsor has proposed 50 mg as the maximum initial dose The proposed pediatric starting dose on a mgkg basis is within the range of starting adult doses (25 ndash 100 mg) assuming an adult weighs 70 kg
3 Cumulative information form dose-response study indicates that Toprol XL has effectiveness in children however the most effective dose is unclear Since the drug can be titrated determining the initial optimal dose does not appear critical As proposed by the applicant dosing is started at a ldquolowrdquo dose that can be up-titrated if needed
DCP1PM Page 85 10182006
Clinical Pharmacology Review NDA 19-962 Toprol-XL 10182006
4 The results did not adequately address the potential impact of CYP2D6 metabolic status for pediatric patients taking Toprol XL There were an insufficient number of patients to make this assessment
5 Covariate effects do not appear significant only body weight significantly affects clearance However a worst case scenario can occur with a person that has a low body weight and is a poor metabolizer this will result in very high possibly supra-therapeutic exposure Age does not impact apparent oral clearance so an age-dependent dose adjustment is not needed for children over 6 years old In essence all children over six years old can initiate therapy at 10 mgkg
The validity of the results Overall the results produced by the sponsor appear valid and the sponsor used a sound modeling approach However alternative approaches that could have been adopted may have improved the outcome of the analyses Three of these approaches are presented below 1 Additional PK samples should have been collected during the absorption phase and
throughout the dosing interval to improve the modelrsquos performance Specifically additional samples collected during the absorption phase may have unambiguously identified the actual absorption input function (eg first order zero order mixed first and zero order) First order input was selected for the analyses although the dosage form is reported to exhibit zero order kinetics in adults It is possible that the input rate in children differs from that in adults but unlikely It should be noted that absorption kinetics in children is often erratic due to multiple factors (eg regioshyselective absorption incomplete gastric emptying and inconsistent absorption) so it is unclear if additional samples would have definitively identified the absorption function However additional non-trough samples may have helped in estimating key PK measures such as V and Cmax The final model did not have an eta associated with V which is atypical Collection of additional samples on different visits may have helped estimate potential inter-occasion variability It should be noted that AUC was estimated precisely for subjects providing serial samples but these subjects were not necessarily included in the PKPD analyses Ideally the PKPD modeling should have been conducted primarily in subjects who had accurate PK measures
2 The PKPD design could have been modified to potentially improve the utility of the analyses Specifically there should have been better placebo matching procedures to minimize the potential impact of the placebo effect This matching could have been improved by ensuring all patients on placebo had the same titration schedule and number of tablets It is noted that the model had a poor predictive performance that was mainly attributed to the high degree of variability in the PD measures Potentially other PD markers could have been explored that have less inherent variability One such marker is the degree of beta blockade using exercise heart rate (EHR) reduction this marker has been used extensively for metoprolol in adult subjects However use of EHR in the pediatric setting may be challenging
DCP1PM Page 86 10182006
Clinical Pharmacology Review NDA 19-962 Toprol-XL 10182006
Comments to sponsor
In future pharmacometric studies you should consider the following 1 collect sufficient (multiple) samples from individual subjects to allow assessment
of inter-occasion variability and estimation of inter-individual variability (eta) for all relevant parameters
2 placebo groups should be identically matched across all dose groups (eg same titration schedule and number tablets) to minimize potential bias or differences in the placebo effect
Comments to medical reviewer
1 The sponsor has adequately characterized metoprolol PK in the studied pediatric population The PK characterization could have been further optimized by obtaining additional samples over the entire dosing interval (eg during the absorption phase and elimination phase) on multiple occasions rather than on one occasion primarily at trough
2 A dose-response relationship could not be established using the protocol specified analysis approach The outcome of the dose-response relationship appeared highly dependent on the ldquoplacebo effectrdquo suggesting that the placebo group may not have been appropriate One should consider re-evaluating the dose-response precisely matched placebo groups (eg all placebo patients have identical number of tablets and titration schedule)
3 Based on the PKPD analysis plasma exposure (AUC) explains lt 10 of the response (reduction in systolic blood pressure) thus has limited clinical utility However the PKPD relationship suggests that there is a trend for increased response with increased exposure (dose driven)
4 Overall information from the dose-response study suggests that Toprol- XL is effective in the pediatric population The optimal initial dose 02 10 or 20 mgkg or the maximum safe and effective dose cannot be determined from the information provided It is noted that the 02 mgkg dose is unlikely to be effective as plasma concentrations achieved at this dose are unlikely to be effective (most concentrations lt LOQ and lower than effective adult concentrations) The 10 mgkg (proposed by applicant) appears to be a reasonable initial dose The labeling should reflect the regimens studied
DCP1PM Page 89 10182006
Clinical Pharmacology Review NDA 19-962 Toprol-XL 10182006
Appendix
DCP1PM Page 90 10182006
Clinical Pharmacology Review NDA 19-962 Toprol-XL 10182006
DCP1PM Page 91 10182006
Clinical Pharmacology Review NDA 19-962 Toprol-XL 10182006
DCP1PM Page 92 10182006
Clinical Pharmacology Review NDA 19-962 Toprol-XL 10182006
DCP1PM Page 93 10182006
Clinical Pharmacology Review NDA 19-962 Toprol-XL 10182006
DCP1PM Page 94 10182006
Clinical Pharmacology Review NDA 19-962 Toprol-XL 10182006
DCP1PM Page 95 10182006
Clinical Pharmacology Review NDA 19-962 Toprol-XL 10182006
Table 15 Control streams for final log-linear PKPD model for the change in DBP using metoprolol Cmax as the measure of exposure
Truncated NONMEM reports for base model identification for PKPD relationship in change of SBP (per sponsor)
DCP1PM Page 96 10182006
Clinical Pharmacology Review NDA 19-962 Toprol-XL 10182006
Reported PD information^
^ Under metoprolol regimen CRZ0K is Toprol XL
DCP1PM Page 97 10182006
Clinical Pharmacology Review NDA 19-962 Toprol-XL 10182006
Table Results of randomised double-blind comparative trials evaluating antihypertensive efficacy of metoprolol formulations or other antihypertensives
DCP1PM Page 98 10182006
---------------------------------------------------------------------------------------------------------------------
---------------------------------------------------------------------------------------------------------------------
---------------------
This is a representation of an electronic record that was signed electronically and this page is the manifestation of the electronic signature
s
Robert Kumi 10182006 045635 PM BIOPHARMACEUTICS
Patrick Marroum 10192006 050811 PM BIOPHARMACEUTICS
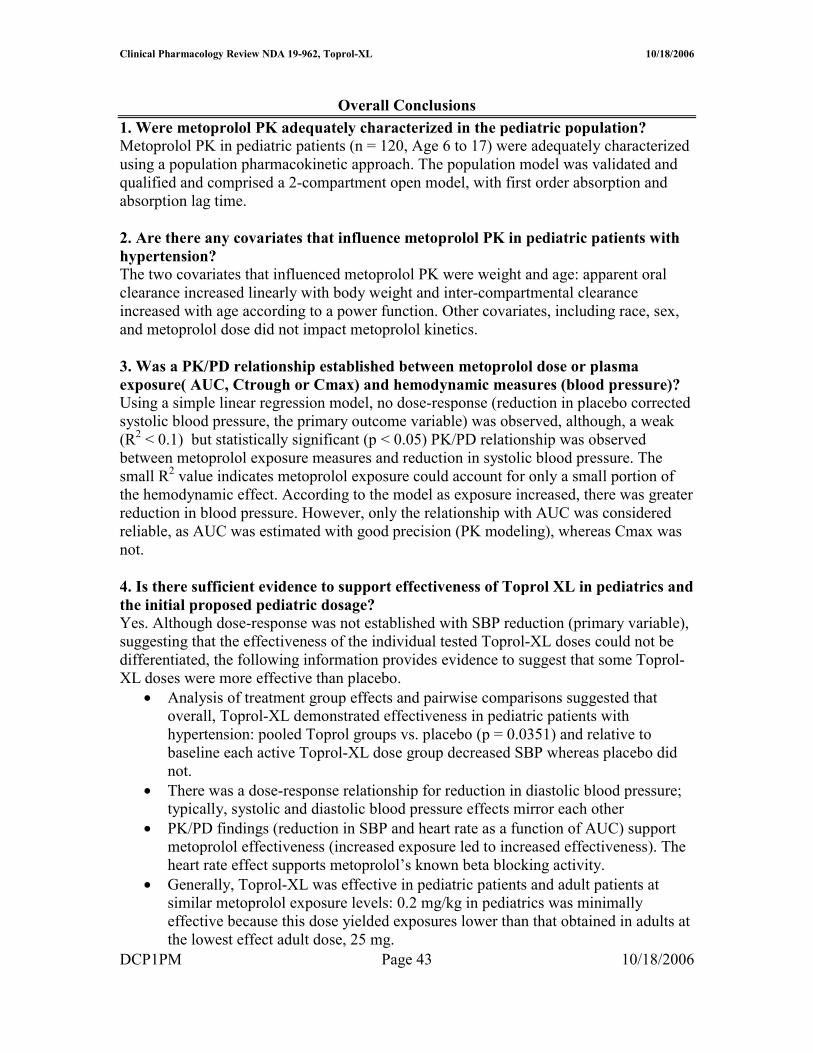
Clinical Pharmacology Review NDA 19-962 Toprol-XL 10182006
3 To evaluate sponsorrsquos population PKPD analyses and determine if the findings support the proposed dosing recommendation
Dose Response Analysis (Study 307A) Title Dose Ranging Safety and Tolerability of TOPROL-XLreg
(metoprolol succinate) Extended-release Tablets (metoprolol CRXL) in Hypertensive Pediatric Subjects A Multicenter Double-blind Placebo-controlled Randomized Parallel-group Study
Study Duration 30 May 2002 - 9 June 2004 Investigators (primary) Bonita E Falkner MD and Jonathan Sorof MD 1800 Sites Multiple locations (36 in US and 1 in Dominican Republic)
Table 1 Objectives and Outcomes for Study 307A
Study Design (FDA-approved Type A design) This was a multi-center international double-blind placebo-controlled randomized parallel-group study The study included a screening visit a 1- to 2-week single-blind placebo run-in period during which all previous antihypertensive medications were discontinued and a 4-week double-blind treatment period At the end of the placebo run-in period eligible patients with blood pressure (BP) measurements in the qualifying range were randomized in a 1212 ratio to receive once daily oral doses of placebo TOPROL-XL 02 mgkg TOPROL-XL 10 mgkg or TOPROL-XL 20 mgkg TOPROL-XL doses of 125 25 375 50 75 100 150 or 200 mg were used to approximate the target doses Patients in the placebo and TOPROL-XL 02 mgkg groups received the target dose for 4 weeks while patients in the TOPROL-XL 10 mgkg and
DCP1PM Page 49 10182006
Clinical Pharmacology Review NDA 19-962 Toprol-XL 10182006
20 mgkg groups had their dose up-titrated (based on weight) to the target dose over the first 1 to 2 weeks of double-blind treatment
Reviewer Note Rationale on Study design The inclusion of more patients in the TOPROL-XL 02 mgkg and 20 mgkg groups allowed better estimation of the dose response at the low and high ends of the dose range The TOPROL-XL 10 mgkg group with fewer patients provided a middle estimate that helped to describe the shape of the dose-response curve However having a fewer number of subjects may have contributed to variability Inclusion of a placebo control group allowed for the quantification of treatment-related BP reductions after adjusting for placebo effect It should be noted that the placebo groups were not identical as they followed different titration schedules and had a different number of tablets
The 02 mgkg dose is lower than the lowest approved adult dose on a mgkg basis (assuming 70 kg adult weight) but the highest studied pediatric dose 20 mgkg (200 mg limit was placed) is lower than the highest studied adult dosage 400 mg
Table 2 Toprol Dosing Scheme for Study 307A
Table 3 Formulations used in 307A
DCP1PM Page 50 10182006
Clinical Pharmacology Review NDA 19-962 Toprol-XL 10182006
SPONSORrsquoS STATISTICAL ANALYSIS PLAN HIGHLIGHTS bull The primary analysis used an intention-to-treat (ITT) population which included
all patients who received at least 1 dose of study medication and had baseline and at least 1 post baseline measurement For this analysis missing data were imputed using a last observation carried forward (LOCF) approach
bull A simple linear regression analysis was performed on the placebo-corrected change from baseline to Week 4LOCF in sitting SBP and sitting DBP with dose ratio as the explanatory variable
bull The placebo correction for placebo-corrected changes from baseline to Week 4 LOCF in sitting SBP and sitting DBP was performed by subtracting the mean change from baseline for the placebo group from the individual patient changes in the other treatment groups
bull ANOVA was performed with treatment group as the main factor for the changes from baseline to each post baseline visit in sitting SBP and DBP This ANOVA model was used to construct pairwise comparisons of each active treatment versus placebo and the active treatment groups combined versus placebo
bull The percentage of responders at Week 4 was summarized by frequency counts percentages and 95 confidence intervals (CI) for each treatment group
bull Subgroup analyses were also performed on the changes from baseline at Week 4 in sitting SBP and DBP and the influence of heart rate and baseline body mass index (BMI) on the mean changes from baseline to Week 4LOCF in sitting SBP and DBP were examined using linear regressions
bull Trough plasma concentrations of metoprolol were summarized descriptively and the lower limit of quantitation (LLQ) was 1 ngmL
bull Safety data were summarized using the safety population defined as all patients who received at least 1 dose of study medication and were not lost to follow-up No statistical analyses were performed on the safety data in this study
DCP1PM Page 51 10182006
Clinical Pharmacology Review NDA 19-962 Toprol-XL 10182006
Results Patient Disposition Per applicant patients recruited into this study were representative of a pediatric population with hypertension The four treatment groups were balanced with respect to demographic and baseline characteristics (Tables 4 and 5) About 80 percent of the patients were considered 90 compliant
Table 4 Baseline Characteristics in Study 307A
Table 5 Sitting SBP and DBP measurements at baseline
Sitting and standing BP measurement were comparable (eg mean SBP for all patients- sitting = 1319 and standing 1306 with similar CVs ~ 9 )
Primary Efficacy Variable The results for the primary efficacy variable are illustrated in Figure 1 Figure Dose response for placebo-corrected change from baseline to Week4LOCF for sitting SBP (ITT population)
DCP1PM Page 52 10182006
Clinical Pharmacology Review NDA 19-962 Toprol-XL 10182006
Figure 1 Change in SBP from baseline as a function of Toprol XL dose
Table 6 Linear regressions statistics used to assess Dose-Response
The results indicate that bull The slope of the curve is not different form zero (p = 05371 for dose ratio)
suggesting that there is no dose-response relationship bull Most active treatment groups are more effective than placebo in reducing SBP
By visual inspection it appears the lack of observed dose-response is mainly driven by a lower than expected response at the 20 mgkg level
Potential issues affecting efficacy and pharmacokinetic results bull LOCF was required for eight patients however the LOCF approach did not
greatly impact the outcome of the trial bull Patients assigned to the 10 mg and 20 mgkg dose received drug for only 2
weeks whereas dose in the 02 mgkg received the same dose for 4 weeks
DCP1PM Page 53 10182006
Clinical Pharmacology Review NDA 19-962 Toprol-XL 10182006
Reviewerrsquos Supplemental Dose-Response Analyses The sponsorrsquos dose-response analysis was successfully reproduced by this Reviewer using pooled placebo corrected data A supplemental analysis was conducted using group-specific placebo corrected data In this procedure data for subjects assigned to a given Active Group (eg 02 mgkg) were corrected with Placebo data (02 mgkg) Group specific placebo data are presented in Table 7
Table 7 Placebo-group specific data Placebo Group Frequency Delta SBP 02 mgkg 8 -567 10 mgkg 6 -300 20 mgkg 9 230
It should be noted that the group-specific placebo data appeared to follow a consistent trend where the placebo effect decreased with increasing number of tablets It is unclear if this titrationtablet-dependent placebo effect is valid or random Overall the apparent differential placebo effects suggest that the placebo group may have overly influenced the outcome of the dose-response analysis
When active groups are corrected using group-matched placebo data there is a statistically significant dose-response The dose response using group-specific placebo data is illustrated in Table 8 and Figure 2
Figure 2 Placebo corrected changes in SBP (chg_pc on y axis) as a function of dose ratio
Potential Limitations of Supplemental Analyses Typically placebo effects are constant if randomization is correct thus it is unclear if subsetting the placebo group is acceptable and did not increase bias Additionally subsetting the placebo group leads to a reduced number of placebo subjects per dose group that may impact the regression analyses
DCP1PM Page 54 10182006
Clinical Pharmacology Review NDA 19-962 Toprol-XL 10182006
Table 8 SAS output for regression analyses using group-specific placebo corrections The REG Procedure
Model MODEL1
Dependent Variable chg_pc
Number of Observations Read 117
Number of Observations Used 117
Analysis of Variance
Sum of Mean
Source DF Squares Square F Value Pr gt F
Model 1 191083177 191083177 2663 lt0001
Error 115 825109481 7174865
Corrected Total 116 10162
Root MSE 847046 R-Square 01880
Dependent Mean -430358 Adj R-Sq 01810
Coeff Var -19682365
Parameter Estimates
Parameter Standard
Variable Label DF Estimate Error t Value Pr gt |t|
Intercept Intercept 1 125480 133166 094 03480
DOSRATIO Dose Ratio 1 -100051 019387 -516 lt0001
Secondary variables
bull Placebo-corrected change from baseline in sitting DBP The mean plusmn SD change (Week 4LOCF) in sitting DBP is illustrated in Figure 3 and Table 9
Figure 3 Mean changes (actual and placebo-corrected) from baseline to Week 4LOCF for sitting DBP (ITT population)
DCP1PM Page 55 10182006
Clinical Pharmacology Review NDA 19-962 Toprol-XL 10182006
Table 9 SAS output for regression analyses for DBP with pooled placebo correction
Treatment group effects and pairwise comparisons for sitting SBP and DBP Results of the treatment group effects at the Week 4LOCF visit and the pairwise comparisons between each TOPROL-XL group and placebo for the change from baseline in sitting SBP and DBP are shown for the ITT population in Table 10
Table 10 Treatment group effects for change in baseline to Week 4LOCF for sitting SBP and DBP (ITT population)
Some key findings from the pair-wise comparison are as follows (Table 10) 1 All active groups produced statistically significant reductions from baseline in sitting
SBP and DBP at the Week 4LOCF visit whereas placebo did not
DCP1PM Page 56 10182006
Clinical Pharmacology Review NDA 19-962 Toprol-XL 10182006
2 Overall the mean change from baseline in sitting SBP at Week 4LOCF for the TOPROL-XL groups pooled was statistically significantly larger than that for the placebo group (p=00351)
3 Results of pairwise comparisons between individual TOPROL-XL dose groups and placebo also revealed a statistically significant difference for the 10 and 20 mgkg groups (p=00270 and p=00492 respectively)
bull Mean changes over time in sitting SBP and DBP Consistent with findings from other studies with beta-blockers apparent maximal reduction in blood pressure occurred between 1 and 4 weeks of treatment
Figure 4 Mean changes over time for sitting SBP and DBP (ITT population)
Data points in plot are from absolute values (not taking baseline into account)
Subgroup Analyses The sponsor conducted several exploratory subgroup analyses however these analyses were not reviewed critically and are not presented in this review as
1 they do no impact the primary outcome or study objective 2 they are unlikely to be clinically useful due to the small number of patients per
subgroup One potentially useful some group analyses involved the percentage of responders as defined in Table 11
The responder analyses shows comparable response rates for all active dose groups suggesting similar efficacy across dose groups despite different exposure (doses)
DCP1PM Page 57 10182006
Clinical Pharmacology Review NDA 19-962 Toprol-XL 10182006
Table 11 Number and proportion of responders (ITT population)
Pharmacokinetic Results The Ctrough information obtained in the trial are summarized in Figure 6 and Tables 12 and 13
Table 12 Summary of Ctrough data (per applicant)
Sixteen patients across the 3 TOPROL-XL groups did not have blood samples obtained for analysis of metoprolol concentrations Based on the number of samples BLQ there appeared to be very low concentrations in the lowest dose group It appeared that Ctrough increased with dose According to the applicant these values are similar to those obtained previously in adults especially at the 2 higher doses Variability was high in all treatment groups (CV gt 60 )
Table 12 Summary of Ctrough (Reviewer Generated) from all patients (samples lt LOQ given value = 0) Toprol XL Dose Number of subjects Concentration (ngmL) (mgkg) Mean plusmn SD Median Range 02 39 137 plusmn 294 000 0 ndash 157 10 17 1224 plusmn 1416 845 0 ndash 571 20 46 2462 plusmn 3352 1140 0 ndash 1670
DCP1PM Page 58 10182006
Clinical Pharmacology Review NDA 19-962 Toprol-XL 10182006
Reviewer Note Overall the plasma concentrations (exposure) for the 02 mgkg dose group appear too low to be effective (close to LOQ) It is noted that adults typically have concentrations gt LOQ at the lowest therapeutic dose 25 mg (~ 4 ngmL)
Figure 6 Boxplot of metoprolol Ctrough using samples gt LLQ (per applicant)
Safety Results According to the applicant Toprol XL was well tolerated in the pediatric population as tabulated below
Main Analyses Conclusions bull No dose response was observed for corrected SBP using pooled placebo data
however using group-matched placebo data demonstrated a dose response bull Ctrough increased with dose bull Toprol 10 and 20 mg kg doses were more effective than placebo in reducing
SBP bull The responder rate was comparable across all active dose groups and this rate was
greater than that of placebo
DCP1PM Page 59 10182006
Clinical Pharmacology Review NDA 19-962 Toprol-XL 10182006
Methods Reviewerrsquos Methods Generally this reviewer conducted the analyses in a manner similar to that of the sponsor to confirm the sponsorrsquos findings
Sponsorrsquos Methods
Design Study1 307A
Reviewer Note This study was described in the Dose-Response Assessment (please refer to Page 7 Dose Response Analyses) Consequently only highlights relevant to the population analyses will be included in this section
Study 307A was a 4-week multi-center double-blind placebo-controlled randomized parallel-group study TOPROL-XL (metoprolol succinate) extended-release tablets were given to hypertensive pediatric patients Patients were randomized to double-treatment with a once daily oral dose of placebo or Toprol-XL at 1 of 3 target doses 02 or 20 mgkg The dose range for this study was 125 to 200 mg daily Patients on placebo followed the same schedule as that for their active group comparators
Study Flow Chart
Key Inclusion Criteria School age and adolescent children with reproducible SBP or DBP at or above the 95th percentile using height-adjusted charts for age and weight were eligible
DCP1PM Page 60 10182006
Clinical Pharmacology Review NDA 19-962 Toprol-XL 10182006
Study2 307B
Study 307B was a 52-week multi-center open-label study to determine the safety and pharmacokinetics of TOPROL-XL (metoprolol succinate) extended-release tablets (metoprolol CRXL) in hypertensive pediatric patients The starting dose was 25 mg daily The dose was increased every 2 weeks in increments of 25 mg or 50 mg based on tolerability until BP was controlled or the dose reached 200 mg
Table 1 Study Assessments
At the end of the 52-treatment period all patients had BP measured and a trough plasma level taken 24 hours the last dose of Toprol-XL with the exception of those patients who completed the serial portion at the final visit Among the participants a subgroup of approximately 30 patients was to participate in PK assessments of metoprolol requiring serial blood sampling at any time during the 52 weeks A single dose of 25 mg of Toprol-XL was given orally to those participating patients after a 48-hour washout period After the PK assessments they returned to the main study protocol Data
Study1 307A
4111 Pharmacokinetics A blood sample was to be collected at Visit 7 into a heparinized Vacutainer tube and obtained at 24 hours (plusmn2 hour) following the last dose of study medication (ie trough measurement) for determination of plasma metoprolol concentrations
Study Disposition Chart
DCP1PM Page 61 10182006
Clinical Pharmacology Review NDA 19-962 Toprol-XL 10182006
Table 2 Study Demographics
4112 Pharmacodynamics Primary variable
Sitting SBP determined at trough (24plusmn4 hours Visit 7) served as the primary efficacy assessment The primary measure of effect was the placebo-corrected change from baseline to the end of treatment (Week 4) in trough sitting SBP Each BP determination represented the mean of 3 readings with less than 7 mmHg between the highest and lowest value Blood pressure was measured using a mercury sphygmomanometer with an appropriate size cuff positioned approximately at the level of the heart Every effort was made to have the same individual measure the patientrsquos BP throughout the study if possible At all post randomization visits BP measurements were to be made at trough defined as 24 hours (plusmn4 hours) after receiving study medication All measurements were to be determined prior to the patient taking the scheduled dose of study medication In the
DCP1PM Page 62 10182006
Clinical Pharmacology Review NDA 19-962 Toprol-XL 10182006
event that the patient accidentally took study medication on the day of the scheduled visit the visit was to be rescheduled within 24 to 48 hours
Study2 307B
4113 Pharmacokinetics A 48-hour washout period prior to sampling was required for all patients including patients who entered the 52-week study and then decided to participate in the serial PK portion of the study All patients were to have a 15-mL blood sample collected into a heparinized Vacutainer tube 24 hours (plusmn2 hour) following the last dose of TOPROL-XL (ie trough measurement) at Visit 18 (or a the time of premature discontinuation) except for patients who participated in the serial PK portion of the study and had blood sampling performed at Visit 18 For patients participating in the serial PK portion of the study blood samples (15 mL) were to be collected into heparinized Vacutainer tubes and obtained at Hour 0 (predose) and at 1 2 3 4 6 8 10 and 24 hours after administration of a single 25 mg dose of TOPROL-XL following a 48-hour washout period After the last blood sample was obtained the patient was to startresume the prescribed dose of TOPROL-XL heshe was receiving prior to PK sampling
Patient Disposition Chart (completion or discontinuation)
Overall a total of 31 patients at 8 centers were enrolled in the serial PK portion of the study Of these 31 patients 27 had plasma concentration data available and were included in the analyses Four patients were excluded from the analyses because their plasma concentrations were not quantifiable (Nos 047-009 and 047-021) or because only whole blood samples were analyzed (Nos 005-002 005-003)
DCP1PM Page 63 10182006
Clinical Pharmacology Review NDA 19-962 Toprol-XL 10182006
Table 3 Subject Demographics for Patients Providing Serial Blood Samples
Missing Data Twenty-six patients did not have blood samples obtained for analysis of metoprolol concentrations in either the 16-week (n=7) or 52-week (n=19) studies Among patients with plasma samples 14 (14) in the 52-week study and 13 (13) in the 16-week study had trough plasma metoprolol concentrations that were below the LLQ Therefore data from a total of 99 patients were included in this analysis
Assay Metoprolol plasma levels were assayed using high-performance liquid chromatography tandem mass spectrometric detection methods having limit of quantitation (LOQ) of 1 ngmL The method was validated in the linear range 1 to 1000 ngmL Precision was less than or equal to 109 Accuracy ranged from 940 to 1013 Pharmacodynamics Not applicable
Data Checking SAS was used to format and check data Additionally visual inspection of several randomly selected subject data was carried out
DCP1PM Page 64 10182006
Clinical Pharmacology Review NDA 19-962 Toprol-XL 10182006
Models
Overview The sponsorrsquos stated assumptions underlying this modeling analysis are
1 Rich sampling data collected from 30 subjects in 307B Study can be used to adequately characterize the structural pharmacokinetic model of metoprolol
2 Structural pharmacokinetic models of metoprolol at other dose strength are identical to that at 25 mg
3 Metoprolol exhibits a linear pharmacokinetics in the dose ranges studied 4 Steady-state pharmacokinetics of metoprolol has been reached at the time of blood
sampling in Study 307A 5 Metoprolol accounts for the blood pressure effect in the study 6 Existing various disease states in the patients have no impact on the pharmacokinetics
of metoprolol and pharmacodynamics of the blood pressure reduction in the study 7 Concomitant medications if existed do not have any effects on the pharmacokinetics
of metoprolol and pharmacodynamics of the blood pressure reduction in the study
Reviewer Comment The sponsorrsquos assumptions appear reasonable based on existing metoprolol PKPD information
Pharmacokinetics
4114 PK Structural Model Several PK models were tested to identify the structural model Flip-flop absorption was taken into consideration based on general PK characteristics following administration of sustained release tablets and observed data in the current study (serial PK samples)
The models tested included linear 1- and 2-compartment PK models with the following characteristics (focused on flip-flop models)
bull first-order absorption with and without absorption lag time (NONMEM subroutines ADVAN2 and ADVAN4)
bull zero-order absorption with and without absorption lag time (NONMEM subroutines ADVAN1 and ADVAN3)
bull simultaneous zero- and first-order absorption from the absorption compartment The models were parameterized in terms of CLF and VF
Ultimately the 2-compartment model with first order flip-flop absorption an absorption lag time and 2 residual error terms was selected as the structural model of metoprolol The model scheme is presented in the following Figure 1 Figure 1 PK Compartmental Model
DCP1PM Page 65 10182006
Clinical Pharmacology Review NDA 19-962 Toprol-XL 10182006
4115 PK Covariate Model Covariate models were developed to account for the potential impact of the following covariates and derived covariates on metoprolol PK
Continuous variables bull Age (AGE years) bull Body weight (WT kg) bull Body surface area (BSA m2) calculated from WT and HT (cm) using the height
weight formula BSA=0024265 x WT 05378 x HT03964 bull Ideal body weight (IBW kg) calculated as - Males IBW=50+(HTndash150)25 and
for Females IBW=45+(HTndash150)25 bull Dose (DOSE mg of Toprol-XL)
Categorical variables bull Gender (SEX) - Male 0 - Female 1 bull Race (RACE) - Caucasian 0 - Black 1 - Asian 2 - Other 3
PK covariate effects were modeled as follows
Effects of continuous covariates (AGE WT BSA IBW and DOSE) were normalized to the corresponding median value across a dataset such that continuous covariates were related to structural PK parameters in a power function as described below
where Θ is the fixed-effect parameter of a covariate estimated by the NONMEM program covariate value is the observed covariate value and PK typical value is the typical value of the PK parameter estimated by NONMEM Effects of categorical covariates (SEX and RACE) are related to structural PK parameters by fractional changes of dummy variables
DCP1PM Page 66 10182006
Clinical Pharmacology Review NDA 19-962 Toprol-XL 10182006
Where Θ is the fixed-effect parameter of a covariate estimated by the NONMEM program covariate is the dummy variable value and modified in the control streams and PK typical value is the typical value of this PK parameter as estimated by NONMEM
Median values of all covariates in the dataset for population PK analysis are presented in Table A
Table A Summary of patient covariates and Toprol-XL doses in the data for population PK analysis
Two Steps were included in the modeling of covariates
Step 1 Forward Addition The covariates were subjected to a stepwise forward selection algorithm using a likelihood ratio test based on a change in MOF values from the base model A significant covariate reduced the MOF more than 660 (chi-square distribution plt001 degrees of freedom [df]=1)
Step 2 Backward deletion (Excluding procedures for covariate effect) The covariates in the full model acquired in Step 1 were subjected to a backward deletion algorithm 1 covariate was deleted at a time using a likelihood ratio test based on a change in MOF values A covariate was determined to be statistically significant if the change in MOF after its deletion from the breakdown model was increased by more than 1083 (chi-square distribution plt0001 df=1)
4116 PK Random Variance Models An exponential error model was used to characterize inter-patient variability based upon the assumption that random effects for PK parameters were not correlated among PK parameters No other error models for eta were evaluated by the applicant or by this Reviewer The retention of ETA values for each PK parameter in the structural model was confirmed by sequentially fixing each ETA value at zero and comparing each resultant MOF with the MOF obtained when all ETA values were retained in the model (see Table 6)
DCP1PM Page 67 10182006
Clinical Pharmacology Review NDA 19-962 Toprol-XL 10182006
The residual model was modeled by an additive model two error terms were used one for error associated with trough samples and the other with serial samples
Reviewer Note Use of an exponential model appears reasonable
Pharmacodynamics
4117 PKPD Structural Model The equations for the structural models are shown below
1 Metoprolol Ctrough The relationships between the observed metoprolol concentrations (Ctrough) and hemodynamic changes were investigated using 4 direct-link models namely a linear model a log-linear model and Hillrsquos sigmoid Emax PKPD model with and without a baseline
2 The relationships between Cmax or AUC0ndash24 and hemodynamic changes were investigated using 2 direct-link models a linear model and a log-linear model
4118 PKPD Covariate Model The inclusion and exclusion procedures of covariate effect on the selected PKPD base model to obtain a selected final PKPD model were identical to those in the covariate evaluation in the population PK models as described previously in PK Covariate Model DCP1PM Page 68 10182006
Clinical Pharmacology Review NDA 19-962 Toprol-XL 10182006
Table B Baseline demographic and covariate characteristics
4119 PKPD Random Variance Models An exponential error model was used by the applicant to model inter-individual variability The retention of a random effect parameter ETA in each selected PKPD structural model was then evaluated by sequentially fixing each ETA value at zero and comparing each resultant MOF with the MOF obtained when all ETA values were retained in the model (plt005) This step reduced over-parameterization by deleting unnecessary random-effect parameters from the structural model to obtain the base model
Reviewer Note The study design precludes assessment of inter-individual variability or random error because only one dose record was available per patient Consequently the model should not have included eta terms It is noted that the sponsor ultimately dropped the eta term in the final model
DCP1PM Page 69 10182006
Clinical Pharmacology Review NDA 19-962 Toprol-XL 10182006
Model Selection
PK Initial Model Selection
PK Base Model to Final Model The selection of the most appropriate PK base model for a metoprolol PK was based upon the following criteria a significant reduction in MOF as compared to the baseline model and asymptotic chi-square distribution based on the likelihood ratio test or AIC (plt005) as compared to the other structural models This selected PK base model was then subject to a covariate evaluation The population PK model bearing all surviving covariate parameters with statistical significance became the penultimate final model If 1 of the body size parameters (WT BSA and HT) was not in the model the penultimate final model became the final model If body size parameters were in the model they were sequentially replaced by other body size parameters in the regression submodel for each PK parameter The best body size parameter was then selected on the basis of lowest MOF to form the final model
PK Final Model Selection Simulations and visual inspections based on goodness of fit plots were used to qualify and validate the model The goodness-of-fit of the final model was evaluated graphically by comparing population and individual predictions of metoprolol concentrations with observed metoprolol concentrations along the line of unity and by visual inspection of the following plots of population-weighted residuals (WRES) for the final population model 1 Population-weighted residuals (WRES) versus population-predicted concentrations (PRED) 2 WRES versus time after first drug administration in each patient 3 WRES versus all covariates evaluated WRES were generally expected to be distributed homogenously around zero for PRED time after administration and covariates For those 27 patients with serial samples goodness-of-fit of the plasma concentration-time profile for each individual was visually inspected The linear relationship between their AUClast values from the observed data and those from the simulated data (final model) was examined
The predictive performance of the final population PK model including covariates was evaluated by comparing typical values of PK parameters with the mean of individual Bayesian estimates or individual values of PK parameters with the results from non-compartmental analysis for patients with serial samples Steady-state metoprolol plasma concentration-time profiles from 0ndash24 hours at the interval of 15 minutes (025 hour) were calculated using the post hoc Bayesian estimated PK parameter obtained for 65 patients included in the PKPD relationship using the following equation
DCP1PM Page 70 10182006
Clinical Pharmacology Review NDA 19-962 Toprol-XL 10182006
PKPD Initial and Final Model Selection A similar approach to that of PK model selection was adopted for PKPD Each of the above-mentioned PKPD models with random effects was identified by curve-fitting the dataset Initial selection of the PKPD structural model was based upon a significant reduction in MOF (plt005) as compared to the baseline model and reasonable PKPD parameter estimates Software
Nonlinear mixed-effect modeling (NONMEM) software (Version V level 11 Globomax Hanover MD) was used in the population PK analysis PK model fitting was accomplished using first-order (FO) approximation methods For PKPD model fitting the first-order conditional estimation (FOCE) with eta-epsilon interaction method in NONMEM was used for all model runs
SAS software (Version VIII Cary NC) was employed to prepare datasets according to the format required by the NONMEM program (Boeckmann et al 1991) Microsoftreg Excel 2000 (Redmond WA) and S-PLUS 2000 (Professional Release 2 MathSoft Inc Cambridge MA) were used to perform exploratory graphical exposure calculation and statistical analyses according to the format required by the NONMEM program (Boeckmann et al 1991) SAS command files logs and listings pertaining to data file conversion and merging were reviewed by an independent analyst Datasets were stored in SAS data frames combined and exported to Excel and then to ASCII files before fitting to the model
Datasets were prepared and pooled in a NONMEM-compliant format using SAS software by the Programming Group Clinical Information Sciences at AstraZeneca Wilmington Delaware SAS command files logs and listings pertaining to file conversion and merging were provided and found to be acceptable The contents of both datasets (toprolkatcsv for PK modeling and cppd2csv for PKPD modeling) were included
DCP1PM Page 71 10182006
Clinical Pharmacology Review NDA 19-962 Toprol-XL 10182006
toprolkatcsv was not provided electronically in a SAS format however this reviewer generated a similar dataset using the applicantrsquos criteria
Reviewer Comment The software and data assembly methods appeared adequate
DCP1PM Page 72 10182006
Clinical Pharmacology Review NDA 19-962 Toprol-XL 10182006
Results and Discussion Design Adequacy
Overall the trial designs appeared adequate to evaluate metoprolol population PK and PKPD in pediatric patients receiving Toprol XL However the design could have been further optimized by increasing the sampling points particularly in the absorption phase Due to the limited number of samples in the absorption phase it was not possible to accurately characterize the absorption model first order vs zero order or mixed first and zero order Additionally collection of mainly trough samples limits the ability to accurately estimate measures such as Cmax that are not directly related to Ctrough particularly if multiple compartments are present Consequently Cmax estimations are unlikely to be accurate Finally most patients provided only one trough sample thus inter-individual variability could not be adequately captured and may have limited the utility of the modeling exercise particularly in PKPD where the random effect could not be accurately characterized Ultimately there was no random variable in the final PKPD model (ie eta was set to zero) Data Integrity
This reviewer checked the data visually by randomly selecting data from patients included in the population modeling and comparing to data in the study report (source data) Overall the data integrity appeared acceptable The applicant observed the following guidelines that appeared acceptable No datum from any study participant with a protocol violation that was thought to materially impact the analysis was included The dataset contained data from only those study participants who could be evaluated ie with all the last dosing datetime blood sampling datetime plasma drug concentrations and demographic covariates
Data that were excluded (n = 62 samples) from the model were as follows One sample from an apparent poor metabolizer Two samples collected gt 96 hours post dose From 307B 10 trough samples lt LOQ From 307A 17 samples lt LOQ Thirty-samples from serial data that were lt LOQ or whole blood samples Model and Model Selection
Base Model
41110 Pharmacokinetic Model description The base PK model was a standard two compartment model that incorporated lag time and flip-flop kinetics The key features of the model were flip-flop was insured by making the value of ke gt ka in the clearance equation Additionally lag time was restricted to a value of 2 hours or less and concentrations were log transformed consequently all concentrations (F) = 0 were given individual predicted concentrations of zero Finally there were two residual error terms one for serial samples and the other for trough samples DCP1PM Page 73 10182006
Clinical Pharmacology Review NDA 19-962 Toprol-XL 10182006
Key equations were as follows
KA = THETA(1)EXP(ETA(1)) V2 = THETA(2)EXP(ETA(2)) CL = (THETA(1)THETA(2)+THETA(3))EXP(ETA(3)) Q = THETA(4)EXP(ETA(4)) V3 = THETA(5)EXP(ETA(5)) ALAG1=THETA(6)EXP(ETA(6))
41111 PK Parameter estimation results Table 1 Summary of PK parameters in the metoprolol population PK base model (per applicant)
41112 Goodness of fit The applicant provided the following goodness-of-fit plots (Figure 1)
Reviewer Note The goodness-of-fit plots were reproduced by this Reviewer (see Appendix) with minor modifications
Figure 1 Goodness of fit plots for Base Model
DCP1PM Page 74 10182006
Clinical Pharmacology Review NDA 19-962 Toprol-XL 10182006
Base PK Model Selection The MOF values of all structural model candidates tested are presented in Table 2 Model selection was based primarily on MOF values the lower MOF the better the model The applicant reports that in general MOF values generated by a conventional absorption model (ie absorption rate is faster than elimination rate) and a flip-flop absorption model (ie absorption rate is slower than elimination rate) were identical
Reviewer Comment The existence of flip-flop kinetics appears plausible based on data provided and general patterns for sustained release formulations Consequently the use of flip-flop kinetics for the bulk of the modeling exercise appears reasonable
General conclusions from the information in Table 2 are First order input is better than zero order input Two compartment model is better than one compartment model Lag time presence is better than lack of lag time Two residual error terms are better than one residual error term It should also be noted that several other models led to unsatisfactory completion of the run and were not considered further
DCP1PM Page 75 10182006
Clinical Pharmacology Review NDA 19-962 Toprol-XL 10182006
Table 2 Comparison of Structural PK Models
Reviewer Comment The selected structural model appears appropriate based on the data
Base Model The deletion of ETA for V2 did not change the MOF value suggesting that ETA for V2 should be deleted to avoid an over-parameterized warning (Table 3) This was consistent with the estimated parameter value of ETA for V2 being 648 x 10ndash9 a very small value Therefore the base model was selected by deleting the ETA for V2 from the structural model
Reviewer Comment on Eta deletion for V2 Deletion of eta for V2 is acceptable based on the empirical data however from a physiological perspective deletion of eta is problematic Generally one anticipates inter-individual differences in volume of distribution In this case it appears that the error associated with V2 may have been randomly shifted to V3 and or Q terms as the three DCP1PM Page 76 10182006
Clinical Pharmacology Review NDA 19-962 Toprol-XL 10182006
terms are interrelated This potential shift in error is supported by the fact that the V2 eta value increases significantly (by several orders of magnitude- 10-5 vs 100) when eta for Q and or V3 is fixed However when Q or V3 are fixed minimization is successful but Q and V3 are not accurately estimated Accounting for the possible error shift is a complex process and goes beyond the scope of this reviewer thus deletion of eta associated with V2 was considered acceptable for the remainder of the modeling evaluation
Table 3 Structural elements tested in the metoprolol population PK structural model (p lt 0005)
Final PK Model
41113 Model description The key feature of the final model is the inclusion of the covariate effects of age on Q and weight on CL in the population PK model
Key Equations CL = (THETA(1)THETA(2)+THETA(3)+EWT)EXP(ETA(2)) Q = THETA(4)EAGEEXP(ETA(3))
Including Covariate Effects As previously described covariate effects were assessed by forward addition and backward deletion Most covariates did not significantly change MOF however BSA significantly affected CL and Age affected Q Consequently these covariates were included in the penultimate final model
DCP1PM Page 77 10182006
Clinical Pharmacology Review NDA 19-962 Toprol-XL 10182006
Reviewer Note BSA is derived form WT and HT covariates implying BSA is highly correlated to these two covariates (Figure 2) weight is the most suitable (practical covariate) as it is readily measured Furthermore weight and BSA produced the same MOF (Table 4) whereas MOF with height was more positive (less significant)
Figure 2 Plot of BSA vs Body Weight
The data in Table 4 support selection of the final model
Table 4 Covariate elements tested in the metoprolol population PK penultimate final model (plt0005)
The applicant acknowledges that mechanism(s) accounting for the impact of age on QF are not clear However since distribution clearance has little effect on metoprolol plasma exposure further investigation is not needed
41114 PK Parameter estimation results As shown in Table 5 PK parameters were estimated fairly precisely by the final model
Table 5 PK Parameter Estimates using Final Model
DCP1PM Page 78 10182006
Clinical Pharmacology Review NDA 19-962 Toprol-XL 10182006
41115 Goodness of fit The goodness-of-fit plots provided by the applicant show good precision Figure 5 Goodness of fit plots for final PK model
DCP1PM Page 79 10182006
Clinical Pharmacology Review NDA 19-962 Toprol-XL 10182006
PK Model Qualification The post hoc Bayesian-estimated AUC (simulated) obtained for the 27 patients with serial plasma samples are plotted against the observed (AUCt) The correlation was high (R2 gt 099) Figure 6 AUClast from observed data versus AUCt from model simulation in the 27 patients providing serial plasma samples
Regression line Y= 4514 + 08976 X R2 = 09957
The graphical validation of the final metoprolol population PK model validation against covariates evaluated is presented in Figure 6
Figure 7 Graphical validation of covariates
DCP1PM Page 80 10182006
Clinical Pharmacology Review NDA 19-962 Toprol-XL 10182006
There was no systematic bias in weighted residuals for any covariates evaluated suggesting that the final model included all appreciable effects of available covariates (Figure)
The effects of weight on metoprolol CLF are illustrated in Figure 8 where Bayesian post hoc estimates of CLF are plotted against weight and overlaid by the model-predicted line Overall the model appeared to fit the data well
Figure 8 Plot of CLF vs Body weight
The effects of AGE on metoprolol QF are illustrated in Figure 9 where Bayesian post hoc estimates of QF are plotted against AGE and overlaid by the model-predicted line Figure 9 Plot of QF vs Age
DCP1PM Page 81 10182006
Clinical Pharmacology Review NDA 19-962 Toprol-XL 10182006
Reviewer Note The applicant indicated that attempts to run the final model using the first-order conditional estimation method resulted in termination errors Therefore the parameter estimates obtained by the FO method were reported as the final parameter estimates
Conclusion Regarding Population PK Modeling Overall the sponsorrsquos population PK modeling is acceptable
PKPD Model and Model Selection
PKPD Base Model PharmacokineticPharmacodynamic Model description The key feature of the model was a lack of random variance term for the slope (since only single data points were available per subject) and inclusion of baseline effect
Key equations were as follows E0 = THETA(1)EXP(ETA(1)) M = THETA(2) Y = E0 + MLOG(AUC) + EPS(1)
The control stream provided in the appendix is that for DBP (provided by sponsor) The control stream for SBP is comparable with appropriate substitution for BP type
It should be noted that only the log-linear and linear PKPD models were considered suitable for AUC and Cmax For this review only AUC estimates were considered reliable as Cmax estimates could not be accurately determined based on the sampling scheme Consequently the remainder of this review focuses on AUC information although Ctrough and Cmax data are displayed for reference
Bayesian estimates from PK modeling are summarized in Table 1
Table 1 Bayesian estimates of metoprolol PK exposure for those patients included in the PKPD analysis (N=65)
DCP1PM Page 82 10182006
Clinical Pharmacology Review NDA 19-962 Toprol-XL 10182006
PKPD Model Selection (initial and final) The log-linear model was adopted as the base model for this PKPD relationship since it improved the MOF significantly (Table 2) The ETA parameter for the slope was pre-eliminated for the purpose of model parsimony The intercept and slope in this log-linear model for AUC(0-24) did not bear ETA parameter therefore no covariates had impact on either parameter in the model
Reviewer Note The intercept should not have borne an eta term because individual subjects provided only one data point Consequently fixing eta to zero or deleting eta in the final model is appropriate No further model development was required after eta was eliminated and the base model was equivalent to the final model
Table 2 Base population PKPD models tested for the change in SBP
41116 PKPD Parameter estimation results The final PKPD parameter estimates are presented in Table 3
Table 3 Summary parameters in the final PKPD model for the change in SBP using trough plasma level Parameter Explanation Estimate SE ()b
DCP1PM Page 83 10182006
Clinical Pharmacology Review NDA 19-962 Toprol-XL 10182006
Model Qualification Based on the relatively low R2 value and as shown in Figure there is a poor correlation between change in SBP and log AUC
Figure 1 Relationship between change in SBP and AUC (line generated from modeling)
Overall goodness-of-fit of the model was considered to be poor probably due to the high variability in the measurements Consequently the precision of the model parameter estimates was not considered to be very reliable These parameters have little clinical usefulness and can be treated only as an indication of trends ie more hemodynamic effects can be potentially achieved when high Toprol-XL doses are given Clinical dose adjustment based on these PKPD parameters is not recommended
Reviewerrsquos Supplemental Analyses A supplemental PKPD analyses was conducted using simple linear regression since the population model did not improve the fit Overall eta made an insignificant contribution to the overall model The results of the analyses were similar to the population analyses A series of regression analyses were conducted and are presented in Table 4
The applicant notes that the preliminary modeling exercise found that there was no difference in the PKPD modeling results using different hemodynamic data formats (ie change in the measurements percent change in the measurements or actual BP measurements) This finding was confirmed by this reviewer (see Table 4)
DCP1PM Page 84 10182006
Clinical Pharmacology Review NDA 19-962 Toprol-XL 10182006
Table 4 Supplemental PKPD Regression Analyses Conducted by Reviewer Model (liner regression) Intercept (I) Slope (m) R2 Probability RSBP = mISBP + I 3957 -035 01626 0009 PSBP = mISBP + I 2524 -023 01252 00038 PSBP = mRSBP + I 0005 074 09891 lt 00001 RSBP = mlogAUC + I 651 -221 0060 00493 RSBP = mDose + I -751 0006 00026 06878 RSBP = mDose^ + I -312 -111 004 02711 RSBP = mlogAUC + nISBP + I 5303 -221 (m)
-035 (n) 02230 0001
RSBPplc = mAUC + I -667 -0003 00458 00871 RSBPplc = mlogAUC + I 461 -2208 00600 00493 RPUL = mlogAUC + I 1868 -405 01102 00069 Symbols in table similar to population PK model without eta term RSBP- change of SBP without placebo correction ISBP- initial (baseline) SBP RPUL- change in HR without placebo correction Dose- in mg where placebo is included as 0 mg PSBP- percentage change of SBP without placebo correction
Conclusion Regarding Population PKPD Modeling Overall the sponsorrsquos population PKPD modeling is acceptable No dose adjustment conclusion can be made from this modeling however an exposure-response relationship was established for AUC and reduction in SBP
Discussion
The significance of the results 1 Provide estimates of PK measures and plasma exposure in pediatric population These data can be compared to adult exposure to determine if exposure differences impact drug effectiveness The main challenge in comparing pediatric data to adult data is different modeling schemes formulations and methods were used in the two populations
2 PKPD findings are not sufficiently precise to provide a dose adjustment algorithm however the PKPD analyses provides rationale for proposed titration as increasing exposure (doses) may improve efficacy (reduction in SBP) Ultimately the risk-benefit analyses overrides PKPD assessment for dose adjustment drug will be titrated thus reliance on PKPD information is not critical The proposed dose 10 mgkg appears suitable based on available information It is unclear from the studies if there should be an initial maximum dose although the sponsor has proposed 50 mg as the maximum initial dose The proposed pediatric starting dose on a mgkg basis is within the range of starting adult doses (25 ndash 100 mg) assuming an adult weighs 70 kg
3 Cumulative information form dose-response study indicates that Toprol XL has effectiveness in children however the most effective dose is unclear Since the drug can be titrated determining the initial optimal dose does not appear critical As proposed by the applicant dosing is started at a ldquolowrdquo dose that can be up-titrated if needed
DCP1PM Page 85 10182006
Clinical Pharmacology Review NDA 19-962 Toprol-XL 10182006
4 The results did not adequately address the potential impact of CYP2D6 metabolic status for pediatric patients taking Toprol XL There were an insufficient number of patients to make this assessment
5 Covariate effects do not appear significant only body weight significantly affects clearance However a worst case scenario can occur with a person that has a low body weight and is a poor metabolizer this will result in very high possibly supra-therapeutic exposure Age does not impact apparent oral clearance so an age-dependent dose adjustment is not needed for children over 6 years old In essence all children over six years old can initiate therapy at 10 mgkg
The validity of the results Overall the results produced by the sponsor appear valid and the sponsor used a sound modeling approach However alternative approaches that could have been adopted may have improved the outcome of the analyses Three of these approaches are presented below 1 Additional PK samples should have been collected during the absorption phase and
throughout the dosing interval to improve the modelrsquos performance Specifically additional samples collected during the absorption phase may have unambiguously identified the actual absorption input function (eg first order zero order mixed first and zero order) First order input was selected for the analyses although the dosage form is reported to exhibit zero order kinetics in adults It is possible that the input rate in children differs from that in adults but unlikely It should be noted that absorption kinetics in children is often erratic due to multiple factors (eg regioshyselective absorption incomplete gastric emptying and inconsistent absorption) so it is unclear if additional samples would have definitively identified the absorption function However additional non-trough samples may have helped in estimating key PK measures such as V and Cmax The final model did not have an eta associated with V which is atypical Collection of additional samples on different visits may have helped estimate potential inter-occasion variability It should be noted that AUC was estimated precisely for subjects providing serial samples but these subjects were not necessarily included in the PKPD analyses Ideally the PKPD modeling should have been conducted primarily in subjects who had accurate PK measures
2 The PKPD design could have been modified to potentially improve the utility of the analyses Specifically there should have been better placebo matching procedures to minimize the potential impact of the placebo effect This matching could have been improved by ensuring all patients on placebo had the same titration schedule and number of tablets It is noted that the model had a poor predictive performance that was mainly attributed to the high degree of variability in the PD measures Potentially other PD markers could have been explored that have less inherent variability One such marker is the degree of beta blockade using exercise heart rate (EHR) reduction this marker has been used extensively for metoprolol in adult subjects However use of EHR in the pediatric setting may be challenging
DCP1PM Page 86 10182006
Clinical Pharmacology Review NDA 19-962 Toprol-XL 10182006
Comments to sponsor
In future pharmacometric studies you should consider the following 1 collect sufficient (multiple) samples from individual subjects to allow assessment
of inter-occasion variability and estimation of inter-individual variability (eta) for all relevant parameters
2 placebo groups should be identically matched across all dose groups (eg same titration schedule and number tablets) to minimize potential bias or differences in the placebo effect
Comments to medical reviewer
1 The sponsor has adequately characterized metoprolol PK in the studied pediatric population The PK characterization could have been further optimized by obtaining additional samples over the entire dosing interval (eg during the absorption phase and elimination phase) on multiple occasions rather than on one occasion primarily at trough
2 A dose-response relationship could not be established using the protocol specified analysis approach The outcome of the dose-response relationship appeared highly dependent on the ldquoplacebo effectrdquo suggesting that the placebo group may not have been appropriate One should consider re-evaluating the dose-response precisely matched placebo groups (eg all placebo patients have identical number of tablets and titration schedule)
3 Based on the PKPD analysis plasma exposure (AUC) explains lt 10 of the response (reduction in systolic blood pressure) thus has limited clinical utility However the PKPD relationship suggests that there is a trend for increased response with increased exposure (dose driven)
4 Overall information from the dose-response study suggests that Toprol- XL is effective in the pediatric population The optimal initial dose 02 10 or 20 mgkg or the maximum safe and effective dose cannot be determined from the information provided It is noted that the 02 mgkg dose is unlikely to be effective as plasma concentrations achieved at this dose are unlikely to be effective (most concentrations lt LOQ and lower than effective adult concentrations) The 10 mgkg (proposed by applicant) appears to be a reasonable initial dose The labeling should reflect the regimens studied
DCP1PM Page 89 10182006
Clinical Pharmacology Review NDA 19-962 Toprol-XL 10182006
Appendix
DCP1PM Page 90 10182006
Clinical Pharmacology Review NDA 19-962 Toprol-XL 10182006
DCP1PM Page 91 10182006
Clinical Pharmacology Review NDA 19-962 Toprol-XL 10182006
DCP1PM Page 92 10182006
Clinical Pharmacology Review NDA 19-962 Toprol-XL 10182006
DCP1PM Page 93 10182006
Clinical Pharmacology Review NDA 19-962 Toprol-XL 10182006
DCP1PM Page 94 10182006
Clinical Pharmacology Review NDA 19-962 Toprol-XL 10182006
DCP1PM Page 95 10182006
Clinical Pharmacology Review NDA 19-962 Toprol-XL 10182006
Table 15 Control streams for final log-linear PKPD model for the change in DBP using metoprolol Cmax as the measure of exposure
Truncated NONMEM reports for base model identification for PKPD relationship in change of SBP (per sponsor)
DCP1PM Page 96 10182006
Clinical Pharmacology Review NDA 19-962 Toprol-XL 10182006
Reported PD information^
^ Under metoprolol regimen CRZ0K is Toprol XL
DCP1PM Page 97 10182006
Clinical Pharmacology Review NDA 19-962 Toprol-XL 10182006
Table Results of randomised double-blind comparative trials evaluating antihypertensive efficacy of metoprolol formulations or other antihypertensives
DCP1PM Page 98 10182006
---------------------------------------------------------------------------------------------------------------------
---------------------------------------------------------------------------------------------------------------------
---------------------
This is a representation of an electronic record that was signed electronically and this page is the manifestation of the electronic signature
s
Robert Kumi 10182006 045635 PM BIOPHARMACEUTICS
Patrick Marroum 10192006 050811 PM BIOPHARMACEUTICS
Clinical Pharmacology Review NDA 19-962 Toprol-XL 10182006
20 mgkg groups had their dose up-titrated (based on weight) to the target dose over the first 1 to 2 weeks of double-blind treatment
Reviewer Note Rationale on Study design The inclusion of more patients in the TOPROL-XL 02 mgkg and 20 mgkg groups allowed better estimation of the dose response at the low and high ends of the dose range The TOPROL-XL 10 mgkg group with fewer patients provided a middle estimate that helped to describe the shape of the dose-response curve However having a fewer number of subjects may have contributed to variability Inclusion of a placebo control group allowed for the quantification of treatment-related BP reductions after adjusting for placebo effect It should be noted that the placebo groups were not identical as they followed different titration schedules and had a different number of tablets
The 02 mgkg dose is lower than the lowest approved adult dose on a mgkg basis (assuming 70 kg adult weight) but the highest studied pediatric dose 20 mgkg (200 mg limit was placed) is lower than the highest studied adult dosage 400 mg
Table 2 Toprol Dosing Scheme for Study 307A
Table 3 Formulations used in 307A
DCP1PM Page 50 10182006
Clinical Pharmacology Review NDA 19-962 Toprol-XL 10182006
SPONSORrsquoS STATISTICAL ANALYSIS PLAN HIGHLIGHTS bull The primary analysis used an intention-to-treat (ITT) population which included
all patients who received at least 1 dose of study medication and had baseline and at least 1 post baseline measurement For this analysis missing data were imputed using a last observation carried forward (LOCF) approach
bull A simple linear regression analysis was performed on the placebo-corrected change from baseline to Week 4LOCF in sitting SBP and sitting DBP with dose ratio as the explanatory variable
bull The placebo correction for placebo-corrected changes from baseline to Week 4 LOCF in sitting SBP and sitting DBP was performed by subtracting the mean change from baseline for the placebo group from the individual patient changes in the other treatment groups
bull ANOVA was performed with treatment group as the main factor for the changes from baseline to each post baseline visit in sitting SBP and DBP This ANOVA model was used to construct pairwise comparisons of each active treatment versus placebo and the active treatment groups combined versus placebo
bull The percentage of responders at Week 4 was summarized by frequency counts percentages and 95 confidence intervals (CI) for each treatment group
bull Subgroup analyses were also performed on the changes from baseline at Week 4 in sitting SBP and DBP and the influence of heart rate and baseline body mass index (BMI) on the mean changes from baseline to Week 4LOCF in sitting SBP and DBP were examined using linear regressions
bull Trough plasma concentrations of metoprolol were summarized descriptively and the lower limit of quantitation (LLQ) was 1 ngmL
bull Safety data were summarized using the safety population defined as all patients who received at least 1 dose of study medication and were not lost to follow-up No statistical analyses were performed on the safety data in this study
DCP1PM Page 51 10182006
Clinical Pharmacology Review NDA 19-962 Toprol-XL 10182006
Results Patient Disposition Per applicant patients recruited into this study were representative of a pediatric population with hypertension The four treatment groups were balanced with respect to demographic and baseline characteristics (Tables 4 and 5) About 80 percent of the patients were considered 90 compliant
Table 4 Baseline Characteristics in Study 307A
Table 5 Sitting SBP and DBP measurements at baseline
Sitting and standing BP measurement were comparable (eg mean SBP for all patients- sitting = 1319 and standing 1306 with similar CVs ~ 9 )
Primary Efficacy Variable The results for the primary efficacy variable are illustrated in Figure 1 Figure Dose response for placebo-corrected change from baseline to Week4LOCF for sitting SBP (ITT population)
DCP1PM Page 52 10182006
Clinical Pharmacology Review NDA 19-962 Toprol-XL 10182006
Figure 1 Change in SBP from baseline as a function of Toprol XL dose
Table 6 Linear regressions statistics used to assess Dose-Response
The results indicate that bull The slope of the curve is not different form zero (p = 05371 for dose ratio)
suggesting that there is no dose-response relationship bull Most active treatment groups are more effective than placebo in reducing SBP
By visual inspection it appears the lack of observed dose-response is mainly driven by a lower than expected response at the 20 mgkg level
Potential issues affecting efficacy and pharmacokinetic results bull LOCF was required for eight patients however the LOCF approach did not
greatly impact the outcome of the trial bull Patients assigned to the 10 mg and 20 mgkg dose received drug for only 2
weeks whereas dose in the 02 mgkg received the same dose for 4 weeks
DCP1PM Page 53 10182006
Clinical Pharmacology Review NDA 19-962 Toprol-XL 10182006
Reviewerrsquos Supplemental Dose-Response Analyses The sponsorrsquos dose-response analysis was successfully reproduced by this Reviewer using pooled placebo corrected data A supplemental analysis was conducted using group-specific placebo corrected data In this procedure data for subjects assigned to a given Active Group (eg 02 mgkg) were corrected with Placebo data (02 mgkg) Group specific placebo data are presented in Table 7
Table 7 Placebo-group specific data Placebo Group Frequency Delta SBP 02 mgkg 8 -567 10 mgkg 6 -300 20 mgkg 9 230
It should be noted that the group-specific placebo data appeared to follow a consistent trend where the placebo effect decreased with increasing number of tablets It is unclear if this titrationtablet-dependent placebo effect is valid or random Overall the apparent differential placebo effects suggest that the placebo group may have overly influenced the outcome of the dose-response analysis
When active groups are corrected using group-matched placebo data there is a statistically significant dose-response The dose response using group-specific placebo data is illustrated in Table 8 and Figure 2
Figure 2 Placebo corrected changes in SBP (chg_pc on y axis) as a function of dose ratio
Potential Limitations of Supplemental Analyses Typically placebo effects are constant if randomization is correct thus it is unclear if subsetting the placebo group is acceptable and did not increase bias Additionally subsetting the placebo group leads to a reduced number of placebo subjects per dose group that may impact the regression analyses
DCP1PM Page 54 10182006
Clinical Pharmacology Review NDA 19-962 Toprol-XL 10182006
Table 8 SAS output for regression analyses using group-specific placebo corrections The REG Procedure
Model MODEL1
Dependent Variable chg_pc
Number of Observations Read 117
Number of Observations Used 117
Analysis of Variance
Sum of Mean
Source DF Squares Square F Value Pr gt F
Model 1 191083177 191083177 2663 lt0001
Error 115 825109481 7174865
Corrected Total 116 10162
Root MSE 847046 R-Square 01880
Dependent Mean -430358 Adj R-Sq 01810
Coeff Var -19682365
Parameter Estimates
Parameter Standard
Variable Label DF Estimate Error t Value Pr gt |t|
Intercept Intercept 1 125480 133166 094 03480
DOSRATIO Dose Ratio 1 -100051 019387 -516 lt0001
Secondary variables
bull Placebo-corrected change from baseline in sitting DBP The mean plusmn SD change (Week 4LOCF) in sitting DBP is illustrated in Figure 3 and Table 9
Figure 3 Mean changes (actual and placebo-corrected) from baseline to Week 4LOCF for sitting DBP (ITT population)
DCP1PM Page 55 10182006
Clinical Pharmacology Review NDA 19-962 Toprol-XL 10182006
Table 9 SAS output for regression analyses for DBP with pooled placebo correction
Treatment group effects and pairwise comparisons for sitting SBP and DBP Results of the treatment group effects at the Week 4LOCF visit and the pairwise comparisons between each TOPROL-XL group and placebo for the change from baseline in sitting SBP and DBP are shown for the ITT population in Table 10
Table 10 Treatment group effects for change in baseline to Week 4LOCF for sitting SBP and DBP (ITT population)
Some key findings from the pair-wise comparison are as follows (Table 10) 1 All active groups produced statistically significant reductions from baseline in sitting
SBP and DBP at the Week 4LOCF visit whereas placebo did not
DCP1PM Page 56 10182006
Clinical Pharmacology Review NDA 19-962 Toprol-XL 10182006
2 Overall the mean change from baseline in sitting SBP at Week 4LOCF for the TOPROL-XL groups pooled was statistically significantly larger than that for the placebo group (p=00351)
3 Results of pairwise comparisons between individual TOPROL-XL dose groups and placebo also revealed a statistically significant difference for the 10 and 20 mgkg groups (p=00270 and p=00492 respectively)
bull Mean changes over time in sitting SBP and DBP Consistent with findings from other studies with beta-blockers apparent maximal reduction in blood pressure occurred between 1 and 4 weeks of treatment
Figure 4 Mean changes over time for sitting SBP and DBP (ITT population)
Data points in plot are from absolute values (not taking baseline into account)
Subgroup Analyses The sponsor conducted several exploratory subgroup analyses however these analyses were not reviewed critically and are not presented in this review as
1 they do no impact the primary outcome or study objective 2 they are unlikely to be clinically useful due to the small number of patients per
subgroup One potentially useful some group analyses involved the percentage of responders as defined in Table 11
The responder analyses shows comparable response rates for all active dose groups suggesting similar efficacy across dose groups despite different exposure (doses)
DCP1PM Page 57 10182006
Clinical Pharmacology Review NDA 19-962 Toprol-XL 10182006
Table 11 Number and proportion of responders (ITT population)
Pharmacokinetic Results The Ctrough information obtained in the trial are summarized in Figure 6 and Tables 12 and 13
Table 12 Summary of Ctrough data (per applicant)
Sixteen patients across the 3 TOPROL-XL groups did not have blood samples obtained for analysis of metoprolol concentrations Based on the number of samples BLQ there appeared to be very low concentrations in the lowest dose group It appeared that Ctrough increased with dose According to the applicant these values are similar to those obtained previously in adults especially at the 2 higher doses Variability was high in all treatment groups (CV gt 60 )
Table 12 Summary of Ctrough (Reviewer Generated) from all patients (samples lt LOQ given value = 0) Toprol XL Dose Number of subjects Concentration (ngmL) (mgkg) Mean plusmn SD Median Range 02 39 137 plusmn 294 000 0 ndash 157 10 17 1224 plusmn 1416 845 0 ndash 571 20 46 2462 plusmn 3352 1140 0 ndash 1670
DCP1PM Page 58 10182006
Clinical Pharmacology Review NDA 19-962 Toprol-XL 10182006
Reviewer Note Overall the plasma concentrations (exposure) for the 02 mgkg dose group appear too low to be effective (close to LOQ) It is noted that adults typically have concentrations gt LOQ at the lowest therapeutic dose 25 mg (~ 4 ngmL)
Figure 6 Boxplot of metoprolol Ctrough using samples gt LLQ (per applicant)
Safety Results According to the applicant Toprol XL was well tolerated in the pediatric population as tabulated below
Main Analyses Conclusions bull No dose response was observed for corrected SBP using pooled placebo data
however using group-matched placebo data demonstrated a dose response bull Ctrough increased with dose bull Toprol 10 and 20 mg kg doses were more effective than placebo in reducing
SBP bull The responder rate was comparable across all active dose groups and this rate was
greater than that of placebo
DCP1PM Page 59 10182006
Clinical Pharmacology Review NDA 19-962 Toprol-XL 10182006
Methods Reviewerrsquos Methods Generally this reviewer conducted the analyses in a manner similar to that of the sponsor to confirm the sponsorrsquos findings
Sponsorrsquos Methods
Design Study1 307A
Reviewer Note This study was described in the Dose-Response Assessment (please refer to Page 7 Dose Response Analyses) Consequently only highlights relevant to the population analyses will be included in this section
Study 307A was a 4-week multi-center double-blind placebo-controlled randomized parallel-group study TOPROL-XL (metoprolol succinate) extended-release tablets were given to hypertensive pediatric patients Patients were randomized to double-treatment with a once daily oral dose of placebo or Toprol-XL at 1 of 3 target doses 02 or 20 mgkg The dose range for this study was 125 to 200 mg daily Patients on placebo followed the same schedule as that for their active group comparators
Study Flow Chart
Key Inclusion Criteria School age and adolescent children with reproducible SBP or DBP at or above the 95th percentile using height-adjusted charts for age and weight were eligible
DCP1PM Page 60 10182006
Clinical Pharmacology Review NDA 19-962 Toprol-XL 10182006
Study2 307B
Study 307B was a 52-week multi-center open-label study to determine the safety and pharmacokinetics of TOPROL-XL (metoprolol succinate) extended-release tablets (metoprolol CRXL) in hypertensive pediatric patients The starting dose was 25 mg daily The dose was increased every 2 weeks in increments of 25 mg or 50 mg based on tolerability until BP was controlled or the dose reached 200 mg
Table 1 Study Assessments
At the end of the 52-treatment period all patients had BP measured and a trough plasma level taken 24 hours the last dose of Toprol-XL with the exception of those patients who completed the serial portion at the final visit Among the participants a subgroup of approximately 30 patients was to participate in PK assessments of metoprolol requiring serial blood sampling at any time during the 52 weeks A single dose of 25 mg of Toprol-XL was given orally to those participating patients after a 48-hour washout period After the PK assessments they returned to the main study protocol Data
Study1 307A
4111 Pharmacokinetics A blood sample was to be collected at Visit 7 into a heparinized Vacutainer tube and obtained at 24 hours (plusmn2 hour) following the last dose of study medication (ie trough measurement) for determination of plasma metoprolol concentrations
Study Disposition Chart
DCP1PM Page 61 10182006
Clinical Pharmacology Review NDA 19-962 Toprol-XL 10182006
Table 2 Study Demographics
4112 Pharmacodynamics Primary variable
Sitting SBP determined at trough (24plusmn4 hours Visit 7) served as the primary efficacy assessment The primary measure of effect was the placebo-corrected change from baseline to the end of treatment (Week 4) in trough sitting SBP Each BP determination represented the mean of 3 readings with less than 7 mmHg between the highest and lowest value Blood pressure was measured using a mercury sphygmomanometer with an appropriate size cuff positioned approximately at the level of the heart Every effort was made to have the same individual measure the patientrsquos BP throughout the study if possible At all post randomization visits BP measurements were to be made at trough defined as 24 hours (plusmn4 hours) after receiving study medication All measurements were to be determined prior to the patient taking the scheduled dose of study medication In the
DCP1PM Page 62 10182006
Clinical Pharmacology Review NDA 19-962 Toprol-XL 10182006
event that the patient accidentally took study medication on the day of the scheduled visit the visit was to be rescheduled within 24 to 48 hours
Study2 307B
4113 Pharmacokinetics A 48-hour washout period prior to sampling was required for all patients including patients who entered the 52-week study and then decided to participate in the serial PK portion of the study All patients were to have a 15-mL blood sample collected into a heparinized Vacutainer tube 24 hours (plusmn2 hour) following the last dose of TOPROL-XL (ie trough measurement) at Visit 18 (or a the time of premature discontinuation) except for patients who participated in the serial PK portion of the study and had blood sampling performed at Visit 18 For patients participating in the serial PK portion of the study blood samples (15 mL) were to be collected into heparinized Vacutainer tubes and obtained at Hour 0 (predose) and at 1 2 3 4 6 8 10 and 24 hours after administration of a single 25 mg dose of TOPROL-XL following a 48-hour washout period After the last blood sample was obtained the patient was to startresume the prescribed dose of TOPROL-XL heshe was receiving prior to PK sampling
Patient Disposition Chart (completion or discontinuation)
Overall a total of 31 patients at 8 centers were enrolled in the serial PK portion of the study Of these 31 patients 27 had plasma concentration data available and were included in the analyses Four patients were excluded from the analyses because their plasma concentrations were not quantifiable (Nos 047-009 and 047-021) or because only whole blood samples were analyzed (Nos 005-002 005-003)
DCP1PM Page 63 10182006
Clinical Pharmacology Review NDA 19-962 Toprol-XL 10182006
Table 3 Subject Demographics for Patients Providing Serial Blood Samples
Missing Data Twenty-six patients did not have blood samples obtained for analysis of metoprolol concentrations in either the 16-week (n=7) or 52-week (n=19) studies Among patients with plasma samples 14 (14) in the 52-week study and 13 (13) in the 16-week study had trough plasma metoprolol concentrations that were below the LLQ Therefore data from a total of 99 patients were included in this analysis
Assay Metoprolol plasma levels were assayed using high-performance liquid chromatography tandem mass spectrometric detection methods having limit of quantitation (LOQ) of 1 ngmL The method was validated in the linear range 1 to 1000 ngmL Precision was less than or equal to 109 Accuracy ranged from 940 to 1013 Pharmacodynamics Not applicable
Data Checking SAS was used to format and check data Additionally visual inspection of several randomly selected subject data was carried out
DCP1PM Page 64 10182006
Clinical Pharmacology Review NDA 19-962 Toprol-XL 10182006
Models
Overview The sponsorrsquos stated assumptions underlying this modeling analysis are
1 Rich sampling data collected from 30 subjects in 307B Study can be used to adequately characterize the structural pharmacokinetic model of metoprolol
2 Structural pharmacokinetic models of metoprolol at other dose strength are identical to that at 25 mg
3 Metoprolol exhibits a linear pharmacokinetics in the dose ranges studied 4 Steady-state pharmacokinetics of metoprolol has been reached at the time of blood
sampling in Study 307A 5 Metoprolol accounts for the blood pressure effect in the study 6 Existing various disease states in the patients have no impact on the pharmacokinetics
of metoprolol and pharmacodynamics of the blood pressure reduction in the study 7 Concomitant medications if existed do not have any effects on the pharmacokinetics
of metoprolol and pharmacodynamics of the blood pressure reduction in the study
Reviewer Comment The sponsorrsquos assumptions appear reasonable based on existing metoprolol PKPD information
Pharmacokinetics
4114 PK Structural Model Several PK models were tested to identify the structural model Flip-flop absorption was taken into consideration based on general PK characteristics following administration of sustained release tablets and observed data in the current study (serial PK samples)
The models tested included linear 1- and 2-compartment PK models with the following characteristics (focused on flip-flop models)
bull first-order absorption with and without absorption lag time (NONMEM subroutines ADVAN2 and ADVAN4)
bull zero-order absorption with and without absorption lag time (NONMEM subroutines ADVAN1 and ADVAN3)
bull simultaneous zero- and first-order absorption from the absorption compartment The models were parameterized in terms of CLF and VF
Ultimately the 2-compartment model with first order flip-flop absorption an absorption lag time and 2 residual error terms was selected as the structural model of metoprolol The model scheme is presented in the following Figure 1 Figure 1 PK Compartmental Model
DCP1PM Page 65 10182006
Clinical Pharmacology Review NDA 19-962 Toprol-XL 10182006
4115 PK Covariate Model Covariate models were developed to account for the potential impact of the following covariates and derived covariates on metoprolol PK
Continuous variables bull Age (AGE years) bull Body weight (WT kg) bull Body surface area (BSA m2) calculated from WT and HT (cm) using the height
weight formula BSA=0024265 x WT 05378 x HT03964 bull Ideal body weight (IBW kg) calculated as - Males IBW=50+(HTndash150)25 and
for Females IBW=45+(HTndash150)25 bull Dose (DOSE mg of Toprol-XL)
Categorical variables bull Gender (SEX) - Male 0 - Female 1 bull Race (RACE) - Caucasian 0 - Black 1 - Asian 2 - Other 3
PK covariate effects were modeled as follows
Effects of continuous covariates (AGE WT BSA IBW and DOSE) were normalized to the corresponding median value across a dataset such that continuous covariates were related to structural PK parameters in a power function as described below
where Θ is the fixed-effect parameter of a covariate estimated by the NONMEM program covariate value is the observed covariate value and PK typical value is the typical value of the PK parameter estimated by NONMEM Effects of categorical covariates (SEX and RACE) are related to structural PK parameters by fractional changes of dummy variables
DCP1PM Page 66 10182006
Clinical Pharmacology Review NDA 19-962 Toprol-XL 10182006
Where Θ is the fixed-effect parameter of a covariate estimated by the NONMEM program covariate is the dummy variable value and modified in the control streams and PK typical value is the typical value of this PK parameter as estimated by NONMEM
Median values of all covariates in the dataset for population PK analysis are presented in Table A
Table A Summary of patient covariates and Toprol-XL doses in the data for population PK analysis
Two Steps were included in the modeling of covariates
Step 1 Forward Addition The covariates were subjected to a stepwise forward selection algorithm using a likelihood ratio test based on a change in MOF values from the base model A significant covariate reduced the MOF more than 660 (chi-square distribution plt001 degrees of freedom [df]=1)
Step 2 Backward deletion (Excluding procedures for covariate effect) The covariates in the full model acquired in Step 1 were subjected to a backward deletion algorithm 1 covariate was deleted at a time using a likelihood ratio test based on a change in MOF values A covariate was determined to be statistically significant if the change in MOF after its deletion from the breakdown model was increased by more than 1083 (chi-square distribution plt0001 df=1)
4116 PK Random Variance Models An exponential error model was used to characterize inter-patient variability based upon the assumption that random effects for PK parameters were not correlated among PK parameters No other error models for eta were evaluated by the applicant or by this Reviewer The retention of ETA values for each PK parameter in the structural model was confirmed by sequentially fixing each ETA value at zero and comparing each resultant MOF with the MOF obtained when all ETA values were retained in the model (see Table 6)
DCP1PM Page 67 10182006
Clinical Pharmacology Review NDA 19-962 Toprol-XL 10182006
The residual model was modeled by an additive model two error terms were used one for error associated with trough samples and the other with serial samples
Reviewer Note Use of an exponential model appears reasonable
Pharmacodynamics
4117 PKPD Structural Model The equations for the structural models are shown below
1 Metoprolol Ctrough The relationships between the observed metoprolol concentrations (Ctrough) and hemodynamic changes were investigated using 4 direct-link models namely a linear model a log-linear model and Hillrsquos sigmoid Emax PKPD model with and without a baseline
2 The relationships between Cmax or AUC0ndash24 and hemodynamic changes were investigated using 2 direct-link models a linear model and a log-linear model
4118 PKPD Covariate Model The inclusion and exclusion procedures of covariate effect on the selected PKPD base model to obtain a selected final PKPD model were identical to those in the covariate evaluation in the population PK models as described previously in PK Covariate Model DCP1PM Page 68 10182006
Clinical Pharmacology Review NDA 19-962 Toprol-XL 10182006
Table B Baseline demographic and covariate characteristics
4119 PKPD Random Variance Models An exponential error model was used by the applicant to model inter-individual variability The retention of a random effect parameter ETA in each selected PKPD structural model was then evaluated by sequentially fixing each ETA value at zero and comparing each resultant MOF with the MOF obtained when all ETA values were retained in the model (plt005) This step reduced over-parameterization by deleting unnecessary random-effect parameters from the structural model to obtain the base model
Reviewer Note The study design precludes assessment of inter-individual variability or random error because only one dose record was available per patient Consequently the model should not have included eta terms It is noted that the sponsor ultimately dropped the eta term in the final model
DCP1PM Page 69 10182006
Clinical Pharmacology Review NDA 19-962 Toprol-XL 10182006
Model Selection
PK Initial Model Selection
PK Base Model to Final Model The selection of the most appropriate PK base model for a metoprolol PK was based upon the following criteria a significant reduction in MOF as compared to the baseline model and asymptotic chi-square distribution based on the likelihood ratio test or AIC (plt005) as compared to the other structural models This selected PK base model was then subject to a covariate evaluation The population PK model bearing all surviving covariate parameters with statistical significance became the penultimate final model If 1 of the body size parameters (WT BSA and HT) was not in the model the penultimate final model became the final model If body size parameters were in the model they were sequentially replaced by other body size parameters in the regression submodel for each PK parameter The best body size parameter was then selected on the basis of lowest MOF to form the final model
PK Final Model Selection Simulations and visual inspections based on goodness of fit plots were used to qualify and validate the model The goodness-of-fit of the final model was evaluated graphically by comparing population and individual predictions of metoprolol concentrations with observed metoprolol concentrations along the line of unity and by visual inspection of the following plots of population-weighted residuals (WRES) for the final population model 1 Population-weighted residuals (WRES) versus population-predicted concentrations (PRED) 2 WRES versus time after first drug administration in each patient 3 WRES versus all covariates evaluated WRES were generally expected to be distributed homogenously around zero for PRED time after administration and covariates For those 27 patients with serial samples goodness-of-fit of the plasma concentration-time profile for each individual was visually inspected The linear relationship between their AUClast values from the observed data and those from the simulated data (final model) was examined
The predictive performance of the final population PK model including covariates was evaluated by comparing typical values of PK parameters with the mean of individual Bayesian estimates or individual values of PK parameters with the results from non-compartmental analysis for patients with serial samples Steady-state metoprolol plasma concentration-time profiles from 0ndash24 hours at the interval of 15 minutes (025 hour) were calculated using the post hoc Bayesian estimated PK parameter obtained for 65 patients included in the PKPD relationship using the following equation
DCP1PM Page 70 10182006
Clinical Pharmacology Review NDA 19-962 Toprol-XL 10182006
PKPD Initial and Final Model Selection A similar approach to that of PK model selection was adopted for PKPD Each of the above-mentioned PKPD models with random effects was identified by curve-fitting the dataset Initial selection of the PKPD structural model was based upon a significant reduction in MOF (plt005) as compared to the baseline model and reasonable PKPD parameter estimates Software
Nonlinear mixed-effect modeling (NONMEM) software (Version V level 11 Globomax Hanover MD) was used in the population PK analysis PK model fitting was accomplished using first-order (FO) approximation methods For PKPD model fitting the first-order conditional estimation (FOCE) with eta-epsilon interaction method in NONMEM was used for all model runs
SAS software (Version VIII Cary NC) was employed to prepare datasets according to the format required by the NONMEM program (Boeckmann et al 1991) Microsoftreg Excel 2000 (Redmond WA) and S-PLUS 2000 (Professional Release 2 MathSoft Inc Cambridge MA) were used to perform exploratory graphical exposure calculation and statistical analyses according to the format required by the NONMEM program (Boeckmann et al 1991) SAS command files logs and listings pertaining to data file conversion and merging were reviewed by an independent analyst Datasets were stored in SAS data frames combined and exported to Excel and then to ASCII files before fitting to the model
Datasets were prepared and pooled in a NONMEM-compliant format using SAS software by the Programming Group Clinical Information Sciences at AstraZeneca Wilmington Delaware SAS command files logs and listings pertaining to file conversion and merging were provided and found to be acceptable The contents of both datasets (toprolkatcsv for PK modeling and cppd2csv for PKPD modeling) were included
DCP1PM Page 71 10182006
Clinical Pharmacology Review NDA 19-962 Toprol-XL 10182006
toprolkatcsv was not provided electronically in a SAS format however this reviewer generated a similar dataset using the applicantrsquos criteria
Reviewer Comment The software and data assembly methods appeared adequate
DCP1PM Page 72 10182006
Clinical Pharmacology Review NDA 19-962 Toprol-XL 10182006
Results and Discussion Design Adequacy
Overall the trial designs appeared adequate to evaluate metoprolol population PK and PKPD in pediatric patients receiving Toprol XL However the design could have been further optimized by increasing the sampling points particularly in the absorption phase Due to the limited number of samples in the absorption phase it was not possible to accurately characterize the absorption model first order vs zero order or mixed first and zero order Additionally collection of mainly trough samples limits the ability to accurately estimate measures such as Cmax that are not directly related to Ctrough particularly if multiple compartments are present Consequently Cmax estimations are unlikely to be accurate Finally most patients provided only one trough sample thus inter-individual variability could not be adequately captured and may have limited the utility of the modeling exercise particularly in PKPD where the random effect could not be accurately characterized Ultimately there was no random variable in the final PKPD model (ie eta was set to zero) Data Integrity
This reviewer checked the data visually by randomly selecting data from patients included in the population modeling and comparing to data in the study report (source data) Overall the data integrity appeared acceptable The applicant observed the following guidelines that appeared acceptable No datum from any study participant with a protocol violation that was thought to materially impact the analysis was included The dataset contained data from only those study participants who could be evaluated ie with all the last dosing datetime blood sampling datetime plasma drug concentrations and demographic covariates
Data that were excluded (n = 62 samples) from the model were as follows One sample from an apparent poor metabolizer Two samples collected gt 96 hours post dose From 307B 10 trough samples lt LOQ From 307A 17 samples lt LOQ Thirty-samples from serial data that were lt LOQ or whole blood samples Model and Model Selection
Base Model
41110 Pharmacokinetic Model description The base PK model was a standard two compartment model that incorporated lag time and flip-flop kinetics The key features of the model were flip-flop was insured by making the value of ke gt ka in the clearance equation Additionally lag time was restricted to a value of 2 hours or less and concentrations were log transformed consequently all concentrations (F) = 0 were given individual predicted concentrations of zero Finally there were two residual error terms one for serial samples and the other for trough samples DCP1PM Page 73 10182006
Clinical Pharmacology Review NDA 19-962 Toprol-XL 10182006
Key equations were as follows
KA = THETA(1)EXP(ETA(1)) V2 = THETA(2)EXP(ETA(2)) CL = (THETA(1)THETA(2)+THETA(3))EXP(ETA(3)) Q = THETA(4)EXP(ETA(4)) V3 = THETA(5)EXP(ETA(5)) ALAG1=THETA(6)EXP(ETA(6))
41111 PK Parameter estimation results Table 1 Summary of PK parameters in the metoprolol population PK base model (per applicant)
41112 Goodness of fit The applicant provided the following goodness-of-fit plots (Figure 1)
Reviewer Note The goodness-of-fit plots were reproduced by this Reviewer (see Appendix) with minor modifications
Figure 1 Goodness of fit plots for Base Model
DCP1PM Page 74 10182006
Clinical Pharmacology Review NDA 19-962 Toprol-XL 10182006
Base PK Model Selection The MOF values of all structural model candidates tested are presented in Table 2 Model selection was based primarily on MOF values the lower MOF the better the model The applicant reports that in general MOF values generated by a conventional absorption model (ie absorption rate is faster than elimination rate) and a flip-flop absorption model (ie absorption rate is slower than elimination rate) were identical
Reviewer Comment The existence of flip-flop kinetics appears plausible based on data provided and general patterns for sustained release formulations Consequently the use of flip-flop kinetics for the bulk of the modeling exercise appears reasonable
General conclusions from the information in Table 2 are First order input is better than zero order input Two compartment model is better than one compartment model Lag time presence is better than lack of lag time Two residual error terms are better than one residual error term It should also be noted that several other models led to unsatisfactory completion of the run and were not considered further
DCP1PM Page 75 10182006
Clinical Pharmacology Review NDA 19-962 Toprol-XL 10182006
Table 2 Comparison of Structural PK Models
Reviewer Comment The selected structural model appears appropriate based on the data
Base Model The deletion of ETA for V2 did not change the MOF value suggesting that ETA for V2 should be deleted to avoid an over-parameterized warning (Table 3) This was consistent with the estimated parameter value of ETA for V2 being 648 x 10ndash9 a very small value Therefore the base model was selected by deleting the ETA for V2 from the structural model
Reviewer Comment on Eta deletion for V2 Deletion of eta for V2 is acceptable based on the empirical data however from a physiological perspective deletion of eta is problematic Generally one anticipates inter-individual differences in volume of distribution In this case it appears that the error associated with V2 may have been randomly shifted to V3 and or Q terms as the three DCP1PM Page 76 10182006
Clinical Pharmacology Review NDA 19-962 Toprol-XL 10182006
terms are interrelated This potential shift in error is supported by the fact that the V2 eta value increases significantly (by several orders of magnitude- 10-5 vs 100) when eta for Q and or V3 is fixed However when Q or V3 are fixed minimization is successful but Q and V3 are not accurately estimated Accounting for the possible error shift is a complex process and goes beyond the scope of this reviewer thus deletion of eta associated with V2 was considered acceptable for the remainder of the modeling evaluation
Table 3 Structural elements tested in the metoprolol population PK structural model (p lt 0005)
Final PK Model
41113 Model description The key feature of the final model is the inclusion of the covariate effects of age on Q and weight on CL in the population PK model
Key Equations CL = (THETA(1)THETA(2)+THETA(3)+EWT)EXP(ETA(2)) Q = THETA(4)EAGEEXP(ETA(3))
Including Covariate Effects As previously described covariate effects were assessed by forward addition and backward deletion Most covariates did not significantly change MOF however BSA significantly affected CL and Age affected Q Consequently these covariates were included in the penultimate final model
DCP1PM Page 77 10182006
Clinical Pharmacology Review NDA 19-962 Toprol-XL 10182006
Reviewer Note BSA is derived form WT and HT covariates implying BSA is highly correlated to these two covariates (Figure 2) weight is the most suitable (practical covariate) as it is readily measured Furthermore weight and BSA produced the same MOF (Table 4) whereas MOF with height was more positive (less significant)
Figure 2 Plot of BSA vs Body Weight
The data in Table 4 support selection of the final model
Table 4 Covariate elements tested in the metoprolol population PK penultimate final model (plt0005)
The applicant acknowledges that mechanism(s) accounting for the impact of age on QF are not clear However since distribution clearance has little effect on metoprolol plasma exposure further investigation is not needed
41114 PK Parameter estimation results As shown in Table 5 PK parameters were estimated fairly precisely by the final model
Table 5 PK Parameter Estimates using Final Model
DCP1PM Page 78 10182006
Clinical Pharmacology Review NDA 19-962 Toprol-XL 10182006
41115 Goodness of fit The goodness-of-fit plots provided by the applicant show good precision Figure 5 Goodness of fit plots for final PK model
DCP1PM Page 79 10182006
Clinical Pharmacology Review NDA 19-962 Toprol-XL 10182006
PK Model Qualification The post hoc Bayesian-estimated AUC (simulated) obtained for the 27 patients with serial plasma samples are plotted against the observed (AUCt) The correlation was high (R2 gt 099) Figure 6 AUClast from observed data versus AUCt from model simulation in the 27 patients providing serial plasma samples
Regression line Y= 4514 + 08976 X R2 = 09957
The graphical validation of the final metoprolol population PK model validation against covariates evaluated is presented in Figure 6
Figure 7 Graphical validation of covariates
DCP1PM Page 80 10182006
Clinical Pharmacology Review NDA 19-962 Toprol-XL 10182006
There was no systematic bias in weighted residuals for any covariates evaluated suggesting that the final model included all appreciable effects of available covariates (Figure)
The effects of weight on metoprolol CLF are illustrated in Figure 8 where Bayesian post hoc estimates of CLF are plotted against weight and overlaid by the model-predicted line Overall the model appeared to fit the data well
Figure 8 Plot of CLF vs Body weight
The effects of AGE on metoprolol QF are illustrated in Figure 9 where Bayesian post hoc estimates of QF are plotted against AGE and overlaid by the model-predicted line Figure 9 Plot of QF vs Age
DCP1PM Page 81 10182006
Clinical Pharmacology Review NDA 19-962 Toprol-XL 10182006
Reviewer Note The applicant indicated that attempts to run the final model using the first-order conditional estimation method resulted in termination errors Therefore the parameter estimates obtained by the FO method were reported as the final parameter estimates
Conclusion Regarding Population PK Modeling Overall the sponsorrsquos population PK modeling is acceptable
PKPD Model and Model Selection
PKPD Base Model PharmacokineticPharmacodynamic Model description The key feature of the model was a lack of random variance term for the slope (since only single data points were available per subject) and inclusion of baseline effect
Key equations were as follows E0 = THETA(1)EXP(ETA(1)) M = THETA(2) Y = E0 + MLOG(AUC) + EPS(1)
The control stream provided in the appendix is that for DBP (provided by sponsor) The control stream for SBP is comparable with appropriate substitution for BP type
It should be noted that only the log-linear and linear PKPD models were considered suitable for AUC and Cmax For this review only AUC estimates were considered reliable as Cmax estimates could not be accurately determined based on the sampling scheme Consequently the remainder of this review focuses on AUC information although Ctrough and Cmax data are displayed for reference
Bayesian estimates from PK modeling are summarized in Table 1
Table 1 Bayesian estimates of metoprolol PK exposure for those patients included in the PKPD analysis (N=65)
DCP1PM Page 82 10182006
Clinical Pharmacology Review NDA 19-962 Toprol-XL 10182006
PKPD Model Selection (initial and final) The log-linear model was adopted as the base model for this PKPD relationship since it improved the MOF significantly (Table 2) The ETA parameter for the slope was pre-eliminated for the purpose of model parsimony The intercept and slope in this log-linear model for AUC(0-24) did not bear ETA parameter therefore no covariates had impact on either parameter in the model
Reviewer Note The intercept should not have borne an eta term because individual subjects provided only one data point Consequently fixing eta to zero or deleting eta in the final model is appropriate No further model development was required after eta was eliminated and the base model was equivalent to the final model
Table 2 Base population PKPD models tested for the change in SBP
41116 PKPD Parameter estimation results The final PKPD parameter estimates are presented in Table 3
Table 3 Summary parameters in the final PKPD model for the change in SBP using trough plasma level Parameter Explanation Estimate SE ()b
DCP1PM Page 83 10182006
Clinical Pharmacology Review NDA 19-962 Toprol-XL 10182006
Model Qualification Based on the relatively low R2 value and as shown in Figure there is a poor correlation between change in SBP and log AUC
Figure 1 Relationship between change in SBP and AUC (line generated from modeling)
Overall goodness-of-fit of the model was considered to be poor probably due to the high variability in the measurements Consequently the precision of the model parameter estimates was not considered to be very reliable These parameters have little clinical usefulness and can be treated only as an indication of trends ie more hemodynamic effects can be potentially achieved when high Toprol-XL doses are given Clinical dose adjustment based on these PKPD parameters is not recommended
Reviewerrsquos Supplemental Analyses A supplemental PKPD analyses was conducted using simple linear regression since the population model did not improve the fit Overall eta made an insignificant contribution to the overall model The results of the analyses were similar to the population analyses A series of regression analyses were conducted and are presented in Table 4
The applicant notes that the preliminary modeling exercise found that there was no difference in the PKPD modeling results using different hemodynamic data formats (ie change in the measurements percent change in the measurements or actual BP measurements) This finding was confirmed by this reviewer (see Table 4)
DCP1PM Page 84 10182006
Clinical Pharmacology Review NDA 19-962 Toprol-XL 10182006
Table 4 Supplemental PKPD Regression Analyses Conducted by Reviewer Model (liner regression) Intercept (I) Slope (m) R2 Probability RSBP = mISBP + I 3957 -035 01626 0009 PSBP = mISBP + I 2524 -023 01252 00038 PSBP = mRSBP + I 0005 074 09891 lt 00001 RSBP = mlogAUC + I 651 -221 0060 00493 RSBP = mDose + I -751 0006 00026 06878 RSBP = mDose^ + I -312 -111 004 02711 RSBP = mlogAUC + nISBP + I 5303 -221 (m)
-035 (n) 02230 0001
RSBPplc = mAUC + I -667 -0003 00458 00871 RSBPplc = mlogAUC + I 461 -2208 00600 00493 RPUL = mlogAUC + I 1868 -405 01102 00069 Symbols in table similar to population PK model without eta term RSBP- change of SBP without placebo correction ISBP- initial (baseline) SBP RPUL- change in HR without placebo correction Dose- in mg where placebo is included as 0 mg PSBP- percentage change of SBP without placebo correction
Conclusion Regarding Population PKPD Modeling Overall the sponsorrsquos population PKPD modeling is acceptable No dose adjustment conclusion can be made from this modeling however an exposure-response relationship was established for AUC and reduction in SBP
Discussion
The significance of the results 1 Provide estimates of PK measures and plasma exposure in pediatric population These data can be compared to adult exposure to determine if exposure differences impact drug effectiveness The main challenge in comparing pediatric data to adult data is different modeling schemes formulations and methods were used in the two populations
2 PKPD findings are not sufficiently precise to provide a dose adjustment algorithm however the PKPD analyses provides rationale for proposed titration as increasing exposure (doses) may improve efficacy (reduction in SBP) Ultimately the risk-benefit analyses overrides PKPD assessment for dose adjustment drug will be titrated thus reliance on PKPD information is not critical The proposed dose 10 mgkg appears suitable based on available information It is unclear from the studies if there should be an initial maximum dose although the sponsor has proposed 50 mg as the maximum initial dose The proposed pediatric starting dose on a mgkg basis is within the range of starting adult doses (25 ndash 100 mg) assuming an adult weighs 70 kg
3 Cumulative information form dose-response study indicates that Toprol XL has effectiveness in children however the most effective dose is unclear Since the drug can be titrated determining the initial optimal dose does not appear critical As proposed by the applicant dosing is started at a ldquolowrdquo dose that can be up-titrated if needed
DCP1PM Page 85 10182006
Clinical Pharmacology Review NDA 19-962 Toprol-XL 10182006
4 The results did not adequately address the potential impact of CYP2D6 metabolic status for pediatric patients taking Toprol XL There were an insufficient number of patients to make this assessment
5 Covariate effects do not appear significant only body weight significantly affects clearance However a worst case scenario can occur with a person that has a low body weight and is a poor metabolizer this will result in very high possibly supra-therapeutic exposure Age does not impact apparent oral clearance so an age-dependent dose adjustment is not needed for children over 6 years old In essence all children over six years old can initiate therapy at 10 mgkg
The validity of the results Overall the results produced by the sponsor appear valid and the sponsor used a sound modeling approach However alternative approaches that could have been adopted may have improved the outcome of the analyses Three of these approaches are presented below 1 Additional PK samples should have been collected during the absorption phase and
throughout the dosing interval to improve the modelrsquos performance Specifically additional samples collected during the absorption phase may have unambiguously identified the actual absorption input function (eg first order zero order mixed first and zero order) First order input was selected for the analyses although the dosage form is reported to exhibit zero order kinetics in adults It is possible that the input rate in children differs from that in adults but unlikely It should be noted that absorption kinetics in children is often erratic due to multiple factors (eg regioshyselective absorption incomplete gastric emptying and inconsistent absorption) so it is unclear if additional samples would have definitively identified the absorption function However additional non-trough samples may have helped in estimating key PK measures such as V and Cmax The final model did not have an eta associated with V which is atypical Collection of additional samples on different visits may have helped estimate potential inter-occasion variability It should be noted that AUC was estimated precisely for subjects providing serial samples but these subjects were not necessarily included in the PKPD analyses Ideally the PKPD modeling should have been conducted primarily in subjects who had accurate PK measures
2 The PKPD design could have been modified to potentially improve the utility of the analyses Specifically there should have been better placebo matching procedures to minimize the potential impact of the placebo effect This matching could have been improved by ensuring all patients on placebo had the same titration schedule and number of tablets It is noted that the model had a poor predictive performance that was mainly attributed to the high degree of variability in the PD measures Potentially other PD markers could have been explored that have less inherent variability One such marker is the degree of beta blockade using exercise heart rate (EHR) reduction this marker has been used extensively for metoprolol in adult subjects However use of EHR in the pediatric setting may be challenging
DCP1PM Page 86 10182006
Clinical Pharmacology Review NDA 19-962 Toprol-XL 10182006
Comments to sponsor
In future pharmacometric studies you should consider the following 1 collect sufficient (multiple) samples from individual subjects to allow assessment
of inter-occasion variability and estimation of inter-individual variability (eta) for all relevant parameters
2 placebo groups should be identically matched across all dose groups (eg same titration schedule and number tablets) to minimize potential bias or differences in the placebo effect
Comments to medical reviewer
1 The sponsor has adequately characterized metoprolol PK in the studied pediatric population The PK characterization could have been further optimized by obtaining additional samples over the entire dosing interval (eg during the absorption phase and elimination phase) on multiple occasions rather than on one occasion primarily at trough
2 A dose-response relationship could not be established using the protocol specified analysis approach The outcome of the dose-response relationship appeared highly dependent on the ldquoplacebo effectrdquo suggesting that the placebo group may not have been appropriate One should consider re-evaluating the dose-response precisely matched placebo groups (eg all placebo patients have identical number of tablets and titration schedule)
3 Based on the PKPD analysis plasma exposure (AUC) explains lt 10 of the response (reduction in systolic blood pressure) thus has limited clinical utility However the PKPD relationship suggests that there is a trend for increased response with increased exposure (dose driven)
4 Overall information from the dose-response study suggests that Toprol- XL is effective in the pediatric population The optimal initial dose 02 10 or 20 mgkg or the maximum safe and effective dose cannot be determined from the information provided It is noted that the 02 mgkg dose is unlikely to be effective as plasma concentrations achieved at this dose are unlikely to be effective (most concentrations lt LOQ and lower than effective adult concentrations) The 10 mgkg (proposed by applicant) appears to be a reasonable initial dose The labeling should reflect the regimens studied
DCP1PM Page 89 10182006
Clinical Pharmacology Review NDA 19-962 Toprol-XL 10182006
Appendix
DCP1PM Page 90 10182006
Clinical Pharmacology Review NDA 19-962 Toprol-XL 10182006
DCP1PM Page 91 10182006
Clinical Pharmacology Review NDA 19-962 Toprol-XL 10182006
DCP1PM Page 92 10182006
Clinical Pharmacology Review NDA 19-962 Toprol-XL 10182006
DCP1PM Page 93 10182006
Clinical Pharmacology Review NDA 19-962 Toprol-XL 10182006
DCP1PM Page 94 10182006
Clinical Pharmacology Review NDA 19-962 Toprol-XL 10182006
DCP1PM Page 95 10182006
Clinical Pharmacology Review NDA 19-962 Toprol-XL 10182006
Table 15 Control streams for final log-linear PKPD model for the change in DBP using metoprolol Cmax as the measure of exposure
Truncated NONMEM reports for base model identification for PKPD relationship in change of SBP (per sponsor)
DCP1PM Page 96 10182006
Clinical Pharmacology Review NDA 19-962 Toprol-XL 10182006
Reported PD information^
^ Under metoprolol regimen CRZ0K is Toprol XL
DCP1PM Page 97 10182006
Clinical Pharmacology Review NDA 19-962 Toprol-XL 10182006
Table Results of randomised double-blind comparative trials evaluating antihypertensive efficacy of metoprolol formulations or other antihypertensives
DCP1PM Page 98 10182006
---------------------------------------------------------------------------------------------------------------------
---------------------------------------------------------------------------------------------------------------------
---------------------
This is a representation of an electronic record that was signed electronically and this page is the manifestation of the electronic signature
s
Robert Kumi 10182006 045635 PM BIOPHARMACEUTICS
Patrick Marroum 10192006 050811 PM BIOPHARMACEUTICS
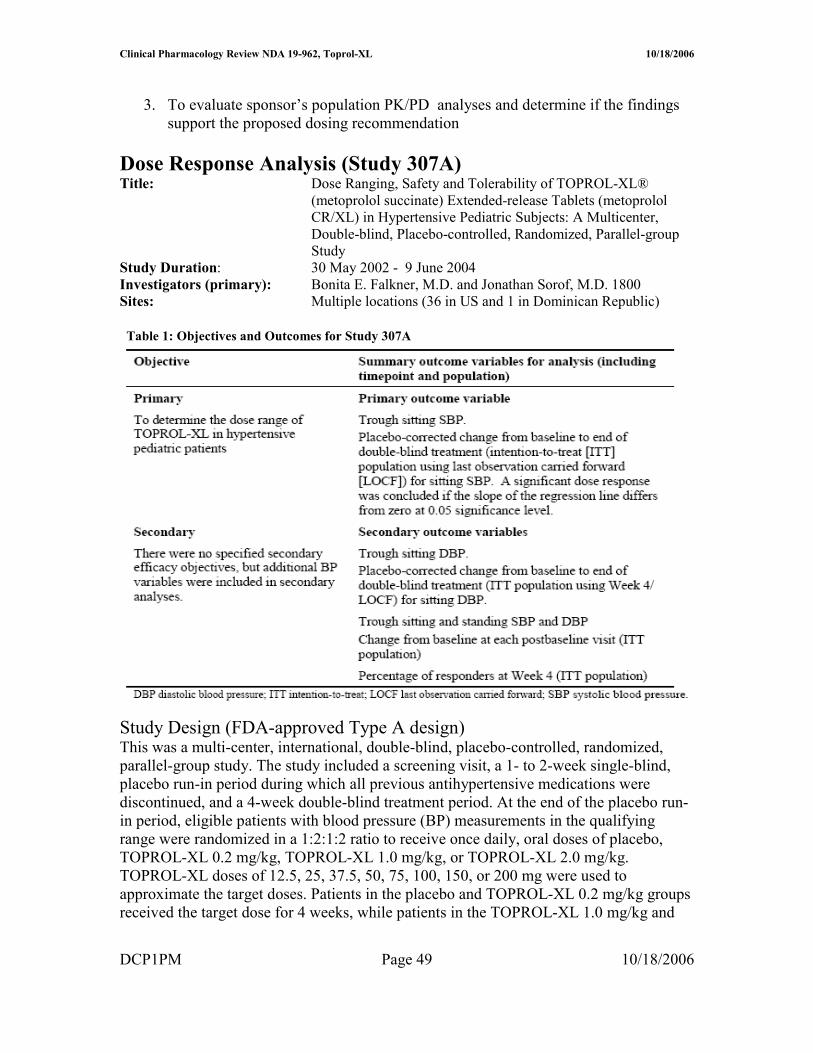
Clinical Pharmacology Review NDA 19-962 Toprol-XL 10182006
Results Patient Disposition Per applicant patients recruited into this study were representative of a pediatric population with hypertension The four treatment groups were balanced with respect to demographic and baseline characteristics (Tables 4 and 5) About 80 percent of the patients were considered 90 compliant
Table 4 Baseline Characteristics in Study 307A
Table 5 Sitting SBP and DBP measurements at baseline
Sitting and standing BP measurement were comparable (eg mean SBP for all patients- sitting = 1319 and standing 1306 with similar CVs ~ 9 )
Primary Efficacy Variable The results for the primary efficacy variable are illustrated in Figure 1 Figure Dose response for placebo-corrected change from baseline to Week4LOCF for sitting SBP (ITT population)
DCP1PM Page 52 10182006
Clinical Pharmacology Review NDA 19-962 Toprol-XL 10182006
Figure 1 Change in SBP from baseline as a function of Toprol XL dose
Table 6 Linear regressions statistics used to assess Dose-Response
The results indicate that bull The slope of the curve is not different form zero (p = 05371 for dose ratio)
suggesting that there is no dose-response relationship bull Most active treatment groups are more effective than placebo in reducing SBP
By visual inspection it appears the lack of observed dose-response is mainly driven by a lower than expected response at the 20 mgkg level
Potential issues affecting efficacy and pharmacokinetic results bull LOCF was required for eight patients however the LOCF approach did not
greatly impact the outcome of the trial bull Patients assigned to the 10 mg and 20 mgkg dose received drug for only 2
weeks whereas dose in the 02 mgkg received the same dose for 4 weeks
DCP1PM Page 53 10182006
Clinical Pharmacology Review NDA 19-962 Toprol-XL 10182006
Reviewerrsquos Supplemental Dose-Response Analyses The sponsorrsquos dose-response analysis was successfully reproduced by this Reviewer using pooled placebo corrected data A supplemental analysis was conducted using group-specific placebo corrected data In this procedure data for subjects assigned to a given Active Group (eg 02 mgkg) were corrected with Placebo data (02 mgkg) Group specific placebo data are presented in Table 7
Table 7 Placebo-group specific data Placebo Group Frequency Delta SBP 02 mgkg 8 -567 10 mgkg 6 -300 20 mgkg 9 230
It should be noted that the group-specific placebo data appeared to follow a consistent trend where the placebo effect decreased with increasing number of tablets It is unclear if this titrationtablet-dependent placebo effect is valid or random Overall the apparent differential placebo effects suggest that the placebo group may have overly influenced the outcome of the dose-response analysis
When active groups are corrected using group-matched placebo data there is a statistically significant dose-response The dose response using group-specific placebo data is illustrated in Table 8 and Figure 2
Figure 2 Placebo corrected changes in SBP (chg_pc on y axis) as a function of dose ratio
Potential Limitations of Supplemental Analyses Typically placebo effects are constant if randomization is correct thus it is unclear if subsetting the placebo group is acceptable and did not increase bias Additionally subsetting the placebo group leads to a reduced number of placebo subjects per dose group that may impact the regression analyses
DCP1PM Page 54 10182006
Clinical Pharmacology Review NDA 19-962 Toprol-XL 10182006
Table 8 SAS output for regression analyses using group-specific placebo corrections The REG Procedure
Model MODEL1
Dependent Variable chg_pc
Number of Observations Read 117
Number of Observations Used 117
Analysis of Variance
Sum of Mean
Source DF Squares Square F Value Pr gt F
Model 1 191083177 191083177 2663 lt0001
Error 115 825109481 7174865
Corrected Total 116 10162
Root MSE 847046 R-Square 01880
Dependent Mean -430358 Adj R-Sq 01810
Coeff Var -19682365
Parameter Estimates
Parameter Standard
Variable Label DF Estimate Error t Value Pr gt |t|
Intercept Intercept 1 125480 133166 094 03480
DOSRATIO Dose Ratio 1 -100051 019387 -516 lt0001
Secondary variables
bull Placebo-corrected change from baseline in sitting DBP The mean plusmn SD change (Week 4LOCF) in sitting DBP is illustrated in Figure 3 and Table 9
Figure 3 Mean changes (actual and placebo-corrected) from baseline to Week 4LOCF for sitting DBP (ITT population)
DCP1PM Page 55 10182006
Clinical Pharmacology Review NDA 19-962 Toprol-XL 10182006
Table 9 SAS output for regression analyses for DBP with pooled placebo correction
Treatment group effects and pairwise comparisons for sitting SBP and DBP Results of the treatment group effects at the Week 4LOCF visit and the pairwise comparisons between each TOPROL-XL group and placebo for the change from baseline in sitting SBP and DBP are shown for the ITT population in Table 10
Table 10 Treatment group effects for change in baseline to Week 4LOCF for sitting SBP and DBP (ITT population)
Some key findings from the pair-wise comparison are as follows (Table 10) 1 All active groups produced statistically significant reductions from baseline in sitting
SBP and DBP at the Week 4LOCF visit whereas placebo did not
DCP1PM Page 56 10182006
Clinical Pharmacology Review NDA 19-962 Toprol-XL 10182006
2 Overall the mean change from baseline in sitting SBP at Week 4LOCF for the TOPROL-XL groups pooled was statistically significantly larger than that for the placebo group (p=00351)
3 Results of pairwise comparisons between individual TOPROL-XL dose groups and placebo also revealed a statistically significant difference for the 10 and 20 mgkg groups (p=00270 and p=00492 respectively)
bull Mean changes over time in sitting SBP and DBP Consistent with findings from other studies with beta-blockers apparent maximal reduction in blood pressure occurred between 1 and 4 weeks of treatment
Figure 4 Mean changes over time for sitting SBP and DBP (ITT population)
Data points in plot are from absolute values (not taking baseline into account)
Subgroup Analyses The sponsor conducted several exploratory subgroup analyses however these analyses were not reviewed critically and are not presented in this review as
1 they do no impact the primary outcome or study objective 2 they are unlikely to be clinically useful due to the small number of patients per
subgroup One potentially useful some group analyses involved the percentage of responders as defined in Table 11
The responder analyses shows comparable response rates for all active dose groups suggesting similar efficacy across dose groups despite different exposure (doses)
DCP1PM Page 57 10182006
Clinical Pharmacology Review NDA 19-962 Toprol-XL 10182006
Table 11 Number and proportion of responders (ITT population)
Pharmacokinetic Results The Ctrough information obtained in the trial are summarized in Figure 6 and Tables 12 and 13
Table 12 Summary of Ctrough data (per applicant)
Sixteen patients across the 3 TOPROL-XL groups did not have blood samples obtained for analysis of metoprolol concentrations Based on the number of samples BLQ there appeared to be very low concentrations in the lowest dose group It appeared that Ctrough increased with dose According to the applicant these values are similar to those obtained previously in adults especially at the 2 higher doses Variability was high in all treatment groups (CV gt 60 )
Table 12 Summary of Ctrough (Reviewer Generated) from all patients (samples lt LOQ given value = 0) Toprol XL Dose Number of subjects Concentration (ngmL) (mgkg) Mean plusmn SD Median Range 02 39 137 plusmn 294 000 0 ndash 157 10 17 1224 plusmn 1416 845 0 ndash 571 20 46 2462 plusmn 3352 1140 0 ndash 1670
DCP1PM Page 58 10182006
Clinical Pharmacology Review NDA 19-962 Toprol-XL 10182006
Reviewer Note Overall the plasma concentrations (exposure) for the 02 mgkg dose group appear too low to be effective (close to LOQ) It is noted that adults typically have concentrations gt LOQ at the lowest therapeutic dose 25 mg (~ 4 ngmL)
Figure 6 Boxplot of metoprolol Ctrough using samples gt LLQ (per applicant)
Safety Results According to the applicant Toprol XL was well tolerated in the pediatric population as tabulated below
Main Analyses Conclusions bull No dose response was observed for corrected SBP using pooled placebo data
however using group-matched placebo data demonstrated a dose response bull Ctrough increased with dose bull Toprol 10 and 20 mg kg doses were more effective than placebo in reducing
SBP bull The responder rate was comparable across all active dose groups and this rate was
greater than that of placebo
DCP1PM Page 59 10182006
Clinical Pharmacology Review NDA 19-962 Toprol-XL 10182006
Methods Reviewerrsquos Methods Generally this reviewer conducted the analyses in a manner similar to that of the sponsor to confirm the sponsorrsquos findings
Sponsorrsquos Methods
Design Study1 307A
Reviewer Note This study was described in the Dose-Response Assessment (please refer to Page 7 Dose Response Analyses) Consequently only highlights relevant to the population analyses will be included in this section
Study 307A was a 4-week multi-center double-blind placebo-controlled randomized parallel-group study TOPROL-XL (metoprolol succinate) extended-release tablets were given to hypertensive pediatric patients Patients were randomized to double-treatment with a once daily oral dose of placebo or Toprol-XL at 1 of 3 target doses 02 or 20 mgkg The dose range for this study was 125 to 200 mg daily Patients on placebo followed the same schedule as that for their active group comparators
Study Flow Chart
Key Inclusion Criteria School age and adolescent children with reproducible SBP or DBP at or above the 95th percentile using height-adjusted charts for age and weight were eligible
DCP1PM Page 60 10182006
Clinical Pharmacology Review NDA 19-962 Toprol-XL 10182006
Study2 307B
Study 307B was a 52-week multi-center open-label study to determine the safety and pharmacokinetics of TOPROL-XL (metoprolol succinate) extended-release tablets (metoprolol CRXL) in hypertensive pediatric patients The starting dose was 25 mg daily The dose was increased every 2 weeks in increments of 25 mg or 50 mg based on tolerability until BP was controlled or the dose reached 200 mg
Table 1 Study Assessments
At the end of the 52-treatment period all patients had BP measured and a trough plasma level taken 24 hours the last dose of Toprol-XL with the exception of those patients who completed the serial portion at the final visit Among the participants a subgroup of approximately 30 patients was to participate in PK assessments of metoprolol requiring serial blood sampling at any time during the 52 weeks A single dose of 25 mg of Toprol-XL was given orally to those participating patients after a 48-hour washout period After the PK assessments they returned to the main study protocol Data
Study1 307A
4111 Pharmacokinetics A blood sample was to be collected at Visit 7 into a heparinized Vacutainer tube and obtained at 24 hours (plusmn2 hour) following the last dose of study medication (ie trough measurement) for determination of plasma metoprolol concentrations
Study Disposition Chart
DCP1PM Page 61 10182006
Clinical Pharmacology Review NDA 19-962 Toprol-XL 10182006
Table 2 Study Demographics
4112 Pharmacodynamics Primary variable
Sitting SBP determined at trough (24plusmn4 hours Visit 7) served as the primary efficacy assessment The primary measure of effect was the placebo-corrected change from baseline to the end of treatment (Week 4) in trough sitting SBP Each BP determination represented the mean of 3 readings with less than 7 mmHg between the highest and lowest value Blood pressure was measured using a mercury sphygmomanometer with an appropriate size cuff positioned approximately at the level of the heart Every effort was made to have the same individual measure the patientrsquos BP throughout the study if possible At all post randomization visits BP measurements were to be made at trough defined as 24 hours (plusmn4 hours) after receiving study medication All measurements were to be determined prior to the patient taking the scheduled dose of study medication In the
DCP1PM Page 62 10182006
Clinical Pharmacology Review NDA 19-962 Toprol-XL 10182006
event that the patient accidentally took study medication on the day of the scheduled visit the visit was to be rescheduled within 24 to 48 hours
Study2 307B
4113 Pharmacokinetics A 48-hour washout period prior to sampling was required for all patients including patients who entered the 52-week study and then decided to participate in the serial PK portion of the study All patients were to have a 15-mL blood sample collected into a heparinized Vacutainer tube 24 hours (plusmn2 hour) following the last dose of TOPROL-XL (ie trough measurement) at Visit 18 (or a the time of premature discontinuation) except for patients who participated in the serial PK portion of the study and had blood sampling performed at Visit 18 For patients participating in the serial PK portion of the study blood samples (15 mL) were to be collected into heparinized Vacutainer tubes and obtained at Hour 0 (predose) and at 1 2 3 4 6 8 10 and 24 hours after administration of a single 25 mg dose of TOPROL-XL following a 48-hour washout period After the last blood sample was obtained the patient was to startresume the prescribed dose of TOPROL-XL heshe was receiving prior to PK sampling
Patient Disposition Chart (completion or discontinuation)
Overall a total of 31 patients at 8 centers were enrolled in the serial PK portion of the study Of these 31 patients 27 had plasma concentration data available and were included in the analyses Four patients were excluded from the analyses because their plasma concentrations were not quantifiable (Nos 047-009 and 047-021) or because only whole blood samples were analyzed (Nos 005-002 005-003)
DCP1PM Page 63 10182006
Clinical Pharmacology Review NDA 19-962 Toprol-XL 10182006
Table 3 Subject Demographics for Patients Providing Serial Blood Samples
Missing Data Twenty-six patients did not have blood samples obtained for analysis of metoprolol concentrations in either the 16-week (n=7) or 52-week (n=19) studies Among patients with plasma samples 14 (14) in the 52-week study and 13 (13) in the 16-week study had trough plasma metoprolol concentrations that were below the LLQ Therefore data from a total of 99 patients were included in this analysis
Assay Metoprolol plasma levels were assayed using high-performance liquid chromatography tandem mass spectrometric detection methods having limit of quantitation (LOQ) of 1 ngmL The method was validated in the linear range 1 to 1000 ngmL Precision was less than or equal to 109 Accuracy ranged from 940 to 1013 Pharmacodynamics Not applicable
Data Checking SAS was used to format and check data Additionally visual inspection of several randomly selected subject data was carried out
DCP1PM Page 64 10182006
Clinical Pharmacology Review NDA 19-962 Toprol-XL 10182006
Models
Overview The sponsorrsquos stated assumptions underlying this modeling analysis are
1 Rich sampling data collected from 30 subjects in 307B Study can be used to adequately characterize the structural pharmacokinetic model of metoprolol
2 Structural pharmacokinetic models of metoprolol at other dose strength are identical to that at 25 mg
3 Metoprolol exhibits a linear pharmacokinetics in the dose ranges studied 4 Steady-state pharmacokinetics of metoprolol has been reached at the time of blood
sampling in Study 307A 5 Metoprolol accounts for the blood pressure effect in the study 6 Existing various disease states in the patients have no impact on the pharmacokinetics
of metoprolol and pharmacodynamics of the blood pressure reduction in the study 7 Concomitant medications if existed do not have any effects on the pharmacokinetics
of metoprolol and pharmacodynamics of the blood pressure reduction in the study
Reviewer Comment The sponsorrsquos assumptions appear reasonable based on existing metoprolol PKPD information
Pharmacokinetics
4114 PK Structural Model Several PK models were tested to identify the structural model Flip-flop absorption was taken into consideration based on general PK characteristics following administration of sustained release tablets and observed data in the current study (serial PK samples)
The models tested included linear 1- and 2-compartment PK models with the following characteristics (focused on flip-flop models)
bull first-order absorption with and without absorption lag time (NONMEM subroutines ADVAN2 and ADVAN4)
bull zero-order absorption with and without absorption lag time (NONMEM subroutines ADVAN1 and ADVAN3)
bull simultaneous zero- and first-order absorption from the absorption compartment The models were parameterized in terms of CLF and VF
Ultimately the 2-compartment model with first order flip-flop absorption an absorption lag time and 2 residual error terms was selected as the structural model of metoprolol The model scheme is presented in the following Figure 1 Figure 1 PK Compartmental Model
DCP1PM Page 65 10182006
Clinical Pharmacology Review NDA 19-962 Toprol-XL 10182006
4115 PK Covariate Model Covariate models were developed to account for the potential impact of the following covariates and derived covariates on metoprolol PK
Continuous variables bull Age (AGE years) bull Body weight (WT kg) bull Body surface area (BSA m2) calculated from WT and HT (cm) using the height
weight formula BSA=0024265 x WT 05378 x HT03964 bull Ideal body weight (IBW kg) calculated as - Males IBW=50+(HTndash150)25 and
for Females IBW=45+(HTndash150)25 bull Dose (DOSE mg of Toprol-XL)
Categorical variables bull Gender (SEX) - Male 0 - Female 1 bull Race (RACE) - Caucasian 0 - Black 1 - Asian 2 - Other 3
PK covariate effects were modeled as follows
Effects of continuous covariates (AGE WT BSA IBW and DOSE) were normalized to the corresponding median value across a dataset such that continuous covariates were related to structural PK parameters in a power function as described below
where Θ is the fixed-effect parameter of a covariate estimated by the NONMEM program covariate value is the observed covariate value and PK typical value is the typical value of the PK parameter estimated by NONMEM Effects of categorical covariates (SEX and RACE) are related to structural PK parameters by fractional changes of dummy variables
DCP1PM Page 66 10182006
Clinical Pharmacology Review NDA 19-962 Toprol-XL 10182006
Where Θ is the fixed-effect parameter of a covariate estimated by the NONMEM program covariate is the dummy variable value and modified in the control streams and PK typical value is the typical value of this PK parameter as estimated by NONMEM
Median values of all covariates in the dataset for population PK analysis are presented in Table A
Table A Summary of patient covariates and Toprol-XL doses in the data for population PK analysis
Two Steps were included in the modeling of covariates
Step 1 Forward Addition The covariates were subjected to a stepwise forward selection algorithm using a likelihood ratio test based on a change in MOF values from the base model A significant covariate reduced the MOF more than 660 (chi-square distribution plt001 degrees of freedom [df]=1)
Step 2 Backward deletion (Excluding procedures for covariate effect) The covariates in the full model acquired in Step 1 were subjected to a backward deletion algorithm 1 covariate was deleted at a time using a likelihood ratio test based on a change in MOF values A covariate was determined to be statistically significant if the change in MOF after its deletion from the breakdown model was increased by more than 1083 (chi-square distribution plt0001 df=1)
4116 PK Random Variance Models An exponential error model was used to characterize inter-patient variability based upon the assumption that random effects for PK parameters were not correlated among PK parameters No other error models for eta were evaluated by the applicant or by this Reviewer The retention of ETA values for each PK parameter in the structural model was confirmed by sequentially fixing each ETA value at zero and comparing each resultant MOF with the MOF obtained when all ETA values were retained in the model (see Table 6)
DCP1PM Page 67 10182006
Clinical Pharmacology Review NDA 19-962 Toprol-XL 10182006
The residual model was modeled by an additive model two error terms were used one for error associated with trough samples and the other with serial samples
Reviewer Note Use of an exponential model appears reasonable
Pharmacodynamics
4117 PKPD Structural Model The equations for the structural models are shown below
1 Metoprolol Ctrough The relationships between the observed metoprolol concentrations (Ctrough) and hemodynamic changes were investigated using 4 direct-link models namely a linear model a log-linear model and Hillrsquos sigmoid Emax PKPD model with and without a baseline
2 The relationships between Cmax or AUC0ndash24 and hemodynamic changes were investigated using 2 direct-link models a linear model and a log-linear model
4118 PKPD Covariate Model The inclusion and exclusion procedures of covariate effect on the selected PKPD base model to obtain a selected final PKPD model were identical to those in the covariate evaluation in the population PK models as described previously in PK Covariate Model DCP1PM Page 68 10182006
Clinical Pharmacology Review NDA 19-962 Toprol-XL 10182006
Table B Baseline demographic and covariate characteristics
4119 PKPD Random Variance Models An exponential error model was used by the applicant to model inter-individual variability The retention of a random effect parameter ETA in each selected PKPD structural model was then evaluated by sequentially fixing each ETA value at zero and comparing each resultant MOF with the MOF obtained when all ETA values were retained in the model (plt005) This step reduced over-parameterization by deleting unnecessary random-effect parameters from the structural model to obtain the base model
Reviewer Note The study design precludes assessment of inter-individual variability or random error because only one dose record was available per patient Consequently the model should not have included eta terms It is noted that the sponsor ultimately dropped the eta term in the final model
DCP1PM Page 69 10182006
Clinical Pharmacology Review NDA 19-962 Toprol-XL 10182006
Model Selection
PK Initial Model Selection
PK Base Model to Final Model The selection of the most appropriate PK base model for a metoprolol PK was based upon the following criteria a significant reduction in MOF as compared to the baseline model and asymptotic chi-square distribution based on the likelihood ratio test or AIC (plt005) as compared to the other structural models This selected PK base model was then subject to a covariate evaluation The population PK model bearing all surviving covariate parameters with statistical significance became the penultimate final model If 1 of the body size parameters (WT BSA and HT) was not in the model the penultimate final model became the final model If body size parameters were in the model they were sequentially replaced by other body size parameters in the regression submodel for each PK parameter The best body size parameter was then selected on the basis of lowest MOF to form the final model
PK Final Model Selection Simulations and visual inspections based on goodness of fit plots were used to qualify and validate the model The goodness-of-fit of the final model was evaluated graphically by comparing population and individual predictions of metoprolol concentrations with observed metoprolol concentrations along the line of unity and by visual inspection of the following plots of population-weighted residuals (WRES) for the final population model 1 Population-weighted residuals (WRES) versus population-predicted concentrations (PRED) 2 WRES versus time after first drug administration in each patient 3 WRES versus all covariates evaluated WRES were generally expected to be distributed homogenously around zero for PRED time after administration and covariates For those 27 patients with serial samples goodness-of-fit of the plasma concentration-time profile for each individual was visually inspected The linear relationship between their AUClast values from the observed data and those from the simulated data (final model) was examined
The predictive performance of the final population PK model including covariates was evaluated by comparing typical values of PK parameters with the mean of individual Bayesian estimates or individual values of PK parameters with the results from non-compartmental analysis for patients with serial samples Steady-state metoprolol plasma concentration-time profiles from 0ndash24 hours at the interval of 15 minutes (025 hour) were calculated using the post hoc Bayesian estimated PK parameter obtained for 65 patients included in the PKPD relationship using the following equation
DCP1PM Page 70 10182006
Clinical Pharmacology Review NDA 19-962 Toprol-XL 10182006
PKPD Initial and Final Model Selection A similar approach to that of PK model selection was adopted for PKPD Each of the above-mentioned PKPD models with random effects was identified by curve-fitting the dataset Initial selection of the PKPD structural model was based upon a significant reduction in MOF (plt005) as compared to the baseline model and reasonable PKPD parameter estimates Software
Nonlinear mixed-effect modeling (NONMEM) software (Version V level 11 Globomax Hanover MD) was used in the population PK analysis PK model fitting was accomplished using first-order (FO) approximation methods For PKPD model fitting the first-order conditional estimation (FOCE) with eta-epsilon interaction method in NONMEM was used for all model runs
SAS software (Version VIII Cary NC) was employed to prepare datasets according to the format required by the NONMEM program (Boeckmann et al 1991) Microsoftreg Excel 2000 (Redmond WA) and S-PLUS 2000 (Professional Release 2 MathSoft Inc Cambridge MA) were used to perform exploratory graphical exposure calculation and statistical analyses according to the format required by the NONMEM program (Boeckmann et al 1991) SAS command files logs and listings pertaining to data file conversion and merging were reviewed by an independent analyst Datasets were stored in SAS data frames combined and exported to Excel and then to ASCII files before fitting to the model
Datasets were prepared and pooled in a NONMEM-compliant format using SAS software by the Programming Group Clinical Information Sciences at AstraZeneca Wilmington Delaware SAS command files logs and listings pertaining to file conversion and merging were provided and found to be acceptable The contents of both datasets (toprolkatcsv for PK modeling and cppd2csv for PKPD modeling) were included
DCP1PM Page 71 10182006
Clinical Pharmacology Review NDA 19-962 Toprol-XL 10182006
toprolkatcsv was not provided electronically in a SAS format however this reviewer generated a similar dataset using the applicantrsquos criteria
Reviewer Comment The software and data assembly methods appeared adequate
DCP1PM Page 72 10182006
Clinical Pharmacology Review NDA 19-962 Toprol-XL 10182006
Results and Discussion Design Adequacy
Overall the trial designs appeared adequate to evaluate metoprolol population PK and PKPD in pediatric patients receiving Toprol XL However the design could have been further optimized by increasing the sampling points particularly in the absorption phase Due to the limited number of samples in the absorption phase it was not possible to accurately characterize the absorption model first order vs zero order or mixed first and zero order Additionally collection of mainly trough samples limits the ability to accurately estimate measures such as Cmax that are not directly related to Ctrough particularly if multiple compartments are present Consequently Cmax estimations are unlikely to be accurate Finally most patients provided only one trough sample thus inter-individual variability could not be adequately captured and may have limited the utility of the modeling exercise particularly in PKPD where the random effect could not be accurately characterized Ultimately there was no random variable in the final PKPD model (ie eta was set to zero) Data Integrity
This reviewer checked the data visually by randomly selecting data from patients included in the population modeling and comparing to data in the study report (source data) Overall the data integrity appeared acceptable The applicant observed the following guidelines that appeared acceptable No datum from any study participant with a protocol violation that was thought to materially impact the analysis was included The dataset contained data from only those study participants who could be evaluated ie with all the last dosing datetime blood sampling datetime plasma drug concentrations and demographic covariates
Data that were excluded (n = 62 samples) from the model were as follows One sample from an apparent poor metabolizer Two samples collected gt 96 hours post dose From 307B 10 trough samples lt LOQ From 307A 17 samples lt LOQ Thirty-samples from serial data that were lt LOQ or whole blood samples Model and Model Selection
Base Model
41110 Pharmacokinetic Model description The base PK model was a standard two compartment model that incorporated lag time and flip-flop kinetics The key features of the model were flip-flop was insured by making the value of ke gt ka in the clearance equation Additionally lag time was restricted to a value of 2 hours or less and concentrations were log transformed consequently all concentrations (F) = 0 were given individual predicted concentrations of zero Finally there were two residual error terms one for serial samples and the other for trough samples DCP1PM Page 73 10182006
Clinical Pharmacology Review NDA 19-962 Toprol-XL 10182006
Key equations were as follows
KA = THETA(1)EXP(ETA(1)) V2 = THETA(2)EXP(ETA(2)) CL = (THETA(1)THETA(2)+THETA(3))EXP(ETA(3)) Q = THETA(4)EXP(ETA(4)) V3 = THETA(5)EXP(ETA(5)) ALAG1=THETA(6)EXP(ETA(6))
41111 PK Parameter estimation results Table 1 Summary of PK parameters in the metoprolol population PK base model (per applicant)
41112 Goodness of fit The applicant provided the following goodness-of-fit plots (Figure 1)
Reviewer Note The goodness-of-fit plots were reproduced by this Reviewer (see Appendix) with minor modifications
Figure 1 Goodness of fit plots for Base Model
DCP1PM Page 74 10182006
Clinical Pharmacology Review NDA 19-962 Toprol-XL 10182006
Base PK Model Selection The MOF values of all structural model candidates tested are presented in Table 2 Model selection was based primarily on MOF values the lower MOF the better the model The applicant reports that in general MOF values generated by a conventional absorption model (ie absorption rate is faster than elimination rate) and a flip-flop absorption model (ie absorption rate is slower than elimination rate) were identical
Reviewer Comment The existence of flip-flop kinetics appears plausible based on data provided and general patterns for sustained release formulations Consequently the use of flip-flop kinetics for the bulk of the modeling exercise appears reasonable
General conclusions from the information in Table 2 are First order input is better than zero order input Two compartment model is better than one compartment model Lag time presence is better than lack of lag time Two residual error terms are better than one residual error term It should also be noted that several other models led to unsatisfactory completion of the run and were not considered further
DCP1PM Page 75 10182006
Clinical Pharmacology Review NDA 19-962 Toprol-XL 10182006
Table 2 Comparison of Structural PK Models
Reviewer Comment The selected structural model appears appropriate based on the data
Base Model The deletion of ETA for V2 did not change the MOF value suggesting that ETA for V2 should be deleted to avoid an over-parameterized warning (Table 3) This was consistent with the estimated parameter value of ETA for V2 being 648 x 10ndash9 a very small value Therefore the base model was selected by deleting the ETA for V2 from the structural model
Reviewer Comment on Eta deletion for V2 Deletion of eta for V2 is acceptable based on the empirical data however from a physiological perspective deletion of eta is problematic Generally one anticipates inter-individual differences in volume of distribution In this case it appears that the error associated with V2 may have been randomly shifted to V3 and or Q terms as the three DCP1PM Page 76 10182006
Clinical Pharmacology Review NDA 19-962 Toprol-XL 10182006
terms are interrelated This potential shift in error is supported by the fact that the V2 eta value increases significantly (by several orders of magnitude- 10-5 vs 100) when eta for Q and or V3 is fixed However when Q or V3 are fixed minimization is successful but Q and V3 are not accurately estimated Accounting for the possible error shift is a complex process and goes beyond the scope of this reviewer thus deletion of eta associated with V2 was considered acceptable for the remainder of the modeling evaluation
Table 3 Structural elements tested in the metoprolol population PK structural model (p lt 0005)
Final PK Model
41113 Model description The key feature of the final model is the inclusion of the covariate effects of age on Q and weight on CL in the population PK model
Key Equations CL = (THETA(1)THETA(2)+THETA(3)+EWT)EXP(ETA(2)) Q = THETA(4)EAGEEXP(ETA(3))
Including Covariate Effects As previously described covariate effects were assessed by forward addition and backward deletion Most covariates did not significantly change MOF however BSA significantly affected CL and Age affected Q Consequently these covariates were included in the penultimate final model
DCP1PM Page 77 10182006
Clinical Pharmacology Review NDA 19-962 Toprol-XL 10182006
Reviewer Note BSA is derived form WT and HT covariates implying BSA is highly correlated to these two covariates (Figure 2) weight is the most suitable (practical covariate) as it is readily measured Furthermore weight and BSA produced the same MOF (Table 4) whereas MOF with height was more positive (less significant)
Figure 2 Plot of BSA vs Body Weight
The data in Table 4 support selection of the final model
Table 4 Covariate elements tested in the metoprolol population PK penultimate final model (plt0005)
The applicant acknowledges that mechanism(s) accounting for the impact of age on QF are not clear However since distribution clearance has little effect on metoprolol plasma exposure further investigation is not needed
41114 PK Parameter estimation results As shown in Table 5 PK parameters were estimated fairly precisely by the final model
Table 5 PK Parameter Estimates using Final Model
DCP1PM Page 78 10182006
Clinical Pharmacology Review NDA 19-962 Toprol-XL 10182006
41115 Goodness of fit The goodness-of-fit plots provided by the applicant show good precision Figure 5 Goodness of fit plots for final PK model
DCP1PM Page 79 10182006
Clinical Pharmacology Review NDA 19-962 Toprol-XL 10182006
PK Model Qualification The post hoc Bayesian-estimated AUC (simulated) obtained for the 27 patients with serial plasma samples are plotted against the observed (AUCt) The correlation was high (R2 gt 099) Figure 6 AUClast from observed data versus AUCt from model simulation in the 27 patients providing serial plasma samples
Regression line Y= 4514 + 08976 X R2 = 09957
The graphical validation of the final metoprolol population PK model validation against covariates evaluated is presented in Figure 6
Figure 7 Graphical validation of covariates
DCP1PM Page 80 10182006
Clinical Pharmacology Review NDA 19-962 Toprol-XL 10182006
There was no systematic bias in weighted residuals for any covariates evaluated suggesting that the final model included all appreciable effects of available covariates (Figure)
The effects of weight on metoprolol CLF are illustrated in Figure 8 where Bayesian post hoc estimates of CLF are plotted against weight and overlaid by the model-predicted line Overall the model appeared to fit the data well
Figure 8 Plot of CLF vs Body weight
The effects of AGE on metoprolol QF are illustrated in Figure 9 where Bayesian post hoc estimates of QF are plotted against AGE and overlaid by the model-predicted line Figure 9 Plot of QF vs Age
DCP1PM Page 81 10182006
Clinical Pharmacology Review NDA 19-962 Toprol-XL 10182006
Reviewer Note The applicant indicated that attempts to run the final model using the first-order conditional estimation method resulted in termination errors Therefore the parameter estimates obtained by the FO method were reported as the final parameter estimates
Conclusion Regarding Population PK Modeling Overall the sponsorrsquos population PK modeling is acceptable
PKPD Model and Model Selection
PKPD Base Model PharmacokineticPharmacodynamic Model description The key feature of the model was a lack of random variance term for the slope (since only single data points were available per subject) and inclusion of baseline effect
Key equations were as follows E0 = THETA(1)EXP(ETA(1)) M = THETA(2) Y = E0 + MLOG(AUC) + EPS(1)
The control stream provided in the appendix is that for DBP (provided by sponsor) The control stream for SBP is comparable with appropriate substitution for BP type
It should be noted that only the log-linear and linear PKPD models were considered suitable for AUC and Cmax For this review only AUC estimates were considered reliable as Cmax estimates could not be accurately determined based on the sampling scheme Consequently the remainder of this review focuses on AUC information although Ctrough and Cmax data are displayed for reference
Bayesian estimates from PK modeling are summarized in Table 1
Table 1 Bayesian estimates of metoprolol PK exposure for those patients included in the PKPD analysis (N=65)
DCP1PM Page 82 10182006
Clinical Pharmacology Review NDA 19-962 Toprol-XL 10182006
PKPD Model Selection (initial and final) The log-linear model was adopted as the base model for this PKPD relationship since it improved the MOF significantly (Table 2) The ETA parameter for the slope was pre-eliminated for the purpose of model parsimony The intercept and slope in this log-linear model for AUC(0-24) did not bear ETA parameter therefore no covariates had impact on either parameter in the model
Reviewer Note The intercept should not have borne an eta term because individual subjects provided only one data point Consequently fixing eta to zero or deleting eta in the final model is appropriate No further model development was required after eta was eliminated and the base model was equivalent to the final model
Table 2 Base population PKPD models tested for the change in SBP
41116 PKPD Parameter estimation results The final PKPD parameter estimates are presented in Table 3
Table 3 Summary parameters in the final PKPD model for the change in SBP using trough plasma level Parameter Explanation Estimate SE ()b
DCP1PM Page 83 10182006
Clinical Pharmacology Review NDA 19-962 Toprol-XL 10182006
Model Qualification Based on the relatively low R2 value and as shown in Figure there is a poor correlation between change in SBP and log AUC
Figure 1 Relationship between change in SBP and AUC (line generated from modeling)
Overall goodness-of-fit of the model was considered to be poor probably due to the high variability in the measurements Consequently the precision of the model parameter estimates was not considered to be very reliable These parameters have little clinical usefulness and can be treated only as an indication of trends ie more hemodynamic effects can be potentially achieved when high Toprol-XL doses are given Clinical dose adjustment based on these PKPD parameters is not recommended
Reviewerrsquos Supplemental Analyses A supplemental PKPD analyses was conducted using simple linear regression since the population model did not improve the fit Overall eta made an insignificant contribution to the overall model The results of the analyses were similar to the population analyses A series of regression analyses were conducted and are presented in Table 4
The applicant notes that the preliminary modeling exercise found that there was no difference in the PKPD modeling results using different hemodynamic data formats (ie change in the measurements percent change in the measurements or actual BP measurements) This finding was confirmed by this reviewer (see Table 4)
DCP1PM Page 84 10182006
Clinical Pharmacology Review NDA 19-962 Toprol-XL 10182006
Table 4 Supplemental PKPD Regression Analyses Conducted by Reviewer Model (liner regression) Intercept (I) Slope (m) R2 Probability RSBP = mISBP + I 3957 -035 01626 0009 PSBP = mISBP + I 2524 -023 01252 00038 PSBP = mRSBP + I 0005 074 09891 lt 00001 RSBP = mlogAUC + I 651 -221 0060 00493 RSBP = mDose + I -751 0006 00026 06878 RSBP = mDose^ + I -312 -111 004 02711 RSBP = mlogAUC + nISBP + I 5303 -221 (m)
-035 (n) 02230 0001
RSBPplc = mAUC + I -667 -0003 00458 00871 RSBPplc = mlogAUC + I 461 -2208 00600 00493 RPUL = mlogAUC + I 1868 -405 01102 00069 Symbols in table similar to population PK model without eta term RSBP- change of SBP without placebo correction ISBP- initial (baseline) SBP RPUL- change in HR without placebo correction Dose- in mg where placebo is included as 0 mg PSBP- percentage change of SBP without placebo correction
Conclusion Regarding Population PKPD Modeling Overall the sponsorrsquos population PKPD modeling is acceptable No dose adjustment conclusion can be made from this modeling however an exposure-response relationship was established for AUC and reduction in SBP
Discussion
The significance of the results 1 Provide estimates of PK measures and plasma exposure in pediatric population These data can be compared to adult exposure to determine if exposure differences impact drug effectiveness The main challenge in comparing pediatric data to adult data is different modeling schemes formulations and methods were used in the two populations
2 PKPD findings are not sufficiently precise to provide a dose adjustment algorithm however the PKPD analyses provides rationale for proposed titration as increasing exposure (doses) may improve efficacy (reduction in SBP) Ultimately the risk-benefit analyses overrides PKPD assessment for dose adjustment drug will be titrated thus reliance on PKPD information is not critical The proposed dose 10 mgkg appears suitable based on available information It is unclear from the studies if there should be an initial maximum dose although the sponsor has proposed 50 mg as the maximum initial dose The proposed pediatric starting dose on a mgkg basis is within the range of starting adult doses (25 ndash 100 mg) assuming an adult weighs 70 kg
3 Cumulative information form dose-response study indicates that Toprol XL has effectiveness in children however the most effective dose is unclear Since the drug can be titrated determining the initial optimal dose does not appear critical As proposed by the applicant dosing is started at a ldquolowrdquo dose that can be up-titrated if needed
DCP1PM Page 85 10182006
Clinical Pharmacology Review NDA 19-962 Toprol-XL 10182006
4 The results did not adequately address the potential impact of CYP2D6 metabolic status for pediatric patients taking Toprol XL There were an insufficient number of patients to make this assessment
5 Covariate effects do not appear significant only body weight significantly affects clearance However a worst case scenario can occur with a person that has a low body weight and is a poor metabolizer this will result in very high possibly supra-therapeutic exposure Age does not impact apparent oral clearance so an age-dependent dose adjustment is not needed for children over 6 years old In essence all children over six years old can initiate therapy at 10 mgkg
The validity of the results Overall the results produced by the sponsor appear valid and the sponsor used a sound modeling approach However alternative approaches that could have been adopted may have improved the outcome of the analyses Three of these approaches are presented below 1 Additional PK samples should have been collected during the absorption phase and
throughout the dosing interval to improve the modelrsquos performance Specifically additional samples collected during the absorption phase may have unambiguously identified the actual absorption input function (eg first order zero order mixed first and zero order) First order input was selected for the analyses although the dosage form is reported to exhibit zero order kinetics in adults It is possible that the input rate in children differs from that in adults but unlikely It should be noted that absorption kinetics in children is often erratic due to multiple factors (eg regioshyselective absorption incomplete gastric emptying and inconsistent absorption) so it is unclear if additional samples would have definitively identified the absorption function However additional non-trough samples may have helped in estimating key PK measures such as V and Cmax The final model did not have an eta associated with V which is atypical Collection of additional samples on different visits may have helped estimate potential inter-occasion variability It should be noted that AUC was estimated precisely for subjects providing serial samples but these subjects were not necessarily included in the PKPD analyses Ideally the PKPD modeling should have been conducted primarily in subjects who had accurate PK measures
2 The PKPD design could have been modified to potentially improve the utility of the analyses Specifically there should have been better placebo matching procedures to minimize the potential impact of the placebo effect This matching could have been improved by ensuring all patients on placebo had the same titration schedule and number of tablets It is noted that the model had a poor predictive performance that was mainly attributed to the high degree of variability in the PD measures Potentially other PD markers could have been explored that have less inherent variability One such marker is the degree of beta blockade using exercise heart rate (EHR) reduction this marker has been used extensively for metoprolol in adult subjects However use of EHR in the pediatric setting may be challenging
DCP1PM Page 86 10182006
Clinical Pharmacology Review NDA 19-962 Toprol-XL 10182006
Comments to sponsor
In future pharmacometric studies you should consider the following 1 collect sufficient (multiple) samples from individual subjects to allow assessment
of inter-occasion variability and estimation of inter-individual variability (eta) for all relevant parameters
2 placebo groups should be identically matched across all dose groups (eg same titration schedule and number tablets) to minimize potential bias or differences in the placebo effect
Comments to medical reviewer
1 The sponsor has adequately characterized metoprolol PK in the studied pediatric population The PK characterization could have been further optimized by obtaining additional samples over the entire dosing interval (eg during the absorption phase and elimination phase) on multiple occasions rather than on one occasion primarily at trough
2 A dose-response relationship could not be established using the protocol specified analysis approach The outcome of the dose-response relationship appeared highly dependent on the ldquoplacebo effectrdquo suggesting that the placebo group may not have been appropriate One should consider re-evaluating the dose-response precisely matched placebo groups (eg all placebo patients have identical number of tablets and titration schedule)
3 Based on the PKPD analysis plasma exposure (AUC) explains lt 10 of the response (reduction in systolic blood pressure) thus has limited clinical utility However the PKPD relationship suggests that there is a trend for increased response with increased exposure (dose driven)
4 Overall information from the dose-response study suggests that Toprol- XL is effective in the pediatric population The optimal initial dose 02 10 or 20 mgkg or the maximum safe and effective dose cannot be determined from the information provided It is noted that the 02 mgkg dose is unlikely to be effective as plasma concentrations achieved at this dose are unlikely to be effective (most concentrations lt LOQ and lower than effective adult concentrations) The 10 mgkg (proposed by applicant) appears to be a reasonable initial dose The labeling should reflect the regimens studied
DCP1PM Page 89 10182006
Clinical Pharmacology Review NDA 19-962 Toprol-XL 10182006
Appendix
DCP1PM Page 90 10182006
Clinical Pharmacology Review NDA 19-962 Toprol-XL 10182006
DCP1PM Page 91 10182006
Clinical Pharmacology Review NDA 19-962 Toprol-XL 10182006
DCP1PM Page 92 10182006
Clinical Pharmacology Review NDA 19-962 Toprol-XL 10182006
DCP1PM Page 93 10182006
Clinical Pharmacology Review NDA 19-962 Toprol-XL 10182006
DCP1PM Page 94 10182006
Clinical Pharmacology Review NDA 19-962 Toprol-XL 10182006
DCP1PM Page 95 10182006
Clinical Pharmacology Review NDA 19-962 Toprol-XL 10182006
Table 15 Control streams for final log-linear PKPD model for the change in DBP using metoprolol Cmax as the measure of exposure
Truncated NONMEM reports for base model identification for PKPD relationship in change of SBP (per sponsor)
DCP1PM Page 96 10182006
Clinical Pharmacology Review NDA 19-962 Toprol-XL 10182006
Reported PD information^
^ Under metoprolol regimen CRZ0K is Toprol XL
DCP1PM Page 97 10182006
Clinical Pharmacology Review NDA 19-962 Toprol-XL 10182006
Table Results of randomised double-blind comparative trials evaluating antihypertensive efficacy of metoprolol formulations or other antihypertensives
DCP1PM Page 98 10182006
---------------------------------------------------------------------------------------------------------------------
---------------------------------------------------------------------------------------------------------------------
---------------------
This is a representation of an electronic record that was signed electronically and this page is the manifestation of the electronic signature
s
Robert Kumi 10182006 045635 PM BIOPHARMACEUTICS
Patrick Marroum 10192006 050811 PM BIOPHARMACEUTICS
Clinical Pharmacology Review NDA 19-962 Toprol-XL 10182006
Figure 1 Change in SBP from baseline as a function of Toprol XL dose
Table 6 Linear regressions statistics used to assess Dose-Response
The results indicate that bull The slope of the curve is not different form zero (p = 05371 for dose ratio)
suggesting that there is no dose-response relationship bull Most active treatment groups are more effective than placebo in reducing SBP
By visual inspection it appears the lack of observed dose-response is mainly driven by a lower than expected response at the 20 mgkg level
Potential issues affecting efficacy and pharmacokinetic results bull LOCF was required for eight patients however the LOCF approach did not
greatly impact the outcome of the trial bull Patients assigned to the 10 mg and 20 mgkg dose received drug for only 2
weeks whereas dose in the 02 mgkg received the same dose for 4 weeks
DCP1PM Page 53 10182006
Clinical Pharmacology Review NDA 19-962 Toprol-XL 10182006
Reviewerrsquos Supplemental Dose-Response Analyses The sponsorrsquos dose-response analysis was successfully reproduced by this Reviewer using pooled placebo corrected data A supplemental analysis was conducted using group-specific placebo corrected data In this procedure data for subjects assigned to a given Active Group (eg 02 mgkg) were corrected with Placebo data (02 mgkg) Group specific placebo data are presented in Table 7
Table 7 Placebo-group specific data Placebo Group Frequency Delta SBP 02 mgkg 8 -567 10 mgkg 6 -300 20 mgkg 9 230
It should be noted that the group-specific placebo data appeared to follow a consistent trend where the placebo effect decreased with increasing number of tablets It is unclear if this titrationtablet-dependent placebo effect is valid or random Overall the apparent differential placebo effects suggest that the placebo group may have overly influenced the outcome of the dose-response analysis
When active groups are corrected using group-matched placebo data there is a statistically significant dose-response The dose response using group-specific placebo data is illustrated in Table 8 and Figure 2
Figure 2 Placebo corrected changes in SBP (chg_pc on y axis) as a function of dose ratio
Potential Limitations of Supplemental Analyses Typically placebo effects are constant if randomization is correct thus it is unclear if subsetting the placebo group is acceptable and did not increase bias Additionally subsetting the placebo group leads to a reduced number of placebo subjects per dose group that may impact the regression analyses
DCP1PM Page 54 10182006
Clinical Pharmacology Review NDA 19-962 Toprol-XL 10182006
Table 8 SAS output for regression analyses using group-specific placebo corrections The REG Procedure
Model MODEL1
Dependent Variable chg_pc
Number of Observations Read 117
Number of Observations Used 117
Analysis of Variance
Sum of Mean
Source DF Squares Square F Value Pr gt F
Model 1 191083177 191083177 2663 lt0001
Error 115 825109481 7174865
Corrected Total 116 10162
Root MSE 847046 R-Square 01880
Dependent Mean -430358 Adj R-Sq 01810
Coeff Var -19682365
Parameter Estimates
Parameter Standard
Variable Label DF Estimate Error t Value Pr gt |t|
Intercept Intercept 1 125480 133166 094 03480
DOSRATIO Dose Ratio 1 -100051 019387 -516 lt0001
Secondary variables
bull Placebo-corrected change from baseline in sitting DBP The mean plusmn SD change (Week 4LOCF) in sitting DBP is illustrated in Figure 3 and Table 9
Figure 3 Mean changes (actual and placebo-corrected) from baseline to Week 4LOCF for sitting DBP (ITT population)
DCP1PM Page 55 10182006
Clinical Pharmacology Review NDA 19-962 Toprol-XL 10182006
Table 9 SAS output for regression analyses for DBP with pooled placebo correction
Treatment group effects and pairwise comparisons for sitting SBP and DBP Results of the treatment group effects at the Week 4LOCF visit and the pairwise comparisons between each TOPROL-XL group and placebo for the change from baseline in sitting SBP and DBP are shown for the ITT population in Table 10
Table 10 Treatment group effects for change in baseline to Week 4LOCF for sitting SBP and DBP (ITT population)
Some key findings from the pair-wise comparison are as follows (Table 10) 1 All active groups produced statistically significant reductions from baseline in sitting
SBP and DBP at the Week 4LOCF visit whereas placebo did not
DCP1PM Page 56 10182006
Clinical Pharmacology Review NDA 19-962 Toprol-XL 10182006
2 Overall the mean change from baseline in sitting SBP at Week 4LOCF for the TOPROL-XL groups pooled was statistically significantly larger than that for the placebo group (p=00351)
3 Results of pairwise comparisons between individual TOPROL-XL dose groups and placebo also revealed a statistically significant difference for the 10 and 20 mgkg groups (p=00270 and p=00492 respectively)
bull Mean changes over time in sitting SBP and DBP Consistent with findings from other studies with beta-blockers apparent maximal reduction in blood pressure occurred between 1 and 4 weeks of treatment
Figure 4 Mean changes over time for sitting SBP and DBP (ITT population)
Data points in plot are from absolute values (not taking baseline into account)
Subgroup Analyses The sponsor conducted several exploratory subgroup analyses however these analyses were not reviewed critically and are not presented in this review as
1 they do no impact the primary outcome or study objective 2 they are unlikely to be clinically useful due to the small number of patients per
subgroup One potentially useful some group analyses involved the percentage of responders as defined in Table 11
The responder analyses shows comparable response rates for all active dose groups suggesting similar efficacy across dose groups despite different exposure (doses)
DCP1PM Page 57 10182006
Clinical Pharmacology Review NDA 19-962 Toprol-XL 10182006
Table 11 Number and proportion of responders (ITT population)
Pharmacokinetic Results The Ctrough information obtained in the trial are summarized in Figure 6 and Tables 12 and 13
Table 12 Summary of Ctrough data (per applicant)
Sixteen patients across the 3 TOPROL-XL groups did not have blood samples obtained for analysis of metoprolol concentrations Based on the number of samples BLQ there appeared to be very low concentrations in the lowest dose group It appeared that Ctrough increased with dose According to the applicant these values are similar to those obtained previously in adults especially at the 2 higher doses Variability was high in all treatment groups (CV gt 60 )
Table 12 Summary of Ctrough (Reviewer Generated) from all patients (samples lt LOQ given value = 0) Toprol XL Dose Number of subjects Concentration (ngmL) (mgkg) Mean plusmn SD Median Range 02 39 137 plusmn 294 000 0 ndash 157 10 17 1224 plusmn 1416 845 0 ndash 571 20 46 2462 plusmn 3352 1140 0 ndash 1670
DCP1PM Page 58 10182006
Clinical Pharmacology Review NDA 19-962 Toprol-XL 10182006
Reviewer Note Overall the plasma concentrations (exposure) for the 02 mgkg dose group appear too low to be effective (close to LOQ) It is noted that adults typically have concentrations gt LOQ at the lowest therapeutic dose 25 mg (~ 4 ngmL)
Figure 6 Boxplot of metoprolol Ctrough using samples gt LLQ (per applicant)
Safety Results According to the applicant Toprol XL was well tolerated in the pediatric population as tabulated below
Main Analyses Conclusions bull No dose response was observed for corrected SBP using pooled placebo data
however using group-matched placebo data demonstrated a dose response bull Ctrough increased with dose bull Toprol 10 and 20 mg kg doses were more effective than placebo in reducing
SBP bull The responder rate was comparable across all active dose groups and this rate was
greater than that of placebo
DCP1PM Page 59 10182006
Clinical Pharmacology Review NDA 19-962 Toprol-XL 10182006
Methods Reviewerrsquos Methods Generally this reviewer conducted the analyses in a manner similar to that of the sponsor to confirm the sponsorrsquos findings
Sponsorrsquos Methods
Design Study1 307A
Reviewer Note This study was described in the Dose-Response Assessment (please refer to Page 7 Dose Response Analyses) Consequently only highlights relevant to the population analyses will be included in this section
Study 307A was a 4-week multi-center double-blind placebo-controlled randomized parallel-group study TOPROL-XL (metoprolol succinate) extended-release tablets were given to hypertensive pediatric patients Patients were randomized to double-treatment with a once daily oral dose of placebo or Toprol-XL at 1 of 3 target doses 02 or 20 mgkg The dose range for this study was 125 to 200 mg daily Patients on placebo followed the same schedule as that for their active group comparators
Study Flow Chart
Key Inclusion Criteria School age and adolescent children with reproducible SBP or DBP at or above the 95th percentile using height-adjusted charts for age and weight were eligible
DCP1PM Page 60 10182006
Clinical Pharmacology Review NDA 19-962 Toprol-XL 10182006
Study2 307B
Study 307B was a 52-week multi-center open-label study to determine the safety and pharmacokinetics of TOPROL-XL (metoprolol succinate) extended-release tablets (metoprolol CRXL) in hypertensive pediatric patients The starting dose was 25 mg daily The dose was increased every 2 weeks in increments of 25 mg or 50 mg based on tolerability until BP was controlled or the dose reached 200 mg
Table 1 Study Assessments
At the end of the 52-treatment period all patients had BP measured and a trough plasma level taken 24 hours the last dose of Toprol-XL with the exception of those patients who completed the serial portion at the final visit Among the participants a subgroup of approximately 30 patients was to participate in PK assessments of metoprolol requiring serial blood sampling at any time during the 52 weeks A single dose of 25 mg of Toprol-XL was given orally to those participating patients after a 48-hour washout period After the PK assessments they returned to the main study protocol Data
Study1 307A
4111 Pharmacokinetics A blood sample was to be collected at Visit 7 into a heparinized Vacutainer tube and obtained at 24 hours (plusmn2 hour) following the last dose of study medication (ie trough measurement) for determination of plasma metoprolol concentrations
Study Disposition Chart
DCP1PM Page 61 10182006
Clinical Pharmacology Review NDA 19-962 Toprol-XL 10182006
Table 2 Study Demographics
4112 Pharmacodynamics Primary variable
Sitting SBP determined at trough (24plusmn4 hours Visit 7) served as the primary efficacy assessment The primary measure of effect was the placebo-corrected change from baseline to the end of treatment (Week 4) in trough sitting SBP Each BP determination represented the mean of 3 readings with less than 7 mmHg between the highest and lowest value Blood pressure was measured using a mercury sphygmomanometer with an appropriate size cuff positioned approximately at the level of the heart Every effort was made to have the same individual measure the patientrsquos BP throughout the study if possible At all post randomization visits BP measurements were to be made at trough defined as 24 hours (plusmn4 hours) after receiving study medication All measurements were to be determined prior to the patient taking the scheduled dose of study medication In the
DCP1PM Page 62 10182006
Clinical Pharmacology Review NDA 19-962 Toprol-XL 10182006
event that the patient accidentally took study medication on the day of the scheduled visit the visit was to be rescheduled within 24 to 48 hours
Study2 307B
4113 Pharmacokinetics A 48-hour washout period prior to sampling was required for all patients including patients who entered the 52-week study and then decided to participate in the serial PK portion of the study All patients were to have a 15-mL blood sample collected into a heparinized Vacutainer tube 24 hours (plusmn2 hour) following the last dose of TOPROL-XL (ie trough measurement) at Visit 18 (or a the time of premature discontinuation) except for patients who participated in the serial PK portion of the study and had blood sampling performed at Visit 18 For patients participating in the serial PK portion of the study blood samples (15 mL) were to be collected into heparinized Vacutainer tubes and obtained at Hour 0 (predose) and at 1 2 3 4 6 8 10 and 24 hours after administration of a single 25 mg dose of TOPROL-XL following a 48-hour washout period After the last blood sample was obtained the patient was to startresume the prescribed dose of TOPROL-XL heshe was receiving prior to PK sampling
Patient Disposition Chart (completion or discontinuation)
Overall a total of 31 patients at 8 centers were enrolled in the serial PK portion of the study Of these 31 patients 27 had plasma concentration data available and were included in the analyses Four patients were excluded from the analyses because their plasma concentrations were not quantifiable (Nos 047-009 and 047-021) or because only whole blood samples were analyzed (Nos 005-002 005-003)
DCP1PM Page 63 10182006
Clinical Pharmacology Review NDA 19-962 Toprol-XL 10182006
Table 3 Subject Demographics for Patients Providing Serial Blood Samples
Missing Data Twenty-six patients did not have blood samples obtained for analysis of metoprolol concentrations in either the 16-week (n=7) or 52-week (n=19) studies Among patients with plasma samples 14 (14) in the 52-week study and 13 (13) in the 16-week study had trough plasma metoprolol concentrations that were below the LLQ Therefore data from a total of 99 patients were included in this analysis
Assay Metoprolol plasma levels were assayed using high-performance liquid chromatography tandem mass spectrometric detection methods having limit of quantitation (LOQ) of 1 ngmL The method was validated in the linear range 1 to 1000 ngmL Precision was less than or equal to 109 Accuracy ranged from 940 to 1013 Pharmacodynamics Not applicable
Data Checking SAS was used to format and check data Additionally visual inspection of several randomly selected subject data was carried out
DCP1PM Page 64 10182006
Clinical Pharmacology Review NDA 19-962 Toprol-XL 10182006
Models
Overview The sponsorrsquos stated assumptions underlying this modeling analysis are
1 Rich sampling data collected from 30 subjects in 307B Study can be used to adequately characterize the structural pharmacokinetic model of metoprolol
2 Structural pharmacokinetic models of metoprolol at other dose strength are identical to that at 25 mg
3 Metoprolol exhibits a linear pharmacokinetics in the dose ranges studied 4 Steady-state pharmacokinetics of metoprolol has been reached at the time of blood
sampling in Study 307A 5 Metoprolol accounts for the blood pressure effect in the study 6 Existing various disease states in the patients have no impact on the pharmacokinetics
of metoprolol and pharmacodynamics of the blood pressure reduction in the study 7 Concomitant medications if existed do not have any effects on the pharmacokinetics
of metoprolol and pharmacodynamics of the blood pressure reduction in the study
Reviewer Comment The sponsorrsquos assumptions appear reasonable based on existing metoprolol PKPD information
Pharmacokinetics
4114 PK Structural Model Several PK models were tested to identify the structural model Flip-flop absorption was taken into consideration based on general PK characteristics following administration of sustained release tablets and observed data in the current study (serial PK samples)
The models tested included linear 1- and 2-compartment PK models with the following characteristics (focused on flip-flop models)
bull first-order absorption with and without absorption lag time (NONMEM subroutines ADVAN2 and ADVAN4)
bull zero-order absorption with and without absorption lag time (NONMEM subroutines ADVAN1 and ADVAN3)
bull simultaneous zero- and first-order absorption from the absorption compartment The models were parameterized in terms of CLF and VF
Ultimately the 2-compartment model with first order flip-flop absorption an absorption lag time and 2 residual error terms was selected as the structural model of metoprolol The model scheme is presented in the following Figure 1 Figure 1 PK Compartmental Model
DCP1PM Page 65 10182006
Clinical Pharmacology Review NDA 19-962 Toprol-XL 10182006
4115 PK Covariate Model Covariate models were developed to account for the potential impact of the following covariates and derived covariates on metoprolol PK
Continuous variables bull Age (AGE years) bull Body weight (WT kg) bull Body surface area (BSA m2) calculated from WT and HT (cm) using the height
weight formula BSA=0024265 x WT 05378 x HT03964 bull Ideal body weight (IBW kg) calculated as - Males IBW=50+(HTndash150)25 and
for Females IBW=45+(HTndash150)25 bull Dose (DOSE mg of Toprol-XL)
Categorical variables bull Gender (SEX) - Male 0 - Female 1 bull Race (RACE) - Caucasian 0 - Black 1 - Asian 2 - Other 3
PK covariate effects were modeled as follows
Effects of continuous covariates (AGE WT BSA IBW and DOSE) were normalized to the corresponding median value across a dataset such that continuous covariates were related to structural PK parameters in a power function as described below
where Θ is the fixed-effect parameter of a covariate estimated by the NONMEM program covariate value is the observed covariate value and PK typical value is the typical value of the PK parameter estimated by NONMEM Effects of categorical covariates (SEX and RACE) are related to structural PK parameters by fractional changes of dummy variables
DCP1PM Page 66 10182006
Clinical Pharmacology Review NDA 19-962 Toprol-XL 10182006
Where Θ is the fixed-effect parameter of a covariate estimated by the NONMEM program covariate is the dummy variable value and modified in the control streams and PK typical value is the typical value of this PK parameter as estimated by NONMEM
Median values of all covariates in the dataset for population PK analysis are presented in Table A
Table A Summary of patient covariates and Toprol-XL doses in the data for population PK analysis
Two Steps were included in the modeling of covariates
Step 1 Forward Addition The covariates were subjected to a stepwise forward selection algorithm using a likelihood ratio test based on a change in MOF values from the base model A significant covariate reduced the MOF more than 660 (chi-square distribution plt001 degrees of freedom [df]=1)
Step 2 Backward deletion (Excluding procedures for covariate effect) The covariates in the full model acquired in Step 1 were subjected to a backward deletion algorithm 1 covariate was deleted at a time using a likelihood ratio test based on a change in MOF values A covariate was determined to be statistically significant if the change in MOF after its deletion from the breakdown model was increased by more than 1083 (chi-square distribution plt0001 df=1)
4116 PK Random Variance Models An exponential error model was used to characterize inter-patient variability based upon the assumption that random effects for PK parameters were not correlated among PK parameters No other error models for eta were evaluated by the applicant or by this Reviewer The retention of ETA values for each PK parameter in the structural model was confirmed by sequentially fixing each ETA value at zero and comparing each resultant MOF with the MOF obtained when all ETA values were retained in the model (see Table 6)
DCP1PM Page 67 10182006
Clinical Pharmacology Review NDA 19-962 Toprol-XL 10182006
The residual model was modeled by an additive model two error terms were used one for error associated with trough samples and the other with serial samples
Reviewer Note Use of an exponential model appears reasonable
Pharmacodynamics
4117 PKPD Structural Model The equations for the structural models are shown below
1 Metoprolol Ctrough The relationships between the observed metoprolol concentrations (Ctrough) and hemodynamic changes were investigated using 4 direct-link models namely a linear model a log-linear model and Hillrsquos sigmoid Emax PKPD model with and without a baseline
2 The relationships between Cmax or AUC0ndash24 and hemodynamic changes were investigated using 2 direct-link models a linear model and a log-linear model
4118 PKPD Covariate Model The inclusion and exclusion procedures of covariate effect on the selected PKPD base model to obtain a selected final PKPD model were identical to those in the covariate evaluation in the population PK models as described previously in PK Covariate Model DCP1PM Page 68 10182006
Clinical Pharmacology Review NDA 19-962 Toprol-XL 10182006
Table B Baseline demographic and covariate characteristics
4119 PKPD Random Variance Models An exponential error model was used by the applicant to model inter-individual variability The retention of a random effect parameter ETA in each selected PKPD structural model was then evaluated by sequentially fixing each ETA value at zero and comparing each resultant MOF with the MOF obtained when all ETA values were retained in the model (plt005) This step reduced over-parameterization by deleting unnecessary random-effect parameters from the structural model to obtain the base model
Reviewer Note The study design precludes assessment of inter-individual variability or random error because only one dose record was available per patient Consequently the model should not have included eta terms It is noted that the sponsor ultimately dropped the eta term in the final model
DCP1PM Page 69 10182006
Clinical Pharmacology Review NDA 19-962 Toprol-XL 10182006
Model Selection
PK Initial Model Selection
PK Base Model to Final Model The selection of the most appropriate PK base model for a metoprolol PK was based upon the following criteria a significant reduction in MOF as compared to the baseline model and asymptotic chi-square distribution based on the likelihood ratio test or AIC (plt005) as compared to the other structural models This selected PK base model was then subject to a covariate evaluation The population PK model bearing all surviving covariate parameters with statistical significance became the penultimate final model If 1 of the body size parameters (WT BSA and HT) was not in the model the penultimate final model became the final model If body size parameters were in the model they were sequentially replaced by other body size parameters in the regression submodel for each PK parameter The best body size parameter was then selected on the basis of lowest MOF to form the final model
PK Final Model Selection Simulations and visual inspections based on goodness of fit plots were used to qualify and validate the model The goodness-of-fit of the final model was evaluated graphically by comparing population and individual predictions of metoprolol concentrations with observed metoprolol concentrations along the line of unity and by visual inspection of the following plots of population-weighted residuals (WRES) for the final population model 1 Population-weighted residuals (WRES) versus population-predicted concentrations (PRED) 2 WRES versus time after first drug administration in each patient 3 WRES versus all covariates evaluated WRES were generally expected to be distributed homogenously around zero for PRED time after administration and covariates For those 27 patients with serial samples goodness-of-fit of the plasma concentration-time profile for each individual was visually inspected The linear relationship between their AUClast values from the observed data and those from the simulated data (final model) was examined
The predictive performance of the final population PK model including covariates was evaluated by comparing typical values of PK parameters with the mean of individual Bayesian estimates or individual values of PK parameters with the results from non-compartmental analysis for patients with serial samples Steady-state metoprolol plasma concentration-time profiles from 0ndash24 hours at the interval of 15 minutes (025 hour) were calculated using the post hoc Bayesian estimated PK parameter obtained for 65 patients included in the PKPD relationship using the following equation
DCP1PM Page 70 10182006
Clinical Pharmacology Review NDA 19-962 Toprol-XL 10182006
PKPD Initial and Final Model Selection A similar approach to that of PK model selection was adopted for PKPD Each of the above-mentioned PKPD models with random effects was identified by curve-fitting the dataset Initial selection of the PKPD structural model was based upon a significant reduction in MOF (plt005) as compared to the baseline model and reasonable PKPD parameter estimates Software
Nonlinear mixed-effect modeling (NONMEM) software (Version V level 11 Globomax Hanover MD) was used in the population PK analysis PK model fitting was accomplished using first-order (FO) approximation methods For PKPD model fitting the first-order conditional estimation (FOCE) with eta-epsilon interaction method in NONMEM was used for all model runs
SAS software (Version VIII Cary NC) was employed to prepare datasets according to the format required by the NONMEM program (Boeckmann et al 1991) Microsoftreg Excel 2000 (Redmond WA) and S-PLUS 2000 (Professional Release 2 MathSoft Inc Cambridge MA) were used to perform exploratory graphical exposure calculation and statistical analyses according to the format required by the NONMEM program (Boeckmann et al 1991) SAS command files logs and listings pertaining to data file conversion and merging were reviewed by an independent analyst Datasets were stored in SAS data frames combined and exported to Excel and then to ASCII files before fitting to the model
Datasets were prepared and pooled in a NONMEM-compliant format using SAS software by the Programming Group Clinical Information Sciences at AstraZeneca Wilmington Delaware SAS command files logs and listings pertaining to file conversion and merging were provided and found to be acceptable The contents of both datasets (toprolkatcsv for PK modeling and cppd2csv for PKPD modeling) were included
DCP1PM Page 71 10182006
Clinical Pharmacology Review NDA 19-962 Toprol-XL 10182006
toprolkatcsv was not provided electronically in a SAS format however this reviewer generated a similar dataset using the applicantrsquos criteria
Reviewer Comment The software and data assembly methods appeared adequate
DCP1PM Page 72 10182006
Clinical Pharmacology Review NDA 19-962 Toprol-XL 10182006
Results and Discussion Design Adequacy
Overall the trial designs appeared adequate to evaluate metoprolol population PK and PKPD in pediatric patients receiving Toprol XL However the design could have been further optimized by increasing the sampling points particularly in the absorption phase Due to the limited number of samples in the absorption phase it was not possible to accurately characterize the absorption model first order vs zero order or mixed first and zero order Additionally collection of mainly trough samples limits the ability to accurately estimate measures such as Cmax that are not directly related to Ctrough particularly if multiple compartments are present Consequently Cmax estimations are unlikely to be accurate Finally most patients provided only one trough sample thus inter-individual variability could not be adequately captured and may have limited the utility of the modeling exercise particularly in PKPD where the random effect could not be accurately characterized Ultimately there was no random variable in the final PKPD model (ie eta was set to zero) Data Integrity
This reviewer checked the data visually by randomly selecting data from patients included in the population modeling and comparing to data in the study report (source data) Overall the data integrity appeared acceptable The applicant observed the following guidelines that appeared acceptable No datum from any study participant with a protocol violation that was thought to materially impact the analysis was included The dataset contained data from only those study participants who could be evaluated ie with all the last dosing datetime blood sampling datetime plasma drug concentrations and demographic covariates
Data that were excluded (n = 62 samples) from the model were as follows One sample from an apparent poor metabolizer Two samples collected gt 96 hours post dose From 307B 10 trough samples lt LOQ From 307A 17 samples lt LOQ Thirty-samples from serial data that were lt LOQ or whole blood samples Model and Model Selection
Base Model
41110 Pharmacokinetic Model description The base PK model was a standard two compartment model that incorporated lag time and flip-flop kinetics The key features of the model were flip-flop was insured by making the value of ke gt ka in the clearance equation Additionally lag time was restricted to a value of 2 hours or less and concentrations were log transformed consequently all concentrations (F) = 0 were given individual predicted concentrations of zero Finally there were two residual error terms one for serial samples and the other for trough samples DCP1PM Page 73 10182006
Clinical Pharmacology Review NDA 19-962 Toprol-XL 10182006
Key equations were as follows
KA = THETA(1)EXP(ETA(1)) V2 = THETA(2)EXP(ETA(2)) CL = (THETA(1)THETA(2)+THETA(3))EXP(ETA(3)) Q = THETA(4)EXP(ETA(4)) V3 = THETA(5)EXP(ETA(5)) ALAG1=THETA(6)EXP(ETA(6))
41111 PK Parameter estimation results Table 1 Summary of PK parameters in the metoprolol population PK base model (per applicant)
41112 Goodness of fit The applicant provided the following goodness-of-fit plots (Figure 1)
Reviewer Note The goodness-of-fit plots were reproduced by this Reviewer (see Appendix) with minor modifications
Figure 1 Goodness of fit plots for Base Model
DCP1PM Page 74 10182006
Clinical Pharmacology Review NDA 19-962 Toprol-XL 10182006
Base PK Model Selection The MOF values of all structural model candidates tested are presented in Table 2 Model selection was based primarily on MOF values the lower MOF the better the model The applicant reports that in general MOF values generated by a conventional absorption model (ie absorption rate is faster than elimination rate) and a flip-flop absorption model (ie absorption rate is slower than elimination rate) were identical
Reviewer Comment The existence of flip-flop kinetics appears plausible based on data provided and general patterns for sustained release formulations Consequently the use of flip-flop kinetics for the bulk of the modeling exercise appears reasonable
General conclusions from the information in Table 2 are First order input is better than zero order input Two compartment model is better than one compartment model Lag time presence is better than lack of lag time Two residual error terms are better than one residual error term It should also be noted that several other models led to unsatisfactory completion of the run and were not considered further
DCP1PM Page 75 10182006
Clinical Pharmacology Review NDA 19-962 Toprol-XL 10182006
Table 2 Comparison of Structural PK Models
Reviewer Comment The selected structural model appears appropriate based on the data
Base Model The deletion of ETA for V2 did not change the MOF value suggesting that ETA for V2 should be deleted to avoid an over-parameterized warning (Table 3) This was consistent with the estimated parameter value of ETA for V2 being 648 x 10ndash9 a very small value Therefore the base model was selected by deleting the ETA for V2 from the structural model
Reviewer Comment on Eta deletion for V2 Deletion of eta for V2 is acceptable based on the empirical data however from a physiological perspective deletion of eta is problematic Generally one anticipates inter-individual differences in volume of distribution In this case it appears that the error associated with V2 may have been randomly shifted to V3 and or Q terms as the three DCP1PM Page 76 10182006
Clinical Pharmacology Review NDA 19-962 Toprol-XL 10182006
terms are interrelated This potential shift in error is supported by the fact that the V2 eta value increases significantly (by several orders of magnitude- 10-5 vs 100) when eta for Q and or V3 is fixed However when Q or V3 are fixed minimization is successful but Q and V3 are not accurately estimated Accounting for the possible error shift is a complex process and goes beyond the scope of this reviewer thus deletion of eta associated with V2 was considered acceptable for the remainder of the modeling evaluation
Table 3 Structural elements tested in the metoprolol population PK structural model (p lt 0005)
Final PK Model
41113 Model description The key feature of the final model is the inclusion of the covariate effects of age on Q and weight on CL in the population PK model
Key Equations CL = (THETA(1)THETA(2)+THETA(3)+EWT)EXP(ETA(2)) Q = THETA(4)EAGEEXP(ETA(3))
Including Covariate Effects As previously described covariate effects were assessed by forward addition and backward deletion Most covariates did not significantly change MOF however BSA significantly affected CL and Age affected Q Consequently these covariates were included in the penultimate final model
DCP1PM Page 77 10182006
Clinical Pharmacology Review NDA 19-962 Toprol-XL 10182006
Reviewer Note BSA is derived form WT and HT covariates implying BSA is highly correlated to these two covariates (Figure 2) weight is the most suitable (practical covariate) as it is readily measured Furthermore weight and BSA produced the same MOF (Table 4) whereas MOF with height was more positive (less significant)
Figure 2 Plot of BSA vs Body Weight
The data in Table 4 support selection of the final model
Table 4 Covariate elements tested in the metoprolol population PK penultimate final model (plt0005)
The applicant acknowledges that mechanism(s) accounting for the impact of age on QF are not clear However since distribution clearance has little effect on metoprolol plasma exposure further investigation is not needed
41114 PK Parameter estimation results As shown in Table 5 PK parameters were estimated fairly precisely by the final model
Table 5 PK Parameter Estimates using Final Model
DCP1PM Page 78 10182006
Clinical Pharmacology Review NDA 19-962 Toprol-XL 10182006
41115 Goodness of fit The goodness-of-fit plots provided by the applicant show good precision Figure 5 Goodness of fit plots for final PK model
DCP1PM Page 79 10182006
Clinical Pharmacology Review NDA 19-962 Toprol-XL 10182006
PK Model Qualification The post hoc Bayesian-estimated AUC (simulated) obtained for the 27 patients with serial plasma samples are plotted against the observed (AUCt) The correlation was high (R2 gt 099) Figure 6 AUClast from observed data versus AUCt from model simulation in the 27 patients providing serial plasma samples
Regression line Y= 4514 + 08976 X R2 = 09957
The graphical validation of the final metoprolol population PK model validation against covariates evaluated is presented in Figure 6
Figure 7 Graphical validation of covariates
DCP1PM Page 80 10182006
Clinical Pharmacology Review NDA 19-962 Toprol-XL 10182006
There was no systematic bias in weighted residuals for any covariates evaluated suggesting that the final model included all appreciable effects of available covariates (Figure)
The effects of weight on metoprolol CLF are illustrated in Figure 8 where Bayesian post hoc estimates of CLF are plotted against weight and overlaid by the model-predicted line Overall the model appeared to fit the data well
Figure 8 Plot of CLF vs Body weight
The effects of AGE on metoprolol QF are illustrated in Figure 9 where Bayesian post hoc estimates of QF are plotted against AGE and overlaid by the model-predicted line Figure 9 Plot of QF vs Age
DCP1PM Page 81 10182006
Clinical Pharmacology Review NDA 19-962 Toprol-XL 10182006
Reviewer Note The applicant indicated that attempts to run the final model using the first-order conditional estimation method resulted in termination errors Therefore the parameter estimates obtained by the FO method were reported as the final parameter estimates
Conclusion Regarding Population PK Modeling Overall the sponsorrsquos population PK modeling is acceptable
PKPD Model and Model Selection
PKPD Base Model PharmacokineticPharmacodynamic Model description The key feature of the model was a lack of random variance term for the slope (since only single data points were available per subject) and inclusion of baseline effect
Key equations were as follows E0 = THETA(1)EXP(ETA(1)) M = THETA(2) Y = E0 + MLOG(AUC) + EPS(1)
The control stream provided in the appendix is that for DBP (provided by sponsor) The control stream for SBP is comparable with appropriate substitution for BP type
It should be noted that only the log-linear and linear PKPD models were considered suitable for AUC and Cmax For this review only AUC estimates were considered reliable as Cmax estimates could not be accurately determined based on the sampling scheme Consequently the remainder of this review focuses on AUC information although Ctrough and Cmax data are displayed for reference
Bayesian estimates from PK modeling are summarized in Table 1
Table 1 Bayesian estimates of metoprolol PK exposure for those patients included in the PKPD analysis (N=65)
DCP1PM Page 82 10182006
Clinical Pharmacology Review NDA 19-962 Toprol-XL 10182006
PKPD Model Selection (initial and final) The log-linear model was adopted as the base model for this PKPD relationship since it improved the MOF significantly (Table 2) The ETA parameter for the slope was pre-eliminated for the purpose of model parsimony The intercept and slope in this log-linear model for AUC(0-24) did not bear ETA parameter therefore no covariates had impact on either parameter in the model
Reviewer Note The intercept should not have borne an eta term because individual subjects provided only one data point Consequently fixing eta to zero or deleting eta in the final model is appropriate No further model development was required after eta was eliminated and the base model was equivalent to the final model
Table 2 Base population PKPD models tested for the change in SBP
41116 PKPD Parameter estimation results The final PKPD parameter estimates are presented in Table 3
Table 3 Summary parameters in the final PKPD model for the change in SBP using trough plasma level Parameter Explanation Estimate SE ()b
DCP1PM Page 83 10182006
Clinical Pharmacology Review NDA 19-962 Toprol-XL 10182006
Model Qualification Based on the relatively low R2 value and as shown in Figure there is a poor correlation between change in SBP and log AUC
Figure 1 Relationship between change in SBP and AUC (line generated from modeling)
Overall goodness-of-fit of the model was considered to be poor probably due to the high variability in the measurements Consequently the precision of the model parameter estimates was not considered to be very reliable These parameters have little clinical usefulness and can be treated only as an indication of trends ie more hemodynamic effects can be potentially achieved when high Toprol-XL doses are given Clinical dose adjustment based on these PKPD parameters is not recommended
Reviewerrsquos Supplemental Analyses A supplemental PKPD analyses was conducted using simple linear regression since the population model did not improve the fit Overall eta made an insignificant contribution to the overall model The results of the analyses were similar to the population analyses A series of regression analyses were conducted and are presented in Table 4
The applicant notes that the preliminary modeling exercise found that there was no difference in the PKPD modeling results using different hemodynamic data formats (ie change in the measurements percent change in the measurements or actual BP measurements) This finding was confirmed by this reviewer (see Table 4)
DCP1PM Page 84 10182006
Clinical Pharmacology Review NDA 19-962 Toprol-XL 10182006
Table 4 Supplemental PKPD Regression Analyses Conducted by Reviewer Model (liner regression) Intercept (I) Slope (m) R2 Probability RSBP = mISBP + I 3957 -035 01626 0009 PSBP = mISBP + I 2524 -023 01252 00038 PSBP = mRSBP + I 0005 074 09891 lt 00001 RSBP = mlogAUC + I 651 -221 0060 00493 RSBP = mDose + I -751 0006 00026 06878 RSBP = mDose^ + I -312 -111 004 02711 RSBP = mlogAUC + nISBP + I 5303 -221 (m)
-035 (n) 02230 0001
RSBPplc = mAUC + I -667 -0003 00458 00871 RSBPplc = mlogAUC + I 461 -2208 00600 00493 RPUL = mlogAUC + I 1868 -405 01102 00069 Symbols in table similar to population PK model without eta term RSBP- change of SBP without placebo correction ISBP- initial (baseline) SBP RPUL- change in HR without placebo correction Dose- in mg where placebo is included as 0 mg PSBP- percentage change of SBP without placebo correction
Conclusion Regarding Population PKPD Modeling Overall the sponsorrsquos population PKPD modeling is acceptable No dose adjustment conclusion can be made from this modeling however an exposure-response relationship was established for AUC and reduction in SBP
Discussion
The significance of the results 1 Provide estimates of PK measures and plasma exposure in pediatric population These data can be compared to adult exposure to determine if exposure differences impact drug effectiveness The main challenge in comparing pediatric data to adult data is different modeling schemes formulations and methods were used in the two populations
2 PKPD findings are not sufficiently precise to provide a dose adjustment algorithm however the PKPD analyses provides rationale for proposed titration as increasing exposure (doses) may improve efficacy (reduction in SBP) Ultimately the risk-benefit analyses overrides PKPD assessment for dose adjustment drug will be titrated thus reliance on PKPD information is not critical The proposed dose 10 mgkg appears suitable based on available information It is unclear from the studies if there should be an initial maximum dose although the sponsor has proposed 50 mg as the maximum initial dose The proposed pediatric starting dose on a mgkg basis is within the range of starting adult doses (25 ndash 100 mg) assuming an adult weighs 70 kg
3 Cumulative information form dose-response study indicates that Toprol XL has effectiveness in children however the most effective dose is unclear Since the drug can be titrated determining the initial optimal dose does not appear critical As proposed by the applicant dosing is started at a ldquolowrdquo dose that can be up-titrated if needed
DCP1PM Page 85 10182006
Clinical Pharmacology Review NDA 19-962 Toprol-XL 10182006
4 The results did not adequately address the potential impact of CYP2D6 metabolic status for pediatric patients taking Toprol XL There were an insufficient number of patients to make this assessment
5 Covariate effects do not appear significant only body weight significantly affects clearance However a worst case scenario can occur with a person that has a low body weight and is a poor metabolizer this will result in very high possibly supra-therapeutic exposure Age does not impact apparent oral clearance so an age-dependent dose adjustment is not needed for children over 6 years old In essence all children over six years old can initiate therapy at 10 mgkg
The validity of the results Overall the results produced by the sponsor appear valid and the sponsor used a sound modeling approach However alternative approaches that could have been adopted may have improved the outcome of the analyses Three of these approaches are presented below 1 Additional PK samples should have been collected during the absorption phase and
throughout the dosing interval to improve the modelrsquos performance Specifically additional samples collected during the absorption phase may have unambiguously identified the actual absorption input function (eg first order zero order mixed first and zero order) First order input was selected for the analyses although the dosage form is reported to exhibit zero order kinetics in adults It is possible that the input rate in children differs from that in adults but unlikely It should be noted that absorption kinetics in children is often erratic due to multiple factors (eg regioshyselective absorption incomplete gastric emptying and inconsistent absorption) so it is unclear if additional samples would have definitively identified the absorption function However additional non-trough samples may have helped in estimating key PK measures such as V and Cmax The final model did not have an eta associated with V which is atypical Collection of additional samples on different visits may have helped estimate potential inter-occasion variability It should be noted that AUC was estimated precisely for subjects providing serial samples but these subjects were not necessarily included in the PKPD analyses Ideally the PKPD modeling should have been conducted primarily in subjects who had accurate PK measures
2 The PKPD design could have been modified to potentially improve the utility of the analyses Specifically there should have been better placebo matching procedures to minimize the potential impact of the placebo effect This matching could have been improved by ensuring all patients on placebo had the same titration schedule and number of tablets It is noted that the model had a poor predictive performance that was mainly attributed to the high degree of variability in the PD measures Potentially other PD markers could have been explored that have less inherent variability One such marker is the degree of beta blockade using exercise heart rate (EHR) reduction this marker has been used extensively for metoprolol in adult subjects However use of EHR in the pediatric setting may be challenging
DCP1PM Page 86 10182006
Clinical Pharmacology Review NDA 19-962 Toprol-XL 10182006
Comments to sponsor
In future pharmacometric studies you should consider the following 1 collect sufficient (multiple) samples from individual subjects to allow assessment
of inter-occasion variability and estimation of inter-individual variability (eta) for all relevant parameters
2 placebo groups should be identically matched across all dose groups (eg same titration schedule and number tablets) to minimize potential bias or differences in the placebo effect
Comments to medical reviewer
1 The sponsor has adequately characterized metoprolol PK in the studied pediatric population The PK characterization could have been further optimized by obtaining additional samples over the entire dosing interval (eg during the absorption phase and elimination phase) on multiple occasions rather than on one occasion primarily at trough
2 A dose-response relationship could not be established using the protocol specified analysis approach The outcome of the dose-response relationship appeared highly dependent on the ldquoplacebo effectrdquo suggesting that the placebo group may not have been appropriate One should consider re-evaluating the dose-response precisely matched placebo groups (eg all placebo patients have identical number of tablets and titration schedule)
3 Based on the PKPD analysis plasma exposure (AUC) explains lt 10 of the response (reduction in systolic blood pressure) thus has limited clinical utility However the PKPD relationship suggests that there is a trend for increased response with increased exposure (dose driven)
4 Overall information from the dose-response study suggests that Toprol- XL is effective in the pediatric population The optimal initial dose 02 10 or 20 mgkg or the maximum safe and effective dose cannot be determined from the information provided It is noted that the 02 mgkg dose is unlikely to be effective as plasma concentrations achieved at this dose are unlikely to be effective (most concentrations lt LOQ and lower than effective adult concentrations) The 10 mgkg (proposed by applicant) appears to be a reasonable initial dose The labeling should reflect the regimens studied
DCP1PM Page 89 10182006
Clinical Pharmacology Review NDA 19-962 Toprol-XL 10182006
Appendix
DCP1PM Page 90 10182006
Clinical Pharmacology Review NDA 19-962 Toprol-XL 10182006
DCP1PM Page 91 10182006
Clinical Pharmacology Review NDA 19-962 Toprol-XL 10182006
DCP1PM Page 92 10182006
Clinical Pharmacology Review NDA 19-962 Toprol-XL 10182006
DCP1PM Page 93 10182006
Clinical Pharmacology Review NDA 19-962 Toprol-XL 10182006
DCP1PM Page 94 10182006
Clinical Pharmacology Review NDA 19-962 Toprol-XL 10182006
DCP1PM Page 95 10182006
Clinical Pharmacology Review NDA 19-962 Toprol-XL 10182006
Table 15 Control streams for final log-linear PKPD model for the change in DBP using metoprolol Cmax as the measure of exposure
Truncated NONMEM reports for base model identification for PKPD relationship in change of SBP (per sponsor)
DCP1PM Page 96 10182006
Clinical Pharmacology Review NDA 19-962 Toprol-XL 10182006
Reported PD information^
^ Under metoprolol regimen CRZ0K is Toprol XL
DCP1PM Page 97 10182006
Clinical Pharmacology Review NDA 19-962 Toprol-XL 10182006
Table Results of randomised double-blind comparative trials evaluating antihypertensive efficacy of metoprolol formulations or other antihypertensives
DCP1PM Page 98 10182006
---------------------------------------------------------------------------------------------------------------------
---------------------------------------------------------------------------------------------------------------------
---------------------
This is a representation of an electronic record that was signed electronically and this page is the manifestation of the electronic signature
s
Robert Kumi 10182006 045635 PM BIOPHARMACEUTICS
Patrick Marroum 10192006 050811 PM BIOPHARMACEUTICS

Clinical Pharmacology Review NDA 19-962 Toprol-XL 10182006
Table 8 SAS output for regression analyses using group-specific placebo corrections The REG Procedure
Model MODEL1
Dependent Variable chg_pc
Number of Observations Read 117
Number of Observations Used 117
Analysis of Variance
Sum of Mean
Source DF Squares Square F Value Pr gt F
Model 1 191083177 191083177 2663 lt0001
Error 115 825109481 7174865
Corrected Total 116 10162
Root MSE 847046 R-Square 01880
Dependent Mean -430358 Adj R-Sq 01810
Coeff Var -19682365
Parameter Estimates
Parameter Standard
Variable Label DF Estimate Error t Value Pr gt |t|
Intercept Intercept 1 125480 133166 094 03480
DOSRATIO Dose Ratio 1 -100051 019387 -516 lt0001
Secondary variables
bull Placebo-corrected change from baseline in sitting DBP The mean plusmn SD change (Week 4LOCF) in sitting DBP is illustrated in Figure 3 and Table 9
Figure 3 Mean changes (actual and placebo-corrected) from baseline to Week 4LOCF for sitting DBP (ITT population)
DCP1PM Page 55 10182006
Clinical Pharmacology Review NDA 19-962 Toprol-XL 10182006
Table 9 SAS output for regression analyses for DBP with pooled placebo correction
Treatment group effects and pairwise comparisons for sitting SBP and DBP Results of the treatment group effects at the Week 4LOCF visit and the pairwise comparisons between each TOPROL-XL group and placebo for the change from baseline in sitting SBP and DBP are shown for the ITT population in Table 10
Table 10 Treatment group effects for change in baseline to Week 4LOCF for sitting SBP and DBP (ITT population)
Some key findings from the pair-wise comparison are as follows (Table 10) 1 All active groups produced statistically significant reductions from baseline in sitting
SBP and DBP at the Week 4LOCF visit whereas placebo did not
DCP1PM Page 56 10182006
Clinical Pharmacology Review NDA 19-962 Toprol-XL 10182006
2 Overall the mean change from baseline in sitting SBP at Week 4LOCF for the TOPROL-XL groups pooled was statistically significantly larger than that for the placebo group (p=00351)
3 Results of pairwise comparisons between individual TOPROL-XL dose groups and placebo also revealed a statistically significant difference for the 10 and 20 mgkg groups (p=00270 and p=00492 respectively)
bull Mean changes over time in sitting SBP and DBP Consistent with findings from other studies with beta-blockers apparent maximal reduction in blood pressure occurred between 1 and 4 weeks of treatment
Figure 4 Mean changes over time for sitting SBP and DBP (ITT population)
Data points in plot are from absolute values (not taking baseline into account)
Subgroup Analyses The sponsor conducted several exploratory subgroup analyses however these analyses were not reviewed critically and are not presented in this review as
1 they do no impact the primary outcome or study objective 2 they are unlikely to be clinically useful due to the small number of patients per
subgroup One potentially useful some group analyses involved the percentage of responders as defined in Table 11
The responder analyses shows comparable response rates for all active dose groups suggesting similar efficacy across dose groups despite different exposure (doses)
DCP1PM Page 57 10182006
Clinical Pharmacology Review NDA 19-962 Toprol-XL 10182006
Table 11 Number and proportion of responders (ITT population)
Pharmacokinetic Results The Ctrough information obtained in the trial are summarized in Figure 6 and Tables 12 and 13
Table 12 Summary of Ctrough data (per applicant)
Sixteen patients across the 3 TOPROL-XL groups did not have blood samples obtained for analysis of metoprolol concentrations Based on the number of samples BLQ there appeared to be very low concentrations in the lowest dose group It appeared that Ctrough increased with dose According to the applicant these values are similar to those obtained previously in adults especially at the 2 higher doses Variability was high in all treatment groups (CV gt 60 )
Table 12 Summary of Ctrough (Reviewer Generated) from all patients (samples lt LOQ given value = 0) Toprol XL Dose Number of subjects Concentration (ngmL) (mgkg) Mean plusmn SD Median Range 02 39 137 plusmn 294 000 0 ndash 157 10 17 1224 plusmn 1416 845 0 ndash 571 20 46 2462 plusmn 3352 1140 0 ndash 1670
DCP1PM Page 58 10182006
Clinical Pharmacology Review NDA 19-962 Toprol-XL 10182006
Reviewer Note Overall the plasma concentrations (exposure) for the 02 mgkg dose group appear too low to be effective (close to LOQ) It is noted that adults typically have concentrations gt LOQ at the lowest therapeutic dose 25 mg (~ 4 ngmL)
Figure 6 Boxplot of metoprolol Ctrough using samples gt LLQ (per applicant)
Safety Results According to the applicant Toprol XL was well tolerated in the pediatric population as tabulated below
Main Analyses Conclusions bull No dose response was observed for corrected SBP using pooled placebo data
however using group-matched placebo data demonstrated a dose response bull Ctrough increased with dose bull Toprol 10 and 20 mg kg doses were more effective than placebo in reducing
SBP bull The responder rate was comparable across all active dose groups and this rate was
greater than that of placebo
DCP1PM Page 59 10182006
Clinical Pharmacology Review NDA 19-962 Toprol-XL 10182006
Methods Reviewerrsquos Methods Generally this reviewer conducted the analyses in a manner similar to that of the sponsor to confirm the sponsorrsquos findings
Sponsorrsquos Methods
Design Study1 307A
Reviewer Note This study was described in the Dose-Response Assessment (please refer to Page 7 Dose Response Analyses) Consequently only highlights relevant to the population analyses will be included in this section
Study 307A was a 4-week multi-center double-blind placebo-controlled randomized parallel-group study TOPROL-XL (metoprolol succinate) extended-release tablets were given to hypertensive pediatric patients Patients were randomized to double-treatment with a once daily oral dose of placebo or Toprol-XL at 1 of 3 target doses 02 or 20 mgkg The dose range for this study was 125 to 200 mg daily Patients on placebo followed the same schedule as that for their active group comparators
Study Flow Chart
Key Inclusion Criteria School age and adolescent children with reproducible SBP or DBP at or above the 95th percentile using height-adjusted charts for age and weight were eligible
DCP1PM Page 60 10182006
Clinical Pharmacology Review NDA 19-962 Toprol-XL 10182006
Study2 307B
Study 307B was a 52-week multi-center open-label study to determine the safety and pharmacokinetics of TOPROL-XL (metoprolol succinate) extended-release tablets (metoprolol CRXL) in hypertensive pediatric patients The starting dose was 25 mg daily The dose was increased every 2 weeks in increments of 25 mg or 50 mg based on tolerability until BP was controlled or the dose reached 200 mg
Table 1 Study Assessments
At the end of the 52-treatment period all patients had BP measured and a trough plasma level taken 24 hours the last dose of Toprol-XL with the exception of those patients who completed the serial portion at the final visit Among the participants a subgroup of approximately 30 patients was to participate in PK assessments of metoprolol requiring serial blood sampling at any time during the 52 weeks A single dose of 25 mg of Toprol-XL was given orally to those participating patients after a 48-hour washout period After the PK assessments they returned to the main study protocol Data
Study1 307A
4111 Pharmacokinetics A blood sample was to be collected at Visit 7 into a heparinized Vacutainer tube and obtained at 24 hours (plusmn2 hour) following the last dose of study medication (ie trough measurement) for determination of plasma metoprolol concentrations
Study Disposition Chart
DCP1PM Page 61 10182006
Clinical Pharmacology Review NDA 19-962 Toprol-XL 10182006
Table 2 Study Demographics
4112 Pharmacodynamics Primary variable
Sitting SBP determined at trough (24plusmn4 hours Visit 7) served as the primary efficacy assessment The primary measure of effect was the placebo-corrected change from baseline to the end of treatment (Week 4) in trough sitting SBP Each BP determination represented the mean of 3 readings with less than 7 mmHg between the highest and lowest value Blood pressure was measured using a mercury sphygmomanometer with an appropriate size cuff positioned approximately at the level of the heart Every effort was made to have the same individual measure the patientrsquos BP throughout the study if possible At all post randomization visits BP measurements were to be made at trough defined as 24 hours (plusmn4 hours) after receiving study medication All measurements were to be determined prior to the patient taking the scheduled dose of study medication In the
DCP1PM Page 62 10182006
Clinical Pharmacology Review NDA 19-962 Toprol-XL 10182006
event that the patient accidentally took study medication on the day of the scheduled visit the visit was to be rescheduled within 24 to 48 hours
Study2 307B
4113 Pharmacokinetics A 48-hour washout period prior to sampling was required for all patients including patients who entered the 52-week study and then decided to participate in the serial PK portion of the study All patients were to have a 15-mL blood sample collected into a heparinized Vacutainer tube 24 hours (plusmn2 hour) following the last dose of TOPROL-XL (ie trough measurement) at Visit 18 (or a the time of premature discontinuation) except for patients who participated in the serial PK portion of the study and had blood sampling performed at Visit 18 For patients participating in the serial PK portion of the study blood samples (15 mL) were to be collected into heparinized Vacutainer tubes and obtained at Hour 0 (predose) and at 1 2 3 4 6 8 10 and 24 hours after administration of a single 25 mg dose of TOPROL-XL following a 48-hour washout period After the last blood sample was obtained the patient was to startresume the prescribed dose of TOPROL-XL heshe was receiving prior to PK sampling
Patient Disposition Chart (completion or discontinuation)
Overall a total of 31 patients at 8 centers were enrolled in the serial PK portion of the study Of these 31 patients 27 had plasma concentration data available and were included in the analyses Four patients were excluded from the analyses because their plasma concentrations were not quantifiable (Nos 047-009 and 047-021) or because only whole blood samples were analyzed (Nos 005-002 005-003)
DCP1PM Page 63 10182006
Clinical Pharmacology Review NDA 19-962 Toprol-XL 10182006
Table 3 Subject Demographics for Patients Providing Serial Blood Samples
Missing Data Twenty-six patients did not have blood samples obtained for analysis of metoprolol concentrations in either the 16-week (n=7) or 52-week (n=19) studies Among patients with plasma samples 14 (14) in the 52-week study and 13 (13) in the 16-week study had trough plasma metoprolol concentrations that were below the LLQ Therefore data from a total of 99 patients were included in this analysis
Assay Metoprolol plasma levels were assayed using high-performance liquid chromatography tandem mass spectrometric detection methods having limit of quantitation (LOQ) of 1 ngmL The method was validated in the linear range 1 to 1000 ngmL Precision was less than or equal to 109 Accuracy ranged from 940 to 1013 Pharmacodynamics Not applicable
Data Checking SAS was used to format and check data Additionally visual inspection of several randomly selected subject data was carried out
DCP1PM Page 64 10182006
Clinical Pharmacology Review NDA 19-962 Toprol-XL 10182006
Models
Overview The sponsorrsquos stated assumptions underlying this modeling analysis are
1 Rich sampling data collected from 30 subjects in 307B Study can be used to adequately characterize the structural pharmacokinetic model of metoprolol
2 Structural pharmacokinetic models of metoprolol at other dose strength are identical to that at 25 mg
3 Metoprolol exhibits a linear pharmacokinetics in the dose ranges studied 4 Steady-state pharmacokinetics of metoprolol has been reached at the time of blood
sampling in Study 307A 5 Metoprolol accounts for the blood pressure effect in the study 6 Existing various disease states in the patients have no impact on the pharmacokinetics
of metoprolol and pharmacodynamics of the blood pressure reduction in the study 7 Concomitant medications if existed do not have any effects on the pharmacokinetics
of metoprolol and pharmacodynamics of the blood pressure reduction in the study
Reviewer Comment The sponsorrsquos assumptions appear reasonable based on existing metoprolol PKPD information
Pharmacokinetics
4114 PK Structural Model Several PK models were tested to identify the structural model Flip-flop absorption was taken into consideration based on general PK characteristics following administration of sustained release tablets and observed data in the current study (serial PK samples)
The models tested included linear 1- and 2-compartment PK models with the following characteristics (focused on flip-flop models)
bull first-order absorption with and without absorption lag time (NONMEM subroutines ADVAN2 and ADVAN4)
bull zero-order absorption with and without absorption lag time (NONMEM subroutines ADVAN1 and ADVAN3)
bull simultaneous zero- and first-order absorption from the absorption compartment The models were parameterized in terms of CLF and VF
Ultimately the 2-compartment model with first order flip-flop absorption an absorption lag time and 2 residual error terms was selected as the structural model of metoprolol The model scheme is presented in the following Figure 1 Figure 1 PK Compartmental Model
DCP1PM Page 65 10182006
Clinical Pharmacology Review NDA 19-962 Toprol-XL 10182006
4115 PK Covariate Model Covariate models were developed to account for the potential impact of the following covariates and derived covariates on metoprolol PK
Continuous variables bull Age (AGE years) bull Body weight (WT kg) bull Body surface area (BSA m2) calculated from WT and HT (cm) using the height
weight formula BSA=0024265 x WT 05378 x HT03964 bull Ideal body weight (IBW kg) calculated as - Males IBW=50+(HTndash150)25 and
for Females IBW=45+(HTndash150)25 bull Dose (DOSE mg of Toprol-XL)
Categorical variables bull Gender (SEX) - Male 0 - Female 1 bull Race (RACE) - Caucasian 0 - Black 1 - Asian 2 - Other 3
PK covariate effects were modeled as follows
Effects of continuous covariates (AGE WT BSA IBW and DOSE) were normalized to the corresponding median value across a dataset such that continuous covariates were related to structural PK parameters in a power function as described below
where Θ is the fixed-effect parameter of a covariate estimated by the NONMEM program covariate value is the observed covariate value and PK typical value is the typical value of the PK parameter estimated by NONMEM Effects of categorical covariates (SEX and RACE) are related to structural PK parameters by fractional changes of dummy variables
DCP1PM Page 66 10182006
Clinical Pharmacology Review NDA 19-962 Toprol-XL 10182006
Where Θ is the fixed-effect parameter of a covariate estimated by the NONMEM program covariate is the dummy variable value and modified in the control streams and PK typical value is the typical value of this PK parameter as estimated by NONMEM
Median values of all covariates in the dataset for population PK analysis are presented in Table A
Table A Summary of patient covariates and Toprol-XL doses in the data for population PK analysis
Two Steps were included in the modeling of covariates
Step 1 Forward Addition The covariates were subjected to a stepwise forward selection algorithm using a likelihood ratio test based on a change in MOF values from the base model A significant covariate reduced the MOF more than 660 (chi-square distribution plt001 degrees of freedom [df]=1)
Step 2 Backward deletion (Excluding procedures for covariate effect) The covariates in the full model acquired in Step 1 were subjected to a backward deletion algorithm 1 covariate was deleted at a time using a likelihood ratio test based on a change in MOF values A covariate was determined to be statistically significant if the change in MOF after its deletion from the breakdown model was increased by more than 1083 (chi-square distribution plt0001 df=1)
4116 PK Random Variance Models An exponential error model was used to characterize inter-patient variability based upon the assumption that random effects for PK parameters were not correlated among PK parameters No other error models for eta were evaluated by the applicant or by this Reviewer The retention of ETA values for each PK parameter in the structural model was confirmed by sequentially fixing each ETA value at zero and comparing each resultant MOF with the MOF obtained when all ETA values were retained in the model (see Table 6)
DCP1PM Page 67 10182006
Clinical Pharmacology Review NDA 19-962 Toprol-XL 10182006
The residual model was modeled by an additive model two error terms were used one for error associated with trough samples and the other with serial samples
Reviewer Note Use of an exponential model appears reasonable
Pharmacodynamics
4117 PKPD Structural Model The equations for the structural models are shown below
1 Metoprolol Ctrough The relationships between the observed metoprolol concentrations (Ctrough) and hemodynamic changes were investigated using 4 direct-link models namely a linear model a log-linear model and Hillrsquos sigmoid Emax PKPD model with and without a baseline
2 The relationships between Cmax or AUC0ndash24 and hemodynamic changes were investigated using 2 direct-link models a linear model and a log-linear model
4118 PKPD Covariate Model The inclusion and exclusion procedures of covariate effect on the selected PKPD base model to obtain a selected final PKPD model were identical to those in the covariate evaluation in the population PK models as described previously in PK Covariate Model DCP1PM Page 68 10182006
Clinical Pharmacology Review NDA 19-962 Toprol-XL 10182006
Table B Baseline demographic and covariate characteristics
4119 PKPD Random Variance Models An exponential error model was used by the applicant to model inter-individual variability The retention of a random effect parameter ETA in each selected PKPD structural model was then evaluated by sequentially fixing each ETA value at zero and comparing each resultant MOF with the MOF obtained when all ETA values were retained in the model (plt005) This step reduced over-parameterization by deleting unnecessary random-effect parameters from the structural model to obtain the base model
Reviewer Note The study design precludes assessment of inter-individual variability or random error because only one dose record was available per patient Consequently the model should not have included eta terms It is noted that the sponsor ultimately dropped the eta term in the final model
DCP1PM Page 69 10182006
Clinical Pharmacology Review NDA 19-962 Toprol-XL 10182006
Model Selection
PK Initial Model Selection
PK Base Model to Final Model The selection of the most appropriate PK base model for a metoprolol PK was based upon the following criteria a significant reduction in MOF as compared to the baseline model and asymptotic chi-square distribution based on the likelihood ratio test or AIC (plt005) as compared to the other structural models This selected PK base model was then subject to a covariate evaluation The population PK model bearing all surviving covariate parameters with statistical significance became the penultimate final model If 1 of the body size parameters (WT BSA and HT) was not in the model the penultimate final model became the final model If body size parameters were in the model they were sequentially replaced by other body size parameters in the regression submodel for each PK parameter The best body size parameter was then selected on the basis of lowest MOF to form the final model
PK Final Model Selection Simulations and visual inspections based on goodness of fit plots were used to qualify and validate the model The goodness-of-fit of the final model was evaluated graphically by comparing population and individual predictions of metoprolol concentrations with observed metoprolol concentrations along the line of unity and by visual inspection of the following plots of population-weighted residuals (WRES) for the final population model 1 Population-weighted residuals (WRES) versus population-predicted concentrations (PRED) 2 WRES versus time after first drug administration in each patient 3 WRES versus all covariates evaluated WRES were generally expected to be distributed homogenously around zero for PRED time after administration and covariates For those 27 patients with serial samples goodness-of-fit of the plasma concentration-time profile for each individual was visually inspected The linear relationship between their AUClast values from the observed data and those from the simulated data (final model) was examined
The predictive performance of the final population PK model including covariates was evaluated by comparing typical values of PK parameters with the mean of individual Bayesian estimates or individual values of PK parameters with the results from non-compartmental analysis for patients with serial samples Steady-state metoprolol plasma concentration-time profiles from 0ndash24 hours at the interval of 15 minutes (025 hour) were calculated using the post hoc Bayesian estimated PK parameter obtained for 65 patients included in the PKPD relationship using the following equation
DCP1PM Page 70 10182006
Clinical Pharmacology Review NDA 19-962 Toprol-XL 10182006
PKPD Initial and Final Model Selection A similar approach to that of PK model selection was adopted for PKPD Each of the above-mentioned PKPD models with random effects was identified by curve-fitting the dataset Initial selection of the PKPD structural model was based upon a significant reduction in MOF (plt005) as compared to the baseline model and reasonable PKPD parameter estimates Software
Nonlinear mixed-effect modeling (NONMEM) software (Version V level 11 Globomax Hanover MD) was used in the population PK analysis PK model fitting was accomplished using first-order (FO) approximation methods For PKPD model fitting the first-order conditional estimation (FOCE) with eta-epsilon interaction method in NONMEM was used for all model runs
SAS software (Version VIII Cary NC) was employed to prepare datasets according to the format required by the NONMEM program (Boeckmann et al 1991) Microsoftreg Excel 2000 (Redmond WA) and S-PLUS 2000 (Professional Release 2 MathSoft Inc Cambridge MA) were used to perform exploratory graphical exposure calculation and statistical analyses according to the format required by the NONMEM program (Boeckmann et al 1991) SAS command files logs and listings pertaining to data file conversion and merging were reviewed by an independent analyst Datasets were stored in SAS data frames combined and exported to Excel and then to ASCII files before fitting to the model
Datasets were prepared and pooled in a NONMEM-compliant format using SAS software by the Programming Group Clinical Information Sciences at AstraZeneca Wilmington Delaware SAS command files logs and listings pertaining to file conversion and merging were provided and found to be acceptable The contents of both datasets (toprolkatcsv for PK modeling and cppd2csv for PKPD modeling) were included
DCP1PM Page 71 10182006
Clinical Pharmacology Review NDA 19-962 Toprol-XL 10182006
toprolkatcsv was not provided electronically in a SAS format however this reviewer generated a similar dataset using the applicantrsquos criteria
Reviewer Comment The software and data assembly methods appeared adequate
DCP1PM Page 72 10182006
Clinical Pharmacology Review NDA 19-962 Toprol-XL 10182006
Results and Discussion Design Adequacy
Overall the trial designs appeared adequate to evaluate metoprolol population PK and PKPD in pediatric patients receiving Toprol XL However the design could have been further optimized by increasing the sampling points particularly in the absorption phase Due to the limited number of samples in the absorption phase it was not possible to accurately characterize the absorption model first order vs zero order or mixed first and zero order Additionally collection of mainly trough samples limits the ability to accurately estimate measures such as Cmax that are not directly related to Ctrough particularly if multiple compartments are present Consequently Cmax estimations are unlikely to be accurate Finally most patients provided only one trough sample thus inter-individual variability could not be adequately captured and may have limited the utility of the modeling exercise particularly in PKPD where the random effect could not be accurately characterized Ultimately there was no random variable in the final PKPD model (ie eta was set to zero) Data Integrity
This reviewer checked the data visually by randomly selecting data from patients included in the population modeling and comparing to data in the study report (source data) Overall the data integrity appeared acceptable The applicant observed the following guidelines that appeared acceptable No datum from any study participant with a protocol violation that was thought to materially impact the analysis was included The dataset contained data from only those study participants who could be evaluated ie with all the last dosing datetime blood sampling datetime plasma drug concentrations and demographic covariates
Data that were excluded (n = 62 samples) from the model were as follows One sample from an apparent poor metabolizer Two samples collected gt 96 hours post dose From 307B 10 trough samples lt LOQ From 307A 17 samples lt LOQ Thirty-samples from serial data that were lt LOQ or whole blood samples Model and Model Selection
Base Model
41110 Pharmacokinetic Model description The base PK model was a standard two compartment model that incorporated lag time and flip-flop kinetics The key features of the model were flip-flop was insured by making the value of ke gt ka in the clearance equation Additionally lag time was restricted to a value of 2 hours or less and concentrations were log transformed consequently all concentrations (F) = 0 were given individual predicted concentrations of zero Finally there were two residual error terms one for serial samples and the other for trough samples DCP1PM Page 73 10182006
Clinical Pharmacology Review NDA 19-962 Toprol-XL 10182006
Key equations were as follows
KA = THETA(1)EXP(ETA(1)) V2 = THETA(2)EXP(ETA(2)) CL = (THETA(1)THETA(2)+THETA(3))EXP(ETA(3)) Q = THETA(4)EXP(ETA(4)) V3 = THETA(5)EXP(ETA(5)) ALAG1=THETA(6)EXP(ETA(6))
41111 PK Parameter estimation results Table 1 Summary of PK parameters in the metoprolol population PK base model (per applicant)
41112 Goodness of fit The applicant provided the following goodness-of-fit plots (Figure 1)
Reviewer Note The goodness-of-fit plots were reproduced by this Reviewer (see Appendix) with minor modifications
Figure 1 Goodness of fit plots for Base Model
DCP1PM Page 74 10182006
Clinical Pharmacology Review NDA 19-962 Toprol-XL 10182006
Base PK Model Selection The MOF values of all structural model candidates tested are presented in Table 2 Model selection was based primarily on MOF values the lower MOF the better the model The applicant reports that in general MOF values generated by a conventional absorption model (ie absorption rate is faster than elimination rate) and a flip-flop absorption model (ie absorption rate is slower than elimination rate) were identical
Reviewer Comment The existence of flip-flop kinetics appears plausible based on data provided and general patterns for sustained release formulations Consequently the use of flip-flop kinetics for the bulk of the modeling exercise appears reasonable
General conclusions from the information in Table 2 are First order input is better than zero order input Two compartment model is better than one compartment model Lag time presence is better than lack of lag time Two residual error terms are better than one residual error term It should also be noted that several other models led to unsatisfactory completion of the run and were not considered further
DCP1PM Page 75 10182006
Clinical Pharmacology Review NDA 19-962 Toprol-XL 10182006
Table 2 Comparison of Structural PK Models
Reviewer Comment The selected structural model appears appropriate based on the data
Base Model The deletion of ETA for V2 did not change the MOF value suggesting that ETA for V2 should be deleted to avoid an over-parameterized warning (Table 3) This was consistent with the estimated parameter value of ETA for V2 being 648 x 10ndash9 a very small value Therefore the base model was selected by deleting the ETA for V2 from the structural model
Reviewer Comment on Eta deletion for V2 Deletion of eta for V2 is acceptable based on the empirical data however from a physiological perspective deletion of eta is problematic Generally one anticipates inter-individual differences in volume of distribution In this case it appears that the error associated with V2 may have been randomly shifted to V3 and or Q terms as the three DCP1PM Page 76 10182006
Clinical Pharmacology Review NDA 19-962 Toprol-XL 10182006
terms are interrelated This potential shift in error is supported by the fact that the V2 eta value increases significantly (by several orders of magnitude- 10-5 vs 100) when eta for Q and or V3 is fixed However when Q or V3 are fixed minimization is successful but Q and V3 are not accurately estimated Accounting for the possible error shift is a complex process and goes beyond the scope of this reviewer thus deletion of eta associated with V2 was considered acceptable for the remainder of the modeling evaluation
Table 3 Structural elements tested in the metoprolol population PK structural model (p lt 0005)
Final PK Model
41113 Model description The key feature of the final model is the inclusion of the covariate effects of age on Q and weight on CL in the population PK model
Key Equations CL = (THETA(1)THETA(2)+THETA(3)+EWT)EXP(ETA(2)) Q = THETA(4)EAGEEXP(ETA(3))
Including Covariate Effects As previously described covariate effects were assessed by forward addition and backward deletion Most covariates did not significantly change MOF however BSA significantly affected CL and Age affected Q Consequently these covariates were included in the penultimate final model
DCP1PM Page 77 10182006
Clinical Pharmacology Review NDA 19-962 Toprol-XL 10182006
Reviewer Note BSA is derived form WT and HT covariates implying BSA is highly correlated to these two covariates (Figure 2) weight is the most suitable (practical covariate) as it is readily measured Furthermore weight and BSA produced the same MOF (Table 4) whereas MOF with height was more positive (less significant)
Figure 2 Plot of BSA vs Body Weight
The data in Table 4 support selection of the final model
Table 4 Covariate elements tested in the metoprolol population PK penultimate final model (plt0005)
The applicant acknowledges that mechanism(s) accounting for the impact of age on QF are not clear However since distribution clearance has little effect on metoprolol plasma exposure further investigation is not needed
41114 PK Parameter estimation results As shown in Table 5 PK parameters were estimated fairly precisely by the final model
Table 5 PK Parameter Estimates using Final Model
DCP1PM Page 78 10182006
Clinical Pharmacology Review NDA 19-962 Toprol-XL 10182006
41115 Goodness of fit The goodness-of-fit plots provided by the applicant show good precision Figure 5 Goodness of fit plots for final PK model
DCP1PM Page 79 10182006
Clinical Pharmacology Review NDA 19-962 Toprol-XL 10182006
PK Model Qualification The post hoc Bayesian-estimated AUC (simulated) obtained for the 27 patients with serial plasma samples are plotted against the observed (AUCt) The correlation was high (R2 gt 099) Figure 6 AUClast from observed data versus AUCt from model simulation in the 27 patients providing serial plasma samples
Regression line Y= 4514 + 08976 X R2 = 09957
The graphical validation of the final metoprolol population PK model validation against covariates evaluated is presented in Figure 6
Figure 7 Graphical validation of covariates
DCP1PM Page 80 10182006
Clinical Pharmacology Review NDA 19-962 Toprol-XL 10182006
There was no systematic bias in weighted residuals for any covariates evaluated suggesting that the final model included all appreciable effects of available covariates (Figure)
The effects of weight on metoprolol CLF are illustrated in Figure 8 where Bayesian post hoc estimates of CLF are plotted against weight and overlaid by the model-predicted line Overall the model appeared to fit the data well
Figure 8 Plot of CLF vs Body weight
The effects of AGE on metoprolol QF are illustrated in Figure 9 where Bayesian post hoc estimates of QF are plotted against AGE and overlaid by the model-predicted line Figure 9 Plot of QF vs Age
DCP1PM Page 81 10182006
Clinical Pharmacology Review NDA 19-962 Toprol-XL 10182006
Reviewer Note The applicant indicated that attempts to run the final model using the first-order conditional estimation method resulted in termination errors Therefore the parameter estimates obtained by the FO method were reported as the final parameter estimates
Conclusion Regarding Population PK Modeling Overall the sponsorrsquos population PK modeling is acceptable
PKPD Model and Model Selection
PKPD Base Model PharmacokineticPharmacodynamic Model description The key feature of the model was a lack of random variance term for the slope (since only single data points were available per subject) and inclusion of baseline effect
Key equations were as follows E0 = THETA(1)EXP(ETA(1)) M = THETA(2) Y = E0 + MLOG(AUC) + EPS(1)
The control stream provided in the appendix is that for DBP (provided by sponsor) The control stream for SBP is comparable with appropriate substitution for BP type
It should be noted that only the log-linear and linear PKPD models were considered suitable for AUC and Cmax For this review only AUC estimates were considered reliable as Cmax estimates could not be accurately determined based on the sampling scheme Consequently the remainder of this review focuses on AUC information although Ctrough and Cmax data are displayed for reference
Bayesian estimates from PK modeling are summarized in Table 1
Table 1 Bayesian estimates of metoprolol PK exposure for those patients included in the PKPD analysis (N=65)
DCP1PM Page 82 10182006
Clinical Pharmacology Review NDA 19-962 Toprol-XL 10182006
PKPD Model Selection (initial and final) The log-linear model was adopted as the base model for this PKPD relationship since it improved the MOF significantly (Table 2) The ETA parameter for the slope was pre-eliminated for the purpose of model parsimony The intercept and slope in this log-linear model for AUC(0-24) did not bear ETA parameter therefore no covariates had impact on either parameter in the model
Reviewer Note The intercept should not have borne an eta term because individual subjects provided only one data point Consequently fixing eta to zero or deleting eta in the final model is appropriate No further model development was required after eta was eliminated and the base model was equivalent to the final model
Table 2 Base population PKPD models tested for the change in SBP
41116 PKPD Parameter estimation results The final PKPD parameter estimates are presented in Table 3
Table 3 Summary parameters in the final PKPD model for the change in SBP using trough plasma level Parameter Explanation Estimate SE ()b
DCP1PM Page 83 10182006
Clinical Pharmacology Review NDA 19-962 Toprol-XL 10182006
Model Qualification Based on the relatively low R2 value and as shown in Figure there is a poor correlation between change in SBP and log AUC
Figure 1 Relationship between change in SBP and AUC (line generated from modeling)
Overall goodness-of-fit of the model was considered to be poor probably due to the high variability in the measurements Consequently the precision of the model parameter estimates was not considered to be very reliable These parameters have little clinical usefulness and can be treated only as an indication of trends ie more hemodynamic effects can be potentially achieved when high Toprol-XL doses are given Clinical dose adjustment based on these PKPD parameters is not recommended
Reviewerrsquos Supplemental Analyses A supplemental PKPD analyses was conducted using simple linear regression since the population model did not improve the fit Overall eta made an insignificant contribution to the overall model The results of the analyses were similar to the population analyses A series of regression analyses were conducted and are presented in Table 4
The applicant notes that the preliminary modeling exercise found that there was no difference in the PKPD modeling results using different hemodynamic data formats (ie change in the measurements percent change in the measurements or actual BP measurements) This finding was confirmed by this reviewer (see Table 4)
DCP1PM Page 84 10182006
Clinical Pharmacology Review NDA 19-962 Toprol-XL 10182006
Table 4 Supplemental PKPD Regression Analyses Conducted by Reviewer Model (liner regression) Intercept (I) Slope (m) R2 Probability RSBP = mISBP + I 3957 -035 01626 0009 PSBP = mISBP + I 2524 -023 01252 00038 PSBP = mRSBP + I 0005 074 09891 lt 00001 RSBP = mlogAUC + I 651 -221 0060 00493 RSBP = mDose + I -751 0006 00026 06878 RSBP = mDose^ + I -312 -111 004 02711 RSBP = mlogAUC + nISBP + I 5303 -221 (m)
-035 (n) 02230 0001
RSBPplc = mAUC + I -667 -0003 00458 00871 RSBPplc = mlogAUC + I 461 -2208 00600 00493 RPUL = mlogAUC + I 1868 -405 01102 00069 Symbols in table similar to population PK model without eta term RSBP- change of SBP without placebo correction ISBP- initial (baseline) SBP RPUL- change in HR without placebo correction Dose- in mg where placebo is included as 0 mg PSBP- percentage change of SBP without placebo correction
Conclusion Regarding Population PKPD Modeling Overall the sponsorrsquos population PKPD modeling is acceptable No dose adjustment conclusion can be made from this modeling however an exposure-response relationship was established for AUC and reduction in SBP
Discussion
The significance of the results 1 Provide estimates of PK measures and plasma exposure in pediatric population These data can be compared to adult exposure to determine if exposure differences impact drug effectiveness The main challenge in comparing pediatric data to adult data is different modeling schemes formulations and methods were used in the two populations
2 PKPD findings are not sufficiently precise to provide a dose adjustment algorithm however the PKPD analyses provides rationale for proposed titration as increasing exposure (doses) may improve efficacy (reduction in SBP) Ultimately the risk-benefit analyses overrides PKPD assessment for dose adjustment drug will be titrated thus reliance on PKPD information is not critical The proposed dose 10 mgkg appears suitable based on available information It is unclear from the studies if there should be an initial maximum dose although the sponsor has proposed 50 mg as the maximum initial dose The proposed pediatric starting dose on a mgkg basis is within the range of starting adult doses (25 ndash 100 mg) assuming an adult weighs 70 kg
3 Cumulative information form dose-response study indicates that Toprol XL has effectiveness in children however the most effective dose is unclear Since the drug can be titrated determining the initial optimal dose does not appear critical As proposed by the applicant dosing is started at a ldquolowrdquo dose that can be up-titrated if needed
DCP1PM Page 85 10182006
Clinical Pharmacology Review NDA 19-962 Toprol-XL 10182006
4 The results did not adequately address the potential impact of CYP2D6 metabolic status for pediatric patients taking Toprol XL There were an insufficient number of patients to make this assessment
5 Covariate effects do not appear significant only body weight significantly affects clearance However a worst case scenario can occur with a person that has a low body weight and is a poor metabolizer this will result in very high possibly supra-therapeutic exposure Age does not impact apparent oral clearance so an age-dependent dose adjustment is not needed for children over 6 years old In essence all children over six years old can initiate therapy at 10 mgkg
The validity of the results Overall the results produced by the sponsor appear valid and the sponsor used a sound modeling approach However alternative approaches that could have been adopted may have improved the outcome of the analyses Three of these approaches are presented below 1 Additional PK samples should have been collected during the absorption phase and
throughout the dosing interval to improve the modelrsquos performance Specifically additional samples collected during the absorption phase may have unambiguously identified the actual absorption input function (eg first order zero order mixed first and zero order) First order input was selected for the analyses although the dosage form is reported to exhibit zero order kinetics in adults It is possible that the input rate in children differs from that in adults but unlikely It should be noted that absorption kinetics in children is often erratic due to multiple factors (eg regioshyselective absorption incomplete gastric emptying and inconsistent absorption) so it is unclear if additional samples would have definitively identified the absorption function However additional non-trough samples may have helped in estimating key PK measures such as V and Cmax The final model did not have an eta associated with V which is atypical Collection of additional samples on different visits may have helped estimate potential inter-occasion variability It should be noted that AUC was estimated precisely for subjects providing serial samples but these subjects were not necessarily included in the PKPD analyses Ideally the PKPD modeling should have been conducted primarily in subjects who had accurate PK measures
2 The PKPD design could have been modified to potentially improve the utility of the analyses Specifically there should have been better placebo matching procedures to minimize the potential impact of the placebo effect This matching could have been improved by ensuring all patients on placebo had the same titration schedule and number of tablets It is noted that the model had a poor predictive performance that was mainly attributed to the high degree of variability in the PD measures Potentially other PD markers could have been explored that have less inherent variability One such marker is the degree of beta blockade using exercise heart rate (EHR) reduction this marker has been used extensively for metoprolol in adult subjects However use of EHR in the pediatric setting may be challenging
DCP1PM Page 86 10182006
Clinical Pharmacology Review NDA 19-962 Toprol-XL 10182006
Comments to sponsor
In future pharmacometric studies you should consider the following 1 collect sufficient (multiple) samples from individual subjects to allow assessment
of inter-occasion variability and estimation of inter-individual variability (eta) for all relevant parameters
2 placebo groups should be identically matched across all dose groups (eg same titration schedule and number tablets) to minimize potential bias or differences in the placebo effect
Comments to medical reviewer
1 The sponsor has adequately characterized metoprolol PK in the studied pediatric population The PK characterization could have been further optimized by obtaining additional samples over the entire dosing interval (eg during the absorption phase and elimination phase) on multiple occasions rather than on one occasion primarily at trough
2 A dose-response relationship could not be established using the protocol specified analysis approach The outcome of the dose-response relationship appeared highly dependent on the ldquoplacebo effectrdquo suggesting that the placebo group may not have been appropriate One should consider re-evaluating the dose-response precisely matched placebo groups (eg all placebo patients have identical number of tablets and titration schedule)
3 Based on the PKPD analysis plasma exposure (AUC) explains lt 10 of the response (reduction in systolic blood pressure) thus has limited clinical utility However the PKPD relationship suggests that there is a trend for increased response with increased exposure (dose driven)
4 Overall information from the dose-response study suggests that Toprol- XL is effective in the pediatric population The optimal initial dose 02 10 or 20 mgkg or the maximum safe and effective dose cannot be determined from the information provided It is noted that the 02 mgkg dose is unlikely to be effective as plasma concentrations achieved at this dose are unlikely to be effective (most concentrations lt LOQ and lower than effective adult concentrations) The 10 mgkg (proposed by applicant) appears to be a reasonable initial dose The labeling should reflect the regimens studied
DCP1PM Page 89 10182006
Clinical Pharmacology Review NDA 19-962 Toprol-XL 10182006
Appendix
DCP1PM Page 90 10182006
Clinical Pharmacology Review NDA 19-962 Toprol-XL 10182006
DCP1PM Page 91 10182006
Clinical Pharmacology Review NDA 19-962 Toprol-XL 10182006
DCP1PM Page 92 10182006
Clinical Pharmacology Review NDA 19-962 Toprol-XL 10182006
DCP1PM Page 93 10182006
Clinical Pharmacology Review NDA 19-962 Toprol-XL 10182006
DCP1PM Page 94 10182006
Clinical Pharmacology Review NDA 19-962 Toprol-XL 10182006
DCP1PM Page 95 10182006
Clinical Pharmacology Review NDA 19-962 Toprol-XL 10182006
Table 15 Control streams for final log-linear PKPD model for the change in DBP using metoprolol Cmax as the measure of exposure
Truncated NONMEM reports for base model identification for PKPD relationship in change of SBP (per sponsor)
DCP1PM Page 96 10182006
Clinical Pharmacology Review NDA 19-962 Toprol-XL 10182006
Reported PD information^
^ Under metoprolol regimen CRZ0K is Toprol XL
DCP1PM Page 97 10182006
Clinical Pharmacology Review NDA 19-962 Toprol-XL 10182006
Table Results of randomised double-blind comparative trials evaluating antihypertensive efficacy of metoprolol formulations or other antihypertensives
DCP1PM Page 98 10182006
---------------------------------------------------------------------------------------------------------------------
---------------------------------------------------------------------------------------------------------------------
---------------------
This is a representation of an electronic record that was signed electronically and this page is the manifestation of the electronic signature
s
Robert Kumi 10182006 045635 PM BIOPHARMACEUTICS
Patrick Marroum 10192006 050811 PM BIOPHARMACEUTICS
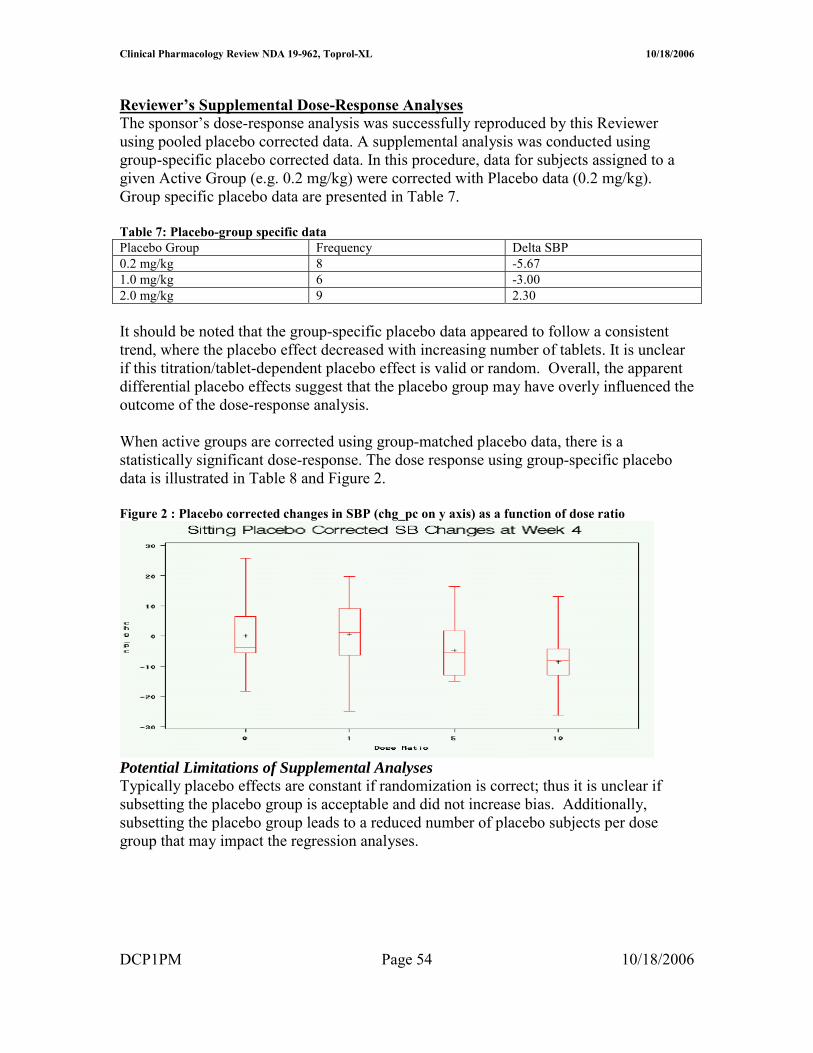
Clinical Pharmacology Review NDA 19-962 Toprol-XL 10182006
Table 9 SAS output for regression analyses for DBP with pooled placebo correction
Treatment group effects and pairwise comparisons for sitting SBP and DBP Results of the treatment group effects at the Week 4LOCF visit and the pairwise comparisons between each TOPROL-XL group and placebo for the change from baseline in sitting SBP and DBP are shown for the ITT population in Table 10
Table 10 Treatment group effects for change in baseline to Week 4LOCF for sitting SBP and DBP (ITT population)
Some key findings from the pair-wise comparison are as follows (Table 10) 1 All active groups produced statistically significant reductions from baseline in sitting
SBP and DBP at the Week 4LOCF visit whereas placebo did not
DCP1PM Page 56 10182006
Clinical Pharmacology Review NDA 19-962 Toprol-XL 10182006
2 Overall the mean change from baseline in sitting SBP at Week 4LOCF for the TOPROL-XL groups pooled was statistically significantly larger than that for the placebo group (p=00351)
3 Results of pairwise comparisons between individual TOPROL-XL dose groups and placebo also revealed a statistically significant difference for the 10 and 20 mgkg groups (p=00270 and p=00492 respectively)
bull Mean changes over time in sitting SBP and DBP Consistent with findings from other studies with beta-blockers apparent maximal reduction in blood pressure occurred between 1 and 4 weeks of treatment
Figure 4 Mean changes over time for sitting SBP and DBP (ITT population)
Data points in plot are from absolute values (not taking baseline into account)
Subgroup Analyses The sponsor conducted several exploratory subgroup analyses however these analyses were not reviewed critically and are not presented in this review as
1 they do no impact the primary outcome or study objective 2 they are unlikely to be clinically useful due to the small number of patients per
subgroup One potentially useful some group analyses involved the percentage of responders as defined in Table 11
The responder analyses shows comparable response rates for all active dose groups suggesting similar efficacy across dose groups despite different exposure (doses)
DCP1PM Page 57 10182006
Clinical Pharmacology Review NDA 19-962 Toprol-XL 10182006
Table 11 Number and proportion of responders (ITT population)
Pharmacokinetic Results The Ctrough information obtained in the trial are summarized in Figure 6 and Tables 12 and 13
Table 12 Summary of Ctrough data (per applicant)
Sixteen patients across the 3 TOPROL-XL groups did not have blood samples obtained for analysis of metoprolol concentrations Based on the number of samples BLQ there appeared to be very low concentrations in the lowest dose group It appeared that Ctrough increased with dose According to the applicant these values are similar to those obtained previously in adults especially at the 2 higher doses Variability was high in all treatment groups (CV gt 60 )
Table 12 Summary of Ctrough (Reviewer Generated) from all patients (samples lt LOQ given value = 0) Toprol XL Dose Number of subjects Concentration (ngmL) (mgkg) Mean plusmn SD Median Range 02 39 137 plusmn 294 000 0 ndash 157 10 17 1224 plusmn 1416 845 0 ndash 571 20 46 2462 plusmn 3352 1140 0 ndash 1670
DCP1PM Page 58 10182006
Clinical Pharmacology Review NDA 19-962 Toprol-XL 10182006
Reviewer Note Overall the plasma concentrations (exposure) for the 02 mgkg dose group appear too low to be effective (close to LOQ) It is noted that adults typically have concentrations gt LOQ at the lowest therapeutic dose 25 mg (~ 4 ngmL)
Figure 6 Boxplot of metoprolol Ctrough using samples gt LLQ (per applicant)
Safety Results According to the applicant Toprol XL was well tolerated in the pediatric population as tabulated below
Main Analyses Conclusions bull No dose response was observed for corrected SBP using pooled placebo data
however using group-matched placebo data demonstrated a dose response bull Ctrough increased with dose bull Toprol 10 and 20 mg kg doses were more effective than placebo in reducing
SBP bull The responder rate was comparable across all active dose groups and this rate was
greater than that of placebo
DCP1PM Page 59 10182006
Clinical Pharmacology Review NDA 19-962 Toprol-XL 10182006
Methods Reviewerrsquos Methods Generally this reviewer conducted the analyses in a manner similar to that of the sponsor to confirm the sponsorrsquos findings
Sponsorrsquos Methods
Design Study1 307A
Reviewer Note This study was described in the Dose-Response Assessment (please refer to Page 7 Dose Response Analyses) Consequently only highlights relevant to the population analyses will be included in this section
Study 307A was a 4-week multi-center double-blind placebo-controlled randomized parallel-group study TOPROL-XL (metoprolol succinate) extended-release tablets were given to hypertensive pediatric patients Patients were randomized to double-treatment with a once daily oral dose of placebo or Toprol-XL at 1 of 3 target doses 02 or 20 mgkg The dose range for this study was 125 to 200 mg daily Patients on placebo followed the same schedule as that for their active group comparators
Study Flow Chart
Key Inclusion Criteria School age and adolescent children with reproducible SBP or DBP at or above the 95th percentile using height-adjusted charts for age and weight were eligible
DCP1PM Page 60 10182006
Clinical Pharmacology Review NDA 19-962 Toprol-XL 10182006
Study2 307B
Study 307B was a 52-week multi-center open-label study to determine the safety and pharmacokinetics of TOPROL-XL (metoprolol succinate) extended-release tablets (metoprolol CRXL) in hypertensive pediatric patients The starting dose was 25 mg daily The dose was increased every 2 weeks in increments of 25 mg or 50 mg based on tolerability until BP was controlled or the dose reached 200 mg
Table 1 Study Assessments
At the end of the 52-treatment period all patients had BP measured and a trough plasma level taken 24 hours the last dose of Toprol-XL with the exception of those patients who completed the serial portion at the final visit Among the participants a subgroup of approximately 30 patients was to participate in PK assessments of metoprolol requiring serial blood sampling at any time during the 52 weeks A single dose of 25 mg of Toprol-XL was given orally to those participating patients after a 48-hour washout period After the PK assessments they returned to the main study protocol Data
Study1 307A
4111 Pharmacokinetics A blood sample was to be collected at Visit 7 into a heparinized Vacutainer tube and obtained at 24 hours (plusmn2 hour) following the last dose of study medication (ie trough measurement) for determination of plasma metoprolol concentrations
Study Disposition Chart
DCP1PM Page 61 10182006
Clinical Pharmacology Review NDA 19-962 Toprol-XL 10182006
Table 2 Study Demographics
4112 Pharmacodynamics Primary variable
Sitting SBP determined at trough (24plusmn4 hours Visit 7) served as the primary efficacy assessment The primary measure of effect was the placebo-corrected change from baseline to the end of treatment (Week 4) in trough sitting SBP Each BP determination represented the mean of 3 readings with less than 7 mmHg between the highest and lowest value Blood pressure was measured using a mercury sphygmomanometer with an appropriate size cuff positioned approximately at the level of the heart Every effort was made to have the same individual measure the patientrsquos BP throughout the study if possible At all post randomization visits BP measurements were to be made at trough defined as 24 hours (plusmn4 hours) after receiving study medication All measurements were to be determined prior to the patient taking the scheduled dose of study medication In the
DCP1PM Page 62 10182006
Clinical Pharmacology Review NDA 19-962 Toprol-XL 10182006
event that the patient accidentally took study medication on the day of the scheduled visit the visit was to be rescheduled within 24 to 48 hours
Study2 307B
4113 Pharmacokinetics A 48-hour washout period prior to sampling was required for all patients including patients who entered the 52-week study and then decided to participate in the serial PK portion of the study All patients were to have a 15-mL blood sample collected into a heparinized Vacutainer tube 24 hours (plusmn2 hour) following the last dose of TOPROL-XL (ie trough measurement) at Visit 18 (or a the time of premature discontinuation) except for patients who participated in the serial PK portion of the study and had blood sampling performed at Visit 18 For patients participating in the serial PK portion of the study blood samples (15 mL) were to be collected into heparinized Vacutainer tubes and obtained at Hour 0 (predose) and at 1 2 3 4 6 8 10 and 24 hours after administration of a single 25 mg dose of TOPROL-XL following a 48-hour washout period After the last blood sample was obtained the patient was to startresume the prescribed dose of TOPROL-XL heshe was receiving prior to PK sampling
Patient Disposition Chart (completion or discontinuation)
Overall a total of 31 patients at 8 centers were enrolled in the serial PK portion of the study Of these 31 patients 27 had plasma concentration data available and were included in the analyses Four patients were excluded from the analyses because their plasma concentrations were not quantifiable (Nos 047-009 and 047-021) or because only whole blood samples were analyzed (Nos 005-002 005-003)
DCP1PM Page 63 10182006
Clinical Pharmacology Review NDA 19-962 Toprol-XL 10182006
Table 3 Subject Demographics for Patients Providing Serial Blood Samples
Missing Data Twenty-six patients did not have blood samples obtained for analysis of metoprolol concentrations in either the 16-week (n=7) or 52-week (n=19) studies Among patients with plasma samples 14 (14) in the 52-week study and 13 (13) in the 16-week study had trough plasma metoprolol concentrations that were below the LLQ Therefore data from a total of 99 patients were included in this analysis
Assay Metoprolol plasma levels were assayed using high-performance liquid chromatography tandem mass spectrometric detection methods having limit of quantitation (LOQ) of 1 ngmL The method was validated in the linear range 1 to 1000 ngmL Precision was less than or equal to 109 Accuracy ranged from 940 to 1013 Pharmacodynamics Not applicable
Data Checking SAS was used to format and check data Additionally visual inspection of several randomly selected subject data was carried out
DCP1PM Page 64 10182006
Clinical Pharmacology Review NDA 19-962 Toprol-XL 10182006
Models
Overview The sponsorrsquos stated assumptions underlying this modeling analysis are
1 Rich sampling data collected from 30 subjects in 307B Study can be used to adequately characterize the structural pharmacokinetic model of metoprolol
2 Structural pharmacokinetic models of metoprolol at other dose strength are identical to that at 25 mg
3 Metoprolol exhibits a linear pharmacokinetics in the dose ranges studied 4 Steady-state pharmacokinetics of metoprolol has been reached at the time of blood
sampling in Study 307A 5 Metoprolol accounts for the blood pressure effect in the study 6 Existing various disease states in the patients have no impact on the pharmacokinetics
of metoprolol and pharmacodynamics of the blood pressure reduction in the study 7 Concomitant medications if existed do not have any effects on the pharmacokinetics
of metoprolol and pharmacodynamics of the blood pressure reduction in the study
Reviewer Comment The sponsorrsquos assumptions appear reasonable based on existing metoprolol PKPD information
Pharmacokinetics
4114 PK Structural Model Several PK models were tested to identify the structural model Flip-flop absorption was taken into consideration based on general PK characteristics following administration of sustained release tablets and observed data in the current study (serial PK samples)
The models tested included linear 1- and 2-compartment PK models with the following characteristics (focused on flip-flop models)
bull first-order absorption with and without absorption lag time (NONMEM subroutines ADVAN2 and ADVAN4)
bull zero-order absorption with and without absorption lag time (NONMEM subroutines ADVAN1 and ADVAN3)
bull simultaneous zero- and first-order absorption from the absorption compartment The models were parameterized in terms of CLF and VF
Ultimately the 2-compartment model with first order flip-flop absorption an absorption lag time and 2 residual error terms was selected as the structural model of metoprolol The model scheme is presented in the following Figure 1 Figure 1 PK Compartmental Model
DCP1PM Page 65 10182006
Clinical Pharmacology Review NDA 19-962 Toprol-XL 10182006
4115 PK Covariate Model Covariate models were developed to account for the potential impact of the following covariates and derived covariates on metoprolol PK
Continuous variables bull Age (AGE years) bull Body weight (WT kg) bull Body surface area (BSA m2) calculated from WT and HT (cm) using the height
weight formula BSA=0024265 x WT 05378 x HT03964 bull Ideal body weight (IBW kg) calculated as - Males IBW=50+(HTndash150)25 and
for Females IBW=45+(HTndash150)25 bull Dose (DOSE mg of Toprol-XL)
Categorical variables bull Gender (SEX) - Male 0 - Female 1 bull Race (RACE) - Caucasian 0 - Black 1 - Asian 2 - Other 3
PK covariate effects were modeled as follows
Effects of continuous covariates (AGE WT BSA IBW and DOSE) were normalized to the corresponding median value across a dataset such that continuous covariates were related to structural PK parameters in a power function as described below
where Θ is the fixed-effect parameter of a covariate estimated by the NONMEM program covariate value is the observed covariate value and PK typical value is the typical value of the PK parameter estimated by NONMEM Effects of categorical covariates (SEX and RACE) are related to structural PK parameters by fractional changes of dummy variables
DCP1PM Page 66 10182006
Clinical Pharmacology Review NDA 19-962 Toprol-XL 10182006
Where Θ is the fixed-effect parameter of a covariate estimated by the NONMEM program covariate is the dummy variable value and modified in the control streams and PK typical value is the typical value of this PK parameter as estimated by NONMEM
Median values of all covariates in the dataset for population PK analysis are presented in Table A
Table A Summary of patient covariates and Toprol-XL doses in the data for population PK analysis
Two Steps were included in the modeling of covariates
Step 1 Forward Addition The covariates were subjected to a stepwise forward selection algorithm using a likelihood ratio test based on a change in MOF values from the base model A significant covariate reduced the MOF more than 660 (chi-square distribution plt001 degrees of freedom [df]=1)
Step 2 Backward deletion (Excluding procedures for covariate effect) The covariates in the full model acquired in Step 1 were subjected to a backward deletion algorithm 1 covariate was deleted at a time using a likelihood ratio test based on a change in MOF values A covariate was determined to be statistically significant if the change in MOF after its deletion from the breakdown model was increased by more than 1083 (chi-square distribution plt0001 df=1)
4116 PK Random Variance Models An exponential error model was used to characterize inter-patient variability based upon the assumption that random effects for PK parameters were not correlated among PK parameters No other error models for eta were evaluated by the applicant or by this Reviewer The retention of ETA values for each PK parameter in the structural model was confirmed by sequentially fixing each ETA value at zero and comparing each resultant MOF with the MOF obtained when all ETA values were retained in the model (see Table 6)
DCP1PM Page 67 10182006
Clinical Pharmacology Review NDA 19-962 Toprol-XL 10182006
The residual model was modeled by an additive model two error terms were used one for error associated with trough samples and the other with serial samples
Reviewer Note Use of an exponential model appears reasonable
Pharmacodynamics
4117 PKPD Structural Model The equations for the structural models are shown below
1 Metoprolol Ctrough The relationships between the observed metoprolol concentrations (Ctrough) and hemodynamic changes were investigated using 4 direct-link models namely a linear model a log-linear model and Hillrsquos sigmoid Emax PKPD model with and without a baseline
2 The relationships between Cmax or AUC0ndash24 and hemodynamic changes were investigated using 2 direct-link models a linear model and a log-linear model
4118 PKPD Covariate Model The inclusion and exclusion procedures of covariate effect on the selected PKPD base model to obtain a selected final PKPD model were identical to those in the covariate evaluation in the population PK models as described previously in PK Covariate Model DCP1PM Page 68 10182006
Clinical Pharmacology Review NDA 19-962 Toprol-XL 10182006
Table B Baseline demographic and covariate characteristics
4119 PKPD Random Variance Models An exponential error model was used by the applicant to model inter-individual variability The retention of a random effect parameter ETA in each selected PKPD structural model was then evaluated by sequentially fixing each ETA value at zero and comparing each resultant MOF with the MOF obtained when all ETA values were retained in the model (plt005) This step reduced over-parameterization by deleting unnecessary random-effect parameters from the structural model to obtain the base model
Reviewer Note The study design precludes assessment of inter-individual variability or random error because only one dose record was available per patient Consequently the model should not have included eta terms It is noted that the sponsor ultimately dropped the eta term in the final model
DCP1PM Page 69 10182006
Clinical Pharmacology Review NDA 19-962 Toprol-XL 10182006
Model Selection
PK Initial Model Selection
PK Base Model to Final Model The selection of the most appropriate PK base model for a metoprolol PK was based upon the following criteria a significant reduction in MOF as compared to the baseline model and asymptotic chi-square distribution based on the likelihood ratio test or AIC (plt005) as compared to the other structural models This selected PK base model was then subject to a covariate evaluation The population PK model bearing all surviving covariate parameters with statistical significance became the penultimate final model If 1 of the body size parameters (WT BSA and HT) was not in the model the penultimate final model became the final model If body size parameters were in the model they were sequentially replaced by other body size parameters in the regression submodel for each PK parameter The best body size parameter was then selected on the basis of lowest MOF to form the final model
PK Final Model Selection Simulations and visual inspections based on goodness of fit plots were used to qualify and validate the model The goodness-of-fit of the final model was evaluated graphically by comparing population and individual predictions of metoprolol concentrations with observed metoprolol concentrations along the line of unity and by visual inspection of the following plots of population-weighted residuals (WRES) for the final population model 1 Population-weighted residuals (WRES) versus population-predicted concentrations (PRED) 2 WRES versus time after first drug administration in each patient 3 WRES versus all covariates evaluated WRES were generally expected to be distributed homogenously around zero for PRED time after administration and covariates For those 27 patients with serial samples goodness-of-fit of the plasma concentration-time profile for each individual was visually inspected The linear relationship between their AUClast values from the observed data and those from the simulated data (final model) was examined
The predictive performance of the final population PK model including covariates was evaluated by comparing typical values of PK parameters with the mean of individual Bayesian estimates or individual values of PK parameters with the results from non-compartmental analysis for patients with serial samples Steady-state metoprolol plasma concentration-time profiles from 0ndash24 hours at the interval of 15 minutes (025 hour) were calculated using the post hoc Bayesian estimated PK parameter obtained for 65 patients included in the PKPD relationship using the following equation
DCP1PM Page 70 10182006
Clinical Pharmacology Review NDA 19-962 Toprol-XL 10182006
PKPD Initial and Final Model Selection A similar approach to that of PK model selection was adopted for PKPD Each of the above-mentioned PKPD models with random effects was identified by curve-fitting the dataset Initial selection of the PKPD structural model was based upon a significant reduction in MOF (plt005) as compared to the baseline model and reasonable PKPD parameter estimates Software
Nonlinear mixed-effect modeling (NONMEM) software (Version V level 11 Globomax Hanover MD) was used in the population PK analysis PK model fitting was accomplished using first-order (FO) approximation methods For PKPD model fitting the first-order conditional estimation (FOCE) with eta-epsilon interaction method in NONMEM was used for all model runs
SAS software (Version VIII Cary NC) was employed to prepare datasets according to the format required by the NONMEM program (Boeckmann et al 1991) Microsoftreg Excel 2000 (Redmond WA) and S-PLUS 2000 (Professional Release 2 MathSoft Inc Cambridge MA) were used to perform exploratory graphical exposure calculation and statistical analyses according to the format required by the NONMEM program (Boeckmann et al 1991) SAS command files logs and listings pertaining to data file conversion and merging were reviewed by an independent analyst Datasets were stored in SAS data frames combined and exported to Excel and then to ASCII files before fitting to the model
Datasets were prepared and pooled in a NONMEM-compliant format using SAS software by the Programming Group Clinical Information Sciences at AstraZeneca Wilmington Delaware SAS command files logs and listings pertaining to file conversion and merging were provided and found to be acceptable The contents of both datasets (toprolkatcsv for PK modeling and cppd2csv for PKPD modeling) were included
DCP1PM Page 71 10182006
Clinical Pharmacology Review NDA 19-962 Toprol-XL 10182006
toprolkatcsv was not provided electronically in a SAS format however this reviewer generated a similar dataset using the applicantrsquos criteria
Reviewer Comment The software and data assembly methods appeared adequate
DCP1PM Page 72 10182006
Clinical Pharmacology Review NDA 19-962 Toprol-XL 10182006
Results and Discussion Design Adequacy
Overall the trial designs appeared adequate to evaluate metoprolol population PK and PKPD in pediatric patients receiving Toprol XL However the design could have been further optimized by increasing the sampling points particularly in the absorption phase Due to the limited number of samples in the absorption phase it was not possible to accurately characterize the absorption model first order vs zero order or mixed first and zero order Additionally collection of mainly trough samples limits the ability to accurately estimate measures such as Cmax that are not directly related to Ctrough particularly if multiple compartments are present Consequently Cmax estimations are unlikely to be accurate Finally most patients provided only one trough sample thus inter-individual variability could not be adequately captured and may have limited the utility of the modeling exercise particularly in PKPD where the random effect could not be accurately characterized Ultimately there was no random variable in the final PKPD model (ie eta was set to zero) Data Integrity
This reviewer checked the data visually by randomly selecting data from patients included in the population modeling and comparing to data in the study report (source data) Overall the data integrity appeared acceptable The applicant observed the following guidelines that appeared acceptable No datum from any study participant with a protocol violation that was thought to materially impact the analysis was included The dataset contained data from only those study participants who could be evaluated ie with all the last dosing datetime blood sampling datetime plasma drug concentrations and demographic covariates
Data that were excluded (n = 62 samples) from the model were as follows One sample from an apparent poor metabolizer Two samples collected gt 96 hours post dose From 307B 10 trough samples lt LOQ From 307A 17 samples lt LOQ Thirty-samples from serial data that were lt LOQ or whole blood samples Model and Model Selection
Base Model
41110 Pharmacokinetic Model description The base PK model was a standard two compartment model that incorporated lag time and flip-flop kinetics The key features of the model were flip-flop was insured by making the value of ke gt ka in the clearance equation Additionally lag time was restricted to a value of 2 hours or less and concentrations were log transformed consequently all concentrations (F) = 0 were given individual predicted concentrations of zero Finally there were two residual error terms one for serial samples and the other for trough samples DCP1PM Page 73 10182006
Clinical Pharmacology Review NDA 19-962 Toprol-XL 10182006
Key equations were as follows
KA = THETA(1)EXP(ETA(1)) V2 = THETA(2)EXP(ETA(2)) CL = (THETA(1)THETA(2)+THETA(3))EXP(ETA(3)) Q = THETA(4)EXP(ETA(4)) V3 = THETA(5)EXP(ETA(5)) ALAG1=THETA(6)EXP(ETA(6))
41111 PK Parameter estimation results Table 1 Summary of PK parameters in the metoprolol population PK base model (per applicant)
41112 Goodness of fit The applicant provided the following goodness-of-fit plots (Figure 1)
Reviewer Note The goodness-of-fit plots were reproduced by this Reviewer (see Appendix) with minor modifications
Figure 1 Goodness of fit plots for Base Model
DCP1PM Page 74 10182006
Clinical Pharmacology Review NDA 19-962 Toprol-XL 10182006
Base PK Model Selection The MOF values of all structural model candidates tested are presented in Table 2 Model selection was based primarily on MOF values the lower MOF the better the model The applicant reports that in general MOF values generated by a conventional absorption model (ie absorption rate is faster than elimination rate) and a flip-flop absorption model (ie absorption rate is slower than elimination rate) were identical
Reviewer Comment The existence of flip-flop kinetics appears plausible based on data provided and general patterns for sustained release formulations Consequently the use of flip-flop kinetics for the bulk of the modeling exercise appears reasonable
General conclusions from the information in Table 2 are First order input is better than zero order input Two compartment model is better than one compartment model Lag time presence is better than lack of lag time Two residual error terms are better than one residual error term It should also be noted that several other models led to unsatisfactory completion of the run and were not considered further
DCP1PM Page 75 10182006
Clinical Pharmacology Review NDA 19-962 Toprol-XL 10182006
Table 2 Comparison of Structural PK Models
Reviewer Comment The selected structural model appears appropriate based on the data
Base Model The deletion of ETA for V2 did not change the MOF value suggesting that ETA for V2 should be deleted to avoid an over-parameterized warning (Table 3) This was consistent with the estimated parameter value of ETA for V2 being 648 x 10ndash9 a very small value Therefore the base model was selected by deleting the ETA for V2 from the structural model
Reviewer Comment on Eta deletion for V2 Deletion of eta for V2 is acceptable based on the empirical data however from a physiological perspective deletion of eta is problematic Generally one anticipates inter-individual differences in volume of distribution In this case it appears that the error associated with V2 may have been randomly shifted to V3 and or Q terms as the three DCP1PM Page 76 10182006
Clinical Pharmacology Review NDA 19-962 Toprol-XL 10182006
terms are interrelated This potential shift in error is supported by the fact that the V2 eta value increases significantly (by several orders of magnitude- 10-5 vs 100) when eta for Q and or V3 is fixed However when Q or V3 are fixed minimization is successful but Q and V3 are not accurately estimated Accounting for the possible error shift is a complex process and goes beyond the scope of this reviewer thus deletion of eta associated with V2 was considered acceptable for the remainder of the modeling evaluation
Table 3 Structural elements tested in the metoprolol population PK structural model (p lt 0005)
Final PK Model
41113 Model description The key feature of the final model is the inclusion of the covariate effects of age on Q and weight on CL in the population PK model
Key Equations CL = (THETA(1)THETA(2)+THETA(3)+EWT)EXP(ETA(2)) Q = THETA(4)EAGEEXP(ETA(3))
Including Covariate Effects As previously described covariate effects were assessed by forward addition and backward deletion Most covariates did not significantly change MOF however BSA significantly affected CL and Age affected Q Consequently these covariates were included in the penultimate final model
DCP1PM Page 77 10182006
Clinical Pharmacology Review NDA 19-962 Toprol-XL 10182006
Reviewer Note BSA is derived form WT and HT covariates implying BSA is highly correlated to these two covariates (Figure 2) weight is the most suitable (practical covariate) as it is readily measured Furthermore weight and BSA produced the same MOF (Table 4) whereas MOF with height was more positive (less significant)
Figure 2 Plot of BSA vs Body Weight
The data in Table 4 support selection of the final model
Table 4 Covariate elements tested in the metoprolol population PK penultimate final model (plt0005)
The applicant acknowledges that mechanism(s) accounting for the impact of age on QF are not clear However since distribution clearance has little effect on metoprolol plasma exposure further investigation is not needed
41114 PK Parameter estimation results As shown in Table 5 PK parameters were estimated fairly precisely by the final model
Table 5 PK Parameter Estimates using Final Model
DCP1PM Page 78 10182006
Clinical Pharmacology Review NDA 19-962 Toprol-XL 10182006
41115 Goodness of fit The goodness-of-fit plots provided by the applicant show good precision Figure 5 Goodness of fit plots for final PK model
DCP1PM Page 79 10182006
Clinical Pharmacology Review NDA 19-962 Toprol-XL 10182006
PK Model Qualification The post hoc Bayesian-estimated AUC (simulated) obtained for the 27 patients with serial plasma samples are plotted against the observed (AUCt) The correlation was high (R2 gt 099) Figure 6 AUClast from observed data versus AUCt from model simulation in the 27 patients providing serial plasma samples
Regression line Y= 4514 + 08976 X R2 = 09957
The graphical validation of the final metoprolol population PK model validation against covariates evaluated is presented in Figure 6
Figure 7 Graphical validation of covariates
DCP1PM Page 80 10182006
Clinical Pharmacology Review NDA 19-962 Toprol-XL 10182006
There was no systematic bias in weighted residuals for any covariates evaluated suggesting that the final model included all appreciable effects of available covariates (Figure)
The effects of weight on metoprolol CLF are illustrated in Figure 8 where Bayesian post hoc estimates of CLF are plotted against weight and overlaid by the model-predicted line Overall the model appeared to fit the data well
Figure 8 Plot of CLF vs Body weight
The effects of AGE on metoprolol QF are illustrated in Figure 9 where Bayesian post hoc estimates of QF are plotted against AGE and overlaid by the model-predicted line Figure 9 Plot of QF vs Age
DCP1PM Page 81 10182006
Clinical Pharmacology Review NDA 19-962 Toprol-XL 10182006
Reviewer Note The applicant indicated that attempts to run the final model using the first-order conditional estimation method resulted in termination errors Therefore the parameter estimates obtained by the FO method were reported as the final parameter estimates
Conclusion Regarding Population PK Modeling Overall the sponsorrsquos population PK modeling is acceptable
PKPD Model and Model Selection
PKPD Base Model PharmacokineticPharmacodynamic Model description The key feature of the model was a lack of random variance term for the slope (since only single data points were available per subject) and inclusion of baseline effect
Key equations were as follows E0 = THETA(1)EXP(ETA(1)) M = THETA(2) Y = E0 + MLOG(AUC) + EPS(1)
The control stream provided in the appendix is that for DBP (provided by sponsor) The control stream for SBP is comparable with appropriate substitution for BP type
It should be noted that only the log-linear and linear PKPD models were considered suitable for AUC and Cmax For this review only AUC estimates were considered reliable as Cmax estimates could not be accurately determined based on the sampling scheme Consequently the remainder of this review focuses on AUC information although Ctrough and Cmax data are displayed for reference
Bayesian estimates from PK modeling are summarized in Table 1
Table 1 Bayesian estimates of metoprolol PK exposure for those patients included in the PKPD analysis (N=65)
DCP1PM Page 82 10182006
Clinical Pharmacology Review NDA 19-962 Toprol-XL 10182006
PKPD Model Selection (initial and final) The log-linear model was adopted as the base model for this PKPD relationship since it improved the MOF significantly (Table 2) The ETA parameter for the slope was pre-eliminated for the purpose of model parsimony The intercept and slope in this log-linear model for AUC(0-24) did not bear ETA parameter therefore no covariates had impact on either parameter in the model
Reviewer Note The intercept should not have borne an eta term because individual subjects provided only one data point Consequently fixing eta to zero or deleting eta in the final model is appropriate No further model development was required after eta was eliminated and the base model was equivalent to the final model
Table 2 Base population PKPD models tested for the change in SBP
41116 PKPD Parameter estimation results The final PKPD parameter estimates are presented in Table 3
Table 3 Summary parameters in the final PKPD model for the change in SBP using trough plasma level Parameter Explanation Estimate SE ()b
DCP1PM Page 83 10182006
Clinical Pharmacology Review NDA 19-962 Toprol-XL 10182006
Model Qualification Based on the relatively low R2 value and as shown in Figure there is a poor correlation between change in SBP and log AUC
Figure 1 Relationship between change in SBP and AUC (line generated from modeling)
Overall goodness-of-fit of the model was considered to be poor probably due to the high variability in the measurements Consequently the precision of the model parameter estimates was not considered to be very reliable These parameters have little clinical usefulness and can be treated only as an indication of trends ie more hemodynamic effects can be potentially achieved when high Toprol-XL doses are given Clinical dose adjustment based on these PKPD parameters is not recommended
Reviewerrsquos Supplemental Analyses A supplemental PKPD analyses was conducted using simple linear regression since the population model did not improve the fit Overall eta made an insignificant contribution to the overall model The results of the analyses were similar to the population analyses A series of regression analyses were conducted and are presented in Table 4
The applicant notes that the preliminary modeling exercise found that there was no difference in the PKPD modeling results using different hemodynamic data formats (ie change in the measurements percent change in the measurements or actual BP measurements) This finding was confirmed by this reviewer (see Table 4)
DCP1PM Page 84 10182006
Clinical Pharmacology Review NDA 19-962 Toprol-XL 10182006
Table 4 Supplemental PKPD Regression Analyses Conducted by Reviewer Model (liner regression) Intercept (I) Slope (m) R2 Probability RSBP = mISBP + I 3957 -035 01626 0009 PSBP = mISBP + I 2524 -023 01252 00038 PSBP = mRSBP + I 0005 074 09891 lt 00001 RSBP = mlogAUC + I 651 -221 0060 00493 RSBP = mDose + I -751 0006 00026 06878 RSBP = mDose^ + I -312 -111 004 02711 RSBP = mlogAUC + nISBP + I 5303 -221 (m)
-035 (n) 02230 0001
RSBPplc = mAUC + I -667 -0003 00458 00871 RSBPplc = mlogAUC + I 461 -2208 00600 00493 RPUL = mlogAUC + I 1868 -405 01102 00069 Symbols in table similar to population PK model without eta term RSBP- change of SBP without placebo correction ISBP- initial (baseline) SBP RPUL- change in HR without placebo correction Dose- in mg where placebo is included as 0 mg PSBP- percentage change of SBP without placebo correction
Conclusion Regarding Population PKPD Modeling Overall the sponsorrsquos population PKPD modeling is acceptable No dose adjustment conclusion can be made from this modeling however an exposure-response relationship was established for AUC and reduction in SBP
Discussion
The significance of the results 1 Provide estimates of PK measures and plasma exposure in pediatric population These data can be compared to adult exposure to determine if exposure differences impact drug effectiveness The main challenge in comparing pediatric data to adult data is different modeling schemes formulations and methods were used in the two populations
2 PKPD findings are not sufficiently precise to provide a dose adjustment algorithm however the PKPD analyses provides rationale for proposed titration as increasing exposure (doses) may improve efficacy (reduction in SBP) Ultimately the risk-benefit analyses overrides PKPD assessment for dose adjustment drug will be titrated thus reliance on PKPD information is not critical The proposed dose 10 mgkg appears suitable based on available information It is unclear from the studies if there should be an initial maximum dose although the sponsor has proposed 50 mg as the maximum initial dose The proposed pediatric starting dose on a mgkg basis is within the range of starting adult doses (25 ndash 100 mg) assuming an adult weighs 70 kg
3 Cumulative information form dose-response study indicates that Toprol XL has effectiveness in children however the most effective dose is unclear Since the drug can be titrated determining the initial optimal dose does not appear critical As proposed by the applicant dosing is started at a ldquolowrdquo dose that can be up-titrated if needed
DCP1PM Page 85 10182006
Clinical Pharmacology Review NDA 19-962 Toprol-XL 10182006
4 The results did not adequately address the potential impact of CYP2D6 metabolic status for pediatric patients taking Toprol XL There were an insufficient number of patients to make this assessment
5 Covariate effects do not appear significant only body weight significantly affects clearance However a worst case scenario can occur with a person that has a low body weight and is a poor metabolizer this will result in very high possibly supra-therapeutic exposure Age does not impact apparent oral clearance so an age-dependent dose adjustment is not needed for children over 6 years old In essence all children over six years old can initiate therapy at 10 mgkg
The validity of the results Overall the results produced by the sponsor appear valid and the sponsor used a sound modeling approach However alternative approaches that could have been adopted may have improved the outcome of the analyses Three of these approaches are presented below 1 Additional PK samples should have been collected during the absorption phase and
throughout the dosing interval to improve the modelrsquos performance Specifically additional samples collected during the absorption phase may have unambiguously identified the actual absorption input function (eg first order zero order mixed first and zero order) First order input was selected for the analyses although the dosage form is reported to exhibit zero order kinetics in adults It is possible that the input rate in children differs from that in adults but unlikely It should be noted that absorption kinetics in children is often erratic due to multiple factors (eg regioshyselective absorption incomplete gastric emptying and inconsistent absorption) so it is unclear if additional samples would have definitively identified the absorption function However additional non-trough samples may have helped in estimating key PK measures such as V and Cmax The final model did not have an eta associated with V which is atypical Collection of additional samples on different visits may have helped estimate potential inter-occasion variability It should be noted that AUC was estimated precisely for subjects providing serial samples but these subjects were not necessarily included in the PKPD analyses Ideally the PKPD modeling should have been conducted primarily in subjects who had accurate PK measures
2 The PKPD design could have been modified to potentially improve the utility of the analyses Specifically there should have been better placebo matching procedures to minimize the potential impact of the placebo effect This matching could have been improved by ensuring all patients on placebo had the same titration schedule and number of tablets It is noted that the model had a poor predictive performance that was mainly attributed to the high degree of variability in the PD measures Potentially other PD markers could have been explored that have less inherent variability One such marker is the degree of beta blockade using exercise heart rate (EHR) reduction this marker has been used extensively for metoprolol in adult subjects However use of EHR in the pediatric setting may be challenging
DCP1PM Page 86 10182006
Clinical Pharmacology Review NDA 19-962 Toprol-XL 10182006
Comments to sponsor
In future pharmacometric studies you should consider the following 1 collect sufficient (multiple) samples from individual subjects to allow assessment
of inter-occasion variability and estimation of inter-individual variability (eta) for all relevant parameters
2 placebo groups should be identically matched across all dose groups (eg same titration schedule and number tablets) to minimize potential bias or differences in the placebo effect
Comments to medical reviewer
1 The sponsor has adequately characterized metoprolol PK in the studied pediatric population The PK characterization could have been further optimized by obtaining additional samples over the entire dosing interval (eg during the absorption phase and elimination phase) on multiple occasions rather than on one occasion primarily at trough
2 A dose-response relationship could not be established using the protocol specified analysis approach The outcome of the dose-response relationship appeared highly dependent on the ldquoplacebo effectrdquo suggesting that the placebo group may not have been appropriate One should consider re-evaluating the dose-response precisely matched placebo groups (eg all placebo patients have identical number of tablets and titration schedule)
3 Based on the PKPD analysis plasma exposure (AUC) explains lt 10 of the response (reduction in systolic blood pressure) thus has limited clinical utility However the PKPD relationship suggests that there is a trend for increased response with increased exposure (dose driven)
4 Overall information from the dose-response study suggests that Toprol- XL is effective in the pediatric population The optimal initial dose 02 10 or 20 mgkg or the maximum safe and effective dose cannot be determined from the information provided It is noted that the 02 mgkg dose is unlikely to be effective as plasma concentrations achieved at this dose are unlikely to be effective (most concentrations lt LOQ and lower than effective adult concentrations) The 10 mgkg (proposed by applicant) appears to be a reasonable initial dose The labeling should reflect the regimens studied
DCP1PM Page 89 10182006
Clinical Pharmacology Review NDA 19-962 Toprol-XL 10182006
Appendix
DCP1PM Page 90 10182006
Clinical Pharmacology Review NDA 19-962 Toprol-XL 10182006
DCP1PM Page 91 10182006
Clinical Pharmacology Review NDA 19-962 Toprol-XL 10182006
DCP1PM Page 92 10182006
Clinical Pharmacology Review NDA 19-962 Toprol-XL 10182006
DCP1PM Page 93 10182006
Clinical Pharmacology Review NDA 19-962 Toprol-XL 10182006
DCP1PM Page 94 10182006
Clinical Pharmacology Review NDA 19-962 Toprol-XL 10182006
DCP1PM Page 95 10182006
Clinical Pharmacology Review NDA 19-962 Toprol-XL 10182006
Table 15 Control streams for final log-linear PKPD model for the change in DBP using metoprolol Cmax as the measure of exposure
Truncated NONMEM reports for base model identification for PKPD relationship in change of SBP (per sponsor)
DCP1PM Page 96 10182006
Clinical Pharmacology Review NDA 19-962 Toprol-XL 10182006
Reported PD information^
^ Under metoprolol regimen CRZ0K is Toprol XL
DCP1PM Page 97 10182006
Clinical Pharmacology Review NDA 19-962 Toprol-XL 10182006
Table Results of randomised double-blind comparative trials evaluating antihypertensive efficacy of metoprolol formulations or other antihypertensives
DCP1PM Page 98 10182006
---------------------------------------------------------------------------------------------------------------------
---------------------------------------------------------------------------------------------------------------------
---------------------
This is a representation of an electronic record that was signed electronically and this page is the manifestation of the electronic signature
s
Robert Kumi 10182006 045635 PM BIOPHARMACEUTICS
Patrick Marroum 10192006 050811 PM BIOPHARMACEUTICS
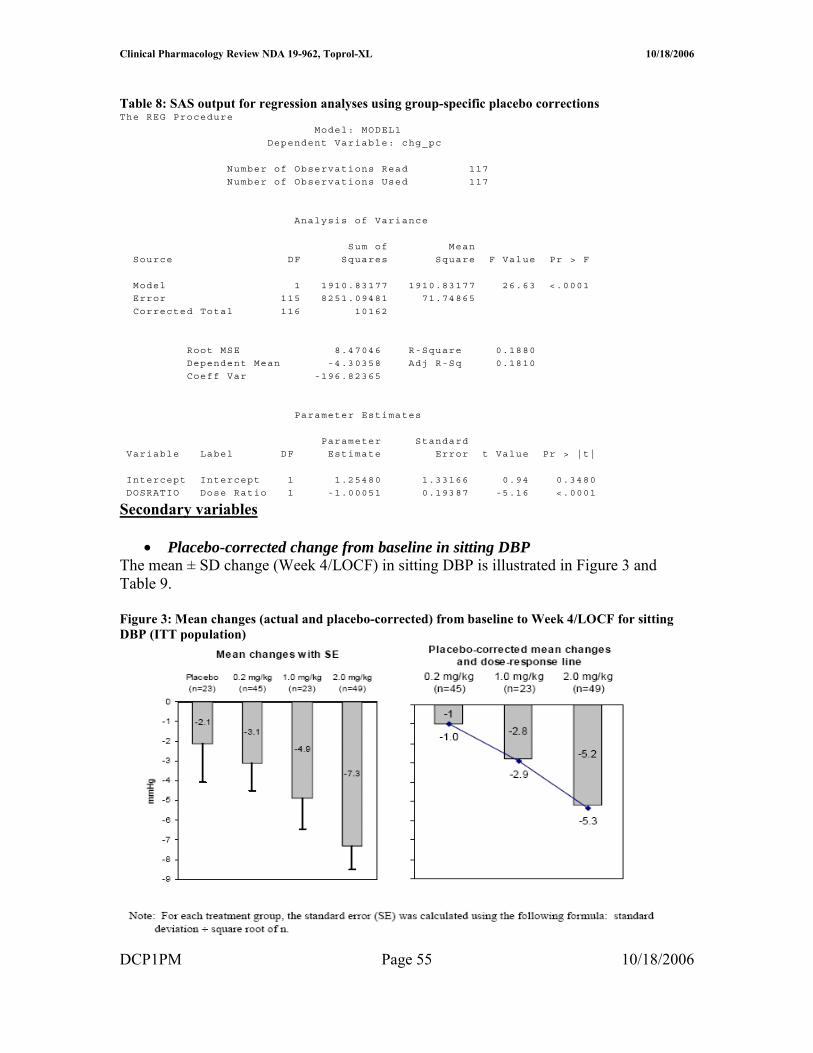
Clinical Pharmacology Review NDA 19-962 Toprol-XL 10182006
2 Overall the mean change from baseline in sitting SBP at Week 4LOCF for the TOPROL-XL groups pooled was statistically significantly larger than that for the placebo group (p=00351)
3 Results of pairwise comparisons between individual TOPROL-XL dose groups and placebo also revealed a statistically significant difference for the 10 and 20 mgkg groups (p=00270 and p=00492 respectively)
bull Mean changes over time in sitting SBP and DBP Consistent with findings from other studies with beta-blockers apparent maximal reduction in blood pressure occurred between 1 and 4 weeks of treatment
Figure 4 Mean changes over time for sitting SBP and DBP (ITT population)
Data points in plot are from absolute values (not taking baseline into account)
Subgroup Analyses The sponsor conducted several exploratory subgroup analyses however these analyses were not reviewed critically and are not presented in this review as
1 they do no impact the primary outcome or study objective 2 they are unlikely to be clinically useful due to the small number of patients per
subgroup One potentially useful some group analyses involved the percentage of responders as defined in Table 11
The responder analyses shows comparable response rates for all active dose groups suggesting similar efficacy across dose groups despite different exposure (doses)
DCP1PM Page 57 10182006
Clinical Pharmacology Review NDA 19-962 Toprol-XL 10182006
Table 11 Number and proportion of responders (ITT population)
Pharmacokinetic Results The Ctrough information obtained in the trial are summarized in Figure 6 and Tables 12 and 13
Table 12 Summary of Ctrough data (per applicant)
Sixteen patients across the 3 TOPROL-XL groups did not have blood samples obtained for analysis of metoprolol concentrations Based on the number of samples BLQ there appeared to be very low concentrations in the lowest dose group It appeared that Ctrough increased with dose According to the applicant these values are similar to those obtained previously in adults especially at the 2 higher doses Variability was high in all treatment groups (CV gt 60 )
Table 12 Summary of Ctrough (Reviewer Generated) from all patients (samples lt LOQ given value = 0) Toprol XL Dose Number of subjects Concentration (ngmL) (mgkg) Mean plusmn SD Median Range 02 39 137 plusmn 294 000 0 ndash 157 10 17 1224 plusmn 1416 845 0 ndash 571 20 46 2462 plusmn 3352 1140 0 ndash 1670
DCP1PM Page 58 10182006
Clinical Pharmacology Review NDA 19-962 Toprol-XL 10182006
Reviewer Note Overall the plasma concentrations (exposure) for the 02 mgkg dose group appear too low to be effective (close to LOQ) It is noted that adults typically have concentrations gt LOQ at the lowest therapeutic dose 25 mg (~ 4 ngmL)
Figure 6 Boxplot of metoprolol Ctrough using samples gt LLQ (per applicant)
Safety Results According to the applicant Toprol XL was well tolerated in the pediatric population as tabulated below
Main Analyses Conclusions bull No dose response was observed for corrected SBP using pooled placebo data
however using group-matched placebo data demonstrated a dose response bull Ctrough increased with dose bull Toprol 10 and 20 mg kg doses were more effective than placebo in reducing
SBP bull The responder rate was comparable across all active dose groups and this rate was
greater than that of placebo
DCP1PM Page 59 10182006
Clinical Pharmacology Review NDA 19-962 Toprol-XL 10182006
Methods Reviewerrsquos Methods Generally this reviewer conducted the analyses in a manner similar to that of the sponsor to confirm the sponsorrsquos findings
Sponsorrsquos Methods
Design Study1 307A
Reviewer Note This study was described in the Dose-Response Assessment (please refer to Page 7 Dose Response Analyses) Consequently only highlights relevant to the population analyses will be included in this section
Study 307A was a 4-week multi-center double-blind placebo-controlled randomized parallel-group study TOPROL-XL (metoprolol succinate) extended-release tablets were given to hypertensive pediatric patients Patients were randomized to double-treatment with a once daily oral dose of placebo or Toprol-XL at 1 of 3 target doses 02 or 20 mgkg The dose range for this study was 125 to 200 mg daily Patients on placebo followed the same schedule as that for their active group comparators
Study Flow Chart
Key Inclusion Criteria School age and adolescent children with reproducible SBP or DBP at or above the 95th percentile using height-adjusted charts for age and weight were eligible
DCP1PM Page 60 10182006
Clinical Pharmacology Review NDA 19-962 Toprol-XL 10182006
Study2 307B
Study 307B was a 52-week multi-center open-label study to determine the safety and pharmacokinetics of TOPROL-XL (metoprolol succinate) extended-release tablets (metoprolol CRXL) in hypertensive pediatric patients The starting dose was 25 mg daily The dose was increased every 2 weeks in increments of 25 mg or 50 mg based on tolerability until BP was controlled or the dose reached 200 mg
Table 1 Study Assessments
At the end of the 52-treatment period all patients had BP measured and a trough plasma level taken 24 hours the last dose of Toprol-XL with the exception of those patients who completed the serial portion at the final visit Among the participants a subgroup of approximately 30 patients was to participate in PK assessments of metoprolol requiring serial blood sampling at any time during the 52 weeks A single dose of 25 mg of Toprol-XL was given orally to those participating patients after a 48-hour washout period After the PK assessments they returned to the main study protocol Data
Study1 307A
4111 Pharmacokinetics A blood sample was to be collected at Visit 7 into a heparinized Vacutainer tube and obtained at 24 hours (plusmn2 hour) following the last dose of study medication (ie trough measurement) for determination of plasma metoprolol concentrations
Study Disposition Chart
DCP1PM Page 61 10182006
Clinical Pharmacology Review NDA 19-962 Toprol-XL 10182006
Table 2 Study Demographics
4112 Pharmacodynamics Primary variable
Sitting SBP determined at trough (24plusmn4 hours Visit 7) served as the primary efficacy assessment The primary measure of effect was the placebo-corrected change from baseline to the end of treatment (Week 4) in trough sitting SBP Each BP determination represented the mean of 3 readings with less than 7 mmHg between the highest and lowest value Blood pressure was measured using a mercury sphygmomanometer with an appropriate size cuff positioned approximately at the level of the heart Every effort was made to have the same individual measure the patientrsquos BP throughout the study if possible At all post randomization visits BP measurements were to be made at trough defined as 24 hours (plusmn4 hours) after receiving study medication All measurements were to be determined prior to the patient taking the scheduled dose of study medication In the
DCP1PM Page 62 10182006
Clinical Pharmacology Review NDA 19-962 Toprol-XL 10182006
event that the patient accidentally took study medication on the day of the scheduled visit the visit was to be rescheduled within 24 to 48 hours
Study2 307B
4113 Pharmacokinetics A 48-hour washout period prior to sampling was required for all patients including patients who entered the 52-week study and then decided to participate in the serial PK portion of the study All patients were to have a 15-mL blood sample collected into a heparinized Vacutainer tube 24 hours (plusmn2 hour) following the last dose of TOPROL-XL (ie trough measurement) at Visit 18 (or a the time of premature discontinuation) except for patients who participated in the serial PK portion of the study and had blood sampling performed at Visit 18 For patients participating in the serial PK portion of the study blood samples (15 mL) were to be collected into heparinized Vacutainer tubes and obtained at Hour 0 (predose) and at 1 2 3 4 6 8 10 and 24 hours after administration of a single 25 mg dose of TOPROL-XL following a 48-hour washout period After the last blood sample was obtained the patient was to startresume the prescribed dose of TOPROL-XL heshe was receiving prior to PK sampling
Patient Disposition Chart (completion or discontinuation)
Overall a total of 31 patients at 8 centers were enrolled in the serial PK portion of the study Of these 31 patients 27 had plasma concentration data available and were included in the analyses Four patients were excluded from the analyses because their plasma concentrations were not quantifiable (Nos 047-009 and 047-021) or because only whole blood samples were analyzed (Nos 005-002 005-003)
DCP1PM Page 63 10182006
Clinical Pharmacology Review NDA 19-962 Toprol-XL 10182006
Table 3 Subject Demographics for Patients Providing Serial Blood Samples
Missing Data Twenty-six patients did not have blood samples obtained for analysis of metoprolol concentrations in either the 16-week (n=7) or 52-week (n=19) studies Among patients with plasma samples 14 (14) in the 52-week study and 13 (13) in the 16-week study had trough plasma metoprolol concentrations that were below the LLQ Therefore data from a total of 99 patients were included in this analysis
Assay Metoprolol plasma levels were assayed using high-performance liquid chromatography tandem mass spectrometric detection methods having limit of quantitation (LOQ) of 1 ngmL The method was validated in the linear range 1 to 1000 ngmL Precision was less than or equal to 109 Accuracy ranged from 940 to 1013 Pharmacodynamics Not applicable
Data Checking SAS was used to format and check data Additionally visual inspection of several randomly selected subject data was carried out
DCP1PM Page 64 10182006
Clinical Pharmacology Review NDA 19-962 Toprol-XL 10182006
Models
Overview The sponsorrsquos stated assumptions underlying this modeling analysis are
1 Rich sampling data collected from 30 subjects in 307B Study can be used to adequately characterize the structural pharmacokinetic model of metoprolol
2 Structural pharmacokinetic models of metoprolol at other dose strength are identical to that at 25 mg
3 Metoprolol exhibits a linear pharmacokinetics in the dose ranges studied 4 Steady-state pharmacokinetics of metoprolol has been reached at the time of blood
sampling in Study 307A 5 Metoprolol accounts for the blood pressure effect in the study 6 Existing various disease states in the patients have no impact on the pharmacokinetics
of metoprolol and pharmacodynamics of the blood pressure reduction in the study 7 Concomitant medications if existed do not have any effects on the pharmacokinetics
of metoprolol and pharmacodynamics of the blood pressure reduction in the study
Reviewer Comment The sponsorrsquos assumptions appear reasonable based on existing metoprolol PKPD information
Pharmacokinetics
4114 PK Structural Model Several PK models were tested to identify the structural model Flip-flop absorption was taken into consideration based on general PK characteristics following administration of sustained release tablets and observed data in the current study (serial PK samples)
The models tested included linear 1- and 2-compartment PK models with the following characteristics (focused on flip-flop models)
bull first-order absorption with and without absorption lag time (NONMEM subroutines ADVAN2 and ADVAN4)
bull zero-order absorption with and without absorption lag time (NONMEM subroutines ADVAN1 and ADVAN3)
bull simultaneous zero- and first-order absorption from the absorption compartment The models were parameterized in terms of CLF and VF
Ultimately the 2-compartment model with first order flip-flop absorption an absorption lag time and 2 residual error terms was selected as the structural model of metoprolol The model scheme is presented in the following Figure 1 Figure 1 PK Compartmental Model
DCP1PM Page 65 10182006
Clinical Pharmacology Review NDA 19-962 Toprol-XL 10182006
4115 PK Covariate Model Covariate models were developed to account for the potential impact of the following covariates and derived covariates on metoprolol PK
Continuous variables bull Age (AGE years) bull Body weight (WT kg) bull Body surface area (BSA m2) calculated from WT and HT (cm) using the height
weight formula BSA=0024265 x WT 05378 x HT03964 bull Ideal body weight (IBW kg) calculated as - Males IBW=50+(HTndash150)25 and
for Females IBW=45+(HTndash150)25 bull Dose (DOSE mg of Toprol-XL)
Categorical variables bull Gender (SEX) - Male 0 - Female 1 bull Race (RACE) - Caucasian 0 - Black 1 - Asian 2 - Other 3
PK covariate effects were modeled as follows
Effects of continuous covariates (AGE WT BSA IBW and DOSE) were normalized to the corresponding median value across a dataset such that continuous covariates were related to structural PK parameters in a power function as described below
where Θ is the fixed-effect parameter of a covariate estimated by the NONMEM program covariate value is the observed covariate value and PK typical value is the typical value of the PK parameter estimated by NONMEM Effects of categorical covariates (SEX and RACE) are related to structural PK parameters by fractional changes of dummy variables
DCP1PM Page 66 10182006
Clinical Pharmacology Review NDA 19-962 Toprol-XL 10182006
Where Θ is the fixed-effect parameter of a covariate estimated by the NONMEM program covariate is the dummy variable value and modified in the control streams and PK typical value is the typical value of this PK parameter as estimated by NONMEM
Median values of all covariates in the dataset for population PK analysis are presented in Table A
Table A Summary of patient covariates and Toprol-XL doses in the data for population PK analysis
Two Steps were included in the modeling of covariates
Step 1 Forward Addition The covariates were subjected to a stepwise forward selection algorithm using a likelihood ratio test based on a change in MOF values from the base model A significant covariate reduced the MOF more than 660 (chi-square distribution plt001 degrees of freedom [df]=1)
Step 2 Backward deletion (Excluding procedures for covariate effect) The covariates in the full model acquired in Step 1 were subjected to a backward deletion algorithm 1 covariate was deleted at a time using a likelihood ratio test based on a change in MOF values A covariate was determined to be statistically significant if the change in MOF after its deletion from the breakdown model was increased by more than 1083 (chi-square distribution plt0001 df=1)
4116 PK Random Variance Models An exponential error model was used to characterize inter-patient variability based upon the assumption that random effects for PK parameters were not correlated among PK parameters No other error models for eta were evaluated by the applicant or by this Reviewer The retention of ETA values for each PK parameter in the structural model was confirmed by sequentially fixing each ETA value at zero and comparing each resultant MOF with the MOF obtained when all ETA values were retained in the model (see Table 6)
DCP1PM Page 67 10182006
Clinical Pharmacology Review NDA 19-962 Toprol-XL 10182006
The residual model was modeled by an additive model two error terms were used one for error associated with trough samples and the other with serial samples
Reviewer Note Use of an exponential model appears reasonable
Pharmacodynamics
4117 PKPD Structural Model The equations for the structural models are shown below
1 Metoprolol Ctrough The relationships between the observed metoprolol concentrations (Ctrough) and hemodynamic changes were investigated using 4 direct-link models namely a linear model a log-linear model and Hillrsquos sigmoid Emax PKPD model with and without a baseline
2 The relationships between Cmax or AUC0ndash24 and hemodynamic changes were investigated using 2 direct-link models a linear model and a log-linear model
4118 PKPD Covariate Model The inclusion and exclusion procedures of covariate effect on the selected PKPD base model to obtain a selected final PKPD model were identical to those in the covariate evaluation in the population PK models as described previously in PK Covariate Model DCP1PM Page 68 10182006
Clinical Pharmacology Review NDA 19-962 Toprol-XL 10182006
Table B Baseline demographic and covariate characteristics
4119 PKPD Random Variance Models An exponential error model was used by the applicant to model inter-individual variability The retention of a random effect parameter ETA in each selected PKPD structural model was then evaluated by sequentially fixing each ETA value at zero and comparing each resultant MOF with the MOF obtained when all ETA values were retained in the model (plt005) This step reduced over-parameterization by deleting unnecessary random-effect parameters from the structural model to obtain the base model
Reviewer Note The study design precludes assessment of inter-individual variability or random error because only one dose record was available per patient Consequently the model should not have included eta terms It is noted that the sponsor ultimately dropped the eta term in the final model
DCP1PM Page 69 10182006
Clinical Pharmacology Review NDA 19-962 Toprol-XL 10182006
Model Selection
PK Initial Model Selection
PK Base Model to Final Model The selection of the most appropriate PK base model for a metoprolol PK was based upon the following criteria a significant reduction in MOF as compared to the baseline model and asymptotic chi-square distribution based on the likelihood ratio test or AIC (plt005) as compared to the other structural models This selected PK base model was then subject to a covariate evaluation The population PK model bearing all surviving covariate parameters with statistical significance became the penultimate final model If 1 of the body size parameters (WT BSA and HT) was not in the model the penultimate final model became the final model If body size parameters were in the model they were sequentially replaced by other body size parameters in the regression submodel for each PK parameter The best body size parameter was then selected on the basis of lowest MOF to form the final model
PK Final Model Selection Simulations and visual inspections based on goodness of fit plots were used to qualify and validate the model The goodness-of-fit of the final model was evaluated graphically by comparing population and individual predictions of metoprolol concentrations with observed metoprolol concentrations along the line of unity and by visual inspection of the following plots of population-weighted residuals (WRES) for the final population model 1 Population-weighted residuals (WRES) versus population-predicted concentrations (PRED) 2 WRES versus time after first drug administration in each patient 3 WRES versus all covariates evaluated WRES were generally expected to be distributed homogenously around zero for PRED time after administration and covariates For those 27 patients with serial samples goodness-of-fit of the plasma concentration-time profile for each individual was visually inspected The linear relationship between their AUClast values from the observed data and those from the simulated data (final model) was examined
The predictive performance of the final population PK model including covariates was evaluated by comparing typical values of PK parameters with the mean of individual Bayesian estimates or individual values of PK parameters with the results from non-compartmental analysis for patients with serial samples Steady-state metoprolol plasma concentration-time profiles from 0ndash24 hours at the interval of 15 minutes (025 hour) were calculated using the post hoc Bayesian estimated PK parameter obtained for 65 patients included in the PKPD relationship using the following equation
DCP1PM Page 70 10182006
Clinical Pharmacology Review NDA 19-962 Toprol-XL 10182006
PKPD Initial and Final Model Selection A similar approach to that of PK model selection was adopted for PKPD Each of the above-mentioned PKPD models with random effects was identified by curve-fitting the dataset Initial selection of the PKPD structural model was based upon a significant reduction in MOF (plt005) as compared to the baseline model and reasonable PKPD parameter estimates Software
Nonlinear mixed-effect modeling (NONMEM) software (Version V level 11 Globomax Hanover MD) was used in the population PK analysis PK model fitting was accomplished using first-order (FO) approximation methods For PKPD model fitting the first-order conditional estimation (FOCE) with eta-epsilon interaction method in NONMEM was used for all model runs
SAS software (Version VIII Cary NC) was employed to prepare datasets according to the format required by the NONMEM program (Boeckmann et al 1991) Microsoftreg Excel 2000 (Redmond WA) and S-PLUS 2000 (Professional Release 2 MathSoft Inc Cambridge MA) were used to perform exploratory graphical exposure calculation and statistical analyses according to the format required by the NONMEM program (Boeckmann et al 1991) SAS command files logs and listings pertaining to data file conversion and merging were reviewed by an independent analyst Datasets were stored in SAS data frames combined and exported to Excel and then to ASCII files before fitting to the model
Datasets were prepared and pooled in a NONMEM-compliant format using SAS software by the Programming Group Clinical Information Sciences at AstraZeneca Wilmington Delaware SAS command files logs and listings pertaining to file conversion and merging were provided and found to be acceptable The contents of both datasets (toprolkatcsv for PK modeling and cppd2csv for PKPD modeling) were included
DCP1PM Page 71 10182006
Clinical Pharmacology Review NDA 19-962 Toprol-XL 10182006
toprolkatcsv was not provided electronically in a SAS format however this reviewer generated a similar dataset using the applicantrsquos criteria
Reviewer Comment The software and data assembly methods appeared adequate
DCP1PM Page 72 10182006
Clinical Pharmacology Review NDA 19-962 Toprol-XL 10182006
Results and Discussion Design Adequacy
Overall the trial designs appeared adequate to evaluate metoprolol population PK and PKPD in pediatric patients receiving Toprol XL However the design could have been further optimized by increasing the sampling points particularly in the absorption phase Due to the limited number of samples in the absorption phase it was not possible to accurately characterize the absorption model first order vs zero order or mixed first and zero order Additionally collection of mainly trough samples limits the ability to accurately estimate measures such as Cmax that are not directly related to Ctrough particularly if multiple compartments are present Consequently Cmax estimations are unlikely to be accurate Finally most patients provided only one trough sample thus inter-individual variability could not be adequately captured and may have limited the utility of the modeling exercise particularly in PKPD where the random effect could not be accurately characterized Ultimately there was no random variable in the final PKPD model (ie eta was set to zero) Data Integrity
This reviewer checked the data visually by randomly selecting data from patients included in the population modeling and comparing to data in the study report (source data) Overall the data integrity appeared acceptable The applicant observed the following guidelines that appeared acceptable No datum from any study participant with a protocol violation that was thought to materially impact the analysis was included The dataset contained data from only those study participants who could be evaluated ie with all the last dosing datetime blood sampling datetime plasma drug concentrations and demographic covariates
Data that were excluded (n = 62 samples) from the model were as follows One sample from an apparent poor metabolizer Two samples collected gt 96 hours post dose From 307B 10 trough samples lt LOQ From 307A 17 samples lt LOQ Thirty-samples from serial data that were lt LOQ or whole blood samples Model and Model Selection
Base Model
41110 Pharmacokinetic Model description The base PK model was a standard two compartment model that incorporated lag time and flip-flop kinetics The key features of the model were flip-flop was insured by making the value of ke gt ka in the clearance equation Additionally lag time was restricted to a value of 2 hours or less and concentrations were log transformed consequently all concentrations (F) = 0 were given individual predicted concentrations of zero Finally there were two residual error terms one for serial samples and the other for trough samples DCP1PM Page 73 10182006
Clinical Pharmacology Review NDA 19-962 Toprol-XL 10182006
Key equations were as follows
KA = THETA(1)EXP(ETA(1)) V2 = THETA(2)EXP(ETA(2)) CL = (THETA(1)THETA(2)+THETA(3))EXP(ETA(3)) Q = THETA(4)EXP(ETA(4)) V3 = THETA(5)EXP(ETA(5)) ALAG1=THETA(6)EXP(ETA(6))
41111 PK Parameter estimation results Table 1 Summary of PK parameters in the metoprolol population PK base model (per applicant)
41112 Goodness of fit The applicant provided the following goodness-of-fit plots (Figure 1)
Reviewer Note The goodness-of-fit plots were reproduced by this Reviewer (see Appendix) with minor modifications
Figure 1 Goodness of fit plots for Base Model
DCP1PM Page 74 10182006
Clinical Pharmacology Review NDA 19-962 Toprol-XL 10182006
Base PK Model Selection The MOF values of all structural model candidates tested are presented in Table 2 Model selection was based primarily on MOF values the lower MOF the better the model The applicant reports that in general MOF values generated by a conventional absorption model (ie absorption rate is faster than elimination rate) and a flip-flop absorption model (ie absorption rate is slower than elimination rate) were identical
Reviewer Comment The existence of flip-flop kinetics appears plausible based on data provided and general patterns for sustained release formulations Consequently the use of flip-flop kinetics for the bulk of the modeling exercise appears reasonable
General conclusions from the information in Table 2 are First order input is better than zero order input Two compartment model is better than one compartment model Lag time presence is better than lack of lag time Two residual error terms are better than one residual error term It should also be noted that several other models led to unsatisfactory completion of the run and were not considered further
DCP1PM Page 75 10182006
Clinical Pharmacology Review NDA 19-962 Toprol-XL 10182006
Table 2 Comparison of Structural PK Models
Reviewer Comment The selected structural model appears appropriate based on the data
Base Model The deletion of ETA for V2 did not change the MOF value suggesting that ETA for V2 should be deleted to avoid an over-parameterized warning (Table 3) This was consistent with the estimated parameter value of ETA for V2 being 648 x 10ndash9 a very small value Therefore the base model was selected by deleting the ETA for V2 from the structural model
Reviewer Comment on Eta deletion for V2 Deletion of eta for V2 is acceptable based on the empirical data however from a physiological perspective deletion of eta is problematic Generally one anticipates inter-individual differences in volume of distribution In this case it appears that the error associated with V2 may have been randomly shifted to V3 and or Q terms as the three DCP1PM Page 76 10182006
Clinical Pharmacology Review NDA 19-962 Toprol-XL 10182006
terms are interrelated This potential shift in error is supported by the fact that the V2 eta value increases significantly (by several orders of magnitude- 10-5 vs 100) when eta for Q and or V3 is fixed However when Q or V3 are fixed minimization is successful but Q and V3 are not accurately estimated Accounting for the possible error shift is a complex process and goes beyond the scope of this reviewer thus deletion of eta associated with V2 was considered acceptable for the remainder of the modeling evaluation
Table 3 Structural elements tested in the metoprolol population PK structural model (p lt 0005)
Final PK Model
41113 Model description The key feature of the final model is the inclusion of the covariate effects of age on Q and weight on CL in the population PK model
Key Equations CL = (THETA(1)THETA(2)+THETA(3)+EWT)EXP(ETA(2)) Q = THETA(4)EAGEEXP(ETA(3))
Including Covariate Effects As previously described covariate effects were assessed by forward addition and backward deletion Most covariates did not significantly change MOF however BSA significantly affected CL and Age affected Q Consequently these covariates were included in the penultimate final model
DCP1PM Page 77 10182006
Clinical Pharmacology Review NDA 19-962 Toprol-XL 10182006
Reviewer Note BSA is derived form WT and HT covariates implying BSA is highly correlated to these two covariates (Figure 2) weight is the most suitable (practical covariate) as it is readily measured Furthermore weight and BSA produced the same MOF (Table 4) whereas MOF with height was more positive (less significant)
Figure 2 Plot of BSA vs Body Weight
The data in Table 4 support selection of the final model
Table 4 Covariate elements tested in the metoprolol population PK penultimate final model (plt0005)
The applicant acknowledges that mechanism(s) accounting for the impact of age on QF are not clear However since distribution clearance has little effect on metoprolol plasma exposure further investigation is not needed
41114 PK Parameter estimation results As shown in Table 5 PK parameters were estimated fairly precisely by the final model
Table 5 PK Parameter Estimates using Final Model
DCP1PM Page 78 10182006
Clinical Pharmacology Review NDA 19-962 Toprol-XL 10182006
41115 Goodness of fit The goodness-of-fit plots provided by the applicant show good precision Figure 5 Goodness of fit plots for final PK model
DCP1PM Page 79 10182006
Clinical Pharmacology Review NDA 19-962 Toprol-XL 10182006
PK Model Qualification The post hoc Bayesian-estimated AUC (simulated) obtained for the 27 patients with serial plasma samples are plotted against the observed (AUCt) The correlation was high (R2 gt 099) Figure 6 AUClast from observed data versus AUCt from model simulation in the 27 patients providing serial plasma samples
Regression line Y= 4514 + 08976 X R2 = 09957
The graphical validation of the final metoprolol population PK model validation against covariates evaluated is presented in Figure 6
Figure 7 Graphical validation of covariates
DCP1PM Page 80 10182006
Clinical Pharmacology Review NDA 19-962 Toprol-XL 10182006
There was no systematic bias in weighted residuals for any covariates evaluated suggesting that the final model included all appreciable effects of available covariates (Figure)
The effects of weight on metoprolol CLF are illustrated in Figure 8 where Bayesian post hoc estimates of CLF are plotted against weight and overlaid by the model-predicted line Overall the model appeared to fit the data well
Figure 8 Plot of CLF vs Body weight
The effects of AGE on metoprolol QF are illustrated in Figure 9 where Bayesian post hoc estimates of QF are plotted against AGE and overlaid by the model-predicted line Figure 9 Plot of QF vs Age
DCP1PM Page 81 10182006
Clinical Pharmacology Review NDA 19-962 Toprol-XL 10182006
Reviewer Note The applicant indicated that attempts to run the final model using the first-order conditional estimation method resulted in termination errors Therefore the parameter estimates obtained by the FO method were reported as the final parameter estimates
Conclusion Regarding Population PK Modeling Overall the sponsorrsquos population PK modeling is acceptable
PKPD Model and Model Selection
PKPD Base Model PharmacokineticPharmacodynamic Model description The key feature of the model was a lack of random variance term for the slope (since only single data points were available per subject) and inclusion of baseline effect
Key equations were as follows E0 = THETA(1)EXP(ETA(1)) M = THETA(2) Y = E0 + MLOG(AUC) + EPS(1)
The control stream provided in the appendix is that for DBP (provided by sponsor) The control stream for SBP is comparable with appropriate substitution for BP type
It should be noted that only the log-linear and linear PKPD models were considered suitable for AUC and Cmax For this review only AUC estimates were considered reliable as Cmax estimates could not be accurately determined based on the sampling scheme Consequently the remainder of this review focuses on AUC information although Ctrough and Cmax data are displayed for reference
Bayesian estimates from PK modeling are summarized in Table 1
Table 1 Bayesian estimates of metoprolol PK exposure for those patients included in the PKPD analysis (N=65)
DCP1PM Page 82 10182006
Clinical Pharmacology Review NDA 19-962 Toprol-XL 10182006
PKPD Model Selection (initial and final) The log-linear model was adopted as the base model for this PKPD relationship since it improved the MOF significantly (Table 2) The ETA parameter for the slope was pre-eliminated for the purpose of model parsimony The intercept and slope in this log-linear model for AUC(0-24) did not bear ETA parameter therefore no covariates had impact on either parameter in the model
Reviewer Note The intercept should not have borne an eta term because individual subjects provided only one data point Consequently fixing eta to zero or deleting eta in the final model is appropriate No further model development was required after eta was eliminated and the base model was equivalent to the final model
Table 2 Base population PKPD models tested for the change in SBP
41116 PKPD Parameter estimation results The final PKPD parameter estimates are presented in Table 3
Table 3 Summary parameters in the final PKPD model for the change in SBP using trough plasma level Parameter Explanation Estimate SE ()b
DCP1PM Page 83 10182006
Clinical Pharmacology Review NDA 19-962 Toprol-XL 10182006
Model Qualification Based on the relatively low R2 value and as shown in Figure there is a poor correlation between change in SBP and log AUC
Figure 1 Relationship between change in SBP and AUC (line generated from modeling)
Overall goodness-of-fit of the model was considered to be poor probably due to the high variability in the measurements Consequently the precision of the model parameter estimates was not considered to be very reliable These parameters have little clinical usefulness and can be treated only as an indication of trends ie more hemodynamic effects can be potentially achieved when high Toprol-XL doses are given Clinical dose adjustment based on these PKPD parameters is not recommended
Reviewerrsquos Supplemental Analyses A supplemental PKPD analyses was conducted using simple linear regression since the population model did not improve the fit Overall eta made an insignificant contribution to the overall model The results of the analyses were similar to the population analyses A series of regression analyses were conducted and are presented in Table 4
The applicant notes that the preliminary modeling exercise found that there was no difference in the PKPD modeling results using different hemodynamic data formats (ie change in the measurements percent change in the measurements or actual BP measurements) This finding was confirmed by this reviewer (see Table 4)
DCP1PM Page 84 10182006
Clinical Pharmacology Review NDA 19-962 Toprol-XL 10182006
Table 4 Supplemental PKPD Regression Analyses Conducted by Reviewer Model (liner regression) Intercept (I) Slope (m) R2 Probability RSBP = mISBP + I 3957 -035 01626 0009 PSBP = mISBP + I 2524 -023 01252 00038 PSBP = mRSBP + I 0005 074 09891 lt 00001 RSBP = mlogAUC + I 651 -221 0060 00493 RSBP = mDose + I -751 0006 00026 06878 RSBP = mDose^ + I -312 -111 004 02711 RSBP = mlogAUC + nISBP + I 5303 -221 (m)
-035 (n) 02230 0001
RSBPplc = mAUC + I -667 -0003 00458 00871 RSBPplc = mlogAUC + I 461 -2208 00600 00493 RPUL = mlogAUC + I 1868 -405 01102 00069 Symbols in table similar to population PK model without eta term RSBP- change of SBP without placebo correction ISBP- initial (baseline) SBP RPUL- change in HR without placebo correction Dose- in mg where placebo is included as 0 mg PSBP- percentage change of SBP without placebo correction
Conclusion Regarding Population PKPD Modeling Overall the sponsorrsquos population PKPD modeling is acceptable No dose adjustment conclusion can be made from this modeling however an exposure-response relationship was established for AUC and reduction in SBP
Discussion
The significance of the results 1 Provide estimates of PK measures and plasma exposure in pediatric population These data can be compared to adult exposure to determine if exposure differences impact drug effectiveness The main challenge in comparing pediatric data to adult data is different modeling schemes formulations and methods were used in the two populations
2 PKPD findings are not sufficiently precise to provide a dose adjustment algorithm however the PKPD analyses provides rationale for proposed titration as increasing exposure (doses) may improve efficacy (reduction in SBP) Ultimately the risk-benefit analyses overrides PKPD assessment for dose adjustment drug will be titrated thus reliance on PKPD information is not critical The proposed dose 10 mgkg appears suitable based on available information It is unclear from the studies if there should be an initial maximum dose although the sponsor has proposed 50 mg as the maximum initial dose The proposed pediatric starting dose on a mgkg basis is within the range of starting adult doses (25 ndash 100 mg) assuming an adult weighs 70 kg
3 Cumulative information form dose-response study indicates that Toprol XL has effectiveness in children however the most effective dose is unclear Since the drug can be titrated determining the initial optimal dose does not appear critical As proposed by the applicant dosing is started at a ldquolowrdquo dose that can be up-titrated if needed
DCP1PM Page 85 10182006
Clinical Pharmacology Review NDA 19-962 Toprol-XL 10182006
4 The results did not adequately address the potential impact of CYP2D6 metabolic status for pediatric patients taking Toprol XL There were an insufficient number of patients to make this assessment
5 Covariate effects do not appear significant only body weight significantly affects clearance However a worst case scenario can occur with a person that has a low body weight and is a poor metabolizer this will result in very high possibly supra-therapeutic exposure Age does not impact apparent oral clearance so an age-dependent dose adjustment is not needed for children over 6 years old In essence all children over six years old can initiate therapy at 10 mgkg
The validity of the results Overall the results produced by the sponsor appear valid and the sponsor used a sound modeling approach However alternative approaches that could have been adopted may have improved the outcome of the analyses Three of these approaches are presented below 1 Additional PK samples should have been collected during the absorption phase and
throughout the dosing interval to improve the modelrsquos performance Specifically additional samples collected during the absorption phase may have unambiguously identified the actual absorption input function (eg first order zero order mixed first and zero order) First order input was selected for the analyses although the dosage form is reported to exhibit zero order kinetics in adults It is possible that the input rate in children differs from that in adults but unlikely It should be noted that absorption kinetics in children is often erratic due to multiple factors (eg regioshyselective absorption incomplete gastric emptying and inconsistent absorption) so it is unclear if additional samples would have definitively identified the absorption function However additional non-trough samples may have helped in estimating key PK measures such as V and Cmax The final model did not have an eta associated with V which is atypical Collection of additional samples on different visits may have helped estimate potential inter-occasion variability It should be noted that AUC was estimated precisely for subjects providing serial samples but these subjects were not necessarily included in the PKPD analyses Ideally the PKPD modeling should have been conducted primarily in subjects who had accurate PK measures
2 The PKPD design could have been modified to potentially improve the utility of the analyses Specifically there should have been better placebo matching procedures to minimize the potential impact of the placebo effect This matching could have been improved by ensuring all patients on placebo had the same titration schedule and number of tablets It is noted that the model had a poor predictive performance that was mainly attributed to the high degree of variability in the PD measures Potentially other PD markers could have been explored that have less inherent variability One such marker is the degree of beta blockade using exercise heart rate (EHR) reduction this marker has been used extensively for metoprolol in adult subjects However use of EHR in the pediatric setting may be challenging
DCP1PM Page 86 10182006
Clinical Pharmacology Review NDA 19-962 Toprol-XL 10182006
Comments to sponsor
In future pharmacometric studies you should consider the following 1 collect sufficient (multiple) samples from individual subjects to allow assessment
of inter-occasion variability and estimation of inter-individual variability (eta) for all relevant parameters
2 placebo groups should be identically matched across all dose groups (eg same titration schedule and number tablets) to minimize potential bias or differences in the placebo effect
Comments to medical reviewer
1 The sponsor has adequately characterized metoprolol PK in the studied pediatric population The PK characterization could have been further optimized by obtaining additional samples over the entire dosing interval (eg during the absorption phase and elimination phase) on multiple occasions rather than on one occasion primarily at trough
2 A dose-response relationship could not be established using the protocol specified analysis approach The outcome of the dose-response relationship appeared highly dependent on the ldquoplacebo effectrdquo suggesting that the placebo group may not have been appropriate One should consider re-evaluating the dose-response precisely matched placebo groups (eg all placebo patients have identical number of tablets and titration schedule)
3 Based on the PKPD analysis plasma exposure (AUC) explains lt 10 of the response (reduction in systolic blood pressure) thus has limited clinical utility However the PKPD relationship suggests that there is a trend for increased response with increased exposure (dose driven)
4 Overall information from the dose-response study suggests that Toprol- XL is effective in the pediatric population The optimal initial dose 02 10 or 20 mgkg or the maximum safe and effective dose cannot be determined from the information provided It is noted that the 02 mgkg dose is unlikely to be effective as plasma concentrations achieved at this dose are unlikely to be effective (most concentrations lt LOQ and lower than effective adult concentrations) The 10 mgkg (proposed by applicant) appears to be a reasonable initial dose The labeling should reflect the regimens studied
DCP1PM Page 89 10182006
Clinical Pharmacology Review NDA 19-962 Toprol-XL 10182006
Appendix
DCP1PM Page 90 10182006
Clinical Pharmacology Review NDA 19-962 Toprol-XL 10182006
DCP1PM Page 91 10182006
Clinical Pharmacology Review NDA 19-962 Toprol-XL 10182006
DCP1PM Page 92 10182006
Clinical Pharmacology Review NDA 19-962 Toprol-XL 10182006
DCP1PM Page 93 10182006
Clinical Pharmacology Review NDA 19-962 Toprol-XL 10182006
DCP1PM Page 94 10182006
Clinical Pharmacology Review NDA 19-962 Toprol-XL 10182006
DCP1PM Page 95 10182006
Clinical Pharmacology Review NDA 19-962 Toprol-XL 10182006
Table 15 Control streams for final log-linear PKPD model for the change in DBP using metoprolol Cmax as the measure of exposure
Truncated NONMEM reports for base model identification for PKPD relationship in change of SBP (per sponsor)
DCP1PM Page 96 10182006
Clinical Pharmacology Review NDA 19-962 Toprol-XL 10182006
Reported PD information^
^ Under metoprolol regimen CRZ0K is Toprol XL
DCP1PM Page 97 10182006
Clinical Pharmacology Review NDA 19-962 Toprol-XL 10182006
Table Results of randomised double-blind comparative trials evaluating antihypertensive efficacy of metoprolol formulations or other antihypertensives
DCP1PM Page 98 10182006
---------------------------------------------------------------------------------------------------------------------
---------------------------------------------------------------------------------------------------------------------
---------------------
This is a representation of an electronic record that was signed electronically and this page is the manifestation of the electronic signature
s
Robert Kumi 10182006 045635 PM BIOPHARMACEUTICS
Patrick Marroum 10192006 050811 PM BIOPHARMACEUTICS
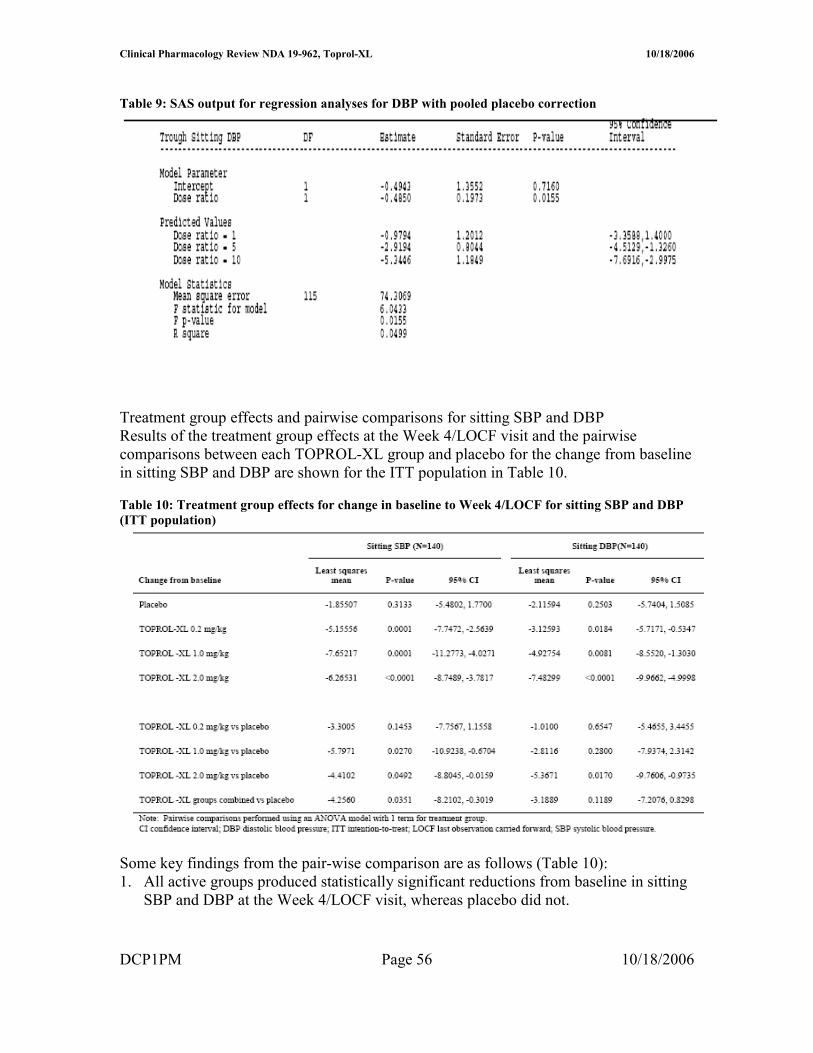
Clinical Pharmacology Review NDA 19-962 Toprol-XL 10182006
Study2 307B
Study 307B was a 52-week multi-center open-label study to determine the safety and pharmacokinetics of TOPROL-XL (metoprolol succinate) extended-release tablets (metoprolol CRXL) in hypertensive pediatric patients The starting dose was 25 mg daily The dose was increased every 2 weeks in increments of 25 mg or 50 mg based on tolerability until BP was controlled or the dose reached 200 mg
Table 1 Study Assessments
At the end of the 52-treatment period all patients had BP measured and a trough plasma level taken 24 hours the last dose of Toprol-XL with the exception of those patients who completed the serial portion at the final visit Among the participants a subgroup of approximately 30 patients was to participate in PK assessments of metoprolol requiring serial blood sampling at any time during the 52 weeks A single dose of 25 mg of Toprol-XL was given orally to those participating patients after a 48-hour washout period After the PK assessments they returned to the main study protocol Data
Study1 307A
4111 Pharmacokinetics A blood sample was to be collected at Visit 7 into a heparinized Vacutainer tube and obtained at 24 hours (plusmn2 hour) following the last dose of study medication (ie trough measurement) for determination of plasma metoprolol concentrations
Study Disposition Chart
DCP1PM Page 61 10182006
Clinical Pharmacology Review NDA 19-962 Toprol-XL 10182006
Table 2 Study Demographics
4112 Pharmacodynamics Primary variable
Sitting SBP determined at trough (24plusmn4 hours Visit 7) served as the primary efficacy assessment The primary measure of effect was the placebo-corrected change from baseline to the end of treatment (Week 4) in trough sitting SBP Each BP determination represented the mean of 3 readings with less than 7 mmHg between the highest and lowest value Blood pressure was measured using a mercury sphygmomanometer with an appropriate size cuff positioned approximately at the level of the heart Every effort was made to have the same individual measure the patientrsquos BP throughout the study if possible At all post randomization visits BP measurements were to be made at trough defined as 24 hours (plusmn4 hours) after receiving study medication All measurements were to be determined prior to the patient taking the scheduled dose of study medication In the
DCP1PM Page 62 10182006
Clinical Pharmacology Review NDA 19-962 Toprol-XL 10182006
event that the patient accidentally took study medication on the day of the scheduled visit the visit was to be rescheduled within 24 to 48 hours
Study2 307B
4113 Pharmacokinetics A 48-hour washout period prior to sampling was required for all patients including patients who entered the 52-week study and then decided to participate in the serial PK portion of the study All patients were to have a 15-mL blood sample collected into a heparinized Vacutainer tube 24 hours (plusmn2 hour) following the last dose of TOPROL-XL (ie trough measurement) at Visit 18 (or a the time of premature discontinuation) except for patients who participated in the serial PK portion of the study and had blood sampling performed at Visit 18 For patients participating in the serial PK portion of the study blood samples (15 mL) were to be collected into heparinized Vacutainer tubes and obtained at Hour 0 (predose) and at 1 2 3 4 6 8 10 and 24 hours after administration of a single 25 mg dose of TOPROL-XL following a 48-hour washout period After the last blood sample was obtained the patient was to startresume the prescribed dose of TOPROL-XL heshe was receiving prior to PK sampling
Patient Disposition Chart (completion or discontinuation)
Overall a total of 31 patients at 8 centers were enrolled in the serial PK portion of the study Of these 31 patients 27 had plasma concentration data available and were included in the analyses Four patients were excluded from the analyses because their plasma concentrations were not quantifiable (Nos 047-009 and 047-021) or because only whole blood samples were analyzed (Nos 005-002 005-003)
DCP1PM Page 63 10182006
Clinical Pharmacology Review NDA 19-962 Toprol-XL 10182006
Table 3 Subject Demographics for Patients Providing Serial Blood Samples
Missing Data Twenty-six patients did not have blood samples obtained for analysis of metoprolol concentrations in either the 16-week (n=7) or 52-week (n=19) studies Among patients with plasma samples 14 (14) in the 52-week study and 13 (13) in the 16-week study had trough plasma metoprolol concentrations that were below the LLQ Therefore data from a total of 99 patients were included in this analysis
Assay Metoprolol plasma levels were assayed using high-performance liquid chromatography tandem mass spectrometric detection methods having limit of quantitation (LOQ) of 1 ngmL The method was validated in the linear range 1 to 1000 ngmL Precision was less than or equal to 109 Accuracy ranged from 940 to 1013 Pharmacodynamics Not applicable
Data Checking SAS was used to format and check data Additionally visual inspection of several randomly selected subject data was carried out
DCP1PM Page 64 10182006
Clinical Pharmacology Review NDA 19-962 Toprol-XL 10182006
Models
Overview The sponsorrsquos stated assumptions underlying this modeling analysis are
1 Rich sampling data collected from 30 subjects in 307B Study can be used to adequately characterize the structural pharmacokinetic model of metoprolol
2 Structural pharmacokinetic models of metoprolol at other dose strength are identical to that at 25 mg
3 Metoprolol exhibits a linear pharmacokinetics in the dose ranges studied 4 Steady-state pharmacokinetics of metoprolol has been reached at the time of blood
sampling in Study 307A 5 Metoprolol accounts for the blood pressure effect in the study 6 Existing various disease states in the patients have no impact on the pharmacokinetics
of metoprolol and pharmacodynamics of the blood pressure reduction in the study 7 Concomitant medications if existed do not have any effects on the pharmacokinetics
of metoprolol and pharmacodynamics of the blood pressure reduction in the study
Reviewer Comment The sponsorrsquos assumptions appear reasonable based on existing metoprolol PKPD information
Pharmacokinetics
4114 PK Structural Model Several PK models were tested to identify the structural model Flip-flop absorption was taken into consideration based on general PK characteristics following administration of sustained release tablets and observed data in the current study (serial PK samples)
The models tested included linear 1- and 2-compartment PK models with the following characteristics (focused on flip-flop models)
bull first-order absorption with and without absorption lag time (NONMEM subroutines ADVAN2 and ADVAN4)
bull zero-order absorption with and without absorption lag time (NONMEM subroutines ADVAN1 and ADVAN3)
bull simultaneous zero- and first-order absorption from the absorption compartment The models were parameterized in terms of CLF and VF
Ultimately the 2-compartment model with first order flip-flop absorption an absorption lag time and 2 residual error terms was selected as the structural model of metoprolol The model scheme is presented in the following Figure 1 Figure 1 PK Compartmental Model
DCP1PM Page 65 10182006
Clinical Pharmacology Review NDA 19-962 Toprol-XL 10182006
4115 PK Covariate Model Covariate models were developed to account for the potential impact of the following covariates and derived covariates on metoprolol PK
Continuous variables bull Age (AGE years) bull Body weight (WT kg) bull Body surface area (BSA m2) calculated from WT and HT (cm) using the height
weight formula BSA=0024265 x WT 05378 x HT03964 bull Ideal body weight (IBW kg) calculated as - Males IBW=50+(HTndash150)25 and
for Females IBW=45+(HTndash150)25 bull Dose (DOSE mg of Toprol-XL)
Categorical variables bull Gender (SEX) - Male 0 - Female 1 bull Race (RACE) - Caucasian 0 - Black 1 - Asian 2 - Other 3
PK covariate effects were modeled as follows
Effects of continuous covariates (AGE WT BSA IBW and DOSE) were normalized to the corresponding median value across a dataset such that continuous covariates were related to structural PK parameters in a power function as described below
where Θ is the fixed-effect parameter of a covariate estimated by the NONMEM program covariate value is the observed covariate value and PK typical value is the typical value of the PK parameter estimated by NONMEM Effects of categorical covariates (SEX and RACE) are related to structural PK parameters by fractional changes of dummy variables
DCP1PM Page 66 10182006
Clinical Pharmacology Review NDA 19-962 Toprol-XL 10182006
Where Θ is the fixed-effect parameter of a covariate estimated by the NONMEM program covariate is the dummy variable value and modified in the control streams and PK typical value is the typical value of this PK parameter as estimated by NONMEM
Median values of all covariates in the dataset for population PK analysis are presented in Table A
Table A Summary of patient covariates and Toprol-XL doses in the data for population PK analysis
Two Steps were included in the modeling of covariates
Step 1 Forward Addition The covariates were subjected to a stepwise forward selection algorithm using a likelihood ratio test based on a change in MOF values from the base model A significant covariate reduced the MOF more than 660 (chi-square distribution plt001 degrees of freedom [df]=1)
Step 2 Backward deletion (Excluding procedures for covariate effect) The covariates in the full model acquired in Step 1 were subjected to a backward deletion algorithm 1 covariate was deleted at a time using a likelihood ratio test based on a change in MOF values A covariate was determined to be statistically significant if the change in MOF after its deletion from the breakdown model was increased by more than 1083 (chi-square distribution plt0001 df=1)
4116 PK Random Variance Models An exponential error model was used to characterize inter-patient variability based upon the assumption that random effects for PK parameters were not correlated among PK parameters No other error models for eta were evaluated by the applicant or by this Reviewer The retention of ETA values for each PK parameter in the structural model was confirmed by sequentially fixing each ETA value at zero and comparing each resultant MOF with the MOF obtained when all ETA values were retained in the model (see Table 6)
DCP1PM Page 67 10182006
Clinical Pharmacology Review NDA 19-962 Toprol-XL 10182006
The residual model was modeled by an additive model two error terms were used one for error associated with trough samples and the other with serial samples
Reviewer Note Use of an exponential model appears reasonable
Pharmacodynamics
4117 PKPD Structural Model The equations for the structural models are shown below
1 Metoprolol Ctrough The relationships between the observed metoprolol concentrations (Ctrough) and hemodynamic changes were investigated using 4 direct-link models namely a linear model a log-linear model and Hillrsquos sigmoid Emax PKPD model with and without a baseline
2 The relationships between Cmax or AUC0ndash24 and hemodynamic changes were investigated using 2 direct-link models a linear model and a log-linear model
4118 PKPD Covariate Model The inclusion and exclusion procedures of covariate effect on the selected PKPD base model to obtain a selected final PKPD model were identical to those in the covariate evaluation in the population PK models as described previously in PK Covariate Model DCP1PM Page 68 10182006
Clinical Pharmacology Review NDA 19-962 Toprol-XL 10182006
Table B Baseline demographic and covariate characteristics
4119 PKPD Random Variance Models An exponential error model was used by the applicant to model inter-individual variability The retention of a random effect parameter ETA in each selected PKPD structural model was then evaluated by sequentially fixing each ETA value at zero and comparing each resultant MOF with the MOF obtained when all ETA values were retained in the model (plt005) This step reduced over-parameterization by deleting unnecessary random-effect parameters from the structural model to obtain the base model
Reviewer Note The study design precludes assessment of inter-individual variability or random error because only one dose record was available per patient Consequently the model should not have included eta terms It is noted that the sponsor ultimately dropped the eta term in the final model
DCP1PM Page 69 10182006
Clinical Pharmacology Review NDA 19-962 Toprol-XL 10182006
Model Selection
PK Initial Model Selection
PK Base Model to Final Model The selection of the most appropriate PK base model for a metoprolol PK was based upon the following criteria a significant reduction in MOF as compared to the baseline model and asymptotic chi-square distribution based on the likelihood ratio test or AIC (plt005) as compared to the other structural models This selected PK base model was then subject to a covariate evaluation The population PK model bearing all surviving covariate parameters with statistical significance became the penultimate final model If 1 of the body size parameters (WT BSA and HT) was not in the model the penultimate final model became the final model If body size parameters were in the model they were sequentially replaced by other body size parameters in the regression submodel for each PK parameter The best body size parameter was then selected on the basis of lowest MOF to form the final model
PK Final Model Selection Simulations and visual inspections based on goodness of fit plots were used to qualify and validate the model The goodness-of-fit of the final model was evaluated graphically by comparing population and individual predictions of metoprolol concentrations with observed metoprolol concentrations along the line of unity and by visual inspection of the following plots of population-weighted residuals (WRES) for the final population model 1 Population-weighted residuals (WRES) versus population-predicted concentrations (PRED) 2 WRES versus time after first drug administration in each patient 3 WRES versus all covariates evaluated WRES were generally expected to be distributed homogenously around zero for PRED time after administration and covariates For those 27 patients with serial samples goodness-of-fit of the plasma concentration-time profile for each individual was visually inspected The linear relationship between their AUClast values from the observed data and those from the simulated data (final model) was examined
The predictive performance of the final population PK model including covariates was evaluated by comparing typical values of PK parameters with the mean of individual Bayesian estimates or individual values of PK parameters with the results from non-compartmental analysis for patients with serial samples Steady-state metoprolol plasma concentration-time profiles from 0ndash24 hours at the interval of 15 minutes (025 hour) were calculated using the post hoc Bayesian estimated PK parameter obtained for 65 patients included in the PKPD relationship using the following equation
DCP1PM Page 70 10182006
Clinical Pharmacology Review NDA 19-962 Toprol-XL 10182006
PKPD Initial and Final Model Selection A similar approach to that of PK model selection was adopted for PKPD Each of the above-mentioned PKPD models with random effects was identified by curve-fitting the dataset Initial selection of the PKPD structural model was based upon a significant reduction in MOF (plt005) as compared to the baseline model and reasonable PKPD parameter estimates Software
Nonlinear mixed-effect modeling (NONMEM) software (Version V level 11 Globomax Hanover MD) was used in the population PK analysis PK model fitting was accomplished using first-order (FO) approximation methods For PKPD model fitting the first-order conditional estimation (FOCE) with eta-epsilon interaction method in NONMEM was used for all model runs
SAS software (Version VIII Cary NC) was employed to prepare datasets according to the format required by the NONMEM program (Boeckmann et al 1991) Microsoftreg Excel 2000 (Redmond WA) and S-PLUS 2000 (Professional Release 2 MathSoft Inc Cambridge MA) were used to perform exploratory graphical exposure calculation and statistical analyses according to the format required by the NONMEM program (Boeckmann et al 1991) SAS command files logs and listings pertaining to data file conversion and merging were reviewed by an independent analyst Datasets were stored in SAS data frames combined and exported to Excel and then to ASCII files before fitting to the model
Datasets were prepared and pooled in a NONMEM-compliant format using SAS software by the Programming Group Clinical Information Sciences at AstraZeneca Wilmington Delaware SAS command files logs and listings pertaining to file conversion and merging were provided and found to be acceptable The contents of both datasets (toprolkatcsv for PK modeling and cppd2csv for PKPD modeling) were included
DCP1PM Page 71 10182006
Clinical Pharmacology Review NDA 19-962 Toprol-XL 10182006
toprolkatcsv was not provided electronically in a SAS format however this reviewer generated a similar dataset using the applicantrsquos criteria
Reviewer Comment The software and data assembly methods appeared adequate
DCP1PM Page 72 10182006
Clinical Pharmacology Review NDA 19-962 Toprol-XL 10182006
Results and Discussion Design Adequacy
Overall the trial designs appeared adequate to evaluate metoprolol population PK and PKPD in pediatric patients receiving Toprol XL However the design could have been further optimized by increasing the sampling points particularly in the absorption phase Due to the limited number of samples in the absorption phase it was not possible to accurately characterize the absorption model first order vs zero order or mixed first and zero order Additionally collection of mainly trough samples limits the ability to accurately estimate measures such as Cmax that are not directly related to Ctrough particularly if multiple compartments are present Consequently Cmax estimations are unlikely to be accurate Finally most patients provided only one trough sample thus inter-individual variability could not be adequately captured and may have limited the utility of the modeling exercise particularly in PKPD where the random effect could not be accurately characterized Ultimately there was no random variable in the final PKPD model (ie eta was set to zero) Data Integrity
This reviewer checked the data visually by randomly selecting data from patients included in the population modeling and comparing to data in the study report (source data) Overall the data integrity appeared acceptable The applicant observed the following guidelines that appeared acceptable No datum from any study participant with a protocol violation that was thought to materially impact the analysis was included The dataset contained data from only those study participants who could be evaluated ie with all the last dosing datetime blood sampling datetime plasma drug concentrations and demographic covariates
Data that were excluded (n = 62 samples) from the model were as follows One sample from an apparent poor metabolizer Two samples collected gt 96 hours post dose From 307B 10 trough samples lt LOQ From 307A 17 samples lt LOQ Thirty-samples from serial data that were lt LOQ or whole blood samples Model and Model Selection
Base Model
41110 Pharmacokinetic Model description The base PK model was a standard two compartment model that incorporated lag time and flip-flop kinetics The key features of the model were flip-flop was insured by making the value of ke gt ka in the clearance equation Additionally lag time was restricted to a value of 2 hours or less and concentrations were log transformed consequently all concentrations (F) = 0 were given individual predicted concentrations of zero Finally there were two residual error terms one for serial samples and the other for trough samples DCP1PM Page 73 10182006
Clinical Pharmacology Review NDA 19-962 Toprol-XL 10182006
Key equations were as follows
KA = THETA(1)EXP(ETA(1)) V2 = THETA(2)EXP(ETA(2)) CL = (THETA(1)THETA(2)+THETA(3))EXP(ETA(3)) Q = THETA(4)EXP(ETA(4)) V3 = THETA(5)EXP(ETA(5)) ALAG1=THETA(6)EXP(ETA(6))
41111 PK Parameter estimation results Table 1 Summary of PK parameters in the metoprolol population PK base model (per applicant)
41112 Goodness of fit The applicant provided the following goodness-of-fit plots (Figure 1)
Reviewer Note The goodness-of-fit plots were reproduced by this Reviewer (see Appendix) with minor modifications
Figure 1 Goodness of fit plots for Base Model
DCP1PM Page 74 10182006
Clinical Pharmacology Review NDA 19-962 Toprol-XL 10182006
Base PK Model Selection The MOF values of all structural model candidates tested are presented in Table 2 Model selection was based primarily on MOF values the lower MOF the better the model The applicant reports that in general MOF values generated by a conventional absorption model (ie absorption rate is faster than elimination rate) and a flip-flop absorption model (ie absorption rate is slower than elimination rate) were identical
Reviewer Comment The existence of flip-flop kinetics appears plausible based on data provided and general patterns for sustained release formulations Consequently the use of flip-flop kinetics for the bulk of the modeling exercise appears reasonable
General conclusions from the information in Table 2 are First order input is better than zero order input Two compartment model is better than one compartment model Lag time presence is better than lack of lag time Two residual error terms are better than one residual error term It should also be noted that several other models led to unsatisfactory completion of the run and were not considered further
DCP1PM Page 75 10182006
Clinical Pharmacology Review NDA 19-962 Toprol-XL 10182006
Table 2 Comparison of Structural PK Models
Reviewer Comment The selected structural model appears appropriate based on the data
Base Model The deletion of ETA for V2 did not change the MOF value suggesting that ETA for V2 should be deleted to avoid an over-parameterized warning (Table 3) This was consistent with the estimated parameter value of ETA for V2 being 648 x 10ndash9 a very small value Therefore the base model was selected by deleting the ETA for V2 from the structural model
Reviewer Comment on Eta deletion for V2 Deletion of eta for V2 is acceptable based on the empirical data however from a physiological perspective deletion of eta is problematic Generally one anticipates inter-individual differences in volume of distribution In this case it appears that the error associated with V2 may have been randomly shifted to V3 and or Q terms as the three DCP1PM Page 76 10182006
Clinical Pharmacology Review NDA 19-962 Toprol-XL 10182006
terms are interrelated This potential shift in error is supported by the fact that the V2 eta value increases significantly (by several orders of magnitude- 10-5 vs 100) when eta for Q and or V3 is fixed However when Q or V3 are fixed minimization is successful but Q and V3 are not accurately estimated Accounting for the possible error shift is a complex process and goes beyond the scope of this reviewer thus deletion of eta associated with V2 was considered acceptable for the remainder of the modeling evaluation
Table 3 Structural elements tested in the metoprolol population PK structural model (p lt 0005)
Final PK Model
41113 Model description The key feature of the final model is the inclusion of the covariate effects of age on Q and weight on CL in the population PK model
Key Equations CL = (THETA(1)THETA(2)+THETA(3)+EWT)EXP(ETA(2)) Q = THETA(4)EAGEEXP(ETA(3))
Including Covariate Effects As previously described covariate effects were assessed by forward addition and backward deletion Most covariates did not significantly change MOF however BSA significantly affected CL and Age affected Q Consequently these covariates were included in the penultimate final model
DCP1PM Page 77 10182006
Clinical Pharmacology Review NDA 19-962 Toprol-XL 10182006
Reviewer Note BSA is derived form WT and HT covariates implying BSA is highly correlated to these two covariates (Figure 2) weight is the most suitable (practical covariate) as it is readily measured Furthermore weight and BSA produced the same MOF (Table 4) whereas MOF with height was more positive (less significant)
Figure 2 Plot of BSA vs Body Weight
The data in Table 4 support selection of the final model
Table 4 Covariate elements tested in the metoprolol population PK penultimate final model (plt0005)
The applicant acknowledges that mechanism(s) accounting for the impact of age on QF are not clear However since distribution clearance has little effect on metoprolol plasma exposure further investigation is not needed
41114 PK Parameter estimation results As shown in Table 5 PK parameters were estimated fairly precisely by the final model
Table 5 PK Parameter Estimates using Final Model
DCP1PM Page 78 10182006
Clinical Pharmacology Review NDA 19-962 Toprol-XL 10182006
41115 Goodness of fit The goodness-of-fit plots provided by the applicant show good precision Figure 5 Goodness of fit plots for final PK model
DCP1PM Page 79 10182006
Clinical Pharmacology Review NDA 19-962 Toprol-XL 10182006
PK Model Qualification The post hoc Bayesian-estimated AUC (simulated) obtained for the 27 patients with serial plasma samples are plotted against the observed (AUCt) The correlation was high (R2 gt 099) Figure 6 AUClast from observed data versus AUCt from model simulation in the 27 patients providing serial plasma samples
Regression line Y= 4514 + 08976 X R2 = 09957
The graphical validation of the final metoprolol population PK model validation against covariates evaluated is presented in Figure 6
Figure 7 Graphical validation of covariates
DCP1PM Page 80 10182006
Clinical Pharmacology Review NDA 19-962 Toprol-XL 10182006
There was no systematic bias in weighted residuals for any covariates evaluated suggesting that the final model included all appreciable effects of available covariates (Figure)
The effects of weight on metoprolol CLF are illustrated in Figure 8 where Bayesian post hoc estimates of CLF are plotted against weight and overlaid by the model-predicted line Overall the model appeared to fit the data well
Figure 8 Plot of CLF vs Body weight
The effects of AGE on metoprolol QF are illustrated in Figure 9 where Bayesian post hoc estimates of QF are plotted against AGE and overlaid by the model-predicted line Figure 9 Plot of QF vs Age
DCP1PM Page 81 10182006
Clinical Pharmacology Review NDA 19-962 Toprol-XL 10182006
Reviewer Note The applicant indicated that attempts to run the final model using the first-order conditional estimation method resulted in termination errors Therefore the parameter estimates obtained by the FO method were reported as the final parameter estimates
Conclusion Regarding Population PK Modeling Overall the sponsorrsquos population PK modeling is acceptable
PKPD Model and Model Selection
PKPD Base Model PharmacokineticPharmacodynamic Model description The key feature of the model was a lack of random variance term for the slope (since only single data points were available per subject) and inclusion of baseline effect
Key equations were as follows E0 = THETA(1)EXP(ETA(1)) M = THETA(2) Y = E0 + MLOG(AUC) + EPS(1)
The control stream provided in the appendix is that for DBP (provided by sponsor) The control stream for SBP is comparable with appropriate substitution for BP type
It should be noted that only the log-linear and linear PKPD models were considered suitable for AUC and Cmax For this review only AUC estimates were considered reliable as Cmax estimates could not be accurately determined based on the sampling scheme Consequently the remainder of this review focuses on AUC information although Ctrough and Cmax data are displayed for reference
Bayesian estimates from PK modeling are summarized in Table 1
Table 1 Bayesian estimates of metoprolol PK exposure for those patients included in the PKPD analysis (N=65)
DCP1PM Page 82 10182006
Clinical Pharmacology Review NDA 19-962 Toprol-XL 10182006
PKPD Model Selection (initial and final) The log-linear model was adopted as the base model for this PKPD relationship since it improved the MOF significantly (Table 2) The ETA parameter for the slope was pre-eliminated for the purpose of model parsimony The intercept and slope in this log-linear model for AUC(0-24) did not bear ETA parameter therefore no covariates had impact on either parameter in the model
Reviewer Note The intercept should not have borne an eta term because individual subjects provided only one data point Consequently fixing eta to zero or deleting eta in the final model is appropriate No further model development was required after eta was eliminated and the base model was equivalent to the final model
Table 2 Base population PKPD models tested for the change in SBP
41116 PKPD Parameter estimation results The final PKPD parameter estimates are presented in Table 3
Table 3 Summary parameters in the final PKPD model for the change in SBP using trough plasma level Parameter Explanation Estimate SE ()b
DCP1PM Page 83 10182006
Clinical Pharmacology Review NDA 19-962 Toprol-XL 10182006
Model Qualification Based on the relatively low R2 value and as shown in Figure there is a poor correlation between change in SBP and log AUC
Figure 1 Relationship between change in SBP and AUC (line generated from modeling)
Overall goodness-of-fit of the model was considered to be poor probably due to the high variability in the measurements Consequently the precision of the model parameter estimates was not considered to be very reliable These parameters have little clinical usefulness and can be treated only as an indication of trends ie more hemodynamic effects can be potentially achieved when high Toprol-XL doses are given Clinical dose adjustment based on these PKPD parameters is not recommended
Reviewerrsquos Supplemental Analyses A supplemental PKPD analyses was conducted using simple linear regression since the population model did not improve the fit Overall eta made an insignificant contribution to the overall model The results of the analyses were similar to the population analyses A series of regression analyses were conducted and are presented in Table 4
The applicant notes that the preliminary modeling exercise found that there was no difference in the PKPD modeling results using different hemodynamic data formats (ie change in the measurements percent change in the measurements or actual BP measurements) This finding was confirmed by this reviewer (see Table 4)
DCP1PM Page 84 10182006
Clinical Pharmacology Review NDA 19-962 Toprol-XL 10182006
Table 4 Supplemental PKPD Regression Analyses Conducted by Reviewer Model (liner regression) Intercept (I) Slope (m) R2 Probability RSBP = mISBP + I 3957 -035 01626 0009 PSBP = mISBP + I 2524 -023 01252 00038 PSBP = mRSBP + I 0005 074 09891 lt 00001 RSBP = mlogAUC + I 651 -221 0060 00493 RSBP = mDose + I -751 0006 00026 06878 RSBP = mDose^ + I -312 -111 004 02711 RSBP = mlogAUC + nISBP + I 5303 -221 (m)
-035 (n) 02230 0001
RSBPplc = mAUC + I -667 -0003 00458 00871 RSBPplc = mlogAUC + I 461 -2208 00600 00493 RPUL = mlogAUC + I 1868 -405 01102 00069 Symbols in table similar to population PK model without eta term RSBP- change of SBP without placebo correction ISBP- initial (baseline) SBP RPUL- change in HR without placebo correction Dose- in mg where placebo is included as 0 mg PSBP- percentage change of SBP without placebo correction
Conclusion Regarding Population PKPD Modeling Overall the sponsorrsquos population PKPD modeling is acceptable No dose adjustment conclusion can be made from this modeling however an exposure-response relationship was established for AUC and reduction in SBP
Discussion
The significance of the results 1 Provide estimates of PK measures and plasma exposure in pediatric population These data can be compared to adult exposure to determine if exposure differences impact drug effectiveness The main challenge in comparing pediatric data to adult data is different modeling schemes formulations and methods were used in the two populations
2 PKPD findings are not sufficiently precise to provide a dose adjustment algorithm however the PKPD analyses provides rationale for proposed titration as increasing exposure (doses) may improve efficacy (reduction in SBP) Ultimately the risk-benefit analyses overrides PKPD assessment for dose adjustment drug will be titrated thus reliance on PKPD information is not critical The proposed dose 10 mgkg appears suitable based on available information It is unclear from the studies if there should be an initial maximum dose although the sponsor has proposed 50 mg as the maximum initial dose The proposed pediatric starting dose on a mgkg basis is within the range of starting adult doses (25 ndash 100 mg) assuming an adult weighs 70 kg
3 Cumulative information form dose-response study indicates that Toprol XL has effectiveness in children however the most effective dose is unclear Since the drug can be titrated determining the initial optimal dose does not appear critical As proposed by the applicant dosing is started at a ldquolowrdquo dose that can be up-titrated if needed
DCP1PM Page 85 10182006
Clinical Pharmacology Review NDA 19-962 Toprol-XL 10182006
4 The results did not adequately address the potential impact of CYP2D6 metabolic status for pediatric patients taking Toprol XL There were an insufficient number of patients to make this assessment
5 Covariate effects do not appear significant only body weight significantly affects clearance However a worst case scenario can occur with a person that has a low body weight and is a poor metabolizer this will result in very high possibly supra-therapeutic exposure Age does not impact apparent oral clearance so an age-dependent dose adjustment is not needed for children over 6 years old In essence all children over six years old can initiate therapy at 10 mgkg
The validity of the results Overall the results produced by the sponsor appear valid and the sponsor used a sound modeling approach However alternative approaches that could have been adopted may have improved the outcome of the analyses Three of these approaches are presented below 1 Additional PK samples should have been collected during the absorption phase and
throughout the dosing interval to improve the modelrsquos performance Specifically additional samples collected during the absorption phase may have unambiguously identified the actual absorption input function (eg first order zero order mixed first and zero order) First order input was selected for the analyses although the dosage form is reported to exhibit zero order kinetics in adults It is possible that the input rate in children differs from that in adults but unlikely It should be noted that absorption kinetics in children is often erratic due to multiple factors (eg regioshyselective absorption incomplete gastric emptying and inconsistent absorption) so it is unclear if additional samples would have definitively identified the absorption function However additional non-trough samples may have helped in estimating key PK measures such as V and Cmax The final model did not have an eta associated with V which is atypical Collection of additional samples on different visits may have helped estimate potential inter-occasion variability It should be noted that AUC was estimated precisely for subjects providing serial samples but these subjects were not necessarily included in the PKPD analyses Ideally the PKPD modeling should have been conducted primarily in subjects who had accurate PK measures
2 The PKPD design could have been modified to potentially improve the utility of the analyses Specifically there should have been better placebo matching procedures to minimize the potential impact of the placebo effect This matching could have been improved by ensuring all patients on placebo had the same titration schedule and number of tablets It is noted that the model had a poor predictive performance that was mainly attributed to the high degree of variability in the PD measures Potentially other PD markers could have been explored that have less inherent variability One such marker is the degree of beta blockade using exercise heart rate (EHR) reduction this marker has been used extensively for metoprolol in adult subjects However use of EHR in the pediatric setting may be challenging
DCP1PM Page 86 10182006
Clinical Pharmacology Review NDA 19-962 Toprol-XL 10182006
Comments to sponsor
In future pharmacometric studies you should consider the following 1 collect sufficient (multiple) samples from individual subjects to allow assessment
of inter-occasion variability and estimation of inter-individual variability (eta) for all relevant parameters
2 placebo groups should be identically matched across all dose groups (eg same titration schedule and number tablets) to minimize potential bias or differences in the placebo effect
Comments to medical reviewer
1 The sponsor has adequately characterized metoprolol PK in the studied pediatric population The PK characterization could have been further optimized by obtaining additional samples over the entire dosing interval (eg during the absorption phase and elimination phase) on multiple occasions rather than on one occasion primarily at trough
2 A dose-response relationship could not be established using the protocol specified analysis approach The outcome of the dose-response relationship appeared highly dependent on the ldquoplacebo effectrdquo suggesting that the placebo group may not have been appropriate One should consider re-evaluating the dose-response precisely matched placebo groups (eg all placebo patients have identical number of tablets and titration schedule)
3 Based on the PKPD analysis plasma exposure (AUC) explains lt 10 of the response (reduction in systolic blood pressure) thus has limited clinical utility However the PKPD relationship suggests that there is a trend for increased response with increased exposure (dose driven)
4 Overall information from the dose-response study suggests that Toprol- XL is effective in the pediatric population The optimal initial dose 02 10 or 20 mgkg or the maximum safe and effective dose cannot be determined from the information provided It is noted that the 02 mgkg dose is unlikely to be effective as plasma concentrations achieved at this dose are unlikely to be effective (most concentrations lt LOQ and lower than effective adult concentrations) The 10 mgkg (proposed by applicant) appears to be a reasonable initial dose The labeling should reflect the regimens studied
DCP1PM Page 89 10182006
Clinical Pharmacology Review NDA 19-962 Toprol-XL 10182006
Appendix
DCP1PM Page 90 10182006
Clinical Pharmacology Review NDA 19-962 Toprol-XL 10182006
DCP1PM Page 91 10182006
Clinical Pharmacology Review NDA 19-962 Toprol-XL 10182006
DCP1PM Page 92 10182006
Clinical Pharmacology Review NDA 19-962 Toprol-XL 10182006
DCP1PM Page 93 10182006
Clinical Pharmacology Review NDA 19-962 Toprol-XL 10182006
DCP1PM Page 94 10182006
Clinical Pharmacology Review NDA 19-962 Toprol-XL 10182006
DCP1PM Page 95 10182006
Clinical Pharmacology Review NDA 19-962 Toprol-XL 10182006
Table 15 Control streams for final log-linear PKPD model for the change in DBP using metoprolol Cmax as the measure of exposure
Truncated NONMEM reports for base model identification for PKPD relationship in change of SBP (per sponsor)
DCP1PM Page 96 10182006
Clinical Pharmacology Review NDA 19-962 Toprol-XL 10182006
Reported PD information^
^ Under metoprolol regimen CRZ0K is Toprol XL
DCP1PM Page 97 10182006
Clinical Pharmacology Review NDA 19-962 Toprol-XL 10182006
Table Results of randomised double-blind comparative trials evaluating antihypertensive efficacy of metoprolol formulations or other antihypertensives
DCP1PM Page 98 10182006
---------------------------------------------------------------------------------------------------------------------
---------------------------------------------------------------------------------------------------------------------
---------------------
This is a representation of an electronic record that was signed electronically and this page is the manifestation of the electronic signature
s
Robert Kumi 10182006 045635 PM BIOPHARMACEUTICS
Patrick Marroum 10192006 050811 PM BIOPHARMACEUTICS

Clinical Pharmacology Review NDA 19-962 Toprol-XL 10182006
Where Θ is the fixed-effect parameter of a covariate estimated by the NONMEM program covariate is the dummy variable value and modified in the control streams and PK typical value is the typical value of this PK parameter as estimated by NONMEM
Median values of all covariates in the dataset for population PK analysis are presented in Table A
Table A Summary of patient covariates and Toprol-XL doses in the data for population PK analysis
Two Steps were included in the modeling of covariates
Step 1 Forward Addition The covariates were subjected to a stepwise forward selection algorithm using a likelihood ratio test based on a change in MOF values from the base model A significant covariate reduced the MOF more than 660 (chi-square distribution plt001 degrees of freedom [df]=1)
Step 2 Backward deletion (Excluding procedures for covariate effect) The covariates in the full model acquired in Step 1 were subjected to a backward deletion algorithm 1 covariate was deleted at a time using a likelihood ratio test based on a change in MOF values A covariate was determined to be statistically significant if the change in MOF after its deletion from the breakdown model was increased by more than 1083 (chi-square distribution plt0001 df=1)
4116 PK Random Variance Models An exponential error model was used to characterize inter-patient variability based upon the assumption that random effects for PK parameters were not correlated among PK parameters No other error models for eta were evaluated by the applicant or by this Reviewer The retention of ETA values for each PK parameter in the structural model was confirmed by sequentially fixing each ETA value at zero and comparing each resultant MOF with the MOF obtained when all ETA values were retained in the model (see Table 6)
DCP1PM Page 67 10182006
Clinical Pharmacology Review NDA 19-962 Toprol-XL 10182006
The residual model was modeled by an additive model two error terms were used one for error associated with trough samples and the other with serial samples
Reviewer Note Use of an exponential model appears reasonable
Pharmacodynamics
4117 PKPD Structural Model The equations for the structural models are shown below
1 Metoprolol Ctrough The relationships between the observed metoprolol concentrations (Ctrough) and hemodynamic changes were investigated using 4 direct-link models namely a linear model a log-linear model and Hillrsquos sigmoid Emax PKPD model with and without a baseline
2 The relationships between Cmax or AUC0ndash24 and hemodynamic changes were investigated using 2 direct-link models a linear model and a log-linear model
4118 PKPD Covariate Model The inclusion and exclusion procedures of covariate effect on the selected PKPD base model to obtain a selected final PKPD model were identical to those in the covariate evaluation in the population PK models as described previously in PK Covariate Model DCP1PM Page 68 10182006
Clinical Pharmacology Review NDA 19-962 Toprol-XL 10182006
Table B Baseline demographic and covariate characteristics
4119 PKPD Random Variance Models An exponential error model was used by the applicant to model inter-individual variability The retention of a random effect parameter ETA in each selected PKPD structural model was then evaluated by sequentially fixing each ETA value at zero and comparing each resultant MOF with the MOF obtained when all ETA values were retained in the model (plt005) This step reduced over-parameterization by deleting unnecessary random-effect parameters from the structural model to obtain the base model
Reviewer Note The study design precludes assessment of inter-individual variability or random error because only one dose record was available per patient Consequently the model should not have included eta terms It is noted that the sponsor ultimately dropped the eta term in the final model
DCP1PM Page 69 10182006
Clinical Pharmacology Review NDA 19-962 Toprol-XL 10182006
Model Selection
PK Initial Model Selection
PK Base Model to Final Model The selection of the most appropriate PK base model for a metoprolol PK was based upon the following criteria a significant reduction in MOF as compared to the baseline model and asymptotic chi-square distribution based on the likelihood ratio test or AIC (plt005) as compared to the other structural models This selected PK base model was then subject to a covariate evaluation The population PK model bearing all surviving covariate parameters with statistical significance became the penultimate final model If 1 of the body size parameters (WT BSA and HT) was not in the model the penultimate final model became the final model If body size parameters were in the model they were sequentially replaced by other body size parameters in the regression submodel for each PK parameter The best body size parameter was then selected on the basis of lowest MOF to form the final model
PK Final Model Selection Simulations and visual inspections based on goodness of fit plots were used to qualify and validate the model The goodness-of-fit of the final model was evaluated graphically by comparing population and individual predictions of metoprolol concentrations with observed metoprolol concentrations along the line of unity and by visual inspection of the following plots of population-weighted residuals (WRES) for the final population model 1 Population-weighted residuals (WRES) versus population-predicted concentrations (PRED) 2 WRES versus time after first drug administration in each patient 3 WRES versus all covariates evaluated WRES were generally expected to be distributed homogenously around zero for PRED time after administration and covariates For those 27 patients with serial samples goodness-of-fit of the plasma concentration-time profile for each individual was visually inspected The linear relationship between their AUClast values from the observed data and those from the simulated data (final model) was examined
The predictive performance of the final population PK model including covariates was evaluated by comparing typical values of PK parameters with the mean of individual Bayesian estimates or individual values of PK parameters with the results from non-compartmental analysis for patients with serial samples Steady-state metoprolol plasma concentration-time profiles from 0ndash24 hours at the interval of 15 minutes (025 hour) were calculated using the post hoc Bayesian estimated PK parameter obtained for 65 patients included in the PKPD relationship using the following equation
DCP1PM Page 70 10182006
Clinical Pharmacology Review NDA 19-962 Toprol-XL 10182006
PKPD Initial and Final Model Selection A similar approach to that of PK model selection was adopted for PKPD Each of the above-mentioned PKPD models with random effects was identified by curve-fitting the dataset Initial selection of the PKPD structural model was based upon a significant reduction in MOF (plt005) as compared to the baseline model and reasonable PKPD parameter estimates Software
Nonlinear mixed-effect modeling (NONMEM) software (Version V level 11 Globomax Hanover MD) was used in the population PK analysis PK model fitting was accomplished using first-order (FO) approximation methods For PKPD model fitting the first-order conditional estimation (FOCE) with eta-epsilon interaction method in NONMEM was used for all model runs
SAS software (Version VIII Cary NC) was employed to prepare datasets according to the format required by the NONMEM program (Boeckmann et al 1991) Microsoftreg Excel 2000 (Redmond WA) and S-PLUS 2000 (Professional Release 2 MathSoft Inc Cambridge MA) were used to perform exploratory graphical exposure calculation and statistical analyses according to the format required by the NONMEM program (Boeckmann et al 1991) SAS command files logs and listings pertaining to data file conversion and merging were reviewed by an independent analyst Datasets were stored in SAS data frames combined and exported to Excel and then to ASCII files before fitting to the model
Datasets were prepared and pooled in a NONMEM-compliant format using SAS software by the Programming Group Clinical Information Sciences at AstraZeneca Wilmington Delaware SAS command files logs and listings pertaining to file conversion and merging were provided and found to be acceptable The contents of both datasets (toprolkatcsv for PK modeling and cppd2csv for PKPD modeling) were included
DCP1PM Page 71 10182006
Clinical Pharmacology Review NDA 19-962 Toprol-XL 10182006
toprolkatcsv was not provided electronically in a SAS format however this reviewer generated a similar dataset using the applicantrsquos criteria
Reviewer Comment The software and data assembly methods appeared adequate
DCP1PM Page 72 10182006
Clinical Pharmacology Review NDA 19-962 Toprol-XL 10182006
Results and Discussion Design Adequacy
Overall the trial designs appeared adequate to evaluate metoprolol population PK and PKPD in pediatric patients receiving Toprol XL However the design could have been further optimized by increasing the sampling points particularly in the absorption phase Due to the limited number of samples in the absorption phase it was not possible to accurately characterize the absorption model first order vs zero order or mixed first and zero order Additionally collection of mainly trough samples limits the ability to accurately estimate measures such as Cmax that are not directly related to Ctrough particularly if multiple compartments are present Consequently Cmax estimations are unlikely to be accurate Finally most patients provided only one trough sample thus inter-individual variability could not be adequately captured and may have limited the utility of the modeling exercise particularly in PKPD where the random effect could not be accurately characterized Ultimately there was no random variable in the final PKPD model (ie eta was set to zero) Data Integrity
This reviewer checked the data visually by randomly selecting data from patients included in the population modeling and comparing to data in the study report (source data) Overall the data integrity appeared acceptable The applicant observed the following guidelines that appeared acceptable No datum from any study participant with a protocol violation that was thought to materially impact the analysis was included The dataset contained data from only those study participants who could be evaluated ie with all the last dosing datetime blood sampling datetime plasma drug concentrations and demographic covariates
Data that were excluded (n = 62 samples) from the model were as follows One sample from an apparent poor metabolizer Two samples collected gt 96 hours post dose From 307B 10 trough samples lt LOQ From 307A 17 samples lt LOQ Thirty-samples from serial data that were lt LOQ or whole blood samples Model and Model Selection
Base Model
41110 Pharmacokinetic Model description The base PK model was a standard two compartment model that incorporated lag time and flip-flop kinetics The key features of the model were flip-flop was insured by making the value of ke gt ka in the clearance equation Additionally lag time was restricted to a value of 2 hours or less and concentrations were log transformed consequently all concentrations (F) = 0 were given individual predicted concentrations of zero Finally there were two residual error terms one for serial samples and the other for trough samples DCP1PM Page 73 10182006
Clinical Pharmacology Review NDA 19-962 Toprol-XL 10182006
Key equations were as follows
KA = THETA(1)EXP(ETA(1)) V2 = THETA(2)EXP(ETA(2)) CL = (THETA(1)THETA(2)+THETA(3))EXP(ETA(3)) Q = THETA(4)EXP(ETA(4)) V3 = THETA(5)EXP(ETA(5)) ALAG1=THETA(6)EXP(ETA(6))
41111 PK Parameter estimation results Table 1 Summary of PK parameters in the metoprolol population PK base model (per applicant)
41112 Goodness of fit The applicant provided the following goodness-of-fit plots (Figure 1)
Reviewer Note The goodness-of-fit plots were reproduced by this Reviewer (see Appendix) with minor modifications
Figure 1 Goodness of fit plots for Base Model
DCP1PM Page 74 10182006
Clinical Pharmacology Review NDA 19-962 Toprol-XL 10182006
Base PK Model Selection The MOF values of all structural model candidates tested are presented in Table 2 Model selection was based primarily on MOF values the lower MOF the better the model The applicant reports that in general MOF values generated by a conventional absorption model (ie absorption rate is faster than elimination rate) and a flip-flop absorption model (ie absorption rate is slower than elimination rate) were identical
Reviewer Comment The existence of flip-flop kinetics appears plausible based on data provided and general patterns for sustained release formulations Consequently the use of flip-flop kinetics for the bulk of the modeling exercise appears reasonable
General conclusions from the information in Table 2 are First order input is better than zero order input Two compartment model is better than one compartment model Lag time presence is better than lack of lag time Two residual error terms are better than one residual error term It should also be noted that several other models led to unsatisfactory completion of the run and were not considered further
DCP1PM Page 75 10182006
Clinical Pharmacology Review NDA 19-962 Toprol-XL 10182006
Table 2 Comparison of Structural PK Models
Reviewer Comment The selected structural model appears appropriate based on the data
Base Model The deletion of ETA for V2 did not change the MOF value suggesting that ETA for V2 should be deleted to avoid an over-parameterized warning (Table 3) This was consistent with the estimated parameter value of ETA for V2 being 648 x 10ndash9 a very small value Therefore the base model was selected by deleting the ETA for V2 from the structural model
Reviewer Comment on Eta deletion for V2 Deletion of eta for V2 is acceptable based on the empirical data however from a physiological perspective deletion of eta is problematic Generally one anticipates inter-individual differences in volume of distribution In this case it appears that the error associated with V2 may have been randomly shifted to V3 and or Q terms as the three DCP1PM Page 76 10182006
Clinical Pharmacology Review NDA 19-962 Toprol-XL 10182006
terms are interrelated This potential shift in error is supported by the fact that the V2 eta value increases significantly (by several orders of magnitude- 10-5 vs 100) when eta for Q and or V3 is fixed However when Q or V3 are fixed minimization is successful but Q and V3 are not accurately estimated Accounting for the possible error shift is a complex process and goes beyond the scope of this reviewer thus deletion of eta associated with V2 was considered acceptable for the remainder of the modeling evaluation
Table 3 Structural elements tested in the metoprolol population PK structural model (p lt 0005)
Final PK Model
41113 Model description The key feature of the final model is the inclusion of the covariate effects of age on Q and weight on CL in the population PK model
Key Equations CL = (THETA(1)THETA(2)+THETA(3)+EWT)EXP(ETA(2)) Q = THETA(4)EAGEEXP(ETA(3))
Including Covariate Effects As previously described covariate effects were assessed by forward addition and backward deletion Most covariates did not significantly change MOF however BSA significantly affected CL and Age affected Q Consequently these covariates were included in the penultimate final model
DCP1PM Page 77 10182006
Clinical Pharmacology Review NDA 19-962 Toprol-XL 10182006
Reviewer Note BSA is derived form WT and HT covariates implying BSA is highly correlated to these two covariates (Figure 2) weight is the most suitable (practical covariate) as it is readily measured Furthermore weight and BSA produced the same MOF (Table 4) whereas MOF with height was more positive (less significant)
Figure 2 Plot of BSA vs Body Weight
The data in Table 4 support selection of the final model
Table 4 Covariate elements tested in the metoprolol population PK penultimate final model (plt0005)
The applicant acknowledges that mechanism(s) accounting for the impact of age on QF are not clear However since distribution clearance has little effect on metoprolol plasma exposure further investigation is not needed
41114 PK Parameter estimation results As shown in Table 5 PK parameters were estimated fairly precisely by the final model
Table 5 PK Parameter Estimates using Final Model
DCP1PM Page 78 10182006
Clinical Pharmacology Review NDA 19-962 Toprol-XL 10182006
41115 Goodness of fit The goodness-of-fit plots provided by the applicant show good precision Figure 5 Goodness of fit plots for final PK model
DCP1PM Page 79 10182006
Clinical Pharmacology Review NDA 19-962 Toprol-XL 10182006
PK Model Qualification The post hoc Bayesian-estimated AUC (simulated) obtained for the 27 patients with serial plasma samples are plotted against the observed (AUCt) The correlation was high (R2 gt 099) Figure 6 AUClast from observed data versus AUCt from model simulation in the 27 patients providing serial plasma samples
Regression line Y= 4514 + 08976 X R2 = 09957
The graphical validation of the final metoprolol population PK model validation against covariates evaluated is presented in Figure 6
Figure 7 Graphical validation of covariates
DCP1PM Page 80 10182006
Clinical Pharmacology Review NDA 19-962 Toprol-XL 10182006
There was no systematic bias in weighted residuals for any covariates evaluated suggesting that the final model included all appreciable effects of available covariates (Figure)
The effects of weight on metoprolol CLF are illustrated in Figure 8 where Bayesian post hoc estimates of CLF are plotted against weight and overlaid by the model-predicted line Overall the model appeared to fit the data well
Figure 8 Plot of CLF vs Body weight
The effects of AGE on metoprolol QF are illustrated in Figure 9 where Bayesian post hoc estimates of QF are plotted against AGE and overlaid by the model-predicted line Figure 9 Plot of QF vs Age
DCP1PM Page 81 10182006
Clinical Pharmacology Review NDA 19-962 Toprol-XL 10182006
Reviewer Note The applicant indicated that attempts to run the final model using the first-order conditional estimation method resulted in termination errors Therefore the parameter estimates obtained by the FO method were reported as the final parameter estimates
Conclusion Regarding Population PK Modeling Overall the sponsorrsquos population PK modeling is acceptable
PKPD Model and Model Selection
PKPD Base Model PharmacokineticPharmacodynamic Model description The key feature of the model was a lack of random variance term for the slope (since only single data points were available per subject) and inclusion of baseline effect
Key equations were as follows E0 = THETA(1)EXP(ETA(1)) M = THETA(2) Y = E0 + MLOG(AUC) + EPS(1)
The control stream provided in the appendix is that for DBP (provided by sponsor) The control stream for SBP is comparable with appropriate substitution for BP type
It should be noted that only the log-linear and linear PKPD models were considered suitable for AUC and Cmax For this review only AUC estimates were considered reliable as Cmax estimates could not be accurately determined based on the sampling scheme Consequently the remainder of this review focuses on AUC information although Ctrough and Cmax data are displayed for reference
Bayesian estimates from PK modeling are summarized in Table 1
Table 1 Bayesian estimates of metoprolol PK exposure for those patients included in the PKPD analysis (N=65)
DCP1PM Page 82 10182006
Clinical Pharmacology Review NDA 19-962 Toprol-XL 10182006
PKPD Model Selection (initial and final) The log-linear model was adopted as the base model for this PKPD relationship since it improved the MOF significantly (Table 2) The ETA parameter for the slope was pre-eliminated for the purpose of model parsimony The intercept and slope in this log-linear model for AUC(0-24) did not bear ETA parameter therefore no covariates had impact on either parameter in the model
Reviewer Note The intercept should not have borne an eta term because individual subjects provided only one data point Consequently fixing eta to zero or deleting eta in the final model is appropriate No further model development was required after eta was eliminated and the base model was equivalent to the final model
Table 2 Base population PKPD models tested for the change in SBP
41116 PKPD Parameter estimation results The final PKPD parameter estimates are presented in Table 3
Table 3 Summary parameters in the final PKPD model for the change in SBP using trough plasma level Parameter Explanation Estimate SE ()b
DCP1PM Page 83 10182006
Clinical Pharmacology Review NDA 19-962 Toprol-XL 10182006
Model Qualification Based on the relatively low R2 value and as shown in Figure there is a poor correlation between change in SBP and log AUC
Figure 1 Relationship between change in SBP and AUC (line generated from modeling)
Overall goodness-of-fit of the model was considered to be poor probably due to the high variability in the measurements Consequently the precision of the model parameter estimates was not considered to be very reliable These parameters have little clinical usefulness and can be treated only as an indication of trends ie more hemodynamic effects can be potentially achieved when high Toprol-XL doses are given Clinical dose adjustment based on these PKPD parameters is not recommended
Reviewerrsquos Supplemental Analyses A supplemental PKPD analyses was conducted using simple linear regression since the population model did not improve the fit Overall eta made an insignificant contribution to the overall model The results of the analyses were similar to the population analyses A series of regression analyses were conducted and are presented in Table 4
The applicant notes that the preliminary modeling exercise found that there was no difference in the PKPD modeling results using different hemodynamic data formats (ie change in the measurements percent change in the measurements or actual BP measurements) This finding was confirmed by this reviewer (see Table 4)
DCP1PM Page 84 10182006
Clinical Pharmacology Review NDA 19-962 Toprol-XL 10182006
Table 4 Supplemental PKPD Regression Analyses Conducted by Reviewer Model (liner regression) Intercept (I) Slope (m) R2 Probability RSBP = mISBP + I 3957 -035 01626 0009 PSBP = mISBP + I 2524 -023 01252 00038 PSBP = mRSBP + I 0005 074 09891 lt 00001 RSBP = mlogAUC + I 651 -221 0060 00493 RSBP = mDose + I -751 0006 00026 06878 RSBP = mDose^ + I -312 -111 004 02711 RSBP = mlogAUC + nISBP + I 5303 -221 (m)
-035 (n) 02230 0001
RSBPplc = mAUC + I -667 -0003 00458 00871 RSBPplc = mlogAUC + I 461 -2208 00600 00493 RPUL = mlogAUC + I 1868 -405 01102 00069 Symbols in table similar to population PK model without eta term RSBP- change of SBP without placebo correction ISBP- initial (baseline) SBP RPUL- change in HR without placebo correction Dose- in mg where placebo is included as 0 mg PSBP- percentage change of SBP without placebo correction
Conclusion Regarding Population PKPD Modeling Overall the sponsorrsquos population PKPD modeling is acceptable No dose adjustment conclusion can be made from this modeling however an exposure-response relationship was established for AUC and reduction in SBP
Discussion
The significance of the results 1 Provide estimates of PK measures and plasma exposure in pediatric population These data can be compared to adult exposure to determine if exposure differences impact drug effectiveness The main challenge in comparing pediatric data to adult data is different modeling schemes formulations and methods were used in the two populations
2 PKPD findings are not sufficiently precise to provide a dose adjustment algorithm however the PKPD analyses provides rationale for proposed titration as increasing exposure (doses) may improve efficacy (reduction in SBP) Ultimately the risk-benefit analyses overrides PKPD assessment for dose adjustment drug will be titrated thus reliance on PKPD information is not critical The proposed dose 10 mgkg appears suitable based on available information It is unclear from the studies if there should be an initial maximum dose although the sponsor has proposed 50 mg as the maximum initial dose The proposed pediatric starting dose on a mgkg basis is within the range of starting adult doses (25 ndash 100 mg) assuming an adult weighs 70 kg
3 Cumulative information form dose-response study indicates that Toprol XL has effectiveness in children however the most effective dose is unclear Since the drug can be titrated determining the initial optimal dose does not appear critical As proposed by the applicant dosing is started at a ldquolowrdquo dose that can be up-titrated if needed
DCP1PM Page 85 10182006
Clinical Pharmacology Review NDA 19-962 Toprol-XL 10182006
4 The results did not adequately address the potential impact of CYP2D6 metabolic status for pediatric patients taking Toprol XL There were an insufficient number of patients to make this assessment
5 Covariate effects do not appear significant only body weight significantly affects clearance However a worst case scenario can occur with a person that has a low body weight and is a poor metabolizer this will result in very high possibly supra-therapeutic exposure Age does not impact apparent oral clearance so an age-dependent dose adjustment is not needed for children over 6 years old In essence all children over six years old can initiate therapy at 10 mgkg
The validity of the results Overall the results produced by the sponsor appear valid and the sponsor used a sound modeling approach However alternative approaches that could have been adopted may have improved the outcome of the analyses Three of these approaches are presented below 1 Additional PK samples should have been collected during the absorption phase and
throughout the dosing interval to improve the modelrsquos performance Specifically additional samples collected during the absorption phase may have unambiguously identified the actual absorption input function (eg first order zero order mixed first and zero order) First order input was selected for the analyses although the dosage form is reported to exhibit zero order kinetics in adults It is possible that the input rate in children differs from that in adults but unlikely It should be noted that absorption kinetics in children is often erratic due to multiple factors (eg regioshyselective absorption incomplete gastric emptying and inconsistent absorption) so it is unclear if additional samples would have definitively identified the absorption function However additional non-trough samples may have helped in estimating key PK measures such as V and Cmax The final model did not have an eta associated with V which is atypical Collection of additional samples on different visits may have helped estimate potential inter-occasion variability It should be noted that AUC was estimated precisely for subjects providing serial samples but these subjects were not necessarily included in the PKPD analyses Ideally the PKPD modeling should have been conducted primarily in subjects who had accurate PK measures
2 The PKPD design could have been modified to potentially improve the utility of the analyses Specifically there should have been better placebo matching procedures to minimize the potential impact of the placebo effect This matching could have been improved by ensuring all patients on placebo had the same titration schedule and number of tablets It is noted that the model had a poor predictive performance that was mainly attributed to the high degree of variability in the PD measures Potentially other PD markers could have been explored that have less inherent variability One such marker is the degree of beta blockade using exercise heart rate (EHR) reduction this marker has been used extensively for metoprolol in adult subjects However use of EHR in the pediatric setting may be challenging
DCP1PM Page 86 10182006
Clinical Pharmacology Review NDA 19-962 Toprol-XL 10182006
Comments to sponsor
In future pharmacometric studies you should consider the following 1 collect sufficient (multiple) samples from individual subjects to allow assessment
of inter-occasion variability and estimation of inter-individual variability (eta) for all relevant parameters
2 placebo groups should be identically matched across all dose groups (eg same titration schedule and number tablets) to minimize potential bias or differences in the placebo effect
Comments to medical reviewer
1 The sponsor has adequately characterized metoprolol PK in the studied pediatric population The PK characterization could have been further optimized by obtaining additional samples over the entire dosing interval (eg during the absorption phase and elimination phase) on multiple occasions rather than on one occasion primarily at trough
2 A dose-response relationship could not be established using the protocol specified analysis approach The outcome of the dose-response relationship appeared highly dependent on the ldquoplacebo effectrdquo suggesting that the placebo group may not have been appropriate One should consider re-evaluating the dose-response precisely matched placebo groups (eg all placebo patients have identical number of tablets and titration schedule)
3 Based on the PKPD analysis plasma exposure (AUC) explains lt 10 of the response (reduction in systolic blood pressure) thus has limited clinical utility However the PKPD relationship suggests that there is a trend for increased response with increased exposure (dose driven)
4 Overall information from the dose-response study suggests that Toprol- XL is effective in the pediatric population The optimal initial dose 02 10 or 20 mgkg or the maximum safe and effective dose cannot be determined from the information provided It is noted that the 02 mgkg dose is unlikely to be effective as plasma concentrations achieved at this dose are unlikely to be effective (most concentrations lt LOQ and lower than effective adult concentrations) The 10 mgkg (proposed by applicant) appears to be a reasonable initial dose The labeling should reflect the regimens studied
DCP1PM Page 89 10182006
Clinical Pharmacology Review NDA 19-962 Toprol-XL 10182006
Appendix
DCP1PM Page 90 10182006
Clinical Pharmacology Review NDA 19-962 Toprol-XL 10182006
DCP1PM Page 91 10182006
Clinical Pharmacology Review NDA 19-962 Toprol-XL 10182006
DCP1PM Page 92 10182006
Clinical Pharmacology Review NDA 19-962 Toprol-XL 10182006
DCP1PM Page 93 10182006
Clinical Pharmacology Review NDA 19-962 Toprol-XL 10182006
DCP1PM Page 94 10182006
Clinical Pharmacology Review NDA 19-962 Toprol-XL 10182006
DCP1PM Page 95 10182006
Clinical Pharmacology Review NDA 19-962 Toprol-XL 10182006
Table 15 Control streams for final log-linear PKPD model for the change in DBP using metoprolol Cmax as the measure of exposure
Truncated NONMEM reports for base model identification for PKPD relationship in change of SBP (per sponsor)
DCP1PM Page 96 10182006
Clinical Pharmacology Review NDA 19-962 Toprol-XL 10182006
Reported PD information^
^ Under metoprolol regimen CRZ0K is Toprol XL
DCP1PM Page 97 10182006
Clinical Pharmacology Review NDA 19-962 Toprol-XL 10182006
Table Results of randomised double-blind comparative trials evaluating antihypertensive efficacy of metoprolol formulations or other antihypertensives
DCP1PM Page 98 10182006
---------------------------------------------------------------------------------------------------------------------
---------------------------------------------------------------------------------------------------------------------
---------------------
This is a representation of an electronic record that was signed electronically and this page is the manifestation of the electronic signature
s
Robert Kumi 10182006 045635 PM BIOPHARMACEUTICS
Patrick Marroum 10192006 050811 PM BIOPHARMACEUTICS
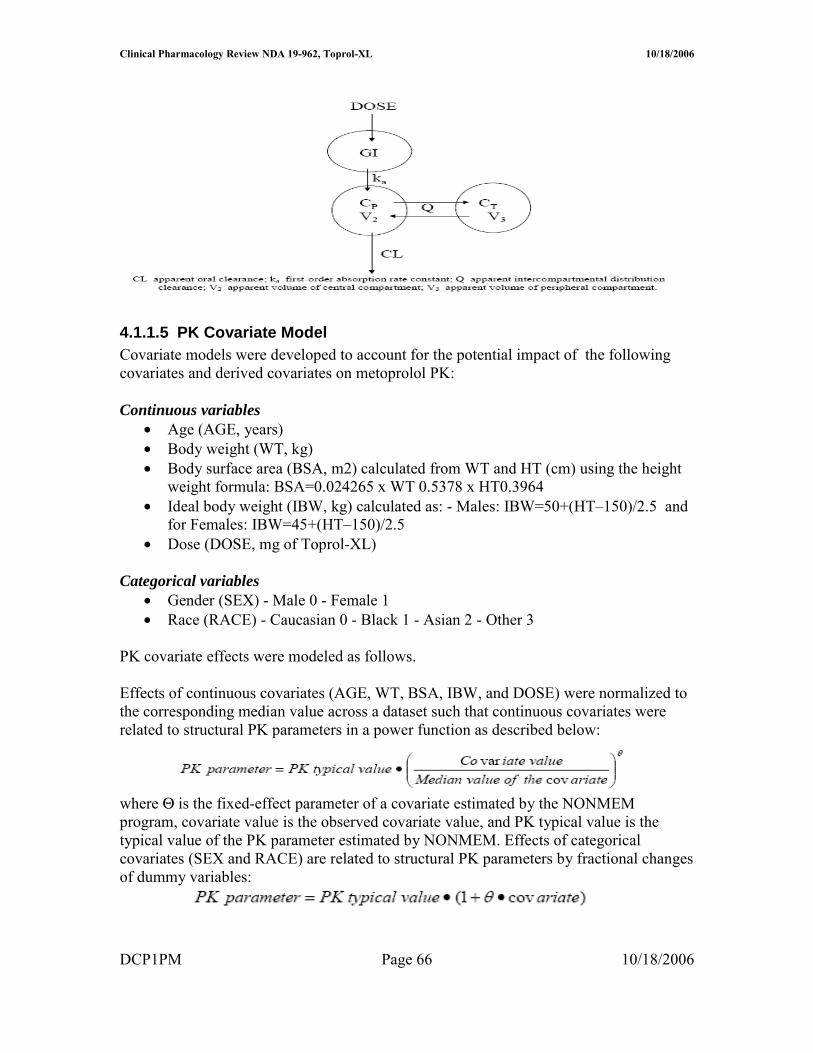
Clinical Pharmacology Review NDA 19-962 Toprol-XL 10182006
The residual model was modeled by an additive model two error terms were used one for error associated with trough samples and the other with serial samples
Reviewer Note Use of an exponential model appears reasonable
Pharmacodynamics
4117 PKPD Structural Model The equations for the structural models are shown below
1 Metoprolol Ctrough The relationships between the observed metoprolol concentrations (Ctrough) and hemodynamic changes were investigated using 4 direct-link models namely a linear model a log-linear model and Hillrsquos sigmoid Emax PKPD model with and without a baseline
2 The relationships between Cmax or AUC0ndash24 and hemodynamic changes were investigated using 2 direct-link models a linear model and a log-linear model
4118 PKPD Covariate Model The inclusion and exclusion procedures of covariate effect on the selected PKPD base model to obtain a selected final PKPD model were identical to those in the covariate evaluation in the population PK models as described previously in PK Covariate Model DCP1PM Page 68 10182006
Clinical Pharmacology Review NDA 19-962 Toprol-XL 10182006
Table B Baseline demographic and covariate characteristics
4119 PKPD Random Variance Models An exponential error model was used by the applicant to model inter-individual variability The retention of a random effect parameter ETA in each selected PKPD structural model was then evaluated by sequentially fixing each ETA value at zero and comparing each resultant MOF with the MOF obtained when all ETA values were retained in the model (plt005) This step reduced over-parameterization by deleting unnecessary random-effect parameters from the structural model to obtain the base model
Reviewer Note The study design precludes assessment of inter-individual variability or random error because only one dose record was available per patient Consequently the model should not have included eta terms It is noted that the sponsor ultimately dropped the eta term in the final model
DCP1PM Page 69 10182006
Clinical Pharmacology Review NDA 19-962 Toprol-XL 10182006
Model Selection
PK Initial Model Selection
PK Base Model to Final Model The selection of the most appropriate PK base model for a metoprolol PK was based upon the following criteria a significant reduction in MOF as compared to the baseline model and asymptotic chi-square distribution based on the likelihood ratio test or AIC (plt005) as compared to the other structural models This selected PK base model was then subject to a covariate evaluation The population PK model bearing all surviving covariate parameters with statistical significance became the penultimate final model If 1 of the body size parameters (WT BSA and HT) was not in the model the penultimate final model became the final model If body size parameters were in the model they were sequentially replaced by other body size parameters in the regression submodel for each PK parameter The best body size parameter was then selected on the basis of lowest MOF to form the final model
PK Final Model Selection Simulations and visual inspections based on goodness of fit plots were used to qualify and validate the model The goodness-of-fit of the final model was evaluated graphically by comparing population and individual predictions of metoprolol concentrations with observed metoprolol concentrations along the line of unity and by visual inspection of the following plots of population-weighted residuals (WRES) for the final population model 1 Population-weighted residuals (WRES) versus population-predicted concentrations (PRED) 2 WRES versus time after first drug administration in each patient 3 WRES versus all covariates evaluated WRES were generally expected to be distributed homogenously around zero for PRED time after administration and covariates For those 27 patients with serial samples goodness-of-fit of the plasma concentration-time profile for each individual was visually inspected The linear relationship between their AUClast values from the observed data and those from the simulated data (final model) was examined
The predictive performance of the final population PK model including covariates was evaluated by comparing typical values of PK parameters with the mean of individual Bayesian estimates or individual values of PK parameters with the results from non-compartmental analysis for patients with serial samples Steady-state metoprolol plasma concentration-time profiles from 0ndash24 hours at the interval of 15 minutes (025 hour) were calculated using the post hoc Bayesian estimated PK parameter obtained for 65 patients included in the PKPD relationship using the following equation
DCP1PM Page 70 10182006
Clinical Pharmacology Review NDA 19-962 Toprol-XL 10182006
PKPD Initial and Final Model Selection A similar approach to that of PK model selection was adopted for PKPD Each of the above-mentioned PKPD models with random effects was identified by curve-fitting the dataset Initial selection of the PKPD structural model was based upon a significant reduction in MOF (plt005) as compared to the baseline model and reasonable PKPD parameter estimates Software
Nonlinear mixed-effect modeling (NONMEM) software (Version V level 11 Globomax Hanover MD) was used in the population PK analysis PK model fitting was accomplished using first-order (FO) approximation methods For PKPD model fitting the first-order conditional estimation (FOCE) with eta-epsilon interaction method in NONMEM was used for all model runs
SAS software (Version VIII Cary NC) was employed to prepare datasets according to the format required by the NONMEM program (Boeckmann et al 1991) Microsoftreg Excel 2000 (Redmond WA) and S-PLUS 2000 (Professional Release 2 MathSoft Inc Cambridge MA) were used to perform exploratory graphical exposure calculation and statistical analyses according to the format required by the NONMEM program (Boeckmann et al 1991) SAS command files logs and listings pertaining to data file conversion and merging were reviewed by an independent analyst Datasets were stored in SAS data frames combined and exported to Excel and then to ASCII files before fitting to the model
Datasets were prepared and pooled in a NONMEM-compliant format using SAS software by the Programming Group Clinical Information Sciences at AstraZeneca Wilmington Delaware SAS command files logs and listings pertaining to file conversion and merging were provided and found to be acceptable The contents of both datasets (toprolkatcsv for PK modeling and cppd2csv for PKPD modeling) were included
DCP1PM Page 71 10182006
Clinical Pharmacology Review NDA 19-962 Toprol-XL 10182006
toprolkatcsv was not provided electronically in a SAS format however this reviewer generated a similar dataset using the applicantrsquos criteria
Reviewer Comment The software and data assembly methods appeared adequate
DCP1PM Page 72 10182006
Clinical Pharmacology Review NDA 19-962 Toprol-XL 10182006
Results and Discussion Design Adequacy
Overall the trial designs appeared adequate to evaluate metoprolol population PK and PKPD in pediatric patients receiving Toprol XL However the design could have been further optimized by increasing the sampling points particularly in the absorption phase Due to the limited number of samples in the absorption phase it was not possible to accurately characterize the absorption model first order vs zero order or mixed first and zero order Additionally collection of mainly trough samples limits the ability to accurately estimate measures such as Cmax that are not directly related to Ctrough particularly if multiple compartments are present Consequently Cmax estimations are unlikely to be accurate Finally most patients provided only one trough sample thus inter-individual variability could not be adequately captured and may have limited the utility of the modeling exercise particularly in PKPD where the random effect could not be accurately characterized Ultimately there was no random variable in the final PKPD model (ie eta was set to zero) Data Integrity
This reviewer checked the data visually by randomly selecting data from patients included in the population modeling and comparing to data in the study report (source data) Overall the data integrity appeared acceptable The applicant observed the following guidelines that appeared acceptable No datum from any study participant with a protocol violation that was thought to materially impact the analysis was included The dataset contained data from only those study participants who could be evaluated ie with all the last dosing datetime blood sampling datetime plasma drug concentrations and demographic covariates
Data that were excluded (n = 62 samples) from the model were as follows One sample from an apparent poor metabolizer Two samples collected gt 96 hours post dose From 307B 10 trough samples lt LOQ From 307A 17 samples lt LOQ Thirty-samples from serial data that were lt LOQ or whole blood samples Model and Model Selection
Base Model
41110 Pharmacokinetic Model description The base PK model was a standard two compartment model that incorporated lag time and flip-flop kinetics The key features of the model were flip-flop was insured by making the value of ke gt ka in the clearance equation Additionally lag time was restricted to a value of 2 hours or less and concentrations were log transformed consequently all concentrations (F) = 0 were given individual predicted concentrations of zero Finally there were two residual error terms one for serial samples and the other for trough samples DCP1PM Page 73 10182006
Clinical Pharmacology Review NDA 19-962 Toprol-XL 10182006
Key equations were as follows
KA = THETA(1)EXP(ETA(1)) V2 = THETA(2)EXP(ETA(2)) CL = (THETA(1)THETA(2)+THETA(3))EXP(ETA(3)) Q = THETA(4)EXP(ETA(4)) V3 = THETA(5)EXP(ETA(5)) ALAG1=THETA(6)EXP(ETA(6))
41111 PK Parameter estimation results Table 1 Summary of PK parameters in the metoprolol population PK base model (per applicant)
41112 Goodness of fit The applicant provided the following goodness-of-fit plots (Figure 1)
Reviewer Note The goodness-of-fit plots were reproduced by this Reviewer (see Appendix) with minor modifications
Figure 1 Goodness of fit plots for Base Model
DCP1PM Page 74 10182006
Clinical Pharmacology Review NDA 19-962 Toprol-XL 10182006
Base PK Model Selection The MOF values of all structural model candidates tested are presented in Table 2 Model selection was based primarily on MOF values the lower MOF the better the model The applicant reports that in general MOF values generated by a conventional absorption model (ie absorption rate is faster than elimination rate) and a flip-flop absorption model (ie absorption rate is slower than elimination rate) were identical
Reviewer Comment The existence of flip-flop kinetics appears plausible based on data provided and general patterns for sustained release formulations Consequently the use of flip-flop kinetics for the bulk of the modeling exercise appears reasonable
General conclusions from the information in Table 2 are First order input is better than zero order input Two compartment model is better than one compartment model Lag time presence is better than lack of lag time Two residual error terms are better than one residual error term It should also be noted that several other models led to unsatisfactory completion of the run and were not considered further
DCP1PM Page 75 10182006
Clinical Pharmacology Review NDA 19-962 Toprol-XL 10182006
Table 2 Comparison of Structural PK Models
Reviewer Comment The selected structural model appears appropriate based on the data
Base Model The deletion of ETA for V2 did not change the MOF value suggesting that ETA for V2 should be deleted to avoid an over-parameterized warning (Table 3) This was consistent with the estimated parameter value of ETA for V2 being 648 x 10ndash9 a very small value Therefore the base model was selected by deleting the ETA for V2 from the structural model
Reviewer Comment on Eta deletion for V2 Deletion of eta for V2 is acceptable based on the empirical data however from a physiological perspective deletion of eta is problematic Generally one anticipates inter-individual differences in volume of distribution In this case it appears that the error associated with V2 may have been randomly shifted to V3 and or Q terms as the three DCP1PM Page 76 10182006
Clinical Pharmacology Review NDA 19-962 Toprol-XL 10182006
terms are interrelated This potential shift in error is supported by the fact that the V2 eta value increases significantly (by several orders of magnitude- 10-5 vs 100) when eta for Q and or V3 is fixed However when Q or V3 are fixed minimization is successful but Q and V3 are not accurately estimated Accounting for the possible error shift is a complex process and goes beyond the scope of this reviewer thus deletion of eta associated with V2 was considered acceptable for the remainder of the modeling evaluation
Table 3 Structural elements tested in the metoprolol population PK structural model (p lt 0005)
Final PK Model
41113 Model description The key feature of the final model is the inclusion of the covariate effects of age on Q and weight on CL in the population PK model
Key Equations CL = (THETA(1)THETA(2)+THETA(3)+EWT)EXP(ETA(2)) Q = THETA(4)EAGEEXP(ETA(3))
Including Covariate Effects As previously described covariate effects were assessed by forward addition and backward deletion Most covariates did not significantly change MOF however BSA significantly affected CL and Age affected Q Consequently these covariates were included in the penultimate final model
DCP1PM Page 77 10182006
Clinical Pharmacology Review NDA 19-962 Toprol-XL 10182006
Reviewer Note BSA is derived form WT and HT covariates implying BSA is highly correlated to these two covariates (Figure 2) weight is the most suitable (practical covariate) as it is readily measured Furthermore weight and BSA produced the same MOF (Table 4) whereas MOF with height was more positive (less significant)
Figure 2 Plot of BSA vs Body Weight
The data in Table 4 support selection of the final model
Table 4 Covariate elements tested in the metoprolol population PK penultimate final model (plt0005)
The applicant acknowledges that mechanism(s) accounting for the impact of age on QF are not clear However since distribution clearance has little effect on metoprolol plasma exposure further investigation is not needed
41114 PK Parameter estimation results As shown in Table 5 PK parameters were estimated fairly precisely by the final model
Table 5 PK Parameter Estimates using Final Model
DCP1PM Page 78 10182006
Clinical Pharmacology Review NDA 19-962 Toprol-XL 10182006
41115 Goodness of fit The goodness-of-fit plots provided by the applicant show good precision Figure 5 Goodness of fit plots for final PK model
DCP1PM Page 79 10182006
Clinical Pharmacology Review NDA 19-962 Toprol-XL 10182006
PK Model Qualification The post hoc Bayesian-estimated AUC (simulated) obtained for the 27 patients with serial plasma samples are plotted against the observed (AUCt) The correlation was high (R2 gt 099) Figure 6 AUClast from observed data versus AUCt from model simulation in the 27 patients providing serial plasma samples
Regression line Y= 4514 + 08976 X R2 = 09957
The graphical validation of the final metoprolol population PK model validation against covariates evaluated is presented in Figure 6
Figure 7 Graphical validation of covariates
DCP1PM Page 80 10182006
Clinical Pharmacology Review NDA 19-962 Toprol-XL 10182006
There was no systematic bias in weighted residuals for any covariates evaluated suggesting that the final model included all appreciable effects of available covariates (Figure)
The effects of weight on metoprolol CLF are illustrated in Figure 8 where Bayesian post hoc estimates of CLF are plotted against weight and overlaid by the model-predicted line Overall the model appeared to fit the data well
Figure 8 Plot of CLF vs Body weight
The effects of AGE on metoprolol QF are illustrated in Figure 9 where Bayesian post hoc estimates of QF are plotted against AGE and overlaid by the model-predicted line Figure 9 Plot of QF vs Age
DCP1PM Page 81 10182006
Clinical Pharmacology Review NDA 19-962 Toprol-XL 10182006
Reviewer Note The applicant indicated that attempts to run the final model using the first-order conditional estimation method resulted in termination errors Therefore the parameter estimates obtained by the FO method were reported as the final parameter estimates
Conclusion Regarding Population PK Modeling Overall the sponsorrsquos population PK modeling is acceptable
PKPD Model and Model Selection
PKPD Base Model PharmacokineticPharmacodynamic Model description The key feature of the model was a lack of random variance term for the slope (since only single data points were available per subject) and inclusion of baseline effect
Key equations were as follows E0 = THETA(1)EXP(ETA(1)) M = THETA(2) Y = E0 + MLOG(AUC) + EPS(1)
The control stream provided in the appendix is that for DBP (provided by sponsor) The control stream for SBP is comparable with appropriate substitution for BP type
It should be noted that only the log-linear and linear PKPD models were considered suitable for AUC and Cmax For this review only AUC estimates were considered reliable as Cmax estimates could not be accurately determined based on the sampling scheme Consequently the remainder of this review focuses on AUC information although Ctrough and Cmax data are displayed for reference
Bayesian estimates from PK modeling are summarized in Table 1
Table 1 Bayesian estimates of metoprolol PK exposure for those patients included in the PKPD analysis (N=65)
DCP1PM Page 82 10182006
Clinical Pharmacology Review NDA 19-962 Toprol-XL 10182006
PKPD Model Selection (initial and final) The log-linear model was adopted as the base model for this PKPD relationship since it improved the MOF significantly (Table 2) The ETA parameter for the slope was pre-eliminated for the purpose of model parsimony The intercept and slope in this log-linear model for AUC(0-24) did not bear ETA parameter therefore no covariates had impact on either parameter in the model
Reviewer Note The intercept should not have borne an eta term because individual subjects provided only one data point Consequently fixing eta to zero or deleting eta in the final model is appropriate No further model development was required after eta was eliminated and the base model was equivalent to the final model
Table 2 Base population PKPD models tested for the change in SBP
41116 PKPD Parameter estimation results The final PKPD parameter estimates are presented in Table 3
Table 3 Summary parameters in the final PKPD model for the change in SBP using trough plasma level Parameter Explanation Estimate SE ()b
DCP1PM Page 83 10182006
Clinical Pharmacology Review NDA 19-962 Toprol-XL 10182006
Model Qualification Based on the relatively low R2 value and as shown in Figure there is a poor correlation between change in SBP and log AUC
Figure 1 Relationship between change in SBP and AUC (line generated from modeling)
Overall goodness-of-fit of the model was considered to be poor probably due to the high variability in the measurements Consequently the precision of the model parameter estimates was not considered to be very reliable These parameters have little clinical usefulness and can be treated only as an indication of trends ie more hemodynamic effects can be potentially achieved when high Toprol-XL doses are given Clinical dose adjustment based on these PKPD parameters is not recommended
Reviewerrsquos Supplemental Analyses A supplemental PKPD analyses was conducted using simple linear regression since the population model did not improve the fit Overall eta made an insignificant contribution to the overall model The results of the analyses were similar to the population analyses A series of regression analyses were conducted and are presented in Table 4
The applicant notes that the preliminary modeling exercise found that there was no difference in the PKPD modeling results using different hemodynamic data formats (ie change in the measurements percent change in the measurements or actual BP measurements) This finding was confirmed by this reviewer (see Table 4)
DCP1PM Page 84 10182006
Clinical Pharmacology Review NDA 19-962 Toprol-XL 10182006
Table 4 Supplemental PKPD Regression Analyses Conducted by Reviewer Model (liner regression) Intercept (I) Slope (m) R2 Probability RSBP = mISBP + I 3957 -035 01626 0009 PSBP = mISBP + I 2524 -023 01252 00038 PSBP = mRSBP + I 0005 074 09891 lt 00001 RSBP = mlogAUC + I 651 -221 0060 00493 RSBP = mDose + I -751 0006 00026 06878 RSBP = mDose^ + I -312 -111 004 02711 RSBP = mlogAUC + nISBP + I 5303 -221 (m)
-035 (n) 02230 0001
RSBPplc = mAUC + I -667 -0003 00458 00871 RSBPplc = mlogAUC + I 461 -2208 00600 00493 RPUL = mlogAUC + I 1868 -405 01102 00069 Symbols in table similar to population PK model without eta term RSBP- change of SBP without placebo correction ISBP- initial (baseline) SBP RPUL- change in HR without placebo correction Dose- in mg where placebo is included as 0 mg PSBP- percentage change of SBP without placebo correction
Conclusion Regarding Population PKPD Modeling Overall the sponsorrsquos population PKPD modeling is acceptable No dose adjustment conclusion can be made from this modeling however an exposure-response relationship was established for AUC and reduction in SBP
Discussion
The significance of the results 1 Provide estimates of PK measures and plasma exposure in pediatric population These data can be compared to adult exposure to determine if exposure differences impact drug effectiveness The main challenge in comparing pediatric data to adult data is different modeling schemes formulations and methods were used in the two populations
2 PKPD findings are not sufficiently precise to provide a dose adjustment algorithm however the PKPD analyses provides rationale for proposed titration as increasing exposure (doses) may improve efficacy (reduction in SBP) Ultimately the risk-benefit analyses overrides PKPD assessment for dose adjustment drug will be titrated thus reliance on PKPD information is not critical The proposed dose 10 mgkg appears suitable based on available information It is unclear from the studies if there should be an initial maximum dose although the sponsor has proposed 50 mg as the maximum initial dose The proposed pediatric starting dose on a mgkg basis is within the range of starting adult doses (25 ndash 100 mg) assuming an adult weighs 70 kg
3 Cumulative information form dose-response study indicates that Toprol XL has effectiveness in children however the most effective dose is unclear Since the drug can be titrated determining the initial optimal dose does not appear critical As proposed by the applicant dosing is started at a ldquolowrdquo dose that can be up-titrated if needed
DCP1PM Page 85 10182006
Clinical Pharmacology Review NDA 19-962 Toprol-XL 10182006
4 The results did not adequately address the potential impact of CYP2D6 metabolic status for pediatric patients taking Toprol XL There were an insufficient number of patients to make this assessment
5 Covariate effects do not appear significant only body weight significantly affects clearance However a worst case scenario can occur with a person that has a low body weight and is a poor metabolizer this will result in very high possibly supra-therapeutic exposure Age does not impact apparent oral clearance so an age-dependent dose adjustment is not needed for children over 6 years old In essence all children over six years old can initiate therapy at 10 mgkg
The validity of the results Overall the results produced by the sponsor appear valid and the sponsor used a sound modeling approach However alternative approaches that could have been adopted may have improved the outcome of the analyses Three of these approaches are presented below 1 Additional PK samples should have been collected during the absorption phase and
throughout the dosing interval to improve the modelrsquos performance Specifically additional samples collected during the absorption phase may have unambiguously identified the actual absorption input function (eg first order zero order mixed first and zero order) First order input was selected for the analyses although the dosage form is reported to exhibit zero order kinetics in adults It is possible that the input rate in children differs from that in adults but unlikely It should be noted that absorption kinetics in children is often erratic due to multiple factors (eg regioshyselective absorption incomplete gastric emptying and inconsistent absorption) so it is unclear if additional samples would have definitively identified the absorption function However additional non-trough samples may have helped in estimating key PK measures such as V and Cmax The final model did not have an eta associated with V which is atypical Collection of additional samples on different visits may have helped estimate potential inter-occasion variability It should be noted that AUC was estimated precisely for subjects providing serial samples but these subjects were not necessarily included in the PKPD analyses Ideally the PKPD modeling should have been conducted primarily in subjects who had accurate PK measures
2 The PKPD design could have been modified to potentially improve the utility of the analyses Specifically there should have been better placebo matching procedures to minimize the potential impact of the placebo effect This matching could have been improved by ensuring all patients on placebo had the same titration schedule and number of tablets It is noted that the model had a poor predictive performance that was mainly attributed to the high degree of variability in the PD measures Potentially other PD markers could have been explored that have less inherent variability One such marker is the degree of beta blockade using exercise heart rate (EHR) reduction this marker has been used extensively for metoprolol in adult subjects However use of EHR in the pediatric setting may be challenging
DCP1PM Page 86 10182006
Clinical Pharmacology Review NDA 19-962 Toprol-XL 10182006
Comments to sponsor
In future pharmacometric studies you should consider the following 1 collect sufficient (multiple) samples from individual subjects to allow assessment
of inter-occasion variability and estimation of inter-individual variability (eta) for all relevant parameters
2 placebo groups should be identically matched across all dose groups (eg same titration schedule and number tablets) to minimize potential bias or differences in the placebo effect
Comments to medical reviewer
1 The sponsor has adequately characterized metoprolol PK in the studied pediatric population The PK characterization could have been further optimized by obtaining additional samples over the entire dosing interval (eg during the absorption phase and elimination phase) on multiple occasions rather than on one occasion primarily at trough
2 A dose-response relationship could not be established using the protocol specified analysis approach The outcome of the dose-response relationship appeared highly dependent on the ldquoplacebo effectrdquo suggesting that the placebo group may not have been appropriate One should consider re-evaluating the dose-response precisely matched placebo groups (eg all placebo patients have identical number of tablets and titration schedule)
3 Based on the PKPD analysis plasma exposure (AUC) explains lt 10 of the response (reduction in systolic blood pressure) thus has limited clinical utility However the PKPD relationship suggests that there is a trend for increased response with increased exposure (dose driven)
4 Overall information from the dose-response study suggests that Toprol- XL is effective in the pediatric population The optimal initial dose 02 10 or 20 mgkg or the maximum safe and effective dose cannot be determined from the information provided It is noted that the 02 mgkg dose is unlikely to be effective as plasma concentrations achieved at this dose are unlikely to be effective (most concentrations lt LOQ and lower than effective adult concentrations) The 10 mgkg (proposed by applicant) appears to be a reasonable initial dose The labeling should reflect the regimens studied
DCP1PM Page 89 10182006
Clinical Pharmacology Review NDA 19-962 Toprol-XL 10182006
Appendix
DCP1PM Page 90 10182006
Clinical Pharmacology Review NDA 19-962 Toprol-XL 10182006
DCP1PM Page 91 10182006
Clinical Pharmacology Review NDA 19-962 Toprol-XL 10182006
DCP1PM Page 92 10182006
Clinical Pharmacology Review NDA 19-962 Toprol-XL 10182006
DCP1PM Page 93 10182006
Clinical Pharmacology Review NDA 19-962 Toprol-XL 10182006
DCP1PM Page 94 10182006
Clinical Pharmacology Review NDA 19-962 Toprol-XL 10182006
DCP1PM Page 95 10182006
Clinical Pharmacology Review NDA 19-962 Toprol-XL 10182006
Table 15 Control streams for final log-linear PKPD model for the change in DBP using metoprolol Cmax as the measure of exposure
Truncated NONMEM reports for base model identification for PKPD relationship in change of SBP (per sponsor)
DCP1PM Page 96 10182006
Clinical Pharmacology Review NDA 19-962 Toprol-XL 10182006
Reported PD information^
^ Under metoprolol regimen CRZ0K is Toprol XL
DCP1PM Page 97 10182006
Clinical Pharmacology Review NDA 19-962 Toprol-XL 10182006
Table Results of randomised double-blind comparative trials evaluating antihypertensive efficacy of metoprolol formulations or other antihypertensives
DCP1PM Page 98 10182006
---------------------------------------------------------------------------------------------------------------------
---------------------------------------------------------------------------------------------------------------------
---------------------
This is a representation of an electronic record that was signed electronically and this page is the manifestation of the electronic signature
s
Robert Kumi 10182006 045635 PM BIOPHARMACEUTICS
Patrick Marroum 10192006 050811 PM BIOPHARMACEUTICS
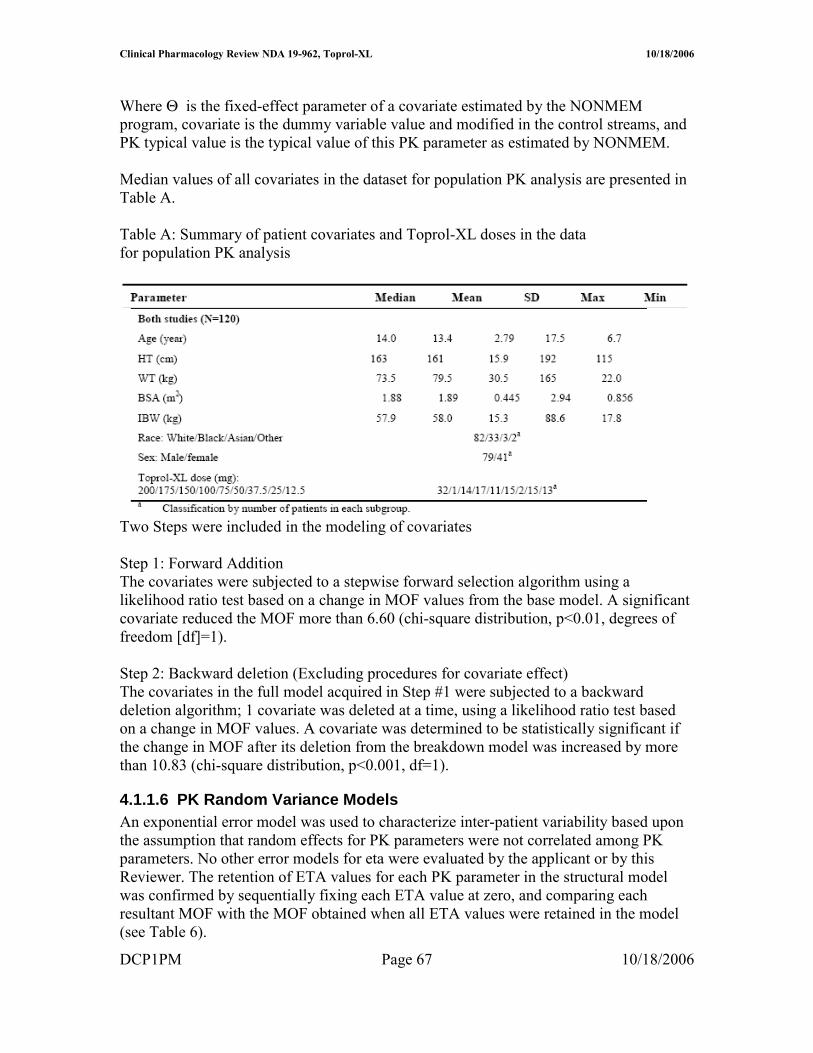
Clinical Pharmacology Review NDA 19-962 Toprol-XL 10182006
Table B Baseline demographic and covariate characteristics
4119 PKPD Random Variance Models An exponential error model was used by the applicant to model inter-individual variability The retention of a random effect parameter ETA in each selected PKPD structural model was then evaluated by sequentially fixing each ETA value at zero and comparing each resultant MOF with the MOF obtained when all ETA values were retained in the model (plt005) This step reduced over-parameterization by deleting unnecessary random-effect parameters from the structural model to obtain the base model
Reviewer Note The study design precludes assessment of inter-individual variability or random error because only one dose record was available per patient Consequently the model should not have included eta terms It is noted that the sponsor ultimately dropped the eta term in the final model
DCP1PM Page 69 10182006
Clinical Pharmacology Review NDA 19-962 Toprol-XL 10182006
Model Selection
PK Initial Model Selection
PK Base Model to Final Model The selection of the most appropriate PK base model for a metoprolol PK was based upon the following criteria a significant reduction in MOF as compared to the baseline model and asymptotic chi-square distribution based on the likelihood ratio test or AIC (plt005) as compared to the other structural models This selected PK base model was then subject to a covariate evaluation The population PK model bearing all surviving covariate parameters with statistical significance became the penultimate final model If 1 of the body size parameters (WT BSA and HT) was not in the model the penultimate final model became the final model If body size parameters were in the model they were sequentially replaced by other body size parameters in the regression submodel for each PK parameter The best body size parameter was then selected on the basis of lowest MOF to form the final model
PK Final Model Selection Simulations and visual inspections based on goodness of fit plots were used to qualify and validate the model The goodness-of-fit of the final model was evaluated graphically by comparing population and individual predictions of metoprolol concentrations with observed metoprolol concentrations along the line of unity and by visual inspection of the following plots of population-weighted residuals (WRES) for the final population model 1 Population-weighted residuals (WRES) versus population-predicted concentrations (PRED) 2 WRES versus time after first drug administration in each patient 3 WRES versus all covariates evaluated WRES were generally expected to be distributed homogenously around zero for PRED time after administration and covariates For those 27 patients with serial samples goodness-of-fit of the plasma concentration-time profile for each individual was visually inspected The linear relationship between their AUClast values from the observed data and those from the simulated data (final model) was examined
The predictive performance of the final population PK model including covariates was evaluated by comparing typical values of PK parameters with the mean of individual Bayesian estimates or individual values of PK parameters with the results from non-compartmental analysis for patients with serial samples Steady-state metoprolol plasma concentration-time profiles from 0ndash24 hours at the interval of 15 minutes (025 hour) were calculated using the post hoc Bayesian estimated PK parameter obtained for 65 patients included in the PKPD relationship using the following equation
DCP1PM Page 70 10182006
Clinical Pharmacology Review NDA 19-962 Toprol-XL 10182006
PKPD Initial and Final Model Selection A similar approach to that of PK model selection was adopted for PKPD Each of the above-mentioned PKPD models with random effects was identified by curve-fitting the dataset Initial selection of the PKPD structural model was based upon a significant reduction in MOF (plt005) as compared to the baseline model and reasonable PKPD parameter estimates Software
Nonlinear mixed-effect modeling (NONMEM) software (Version V level 11 Globomax Hanover MD) was used in the population PK analysis PK model fitting was accomplished using first-order (FO) approximation methods For PKPD model fitting the first-order conditional estimation (FOCE) with eta-epsilon interaction method in NONMEM was used for all model runs
SAS software (Version VIII Cary NC) was employed to prepare datasets according to the format required by the NONMEM program (Boeckmann et al 1991) Microsoftreg Excel 2000 (Redmond WA) and S-PLUS 2000 (Professional Release 2 MathSoft Inc Cambridge MA) were used to perform exploratory graphical exposure calculation and statistical analyses according to the format required by the NONMEM program (Boeckmann et al 1991) SAS command files logs and listings pertaining to data file conversion and merging were reviewed by an independent analyst Datasets were stored in SAS data frames combined and exported to Excel and then to ASCII files before fitting to the model
Datasets were prepared and pooled in a NONMEM-compliant format using SAS software by the Programming Group Clinical Information Sciences at AstraZeneca Wilmington Delaware SAS command files logs and listings pertaining to file conversion and merging were provided and found to be acceptable The contents of both datasets (toprolkatcsv for PK modeling and cppd2csv for PKPD modeling) were included
DCP1PM Page 71 10182006
Clinical Pharmacology Review NDA 19-962 Toprol-XL 10182006
toprolkatcsv was not provided electronically in a SAS format however this reviewer generated a similar dataset using the applicantrsquos criteria
Reviewer Comment The software and data assembly methods appeared adequate
DCP1PM Page 72 10182006
Clinical Pharmacology Review NDA 19-962 Toprol-XL 10182006
Results and Discussion Design Adequacy
Overall the trial designs appeared adequate to evaluate metoprolol population PK and PKPD in pediatric patients receiving Toprol XL However the design could have been further optimized by increasing the sampling points particularly in the absorption phase Due to the limited number of samples in the absorption phase it was not possible to accurately characterize the absorption model first order vs zero order or mixed first and zero order Additionally collection of mainly trough samples limits the ability to accurately estimate measures such as Cmax that are not directly related to Ctrough particularly if multiple compartments are present Consequently Cmax estimations are unlikely to be accurate Finally most patients provided only one trough sample thus inter-individual variability could not be adequately captured and may have limited the utility of the modeling exercise particularly in PKPD where the random effect could not be accurately characterized Ultimately there was no random variable in the final PKPD model (ie eta was set to zero) Data Integrity
This reviewer checked the data visually by randomly selecting data from patients included in the population modeling and comparing to data in the study report (source data) Overall the data integrity appeared acceptable The applicant observed the following guidelines that appeared acceptable No datum from any study participant with a protocol violation that was thought to materially impact the analysis was included The dataset contained data from only those study participants who could be evaluated ie with all the last dosing datetime blood sampling datetime plasma drug concentrations and demographic covariates
Data that were excluded (n = 62 samples) from the model were as follows One sample from an apparent poor metabolizer Two samples collected gt 96 hours post dose From 307B 10 trough samples lt LOQ From 307A 17 samples lt LOQ Thirty-samples from serial data that were lt LOQ or whole blood samples Model and Model Selection
Base Model
41110 Pharmacokinetic Model description The base PK model was a standard two compartment model that incorporated lag time and flip-flop kinetics The key features of the model were flip-flop was insured by making the value of ke gt ka in the clearance equation Additionally lag time was restricted to a value of 2 hours or less and concentrations were log transformed consequently all concentrations (F) = 0 were given individual predicted concentrations of zero Finally there were two residual error terms one for serial samples and the other for trough samples DCP1PM Page 73 10182006
Clinical Pharmacology Review NDA 19-962 Toprol-XL 10182006
Key equations were as follows
KA = THETA(1)EXP(ETA(1)) V2 = THETA(2)EXP(ETA(2)) CL = (THETA(1)THETA(2)+THETA(3))EXP(ETA(3)) Q = THETA(4)EXP(ETA(4)) V3 = THETA(5)EXP(ETA(5)) ALAG1=THETA(6)EXP(ETA(6))
41111 PK Parameter estimation results Table 1 Summary of PK parameters in the metoprolol population PK base model (per applicant)
41112 Goodness of fit The applicant provided the following goodness-of-fit plots (Figure 1)
Reviewer Note The goodness-of-fit plots were reproduced by this Reviewer (see Appendix) with minor modifications
Figure 1 Goodness of fit plots for Base Model
DCP1PM Page 74 10182006
Clinical Pharmacology Review NDA 19-962 Toprol-XL 10182006
Base PK Model Selection The MOF values of all structural model candidates tested are presented in Table 2 Model selection was based primarily on MOF values the lower MOF the better the model The applicant reports that in general MOF values generated by a conventional absorption model (ie absorption rate is faster than elimination rate) and a flip-flop absorption model (ie absorption rate is slower than elimination rate) were identical
Reviewer Comment The existence of flip-flop kinetics appears plausible based on data provided and general patterns for sustained release formulations Consequently the use of flip-flop kinetics for the bulk of the modeling exercise appears reasonable
General conclusions from the information in Table 2 are First order input is better than zero order input Two compartment model is better than one compartment model Lag time presence is better than lack of lag time Two residual error terms are better than one residual error term It should also be noted that several other models led to unsatisfactory completion of the run and were not considered further
DCP1PM Page 75 10182006
Clinical Pharmacology Review NDA 19-962 Toprol-XL 10182006
Table 2 Comparison of Structural PK Models
Reviewer Comment The selected structural model appears appropriate based on the data
Base Model The deletion of ETA for V2 did not change the MOF value suggesting that ETA for V2 should be deleted to avoid an over-parameterized warning (Table 3) This was consistent with the estimated parameter value of ETA for V2 being 648 x 10ndash9 a very small value Therefore the base model was selected by deleting the ETA for V2 from the structural model
Reviewer Comment on Eta deletion for V2 Deletion of eta for V2 is acceptable based on the empirical data however from a physiological perspective deletion of eta is problematic Generally one anticipates inter-individual differences in volume of distribution In this case it appears that the error associated with V2 may have been randomly shifted to V3 and or Q terms as the three DCP1PM Page 76 10182006
Clinical Pharmacology Review NDA 19-962 Toprol-XL 10182006
terms are interrelated This potential shift in error is supported by the fact that the V2 eta value increases significantly (by several orders of magnitude- 10-5 vs 100) when eta for Q and or V3 is fixed However when Q or V3 are fixed minimization is successful but Q and V3 are not accurately estimated Accounting for the possible error shift is a complex process and goes beyond the scope of this reviewer thus deletion of eta associated with V2 was considered acceptable for the remainder of the modeling evaluation
Table 3 Structural elements tested in the metoprolol population PK structural model (p lt 0005)
Final PK Model
41113 Model description The key feature of the final model is the inclusion of the covariate effects of age on Q and weight on CL in the population PK model
Key Equations CL = (THETA(1)THETA(2)+THETA(3)+EWT)EXP(ETA(2)) Q = THETA(4)EAGEEXP(ETA(3))
Including Covariate Effects As previously described covariate effects were assessed by forward addition and backward deletion Most covariates did not significantly change MOF however BSA significantly affected CL and Age affected Q Consequently these covariates were included in the penultimate final model
DCP1PM Page 77 10182006
Clinical Pharmacology Review NDA 19-962 Toprol-XL 10182006
Reviewer Note BSA is derived form WT and HT covariates implying BSA is highly correlated to these two covariates (Figure 2) weight is the most suitable (practical covariate) as it is readily measured Furthermore weight and BSA produced the same MOF (Table 4) whereas MOF with height was more positive (less significant)
Figure 2 Plot of BSA vs Body Weight
The data in Table 4 support selection of the final model
Table 4 Covariate elements tested in the metoprolol population PK penultimate final model (plt0005)
The applicant acknowledges that mechanism(s) accounting for the impact of age on QF are not clear However since distribution clearance has little effect on metoprolol plasma exposure further investigation is not needed
41114 PK Parameter estimation results As shown in Table 5 PK parameters were estimated fairly precisely by the final model
Table 5 PK Parameter Estimates using Final Model
DCP1PM Page 78 10182006
Clinical Pharmacology Review NDA 19-962 Toprol-XL 10182006
41115 Goodness of fit The goodness-of-fit plots provided by the applicant show good precision Figure 5 Goodness of fit plots for final PK model
DCP1PM Page 79 10182006
Clinical Pharmacology Review NDA 19-962 Toprol-XL 10182006
PK Model Qualification The post hoc Bayesian-estimated AUC (simulated) obtained for the 27 patients with serial plasma samples are plotted against the observed (AUCt) The correlation was high (R2 gt 099) Figure 6 AUClast from observed data versus AUCt from model simulation in the 27 patients providing serial plasma samples
Regression line Y= 4514 + 08976 X R2 = 09957
The graphical validation of the final metoprolol population PK model validation against covariates evaluated is presented in Figure 6
Figure 7 Graphical validation of covariates
DCP1PM Page 80 10182006
Clinical Pharmacology Review NDA 19-962 Toprol-XL 10182006
There was no systematic bias in weighted residuals for any covariates evaluated suggesting that the final model included all appreciable effects of available covariates (Figure)
The effects of weight on metoprolol CLF are illustrated in Figure 8 where Bayesian post hoc estimates of CLF are plotted against weight and overlaid by the model-predicted line Overall the model appeared to fit the data well
Figure 8 Plot of CLF vs Body weight
The effects of AGE on metoprolol QF are illustrated in Figure 9 where Bayesian post hoc estimates of QF are plotted against AGE and overlaid by the model-predicted line Figure 9 Plot of QF vs Age
DCP1PM Page 81 10182006
Clinical Pharmacology Review NDA 19-962 Toprol-XL 10182006
Reviewer Note The applicant indicated that attempts to run the final model using the first-order conditional estimation method resulted in termination errors Therefore the parameter estimates obtained by the FO method were reported as the final parameter estimates
Conclusion Regarding Population PK Modeling Overall the sponsorrsquos population PK modeling is acceptable
PKPD Model and Model Selection
PKPD Base Model PharmacokineticPharmacodynamic Model description The key feature of the model was a lack of random variance term for the slope (since only single data points were available per subject) and inclusion of baseline effect
Key equations were as follows E0 = THETA(1)EXP(ETA(1)) M = THETA(2) Y = E0 + MLOG(AUC) + EPS(1)
The control stream provided in the appendix is that for DBP (provided by sponsor) The control stream for SBP is comparable with appropriate substitution for BP type
It should be noted that only the log-linear and linear PKPD models were considered suitable for AUC and Cmax For this review only AUC estimates were considered reliable as Cmax estimates could not be accurately determined based on the sampling scheme Consequently the remainder of this review focuses on AUC information although Ctrough and Cmax data are displayed for reference
Bayesian estimates from PK modeling are summarized in Table 1
Table 1 Bayesian estimates of metoprolol PK exposure for those patients included in the PKPD analysis (N=65)
DCP1PM Page 82 10182006
Clinical Pharmacology Review NDA 19-962 Toprol-XL 10182006
PKPD Model Selection (initial and final) The log-linear model was adopted as the base model for this PKPD relationship since it improved the MOF significantly (Table 2) The ETA parameter for the slope was pre-eliminated for the purpose of model parsimony The intercept and slope in this log-linear model for AUC(0-24) did not bear ETA parameter therefore no covariates had impact on either parameter in the model
Reviewer Note The intercept should not have borne an eta term because individual subjects provided only one data point Consequently fixing eta to zero or deleting eta in the final model is appropriate No further model development was required after eta was eliminated and the base model was equivalent to the final model
Table 2 Base population PKPD models tested for the change in SBP
41116 PKPD Parameter estimation results The final PKPD parameter estimates are presented in Table 3
Table 3 Summary parameters in the final PKPD model for the change in SBP using trough plasma level Parameter Explanation Estimate SE ()b
DCP1PM Page 83 10182006
Clinical Pharmacology Review NDA 19-962 Toprol-XL 10182006
Model Qualification Based on the relatively low R2 value and as shown in Figure there is a poor correlation between change in SBP and log AUC
Figure 1 Relationship between change in SBP and AUC (line generated from modeling)
Overall goodness-of-fit of the model was considered to be poor probably due to the high variability in the measurements Consequently the precision of the model parameter estimates was not considered to be very reliable These parameters have little clinical usefulness and can be treated only as an indication of trends ie more hemodynamic effects can be potentially achieved when high Toprol-XL doses are given Clinical dose adjustment based on these PKPD parameters is not recommended
Reviewerrsquos Supplemental Analyses A supplemental PKPD analyses was conducted using simple linear regression since the population model did not improve the fit Overall eta made an insignificant contribution to the overall model The results of the analyses were similar to the population analyses A series of regression analyses were conducted and are presented in Table 4
The applicant notes that the preliminary modeling exercise found that there was no difference in the PKPD modeling results using different hemodynamic data formats (ie change in the measurements percent change in the measurements or actual BP measurements) This finding was confirmed by this reviewer (see Table 4)
DCP1PM Page 84 10182006
Clinical Pharmacology Review NDA 19-962 Toprol-XL 10182006
Table 4 Supplemental PKPD Regression Analyses Conducted by Reviewer Model (liner regression) Intercept (I) Slope (m) R2 Probability RSBP = mISBP + I 3957 -035 01626 0009 PSBP = mISBP + I 2524 -023 01252 00038 PSBP = mRSBP + I 0005 074 09891 lt 00001 RSBP = mlogAUC + I 651 -221 0060 00493 RSBP = mDose + I -751 0006 00026 06878 RSBP = mDose^ + I -312 -111 004 02711 RSBP = mlogAUC + nISBP + I 5303 -221 (m)
-035 (n) 02230 0001
RSBPplc = mAUC + I -667 -0003 00458 00871 RSBPplc = mlogAUC + I 461 -2208 00600 00493 RPUL = mlogAUC + I 1868 -405 01102 00069 Symbols in table similar to population PK model without eta term RSBP- change of SBP without placebo correction ISBP- initial (baseline) SBP RPUL- change in HR without placebo correction Dose- in mg where placebo is included as 0 mg PSBP- percentage change of SBP without placebo correction
Conclusion Regarding Population PKPD Modeling Overall the sponsorrsquos population PKPD modeling is acceptable No dose adjustment conclusion can be made from this modeling however an exposure-response relationship was established for AUC and reduction in SBP
Discussion
The significance of the results 1 Provide estimates of PK measures and plasma exposure in pediatric population These data can be compared to adult exposure to determine if exposure differences impact drug effectiveness The main challenge in comparing pediatric data to adult data is different modeling schemes formulations and methods were used in the two populations
2 PKPD findings are not sufficiently precise to provide a dose adjustment algorithm however the PKPD analyses provides rationale for proposed titration as increasing exposure (doses) may improve efficacy (reduction in SBP) Ultimately the risk-benefit analyses overrides PKPD assessment for dose adjustment drug will be titrated thus reliance on PKPD information is not critical The proposed dose 10 mgkg appears suitable based on available information It is unclear from the studies if there should be an initial maximum dose although the sponsor has proposed 50 mg as the maximum initial dose The proposed pediatric starting dose on a mgkg basis is within the range of starting adult doses (25 ndash 100 mg) assuming an adult weighs 70 kg
3 Cumulative information form dose-response study indicates that Toprol XL has effectiveness in children however the most effective dose is unclear Since the drug can be titrated determining the initial optimal dose does not appear critical As proposed by the applicant dosing is started at a ldquolowrdquo dose that can be up-titrated if needed
DCP1PM Page 85 10182006
Clinical Pharmacology Review NDA 19-962 Toprol-XL 10182006
4 The results did not adequately address the potential impact of CYP2D6 metabolic status for pediatric patients taking Toprol XL There were an insufficient number of patients to make this assessment
5 Covariate effects do not appear significant only body weight significantly affects clearance However a worst case scenario can occur with a person that has a low body weight and is a poor metabolizer this will result in very high possibly supra-therapeutic exposure Age does not impact apparent oral clearance so an age-dependent dose adjustment is not needed for children over 6 years old In essence all children over six years old can initiate therapy at 10 mgkg
The validity of the results Overall the results produced by the sponsor appear valid and the sponsor used a sound modeling approach However alternative approaches that could have been adopted may have improved the outcome of the analyses Three of these approaches are presented below 1 Additional PK samples should have been collected during the absorption phase and
throughout the dosing interval to improve the modelrsquos performance Specifically additional samples collected during the absorption phase may have unambiguously identified the actual absorption input function (eg first order zero order mixed first and zero order) First order input was selected for the analyses although the dosage form is reported to exhibit zero order kinetics in adults It is possible that the input rate in children differs from that in adults but unlikely It should be noted that absorption kinetics in children is often erratic due to multiple factors (eg regioshyselective absorption incomplete gastric emptying and inconsistent absorption) so it is unclear if additional samples would have definitively identified the absorption function However additional non-trough samples may have helped in estimating key PK measures such as V and Cmax The final model did not have an eta associated with V which is atypical Collection of additional samples on different visits may have helped estimate potential inter-occasion variability It should be noted that AUC was estimated precisely for subjects providing serial samples but these subjects were not necessarily included in the PKPD analyses Ideally the PKPD modeling should have been conducted primarily in subjects who had accurate PK measures
2 The PKPD design could have been modified to potentially improve the utility of the analyses Specifically there should have been better placebo matching procedures to minimize the potential impact of the placebo effect This matching could have been improved by ensuring all patients on placebo had the same titration schedule and number of tablets It is noted that the model had a poor predictive performance that was mainly attributed to the high degree of variability in the PD measures Potentially other PD markers could have been explored that have less inherent variability One such marker is the degree of beta blockade using exercise heart rate (EHR) reduction this marker has been used extensively for metoprolol in adult subjects However use of EHR in the pediatric setting may be challenging
DCP1PM Page 86 10182006
Clinical Pharmacology Review NDA 19-962 Toprol-XL 10182006
Comments to sponsor
In future pharmacometric studies you should consider the following 1 collect sufficient (multiple) samples from individual subjects to allow assessment
of inter-occasion variability and estimation of inter-individual variability (eta) for all relevant parameters
2 placebo groups should be identically matched across all dose groups (eg same titration schedule and number tablets) to minimize potential bias or differences in the placebo effect
Comments to medical reviewer
1 The sponsor has adequately characterized metoprolol PK in the studied pediatric population The PK characterization could have been further optimized by obtaining additional samples over the entire dosing interval (eg during the absorption phase and elimination phase) on multiple occasions rather than on one occasion primarily at trough
2 A dose-response relationship could not be established using the protocol specified analysis approach The outcome of the dose-response relationship appeared highly dependent on the ldquoplacebo effectrdquo suggesting that the placebo group may not have been appropriate One should consider re-evaluating the dose-response precisely matched placebo groups (eg all placebo patients have identical number of tablets and titration schedule)
3 Based on the PKPD analysis plasma exposure (AUC) explains lt 10 of the response (reduction in systolic blood pressure) thus has limited clinical utility However the PKPD relationship suggests that there is a trend for increased response with increased exposure (dose driven)
4 Overall information from the dose-response study suggests that Toprol- XL is effective in the pediatric population The optimal initial dose 02 10 or 20 mgkg or the maximum safe and effective dose cannot be determined from the information provided It is noted that the 02 mgkg dose is unlikely to be effective as plasma concentrations achieved at this dose are unlikely to be effective (most concentrations lt LOQ and lower than effective adult concentrations) The 10 mgkg (proposed by applicant) appears to be a reasonable initial dose The labeling should reflect the regimens studied
DCP1PM Page 89 10182006
Clinical Pharmacology Review NDA 19-962 Toprol-XL 10182006
Appendix
DCP1PM Page 90 10182006
Clinical Pharmacology Review NDA 19-962 Toprol-XL 10182006
DCP1PM Page 91 10182006
Clinical Pharmacology Review NDA 19-962 Toprol-XL 10182006
DCP1PM Page 92 10182006
Clinical Pharmacology Review NDA 19-962 Toprol-XL 10182006
DCP1PM Page 93 10182006
Clinical Pharmacology Review NDA 19-962 Toprol-XL 10182006
DCP1PM Page 94 10182006
Clinical Pharmacology Review NDA 19-962 Toprol-XL 10182006
DCP1PM Page 95 10182006
Clinical Pharmacology Review NDA 19-962 Toprol-XL 10182006
Table 15 Control streams for final log-linear PKPD model for the change in DBP using metoprolol Cmax as the measure of exposure
Truncated NONMEM reports for base model identification for PKPD relationship in change of SBP (per sponsor)
DCP1PM Page 96 10182006
Clinical Pharmacology Review NDA 19-962 Toprol-XL 10182006
Reported PD information^
^ Under metoprolol regimen CRZ0K is Toprol XL
DCP1PM Page 97 10182006
Clinical Pharmacology Review NDA 19-962 Toprol-XL 10182006
Table Results of randomised double-blind comparative trials evaluating antihypertensive efficacy of metoprolol formulations or other antihypertensives
DCP1PM Page 98 10182006
---------------------------------------------------------------------------------------------------------------------
---------------------------------------------------------------------------------------------------------------------
---------------------
This is a representation of an electronic record that was signed electronically and this page is the manifestation of the electronic signature
s
Robert Kumi 10182006 045635 PM BIOPHARMACEUTICS
Patrick Marroum 10192006 050811 PM BIOPHARMACEUTICS
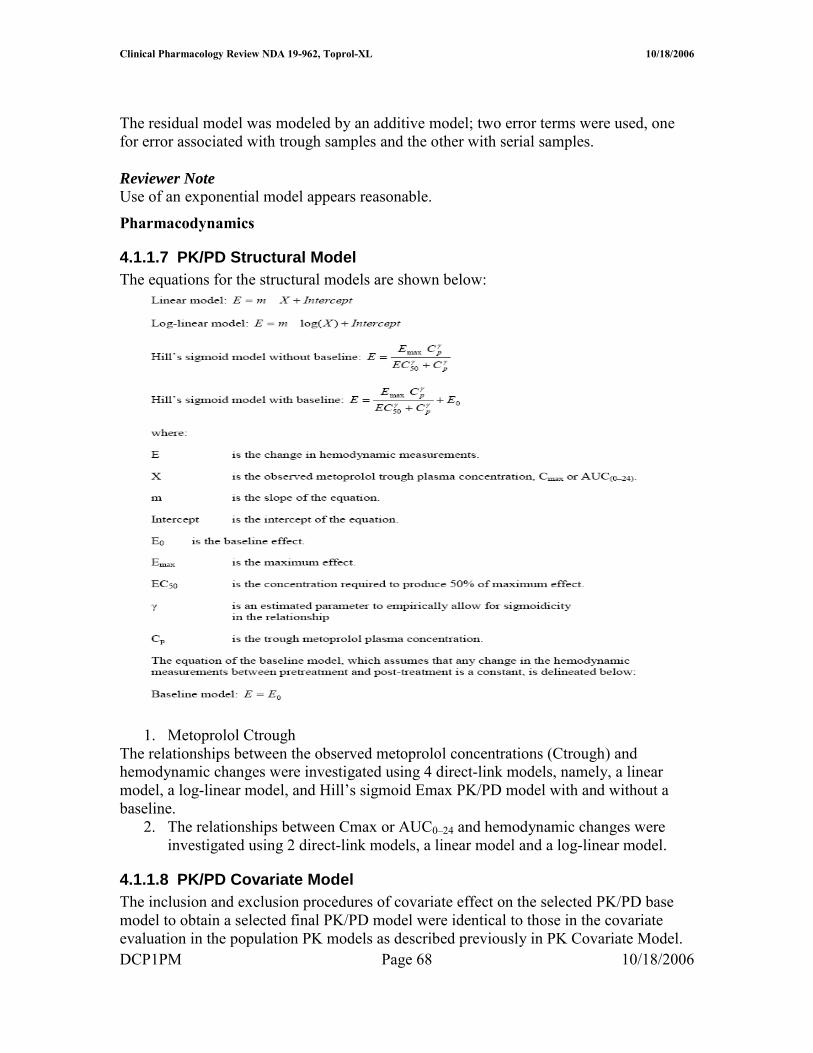
Clinical Pharmacology Review NDA 19-962 Toprol-XL 10182006
Model Selection
PK Initial Model Selection
PK Base Model to Final Model The selection of the most appropriate PK base model for a metoprolol PK was based upon the following criteria a significant reduction in MOF as compared to the baseline model and asymptotic chi-square distribution based on the likelihood ratio test or AIC (plt005) as compared to the other structural models This selected PK base model was then subject to a covariate evaluation The population PK model bearing all surviving covariate parameters with statistical significance became the penultimate final model If 1 of the body size parameters (WT BSA and HT) was not in the model the penultimate final model became the final model If body size parameters were in the model they were sequentially replaced by other body size parameters in the regression submodel for each PK parameter The best body size parameter was then selected on the basis of lowest MOF to form the final model
PK Final Model Selection Simulations and visual inspections based on goodness of fit plots were used to qualify and validate the model The goodness-of-fit of the final model was evaluated graphically by comparing population and individual predictions of metoprolol concentrations with observed metoprolol concentrations along the line of unity and by visual inspection of the following plots of population-weighted residuals (WRES) for the final population model 1 Population-weighted residuals (WRES) versus population-predicted concentrations (PRED) 2 WRES versus time after first drug administration in each patient 3 WRES versus all covariates evaluated WRES were generally expected to be distributed homogenously around zero for PRED time after administration and covariates For those 27 patients with serial samples goodness-of-fit of the plasma concentration-time profile for each individual was visually inspected The linear relationship between their AUClast values from the observed data and those from the simulated data (final model) was examined
The predictive performance of the final population PK model including covariates was evaluated by comparing typical values of PK parameters with the mean of individual Bayesian estimates or individual values of PK parameters with the results from non-compartmental analysis for patients with serial samples Steady-state metoprolol plasma concentration-time profiles from 0ndash24 hours at the interval of 15 minutes (025 hour) were calculated using the post hoc Bayesian estimated PK parameter obtained for 65 patients included in the PKPD relationship using the following equation
DCP1PM Page 70 10182006
Clinical Pharmacology Review NDA 19-962 Toprol-XL 10182006
PKPD Initial and Final Model Selection A similar approach to that of PK model selection was adopted for PKPD Each of the above-mentioned PKPD models with random effects was identified by curve-fitting the dataset Initial selection of the PKPD structural model was based upon a significant reduction in MOF (plt005) as compared to the baseline model and reasonable PKPD parameter estimates Software
Nonlinear mixed-effect modeling (NONMEM) software (Version V level 11 Globomax Hanover MD) was used in the population PK analysis PK model fitting was accomplished using first-order (FO) approximation methods For PKPD model fitting the first-order conditional estimation (FOCE) with eta-epsilon interaction method in NONMEM was used for all model runs
SAS software (Version VIII Cary NC) was employed to prepare datasets according to the format required by the NONMEM program (Boeckmann et al 1991) Microsoftreg Excel 2000 (Redmond WA) and S-PLUS 2000 (Professional Release 2 MathSoft Inc Cambridge MA) were used to perform exploratory graphical exposure calculation and statistical analyses according to the format required by the NONMEM program (Boeckmann et al 1991) SAS command files logs and listings pertaining to data file conversion and merging were reviewed by an independent analyst Datasets were stored in SAS data frames combined and exported to Excel and then to ASCII files before fitting to the model
Datasets were prepared and pooled in a NONMEM-compliant format using SAS software by the Programming Group Clinical Information Sciences at AstraZeneca Wilmington Delaware SAS command files logs and listings pertaining to file conversion and merging were provided and found to be acceptable The contents of both datasets (toprolkatcsv for PK modeling and cppd2csv for PKPD modeling) were included
DCP1PM Page 71 10182006
Clinical Pharmacology Review NDA 19-962 Toprol-XL 10182006
toprolkatcsv was not provided electronically in a SAS format however this reviewer generated a similar dataset using the applicantrsquos criteria
Reviewer Comment The software and data assembly methods appeared adequate
DCP1PM Page 72 10182006
Clinical Pharmacology Review NDA 19-962 Toprol-XL 10182006
Results and Discussion Design Adequacy
Overall the trial designs appeared adequate to evaluate metoprolol population PK and PKPD in pediatric patients receiving Toprol XL However the design could have been further optimized by increasing the sampling points particularly in the absorption phase Due to the limited number of samples in the absorption phase it was not possible to accurately characterize the absorption model first order vs zero order or mixed first and zero order Additionally collection of mainly trough samples limits the ability to accurately estimate measures such as Cmax that are not directly related to Ctrough particularly if multiple compartments are present Consequently Cmax estimations are unlikely to be accurate Finally most patients provided only one trough sample thus inter-individual variability could not be adequately captured and may have limited the utility of the modeling exercise particularly in PKPD where the random effect could not be accurately characterized Ultimately there was no random variable in the final PKPD model (ie eta was set to zero) Data Integrity
This reviewer checked the data visually by randomly selecting data from patients included in the population modeling and comparing to data in the study report (source data) Overall the data integrity appeared acceptable The applicant observed the following guidelines that appeared acceptable No datum from any study participant with a protocol violation that was thought to materially impact the analysis was included The dataset contained data from only those study participants who could be evaluated ie with all the last dosing datetime blood sampling datetime plasma drug concentrations and demographic covariates
Data that were excluded (n = 62 samples) from the model were as follows One sample from an apparent poor metabolizer Two samples collected gt 96 hours post dose From 307B 10 trough samples lt LOQ From 307A 17 samples lt LOQ Thirty-samples from serial data that were lt LOQ or whole blood samples Model and Model Selection
Base Model
41110 Pharmacokinetic Model description The base PK model was a standard two compartment model that incorporated lag time and flip-flop kinetics The key features of the model were flip-flop was insured by making the value of ke gt ka in the clearance equation Additionally lag time was restricted to a value of 2 hours or less and concentrations were log transformed consequently all concentrations (F) = 0 were given individual predicted concentrations of zero Finally there were two residual error terms one for serial samples and the other for trough samples DCP1PM Page 73 10182006
Clinical Pharmacology Review NDA 19-962 Toprol-XL 10182006
Key equations were as follows
KA = THETA(1)EXP(ETA(1)) V2 = THETA(2)EXP(ETA(2)) CL = (THETA(1)THETA(2)+THETA(3))EXP(ETA(3)) Q = THETA(4)EXP(ETA(4)) V3 = THETA(5)EXP(ETA(5)) ALAG1=THETA(6)EXP(ETA(6))
41111 PK Parameter estimation results Table 1 Summary of PK parameters in the metoprolol population PK base model (per applicant)
41112 Goodness of fit The applicant provided the following goodness-of-fit plots (Figure 1)
Reviewer Note The goodness-of-fit plots were reproduced by this Reviewer (see Appendix) with minor modifications
Figure 1 Goodness of fit plots for Base Model
DCP1PM Page 74 10182006
Clinical Pharmacology Review NDA 19-962 Toprol-XL 10182006
Base PK Model Selection The MOF values of all structural model candidates tested are presented in Table 2 Model selection was based primarily on MOF values the lower MOF the better the model The applicant reports that in general MOF values generated by a conventional absorption model (ie absorption rate is faster than elimination rate) and a flip-flop absorption model (ie absorption rate is slower than elimination rate) were identical
Reviewer Comment The existence of flip-flop kinetics appears plausible based on data provided and general patterns for sustained release formulations Consequently the use of flip-flop kinetics for the bulk of the modeling exercise appears reasonable
General conclusions from the information in Table 2 are First order input is better than zero order input Two compartment model is better than one compartment model Lag time presence is better than lack of lag time Two residual error terms are better than one residual error term It should also be noted that several other models led to unsatisfactory completion of the run and were not considered further
DCP1PM Page 75 10182006
Clinical Pharmacology Review NDA 19-962 Toprol-XL 10182006
Table 2 Comparison of Structural PK Models
Reviewer Comment The selected structural model appears appropriate based on the data
Base Model The deletion of ETA for V2 did not change the MOF value suggesting that ETA for V2 should be deleted to avoid an over-parameterized warning (Table 3) This was consistent with the estimated parameter value of ETA for V2 being 648 x 10ndash9 a very small value Therefore the base model was selected by deleting the ETA for V2 from the structural model
Reviewer Comment on Eta deletion for V2 Deletion of eta for V2 is acceptable based on the empirical data however from a physiological perspective deletion of eta is problematic Generally one anticipates inter-individual differences in volume of distribution In this case it appears that the error associated with V2 may have been randomly shifted to V3 and or Q terms as the three DCP1PM Page 76 10182006
Clinical Pharmacology Review NDA 19-962 Toprol-XL 10182006
terms are interrelated This potential shift in error is supported by the fact that the V2 eta value increases significantly (by several orders of magnitude- 10-5 vs 100) when eta for Q and or V3 is fixed However when Q or V3 are fixed minimization is successful but Q and V3 are not accurately estimated Accounting for the possible error shift is a complex process and goes beyond the scope of this reviewer thus deletion of eta associated with V2 was considered acceptable for the remainder of the modeling evaluation
Table 3 Structural elements tested in the metoprolol population PK structural model (p lt 0005)
Final PK Model
41113 Model description The key feature of the final model is the inclusion of the covariate effects of age on Q and weight on CL in the population PK model
Key Equations CL = (THETA(1)THETA(2)+THETA(3)+EWT)EXP(ETA(2)) Q = THETA(4)EAGEEXP(ETA(3))
Including Covariate Effects As previously described covariate effects were assessed by forward addition and backward deletion Most covariates did not significantly change MOF however BSA significantly affected CL and Age affected Q Consequently these covariates were included in the penultimate final model
DCP1PM Page 77 10182006
Clinical Pharmacology Review NDA 19-962 Toprol-XL 10182006
Reviewer Note BSA is derived form WT and HT covariates implying BSA is highly correlated to these two covariates (Figure 2) weight is the most suitable (practical covariate) as it is readily measured Furthermore weight and BSA produced the same MOF (Table 4) whereas MOF with height was more positive (less significant)
Figure 2 Plot of BSA vs Body Weight
The data in Table 4 support selection of the final model
Table 4 Covariate elements tested in the metoprolol population PK penultimate final model (plt0005)
The applicant acknowledges that mechanism(s) accounting for the impact of age on QF are not clear However since distribution clearance has little effect on metoprolol plasma exposure further investigation is not needed
41114 PK Parameter estimation results As shown in Table 5 PK parameters were estimated fairly precisely by the final model
Table 5 PK Parameter Estimates using Final Model
DCP1PM Page 78 10182006
Clinical Pharmacology Review NDA 19-962 Toprol-XL 10182006
41115 Goodness of fit The goodness-of-fit plots provided by the applicant show good precision Figure 5 Goodness of fit plots for final PK model
DCP1PM Page 79 10182006
Clinical Pharmacology Review NDA 19-962 Toprol-XL 10182006
PK Model Qualification The post hoc Bayesian-estimated AUC (simulated) obtained for the 27 patients with serial plasma samples are plotted against the observed (AUCt) The correlation was high (R2 gt 099) Figure 6 AUClast from observed data versus AUCt from model simulation in the 27 patients providing serial plasma samples
Regression line Y= 4514 + 08976 X R2 = 09957
The graphical validation of the final metoprolol population PK model validation against covariates evaluated is presented in Figure 6
Figure 7 Graphical validation of covariates
DCP1PM Page 80 10182006
Clinical Pharmacology Review NDA 19-962 Toprol-XL 10182006
There was no systematic bias in weighted residuals for any covariates evaluated suggesting that the final model included all appreciable effects of available covariates (Figure)
The effects of weight on metoprolol CLF are illustrated in Figure 8 where Bayesian post hoc estimates of CLF are plotted against weight and overlaid by the model-predicted line Overall the model appeared to fit the data well
Figure 8 Plot of CLF vs Body weight
The effects of AGE on metoprolol QF are illustrated in Figure 9 where Bayesian post hoc estimates of QF are plotted against AGE and overlaid by the model-predicted line Figure 9 Plot of QF vs Age
DCP1PM Page 81 10182006
Clinical Pharmacology Review NDA 19-962 Toprol-XL 10182006
Reviewer Note The applicant indicated that attempts to run the final model using the first-order conditional estimation method resulted in termination errors Therefore the parameter estimates obtained by the FO method were reported as the final parameter estimates
Conclusion Regarding Population PK Modeling Overall the sponsorrsquos population PK modeling is acceptable
PKPD Model and Model Selection
PKPD Base Model PharmacokineticPharmacodynamic Model description The key feature of the model was a lack of random variance term for the slope (since only single data points were available per subject) and inclusion of baseline effect
Key equations were as follows E0 = THETA(1)EXP(ETA(1)) M = THETA(2) Y = E0 + MLOG(AUC) + EPS(1)
The control stream provided in the appendix is that for DBP (provided by sponsor) The control stream for SBP is comparable with appropriate substitution for BP type
It should be noted that only the log-linear and linear PKPD models were considered suitable for AUC and Cmax For this review only AUC estimates were considered reliable as Cmax estimates could not be accurately determined based on the sampling scheme Consequently the remainder of this review focuses on AUC information although Ctrough and Cmax data are displayed for reference
Bayesian estimates from PK modeling are summarized in Table 1
Table 1 Bayesian estimates of metoprolol PK exposure for those patients included in the PKPD analysis (N=65)
DCP1PM Page 82 10182006
Clinical Pharmacology Review NDA 19-962 Toprol-XL 10182006
PKPD Model Selection (initial and final) The log-linear model was adopted as the base model for this PKPD relationship since it improved the MOF significantly (Table 2) The ETA parameter for the slope was pre-eliminated for the purpose of model parsimony The intercept and slope in this log-linear model for AUC(0-24) did not bear ETA parameter therefore no covariates had impact on either parameter in the model
Reviewer Note The intercept should not have borne an eta term because individual subjects provided only one data point Consequently fixing eta to zero or deleting eta in the final model is appropriate No further model development was required after eta was eliminated and the base model was equivalent to the final model
Table 2 Base population PKPD models tested for the change in SBP
41116 PKPD Parameter estimation results The final PKPD parameter estimates are presented in Table 3
Table 3 Summary parameters in the final PKPD model for the change in SBP using trough plasma level Parameter Explanation Estimate SE ()b
DCP1PM Page 83 10182006
Clinical Pharmacology Review NDA 19-962 Toprol-XL 10182006
Model Qualification Based on the relatively low R2 value and as shown in Figure there is a poor correlation between change in SBP and log AUC
Figure 1 Relationship between change in SBP and AUC (line generated from modeling)
Overall goodness-of-fit of the model was considered to be poor probably due to the high variability in the measurements Consequently the precision of the model parameter estimates was not considered to be very reliable These parameters have little clinical usefulness and can be treated only as an indication of trends ie more hemodynamic effects can be potentially achieved when high Toprol-XL doses are given Clinical dose adjustment based on these PKPD parameters is not recommended
Reviewerrsquos Supplemental Analyses A supplemental PKPD analyses was conducted using simple linear regression since the population model did not improve the fit Overall eta made an insignificant contribution to the overall model The results of the analyses were similar to the population analyses A series of regression analyses were conducted and are presented in Table 4
The applicant notes that the preliminary modeling exercise found that there was no difference in the PKPD modeling results using different hemodynamic data formats (ie change in the measurements percent change in the measurements or actual BP measurements) This finding was confirmed by this reviewer (see Table 4)
DCP1PM Page 84 10182006
Clinical Pharmacology Review NDA 19-962 Toprol-XL 10182006
Table 4 Supplemental PKPD Regression Analyses Conducted by Reviewer Model (liner regression) Intercept (I) Slope (m) R2 Probability RSBP = mISBP + I 3957 -035 01626 0009 PSBP = mISBP + I 2524 -023 01252 00038 PSBP = mRSBP + I 0005 074 09891 lt 00001 RSBP = mlogAUC + I 651 -221 0060 00493 RSBP = mDose + I -751 0006 00026 06878 RSBP = mDose^ + I -312 -111 004 02711 RSBP = mlogAUC + nISBP + I 5303 -221 (m)
-035 (n) 02230 0001
RSBPplc = mAUC + I -667 -0003 00458 00871 RSBPplc = mlogAUC + I 461 -2208 00600 00493 RPUL = mlogAUC + I 1868 -405 01102 00069 Symbols in table similar to population PK model without eta term RSBP- change of SBP without placebo correction ISBP- initial (baseline) SBP RPUL- change in HR without placebo correction Dose- in mg where placebo is included as 0 mg PSBP- percentage change of SBP without placebo correction
Conclusion Regarding Population PKPD Modeling Overall the sponsorrsquos population PKPD modeling is acceptable No dose adjustment conclusion can be made from this modeling however an exposure-response relationship was established for AUC and reduction in SBP
Discussion
The significance of the results 1 Provide estimates of PK measures and plasma exposure in pediatric population These data can be compared to adult exposure to determine if exposure differences impact drug effectiveness The main challenge in comparing pediatric data to adult data is different modeling schemes formulations and methods were used in the two populations
2 PKPD findings are not sufficiently precise to provide a dose adjustment algorithm however the PKPD analyses provides rationale for proposed titration as increasing exposure (doses) may improve efficacy (reduction in SBP) Ultimately the risk-benefit analyses overrides PKPD assessment for dose adjustment drug will be titrated thus reliance on PKPD information is not critical The proposed dose 10 mgkg appears suitable based on available information It is unclear from the studies if there should be an initial maximum dose although the sponsor has proposed 50 mg as the maximum initial dose The proposed pediatric starting dose on a mgkg basis is within the range of starting adult doses (25 ndash 100 mg) assuming an adult weighs 70 kg
3 Cumulative information form dose-response study indicates that Toprol XL has effectiveness in children however the most effective dose is unclear Since the drug can be titrated determining the initial optimal dose does not appear critical As proposed by the applicant dosing is started at a ldquolowrdquo dose that can be up-titrated if needed
DCP1PM Page 85 10182006
Clinical Pharmacology Review NDA 19-962 Toprol-XL 10182006
4 The results did not adequately address the potential impact of CYP2D6 metabolic status for pediatric patients taking Toprol XL There were an insufficient number of patients to make this assessment
5 Covariate effects do not appear significant only body weight significantly affects clearance However a worst case scenario can occur with a person that has a low body weight and is a poor metabolizer this will result in very high possibly supra-therapeutic exposure Age does not impact apparent oral clearance so an age-dependent dose adjustment is not needed for children over 6 years old In essence all children over six years old can initiate therapy at 10 mgkg
The validity of the results Overall the results produced by the sponsor appear valid and the sponsor used a sound modeling approach However alternative approaches that could have been adopted may have improved the outcome of the analyses Three of these approaches are presented below 1 Additional PK samples should have been collected during the absorption phase and
throughout the dosing interval to improve the modelrsquos performance Specifically additional samples collected during the absorption phase may have unambiguously identified the actual absorption input function (eg first order zero order mixed first and zero order) First order input was selected for the analyses although the dosage form is reported to exhibit zero order kinetics in adults It is possible that the input rate in children differs from that in adults but unlikely It should be noted that absorption kinetics in children is often erratic due to multiple factors (eg regioshyselective absorption incomplete gastric emptying and inconsistent absorption) so it is unclear if additional samples would have definitively identified the absorption function However additional non-trough samples may have helped in estimating key PK measures such as V and Cmax The final model did not have an eta associated with V which is atypical Collection of additional samples on different visits may have helped estimate potential inter-occasion variability It should be noted that AUC was estimated precisely for subjects providing serial samples but these subjects were not necessarily included in the PKPD analyses Ideally the PKPD modeling should have been conducted primarily in subjects who had accurate PK measures
2 The PKPD design could have been modified to potentially improve the utility of the analyses Specifically there should have been better placebo matching procedures to minimize the potential impact of the placebo effect This matching could have been improved by ensuring all patients on placebo had the same titration schedule and number of tablets It is noted that the model had a poor predictive performance that was mainly attributed to the high degree of variability in the PD measures Potentially other PD markers could have been explored that have less inherent variability One such marker is the degree of beta blockade using exercise heart rate (EHR) reduction this marker has been used extensively for metoprolol in adult subjects However use of EHR in the pediatric setting may be challenging
DCP1PM Page 86 10182006
Clinical Pharmacology Review NDA 19-962 Toprol-XL 10182006
Comments to sponsor
In future pharmacometric studies you should consider the following 1 collect sufficient (multiple) samples from individual subjects to allow assessment
of inter-occasion variability and estimation of inter-individual variability (eta) for all relevant parameters
2 placebo groups should be identically matched across all dose groups (eg same titration schedule and number tablets) to minimize potential bias or differences in the placebo effect
Comments to medical reviewer
1 The sponsor has adequately characterized metoprolol PK in the studied pediatric population The PK characterization could have been further optimized by obtaining additional samples over the entire dosing interval (eg during the absorption phase and elimination phase) on multiple occasions rather than on one occasion primarily at trough
2 A dose-response relationship could not be established using the protocol specified analysis approach The outcome of the dose-response relationship appeared highly dependent on the ldquoplacebo effectrdquo suggesting that the placebo group may not have been appropriate One should consider re-evaluating the dose-response precisely matched placebo groups (eg all placebo patients have identical number of tablets and titration schedule)
3 Based on the PKPD analysis plasma exposure (AUC) explains lt 10 of the response (reduction in systolic blood pressure) thus has limited clinical utility However the PKPD relationship suggests that there is a trend for increased response with increased exposure (dose driven)
4 Overall information from the dose-response study suggests that Toprol- XL is effective in the pediatric population The optimal initial dose 02 10 or 20 mgkg or the maximum safe and effective dose cannot be determined from the information provided It is noted that the 02 mgkg dose is unlikely to be effective as plasma concentrations achieved at this dose are unlikely to be effective (most concentrations lt LOQ and lower than effective adult concentrations) The 10 mgkg (proposed by applicant) appears to be a reasonable initial dose The labeling should reflect the regimens studied
DCP1PM Page 89 10182006
Clinical Pharmacology Review NDA 19-962 Toprol-XL 10182006
Appendix
DCP1PM Page 90 10182006
Clinical Pharmacology Review NDA 19-962 Toprol-XL 10182006
DCP1PM Page 91 10182006
Clinical Pharmacology Review NDA 19-962 Toprol-XL 10182006
DCP1PM Page 92 10182006
Clinical Pharmacology Review NDA 19-962 Toprol-XL 10182006
DCP1PM Page 93 10182006
Clinical Pharmacology Review NDA 19-962 Toprol-XL 10182006
DCP1PM Page 94 10182006
Clinical Pharmacology Review NDA 19-962 Toprol-XL 10182006
DCP1PM Page 95 10182006
Clinical Pharmacology Review NDA 19-962 Toprol-XL 10182006
Table 15 Control streams for final log-linear PKPD model for the change in DBP using metoprolol Cmax as the measure of exposure
Truncated NONMEM reports for base model identification for PKPD relationship in change of SBP (per sponsor)
DCP1PM Page 96 10182006
Clinical Pharmacology Review NDA 19-962 Toprol-XL 10182006
Reported PD information^
^ Under metoprolol regimen CRZ0K is Toprol XL
DCP1PM Page 97 10182006
Clinical Pharmacology Review NDA 19-962 Toprol-XL 10182006
Table Results of randomised double-blind comparative trials evaluating antihypertensive efficacy of metoprolol formulations or other antihypertensives
DCP1PM Page 98 10182006
---------------------------------------------------------------------------------------------------------------------
---------------------------------------------------------------------------------------------------------------------
---------------------
This is a representation of an electronic record that was signed electronically and this page is the manifestation of the electronic signature
s
Robert Kumi 10182006 045635 PM BIOPHARMACEUTICS
Patrick Marroum 10192006 050811 PM BIOPHARMACEUTICS
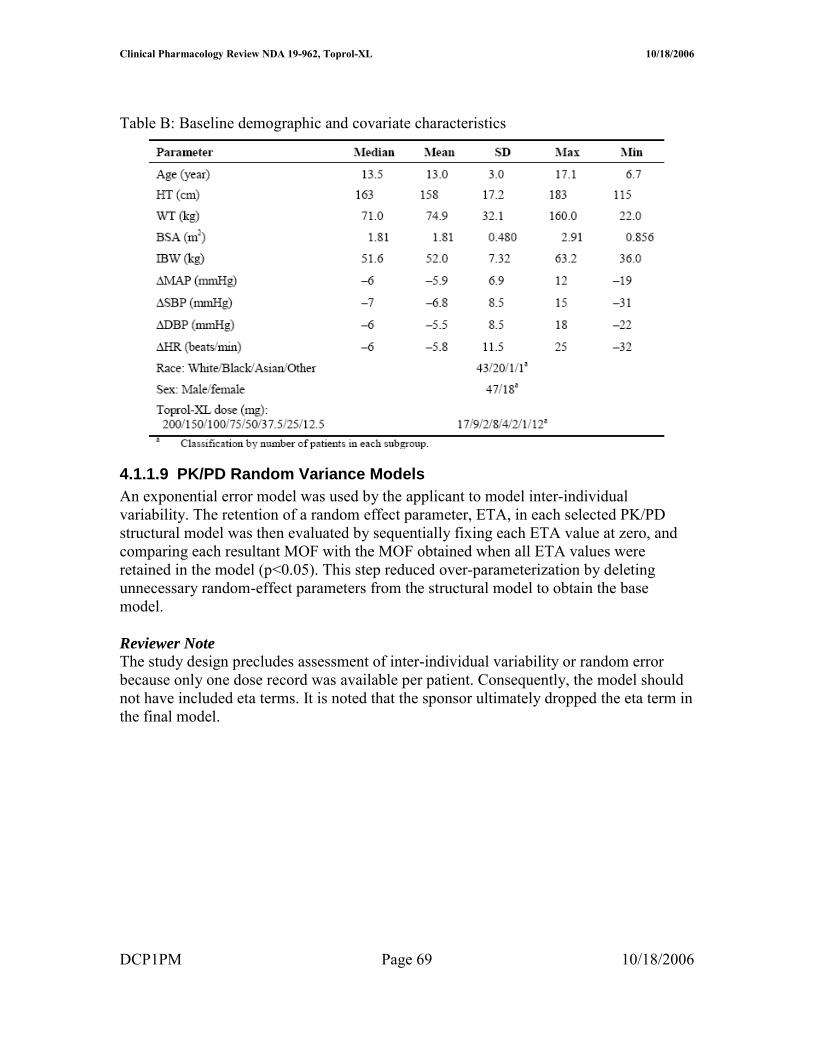
Clinical Pharmacology Review NDA 19-962 Toprol-XL 10182006
PKPD Initial and Final Model Selection A similar approach to that of PK model selection was adopted for PKPD Each of the above-mentioned PKPD models with random effects was identified by curve-fitting the dataset Initial selection of the PKPD structural model was based upon a significant reduction in MOF (plt005) as compared to the baseline model and reasonable PKPD parameter estimates Software
Nonlinear mixed-effect modeling (NONMEM) software (Version V level 11 Globomax Hanover MD) was used in the population PK analysis PK model fitting was accomplished using first-order (FO) approximation methods For PKPD model fitting the first-order conditional estimation (FOCE) with eta-epsilon interaction method in NONMEM was used for all model runs
SAS software (Version VIII Cary NC) was employed to prepare datasets according to the format required by the NONMEM program (Boeckmann et al 1991) Microsoftreg Excel 2000 (Redmond WA) and S-PLUS 2000 (Professional Release 2 MathSoft Inc Cambridge MA) were used to perform exploratory graphical exposure calculation and statistical analyses according to the format required by the NONMEM program (Boeckmann et al 1991) SAS command files logs and listings pertaining to data file conversion and merging were reviewed by an independent analyst Datasets were stored in SAS data frames combined and exported to Excel and then to ASCII files before fitting to the model
Datasets were prepared and pooled in a NONMEM-compliant format using SAS software by the Programming Group Clinical Information Sciences at AstraZeneca Wilmington Delaware SAS command files logs and listings pertaining to file conversion and merging were provided and found to be acceptable The contents of both datasets (toprolkatcsv for PK modeling and cppd2csv for PKPD modeling) were included
DCP1PM Page 71 10182006
Clinical Pharmacology Review NDA 19-962 Toprol-XL 10182006
toprolkatcsv was not provided electronically in a SAS format however this reviewer generated a similar dataset using the applicantrsquos criteria
Reviewer Comment The software and data assembly methods appeared adequate
DCP1PM Page 72 10182006
Clinical Pharmacology Review NDA 19-962 Toprol-XL 10182006
Results and Discussion Design Adequacy
Overall the trial designs appeared adequate to evaluate metoprolol population PK and PKPD in pediatric patients receiving Toprol XL However the design could have been further optimized by increasing the sampling points particularly in the absorption phase Due to the limited number of samples in the absorption phase it was not possible to accurately characterize the absorption model first order vs zero order or mixed first and zero order Additionally collection of mainly trough samples limits the ability to accurately estimate measures such as Cmax that are not directly related to Ctrough particularly if multiple compartments are present Consequently Cmax estimations are unlikely to be accurate Finally most patients provided only one trough sample thus inter-individual variability could not be adequately captured and may have limited the utility of the modeling exercise particularly in PKPD where the random effect could not be accurately characterized Ultimately there was no random variable in the final PKPD model (ie eta was set to zero) Data Integrity
This reviewer checked the data visually by randomly selecting data from patients included in the population modeling and comparing to data in the study report (source data) Overall the data integrity appeared acceptable The applicant observed the following guidelines that appeared acceptable No datum from any study participant with a protocol violation that was thought to materially impact the analysis was included The dataset contained data from only those study participants who could be evaluated ie with all the last dosing datetime blood sampling datetime plasma drug concentrations and demographic covariates
Data that were excluded (n = 62 samples) from the model were as follows One sample from an apparent poor metabolizer Two samples collected gt 96 hours post dose From 307B 10 trough samples lt LOQ From 307A 17 samples lt LOQ Thirty-samples from serial data that were lt LOQ or whole blood samples Model and Model Selection
Base Model
41110 Pharmacokinetic Model description The base PK model was a standard two compartment model that incorporated lag time and flip-flop kinetics The key features of the model were flip-flop was insured by making the value of ke gt ka in the clearance equation Additionally lag time was restricted to a value of 2 hours or less and concentrations were log transformed consequently all concentrations (F) = 0 were given individual predicted concentrations of zero Finally there were two residual error terms one for serial samples and the other for trough samples DCP1PM Page 73 10182006
Clinical Pharmacology Review NDA 19-962 Toprol-XL 10182006
Key equations were as follows
KA = THETA(1)EXP(ETA(1)) V2 = THETA(2)EXP(ETA(2)) CL = (THETA(1)THETA(2)+THETA(3))EXP(ETA(3)) Q = THETA(4)EXP(ETA(4)) V3 = THETA(5)EXP(ETA(5)) ALAG1=THETA(6)EXP(ETA(6))
41111 PK Parameter estimation results Table 1 Summary of PK parameters in the metoprolol population PK base model (per applicant)
41112 Goodness of fit The applicant provided the following goodness-of-fit plots (Figure 1)
Reviewer Note The goodness-of-fit plots were reproduced by this Reviewer (see Appendix) with minor modifications
Figure 1 Goodness of fit plots for Base Model
DCP1PM Page 74 10182006
Clinical Pharmacology Review NDA 19-962 Toprol-XL 10182006
Base PK Model Selection The MOF values of all structural model candidates tested are presented in Table 2 Model selection was based primarily on MOF values the lower MOF the better the model The applicant reports that in general MOF values generated by a conventional absorption model (ie absorption rate is faster than elimination rate) and a flip-flop absorption model (ie absorption rate is slower than elimination rate) were identical
Reviewer Comment The existence of flip-flop kinetics appears plausible based on data provided and general patterns for sustained release formulations Consequently the use of flip-flop kinetics for the bulk of the modeling exercise appears reasonable
General conclusions from the information in Table 2 are First order input is better than zero order input Two compartment model is better than one compartment model Lag time presence is better than lack of lag time Two residual error terms are better than one residual error term It should also be noted that several other models led to unsatisfactory completion of the run and were not considered further
DCP1PM Page 75 10182006
Clinical Pharmacology Review NDA 19-962 Toprol-XL 10182006
Table 2 Comparison of Structural PK Models
Reviewer Comment The selected structural model appears appropriate based on the data
Base Model The deletion of ETA for V2 did not change the MOF value suggesting that ETA for V2 should be deleted to avoid an over-parameterized warning (Table 3) This was consistent with the estimated parameter value of ETA for V2 being 648 x 10ndash9 a very small value Therefore the base model was selected by deleting the ETA for V2 from the structural model
Reviewer Comment on Eta deletion for V2 Deletion of eta for V2 is acceptable based on the empirical data however from a physiological perspective deletion of eta is problematic Generally one anticipates inter-individual differences in volume of distribution In this case it appears that the error associated with V2 may have been randomly shifted to V3 and or Q terms as the three DCP1PM Page 76 10182006
Clinical Pharmacology Review NDA 19-962 Toprol-XL 10182006
terms are interrelated This potential shift in error is supported by the fact that the V2 eta value increases significantly (by several orders of magnitude- 10-5 vs 100) when eta for Q and or V3 is fixed However when Q or V3 are fixed minimization is successful but Q and V3 are not accurately estimated Accounting for the possible error shift is a complex process and goes beyond the scope of this reviewer thus deletion of eta associated with V2 was considered acceptable for the remainder of the modeling evaluation
Table 3 Structural elements tested in the metoprolol population PK structural model (p lt 0005)
Final PK Model
41113 Model description The key feature of the final model is the inclusion of the covariate effects of age on Q and weight on CL in the population PK model
Key Equations CL = (THETA(1)THETA(2)+THETA(3)+EWT)EXP(ETA(2)) Q = THETA(4)EAGEEXP(ETA(3))
Including Covariate Effects As previously described covariate effects were assessed by forward addition and backward deletion Most covariates did not significantly change MOF however BSA significantly affected CL and Age affected Q Consequently these covariates were included in the penultimate final model
DCP1PM Page 77 10182006
Clinical Pharmacology Review NDA 19-962 Toprol-XL 10182006
Reviewer Note BSA is derived form WT and HT covariates implying BSA is highly correlated to these two covariates (Figure 2) weight is the most suitable (practical covariate) as it is readily measured Furthermore weight and BSA produced the same MOF (Table 4) whereas MOF with height was more positive (less significant)
Figure 2 Plot of BSA vs Body Weight
The data in Table 4 support selection of the final model
Table 4 Covariate elements tested in the metoprolol population PK penultimate final model (plt0005)
The applicant acknowledges that mechanism(s) accounting for the impact of age on QF are not clear However since distribution clearance has little effect on metoprolol plasma exposure further investigation is not needed
41114 PK Parameter estimation results As shown in Table 5 PK parameters were estimated fairly precisely by the final model
Table 5 PK Parameter Estimates using Final Model
DCP1PM Page 78 10182006
Clinical Pharmacology Review NDA 19-962 Toprol-XL 10182006
41115 Goodness of fit The goodness-of-fit plots provided by the applicant show good precision Figure 5 Goodness of fit plots for final PK model
DCP1PM Page 79 10182006
Clinical Pharmacology Review NDA 19-962 Toprol-XL 10182006
PK Model Qualification The post hoc Bayesian-estimated AUC (simulated) obtained for the 27 patients with serial plasma samples are plotted against the observed (AUCt) The correlation was high (R2 gt 099) Figure 6 AUClast from observed data versus AUCt from model simulation in the 27 patients providing serial plasma samples
Regression line Y= 4514 + 08976 X R2 = 09957
The graphical validation of the final metoprolol population PK model validation against covariates evaluated is presented in Figure 6
Figure 7 Graphical validation of covariates
DCP1PM Page 80 10182006
Clinical Pharmacology Review NDA 19-962 Toprol-XL 10182006
There was no systematic bias in weighted residuals for any covariates evaluated suggesting that the final model included all appreciable effects of available covariates (Figure)
The effects of weight on metoprolol CLF are illustrated in Figure 8 where Bayesian post hoc estimates of CLF are plotted against weight and overlaid by the model-predicted line Overall the model appeared to fit the data well
Figure 8 Plot of CLF vs Body weight
The effects of AGE on metoprolol QF are illustrated in Figure 9 where Bayesian post hoc estimates of QF are plotted against AGE and overlaid by the model-predicted line Figure 9 Plot of QF vs Age
DCP1PM Page 81 10182006
Clinical Pharmacology Review NDA 19-962 Toprol-XL 10182006
Reviewer Note The applicant indicated that attempts to run the final model using the first-order conditional estimation method resulted in termination errors Therefore the parameter estimates obtained by the FO method were reported as the final parameter estimates
Conclusion Regarding Population PK Modeling Overall the sponsorrsquos population PK modeling is acceptable
PKPD Model and Model Selection
PKPD Base Model PharmacokineticPharmacodynamic Model description The key feature of the model was a lack of random variance term for the slope (since only single data points were available per subject) and inclusion of baseline effect
Key equations were as follows E0 = THETA(1)EXP(ETA(1)) M = THETA(2) Y = E0 + MLOG(AUC) + EPS(1)
The control stream provided in the appendix is that for DBP (provided by sponsor) The control stream for SBP is comparable with appropriate substitution for BP type
It should be noted that only the log-linear and linear PKPD models were considered suitable for AUC and Cmax For this review only AUC estimates were considered reliable as Cmax estimates could not be accurately determined based on the sampling scheme Consequently the remainder of this review focuses on AUC information although Ctrough and Cmax data are displayed for reference
Bayesian estimates from PK modeling are summarized in Table 1
Table 1 Bayesian estimates of metoprolol PK exposure for those patients included in the PKPD analysis (N=65)
DCP1PM Page 82 10182006
Clinical Pharmacology Review NDA 19-962 Toprol-XL 10182006
PKPD Model Selection (initial and final) The log-linear model was adopted as the base model for this PKPD relationship since it improved the MOF significantly (Table 2) The ETA parameter for the slope was pre-eliminated for the purpose of model parsimony The intercept and slope in this log-linear model for AUC(0-24) did not bear ETA parameter therefore no covariates had impact on either parameter in the model
Reviewer Note The intercept should not have borne an eta term because individual subjects provided only one data point Consequently fixing eta to zero or deleting eta in the final model is appropriate No further model development was required after eta was eliminated and the base model was equivalent to the final model
Table 2 Base population PKPD models tested for the change in SBP
41116 PKPD Parameter estimation results The final PKPD parameter estimates are presented in Table 3
Table 3 Summary parameters in the final PKPD model for the change in SBP using trough plasma level Parameter Explanation Estimate SE ()b
DCP1PM Page 83 10182006
Clinical Pharmacology Review NDA 19-962 Toprol-XL 10182006
Model Qualification Based on the relatively low R2 value and as shown in Figure there is a poor correlation between change in SBP and log AUC
Figure 1 Relationship between change in SBP and AUC (line generated from modeling)
Overall goodness-of-fit of the model was considered to be poor probably due to the high variability in the measurements Consequently the precision of the model parameter estimates was not considered to be very reliable These parameters have little clinical usefulness and can be treated only as an indication of trends ie more hemodynamic effects can be potentially achieved when high Toprol-XL doses are given Clinical dose adjustment based on these PKPD parameters is not recommended
Reviewerrsquos Supplemental Analyses A supplemental PKPD analyses was conducted using simple linear regression since the population model did not improve the fit Overall eta made an insignificant contribution to the overall model The results of the analyses were similar to the population analyses A series of regression analyses were conducted and are presented in Table 4
The applicant notes that the preliminary modeling exercise found that there was no difference in the PKPD modeling results using different hemodynamic data formats (ie change in the measurements percent change in the measurements or actual BP measurements) This finding was confirmed by this reviewer (see Table 4)
DCP1PM Page 84 10182006
Clinical Pharmacology Review NDA 19-962 Toprol-XL 10182006
Table 4 Supplemental PKPD Regression Analyses Conducted by Reviewer Model (liner regression) Intercept (I) Slope (m) R2 Probability RSBP = mISBP + I 3957 -035 01626 0009 PSBP = mISBP + I 2524 -023 01252 00038 PSBP = mRSBP + I 0005 074 09891 lt 00001 RSBP = mlogAUC + I 651 -221 0060 00493 RSBP = mDose + I -751 0006 00026 06878 RSBP = mDose^ + I -312 -111 004 02711 RSBP = mlogAUC + nISBP + I 5303 -221 (m)
-035 (n) 02230 0001
RSBPplc = mAUC + I -667 -0003 00458 00871 RSBPplc = mlogAUC + I 461 -2208 00600 00493 RPUL = mlogAUC + I 1868 -405 01102 00069 Symbols in table similar to population PK model without eta term RSBP- change of SBP without placebo correction ISBP- initial (baseline) SBP RPUL- change in HR without placebo correction Dose- in mg where placebo is included as 0 mg PSBP- percentage change of SBP without placebo correction
Conclusion Regarding Population PKPD Modeling Overall the sponsorrsquos population PKPD modeling is acceptable No dose adjustment conclusion can be made from this modeling however an exposure-response relationship was established for AUC and reduction in SBP
Discussion
The significance of the results 1 Provide estimates of PK measures and plasma exposure in pediatric population These data can be compared to adult exposure to determine if exposure differences impact drug effectiveness The main challenge in comparing pediatric data to adult data is different modeling schemes formulations and methods were used in the two populations
2 PKPD findings are not sufficiently precise to provide a dose adjustment algorithm however the PKPD analyses provides rationale for proposed titration as increasing exposure (doses) may improve efficacy (reduction in SBP) Ultimately the risk-benefit analyses overrides PKPD assessment for dose adjustment drug will be titrated thus reliance on PKPD information is not critical The proposed dose 10 mgkg appears suitable based on available information It is unclear from the studies if there should be an initial maximum dose although the sponsor has proposed 50 mg as the maximum initial dose The proposed pediatric starting dose on a mgkg basis is within the range of starting adult doses (25 ndash 100 mg) assuming an adult weighs 70 kg
3 Cumulative information form dose-response study indicates that Toprol XL has effectiveness in children however the most effective dose is unclear Since the drug can be titrated determining the initial optimal dose does not appear critical As proposed by the applicant dosing is started at a ldquolowrdquo dose that can be up-titrated if needed
DCP1PM Page 85 10182006
Clinical Pharmacology Review NDA 19-962 Toprol-XL 10182006
4 The results did not adequately address the potential impact of CYP2D6 metabolic status for pediatric patients taking Toprol XL There were an insufficient number of patients to make this assessment
5 Covariate effects do not appear significant only body weight significantly affects clearance However a worst case scenario can occur with a person that has a low body weight and is a poor metabolizer this will result in very high possibly supra-therapeutic exposure Age does not impact apparent oral clearance so an age-dependent dose adjustment is not needed for children over 6 years old In essence all children over six years old can initiate therapy at 10 mgkg
The validity of the results Overall the results produced by the sponsor appear valid and the sponsor used a sound modeling approach However alternative approaches that could have been adopted may have improved the outcome of the analyses Three of these approaches are presented below 1 Additional PK samples should have been collected during the absorption phase and
throughout the dosing interval to improve the modelrsquos performance Specifically additional samples collected during the absorption phase may have unambiguously identified the actual absorption input function (eg first order zero order mixed first and zero order) First order input was selected for the analyses although the dosage form is reported to exhibit zero order kinetics in adults It is possible that the input rate in children differs from that in adults but unlikely It should be noted that absorption kinetics in children is often erratic due to multiple factors (eg regioshyselective absorption incomplete gastric emptying and inconsistent absorption) so it is unclear if additional samples would have definitively identified the absorption function However additional non-trough samples may have helped in estimating key PK measures such as V and Cmax The final model did not have an eta associated with V which is atypical Collection of additional samples on different visits may have helped estimate potential inter-occasion variability It should be noted that AUC was estimated precisely for subjects providing serial samples but these subjects were not necessarily included in the PKPD analyses Ideally the PKPD modeling should have been conducted primarily in subjects who had accurate PK measures
2 The PKPD design could have been modified to potentially improve the utility of the analyses Specifically there should have been better placebo matching procedures to minimize the potential impact of the placebo effect This matching could have been improved by ensuring all patients on placebo had the same titration schedule and number of tablets It is noted that the model had a poor predictive performance that was mainly attributed to the high degree of variability in the PD measures Potentially other PD markers could have been explored that have less inherent variability One such marker is the degree of beta blockade using exercise heart rate (EHR) reduction this marker has been used extensively for metoprolol in adult subjects However use of EHR in the pediatric setting may be challenging
DCP1PM Page 86 10182006
Clinical Pharmacology Review NDA 19-962 Toprol-XL 10182006
Comments to sponsor
In future pharmacometric studies you should consider the following 1 collect sufficient (multiple) samples from individual subjects to allow assessment
of inter-occasion variability and estimation of inter-individual variability (eta) for all relevant parameters
2 placebo groups should be identically matched across all dose groups (eg same titration schedule and number tablets) to minimize potential bias or differences in the placebo effect
Comments to medical reviewer
1 The sponsor has adequately characterized metoprolol PK in the studied pediatric population The PK characterization could have been further optimized by obtaining additional samples over the entire dosing interval (eg during the absorption phase and elimination phase) on multiple occasions rather than on one occasion primarily at trough
2 A dose-response relationship could not be established using the protocol specified analysis approach The outcome of the dose-response relationship appeared highly dependent on the ldquoplacebo effectrdquo suggesting that the placebo group may not have been appropriate One should consider re-evaluating the dose-response precisely matched placebo groups (eg all placebo patients have identical number of tablets and titration schedule)
3 Based on the PKPD analysis plasma exposure (AUC) explains lt 10 of the response (reduction in systolic blood pressure) thus has limited clinical utility However the PKPD relationship suggests that there is a trend for increased response with increased exposure (dose driven)
4 Overall information from the dose-response study suggests that Toprol- XL is effective in the pediatric population The optimal initial dose 02 10 or 20 mgkg or the maximum safe and effective dose cannot be determined from the information provided It is noted that the 02 mgkg dose is unlikely to be effective as plasma concentrations achieved at this dose are unlikely to be effective (most concentrations lt LOQ and lower than effective adult concentrations) The 10 mgkg (proposed by applicant) appears to be a reasonable initial dose The labeling should reflect the regimens studied
DCP1PM Page 89 10182006
Clinical Pharmacology Review NDA 19-962 Toprol-XL 10182006
Appendix
DCP1PM Page 90 10182006
Clinical Pharmacology Review NDA 19-962 Toprol-XL 10182006
DCP1PM Page 91 10182006
Clinical Pharmacology Review NDA 19-962 Toprol-XL 10182006
DCP1PM Page 92 10182006
Clinical Pharmacology Review NDA 19-962 Toprol-XL 10182006
DCP1PM Page 93 10182006
Clinical Pharmacology Review NDA 19-962 Toprol-XL 10182006
DCP1PM Page 94 10182006
Clinical Pharmacology Review NDA 19-962 Toprol-XL 10182006
DCP1PM Page 95 10182006
Clinical Pharmacology Review NDA 19-962 Toprol-XL 10182006
Table 15 Control streams for final log-linear PKPD model for the change in DBP using metoprolol Cmax as the measure of exposure
Truncated NONMEM reports for base model identification for PKPD relationship in change of SBP (per sponsor)
DCP1PM Page 96 10182006
Clinical Pharmacology Review NDA 19-962 Toprol-XL 10182006
Reported PD information^
^ Under metoprolol regimen CRZ0K is Toprol XL
DCP1PM Page 97 10182006
Clinical Pharmacology Review NDA 19-962 Toprol-XL 10182006
Table Results of randomised double-blind comparative trials evaluating antihypertensive efficacy of metoprolol formulations or other antihypertensives
DCP1PM Page 98 10182006
---------------------------------------------------------------------------------------------------------------------
---------------------------------------------------------------------------------------------------------------------
---------------------
This is a representation of an electronic record that was signed electronically and this page is the manifestation of the electronic signature
s
Robert Kumi 10182006 045635 PM BIOPHARMACEUTICS
Patrick Marroum 10192006 050811 PM BIOPHARMACEUTICS
Clinical Pharmacology Review NDA 19-962 Toprol-XL 10182006
toprolkatcsv was not provided electronically in a SAS format however this reviewer generated a similar dataset using the applicantrsquos criteria
Reviewer Comment The software and data assembly methods appeared adequate
DCP1PM Page 72 10182006
Clinical Pharmacology Review NDA 19-962 Toprol-XL 10182006
Results and Discussion Design Adequacy
Overall the trial designs appeared adequate to evaluate metoprolol population PK and PKPD in pediatric patients receiving Toprol XL However the design could have been further optimized by increasing the sampling points particularly in the absorption phase Due to the limited number of samples in the absorption phase it was not possible to accurately characterize the absorption model first order vs zero order or mixed first and zero order Additionally collection of mainly trough samples limits the ability to accurately estimate measures such as Cmax that are not directly related to Ctrough particularly if multiple compartments are present Consequently Cmax estimations are unlikely to be accurate Finally most patients provided only one trough sample thus inter-individual variability could not be adequately captured and may have limited the utility of the modeling exercise particularly in PKPD where the random effect could not be accurately characterized Ultimately there was no random variable in the final PKPD model (ie eta was set to zero) Data Integrity
This reviewer checked the data visually by randomly selecting data from patients included in the population modeling and comparing to data in the study report (source data) Overall the data integrity appeared acceptable The applicant observed the following guidelines that appeared acceptable No datum from any study participant with a protocol violation that was thought to materially impact the analysis was included The dataset contained data from only those study participants who could be evaluated ie with all the last dosing datetime blood sampling datetime plasma drug concentrations and demographic covariates
Data that were excluded (n = 62 samples) from the model were as follows One sample from an apparent poor metabolizer Two samples collected gt 96 hours post dose From 307B 10 trough samples lt LOQ From 307A 17 samples lt LOQ Thirty-samples from serial data that were lt LOQ or whole blood samples Model and Model Selection
Base Model
41110 Pharmacokinetic Model description The base PK model was a standard two compartment model that incorporated lag time and flip-flop kinetics The key features of the model were flip-flop was insured by making the value of ke gt ka in the clearance equation Additionally lag time was restricted to a value of 2 hours or less and concentrations were log transformed consequently all concentrations (F) = 0 were given individual predicted concentrations of zero Finally there were two residual error terms one for serial samples and the other for trough samples DCP1PM Page 73 10182006
Clinical Pharmacology Review NDA 19-962 Toprol-XL 10182006
Key equations were as follows
KA = THETA(1)EXP(ETA(1)) V2 = THETA(2)EXP(ETA(2)) CL = (THETA(1)THETA(2)+THETA(3))EXP(ETA(3)) Q = THETA(4)EXP(ETA(4)) V3 = THETA(5)EXP(ETA(5)) ALAG1=THETA(6)EXP(ETA(6))
41111 PK Parameter estimation results Table 1 Summary of PK parameters in the metoprolol population PK base model (per applicant)
41112 Goodness of fit The applicant provided the following goodness-of-fit plots (Figure 1)
Reviewer Note The goodness-of-fit plots were reproduced by this Reviewer (see Appendix) with minor modifications
Figure 1 Goodness of fit plots for Base Model
DCP1PM Page 74 10182006
Clinical Pharmacology Review NDA 19-962 Toprol-XL 10182006
Base PK Model Selection The MOF values of all structural model candidates tested are presented in Table 2 Model selection was based primarily on MOF values the lower MOF the better the model The applicant reports that in general MOF values generated by a conventional absorption model (ie absorption rate is faster than elimination rate) and a flip-flop absorption model (ie absorption rate is slower than elimination rate) were identical
Reviewer Comment The existence of flip-flop kinetics appears plausible based on data provided and general patterns for sustained release formulations Consequently the use of flip-flop kinetics for the bulk of the modeling exercise appears reasonable
General conclusions from the information in Table 2 are First order input is better than zero order input Two compartment model is better than one compartment model Lag time presence is better than lack of lag time Two residual error terms are better than one residual error term It should also be noted that several other models led to unsatisfactory completion of the run and were not considered further
DCP1PM Page 75 10182006
Clinical Pharmacology Review NDA 19-962 Toprol-XL 10182006
Table 2 Comparison of Structural PK Models
Reviewer Comment The selected structural model appears appropriate based on the data
Base Model The deletion of ETA for V2 did not change the MOF value suggesting that ETA for V2 should be deleted to avoid an over-parameterized warning (Table 3) This was consistent with the estimated parameter value of ETA for V2 being 648 x 10ndash9 a very small value Therefore the base model was selected by deleting the ETA for V2 from the structural model
Reviewer Comment on Eta deletion for V2 Deletion of eta for V2 is acceptable based on the empirical data however from a physiological perspective deletion of eta is problematic Generally one anticipates inter-individual differences in volume of distribution In this case it appears that the error associated with V2 may have been randomly shifted to V3 and or Q terms as the three DCP1PM Page 76 10182006
Clinical Pharmacology Review NDA 19-962 Toprol-XL 10182006
terms are interrelated This potential shift in error is supported by the fact that the V2 eta value increases significantly (by several orders of magnitude- 10-5 vs 100) when eta for Q and or V3 is fixed However when Q or V3 are fixed minimization is successful but Q and V3 are not accurately estimated Accounting for the possible error shift is a complex process and goes beyond the scope of this reviewer thus deletion of eta associated with V2 was considered acceptable for the remainder of the modeling evaluation
Table 3 Structural elements tested in the metoprolol population PK structural model (p lt 0005)
Final PK Model
41113 Model description The key feature of the final model is the inclusion of the covariate effects of age on Q and weight on CL in the population PK model
Key Equations CL = (THETA(1)THETA(2)+THETA(3)+EWT)EXP(ETA(2)) Q = THETA(4)EAGEEXP(ETA(3))
Including Covariate Effects As previously described covariate effects were assessed by forward addition and backward deletion Most covariates did not significantly change MOF however BSA significantly affected CL and Age affected Q Consequently these covariates were included in the penultimate final model
DCP1PM Page 77 10182006
Clinical Pharmacology Review NDA 19-962 Toprol-XL 10182006
Reviewer Note BSA is derived form WT and HT covariates implying BSA is highly correlated to these two covariates (Figure 2) weight is the most suitable (practical covariate) as it is readily measured Furthermore weight and BSA produced the same MOF (Table 4) whereas MOF with height was more positive (less significant)
Figure 2 Plot of BSA vs Body Weight
The data in Table 4 support selection of the final model
Table 4 Covariate elements tested in the metoprolol population PK penultimate final model (plt0005)
The applicant acknowledges that mechanism(s) accounting for the impact of age on QF are not clear However since distribution clearance has little effect on metoprolol plasma exposure further investigation is not needed
41114 PK Parameter estimation results As shown in Table 5 PK parameters were estimated fairly precisely by the final model
Table 5 PK Parameter Estimates using Final Model
DCP1PM Page 78 10182006
Clinical Pharmacology Review NDA 19-962 Toprol-XL 10182006
41115 Goodness of fit The goodness-of-fit plots provided by the applicant show good precision Figure 5 Goodness of fit plots for final PK model
DCP1PM Page 79 10182006
Clinical Pharmacology Review NDA 19-962 Toprol-XL 10182006
PK Model Qualification The post hoc Bayesian-estimated AUC (simulated) obtained for the 27 patients with serial plasma samples are plotted against the observed (AUCt) The correlation was high (R2 gt 099) Figure 6 AUClast from observed data versus AUCt from model simulation in the 27 patients providing serial plasma samples
Regression line Y= 4514 + 08976 X R2 = 09957
The graphical validation of the final metoprolol population PK model validation against covariates evaluated is presented in Figure 6
Figure 7 Graphical validation of covariates
DCP1PM Page 80 10182006
Clinical Pharmacology Review NDA 19-962 Toprol-XL 10182006
There was no systematic bias in weighted residuals for any covariates evaluated suggesting that the final model included all appreciable effects of available covariates (Figure)
The effects of weight on metoprolol CLF are illustrated in Figure 8 where Bayesian post hoc estimates of CLF are plotted against weight and overlaid by the model-predicted line Overall the model appeared to fit the data well
Figure 8 Plot of CLF vs Body weight
The effects of AGE on metoprolol QF are illustrated in Figure 9 where Bayesian post hoc estimates of QF are plotted against AGE and overlaid by the model-predicted line Figure 9 Plot of QF vs Age
DCP1PM Page 81 10182006
Clinical Pharmacology Review NDA 19-962 Toprol-XL 10182006
Reviewer Note The applicant indicated that attempts to run the final model using the first-order conditional estimation method resulted in termination errors Therefore the parameter estimates obtained by the FO method were reported as the final parameter estimates
Conclusion Regarding Population PK Modeling Overall the sponsorrsquos population PK modeling is acceptable
PKPD Model and Model Selection
PKPD Base Model PharmacokineticPharmacodynamic Model description The key feature of the model was a lack of random variance term for the slope (since only single data points were available per subject) and inclusion of baseline effect
Key equations were as follows E0 = THETA(1)EXP(ETA(1)) M = THETA(2) Y = E0 + MLOG(AUC) + EPS(1)
The control stream provided in the appendix is that for DBP (provided by sponsor) The control stream for SBP is comparable with appropriate substitution for BP type
It should be noted that only the log-linear and linear PKPD models were considered suitable for AUC and Cmax For this review only AUC estimates were considered reliable as Cmax estimates could not be accurately determined based on the sampling scheme Consequently the remainder of this review focuses on AUC information although Ctrough and Cmax data are displayed for reference
Bayesian estimates from PK modeling are summarized in Table 1
Table 1 Bayesian estimates of metoprolol PK exposure for those patients included in the PKPD analysis (N=65)
DCP1PM Page 82 10182006
Clinical Pharmacology Review NDA 19-962 Toprol-XL 10182006
PKPD Model Selection (initial and final) The log-linear model was adopted as the base model for this PKPD relationship since it improved the MOF significantly (Table 2) The ETA parameter for the slope was pre-eliminated for the purpose of model parsimony The intercept and slope in this log-linear model for AUC(0-24) did not bear ETA parameter therefore no covariates had impact on either parameter in the model
Reviewer Note The intercept should not have borne an eta term because individual subjects provided only one data point Consequently fixing eta to zero or deleting eta in the final model is appropriate No further model development was required after eta was eliminated and the base model was equivalent to the final model
Table 2 Base population PKPD models tested for the change in SBP
41116 PKPD Parameter estimation results The final PKPD parameter estimates are presented in Table 3
Table 3 Summary parameters in the final PKPD model for the change in SBP using trough plasma level Parameter Explanation Estimate SE ()b
DCP1PM Page 83 10182006
Clinical Pharmacology Review NDA 19-962 Toprol-XL 10182006
Model Qualification Based on the relatively low R2 value and as shown in Figure there is a poor correlation between change in SBP and log AUC
Figure 1 Relationship between change in SBP and AUC (line generated from modeling)
Overall goodness-of-fit of the model was considered to be poor probably due to the high variability in the measurements Consequently the precision of the model parameter estimates was not considered to be very reliable These parameters have little clinical usefulness and can be treated only as an indication of trends ie more hemodynamic effects can be potentially achieved when high Toprol-XL doses are given Clinical dose adjustment based on these PKPD parameters is not recommended
Reviewerrsquos Supplemental Analyses A supplemental PKPD analyses was conducted using simple linear regression since the population model did not improve the fit Overall eta made an insignificant contribution to the overall model The results of the analyses were similar to the population analyses A series of regression analyses were conducted and are presented in Table 4
The applicant notes that the preliminary modeling exercise found that there was no difference in the PKPD modeling results using different hemodynamic data formats (ie change in the measurements percent change in the measurements or actual BP measurements) This finding was confirmed by this reviewer (see Table 4)
DCP1PM Page 84 10182006
Clinical Pharmacology Review NDA 19-962 Toprol-XL 10182006
Table 4 Supplemental PKPD Regression Analyses Conducted by Reviewer Model (liner regression) Intercept (I) Slope (m) R2 Probability RSBP = mISBP + I 3957 -035 01626 0009 PSBP = mISBP + I 2524 -023 01252 00038 PSBP = mRSBP + I 0005 074 09891 lt 00001 RSBP = mlogAUC + I 651 -221 0060 00493 RSBP = mDose + I -751 0006 00026 06878 RSBP = mDose^ + I -312 -111 004 02711 RSBP = mlogAUC + nISBP + I 5303 -221 (m)
-035 (n) 02230 0001
RSBPplc = mAUC + I -667 -0003 00458 00871 RSBPplc = mlogAUC + I 461 -2208 00600 00493 RPUL = mlogAUC + I 1868 -405 01102 00069 Symbols in table similar to population PK model without eta term RSBP- change of SBP without placebo correction ISBP- initial (baseline) SBP RPUL- change in HR without placebo correction Dose- in mg where placebo is included as 0 mg PSBP- percentage change of SBP without placebo correction
Conclusion Regarding Population PKPD Modeling Overall the sponsorrsquos population PKPD modeling is acceptable No dose adjustment conclusion can be made from this modeling however an exposure-response relationship was established for AUC and reduction in SBP
Discussion
The significance of the results 1 Provide estimates of PK measures and plasma exposure in pediatric population These data can be compared to adult exposure to determine if exposure differences impact drug effectiveness The main challenge in comparing pediatric data to adult data is different modeling schemes formulations and methods were used in the two populations
2 PKPD findings are not sufficiently precise to provide a dose adjustment algorithm however the PKPD analyses provides rationale for proposed titration as increasing exposure (doses) may improve efficacy (reduction in SBP) Ultimately the risk-benefit analyses overrides PKPD assessment for dose adjustment drug will be titrated thus reliance on PKPD information is not critical The proposed dose 10 mgkg appears suitable based on available information It is unclear from the studies if there should be an initial maximum dose although the sponsor has proposed 50 mg as the maximum initial dose The proposed pediatric starting dose on a mgkg basis is within the range of starting adult doses (25 ndash 100 mg) assuming an adult weighs 70 kg
3 Cumulative information form dose-response study indicates that Toprol XL has effectiveness in children however the most effective dose is unclear Since the drug can be titrated determining the initial optimal dose does not appear critical As proposed by the applicant dosing is started at a ldquolowrdquo dose that can be up-titrated if needed
DCP1PM Page 85 10182006
Clinical Pharmacology Review NDA 19-962 Toprol-XL 10182006
4 The results did not adequately address the potential impact of CYP2D6 metabolic status for pediatric patients taking Toprol XL There were an insufficient number of patients to make this assessment
5 Covariate effects do not appear significant only body weight significantly affects clearance However a worst case scenario can occur with a person that has a low body weight and is a poor metabolizer this will result in very high possibly supra-therapeutic exposure Age does not impact apparent oral clearance so an age-dependent dose adjustment is not needed for children over 6 years old In essence all children over six years old can initiate therapy at 10 mgkg
The validity of the results Overall the results produced by the sponsor appear valid and the sponsor used a sound modeling approach However alternative approaches that could have been adopted may have improved the outcome of the analyses Three of these approaches are presented below 1 Additional PK samples should have been collected during the absorption phase and
throughout the dosing interval to improve the modelrsquos performance Specifically additional samples collected during the absorption phase may have unambiguously identified the actual absorption input function (eg first order zero order mixed first and zero order) First order input was selected for the analyses although the dosage form is reported to exhibit zero order kinetics in adults It is possible that the input rate in children differs from that in adults but unlikely It should be noted that absorption kinetics in children is often erratic due to multiple factors (eg regioshyselective absorption incomplete gastric emptying and inconsistent absorption) so it is unclear if additional samples would have definitively identified the absorption function However additional non-trough samples may have helped in estimating key PK measures such as V and Cmax The final model did not have an eta associated with V which is atypical Collection of additional samples on different visits may have helped estimate potential inter-occasion variability It should be noted that AUC was estimated precisely for subjects providing serial samples but these subjects were not necessarily included in the PKPD analyses Ideally the PKPD modeling should have been conducted primarily in subjects who had accurate PK measures
2 The PKPD design could have been modified to potentially improve the utility of the analyses Specifically there should have been better placebo matching procedures to minimize the potential impact of the placebo effect This matching could have been improved by ensuring all patients on placebo had the same titration schedule and number of tablets It is noted that the model had a poor predictive performance that was mainly attributed to the high degree of variability in the PD measures Potentially other PD markers could have been explored that have less inherent variability One such marker is the degree of beta blockade using exercise heart rate (EHR) reduction this marker has been used extensively for metoprolol in adult subjects However use of EHR in the pediatric setting may be challenging
DCP1PM Page 86 10182006
Clinical Pharmacology Review NDA 19-962 Toprol-XL 10182006
Comments to sponsor
In future pharmacometric studies you should consider the following 1 collect sufficient (multiple) samples from individual subjects to allow assessment
of inter-occasion variability and estimation of inter-individual variability (eta) for all relevant parameters
2 placebo groups should be identically matched across all dose groups (eg same titration schedule and number tablets) to minimize potential bias or differences in the placebo effect
Comments to medical reviewer
1 The sponsor has adequately characterized metoprolol PK in the studied pediatric population The PK characterization could have been further optimized by obtaining additional samples over the entire dosing interval (eg during the absorption phase and elimination phase) on multiple occasions rather than on one occasion primarily at trough
2 A dose-response relationship could not be established using the protocol specified analysis approach The outcome of the dose-response relationship appeared highly dependent on the ldquoplacebo effectrdquo suggesting that the placebo group may not have been appropriate One should consider re-evaluating the dose-response precisely matched placebo groups (eg all placebo patients have identical number of tablets and titration schedule)
3 Based on the PKPD analysis plasma exposure (AUC) explains lt 10 of the response (reduction in systolic blood pressure) thus has limited clinical utility However the PKPD relationship suggests that there is a trend for increased response with increased exposure (dose driven)
4 Overall information from the dose-response study suggests that Toprol- XL is effective in the pediatric population The optimal initial dose 02 10 or 20 mgkg or the maximum safe and effective dose cannot be determined from the information provided It is noted that the 02 mgkg dose is unlikely to be effective as plasma concentrations achieved at this dose are unlikely to be effective (most concentrations lt LOQ and lower than effective adult concentrations) The 10 mgkg (proposed by applicant) appears to be a reasonable initial dose The labeling should reflect the regimens studied
DCP1PM Page 89 10182006
Clinical Pharmacology Review NDA 19-962 Toprol-XL 10182006
Appendix
DCP1PM Page 90 10182006
Clinical Pharmacology Review NDA 19-962 Toprol-XL 10182006
DCP1PM Page 91 10182006
Clinical Pharmacology Review NDA 19-962 Toprol-XL 10182006
DCP1PM Page 92 10182006
Clinical Pharmacology Review NDA 19-962 Toprol-XL 10182006
DCP1PM Page 93 10182006
Clinical Pharmacology Review NDA 19-962 Toprol-XL 10182006
DCP1PM Page 94 10182006
Clinical Pharmacology Review NDA 19-962 Toprol-XL 10182006
DCP1PM Page 95 10182006
Clinical Pharmacology Review NDA 19-962 Toprol-XL 10182006
Table 15 Control streams for final log-linear PKPD model for the change in DBP using metoprolol Cmax as the measure of exposure
Truncated NONMEM reports for base model identification for PKPD relationship in change of SBP (per sponsor)
DCP1PM Page 96 10182006
Clinical Pharmacology Review NDA 19-962 Toprol-XL 10182006
Reported PD information^
^ Under metoprolol regimen CRZ0K is Toprol XL
DCP1PM Page 97 10182006
Clinical Pharmacology Review NDA 19-962 Toprol-XL 10182006
Table Results of randomised double-blind comparative trials evaluating antihypertensive efficacy of metoprolol formulations or other antihypertensives
DCP1PM Page 98 10182006
---------------------------------------------------------------------------------------------------------------------
---------------------------------------------------------------------------------------------------------------------
---------------------
This is a representation of an electronic record that was signed electronically and this page is the manifestation of the electronic signature
s
Robert Kumi 10182006 045635 PM BIOPHARMACEUTICS
Patrick Marroum 10192006 050811 PM BIOPHARMACEUTICS

Clinical Pharmacology Review NDA 19-962 Toprol-XL 10182006
Key equations were as follows
KA = THETA(1)EXP(ETA(1)) V2 = THETA(2)EXP(ETA(2)) CL = (THETA(1)THETA(2)+THETA(3))EXP(ETA(3)) Q = THETA(4)EXP(ETA(4)) V3 = THETA(5)EXP(ETA(5)) ALAG1=THETA(6)EXP(ETA(6))
41111 PK Parameter estimation results Table 1 Summary of PK parameters in the metoprolol population PK base model (per applicant)
41112 Goodness of fit The applicant provided the following goodness-of-fit plots (Figure 1)
Reviewer Note The goodness-of-fit plots were reproduced by this Reviewer (see Appendix) with minor modifications
Figure 1 Goodness of fit plots for Base Model
DCP1PM Page 74 10182006
Clinical Pharmacology Review NDA 19-962 Toprol-XL 10182006
Base PK Model Selection The MOF values of all structural model candidates tested are presented in Table 2 Model selection was based primarily on MOF values the lower MOF the better the model The applicant reports that in general MOF values generated by a conventional absorption model (ie absorption rate is faster than elimination rate) and a flip-flop absorption model (ie absorption rate is slower than elimination rate) were identical
Reviewer Comment The existence of flip-flop kinetics appears plausible based on data provided and general patterns for sustained release formulations Consequently the use of flip-flop kinetics for the bulk of the modeling exercise appears reasonable
General conclusions from the information in Table 2 are First order input is better than zero order input Two compartment model is better than one compartment model Lag time presence is better than lack of lag time Two residual error terms are better than one residual error term It should also be noted that several other models led to unsatisfactory completion of the run and were not considered further
DCP1PM Page 75 10182006
Clinical Pharmacology Review NDA 19-962 Toprol-XL 10182006
Table 2 Comparison of Structural PK Models
Reviewer Comment The selected structural model appears appropriate based on the data
Base Model The deletion of ETA for V2 did not change the MOF value suggesting that ETA for V2 should be deleted to avoid an over-parameterized warning (Table 3) This was consistent with the estimated parameter value of ETA for V2 being 648 x 10ndash9 a very small value Therefore the base model was selected by deleting the ETA for V2 from the structural model
Reviewer Comment on Eta deletion for V2 Deletion of eta for V2 is acceptable based on the empirical data however from a physiological perspective deletion of eta is problematic Generally one anticipates inter-individual differences in volume of distribution In this case it appears that the error associated with V2 may have been randomly shifted to V3 and or Q terms as the three DCP1PM Page 76 10182006
Clinical Pharmacology Review NDA 19-962 Toprol-XL 10182006
terms are interrelated This potential shift in error is supported by the fact that the V2 eta value increases significantly (by several orders of magnitude- 10-5 vs 100) when eta for Q and or V3 is fixed However when Q or V3 are fixed minimization is successful but Q and V3 are not accurately estimated Accounting for the possible error shift is a complex process and goes beyond the scope of this reviewer thus deletion of eta associated with V2 was considered acceptable for the remainder of the modeling evaluation
Table 3 Structural elements tested in the metoprolol population PK structural model (p lt 0005)
Final PK Model
41113 Model description The key feature of the final model is the inclusion of the covariate effects of age on Q and weight on CL in the population PK model
Key Equations CL = (THETA(1)THETA(2)+THETA(3)+EWT)EXP(ETA(2)) Q = THETA(4)EAGEEXP(ETA(3))
Including Covariate Effects As previously described covariate effects were assessed by forward addition and backward deletion Most covariates did not significantly change MOF however BSA significantly affected CL and Age affected Q Consequently these covariates were included in the penultimate final model
DCP1PM Page 77 10182006
Clinical Pharmacology Review NDA 19-962 Toprol-XL 10182006
Reviewer Note BSA is derived form WT and HT covariates implying BSA is highly correlated to these two covariates (Figure 2) weight is the most suitable (practical covariate) as it is readily measured Furthermore weight and BSA produced the same MOF (Table 4) whereas MOF with height was more positive (less significant)
Figure 2 Plot of BSA vs Body Weight
The data in Table 4 support selection of the final model
Table 4 Covariate elements tested in the metoprolol population PK penultimate final model (plt0005)
The applicant acknowledges that mechanism(s) accounting for the impact of age on QF are not clear However since distribution clearance has little effect on metoprolol plasma exposure further investigation is not needed
41114 PK Parameter estimation results As shown in Table 5 PK parameters were estimated fairly precisely by the final model
Table 5 PK Parameter Estimates using Final Model
DCP1PM Page 78 10182006
Clinical Pharmacology Review NDA 19-962 Toprol-XL 10182006
41115 Goodness of fit The goodness-of-fit plots provided by the applicant show good precision Figure 5 Goodness of fit plots for final PK model
DCP1PM Page 79 10182006
Clinical Pharmacology Review NDA 19-962 Toprol-XL 10182006
PK Model Qualification The post hoc Bayesian-estimated AUC (simulated) obtained for the 27 patients with serial plasma samples are plotted against the observed (AUCt) The correlation was high (R2 gt 099) Figure 6 AUClast from observed data versus AUCt from model simulation in the 27 patients providing serial plasma samples
Regression line Y= 4514 + 08976 X R2 = 09957
The graphical validation of the final metoprolol population PK model validation against covariates evaluated is presented in Figure 6
Figure 7 Graphical validation of covariates
DCP1PM Page 80 10182006
Clinical Pharmacology Review NDA 19-962 Toprol-XL 10182006
There was no systematic bias in weighted residuals for any covariates evaluated suggesting that the final model included all appreciable effects of available covariates (Figure)
The effects of weight on metoprolol CLF are illustrated in Figure 8 where Bayesian post hoc estimates of CLF are plotted against weight and overlaid by the model-predicted line Overall the model appeared to fit the data well
Figure 8 Plot of CLF vs Body weight
The effects of AGE on metoprolol QF are illustrated in Figure 9 where Bayesian post hoc estimates of QF are plotted against AGE and overlaid by the model-predicted line Figure 9 Plot of QF vs Age
DCP1PM Page 81 10182006
Clinical Pharmacology Review NDA 19-962 Toprol-XL 10182006
Reviewer Note The applicant indicated that attempts to run the final model using the first-order conditional estimation method resulted in termination errors Therefore the parameter estimates obtained by the FO method were reported as the final parameter estimates
Conclusion Regarding Population PK Modeling Overall the sponsorrsquos population PK modeling is acceptable
PKPD Model and Model Selection
PKPD Base Model PharmacokineticPharmacodynamic Model description The key feature of the model was a lack of random variance term for the slope (since only single data points were available per subject) and inclusion of baseline effect
Key equations were as follows E0 = THETA(1)EXP(ETA(1)) M = THETA(2) Y = E0 + MLOG(AUC) + EPS(1)
The control stream provided in the appendix is that for DBP (provided by sponsor) The control stream for SBP is comparable with appropriate substitution for BP type
It should be noted that only the log-linear and linear PKPD models were considered suitable for AUC and Cmax For this review only AUC estimates were considered reliable as Cmax estimates could not be accurately determined based on the sampling scheme Consequently the remainder of this review focuses on AUC information although Ctrough and Cmax data are displayed for reference
Bayesian estimates from PK modeling are summarized in Table 1
Table 1 Bayesian estimates of metoprolol PK exposure for those patients included in the PKPD analysis (N=65)
DCP1PM Page 82 10182006
Clinical Pharmacology Review NDA 19-962 Toprol-XL 10182006
PKPD Model Selection (initial and final) The log-linear model was adopted as the base model for this PKPD relationship since it improved the MOF significantly (Table 2) The ETA parameter for the slope was pre-eliminated for the purpose of model parsimony The intercept and slope in this log-linear model for AUC(0-24) did not bear ETA parameter therefore no covariates had impact on either parameter in the model
Reviewer Note The intercept should not have borne an eta term because individual subjects provided only one data point Consequently fixing eta to zero or deleting eta in the final model is appropriate No further model development was required after eta was eliminated and the base model was equivalent to the final model
Table 2 Base population PKPD models tested for the change in SBP
41116 PKPD Parameter estimation results The final PKPD parameter estimates are presented in Table 3
Table 3 Summary parameters in the final PKPD model for the change in SBP using trough plasma level Parameter Explanation Estimate SE ()b
DCP1PM Page 83 10182006
Clinical Pharmacology Review NDA 19-962 Toprol-XL 10182006
Model Qualification Based on the relatively low R2 value and as shown in Figure there is a poor correlation between change in SBP and log AUC
Figure 1 Relationship between change in SBP and AUC (line generated from modeling)
Overall goodness-of-fit of the model was considered to be poor probably due to the high variability in the measurements Consequently the precision of the model parameter estimates was not considered to be very reliable These parameters have little clinical usefulness and can be treated only as an indication of trends ie more hemodynamic effects can be potentially achieved when high Toprol-XL doses are given Clinical dose adjustment based on these PKPD parameters is not recommended
Reviewerrsquos Supplemental Analyses A supplemental PKPD analyses was conducted using simple linear regression since the population model did not improve the fit Overall eta made an insignificant contribution to the overall model The results of the analyses were similar to the population analyses A series of regression analyses were conducted and are presented in Table 4
The applicant notes that the preliminary modeling exercise found that there was no difference in the PKPD modeling results using different hemodynamic data formats (ie change in the measurements percent change in the measurements or actual BP measurements) This finding was confirmed by this reviewer (see Table 4)
DCP1PM Page 84 10182006
Clinical Pharmacology Review NDA 19-962 Toprol-XL 10182006
Table 4 Supplemental PKPD Regression Analyses Conducted by Reviewer Model (liner regression) Intercept (I) Slope (m) R2 Probability RSBP = mISBP + I 3957 -035 01626 0009 PSBP = mISBP + I 2524 -023 01252 00038 PSBP = mRSBP + I 0005 074 09891 lt 00001 RSBP = mlogAUC + I 651 -221 0060 00493 RSBP = mDose + I -751 0006 00026 06878 RSBP = mDose^ + I -312 -111 004 02711 RSBP = mlogAUC + nISBP + I 5303 -221 (m)
-035 (n) 02230 0001
RSBPplc = mAUC + I -667 -0003 00458 00871 RSBPplc = mlogAUC + I 461 -2208 00600 00493 RPUL = mlogAUC + I 1868 -405 01102 00069 Symbols in table similar to population PK model without eta term RSBP- change of SBP without placebo correction ISBP- initial (baseline) SBP RPUL- change in HR without placebo correction Dose- in mg where placebo is included as 0 mg PSBP- percentage change of SBP without placebo correction
Conclusion Regarding Population PKPD Modeling Overall the sponsorrsquos population PKPD modeling is acceptable No dose adjustment conclusion can be made from this modeling however an exposure-response relationship was established for AUC and reduction in SBP
Discussion
The significance of the results 1 Provide estimates of PK measures and plasma exposure in pediatric population These data can be compared to adult exposure to determine if exposure differences impact drug effectiveness The main challenge in comparing pediatric data to adult data is different modeling schemes formulations and methods were used in the two populations
2 PKPD findings are not sufficiently precise to provide a dose adjustment algorithm however the PKPD analyses provides rationale for proposed titration as increasing exposure (doses) may improve efficacy (reduction in SBP) Ultimately the risk-benefit analyses overrides PKPD assessment for dose adjustment drug will be titrated thus reliance on PKPD information is not critical The proposed dose 10 mgkg appears suitable based on available information It is unclear from the studies if there should be an initial maximum dose although the sponsor has proposed 50 mg as the maximum initial dose The proposed pediatric starting dose on a mgkg basis is within the range of starting adult doses (25 ndash 100 mg) assuming an adult weighs 70 kg
3 Cumulative information form dose-response study indicates that Toprol XL has effectiveness in children however the most effective dose is unclear Since the drug can be titrated determining the initial optimal dose does not appear critical As proposed by the applicant dosing is started at a ldquolowrdquo dose that can be up-titrated if needed
DCP1PM Page 85 10182006
Clinical Pharmacology Review NDA 19-962 Toprol-XL 10182006
4 The results did not adequately address the potential impact of CYP2D6 metabolic status for pediatric patients taking Toprol XL There were an insufficient number of patients to make this assessment
5 Covariate effects do not appear significant only body weight significantly affects clearance However a worst case scenario can occur with a person that has a low body weight and is a poor metabolizer this will result in very high possibly supra-therapeutic exposure Age does not impact apparent oral clearance so an age-dependent dose adjustment is not needed for children over 6 years old In essence all children over six years old can initiate therapy at 10 mgkg
The validity of the results Overall the results produced by the sponsor appear valid and the sponsor used a sound modeling approach However alternative approaches that could have been adopted may have improved the outcome of the analyses Three of these approaches are presented below 1 Additional PK samples should have been collected during the absorption phase and
throughout the dosing interval to improve the modelrsquos performance Specifically additional samples collected during the absorption phase may have unambiguously identified the actual absorption input function (eg first order zero order mixed first and zero order) First order input was selected for the analyses although the dosage form is reported to exhibit zero order kinetics in adults It is possible that the input rate in children differs from that in adults but unlikely It should be noted that absorption kinetics in children is often erratic due to multiple factors (eg regioshyselective absorption incomplete gastric emptying and inconsistent absorption) so it is unclear if additional samples would have definitively identified the absorption function However additional non-trough samples may have helped in estimating key PK measures such as V and Cmax The final model did not have an eta associated with V which is atypical Collection of additional samples on different visits may have helped estimate potential inter-occasion variability It should be noted that AUC was estimated precisely for subjects providing serial samples but these subjects were not necessarily included in the PKPD analyses Ideally the PKPD modeling should have been conducted primarily in subjects who had accurate PK measures
2 The PKPD design could have been modified to potentially improve the utility of the analyses Specifically there should have been better placebo matching procedures to minimize the potential impact of the placebo effect This matching could have been improved by ensuring all patients on placebo had the same titration schedule and number of tablets It is noted that the model had a poor predictive performance that was mainly attributed to the high degree of variability in the PD measures Potentially other PD markers could have been explored that have less inherent variability One such marker is the degree of beta blockade using exercise heart rate (EHR) reduction this marker has been used extensively for metoprolol in adult subjects However use of EHR in the pediatric setting may be challenging
DCP1PM Page 86 10182006
Clinical Pharmacology Review NDA 19-962 Toprol-XL 10182006
Comments to sponsor
In future pharmacometric studies you should consider the following 1 collect sufficient (multiple) samples from individual subjects to allow assessment
of inter-occasion variability and estimation of inter-individual variability (eta) for all relevant parameters
2 placebo groups should be identically matched across all dose groups (eg same titration schedule and number tablets) to minimize potential bias or differences in the placebo effect
Comments to medical reviewer
1 The sponsor has adequately characterized metoprolol PK in the studied pediatric population The PK characterization could have been further optimized by obtaining additional samples over the entire dosing interval (eg during the absorption phase and elimination phase) on multiple occasions rather than on one occasion primarily at trough
2 A dose-response relationship could not be established using the protocol specified analysis approach The outcome of the dose-response relationship appeared highly dependent on the ldquoplacebo effectrdquo suggesting that the placebo group may not have been appropriate One should consider re-evaluating the dose-response precisely matched placebo groups (eg all placebo patients have identical number of tablets and titration schedule)
3 Based on the PKPD analysis plasma exposure (AUC) explains lt 10 of the response (reduction in systolic blood pressure) thus has limited clinical utility However the PKPD relationship suggests that there is a trend for increased response with increased exposure (dose driven)
4 Overall information from the dose-response study suggests that Toprol- XL is effective in the pediatric population The optimal initial dose 02 10 or 20 mgkg or the maximum safe and effective dose cannot be determined from the information provided It is noted that the 02 mgkg dose is unlikely to be effective as plasma concentrations achieved at this dose are unlikely to be effective (most concentrations lt LOQ and lower than effective adult concentrations) The 10 mgkg (proposed by applicant) appears to be a reasonable initial dose The labeling should reflect the regimens studied
DCP1PM Page 89 10182006
Clinical Pharmacology Review NDA 19-962 Toprol-XL 10182006
Appendix
DCP1PM Page 90 10182006
Clinical Pharmacology Review NDA 19-962 Toprol-XL 10182006
DCP1PM Page 91 10182006
Clinical Pharmacology Review NDA 19-962 Toprol-XL 10182006
DCP1PM Page 92 10182006
Clinical Pharmacology Review NDA 19-962 Toprol-XL 10182006
DCP1PM Page 93 10182006
Clinical Pharmacology Review NDA 19-962 Toprol-XL 10182006
DCP1PM Page 94 10182006
Clinical Pharmacology Review NDA 19-962 Toprol-XL 10182006
DCP1PM Page 95 10182006
Clinical Pharmacology Review NDA 19-962 Toprol-XL 10182006
Table 15 Control streams for final log-linear PKPD model for the change in DBP using metoprolol Cmax as the measure of exposure
Truncated NONMEM reports for base model identification for PKPD relationship in change of SBP (per sponsor)
DCP1PM Page 96 10182006
Clinical Pharmacology Review NDA 19-962 Toprol-XL 10182006
Reported PD information^
^ Under metoprolol regimen CRZ0K is Toprol XL
DCP1PM Page 97 10182006
Clinical Pharmacology Review NDA 19-962 Toprol-XL 10182006
Table Results of randomised double-blind comparative trials evaluating antihypertensive efficacy of metoprolol formulations or other antihypertensives
DCP1PM Page 98 10182006
---------------------------------------------------------------------------------------------------------------------
---------------------------------------------------------------------------------------------------------------------
---------------------
This is a representation of an electronic record that was signed electronically and this page is the manifestation of the electronic signature
s
Robert Kumi 10182006 045635 PM BIOPHARMACEUTICS
Patrick Marroum 10192006 050811 PM BIOPHARMACEUTICS
Clinical Pharmacology Review NDA 19-962 Toprol-XL 10182006
Base PK Model Selection The MOF values of all structural model candidates tested are presented in Table 2 Model selection was based primarily on MOF values the lower MOF the better the model The applicant reports that in general MOF values generated by a conventional absorption model (ie absorption rate is faster than elimination rate) and a flip-flop absorption model (ie absorption rate is slower than elimination rate) were identical
Reviewer Comment The existence of flip-flop kinetics appears plausible based on data provided and general patterns for sustained release formulations Consequently the use of flip-flop kinetics for the bulk of the modeling exercise appears reasonable
General conclusions from the information in Table 2 are First order input is better than zero order input Two compartment model is better than one compartment model Lag time presence is better than lack of lag time Two residual error terms are better than one residual error term It should also be noted that several other models led to unsatisfactory completion of the run and were not considered further
DCP1PM Page 75 10182006
Clinical Pharmacology Review NDA 19-962 Toprol-XL 10182006
Table 2 Comparison of Structural PK Models
Reviewer Comment The selected structural model appears appropriate based on the data
Base Model The deletion of ETA for V2 did not change the MOF value suggesting that ETA for V2 should be deleted to avoid an over-parameterized warning (Table 3) This was consistent with the estimated parameter value of ETA for V2 being 648 x 10ndash9 a very small value Therefore the base model was selected by deleting the ETA for V2 from the structural model
Reviewer Comment on Eta deletion for V2 Deletion of eta for V2 is acceptable based on the empirical data however from a physiological perspective deletion of eta is problematic Generally one anticipates inter-individual differences in volume of distribution In this case it appears that the error associated with V2 may have been randomly shifted to V3 and or Q terms as the three DCP1PM Page 76 10182006
Clinical Pharmacology Review NDA 19-962 Toprol-XL 10182006
terms are interrelated This potential shift in error is supported by the fact that the V2 eta value increases significantly (by several orders of magnitude- 10-5 vs 100) when eta for Q and or V3 is fixed However when Q or V3 are fixed minimization is successful but Q and V3 are not accurately estimated Accounting for the possible error shift is a complex process and goes beyond the scope of this reviewer thus deletion of eta associated with V2 was considered acceptable for the remainder of the modeling evaluation
Table 3 Structural elements tested in the metoprolol population PK structural model (p lt 0005)
Final PK Model
41113 Model description The key feature of the final model is the inclusion of the covariate effects of age on Q and weight on CL in the population PK model
Key Equations CL = (THETA(1)THETA(2)+THETA(3)+EWT)EXP(ETA(2)) Q = THETA(4)EAGEEXP(ETA(3))
Including Covariate Effects As previously described covariate effects were assessed by forward addition and backward deletion Most covariates did not significantly change MOF however BSA significantly affected CL and Age affected Q Consequently these covariates were included in the penultimate final model
DCP1PM Page 77 10182006
Clinical Pharmacology Review NDA 19-962 Toprol-XL 10182006
Reviewer Note BSA is derived form WT and HT covariates implying BSA is highly correlated to these two covariates (Figure 2) weight is the most suitable (practical covariate) as it is readily measured Furthermore weight and BSA produced the same MOF (Table 4) whereas MOF with height was more positive (less significant)
Figure 2 Plot of BSA vs Body Weight
The data in Table 4 support selection of the final model
Table 4 Covariate elements tested in the metoprolol population PK penultimate final model (plt0005)
The applicant acknowledges that mechanism(s) accounting for the impact of age on QF are not clear However since distribution clearance has little effect on metoprolol plasma exposure further investigation is not needed
41114 PK Parameter estimation results As shown in Table 5 PK parameters were estimated fairly precisely by the final model
Table 5 PK Parameter Estimates using Final Model
DCP1PM Page 78 10182006
Clinical Pharmacology Review NDA 19-962 Toprol-XL 10182006
41115 Goodness of fit The goodness-of-fit plots provided by the applicant show good precision Figure 5 Goodness of fit plots for final PK model
DCP1PM Page 79 10182006
Clinical Pharmacology Review NDA 19-962 Toprol-XL 10182006
PK Model Qualification The post hoc Bayesian-estimated AUC (simulated) obtained for the 27 patients with serial plasma samples are plotted against the observed (AUCt) The correlation was high (R2 gt 099) Figure 6 AUClast from observed data versus AUCt from model simulation in the 27 patients providing serial plasma samples
Regression line Y= 4514 + 08976 X R2 = 09957
The graphical validation of the final metoprolol population PK model validation against covariates evaluated is presented in Figure 6
Figure 7 Graphical validation of covariates
DCP1PM Page 80 10182006
Clinical Pharmacology Review NDA 19-962 Toprol-XL 10182006
There was no systematic bias in weighted residuals for any covariates evaluated suggesting that the final model included all appreciable effects of available covariates (Figure)
The effects of weight on metoprolol CLF are illustrated in Figure 8 where Bayesian post hoc estimates of CLF are plotted against weight and overlaid by the model-predicted line Overall the model appeared to fit the data well
Figure 8 Plot of CLF vs Body weight
The effects of AGE on metoprolol QF are illustrated in Figure 9 where Bayesian post hoc estimates of QF are plotted against AGE and overlaid by the model-predicted line Figure 9 Plot of QF vs Age
DCP1PM Page 81 10182006
Clinical Pharmacology Review NDA 19-962 Toprol-XL 10182006
Reviewer Note The applicant indicated that attempts to run the final model using the first-order conditional estimation method resulted in termination errors Therefore the parameter estimates obtained by the FO method were reported as the final parameter estimates
Conclusion Regarding Population PK Modeling Overall the sponsorrsquos population PK modeling is acceptable
PKPD Model and Model Selection
PKPD Base Model PharmacokineticPharmacodynamic Model description The key feature of the model was a lack of random variance term for the slope (since only single data points were available per subject) and inclusion of baseline effect
Key equations were as follows E0 = THETA(1)EXP(ETA(1)) M = THETA(2) Y = E0 + MLOG(AUC) + EPS(1)
The control stream provided in the appendix is that for DBP (provided by sponsor) The control stream for SBP is comparable with appropriate substitution for BP type
It should be noted that only the log-linear and linear PKPD models were considered suitable for AUC and Cmax For this review only AUC estimates were considered reliable as Cmax estimates could not be accurately determined based on the sampling scheme Consequently the remainder of this review focuses on AUC information although Ctrough and Cmax data are displayed for reference
Bayesian estimates from PK modeling are summarized in Table 1
Table 1 Bayesian estimates of metoprolol PK exposure for those patients included in the PKPD analysis (N=65)
DCP1PM Page 82 10182006
Clinical Pharmacology Review NDA 19-962 Toprol-XL 10182006
PKPD Model Selection (initial and final) The log-linear model was adopted as the base model for this PKPD relationship since it improved the MOF significantly (Table 2) The ETA parameter for the slope was pre-eliminated for the purpose of model parsimony The intercept and slope in this log-linear model for AUC(0-24) did not bear ETA parameter therefore no covariates had impact on either parameter in the model
Reviewer Note The intercept should not have borne an eta term because individual subjects provided only one data point Consequently fixing eta to zero or deleting eta in the final model is appropriate No further model development was required after eta was eliminated and the base model was equivalent to the final model
Table 2 Base population PKPD models tested for the change in SBP
41116 PKPD Parameter estimation results The final PKPD parameter estimates are presented in Table 3
Table 3 Summary parameters in the final PKPD model for the change in SBP using trough plasma level Parameter Explanation Estimate SE ()b
DCP1PM Page 83 10182006
Clinical Pharmacology Review NDA 19-962 Toprol-XL 10182006
Model Qualification Based on the relatively low R2 value and as shown in Figure there is a poor correlation between change in SBP and log AUC
Figure 1 Relationship between change in SBP and AUC (line generated from modeling)
Overall goodness-of-fit of the model was considered to be poor probably due to the high variability in the measurements Consequently the precision of the model parameter estimates was not considered to be very reliable These parameters have little clinical usefulness and can be treated only as an indication of trends ie more hemodynamic effects can be potentially achieved when high Toprol-XL doses are given Clinical dose adjustment based on these PKPD parameters is not recommended
Reviewerrsquos Supplemental Analyses A supplemental PKPD analyses was conducted using simple linear regression since the population model did not improve the fit Overall eta made an insignificant contribution to the overall model The results of the analyses were similar to the population analyses A series of regression analyses were conducted and are presented in Table 4
The applicant notes that the preliminary modeling exercise found that there was no difference in the PKPD modeling results using different hemodynamic data formats (ie change in the measurements percent change in the measurements or actual BP measurements) This finding was confirmed by this reviewer (see Table 4)
DCP1PM Page 84 10182006
Clinical Pharmacology Review NDA 19-962 Toprol-XL 10182006
Table 4 Supplemental PKPD Regression Analyses Conducted by Reviewer Model (liner regression) Intercept (I) Slope (m) R2 Probability RSBP = mISBP + I 3957 -035 01626 0009 PSBP = mISBP + I 2524 -023 01252 00038 PSBP = mRSBP + I 0005 074 09891 lt 00001 RSBP = mlogAUC + I 651 -221 0060 00493 RSBP = mDose + I -751 0006 00026 06878 RSBP = mDose^ + I -312 -111 004 02711 RSBP = mlogAUC + nISBP + I 5303 -221 (m)
-035 (n) 02230 0001
RSBPplc = mAUC + I -667 -0003 00458 00871 RSBPplc = mlogAUC + I 461 -2208 00600 00493 RPUL = mlogAUC + I 1868 -405 01102 00069 Symbols in table similar to population PK model without eta term RSBP- change of SBP without placebo correction ISBP- initial (baseline) SBP RPUL- change in HR without placebo correction Dose- in mg where placebo is included as 0 mg PSBP- percentage change of SBP without placebo correction
Conclusion Regarding Population PKPD Modeling Overall the sponsorrsquos population PKPD modeling is acceptable No dose adjustment conclusion can be made from this modeling however an exposure-response relationship was established for AUC and reduction in SBP
Discussion
The significance of the results 1 Provide estimates of PK measures and plasma exposure in pediatric population These data can be compared to adult exposure to determine if exposure differences impact drug effectiveness The main challenge in comparing pediatric data to adult data is different modeling schemes formulations and methods were used in the two populations
2 PKPD findings are not sufficiently precise to provide a dose adjustment algorithm however the PKPD analyses provides rationale for proposed titration as increasing exposure (doses) may improve efficacy (reduction in SBP) Ultimately the risk-benefit analyses overrides PKPD assessment for dose adjustment drug will be titrated thus reliance on PKPD information is not critical The proposed dose 10 mgkg appears suitable based on available information It is unclear from the studies if there should be an initial maximum dose although the sponsor has proposed 50 mg as the maximum initial dose The proposed pediatric starting dose on a mgkg basis is within the range of starting adult doses (25 ndash 100 mg) assuming an adult weighs 70 kg
3 Cumulative information form dose-response study indicates that Toprol XL has effectiveness in children however the most effective dose is unclear Since the drug can be titrated determining the initial optimal dose does not appear critical As proposed by the applicant dosing is started at a ldquolowrdquo dose that can be up-titrated if needed
DCP1PM Page 85 10182006
Clinical Pharmacology Review NDA 19-962 Toprol-XL 10182006
4 The results did not adequately address the potential impact of CYP2D6 metabolic status for pediatric patients taking Toprol XL There were an insufficient number of patients to make this assessment
5 Covariate effects do not appear significant only body weight significantly affects clearance However a worst case scenario can occur with a person that has a low body weight and is a poor metabolizer this will result in very high possibly supra-therapeutic exposure Age does not impact apparent oral clearance so an age-dependent dose adjustment is not needed for children over 6 years old In essence all children over six years old can initiate therapy at 10 mgkg
The validity of the results Overall the results produced by the sponsor appear valid and the sponsor used a sound modeling approach However alternative approaches that could have been adopted may have improved the outcome of the analyses Three of these approaches are presented below 1 Additional PK samples should have been collected during the absorption phase and
throughout the dosing interval to improve the modelrsquos performance Specifically additional samples collected during the absorption phase may have unambiguously identified the actual absorption input function (eg first order zero order mixed first and zero order) First order input was selected for the analyses although the dosage form is reported to exhibit zero order kinetics in adults It is possible that the input rate in children differs from that in adults but unlikely It should be noted that absorption kinetics in children is often erratic due to multiple factors (eg regioshyselective absorption incomplete gastric emptying and inconsistent absorption) so it is unclear if additional samples would have definitively identified the absorption function However additional non-trough samples may have helped in estimating key PK measures such as V and Cmax The final model did not have an eta associated with V which is atypical Collection of additional samples on different visits may have helped estimate potential inter-occasion variability It should be noted that AUC was estimated precisely for subjects providing serial samples but these subjects were not necessarily included in the PKPD analyses Ideally the PKPD modeling should have been conducted primarily in subjects who had accurate PK measures
2 The PKPD design could have been modified to potentially improve the utility of the analyses Specifically there should have been better placebo matching procedures to minimize the potential impact of the placebo effect This matching could have been improved by ensuring all patients on placebo had the same titration schedule and number of tablets It is noted that the model had a poor predictive performance that was mainly attributed to the high degree of variability in the PD measures Potentially other PD markers could have been explored that have less inherent variability One such marker is the degree of beta blockade using exercise heart rate (EHR) reduction this marker has been used extensively for metoprolol in adult subjects However use of EHR in the pediatric setting may be challenging
DCP1PM Page 86 10182006
Clinical Pharmacology Review NDA 19-962 Toprol-XL 10182006
Comments to sponsor
In future pharmacometric studies you should consider the following 1 collect sufficient (multiple) samples from individual subjects to allow assessment
of inter-occasion variability and estimation of inter-individual variability (eta) for all relevant parameters
2 placebo groups should be identically matched across all dose groups (eg same titration schedule and number tablets) to minimize potential bias or differences in the placebo effect
Comments to medical reviewer
1 The sponsor has adequately characterized metoprolol PK in the studied pediatric population The PK characterization could have been further optimized by obtaining additional samples over the entire dosing interval (eg during the absorption phase and elimination phase) on multiple occasions rather than on one occasion primarily at trough
2 A dose-response relationship could not be established using the protocol specified analysis approach The outcome of the dose-response relationship appeared highly dependent on the ldquoplacebo effectrdquo suggesting that the placebo group may not have been appropriate One should consider re-evaluating the dose-response precisely matched placebo groups (eg all placebo patients have identical number of tablets and titration schedule)
3 Based on the PKPD analysis plasma exposure (AUC) explains lt 10 of the response (reduction in systolic blood pressure) thus has limited clinical utility However the PKPD relationship suggests that there is a trend for increased response with increased exposure (dose driven)
4 Overall information from the dose-response study suggests that Toprol- XL is effective in the pediatric population The optimal initial dose 02 10 or 20 mgkg or the maximum safe and effective dose cannot be determined from the information provided It is noted that the 02 mgkg dose is unlikely to be effective as plasma concentrations achieved at this dose are unlikely to be effective (most concentrations lt LOQ and lower than effective adult concentrations) The 10 mgkg (proposed by applicant) appears to be a reasonable initial dose The labeling should reflect the regimens studied
DCP1PM Page 89 10182006
Clinical Pharmacology Review NDA 19-962 Toprol-XL 10182006
Appendix
DCP1PM Page 90 10182006
Clinical Pharmacology Review NDA 19-962 Toprol-XL 10182006
DCP1PM Page 91 10182006
Clinical Pharmacology Review NDA 19-962 Toprol-XL 10182006
DCP1PM Page 92 10182006
Clinical Pharmacology Review NDA 19-962 Toprol-XL 10182006
DCP1PM Page 93 10182006
Clinical Pharmacology Review NDA 19-962 Toprol-XL 10182006
DCP1PM Page 94 10182006
Clinical Pharmacology Review NDA 19-962 Toprol-XL 10182006
DCP1PM Page 95 10182006
Clinical Pharmacology Review NDA 19-962 Toprol-XL 10182006
Table 15 Control streams for final log-linear PKPD model for the change in DBP using metoprolol Cmax as the measure of exposure
Truncated NONMEM reports for base model identification for PKPD relationship in change of SBP (per sponsor)
DCP1PM Page 96 10182006
Clinical Pharmacology Review NDA 19-962 Toprol-XL 10182006
Reported PD information^
^ Under metoprolol regimen CRZ0K is Toprol XL
DCP1PM Page 97 10182006
Clinical Pharmacology Review NDA 19-962 Toprol-XL 10182006
Table Results of randomised double-blind comparative trials evaluating antihypertensive efficacy of metoprolol formulations or other antihypertensives
DCP1PM Page 98 10182006
---------------------------------------------------------------------------------------------------------------------
---------------------------------------------------------------------------------------------------------------------
---------------------
This is a representation of an electronic record that was signed electronically and this page is the manifestation of the electronic signature
s
Robert Kumi 10182006 045635 PM BIOPHARMACEUTICS
Patrick Marroum 10192006 050811 PM BIOPHARMACEUTICS
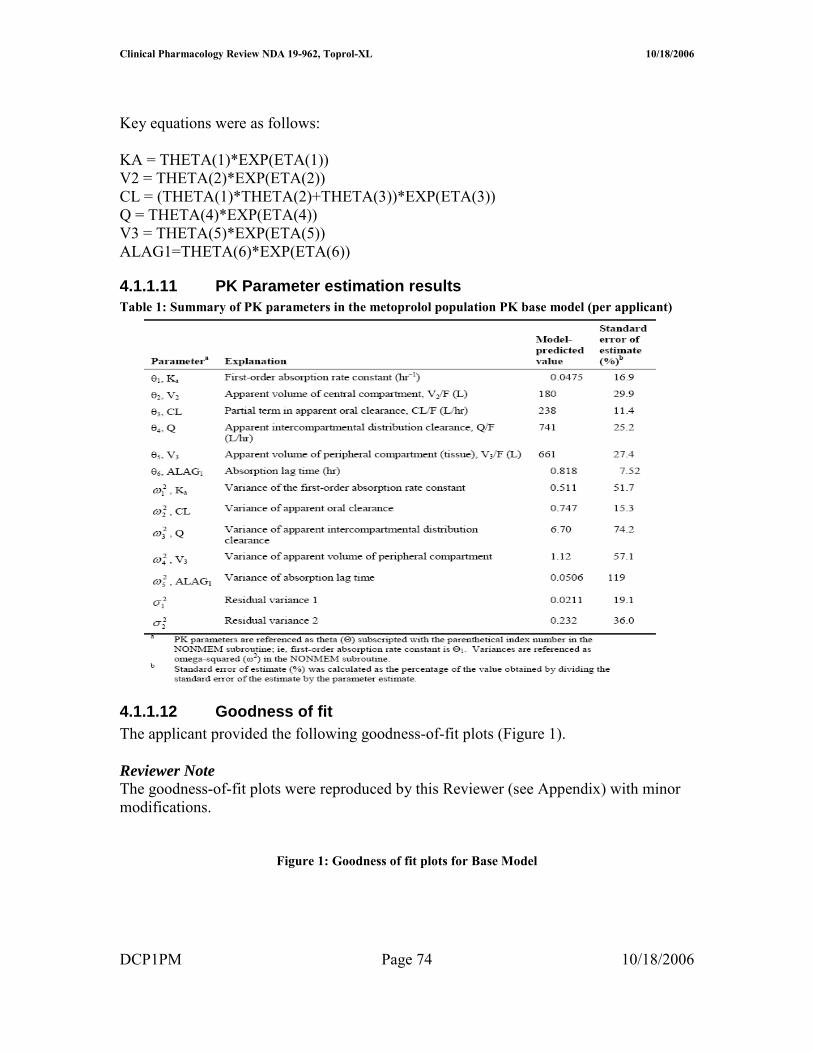
Clinical Pharmacology Review NDA 19-962 Toprol-XL 10182006
41115 Goodness of fit The goodness-of-fit plots provided by the applicant show good precision Figure 5 Goodness of fit plots for final PK model
DCP1PM Page 79 10182006
Clinical Pharmacology Review NDA 19-962 Toprol-XL 10182006
PK Model Qualification The post hoc Bayesian-estimated AUC (simulated) obtained for the 27 patients with serial plasma samples are plotted against the observed (AUCt) The correlation was high (R2 gt 099) Figure 6 AUClast from observed data versus AUCt from model simulation in the 27 patients providing serial plasma samples
Regression line Y= 4514 + 08976 X R2 = 09957
The graphical validation of the final metoprolol population PK model validation against covariates evaluated is presented in Figure 6
Figure 7 Graphical validation of covariates
DCP1PM Page 80 10182006
Clinical Pharmacology Review NDA 19-962 Toprol-XL 10182006
There was no systematic bias in weighted residuals for any covariates evaluated suggesting that the final model included all appreciable effects of available covariates (Figure)
The effects of weight on metoprolol CLF are illustrated in Figure 8 where Bayesian post hoc estimates of CLF are plotted against weight and overlaid by the model-predicted line Overall the model appeared to fit the data well
Figure 8 Plot of CLF vs Body weight
The effects of AGE on metoprolol QF are illustrated in Figure 9 where Bayesian post hoc estimates of QF are plotted against AGE and overlaid by the model-predicted line Figure 9 Plot of QF vs Age
DCP1PM Page 81 10182006
Clinical Pharmacology Review NDA 19-962 Toprol-XL 10182006
Reviewer Note The applicant indicated that attempts to run the final model using the first-order conditional estimation method resulted in termination errors Therefore the parameter estimates obtained by the FO method were reported as the final parameter estimates
Conclusion Regarding Population PK Modeling Overall the sponsorrsquos population PK modeling is acceptable
PKPD Model and Model Selection
PKPD Base Model PharmacokineticPharmacodynamic Model description The key feature of the model was a lack of random variance term for the slope (since only single data points were available per subject) and inclusion of baseline effect
Key equations were as follows E0 = THETA(1)EXP(ETA(1)) M = THETA(2) Y = E0 + MLOG(AUC) + EPS(1)
The control stream provided in the appendix is that for DBP (provided by sponsor) The control stream for SBP is comparable with appropriate substitution for BP type
It should be noted that only the log-linear and linear PKPD models were considered suitable for AUC and Cmax For this review only AUC estimates were considered reliable as Cmax estimates could not be accurately determined based on the sampling scheme Consequently the remainder of this review focuses on AUC information although Ctrough and Cmax data are displayed for reference
Bayesian estimates from PK modeling are summarized in Table 1
Table 1 Bayesian estimates of metoprolol PK exposure for those patients included in the PKPD analysis (N=65)
DCP1PM Page 82 10182006
Clinical Pharmacology Review NDA 19-962 Toprol-XL 10182006
PKPD Model Selection (initial and final) The log-linear model was adopted as the base model for this PKPD relationship since it improved the MOF significantly (Table 2) The ETA parameter for the slope was pre-eliminated for the purpose of model parsimony The intercept and slope in this log-linear model for AUC(0-24) did not bear ETA parameter therefore no covariates had impact on either parameter in the model
Reviewer Note The intercept should not have borne an eta term because individual subjects provided only one data point Consequently fixing eta to zero or deleting eta in the final model is appropriate No further model development was required after eta was eliminated and the base model was equivalent to the final model
Table 2 Base population PKPD models tested for the change in SBP
41116 PKPD Parameter estimation results The final PKPD parameter estimates are presented in Table 3
Table 3 Summary parameters in the final PKPD model for the change in SBP using trough plasma level Parameter Explanation Estimate SE ()b
DCP1PM Page 83 10182006
Clinical Pharmacology Review NDA 19-962 Toprol-XL 10182006
Model Qualification Based on the relatively low R2 value and as shown in Figure there is a poor correlation between change in SBP and log AUC
Figure 1 Relationship between change in SBP and AUC (line generated from modeling)
Overall goodness-of-fit of the model was considered to be poor probably due to the high variability in the measurements Consequently the precision of the model parameter estimates was not considered to be very reliable These parameters have little clinical usefulness and can be treated only as an indication of trends ie more hemodynamic effects can be potentially achieved when high Toprol-XL doses are given Clinical dose adjustment based on these PKPD parameters is not recommended
Reviewerrsquos Supplemental Analyses A supplemental PKPD analyses was conducted using simple linear regression since the population model did not improve the fit Overall eta made an insignificant contribution to the overall model The results of the analyses were similar to the population analyses A series of regression analyses were conducted and are presented in Table 4
The applicant notes that the preliminary modeling exercise found that there was no difference in the PKPD modeling results using different hemodynamic data formats (ie change in the measurements percent change in the measurements or actual BP measurements) This finding was confirmed by this reviewer (see Table 4)
DCP1PM Page 84 10182006
Clinical Pharmacology Review NDA 19-962 Toprol-XL 10182006
Table 4 Supplemental PKPD Regression Analyses Conducted by Reviewer Model (liner regression) Intercept (I) Slope (m) R2 Probability RSBP = mISBP + I 3957 -035 01626 0009 PSBP = mISBP + I 2524 -023 01252 00038 PSBP = mRSBP + I 0005 074 09891 lt 00001 RSBP = mlogAUC + I 651 -221 0060 00493 RSBP = mDose + I -751 0006 00026 06878 RSBP = mDose^ + I -312 -111 004 02711 RSBP = mlogAUC + nISBP + I 5303 -221 (m)
-035 (n) 02230 0001
RSBPplc = mAUC + I -667 -0003 00458 00871 RSBPplc = mlogAUC + I 461 -2208 00600 00493 RPUL = mlogAUC + I 1868 -405 01102 00069 Symbols in table similar to population PK model without eta term RSBP- change of SBP without placebo correction ISBP- initial (baseline) SBP RPUL- change in HR without placebo correction Dose- in mg where placebo is included as 0 mg PSBP- percentage change of SBP without placebo correction
Conclusion Regarding Population PKPD Modeling Overall the sponsorrsquos population PKPD modeling is acceptable No dose adjustment conclusion can be made from this modeling however an exposure-response relationship was established for AUC and reduction in SBP
Discussion
The significance of the results 1 Provide estimates of PK measures and plasma exposure in pediatric population These data can be compared to adult exposure to determine if exposure differences impact drug effectiveness The main challenge in comparing pediatric data to adult data is different modeling schemes formulations and methods were used in the two populations
2 PKPD findings are not sufficiently precise to provide a dose adjustment algorithm however the PKPD analyses provides rationale for proposed titration as increasing exposure (doses) may improve efficacy (reduction in SBP) Ultimately the risk-benefit analyses overrides PKPD assessment for dose adjustment drug will be titrated thus reliance on PKPD information is not critical The proposed dose 10 mgkg appears suitable based on available information It is unclear from the studies if there should be an initial maximum dose although the sponsor has proposed 50 mg as the maximum initial dose The proposed pediatric starting dose on a mgkg basis is within the range of starting adult doses (25 ndash 100 mg) assuming an adult weighs 70 kg
3 Cumulative information form dose-response study indicates that Toprol XL has effectiveness in children however the most effective dose is unclear Since the drug can be titrated determining the initial optimal dose does not appear critical As proposed by the applicant dosing is started at a ldquolowrdquo dose that can be up-titrated if needed
DCP1PM Page 85 10182006
Clinical Pharmacology Review NDA 19-962 Toprol-XL 10182006
4 The results did not adequately address the potential impact of CYP2D6 metabolic status for pediatric patients taking Toprol XL There were an insufficient number of patients to make this assessment
5 Covariate effects do not appear significant only body weight significantly affects clearance However a worst case scenario can occur with a person that has a low body weight and is a poor metabolizer this will result in very high possibly supra-therapeutic exposure Age does not impact apparent oral clearance so an age-dependent dose adjustment is not needed for children over 6 years old In essence all children over six years old can initiate therapy at 10 mgkg
The validity of the results Overall the results produced by the sponsor appear valid and the sponsor used a sound modeling approach However alternative approaches that could have been adopted may have improved the outcome of the analyses Three of these approaches are presented below 1 Additional PK samples should have been collected during the absorption phase and
throughout the dosing interval to improve the modelrsquos performance Specifically additional samples collected during the absorption phase may have unambiguously identified the actual absorption input function (eg first order zero order mixed first and zero order) First order input was selected for the analyses although the dosage form is reported to exhibit zero order kinetics in adults It is possible that the input rate in children differs from that in adults but unlikely It should be noted that absorption kinetics in children is often erratic due to multiple factors (eg regioshyselective absorption incomplete gastric emptying and inconsistent absorption) so it is unclear if additional samples would have definitively identified the absorption function However additional non-trough samples may have helped in estimating key PK measures such as V and Cmax The final model did not have an eta associated with V which is atypical Collection of additional samples on different visits may have helped estimate potential inter-occasion variability It should be noted that AUC was estimated precisely for subjects providing serial samples but these subjects were not necessarily included in the PKPD analyses Ideally the PKPD modeling should have been conducted primarily in subjects who had accurate PK measures
2 The PKPD design could have been modified to potentially improve the utility of the analyses Specifically there should have been better placebo matching procedures to minimize the potential impact of the placebo effect This matching could have been improved by ensuring all patients on placebo had the same titration schedule and number of tablets It is noted that the model had a poor predictive performance that was mainly attributed to the high degree of variability in the PD measures Potentially other PD markers could have been explored that have less inherent variability One such marker is the degree of beta blockade using exercise heart rate (EHR) reduction this marker has been used extensively for metoprolol in adult subjects However use of EHR in the pediatric setting may be challenging
DCP1PM Page 86 10182006
Clinical Pharmacology Review NDA 19-962 Toprol-XL 10182006
Comments to sponsor
In future pharmacometric studies you should consider the following 1 collect sufficient (multiple) samples from individual subjects to allow assessment
of inter-occasion variability and estimation of inter-individual variability (eta) for all relevant parameters
2 placebo groups should be identically matched across all dose groups (eg same titration schedule and number tablets) to minimize potential bias or differences in the placebo effect
Comments to medical reviewer
1 The sponsor has adequately characterized metoprolol PK in the studied pediatric population The PK characterization could have been further optimized by obtaining additional samples over the entire dosing interval (eg during the absorption phase and elimination phase) on multiple occasions rather than on one occasion primarily at trough
2 A dose-response relationship could not be established using the protocol specified analysis approach The outcome of the dose-response relationship appeared highly dependent on the ldquoplacebo effectrdquo suggesting that the placebo group may not have been appropriate One should consider re-evaluating the dose-response precisely matched placebo groups (eg all placebo patients have identical number of tablets and titration schedule)
3 Based on the PKPD analysis plasma exposure (AUC) explains lt 10 of the response (reduction in systolic blood pressure) thus has limited clinical utility However the PKPD relationship suggests that there is a trend for increased response with increased exposure (dose driven)
4 Overall information from the dose-response study suggests that Toprol- XL is effective in the pediatric population The optimal initial dose 02 10 or 20 mgkg or the maximum safe and effective dose cannot be determined from the information provided It is noted that the 02 mgkg dose is unlikely to be effective as plasma concentrations achieved at this dose are unlikely to be effective (most concentrations lt LOQ and lower than effective adult concentrations) The 10 mgkg (proposed by applicant) appears to be a reasonable initial dose The labeling should reflect the regimens studied
DCP1PM Page 89 10182006
Clinical Pharmacology Review NDA 19-962 Toprol-XL 10182006
Appendix
DCP1PM Page 90 10182006
Clinical Pharmacology Review NDA 19-962 Toprol-XL 10182006
DCP1PM Page 91 10182006
Clinical Pharmacology Review NDA 19-962 Toprol-XL 10182006
DCP1PM Page 92 10182006
Clinical Pharmacology Review NDA 19-962 Toprol-XL 10182006
DCP1PM Page 93 10182006
Clinical Pharmacology Review NDA 19-962 Toprol-XL 10182006
DCP1PM Page 94 10182006
Clinical Pharmacology Review NDA 19-962 Toprol-XL 10182006
DCP1PM Page 95 10182006
Clinical Pharmacology Review NDA 19-962 Toprol-XL 10182006
Table 15 Control streams for final log-linear PKPD model for the change in DBP using metoprolol Cmax as the measure of exposure
Truncated NONMEM reports for base model identification for PKPD relationship in change of SBP (per sponsor)
DCP1PM Page 96 10182006
Clinical Pharmacology Review NDA 19-962 Toprol-XL 10182006
Reported PD information^
^ Under metoprolol regimen CRZ0K is Toprol XL
DCP1PM Page 97 10182006
Clinical Pharmacology Review NDA 19-962 Toprol-XL 10182006
Table Results of randomised double-blind comparative trials evaluating antihypertensive efficacy of metoprolol formulations or other antihypertensives
DCP1PM Page 98 10182006
---------------------------------------------------------------------------------------------------------------------
---------------------------------------------------------------------------------------------------------------------
---------------------
This is a representation of an electronic record that was signed electronically and this page is the manifestation of the electronic signature
s
Robert Kumi 10182006 045635 PM BIOPHARMACEUTICS
Patrick Marroum 10192006 050811 PM BIOPHARMACEUTICS
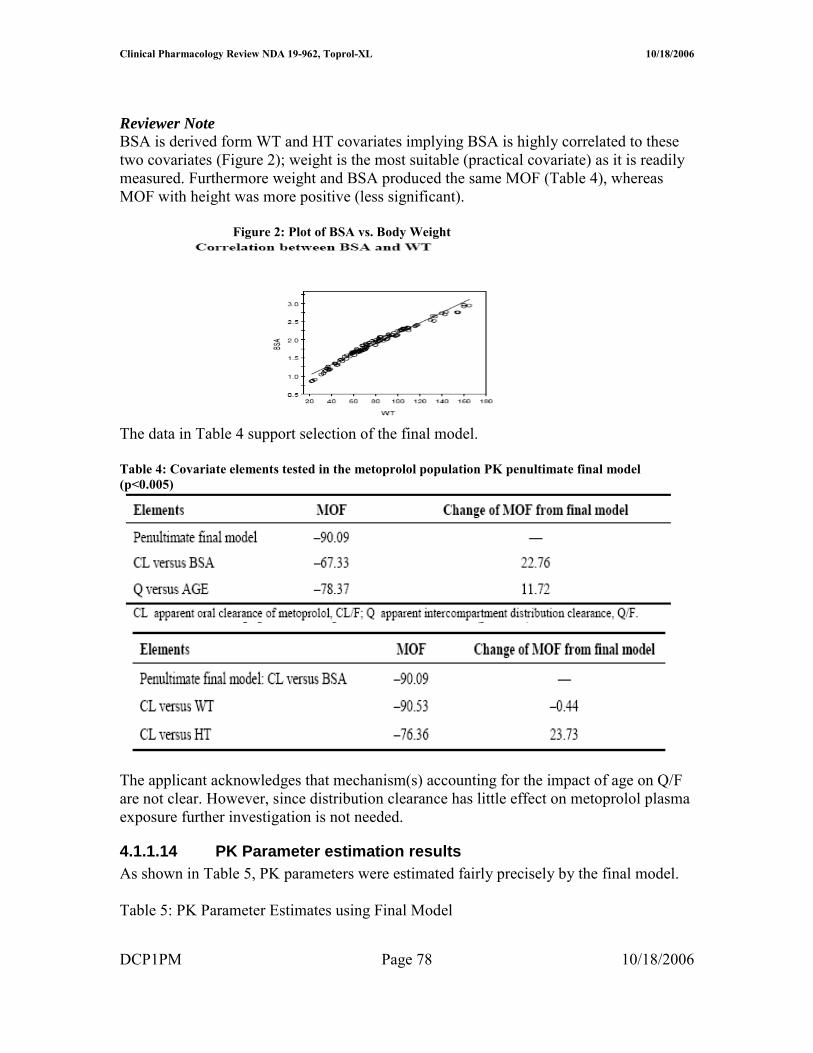
Clinical Pharmacology Review NDA 19-962 Toprol-XL 10182006
PK Model Qualification The post hoc Bayesian-estimated AUC (simulated) obtained for the 27 patients with serial plasma samples are plotted against the observed (AUCt) The correlation was high (R2 gt 099) Figure 6 AUClast from observed data versus AUCt from model simulation in the 27 patients providing serial plasma samples
Regression line Y= 4514 + 08976 X R2 = 09957
The graphical validation of the final metoprolol population PK model validation against covariates evaluated is presented in Figure 6
Figure 7 Graphical validation of covariates
DCP1PM Page 80 10182006
Clinical Pharmacology Review NDA 19-962 Toprol-XL 10182006
There was no systematic bias in weighted residuals for any covariates evaluated suggesting that the final model included all appreciable effects of available covariates (Figure)
The effects of weight on metoprolol CLF are illustrated in Figure 8 where Bayesian post hoc estimates of CLF are plotted against weight and overlaid by the model-predicted line Overall the model appeared to fit the data well
Figure 8 Plot of CLF vs Body weight
The effects of AGE on metoprolol QF are illustrated in Figure 9 where Bayesian post hoc estimates of QF are plotted against AGE and overlaid by the model-predicted line Figure 9 Plot of QF vs Age
DCP1PM Page 81 10182006
Clinical Pharmacology Review NDA 19-962 Toprol-XL 10182006
Reviewer Note The applicant indicated that attempts to run the final model using the first-order conditional estimation method resulted in termination errors Therefore the parameter estimates obtained by the FO method were reported as the final parameter estimates
Conclusion Regarding Population PK Modeling Overall the sponsorrsquos population PK modeling is acceptable
PKPD Model and Model Selection
PKPD Base Model PharmacokineticPharmacodynamic Model description The key feature of the model was a lack of random variance term for the slope (since only single data points were available per subject) and inclusion of baseline effect
Key equations were as follows E0 = THETA(1)EXP(ETA(1)) M = THETA(2) Y = E0 + MLOG(AUC) + EPS(1)
The control stream provided in the appendix is that for DBP (provided by sponsor) The control stream for SBP is comparable with appropriate substitution for BP type
It should be noted that only the log-linear and linear PKPD models were considered suitable for AUC and Cmax For this review only AUC estimates were considered reliable as Cmax estimates could not be accurately determined based on the sampling scheme Consequently the remainder of this review focuses on AUC information although Ctrough and Cmax data are displayed for reference
Bayesian estimates from PK modeling are summarized in Table 1
Table 1 Bayesian estimates of metoprolol PK exposure for those patients included in the PKPD analysis (N=65)
DCP1PM Page 82 10182006
Clinical Pharmacology Review NDA 19-962 Toprol-XL 10182006
PKPD Model Selection (initial and final) The log-linear model was adopted as the base model for this PKPD relationship since it improved the MOF significantly (Table 2) The ETA parameter for the slope was pre-eliminated for the purpose of model parsimony The intercept and slope in this log-linear model for AUC(0-24) did not bear ETA parameter therefore no covariates had impact on either parameter in the model
Reviewer Note The intercept should not have borne an eta term because individual subjects provided only one data point Consequently fixing eta to zero or deleting eta in the final model is appropriate No further model development was required after eta was eliminated and the base model was equivalent to the final model
Table 2 Base population PKPD models tested for the change in SBP
41116 PKPD Parameter estimation results The final PKPD parameter estimates are presented in Table 3
Table 3 Summary parameters in the final PKPD model for the change in SBP using trough plasma level Parameter Explanation Estimate SE ()b
DCP1PM Page 83 10182006
Clinical Pharmacology Review NDA 19-962 Toprol-XL 10182006
Model Qualification Based on the relatively low R2 value and as shown in Figure there is a poor correlation between change in SBP and log AUC
Figure 1 Relationship between change in SBP and AUC (line generated from modeling)
Overall goodness-of-fit of the model was considered to be poor probably due to the high variability in the measurements Consequently the precision of the model parameter estimates was not considered to be very reliable These parameters have little clinical usefulness and can be treated only as an indication of trends ie more hemodynamic effects can be potentially achieved when high Toprol-XL doses are given Clinical dose adjustment based on these PKPD parameters is not recommended
Reviewerrsquos Supplemental Analyses A supplemental PKPD analyses was conducted using simple linear regression since the population model did not improve the fit Overall eta made an insignificant contribution to the overall model The results of the analyses were similar to the population analyses A series of regression analyses were conducted and are presented in Table 4
The applicant notes that the preliminary modeling exercise found that there was no difference in the PKPD modeling results using different hemodynamic data formats (ie change in the measurements percent change in the measurements or actual BP measurements) This finding was confirmed by this reviewer (see Table 4)
DCP1PM Page 84 10182006
Clinical Pharmacology Review NDA 19-962 Toprol-XL 10182006
Table 4 Supplemental PKPD Regression Analyses Conducted by Reviewer Model (liner regression) Intercept (I) Slope (m) R2 Probability RSBP = mISBP + I 3957 -035 01626 0009 PSBP = mISBP + I 2524 -023 01252 00038 PSBP = mRSBP + I 0005 074 09891 lt 00001 RSBP = mlogAUC + I 651 -221 0060 00493 RSBP = mDose + I -751 0006 00026 06878 RSBP = mDose^ + I -312 -111 004 02711 RSBP = mlogAUC + nISBP + I 5303 -221 (m)
-035 (n) 02230 0001
RSBPplc = mAUC + I -667 -0003 00458 00871 RSBPplc = mlogAUC + I 461 -2208 00600 00493 RPUL = mlogAUC + I 1868 -405 01102 00069 Symbols in table similar to population PK model without eta term RSBP- change of SBP without placebo correction ISBP- initial (baseline) SBP RPUL- change in HR without placebo correction Dose- in mg where placebo is included as 0 mg PSBP- percentage change of SBP without placebo correction
Conclusion Regarding Population PKPD Modeling Overall the sponsorrsquos population PKPD modeling is acceptable No dose adjustment conclusion can be made from this modeling however an exposure-response relationship was established for AUC and reduction in SBP
Discussion
The significance of the results 1 Provide estimates of PK measures and plasma exposure in pediatric population These data can be compared to adult exposure to determine if exposure differences impact drug effectiveness The main challenge in comparing pediatric data to adult data is different modeling schemes formulations and methods were used in the two populations
2 PKPD findings are not sufficiently precise to provide a dose adjustment algorithm however the PKPD analyses provides rationale for proposed titration as increasing exposure (doses) may improve efficacy (reduction in SBP) Ultimately the risk-benefit analyses overrides PKPD assessment for dose adjustment drug will be titrated thus reliance on PKPD information is not critical The proposed dose 10 mgkg appears suitable based on available information It is unclear from the studies if there should be an initial maximum dose although the sponsor has proposed 50 mg as the maximum initial dose The proposed pediatric starting dose on a mgkg basis is within the range of starting adult doses (25 ndash 100 mg) assuming an adult weighs 70 kg
3 Cumulative information form dose-response study indicates that Toprol XL has effectiveness in children however the most effective dose is unclear Since the drug can be titrated determining the initial optimal dose does not appear critical As proposed by the applicant dosing is started at a ldquolowrdquo dose that can be up-titrated if needed
DCP1PM Page 85 10182006
Clinical Pharmacology Review NDA 19-962 Toprol-XL 10182006
4 The results did not adequately address the potential impact of CYP2D6 metabolic status for pediatric patients taking Toprol XL There were an insufficient number of patients to make this assessment
5 Covariate effects do not appear significant only body weight significantly affects clearance However a worst case scenario can occur with a person that has a low body weight and is a poor metabolizer this will result in very high possibly supra-therapeutic exposure Age does not impact apparent oral clearance so an age-dependent dose adjustment is not needed for children over 6 years old In essence all children over six years old can initiate therapy at 10 mgkg
The validity of the results Overall the results produced by the sponsor appear valid and the sponsor used a sound modeling approach However alternative approaches that could have been adopted may have improved the outcome of the analyses Three of these approaches are presented below 1 Additional PK samples should have been collected during the absorption phase and
throughout the dosing interval to improve the modelrsquos performance Specifically additional samples collected during the absorption phase may have unambiguously identified the actual absorption input function (eg first order zero order mixed first and zero order) First order input was selected for the analyses although the dosage form is reported to exhibit zero order kinetics in adults It is possible that the input rate in children differs from that in adults but unlikely It should be noted that absorption kinetics in children is often erratic due to multiple factors (eg regioshyselective absorption incomplete gastric emptying and inconsistent absorption) so it is unclear if additional samples would have definitively identified the absorption function However additional non-trough samples may have helped in estimating key PK measures such as V and Cmax The final model did not have an eta associated with V which is atypical Collection of additional samples on different visits may have helped estimate potential inter-occasion variability It should be noted that AUC was estimated precisely for subjects providing serial samples but these subjects were not necessarily included in the PKPD analyses Ideally the PKPD modeling should have been conducted primarily in subjects who had accurate PK measures
2 The PKPD design could have been modified to potentially improve the utility of the analyses Specifically there should have been better placebo matching procedures to minimize the potential impact of the placebo effect This matching could have been improved by ensuring all patients on placebo had the same titration schedule and number of tablets It is noted that the model had a poor predictive performance that was mainly attributed to the high degree of variability in the PD measures Potentially other PD markers could have been explored that have less inherent variability One such marker is the degree of beta blockade using exercise heart rate (EHR) reduction this marker has been used extensively for metoprolol in adult subjects However use of EHR in the pediatric setting may be challenging
DCP1PM Page 86 10182006
Clinical Pharmacology Review NDA 19-962 Toprol-XL 10182006
Comments to sponsor
In future pharmacometric studies you should consider the following 1 collect sufficient (multiple) samples from individual subjects to allow assessment
of inter-occasion variability and estimation of inter-individual variability (eta) for all relevant parameters
2 placebo groups should be identically matched across all dose groups (eg same titration schedule and number tablets) to minimize potential bias or differences in the placebo effect
Comments to medical reviewer
1 The sponsor has adequately characterized metoprolol PK in the studied pediatric population The PK characterization could have been further optimized by obtaining additional samples over the entire dosing interval (eg during the absorption phase and elimination phase) on multiple occasions rather than on one occasion primarily at trough
2 A dose-response relationship could not be established using the protocol specified analysis approach The outcome of the dose-response relationship appeared highly dependent on the ldquoplacebo effectrdquo suggesting that the placebo group may not have been appropriate One should consider re-evaluating the dose-response precisely matched placebo groups (eg all placebo patients have identical number of tablets and titration schedule)
3 Based on the PKPD analysis plasma exposure (AUC) explains lt 10 of the response (reduction in systolic blood pressure) thus has limited clinical utility However the PKPD relationship suggests that there is a trend for increased response with increased exposure (dose driven)
4 Overall information from the dose-response study suggests that Toprol- XL is effective in the pediatric population The optimal initial dose 02 10 or 20 mgkg or the maximum safe and effective dose cannot be determined from the information provided It is noted that the 02 mgkg dose is unlikely to be effective as plasma concentrations achieved at this dose are unlikely to be effective (most concentrations lt LOQ and lower than effective adult concentrations) The 10 mgkg (proposed by applicant) appears to be a reasonable initial dose The labeling should reflect the regimens studied
DCP1PM Page 89 10182006
Clinical Pharmacology Review NDA 19-962 Toprol-XL 10182006
Appendix
DCP1PM Page 90 10182006
Clinical Pharmacology Review NDA 19-962 Toprol-XL 10182006
DCP1PM Page 91 10182006
Clinical Pharmacology Review NDA 19-962 Toprol-XL 10182006
DCP1PM Page 92 10182006
Clinical Pharmacology Review NDA 19-962 Toprol-XL 10182006
DCP1PM Page 93 10182006
Clinical Pharmacology Review NDA 19-962 Toprol-XL 10182006
DCP1PM Page 94 10182006
Clinical Pharmacology Review NDA 19-962 Toprol-XL 10182006
DCP1PM Page 95 10182006
Clinical Pharmacology Review NDA 19-962 Toprol-XL 10182006
Table 15 Control streams for final log-linear PKPD model for the change in DBP using metoprolol Cmax as the measure of exposure
Truncated NONMEM reports for base model identification for PKPD relationship in change of SBP (per sponsor)
DCP1PM Page 96 10182006
Clinical Pharmacology Review NDA 19-962 Toprol-XL 10182006
Reported PD information^
^ Under metoprolol regimen CRZ0K is Toprol XL
DCP1PM Page 97 10182006
Clinical Pharmacology Review NDA 19-962 Toprol-XL 10182006
Table Results of randomised double-blind comparative trials evaluating antihypertensive efficacy of metoprolol formulations or other antihypertensives
DCP1PM Page 98 10182006
---------------------------------------------------------------------------------------------------------------------
---------------------------------------------------------------------------------------------------------------------
---------------------
This is a representation of an electronic record that was signed electronically and this page is the manifestation of the electronic signature
s
Robert Kumi 10182006 045635 PM BIOPHARMACEUTICS
Patrick Marroum 10192006 050811 PM BIOPHARMACEUTICS
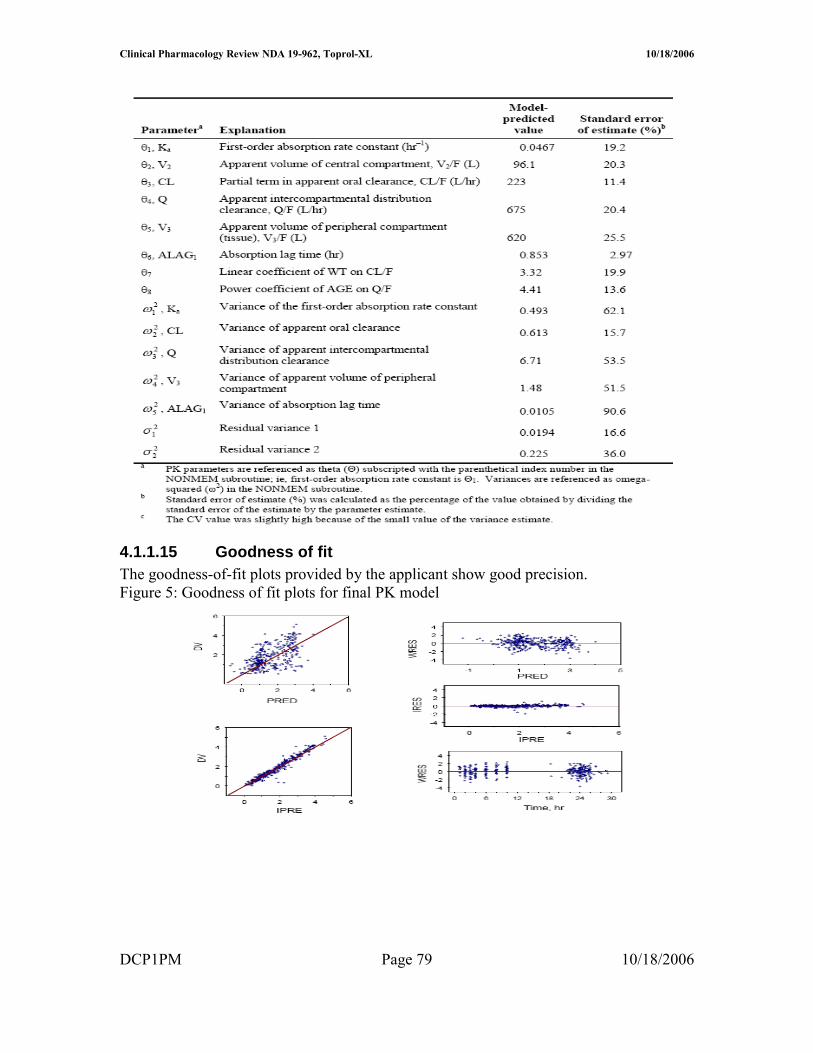
Clinical Pharmacology Review NDA 19-962 Toprol-XL 10182006
Reviewer Note The applicant indicated that attempts to run the final model using the first-order conditional estimation method resulted in termination errors Therefore the parameter estimates obtained by the FO method were reported as the final parameter estimates
Conclusion Regarding Population PK Modeling Overall the sponsorrsquos population PK modeling is acceptable
PKPD Model and Model Selection
PKPD Base Model PharmacokineticPharmacodynamic Model description The key feature of the model was a lack of random variance term for the slope (since only single data points were available per subject) and inclusion of baseline effect
Key equations were as follows E0 = THETA(1)EXP(ETA(1)) M = THETA(2) Y = E0 + MLOG(AUC) + EPS(1)
The control stream provided in the appendix is that for DBP (provided by sponsor) The control stream for SBP is comparable with appropriate substitution for BP type
It should be noted that only the log-linear and linear PKPD models were considered suitable for AUC and Cmax For this review only AUC estimates were considered reliable as Cmax estimates could not be accurately determined based on the sampling scheme Consequently the remainder of this review focuses on AUC information although Ctrough and Cmax data are displayed for reference
Bayesian estimates from PK modeling are summarized in Table 1
Table 1 Bayesian estimates of metoprolol PK exposure for those patients included in the PKPD analysis (N=65)
DCP1PM Page 82 10182006
Clinical Pharmacology Review NDA 19-962 Toprol-XL 10182006
PKPD Model Selection (initial and final) The log-linear model was adopted as the base model for this PKPD relationship since it improved the MOF significantly (Table 2) The ETA parameter for the slope was pre-eliminated for the purpose of model parsimony The intercept and slope in this log-linear model for AUC(0-24) did not bear ETA parameter therefore no covariates had impact on either parameter in the model
Reviewer Note The intercept should not have borne an eta term because individual subjects provided only one data point Consequently fixing eta to zero or deleting eta in the final model is appropriate No further model development was required after eta was eliminated and the base model was equivalent to the final model
Table 2 Base population PKPD models tested for the change in SBP
41116 PKPD Parameter estimation results The final PKPD parameter estimates are presented in Table 3
Table 3 Summary parameters in the final PKPD model for the change in SBP using trough plasma level Parameter Explanation Estimate SE ()b
DCP1PM Page 83 10182006
Clinical Pharmacology Review NDA 19-962 Toprol-XL 10182006
Model Qualification Based on the relatively low R2 value and as shown in Figure there is a poor correlation between change in SBP and log AUC
Figure 1 Relationship between change in SBP and AUC (line generated from modeling)
Overall goodness-of-fit of the model was considered to be poor probably due to the high variability in the measurements Consequently the precision of the model parameter estimates was not considered to be very reliable These parameters have little clinical usefulness and can be treated only as an indication of trends ie more hemodynamic effects can be potentially achieved when high Toprol-XL doses are given Clinical dose adjustment based on these PKPD parameters is not recommended
Reviewerrsquos Supplemental Analyses A supplemental PKPD analyses was conducted using simple linear regression since the population model did not improve the fit Overall eta made an insignificant contribution to the overall model The results of the analyses were similar to the population analyses A series of regression analyses were conducted and are presented in Table 4
The applicant notes that the preliminary modeling exercise found that there was no difference in the PKPD modeling results using different hemodynamic data formats (ie change in the measurements percent change in the measurements or actual BP measurements) This finding was confirmed by this reviewer (see Table 4)
DCP1PM Page 84 10182006
Clinical Pharmacology Review NDA 19-962 Toprol-XL 10182006
Table 4 Supplemental PKPD Regression Analyses Conducted by Reviewer Model (liner regression) Intercept (I) Slope (m) R2 Probability RSBP = mISBP + I 3957 -035 01626 0009 PSBP = mISBP + I 2524 -023 01252 00038 PSBP = mRSBP + I 0005 074 09891 lt 00001 RSBP = mlogAUC + I 651 -221 0060 00493 RSBP = mDose + I -751 0006 00026 06878 RSBP = mDose^ + I -312 -111 004 02711 RSBP = mlogAUC + nISBP + I 5303 -221 (m)
-035 (n) 02230 0001
RSBPplc = mAUC + I -667 -0003 00458 00871 RSBPplc = mlogAUC + I 461 -2208 00600 00493 RPUL = mlogAUC + I 1868 -405 01102 00069 Symbols in table similar to population PK model without eta term RSBP- change of SBP without placebo correction ISBP- initial (baseline) SBP RPUL- change in HR without placebo correction Dose- in mg where placebo is included as 0 mg PSBP- percentage change of SBP without placebo correction
Conclusion Regarding Population PKPD Modeling Overall the sponsorrsquos population PKPD modeling is acceptable No dose adjustment conclusion can be made from this modeling however an exposure-response relationship was established for AUC and reduction in SBP
Discussion
The significance of the results 1 Provide estimates of PK measures and plasma exposure in pediatric population These data can be compared to adult exposure to determine if exposure differences impact drug effectiveness The main challenge in comparing pediatric data to adult data is different modeling schemes formulations and methods were used in the two populations
2 PKPD findings are not sufficiently precise to provide a dose adjustment algorithm however the PKPD analyses provides rationale for proposed titration as increasing exposure (doses) may improve efficacy (reduction in SBP) Ultimately the risk-benefit analyses overrides PKPD assessment for dose adjustment drug will be titrated thus reliance on PKPD information is not critical The proposed dose 10 mgkg appears suitable based on available information It is unclear from the studies if there should be an initial maximum dose although the sponsor has proposed 50 mg as the maximum initial dose The proposed pediatric starting dose on a mgkg basis is within the range of starting adult doses (25 ndash 100 mg) assuming an adult weighs 70 kg
3 Cumulative information form dose-response study indicates that Toprol XL has effectiveness in children however the most effective dose is unclear Since the drug can be titrated determining the initial optimal dose does not appear critical As proposed by the applicant dosing is started at a ldquolowrdquo dose that can be up-titrated if needed
DCP1PM Page 85 10182006
Clinical Pharmacology Review NDA 19-962 Toprol-XL 10182006
4 The results did not adequately address the potential impact of CYP2D6 metabolic status for pediatric patients taking Toprol XL There were an insufficient number of patients to make this assessment
5 Covariate effects do not appear significant only body weight significantly affects clearance However a worst case scenario can occur with a person that has a low body weight and is a poor metabolizer this will result in very high possibly supra-therapeutic exposure Age does not impact apparent oral clearance so an age-dependent dose adjustment is not needed for children over 6 years old In essence all children over six years old can initiate therapy at 10 mgkg
The validity of the results Overall the results produced by the sponsor appear valid and the sponsor used a sound modeling approach However alternative approaches that could have been adopted may have improved the outcome of the analyses Three of these approaches are presented below 1 Additional PK samples should have been collected during the absorption phase and
throughout the dosing interval to improve the modelrsquos performance Specifically additional samples collected during the absorption phase may have unambiguously identified the actual absorption input function (eg first order zero order mixed first and zero order) First order input was selected for the analyses although the dosage form is reported to exhibit zero order kinetics in adults It is possible that the input rate in children differs from that in adults but unlikely It should be noted that absorption kinetics in children is often erratic due to multiple factors (eg regioshyselective absorption incomplete gastric emptying and inconsistent absorption) so it is unclear if additional samples would have definitively identified the absorption function However additional non-trough samples may have helped in estimating key PK measures such as V and Cmax The final model did not have an eta associated with V which is atypical Collection of additional samples on different visits may have helped estimate potential inter-occasion variability It should be noted that AUC was estimated precisely for subjects providing serial samples but these subjects were not necessarily included in the PKPD analyses Ideally the PKPD modeling should have been conducted primarily in subjects who had accurate PK measures
2 The PKPD design could have been modified to potentially improve the utility of the analyses Specifically there should have been better placebo matching procedures to minimize the potential impact of the placebo effect This matching could have been improved by ensuring all patients on placebo had the same titration schedule and number of tablets It is noted that the model had a poor predictive performance that was mainly attributed to the high degree of variability in the PD measures Potentially other PD markers could have been explored that have less inherent variability One such marker is the degree of beta blockade using exercise heart rate (EHR) reduction this marker has been used extensively for metoprolol in adult subjects However use of EHR in the pediatric setting may be challenging
DCP1PM Page 86 10182006
Clinical Pharmacology Review NDA 19-962 Toprol-XL 10182006
Comments to sponsor
In future pharmacometric studies you should consider the following 1 collect sufficient (multiple) samples from individual subjects to allow assessment
of inter-occasion variability and estimation of inter-individual variability (eta) for all relevant parameters
2 placebo groups should be identically matched across all dose groups (eg same titration schedule and number tablets) to minimize potential bias or differences in the placebo effect
Comments to medical reviewer
1 The sponsor has adequately characterized metoprolol PK in the studied pediatric population The PK characterization could have been further optimized by obtaining additional samples over the entire dosing interval (eg during the absorption phase and elimination phase) on multiple occasions rather than on one occasion primarily at trough
2 A dose-response relationship could not be established using the protocol specified analysis approach The outcome of the dose-response relationship appeared highly dependent on the ldquoplacebo effectrdquo suggesting that the placebo group may not have been appropriate One should consider re-evaluating the dose-response precisely matched placebo groups (eg all placebo patients have identical number of tablets and titration schedule)
3 Based on the PKPD analysis plasma exposure (AUC) explains lt 10 of the response (reduction in systolic blood pressure) thus has limited clinical utility However the PKPD relationship suggests that there is a trend for increased response with increased exposure (dose driven)
4 Overall information from the dose-response study suggests that Toprol- XL is effective in the pediatric population The optimal initial dose 02 10 or 20 mgkg or the maximum safe and effective dose cannot be determined from the information provided It is noted that the 02 mgkg dose is unlikely to be effective as plasma concentrations achieved at this dose are unlikely to be effective (most concentrations lt LOQ and lower than effective adult concentrations) The 10 mgkg (proposed by applicant) appears to be a reasonable initial dose The labeling should reflect the regimens studied
DCP1PM Page 89 10182006
Clinical Pharmacology Review NDA 19-962 Toprol-XL 10182006
Appendix
DCP1PM Page 90 10182006
Clinical Pharmacology Review NDA 19-962 Toprol-XL 10182006
DCP1PM Page 91 10182006
Clinical Pharmacology Review NDA 19-962 Toprol-XL 10182006
DCP1PM Page 92 10182006
Clinical Pharmacology Review NDA 19-962 Toprol-XL 10182006
DCP1PM Page 93 10182006
Clinical Pharmacology Review NDA 19-962 Toprol-XL 10182006
DCP1PM Page 94 10182006
Clinical Pharmacology Review NDA 19-962 Toprol-XL 10182006
DCP1PM Page 95 10182006
Clinical Pharmacology Review NDA 19-962 Toprol-XL 10182006
Table 15 Control streams for final log-linear PKPD model for the change in DBP using metoprolol Cmax as the measure of exposure
Truncated NONMEM reports for base model identification for PKPD relationship in change of SBP (per sponsor)
DCP1PM Page 96 10182006
Clinical Pharmacology Review NDA 19-962 Toprol-XL 10182006
Reported PD information^
^ Under metoprolol regimen CRZ0K is Toprol XL
DCP1PM Page 97 10182006
Clinical Pharmacology Review NDA 19-962 Toprol-XL 10182006
Table Results of randomised double-blind comparative trials evaluating antihypertensive efficacy of metoprolol formulations or other antihypertensives
DCP1PM Page 98 10182006
---------------------------------------------------------------------------------------------------------------------
---------------------------------------------------------------------------------------------------------------------
---------------------
This is a representation of an electronic record that was signed electronically and this page is the manifestation of the electronic signature
s
Robert Kumi 10182006 045635 PM BIOPHARMACEUTICS
Patrick Marroum 10192006 050811 PM BIOPHARMACEUTICS
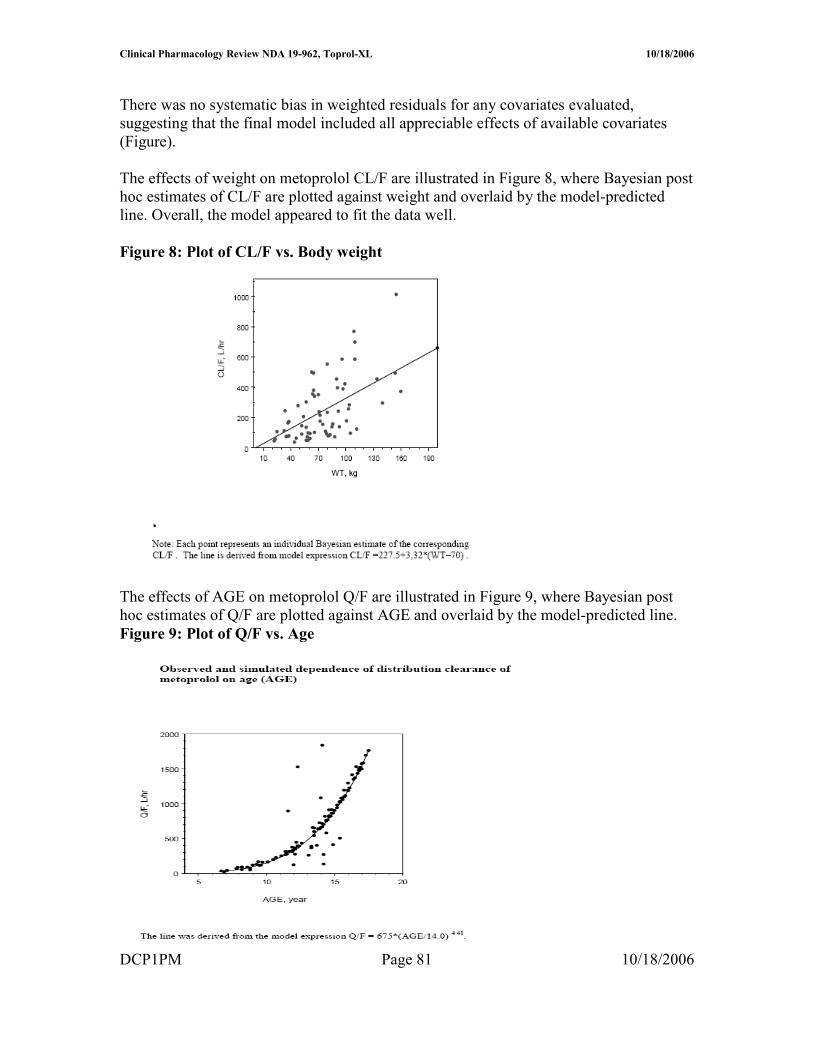
Clinical Pharmacology Review NDA 19-962 Toprol-XL 10182006
Table 4 Supplemental PKPD Regression Analyses Conducted by Reviewer Model (liner regression) Intercept (I) Slope (m) R2 Probability RSBP = mISBP + I 3957 -035 01626 0009 PSBP = mISBP + I 2524 -023 01252 00038 PSBP = mRSBP + I 0005 074 09891 lt 00001 RSBP = mlogAUC + I 651 -221 0060 00493 RSBP = mDose + I -751 0006 00026 06878 RSBP = mDose^ + I -312 -111 004 02711 RSBP = mlogAUC + nISBP + I 5303 -221 (m)
-035 (n) 02230 0001
RSBPplc = mAUC + I -667 -0003 00458 00871 RSBPplc = mlogAUC + I 461 -2208 00600 00493 RPUL = mlogAUC + I 1868 -405 01102 00069 Symbols in table similar to population PK model without eta term RSBP- change of SBP without placebo correction ISBP- initial (baseline) SBP RPUL- change in HR without placebo correction Dose- in mg where placebo is included as 0 mg PSBP- percentage change of SBP without placebo correction
Conclusion Regarding Population PKPD Modeling Overall the sponsorrsquos population PKPD modeling is acceptable No dose adjustment conclusion can be made from this modeling however an exposure-response relationship was established for AUC and reduction in SBP
Discussion
The significance of the results 1 Provide estimates of PK measures and plasma exposure in pediatric population These data can be compared to adult exposure to determine if exposure differences impact drug effectiveness The main challenge in comparing pediatric data to adult data is different modeling schemes formulations and methods were used in the two populations
2 PKPD findings are not sufficiently precise to provide a dose adjustment algorithm however the PKPD analyses provides rationale for proposed titration as increasing exposure (doses) may improve efficacy (reduction in SBP) Ultimately the risk-benefit analyses overrides PKPD assessment for dose adjustment drug will be titrated thus reliance on PKPD information is not critical The proposed dose 10 mgkg appears suitable based on available information It is unclear from the studies if there should be an initial maximum dose although the sponsor has proposed 50 mg as the maximum initial dose The proposed pediatric starting dose on a mgkg basis is within the range of starting adult doses (25 ndash 100 mg) assuming an adult weighs 70 kg
3 Cumulative information form dose-response study indicates that Toprol XL has effectiveness in children however the most effective dose is unclear Since the drug can be titrated determining the initial optimal dose does not appear critical As proposed by the applicant dosing is started at a ldquolowrdquo dose that can be up-titrated if needed
DCP1PM Page 85 10182006
Clinical Pharmacology Review NDA 19-962 Toprol-XL 10182006
4 The results did not adequately address the potential impact of CYP2D6 metabolic status for pediatric patients taking Toprol XL There were an insufficient number of patients to make this assessment
5 Covariate effects do not appear significant only body weight significantly affects clearance However a worst case scenario can occur with a person that has a low body weight and is a poor metabolizer this will result in very high possibly supra-therapeutic exposure Age does not impact apparent oral clearance so an age-dependent dose adjustment is not needed for children over 6 years old In essence all children over six years old can initiate therapy at 10 mgkg
The validity of the results Overall the results produced by the sponsor appear valid and the sponsor used a sound modeling approach However alternative approaches that could have been adopted may have improved the outcome of the analyses Three of these approaches are presented below 1 Additional PK samples should have been collected during the absorption phase and
throughout the dosing interval to improve the modelrsquos performance Specifically additional samples collected during the absorption phase may have unambiguously identified the actual absorption input function (eg first order zero order mixed first and zero order) First order input was selected for the analyses although the dosage form is reported to exhibit zero order kinetics in adults It is possible that the input rate in children differs from that in adults but unlikely It should be noted that absorption kinetics in children is often erratic due to multiple factors (eg regioshyselective absorption incomplete gastric emptying and inconsistent absorption) so it is unclear if additional samples would have definitively identified the absorption function However additional non-trough samples may have helped in estimating key PK measures such as V and Cmax The final model did not have an eta associated with V which is atypical Collection of additional samples on different visits may have helped estimate potential inter-occasion variability It should be noted that AUC was estimated precisely for subjects providing serial samples but these subjects were not necessarily included in the PKPD analyses Ideally the PKPD modeling should have been conducted primarily in subjects who had accurate PK measures
2 The PKPD design could have been modified to potentially improve the utility of the analyses Specifically there should have been better placebo matching procedures to minimize the potential impact of the placebo effect This matching could have been improved by ensuring all patients on placebo had the same titration schedule and number of tablets It is noted that the model had a poor predictive performance that was mainly attributed to the high degree of variability in the PD measures Potentially other PD markers could have been explored that have less inherent variability One such marker is the degree of beta blockade using exercise heart rate (EHR) reduction this marker has been used extensively for metoprolol in adult subjects However use of EHR in the pediatric setting may be challenging
DCP1PM Page 86 10182006
Clinical Pharmacology Review NDA 19-962 Toprol-XL 10182006
Comments to sponsor
In future pharmacometric studies you should consider the following 1 collect sufficient (multiple) samples from individual subjects to allow assessment
of inter-occasion variability and estimation of inter-individual variability (eta) for all relevant parameters
2 placebo groups should be identically matched across all dose groups (eg same titration schedule and number tablets) to minimize potential bias or differences in the placebo effect
Comments to medical reviewer
1 The sponsor has adequately characterized metoprolol PK in the studied pediatric population The PK characterization could have been further optimized by obtaining additional samples over the entire dosing interval (eg during the absorption phase and elimination phase) on multiple occasions rather than on one occasion primarily at trough
2 A dose-response relationship could not be established using the protocol specified analysis approach The outcome of the dose-response relationship appeared highly dependent on the ldquoplacebo effectrdquo suggesting that the placebo group may not have been appropriate One should consider re-evaluating the dose-response precisely matched placebo groups (eg all placebo patients have identical number of tablets and titration schedule)
3 Based on the PKPD analysis plasma exposure (AUC) explains lt 10 of the response (reduction in systolic blood pressure) thus has limited clinical utility However the PKPD relationship suggests that there is a trend for increased response with increased exposure (dose driven)
4 Overall information from the dose-response study suggests that Toprol- XL is effective in the pediatric population The optimal initial dose 02 10 or 20 mgkg or the maximum safe and effective dose cannot be determined from the information provided It is noted that the 02 mgkg dose is unlikely to be effective as plasma concentrations achieved at this dose are unlikely to be effective (most concentrations lt LOQ and lower than effective adult concentrations) The 10 mgkg (proposed by applicant) appears to be a reasonable initial dose The labeling should reflect the regimens studied
DCP1PM Page 89 10182006
Clinical Pharmacology Review NDA 19-962 Toprol-XL 10182006
Appendix
DCP1PM Page 90 10182006
Clinical Pharmacology Review NDA 19-962 Toprol-XL 10182006
DCP1PM Page 91 10182006
Clinical Pharmacology Review NDA 19-962 Toprol-XL 10182006
DCP1PM Page 92 10182006
Clinical Pharmacology Review NDA 19-962 Toprol-XL 10182006
DCP1PM Page 93 10182006
Clinical Pharmacology Review NDA 19-962 Toprol-XL 10182006
DCP1PM Page 94 10182006
Clinical Pharmacology Review NDA 19-962 Toprol-XL 10182006
DCP1PM Page 95 10182006
Clinical Pharmacology Review NDA 19-962 Toprol-XL 10182006
Table 15 Control streams for final log-linear PKPD model for the change in DBP using metoprolol Cmax as the measure of exposure
Truncated NONMEM reports for base model identification for PKPD relationship in change of SBP (per sponsor)
DCP1PM Page 96 10182006
Clinical Pharmacology Review NDA 19-962 Toprol-XL 10182006
Reported PD information^
^ Under metoprolol regimen CRZ0K is Toprol XL
DCP1PM Page 97 10182006
Clinical Pharmacology Review NDA 19-962 Toprol-XL 10182006
Table Results of randomised double-blind comparative trials evaluating antihypertensive efficacy of metoprolol formulations or other antihypertensives
DCP1PM Page 98 10182006
---------------------------------------------------------------------------------------------------------------------
---------------------------------------------------------------------------------------------------------------------
---------------------
This is a representation of an electronic record that was signed electronically and this page is the manifestation of the electronic signature
s
Robert Kumi 10182006 045635 PM BIOPHARMACEUTICS
Patrick Marroum 10192006 050811 PM BIOPHARMACEUTICS
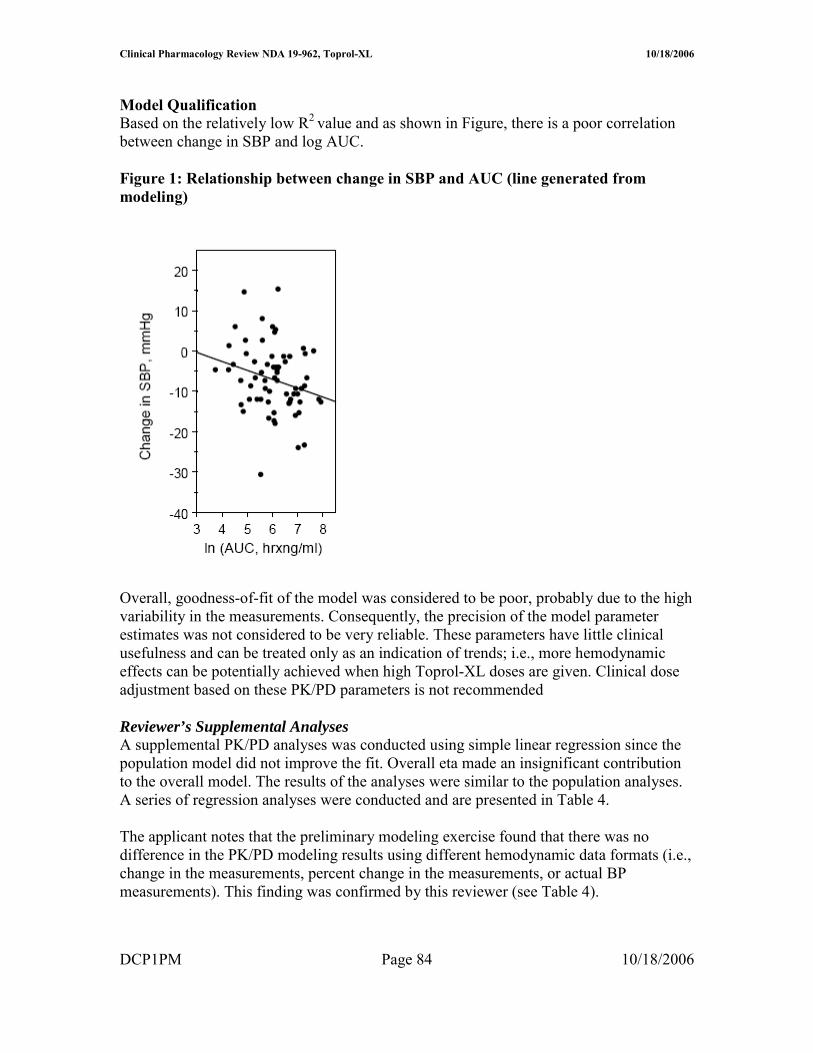
Clinical Pharmacology Review NDA 19-962 Toprol-XL 10182006
DCP1PM Page 92 10182006
Clinical Pharmacology Review NDA 19-962 Toprol-XL 10182006
DCP1PM Page 93 10182006
Clinical Pharmacology Review NDA 19-962 Toprol-XL 10182006
DCP1PM Page 94 10182006
Clinical Pharmacology Review NDA 19-962 Toprol-XL 10182006
DCP1PM Page 95 10182006
Clinical Pharmacology Review NDA 19-962 Toprol-XL 10182006
Table 15 Control streams for final log-linear PKPD model for the change in DBP using metoprolol Cmax as the measure of exposure
Truncated NONMEM reports for base model identification for PKPD relationship in change of SBP (per sponsor)
DCP1PM Page 96 10182006
Clinical Pharmacology Review NDA 19-962 Toprol-XL 10182006
Reported PD information^
^ Under metoprolol regimen CRZ0K is Toprol XL
DCP1PM Page 97 10182006
Clinical Pharmacology Review NDA 19-962 Toprol-XL 10182006
Table Results of randomised double-blind comparative trials evaluating antihypertensive efficacy of metoprolol formulations or other antihypertensives
DCP1PM Page 98 10182006
---------------------------------------------------------------------------------------------------------------------
---------------------------------------------------------------------------------------------------------------------
---------------------
This is a representation of an electronic record that was signed electronically and this page is the manifestation of the electronic signature
s
Robert Kumi 10182006 045635 PM BIOPHARMACEUTICS
Patrick Marroum 10192006 050811 PM BIOPHARMACEUTICS
Clinical Pharmacology Review NDA 19-962 Toprol-XL 10182006
DCP1PM Page 93 10182006
Clinical Pharmacology Review NDA 19-962 Toprol-XL 10182006
DCP1PM Page 94 10182006
Clinical Pharmacology Review NDA 19-962 Toprol-XL 10182006
DCP1PM Page 95 10182006
Clinical Pharmacology Review NDA 19-962 Toprol-XL 10182006
Table 15 Control streams for final log-linear PKPD model for the change in DBP using metoprolol Cmax as the measure of exposure
Truncated NONMEM reports for base model identification for PKPD relationship in change of SBP (per sponsor)
DCP1PM Page 96 10182006
Clinical Pharmacology Review NDA 19-962 Toprol-XL 10182006
Reported PD information^
^ Under metoprolol regimen CRZ0K is Toprol XL
DCP1PM Page 97 10182006
Clinical Pharmacology Review NDA 19-962 Toprol-XL 10182006
Table Results of randomised double-blind comparative trials evaluating antihypertensive efficacy of metoprolol formulations or other antihypertensives
DCP1PM Page 98 10182006
---------------------------------------------------------------------------------------------------------------------
---------------------------------------------------------------------------------------------------------------------
---------------------
This is a representation of an electronic record that was signed electronically and this page is the manifestation of the electronic signature
s
Robert Kumi 10182006 045635 PM BIOPHARMACEUTICS
Patrick Marroum 10192006 050811 PM BIOPHARMACEUTICS

Clinical Pharmacology Review NDA 19-962 Toprol-XL 10182006
Table 15 Control streams for final log-linear PKPD model for the change in DBP using metoprolol Cmax as the measure of exposure
Truncated NONMEM reports for base model identification for PKPD relationship in change of SBP (per sponsor)
DCP1PM Page 96 10182006
Clinical Pharmacology Review NDA 19-962 Toprol-XL 10182006
Reported PD information^
^ Under metoprolol regimen CRZ0K is Toprol XL
DCP1PM Page 97 10182006
Clinical Pharmacology Review NDA 19-962 Toprol-XL 10182006
Table Results of randomised double-blind comparative trials evaluating antihypertensive efficacy of metoprolol formulations or other antihypertensives
DCP1PM Page 98 10182006
---------------------------------------------------------------------------------------------------------------------
---------------------------------------------------------------------------------------------------------------------
---------------------
This is a representation of an electronic record that was signed electronically and this page is the manifestation of the electronic signature
s
Robert Kumi 10182006 045635 PM BIOPHARMACEUTICS
Patrick Marroum 10192006 050811 PM BIOPHARMACEUTICS
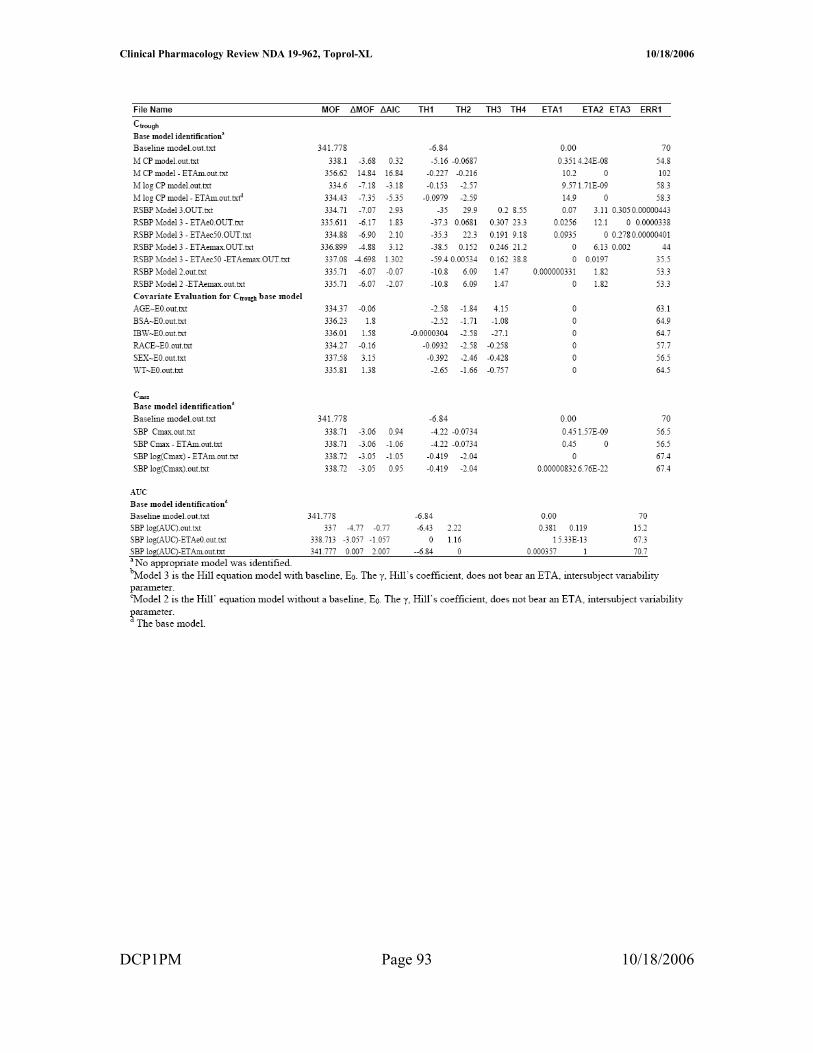
Clinical Pharmacology Review NDA 19-962 Toprol-XL 10182006
Reported PD information^
^ Under metoprolol regimen CRZ0K is Toprol XL
DCP1PM Page 97 10182006
Clinical Pharmacology Review NDA 19-962 Toprol-XL 10182006
Table Results of randomised double-blind comparative trials evaluating antihypertensive efficacy of metoprolol formulations or other antihypertensives
DCP1PM Page 98 10182006
---------------------------------------------------------------------------------------------------------------------
---------------------------------------------------------------------------------------------------------------------
---------------------
This is a representation of an electronic record that was signed electronically and this page is the manifestation of the electronic signature
s
Robert Kumi 10182006 045635 PM BIOPHARMACEUTICS
Patrick Marroum 10192006 050811 PM BIOPHARMACEUTICS
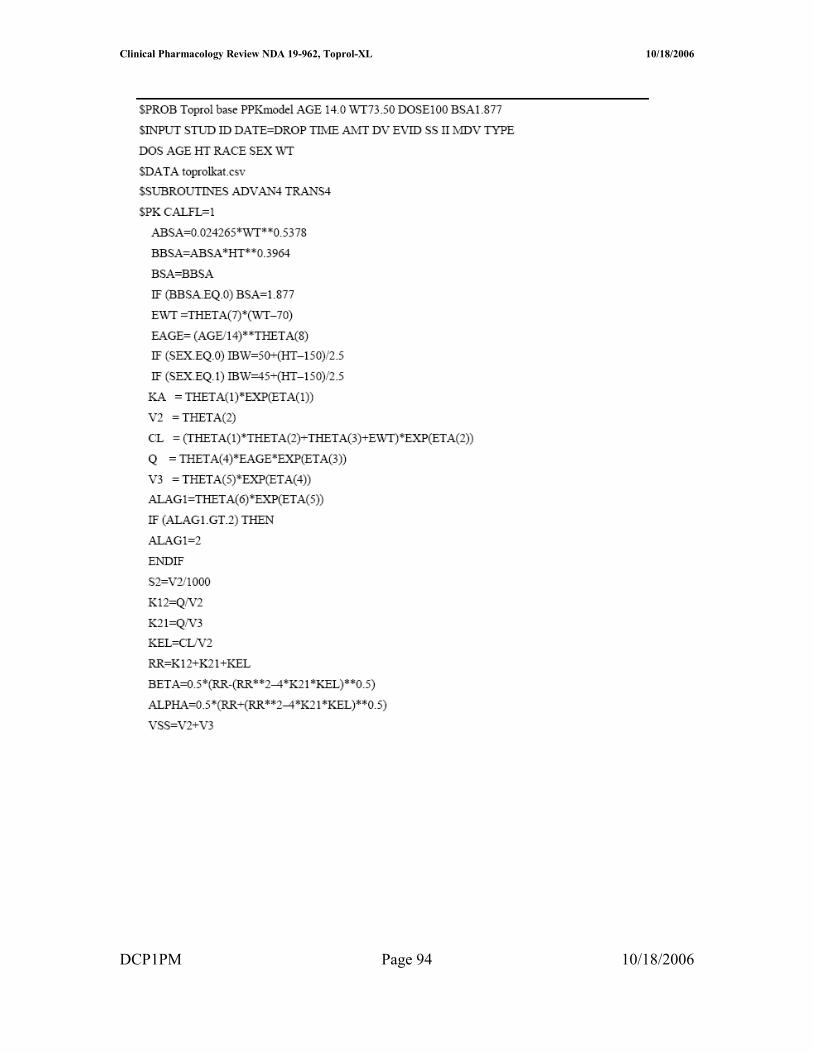
Clinical Pharmacology Review NDA 19-962 Toprol-XL 10182006
Table Results of randomised double-blind comparative trials evaluating antihypertensive efficacy of metoprolol formulations or other antihypertensives
DCP1PM Page 98 10182006
---------------------------------------------------------------------------------------------------------------------
---------------------------------------------------------------------------------------------------------------------
---------------------
This is a representation of an electronic record that was signed electronically and this page is the manifestation of the electronic signature
s
Robert Kumi 10182006 045635 PM BIOPHARMACEUTICS
Patrick Marroum 10192006 050811 PM BIOPHARMACEUTICS

---------------------------------------------------------------------------------------------------------------------
---------------------------------------------------------------------------------------------------------------------
---------------------
This is a representation of an electronic record that was signed electronically and this page is the manifestation of the electronic signature
s
Robert Kumi 10182006 045635 PM BIOPHARMACEUTICS
Patrick Marroum 10192006 050811 PM BIOPHARMACEUTICS