clinical quality control metrics in radiation oncology, charles able
TRANSCRIPT
Quality Control Metrics in Radiation Oncology
Charles M. Able, MS
South East Chapter
American Association of Physicist in Medicine
April 20, 2012
Objectives
1. Define the term “Process” as it relates to Quality
Control
2. Describe two Statistical Process Control techniques
for evaluating continuous data
Mean and Range (Xbar/R) Chart
Individual and Moving Range (I/MR) Chart
3. Describe several examples using these techniques

What is a “Process”
“Everything required to turn an input into
an output for a patient”

The inputs and outputs along the process
exhibit variation.
Total time from simulation to plan approval
Magnitude of daily shifts for IGRT patients
Number of therapist logged on at the time of patient
treatment
Magnitude of setup deviation from plan values on the
first day of treatment
Measured dose deviation from plan dose during IMRT
QA by body site or delivery technique
Exceptional variation of inputs and outputs
along the process impact the quality of
care.
Statistical Process Control (SPC) methodology is used
to detect exceptional variation in a process using
performance data.
Statistical Process Control (SPC)
W. A. Shewhart, Bell Labs, 1924
Application of probability and statistics to quality control
of mass production
Introduced the control chart (or process behavior chart)
Process behavior chart is the primary tool of all of the SPC
techniques
Statistical Process Control (SPC)

Statistical Process Control (SPC)
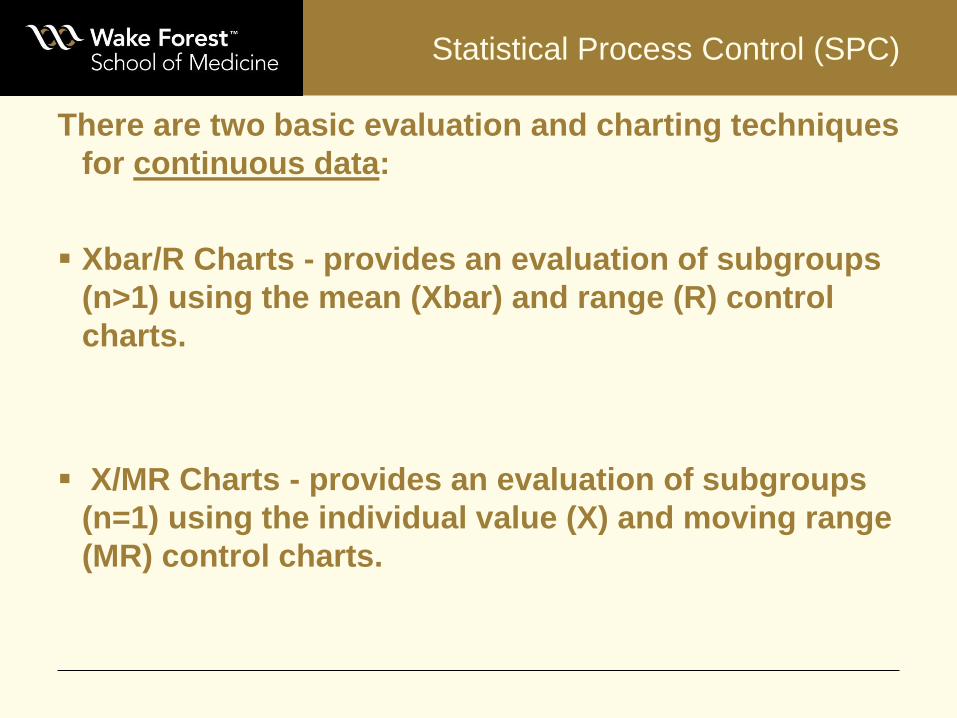
There are two basic evaluation and charting techniques
for continuous data:
Xbar/R Charts - provides an evaluation of subgroups
(n>1) using the mean (Xbar) and range (R) control
charts.
X/MR Charts - provides an evaluation of subgroups
(n=1) using the individual value (X) and moving range
(MR) control charts.
Statistical Process Control (SPC)

Normal Distribution of trials or samples
The normal distribution uses the
standard deviation
Oakland, JS. Statistical process control. Jordan Hill, Oxford, UK: Butterworth-Heinemann;2008.
Fre
qu
en
cy
Variable
–3σ
μ
–2σ – σ +3σ + σ +2σ
68.3% of values
lie between
95.4% of values
lie between
99.7% of values
lie between
Mean and Range Charts
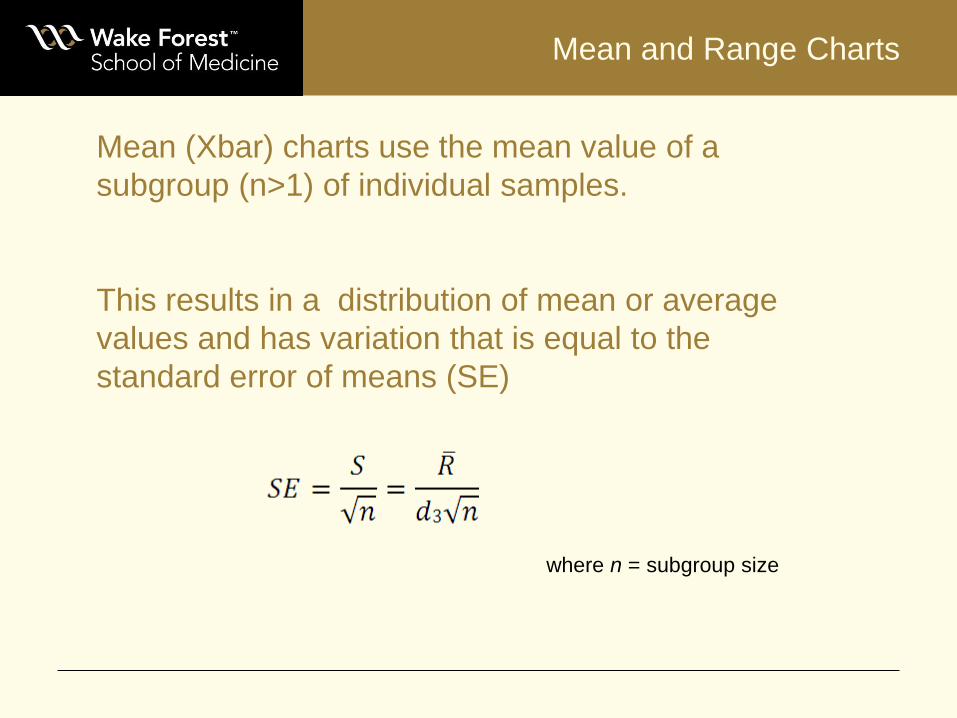
Mean (Xbar) charts use the mean value of a
subgroup (n>1) of individual samples.
This results in a distribution of mean or average
values and has variation that is equal to the
standard error of means (SE)
where n = subgroup size
Mean and Range Charts
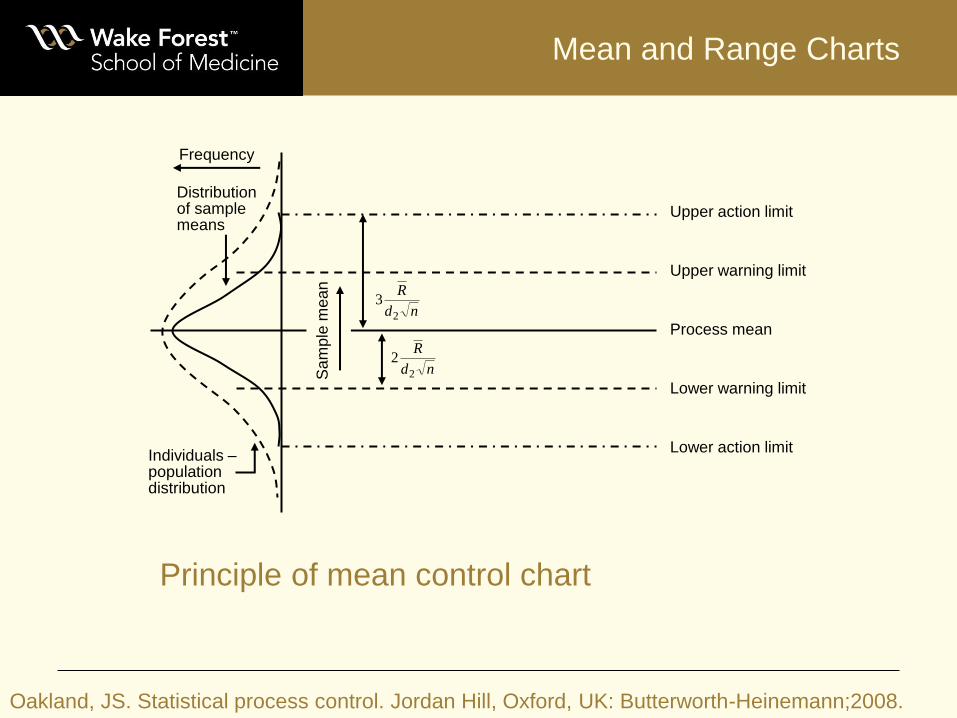
Principle of mean control chart
Oakland, JS. Statistical process control. Jordan Hill, Oxford, UK: Butterworth-Heinemann;2008.
Frequency
Distribution of sample means
Individuals – population distribution
Lower action limit
Lower warning limit
Upper warning limit
Upper action limit
Process mean
nd
R
2
3
nd
R
2
2
Sa
mp
le m
ean

Mean and Range Charts
Typical formulation of control limits for the Mean Chart
UALnd
RxAu
2
3
TxxAT
tc1
LALnd
RxAl
2
3
where T= number of subgroups

Mean and Range Charts
Range (R) charts use the range value from the
subgroup (n>1) of individual samples.
This results in a distribution of range values that
is asymmetrical about the mean and positively
skewed.
where Rt = |xtmax – xtmin| and T= number of subgroups
UALRd
dRl
2
331
TRRRT
tc1
LALRd
dRu
2
331
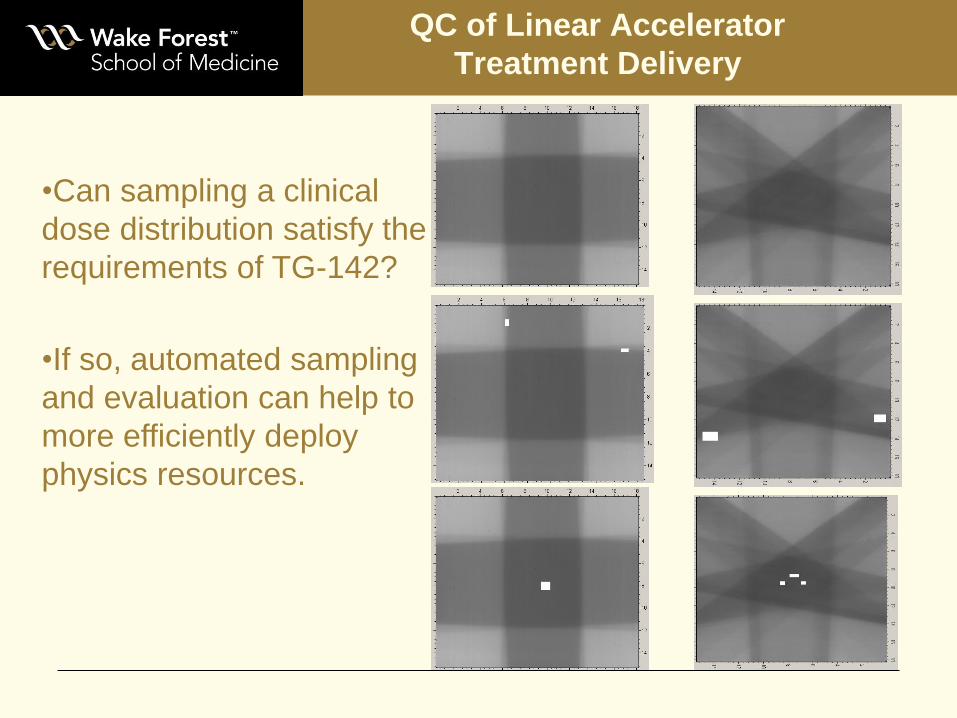
•Can sampling a clinical
dose distribution satisfy the
requirements of TG-142?
•If so, automated sampling
and evaluation can help to
more efficiently deploy
physics resources.
QC of Linear Accelerator
Treatment Delivery
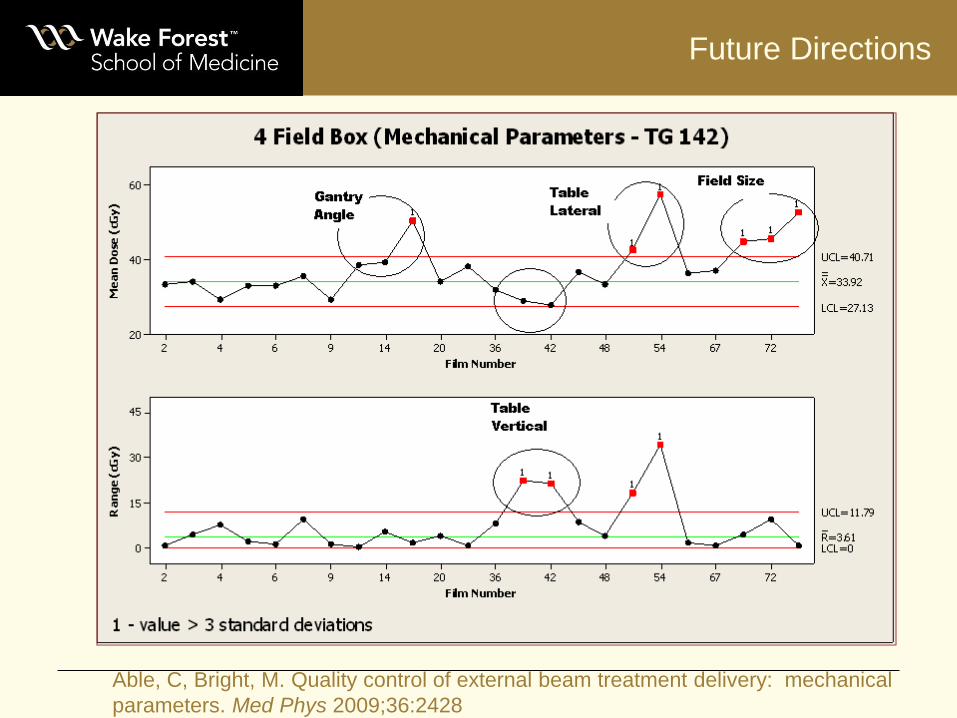
Future Directions
Able, C, Bright, M. Quality control of external beam treatment delivery: mechanical
parameters. Med Phys 2009;36:2428
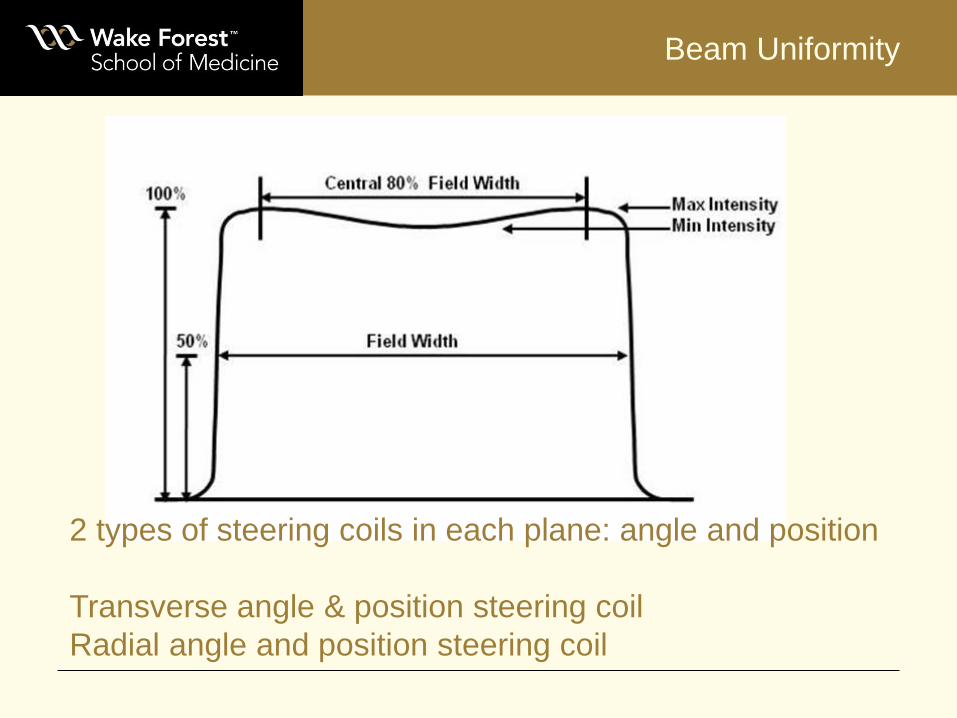
Beam Uniformity
2 types of steering coils in each plane: angle and position
Transverse angle & position steering coil
Radial angle and position steering coil
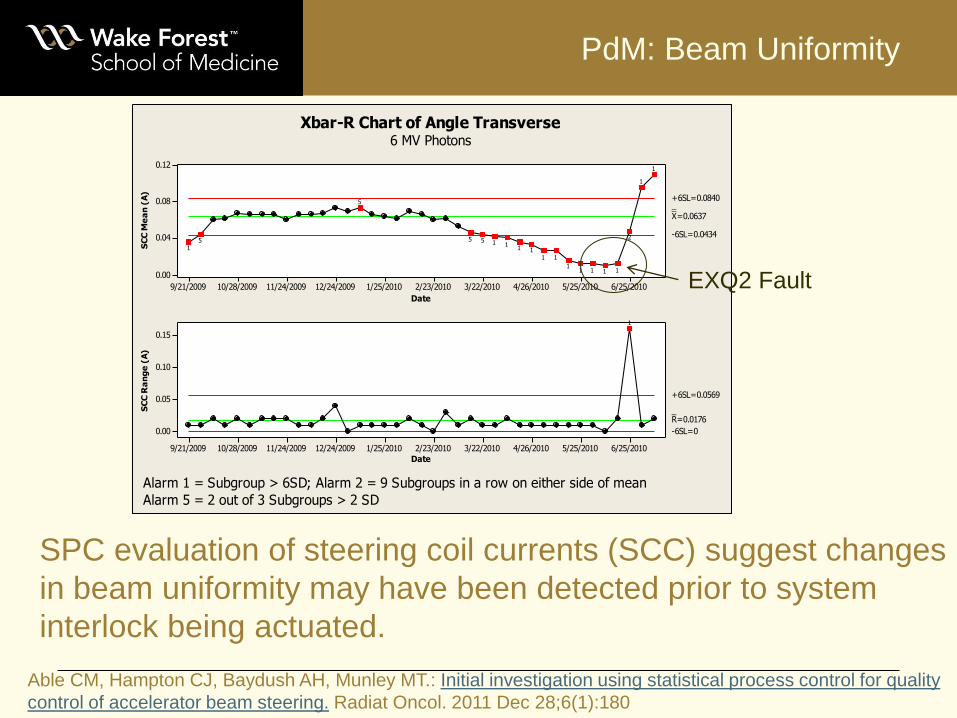
PdM: Beam Uniformity
6/25/20105/25/20104/26/20103/22/20102/23/20101/25/201012/24/200911/24/200910/28/20099/21/2009
0.12
0.08
0.04
0.00
Date
SC
C M
ea
n (
A)
__X=0.0637
+6SL=0.0840
-6SL=0.0434
6/25/20105/25/20104/26/20103/22/20102/23/20101/25/201012/24/200911/24/200910/28/20099/21/2009
0.15
0.10
0.05
0.00
Date
SC
C R
an
ge
(A
)
_R=0.0176
+6SL=0.0569
-6SL=0
1
1
2
11111
1111
1155
5
51
1
6 MV Photons
Alarm 1 = Subgroup > 6SD; Alarm 2 = 9 Subgroups in a row on either side of mean
Xbar-R Chart of Angle Transverse
Alarm 5 = 2 out of 3 Subgroups > 2 SD
EXQ2 Fault
SPC evaluation of steering coil currents (SCC) suggest changes
in beam uniformity may have been detected prior to system
interlock being actuated.
Able CM, Hampton CJ, Baydush AH, Munley MT.: Initial investigation using statistical process control for quality
control of accelerator beam steering. Radiat Oncol. 2011 Dec 28;6(1):180
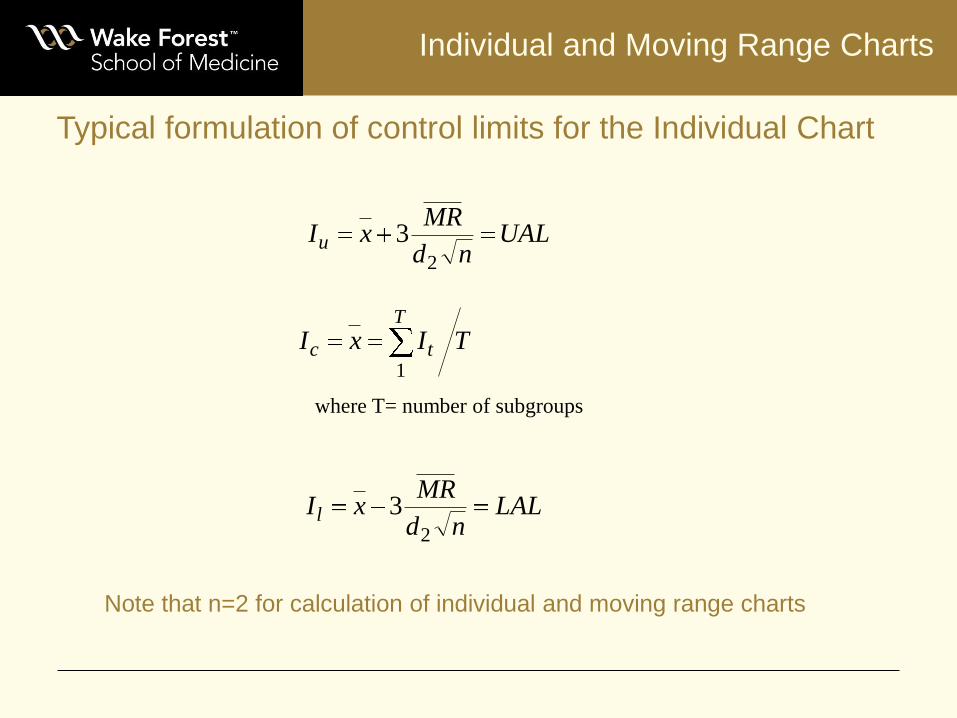
Individual and Moving Range Charts
UALnd
MRxIu
2
3
TIxIT
tc1
LALnd
MRxIl
2
3
where T= number of subgroups
Typical formulation of control limits for the Individual Chart
Note that n=2 for calculation of individual and moving range charts

Individual and Moving Range Charts
UALMRd
dMRu
2
331
11
1
TMRMRMRT
tc
LALMRd
dMRl
2
331
where MRt = |It – It+1| and T= number of subgroups
Typical formulation of control limits for the Moving Range Chart
Note that n=2 for calculation of individual and moving range charts
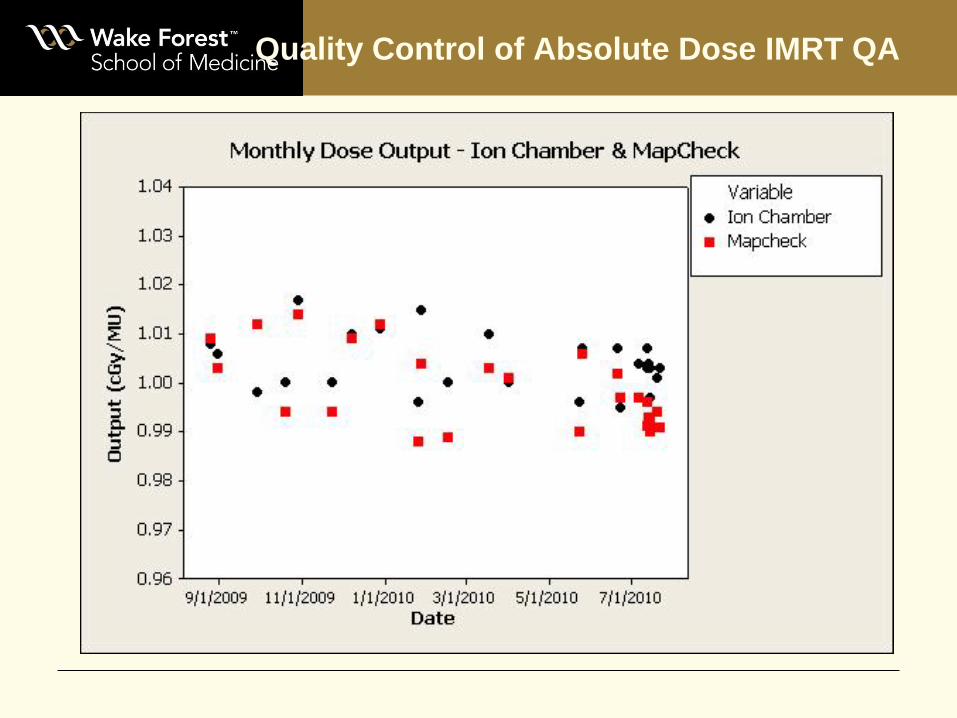
Quality Control of Absolute Dose IMRT QA
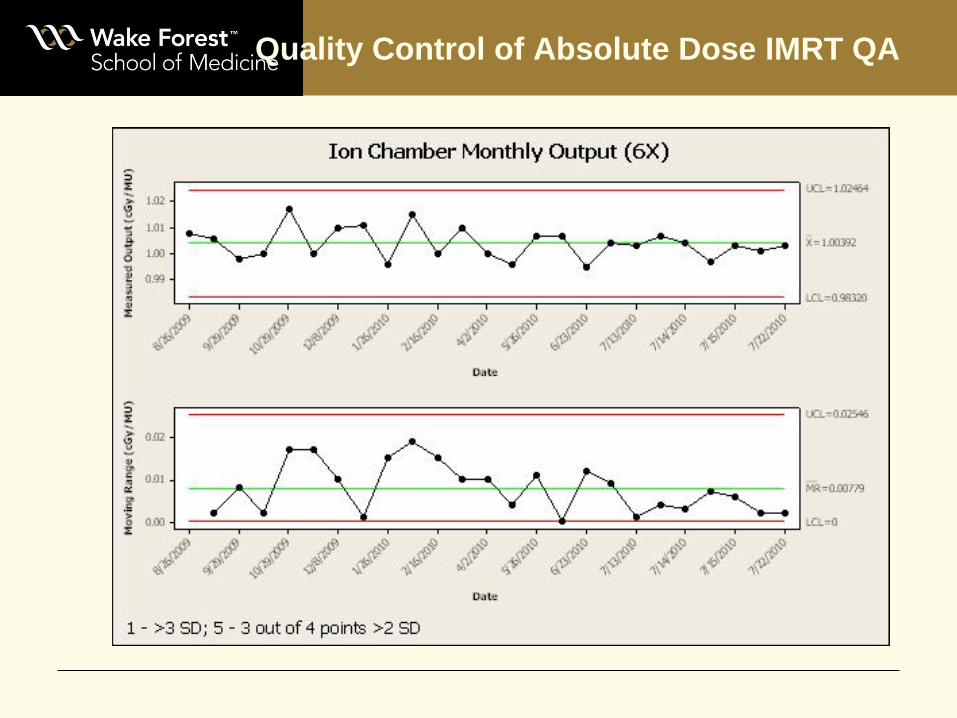
Quality Control of Absolute Dose IMRT QA

Quality Control of Absolute Dose IMRT QA
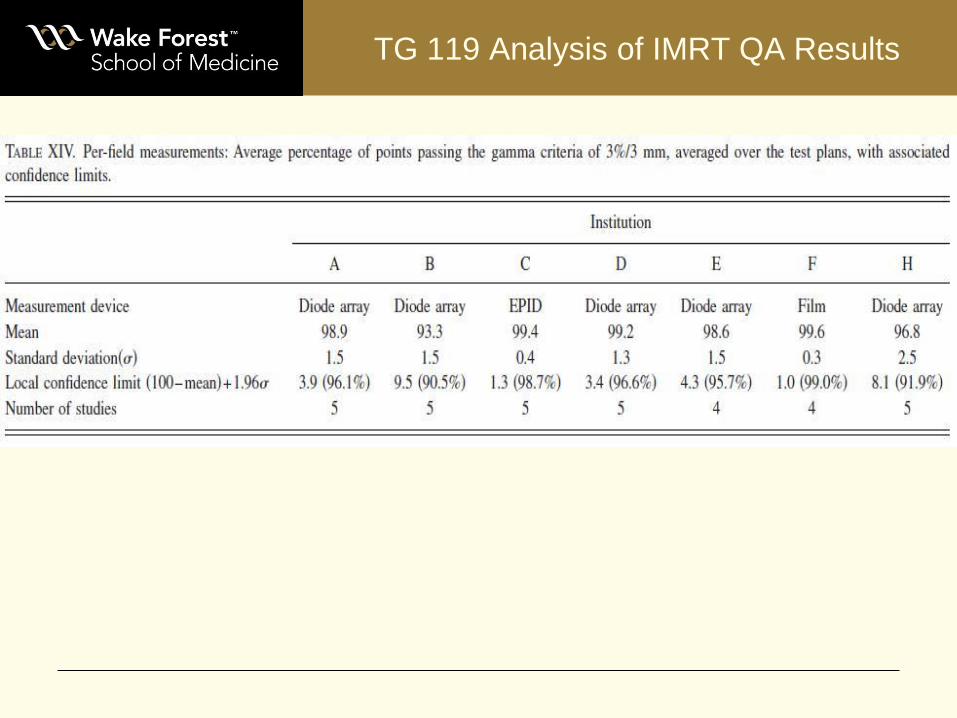
TG 119 Analysis of IMRT QA Results
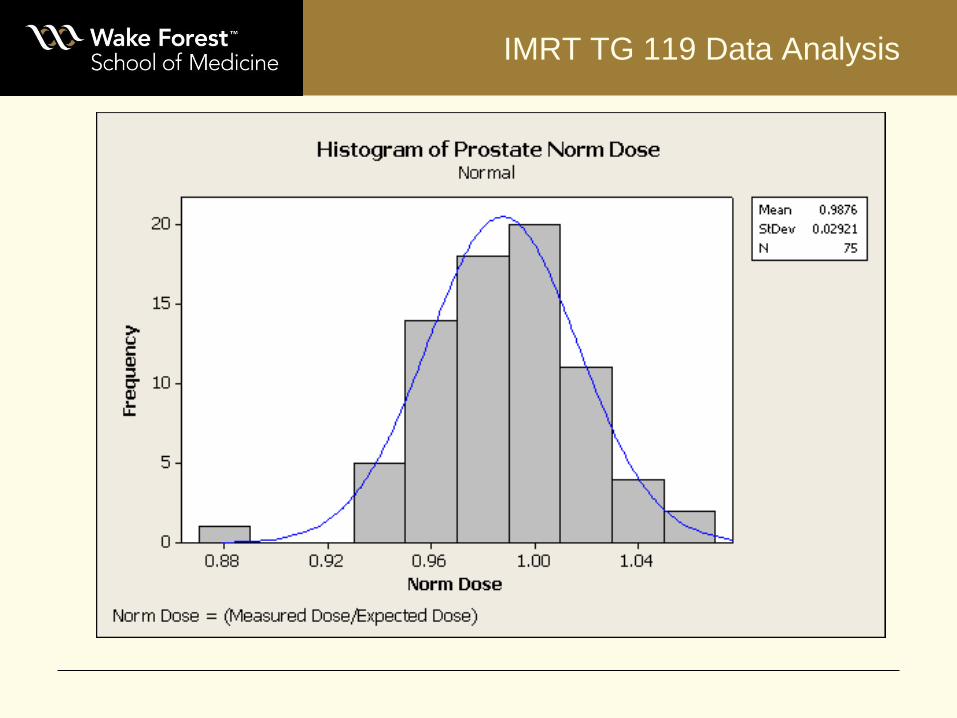
IMRT TG 119 Data Analysis

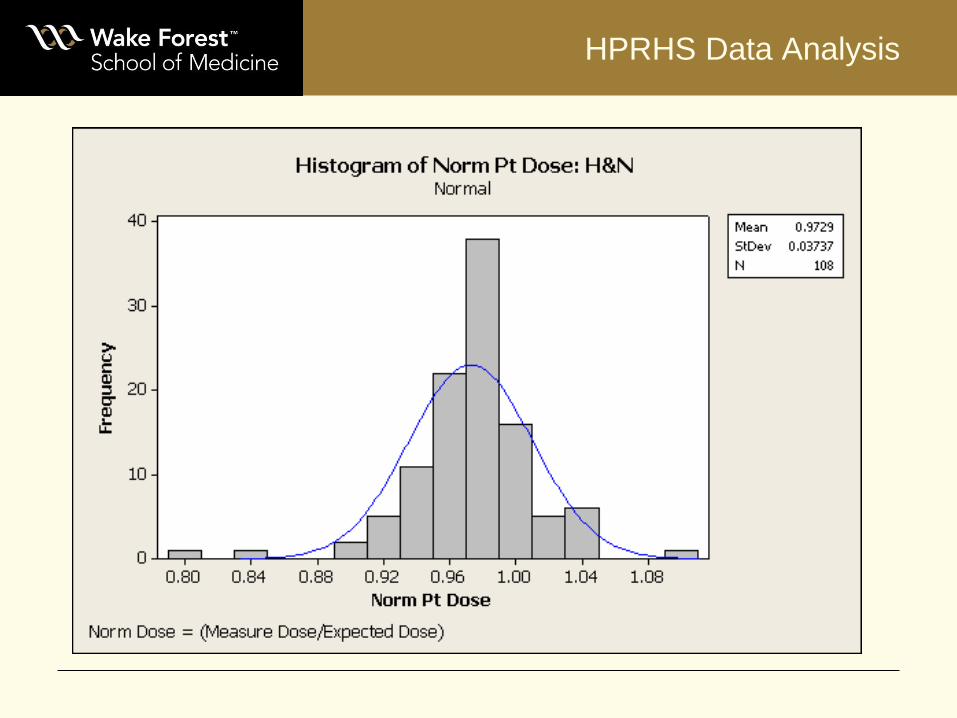
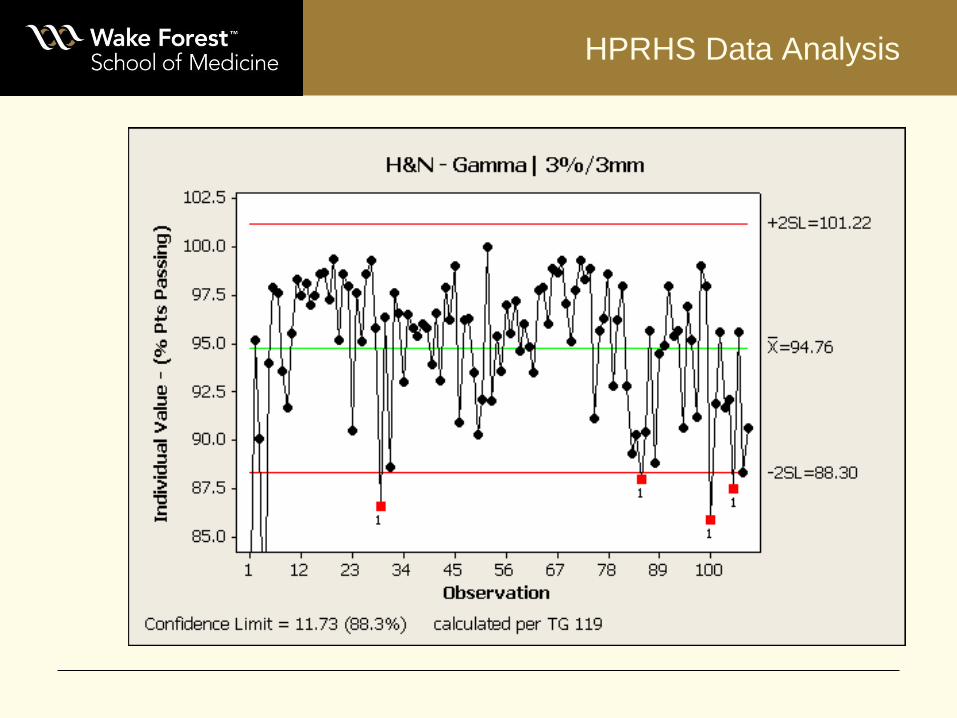
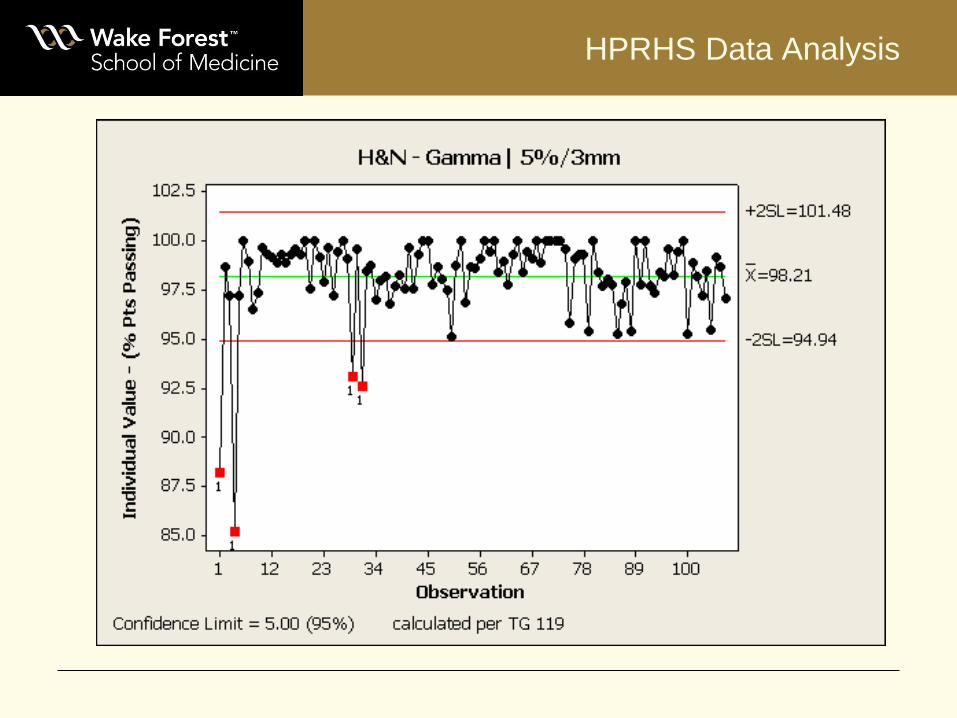
HPRHS Data Analysis
HPRHS Data Analysis
HPRHS Data Analysis
HPRHS Data Analysis

Summary of Results
HPRHS Results
Mean = 95.9
SD = 2.9
Confidence limit = 9.8(90.2%)
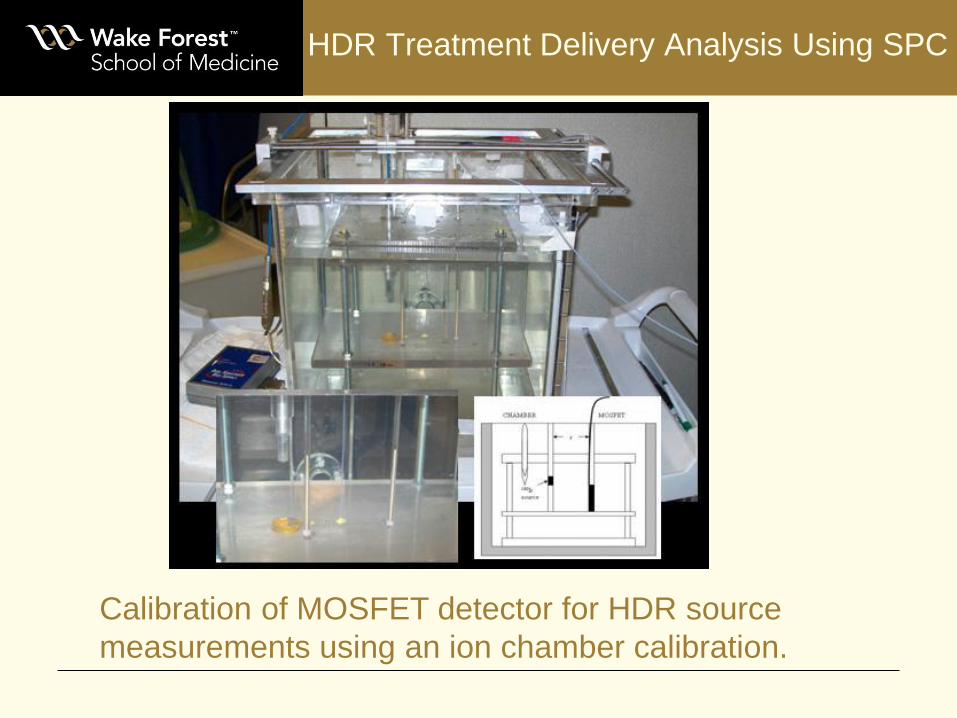
HDR Treatment Delivery Analysis Using SPC
Calibration of MOSFET detector for HDR source
measurements using an ion chamber calibration.

HDR Treatment Delivery Analysis Using SPC
HDR Treatment Delivery Analysis Using SPC
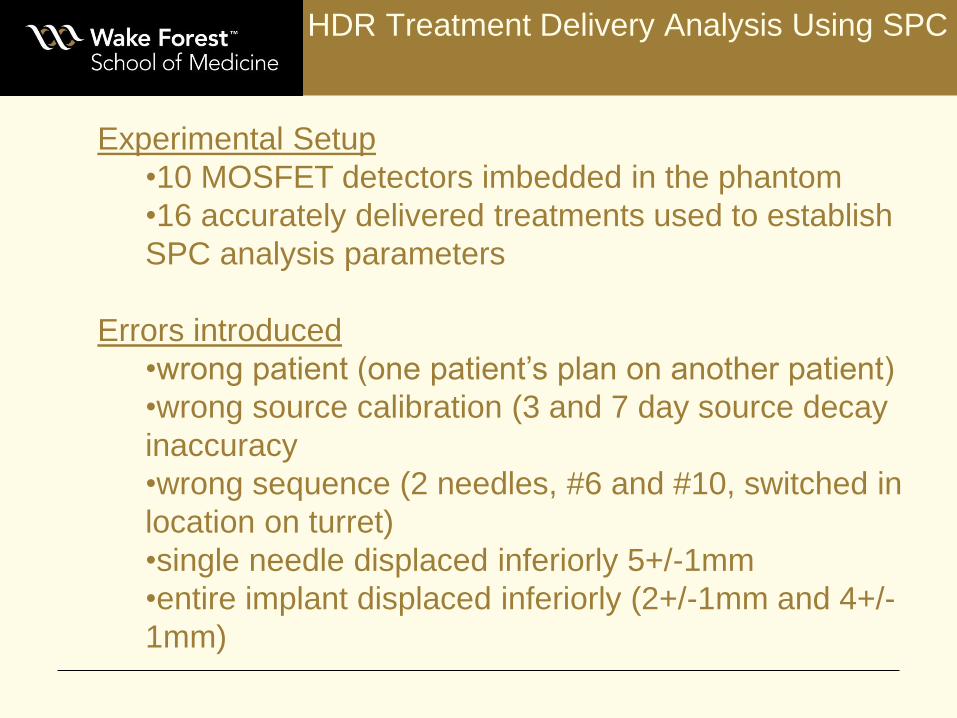
Experimental Setup
•10 MOSFET detectors imbedded in the phantom
•16 accurately delivered treatments used to establish
SPC analysis parameters
Errors introduced
•wrong patient (one patient’s plan on another patient)
•wrong source calibration (3 and 7 day source decay
inaccuracy
•wrong sequence (2 needles, #6 and #10, switched in
location on turret)
•single needle displaced inferiorly 5+/-1mm
•entire implant displaced inferiorly (2+/-1mm and 4+/-
1mm)

HDR Treatment Delivery Analysis Using SPC
170
180
190
200
210
220
230
240
0 5 10 15 20 25 30 35
Me
as
ure
d D
os
e (
cG
y)
Measurement Number
Lower Left Apex Individual Dose Chart
Accurate DoseInaccurate DoseUpper LimitCenter LineLower Limit
All treatment delivery errors were detected at this location
with exception of 3 day source calibration error.
HDR Treatment Delivery Analysis Using SPC
-10
0
10
20
30
40
50
60
0 5 10 15 20 25 30 35
Me
as
ure
Do
se
Ra
ng
e (
cG
y)
Measurement Number
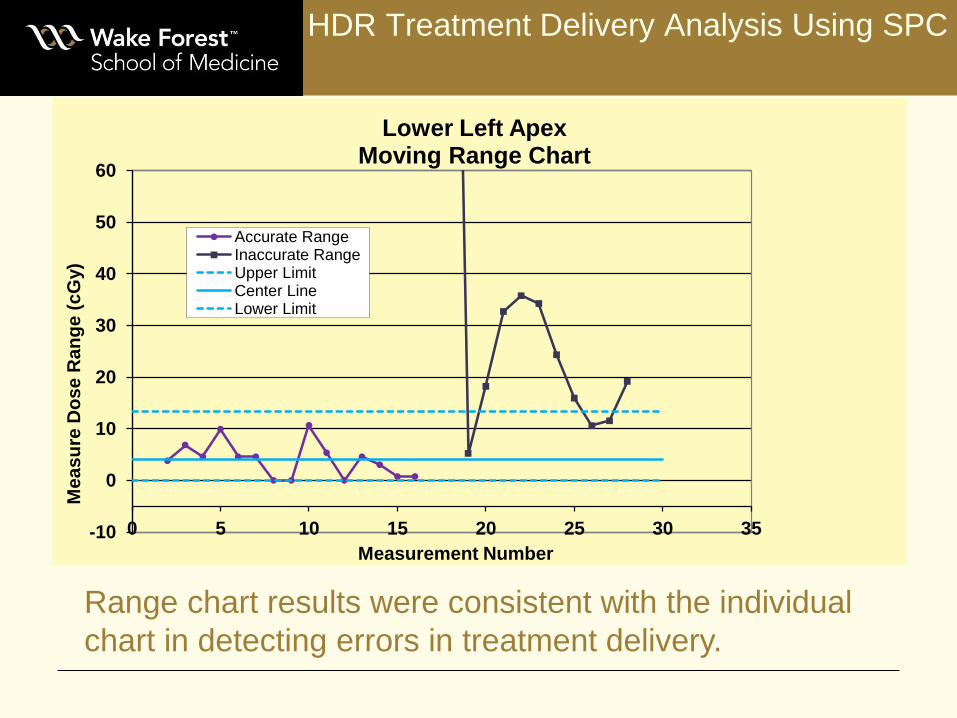
Lower Left Apex Moving Range Chart
Accurate RangeInaccurate RangeUpper LimitCenter LineLower Limit
Range chart results were consistent with the individual
chart in detecting errors in treatment delivery.

1. SPC is an accessible methodology for quality
control in radiation oncology.
2. Mean and Range chart evaluation as well as
Individual and Moving Range charts are used for
quality control analysis of continuous data
3. A wide range of applications for these tools exist in
radiation oncology
Summary

References
1. Oakland, JS. Statistical process control. Jordan Hill, Oxford, UK: Butterworth-
Heinemann;2008.
2. Stapenhurst, T. Mastering statistical process control. Jordan Hill, Oxford, UK:
Butterworth-Heinemann; 2005.
3. Burr, IW: The effect of non-normality on constants for Xbar and R Charts.
Industrial Quality Control 1996, May: 565-569.
4. Manual on quality control of materials. American Society for Testing and
Materials ;Philadelphia, PA, USA; 1951.
5. Pawlicki T, Mundt AJ. Quality in radiation oncology. Med Phys 2007;34:1529-
1534.
6. Pawlicki T, Whitaker M. Variation and control of process behavior. Int J Radiat
Oncol Biol Phys 2008;71 Supplement 1:S210-S214.
7. Pawlicki T, Whitaker M, Boyer A. Statistical process control for radiotherapy
quality assurance. Med Phys 2005;32:2777-2786.
8. Ezzell GA, Burmeister JW, Dogan, N, et al. lMRT commissioning: Multiple
institution planning and dosimetry comparisons, a report from AAPM Task
Group 119. Med Phys 2009;36:5359-5373.

References
9. Able, C, Bright, M. Quality control of external beam treatment delivery:
mechanical parameters. Med Phys 2009;36:2428
10. Able CM, Hampton CJ, Baydush AH, Munley MT.: Initial investigation using
statistical process control for quality control of accelerator beam steering.
Radiation Oncology 2011 6:180
11. Able, C.M., Bright, M., Frizzell, B.: “Quality Control of High-Dose-Rate
Brachytherapy: Treatment Delivery Analysis Using Statistical Process Control”,
Brachytherapy 9, S64-S65 (2010).

Thank You!
¡Gracias!
Grazie!
Merci!
Asante!
Vielen Dank!