clinical relevance of genetic alterations in acute ... · clinical relevance of genetic alterations...
TRANSCRIPT

Clinical Relevance of Genetic Alterations in Acute Lymphoblastic Leukemia in
Children with Down syndrome
Trudy BuiTenkamp

Clinical relevance of Genetic alterations in acute Lymphoblastic Leukemia in Children
with down syndrome
Copyright © T.D. Buitenkamp, the Netherlands 2014
Cover: Trudy Buitenkamp, Mieke Fraussen
Printed by: Optima Grafische Communicatie Rotterdam
ISBN/EAN: 978-94-6169-522-2
No part of this thesis may be reproduced, stored in a retrieval system or transmitted in any
form or by any means, without written permission of the author or, when appropriate, of the
publishers of the publications.
The work described in this thesis was performed at the Department of Paediatric Oncology/
Haematology of the Erasmus Medical Centrum, Sophia Children’s Hospital, Rotterdam, the
Netherlands. This work was funded by KinderenKankervrij (KIKA) and the Paediatric Oncol-
ogy Foundation Rotterdam (KOCR)
Publication of this thesis was financially supported by:
Erasmus Universtity Rotterdam, Stichting Kinderoncologisch Centrum Rotterdam, MRC Hol-
land and AMGEN BV.
HollandMLPA®
MRC-

Clinical Relevance of Genetic Alterations in Acute Lymphoblastic Leukemia in Children
with Down syndrome
Klinische relevantie van genetische afwijkingen in Acute Lymfatische Leukemie bij kinderen met het syndroom
van Down.
Proefschrift
Ter verkrijging van de graad van doctor aan de
Erasmus Universiteit Rotterdam
op gezag van de rector magnificus
Prof.dr. H.A.P. Pols
en volgens besluit van het college voor Promoties.
De openbare verdediging zal plaatsvinden op
woensdag 2 juli 2014 om 15: 30 uur
Door
Trudy Dina Buitenkamp
geboren te Ten Post

prOmOTieCOmmiSSie:
Promotor: Prof.dr. R. Pieters
Overige leden: Prof.dr. M.L den Boer
Prof.dr. P.C. Huijgens
Dr. M.W.J. Fornerod
Copromotoren: Dr. C.M. Zwaan
Dr. M.M. van de Heuvel-Eibrink

“Life isn’t about waiting for the storm to pass,it’s learning to dance in the rain.”
Voor Martijn & Sterre


COnTenTS
Chapter 1. General Introduction 9
Chapter 2. Acute Lymphoblastic Leukemia in children with Down syndrome: a retrospective analysis from the Ponte di Legno study group
23
Blood. 2014 Jan 2; 123(1): 70-7
Chapter 3. Methotrexate-induced side effects are not due to differences in pharmacokinetics In children with Down syndrome and Acute Lymphoblastic Leukemia
49
Haematologica. 2010 Jul; 95(7): 1106-13
Chapter 4. Frequency and prognostic implications of JAK 1-3 aberrations in Down syndrome acute lymphoblastic and myeloid leukemias
69
Leukemia. 2011 Aug; 25(8): 1365-8
Chapter 5. Outcome in children with Down syndrome and Acute Lymphoblastic Leukemia and IKZF1 deletions and CRLF2 aberrations
85
Leukemia. 2012 Oct; 26(10): 2204-11
Chapter 6. BTG1 deletions do not predict outcome in Down syndrome Acute Lymphoblastic leukemia
119
Leukemia. 2013 Jan; 27(1): 251-2
Chapter 7. Down syndrome acute lymphoblastic leukemia is characterized by loss of ETS-related gene (ERG) repression
127
Manuscript in preparation
Chapter 8. General Discussion and Future Perspectives 151
Chapter 9. Summary Samenvatting 173
Chapter 10. About the author 185
Curriculum Vitae 187
List of publications 189
PhD Portfolio 191
Dankwoord 193
Affiliations co-authors 201
List of abbreviations 197


1 General Introduction


11
CHAPTER 1
1nOrmaL hemaTOpOieSiS and Leukemia
Hematopoiesis encompasses the process by which mature peripheral blood cells are
generated by differentiation of hematopoietic stem cells (HSC) in the bone marrow (BM).
The daughter cells of HSC’s, progenitor cells, can each commit to the myeloid or lymphoid
differentiation pathways that lead to the production of one or more specific types of ma-
ture blood cells. These cells are then released in the peripheral blood. The myeloid lineage
generates platelets, erythrocytes, granulocytes (basophils, neutrophils and eosinophils) and
monocytes, whereas the lymphoid lineage differentiates into T and B-lymphocytes (Figure
1).1,2
Leukemia is a comprehensive term covering a spectrum of malignant hematological
diseases originating from hematopoietic precursor cells and affecting the hematopoietic
system and extra-medullary sites. The initial lineage of the leukemic cells defines the type
of leukemia. In general, leukemic blasts originate from either the lymphoid lineage resulting
in lymphoblastic leukemia, or from the myeloid lineage causing myeloid leukemia, although
mixed lineage leukemias/bi-phenotypic leukemias exist. Both lymphoid and myeloid leuke-
mia can be further subdivided into acute and chronic leukemias. Acute leukemia is character-
Mul$potent progenitor cells
Common lymphoid progenitor cells Common myeloid progenitor cells
Self renewal
Natural killer cell Small lymphocyte
B-‐lymphocyte T-‐lymphocyte
Plasma cell
Megakaryocyte Erythrocyte Mest cell Myeoloblast
Thrombocyte
Basophil Monocyte
Macrophage
Neutrophil Eosinophil
Pluripotent hematopoie$c stem cells
Figure 1. Schematic representation of the different lineages and stages during normal hematopoiesisThe development of blood cells from a bone marrow pluripotent hematopoietic stem cell to mature cells of different lineages.
CHAPTER 1
12
ized by a maturation arrest, followed by rapid clonal expansion of highly immature malignant
precursor cells in the BM and blood. In chronic leukemia, malignant cells accumulate due
to hyper-proliferation without a clear maturation arrest, and usually develop more slowly.
Subsequently, normal hematopoiesis fails and patients suffer from the absence of normal
blood cells resulting in symptoms such as anemia, paleness, fatigue, fever, infections, bruis-
ing and petechiae.
Pediatric Acute Lymphoblastic Leukemia
Worldwide, more than 200,000 children are diagnosed with cancer every year.3 In the Nether-
lands, 500-600 children are diagnosed with cancer annually. Leukemia is the most common
type of cancer in children, comprising approximately 30% of all childhood malignancies
(DCOG registration 2006-2011). Acute lymphoblastic leukemia (ALL) accounts for ~75% of all
childhood leukemias, and can be subdivided in precursor B-cell ALL (BCP-ALL; ~85%) and in
ALL originating from the T-cell lineage (T ALL; ~15%). The proportion of acute myeloid leu-
kemia (AML) is ~18%, and the very rare other myeloid malignancies, such as myelodysplastic
syndrome (MDS), juvenile myelomonocytic leukemia (JMML) or chronic myeloid leukemia
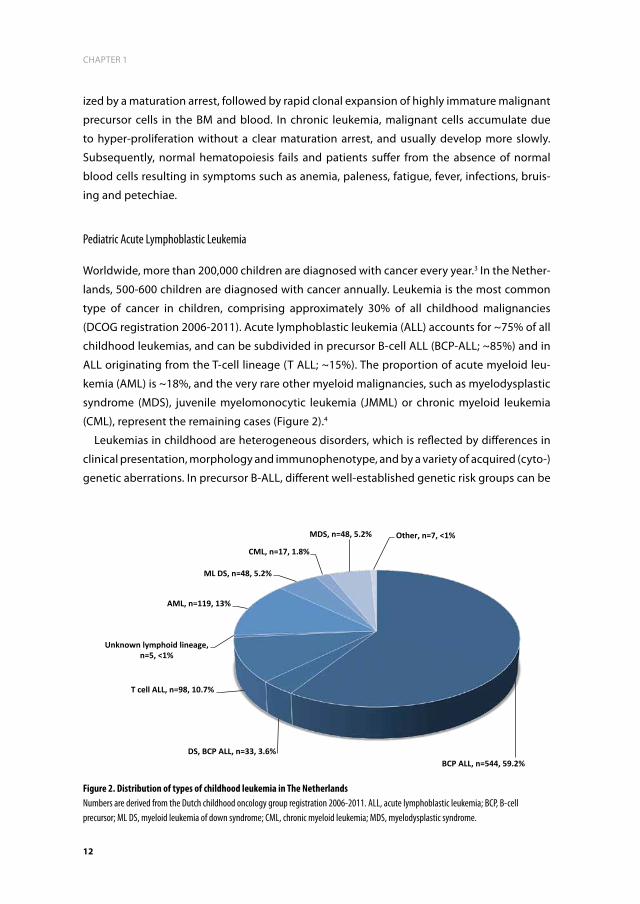
(CML), represent the remaining cases (Figure 2).4
Leukemias in childhood are heterogeneous disorders, which is reflected by differences in
clinical presentation, morphology and immunophenotype, and by a variety of acquired (cyto-)
genetic aberrations. In precursor B-ALL, different well-established genetic risk groups can be
BCP ALL, n=544, 59.2% DS, BCP ALL, n=33, 3.6%
T cell ALL, n=98, 10.7%
Unknown lymphoid lineage, n=5, <1%
AML, n=119, 13%
ML DS, n=48, 5.2%
CML, n=17, 1.8%
MDS, n=48, 5.2% Other, n=7, <1%
Figure 2. Distribution of types of childhood leukemia in The Netherlands Numbers are derived from the Dutch childhood oncology group registration 2006-2011. ALL, acute lymphoblastic leukemia; BCP, B-cell precursor; ML DS, myeloid leukemia of down syndrome; CML, chronic myeloid leukemia; MDS, myelodysplastic syndrome.

13
CHAPTER 1
1distinguished. The favorable risk group includes cases with abnormalities such as t(12;21)
(p13;q22) [ETV6-RUNX1] and high hyperdiploidy (HeH) (51-65 chromosomes), especially
when extra copies of chromosome 4 and 10 are present.5-9 The unfavorable abnormalities
include translocations such as t(9;22)(q34;q11) [BCR-ABL1] and t(4;11)(q21;q23) [MLL-AF4].6-9
The World Health Organisations’ (WHO) classification of childhood ALL is defined by these
genetic aberrations in combination with an immunophenotypic classification based on the
different maturation stages in B lymphocyte development (Table 1).10 These cytogenetic
abnormalities are essential for risk group stratification in treatment protocols.5
The remaining cases are patients with genetically unclassified disease and referred to as
’B-Other’ ALL, comprising ~25% of pediatric B-cell precursor-ALL.11-13 Interestingly, the avail-
ability of new genome-wide screening techniques led to the discovery of a large new genetic
subgroup, referred to as ‘BCR-ABL1 like’.11,69 These leukemias have a similar gene expression
profile as BCR-ABL1 positive ALL, but lack the typical BCR-ABL1 translocation. Moreover, over
70% of these ‘BCR-ABL1 like’ cases have abnormalities in B-cell differentiation genes, includ-
ing the IKZF1, PAX5 and EBF1 genes. The prognosis of ‘BCR-ABL1 like’ patients is poor, as they
merely reach an event free survival (EFS) of 50-70%.11,14
Treatment of Acute Lymphoblastic Leukemia
In recent decennia, ALL therapy has become very effective, now resulting in an overall sur-
vival of ~85% for children diagnosed with ALL and treated with risk-stratified combination
chemotherapy.15-18 In the Netherlands, children with ALL are currently treated according to
the Dutch Childhood Oncology Group (DCOG) ALL-11 treatment protocol, which opened
in 2013 and followed the previous ALL-10 protocol. Both protocols use a Berlin-Frankfurt-
Münster Group (BFM) backbone,19 consisting of an initial consolidation (protocol 1B) phase,
an interim maintenance phase, a reinduction (delayed intensification) phase followed by
maintenance therapy.
Table 1. The WHO classification of B cell ALL based on immunophenotype and genotype
immunophenotype Cd19 Cd10 cy μ sur μ Genotype
Pro B-cell ALL + - - - MLL-AF4, MLL-ENL
Common B-cell ALL + + - - ETV6-RUNX1, BCR-ABL1
Pre B-cell ALL + + + - E2A-PBX
WHO, world health organization; CD, cluster of differentiation; Cy, cytoplasmic; sur, surface; ALL, acute lymphoblastic leukemia.

CHAPTER 1
14
dOwn SyndrOme and Leukemia
Down syndrome
Down syndrome (DS) is considered one of the most common chromosomal abnormalities in
the normal population,20 with a prevalence of ~320 live births in the Netherlands.21,22 Despite
the increasing age at which women deliver their first child in Europe, this prevalence has
decreased over the past decades due to increased screening and termination of DS pregnan-
cies.23
DS is caused by trisomy of chromosome 21 (Hsa21), which is the result of abnormal division
of chromosomes (non-disjunction) in the first or second meiotic division of the oocyte (80-
95%) or the sperm cell (5-20%), or occasionally during mitotic division.23-25 These DS children
(95%) carry trisomy 21 in all their cells. However, ~5% of DS children have phenotypically
none or fewer symptoms, which is a result of 1) mosaicism, i.e. that not all cells carry an ad-
ditional chromosome 21, or 2) due to a Robertsonian translocation, where the participating
chromosomes, usually chromosome 14 and 21, break at their centromeres and the long (q)
arms fuse to form a single chromosome with a single centromere.25
Typically, DS patients have characteristic clinical features, such as an up-slant of the eyes, a
protruding tongue, a single crease of the hand palm, and a sandal gap deformity of the feet.
Most DS children show cognitive impairment, although this varies in severity.23 DS children
carry an increased risk to encounter a wide variety of complex medical problems including
congenital cardiac anomalies, anatomical abnormalities of the gastrointestinal tract, autoim-
mune phenomena such as hypothyroidism and coeliac disease, a vulnerability to recurrent
bacterial and viral complications due to an impaired immune system, and an increased risk of
hematological malignancies.23,26-30 The life expectancy of DS children is primarily dependent
on the risk of morbidity and mortality in the first year of life.23
Leukemia in Down syndrome
DS children have an increased risk of developing leukemia as compared to non-DS children,
which was already recognized in the 1930s.31-34 This increased risk of leukemia includes both
the risk for ALL, which is approximately 20-fold higher, as well as for myeloid leukemia of DS
(ML DS), which is 150-fold higher.32 Leukemic disease from the myeloid lineage consists of 2
entities, i.e. transient myeloproliferative disorder (TMD) and ML DS. TMD is a clonal disease
that is characterized by immature megakaryoblasts in the fetal liver and peripheral blood.35,36
In absolute numbers, ALL affects ~5 and ML DS ~8 DS children each year in the Netherlands
every year (DCOG registration 2006-2011, Figure 2). The true incidence of TMD is not known,
as the course of TMD is uncomplicated and asymptomatic in the vast majority of cases, a
diagnosis of TMD is often missed prior to its spontaneous remission. Probably TMD occurs in

15
CHAPTER 1
1less than 10% of newborns with DS, which is based on the finding of GATA1 mutations (see
below) in 590 Guthrie cards in 4% of newborn DS children.37 The strong predisposition for DS
children to develop acute leukemias is as yet not completely understood. Remarkably, the
general risk for developing cancer in DS individuals is not increased, as there is a reduced
propensity for solid tumors, and even a decreased frequency of secondary malignancies
after treatment for prior leukemia.32,38 Hence, DS is not a cancer susceptibility but a leukemia
susceptible syndrome.
DS-ALL patients are different from ALL patients without DS (non-DS ALL) in presenting
characteristics. For instance, in DS-ALL there is a lower frequency of T cell ALL, and ALL never
occurs in DS infants (<1 year).8,39-41 Moreover, in DS ALL, favorable subtypes such as high
hyperdiploidy and ETV6-RUNX1, as well as the unfavorable characteristics such as MLL rear-
rangements and the Philadelphia-chromosome [BCR-ABL1] occur less frequent.6-9 In addition,
there is a relatively large group of DS ALL patients (~40%) without known cytogenetic aber-
rations.9 It is unknown whether this group comprises ‘BCR-ABL1 like’ patients, and leukemias
with abnormalities of B-cell differentiation genes, as this has not been studied in DS ALL.
ML DS is characterized by a unique acquired mutation in the globin transcription factor 1
(GATA1).42-44 These mutations are disease specific and therefore can be used as a marker for
MRD.35 It is unknown whether such a unique genetic event also exists in DS ALL. Recently
new molecular aberrations such as mutations of Janus Kinase 2 (JAK2) and rearrangements of
Cytokine Receptor Like Factor 2 (CRLF2) were reported to occur in DS ALL, but later they were
also identified in non-DS high-risk ALL.45-55 Their role in DS and non-DS ALL pathogenesis is
uncertain, as it is unknown whether they are true leukemia initiating events. To unravel the
cytogenetic profile of DS ALL, it is needed to search with new techniques on a molecular
level. Furthermore, as all published series are small, large series are needed to determine the
prognostic relevance of well-established cytogenetic and novel molecular aberrations, and
to study clinical relevant outcome parameters in DS ALL, thereby allowing a sufficient sample
size to draw meaningful conclusions.
The outcome of DS ALL patients has been reported to be at best similar and often inferior
to that of non-DS ALL patients.6-8,39,41,56-58 This is in sharp contrast to ML DS patients, who
have an excellent prognosis compared to other AML types, based on a very unique chemo-
sensitivity profile with enhanced sensitivity to most AML drugs.59,60 Moreover, TMD often
resolves without therapy, although early death occurs in 10-20% of the affected children.61,62
The biological basis for the reduced probability of survival in DS ALL is not fully understood.
A study from the Children’s Oncology Group reported that DS ALL patients treated in SR arms
had an inferior outcome, while patients treated in HR arms had similar outcome as compared
to non-DS ALL patients.8 It is therefore questionable whether the National Cancer Institute
classification is appropriate for risk-group stratification in DS ALL. It may also suggest that
DS ALL cells are relatively resistant to chemotherapy. This is reflected in a small number of
cellular cytotoxicity assays showing that DS ALL cells do not have increased sensitivity to

CHAPTER 1
16
chemotherapy in vitro; indicating that reduction of therapy for DS-ALL patients may not
be possible in contrast to ML DS.60 However, intensification of therapy in these vulnerable
patients may neither be feasible nor desirable given the increased risk of treatment-related
morbidity and mortality.
Worldwide, DS ALL patients are treated according to the same protocols as their non-DS
ALL counterparts, although dose reductions of Methotrexate and / or Anthracyclines are
frequently applied This is different from ML DS patients, who are treated according to specific
ML DS regimens with reduced treatment intensity in some countries.63,64
It is well known that DS ALL patients have a higher susceptibility to the toxic side effects and
to treatment related mortality (TRM) compared to non-DS ALL children.58,65,66 It is conceivable
therefore that attempts to decrease morbidity and TRM by reduction of treatment intensity
in individual DS ALL patients may have contributed to their inferior outcome.67 For instance,
it is well known that DS-ALL patients are more susceptible to MTX induced side effects than
non-DS-ALL patients.58,65,66,68 However, it is not known whether the enhanced susceptibility
for MTX induced side effects is due to the difference in cellular sensitivity (for instance of the
mucosa), but whether it also the reflects differences in pharmacokinetics between DS-ALL
and non- DS-ALL patients. Moreover it is unknown whether the risk for TRM is related to a
specific treatment phase or chemotherapeutic agent.
In order to guide subgroup directed therapy and the development of novel therapies, the
frequency and prognostic relevance of conventional and new (cyto-) genetic aberrations
needs to be established in large series of DS ALL, despite the caveat of heterogeneity in treat-
ment over time and between different study groups. Furthermore, molecular insight into the
pathogenesis of DS ALL is necessary, and this could be achieved by identifying novel (and
drugable) molecular abnormalities that characterize DS ALL.
OuTLine Of ThiS TheSiS
In this thesis we studied the clinical and biological features of DS ALL that determine
prognosis (chapter 2-3). Although DS children have an increased risk of developing ALL, it
remains a rare disease and almost all published series lack sufficient power to draw mean-
ingful conclusions. Therefore, in chapter 2, we performed a large retrospective study within
the international childhood ALL Ponte-di-Legno working group, with the aim to determine
clinical relevant outcome parameters, the prognostic relevance of well-established (cyto-)
genetic and novel molecular aberrations, and causes of treatment failure in DS ALL. Chapter
3 describes the results of a retrospective case-control study, which defined whether the well-
known enhanced susceptibility for MTX-induced side effects is the result of differences in
pharmacokinetics between DS-ALL and non-DS ALL patients.
17
CHAPTER 1
1In chapter 4-7 we report on the results of several genome wide techniques to identify spe-
cific molecular aberrations involved in the pathogenesis of DS ALL. In chapter 4, we searched
for mutations in the kinase and pseudokinase domains of Janus Kinase (JAK) 1-3 by direct
sequencing in order to identify novel aberrations. Moreover, we analyzed the prognostic
significance of JAK2 mutations in DS ALL in our cohort, and included a meta-analysis of all
published data. In chapter 5, results of the array comparative genomic hybridization and
multiplex ligation-dependent probe amplification studies to determine the frequency and
prognostic significance of abnormalities in B-cell development and differentiation genes in a
population based DCOG DS ALL cohort are presented, which was validated with DS ALL pa-
tients from UK trials. Chapter 6 reports a study on the frequency of BTG1 deletions in a large
series of DS ALL patients and describes the prognostic significance of these abnormalities.
In chapter 7 we show the results of gene-expression profiling to determine whether DS ALL
can be characterized by differentially expressed genes and pathways as compared to non-DS
ALL. Chapter 8 provides the general discussion of this thesis and includes future perspectives
for further research. Chapter 9 contains the summary in English and the layman’s summary
in Dutch.

CHAPTER 1
18
referenCeS
1. Sachs L. The control of hematopoiesis and leukemia: from basic biology to the clinic. Proceedings of the National Academy of Sci-ences of the United States of America. 1996; 93(10): 4742-4749.
2. Handin R, Lux S, Stossel T. Blood: principles and practice of hematology. Vol. 1, 2nd edition. Philadelphia, PA, USA: Lipincott, Williams and Wilkins; 2003.
3. Jemal A, Siegel R, Xu J, Ward E. Cancer statis-tics, 2010. CA: a cancer journal for clinicians. 2010; 60(5): 277-300.
4. Passmore SJ, Chessells JM, Kempski H, Hann IM, Brownbill PA, Stiller CA. Paediatric myelodysplastic syndromes and juvenile myelomonocytic leukaemia in the UK: a population-based study of incidence and survival. British journal of haematology. 2003; 121(5): 758-767.
5. Pui CH, Carroll WL, Meshinchi S, Arceci RJ. Biology, risk stratification, and therapy of pediatric acute leukemias: an update. Jour-nal of clinical oncology : official journal of the American Society of Clinical Oncology. 2011; 29(5): 551-565.
6. Chessells JM, Harrison CJ, Watson SL, Vora AJ, Richards SM, Medical Research Council Working Party on Childhood L. Treatment of infants with lymphoblastic leukaemia: results of the UK Infant Protocols 1987-1999. Br J Haematol. 2002; 117(2): 306-314.
7. Maloney KW, Carroll WL, Carroll AJ, et al. Down syndrome childhood acute lympho-blastic leukemia has a unique spectrum of sentinel cytogenetic lesions that influences treatment outcome: a report from the Chil-dren’s Oncology Group. Blood. 2010; 116(7): 1045-1050.
8. Whitlock JA, Sather HN, Gaynon P, et al. Clini-cal characteristics and outcome of children with Down syndrome and acute lympho-blastic leukemia: a Children’s Cancer Group study. Blood. 2005; 106(13): 4043-4049.
9. Forestier E, Izraeli S, Beverloo B, et al. Cyto-genetic features of acute lymphoblastic and myeloid leukemias in pediatric patients with Down syndrome: an iBFM-SG study. Blood. 2008; 111(3): 1575-1583.
10. Schrappe M. PR. Acute Lymphoblastic Leu-kemia. Paediatric Oncology. London: Arnold; 2004: 230-253.
11. Den Boer ML, van Slegtenhorst M, De Menezes RX, et al. A subtype of childhood acute lymphoblastic leukaemia with poor treatment outcome: a genome-wide clas-sification study. Lancet Oncol. 2009; 10(2): 125-134.
12. Pieters R, Carroll WL. Biology and treatment of acute lymphoblastic leukemia. Pediatric clinics of North America. 2008; 55(1): 1-20, ix.
13. Pui CH, Relling MV, Downing JR. Acute lymphoblastic leukemia. The New England journal of medicine. 2004; 350(15): 1535-1548.
14. van der Veer A, Waanders E, Pieters R, et al. Independent prognostic value of BCR-ABL1-like signature and IKZF1 deletion, but not high CRLF2 expression, in children with B-cell precursor ALL. Blood. 2013; 122(15): 2622-2629.
15. Kamps WA, van der Pal-de Bruin KM, Veer-man AJ, Fiocco M, Bierings M, Pieters R. Long-term results of Dutch Childhood Oncology Group studies for children with acute lymphoblastic leukemia from 1984 to 2004. Leukemia. 2010; 24(2): 309-319.
16. Pui CH, Evans WE. Treatment of acute lymphoblastic leukemia. The New England journal of medicine. 2006; 354(2): 166-178.
17. Pui CH, Pei D, Sandlund JT, et al. Long-term results of St Jude Total Therapy Studies 11, 12, 13A, 13B, and 14 for childhood acute lymphoblastic leukemia. Leukemia 2010; 24(2): 371-382.
18. Gatta G, Botta L, Rossi S, et al. Childhood cancer survival in Europe 1999-2007: results of EUROCARE-5--a population-based study. The lancet oncology. 2014; 15(1): 35-47.

19
CHAPTER 1
1 19. Schrappe M, Reiter A, Zimmermann M, et al.
Long-term results of four consecutive trials in childhood ALL performed by the ALL-BFM study group from 1981 to 1995. Berlin-Frankfurt-Munster. Leukemia. 2000; 14(12): 2205-2222.
20. Down JL. Observations on an ethnic clas-sification of idiots. 1866. Mental retardation. 1995; 33(1): 54-56.
21. Weijerman ME, van Furth AM, Vonk Noor-degraaf A, van Wouwe JP, Broers CJ, Gemke RJ. Prevalence, neonatal characteristics, and first-year mortality of Down syndrome: a national study. J Pediatr. 2008; 152(1): 15-19.
22. de Graaf G, Haveman M, Hochstenbach R, et al. Changes in yearly birth prevalence rates of children with Down syndrome in the pe-riod 1986-2007 in The Netherlands. Journal of intellectual disability research : JIDR. 2011; 55(5): 462-473.
23. Roizen NJ, Patterson D. Down’s syndrome. Lancet. 2003; 361(9365): 1281-1289.
24. Lejeune J, Gautier M, Turpin R. [Study of somatic chromosomes from 9 mongoloid children]. Comptes rendus hebdomadaires des seances de l’Academie des sciences. 1959; 248(11): 1721-1722.
25. Modi D, Berde P, Bhartiya D. Down syn-drome: a study of chromosomal mosaicism. Reproductive biomedicine online. 2003; 6(4): 499-503.
26. Tolksdorf M, Wiedemann HR. Clinical aspects of Down’s syndrome from infancy to adult life. Human genetics Supplement. 1981; 2: 3-31.
27. Bloemers BL, van Bleek GM, Kimpen JL, Bont L. Distinct abnormalities in the innate immune system of children with Down syn-drome. The Journal of pediatrics. 2010; 156(5): 804-809, 809 e801-809 e805.
28. Kusters MA, Verstegen RH, de Vries E. Down syndrome: is it really characterized by precocious immunosenescence? Aging and disease. 2011; 2(6): 538-545.
29. Kusters MA, Verstegen RH, Gemen EF, de Vr-ies E. Intrinsic defect of the immune system
in children with Down syndrome: a review. Clinical and experimental immunology. 2009; 156(2): 189-193.
30. Ram G, Chinen J. Infections and immuno-deficiency in Down syndrome. Clinical and experimental immunology. 2011; 164(1): 9-16.
31. Fong CT, Brodeur GM. Down’s syndrome and leukemia: epidemiology, genetics, cytoge-netics and mechanisms of leukemogenesis. Cancer Genet Cytogenet. 1987; 28(1): 55-76.
32. Hasle H, Clemmensen IH, Mikkelsen M. Risks of leukaemia and solid tumours in individuals with Down’s syndrome. Lancet. 2000; 355(9199): 165-169.
33. James R, Lightfoot T, Simpson J, Moorman AV, Roman E, Kinsey S. Acute leukemia in children with Down’s syndrome: the impor-tance of population based study. Haemato-logica. 2008; 93(8): 1262-1263.
34. Yang Q, Rasmussen SA, Friedman JM. Mortal-ity associated with Down’s syndrome in the USA from 1983 to 1997: a population-based study. Lancet. 2002; 359(9311): 1019-1025.
35. Pine SR, Guo Q, Yin C, et al. GATA1 as a new target to detect minimal residual disease in both transient leukemia and mega-karyoblastic leukemia of Down syndrome. Leukemia research. 2005; 29(11): 1353-1356.
36. Zipursky A. Transient leukaemia--a benign form of leukaemia in newborn infants with trisomy 21. British journal of haematology. 2003; 120(6): 930-938.
37. Pine SR, Guo Q, Yin C, Jayabose S, Druschel CM, Sandoval C. Incidence and clinical im-plications of GATA1 mutations in newborns with Down syndrome. Blood. 2007; 110(6): 2128-2131.
38. Hasle H. Pattern of malignant disorders in in-dividuals with Down’s syndrome. The lancet oncology. 2001; 2(7): 429-436.
39. Dordelmann M, Schrappe M, Reiter A, et al. Down’s syndrome in childhood acute lym-phoblastic leukemia: clinical characteristics and treatment outcome in four consecutive BFM trials. Berlin-Frankfurt-Munster Group. Leukemia. 1998; 12(5): 645-651.

CHAPTER 1
20
40. Pieters R, Schrappe M, De Lorenzo P, et al. A treatment protocol for infants younger than 1 year with acute lymphoblastic leukaemia (Interfant-99): an observational study and a multicentre randomised trial. Lancet. 2007; 370(9583): 240-250.
41. Zeller B, Gustafsson G, Forestier E, et al. Acute leukaemia in children with Down syndrome: a population-based Nordic study. Br J Haematol. 2005; 128(6): 797-804.
42. Kuhl C, Atzberger A, Iborra F, Nieswandt B, Porcher C, Vyas P. GATA1-mediated megakaryocyte differentiation and growth control can be uncoupled and mapped to different domains in GATA1. Molecular and cellular biology. 2005; 25(19): 8592-8606.
43. Li Z, Godinho FJ, Klusmann JH, Garriga-Canut M, Yu C, Orkin SH. Developmental stage-selective effect of somatically mutated leukemogenic transcription factor GATA1. Nature genetics. 2005; 37(6): 613-619.
44. Muntean AG, Crispino JD. Differential requirements for the activation domain and FOG-interaction surface of GATA-1 in megakaryocyte gene expression and devel-opment. Blood. 2005; 106(4): 1223-1231.
45. Bercovich D, Ganmore I, Scott LM, et al. Mu-tations of JAK2 in acute lymphoblastic leu-kaemias associated with Down’s syndrome. Lancet. 2008; 372(9648): 1484-1492.
46. Gaikwad A, Rye CL, Devidas M, et al. Prevalence and clinical correlates of JAK2 mutations in Down syndrome acute lym-phoblastic leukaemia. Br J Haematol. 2009; 144(6): 930-932.
47. Kearney L, Gonzalez De Castro D, Yeung J, et al. Specific JAK2 mutation (JAK2R683) and multiple gene deletions in Down syndrome acute lymphoblastic leukemia. Blood. 2009; 113(3): 646-648.
48. Mullighan CG, Zhang J, Harvey RC, et al. JAK mutations in high-risk childhood acute lymphoblastic leukemia. Proc Natl Acad Sci U S A. 2009; 106(23): 9414-9418.
49. Cario G, Zimmermann M, Romey R, et al. Presence of the P2RY8-CRLF2 rearrange-
ment is associated with a poor prognosis in non-high-risk precursor B-cell acute lymphoblastic leukemia in children treated according to the ALL-BFM 2000 protocol. Blood. 2010; 115(26): 5393-5397.
50. Ensor HM, Schwab C, Russell LJ, et al. Demo-graphic, clinical, and outcome features of children with acute lymphoblastic leukemia and CRLF2 deregulation: results from the MRC ALL97 clinical trial. Blood. 2011; 117(7): 2129-2136.
51. Harvey RC, Mullighan CG, Chen IM, et al. Rearrangement of CRLF2 is associated with mutation of JAK kinases, alteration of IKZF1, Hispanic/Latino ethnicity, and a poor outcome in pediatric B-progenitor acute lymphoblastic leukemia. Blood. 2010; 115(26): 5312-5321.
52. Hertzberg L, Vendramini E, Ganmore I, et al. Down syndrome acute lymphoblastic leukemia, a highly heterogeneous disease in which aberrant expression of CRLF2 is associated with mutated JAK2: a report from the International BFM Study Group. Blood. 2010; 115(5): 1006-1017.
53. Mullighan CG, Collins-Underwood JR, Phil-lips LA, et al. Rearrangement of CRLF2 in B-progenitor- and Down syndrome-associated acute lymphoblastic leukemia. Nat Genet. 2009; 41(11): 1243-1246.
54. Russell LJ, Capasso M, Vater I, et al. Deregu-lated expression of cytokine receptor gene, CRLF2, is involved in lymphoid transforma-tion in B-cell precursor acute lymphoblastic leukemia. Blood. 2009; 114(13): 2688-2698.
55. Yoda A, Yoda Y, Chiaretti S, et al. Functional screening identifies CRLF2 in precursor B-cell acute lymphoblastic leukemia. Proc Natl Acad Sci U S A. 2010; 107(1): 252-257.
56. Bassal M, La MK, Whitlock JA, et al. Lympho-blast biology and outcome among children with Down syndrome and ALL treated on CCG-1952. Pediatr Blood Cancer. 2005; 44(1): 21-28.
57. Arico M, Ziino O, Valsecchi MG, et al. Acute lymphoblastic leukemia and Down syn-

21
CHAPTER 1
1drome: presenting features and treatment outcome in the experience of the Italian Association of Pediatric Hematology and Oncology (AIEOP). Cancer. 2008; 113(3): 515-521.
58. Shah N, Al-Ahmari A, Al-Yamani A, Dupuis L, Stephens D, Hitzler J. Outcome and toxicity of chemotherapy for acute lymphoblastic leukemia in children with Down syndrome. Pediatr Blood Cancer. 2009; 52(1): 14-19.
59. Taub JW, Stout ML, Buck SA, et al. Myelo-blasts from Down syndrome children with acute myeloid leukemia have increased in vitro sensitivity to cytosine arabinoside and daunorubicin. Leukemia. 1997; 11(9): 1594-1595.
60. Zwaan CM, Kaspers GJ, Pieters R, et al. Differ-ent drug sensitivity profiles of acute myeloid and lymphoblastic leukemia and normal pe-ripheral blood mononuclear cells in children with and without Down syndrome. Blood. 2002; 99(1): 245-251.
61. Gamis AS, Alonzo TA, Gerbing RB, et al. Natural history of transient myeloprolifera-tive disorder clinically diagnosed in Down syndrome neonates: a report from the Chil-dren’s Oncology Group Study A2971. Blood. 2011; 118(26): 6752-6759; quiz 6996.
62. Klusmann JH, Creutzig U, Zimmermann M, et al. Treatment and prognostic impact of transient leukemia in neonates with Down syndrome. Blood. 2008; 111(6): 2991-2998.
63. Lange BJ, Kobrinsky N, Barnard DR, et al. Distinctive demography, biology, and outcome of acute myeloid leukemia and myelodysplastic syndrome in children with Down syndrome: Children’s Cancer Group
Studies 2861 and 2891. Blood. 1998; 91(2): 608-615.
64. Ravindranath Y, Abella E, Krischer JP, et al. Acute myeloid leukemia (AML) in Down’s syndrome is highly responsive to chemo-therapy: experience on Pediatric Oncology Group AML Study 8498. Blood. 1992; 80(9): 2210-2214.
65. Peeters M, Poon A. Down syndrome and leukemia: unusual clinical aspects and unexpected methotrexate sensitivity. Eur J Pediatr. 1987; 146(4): 416-422.
66. Taub JW, Ge Y. Down syndrome, drug me-tabolism and chromosome 21. Pediatr Blood Cancer. 2005; 44(1): 33-39.
67. Bohnstedt C, Levinsen M, Rosthoj S, et al. Physicians compliance during maintenance therapy in children with Down syndrome and acute lymphoblastic leukemia. Leuke-mia. 2013; 27(4): 866-870.
68. Garre ML, Relling MV, Kalwinsky D, et al. Pharmacokinetics and toxicity of methotrex-ate in children with Down syndrome and acute lymphocytic leukemia. J Pediatr. 1987; 111(4): 606-612.
69. Mullighan CG, Su X, Zhang J, et al. Deletion of IKZF1 and prognosis in acute lymphoblastic leukemia. N Engl J Med. 2009;360(5):470-480.


2Acute lymphoblastic leukemia in children with Down syndrome: a retrospective analysis from the Ponte di Legno study group
T.D. Buitenkamp, S. Izraeli, M. Zimmermann, E. Forestier, N.A.
Heerema, M.M. van den Heuvel-Eibrink, R. Pieters, C.M. Korbijn,
L.B. Silverman, K. Schmiegelow, D.C. Liang, K. Horibe, M. Arico, A.
Biondi, G. Basso, K.R. Rabin, M. Schrappe, G. Cario, G. Mann, M.
Morak, R. Panzer-Grümayer, V. Mondelaers, T. Lammens, H. Cave, B.
Stark, I. Ganmore, A.V. Moorman, A. Vora, S.P. Hunger, C.H. Pui, C.G.
Mullighan, A. Manabe, G. Escherich, J.R. Kowalczyk, J.A. Whitlock,
and C.M Zwaan
Blood. 2014 Jan 2; 123(1): 70-7.

aBSTraCT
Children with Down syndrome (DS) have an increased risk of B-cell precursor acute lym-
phoblastic leukemia (BCP-ALL). The prognostic factors and outcome of DS-ALL patients
treated in contemporary protocols are uncertain. We studied 653 DS-ALL patients enrolled
in 16 international trials from 1995-2004. Non-DS BCP-ALL patients from the DCOG and
BFM were reference cohorts. DS-ALL patients had a higher 8-year cumulative incidence of
relapse (26±2% vs. 15±1%; p<0.001) and 2-year treatment-related mortality (TRM) (7±1%
vs. 2.0±<1%; p<0.0001) than non-DS patients, resulting in lower 8-year event-free survival
(EFS) (64±2% vs. 81±2%; p<0.0001) and overall survival (74±2% vs. 89±1%; p<0.0001). Inde-
pendent favorable prognostic factors include age<6 years (hazard ratio [HR]=0.58, p=0.002),
white blood cell count (WBC) <10x109/L (HR=0.60, p=0.005) and ETV6-RUNX1 (HR=0.14;
p=0.006) for EFS, age (HR=0.48, p<0.001), ETV6-RUNX1 (HR 0.1, p=0.016) and high hyperdip-
loidy (HeH) (HR 0.29, p=0.04) for relapse-free survival. TRM was the major cause of death in
ETV6-RUNX1 and HeH DS-ALLs. Thus while relapse is the main contributor to poorer survival
in DS-ALL, infection-associated TRM was increased in all protocol elements, unrelated to
treatment-phase or regimen. Future strategies to improve outcome in DS-ALL should include
improved supportive care throughout therapy, and reduction of therapy in newly identified
good-prognosis subgroups.

25
CHAPTER 2
2
inTrOduCTiOn
Children with Down syndrome (DS) are predisposed to develop acute myeloid leukemia
(AML) and acute lymphoblastic leukemia (ALL),1 which are characterized by unique biological
features in comparison with those of non-DS ALL.2-4
Children with DS-ALL have an inferior outcome compared to non-DS patients because
of both higher treatment related mortality (TRM) and higher relapse rate.5-9 As attempts to
decrease TRM by reducing treatment intensity may contribute to the increased risk of relapse
in DS-ALL, it is important to determine whether the risk for TRM is related to a specific treat-
ment phase or chemotherapeutic agent.8-10 Small series suggest that DS-ALL patients have an
increased risk of mucositis from methotrexate, myelosuppression from anthracyclines, and
hyperglycemia from glucocorticoids.10-16 Acquired leukemic cell genetic abnormalities have
important prognostic significance in non-DS childhood ALL.17 However, the impact of these
abnormalities on treatment outcome in DS-ALL is unknown, as all published series lack a suf-
ficient sample size to draw clear conclusions. Even the prognostic significance of well-known
good prognostic factors in non-DS ALL such as the t(12;21)(p13;q22) [ETV6-RUNX1], high
hyperdiploidy (HeH) and trisomies 4&10 is uncertain in DS-ALL, as well as for the unfavorable
translocations including the t(9;22)(q34;q11) [BCR-ABL1] and t(4;11)(q21;q23) [MLL-AF4].2 Of
interest, these prognostic genetic features have a lower frequency in DS-ALL.2,7,18,19
Recently, genetic abnormalities such as JAK2 mutations20 and CRLF2 rearrangements have
been identified in both DS and non-DS ALL.3,4,20-27 Activating JAK2 R683 mutations were
found in ~18% of DS-ALL patients.20,24 Rearrangements of CRLF2 occurred in ~60% of DS-ALL
patients and in fewer than 10% of non-DS ALL patients.3,4,23 In almost all instances JAK2 (or
rarely JAK1, or IL7R) mutations were associated with CRLF2 gene rearrangements, suggesting
a model by which CRLF2 overexpression results in JAK-STAT activation and proliferation of the
leukemic clone.3 Thus far, CRLF2 gene rearrangements lack prognostic relevance in DS ALL,
although all series were small.3,4,21,27
The small size of most studies in DS-ALL patients has precluded definitive answers to the
issues raised above. Hence, we undertook a large retrospective study of DS-ALL within the
International ALL “Ponte di Legno” Working Group to study clinically relevant outcome pa-
rameters, the prognostic relevance of well-established and novel (cyto-) genetic aberrations
in ALL, and causes of treatment failure, thereby allowing a sufficient sample size to draw
meaningful conclusions, despite the caveat of heterogeneity in treatment over time and
between different study groups.28

CHAPTER 2
26
paTienTS and meThOdS
Patients
Patients eligible for this study were enrolled in various national or collaborative group clinical
trials between January 1, 1995 and December 31, 2004, were ≤18 years at diagnosis and were
treated with curative intent. The Institutional Review Boards of each participating center
approved treatment protocols according to the local law and guidelines. Participating study
groups and their number of patients are mentioned in Supplementary Table S1. A predefined
set of data was collected, consisting of clinical data obtained at diagnosis, treatment, and
cytogenetic and molecular data (Supplementary Table S2).
DS-ALL patients were treated according to standard ALL treatment protocols, but
modifications of the standard protocol did occur. None of the protocols provided specific
supportive care measures for DS-ALL children. In total, 42.3% (n=276) DS-ALL patients re-
ceived a reduced dose of chemotherapy. Most of these dose-reductions (79%) were planned
prior to the administration of specific courses of chemotherapy and gradually increased by
observed clinical toxicity. Modifications for MTX consisted of dose-reductions of high dose
MTX, varying from 10-75% of the maximum dose, and intensified leucovorin rescue. DS ALL
patients enrolled in EORTC 58951 protocols from September 2002 (n=7) received 0.5g/m2 of
MTX instead of 5g/m2. In addition, patients treated on protocol POG 9405 (n=10) started with
50% of the total dose of Daunorubicin, Cytarabine, Teniposide, HDAC and Peg-asparaginase,
which was successively increased or reduced depending on toxicity. Supplementary Table S3
provides an overview of the main chemotherapeutic agents of treatment protocols used by
the various study groups.
Data on either JAK2 R683 mutations and/or CRLF2 gene rearrangements were available
from a subset of patients (n=182) included in this study. There were no statistical differences
between patients with and without available data. Some of these data have been previously
reported.20,24,25 However, several study groups contributed new unpublished data.
Non-DS ALL reference cohort
For comparison, population-based B-cell precursor ALL reference cohorts from the DCOG
and the ALL-BFM Study Group, from exactly the same time period as the DS patients (January
1, 1995 and December 31, 2004), were added. The DCOG dataset consisted of 827 non-DS
BCP-ALL patients enrolled in 3 DCOG ALL treatment protocols (ALL-8, ALL-9 and ALL-10).
The BFM dataset consisted of 3618 non-DS BCP-ALL patients enrolled in 2 BFM treatment
protocols (BFM-95 and BFM-2000) in Germany and Austria. Details of these protocols have
been reported elsewhere, except for protocol ALL10, which is on-going.29,30

27
CHAPTER 2
2
There were no significant differences in outcome estimates, nor in the distribution of
cytogenetic subgroups, between the DCOG and BFM datasets (data not shown), nor when
compared to reported data from other participating groups.31-38 The DCOG and BFM non-DS
datasets were merged for statistical analysis.
Cytogenetic analysis
Genetic abnormalities were determined by G-, Q-, or R-banded karyotyping, fluorescence in
situ hybridization (FISH) or reverse-transcribed polymerase chain reaction (RT-PCR). Diagno-
sis of rearrangements of ETV6-RUNX1, BCR-ABL1 and MLL were based on one or more of these
techniques; diagnosis of high hyperdiploidy (HeH) was defined by modal chromosomal num-
ber ≥52 or DNA index ≥1.13 for DS-ALL patients and ≥51 chromosomes for non-DS patients.
All cytogenetic data were centrally reviewed by two co-authors (N.H. and E.F.). The definition
and description of clonal abnormalities followed the recommendations of the International
System for Human Cytogenetic Nomenclature (ISCN 2005).39
CRLF2 gene rearrangements were identified by genomic array, FISH, genomic PCR, Sanger
sequencing or Multiplex Ligation-dependent Probe Amplification.
Statistical analyses
Statistical analyses were conducted using SAS software (SAS-PC, Version 9.1). The Kaplan-
Meier method was used to estimate survival: complete remission rate (CR), event-free survival
(EFS), overall survival (OS), relapse free survival (RFS). The survival estimates were compared
using the log-rank test. The cumulative incidence of toxic death (TRM) and the cumulative
incidence of relapse (CIR) were calculated by the method of Kalbfleisch and Prentice and
compared with the use of Gray’s test. CR was defined as less than 5% blasts in the bone
marrow, with regeneration of tri-lineage hematopoiesis plus absence of leukemic cells in the
cerebrospinal fluid or elsewhere. EFS was calculated from the date of diagnosis to the date
of last follow-up or to the first event, including relapse, death in CR, failure to achieve CR
(considered as event on day 0) or second malignancy. Early death was defined as any death
within the first 6 weeks of treatment, and was considered as an event on day 0 for statistical
analysis. OS was measured from the date of diagnosis to the date of last follow-up or to the
date of death from any cause. CIR included death in CR and other events as competing events.
To compare categorical variables c2 analyses was used and the Fisher exact test was used
for small patient numbers. The non-parametric Mann-Whitney U test was applied for continu-
ous variables. P values ≤ 0.05 were considered as statistically significant (two-tailed testing).
For multivariate analysis, the Cox regression model was used. Continuous variables were
categorized according to the National Cancer Institute (NCI) risk criteria.40 P values ≤ 0.05
were considered as statistically significant (two-tailed testing).
CHAPTER 2
28
reSuLTS
Patient characteristics
In total data of 708 DS-ALL patients were collected, of which 55 were excluded because they
did not meet the inclusion criteria; i.e. the karyotype of one patient lacked constitutional
trisomy 21; 39 patients were diagnosed outside the inclusion period of the study; 2 patients
were not treated with curative intent; and the age of 9 patients was above 18 years at di-
agnosis (range 18.2 – 21.9). Furthermore, we excluded the 5 patients with T-cell ALL as this
number was considered too small for meaningful statistical analysis. However, clinical and
cyto-genetic characteristics of these 5 T-cell ALL patients are described in Supplementary
Table S4. Hence, 653 patients with DS BCP-ALL were analyzed. DS-ALL patients were slightly
older than non-DS patients at diagnosis (median 5.0 vs. 4.7 years; p=0.002) (Table 1), and
DS-ALL did not occur in infants. The initial white blood-cell count (WBC) of DS-ALL patients
was not different compared with non-DS (median 10.2x10⁹/L (range 0.2–459) vs. 8.9x10⁹/L
(range 1.7–998), p=0.14).
Genetic data
All leukemic karyotypes, FISH and RT-PCR results underwent central review; 68% (n=444) of
the DS patients had adequate genetic data (Table 1). In total, 40.3% had a cytogenetically
normal (CN) karyotype (i.e. only constitutional trisomy 21) compared to 6.9% of the non-DS
cases (p<0.001). Nine percent of DS patients had a HeH karyotype compared to 33% of non-
DS patients (p<0.001). HeH DS patients were significantly older than HeH non-DS patients
(median, 7.2 years vs. 4.2; p<0.001). Trisomies of both chromosomes 4 and 10 were found in
45% of the HeH DS-ALL patients, similar to non-DS HeH patients (42.6%; p=0.77).18,41
ETV6-RUNX1 fusion was found in 8.3% of the DS-ALL patients (compared with 25.8% in
non-DS; p<0.001), BCR-ABL1 fusion in 0.7% compared with 2.4% in non-DS (p=0.02) and MLL
rearrangements in <1% compared with 1.2% in non-DS (p=0.2). The previously reported
t(8;14)(q11.2;q32) translocation was found in DS-ALL patients only (2%).2,42,43
In total, 182 patients had available data on either JAK and/or CRLF2 aberrations. JAK2
R683 mutations were found in 21% (n=30) of the 141 DS-ALL patients with available data, of
which 83% (n=25) also had a CRLF2 gene rearrangement. In 69% (n=93) of the 134 DS-ALL
patients with available data, CRLF2 gene rearrangements were found, including 5.4% (n=6)
with IGH@-CRLF2 translocations, and 94.6% (n=87) with P2RY8-CRLF2 fusions. DS patients
with CRLF2 gene rearrangements were younger compared to DS patients with wildtype
CRLF2 (4.1 vs. 7.7 years, p<0.001), but no difference in diagnostic WBC was observed (14.8 vs.
11.8x10⁹/L, p=0.7). This differs from non-DS patients with CRLF2 gene rearrangements who

29
CHAPTER 2
2
had lower WBC (14.6 vs. 34.6x10⁹/L, p=0.004), but did not differ in age (5.1 vs. 4.7 years, p=0.7)
compared to wild-type patients (Supplementary Table S5).
Treatment outcome according to clinical data
The median follow up time was 6.8 years for DS-ALL and 8.4 years for non-DS survivors.
The CR rate was 96.7% in DS-ALL and 99% in non-DS patients (p<0.001). Induction failures
were more frequent in DS-ALL compared to non-DS (3.0% and 1.0% respectively, p<0.001).
DS patients had a higher cumulative incidence of relapse (CIR, 26±2% vs. 15±1% at 8 years;
p<0.0001), and treatment related mortality (TRM, 7±1% vs. 2±<1% at 2 years; p<0.0001) than
non-DS patients, resulting in a lower EFS (64±2% vs. 81±2% at 8 years; p<0.0001) and OS
Table 1. Patient characteristics of DS-ALL patients and the DCOG non-DS BCP ALL reference cohort
dS aLL non-dS aLL p
number 653 4445
age at diagnosis (range) 5.0 (1.2-17.9) 4.7 (0.1 - 17.9) 0.002
Sex
Male 343 2431
Female 310 2014 0.3
median initial wBC x 109/L (range) 10.5 (0.2-459) 8.8 (0.2 - 999) 0.14
extra medullary disease
CNS (%) 16/624* (2.5) 98/4258* (2.2) 0.69
Lymphnodes (%) 134/412* (32.5) 1471/4339* (33.1) 0.57
Hepatomegaly (%) 245/469* (52.2) 3156/4357* (71) <0.001
Testis (%) 1/296* (<1%) 28/4317 (<1%) 0.51
Cytogenetic subgroups
Normal karyotype 179 (40.3) 45/650* (6.9) <0.001
BCR-ABL1 t(9;22) 3 (0.7) 93/3898* (2.4) 0.02
MLL (11q23) 2 (0.5) 36/2966* (1.2) 0.15
ETV6-RUNX1 t(12;21) 37 (8.3) 841/3264* (25.8) <0.001
HeH$ 40 (9) 235/708* (33) <0.001
HeH trisomy 4 & 10 18 (4.1) 100/650* (15.4) <0.001
HeH, other 22 (5.0) 135/708* (19.1) <0.001
Others 183 (41.2) 225/650* (34.6) 0.03
8-year OS 74 ± 2% 89 ± 2% <0.001
8-year efS 64 ± 2% 81 ± 2% <0.001
8-year Cir 26 ± 2% 15 ± 1% 0,001
2-year Trm 7 ± 1% 2 ± <1% <0.001
DCOG, Dutch childhood oncology group; BCP, B-cell precursor; WBC, white blood cell count; CNS, central nervous system involvement at diagnosis (>5 WBC/ml; CNS-3); HeH$ DS: 52-60 chromosomes, non-DS 51-60 chromosomes; OS, overall survival; EFS, event-free survival; TRM, treatment-related mortality; CIR, cumulative incidence of relapse, *Number of patients available for analysis.

CHAPTER 2
30
(74±2% vs. 89±2%; p<0.0001) (Figure 1). In total, 144 DS patients relapsed compared to 650
non-DS patients. The time-to-relapse after CR was significantly longer for DS (median 2.8
years, p25: 1.8 years, p75: 4.0 years), than for non-DS patients (median 2.4 years, p25: 1.4
years, p75: 3.5 years; p=0.007). In addition, 23 DS ALL patients relapsed after 5 years versus
33 non-DS ALL patients, p<0.001. Treatment outcome did not differ significantly between the
early (1995-2000) and late treatment eras (2000-2004) for DS patients (8-year: OS 77±3% vs.
73±3%;p=0.7, CIR 26.7±3% vs. 31±6%; p=0.4).
The 379 DS-ALL children below the age of 6 years fared significantly better than the 272
older children (8-year: EFS 70±3% vs. 54±4%; p<0.0001; OS 78±2% vs. 67±3%; p=0.002,
CIR 21±2% vs. 34±3%; p=<0.001, and 2-year cumulative incidence of TRM 7±1% vs. 8±2%;
p=0.33). Notably, the 126 children aged 6-9 years had a relatively poor outcome (8-year: EFS
51±3%, OS 70±5%), which was due to a very high frequency of relapse (CIR 41±6%), not at-
tributable to any known risk factor(s). Outcome declined with increasing WBC, and was best
for the 319 patients with WBC <10x109/L due to a low risk of TRM (8-year: 4±1% vs.11±2% for
WBC ≥10x109/L; p=0.0003) and relapse (8-year: 21±3% vs. 30±3%; p=0.03). These features
thus define a favorable risk-group with age <6 years and WBC <10x109/L, when compared to
the remaining DS patients (8-year: EFS: 78±3% vs. 58±3%, p<0.0001; OS: 87±3% vs. 68±3%,
p<0.0001; CIR: 17±3% vs. 30±2%, p=0.003; 2-year TRM: 3±1% vs. 9±1%, p=0.002) (Figure 2,
Table 2). These criteria predicted outcome more accurately than the classical NCI-criteria
(Figure 3).40 These features remained significant after excluding patients with ETV6-RUNX1
rearrangements or trisomies 4&10 from the analysis. The effect of this new PdL risk stratifica-
tion was consistent among the larger study groups including AIEOP, BFM, CCG, POG, and the
0.0
0.1
0.2
0.3
0.4
0.5
0.6
0.7
0.8
0.9
1.0
0 1 2 3 4 5 6 7 8 9 10 11 12 13 14 15 years
P
0.02, SE=.00 0.07, SE=.01
0.26, SE=.02
0.15, SE=.01
0.64, SE=0.02
0.74, SE=0.02
0.81, SE=0.02
0.89, SE=0.02
EFS DS (N=653, 212 events)
Survival DS (N=653, 153 events)
EFS non-DS (N=4445, 840 events)
Survival non-DS (N=4445, 504 events) p<0.0001
p<0.0001
TRM DS (N=50)
CIR DS (N=148)
TRM non-DS (N=87)
CIR non-DS (N=650) p<0.0001
p<0.0001
Figure 1. Treatment outcome of the Down syndrome and non Down syndrome ALL patients The continuous lines represent the DS-ALL patients, the dotted lines represent the non-DS ALL patients. The 100%-black line represents overall survival, the 50%-black line event free survival, the 25%-black line the cumulative incidence of treatment-related mortality and the 75%- black line the cumulative incidence of relapse.

31
CHAPTER 2
2
UK with a HR of 1.62 for high-risk patients from the UK, and 3.79 for BFM patients. Among pa-
tients with age >6 years and WBC >10x109/L, DS patients had a poorer outcome than non-DS
patients (8-year: EFS: 58±3% vs. 78±1%, p<0.001; OS: 68±3% vs. 86±1%, p<0.001; CIR: 30±2%
vs. 17±1%, p<0.001; 2-year TRM: 10±1 vs. 2±<1%, p<0.0001). The clinical characteristics of
DS-ALL patients (n=246) classified as NCI low risk, but considered high-risk according to our
criteria are described in Supplementary Table S6.
In total, 18 (2.8%) of the DS-ALL patients received a stem-cell transplantation, 3 in CR1 and
15 in CR2. Of these patients, 6 are alive in continuous CR, and 12 patients died (1 graft versus
host disease, 1 toxic non-infectious event, 1 infection, and 9 relapsed).
Figure 2. Treatment outcome according to age and white blood cell count in Down syndrome ALLThe overall survival (A), event-free survival (B), cumulative incidence of treatment-related mortality (C) and cumulative incidence of relapse (D) are depicted for patients with age <6 years and WBC <10x109/L (black line) versus all other DS-ALL patients (grey line). The numbers on the curves for overall survival and event-free survival represent results at 8 years. The numbers on the curves for treatment related mortality are 2-year results (during treatment only) and those for relapse are results at 8 years.

CHAPTER 2
32
Treatment outcome according to genetic data
The 37 DS-ALL patients with ETV6-RUNX1 had significantly better outcome than the other DS
patients: 8-year EFS 95±4% vs. 63±3% (p=0.001), OS 97±3% vs. 75±2% (p=0.007), CIR 3±3% vs.
26±2% (p=0.004), and 2-year: TRM 3±3% vs. 8±1%; (p=0.2). DS ALL patients with ETV6-RUNX1
did not differ in outcome when compared to the 841 non-DS patients with this abnormality
(8-year: EFS 95%, p=0.48; OS 96%, p=0.91; CIR 7%, p=0.32; 2-year TRM 1%, p=0.19).
The 40 HeH DS-ALL patients had a significantly lower CIR than the other DS-ALL patients
(8-year: 8±5% vs. 26±3%, p=0.02). However a relatively high rate of TRM (2-year: 13±5% in
HeH vs. 7±1% in non-HeH DS; p=0.2) resulted in similar 8-year EFS (77±7% vs. 65±3%, p=0.28)
and OS (79±6% vs. 76±2%, p=0.88). TRM in these HeH patients was not exclusively seen in
one treatment strategy, but was spread across the different treatment protocols. HeH DS-ALL
patients showed lower OS when compared to the 235 HeH non-DS patients due to increased
TRM (8-year: OS 79±6% vs. 93±2%; p=0.009, EFS 77±7% vs. 86±2%; p=0.06, CIR 8±5% vs.
11±2%; p=0.7, 2-year: TRM 13±5% vs. 1±1%, p<0.001).
The subgroup of HeH DS-ALL patients with trisomies 4&10 (n=18) showed a trend towards
better outcome, when compared to all other DS-ALL patients (8-year: EFS 88±8% vs. 65±3%,
p=0.09; OS 88±8% vs. 76±2%, p=0.32; CIR 0% vs.25±2%, p=0.03; 2-year: TRM 12±8% vs.7±1%,
p=0.6). No DS patients with these trisomies did relapse, and all events were due to toxicity.
Their outcome was similar when compared to non-DS patients with trisomy 4&10 (8-year:
EFS 90.8±3%; p=0.75, OS 92.3±4%; p=0.65, CIR 5.1±2%; p=0.34, 2-year: TRM 3.0±2%, p=0.1).
Table 2. Contingency table representing outcome of Down syndrome patients by NCI risk group and PdL risk group criteria
ponte di Legno risk model
Low risk high risk
nCi c
riter
ia
Low risk
N=187 N=246
EFS 78±3% EFS 63±4% NCI LR
Clas
sical
OS 87±3% OS 73 ±3% N=433
TRM 3±1% TRM ±%
CIR 17±3% CIR ±%
high risk
N=218
EFS 57±4% NCI HR
N=0 OS 62±4% N=218
TRM 12±2
CIR 29±3%
PdL LR model PdL HR model Total
N=187 N=464 N=651
EFS, event-free survival; OS, overall survival; TRM, treatment-related mortality; CIR, cumulative incidence of relapse; SR, standard risk; HR, high risk; PdL, Ponte di Legno; Classical NCI risk criteria, age 1-9 or ≥10 years at diagnosis and WBC < or ≥50x109/L; Ponte di Legno low risk criteria; age <6 years and WBC <10x109/L, Ponte di Legno high risk criteria; all other patients.

33
CHAPTER 2
2
DS ALL patients with or without JAK2 mutations had similar treatment 8-year outcomes (EFS
57±10% vs. 69±5%, p=0.1; CIR 26±9% vs. 23±5%, p=0.48). No data were available in the refer-
ence cohort. The 93 DS ALL patients with CRLF2 aberrations showed no significant difference
in 8-year survival compared to the 41 wild-type DS ALL patients (EFS 62±6% vs. 71±8%,
p=0.21; OS 73±5% vs. 83±8%, p=0.13; CIR 26±6% vs. 22±8%; p=0.44). DS ALL patients with
CRLF2 gene rearrangements did not differ in outcome from non-DS ALL patients with these
aberrations (8-year: EFS 62±6% vs. 58±9%; p=0.7; OS 73±5% vs. 79±8%; p=0.6; CIR 26±6%
vs. 38±9%; p=0.15). Median time to relapse for DS patients with CRLF2 aberrations was 29
months versus 51 months in patients with wildtype CRLF2 (p=0.11).
Treatment related mortality
In total, 7.7% of the DS-ALL patients died from other causes than relapsed/refractory disease
compared to 2.3% in non-DS (p<0.001). TRM occurred at all phases of therapy, including main-
Figure 3. Treatment outcome according to standard- and high-risk National cancer Institute criteria in Down syndrome ALL patientsThe overall survival (A), event-free survival (B), cumulative risk of mortality (C) and cumulative risk of relapse (D) depicted for patients with NCI standard-risk (black line) and high-risk (grey line) patients with cut off values for WBC < or ≥ 50x109/L and age < or ≥10 years. The numbers on the curves for overall survival and event-free survival represent results at 8 years. The numbers on the curves for treatment-related mortality are 2-year results and those for relapse are results at 8 years.
CHAPTER 2
34
tenance (supplementary Table S7). TRM death during induction occurred in 2.8% (n=18) of
the DS patients (13 infectious, 5 non-infectious deaths). In CR, 4.9% (n=32) of the DS patients
died of TRM (25 infectious, 7 non-infectious). The most common cause of TRM was infection,
mainly respiratory and bacterial infections. Only 0.3% (n=2) of the DS ALL patients died of
second malignancies in CR1 (secondary AML and Epstein-Barr virus lymphoproliferative dis-
ease), compared to 1.3% of the non-DS patients, p<0.04. Secondary malignancies in non-DS
patients included 28 AML/MDS, 5 brain tumors, 9 other tumors, and 13 other malignancies.
TRM was not significantly different between DS patients treated on the CCG/POG/UK
studies (3-drug induction) and those DS patients treated on AIEOP/BFM-studies (4-drug
induction): the rate of death during induction was 1.1±1% vs. 1.9±1% (p=0.7) and the 2-year
cumulative rate was 7±2% vs. 8±3 % (p=0.99). The inclusion of an anthracycline in induction
(4-drug induction) had no impact on TRM.
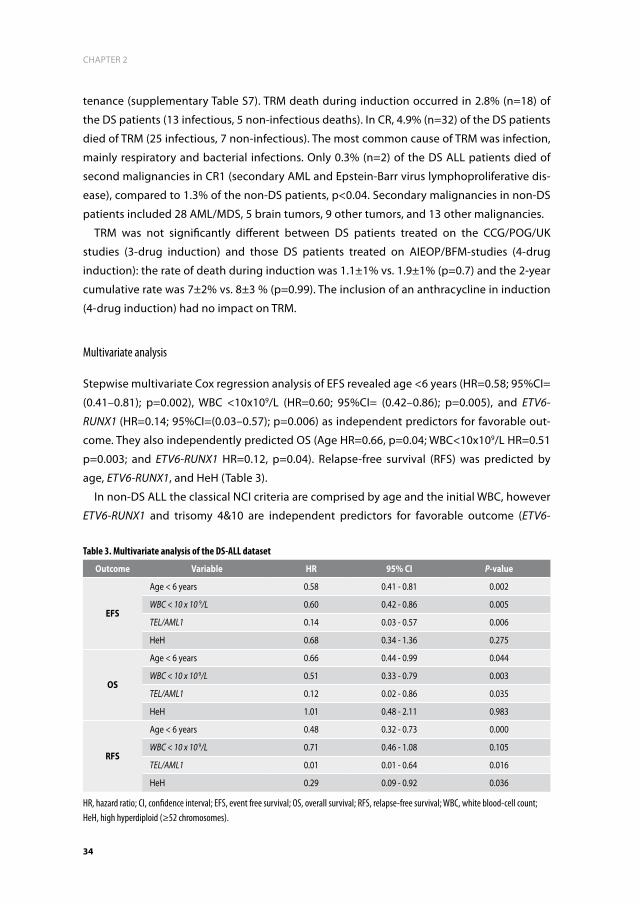
Multivariate analysis
Stepwise multivariate Cox regression analysis of EFS revealed age <6 years (HR=0.58; 95%CI=
(0.41–0.81); p=0.002), WBC <10x109/L (HR=0.60; 95%CI= (0.42–0.86); p=0.005), and ETV6-
RUNX1 (HR=0.14; 95%CI=(0.03–0.57); p=0.006) as independent predictors for favorable out-
come. They also independently predicted OS (Age HR=0.66, p=0.04; WBC<10x109/L HR=0.51
p=0.003; and ETV6-RUNX1 HR=0.12, p=0.04). Relapse-free survival (RFS) was predicted by
age, ETV6-RUNX1, and HeH (Table 3).
In non-DS ALL the classical NCI criteria are comprised by age and the initial WBC, however
ETV6-RUNX1 and trisomy 4&10 are independent predictors for favorable outcome (ETV6-
Table 3. Multivariate analysis of the DS-ALL dataset
Outcome Variable hr 95% Ci P-value
efS
Age < 6 years 0.58 0.41 - 0.81 0.002
WBC < 10 x 10 9/L 0.60 0.42 - 0.86 0.005
TEL/AML1 0.14 0.03 - 0.57 0.006
HeH 0.68 0.34 - 1.36 0.275
OS
Age < 6 years 0.66 0.44 - 0.99 0.044
WBC < 10 x 10 9/L 0.51 0.33 - 0.79 0.003
TEL/AML1 0.12 0.02 - 0.86 0.035
HeH 1.01 0.48 - 2.11 0.983
rfS
Age < 6 years 0.48 0.32 - 0.73 0.000
WBC < 10 x 10 9/L 0.71 0.46 - 1.08 0.105
TEL/AML1 0.01 0.01 - 0.64 0.016
HeH 0.29 0.09 - 0.92 0.036
HR, hazard ratio; CI, confidence interval; EFS, event free survival; OS, overall survival; RFS, relapse-free survival; WBC, white blood-cell count; HeH, high hyperdiploid (≥52 chromosomes).

35
CHAPTER 2
2
RUNX1: HR=0.29; 95%CI= (0.15–0.58); p<0.001; or trisomy 4&10: HR=0.37; 95%CI= (0.17–0.79);
p=0.011). NCI-criteria retained their prognostic value in a Cox model with these three vari-
ables (HR 1.96; 95%CI= (1.30-2.95), p=0.001). In addition, multivariate analysis showed that
the PdL criteria are not driven by the large group of DS-ALL patients having CRLF2 aberrations
(HR=0.66; 95%CI= (0.33–1.33); p=0.25), but more likely by age and initial WBC (HR=2.16;
95%CI= (0.95–4.90); p=0.07).
diSCuSSiOn
Many study groups have reported the worse clinical outcome of DS-ALL, however, almost all
reports lack sufficient power to answer relevant biological questions in DS-ALL, which is the
reason the Ponte di Legno group undertook this retrospective review. The unprecedented
size of this study cohort resolves the controversy of the frequency and clinical impact of
specific (cyto-) genetic aberrations in DS ALL.2,18 Moreover, the scale of the study enabled
the identification of relatively small subgroups of DS-ALL with favorable outcomes. Analysis
of 444 DS-ALL patients with known cytogenetics, demonstrated that the genetic subgroups
predicting favorable outcome in non-DS ALL,2,6,7,18,41,44 also predict favorable outcome in DS-
ALL. Most significant is the discovery that ETV6-RUNX1 conferred an excellent prognosis, and
that HeH with trisomy of chromosomes 4&10 was associated with a very low CIR. Hence these
patients, comprising 12% of DS-ALL, may be eligible for future treatment reduction to reduce
TRM, and can be treated according to the same risk-stratified algorithms as non-DS patients
in the collaborative study group protocols.
Another novel finding of this study was the identification of a clinically favorable prognos-
tic subgroup of DS-ALL patients, characterized by age <6 years and WBC <10x109/L. These
cut points differ from those used in the classical NCI ALL risk criteria, although the biological
basis for this difference is not fully understood.40 No genetic abnormalities were identified
that could explain this difference between the classical NCI- and the herein reported criteria.
Remarkably, children aged between 6 and 9 years at diagnosis, had a relatively poor outcome
similar to high-risk ALL patients, which was due to a high frequency of relapse. This subgroup
may be treated according to a medium or high-risk arm of future collaborative study group
protocols. Unraveling the genetic background of the leukemia in this subgroup will be
required in order to design more rational therapy for these patients. Noteworthy, MRD was
not routinely determined during the era of this study, and it is unclear whether MRD would
confirm these novel risk-groups. Since MRD was proven to be a powerful tool in non-DS ALL
risk assignment,45,46 further research is needed to validate whether a MRD based strategy is
desirable in future DS ALL treatment protocols.
In general, we showed that DS-ALL patients have an inferior survival when compared to
a representative non-DS ALL cohort treated in the same time period, which is in agreement

CHAPTER 2
36
with previous smaller studies.5,10,47 Despite a high rate of TRM, and different from what is often
suggested, relapse remained the main cause of treatment failure in DS patients. Interestingly
the relapses tend to occur later in DS. It is unclear if this is due to the genetic makeup of DS-
ALL or to decreased immune surveillance of the residual leukemia in DS patients. It cannot be
ruled out that under-reported treatment reduction of patients with DS-ALL contributes to the
increased relapse risk.48 This finding suggests that the currently accepted strategy of treat-
ment reduction in DS-AML, which is characterized by a chemotherapy-sensitive phenotype,49
is not applicable to DS-ALL.47 The only exception may be DS-ALL patients with ETV6-RUNX1 or
HeH, in which TRM outweighed the risk of relapse, for whom a 3-drug induction and a limited
re-induction might be adequate. Interestingly and in accordance with previous results, the
incidence of secondary malignancies was significantly lower in DS patients as compared to
non-DS ALL patients. This is in agreement with the reduced propensity for solid tumors in DS
patients reported before.50
The genetic basis of the aggressive clinical behavior of DS-ALL is still unknown. A high
proportion of DS-ALLs have normal karyotype (40.3% compared with 6.9% of non-DS),
suggesting the presence of cytogenetically invisible molecular abnormalities. One of these
abnormalities, detected in 60% of DS-ALLs is the aberrant expression of CRLF2, which is often
associated with JAK-STAT mutations. In contrast to some studies showing deleterious effects
of CRLF2 alterations in non-DS high-risk ALL,26,51 no such association was found in this study,
nor in several prior smaller studies of DS-ALL.3,4,21,27 Nevertheless, a substantial proportion
of DS ALL patients carry these aberrations, thereby providing a pathway which might be
targeted by inhibitors of the JAK-STAT pathway or mTOR signaling.52
IKZF1 mutational status was unknown in our dataset. Recently it was shown that this gene
was frequently deleted in DS-ALL patients (in ~35%), and was found to be an independent
predictor for dismal outcome.27 Of note, the median age of patients with IKZF1 aberrations in
the DS-ALL study was significantly higher compared to wildtype patients (8.2 vs. 4.3 years),
which could be an important genetic factor underlying the biological basis for the age cut-off
point of 6 years reported here as clinically significant.
Previous studies reported increased TRM in children with DS-ALL9, also in relapse proto-
cols.53 The large size of our cohort enabled the observation that the increased TRM is present
throughout treatment, with about half of the deaths occurring during maintenance therapy.
While doses of myelosuppressive chemotherapy are typically adjusted during maintenance
therapy, to maintain an adequate neutrophil count, this phase of treatment may neverthe-
less lead to B-cell depletion and hypo-gammaglobulinemia, and hence to a higher infection
rate in already immune-compromised DS patients.54,55 To reduce TRM, we suggest improving
supportive care throughout the treatment period with aggressive treatment of infections,
and studies analyzing the potential benefit of anti-bacterial and anti-fungal prophylaxis, and/
or immunoglobulin substitution. Patients should be leucocyte depleted as non-DS patients
during maintenance in order to prevent relapse, but with prompt interruptions for aplasia

37
CHAPTER 2
2
and with more intensive surveillance than non-DS children. In conclusion, this large interna-
tional study demonstrated that the poorer survival seen in DS-ALL is mainly due to a higher
relapse rate, and less so to TRM. Therefore, treatment reduction is not warranted, except for
the 12% of patients with HeH or ETV6-RUNX1 in which toxicity is the major cause of mortality.
As TRM occurs throughout therapy and is not associated with a specific chemotherapy regi-
men, better surveillance and improved supportive care measures throughout therapy need
to be evaluated. As a result of this study an initiative is underway to develop an international
treatment protocol for children with DS-ALL.
aCknOwLedGemenTS
We are indebted to all members of the study groups clinical centers and laboratories for
contribution of data. In addition, this work was supported by KiKa (Erasmus MC - Sophia chil-
dren’s hospital), and in part by grants to the Children’s Oncology Group including CA98543,
U10CA98413, U24CA114766; Ergen Family Chair in Pediatric Cancer (SPH); Women’s Auxiliary
Millennium Chair (JAW), NCI CA 21765 (SJCRH), the American Lebanese Syrian Associated
Charities (SJCRH), the National Cancer Institute grant 5 P01CA068484 (DFCI, LBS), and the
Israel Cancer Association and Israel Science Foundation Legacy program, Waxman and Israel
Cancer Research Foundations (SI).

CHAPTER 2
38
referenCeS
1. Hasle H, Clemmensen IH, Mikkelsen M. Risks of leukaemia and solid tumours in individuals with Down’s syndrome. Lancet. 2000; 355(9199): 165-169.
2. Forestier E, Izraeli S, Beverloo B, et al. Cyto-genetic features of acute lymphoblastic and myeloid leukemias in pediatric patients with Down syndrome: an iBFM-SG study. Blood. 2008; 111(3): 1575-1583.
3. Hertzberg L, Vendramini E, Ganmore I, et al. Down syndrome acute lymphoblastic leukemia, a highly heterogeneous disease in which aberrant expression of CRLF2 is associated with mutated JAK2: a report from the International BFM Study Group. Blood. 2010; 115(5): 1006-1017.
4. Mullighan CG, Collins-Underwood JR, Phil-lips LA, et al. Rearrangement of CRLF2 in B-progenitor- and Down syndrome-associated acute lymphoblastic leukemia. Nat Genet. 2009; 41(11): 1243-1246.
5. Dordelmann M, Schrappe M, Reiter A, et al. Down’s syndrome in childhood acute lym-phoblastic leukemia: clinical characteristics and treatment outcome in four consecutive BFM trials. Berlin-Frankfurt-Munster Group. Leukemia. 1998; 12(5): 645-651.
6. Arico M, Ziino O, Valsecchi MG, et al. Acute lymphoblastic leukemia and Down syn-drome: presenting features and treatment outcome in the experience of the Italian Association of Pediatric Hematology and Oncology (AIEOP). Cancer. 2008; 113(3): 515-521.
7. Chessells JM, Harrison CJ, Watson SL, Vora AJ, Richards SM, Medical Research Council Working Party on Childhood L. Treatment of infants with lymphoblastic leukaemia: results of the UK Infant Protocols 1987-1999. Br J Haematol. 2002; 117(2): 306-314.
8. Zeller B, Gustafsson G, Forestier E, et al. Acute leukaemia in children with Down syndrome: a population-based Nordic study. Br J Haematol. 2005; 128(6): 797-804.
9. Shah N, Al-Ahmari A, Al-Yamani A, Dupuis L, Stephens D, Hitzler J. Outcome and toxicity of chemotherapy for acute lymphoblastic leukemia in children with Down syndrome. Pediatr Blood Cancer. 2009; 52(1): 14-19.
10. Bassal M, La MK, Whitlock JA, et al. Lympho-blast biology and outcome among children with Down syndrome and ALL treated on CCG-1952. Pediatr Blood Cancer. 2005; 44(1): 21-28.
11. Mitchell CD, Richards SM, Kinsey SE, et al. Benefit of dexamethasone compared with prednisolone for childhood acute lympho-blastic leukaemia: results of the UK Medical Research Council ALL97 randomized trial. Br J Haematol. 2005; 129(6): 734-745.
12. Baillargeon J, Langevin AM, Mullins J, et al. Transient hyperglycemia in Hispanic children with acute lymphoblastic leukemia. Pediatr Blood Cancer. 2005; 45(7): 960-963.
13. Belgaumi AF, Al-Bakrah M, Al-Mahr M, et al. Dexamethasone-associated toxicity during induction chemotherapy for childhood acute lymphoblastic leukemia is augmented by concurrent use of daunomycin. Cancer. 2003; 97(11): 2898-2903.
14. Cetin M, Yetgin S, Kara A, et al. Hyperglyce-mia, ketoacidosis and other complications of L-asparaginase in children with acute lymphoblastic leukemia. J Med. 1994; 25(3-4): 219-229.
15. Howard SC, Pui CH. Endocrine complications in pediatric patients with acute lymphoblas-tic leukemia. Blood Rev. 2002; 16(4): 225-243.
16. Buitenkamp TD, Mathot RA, de Haas V, Pieters R, Zwaan CM. Methotrexate-induced side effects are not due to differences in pharmacokinetics in children with Down syndrome and acute lymphoblastic leuke-mia. Haematologica. 2010; 95(7): 1106-1113.
17. Pui CH, Gajjar AJ, Kane JR, Qaddoumi IA, Pappo AS. Challenging issues in pediatric oncology. Nature reviews Clinical oncology. 2011; 8(9): 540-549.

39
CHAPTER 2
2
18. Maloney KW, Carroll WL, Carroll AJ, et al. Down syndrome childhood acute lympho-blastic leukemia has a unique spectrum of sentinel cytogenetic lesions that influences treatment outcome: a report from the Chil-dren’s Oncology Group. Blood. 2010; 116(7): 1045-1050.
19. Whitlock JA, Sather HN, Gaynon P, et al. Clini-cal characteristics and outcome of children with Down syndrome and acute lympho-blastic leukemia: a Children’s Cancer Group study. Blood. 2005; 106(13): 4043-4049.
20. Bercovich D, Ganmore I, Scott LM, et al. Mu-tations of JAK2 in acute lymphoblastic leu-kaemias associated with Down’s syndrome. Lancet. 2008; 372(9648): 1484-1492.
21. Ensor HM, Schwab C, Russell LJ, et al. Demo-graphic, clinical, and outcome features of children with acute lymphoblastic leukemia and CRLF2 deregulation: results from the MRC ALL97 clinical trial. Blood. 2011; 117(7): 2129-2136.
22. Harvey RC, Mullighan CG, Chen IM, et al. Rearrangement of CRLF2 is associated with mutation of JAK kinases, alteration of IKZF1, Hispanic/Latino ethnicity, and a poor outcome in pediatric B-progenitor acute lymphoblastic leukemia. Blood. 2010; 115(26): 5312-5321.
23. Russell LJ, Capasso M, Vater I, et al. Deregu-lated expression of cytokine receptor gene, CRLF2, is involved in lymphoid transforma-tion in B-cell precursor acute lymphoblastic leukemia. Blood. 2009; 114(13): 2688-2698.
24. Blink M, Buitenkamp TD, van den Heuvel-Eibrink MM, et al. Frequency and prognostic implications of JAK 1-3 aberrations in Down syndrome acute lymphoblastic and myeloid leukemia. Leukemia. 2011; 25(8): 1365-1368.
25. Gaikwad A, Rye CL, Devidas M, et al. Prevalence and clinical correlates of JAK2 mutations in Down syndrome acute lym-phoblastic leukaemia. Br J Haematol. 2009; 144(6): 930-932.
26. Yoda A, Yoda Y, Chiaretti S, et al. Functional screening identifies CRLF2 in precursor B-
cell acute lymphoblastic leukemia. Proc Natl Acad Sci U S A. 2010; 107(1): 252-257.
27. Buitenkamp TD, Pieters R, Gallimore NE, et al. Outcome in children with Down’s syndrome and acute lymphoblastic leukemia: role of IKZF1 deletions and CRLF2 aberrations. Leukemia 2012; 26(10): 2204-2211.
28. Biondi A, Baruchel A, Hunger S, et al. The Eleventh International Childhood Acute Lymphoblastic Leukemia Workshop Report: Ponte di Legno, Italy, 6-7 May 2009. Leuke-mia. 2009; 23(12): 2318-2324.
29. Kamps WA, van der Pal-de Bruin KM, Veer-man AJ, Fiocco M, Bierings M, Pieters R. Long-term results of Dutch Childhood Oncology Group studies for children with acute lymphoblastic leukemia from 1984 to 2004. Leukemia. 2010; 24(2): 309-319.
30. Moricke A, Zimmermann M, Reiter A, et al. Long-term results of five consecutive trials in childhood acute lymphoblastic leukemia performed by the ALL-BFM study group from 1981 to 2000. Leukemia. 2010; 24(2): 265-284.
31. Gaynon PS, Angiolillo AL, Carroll WL, et al. Long-term results of the children’s cancer group studies for childhood acute lympho-blastic leukemia 1983-2002: a Children’s Oncology Group Report. Leukemia. 2010; 24(2): 285-297.
32. Mitchell C, Richards S, Harrison CJ, Eden T. Long-term follow-up of the United Kingdom medical research council protocols for childhood acute lymphoblastic leukaemia, 1980-2001. Leukemia. 2010; 24(2): 406-418.
33. Pui CH, Pei D, Sandlund JT, et al. Long-term results of St Jude Total Therapy Studies 11, 12, 13A, 13B, and 14 for childhood acute lymphoblastic leukemia. Leukemia 2010; 24(2): 371-382.
34. Schmiegelow K, Forestier E, Hellebostad M, et al. Long-term results of NOPHO ALL-92 and ALL-2000 studies of childhood acute lymphoblastic leukemia. Leukemia 2010; 24(2): 345-354.

CHAPTER 2
40
35. Stark B, Nirel R, Avrahami G, et al. Long-term results of the Israeli National Studies in child-hood acute lymphoblastic leukemia: INS 84, 89 and 98. Leukemia 2010; 24(2): 419-424.
36. Tsuchida M, Ohara A, Manabe A, et al. Long-term results of Tokyo Children’s Cancer Study Group trials for childhood acute lym-phoblastic leukemia, 1984-1999. Leukemia 2010; 24(2): 383-396.
37. Vilmer E, Suciu S, Ferster A, et al. Long-term results of three randomized trials (58831, 58832, 58881) in childhood acute lympho-blastic leukemia: a CLCG-EORTC report. Children Leukemia Cooperative Group. Leukemia. 2000; 14(12): 2257-2266.
38. Liang DC, Yang CP, Lin DT, et al. Long-term results of Taiwan Pediatric Oncology Group studies 1997 and 2002 for childhood acute lymphoblastic leukemia. Leukemia. 2010; 24(2): 397-405.
39. Shaffer LG TN. An international system for Human Cytogenetic Nomenclature (2005). Recommendations of the international standing committee of Human Cytogenetic Nomenclature. Basel, Switzerland; 2005.
40. Smith M, Arthur D, Camitta B, et al. Uniform approach to risk classification and treatment assignment for children with acute lympho-blastic leukemia. J Clin Oncol. 1996; 14(1): 18-24.
41. Harris MB, Shuster JJ, Carroll A, et al. Trisomy of leukemic cell chromosomes 4 and 10 identifies children with B-progenitor cell acute lymphoblastic leukemia with a very low risk of treatment failure: a Pediatric Oncology Group study. Blood. 1992; 79(12): 3316-3324.
42. Lundin C, Heldrup J, Ahlgren T, Olofsson T, Johansson B. B-cell precursor t(8; 14)(q11; q32)-positive acute lymphoblastic leukemia in children is strongly associated with Down syndrome or with a concomitant Philadelphia chromosome. European journal of haematology. 2009; 82(1): 46-53.
43. Messinger YH, Higgins RR, Devidas M, Hunger SP, Carroll AJ, Heerema NA. Pediatric
acute lymphoblastic leukemia with a t(8; 14)(q11.2; q32): B-cell disease with a high proportion of Down syndrome: a Children’s Oncology Group study. Cancer genetics. 2012; 205(9): 453-458.
44. Pui CH, Raimondi SC, Borowitz MJ, et al. Immunophenotypes and karyotypes of leu-kemic cells in children with Down syndrome and acute lymphoblastic leukemia. J Clin Oncol. 1993; 11(7): 1361-1367.
45. Conter V, Bartram CR, Valsecchi MG, et al. Molecular response to treatment redefines all prognostic factors in children and ado-lescents with B-cell precursor acute lympho-blastic leukemia: results in 3184 patients of the AIEOP-BFM ALL 2000 study. Blood. 2010; 115(16): 3206-3214.
46. van Dongen JJ, Seriu T, Panzer-Grumayer ER, et al. Prognostic value of minimal residual disease in acute lymphoblastic leukaemia in childhood. Lancet. 1998; 352(9142): 1731-1738.
47. Goto H, Inukai T, Inoue H, et al. Acute lym-phoblastic leukemia and Down syndrome: the collaborative study of the Tokyo Chil-dren’s Cancer Study Group and the Kyushu Yamaguchi Children’s Cancer Study Group. International journal of hematology. 2011; 93(2): 192-198.
48. Bohnstedt C, Levinsen M, Rosthoj S, et al. Physicians compliance during maintenance therapy in children with Down syndrome and acute lymphoblastic leukemia. Leuke-mia. 2013; 27(4): 866-870.
49. Zwaan CM, Kaspers GJ, Pieters R, et al. Differ-ent drug sensitivity profiles of acute myeloid and lymphoblastic leukemia and normal pe-ripheral blood mononuclear cells in children with and without Down syndrome. Blood. 2002; 99(1): 245-251.
50. Hasle H. Pattern of malignant disorders in in-dividuals with Down’s syndrome. The lancet oncology. 2001; 2(7): 429-436.
51. Cario G, Zimmermann M, Romey R, et al. Presence of the P2RY8-CRLF2 rearrange-ment is associated with a poor prognosis

41
CHAPTER 2
2
in non-high-risk precursor B-cell acute lymphoblastic leukemia in children treated according to the ALL-BFM 2000 protocol. Blood. 2010; 115(26): 5393-5397.
52. Maude SL, Tasian SK, Vincent T, et al. Target-ing JAK1/2 and mTOR in murine xenograft models of Ph-like acute lymphoblastic leukemia. Blood. 2012; 120(17): 3510-3518.
53. Meyr F, Escherich G, Mann G, et al. Outcomes of treatment for relapsed acute lympho-blastic leukaemia in children with Down syndrome. British journal of haematology. 2013; 162(1): 98-106.
54. Cetiner S, Demirhan O, Inal TC, Tastemir D, Sertdemir Y. Analysis of peripheral blood T-cell subsets, natural killer cells and serum levels of cytokines in children with Down syndrome. International journal of immuno-genetics. 2010; 37(4): 233-237.
55. Chaushu S, Chaushu G, Zigmond M, et al. Age-dependent deficiency in saliva and salivary antibodies secretion in Down’s syn-drome. Archives of oral biology. 2007; 52(11): 1088-1096.

CHAPTER 2
42
Supplementary Table S1. Participating study groups
Study group number of included patients
North American Children’s Oncology Group including the Children’s Cancer Group and the Pediatric Oncology Group studies
202
German Berlin-Frankfurt-Münster Study Group 109
UK Medical Research Council 66
Italian Associazione Italiana di Ematologia ed Oncologia Pediatrica 63
Scandinavian Nordic Society for Pediatric Hematology and Oncology 43
Belgian European Organization for Research and Treatment of Cancer 31
Dutch Childhood Oncology Group 30
North American Dana Faber Cancer Institute 27
Japan Association of Childhood Leukemia Study 18
German Cooperative study-group for childhood acute lymphoblastic leukemia 16
St. Jude Children’s Research Hospital 13
Tokyo Children’s Cancer Study Group 10
Taiwan Pediatric Oncology Group 9
Polish Paediatric Leukaemia and Lymphoma Study Group 8
Israel National Study group for Childhood ALL 8
Supplementary Table S2. Collected variables in the dataset
Collected variables in the dataset
Patient ID Name of protocol
Study group Use of Anthracylines in induction: yes/no
Lab ID cytogenetic lab Steroids in induction: Prednisone or Dexamethasone
Date of birth L’ asparaginase in induction: yes or no
Gender Dose of Methotrexate: gram/m2
Age at diagnosis Therapy reduction: yes/no, agent, dose
Date of diagnosis Day 6-9 BM evaluated
Hepatomegaly Day 6-9 BM evaluated
Splenomegaly Day 6-9 PB evaluated
Lymphnodes Day 6-9 PB evaluated
Mediastinal involvement Day 12-16 BM evaluated
Testicular infiltration Day 12-16 BM evaluated
Hemoglobine Start date and name of therapy block 1
Platelets Start date and name of therapy block 2
White bloodcell count Start date and name of therapy block 3
CNS involvement Start date and name of therapy block 4
Percentage blasts in PB by morphology Start date and name of therapy block 5
Percentage blasts in PB by immunology Start date and name of therapy block 6
BM aspirate: percentage blasts morphologically Start date and name of therapy block 7
BM aspirate: percentage blasts immunological Start date and name of therapy block 8

43
CHAPTER 2
2
Supplementary Table S2. (Continued)
Collected variables in the dataset
Trephine % blasts morphologically Irradiation and dose
Trephine % blasts immunology Therapy Comments
Immunophenotype determined on PB or BM Stemcell transplantation, type and date
Immunophenotype Date of CR
Date karyotype Date of relapse
Karyotype on PB or BM Date and type of secondary malignancy
Karyotype (ISCN 1995 nomenclature) Date and status at last follow up
Number of metaphases Date of death
Ploidy Cause of death
FISH for ETV6-RUNX1, BCR-ABL, MLL-AF4, and any other FISH performed.
General comments
Percentage of positive cells in FISH
Number of assessed nuclei in FISH
PCR for ETV6-RUNX1, BCR-ABL, MLL-AF4, and any other PCR performed.
CRLF2 gene rearrangement
JAK 1-3 mutation
DNA index
If available percentage of positive cells of CD33, CD 117, TdT, HLA-DR, CD19, CD10, CD20, CD22, CD79a, CD1, TCR a/b, TCR g/d, CD13, CD33, cylgM, CD2, CD3m, CD3cy, CD4, CD5, CD7, CD8
CNS, central nervous system; PB, peripheral blood; BM, bone marrow; CD, cluster of differentiation; CR, complete remission.
Supplementary Table S3. Details of the various treatment protocols used in this study
Study group
protocolmethotrexate
(gram/m2)anthracycline
induction steroids
L’asparaginase
AIEOP AIEOP ALL 95 SR 11 No Prednisone Yes
AIEOP AIEOP ALL 95 MR 11 Yes Prednisone Yes
AIEOP AIEOP ALL 95 HR 11 Yes Prednisone Yes
AIEOP AIEOP ALL 2000 11 Yes Prednisone Yes
AIEOP AIEOP ALL 2000 (SR1) 11 Yes Prednisone Yes
AIEOP AIEOP ALL 2000 (SR2) 11 Yes Prednisone Yes
AIEOP AIEOP ALL 2000 (MR1) 11 Yes Prednisone Yes
AIEOP AIEOP ALL 2000 (MR2) 11 Yes Prednisone Yes
AIEOP AIEOP ALL 2000 (DXM) 11 Yes Dexamethasone Yes
AIEOP AIEOP ALL 2000 (DXM-SR1) 11 Yes Dexamethasone Yes
AIEOP AIEOP ALL 2000 (PDN-MR1) 11 Yes Prednisone Yes
AIEOP AIEOP ALL 2000 (DXM-MR2) 11 Yes Dexamethasone Yes
AIEOP AIEOP ALL 2000 (PDN-MR2) 11 Yes Prednisone Yes

CHAPTER 2
44
Supplementary Table S3. (Continued)
Study group
protocolmethotrexate
(gram/m2)anthracycline
induction steroids
L’asparaginase
BFM-A ALL-BFM 95 SR 5 Yes Prednisone Yes
BFM-A ALL-BFM 95 MR 5 Yes Prednisone Yes
BFM-A ALL-BFM 2000 SR 5 Yes Prednisone Yes
BFM-A ALL-BFM 2000 MR 5 Yes Prednisone Yes
BFM-G ALL-BFM 95 SR 5 Yes Prednisone Yes
BFM-G ALL-BFM 95 MR 5 Yes Prednisone Yes
BFM-G ALL-BFM 2000 SR 5.02 Yes Prednisone Yes
BFM-G ALL-BFM 2000 MR 5.02 Yes Prednisone Yes
BFM-G ALL-BFM 2000 HR 5.02 Yes Prednisone Yes
CCG 1952 No HD MTX No No No
CCG 1961 No HD MTX Yes No No
CCG 1991 No HD MTX No No No
POG 9201 0.53 No No No
POG 9405 14 No No No
POG 9406 14 Yes No No
POG 9605 0.53 No No No
POG 9904 0.53 No No No
POG 9905 0.53 No No No
POG 9906 0.53 Yes No No
DCOG ALL8 5 Yes Prednisone Yes
DCOG ALL9 NHR 3 No Dexamethasone Yes
DCOG ALL9 HR 5 Yes Dexamethasone Yes
DCOG ALL10 5 Yes Prednisone Yes
DFCI 95001 (SR) 4 Yes Prednisone Yes
DFCI 95001 (HR) 4 Yes Prednisone Yes
DFCI 00001 (SR) 4 Yes Prednisone Yes
DFCI 00001 (HR) 4 Yes Prednisone Yes
EORTC EORTC CLG 58881 5 Yes Prednisone Yes
EORTC EORTC CLG 58951 55 Yes Randomized trial Yes
Israel 93-01(ALL -BFM 90 mod) 5 Yes Prednisone Yes
Israel 98-01(ALL-BFM 95 SR) 5 Yes Prednisone Yes
Israel 98-02(ALL-BFM 95 MR) 5 Yes Prednisone Yes
Israel 03-02-00(IC-BFM 2002) 5 Yes Prednisone Yes
1 First high dose MTX course is 1g/m2, if tolerated 2nd course 2g/m2; 2 First high dose MTX course 0.5g/m2, if tolerated 2nd course 2g/m2, if tolerated following course 5g/m2; 3 First course of MTX 0.5g/m2, if tolerated 2nd course 1g/m2. If not tolerated, continue to reduce each dose by 25% until tolerated; 4 DS patients not eligible for randomization to 2.5 mg/m2 MTX; 5 From September 2002, DS ALL patients were only enrolled in VLR and AR1 risk groups, and received 0.5g.m2 MTX; 6 Children <4 years of age receive 8 g/m2, and those older received 6g/m2. 7High dose MTX is limited to 0.5g/m2 for all course, leucovorin rescue from T=30 and vigorous hydration; 8 High dose MTX is limited to 0.5g/m2, normal dose is 2.5 g/m2 for SR and 5.0 g/m2 for HR patients.

45
CHAPTER 2
2
Supplementary Table S4. Patient characteristics and outcome parameters of the 5 excluded T cell DS-ALL patients
id no.
age, y
SexwBC,
x109/LCnS Lymphnodes hepatomegaly Testis karyotype Cr
relapse (rfS)
dead (OS)
1 13,6 M 55,9 No No No No 47,XY,+21c Yes No No (101)
2 9,1 F 231,6 No No No NK 47,XX,+21c Yes No No (78)
3 2,2 M 50,2 No No No No
47,XY,t(1;16)(p34),t(3;6)(q24;p12),del(4)(q34),der(7)t(1;7)(q32;q36),+21c[18]
Yes Yes (13.2) Yes (18.5)
4 11,2 M 0,6 No Yes Yes No NK NA NK No (60)
5 3,5 M 5,5 No NK Yes NK 47,XY,+21c[10] Yes No No (154)
WBC, white blood cell count x 109/L; CNS, central nervous system; CR, complete remission; RFS, relapse free survival in months; OS, overall survival in months; M, male; F, female; NK, not known
Supplementary Table S5. JAK2 and CRLF2 subgroup analysis
JAK2/CRLF2 cohort (n=182) residual cohort (n=471) p-value
age at diagnosis (range) 5.1 (1.2-17.2) 5.0 (1.2-17.9) 0,6
Sex
Male (%) 98 (54) 245 (52)
Female (%) 84 (46) 226 (48) 0,68
median initial wBC x 109/L (range) 11.7 (1.0-322) 9.5 (0.2-459) 0,15
extra medullary disease
CNS (%) 8/176* (4.5) 8/440* (1.8) 0.06
molecular aberrations
JAK1 2/141* (1.4)
JAK2 R683 30/141* (21.3)
IGH@-CRLF2 6/134* (4.5)
P2RY8-CRLF2 87/134* (69.4)
8-year OS 73 ± 5% 83 ± 8% 0,13
8-year efS 62 ± 6% 71 ± 8% 0,21
8-year Cir 26 ± 6% 22 ± 8% 0,44
*Number of patients available for analysis.
Supplementary Table S6. Patient characteristics of NCI standard risk DS ALL patients considered high risk by Ponte di Legno DS ALL risk group criteria
high risk modified model
number 246
age at diagnosis (range) 5.2 (1.2 - 9.9)
Sex
Male 136
Female 110
median initial wBC x 109/L (range) 16.4 (0.5 - 48.8)
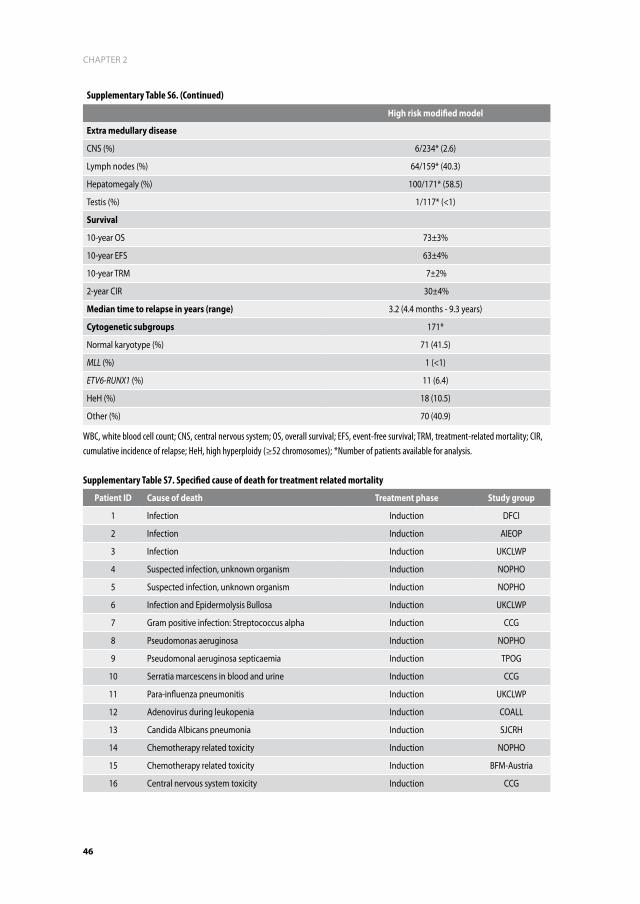
CHAPTER 2
46
Supplementary Table S6. (Continued)
high risk modified model
extra medullary disease
CNS (%) 6/234* (2.6)
Lymph nodes (%) 64/159* (40.3)
Hepatomegaly (%) 100/171* (58.5)
Testis (%) 1/117* (<1)
Survival
10-year OS 73±3%
10-year EFS 63±4%
10-year TRM 7±2%
2-year CIR 30±4%
median time to relapse in years (range) 3.2 (4.4 months - 9.3 years)
Cytogenetic subgroups 171*
Normal karyotype (%) 71 (41.5)
MLL (%) 1 (<1)
ETV6-RUNX1 (%) 11 (6.4)
HeH (%) 18 (10.5)
Other (%) 70 (40.9)
WBC, white blood cell count; CNS, central nervous system; OS, overall survival; EFS, event-free survival; TRM, treatment-related mortality; CIR, cumulative incidence of relapse; HeH, high hyperploidy (≥52 chromosomes); *Number of patients available for analysis.
Supplementary Table S7. Specified cause of death for treatment related mortality
patient id Cause of death Treatment phase Study group
1 Infection Induction DFCI
2 Infection Induction AIEOP
3 Infection Induction UKCLWP
4 Suspected infection, unknown organism Induction NOPHO
5 Suspected infection, unknown organism Induction NOPHO
6 Infection and Epidermolysis Bullosa Induction UKCLWP
7 Gram positive infection: Streptococcus alpha Induction CCG
8 Pseudomonas aeruginosa Induction NOPHO
9 Pseudomonal aeruginosa septicaemia Induction TPOG
10 Serratia marcescens in blood and urine Induction CCG
11 Para-influenza pneumonitis Induction UKCLWP
12 Adenovirus during leukopenia Induction COALL
13 Candida Albicans pneumonia Induction SJCRH
14 Chemotherapy related toxicity Induction NOPHO
15 Chemotherapy related toxicity Induction BFM-Austria
16 Central nervous system toxicity Induction CCG

47
CHAPTER 2
2
Supplementary Table S7. (Continued)
patient id Cause of death Treatment phase Study group
17Coagulation disturbances (thrombosis in oment to intestinal ischemia)
Induction NOPHO
18 Hemorrhage Induction UKCLWP
19 Pseudomonal septicemia Delayed intensification UKCLWP
20Gram negative septicemia, aspiration and septic shock
Delayed intensification UKCLWP
21 Rhinovirus Delayed intensification UKCLWP
22 Respiratory syncytial virus Delayed intensification CCG
23 Sepsis Interim maintenance BFM-Germany
24 Cardiopulmonal decompensation Interim maintenance BFM-Germany
25 Infection during aplasia Consolidation BFM-Germany
26 Infection and neutropenia Consolidation UKCLWP
27 Hemorrhage Consolidation UKCLWP
28 Atypical pneumonia during aplasia Consolidation BFM-Germany
29 Candida septicemia Intensified consolidation POG
30 Infection Maintenance DFCI
31 Fulminant sepsis, multi organ failure Maintenance BFM-Germany
32Detection of adenovirus in stool and serum, acute liver failure
Maintenance BFM-Germany
33 Infection, pneumonia Maintenance BFM-Germany
34 Sepsis, aplasia Maintenance BFM-Germany
35 Septic shock Maintenance UKCLWP
36 Septic shock Maintenance TPOG
37 Septic shock, Acute Respiratory Distress Syndrome Maintenance DCOG
38 Pseudomonal septicaemia Maintenance UKCLWP
39 Pneumonia, septicaemia, acute renal failure Maintenance UKCLWP
40Infection and lympho proliferative disease (EBV associated)
Maintenance POG
41 Bacterial pneumonia Maintenance UKCLWP
42 Bacillus meningitis Maintenance CCG
43 Aspergillus pneumonia Maintenance UKCLWP
44 RSV pneumonitis Maintenance UKCLWP
45 Influenza Maintenance UKCLWP
46Cardiopulmonary failure secondary to overwhelming sepsis, presumed viral etiology
Maintenance POG
47Cardiopulmonal circulatory failure during conditioning for SCT
Maintenance BFM-Germany
48 Chemotherapy related toxicity Maintenance CCG
49 Renal insuffiency Maintenance EORTC-CLG
50 Hemorrhage Maintenance UKCLWP


3
Methotrexate induced side effects are not due to differences in pharmacokinetics in children with Down syndrome and acute lymphoblastic leukemia
T.D. Buitenkamp, R.A.A. Mathôt, V. de Haas, R. Pieters and C.M.
Zwaan
Haematologica. 2010 Jul; 95(7): 1106-13

aBSTraCT
Children with Down Syndrome (DS) have an increased risk of developing acute lymphoblas-
tic leukemia (ALL). They have a poor tolerance for methotrexate (MTX). This is assumed to be
caused by a higher cellular sensitivity of the tissues in DS children. However, whether differ-
ences in pharmacokinetics (PK) play a role is unknown. We compared MTX induced toxicity
and pharmacokinetics in a retrospective case-control study between DS-ALL and non-DS
ALL patients. Population PK-models were fitted to data from all individuals simultaneously,
using non-linear mixed effect modeling. 468 MTX courses (1-5 g/m2) were given to 44 DS and
87 non-DS ALL patients. Grade 3-4 gastro-intestinal toxicity was significantly more frequent
in DS versus non-DS children (25.5% vs. 3.9%; p=0.001). Moreover, the occurrence of grade
3-4 gastro-intestinal toxicity was not related to plasma MTX area under the curve (AUC).
MTX-clearance was 5% lower in DS-ALL patients (p= 0.001), however this small difference is
probably clinically not relevant, because no significant differences in MTX plasma levels were
detected at T=24 and at T=48 hours. No major safety concerns were observed when using
intermediate dosages of MTX (1-3 gr/m2) in DS-ALL children in this study, and hence this may
be a safe dose for DS-ALL children.

51
CHAPTER 3
3
inTrOduCTiOn
Down syndrome (DS) is one of the most common congenital chromosome abnormalities,
with a prevalence of 16 per 10.000 live births in the Netherlands.1 Children with DS have an
increased risk of developing both acute myeloid, as well as acute lymphoblastic leukemia
(DS-ALL).2
DS-ALL patients differ in presenting characteristics from ALL patients without DS (non-
DS ALL). For instance, in DS-ALL a lower frequency of T-cell ALL2-5 and CD-10 negative ALL
(pro-B cell ALL) is found.4 Moreover, there are differences in the distribution of genetic ab-
normalities, with lower frequencies of unfavorable characteristics such as MLL-AF4 and the
Philadelphia-chromosome, as well as lower frequencies of favorable characteristics such as
high hyperdiploidy and TEL-AML1 in DS-ALL cases.2,3,6
Several studies indicate a poorer outcome for children with DS-ALL compared to non-DS
ALL patients.2,3,7 Whitlock et al. reported that children with DS-ALL treated according to the
NCI (National Cancer Institute) standard-risk arm in Children’s Oncology Group (COG) proto-
cols, had a worse outcome when compared with children with non-DS ALL.2 In contrast, DS-
ALL patients stratified in the NCI high-risk arm showed no significant differences in outcome
compared to high-risk non-DS ALL. This suggests that DS-ALL cells are relatively resistant to
chemotherapy, and that intensification of therapy for DS-ALL patients may be warranted.2
Moreover, this study may suggest that the NCI-classification is not appropriate for risk-group
stratification in DS ALL. Preliminary results of the ALL-BFM 2000 study showed no significant
differences in minimal residual disease levels in the first 3 months of treatment between DS
and non-DS ALL children, nor in relapse risk (6.1% in DS versus 11.4% in non-DS patients).8,9
Of interest, the risk of serious adverse events was significantly higher in DS-ALL patients
(23.4%) vs. non-DS ALL (6%) patients, as well as the cumulative incidence of treatment related
deaths (9% vs. 2%).8,9 These data suggest that treatment intensification in DS ALL patients
need to be carefully balanced against enhanced toxicity and potential excess in treatment
related mortality.
One of the key agents used in ALL treatment is methotrexate (MTX). MTX inhibits dihydro-
folate reductase, and leads to inhibition of DNA-synthesis. MTX-polyglutamylation increases
the intracellular retention of MTX, which is an important parameter of MTX efficacy.10-13 MTX
is associated with side effects, especially mucositis, liver-toxicity and myelo-suppression. Pa-
tients can be rescued from excessive toxicity with leucovorin, which is routinely administered
following the infusion of higher dosages of MTX. It is well-known that patients with Down
syndrome are more susceptible to MTX-induced side-effects than non-DS ALL patients,14,15
which is due to the higher cellular sensitivity of the tissues affected by MTX, such as the
mucosa and bone-marrow. This vulnerability often results in MTX dose reductions. It is not
known whether the differences in toxicity between DS and non-DS children also reflect dif-
ferences in MTX-pharmacokinetics. The only available study from Garré et al., showed that

CHAPTER 3
52
MTX plasma concentrations 42 hours after the start of infusion were significantly higher in 5
DS-ALL patients compared to 3 non-DS ALL patients.16
We performed a retrospective case-control study of 44 children with DS-ALL and 87 non-DS
ALL controls, enrolled on Dutch Childhood Oncology Group (DCOG) studies. The aim of the
study was to identify differences in MTX pharmacokinetics between DS and non-DS children,
and whether this was related to side effects.
paTienTS and meThOdS
Patients
We identified all DS-ALL patients enrolled in 3 consecutive DCOG treatment protocols, i.e.
study DCOG ALL-8, -9 and -10, conducted between November 1991 and December 2006. The
children were enrolled in the 8 participating University Hospitals in the Netherlands. Only
children who were treated according to the protocol and in complete remission (CR) after
induction therapy were included. In addition, for each DS ALL case, we selected 2 non-DS ALL
controls that were matched for treatment protocol, sex and body surface area (BSA).
Treatment protocols and MTX-administration
From 1991 until January 1997, children with newly diagnosed ALL were enrolled in the BFM-
based treatment protocol DCOG-ALL-8.17 Patients were stratified in 3 risk groups; standard
(SRG), medium (MRG) and high risk (HRG). SRG and MRG patients received HD-MTX courses
(5 g/m2/course), given every 2 weeks for a total of 4 courses; combined with intrathecal triple
therapy (ITT) consisting of MTX/DAF/ARA-C, and oral 6-mercaptopurine (6-MP; 25 mg/m2/
day) given once daily for 8 weeks. MRG patients were randomized to receive this bock with
either oral low-dose 6-MP oral, or high-dose 6-MP intravenously (1300 mg/m2, directly fol-
lowing the MTX infusions) every two weeks. HRG patients received HD-MTX (5 g/m2/course)
in 2 of the 3 high-risk blocks. Three doses of leucovorin rescue (SRG: 15 mg/m2; MRG and
HRG patients: first dose 30 mg/m2; subsequent dosages 15 mg/m2) were given every 6 hours,
starting 36 hours after the start of the MTX infusion for SRG patients, and at 42 hours for MRG
and HRG patients.
The DCOG-ALL-9 protocol (1997 – 2004) stratified children into 2 risk groups; non-high risk
(NHR) and high risk (HR). NHR patients received 3 HD-MTX courses (2 g/m2/course) given once
weekly and HR patients received 4 HD-MTX courses (3 g/m2/course), given every 2 weeks.
HD-MTX courses were combined with ITT at the start of every MTX infusion. Children treated
according to the SR group did not receive 6-MP; the HR group received oral 6-MP (50 mg/m2,
53
CHAPTER 3
3
once daily) for 8 weeks. Leucovorin rescue therapy (15 mg/m2) was initiated at 36 hours after
start of the infusion, and was administered every 6 hours for 3 doses.18
From November 2004 onwards, children with ALL were treated according to the DCOG-
ALL-10 protocol, which is ongoing. Patients were stratified in three risk groups; standard
(SR), medium (MR) and high risk (HR). SR and MR patients received HD-MTX courses (5 g/m2/
course), given every 2 weeks for a total of 4 courses. HD-MTX courses were combined with
ITT and oral 6-MP (25 mg/m2, once daily) for 8 weeks. Leucovorin rescue (15 mg/m2) was
given every 6 hours starting at 42 hours after the start of the MTX infusion, for a minimum of
3 doses. HR patients received 3 HR blocks with HD-MTX (5g/m2/course) after which patients
who were eligible received stem cell transplantation, or 3 subsequent HR courses when
patients did not have a suitable donor. Leucovorin rescue therapy (15 mg/m2) was initiated at
42 hours after start of the infusion and was given every 6 hours.
All protocols used similar supportive care guidelines for administration of high dose
MTX, including hyperhydration (2.5-3.0 L/m2/day), and urine alkalinization (using sodium
bicarbonate infusion, aiming at producing urine with a pH between 7 and 8). In case of MTX
plasma levels ≥ 0.4 µmol/L at time point (T) T=48 hours after the start of the MTX infusion,
hyperhydration, alkalinization and leucovorin rescue were continued for at least another 24
hours. The required MTX plasma level to discontinue these measures was ≤ 0.25 µmol/L at
T=72 hours or later. No specific guidelines for DS patients regarding MTX administration were
provided in any of these protocols. The MTX and Leucovorin dosages are specified in detail
in Table 1.
MTX toxicity and plasma levels
The data were extracted from patient files, and included the number of MTX courses, the
dose of MTX that was prescribed, the MTX plasma levels, the leucovorin rescue that was
given, the hyperhydration and urine alkalinization procedures, as well as the side-effects
during and after the MTX infusion until the next block of chemotherapy. Toxicity data were
graded according to the Common Toxicity Criteria for Adverse Events version 3.0 (CTCAE).
MTX plasma levels 48 hours after the start of the MTX infusion were collected, as well as
additional time-points in case of high levels, or in case the hospital also routinely determined
plasma levels at other time-points. Other items that were tabulated included co-medication,
delays in starting subsequent therapy elements, creatinine and liver function tests. In a few
cases the exact time of MTX plasma level determination was missing, and then the assump-
tion was made that the physicians followed the treatment protocol, and that samples were
taken at the prescribed time-points.

CHAPTER 3
54
Pharmacokinetic analysis
The pharmacokinetic model was fitted to the data from all individuals simultaneously, us-
ing non-linear mixed effect modeling (NONMEM).19 The population parameters, intra- and
inter-patient and residual variances were estimated using the NONMEM software program
(double precision; version VI, level 1.0). The first-order conditional estimate method was used
throughout the analysis.
MTX pharmacokinetics was described according to a two-compartmental model with
a first order elimination from the central compartment. The following parameters were
estimated: the volume of distribution of the central compartment (V1), clearance from the
central compartment (CL), volume of distribution of the peripheral compartment (V2) and
inter-compartmental clearance (Q). In the structural model pharmacokinetic parameter val-
ues were standardized for a body weight of 70 kg using an allometric model.20 For instance
CL and V1 were standardized as to CLpop = CLstd • (WT / 70)0.75 and V1pop = V1std • (WT /
70), where CLpop and V1pop are typical population parameter values in individuals with a
certain weight (WT) and CLstd and V1std are the standard values for patients with a weight of
Table 1. Methotrexate and standard leucovorin rescue dosages in the 3 Dutch Childhood Oncology Group ALL treatment protocols
protocol mTX 6-mp Leucovorin rescue
dCOG aLL 8
SRG 4 x 2 gram/m2 every 14 days
25mg/m2/day, orally for 56 days
15 mg/m2, every 6 hrs from T=36 for 3 dosages
MRG 4 x 5 gram/m2 every 14 days
25mg/m2/day, orally for 56 days, or 1300mg2 iv every 14 days
30 mg/m2 at T=42; followed by 15 mg/m2 at T=48 and T=54
HRG 2 x 5 gram/m2 every 21 days
100 mg/m2 for 5 days 30 mg/m2 at T=42; followed by 15 mg/m2 at T=48 and T=54
dCOG aLL 9
NHR 3 x 2 gram/m2 every 7 days
NA 15 mg/m2, every 6 hours from T=36 for 3 dosages
HR 4 x 3 gram/m2 every 14 days
50mg/m2/day for 56 days 15 mg/m2, every 6 hours from T=36 for 3 dosages
dCOG aLL 10
SR 4 x 5 gram/m2 every 14 days
25mg/m2/day for 56 days 15 mg/m2, every 6 hours from T=42 for 3 dosages
MR 4 x 5 gram/m2 every 14 days
25mg/m2/day for 56 days 15 mg/m2, every 6 hours from T=42 for 3 dosages
HR 5 gram/m2 every 50 days, for 3-6 courses
25mg/m2/day for 14 days 15 mg/m2, every 6 hours from T=42 for 3 dosages
In some protocols 6-mercaptopurine (6-MP) was added during this treatment block. SRG: standard risk group; MRG: medium risk group; HRG: high risk group; NHR: non high risk; HR: high risk; SR: standard risk; MR: medium risk; T: time-point after start of MTX-infusion; m2: meter square; DCOG: Dutch Childhood Oncology Group; MTX: methotrexate. NA: not applicable, since none of the ALL9-NHR patients did receive 6-MP.

55
CHAPTER 3
3
70kg. Inter-and intra-patient variability of the pharmacokinetic parameters was estimated us-
ing an exponential error model. For instance, inter- and intra-individual variability in CL was
estimated using: CLi = CLpop x exp (ηi + κi) where CLi represents the clearance of individual
i, and η and κ are the respective inter- and intra-patient random effects with a mean of zero
and variance ω2. The covariance between inter-patient variability was estimated as well. For a
NONMEM model, the residual variance corresponds to the difference between the observed
concentration (Cobs) and predicted concentration (Cpred). The latter is predicted on basis of
individual parameters (e.g. CLi, V1i, etc.). Residual variance was modelled with a combined
additive and proportional error model: Cobs, i = ε1 + Cpred, i (1 + ε2), where ε1 and ε2 are
independent random variables with zero mean and common variances of σ2. The adequacy
of the developed model was evaluated by examination of the precision of the parameter
estimates, the values of random-effect variances and various diagnostic plots.20-23 In order
to explain the pharmacokinetic variability between and within the patients, relationships
were investigated between pharmacokinetic parameters and various patient characteristics.
Covariates were introduced in a multiplicative way. Categorical variables, like for example
Down syndrome, were modelled as: CLi = CLpop x θ DOWN, where CLpop is the population
value for MTX-clearance in non-Down patients (exponent DOWN=0) and θ is the fractional
change in clearance in Down-patients (DOWN = 1). Continuous variables, like creatinine
clearance (CRCL), were modelled centred around the median value in the population: CLi
= CLpop * (CRCL/142) θ, where CLpop is the MTX-clearance in individuals with a creatinine
clearance of 142 ml/min and θ is an exponential. The objective function value (OFV) was used
for comparison of the models. Discrimination between hierarchical models was based on the
OFV using the log-likelihood ratio test. A value of p=0.05, representing a decrease in OFV of
3.8 units was considered statistically significant (df=1).19
Individual pharmacokinetic parameters were generated by Bayesian analysis. On basis of
these parameters, individual plasma concentration-time profiles were generated for assess-
ment of the area under the plasma concentration versus time curve (AUC), and the plasma
concentration at 48 hours after the start of the MTX infusion.
Statistics
For statistical comparisons the Statistical Package for the Social Sciences (SPSS) Analysis
system (v.15.0, SPSS Inc., Chicago, IL, USA) was used. To analyze differences between DS-ALL
patients and non-DS ALL patients, non-parametric matched paired analysis was applied. For
toxicity parameters with binary values, the non-parametric Cochran test for k related samples
was used. Analysis were 2-tailed at the significance level of p<0.05.

CHAPTER 3
56
reSuLTS
Patient characteristics
In total 47 DS-ALL patients, enrolled in protocols DCOG ALL 8, 9 and 10, were identified in the
DCOG database. Three patients died during induction therapy, and could therefore not be
evaluated. For the remaining 44 DS-ALL patients (25 boys, 19 girls), 87 matched non-DS-ALL
controls (50 boys, 37 girls) were selected. One patient with DS was matched to 1 instead of 2
non-DS ALL patients, because no other appropriate control could be identified.
Patient characteristics are shown in table 2. All DS-ALL patients had B-cell-precursor ALL,
and 7/87 (8%) non-DS ALL patients had T-cell ALL. DS-ALL patients were slightly older com-
pared to non-DS-ALL patients (3.4 vs. 5.4 years respectively; p=0.02), which was the result of
matching on BSA. There was a difference in median presenting white blood cell count (WBC)
between DS and non-DS children (8.8x10⁹/l. vs. 26.9x10⁹/l. respectively; p= 0.005). Significant
co-morbidity was present in 5 DS-ALL patients, including a complex cor vitium (n=3; surgi-
cally corrected before diagnoses of ALL in all of them), hypothyroidism (n=1), and diabetes
mellitus (n=1). However, all patients were in a clinically good condition before they were
diagnosed with DS-ALL, and all children were treated with curative intent.
MTX treatment
In total, 468 HD-MTX courses were administered to 44 DS children (n = 152 courses) and 87
non-DS children (n = 366 courses). Dose reductions were applied in 26 of 152 (17.1%) MTX
courses, in 9 out of 44 (20.5%) patients, whereas none of the non-DS ALL patients received a
dose-reduction. Three DS-ALL patients received one course less than required per protocol,
and 1 non-DS ALL patient received 3 instead of 4 courses because of severe MTX induced
side effects (p= 0.68). Dose-reduction was electively initiated from the 1st course onwards, in
anticipation of possible greater toxicity in 18/26 courses in 5 DS children. In 8 of 26 courses in
4 DS patients, dose-reductions were applied from the 2nd or subsequent courses onwards be-
cause of documented excessive toxicity in earlier HD-MTX courses. Dose-reductions occurred
in protocol ALL-9 at the 2 gr/m2 MTX dose (2 courses in 1 patient), and in protocol ALL-10
at the 5 gr/m2 MTX dose (6 courses in 3 patients). Of interest, the number of DS patients
requiring dose-reductions in the 2nd or subsequent courses due to excessive toxicity in earlier
courses was therefore 1/27 (3.7%) patients when treated at the 2-3 gr/m2 dose-level, and
3/12 (25%) patients when treated at the 5 gr/m2 dose level (p=0.046).

57
CHAPTER 3
3
Table 2. Patient characteristics of Down syndrome ALL patients and their non-Down syndrome ALL matched controls
parameter dS-aLL patients non dS-aLL patients p-value
N 44 87
matching parameters
Sex, n and (%)
Male 25 (56.8) 50 (57.5)
Female 19 (43.2) 37 (42.5)
BSA, median (range), m2 0.70 (0.3-1.6) 0.74 (0.5-1.6)
Treatment protocol.
ALL 8, n and (%) 10 (22.7) 20 (23)
ALL 9, n and (%) 24 (54.5) 48 (55.2)
ALL 10, no and (%) 10 (22.7) 19 (21.8)
patient characteristics
Age, median (range), years 5.4 (2.0-17.1) 3.6 (1.3-14.7) 0.03
Initial WBC, median x 109/L 8.8 (1.2-460) 27.0 (0.8-684.0) 0.005
Immunophenotype
Pro B-ALL, n and (%) 0 4 (4.6)
BCP-ALL, n and (%) 48 (100) 76 (87.4)
T-ALL, n and (%) 0 7 (8)
DNA index
<1,16 29/32 (90.6%) 45/87 (51.7%) 0.524
>= 1,16 3/32 (9.3%) 8/87 (9.2)
unknown 12 34 (39.1)
Cytogenetic abnormalities
t(9;22), n and (%) 2/44 (4.5) 1/87 (1.1) 0.261
t(12;21), n and (%) 4/44 (9.1) 6/87 (6.9) 0.732
mTX Courses
Number of MTX courses (n)1 152 316
Administered at 2 gr/m2 89 126 (39.8)
Administered at 3 gr/m2 15 71 (22.5)
Administered at 5 gr/m2 39 119 (37.6)
Administered other 9
Courses not received, n. 3 1 0.68
Reduced dosage, n and (%)
All courses, n and (%) 26 (17.1) 0 (0) 0.001
Dose reduction below the prescribed of 2 gr/m2 2/74 0/126
Dose reduction below the prescribed of 3 gr/m2 0/15 0/71
Dose reduction below the prescribed of 5 gr/m2 24/63 0/119
1 This is the actual dose that was given to patients, which sometimes differs from the prescribed dose in the protocol. *Dose reductions were either given empirically before the 1st course of MTX, or dosages were adapted based on experiences toxicity in the 1st course. WBC: white blood cell count; BSA: body surface area; BCP-ALL: B-cell precursor acute lymphoblastic leukemia.
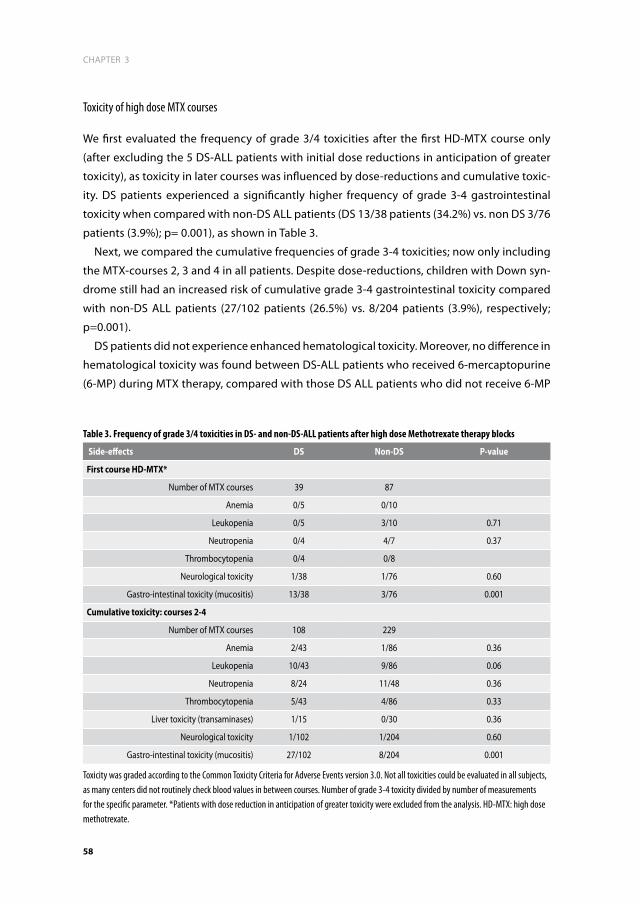
CHAPTER 3
58
Toxicity of high dose MTX courses
We first evaluated the frequency of grade 3/4 toxicities after the first HD-MTX course only
(after excluding the 5 DS-ALL patients with initial dose reductions in anticipation of greater
toxicity), as toxicity in later courses was influenced by dose-reductions and cumulative toxic-
ity. DS patients experienced a significantly higher frequency of grade 3-4 gastrointestinal
toxicity when compared with non-DS ALL patients (DS 13/38 patients (34.2%) vs. non DS 3/76
patients (3.9%); p= 0.001), as shown in Table 3.
Next, we compared the cumulative frequencies of grade 3-4 toxicities; now only including
the MTX-courses 2, 3 and 4 in all patients. Despite dose-reductions, children with Down syn-
drome still had an increased risk of cumulative grade 3-4 gastrointestinal toxicity compared
with non-DS ALL patients (27/102 patients (26.5%) vs. 8/204 patients (3.9%), respectively;
p=0.001).
DS patients did not experience enhanced hematological toxicity. Moreover, no difference in
hematological toxicity was found between DS-ALL patients who received 6-mercaptopurine
(6-MP) during MTX therapy, compared with those DS ALL patients who did not receive 6-MP
Table 3. Frequency of grade 3/4 toxicities in DS- and non-DS-ALL patients after high dose Methotrexate therapy blocks
Side-effects dS non-dS p-value
first course hd-mTX*
Number of MTX courses 39 87
Anemia 0/5 0/10
Leukopenia 0/5 3/10 0.71
Neutropenia 0/4 4/7 0.37
Thrombocytopenia 0/4 0/8
Neurological toxicity 1/38 1/76 0.60
Gastro-intestinal toxicity (mucositis) 13/38 3/76 0.001
Cumulative toxicity: courses 2-4
Number of MTX courses 108 229
Anemia 2/43 1/86 0.36
Leukopenia 10/43 9/86 0.06
Neutropenia 8/24 11/48 0.36
Thrombocytopenia 5/43 4/86 0.33
Liver toxicity (transaminases) 1/15 0/30 0.36
Neurological toxicity 1/102 1/204 0.60
Gastro-intestinal toxicity (mucositis) 27/102 8/204 0.001
Toxicity was graded according to the Common Toxicity Criteria for Adverse Events version 3.0. Not all toxicities could be evaluated in all subjects, as many centers did not routinely check blood values in between courses. Number of grade 3-4 toxicity divided by number of measurements for the specific parameter. *Patients with dose reduction in anticipation of greater toxicity were excluded from the analysis. HD-MTX: high dose methotrexate.

59
CHAPTER 3
3
treatment (p=0.58). The same lack of difference in hematological toxicity was observed when
comparing the non-DS ALL controls that received 6-MP versus those that did not (p= 0.74).
Neurological toxicity (grade1-4) was reported in 3 DS (in 5 courses) and in 3 non-DS patients
(in 4 courses). Grade 4 MTX encephalopathy, consisting of either seizures, unconsciousness,
and/or transient hemi-paresis, occurred in 1 DS (in 2 courses) and in 2 non-DS patients (in 1
course per patient).
MTX pharmacokinetics
Figure 1 shows the observed MTX plasma concentrations and the diagnostic plots of the
developed population pharmacokinetic model in DS and non-DS ALL patients. The popula-
tion pharmacokinetic parameters are given in Table 4. Predicted concentrations are evenly
distributed around the line of unity, indicating the ‘goodness of fit’ of the model. For each
patient the individual estimates of CL, Q, V1 and V2 were obtained by Bayesian analysis. On
basis of these parameters, individual plasma concentration-time profiles were calculated.
The two-compartment pharmacokinetic model adequately described the data, and the
parameters were generally well estimated as indicated by their standard errors. Allometric
normalization of clearances for weight reduced the inter-patient variability from 45% to 31%.
Both inter- and intra-patient variability in clearance was moderate with respective values of
31% and 15%. Covariate analysis revealed that MTX-clearance was 5% lower in DS-ALL pa-
tients compared to non-DS ALL patients (p=0.001). Median (range) posthoc values for clear-
ance were 4.7 (2.4 – 11.9) L/hr and 4.9 (1.3 – 10.4) L/hr in DS ALL and non-DS ALL patients,
respectively; standardized values were 12.3 (7.3 – 18.9) L/hr/70kg and 13.0 (4.6 – 25.2) L/hr/
kg. No relationship was found between the pharmacokinetic parameters and the treatment
center or treatment protocol, MTX dose, hyper hydration (L/m2), number of leucovorin dos-
ages, creatinine clearance, age, WBC, bilirubin or ASAT levels.
The 5% difference in MTX-clearance between DS-ALL and non-DS ALL is small, which is
further demonstrated by the fact that no significant differences were detected in the plasma
concentration at T=24 and T=48 hours after the start of the MTX infusions. At T=24, the me-
dian MTX-level in DS-ALL patients was 38.74 µmol/L (range 0.38-133.11 µmol/L; 25th and 75th
percentiles: 19.7–66.3 µmol/L) versus 36.49 µmol/L (range 7.62-261.49 µmol/L; 25th and 75th
percentiles: 22.8-63.5 µmol/L; p=0.51) in non-DS patients. At T=48 hours, the median MTX
level in DS-ALL patients was 0.28 µmol/L (range 0.04-9.57 µmol/L; 25th and 75th percentiles:
0. 15-0.51 µmol/L), versus 0.27 µmol/L (range 0.06-14.63 µmol/L; 25th and 75th percentiles
0.17-0.41; p=0.41) in non-DS patients. After stratification for the various dosages of MTX that
were administered to the patients (either 2, 3 or 5 gram/m2/course), again MTX plasma levels
did not differ significantly between DS and non-DS ALL children.

CHAPTER 3
60
0 48 96 144 192 240 288 336
0.01
0.1
1
10
100
1000
time (hr)
MT
X p
lasm
a c
on
cen
trati
on
(µ
mo
l/L
)
0 48 96 144 192 240 288 336
0.01
0.1
1
10
100
1000
time (hr)
MT
X p
lasm
a c
on
cen
trati
on
(µ
mo
l/L
)
0.01 0.1 1 10 100 1000
0.01
0.1
1
10
100
1000
observed MTX conc (µmol/L)
pre
dic
ted
MT
X c
on
c (µ
mo
l/L
)
0.01 0.1 1 10 100 1000
0.01
0.1
1
10
100
1000
observed MTX conc (µmol/L)
pre
dic
ted
MT
X c
on
c (µ
mo
l/L
)
A B
D C
Figure 1. Methotrexate plasma levels and diagnostic plots of the population pharmacokinetic modelMethotrexate (MTX) plasma levels at various time-points following the start of a 24-hour MTX-infusion in DS (graph A, n=152 courses in 44 patients) and non-DS (graph B, n=316 courses in 87 patients) ALL. Each dot represents a plasma level in a patient measured at a given time-point. Plasma concentrations at T=48 hours were available from all patients, whereas levels at T=1 hour and T=24 hour were only determined in some of the hospitals. In case of T=48 MTX levels > 0.4 µmol/L monitoring of MTX levels was continued. C) Model predicted MTX concentrations calculated by the NONMEM two-compartment model versus observed concentrations for all patients. The points are evenly distributed around the line of unity indicating the goodness of fit of the model. Deviations from the line are caused by intra- and inter-patient variability and residual variability. D) Individually (Bayesian) predicted MTX concentrations versus observed concentrations for all patients. All dots are close to the line of unity indicating limited residual variability.
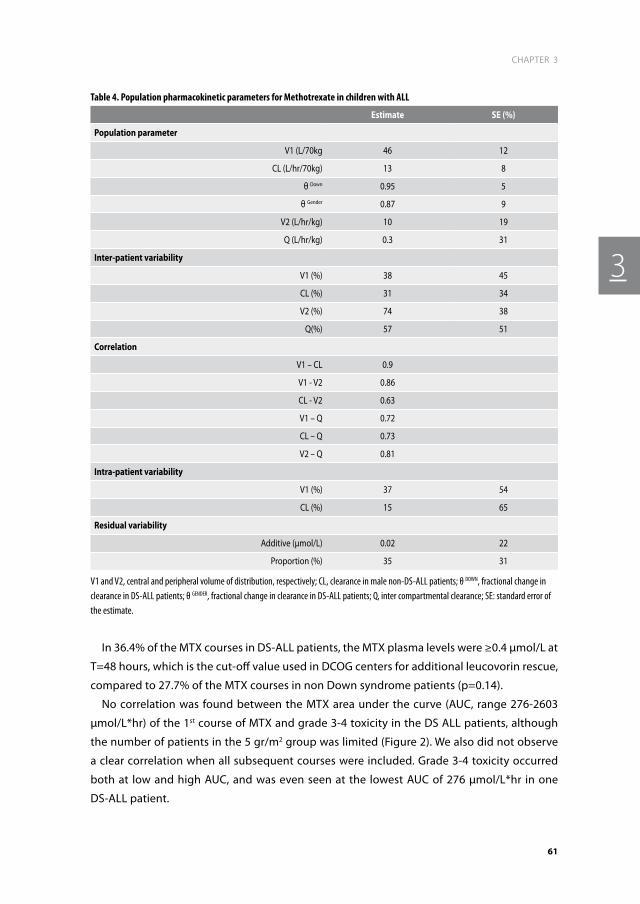
61
CHAPTER 3
3
In 36.4% of the MTX courses in DS-ALL patients, the MTX plasma levels were ≥0.4 µmol/L at
T=48 hours, which is the cut-off value used in DCOG centers for additional leucovorin rescue,
compared to 27.7% of the MTX courses in non Down syndrome patients (p=0.14).
No correlation was found between the MTX area under the curve (AUC, range 276-2603
µmol/L*hr) of the 1st course of MTX and grade 3-4 toxicity in the DS ALL patients, although
the number of patients in the 5 gr/m2 group was limited (Figure 2). We also did not observe
a clear correlation when all subsequent courses were included. Grade 3-4 toxicity occurred
both at low and high AUC, and was even seen at the lowest AUC of 276 µmol/L*hr in one
DS-ALL patient.
Table 4. Population pharmacokinetic parameters for Methotrexate in children with ALL
estimate Se (%)
population parameter
V1 (L/70kg 46 12
CL (L/hr/70kg) 13 8
θ Down 0.95 5
θ Gender 0.87 9
V2 (L/hr/kg) 10 19
Q (L/hr/kg) 0.3 31
inter-patient variability
V1 (%) 38 45
CL (%) 31 34
V2 (%) 74 38
Q(%) 57 51
Correlation
V1 – CL 0.9
V1 - V2 0.86
CL - V2 0.63
V1 – Q 0.72
CL – Q 0.73
V2 – Q 0.81
intra-patient variability
V1 (%) 37 54
CL (%) 15 65
residual variability
Additive (µmol/L) 0.02 22
Proportion (%) 35 31
V1 and V2, central and peripheral volume of distribution, respectively; CL, clearance in male non-DS-ALL patients; θ DOWN, fractional change in clearance in DS-ALL patients; θ GENDER, fractional change in clearance in DS-ALL patients; Q, inter compartmental clearance; SE: standard error of the estimate.
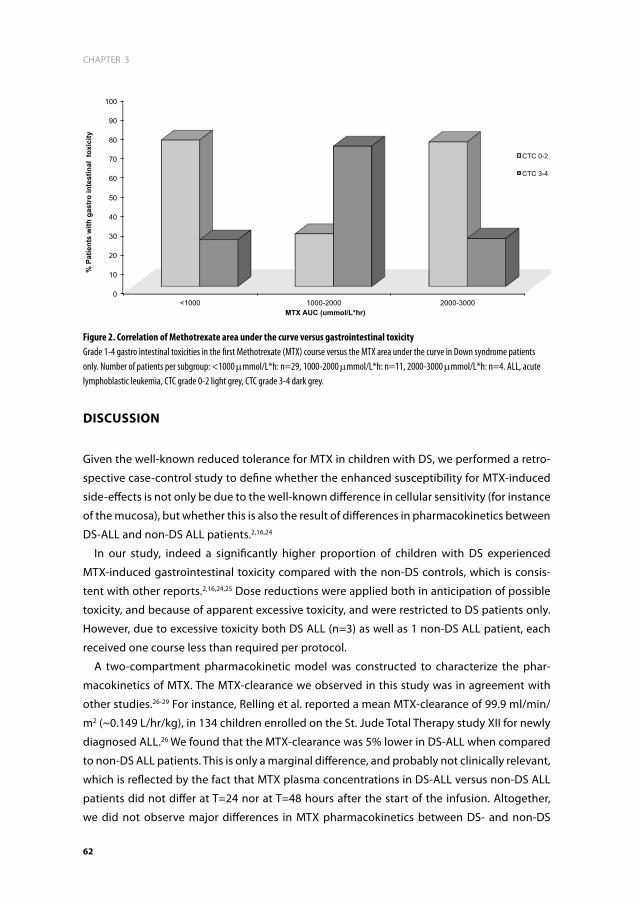
CHAPTER 3
62
diSCuSSiOn
Given the well-known reduced tolerance for MTX in children with DS, we performed a retro-
spective case-control study to define whether the enhanced susceptibility for MTX-induced
side-effects is not only be due to the well-known difference in cellular sensitivity (for instance
of the mucosa), but whether this is also the result of differences in pharmacokinetics between
DS-ALL and non-DS ALL patients.2,16,24
In our study, indeed a significantly higher proportion of children with DS experienced
MTX-induced gastrointestinal toxicity compared with the non-DS controls, which is consis-
tent with other reports.2,16,24,25 Dose reductions were applied both in anticipation of possible
toxicity, and because of apparent excessive toxicity, and were restricted to DS patients only.
However, due to excessive toxicity both DS ALL (n=3) as well as 1 non-DS ALL patient, each
received one course less than required per protocol.
A two-compartment pharmacokinetic model was constructed to characterize the phar-
macokinetics of MTX. The MTX-clearance we observed in this study was in agreement with
other studies.26-29 For instance, Relling et al. reported a mean MTX-clearance of 99.9 ml/min/
m2 (~0.149 L/hr/kg), in 134 children enrolled on the St. Jude Total Therapy study XII for newly
diagnosed ALL.26 We found that the MTX-clearance was 5% lower in DS-ALL when compared
to non-DS ALL patients. This is only a marginal difference, and probably not clinically relevant,
which is reflected by the fact that MTX plasma concentrations in DS-ALL versus non-DS ALL
patients did not differ at T=24 nor at T=48 hours after the start of the infusion. Altogether,
we did not observe major differences in MTX pharmacokinetics between DS- and non-DS
0
10
20
30
40
50
60
70
80
90
100
<1000 1000-2000 2000-3000
% P
atie
nts
with
gas
tro
inte
stin
al t
oxic
ity
MTX AUC (ummol/L*hr)
CTC 0-2
CTC 3-4
Figure 2. Correlation of Methotrexate area under the curve versus gastrointestinal toxicity Grade 1-4 gastro intestinal toxicities in the first Methotrexate (MTX) course versus the MTX area under the curve in Down syndrome patients only. Number of patients per subgroup: <1000 mmmol/L*h: n=29, 1000-2000 mmmol/L*h: n=11, 2000-3000 mmmol/L*h: n=4. ALL, acute lymphoblastic leukemia, CTC grade 0-2 light grey, CTC grade 3-4 dark grey.

63
CHAPTER 3
3
children, which would explain the enhanced rate of side effects in DS children. The only other
study regarding MTX pharmacokinetics in DS-ALL found significantly higher plasma concen-
trations for DS ALL patients, but numbers were small (5 DS-ALL and 3 non-DS ALL patients).16
We could not relate clinical severe toxicity to the MTX AUC, and toxicity was not restricted
to DS-patients with higher plasma levels only. This suggest that the enhanced frequency of
gastrointestinal side effects in the DS patients must have been related to pharmacodynamic
differences of the gastrointestinal mucosa between DS and non-DS children. Several differ-
ences in MTX pharmacodynamics between DS and non-DS children have been reported in the
literature. For instance, patients with DS have decreased folate levels when compared to con-
trol patients without DS, which may result in enhanced polyglutamylation and MTX-induced
cell-kill.16,30 Another plausible explanation for the observed MTX toxicity in DS patients could
be a gene dosage effect for enzymes found on chromosome 21.30,31 In particular, the reduced
folate carrier gene (RFC), which is responsible for MTX transport over the cell-membrane, is
localized on chromosome 21q22 15,32. However, at higher concentrations passive diffusion of
MTX across the cell-membrane may also occur.33,34 This may explain why, in an earlier study,
we could not demonstrate higher sensitivity of DS-ALL cells to MTX, compared to non-DS
ALL cells.32
Furthermore, polymorphisms in genes linked to the pharmacodynamics of MTX, such as
folate-metabolism related genes, could give rise to enhanced toxicity, as has been shown in
previous reports by us and others.35-38 Children harboring polymorphisms exhibited signifi-
cantly more GI toxicity. More knowledge on folate related polymorphisms might contribute
to further individualization of MTX treatment in ALL and specifically for DS-ALL patients.
It remains a challenge to advise clinicians on the right dose of MTX to use in DS patients.
Even in non-DS ALL patients, different protocols use different dosages, and there seems to
be no consensus when it comes to the best dose of MTX to be used. In this retrospective
study, a significantly higher number of DS-patients was given a dose-reduction in subse-
quent courses when treated with higher dosages (5 gram/m2/course) of MTX, compared with
intermediate MTX-dosages (1–3 g/m2/course). In absence of major safety concerns, it seems
safe to start with intermediate dosages of MTX, followed by careful monitoring. The fear of
enhanced toxicity, however, needs to be balanced against efficacy, as DS ALL cells are not
more sensitive to chemotherapy when compared to non-DS ALL cells, which is different from
the situation in myeloid leukemia of Down syndrome, which is characterized by hypersensi-
tivity to chemotherapy.32,39-41
In summary, we did not find evidence for differences in MTX pharmacokinetics between
DS-ALL and non-DS ALL patients, which might have explained the higher rate of grade 3-4
gastrointestinal toxicity and the greater need for MTX dose-reductions in DS-ALL patients
due to excessive toxicity in earlier courses. Hence, these differences are most likely explained
by differential pharmacodynamic effects in the tissues/organs of MTX between DS and
non-DS children. Based on the clinical experience in this retrospective study, no major safety

CHAPTER 3
64
concerns were observed when using intermediate dosages of MTX (1-3 gr/m2) in DS-ALL
children, and hence this might be a safe dose to consider in future studies.
aCknOwLedGemenTS
We thank all the clinicians, nurses and laboratory technicians and data-managers in the
DCOG centers that participated in this study.

65
CHAPTER 3
3
referenCeS
1. Weijerman ME, van Furth AM, Vonk Noor-degraaf A, van Wouwe JP, Broers CJ, Gemke RJ. Prevalence, neonatal characteristics, and first-year mortality of Down syndrome: a national study. J Pediatr. 2008; 152(1): 15-19.
2. Whitlock JA, Sather HN, Gaynon P, et al. Clini-cal characteristics and outcome of children with Down syndrome and acute lympho-blastic leukemia: a Children’s Cancer Group study. Blood. 2005; 106(13): 4043-4049.
3. Chessells JM, Harrison G, Richards SM, et al. Down’s syndrome and acute lymphoblastic leukaemia: clinical features and response to treatment. Arch Dis Child. 2001; 85(4): 321-325.
4. Dordelmann M, Schrappe M, Reiter A, et al. Down’s syndrome in childhood acute lym-phoblastic leukemia: clinical characteristics and treatment outcome in four consecutive BFM trials. Berlin-Frankfurt-Munster Group. Leukemia. 1998; 12(5): 645-651.
5. Zeller B, Gustafsson G, Forestier E, et al. Acute leukaemia in children with Down syndrome: a population-based Nordic study. Br J Haematol. 2005; 128(6): 797-804.
6. Forestier E, Izraeli S, Beverloo B, et al. Cyto-genetic features of acute lymphoblastic and myeloid leukemias in pediatric patients with Down syndrome: an iBFM-SG study. Blood. 2008; 111(3): 1575-1583.
7. Hasle H, Clemmensen IH, Mikkelsen M. Risks of leukaemia and solid tumours in individuals with Down’s syndrome. Lancet. 2000; 355(9199): 165-169.
8. Moericke A. ZM, Schwarz C., Mann G., Schmid H., Niemeyer C., Schrappe M., . Excellent event-free survival despite higher incidence of treatment-related toxicity and mortility in Down syndrome patients with acute lymphoblastic leukemia as compared to patients without Down syndrome: data from the ALL-BFM 2000 trial P018. 5th Bi-annual Symposium on Childhood Leukemia 2006 Noordwijkerhout; 2006: 45-46.
9. Stanulla M, Cario G, Meissner B, et al. Integrating molecular information into treatment of childhood acute lymphoblastic leukemia--a perspective from the BFM Study Group. Blood Cells Mol Dis. 2007; 39(2): 160-163.
10. Kager L, Cheok M, Yang W, et al. Folate pathway gene expression differs in subtypes of acute lymphoblastic leukemia and influ-ences methotrexate pharmacodynamics. J Clin Invest. 2005; 115(1): 110-117.
11. Rots MG, Pieters R, Kaspers GJ, Veerman AJ, Peters GJ, Jansen G. Classification of ex vivo methotrexate resistance in acute lymphoblastic and myeloid leukaemia. Br J Haematol. 2000; 110(4): 791-800.
12. Rots MG, Pieters R, Peters GJ, et al. Role of folylpolyglutamate synthetase and folyl-polyglutamate hydrolase in methotrexate accumulation and polyglutamylation in childhood leukemia. Blood. 1999; 93(5): 1677-1683.
13. Masson E, Relling MV, Synold TW, et al. Accu-mulation of methotrexate polyglutamates in lymphoblasts is a determinant of antileuke-mic effects in vivo. A rationale for high-dose methotrexate. J Clin Invest. 1996; 97(1): 73-80.
14. Peeters MA, Rethore MO, Lejeune J. In vivo folic acid supplementation partially corrects in vitro methotrexate toxicity in patients with Down syndrome. Br J Haematol. 1995; 89(3): 678-680.
15. Taub JW, Ge Y. Down syndrome, drug me-tabolism and chromosome 21. Pediatr Blood Cancer. 2005; 44(1): 33-39.
16. Garre ML, Relling MV, Kalwinsky D, et al. Pharmacokinetics and toxicity of methotrex-ate in children with Down syndrome and acute lymphocytic leukemia. J Pediatr. 1987; 111(4): 606-612.
17. Kamps WA, Bokkerink JP, Hakvoort-Cammel FG, et al. BFM-oriented treatment for chil-dren with acute lymphoblastic leukemia without cranial irradiation and treatment

CHAPTER 3
66
reduction for standard risk patients: results of DCLSG protocol ALL-8 (1991-1996). Leuke-mia. 2002; 16(6): 1099-1111.
18. Veerman AJ, Kamps WA, van den Berg H, et al. Dexamethasone-based therapy for childhood acute lymphoblastic leukaemia: results of the prospective Dutch Childhood Oncology Group (DCOG) protocol ALL-9 (1997-2004). Lancet Oncol. 2009; 10(10): 957-966.
19. Beal SL. BA SL. NONMEM: Users Guides University of California at San Francisco; 1988-1992.
20. Anderson BJ, Holford NH. Mechanism-based concepts of size and maturity in pharmaco-kinetics. Annu Rev Pharmacol Toxicol. 2008; 48: 303-332.
21. Ette EI. Statistical graphics in pharmacoki-netics and pharmacodynamics: a tutorial. Ann Pharmacother. 1998; 32(7-8): 818-828.
22. Ette EI, Sun H, Ludden TM. Balanced designs in longitudinal population pharmacokinetic studies. J Clin Pharmacol. 1998; 38(5): 417-423.
23. Ette EI, Sun H, Ludden TM. Ignorability and parameter estimation in longitudinal phar-macokinetic studies. J Clin Pharmacol. 1998; 38(3): 221-226.
24. Peeters M, Poon A. Down syndrome and leukemia: unusual clinical aspects and unexpected methotrexate sensitivity. Eur J Pediatr. 1987; 146(4): 416-422.
25. Shah N, Al-Ahmari A, Al-Yamani A, Dupuis L, Stephens D, Hitzler J. Outcome and toxicity of chemotherapy for acute lymphoblastic leukemia in children with Down syndrome. Pediatr Blood Cancer. 2009; 52(1): 14-19.
26. Aumente D, Buelga DS, Lukas JC, Gomez P, Torres A, Garcia MJ. Population pharmacoki-netics of high-dose methotrexate in children with acute lymphoblastic leukaemia. Clin Pharmacokinet. 2006; 45(12): 1227-1238.
27. Plard C, Bressolle F, Fakhoury M, et al. A lim-ited sampling strategy to estimate individual pharmacokinetic parameters of methotrex-ate in children with acute lymphoblastic
leukemia. Cancer Chemother Pharmacol. 2007; 60(4): 609-620.
28. Relling MV, Fairclough D, Ayers D, et al. Patient characteristics associated with high-risk methotrexate concentrations and toxicity. J Clin Oncol. 1994; 12(8): 1667-1672.
29. Wall AM, Gajjar A, Link A, Mahmoud H, Pui CH, Relling MV. Individualized methotrexate dosing in children with relapsed acute lym-phoblastic leukemia. Leukemia. 2000; 14(2): 221-225.
30. Ueland PM, Refsum H, Christensen B. Metho-trexate sensitivity in Down’s syndrome: a hypothesis. Cancer Chemother Pharmacol. 1990; 25(5): 384-386.
31. Zwaan MC, Reinhardt D, Hitzler J, Vyas P. Acute leukemias in children with Down syndrome. Pediatr Clin North Am. 2008; 55(1): 53-70.
32. Zwaan CM, Kaspers GJ, Pieters R, et al. Differ-ent drug sensitivity profiles of acute myeloid and lymphoblastic leukemia and normal pe-ripheral blood mononuclear cells in children with and without Down syndrome. Blood. 2002; 99(1): 245-251.
33. von Stackelberg A, Hartmann R, Buhrer C, et al. High-dose compared with intermediate-dose methotrexate in children with a first relapse of acute lymphoblastic leukemia. Blood. 2008; 111(5): 2573-2580.
34. Belkov VM, Krynetski EY, Schuetz JD, et al. Reduced folate carrier expression in acute lymphoblastic leukemia: a mechanism for ploidy but not lineage differences in metho-trexate accumulation. Blood. 1999; 93(5): 1643-1650.
35. Cheok MH, Evans WE. Acute lymphoblastic leukaemia: a model for the pharmacoge-nomics of cancer therapy. Nat Rev Cancer. 2006; 6(2): 117-129.
36. de Jonge R, Tissing WJ, Hooijberg JH, et al. Polymorphisms in folate-related genes and risk of pediatric acute lymphoblastic leuke-mia. Blood. 2009; 113(10): 2284-2289.
37. Huang L, Tissing WJ, de Jonge R, van Zelst BD, Pieters R. Polymorphisms in folate-

67
CHAPTER 3
3
related genes: association with side effects of high-dose methotrexate in childhood acute lymphoblastic leukemia. Leukemia. 2008; 22(9): 1798-1800.
38. Kishi S, Cheng C, French D, et al. Ancestry and pharmacogenetics of antileukemic drug toxicity. Blood. 2007; 109(10): 4151-4157.
39. Frost BM, Gustafsson G, Larsson R, Nygren P, Lonnerholm G. Cellular cytotoxic drug sensitivity in children with acute leukemia and Down’s syndrome: an explanation to differences in clinical outcome? Leukemia. 2000; 14(5): 943-944.
40. Yamada S, Hongo T, Okada S, et al. Distinc-tive multidrug sensitivity and outcome of acute erythroblastic and megakaryoblastic leukemia in children with Down syndrome. Int J Hematol. 2001; 74(4): 428-436.
41. Taub JW, Stout ML, Buck SA, et al. Myelo-blasts from Down syndrome children with acute myeloid leukemia have increased in vitro sensitivity to cytosine arabinoside and daunorubicin. Leukemia. 1997; 11(9): 1594-1595.


4
Frequency and prognostic implications of JAK 1-3 aberrations in Down syndrome acute lymphoblastic and myeloid leukemias
M. Blink, T.D. Buitenkamp, A.A. Danen- van Oorschot, V. de Haas, D.
Reinhardt, J-H. Klusmann, M. Zimmermann, M. Devidas, A.J. Carroll,
G. Basso, A. Pession, H. Hasle, R. Pieters, M.M. van den Heuvel-
Eibrink, K.R. Rabin, S. Izraeli, C.M. Zwaan
Leukemia. 2011 Aug; 25(8):1365-8.

aBSTraCT
Children with Down Syndrome (DS) have an increased risk of developing acute lymphoblastic
leukemia (DS ALL) and acute myeloid leukemia (ML-DS). ML-DS can be preceded by transient
leukemia (TL). As most studies focus only on known mutations, the true frequency of JAK
mutations in acute leukemias in Down syndrome may be underestimated. We performed
mutational analysis of the whole kinase and pseudokinase domains of JAK 1-3 by direct
sequencing of 6 TL, 14 ML-DS and 35 DS ALL samples and related this to outcome. JAK1 muta-
tions were found in 1 ML-DS patient and 1 DS ALL patient. One TL patient and 1 ML-DS patient
harbored a JAK3 mutation. Six DS ALL patients had a JAK2 mutation and their 10-year event
free survival (EFS) was 100% vs. 75 +/- 9 % in wildtype patients (p=0.27); the 10-year overall
survival (OS) was 100% vs. 86 +/- 7% (p=0.3) and the cumulative incidence of relapse (CIR)
was 0% vs. 21 +/- 9% (p= 0.32). Moreover, a large meta-analysis did not show any differences
in survival of JAK2 mutants compared to wildtype patients. In summary, JAK mutations are
rare in DS-leukemias, except for JAK2 mutations in DS ALL, which have no prognostic value.

71
CHAPTER 4
4
inTrOduCTiOn
Children with Down Syndrome (DS) have an increased risk of developing leukemia, including
both acute myeloid (ML-DS) and acute lymphoblastic leukemia (DS ALL).1 These leukemias
differ in clinical characteristics and biology from leukemias in non-DS children. ML-DS is char-
acterized by a low diagnostic white blood cell count (WBC), young age, FAB M7 morphology,
excellent clinical outcome with survival rates of >90%, and a high sensitivity to chemotherapy
in vivo and in-vitro.2,3 Reduced intensity treatment in ML-DS does not lead to an increase
in relapse rates, however, due to a decrease in treatment related mortality, it does result in
improved overall survival.4,5 ML-DS is often preceded by transient leukemia in newborns (TL),
which in most cases resolves spontaneously. Approximately 20% of TL-patients subsequently
develop ML-DS.6,7 Both the TL and ML-DS blasts are characterized by mutations in the GATA-
1 gene, a hematopoietic transcription factor, which result in a truncated protein GATA1s.8
Because these mutations occur both in TL and ML-DS, additional genetic abnormalities are
needed in the progression from TL to ML-DS.
The prognosis of DS ALL patients is at best similar and often inferior to that of non-DS ALL
patients.9,10 This is in agreement with findings from cellular cytotoxicity assays that showed
that. DS ALL cells do not have increased sensitivity to chemotherapy in vitro.3 Consequently,
in DS ALL dose-reduction should only be considered in case of unacceptable toxicity arising
during treatment. Favorable prognostic factors in non-DS ALL such as high hyperdiploidy and
ETV6-RUNX1 gene-rearrangements are less frequently found in DS ALL, as well as unfavorable
factors such as Philadelphia-chromosome or MLL-rearrangements.11,12
Janus kinases (JAK) belong to a family of intracellular non-receptor protein tyrosine kinases
that transduce cytokine-mediated signals via the STAT family of transcription factors. JAK
plays an important role in regulating the processes of cell proliferation, differentiation and
apoptosis in response to growth factors. The JAK2 V617F mutation is well-known in myelo-
proliferative disorders (MPD), and result in the impaired ability of the pseudokinase domain
to negatively regulate the kinase domain.13 The expression of JAK2 V617F in mouse models
leads to the development of a disease with a similar phenotype to polycythemia vera, with
eventual progression to myelofibrosis, underscoring the role of this mutation in the patho-
genesis of myeloproliferative disorders.14,15 We and others have previously described activat-
ing mutations in JAK2 and JAK3 in TL and ML-DS.16,17 Mutations within the pseudokinase
domain of JAK2 in DS ALL patients have also recently been reported. These activating JAK2
R683 mutations occur at a different site than the V617F mutation, but both these mutations
are localized in the pseudokinase domain and both have the same functional consequence,
i.e. constitutive kinase activity.18-20
As most studies only focus on known mutations in JAK, and hence may underestimate
mutational frequency, we performed mutational analysis of the whole kinase and pseudoki-
nase domains of JAK 1-3 by direct sequencing.16,17,19-22 Moreover, we analyzed the prognostic

CHAPTER 4
72
significance of JAK2 mutations in DS ALL in our cohort. As all cohorts of the prognostic impact
of JAK2 mutations in DS ALL are small, we collected all clinical data from these series,18,19 and
performed a meta-analysis, assuming that since most JAK mutations have been described to
be activating mutations,18 they will result in increased proliferation and hence in increased
relapse rates.
deSiGn and meThOdS
Patient samples
We screened 6 TL, 15 ML-DS (TL and ML-DS samples were unpaired) and 35 DS ALL samples
taken at initial diagnosis. TL and ML-DS patients were diagnosed between 1994 and 2007. DS
ALL patients were diagnosed between 1992 and 2008 and were treated according to subse-
quent DCOG treatment protocols ALL 8, 9 and 10. Details of these treatment protocols have
been reported elsewhere, except for protocol ALL10, which is currently ongoing.23,24 Clinical
and cell-biological data, including cytogenetic data, were available for all mutated cases.
Samples were provided by the Dutch Childhood Oncology Group, the AML-‘Berlin-Frankfurt-
Munster’ Study Group, and the Nordic Society for Pediatric Hematology and Oncology. All
study groups performed central review of the diagnosis, classification and clinical follow-up
of the patients. All investigations had been approved by the Institutional Review Board, and
informed consent was obtained according to local law and regulations.
Low-density mononuclear cell populations of bone marrow or peripheral blood were
isolated after density gradient centrifugation of the sample using Ficoll Isopaque. All re-
sulting samples contained 80% or more leukemic cells, as determined morphologically by
May-Grünwald-Giemsa (Merck, Darmstadt, Germany)–stained cytospins. Genomic DNA was
extracted using standard methods.
Mutation analysis
For mutational analyses, all exons encoding the kinase and pseudokinase domains of JAK1
(exon 12-25), JAK2 (exon 12-25) and JAK3 (exon 12-24) were PCR amplified. All ML-DS and TL
samples were screened for GATA-1 mutations in exon 2 and 3. Purified PCR products of JAK 1-3
and GATA-1 were bi-directionally sequenced on an ABI Prism 3100 genetic analyzer (Applied
Biosystems Inc., Foster City, CA, USA). The sequence data were assembled and analyzed for
mutations using CLC Workbench version 3.5.1 (CLC Bio, Aarhus, Denmark).

73
CHAPTER 4
4
Statistics
For statistical comparisons the Statistical Package for the Social Sciences (SPSS) Analysis
system (v.15.0, SPSS Inc., Chicago, IL, USA) was used. P-values less than or equal to 0.05 were
considered statistically significant (two-tailed testing).
To evaluate outcome, the following parameters were used: complete remission rate (CR),
event-free survival (EFS), overall survival (OS) and cumulative incidence of relapse (CIR).
CR was defined as less than 5% blasts in the bone marrow, with regeneration of tri-lineage
hematopoiesis plus absence of leukemic cells in the cerebrospinal fluid or elsewhere. Patients
who did not achieve CR were considered as treatment failure on day 0. OS was measured
from the date of diagnosis to the date of last follow-up or date of death from any cause. EFS
was calculated from the date of diagnosis to the date of last follow-up or to the first event,
including relapse, death in CR, and failure to achieve CR. The Kaplan-Meier method was used
to estimate the 10-year probabilities of OS (OS), and EFS (EFS), and survival estimates were
compared using the log-rank test. CIR (with treatment related death as competing event)
was constructed by the method of Kalbfleisch and Prentice and compared by the Gray test.
Statistical analysis was only performed when at least 5 patients were available in a given
subgroup.
For the meta-analysis we collected the original outcome data from all participating study
groups and evaluated OS and EFS.
reSuLTS
Patient characteristics
All 35 DS ALL patients were classified as B-cell precursor ALL and enrolled in consecutive
DCOG treatment protocols (DCOG ALL 8, 9 and 10). The median age of DS ALL patients was
4.5 years (range 2.0-17.1 years), the median WBC was 8.7x10⁹/l (range 1.2-390x109/l), and
51% of the patients were male. The median age of the ML-DS patients was 2.0 years (range
0.7-2.4 years), the median WBC was 8,0 x10⁹/l (range 2.6-168 x109/l) and 36% were male. The
TL patients had a median age of 1.5 days (range 1-6 days) with a median WBC of 172.8 x10⁹/l
(range 35-410 x109/l) and 67% were male.
The median follow up time for survivors with DS ALL was 5.2 years (range 1.1 – 15.4 years)
and for survivors with ML-DS 1.9 years (range 0-16.4 years). The patient characteristics of the
TL, ML-DS and DS ALL patients as well as JAK 1-3 mutations are described in detail Table 1
and Table 2.

CHAPTER 4
74
Table 1. Clinical and genetic characteristics of the included transient and myeloid leukemia of Down syndrome
id disease Sex age wBC karyotype JAKGATA 1
mutation
1TL Male
1 day 64 NA JAK3 A573V
itd 105 bpt
2TL Female
2 days 193 47,XX,+21c
WT del 2 bp
3TL Male
1 day 35 NA
WT ins 14 bp
4TL Female
2 days 173 NA
WTdel 1 bp, ins
2 bp
5TL Male
6 days NA NA
WTdel 2 bp
6TL Male
1 day 410 NA
WTins 14 bp
7 ML-DS Female 0.7 4 NA JAK3 A573V del 4 bp
8 ML-DS Female 2.2 7
45-46,XX,der(1)t(1;6)(q31;q?),ins(4;1)(q12;q25q44),-6,-7,der(7)t(6;7)(p21;p22),der(7)t(7;8)(q2?2;q2?3),der(11)
t(7;11)(p14;p15),+21c,der(22)t(1;22)(q25;p11)[cp13]/47,XX,+21c[28]
JAK 1 D625R ins 7 bp
9ML-DS Male
1.36
47,XY,+21c 2/47,idem,t(4;15),(q?21;q?21),del(7)(q?31q?33)
WT ins 16 bp
10 ML-DS Male 2.0 26 NA WT del 2 bp
11 ML-DS Female 2.2 9 NA WT del 2 bp
12 ML-DS Female 2.0 168 NA WT pointmutation
13 ML-DS Female 2.0 6 NA WT ins 1 bp
14 ML-DS Male 2.3 12 NA WT ins 14 bp
15 ML-DS Female 0.9 19 NA WT del 5 bp
16 ML-DS Male 1.8 7 47,XY,+21c [3] WT ins 4 bp
17 ML-DS Male 1.4 648,X,ins(Y;5)(q11;?),der(3)t(3;6)(q2?8;?) or ins(3;6)(q2?8;?),-5,del(6)(q1?4q2?4),+21c,+21,+mar [24]
WTdel 3 bp, ins
5 bp
18 ML-DS Female 2.3 49 47,XX,der(9)inv(9)(p24;q2?1)del(9)(q2q3) [14] WT del 3 bp
19 ML-DS Female 1.9 40 47,XX,der(1)t(1;1)(p36;q21),t(5;6)(p15;p23),+21c [23] WT del 6 bp
20ML-DS Female
2.43
47,XX,r(7)(p22q22),+21c,.ish r(7)(WCP7+,D7Z1+,D7S486-,164D18-,3K23-)
WT pointmutation
WBC= white blood cell count (*109/l); WT = wildtype; NA = not available. Age in years (except for TL). Karyotype nomenclature according to ISCN 1995.
Table 2. Clinical and genetic characteristics of the included Down syndrome acute lymphoblastic leukemia patients
id ipT Sex age wBC karyotype JAK GATA 1
21 C-ALL Male 3.1 7 48,XY,+X,+21c[19]JAK-2 R683
insertion GGCCCCATC
WT
22 C-ALL Female 2.7 2 50,XX,+X,+4,+17,+21c[5]/47,XX,21c[5] JAK-2 R683 WT

75
CHAPTER 4
4
Table 2. (Continued)
id ipT Sex age wBC karyotype JAK GATA 1
23 C-ALL Male 2.2 18 47,XY,+21c[20] JAK-2 R683 WT
24 PRE-B Male 3.8 3 47,XY,+21c[22] JAK-2 R683 WT
25 C-ALL Male 3.3 4 47,XY,+21c JAK-2 R683 WT
26 PRE-B Female 6.2 5 46,XX,der(14;21)(q10;q10)c,+21c[27] JAK-2 R683 WT
27 C-ALL Female 3.4 17 47,XX,+21c[20] JAK-1 V651M WT
28 C-ALL Male 9.2 30 48,XY,+X,t(8;14)(q12;q32),+21c/47,XY,+21c WT WT
29 PRE-B Female 4.9 4 47,XX,+21c[30] WT WT
30 PRE-B Female 2.6 18 48,XX,+X,add(18)(q22),+21c[2]/47,XX,+21c[30] WT WT
31 C-ALL Male 13.5 1 56,XY,+X,+4,+10,+14,+14,+17,+18,+18,+21c,+mar[13]/47,XY,+21c[9] WT WT
32 C-ALL Male 15.4 447,XY,t(1;3)(q32;q26),t(2;12)(q23;q13),t(7;8)(q31;q12),del(13)(q14q32),+21c[17]/40-46,idem[4]
WT WT
33 PRE-B Female 4.0 48 NA WT WT
34 PRE-B Female 2.6 9 57,XX,+5,+6,+17,+18,+21c,+5mar[cp23]/47,XX,+21c[9] WT WT
35 C-ALL Male 4.2 4146,XY,t(8;9)(q24;p13),del(12)(p13.1),?dic(12;13)(p11.2;p10),+21c[20].ish del(12)(TEL-,AML1-,CEP12+),?dic(12;13)(TEL-,AML1-,CEP12+)
WT WT
36 PRE-B Female 2.8 33 47,XX,+21c WT WT
37 PRE-B Male 3.9 78 47,XY,+21c WT WT
38 PRE-B Male 5.6 5 47,XX,+21c WT WT
39 C-ALL Female 7.9 13 47,XX,+21c[21] WT WT
40 C-ALL Male 6.8 19947,XY,der(9)del(9)(p13p2?2)t(9;22)(q34;q11),+21c,der(22)t(9;22)[15]/47,idem,add(21)(q22)[7]/47,XY,+21c[1]
WT WT
41 C-ALL Male 3.7 17 48,XY,+21c,+mar[4]/48,XY,+X,+21c[3]/47,XY+21c[13] WT WT
42 C-ALL Male 17.1 20 47,XY,+21c[20] WT WT
43 C-ALL Female 7.0 33 47,XX,del(12)(p11p13),+21c[18]/47,XX,+21c[2] WT WT
44 C-ALL Male 2.0 112 47,XY,+21c WT WT
45 C-ALL Female 8.4 458~59,XX,+4[3],+6,+10[2],+11,+?14,+18[2],+21,+21c,+1~5mar,inc[cp4]/47,XX,+21c[5]
WT WT
46 PRO-B Male 13.3 7 46,XY,-13,+21c[17]/47,XY,+21c[3] WT WT
47 C-ALL Female 13.8 2 49,XX,+X,+5,+21c WT WT
48 C-ALL Male 5.5 5 47,XY,+21c WT WT
49 C-ALL Female 8.1 390 47,XX,-2,-8,+21c,+mar1,+mar2[8]/46,idem,-X/47,XX,+21c[3] WT WT
50 PRE-B Female 5.4 4 47,XX,add(17)(q2?5),+21c[4]/47,XX,+21c[28] WT WT
51 PRE-B Male 4.9 11 47,XY,+21c[32] WT WT
52 C-ALL Female 3.7 947,XX,+X,-13,i(17)(q10),der(19)t(13;19)(q1?3;q1?2),+21c[15]/47,idem,del(12)(q1?4q2?1)[7]/52,idem,+3,+10,+14,+21,+21[2]/47,XX,+21c[29]
WT WT
53 C-ALL Male 2.3 6 47,XY,+21c WT WT
54 PRE-B Female 4.5 6 47,XX,+21c[32] WT WT
55 C-ALL Female 4.5 5 47 XX +21c [5] WT WT
WBC=white blood cell count (*109/l) ; WT = wildtype; IPT= immunophenotype; NA = not available. Age in years. Karyotype nomenclature according to ISCN 1995

CHAPTER 4
76
Mutation analysis
GATA1 mutations were identified in all ML-DS and TL cases (details are given in Table 1).
Mutations in JAK1 were found in 1 (7%) ML-DS patient (D625R), and in 1 (3%) DS ALL patient
(V651M). These were both missense mutations leading to substitution of a single amino
acid which are predicted to result in an altered protein. No events occurred in either of the
patients with a follow-up of 2.4 and 3.1 years, respectively. See Figure 1 for the localization of
the mutations in JAK 1-3.
JAK2 mutations were not identified in any of the TL and ML-DS patients. However, JAK2
R683 activating mutations were found in 6/35 (17%) of the DS ALL patients. In 5 patients a
substitution of nucleotides A à G was found which resulted in a substitution of arginine with
glycine and 1 patient had an insertion of 9 base pairs (GGCCCCATC) immediately upstream
of R683. In DS ALL, cases with JAK2 mutations were significantly younger than the wildtype
patients, with a median age of 3.2 year versus 4.9 years (p= 0.044). There were no significant
differences in other characteristics such as WBC, sex, and cytogenetics between the JAK2
mutated and the wildtype DS ALL patients.
One TL-patient (17%) and 1 ML-DS patient (7%) harbored the JAK3 A573V-mutation. Both
patients are in continuous complete remission (CCR) with a follow up of 1.4 and 1.9 years,
respectively.
Survival analysis
None of the 6 JAK2 mutated DS ALL patients experienced an event, whereas 5 of the 29
patients with wildtype JAK2 relapsed, and one died of treatment-related toxicity. Using
Figure 1. Localization of mutations in JAK 1-3Schematic overview of the structure of JAK 1-3 with the kinase, pseudokinase and FERM (4.1-ezrin-radixin-moesin) domain in which the location of the mutations we identified is indicated. Mutations in Down syndrome ALL are depicted in black, mutations in myeloid leukemia of Down syndrome and transient myeloproliferative leukemia in grey.

77
CHAPTER 4
4
Kaplan-Meier analysis (see graphs in Figure 2), no significant differences in clinical outcome
were detected: the 10-year EFS for JAK2 mutated versus JAK2 wildtype patients was 100% vs.
75 +/- 9%; (p=0.27), the 10 year OS 100% vs. 86 +/- 7% (p=0.3). The cumulative incidence of
relapse at 10 years after diagnosis in JAK2 wildtype patients was 21 +/- 9% versus 0% in the
JAK2 mutated group; ( p(Gray)= 0.32).
Meta-analysis
To assess the impact of JAK2 mutations on the survival in a larger cohort of patients, we per-
formed a meta-analysis of the data of 3 studies taken together pooling our data with those
of Bercovich et al, and Gaikwad et al.17-18 This analysis did not show a statistical significant
difference for the JAK2 wildtype versus the JAK2 mutated patients. Six year EFS was 71 +/- 5%
vs. 74 +/- 10%; P= 0.63 and OS was 76.0 +/- 4% vs. 89 +/- 6%; P= 0.30 (Figure 3A and 3B).
Figure 2. Ten years survival parameters of JAK2 R683 mutations in DS ALL patientsThe event-free survival, 100% versus 75±9%; p= 0.27 (A), overall survival, 100% versus 86±7%; p= 0.30 (B), and cumulative incidence of relapse, 0% versus 21±9%; p= 0.32 (C) are depicted for patients with JAK2 R683 mutations (grey line) and wildtype JAK2 (black line).
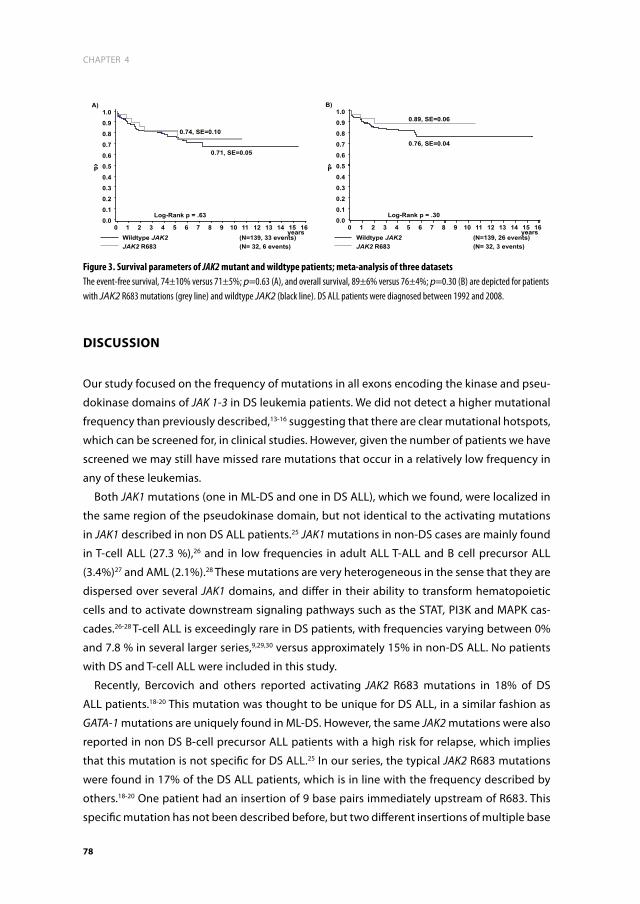
CHAPTER 4
78
diSCuSSiOn
Our study focused on the frequency of mutations in all exons encoding the kinase and pseu-
dokinase domains of JAK 1-3 in DS leukemia patients. We did not detect a higher mutational
frequency than previously described,13-16 suggesting that there are clear mutational hotspots,
which can be screened for, in clinical studies. However, given the number of patients we have
screened we may still have missed rare mutations that occur in a relatively low frequency in
any of these leukemias.
Both JAK1 mutations (one in ML-DS and one in DS ALL), which we found, were localized in
the same region of the pseudokinase domain, but not identical to the activating mutations
in JAK1 described in non DS ALL patients.25 JAK1 mutations in non-DS cases are mainly found
in T-cell ALL (27.3 %),26 and in low frequencies in adult ALL T-ALL and B cell precursor ALL
(3.4%)27 and AML (2.1%).28 These mutations are very heterogeneous in the sense that they are
dispersed over several JAK1 domains, and differ in their ability to transform hematopoietic
cells and to activate downstream signaling pathways such as the STAT, PI3K and MAPK cas-
cades.26-28 T-cell ALL is exceedingly rare in DS patients, with frequencies varying between 0%
and 7.8 % in several larger series,9,29,30 versus approximately 15% in non-DS ALL. No patients
with DS and T-cell ALL were included in this study.
Recently, Bercovich and others reported activating JAK2 R683 mutations in 18% of DS
ALL patients.18-20 This mutation was thought to be unique for DS ALL, in a similar fashion as
GATA-1 mutations are uniquely found in ML-DS. However, the same JAK2 mutations were also
reported in non DS B-cell precursor ALL patients with a high risk for relapse, which implies
that this mutation is not specific for DS ALL.25 In our series, the typical JAK2 R683 mutations
were found in 17% of the DS ALL patients, which is in line with the frequency described by
others.18-20 One patient had an insertion of 9 base pairs immediately upstream of R683. This
specific mutation has not been described before, but two different insertions of multiple base
Figure 3. Survival parameters of JAK2 mutant and wildtype patients; meta-analysis of three datasetsThe event-free survival, 74±10% versus 71±5%; p=0.63 (A), and overall survival, 89±6% versus 76±4%; p=0.30 (B) are depicted for patients with JAK2 R683 mutations (grey line) and wildtype JAK2 (black line). DS ALL patients were diagnosed between 1992 and 2008.

79
CHAPTER 4
4
pairs at this position have been reported, and were considered to have an effect analogous to
R683 mutations because of their location.18
In contrast to the non DS B-cell precursor high-risk ALL patients with JAK2 mutations who
were found to have a high relapse rate,25 none of the JAK2 mutated DS ALL patients in our
cohort experienced an event. The observed better outcome for JAK2 mutated patients was,
however, not statistically significant. So far, only two other studies report on the clinical
relevance of JAK2 mutations in DS-ALL and both studies are in agreement with our results
reported here. Bercovich et al. reported a 5-year EFS of 73% in JAK2 wildtype patients (n=62)
versus 78% in JAK2 mutated patients (n= 16), which was also not statistically significant.17
In addition, Gaikwad et al. described a 5-year EFS in JAK2 wildtype patients (n=43) of 76.3
% versus 87.5% in JAK2 mutated patients (n=10), again a statistically non-significant differ-
ence.19 A combined analysis of our data plus the 2 studies just mentioned above showed
no statistically significant difference in survival between JAK2 mutated and JAK2 wildtype
patients. Since this meta-analysis includes 32 mutated cases and 139 wildtype cases, it pro-
vides substantially greater certainty that there is no survival advantage for DS ALL patients
with a JAK2 mutation.
JAK mutations play a role in activation of the JAK-STAT pathway, resulting in a proliferation
advantage for leukemic cells,18 which led to our initial hypothesis that they would be associ-
ated with poor clinical outcome. One possible explanation for the observed good clinical
outcome may be that this increased proliferation could contribute to enhanced sensitivity to
chemotherapy. However, this is contradictory with the outcome of JAK2 mutants in high-risk
ALL, in which patients with a JAK2 mutation have a high risk for relapse.25 This may be due to
currently unknown differences in step-wise leukemogenesis or cooperating genetic events
between DS and non-DS JAK2 mutated ALL.
Both one TL patient and one ML-DS patient harbored a JAK3 A573V-mutation. This activat-
ing mutation has previously been described in ML-DS patients and the megakaryoblastic
cell line CMY.21 It has been suggested that JAK3 mutations may be associated with a more
aggressive form of ML-DS.16 However, our 2 patients with a JAK3 mutation are in continuous
complete remission (CCR) with a follow up of 1.4 and 1.9 years, respectively.
Of interest, JAK mutated cases may be sensitive to JAK-inhibitors.25 This might be of benefit,
since it is well-known that DS patients have an increased risk for chemotherapy related mor-
bidity and mortality. In myeloproliferative disorders, several JAK-inhibitors are already used.31
Remarkably, patients with and without the JAK2 V617F mutation may benefit to the same
extent which is due to the fact that the current inhibitors do not differentially inhibit mutated
and wildtype JAK2, because of the location of the mutation outside the ATP-binding pocket
of the enzyme.10 Treatment results in a decrease in organomegaly in responding patients.31,32
The major side-effect of JAK2 inhibitors is myelosuppression, which is due to suppression of
wildtype JAK2 that is required for normal hematopoiesis,13 and which may render it difficult
to combine JAK inhibitors with chemotherapy. Given that JAK2 mutated DS ALL cases do not

CHAPTER 4
80
have worse outcome it is difficult to predict whether the cells are addicted to the constitutive
activity of JAK2, and hence whether inhibiting this will provide a benefit to these patients. We
therefore feel that studies with JAK2 inhibitors in DS ALL patients require further pre-clinical
evidence of potential benefit before implementation.
Unfortunately, due to limited availability of our samples, we were not able to show activa-
tion of the JAK-STAT pathway at the protein level in the Down syndrome patients, and hence
we may have missed patients that have JAK-STAT activation due to other mechanisms than
mutations in JAK. Hence, further research is needed to identify potential JAK-STAT activation
and its causes in patients without JAK-mutations. For instance, it is known that MPL (myelo-
proliferative leukemia virus oncogene) mutations may also activate the JAK-STAT pathway.13
In an earlier study in 8 TL and ML-DS patients these MPL mutations were not found.22
In conclusion, JAK1 and JAK3 mutations are rare in DS-leukemias (although there seem to
be mutational hotspots) whereas JAK2 mutations occur relatively frequently in approximately
17% DS ALL cases. Of interest, none of the DS ALL cases with a JAK2 in our cohort mutation
relapsed so far, and a meta-analysis confirmed the lack of prognostic significance for JAK2
mutated DS ALL patients.
aCknOwLedGemenTS
This study was supported by research funding from the foundation Kinderen Kankervrij
(KIKA) and the Sophia Foundation for Medical Research (SSWO) to M.B., T.D.B. and C.M.Z.

81
CHAPTER 4
4
referenCeS
1. Hasle H, Clemmensen IH, Mikkelsen M. Risks of leukaemia and solid tumours in individuals with Down’s syndrome. Lancet. 2000; 355(9199): 165-169.
2. Taub JW, Huang X, Matherly LH, et al. Expres-sion of chromosome 21-localized genes in acute myeloid leukemia: differences between Down syndrome and non-Down syndrome blast cells and relationship to in vitro sensitivity to cytosine arabinoside and daunorubicin. Blood. 1999; 94(4): 1393-1400.
3. Zwaan CM, Kaspers GJ, Pieters R, et al. Differ-ent drug sensitivity profiles of acute myeloid and lymphoblastic leukemia and normal pe-ripheral blood mononuclear cells in children with and without Down syndrome. Blood. 2002; 99(1): 245-251.
4. Creutzig U, Reinhardt D, Diekamp S, Dworzak M, Stary J, Zimmermann M. AML patients with Down syndrome have a high cure rate with AML-BFM therapy with reduced dose intensity. Leukemia. 2005; 19(8): 1355-1360.
5. Abildgaard L, Ellebaek E, Gustafsson G, et al. Optimal treatment intensity in children with Down syndrome and myeloid leukaemia: data from 56 children treated on NOPHO-AML protocols and a review of the literature. Ann Hematol. 2006; 85(5): 275-280.
6. Klusmann JH, Creutzig U, Zimmermann M, et al. Treatment and prognostic impact of transient leukemia in neonates with Down syndrome. Blood. 2008; 111(6): 2991-2998.
7. Zipursky A. Transient leukaemia--a benign form of leukaemia in newborn infants with trisomy 21. Br J Haematol. 2003; 120(6): 930-938.
8. Hitzler JK, Zipursky A. Origins of leukaemia in children with Down syndrome. Nat Rev Cancer. 2005; 5(1): 11-20.
9. Bassal M, La MK, Whitlock JA, et al. Lympho-blast biology and outcome among children with Down syndrome and ALL treated on CCG-1952. Pediatr Blood Cancer. 2005; 44(1): 21-28.
10. Whitlock JA, Sather HN, Gaynon P, et al. Clini-cal characteristics and outcome of children with Down syndrome and acute lympho-blastic leukemia: a Children’s Cancer Group study. Blood. 2005; 106(13): 4043-4049.
11. Forestier E, Izraeli S, Beverloo B, et al. Cyto-genetic features of acute lymphoblastic and myeloid leukemias in pediatric patients with Down syndrome: an iBFM-SG study. Blood. 2008; 111(3): 1575-1583.
12. Maloney KW, Carroll WL, Carroll AJ, et al. Down syndrome childhood acute lympho-blastic leukemia has a unique spectrum of sentinel cytogenetic lesions that influences treatment outcome: a report from the Chil-dren’s Oncology Group. Blood. 2010.
13. Verstovsek S. Therapeutic potential of JAK2 inhibitors. Hematology Am Soc Hematol Educ Program. 2009: 636-642.
14. Lacout C, Pisani DF, Tulliez M, Gachelin FM, Vainchenker W, Villeval JL. JAK2V617F expression in murine hematopoietic cells leads to MPD mimicking human PV with secondary myelofibrosis. Blood. 2006; 108(5): 1652-1660.
15. Wernig G, Mercher T, Okabe R, Levine RL, Lee BH, Gilliland DG. Expression of Jak2V617F causes a polycythemia vera-like disease with associated myelofibrosis in a murine bone marrow transplant model. Blood. 2006; 107(11): 4274-4281.
16. Klusmann JH, Reinhardt D, Hasle H, et al. Janus kinase mutations in the development of acute megakaryoblastic leukemia in chil-dren with and without Down’s syndrome. Leukemia. 2007; 21(7): 1584-1587.
17. Malinge S, Ragu C, Della-Valle V, et al. Activating mutations in human acute mega-karyoblastic leukemia. Blood. 2008; 112(10): 4220-4226.
18. Bercovich D, Ganmore I, Scott LM, et al. Mu-tations of JAK2 in acute lymphoblastic leu-kaemias associated with Down’s syndrome. Lancet. 2008; 372(9648): 1484-1492.

CHAPTER 4
82
19. Gaikwad A, Rye CL, Devidas M, et al. Prevalence and clinical correlates of JAK2 mutations in Down syndrome acute lym-phoblastic leukaemia. Br J Haematol. 2009; 144(6): 930-932.
20. Kearney L, Gonzalez De Castro D, Yeung J, et al. Specific JAK2 mutation (JAK2R683) and multiple gene deletions in Down syndrome acute lymphoblastic leukemia. Blood. 2009; 113(3): 646-648.
21. Kiyoi H, Yamaji S, Kojima S, Naoe T. JAK3 mutations occur in acute megakaryoblastic leukemia both in Down syndrome children and non-Down syndrome adults. Leukemia. 2007; 21(3): 574-576.
22. Norton A, Fisher C, Liu H, et al. Analysis of JAK3, JAK2, and C-MPL mutations in transient myeloproliferative disorder and myeloid leukemia of Down syndrome blasts in children with Down syndrome. Blood. 2007; 110(3): 1077-1079.
23. Veerman AJ, Kamps WA, van den Berg H, et al. Dexamethasone-based therapy for childhood acute lymphoblastic leukaemia: results of the prospective Dutch Childhood Oncology Group (DCOG) protocol ALL-9 (1997-2004). Lancet Oncol. 2009; 10(10): 957-966.
24. Kamps WA, Bokkerink JP, Hakvoort-Cammel FG, et al. BFM-oriented treatment for children with acute lymphoblastic leukemia without cranial irradiation and treatment reduction for standard risk patients: results of DCLSG protocol ALL-8 (1991-1996). Leukemia. 2002; 16(6): 1099-1111.25. Mullighan CG, Zhang J, Harvey RC, et al. JAK mutations in high-risk childhood acute lymphoblastic
leukemia. Proc Natl Acad Sci U S A. 2009; 106(23): 9414-9418.26. Jeong EG, Kim MS, Nam HK, et al. Somatic mutations of JAK1 and JAK3 in acute leukemias and solid can-cers. Clin Cancer Res. 2008; 14(12): 3716-3721.
27. Flex E, Petrangeli V, Stella L, et al. Somatically acquired JAK1 mutations in adult acute lym-phoblastic leukemia. J Exp Med. 2008; 205(4): 751-758.
28. Xiang Z, Zhao Y, Mitaksov V, et al. Identifica-tion of somatic JAK1 mutations in patients with acute myeloid leukemia. Blood. 2008; 111(9): 4809-4812.
29. Chessells JM, Harrison G, Richards SM, et al. Down’s syndrome and acute lymphoblastic leukaemia: clinical features and response to treatment. Arch Dis Child. 2001; 85(4): 321-325.
30. Dordelmann M, Schrappe M, Reiter A, et al. Down’s syndrome in childhood acute lym-phoblastic leukemia: clinical characteristics and treatment outcome in four consecutive BFM trials. Berlin-Frankfurt-Munster Group. Leukemia. 1998; 12(5): 645-651.
31. Hitoshi Y, Lin N, Payan DG, Markovtsov V. The current status and the future of JAK2 inhibi-tors for the treatment of myeloproliferative diseases. Int J Hematol. 2010; 91(2): 189-200.
32. Santos FP, Kantarjian HM, Jain N, et al. Phase 2 study of CEP-701, an orally available JAK2 inhibitor, in patients with primary or post-polycythemia vera/essential thrombo-cythemia myelofibrosis. Blood. 2010; 115(6): 1131-1136.


5
Outcome in children with Down syndrome and Acute Lymphoblastic Leukemia: role of IKZF1 deletions and CRLF2 aberrations
T.D. Buitenkamp, R. Pieters, N.E. Gallimore, A. van der Veer,
J.P.P. Meijerink, H.B. Beverloo, M. Zimmermann, V. de Haas, S.M.
Richards, A.J. Vora, C.D. Mitchell, L.J. Russel, C. Schwab, C.J.
Harrison, A.V. Moorman, M.M. van den Heuvel-Eibrink, M.L. den
Boer, C.M. Zwaan
Leukemia. 2012 Oct; 26(10): 2204-11.

aBSTraCT
Children with Down syndrome (DS) have an increased risk of developing acute lymphoblastic
leukemia (ALL) and have a low frequency of established genetic aberrations. We aimed to
determine which genetic abnormalities are involved in DS ALL. We studied the frequency
and prognostic value of deletions in B-cell development genes and aberrations of JAK2 and
CRLF2 using array-CGH, and MLPA in a population-based cohort of 34 DCOG DS ALL samples.
A population-based cohort of 88 DS samples from UK trials was used to validate survival esti-
mates for IKZF1 and CRLF2 abnormalities. In total, 50% of DS ALL patients had ≥1 deletion in
the B-cell development genes: PAX5 (12%), VPREB1 (18%), and IKZF1 (35%). JAK2 was mutated
in 15% of patients, genomic CRLF2 rearrangements in 62%. Outcome was significantly worse
in patients with IKZF1 deletions (6-year EFS 45±16% vs. 95±4%; p=0.002), which was con-
firmed in the validation cohort (6-year EFS 21±12% vs. 58±11%; p=0.002). This IKZF1 deletion
was a strong independent predictor for outcome (Hazard-Ratio EFS 3.05; p=0.001). Neither
CRLF2, nor JAK2 were predictors for worse prognosis. If confirmed in prospective series, IKZF1
deletions may be used for risk-group stratification in DS ALL.

87
CHAPTER 5
5
inTrOduCTiOn
Children with Down syndrome (DS) have an increased risk of developing acute myeloid (AML)
and acute lymphoblastic leukemia (ALL).1 While AML in children with DS is characterized by
unique acquired mutations in the transcription factor GATA1 (globin transcription factor 1),2-4
there is no evidence as yet for such a unique genetic event in DS ALL.
The established cytogenetic abnormalities, such as high hyperdiploidy (51-65 chromo-
somes), ETV6-RUNX1, BCR-ABL1, MLL-rearrangements and TCF3-PBX1, occur in about two-
third of non-DS B-cell precursor (BCP) ALL patients. However, these abnormalities are found
only in approximately 20% of DS children with ALL.5,6 Recently, genomic abnormalities of
Cytokine Receptor Like Factor 2 (CRLF2) have been described in approximately 60% of DS ALL
patients.7 These rearrangements include a) translocations of CRLF2 with the Immunoglobulin
heavy chain locus (IGH@) at chromosome 14q32 and b) interstitial deletions in the pseudo-
autosomal region 1 (PAR1) resulting in P2RY8-CRLF2 fusion.7-9 Functionally, both aberrations
result in overexpression of CRLF2 and activation of the JAK-STAT pathway.7-9 Activating muta-
tions in amino acid R683 of Janus Kinase 2 (JAK2) occur in around 20% of DS ALL cases, which
were initially thought to be unique to DS ALL.6,10-12 Mutations of JAK2 and rearrangements of
CRLF2 are found in <10% and up to 15% of high-risk non DS ALL patients, respectively.8,12-16
Deletions in B-cell development and differentiation genes, including IKZF1, TCF3, EBF1,
PAX5 and VPREB1, have recently been described in DS and non-DS ALL.17-20 The prognostic
significance of abnormalities of these genes in DS ALL is currently unknown. Therefore, we
analyzed a population-based cohort of DS ALL samples for deletions in these genes using ge-
nomic profiling and related these to clinical outcome. The survival parameters were validated
using another population-based cohort of DS ALL patients from UK trials for abnormalities
involving IKZF1 and CRLF2.
maTeriaLS and meThOdS
Patients and patient samples
We identified all DS ALL patients (n=58) enrolled in 3 consecutive Dutch Childhood Oncology
Group (DCOG) ALL treatment protocols (DCOG ALL8, ALL9 and ALL10). Details of DCOG ALL8
and ALL9 have been reported elsewhere, and ALL10 is currently ongoing (Supplementary
figure 1).21,22 In addition, we identified all DS ALL patients (n=114) enrolled in the UK National
Cancer Research Institute (NCRI) Childhood Cancer and Leukaemia Group (CCLG) treatments
protocols ALL97, ALL97/99 and ALL2003, which were used as a validation cohort.23,24 Both,
DCOG and UK treatment protocols were approved by the Institutional Review Board of the
participating centers according to local law and guidelines, and informed consent was ob-
CHAPTER 5
88
tained from all patients, their parents or guardians. Data on clinical characteristics, biological
features and outcome were extracted from national databases.
Vials with frozen cells were available from 34/58 DCOG patients. After thawing, contami-
nating non-leukemic cells were eliminated as previously described.25 Blast percentages were
assessed morphologically on May-Grünwald-Giemsa–stained cytospin slides. All patient
samples contained ≥ 80% leukemic blasts (median 95.5%, range 83% – 99%). Genomic DNA
and total cellular RNA were extracted from leukemic cells using Trizol reagent (Gibco BRL,
Life Technologies, Breda, the Netherlands), as previously described.25 DNA quality was tested
using gel electrophoresis, and DNA quality and quantity were measured on the Nanodrop
1000 spectrophotometer (Isogen, De Meern, the Netherlands). Analyses for UK patients
(n=88) were performed on pre-treatment samples using standard methodologies and were
reported using established nomenclature and definitions.26,27
Cytogenetics and Fluorescence in situ Hybridization
Diagnostic samples were routinely analyzed using standard cytogenetic procedures by the
reference cytogenetic laboratories in the University Hospitals participating in the DCOG and
UK trials. Ploidy status was determined from the karyotypes; if these data were missing array-
CGH results were used. Hypodiploidy was defined as <47 chromosomes, diploidy was defined
as 47 chromosomes, low hyperdiploidy as ≥48 ≤50 chromosomes, and high hyperdiploidy
as ≥ 51 chromosomes. All DCOG and UK samples were further analyzed for the presence
of the ETV6-RUNX1 fusion using fluorescence in-situ hybridization (FISH) with the dual-color
translocation probe set: LSI ETV6 (TEL)/RUNX1(AML1)ES (Vysis).
Genomic CRLF2 aberrations in the DCOG and UK cohorts, and IKZF1 deletions in the UK
cohort were detected using FISH as previously described.8,16 Briefly, we used a break-apart
FISH probe to identify CRLF2 involvement. A break-apart probe to P2RY8 was designed to
map the centromeric breakpoint of the deletion in patients with loss of the centromeric sig-
nal indicating deletion within the pseudo autosomal region centromeric of CRLF2. Combined
results from these two break-apart probes indicated the presence of the P2RY8-CRLF2 fusion.
The involvement of IGH@ was determined by interphase FISH using the LSI IGH Dual Color
Break-Apart Rearrangement Probe (Abbott Diagnostics). Results were recorded using a Zeiss
Axioscop fluorescence microscope (Zeiss) fitted with a 100_/1.30 oil objective, CCD camera
and digital imaging software: ISIS software version 5.1.9 (Metasystems, Germany) and Cytovi-
sion Version 4.5 (Leica Microsystems, UK).
Array-Comparative Genomic Hybridization
To identify copy number changes, particularly in the B-cell development and differentiation
genes: PAX5, VPREB1, TCF3, EBF1 and IKZF1, we performed 105-K oligonucleotide array-CGH

89
CHAPTER 5
5
on genomic DNA on the DCOG cohort as previously described.17,28 Genomic losses and gains
were identified as a minimum of 3 consecutive probes deviating beyond the threshold of -0.8
for single copy loss and -1.8 for bi-allelic loss (log ratio). Deletions were defined as a loss ≥0.5
million bases, whereas focal deletions were defined as losses < 0.5 million bases.17
To further specify deletions of IKZF1 in the DCOG cohort, genomic DNA was PCR amplified
to detect Isoform 6 of the IKZF1 gene with primers previously described.19
Mutation analysis
To analyze mutations in the coding exons of IKZF1 (exon 2-8) and in the JAK2 R683, PCR ampli-
fied DNA was purified and bi-directionally sequenced as previously described.8,29,30
Multiplex Ligation-dependent Probe Amplification (MLPA)
MLPA was used in both DCOG and UK cases for detection and validation of aberrations in
B-cell development and differentiation genes found by array-CGH and to further define
IKZF1 deletions into different splice variants. MLPA analysis was performed using the SALSA
MLPA kit P335-A3 ALL-IKZF1 which contains probes for selected B-cell development and
differentiation genes, and the SALSA MLPA kit P202-A1 IKZF1, which contains an increased
density of probes for IKZF1 (MRC Holland). The full list and location of the MLPA probes can be
downloaded from the MRC Holland website (http://www.mrc-holland.com). The data were
normalized, by dividing the peak area of each probe by the mean peak area of the control
probes. Peak heights below 0.7 (0.75 for MRC UKALL samples) and above 1.3 times the control
peak height were considered abnormal, with those below 0.7 representing deletions, and
those above 1.3 representing duplications.31,32
Gene-expression profiling and Quantitative real-time PCR
Biotinylated cRNA of DCOG subjects was synthesized, hybridized and processed to Affymetrix
U133 plus 2.0 GeneChips (Affymetrix, Santa Clara, CA USA) as previously described.17,31 Data
was acquired using Expresso (BioConductor package Affymetrix) and probe-set intensities
were normalized using the variance-stabilization normalization (VSN) BioConductor package
in the statistical data analysis environment R, version 2.7.0. VSN RMA normalized data was
used to test for statistical differences in the expression of CRLF2 (probe set 208303_s_at). We
performed Quantitative real-time PCR (RT-qPCR)33 with primers as previously described and
used SYBRgreen (Finnzymes) for expression analysis.7 The average cycle threshold (Ct) value
was used to calculate mRNA expression levels of CRLF2 relative to the expression level of
the reference gene ‘ribosomal protein S20’ (RPS20) by use of the comparative cycle time (_Ct)
method.34

CHAPTER 5
90
Statistics
For statistical comparisons the Statistical Package for the Social Sciences (SPSS) Analysis
system (v.15.0, SPSS Inc., Chicago, IL, USA) was used. To compare categorical variables we
used c2 analyses, for continuous variables the Mann-Whitney U test and Spearman Rho (ρ)
was used to calculate correlation coefficients. P-values ≤ 0.05 were considered statistically
significant (two-tailed testing).
To evaluate outcome, statistical analyses were conducted using SAS software (SAS-PC,
Version 9.1). Complete remission (CR) was defined as less than 5% blast in the bone marrow,
with regeneration of tri-lineage hematopoiesis plus absence of leukemic cells in the cerebro-
spinal fluid or elsewhere. Event free survival (EFS) was calculated from the date of diagnosis
to the date of last follow-up or to the first event, including relapse, death in CR, and failure
to achieve CR (considered as event on day 0). Early death was defined as any death within
the first 6 weeks of treatment, and was considered as an event on day 0. Overall survival (OS)
was measured from the date of diagnosis to the date of last follow-up or to the date of death
from any cause. The Kaplan-Meier method was used to estimate survival rates, and survival
estimates were compared using the log-rank test. The cumulative incidence of relapse (CIR),
with other events and death in CR as competing events was constructed by the method of
Kalbfleisch and Prentice and compared using the Gray test.
For multivariate analysis, a stepwise Cox proportional-hazard regression model was used.
Data from both the DCOG and UK validation cohorts were merged for this purpose. Con-
tinuous variables known to be of prognostic value in ALL were categorized according to the
National Cancer Institute (NCI) risk criteria 35, and with the cut-offs previously described in DS
ALL and BFM-95.36,37
reSuLTS
Patient samples and characteristics
A total of 34/58 (59%) DCOG and 88/114 (77%) UK DS ALL patients were enrolled in this study.
All 122 patients were classified as B-cell precursor ALL and treated with curative intent. The
clinical and presenting characteristics of the tested cohort and the remaining DS ALL samples
(residual cohort), for both DCOG and UK, were compared to test for selection bias, and no
differences were detected (Supplementary Table S1 and S2). Furthermore, we tested for dif-
ferences between the DCOG and the UK sample cohorts (Table 1). Patients from UK trials
had a lower 6-year survival estimate, which was due to a higher rate of death and relapse in
early treatment protocols.38 In addition, WBC was slightly higher in UK patients then in DCOG
patients (18.8 vs. 8.8 x10⁹/L; p=0.07).

91
CHAPTER 5
5
Cytogenetics and Fluorescence in situ Hybridization
Cytogenetic data were available for 31/34 DCOG patients (3 were based on array-CGH) and
88 UK patients (Supplementary Table S3A and B, respectively). A normal karyotype was found
in 14 (45%) DCOG and 34 UK patients based on the full analysis of least 10 cells (there was
failure to achieve a successful karyotype in 6 UK patients); 1 DCOG patient had a BCR-ABL1
fusion, while 1 DCOG and 2 UK patients had t(8;14)(q11;q32).5 The gain of an X chromosome
was observed in 6 DCOG and 18 UK patients, which were identified as additional derived X
chromosomes.5 The remaining patients (n=15, 48%) had random cytogenetic aberrations.
The ETV6-RUNX1 fusion was found in 2 (6%) DCOG patients and 15/85 (18%) UK patients.
Ploidy status of DCOG patients was determined from karyotypes (n=31) and from array-
CGH (n=3). Four (12%) patients had a high hyperdiploid karyotype (HeH) (≥52 chromosomes),
including trisomy 10 (n=4), trisomy 4 or 18 (n=3), and tetrasomy 21 (including the constitu-
Table 1. Down syndrome ALL patient characteristics of the DCOG cohort compared with the UK Cohort
dCOG sample cohort uk sample cohort p
number 34 88
age at diagnosis (year) 4.9 4.8 0.85
Gender 0.29
Male 20 58
Female 14 26
median initial wBC (x 109/L) 8.8 18.8 0.07
immune phenotype
Pro-B 2 NK
C-ALL 21 NK
Pre-B 11 NK
Treatment protocol
ALL 8 8 NA
ALL 9 17 NA
ALL 10 9 NA
efS 76.2 ± 8.2% 58 ± 6% 0.05
OS 85.1 ± 6.2% 63 ± 6% 0.01
Cir 18 ± 8% 16 ± 5% 0.8
Cytogenetic aberrations
ETV6-RUNX1 2 (1.5) 15/85* (18) 0.15
HeH 4 (11.8) 4/73* (5) 0.26
IKZF1 12 (35) 23/85* (27) 0.37
CRLF2 21/33* (62) 43/84* (51) 0.07
JAK 2 5 (15) 8/20* (40) 0.05
DCOG, Dutch childhood oncology group; UK, united kingdom; NK, not known; NA, not applicable; WBC, white blood cell count, HeH, high hyperdiploidy (>52 chromosomes); ALL, acute lymphoblastic leukemia; * Not all genomic aberrations were analysed in all patients.

CHAPTER 5
92
tional gain) (n=2). A similar proportion of UK patients (4/73, 5.5%) had a HeH karyotype; and
included trisomy of 4 (n=5), 10 (n=4) and 18 (n=4) and tetrasomy 21 (n=5).
In 21/33 (64%) DCOG DS ALL patients, CRLF2 was aberrant, including IGH@-CRLF2 (n=5)
and P2RY8-CRLF2 (n=16). One patient could not be evaluated due to the poor quality of the
material. In the UK cohort 43/84 (52%) DS ALL patients had lesions of CRLF2, with 6/84 (7%)
IGH@-CRLF2 translocations and 37/84 (44%) P2RY8-CRLF2 fusions. Four patients were not
tested for IGH@-CRLF2, but were negative for P2RY8-CRLF2.
Array-Comparative Genomic Hybridization
In total, 17/34 (50%) DCOG cases had ≥1 deletion of B-cell development and differentiation
genes. Affected genes included the transcription factors: IKZF1 (n=12, 35%), VPREB1 (n=6,
18%) and PAX5 (n=4, 12%). Eight patients had focal deletions within IKZF1, 2 patients had a
focal deletion of IKZF1 including the 3’ flanking region, and 2 patients had a deletion of the
entire gene, as the whole chromosome 7p arm was deleted (Figure 1). In 6 of the patients
with focal deletions within IKZF1, exon 3 through 6 was deleted, which was validated by PCR.
This deletion results in the expression of isoform 6, a dominant-negative form of IKZF1.18 No
deletions were found in EBF1 or TCF3. Deletions in the PAX5 gene were always part of larger
deleted regions, whereas deletions of the other genes were mainly focal. Aberrations of IKZF1
were not mutually exclusive: i.e. in 4 cases an IKZF1 deletion was found in combination with
a PAX5 or VPREB1 deletion. Overlap between IKZF1, CRLF2 and JAK2 aberrations are depicted
in figure 2.
Mutation analysis
No additional mutations were found after sequencing the coding exons (2-8) of IKZF1 in
DCOG DS ALL patients. Synonymous polymorphisms were found at P334 in 6 patients (17.6%)
and at N392 in 2 (5.9%) patients. JAK2 R683 activating mutations were found in 5/34 (15%)
of the DCOG DS ALL patients as previously reported.30 The incidence of JAK2 R683 mutations
was higher in the UK cohort (8/20, 40%) as previously reported.16
Multiplex Ligation-dependent Probe Amplification
The SALSA MLPA P202-A1 IKZF1 kit, with the majority of probes targeting IKZF1, confirmed
that 12/34 (35%) of the DCOG DS ALL patients had deletions of IKZF1 which were identical to
those detected by array-CGH.
Using the SALSA MLPA P335-A3 ALL-IKZF1 kit, the same results were achieved for IKZF1
deletions as with the P202 MLPA kit. In addition, in 4 patients (12%), all probes for PAX5
were deleted, while no focal deletions of PAX5 were seen. No aberrations of EBF1 (0/34) were

93
CHAPTER 5
5
a
B
Figure 1. IKZF1 aberration detected by Array-CGH and MLPAA) The figure shows a chromosome 7 oligonucleotide Array Comparative Genomic Hybridization (CGH) plot of the log-ratio of patient DNA/control DNA ratios (grey tracing) versus the dye-swap experiment (black racing) from a patient with an IKZF1 deletion. The figure zooms in on the deleted area and presents the genes located in this area.B) Multiplex Ligation-dependent Probe Amplification (MLPA) plot of a patient with a Isoform6 deletion of IKZF1. Each square indicates a different probe. The white squares are control probes, grey squares represent normal probes, and the black squares are deleted probes. All probes located in exon 3 through 6 are deleted, resulting in Isoform 6 of IKZF1.

CHAPTER 5
94
detected. In the UK cohort, IKZF1 was found to be aberrant in 23/85 (27%) patients, of which
5 (29%) resulted in IKZF1 Isoform 6, 5 (29%) had whole gene deletions and 7 (41%) had differ-
ent deletion profiles. Interestingly, patients with IKZF1 deletions are significantly older then
patients with wildtype IKZF1 (8.2 vs. 4.3; p=0.03) (Table 2).
Gene-expression profiling and real-time PCR
Of 23 DCOG DS ALL patients, RNA was available for gene-expression profiling and RT-PCR.
The median variance-stabilization normalized (VSN) expression value of patients with P2RY8-
CRLF2 (n=11; median 9.4) was significantly higher than in patients with wildtype CRLF2 (n=8;
median 7.8); p 0.001), and was also higher as compared to patients with IGH@-CRLF2 (n=4;
median 8.4); p=0.001) (Figure 3A), which was confirmed by RT-PCR (correlation coefficient
of ρ = 0.7, p=0.0002) (Figure 3B). The median relative mRNA expression of CRLF2 in patients
with P2RY8-CRLF2 was 6.5 fold higher (median 6.5) than in patients with IGH@-CRLF2 (median:
0.001) and wildtype CRLF2 (median: 0.001); p<0.001.
Table 2. Characteristics of patients with aberrant and wildtype IKZF1
IKZF1 deletions wildtype IKZF1 p
number 35 84
median age at diagnosis (year) 8.2 4.3 0.03
Gender 0.49
Male 21 56
Female 14 28
median initial wBC (109/L) 17.5 14.9 0.07
WBC, white blood cell count
N=3
N=9
IKZF1 N=11
N= 9
CRLF2 N=21
N= 1
N= 7
N=4
JAK2 N=5
Wildtype
A)
N=8
N=32
N=28
IKZF1 N=21
CRLF2 N=41
N=13
Wildtype
B)
Figure 2. Venn-diagram showing the overlap between aberrationsA) DCOG cohort. One patient was excluded from the figure since the CRLF2 status was not determined. Four patients were excluded from the figure of the UK cohort (B), as IKZF1 or CRLF2 were not known for these cases.

95
CHAPTER 5
5Univariate survival analysis
The median follow up time for survivors in the DCOG sample cohort was 5.7 years (range
1.2–15.4 years), the median FU time for UK survivors was 4.6 years (range 0.4-12.0 years). The
6-year EFS was 76±8.2%, the 6-year OS 85±6.2% and the CIR was 18±8% in DCOG DS ALL
patients. UK DS ALL patients had a 6-year EFS of 58±6%, a 6 year OS of 63±6.1% and a CIR of
16±5%.
DCOG DS ALL patients with a WBC ≥20x109/L at diagnosis (n= 11) had a significantly worse
outcome than patients with lower WBC (n=23) (6-year EFS 38±16.1% vs. 96±4.3%; p<0.001,
6-year OS 60±15.5% vs. 96±4.3%; p=0.005), and this was confirmed in the UK cohort (6-year
EFS 43±8.7% vs. 70±7.4%; p=0.01, 6-year OS 50±8.6% vs. 70±8.3%; p=0.03). There was no
significant difference in outcome for patients below or above 6 years of age at diagnosis in
both DCOG and UK patients.
Patients with an IKZF1 deletion (n=12) had a significantly worse outcome than patients
without an IKZF1 deletion. In fact, with the exception of a single patient, all 7 events occurred
in patients with an IKZF1 deletion. The 6 year EFS was 45±16% for IKZF1 deleted vs.95±4%
for IKZF1 wild-type patients; p=0.002, the OS 66±14% vs. 95±4%; p=0.02 and CIR 37±16% vs.
5±5 %; p(Gray)=0.044. The poor outcome for IKZF1 deleted patients was confirmed in the UK
cohort (EFS 21±12% vs. 58±11%; p=0.002, OS 15±12% vs. 71±9%; p=0.02, and CIR 37±15%
vs. 18±10 %; p(Gray)=0.06) (Figure 4). Also when we combined the DCOG and the UK cohort
(EFS 31±10% vs. 75±7%; p<0.001, OS 40±10% vs. 82±6%; p=0.0003, and CIR 37±11% vs. 11±6
Figure 3. CRLF2 expression as determined by gene expression profiling and RT-qPCR Graphs showing the expression of CRLF2. Bars represent the median expression in each group. Differences in CRLF2 expression are shown between patients with wildtype CRLF2, IGH@-CRLF2 translocation and P2RY8-CRLF2. a) Expression of probe 208303_s_at representing the CRLF2 gene after log transformation. Significant differences in median expression are shown between patients with CRLF2 wildtype (n=8; 7.8) and patients with P2RY8-CRLF2 (n=15; 9.4), p=0.001, between P2RY8-CRLF2 and IGH@-CRLF2 translocation (n=4; 8.4, p=0.33), and between wildtype and all patients with CRLF2 lesions, p=0.009. B) Cumulative mRNA expression levels of CRLF2 relative to RPS20 (%). Significant differences are observed between patients CRLF2 wildtype (n=8; 0.001) and patients with P2RY8-CRLF2 (n=15; 6.5), p<0.001, between P2RY8-CRLF2 and IGH@-CRLF2 translocation (n=4; 0.001), and between wildtype and all patients with CRLF2 lesions, p=0.02.
A B

CHAPTER 5
96
0.95, SE=0.04
Patients with IKZF1 wildtype (N= 22, 1 event)
0.45, SE=0.16
Patients with IKZF1 deletions (N= 12, 6 events)
years
Log-Rank p = .0016
P
0.0
0.1
0.2
0.3
0.4
0.5
0.6
0.7
0.8
0.9
1.0
0 1 2 3 4 5 6 7 8 9 10
A)
0.95, SE=0.04
Patients with IKZF1 wildtype (N= 22, 1 event)
0.66, SE=0.14
Patients with IKZF1 deletions (N= 12, 4 events)
years
Log-Rank p = .015
P
0.0
0.1
0.2
0.3
0.4
0.5
0.6
0.7
0.8
0.9
1.0
0 1 2 3 4 5 6 7 8 9 10
B)
Patients with IKZF1 wildtype (Events/N 1/22) Patients with IKZF1 deletions (Events/N 4/12)
years
P
Relapse p(Gray)= 0.04
0.0
0.1
0.2
0.3
0.4
0.5
0 1 2 3 4 5 6 7 8 9 10
0.37, SE=0.16
0.5, SE=0.05
C)

97
CHAPTER 5
5
0.58, SE=0.11
Patients with IKZF1 wildtype (N= 32, 10 events)
0.21, SE=0.12
Patients with IKZF1 deletions (N= 17, 12 events)
years
Log-Rank p = .0022
P
0.0
0.1
0.2
0.3
0.4
0.5
0.6
0.7
0.8
0.9
1.0
0 1 2 3 4 5 6 7 8 9 10
D)
0.71, SE=0.09
Patients with IKZF1 wildtype (N= 32, 9 events)
0.15, SE=0.12
Patients with IKZF1 deletions (N= 17, 12 events)
years
Log-Rank p = .0017
P
0.0
0.1
0.2
0.3
0.4
0.5
0.6
0.7
0.8
0.9
1.0
0 1 2 3 4 5 6 7 8 9 10
E)
Patients with IKZF1 wildtype (Events/N 3/32) Patients with IKZF1 deletions (Events/N 5/17)
years
P
Relapse p(Gray)= 0.06
0.0
0.1
0.2
0.3
0.4
0.5
0 1 2 3 4 5 6 7 8 9 10
0.18, SE=0.10
0.37, SE=0.15
F)
Figure 4. Kaplan-Meier estimates of DS ALL patients with and without IKZF1 aberrationsSix year event free survival (EFS) in DCOG DS ALL patients for IKZF1 is depicted in (A) and EFS for the UK dataset is depicted in (D), the overall survival (OS) of DCOG DS ALL patients is shown in (B), the OS for the UK dataset depicted in (E), and the cumulative incidence of relapse (CIR) of DCOG DS ALL patients is shown in (C), the CIR for the UK cohort is depicted in (F). Patients with IKZF1 deletions have a significantly worse outcome in terms of OS, EFS, and CIR compared with IKZF1 wildtype patients.

CHAPTER 5
98
%; p(Gray)=0.007) (Supplementary figure S2) the poor outcome of IKZF1 deleted cases was
evident.
There was no statistically significant difference in clinical outcome between patients with
or without genomic CRLF2 aberrations, neither in the DCOG cohort (EFS 75±10% vs. 79±14%
in CRLF2 wildtype patients; p=0.6, OS 81±9% vs. 92±8%; p=0.42, CIR 15±8% vs. 21±15%;
p(Gray)=0.9, supplementary figure S3) nor in the UK cohort (EFS 50±9% vs. 67±8%; p=0.26,
OS 58±9% vs. 69±8%; p=0.27 and CIR 22±8% vs. 11±5%; p(Gray =0.32, supplementary figure
S4).
The OS for DCOG patients with a PAX5 deletion was significantly lower compared to those
with wildtype PAX5 due to the poor salvage rate at relapse (OS: 50±25% vs. 90±6%; p=0.03).
No statistically significant differences in outcome were found in DCOG patients with and
without a deletion of VPREB1 (OS 67± 9% vs. 89±6%; p=0.12, CIR 17±17% vs. 18±9%; p(Gray)
=0.85), nor for JAK2 R683 (data not shown).
Multivariate survival analysis
A stepwise multivariate Cox regression model was performed on the total dataset (DCOG
and UK) for enough statistical power and included WBC at diagnosis (≥20 x 109/L), sample
cohort, mutational status of IKZF1 and genomic CRLF2 aberrations were variables included in
the multivariate model.
Deletions of IKZF1 appeared to be the strongest independent risk factor for EFS, OS and
relapse-free survival (RFS) with a hazard ratio (HR) for EFS of 3.05 (95% CI 1.55 – 6.02; p=0.001),
for OS of 2.82 (95% CI 1.40 – 5.70; p=0.003) and for RFS of 7.83 (95% CI 2.39 – 25.63; p=0.001).
The cohort (UK v DCOG) was also an independent risk factor for EFS and OS, but not for RFS
(EFS: HR 2.37, 95% CI 1.01 – 5.54; p=0.046, OS: HR 3.26, 95% CI 1.23 – 8.65; p = 0.02 (Table 3).
Genomic CRLF2 aberrations were not a predictor for prognosis.
diSCuSSiOn
When assessing overall outcome, children with DS-ALL have fared less well than their
non-DS counterparts in most clinical trials.39-43 There is a need to understand which genetic
abnormalities contribute to the development of ALL in DS children, and which abnormalities
predict for poor outcome. This study has focused on the frequency and prognostic value
of aberrations involving B-cell development and differentiation genes in DS ALL patients,
especially IKZF1 deletions, based on recent findings in non-DS high-risk ALL, and the recent
detection of patients with a BCR-ABL1-like gene expression signature by Den Boer et al from
our department, with a high-risk of recurrent disease.17,18

99
CHAPTER 5
5Aberrations in genes encoding for B-cell development and differentiation, are common
in non-DS B-cell precursor ALL. The frequency varies between 67% in high-risk non-DS ALL
and 82% in non-DS patients with a BCR-ABL1-like gene expression signature.17,18 We found
that deletions in these genes, including PAX5, VPREB1, TCF3, EBF1 and IKZF1, occurred in ap-
proximately 50% of an unselected cohort of DS ALL, which also included low risk patients.
The incidence of PAX5 deletions reported in this study is rather low (12%) when compared
to non-DS ALL patients (21% - 29%) 19,29,44, but similar to a group of non-DS ALL patients with
genetically unclassified disease (B-other), as previously reported by Den Boer et al.17 None of
the DS ALL patients had deletions in EBF1, which is in correspondence to the low frequency
reported in non-DS ALL.17,19,29
The frequency of IKZF1 deletions in the unselected DCOG (35%) and UK cohorts (26%) is
comparable to the 29% found in high-risk non DS ALL patients 18 and to the 39% in a group
of high-risk non-DS ALL patients with a ‘BCR-ABL1 like’ gene-expression signature.17 Interest-
ingly, 38% of the DCOG DS ALL have a gene-expression signature similar to those of BCR-
ABL1-like non-DS ALL as identified in our previous study by a 110 probe-set based classifier.
Within this DS-BCR-ABL1-like group, 40% has a deletion of IKZF1 similar to the frequency of
IKZF1 deletions observed in non-DS BCR-ABL1-like cases.17 Taken together, this suggests that
a relatively large proportion of DS ALL patients have a genetic profile with characteristics of
high-risk B-cell precursor ALL, and thus need to be treated accordingly, although this should
be balanced against the increased risk of treatment related mortality in DS children. Given
that the option for intensification of chemotherapy in DS subjects are limited, it is key to
unravel the underlying biology of IKZF1 aberrant leukemias, in order to develop les toxic
Table 3. Results of multivariate analysis for overall survival, event-free survival and relapse free survival for the combined DCOG and UK cohorts
Outcome Variable hr 95% Ci P-value
efS
IKZF1 3.05 1.55 - 6.02 0.001
Collaborative Group 2.37 1.01 - 5.54 0.05
Genomic CRLF2 1.69 0.83 - 3.44 0.15
WBC ≥ 20x109/L 2.41 1.20 - 4.85 0.01
OS
IKZF1 2,82 1.40 - 5.70 0.004
Collaborative Group 3.26 1.23 - 8.65 0.02
Genomic CRLF2 1.86 0.87 - 3.94 0.11
WBC ≥ 20x109/L 2.01 0.98 - 4.13 0.06
rfS
IKZF1 7.83 2.39 - 25.63 0.001
Collaborative Group 1.38 0.45 - 4.27 0.58
Genomic CRLF2 1.14 0.39 - 3.36 0.81
WBC ≥ 20x109/L 2.87 0.95 - 8.67 0.06
DCOD, Dutch childhood oncology group; UK, united kingdom; HR, hazard ration; CI, confidence interval, WBC, white blood cell count; EFS, event free survival; OS, overall survival; RFS: relapse free survival

CHAPTER 5
100
(targeted) therapy options for these patients. If confirmed in future studies or by other collab-
orative study groups, screening for evidence of high-risk genetic abnormalities such as IKZF1
in DS ALL may lead to improved risk-group stratification. The future DCOG ALL11 treatment
protocol will already use IKZF1 deletions to assist in this and to tailor anthracycline exposure.
Recently, Mullighan et al. reported that alterations of IKZF1 were associated with JAK2 R683
mutations in 87% of high-risk non-DS ALL patients.12 These patients had a 4-year CIR of 77%,
from which the authors concluded that this defined a very poor risk subgroup.12 This is differ-
ent in DS ALL, as only 1/34 DCOG patients had a combined IKZF1 and JAK2 aberrations and
the clinical course was uneventful during 7 years of follow up. Moreover, none of the 5 JAK2
R683 mutated DS ALL patients without IKZF1 aberrations experienced an event (data not
shown). This implies a difference in the pattern of genetic changes leading to leukemogen-
esis, between non-DS and DS ALL patients, which is so far not very well understood.
Aberrations of CRLF2 are recently described genetic abnormalities in DS ALL, 8,9,13 occurring
at a high frequency of ~51% in this study. Some authors have used gene expression profiling
to screen for CRLF2 overexpression, however this may occur independently from genomic
aberrations in the CRLF2 gene.13 Loudin et al, identified with supervised clustering a gene
expression signature associated with high CRLF2 expression.20 After supervised clustering
of our DCOG patients, genomic CRLF2 positive samples clustered separately from wildtype
CRLF2 samples. However, only 4 genes with a false discovery rate <10% were detected (data
not shown), which implies that CRLF2 is not a strong signature. Furthermore, we found that
DCOG DS ALL patients who carried the P2RY8-CRLF2 aberration had a significantly higher
expression of CRLF2 compared to patients with a translocation of IGH@-CRLF2 or wildtype
CRLF2, which is different from what is found in other studies, although this might be due
to small numbers in our study.8,14 Moreover, we did not identify the CRLF2 expression level,
or genomic CRLF2 aberrations to be a significant risk factor for inferior treatment outcome,
which is in agreement with the interim report of the Ponte di Legno on a large cohort of DS
ALL patients 37 and several other DS and non-DS ALL studies, 7,9,16,37, but different from some
other studies. 13,15
In agreement with our findings, Harvey et al. previously demonstrated in high-risk non-DS
ALL patients that only IKZF1 deletions, but not CRLF2 aberrations were independently as-
sociated with relapse.14 Furthermore, genomic aberrations of CRLF2 were strongly associated
with JAK2 mutations.7,8,14 Indeed, in our DS ALL cohort, all patients (n=5) with a JAK2 R683
mutation harbored P2RY8-CRLF2, although, none of these patients experienced an event.
Recently Herztberg et al hypothesized that overexpression of CRLF2 is the first event in leu-
kemogenesis of DS ALL, followed by mutations such as JAK2 and CRLF2 6-8,15. However, IKZF1
deletions, which disrupt normal lymphoid development, are not yet included in this model.
Further research is needed to identify which of the aberrations is the primary event, and how
they cooperate in the pathogenesis of DS ALL.

101
CHAPTER 5
5
Histone gene deletions have been recently reported by Loudin et al. to be more common
in DS ALL compared to non-DS ALL (22% vs. 3.1%) patients, albeit without prognostic signifi-
cance.20 In our DCOG cohort, only 1 (3%) DS ALL patient had a large deletion at the histone-
cluster at 6p22, while other patients showed only single probe deletions by array-CGH, which
we consider to be below the threshold for true copy number changes. We did not search for
point mutations, thus the involvement of the histone cluster may be underestimated in this
study. In conclusion we could not confirm a high frequency of histon deletions in DS ALL
patients, but more sensitive techniques are needed.
In this study, MRD data was only available of a limited number of patients, and patients
were treated on different protocols. Unfortunately we therefore could not include this pa-
rameter in the multivariate analysis.
In conclusion, this study demonstrates that IKZF1 is a strong and independent predictor for
poor clinical outcome in DS ALL, which was confirmed in an independent validation cohort
of UK DS ALL patients. These data suggest that there are similarities between DS and non-DS
ALL in relation to the underlying genetic background. A relatively large proportion of DS
ALL patients has high-risk genetic characteristics and thus need to be treated accordingly, in
balance with TRM. If confirmed in larger and prospective series, IKZF1 abnormalities may be
integrated into risk stratification of DS ALL patients for treatment.
aCknOwLedGemenT Of reSearCh SuppOrT
This study was supported by research funding from the foundation Kinderen Kankervrij
(KIKA) to T.D.B. and C.M.Z, Dutch Cancer Society (grant EMCR 2007-3718) to AvdV, RP and
MLDB, Leukaemia and Lymphoma Research (LLR) to L.J.R., C.S., H.M., L.J., C.J.H. and A.V.M.

CHAPTER 5
102
referenCeS
1. Hasle H, Clemmensen IH, Mikkelsen M. Risks of leukaemia and solid tumours in individuals with Down’s syndrome. Lancet. 2000; 355(9199): 165-169.
2. Rainis L, Bercovich D, Strehl S, et al. Muta-tions in exon 2 of GATA1 are early events in megakaryocytic malignancies associated with trisomy 21. Blood. 2003; 102(3): 981-986.
3. Vyas P, Crispino JD. Molecular insights into Down syndrome-associated leukemia. Curr Opin Pediatr. 2007; 19(1): 9-14.
4. Wechsler J, Greene M, McDevitt MA, et al. Acquired mutations in GATA1 in the mega-karyoblastic leukemia of Down syndrome. Nat Genet. 2002; 32(1): 148-152.
5. Forestier E, Izraeli S, Beverloo B, et al. Cyto-genetic features of acute lymphoblastic and myeloid leukemias in pediatric patients with Down syndrome: an iBFM-SG study. Blood. 2008; 111(3): 1575-1583.
6. Bercovich D, Ganmore I, Scott LM, et al. Mu-tations of JAK2 in acute lymphoblastic leu-kaemias associated with Down’s syndrome. Lancet. 2008; 372(9648): 1484-1492.
7. Mullighan CG, Collins-Underwood JR, Phil-lips LA, et al. Rearrangement of CRLF2 in B-progenitor- and Down syndrome-associated acute lymphoblastic leukemia. Nat Genet. 2009; 41(11): 1243-1246.
8. Russell LJ, Capasso M, Vater I, et al. Deregu-lated expression of cytokine receptor gene, CRLF2, is involved in lymphoid transforma-tion in B-cell precursor acute lymphoblastic leukemia. Blood. 2009; 114(13): 2688-2698.
9. Hertzberg L, Vendramini E, Ganmore I, et al. Down syndrome acute lymphoblastic leukemia, a highly heterogeneous disease in which aberrant expression of CRLF2 is associated with mutated JAK2: a report from the International BFM Study Group. Blood. 2010; 115(5): 1006-1017.
10. Gaikwad A, Rye CL, Devidas M, et al. Prevalence and clinical correlates of JAK2 mutations in Down syndrome acute lym-
phoblastic leukaemia. Br J Haematol. 2009; 144(6): 930-932.
11. Kearney L, Gonzalez De Castro D, Yeung J, et al. Specific JAK2 mutation (JAK2R683) and multiple gene deletions in Down syndrome acute lymphoblastic leukemia. Blood. 2009; 113(3): 646-648.
12. Mullighan CG, Zhang J, Harvey RC, et al. JAK mutations in high-risk childhood acute lymphoblastic leukemia. Proc Natl Acad Sci U S A. 2009; 106(23): 9414-9418.
13. Cario G, Zimmermann M, Romey R, et al. Presence of the P2RY8-CRLF2 rearrange-ment is associated with a poor prognosis in non-high-risk precursor B-cell acute lymphoblastic leukemia in children treated according to the ALL-BFM 2000 protocol. Blood. 2010; 115(26): 5393-5397.
14. Harvey RC, Mullighan CG, Chen IM, et al. Rearrangement of CRLF2 is associated with mutation of JAK kinases, alteration of IKZF1, Hispanic/Latino ethnicity, and a poor outcome in pediatric B-progenitor acute lymphoblastic leukemia. Blood. 2010; 115(26): 5312-5321.
15. Yoda A, Yoda Y, Chiaretti S, et al. Functional screening identifies CRLF2 in precursor B-cell acute lymphoblastic leukemia. Proc Natl Acad Sci U S A. 2010; 107(1): 252-257.
16. Ensor HM, Schwab C, Russell LJ, et al. Demo-graphic, clinical, and outcome features of children with acute lymphoblastic leukemia and CRLF2 deregulation: results from the MRC ALL97 clinical trial. Blood. 2011; 117(7): 2129-2136.
17. Den Boer ML, van Slegtenhorst M, De Menezes RX, et al. A subtype of childhood acute lymphoblastic leukaemia with poor treatment outcome: a genome-wide clas-sification study. Lancet Oncol. 2009; 10(2): 125-134.
18. Mullighan CG, Su X, Zhang J, et al. Deletion of IKZF1 and prognosis in acute lymphoblastic leukemia. N Engl J Med. 2009; 360(5): 470-480.

103
CHAPTER 5
5
19. Mullighan CG, Goorha S, Radtke I, et al. Genome-wide analysis of genetic alterations in acute lymphoblastic leukaemia. Nature. 2007; 446(7137): 758-764.
20. Loudin MG, Wang J, Eastwood Leung HC, et al. Genomic profiling in Down syndrome acute lymphoblastic leukemia identifies his-tone gene deletions associated with altered methylation profiles. Leukemia. 2011; 25(10): 1555-1563.
21. Kamps WA, Bokkerink JP, Hakvoort-Cammel FG, et al. BFM-oriented treatment for chil-dren with acute lymphoblastic leukemia without cranial irradiation and treatment reduction for standard risk patients: results of DCLSG protocol ALL-8 (1991-1996). Leuke-mia. 2002; 16(6): 1099-1111.
22. Veerman AJ, Kamps WA, van den Berg H, et al. Dexamethasone-based therapy for childhood acute lymphoblastic leukaemia: results of the prospective Dutch Childhood Oncology Group (DCOG) protocol ALL-9 (1997-2004). Lancet Oncol. 2009; 10(10): 957-966.
23. Qureshi A, Mitchell C, Richards S, Vora A, Goulden N. Asparaginase-related venous thrombosis in UKALL 2003- re-exposure to asparaginase is feasible and safe. Br J Hae-matol. 2010; 149(3): 410-413.
24. Hann I, Vora A, Richards S, et al. Benefit of intensified treatment for all children with acute lymphoblastic leukaemia: results from MRC UKALL XI and MRC ALL97 randomised trials. UK Medical Research Council’s Work-ing Party on Childhood Leukaemia. Leuke-mia. 2000; 14(3): 356-363.
25. Kaspers GJ, Veerman AJ, Pieters R, et al. Mononuclear cells contaminating acute lymphoblastic leukaemic samples tested for cellular drug resistance using the methyl-thiazol-tetrazolium assay. Br J Cancer. 1994; 70(6): 1047-1052.
26. Harrison CJ, Martineau M, Secker-Walker LM. The Leukaemia Research Fund/United King-dom Cancer Cytogenetics Group Karyotype Database in acute lymphoblastic leukaemia:
a valuable resource for patient manage-ment. Br J Haematol. 2001; 113(1): 3-10.
27. Moorman AV, Ensor HM, Richards SM, et al. Prognostic effect of chromosomal abnormalities in childhood B-cell precursor acute lymphoblastic leukaemia: results from the UK Medical Research Council ALL97/99 randomised trial. Lancet Oncol. 2010; 11(5): 429-438.
28. Van Vlierberghe P, van Grotel M, Beverloo HB, et al. The cryptic chromosomal dele-tion del(11)(p12p13) as a new activation mechanism of LMO2 in pediatric T-cell acute lymphoblastic leukemia. Blood. 2006; 108(10): 3520-3529.
29. Kuiper RP, Waanders E, van der Velden VH, et al. IKZF1 deletions predict relapse in uniformly treated pediatric precursor B-ALL. Leukemia. 2010; 24(7): 1258-1264.
30. Blink M, Buitenkamp TD, van den Heuvel-Eibrink MM, et al. Frequency and prognostic implications of JAK 1-3 aberrations in Down syndrome acute lymphoblastic and myeloid leukemia. Leukemia. 2011; 25(8): 1365-1368.
31. Balgobind BV, Van den Heuvel-Eibrink MM, De Menezes RX, et al. Evaluation of gene expression signatures predictive of cytoge-netic and molecular subtypes of pediatric acute myeloid leukemia. Haematologica. 2011; 96(2): 221-230.
32. Schwab CJ, Jones LR, Morrison H, et al. Evalu-ation of multiplex ligation-dependent probe amplification as a method for the detection of copy number abnormalities in B-cell precursor acute lymphoblastic leukemia. Genes Chromosomes Cancer. 2010; 49(12): 1104-1113.
33. Tissing WJ, Meijerink JP, Brinkhof B, et al. Glucocorticoid-induced glucocorticoid-receptor expression and promoter usage is not linked to glucocorticoid resistance in childhood ALL. Blood. 2006; 108(3): 1045-1049.
34. Meijerink J, Mandigers C, van de Locht L, Tonnissen E, Goodsaid F, Raemaekers J. A novel method to compensate for different

CHAPTER 5
104
amplification efficiencies between patient DNA samples in quantitative real-time PCR. J Mol Diagn. 2001; 3(2): 55-61.
35. Smith M, Arthur D, Camitta B, et al. Uniform approach to risk classification and treatment assignment for children with acute lympho-blastic leukemia. J Clin Oncol. 1996; 14(1): 18-24.
36. Moricke A, Reiter A, Zimmermann M, et al. Risk-adjusted therapy of acute lymphoblas-tic leukemia can decrease treatment burden and improve survival: treatment results of 2169 unselected pediatric and adolescent patients enrolled in the trial ALL-BFM 95. Blood. 2008; 111(9): 4477-4489.
37. Buitenkamp T ZM, Forestier E, Heerema NA, van den Heuvel MM, Pieters R, de Haas V, Silverman LB, Schmiegelow K, Liang DC, Horibe K, Arico M, Cazzzaniga G, Basso G, Rabin KR, Schrappe M Cario G, Mann G, Mondelears V, Lammens T, Cave H, Stark B, Moorman AV, Vora AJ, Hunger S, Pui CH, Mulligahn CG, Manabe A, Escherich G, Kowalczyk J, Whitlock JA, Zwaan CM. Acute Lymphoblastic Leukemia in children with Down Syndrome: a report from the Ponti di Legno Study group. ASH. San Diego; 2011.
38. Mitchell C, Richards S, Harrison CJ, Eden T. Long-term follow-up of the United Kingdom medical research council protocols for childhood acute lymphoblastic leukaemia, 1980-2001. Leukemia : official journal of the Leukemia Society of America, Leukemia Research Fund, UK. 2010; 24(2): 406-418.
39. Zeller B, Gustafsson G, Forestier E, et al. Acute leukaemia in children with Down syndrome: a population-based Nordic study. Br J Haematol. 2005; 128(6): 797-804.
40. Whitlock JA, Sather HN, Gaynon P, et al. Clini-cal characteristics and outcome of children with Down syndrome and acute lympho-blastic leukemia: a Children’s Cancer Group study. Blood. 2005; 106(13): 4043-4049.
41. Maloney KW, Carroll WL, Carroll AJ, et al. Down syndrome childhood acute lympho-blastic leukemia has a unique spectrum of sentinel cytogenetic lesions that influences treatment outcome: a report from the Chil-dren’s Oncology Group. Blood. 2010; 116(7): 1045-1050.
42. Dordelmann M, Schrappe M, Reiter A, et al. Down’s syndrome in childhood acute lym-phoblastic leukemia: clinical characteristics and treatment outcome in four consecutive BFM trials. Berlin-Frankfurt-Munster Group. Leukemia. 1998; 12(5): 645-651.
43. Chessells JM, Harrison G, Richards SM, et al. Down’s syndrome and acute lymphoblastic leukaemia: clinical features and response to treatment. Archives of disease in childhood. 2001; 85(4): 321-325.
44. Kuiper RP, Schoenmakers EF, van Reijmersdal SV, et al. High-resolution genomic profiling of childhood ALL reveals novel recurrent genetic lesions affecting pathways involved in lymphocyte differentiation and cell cycle progression. Leukemia. 2007; 21(6): 1258-1266.

105
CHAPTER 5
5
Supplementary Table S1: Characteristics of the Dutch childhood oncology group sample cohort and residual cohort
Sample cohort residual cohort p-value
number 34 24
age at diagnosis (year) 4,9 5.3 0,99
Sex
Male 20 11
Female 14 13 0.33
median initial wBC (x 109/L) 8.8 7.7 0.26
immune phenotype
Pro-B 2 8
C-ALL 21 16
Pre-B 11 0 0.48
Treatment protocol
ALL 8 8 4
ALL 9 17 7
ALL 10 9 13 0,1
efS 76% ± 8% 65% ± 11% 0,18
OS 85% ± 6% 72% ± 10% 0,16
Cir 18 ± 8% 14 ± 10% 0,6
ALL, Acute lymphoblastic leukemia; Pro, Early B-Lymphocyte Precursor Cells; C, common; Pre, precursor; WBC, white blood cell count; EFS, event free survival; OS, overall survival; CIR, cumulative incidence of relapse.
Supplementary Table S2: Characteristics of United Kingdom sample cohort and residual cohort
Sample cohort residual cohort p-value
number 88 26
age at diagnosis (year) 4.9 4.9 0.89
Sex 0.22
Male 59 14
Female 29 12
median initial wBC (x 109/L) 16.1 13.9 0.78
efS 78.8 ± 6.1 95 ± 4.9 0,41
OS 61 ± 6% 65.3 ± 11.8% 0,48
Cir 15.7 ± 4.6% 4.2 ± 4.1% 0,4
WBC, white blood cell; EFS, event free survival; OS, overall survival; CIR, cumulative incidence of relapse
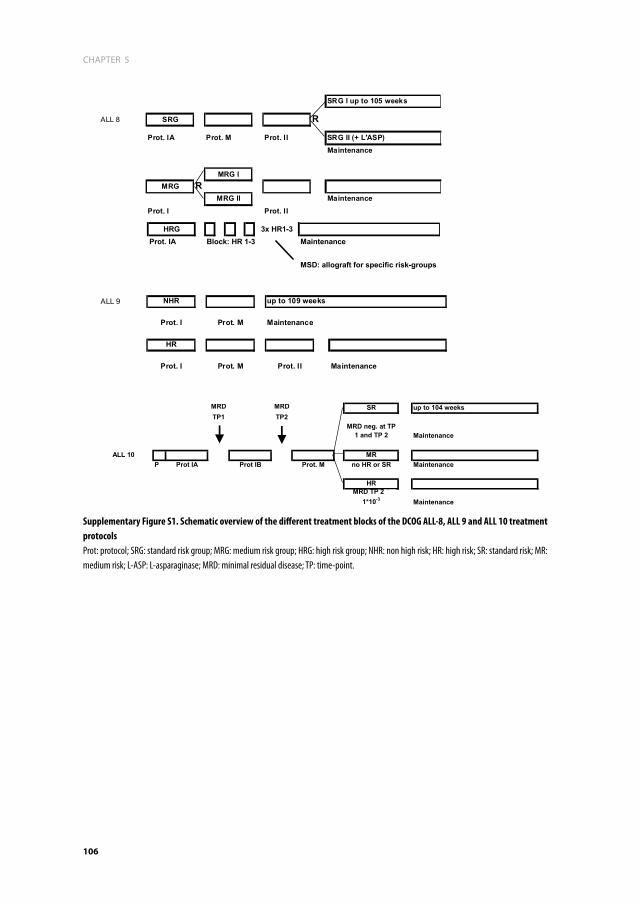
CHAPTER 5
106
ALL 9 NHR up to 109 weeks
Prot. I Prot. M Maintenance
HR
Prot. I Prot. M Prot. II Maintenance
SRG I up to 105 weeks
ALL 8 SRG R
Prot. IA Prot. M Prot. II SRG II (+ L'ASP)Maintenance
MRG IMRG R
MRG II MaintenanceProt. I Prot. II
HRG 3x HR1-3Prot. IA Block: HR 1-3 Maintenance
MSD: allograft for specific risk-groups
MRD MRD SR up to 104 weeksTP1 TP2
MRD neg. at TP 1 and TP 2 Maintenance
ALL 10 MRP Prot IA Prot IB Prot. M no HR or SR Maintenance
HRMRD TP 2 ?
1*10-3 Maintenance
Supplementary Figure S1. Schematic overview of the different treatment blocks of the DCOG ALL-8, ALL 9 and ALL 10 treatment protocols Prot: protocol; SRG: standard risk group; MRG: medium risk group; HRG: high risk group; NHR: non high risk; HR: high risk; SR: standard risk; MR: medium risk; L-ASP: L-asparaginase; MRD: minimal residual disease; TP: time-point.

107
CHAPTER 5
5
Supp
lem
enta
ry Ta
ble S
3A. C
linica
l and
gen
etic
char
acte
ristic
s of D
utch
child
hood
onco
logy
gro
up D
S ALL
pat
ient
s
fi
ShpC
r and
se
quen
cing
pCr
isofo
rm 6
arra
y-CG
h an
d m
Lpa
idSe
xag
ew
BCip
Tka
ryot
ype
ploi
dyET
V6-
RUNX
1BC
R/AB
L CR
LF2
JAK2
r68
3IK
ZF1
IKZF
1 TC
F3
PAX5
VP
REB1
EB
F1
1M
ale
9.2
29.7
C-AL
L48
,XY,+
X,t(8
;14)
(q12
;q32
),+21
c/47
,XY,+
21c
3W
TW
TW
TW
TW
TW
TW
TW
TW
TW
T
2Fe
mal
e4.
94
PRE-
B47
,XX,
+21c
[30]
2W
TW
TTL
WT
WT
WT
WT
WT
WT
WT
3Fe
mal
e2.
618
.4PR
E-B
48,X
X,+X
,add(
18)
(q22
),+21
c[2]
/47,
XX,+
21c[
30]
3W
TW
TR
WT
WT
WT
WT
WT
WT
WT
4M
ale
13.5
1.2
C-AL
L56
,XY,+
X,+4
,+10
,+14
,+14
,+17
,+18
,+18
,+21
c,+m
ar[1
3]/4
7,XY
,+21
c[9]
4W
TW
TW
TW
TW
TW
TW
TW
TR
WT
5M
ale
3.5
22.3
C-AL
L47
,XX,
+21c
2W
TW
TR
WT
WT
RW
TW
TR
WT
6M
ale
15.4
4.3
C-AL
L47
,XY,t
(1;3
)(q32
;q26
),t(2
;12)
(q23
;q13
),t(7
;8)(q
31;q
12),d
el(1
3)(q
14q3
2),+
21c[
17]
2W
TW
TW
TW
TW
TW
TW
TW
TW
TW
T
7Fe
mal
e2.
68.
7PR
E-B
57,X
X,+5
,+6,
+17,
+18,
+21c
,+5m
ar[
cp23
]/47,
XX,+
21c[
9]4
WT
WT
RW
TW
TW
TW
TW
TR
WT
8M
ale
4.2
41.2
C-AL
L
46,X
Y,t(8
;9)(q
24;p
13),d
el(1
2)(p
13.1
),dic(
12;1
3)(p
11.2
;p10
),+21
c[20
].ish
del
(12)
(TEL
-,AM
L1-,C
EP12
+),d
ic(12
;13)
(TEL
-,AM
L1-,C
EP12
+)
1W
TW
TW
TW
TW
TW
TW
TR
WT
WT
9Fe
mal
e2.
832
.6PR
E-B
47,X
X,+2
1c2
WT
WT
TLW
TW
TR
WT
WT
WT
WT
10M
ale
3.1
7.3
C-AL
L48
,XY,+
X,+2
1c[1
9]3
WT
WT
RR
WT
WT
WT
WT
WT
WT
11M
ale
3.9
77.9
PRE-
B47
,XY,+
21c
2W
TW
TR
WT
RR
WT
RW
TW
T
12M
ale
5.6
5PR
E-B
47,X
X,+2
1c2
WT
WT
RW
TW
TW
TW
TR
WT
WT
13Fe
mal
e7.
912
.9C-
ALL
47,X
X,+2
1c[2
1]2
WT
WT
WT
WT
WT
RW
TW
TW
TW
T

CHAPTER 5
108 109
CHAPTER 5
5
Supp
lem
enta
ry Ta
ble S
3A. (
Cont
inue
d)
fi
ShpC
r and
se
quen
cing
pCr
isofo
rm 6
arra
y-CG
h an
d m
Lpa
14M
ale
6.8
199
C-AL
L
47,X
Y,der
(9)d
el(9
)(p13
p2?2
)t(9
;22)
(q34
;q11
),+21
c,der
(22)
t(9;2
2)[1
5]/4
7,id
em,ad
d(21
)(q22
)[7
]/47,
XY,+
21c[
1]
2W
TR
WT
WT
RR
WT
RR
WT
15M
ale
3.7
16.5
C-AL
L48
,XY,+
21c,+
mar
[4]/4
8,XY
,+X,
+21
c[3]
/47,
XY+2
1c[1
3]3
WT
WT
RW
TW
TW
TW
TW
TW
TW
T
16M
ale
17.1
20.3
C-AL
L47
,XY,+
21c[
20]
2W
TW
TW
TW
TR
RW
TW
TR
WT
17Fe
mal
e7.
033
C-AL
L47
,XX,
del(1
2)(p
11p1
3),+
21c[
18]/4
7,XX
,+21
c[2]
2W
TW
TR
WT
WT
RW
TW
TW
TW
T
18M
ale
2.0
112
C-AL
L47
,XY,+
21c
2W
TW
TR
WT
WT
WT
WT
WT
WT
WT
19Fe
mal
e8.
44.
1C-
ALL
58~5
9,XX
,+4[
3],+
6,+1
0[2]
,+11
,+?1
4,+1
8[2]
,+21
,+21
c,+1~
5mar
,inc[
cp4
]/47,
XX,+
21c[
5]4
WT
WT
NEW
TW
TR
WT
WT
WT
WT
20M
ale
13.3
6.6
PRO-
B46
,XY,-
13,+
21c[
17]/4
7,XY
,+21
c[3]
1W
TW
TW
TW
TW
TW
TW
TW
TW
TW
T
21M
ale
2.2
17.5
C-AL
L47
,XY,+
21c[
20]
2W
TW
TR
RW
TW
TW
TW
TR
WT
22M
ale
3.8
2.9
PRE-
B47
,XY,+
21c[
22]
2W
TW
TR
RW
TW
TW
TW
TR
WT
23Fe
mal
e13
.81.
5C-
ALL
49,X
X,+X
,+5,
+21c
*3*
WT
WT
WT
WT
WT
WT
WT
WT
Ram
plific
ation
24M
ale
5.5
4.5
C-AL
L47
,XY,+
21c*
2*W
TW
TW
TW
TW
TW
TW
TW
TW
TW
T
25Fe
mal
e8.
139
0C-
ALL
47,X
X,-2
,-8,
+21c
,+m
ar1,
+mar
2[8]
/46,
idem
,-X/
47,X
X,+2
1c[3
]2
WT
WT
TLW
TR
RW
TW
TR
WT
26Fe
mal
e5.
43.
6PR
E-B
47,X
X,ad
d(17
)(q
2?5)
,+21
c[4]
/47,
XX,+
21c[
28]
2W
TW
TR
WT
WT
WT
WT
WT
WT
WT
27Fe
mal
e3.
416
.7C-
ALL
47,X
X,+2
1c[2
0]2
WT
WT
TLW
TW
TR
WT
WT
WT
WT
28M
ale
4.9
11.3
PRE-
B47
,XY,+
21c[
32]
2R
WT
WT
WT
WT
WT
WT
WT
RW
T

CHAPTER 5
108 109
CHAPTER 5
5
Supp
lem
enta
ry Ta
ble S
3A. (
Cont
inue
d)
fi
ShpC
r and
se
quen
cing
pCr
isofo
rm 6
arra
y-CG
h an
d m
Lpa
29Fe
mal
e3.
78.
9C-
ALL
47,X
X,+X
,-13,
i(17)
(q10
),der
(19)
t(13;
19)(q
1?3;
q1?2
),+21
c[15
]/47,
idem
,del
(12)
(q1?
4q2?
1)[7
]/52,
idem
,+3,
+10,
+14,
+21,
+21[
2]/4
7,X
X,+2
1c[2
9]
4W
TW
TR
WT
WT
WT
WT
WT
WT
WT
30M
ale
3.3
3.6
C-AL
L47
,XY,+
21c
2W
TW
TR
RW
TW
TW
TW
TW
TW
T
31M
ale
2.3
6.4
C-AL
L47
,XY,+
21c*
2*R
WT
TLW
TW
TW
TW
TW
TW
TW
T
32Fe
mal
e4.
55.
7PR
E-B
47,X
X,+2
1c[3
2]2
WT
WT
RW
TR
RW
TW
TW
TW
T
33M
ale
7.7
4.2
PRO-
B47
,XX,
?der
(9),d
el(1
3)(q
12q3
1),d
el(1
6)(q
23),a
dd(2
0)(q
11),+
21c[
26]
2W
TW
TW
TW
TW
TW
TW
TW
TW
TW
T
34Fe
mal
e6.
24.
5PR
E-B
46,X
X,de
r(14;
21)(q
10;q
10)
c,+21
c[27
]1
WT
WT
RR
RR
WT
WT
WT
WT
6 (1
7.6%
)12
(3
5.3%
)
Tota
l num
ber o
f abe
rrat
ions
2
(5.9
%)
1 (2
.9%
)21
(61
.8%)
5 (1
4.7%
)12
(35.
3%)
04
(11.
7%)
10
(29.
45)
0
Kary
otyp
e nom
encla
ture
acco
rding
to IS
CN 20
09. D
S ALL
, Dow
n syn
drom
e acu
te ly
mph
oblas
tic le
ukem
ia; W
BC, w
hite b
lood c
ell co
unt;
IPT,
imm
une p
heno
type
; BCP
, B ce
ll pre
curso
r; Plo
idy: 1
=hy
podip
loid (
<47
(46 +
21c),
2=
diploi
d (47
(46 +
21c),
3=low
hype
rdipl
oid (4
8-50
), 4=
hype
rdipl
oid (≥
51 (5
0 + 21
c), *
base
d on A
rray-
CGH;
WT,
wildt
ype;
R, re
arra
ngem
ent; T
L, tra
nsloc
ation
.

CHAPTER 5
110 111
CHAPTER 5
5
Supp
lem
enta
ry Ta
ble S
3B. C
linica
l and
gen
etic
char
acte
ristic
s of U
nite
d Ki
ngdo
m D
S ALL
pat
ient
s
fi
ShpC
r an
d se
quen
cing
mLp
a
idSe
xag
ew
BCip
Tka
ryot
ype
heh
ETV6
-RUN
X1BC
R/AB
L CR
LF2
JAK2
r68
3IK
ZF1
subg
roup
IK
ZF1
1Fe
mal
e16
.92
21.7
C- o
r Pre
-B48
,XX,
+21c
,+21
[4]/4
7,XX
,+21
c[19
]No
WT
WT
TLNK
WT
WT
2M
ale
5.01
2.8
C- o
r Pre
-B47
,XY,t
(8;1
4)(q
11;q
32),+
21c[
5]/4
7,X
Y,+21
c[23
]No
WT
WT
WT
NKIK
6R
3M
ale
7.27
42.8
C- o
r Pre
-B47
,XY,+
21c[
12]
NKW
TW
TW
TR
IK6
R
4M
ale
2.62
6.9
C- o
r Pre
-B46
,XY,d
er(1
4;21
)(q10
;q10
)c,+
21c[
18]
NoW
TW
TR
NKW
TW
T
5M
ale
2.46
1.9
C- o
r Pre
-B48
,XY,+
X,+2
1c[2
]/47,
XY,+
21c[
8]No
WT
WT
RNK
WT
WT
6M
ale
9.08
39.5
C- o
r Pre
-B48
,XY,+
X,+2
1c[3
]/46,
XY,-4
,-7,
+21c
,+m
ar[6
]/47,
XY,+
21c[
3]No
NKW
TR
RW
TW
T
7M
ale
5.47
53.1
C- o
r Pre
-B47
,XY,d
el(9
)(p1?
3p2?
),+21
c[10
]/53,
idem
,+X,
+?4,
+?8,
+9,+
18,+
22[2
]No
WT
WT
RNK
Othe
rR
8M
ale
5.78
5.2
C- o
r Pre
-B47
,XY,+
21c[
20]
NoR
WT
WT
NKW
TW
T
9M
ale
9.41
2.5
C- o
r Pre
-B
47,X
Y,?r(6
)(::p
?25q
2?1:
:),-10
,add(
12)(p
1?3)
,add(
18)
(q23
),+21
c,+r
NoR
WT
WT
NKW
TW
T
10Fe
mal
e2.
9782
.8C-
or P
re-B
Fail
NKR
WT
WT
RW
TW
T
11Fe
mal
e3.
679.
5C-
or P
re-B
48,X
X,+X
,+21
c[7]
/47,
XX,+
21c[
6]No
WT
WT
RNK
WT
WT
12M
ale
3.74
102.
2C-
or P
re-B
48,X
Y,+X,
t(7;1
7)(p
11;q
25),+
21c[
11]/4
7,XY
,+21
c[9]
NoW
TW
TR
NKNK
R
13Fe
mal
e1.
8120
.1C-
or P
re-B
47,X
X,+2
1c[2
0]No
RW
TW
TW
TW
TW
T
14Fe
mal
e16
.33
22C-
or P
re-B
47,X
X,+2
1c[1
0]No
WT
WT
TLNK
Who
le G
ene
R
15Fe
mal
e14
.16
9.2
C- o
r Pre
-B47
,XX,
+21c
[10]
NKW
TW
TR
neg,
TL N
KNK
Who
le G
ene
R

CHAPTER 5
110 111
CHAPTER 5
5
Supp
lem
enta
ry Ta
ble S
3B. (
Cont
inue
d)
fi
ShpC
r an
d se
quen
cing
mLp
a
16Fe
mal
e2.
8458
C- o
r Pre
-B48
,XX,
+X,+
21c[
10]/4
7,XX
,+2
1c[1
0]No
WT
WT
RNK
WT
WT
17M
ale
10.6
55.
2C-
or P
re-B
46,X
,-Y,d
el(6
)(q?1
3q?2
1),in
v(9)
(p24
q21)
,del
(11)
(q2?
1q23
),+21
c[5
]/47,
XY,+
21c[
13]
NoW
TW
TW
TNK
Who
le G
ene
R
18M
ale
2.88
32.4
C- o
r Pre
-B47
,XY,+
21c[
18]/4
6,XY
[2]
NoW
TW
TR
RNK
NK
19M
ale
6.12
47.7
C- o
r Pre
-B47
,XY,d
el(9
)(p22
p24)
,+21
c[20
]No
NKW
TR
NKIK
6R
20M
ale
2.04
29C-
or P
re-B
47,X
Y,+21
c[30
]No
WT
WT
WT
RW
TW
T
21M
ale
4.68
9.7
C- o
r Pre
-B47
,XY,+
9,de
r(9;1
6)(q
10;p
10),+
21c[
12]
NoW
TW
TR
NKW
TW
T
22Fe
mal
e1.
3411
1C-
or P
re-B
49,X
X,+6
,+19
,+21
c[10
]No
WT
WT
WT
NKW
TW
T
23Fe
mal
e5.
5919
C- o
r Pre
-B48
,XX,
+X,+
21c[
7]/4
7,XX
,+21
c[3]
NoW
TW
TR
WT
WT
WT
24M
ale
5.13
2.2
C- o
r Pre
-B47
,XY,+
21c[
22]
NoW
TW
TR
NKW
TW
T
25M
ale
3.03
47.2
C- o
r Pre
-B47
,XY,+
21c[
10]
NKW
TW
TR
NKW
TW
T
26Fe
mal
e3.
5910
.2C-
or P
re-B
47,X
X,de
l(12)
(p1?
),+21
c[2]
/47,
XX,+
21c[
20]
NoR
WT
WT
RNK
NK
27M
ale
4.24
6.4
C- o
r Pre
-B
48,Y,
t(X;1
4)(p
22;q
32),+
der(X
)t(X
;14)
,del
(15)
(q11
.2q1
5),+
21c[
2]/
47,X
Y+21
c[18
]No
NKW
TTL
NKOt
her
R
28Fe
mal
e3.
573.
8C-
or P
re-B
47,X
X,+2
1c[2
0]No
WT
WT
WT
NKW
TW
T
29M
ale
3.58
19.4
C- o
r Pre
-B
47,X
Y,der
(11)
t(X;1
1)(q
?2;q
2),+
21c[
4]/4
7,id
em,d
el(6
)(q)
[4]/
47,X
Y,+21
c[2]
NoW
TW
TR
WT
NKNK
30M
ale
8.45
89.1
BCP
47,X
Y,+21
cNo
WT
WT
RNK
Othe
rR
31M
ale
10.7
04
BCP
47,X
Y,+21
c[30
]No
WT
WT
WT
NKW
TW
T
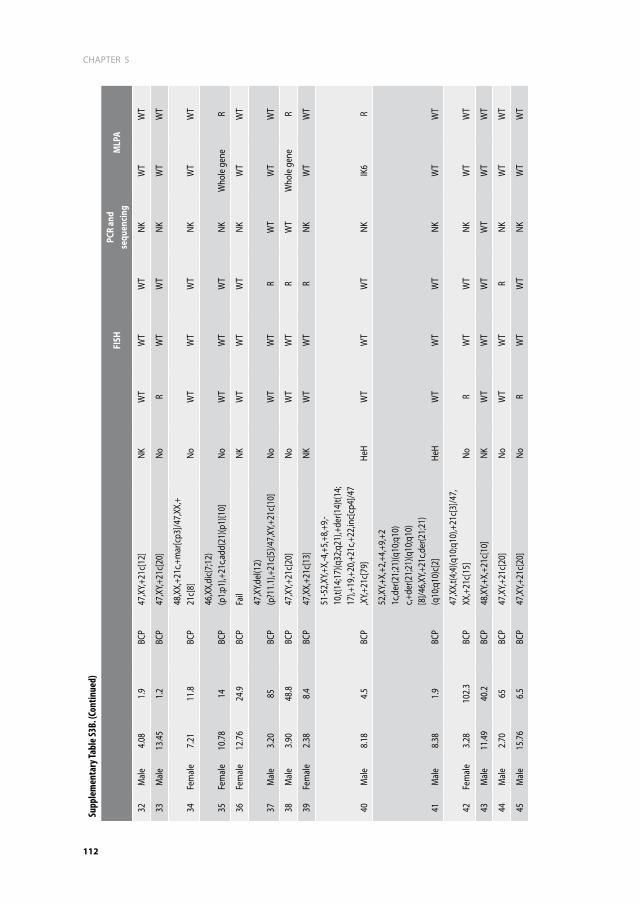
CHAPTER 5
112 113
CHAPTER 5
5
Supp
lem
enta
ry Ta
ble S
3B. (
Cont
inue
d)
fi
ShpC
r an
d se
quen
cing
mLp
a
32M
ale
4.08
1.9
BCP
47,X
Y,+21
c[12
]NK
WT
WT
WT
NKW
TW
T
33M
ale
13.4
51.
2BC
P47
,XY,+
21c[
20]
NoR
WT
WT
NKW
TW
T
34Fe
mal
e7.
2111
.8BC
P48
,XX,
+21c
,+m
ar[c
p3]/4
7,XX
,+21
c[8]
NoW
TW
TW
TNK
WT
WT
35Fe
mal
e10
.78
14BC
P46
,XX,
dic(
7;12
)(p
1;p1
),+21
c,add
(21)
(p1)
[10]
NoW
TW
TW
TNK
Who
le g
ene
R
36Fe
mal
e12
.76
24.9
BCP
Fail
NKW
TW
TW
TNK
WT
WT
37M
ale
3.20
85BC
P47
,XY,d
el(1
2)(p
?11.
1),+
21c[
5]/4
7,XY
,+21
c[10
]No
WT
WT
RW
TW
TW
T
38M
ale
3.90
48.8
BCP
47,X
Y,+21
c[20
]No
WT
WT
RW
TW
hole
gen
eR
39Fe
mal
e2.
388.
4BC
P47
,XX,
+21c
[13]
NKW
TW
TR
NKW
TW
T
40M
ale
8.18
4.5
BCP
51-5
2,XY
,+X,
-4,+
5,+8
,+9,
-10
,t(14
;17)
(q32
;q21
),+de
r(14)
t(14;
17),+
19,+
20,+
21c,+
22,in
c[cp
4]/4
7,X
Y,+21
c[79
]He
HW
TW
TW
TNK
IK6
R
41M
ale
8.38
1.9
BCP
52,X
Y,+X,
+2,+
4,+9
,+2
1c,d
er(2
1;21
)(q10
;q10
)c,+
der(2
1;21
)(q10
;q10
)[8
]/46,
XY,+
21c,d
er(2
1;21
)(q
10;q
10)c
[2]
HeH
WT
WT
WT
NKW
TW
T
42Fe
mal
e3.
2810
2.3
BCP
47,X
X,t(4
;4)(q
10;q
10),+
21c[
3]/4
7,XX
,+21
c[15
]No
RW
TW
TNK
WT
WT
43M
ale
11.4
940
.2BC
P48
,XY,+
X,+2
1c[1
0]NK
WT
WT
WT
WT
WT
WT
44M
ale
2.70
65BC
P47
,XY,+
21c[
20]
NoW
TW
TR
NKW
TW
T
45M
ale
15.7
66.
5BC
P47
,XY,+
21c[
20]
NoR
WT
WT
NKW
TW
T

CHAPTER 5
112 113
CHAPTER 5
5
Supp
lem
enta
ry Ta
ble S
3B. (
Cont
inue
d)
fi
ShpC
r an
d se
quen
cing
mLp
a
46M
ale
9.66
3.7
BCP
47,X
Y,del
(6)(q
2?1q
2?5)
,+21
c[9]
/47,
XY,+
21c[
3]No
WT
WT
WT
NKW
TW
T
47M
ale
2.36
17.3
BCP
Fail
NKW
TW
TR
NKW
TW
T
48M
ale
4.35
25.2
BCP
48,X
Y,+X,
del(1
)(q
32),+
21c[
6]/4
8,XY
,+X,
add(
1)(q
32),+
21c[
3]/ 4
7,XY
,+21
c[1]
NoW
TW
TR
NKW
TW
T
49M
ale
8.57
10.6
BCP
48,X
Y,t(2
;12)
(p1;
q1),-
13,-
20,+
21c,+
21,+
3-4m
ar,in
c[cp
7]No
WT
WT
WT
NKW
TW
T
50M
ale
10.9
415
1BC
P47
,XY,a
dd(1
)(q
2?),+
21c,i
nc[3
]/47,
XY,+
21c[
2]No
WT
WT
WT
NKOt
her
R
51M
ale
13.5
732
.9BC
P47
,XY,+
21c[
20]
NoW
TW
TW
TNK
WT
WT
52M
ale
3.63
24.8
BCP
47,X
Y,+21
c[14
]NK
WT
WT
RW
TW
TW
T
53M
ale
2.49
12.6
BCP
47,X
Y,+21
c[20
]No
WT
WT
RW
TIK
6R
54Fe
mal
e3.
183.
9BC
P47
,XX,
add(
19)
(p13
.3),+
21c[
8]/4
7,XX
,+21
c[7]
NoW
TW
TR
NKW
TW
T
55M
ale
3.70
26BC
P53
~55,
XY,+
X,+4
,+9,
+10,
+18,
+21c
,+2
1,+2
~3m
ar[c
p12]
HeH
WT
WT
WT
NKW
TW
T
56M
ale
3.62
1.7
Null
46,X
Y,add
(6)(q
1),-
13,+
21c[
12]/4
7,XY
,+21
c[8]
NoW
TW
TW
TR
WT
WT
57Fe
mal
e3.
8010
3BC
P47
,XX,
+21c
[2]
NKW
TW
TR
WT
WT
WT
58M
ale
8.31
400
BCP
47,X
Y,-2,
?add
(14)
(q32
),+21
c,+m
ar[5
]No
WT
WT
RNK
IK6
R
59Fe
mal
e8.
1411
.5BC
P47
,XX,
+21c
[20]
NoW
TW
TR
NKW
TW
T

CHAPTER 5
114
Supp
lem
enta
ry Ta
ble S
3B. (
Cont
inue
d)
fi
ShpC
r an
d se
quen
cing
mLp
a
60M
ale
4.94
9.7
Null
47,X
Y,-13
,+21
,+21
c[7]
/47,
XY,t(
9;13
)(q
2?2;
q3?3
),-13
,+21
c[3]
/47,
XY,+
21c[
2]No
WT
WT
WT
NKW
TW
T
61Fe
mal
e5.
731.
9BC
P47
,XX,
del(9
)(p?2
1p?2
1),i(
9)(q
10),+
21c[
8]/4
7,XX
,+21
c[7]
NoW
TW
TW
TR
IK6
R
62M
ale
3.54
95.7
BCP
49,X
Y,+X,
+9,?a
dd(1
2)(p
1),+
21c[
12]/4
7,XY
,+21
c[8]
NoW
TW
TR
WT
WT
WT
63Fe
mal
e18
.50
4.2
BCP
47,X
X,+2
1c[1
3]NK
WT
WT
TLNK
Who
le g
ene
R
64M
ale
12.3
421
.9BC
P47
,XY,d
er(1
4)t(8
;14)
(q11
;q32
),+21
c[5]
/47,
XY,+
21c[
5]No
WT
WT
WT
NKW
TW
T
65M
ale
1.89
14.9
BCP
47,X
Y,del
(7)(q
22q3
4),ad
d(20
)(q
11),+
21c[
15]/4
7,XY
,+21
c[5]
NoR
WT
WT
NKW
TW
T
66M
ale
3.28
148
BCP
Fail
NKR
WT
R ne
g, TL
NK
WT
WT
WT
67M
ale
4.11
29.5
BCP
47,X
Y,+21
c[25
]No
WT
WT
RNK
Othe
rR
68Fe
mal
e6.
652.
5BC
P
58,X
X,+X
,+4,
+6,+
8,+1
0,+1
4,+1
4,+
17,+
18,+
21c,+
21,+
21[5
]/47,
XX,
+21c
[5]
HeH
WT
WT
R ne
g, TL
NK
NKW
TW
T
69Fe
mal
e4.
245.
1BC
P47
,XX,
+21c
[20]
NoW
TW
TR
NKW
TW
T
70M
ale
5.15
18.6
BCP
46,X
Y,der
(14;
21)
(q10
;q10
),+21
c[20
]No
RW
TW
TNK
WT
WT
71Fe
mal
e2.
395.
2BC
P47
,XX,
+21c
[20]
NoW
TW
TW
TNK
WT
WT
72Fe
mal
e23
.24
14.9
BCP
Fail
NoW
TW
TR
neg,
TL N
KNK
Who
le g
ene
R
73M
ale
4.33
13.5
BCP
47,Y,
add(
X)(q
2?8)
,+21
c/47
,XY,+
21c[
5]No
WT
WT
RNK
WT
WT
74M
ale
2.50
13.7
BCP
47,X
Y,+21
c[10
]NK
RNK
WT
NKW
TW
T

115
CHAPTER 5
5
Supp
lem
enta
ry Ta
ble S
3B. (
Cont
inue
d)
fi
ShpC
r an
d se
quen
cing
mLp
a
75M
ale
3.60
57.9
BCP
47,X
Y,+21
c[21
]No
WT
WT
RNK
WT
WT
76M
ale
3.55
14.8
BCP
47,X
Y,+21
c[20
]No
WT
WT
WT
NKW
TW
T
77Fe
mal
e18
.95
21.2
BCP
48,X
,t(X;
14)
(p2;
q32)
,+de
r(X)t(
X;14
)(p
2;q3
2),+
21c[
7]/4
7,XX
,+21
c[16
]No
WT
WT
TLNK
WT
WT
78M
ale
3.43
6.3
BCP
47,X
X,+X
,i(21
)(q10
)c,i
nc[2
]/46,
XY,i(
21)(q
10)c
,inc[
18]
NoW
TW
TR
NKIK
6R
79M
ale
5.98
4.5
BCP
49,X
Y,+X,
del(1
1)(q
22q2
5),+
17,+
21c
[10]
/47,
XY,+
21c[
1]No
WT
WT
RNK
WT
WT
80M
ale
21.7
817
.5BC
P46
,XY,+
21c[
20]
NoW
TW
TR
NKIK
6R
81Fe
mal
e10
.55
83.4
BCP
47,X
X,ad
d(12
)(p
1?),+
21c[
4]/4
7,ad
d(6)
(q1)
,-9,
+21c
,+m
ar,in
c[3]
/47,
XX,+
21c[
5]No
RW
TW
TNK
WT
WT
82M
ale
6.93
60.3
BCP
48,X
Y,+21
c,+21
[8]/4
7,XY
,+21
c[2]
NoW
TW
TW
TNK
WT
WT
83M
ale
4.84
3.2
BCP
47,X
Y,+21
c[20
]No
WT
WT
RNK
WT
WT
84M
ale
19.7
919
.6BC
P47
,XY,a
dd(7
)(q?1
1.2),-
13,d
el(14
)(q?1
1.2),+
21c,+
mar
[cp7]
/47,X
Y,+21
c[13]
NoW
TW
TW
TNK
Othe
rR
85M
ale
5.41
67.7
BCP
47,X
Y,+21
c[10
]No
RW
TW
TNK
WT
WT
86M
ale
5.21
13BC
P47
,XY,+
21c[
20]
NoW
TW
TR
NKW
TW
T
87Fe
mal
e4.
286.
9BC
P47
,XX,
+21c
[20]
NoW
TW
TTL
NKW
TW
T
88Fe
mal
e2.
4173
.2BC
P47
,XX,
+21c
[14]
NKR
WT
WT
WT
WT
WT
9 (1
0.6%
)23
(27.
1%)
Tota
l num
ber o
f abe
rrat
ions
4 (5
.5%
)15
(17.
6%)
-43
(51.
2%)
8 (4
0%)
23 (2
7.1%
)
Kary
otyp
e nom
encla
ture
acco
rding
to IS
CN 20
09. D
own s
yndr
ome a
cute
lym
phob
lastic
leuk
emia;
WBC
, whit
e bloo
d cell
coun
t; IP
T, im
mun
e phe
noty
pe; B
CP, B
cell p
recu
rsor;
HeH,
High
Hyp
erdip
loid (
≥51
chro
mos
omes
[50 +
21
c]), W
T, wi
ldtyp
e; R,
rear
rang
emen
t; TL,
trans
locat
ion; N
K, no
t kno
wn; IK
6, IK
ZF1 i
sofo
rm 6.

CHAPTER 5
116
0.75, SE=0.07
Pa,ents with IKZF1 wildtype (N= 54, 11 events)
0.31, SE=0.10
Pa,ents with IKZF1 dele,ons (N= 29, 18 events)
years
Log-‐Rank p = <.0001
P
0.0
0.1
0.2
0.3
0.4
0.5
0.6
0.7
0.8
0.9
1.0
0 1 2 3 4 5 6 7 8 9 10
A)
0.82, SE=0.06
Pa,ents with IKZF1 wildtype (N= 54, 10 events)
0.40, SE=0.10
Pa,ents with IKZF1 dele,ons (N= 29, 16 events)
years
Log-‐Rank p = .00030
P
0.0
0.1
0.2
0.3
0.4
0.5
0.6
0.7
0.8
0.9
1.0
0 1 2 3 4 5 6 7 8 9 10
B)
Pa,ents with IKZF1 wildtype (Events/N 4/54) Pa,ents with IKZF1 dele,ons (Events/N 9/29)
years
P
Relapse p(Gray)=0.007
0.0
0.1
0.2
0.3
0.4
0.5
0 1 2 3 4 5 6 7 8 9 10
0.11, SE=0.06
0.37, SE=0.11
C)
Supplementary Figure S2. Survival of the combined dataset with and without IKZF1 aberrationsKaplan-Meier estimates for 6-year EFS (A), OS (B) and CIR (C) for IKZF1 in the combined dataset (DCOG and UK DS ALL patients). Patients with IKZF1 deletions have a significantly worse outcome in terms of OS and EFS compared with IKZF1 wildtype patients. There is no statistically significant difference in CIR.
0.79, SE=0.14
Pa.ents with CRLF2 wildtype (N= 12, 2 events)
0.75, SE=0.10
Pa.ents with genomic CRLF2 aberra.ons (N= 21, 5 events)
years
Log-‐Rank p = .58
P
0.0
0.1
0.2
0.3
0.4
0.5
0.6
0.7
0.8
0.9
1.0
0 1 2 3 4 5 6 7 8 9 10
A) 0.92, SE=0.08
Pa.ents with CRLF2 wildtype (N= 12, 1 event)
0.81, SE=0.09
Pa.ents with genomic CRLF2 aberra.ons (N= 21, 4 events)
years
Log-‐Rank p = .42
P
0.0
0.1
0.2
0.3
0.4
0.5
0.6
0.7
0.8
0.9
1.0
0 1 2 3 4 5 6 7 8 9 10
B)
Pa.ents with CRLF2 wildtype (Events/N 2/12) Pa.ents with genomic CRLF2 aberra.ons (Events/N 3/21)
years
P
Relapse p(Gray)= 0.90
0.0
0.1
0.2
0.3
0.4
0.5
0 1 2 3 4 5 6 7 8 9 10
0.21, SE=0.15
0.15, SE=0.08
C)
Supplementary Figure S3. Survival of Dutch childhood oncology group Down syndrome ALL patients with and without CRLF2 aberrations. Kaplan-Meier estimates for 6-year EFS (A), OS (B) and CIR (C) for CRLF2 in DCOG DS ALL patients. There was no statistically significant difference in clinical outcome between patients with or without genomic CRLF2 aberrations, neither in the DCOG cohort (EFS 75±10% vs. 79±14%; p=0.6, OS 81±9% vs. 92±8%; p=0.42 and CIR 15±8% vs. 21±15%; p (Gray) = 0.9) nor in the UK cohort (EFS 50±9% vs. 67±8%; p=0.26, OS 58±9% vs. 69±8%; p=0.27 and CIR 22±8% vs. 11±5%; p (Gray) = 0.32)
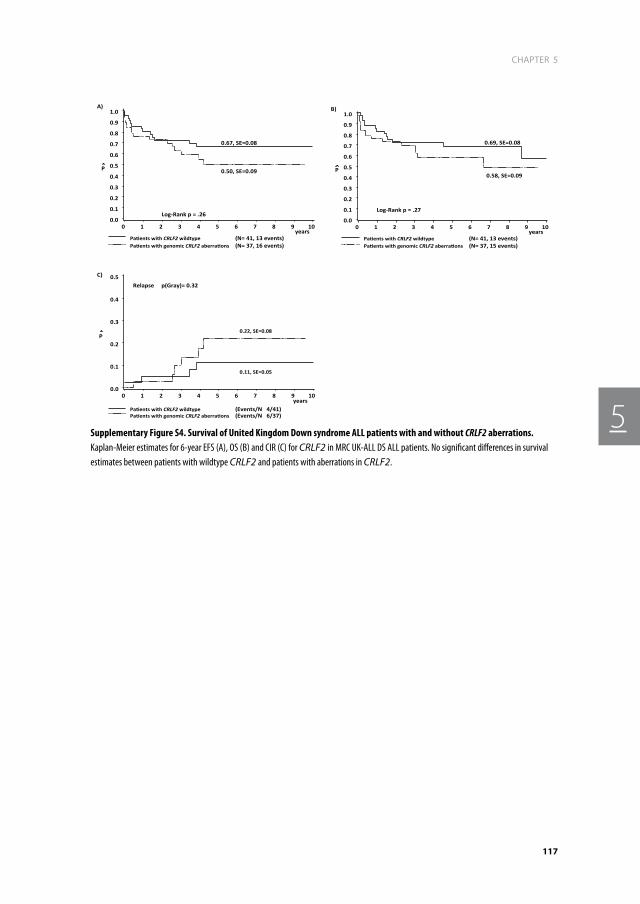
117
CHAPTER 5
5
0.67, SE=0.08
Pa-ents with CRLF2 wildtype (N= 41, 13 events)
0.50, SE=0.09
Pa-ents with genomic CRLF2 aberra-ons (N= 37, 16 events)
years
Log-‐Rank p = .26
P
0.0
0.1
0.2
0.3
0.4
0.5
0.6
0.7
0.8
0.9
1.0
0 1 2 3 4 5 6 7 8 9 10
A)
0.69, SE=0.08
Pa-ents with CRLF2 wildtype (N= 41, 13 events)
0.58, SE=0.09
Pa-ents with genomic CRLF2 aberra-ons (N= 37, 15 events)
years
Log-‐Rank p = .27
P
0.0
0.1
0.2
0.3
0.4
0.5
0.6
0.7
0.8
0.9
1.0
0 1 2 3 4 5 6 7 8 9 10
B)
Pa-ents with CRLF2 wildtype (Events/N 4/41) Pa-ents with genomic CRLF2 aberra-ons (Events/N 6/37)
years
P
Relapse p(Gray)= 0.32
0.0
0.1
0.2
0.3
0.4
0.5
0 1 2 3 4 5 6 7 8 9 10
0.22, SE=0.08
0.11, SE=0.05
C)
Supplementary Figure S4. Survival of United Kingdom Down syndrome ALL patients with and without CRLF2 aberrations. Kaplan-Meier estimates for 6-year EFS (A), OS (B) and CIR (C) for CRLF2 in MRC UK-ALL DS ALL patients. No significant differences in survival estimates between patients with wildtype CRLF2 and patients with aberrations in CRLF2.


6BTG1 deletions do not predict outcome in Down syndrome acute lymphoblastic leukemia
T.D. Buitenkamp, R. Pieters, M. Zimmermann, V. de Haas, S.M.
Richards, A.J. Vora, C.D. Mitchell, C. Schwab, C.J. Harrison, A.V.
Moorman, M.M. van den Heuvel-Eibrink, C.M. Zwaan
Leukemia. 2013 Jan; 27(1): 251-2.


121
CHAPTER 6
6
TO The ediTOr
Children with Down syndrome (DS) have an increased risk of developing acute myeloid (AML)
and B-cell precursor acute lymphoblastic leukemia (BCP-ALL).1 The prognosis of DS ALL is at
best similar and often inferior to that of sporadic ALL (non-DS) patients.2,3 DS ALL is character-
ized by unique biological features when compared to non-DS ALL. For instance, DS ALL has
a lower frequency of the favorable genetic abnormalities t(12;21)(p13;q22) [ETV6-RUNX1]
and the unfavorable t(9;22)(q34;q11) [BCR-ABL1]],3,4 but a higher frequency of JAK2 muta-
tions and CRLF2 rearrangements.5,6 Using genome wide screening techniques, several (novel)
genomic aberrations involved in the pathogenesis of (non) DS ALL were identified.7,8 The
potential prognostic impact of most of these novel aberrations and whether these patients
may benefit from specific therapies targeted to these unique genetic features needs to be
investigated further.
The B-cell translocation gene 1 (BTG1) was recently described as a recurrent lesion in
pediatric BCP-ALL.7,9,10 It was originally identified as a translocation partner of c-MYC in B-cell
chronic lymphocytic leukemia.11,12 BTG1 is a highly conserved gene and belongs to the family
of BTG/TOB genes.11,13 It plays a role in several crucial cellular processes, such as proliferation,
and apoptosis. Recently, Lundin et al. reported on a high frequency of BTG1 deletions (~29%)
in DS ALL.14 However, the study included a limited number of DS ALL patients (n=17) and
hence may not be an accurate estimate of the frequency of BTG1 deletions in DS ALL. There-
fore, we investigated the frequency of BTG1 deletions in a large series of DS ALL patients and
in addition analyzed the prognostic significance of BTG1 abnormalities.
We screened a population-based cohort of 116 DS ALL patients enrolled in consecutive
DCOG and UK treatment protocols (DCOG ALL 8, 9 and 10 and UK ALL ALL97, ALL97/99 and
ALL2003).8 Clinical and cell-biological data, including cytogenetics, were available for all
cases. DCOG and UK centrally reviewed diagnosis, classification and clinical follow-up of the
patients. The Institutional Review Board approved the investigations, and informed consent
was obtained according to local law and regulations.
To identify BTG1 deletions, we performed Multiplex Ligation-dependent Probe Amplifi-
cation (MLPA) analysis using the SALSA MLPA kit P335-A3 ALL-IKZF1 (MRC Holland) which
contains probes for selected B-cell development and differentiation genes.8 The BTG1 gene
is covered by four probes, probes to exon 1, exon 2, and 2 additional probes localized to
the highly conserved promoter region of the gene (area 1 and 2). The full list and location
of the MLPA probes can be downloaded from the MRC Holland website (http://www.mrc-
holland.com). Peak heights below 0.7 (0.75 for MRC UKALL samples) and above 1.3 times
the control peak height were considered abnormal, with those below 0.7 (0.75) representing
deletions, and those above 1.3 representing duplications. The Kaplan-Meier method was
used to estimate the 5-year probability of overall survival (OS), and event-free survival (EFS);
survival estimates were compared using the log-rank test. OS was measured from the date
CHAPTER 6
122
of diagnosis to the date of last follow-up or date of death from any cause. EFS was calculated
from the date of diagnosis to the date of last follow-up or to the first event, including relapse,
failure to achieve CR, and death in complete remission (CR). Cumulative incidence of relapse
(CIR) was constructed by the method of Kalbfleisch and Prentice and compared by the Gray
test.
All 116 DS ALL patients were classified as B-cell precursor ALL and treated with curative
intent. The median age was 5.1 years (range 1.3 – 23.2), the median WBC was 14 x 109/L (range
1.2-400), and 65% of the patients were male. The median follow up time for survivors was 4.6
years (range 1.3 months – 15.3 years).
In total we found 8/116 (6.9 %) deletions of BTG1, a frequency lower than described by
Lundin et al14 in DS ALL and similar to other non-DS B-cell precursor ALL series.7,9 Remarkably,
all 8 patients showed a nearly identical deletion pattern in which the BTG1 area 1, area 2, and
exon 2 probes were deleted, while exon 1 was retained (6x mono-allelic, 2x bi-allelic). Due to
statistical power, we excluded one patient from the analysis who had a mono-allelic amplifi-
cation of the BTG1 area 2 probe. This patient also had a CRLF2 aberration, but the karyotype
of this patient showed no other aberration than the constitutional trisomy 21. She remains in
complete remission for >10 years. The median age of DS ALL patients with a deletion of BTG1
was 5.4 years (range 2.7 – 23.2), the median WBC was 59 x 109/L (range 11.3-390), and 62% of
the patients were male. This is different from the cohort of Lundin et al 14, who reported a high
median age of 12 years in patients with a BTG1 deletion and a WBC of 25x109/L. Interestingly
they reported that BTG1 deletions occurred in predominantly male patients (80%), which is
different from our cohort (62% male). BTG1 deletions were not mutually exclusive of other
genomic aberrations (e.g. IKZF1 in 4 patients, CRLF2 in 4 patients). As previously described 7,9,10, BTG1 deletions were mainly found in patients with ETV6-RUNX1 positive ALL (38% vs.
12% in the BTG1 wildtype group; p=0.02).
Interestingly BTG1 regulates the glucocorticoid (GC) receptor dependent response in
leukemic cells,15 and it is therefore implicated that loss of this gene perhaps contributes to
a poor outcome.14,15 Unfortunately, data were available on clinical response to one week of
prednisone for only 2 patients with a BTG1 deletion; both were good responders. No sig-
nificant differences in long-term clinical outcome between wildtype and BTG1 deleted cases
were detected: 5-year EFS 67 ± 5% vs. 60 ± 18% (p=0.4), OS 72 ± 5% vs. 60 ±18%; (p=0.3) CIR
17± 4% vs. 15 ± 15%; (p(Gray)= 0.9). A stepwise multivariate Cox regression model was per-
formed which included WBC ≥50x109, age ≥10 years, and mutational status of BTG1, IKZF1,
and ETV6-RUNX1 (Table 1). Deletions of BTG1 did not predict for prognosis with a hazard ratio
(HR) for EFS of 1.97 (95% CI 0.6 – 6.8); p=0.29 and OS HR 2.24 (95% CI 0.6 - 7.9; p=0.2). Instead,
IKZF1 appeared to be the strongest independent risk factor for EFS, with a HR EFS 2.45 (95%
CI 1.2–5.1; p=0.02), as previously described by us.8
In conclusion, we could not confirm the high frequency of BTG1 deletions previously
described in a small series of DS ALL but found a prevalence similar to non-DS ALL patients.

123
CHAPTER 6
6
Moreover, BTG1 deletions did not predict for dismal outcome in DS ALL patients in contrast
to IKZF1 aberrations. Further research is needed to identify other potential players and coop-
erating events in the leukemogenesis in DS children.
aCknOwLedGemenT Of reSearCh SuppOrT
This study was supported by research funding from the foundation Kinderen Kankervrij
(KIKA) to T.D.B. and C.M.Z, and the Leukaemia and Lymphoma Research (LLR) to C.S., C.J.H.
and A.V.M.
Table 1. Results of multivariate analysis for event-free survival, overall survival, and relapse free survival
Outcome Variable hr 95% Ci P-value
efS
BTG1 1.97 0.57 - 6.84 0.29
IKZF1 2.45 1.18 - 5.07 0.02
ETV6-RUNX1 0.22 0.03 - 1.74 0.15
WBC ≥50x109 2.55 0.88 - 7.39 0.08
Age ≥10 years 1.29 0.59 - 2.85 0.52
OS
BTG1 2.24 0.63 - 7.91 0.21
IKZF1 2.02 0.95 - 4,29 0,06
ETV6-RUNX1 0.21 0.03 -1.67 0.14
WBC ≥50x109 2.49 0.85 - 7.26 0.09
Age ≥10 years 1.20 0.52 - 2.76 0.66
HR, Hazard ration; CI, Confidence interval; EFS, event-free survival; OS, overall survival; WBC, white blood cell

CHAPTER 6
124
referenCeS
1. Hasle H, Clemmensen IH, Mikkelsen M. Risks of leukaemia and solid tumours in individuals with Down’s syndrome. Lancet. 2000; 355(9199): 165-169.
2. Whitlock JA, Sather HN, Gaynon P, et al. Clini-cal characteristics and outcome of children with Down syndrome and acute lympho-blastic leukemia: a Children’s Cancer Group study. Blood. 2005; 106(13): 4043-4049.
3. Buitenkamp T ZM, Forestier E, Heerema NA, van den Heuvel MM, Pieters R, de Haas V, Silverman LB, Schmiegelow K, Liang DC, Horibe K, Arico M, Cazzzaniga G, Basso G, Rabin KR, Schrappe M Cario G, Mann G, Mondelears V, Lammens T, Cave H, Stark B, Moorman AV, Vora AJ, Hunger S, Pui CH, Mulligahn CG, Manabe A, Escherich G, Kowalczyk J, Whitlock JA, Zwaan CM. Acute Lymphoblastic Leukemia in children with Down Syndrome: a report from the Ponti di Legno Study group. ASH. San Diego; 2011.
4. Forestier E, Izraeli S, Beverloo B, et al. Cyto-genetic features of acute lymphoblastic and myeloid leukemias in pediatric patients with Down syndrome: an iBFM-SG study. Blood. 2008; 111(3): 1575-1583.
5. Hertzberg L, Vendramini E, Ganmore I, et al. Down syndrome acute lymphoblastic leukemia, a highly heterogeneous disease in which aberrant expression of CRLF2 is associated with mutated JAK2: a report from the International BFM Study Group. Blood. 2010; 115(5): 1006-1017.
6. Mullighan CG, Collins-Underwood JR, Phil-lips LA, et al. Rearrangement of CRLF2 in B-progenitor- and Down syndrome-associated acute lymphoblastic leukemia. Nat Genet. 2009; 41(11): 1243-1246.
7. Mullighan CG, Goorha S, Radtke I, et al. Genome-wide analysis of genetic alterations in acute lymphoblastic leukaemia. Nature. 2007; 446(7137): 758-764.
8. Buitenkamp TD, Pieters R, Gallimore NE, et al. Outcome in children with Down syndrome
and Acute Lymphoblastic Leukemia: role of IKZF1 deletions and CRLF2 aberrations. Leukemia. 2012.
9. Kuiper RP, Schoenmakers EF, van Reijmersdal SV, et al. High-resolution genomic profiling of childhood ALL reveals novel recurrent genetic lesions affecting pathways involved in lymphocyte differentiation and cell cycle progression. Leukemia. 2007; 21(6): 1258-1266.
10. Tsuzuki S, Karnan S, Horibe K, et al. Genetic abnormalities involved in t(12; 21) TEL-AML1 acute lymphoblastic leukemia: analysis by means of array-based comparative genomic hybridization. Cancer science. 2007; 98(5): 698-706.
11. Rouault JP, Rimokh R, Tessa C, et al. BTG1, a member of a new family of antiproliferative genes. The EMBO journal. 1992; 11(4): 1663-1670.
12. Rimokh R, Rouault JP, Wahbi K, et al. A chro-mosome 12 coding region is juxtaposed to the MYC protooncogene locus in a t(8; 12)(q24; q22) translocation in a case of B-cell chronic lymphocytic leukemia. Genes, chro-mosomes & cancer. 1991; 3(1): 24-36.
13. Rouault JP, Samarut C, Duret L, Tessa C, Samarut J, Magaud JP. Sequence analysis reveals that the BTG1 anti-proliferative gene is conserved throughout evolution in its coding and 3’ non-coding regions. Gene. 1993; 129(2): 303-306.
14. Lundin C, Hjorth L, Behrendtz M, et al. High frequency of BTG1 deletions in acute lym-phoblastic leukemia in children with down syndrome. Genes, chromosomes & cancer. 2012; 51(2): 196-206.
15. van Galen JC, Kuiper RP, van Emst L, et al. BTG1 regulates glucocorticoid receptor autoinduction in acute lymphoblastic leuke-mia. Blood. 2010; 115(23): 4810-4819.


7
Down syndrome acute lymphoblastic leukemia is characterized by loss of ETS-related gene (ERG) repression
T.D. Buitenkamp, M.M. van den Heuvel-Eibrink, M. Zimmerman,
M.A. Horstmann, J.M. Boer, M. Blink, T.C.J.M. Arentsen-Peters, V. de
Haas, R. Pieters, M.L. den Boer, M. Fornerod, C.M. Zwaan
Manuscript in preparation

aBSTraCT
Children with Down syndrome (DS) have an increased risk to develop B-cell precursor acute
lymphoblastic leukemia (BCP-ALL). The driving molecular events in DS ALL pathogenesis are
as yet unsolved. We compared global gene-expression of 30 DS BCP ALL with 502 non-DS
BCP ALL patients to obtain insight into this disease and uncover candidate genes involved
in DS ALL leukemogenesis. Interestingly, 25% of the DS ALL patients with genetically unclas-
sified disease (referred to as B-other ALL) were classified as ‘BCR-ABL1 like’ of which 50% also
had a deletion of IKZF1, indicating that DS ALL has a prognostic unfavorable genetic profile.
In total, we identified 357 probe sets (307 genes) differentially expressed between DS and
non-DS B-other-ALL. Most of these genes were not differentially expressed in DS hemato-
poietic induced pluripotent stem (iPS) cells as compared to non-DS cells. This suggests that
deregulation is related to the DS leukemogenesis and not to trisomy 21. Interestingly, the
hematopoietic regulator ERG was overexpressed in DS-B-other-ALL but strongly repressed
in trisomy 21 hematopoietic iPS cells and healthy DS bone marrow. Literature shows that
hematopoietic overexpression of ERG causes leukemia in mouse models. Considering this
oncogenic potential of ERG overexpression, we suggest that loss of ERG repression in DS early
hematopoietic cells may be an important oncogenic driving event in DS BCP-ALL.

129
CHAPTER 7
7
inTrOduCTiOn
Children with Down syndrome (DS) have an increased risk of developing B-cell precursor
acute lymphoblastic leukemia (BCP-ALL).1 The latter differs in presenting phenotypic charac-
teristics as compared non-DS ALL. For instance, an almost complete absence of T cell ALL and
infant ALL was shown in DS ALL.2-5 In addition, the incidence of the well-known (cyto-) genetic
subtypes such as ETV6-RUNX1, BCR-ABL1 and MLL is low in DS ALL, whereas the frequency of
JAK2, CRLF2 and IKZF1 abnormalities is high as compared to non-DS ALL.6-10 However, the
unique driving genetic event in DS ALL is as yet unknown. Hence, there remains a need to
further investigate the molecular aberrations associated with DS ALL, providing more insight
in the biological background of DS ALL.
Previous studies in non-DS ALL cases showed that relevant genetic subtypes of ALL can be
distinguished by specific discriminative gene expression profiles (GEP).11-13 In this way, a new
clinically relevant group of patients with a ‘BCR-ABL1-like’ profile was identified by us and by
others in 16% of the non-DS ALL and 38% of the DS ALL patients.7,10,13,14 These patients cluster
together in gene expression profiling with BCR-ABL1 rearranged ALL, although the leukemic
cells do not harbor the BCR-ABL1 translocation. This ‘BCR-ABL1-like’ profile is associated with
a poor outcome in non-DS ALL, i.e. event-free survival (EFS) of less than 60% and a cumula-
tive incidence of relapse (CIR) of ~30%.13,14 To date it is unknown what the frequency and
prognostic impact of the ‘BCR-ABL1-like’ GEP is in DS ALL.
Interestingly, previous studies have shown that DS ALL cases cluster together with the
(cyto-) genetic subgroups of their non-DS ALL counterparts, instead of clustering together
as a separate entity from non-DS ALL.8,15 This suggests that, in contrast to myeloid leukemia
(ML) of DS, which is characterized by unique acquired mutations in the transcription factor
GATA1 (globin transcription factor 1),16-18 DS ALL is a molecularly heterogeneous disease often
driven by similar abnormalities as non-DS ALL.8 To further explore candidate genes and their
pathways mediating the leukemogenic effect of trisomy 21, we studied gene expression
profiles of DS and non-DS ALL patients, using the Affymetrix Human Genome U133 plus
2.0 platform, to determine whether DS ALL can be characterized by differentially expressed
genes or pathways as compared to non-DS ALL.
maTeriaLS and meThOdS
Patient material
In total, viably frozen bone marrow (BM) and/or peripheral blood (PB) samples were pro-
vided by the Dutch Childhood Oncology Group (DCOG) and by the German Cooperative ALL
(CoALL) of respectively 31 and 7 DS ALL patients (BM). Moreover, 10 DS ALL unpaired remis-

CHAPTER 7
130
sion samples (9 BM, 1 PB), and 18 healthy newborn DS patients (13 PB, 5 BM) were obtained
from the DCOG. In total, 502 non-DS ALL samples from the DCOG and the CoALL study group,
and 22 healthy non-DS ALL samples from the DCOG were collected. Samples from healthy
non-DS patients were taken during diagnostic work up for disease other than leukemia, such
as solid tumors. Informed consent was obtained from all patients, after Institutional Review
Board approval according to national law and regulations.
The DCOG collected patient characteristics (gender, age, WBC, immunophenotype,
and karyotype). No clinical data was available of CoALL DS ALL patients. In our laboratory,
samples were analyzed for the presence of a ETV6-RUNX1 fusion (FISH and RT-PCR), a BCR-
ABL1 translocation (PCR), an MLL-rearrangement (split-signal FISH and PCR), a TCF3 (E2A)
rearrangement (split-signal FISH), a TCF3-PBX1 (E2A-PBX1) fusion (RT-PCR), and hyperdiploidy
by FISH for chromosomes 4, 8, 17, 21, X.
Microarray- based gene expression profiling
After thawing vials with frozen cells, contaminating non-leukemic cells were eliminated as
described before,19 and genomic DNA and total cellular RNA were extracted from leukemic
cells using Trizol reagent (Gibco BRL, Life Technologies, Breda, the Netherlands), as previ-
ously described.20 RNA integrity was checked using the Agilent 2100 Bio-analyzer (Agilent,
Santa Clara, CA, USA). cDNA and biotinylated cRNA was synthesized and hybridized to the
Affymetrix Human Genome U133 Plus 2.0 Array (Affymetrix, Santa Clara, CA, USA) according
to the manufacturer’s guidelines. All included samples had a ratio between 3′probe/5′probe
for β-actin or glyceraldehyde-3-phosphate dehydrogenase smaller than three, suggesting a
minimal breakdown of RNA/cRNA during the experimental procedure.
Preprocessing of microarray data
Samples of de novo DS ALL and non-DS ALL patients were hybridized to Affymetrix Gene
Chips in different time periods, and for normalization procedures, 8 DS ALL samples were
processed in both datasets. Data acquisition was performed using GCOS 1.0 software, and
probe set intensities of both DS and non-DS samples were normalized using the variance
stabilization normalization (VSN-rma) procedure.21 Thereafter, the median of the 8 overlap-
ping DS ALL samples were used as a reference to calculate log2 expression ratios for each
probe set in the DS ALL and non-DS ALL cohorts separately to correct for batch effects. The
8 overlapping samples were used as reference samples and therefore removed from the two
datasets (Supplementary Figure S1). A principal components analysis (PCA) on log2 ratios
was carried out as a quality control.
To explore whether differences in gene expression were related to the constitutional tri-
somy 21 or to the leukemic clone, we compared our data a with the gene expression profile

131
CHAPTER 7
7
of induced pluripotent stem cells (iPS) differentiated towards hematopoietic tissue (CD43+,
CD41+ and CD235+), and derived from DS and non-DS non-disease tissue (GEO dataset
GDS4377),22 and calculated median log2 ratios per gene, using R, version 3.0.2.23
Identification of ‘BCR-ABL1-like’ cases
DS ALL patients with a ‘BCR-ABL1-like’ signature were identified based on hierarchical cluster-
ing using our previous described 110 probes in a non-DS ALL reference cohort (Gene Expres-
sion Omnibus accession number GSE13351).13,14 DS ALL cases that clustered together with
‘BCR-ABL1 positive cases’ were identified as ‘BCR-ABL1-like’ cases if proven negative for the
BCR-ABL1 translocation. Unsupervised clustering of centralized and scaled expression data,
was performed in R using cosine correlations (www.r-project.org).
Quantitative real-time quantitative PCR (RT-qPCR)
The mRNA expression levels of CRLF2 obtained with GEP were validated in 25/38 DS ALL sam-
ples using Taqman. Moreover, expression levels of the ETS-related gene (ERG) were validated
in 36/38 DS ALL, 10 DS ALL remission, 18 healthy newborn DS, 20 non-DS ALL and 22 healthy
non-DS samples. The non-DS ALL samples were selected for hyperdiploidy with additional
copies of chromosome 21 (n=11) and B-other (n=9). We performed quantitative real-time
PCR (RT-qPCR) with primers as previously described and used SYBRgreen (Finnzymes) for
expression analysis.9,24 The average cycle threshold (Ct) value was used to calculate mRNA
expression levels relative to the expression level of the reference gene RPS20 for CRLF2 and
GAPDH for ERG, by use of the comparative cycle time (ΔCt) method.25
Multiplex Ligation-dependent Probe Amplification (MLPA)
MLPA analysis was performed using the SALSA MLPA kit P335-A3 (MRC Holland). The data
were normalized, by dividing the peak area of each probe by the mean peak area of the
control probes. Peak heights below 0.7 and above 1.3 times the control peak height were
considered abnormal, with those below 0.7 representing deletions, and those above 1.3
representing duplications.
Array-Comparative Genomic Hybridization
To identify copy number changes, we performed 105-K oligonucleotide array-CGH on ge-
nomic DNA on the DCOG cohort as previously described.60 Genomic losses and gains were
identified as a minimum of 3 consecutive probes deviating beyond the threshold of -0.8 for

CHAPTER 7
132
single copy loss and -1.8 for bi-allelic loss (log ratio). Deletions were defined as a loss ≥0.5
million bases, whereas focal deletions were defined as losses < 0.5 million bases.
Statistics
The top most discriminative probe sets between DS and non-DS B-other ALL patients were
selected by rank of p-values obtained by applying an empirical Bayes linear regression model
(LIMMA).26 Moderated T-statistics p-values were corrected for multiple testing using the
False Discovery Rate (FDR) method defined by Benjamini and Hochberg.27 Probe set top lists
were used for analysis in the database for annotation, visualization and integrated discovery
(DAVID), which can be freely accessed at their website.28
To evaluate outcome, statistical analyses were conducted using SAS software (SAS-PC, Ver-
sion 9.1). Complete remission (CR) was defined as less than 5% blast in the bone marrow, with
regeneration of tri-lineage hematopoiesis plus absence of leukemic cells in the cerebrospinal
fluid or elsewhere. Event-free survival (EFS) was calculated from the date of diagnosis to
the date of last follow-up or to the first event, including relapse, death in CR, and failure to
achieve CR (considered as event on day 0). Early death was defined as any death within the
first 6 weeks of treatment, and was considered as an event on day 0. Overall survival (OS)
was measured from the date of diagnosis to the date of last follow-up or to the date of death
from any cause. The Kaplan-Meier method was used to estimate survival rates, and survival
estimates were compared using the log-rank test. The cumulative incidence of relapse (CIR),
with other events and death in CR as competing events, was constructed by the method of
Kalbfleisch and Prentice and compared using the Gray test. Differences with a P value <0.05
were considered significant.
reSuLTS
Patients
A cohort of 38 DS ALL (including the aforementioned 8 reference samples) samples were
available for gene expression profiling. All 38 DS ALL patients were B-cell precursor ALL and
treated with curative intent according to consecutive DCOG studies (n=31),29,30 and CoALL
studies (n=7).31 The DCOG DS ALL patients had a median age of 4.5 years at diagnosis (range
2.0 – 17.1), and a median WBC of 8.1x10⁹/L (range 1.2-112x109/L). Complete cytogenetic data
were available for 37 patients. ETV6-RUNX1 fusions were found in 2 patients; 2 patients had
a hyperdiploid (HD) karyotype (51 chromosomes); 1 patient had a BCR-ABL1 translocation, 1
patient tested negative with molecular methods for ETV6-RUNX1, BCR-ABL1, MLL, and E2A-
PBX1, but could not be tested for HD due to lack of cytospin preparations for immunological

133
CHAPTER 7
7
Table 1. Patient characteristics of included DS ALL patients
id Study group age wBC Subtype IKZF1 del ‘BCR-ABL1-like’ ERG
1 DCOG 9.2 29.7 B-other No No No
2 DCOG 4.9 4 B-other No No No
3 DCOG 2.6 18.4 B-other No Yes No
4 DCOG 13.5 1.2 HD No No No
5 DCOG 3.5 22.3 B-other Total gene No No
6 DCOG 15.4 4.3 B-other No No No
7 DCOG 4.2 41.2 B-other No No No
8 DCOG 2.8 32.6 B-other exon 3-7 No No
9 DCOG 3.1 7.3 B-other No No No
10* DCOG 3.9 77.9 B-other exon 3-6 No No
11 DCOG 5.6 5 B-other No Yes No
12* DCOG 7.9 12.9 B-other exon 2 Yes No
13* DCOG 6.8 199 BCR-ABL1 exon 3-6 No No
14 DCOG 3.7 16.5 B-other No No No
15 DCOG 17.1 20.3 B-other exon 3-6 Yes No
16 DCOG 7 33 B-other exon 3-7 No No
17 DCOG 2 112 B-other No No No
18 DCOG 13.8 1.5 B-other No No No
19* DCOG 5.5 4.5 B-other No Yes No
20* DCOG 8.1 390 B-other exon 3-6 Yes No
21 DCOG 5.4 3.6 B-other No Yes No
22 DCOG 3.7 8.9 HD No No No
23* DCOG 3.3 3.6 B-other No No No
24 DCOG 2.3 6.4 ETV6-RUNX1 No No No
25 DCOG 4.5 5.7 B-other exon 3-6 Yes No
26 DCOG 6.2 4.5 B-other exon 3-6 No No
27 DCOG 4.5 4.8 B-other Total gene No NK
28 DCOG 2.9 19.6 ETV6-RUNX1 No No NK
29 DCOG 12.8 39.8 B-other exon 3-6 No NK
30* DCOG 18.1 16.8 B-other No No NK
31* DCOG 17.1 12.9 B-other No No NK
32 CoALL NK NK B-other No No NK
33 CoALL NK NK B-other No No NK
34 CoALL NK NK B-other No No NK
35 CoALL NK NK B-other Total gene No NK
36 CoALL NK NK B-other No No NK
37 CoALL NK NK Nk# No No NK
38 CoALL NK NK B-other No No NK
* Samples used as a reference sample; HD, hyperdiploid (≥ 51 chromosomes); NK, not known; NK#, this patient tested negative with molecular methods for ETV6-RUNX1, BCR-ABL1, MLL, and E2A-PBX, but could not be tested for HD due to lack of cytospins.
CHAPTER 7
134
staining. The remaining patients (n=32) had no recurrent aberrations and were classified as
B-other. No MLL rearrangements and E2A-PBX1 fusions were found in DS ALL samples. Dele-
tions of IKZF1 were found in 13/38 (34.2%) (Table 1).
Gene expression profiles of DS ALL patients compared to non-DS ALL patients
Microarray based gene expression profiles of DS ALL patients were compared to non-DS ALL
patients. To preclude interference by well-known cytogenetic aberrations, only patients with
genetically unclassified disease (referred to as B-other) were selected for this comparison,
including 25 DS and 141 non-DS B-other ALL patients. In total, 357 probe sets were dif-
ferentially overexpressed with log fold change (FC) ≥1.5 and pFDR ≤0.05 between these 2
groups. The most significant differentially overexpressed gene was CRLF2 with median log
FC 7.3, pFDR 6.13E-28 for DS ALL patients, which was validated with RT-qPCR (correlation
coefficient of Rs=0.7, p<0.001). Focusing on B-cell development and differentiation genes,
besides CRLF2, only VPREB1 (log FC 1.9, pFDR 0.001) was significantly overexpressed in DS
ALL patients (Table 1). The median expression levels for both probe sets (ps) for IKZF1 was
just below our cutoff (ps 1565818_s_at: log FC 0.9, pFDR 0.5 and ps 1565817_at: log FC 1.0,
pFDR 0.95).
Characteristics of ‘BCR-ABL1-like’ DS ALL patients
Eight out of 25 B-other DS ALL patients (32%) were classified as ‘BCR-ABL1 like’. The median
age of these patients was 5.6 years (range 2.6-17.1) versus 4.7 years (range 2.0-18.1) in the
non-‘BCR-ABL1 like’ B-other DS patients, p=0.67. The median white blood cell count at
diagnosis was 9.3x10⁹/L (range 3.6-390x109/L) for ‘BCR-ABL1 like’ versus 16.7.1x109/L (range
1.5-77.9x10⁹/L) for the non-‘BCR-ABL1 like’ B-other DS patients, p=0.66. In total, 4 (50%) of the
‘BCR-ABL1 like’ patients had an IKZF1 deletion.
We next analyzed whether the ‘BCR-ABL1-like’ DS-ALL patients differed in prognosis from
DS B-other ALL patients without a ‘BCR-ABL1 like’ profile. Six out of 8 ‘BCR-ABL1 like’ patients
were in continuous CR with a median FU time of 6.5 years, and 2 patients died of relapse. Ka-
plan Meier survival estimates showed no differences in 6-year EFS comparing DS ALL with a
‘BCR-ABL1 like’ profile versus B-other DS ALL patients (EFS 70±18% vs. 70±11%, p=0.8) overall
survival (OS 88±12% vs. 77±10%, p=0.5) and cumulative incidence of relapse (30±20% vs.
7±7%, p=0.2), but numbers were small (Supplementary Figure S2).
Overexpression of DNA replication and apoptosis pathways in DS ALL
Using DAVID Gene Ontology28 to analyze the differentially overexpressed genes for enrich-
ment of pathways, resulted in 17 clusters with a enrichment score (ES) of ≥1.30 (Table 2),

135
CHAPTER 7
7meaning a p-value less than 0.05. The most significant up-regulated pathway was DNA repli-
cation with an ES of 3.47. This cluster comprises 12 genes, including TERF2 (log FC 3.0, pFDR
3.2E-07), which plays a central role in telomere maintenance and protection against end-
to-end fusion of chromosomes.32,33 In addition, the GINS complex genes 1 and 2 (GINS1 log
FC 2.34, pFDR 1,73E-07, GINS2 log FC 1.77, pFDR 0.0001), 3 mini-chromosome maintenance
proteins MCM2 (log FC 1.88, pFDR 3.3E-06), MCM5 (log FC 1.85, pFDR 0.0004) and MCM6 (log
FC 1.6, pFDR 0.01), and CDT1 (log FC 1.65, pFDR 0.003), were all over expressed, and play an
essential role in initiation of genome replication.34-37 The 2nd up-regulated cluster (ES 2.9)
included the identical protein binding pathway and the 3rd cluster (ES 2.6) comprised the
hemoglobin complex. The fourth up-regulated cluster in DS ALL with ES 2.16, included an
apoptotic pathway comprising genes such as POU4F1 (log FC 2.66, pFDR 0.006), which is an
anti-apoptotic gene, and associated with t(8;21) in adult AML.38 It also includes EPHA7 (log
FC 2.04, pFDR 0.0001), which is a receptor tyrosine kinase and known to be up-regulated in
MLL-AF4 and MLL-AF9 positive cells.39 Furthermore, the cluster showed up-regulation of HRK
(log FC 2.0, pFDR 0.01) and BAX (log FC 1.77, pFDR 1.41E-06), and genes from the TNF family,
TNFAIP3 (log FC 2.0, pFDR 0.0007) and TNFSF12- TNFSF13 (log FC 1.67, pFDR 1.62E-06) all
Table 2. Genes involved in B-cell development and hematopoietic differentiation
Gene symbol Chromosome fold-Change p-value fdr
Genes involved in hematopoietic lineage determination and differentiation
CD34 Chr1 1,3 <0.001 0,1
MYB Chr6 1,2 <0.001 <0.001
GATA1 ChrX 1,0 <0.001 <0.001
GFI1B Chr9 1,0 0,9 0,9
CSF1R Chr5 1,0 0,2 0,3
CEBPA Chr19 0,9 0,5 0,6
Genes involved in B-cell development and differentiation
CRLF2 ChrX 7,3 <0.001 <0.001
VPREB1 Chr22 1,9 <0.001 <0.001
IKZF1 Chr7 1,4 <0.001 <0.001
EBF1 Chr5 1,3 <0.001 0,1
CDKN2A Chr9 1,3 <0.001 <0.001
ETV6 Chr12 1,3 0,2 0,3
JAK2 Chr9 1,1 0,2 0,4
CDKN2B Chr9 1,1 <0.001 0,1
PAX5 Chr9 1,0 <0.001 0,1
P2RY8 ChrX 1,0 0,1 0,2
IL3RA ChrX 0,8 <0.001 0,1
BTG1 Chr12 0,7 <0.001 <0.001
FDR, false discovery rate; Chr, chromosome; * Fold change between the median of the DS B-other patients versus the median of the non-DS B-other patients.
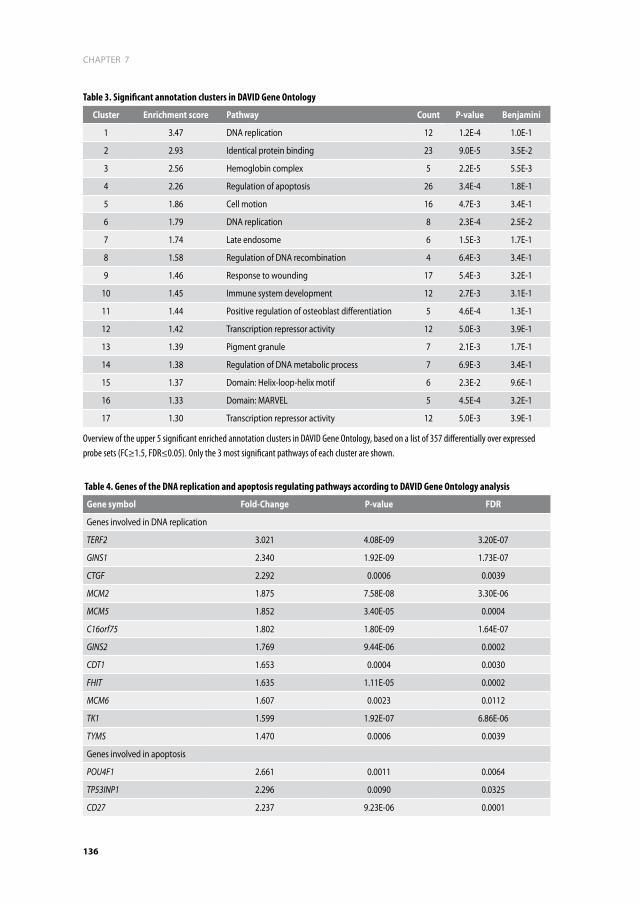
CHAPTER 7
136
Table 3. Significant annotation clusters in DAVID Gene Ontology
Cluster enrichment score pathway Count p-value Benjamini
1 3.47 DNA replication 12 1.2E-4 1.0E-1
2 2.93 Identical protein binding 23 9.0E-5 3.5E-2
3 2.56 Hemoglobin complex 5 2.2E-5 5.5E-3
4 2.26 Regulation of apoptosis 26 3.4E-4 1.8E-1
5 1.86 Cell motion 16 4.7E-3 3.4E-1
6 1.79 DNA replication 8 2.3E-4 2.5E-2
7 1.74 Late endosome 6 1.5E-3 1.7E-1
8 1.58 Regulation of DNA recombination 4 6.4E-3 3.4E-1
9 1.46 Response to wounding 17 5.4E-3 3.2E-1
10 1.45 Immune system development 12 2.7E-3 3.1E-1
11 1.44 Positive regulation of osteoblast differentiation 5 4.6E-4 1.3E-1
12 1.42 Transcription repressor activity 12 5.0E-3 3.9E-1
13 1.39 Pigment granule 7 2.1E-3 1.7E-1
14 1.38 Regulation of DNA metabolic process 7 6.9E-3 3.4E-1
15 1.37 Domain: Helix-loop-helix motif 6 2.3E-2 9.6E-1
16 1.33 Domain: MARVEL 5 4.5E-4 3.2E-1
17 1.30 Transcription repressor activity 12 5.0E-3 3.9E-1
Overview of the upper 5 significant enriched annotation clusters in DAVID Gene Ontology, based on a list of 357 differentially over expressed probe sets (FC≥1.5, FDR≤0.05). Only the 3 most significant pathways of each cluster are shown.
Table 4. Genes of the DNA replication and apoptosis regulating pathways according to DAVID Gene Ontology analysis
Gene symbol fold-Change p-value fdr
Genes involved in DNA replication
TERF2 3.021 4.08E-09 3.20E-07
GINS1 2.340 1.92E-09 1.73E-07
CTGF 2.292 0.0006 0.0039
MCM2 1.875 7.58E-08 3.30E-06
MCM5 1.852 3.40E-05 0.0004
C16orf75 1.802 1.80E-09 1.64E-07
GINS2 1.769 9.44E-06 0.0002
CDT1 1.653 0.0004 0.0030
FHIT 1.635 1.11E-05 0.0002
MCM6 1.607 0.0023 0.0112
TK1 1.599 1.92E-07 6.86E-06
TYMS 1.470 0.0006 0.0039
Genes involved in apoptosis
POU4F1 2.661 0.0011 0.0064
TP53INP1 2.296 0.0090 0.0325
CD27 2.237 9.23E-06 0.0001

137
CHAPTER 7
7inducing apoptosis via multiple pathways. Table 3 shows genes involved in DNA replication
and the apoptotic pathway, including their corresponding values.
Overexpression of chromosome 21 located hematopoietic regulator ERG
As DS-ALL is characterized by an extra copy of chromosome 21, it is expected that deregula-
tion of one or more chromosome 21 encoded genes plays a role in driving the oncogenic pro-
cess. However, the top list of overexpressed genes between DS and non-DS B-other ALL (log
FC ≥1.5, pFDR ≤0.05) showed only 10 genes located on chromosome 21 (Table 4), of which 2
were hematopoietic regulators (RCAN and ERG). In addition, the median expression (-0.002,
p25: -0.05, p75: 0.005) of all genes located on chromosome 21 was slightly, but statistically
significantly, higher for DS ALL patients as compared to non-DS ALL patients (-0.014, p25:
-0.06, p75: 0.04, p=1.4E-10) (Figure 1A), whereas there was no statistical difference (p=0.58)
in median expression for the non-chromosome 21 located genes between DS and non-DS
Table 4. (Continued)
Gene symbol fold-Change p-value fdr
HSP90B1 2.179 0.0001 0.0011
HSPA1A/B 2.051 3.89E-05 0.0005
TNF-AIP3 2.047 0.0001 0.0007
EPHA7 2.043 3.95E-06 0.0001
HRK 2.034 0.0026 0.0126
TUBB 2.021 4.73E-13 2.39E-10
cystatine B 1.921 2.47E-06 0.0001
CD74 1.898 7.94E-12 2.15E-09
LTB 1.832 0.0100 0.0353
TGFB1 1.794 0.0001 0.0008
BAX 1.777 2.61E-08 1.41E-06
Catalase 1.734 0.0068 0.0263
RAG1 1.703 0.0002 0.0019
TNFSF12-TNFSF13 1.667 3.13E-08 1.62E-06
ID3 1.638 0.0108 0.0376
WFS1 1.635 0.0047 0.0196
HSPB1 1.615 0.0009 0.0052
SQSTM1 1.573 0.0058 0.0232
mutS6 1.547 2.40E-08 1.32E-06
IL6R 1.538 4.78E-06 0.0001
PREX1 1.523 1.97E-07 7.01E-06
CD24 1.512 0.0152 0.0487
RAB27A 1.502 0.0002 0.0016
FDR, false discovery rate

CHAPTER 7
138
!"#$%$&'()*+$
!"#$)$&,(-*+$
!"#$,$&-(%*+$
!"#$.$&.(/*+$
!"#$'$&'()*+$
!"#$0$&.(/*+$
!"#$-$&.('*+$
!"#$1$&,(-*+$
!"#$/$&.(/*+$
!"#$%2$&,*+$
!"#$%%$&-('*+$
!"#$%)$&.('*+$!"#$%,$&%('*+$
!"#$%.$&%(/*+$
!"#$%'$&)(0*+$
!"#$%0$&0*+$
!"#$%-$&0(-*+$
!"#$%1$%(%*+$ !"#$%/$&0*+$
!"#$)2$&,(.*+$
!"#$)%$&,(-*+$
!"#$))$&,(-*+$
!"#$345$&.(%*+$
Figure 1. Distribution of differentially expressed genes Hypergeometric distribution of differentially expressed genes for DS as compared to non-DS B-other ALL patients, showing a 2.4% higher median expression of genes located on chromosome 21, p=1.4e-10 (a), and a 0.5% higher median expression of all other genes, not located on chromosome 21, p=0.58 (B). The pie chart (C) illustrates the distribution of 267 differentially over expressed genes from 357 probe sets (FC≥1.5, FDR≤0.05) between DS- and non-DS B-other ALL over the chromosomes. Each part represents a chromosome. The percentage of overexpressed genes per chromosome is shown on the respective part. Chromosome 21 is highlighted because of the constitutional trisomy 21 in DS, and shows an equivalent proportion of genes, c2 p=0.28. Chr, chromosome; BO, B-other; DS, Down syndrome.
A
C
B

139
CHAPTER 7
7
ALL B-other patients (Figure 1B). Consistent with only a slight overall expression increase,
the proportion of significantly differentially over expressed genes (3.7%) on chromosomes
21 in DS ALL cases was not increased when compared to all other chromosomes (4.5%, range
1.1 – 7.5%, c2 p=0.28) (Figure 1C).
We next explored whether the overexpression of genes localized on chromosome 21 in
DS ALL as compared to non-DS ALL, was mainly due to trisomy 21 or due to the leukemic
process promoted by trisomy 21. For that purpose, we compared gene expression changes
in DS-ALL with expression changes in DS-derived iPS cells.22 The vast majority of genes that
were found to be overexpressed in DS ALL compared to non-DS ALL patients in our dataset,
turned out not to be overexpressed when DS-iPS cells where compared to non-DS ALL cells
(p=0.002), indicating that overexpression is not a consequence of merely having an extra
copy of chromosome 21 (Figure 2). Interestingly, the chromosome 21 encoded ERG gene was
strongly reduced in DS-iPS cells, instead of being more highly expressed like the vast majority
of genes on chromosome 21 (Figure 3B).
!"#"$
!"#
Figure 2. Overexpressed genes in Down syndrome ALL as compared to non-Down syndrome ALLPlot showing the expression of chromosome 21 localized and non-chromosome 21 localized genes in DS ALL versus expression changes in trisomy 21 hematopoietic derived iPS cells.

CHAPTER 7
140
To assess whether this reduced expression was also present in patient samples, we mea-
sured ERG mRNA levels in bone marrow of DS ALL remission samples, healthy DS samples and
healthy non-DS individuals. BM samples were taken from 10 DS ALL patients at time of remis-
sion 5.4 (range 1.03-14) months after diagnosis. Samples from healthy newborn DS patients
−0.4 −0.2 0.0 0.2 0.4 0.6 0.8−1.0
−0.5
0.0
0.5
1.0 rho = 0.35p = 6.8e−06
−1
−2
−1
0
1
non-chr21 mRNA expression
DS ALL (mRNA log2 ratios)
triso
my
21 iP
S-de
rived
HC
(mRN
A lo
g2 ra
tios)
rho = −0.02ERG
0 1 2
DS ALL (mRNA log2 ratios)
chr21 mRNA expression
triso
my
21 iP
S-de
rived
HC
(mRN
A lo
g2 ra
tios)
A B
C
−6
−4
−2
0
ERG
mRN
A ex
pres
sion
(log2
GAP
DH ra
tio)
non-DS DS
healthy BM
p = 0.004
n=10
D
rho = 0.77p = 5e−05
n=15
−1 0 1 2
−1.5
−1.0
−0.5
0.0
0.5
ERG expression
microarray (log2 intensties)
Q R
T−PC
R (lo
g2 G
APDH
ratio
)
Figure 3. Gene expression in Down syndrome and non Down syndrome hematopoietic differentiated induced pluripotent stem cellsa) Correlation of mRNA expression of all genes, with the exception of chromosome 21 located genes, between DS ALL and trisomy 21 hematopoietic derived iPS cells. B) Correlation of mRNA expression of chromosome 21 located genes between DS ALL and trisomy 21 hematopoietic derived iPS cells, showing a low expression of ERG in DS ALL cells. C) Boxplot showing the median (line) m-RNA expression of ERG in healthy DS and non-DS samples, boxes represent 25th and 75th percentile and lines minimum and maximum expression. d) Results of RT-qPCR showing the correlation between the mean expression of 4 probe-sets of ERG on gene expression arrays and mRNA expression of ERG relative to GAPDH. Line represents the linear regression fit.

141
CHAPTER 7
7
were drawn within 4 weeks after birth within the context of a DCOG study regarding neonatal
prospective screening for Transient Myeloproliferative Disorder (TMD) in DS children. Data on
the non-DS BCP ALL patients have been previously reported.13,14 We showed that, consistent
with the DS-iPS data, ERG BM mRNA levels in DS remission and healthy samples were reduced
(median: -3.5, p25:-4.5, p:75 -2.2) compared to healthy non-DS individuals (median -1.5, p25
-2.2, p75 -0.3, p=0.004) (Figure 3C). This was confirmed with RT-qPCR showing a correlation
coefficient of Rs = 0.77, p<0.001 for probe set 213541_s_at (Figure 3D). Array-CGH analysis
did not show copy number variations of ERG in this DS ALL patient cohort, which potentially
could influence ERG expression.
As recently was published that ERG deletions and IKZF1 deletions co-occur,40,41 we explored
the correlation between IKZF1 deletions and increasing ERG expression, but the results
showed no significant relation (Figure 4).13
diSCuSSiOn
In the present study, we showed that 25% of the B-other cases cluster together with the
‘BCR-ABL1 like’ non-DS patients. The DS ALL patients with a ‘BCR-ABL1 like profile’ had a
Figure 4. Distribution of IKZF1 deletions in relation to ERG expression in Down syndrome ALL patientsHistogram showing ERG expression for DS ALL patients, thereby indicating the IZKF1 status of patients. ERG expression is shown in log2 intensities. Dark grey bars represent patients with IKZF1 deletions, black bars represent patients with wild type IKZF1 (including 1 patient with an amplification of exon 2, ID 5835), and light grey bars represent patients with unknown IKZF1 status.

CHAPTER 7
142
30% cumulative incidence of relapse, which is similar to their non-DS counterparts.7,13,14,42,43
Although given the limited sample size, we could not statistically proof that relapse rate was
increased compared to DS B-other ALL patients without this signature, these data suggests
that the genetic make-up of DS ALL is unfavorable. In an unselected DCOG series of non-DS
ALL the frequency of the ‘BCR-ABL1-like’ signature was 15%, and 40% of these had IKZF1 dele-
tions, compared to 20% in ‘non-BCR-ABL1-like’ B-other cases.13,14 In our series, 50% of the DS
ALL patients within the ‘BCR-ABL1 like’ had an IKZF1 deletion, which we reported before to
confer poor outcome in DS ALL.7 Interestingly, recent work in non-DS ALL patients showed
that IKZF1 and ERG deletions co-occur in 1.5% of non-DS ALL cases, and that patients with
concurrent ERG deletions have a better outcome.40,41 Remarkably, none of our DS ALL patients
had an ERG deletion (95% CI: 0± 10%).
Consistent with previous studies, the expression profiles showed CRLF2 to be the most
significant gene differentially expressed between DS and non-DS B-other ALL patients.8,9,44
Overexpression arises from IGH@-CRLF2, P2RY8-CRLF2 fusions, or gain of function mutations
of CRLF2 or IL7R.9,44-46 Remarkably, as these abnormalities are present in a substantial propor-
tion (~60%) of all DS ALL patients, CRLF2 was not present in a specific DS ALL signature,8
despite the fact that this DS ALL signature was associated with CRLF2 overexpression in a
supervised analysis.15 Since CRLF2 abnormalities in DS and non-DS ALL are lacking prognostic
relevance,7,47 the value of CRLF2 abnormalities in ALL pathogenesis remains to be seen.
Global analysis of gene expression changes with Gene Ontology (GO)28 revealed an in-
creased expression of DNA replication and apoptosis pathways. For instance, pro-apoptotic
genes such as BAX and HRK in DS ALL were overexpressed in DS ALL. Hypothetically, over-
expression of BAX results in even more apoptotic activity as it promotes apoptosis through
binding and antagonizing B-cell lymphoma 2 (BCL2), which is a suppressor of apoptosis.48 If
apoptosis is less well regulated, it could contribute to clonal expansion of hematopoietic cells,
thereby facilitating the multistep leukemogenesis of DS ALL. Herztberg et al. also used GO
and found a significant enrichment in DNA damage and repair genes in DS ALL with a strong
signature of BCL6.8 They hypothesized that either DS is a predisposing factor for ALL through
B-cell lymphocytic specific genomic instability involving BCL6 or that CRLF2 abnormalities
cause a developmental arrest of the pre-leukemic cell in a stage in which BCL6 is active.8
Further research is needed to investigate the aforementioned pathways and hypothesis.
Interestingly, while genes localized on chromosome 21 are mostly overexpressed in DS
ALL and DS-iPS cells, we saw a reduced expression of ERG in BM samples taken from DS
children without leukemia, and non-leukemic DS iPS derived HPSCs. ERG is a chromosome
21 localized transcriptional regulator of hematopoiesis and is tightly regulated within the
hematopoietic stem cell network.49-51 Within this network, ERG is repressed by SCL and ETO2,
which are known repressors of genes necessary for erythroid maturation.52-55 However, these
genes are also directly and indirectly induced by ERG. Consequently, activation of ERG also
represses ERG. Hypothetically, the extra copy of the ERG gene in DS patients may result in

143
CHAPTER 7
7
deregulation of this network causing an over-repression of ERG.49-51 Reduced levels of ERG
have been found to lead to a significant change in cell morphology, increased apoptosis and
reduction in hematopoiesis, in particular of the megakaryocyte lineage.55,56
In contrast to lower ERG levels in DS healthy bone marrow and iPS cells, we found a substan-
tial overexpression of ERG in leukemic samples of DS patients. Notably, none of the DS ALL
patients in this study had ERG abnormalities, other than the constitutional additional copy,
which potentially could explain the difference in expression. Until now, the precise mecha-
nism of ERG overexpression is unknown, but hematopoietic overexpression of ERG has been
shown to cause leukemia in mouse models.57,58 In addition, ERG strongly cooperates with the
GATA1s truncated protein found in myeloid leukemia (ML) of DS, by immortalizing fetal liver
megakaryocyte progenitors.58,59 In view of the clear role of ERG overexpression in leukemic
proliferation, we suggest that ERG is an important chromosome 21 driving oncogene in DS
BCP-ALL, paradoxically first characterized by lower expression in healthy DS hematopoiesis.
In conclusion, 25% of the DS B-other ALL patients have a ‘BCR-ABL1-like’ profile The CIR for
this subset of DS ALL patients was 30%, which is similar as compared to their non-DS coun-
terparts. Furthermore, we found limited up regulation of chromosome 21 localized genes
in DS ALL compared to non-DS ALL, and many of these changes are trisomy 21 rather than
leukemia specific. One of the few exceptions to this rule is ERG, which is overexpressed in DS
ALL but repressed in healthy DS BM and DS iPS derived hematopoietic pluripotent stem cells.
Further research, studying the role of ERG in DS ALL pathogenesis, is warranted.
aCknOwLedGemenTS
This study was supported by research funding from the foundation Kinderen Kankervrij
(KIKA) to T.D.B. and C.M.Z., and by the Dutch Cancer Society (grant EMCR 2007-3718) to R.P.
and M.L.d.B.

CHAPTER 7
144
referenCeS
1. Hasle H, Clemmensen IH, Mikkelsen M. Risks of leukaemia and solid tumours in individuals with Down’s syndrome. Lancet. 2000; 355(9199): 165-169.
2. Arico M, Ziino O, Valsecchi MG, et al. Acute lymphoblastic leukemia and Down syn-drome: presenting features and treatment outcome in the experience of the Italian Association of Pediatric Hematology and Oncology (AIEOP). Cancer. 2008; 113(3): 515-521.
3. Dordelmann M, Schrappe M, Reiter A, et al. Down’s syndrome in childhood acute lym-phoblastic leukemia: clinical characteristics and treatment outcome in four consecutive BFM trials. Berlin-Frankfurt-Munster Group. Leukemia. 1998; 12(5): 645-651.
4. Maloney KW, Carroll WL, Carroll AJ, et al. Down syndrome childhood acute lympho-blastic leukemia has a unique spectrum of sentinel cytogenetic lesions that influences treatment outcome: a report from the Chil-dren’s Oncology Group. Blood. 2010; 116(7): 1045-1050.
5. Whitlock JA, Sather HN, Gaynon P, et al. Clini-cal characteristics and outcome of children with Down syndrome and acute lympho-blastic leukemia: a Children’s Cancer Group study. Blood. 2005; 106(13): 4043-4049.
6. Bercovich D, Ganmore I, Scott LM, et al. Mu-tations of JAK2 in acute lymphoblastic leu-kaemias associated with Down’s syndrome. Lancet. 2008; 372(9648): 1484-1492.
7. Buitenkamp TD, Pieters R, Gallimore NE, et al. Outcome in children with Down syndrome and Acute Lymphoblastic Leukemia: role of IKZF1 deletions and CRLF2 aberrations. Leukemia. 2012.
8. Hertzberg L, Vendramini E, Ganmore I, et al. Down syndrome acute lymphoblastic leukemia, a highly heterogeneous disease in which aberrant expression of CRLF2 is associated with mutated JAK2: a report from
the International BFM Study Group. Blood. 2010; 115(5): 1006-1017.
9. Mullighan CG, Collins-Underwood JR, Phil-lips LA, et al. Rearrangement of CRLF2 in B-progenitor- and Down syndrome-associated acute lymphoblastic leukemia. Nat Genet. 2009; 41(11): 1243-1246.
10. Mullighan CG, Su X, Zhang J, et al. Deletion of IKZF1 and prognosis in acute lymphoblastic leukemia. N Engl J Med. 2009; 360(5): 470-480.
11. Ross ME, Zhou X, Song G, et al. Classification of pediatric acute lymphoblastic leukemia by gene expression profiling. Blood. 2003; 102(8): 2951-2959.
12. Yeoh EJ, Ross ME, Shurtleff SA, et al. Clas-sification, subtype discovery, and prediction of outcome in pediatric acute lymphoblastic leukemia by gene expression profiling. Cancer cell. 2002; 1(2): 133-143.
13. Den Boer ML, van Slegtenhorst M, De Menezes RX, et al. A subtype of childhood acute lymphoblastic leukaemia with poor treatment outcome: a genome-wide clas-sification study. Lancet Oncol. 2009; 10(2): 125-134.
14. van der Veer A, Waanders E, Pieters R, et al. Independent prognostic value of BCR-ABL1-like signature and IKZF1 deletion, but not high CRLF2 expression, in children with B-cell precursor ALL. Blood. 2013; 122(15): 2622-2629.
15. Loudin MG, Wang J, Leung HC, et al. Ge-nomic profiling in Down syndrome acute lymphoblastic leukemia identifies histone gene deletions associated with altered methylation profiles. Leukemia. 2011; 25(10): 1555-1563.
16. Rainis L, Bercovich D, Strehl S, et al. Muta-tions in exon 2 of GATA1 are early events in megakaryocytic malignancies associated with trisomy 21. Blood. 2003; 102(3): 981-986.
17. Vyas P, Crispino JD. Molecular insights into Down syndrome-associated leukemia. Curr Opin Pediatr. 2007; 19(1): 9-14.

145
CHAPTER 7
7
18. Wechsler J, Greene M, McDevitt MA, et al. Acquired mutations in GATA1 in the mega-karyoblastic leukemia of Down syndrome. Nat Genet. 2002; 32(1): 148-152.
19. Kaspers GJ, Veerman AJ, Pieters R, et al. Mononuclear cells contaminating acute lymphoblastic leukaemic samples tested for cellular drug resistance using the methyl-thiazol-tetrazolium assay. Br J Cancer. 1994; 70(6): 1047-1052.
20. Van Vlierberghe P, van Grotel M, Beverloo HB, et al. The cryptic chromosomal dele-tion del(11)(p12p13) as a new activation mechanism of LMO2 in pediatric T-cell acute lymphoblastic leukemia. Blood. 2006; 108(10): 3520-3529.
21. Huber W, von Heydebreck A, Sultmann H, Poustka A, Vingron M. Variance stabilization applied to microarray data calibration and to the quantification of differential expression. Bioinformatics. 2002; 18 Suppl 1: S96-104.
22. Chou ST, Byrska-Bishop M, Tober JM, et al. Trisomy 21-associated defects in human primitive hematopoiesis revealed through induced pluripotent stem cells. Proceed-ings of the National Academy of Sciences of the United States of America. 2012; 109(43): 17573-17578.
23. R Development Core Team. R: a language and enviroment for statistical computing. In: Computing RFfS ed. Vienna Austria; 2008.
24. Hermkens MC, van den Heuvel-Eibrink MM, Arentsen-Peters ST, et al. The clinical rel-evance of BAALC and ERG expression levels in pediatric AML. Leukemia. 2013; 27(3): 735-737.
25. Meijerink J, Mandigers C, van de Locht L, Tonnissen E, Goodsaid F, Raemaekers J. A novel method to compensate for different amplification efficiencies between patient DNA samples in quantitative real-time PCR. J Mol Diagn. 2001; 3(2): 55-61.
26. Smyth GK. Linear models and empirical bayes methods for assessing differential expression in microarray experiments. Sta-
tistical applications in genetics and molecular biology. 2004; 3: Article3.
27. Benjamini Y, Hochberg Y. Controlling the False Discoery Rate: A Practical and Powerful Approach to Multiple Testing. Journal of the Royal Statiscal Society. 1995; 57(1): 289-300.
28. Database for annotation vaidD. Nature Pro-tocols 2009; 4(1): 44 & Genome Biology 2003; 4(5): P3
29. Kamps WA, Bokkerink JP, Hakvoort-Cammel FG, et al. BFM-oriented treatment for chil-dren with acute lymphoblastic leukemia without cranial irradiation and treatment reduction for standard risk patients: results of DCLSG protocol ALL-8 (1991-1996). Leuke-mia. 2002; 16(6): 1099-1111.
30. Veerman AJ, Kamps WA, van den Berg H, et al. Dexamethasone-based therapy for childhood acute lymphoblastic leukaemia: results of the prospective Dutch Childhood Oncology Group (DCOG) protocol ALL-9 (1997-2004). Lancet Oncol. 2009; 10(10): 957-966.
31. Escherich G, Horstmann MA, Zimmermann M, Janka-Schaub GE. Cooperative study group for childhood acute lymphoblastic leukaemia (COALL): long-term results of tri-als 82,85,89,92 and 97. Leukemia. 2010; 24(2): 298-308.
32. Mitchell TR, Glenfield K, Jeyanthan K, Zhu XD. Arginine methylation regulates telomere length and stability. Molecular and cellular biology. 2009; 29(18): 4918-4934.
33. van Steensel B, Smogorzewska A, de Lange T. TRF2 protects human telomeres from end-to-end fusions. Cell. 1998; 92(3): 401-413.
34. Kamada K, Kubota Y, Arata T, Shindo Y, Hana-oka F. Structure of the human GINS complex and its assembly and functional interface in replication initiation. Nature structural & molecular biology. 2007; 14(5): 388-396.
35. Yu Z, Feng D, Liang C. Pairwise interactions of the six human MCM protein subunits. Journal of molecular biology. 2004; 340(5): 1197-1206.

CHAPTER 7
146
36. Caillat C, Perrakis A. Cdt1 and geminin in DNA replication initiation. Sub-cellular bio-chemistry. 2012; 62: 71-87.
37. Costa A, Onesti S. Structural biology of MCM helicases. Critical reviews in biochemistry and molecular biology. 2009; 44(5): 326-342.
38. Fortier JM, Payton JE, Cahan P, Ley TJ, Walter MJ, Graubert TA. POU4F1 is associated with t(8; 21) acute myeloid leukemia and contrib-utes directly to its unique transcriptional signature. Leukemia. 2010; 24(5): 950-957.
39. Nakanishi H, Nakamura T, Canaani E, Croce CM. ALL1 fusion proteins induce deregula-tion of EphA7 and ERK phosphorylation in human acute leukemias. Proceedings of the National Academy of Sciences of the United States of America. 2007; 104(36): 14442-14447.
40. Clappier E, Auclerc MF, Rapion J, et al. An intragenic ERG deletion is a marker of an oncogenic subtype of B-cell precursor acute lymphoblastic leukemia with a favorable outcome despite frequent IKZF1 deletions. Leukemia. 2014; 28(1): 70-77.
41. Zaliova M, Zimmermannova O, Dorge P, et al. ERG deletion is associated with CD2 and attenuates the negative impact of IKZF1 deletion in childhood acute lymphoblastic leukemia. Leukemia. 2014; 28(1): 182-185.
42. Harvey RC, Mullighan CG, Wang X, et al. Iden-tification of novel cluster groups in pediatric high-risk B-precursor acute lymphoblastic leukemia with gene expression profiling: correlation with genome-wide DNA copy number alterations, clinical characteristics, and outcome. Blood. 2010; 116(23): 4874-4884.
43. van der Veer A, Zaliova M, Mottadelli F, et al. IKZF1 status as a prognostic feature in BCR-ABL1-positive childhood ALL. Blood. 2013.
44. Russell LJ, Capasso M, Vater I, et al. Deregu-lated expression of cytokine receptor gene, CRLF2, is involved in lymphoid transforma-tion in B-cell precursor acute lymphoblastic leukemia. Blood. 2009; 114(13): 2688-2698.
45. Chapiro E, Russell L, Lainey E, et al. Activating mutation in the TSLPR gene in B-cell precur-sor lymphoblastic leukemia. Leukemia. 2010; 24(3): 642-645.
46. Shochat C, Tal N, Bandapalli OR, et al. Gain-of-function mutations in interleukin-7 receptor-alpha (IL7R) in childhood acute lymphoblastic leukemias. The Journal of experimental medicine. 2011; 208(5): 901-908.
47. Buitenkamp TD, Izraeli S, Zimmermann M, et al. Acute lymphoblastic leukemia in children with Down syndrome: a retrospective analy-sis from the Ponte di Legno study group. Blood. 2013.
48. Addeo R, Caraglia M, Baldi A, et al. Prog-nostic role of bcl-xL and p53 in childhood acute lymphoblastic leukemia (ALL). Cancer biology & therapy. 2005; 4(1): 32-38.
49. Bonzanni N, Garg A, Feenstra KA, et al. Hard-wired heterogeneity in blood stem cells revealed using a dynamic regulatory network model. Bioinformatics. 2013; 29(13): i80-88.
50. Ng AP, Loughran SJ, Metcalf D, et al. Erg is required for self-renewal of hematopoietic stem cells during stress hematopoiesis in mice. Blood. 2011; 118(9): 2454-2461.
51. Goldberg L, Tijssen MR, Birger Y, et al. Genome-scale expression and transcription factor binding profiles reveal therapeutic targets in transgenic ERG myeloid leukemia. Blood. 2013; 122(15): 2694-2703.
52. Schuh AH, Tipping AJ, Clark AJ, et al. ETO-2 associates with SCL in erythroid cells and megakaryocytes and provides repressor functions in erythropoiesis. Molecular and cellular biology. 2005; 25(23): 10235-10250.
53. Green AR, DeLuca E, Begley CG. Antisense SCL suppresses self-renewal and enhances spontaneous erythroid differentiation of the human leukaemic cell line K562. The EMBO journal. 1991; 10(13): 4153-4158.
54. Lecuyer E, Herblot S, Saint-Denis M, et al. The SCL complex regulates c-kit expression in hematopoietic cells through functional
147
CHAPTER 7
7
interaction with Sp1. Blood. 2002; 100(7): 2430-2440.
55. Thoms JA, Birger Y, Foster S, et al. ERG pro-motes T-acute lymphoblastic leukemia and is transcriptionally regulated in leukemic cells by a stem cell enhancer. Blood. 2011; 117(26): 7079-7089.
56. Tsuzuki S, Taguchi O, Seto M. Promotion and maintenance of leukemia by ERG. Blood. 2011; 117(14): 3858-3868.
57. Carmichael CL, Metcalf D, Henley KJ, et al. Hematopoietic overexpression of the tran-scription factor Erg induces lymphoid and erythro-megakaryocytic leukemia. Proceed-ings of the National Academy of Sciences of the United States of America. 2012; 109(38): 15437-15442.
58. Salek-Ardakani S, Smooha G, de Boer J, et al. ERG is a megakaryocytic oncogene. Cancer research. 2009; 69(11): 4665-4673.
59. Stankiewicz MJ, Crispino JD. ETS2 and ERG promote megakaryopoiesis and synergize with alterations in GATA-1 to immortalize hematopoietic progenitor cells. Blood. 2009; 113(14): 3337-3347.
60. Buitenkamp TD, Pieters R, Gallimore NE, van der Veer A, Meijerink JP, Beverloo HB, Zim-mermann M, de Haas V, Richards SM, Vora AJ, Mitchell CD, Russell LJ, Schwab C, Harrison CJ, Moorman AV, van den Heuvel-Eibrink MM, den Boer ML, Zwaan CM. Outcome in children with Down’s syndrome and acute lymphoblastic leukemia: role of IKZF1 deletions and CRLF2 aberrations. Leukemia. 2012 Oct; 26(10): 2204-11.

CHAPTER 7
148
Table 5. Differentially over-expressed genes located on chromosome 21
Gene symbol Chromosome fold-Change p-value fdr
PDXK Chr21 (DSCR) 2,340 2,70E-18 1,06E-14
CSTB Chr21 (DSCR) 1,921 2,47E-06 5,25E-05
NRIP1 Chr21 1,708 2,34E-05 0,0003
HSPA13 Chr21 1,673 7,11E-06 0,0001
SUMO3 Chr21 (DSCR) 1,649 9,68E-12 2,47E-09
MRPS6 Chr21 (DSCR) 1,545 1,58E-05 0,0002
DONSON Chr21 (DSCR) 1,528 3,16E-05 0,0004
C21orf45 Chr21 (DSCR) 1,509 9,24E-06 0,0001
ERG Chr21 (DSCR) 1,951 0,0002 0,002
RCAN1 Chr21 (DSCR) 1,507 0,003 0,013
FDR, false discovery rate; Chr, chromosome; DSCR, Down syndrome Critical Region located on chromosome 21q22.1 – 21q22.3.
DS ALL N=38
Non-‐DS ALL N=510
Overlapping DS ALL samples N=8
Calcula>on of median expression per probe set over the 8 reference samples in the DS
and non-‐DS All cohorts
Sample log2 –reference median log2
Join log2 ra>os of DS and non-‐DS ALL samples in a data-‐matrix
Quality control: PCA on log2 ra>os
VSN-‐rma normaliza>on procedure
Use 8 overlapping DS ALL samples as a
reference
Supplementary Figure S1. Flowchart of experimental set up and normalization process Flow chart showing the normalization process of 2 batches of ALL samples. DS, Down syndrome; ALL, Acute Lymphoblastic Leukemia; PCA, Principal Components Analysis.

149
CHAPTER 7
7
a B
C
Supplementary Figure S2. Kaplan-Meier estimates of DS ALL patients with and without a ‘BCR-ABL1-like’ signatureThe overall survival (B), event-free survival (A), and cumulative incidence of relapse (C) are depicted for the n=8 patients with a ‘BCR-ABL1-like’ signature (grey line) versus B-other DS-ALL patients (n=18, black line).


8 General Discussion and future
perspectives


153
CHAPTER 8
8
In this thesis we aimed at identifying novel genetic abnormalities that characterize DS ALL
and described clinically relevant prognostic factors and molecular aberrations found in high
frequencies in DS ALL patients. Here we discuss the main findings in the context of current
literature, and their implications for future research and treatment approaches.
The unreSOLVed rOLe Of TriSOmy 21 in dOwn SyndrOme Leukemia
Down syndrome is one of the most common congenital chromosomal abnormalities, with a
prevalence of ~320 live births in the Netherlands.1 Children with DS have an increased risk
of developing ALL as well as Down syndrome myeloid leukemia (ML DS), which was already
discovered in the 1930’s.2 3-7 It is reasonable to suspect that the constitutional chromosome
21 provides a natural model for multistep leukemogenesis. For instance, in studies on abor-
tion material it appeared that trisomy 21 induced an increase in megakaryopoiesis, perhaps
as a first step towards myeloid leukemia, which is often megakaryoblastic in nature.8
Remarkably, an additional chromosome 21 is one of the most common changes in non-DS
ALL cells.9 Moreover, in approximately 8% of the DS ALL patients there are additional copies
of chromosome 21 on top of the +21c. However, the functional consequences of tri- and
tetrasomies of genes localized in the “Down syndrome critical region” (DSCR), mapped
between the DS21S17 marker and Myxovirus Resistance1 (MX1) on chromosome 21, are still
controversial.10 For instance, it appears that mRNA levels are not always 1.5 fold higher as
would be expected by the trisomy state.11 However, leukemia initiating evens may not be
limited to chromosome 21, as for instance in myeloid leukemia of Down syndrome (ML DS)
GATA1 mutations are pathognomonic, and localized on chromosome X, whereas the high
frequency of IKZF1 abnormalities found in DS ALL (reported in this thesis in chapter 5) are
localized on chromosome 7.
Furthermore, approximately 25-50% of DS ALL cells harbor an additional chromosome
X, which is a common event in hyperdiploid non-DS ALL as well.12 However, hyperdiploid
non-DS ALL often also includes additional copies of chromosome 6, 10, 14, 17, 18 and 21,
whereas in DS ALL an additional chromosome X often is a single event. The latter suggests
a mechanism between genes localized on chromosome 21 and chromosome X, as also seen
in myeloid leukemogenesis in DS children.13,14 In addition, other cytogenetic abnormalities
(discussed in more detail below) may be initiating or additional events in multistep DS ALL
leukemogenesis. However, in the end, the underlying responsible mechanism for the high
frequency of leukemias in DS children remains unclear. Moreover, as DS patients have a
reduced propensity for solid tumors, trisomy 21 is not a cancer susceptible syndrome per se.2

CHAPTER 8
154
CLiniCaL CharaCTeriSTiCS Of aLL in dOwn SyndrOme
DS-ALL patients differ in presenting phenotypic characteristics from non-DS ALL patients.
For instance, the incidence of T cell ALL and CD10-negative ALL (pro-B cell ALL) is lower in
DS ALL, but the frequency of these features varies in the literature due the small size of most
studies in DS-ALL patients. 14-20 In the large international retrospective study including >650
cases (chapter 2), we indeed showed an almost complete absence of T cell ALL cases (<1%) in
DS children while the rate in non-DS ALL is 10-15%.15,16,18 Hence the increased risk of lympho-
blastic leukemia in DS is limited to the B cell lineage. Hypothetically, the rarity of T cell ALL
might be due to a block in the NFAT Calcineurin pathway.21 This pathway is a major regulator
of T cell development and function, and is inhibited in DS due to the increased dosage of
chromosome 21 localized RCAN and DYRK1A49-50 genes.22
We also showed that the age distribution at diagnosis is different as compared to non-DS
ALL, as ALL in DS infants did not occur in our large series.23 The biological background for this
is not understood. Furthermore, the absence of DS ALL in infants is in sharp contrast to the
transient myeloid disorders (TMD) that are already present at birth in about 5-10% of all DS
infants.24-28 The latter may be derived from a major change in normal multi-lineage myeloid
hematopoiesis in the fetal liver, induced by trisomy 21 itself, and thereby creating a window
of opportunity for myeloid leukemic transformation in newborn DS children.8
In the large PdL working group study, we identified a novel clinically favorable prognostic
subgroup of DS-ALL patients, characterized by age <6 years and WBC <10x109/L.23 These
criteria predicted outcome more reliably than the classical NCI-criteria (age <10 years and
WBC <50x109/L).23,29 Remarkably, DS ALL patients aged ≥6 and <10 year at diagnosis had a
relatively poor outcome (EFS 51±3%, OS 70±5%), which was due to a very high frequency of
relapse (CIR 41± 6%). This might have contributed to the reduced ability of the classical NCI
criteria to risk-stratify DS ALL patients (age cut off ≥10 years). The subgroup of DS ALL pa-
tients aged ≥6 and <10 years did not differ in clinical characteristics from patients less than 6
year or ≥10 year at diagnosis. Moreover, no recurrent cytogenetic aberrations were reported
for the vast majority of patients within this age group and 42% had a normal karyotype,
which is similar to other age groups. This subgroup of DS ALL patients, characterized by a
normal karyotype and a poor prognosis, should be explored further by using next generation
sequencing to identify the underlying genetic abnormalities that drive the disease.
Unfortunately MRD was not routinely determined during the era of the PdL working group
study, hence it is unknown whether MRD would be a better predictive biomarker for outcome
than these revised NCI-criteria, as has been shown for non-DS ALL in multiple studies.

155
CHAPTER 8
8
rOLe Of CyTOGeneTiC and mOLeCuLar aBerraTiOnS Of aLL in dOwn SyndrOme
Over the past decades, genetic features of leukemic cells have become an integral part of
classification and prognosis of pediatric leukemia.30 To better stratify DS ALL patients into
appropriate risk-adapted treatment strategies, we searched for molecular aberrations with
modern techniques such as bi-directionally sequencing and multiplex ligation-dependent
probe amplification (MLPA). In addition we used array-comparative genomic hybridization
(CGH) to search for copy number variations (CNVs) in DS ALL, and gene expression profiling
(GEP) and compared DS patients to non-DS ALL patients.
The frequency of the genetic abnormalities of the leukemic cells that have well established
favorable and unfavorable prognostic relevance in non-DS ALL, is lower in DS ALL (Figure
1).13,17,18,30-32 Also, the precise impact of these abnormalities on treatment outcome in DS
ALL was unknown, as all published series lack a sufficient sample size to draw clear conclu-
sions.13,16-18 In this thesis (chapter 2), we demonstrated that the genetic abnormalities predict-
ing favorable outcome in non-DS ALL similarly predict outcome in DS-ALL.23 For instance, DS
patients having ETV6-RUNX1 positive ALL or HeH ALL with trisomy 4&10 abnormalities have
an excellent prognosis, but comprise only ~12% of all DS ALL patients, whereas in non-DS
ALL they comprise ~35% of patients. The low incidence of MLL rearrangements and BCR-ABL1
translocations, has precluded us from a definitive answer regarding the predictive value of
these aberrations, although we did not find evidence that the prognostic impact of these
aberrations would differ from non-DS ALL.
When focusing on novel molecular aberrations as described in this thesis, the first abnor-
mality is a mutation in the pseudokinase domain of Janus Kinase 2 (JAK2).33 Point mutations
of JAK2 at R683 were found in ~20% of the DS ALL patients (Chapter 4),33-36 and differ from the
well-known activating JAK2 V617F mutation found in myeloproliferative neoplasms (MPN).37
Initially, the JAK2 R683 mutation was thought to be unique for DS ALL, in a similar fashion
as GATA-1 mutations are for ML-DS.38,39 However, a little later the same JAK2 mutations were
also reported in less than 10% of high-risk non DS ALL patients.40 JAK belongs to a family of
intracellular non-receptor protein tyrosine kinases that transduce cytokine-mediated signals
through the STAT family of transcription factors, and plays an important role in regulating the
processes of cell proliferation.33,41 In vitro experiments showed immortalization of hemato-
poietic progenitor cells and constitutive activation of the JAK-STAT pathway in JAK2 mutated
mouse BaF3 cells. Expression of the JAK2 mutants, but not the wild-type gene, conferred
cytokine-independent proliferation of BaF3 mouse cells, indicating that JAK2 R683 mutations
are gain-of-function driver mutations.33 As a consequence it is suggested that JAK2 inhibition
might be a useful therapeutic approach in JAK2 mutated DS ALL.41
Shortly thereafter, genomic abnormalities of the cytokine receptor like factor 2 (CRLF2),
have been reported both by others and by our group, in approximately 60% of DS ALL

CHAPTER 8
156
patients (chapter 2 and 5). This is remarkably high as compared to the 15% observed in
high-risk non-DS ALL patients.42-46 These aberrations include a) translocations of CRLF2 with
the Immunoglobulin heavy chain locus (IGH@) at chromosome 14q32 and b) interstitial
Figure 1. Cytogenetic aberrations of Down syndrome and non Down syndrome ALL patients Pie chart depicting the genetic heterogeneity of DS-ALL patients (A) and non-DS ALL patients (B). HeH, hyperdiploid: >51 chromosomes in DS ALL, >50 chromosomes in non-DS ALL.

157
CHAPTER 8
8
deletions in the pseudo autosomal region 1 (PAR1) resulting in P2RY8-CRLF2 fusion, c) gain
of function mutations of CRLF2, and d) gain of function mutations of IL7R. CRLF2, together
with the a-chain of the IL7R, forms a receptor for TSLP, and is known to mediate allergic
and inflammatory responses.47 Interestingly in ~50% of the DS ALL patients with CRLF2 over-
expression, there are additional genomic mutations in IL7R, or in the signaling components
downstream, that include the enzymes JAK2 and JAK1.33,35,43,47-49 Functionally, aberrations of
CRLF2 lead to constitutive activation of the JAK-STAT pathway, enabling increased survival
and proliferation.43-46 However the exact role of CRLF2 abnormalities in ALL and in particular
in DS ALL leukemogenesis is still unclear.
In an attempt to obtain insight in the underlying causal relation between the high frequency
of CRLF2 aberrations and the biological background of DS ALL, we hypothesized that CRLF2
alterations are already present prenatally, analogous to non-DS patients with ETV6-RUNX1
positive ALL which in combination with post-natal genetic changes gives rise to leukemia.50
For that purpose, we performed, in collaboration with the Institute of Cancer Research (UK), a
pilot study in 111 peripheral blood samples of healthy newborn DS patients, but none of the
patient samples showed a P2RY8-CRLF2 fusion transcript (unpublished data). This can be due
to either CRLF2 being an unstable transcript, which is also sometimes seen in prenatal ETV6-
RUNX1 rearrangements, or due to a low sensitivity of the used method (RT-qPCR), or due to
CRLF2 aberrations occurring as a second hit occurring later during leukemogenesis. It could
also indicate that genomic CRLF2 aberrations are passengers or late clonal events, which is
reflected by the fact that others and we could not confirm the prognostic significance of
CRLF2.42,43,45,51
The third molecular aberration investigated in this thesis emerging from our array com-
parative genomic hybridization (CGH) studies were abnormalities in B-cell development and
differentiation genes (chapter 5). In non-DS BCP ALL, such aberrations recently appeared to
be common, occurring in a frequency of 67%-82% in high-risk and BCR-ABL1-like non-DS ALL
patients.52-57 We found deletions in B-cell development genes in approximately 50% of un-
selected DS ALL children, hence also in ‘low risk’ patients as defined by classical NCI-criteria.
We showed that deletions in IKZF1, encoding the lymphoid transcription factor IKAROS, were
the most prominent aberrations, being present in 35% of our DS ALL patients, as compared
to 15% of non–DS B-other ALL.42,55,58 Intriguingly, this frequency is comparable to the inci-
dence in high-risk non-DS ALL patients, and to non-DS ALL patients with a ‘BCR-ABL1 like’
gene-expression signature.52,55 The ‘BCR-ABL1 like’ signature denote a new clinically relevant
entity which is associated with a poor outcome and clusters together in gene expression
profiling with BCR-ABL1 positive ALL, although these leukemic cells do not harbor the BCR-
ABL1 translocation. Of interest, the ‘BCR-ABL1 like’ signatures as reported by North-American
and European investigators appear to classify different patients as ‘BCR-ABL1 like’.52,59,60
Approximately 25% of the DS ALL as compared to 16% of the non-DS ALL patients has a
‘BCR-ABL1-like’ profile.61 This profile is associated with poor outcome, resulting in an EFS of

CHAPTER 8
158
70% for DS ALL as compared to less than 60% in non-DS ALL.52,61,62 The cumulative incidence
of relapse is around 30% for both DS and non-DS ‘BCR-ABL1-like’ ALL.61 Within ‘BCR-ABL1-like’
DS ALL, 40% has a deletion of IKZF1, which is similar to the frequency of IKZF1 deletions
observed in non-DS ‘BCR-ABL1-like’ cases.57 The high frequency of ‘BCR-ABL1-like’ and IKZF1
in DS ALL, suggests that a relatively large proportion of DS ALL patients may have a genetic
signature with characteristics of high-risk BCP non-DS ALL. This suggestion fits with previous
published outcome estimates showing that DS ALL patients treated according to a high-risk
protocol showed similar outcome as compared to non-DS ALL patients, in contrast to what
was considered standard risk DS ALL patients by classical NCI criteria who experience inferior
outcome on ‘standard risk’ protocols.17,18
Using next generation sequencing, Roberts et al., have shown that activating tyrosine ki-
nase and cytokine receptor signaling rearrangements, are a hallmark of ‘BCR-ABL1-like’ ALL.62
Furthermore, genomic lesions affecting lymphoid transcription factors were found in all
(n=15) studied cases with ‘BCR-ABL1-like’ ALL, including 2 cases with NUP214-ABL1, one case
with insertion of the erythropoietin receptor gene (EPOR) into the immunoglobulin heavy
chain locus (IGH@-EPOR), and 1 case each with the in-frame fusions EBF1-PDGFRB, BCR-JAK2,
STRN3-JAK2, PAX5-JAK2, ETV6-ABL1, RANBP2-ABL1, and RCSD1-ABL1.62 Moreover, abnormali-
ties of lymphoid transcription factors, the vast majority being IKZF1 deletions, were found
in all studied cases.62 Considering the high percentage of ‘BCR-ABL1 like’ patients in DS ALL,
it would be very interesting to investigate if PDGFRB and other targetable fusions are also
present in ‘BCR-ABL1 like’ DS ALL.
Interestingly, recent work in non-DS ALL patients showed that IKZF1 and ERG deletions
may co-occur, and that patients with concurrent ERG deletions, do not have a poor clinical
outcome.63,64 Approximately 3% of non-DS ALL patients harbor ERG deletions, and 40% of
these patients also have IKZF1 deletions. Therefore the combination of the latter two is rare,
as it only comprises ~1.5% of the non-DS patients.63,64 Remarkably, we did not find any ERG
deletions (95% CI 0±10%) in our DS ALL cohort.
The role of IKZF1 deletions in ALL and in particular in ‘BCR-ABL1 like’ ALL is yet unsolved.
However, as disruption of normal lymphoid development by deletions of IKZF1 and rear-
rangements of cytokine receptor signaling by CRLF2 abnormalities, frequently occur in both
DS and non-DS ‘BCR-ABL1-like’ ALL. This suggests that these two pathways may cooperate in
inducing precursor B ALL in DS ALL, and this pleads against a unique event initiating DS ALL.
Another interesting observation is that the expression of the immunoglobulin joining chain
(IGJ) gene, which is involved in maturation of immunoglobulin’s, is deregulated in IKZF1
deleted and in ‘BCR-ABL1-like’ ALL. Further research is needed to elucidate whether IKZF1
deletions functionally affect this maturation process or that IKZF1 deletions cooperate with
activating JAK-STAT pathway alterations occurring in ~60% of DS ALL patients.
The last molecular aberration investigated in this thesis concerns deletions of BTG1, which
was reported to occur in high frequency (27%) in DS ALL.65 We found a prevalence of only

159
CHAPTER 8
8
7% of BTG1 deletions in DS ALL, which is similar to non-DS ALL patients.66 Deletions of BTG1
were mainly found in ETV6-RUNX1 positive ALL, which might explain the lack of prognostic
impact of BTG1 deletions in our cohort of DS ALL patients. Remarkably, recent work in non-DS
ALL patients, showed that BTG1 deletions are mainly detected in the prognostic unfavorable
BCR-ABL1 positive subset of ALL, and less frequent in hyperdiploid ALL, which in general has a
good prognosis.66 All deletions of BTG1 DS ALL were mono-allelic, and localized in the second
exon at the telomeric site of BTG1, however exon 1 was retained. Interestingly, Waanders, et
al. identified multiple additional BTG1 deletions at a subclonal level, by using a sensitive PCR-
based screening.66 In some cases these subclones grew out into the major clone at relapse.66
From literature it is known that at both sites of the BTG1 deletion, a VD(J) recombination
signal sequence is present, suggesting that illegitimate RAG1/RAG2-mediated recombina-
tion is the responsible molecular mechanism for multiclonal evolution.66 Interestingly, the
same mechanism is suggested to play a role in IKZF1 deletions.67,68 Since the frequency of
IKZF1 deletions in DS ALL is as high as 35%, it strengthens our hypothesis that IKZF1 deletions
are an important driving event in DS ALL leukemogenesis.
None of the discussed molecular aberrations was mutually exclusive of other genomic
abnormalities, which is depicted in Figure 2. For instance, DS ALL patients having JAK2 muta-
tions as the sole aberration were not found; instead, JAK2 mutations occur frequently with
!No addi'onal aberra'on
ETV6-‐RUNX1
HeH
BCR-‐ABL1
‘BCR-‐ABL1 like’
Normal karyotype
IKZF1
CRLF2
IKZF1 & CRLF2
CRLF2 & JAK2 IKZF1 & CRLF2 & JAK2
Figure 2. Circosplot depicting connections between (cyto-) genetic and molecular aberrations in Down syndrome acute lymphoblastic leukemia

CHAPTER 8
160
IKZF1 deletions and CRLF2 gene rearrangements. Notably, a large subset of patients (40%)
has no known aberrations. This subset of patients would be an ideal group to apply RNA se-
quencing to identify potential players and cooperating events that underlie leukemogenesis
in DS children.
OVereXpreSSiOn Of eTS-reLaTed Gene in dOwn SyndrOme aLL
Previous studies in non-DS ALL cases showed that gene-expression profiling (GEP) is a
powerful diagnostic tool to classify relevant genetic subtypes of ALL.52,59,60 However, in previ-
ous studies, it was shown that clustering of DS ALL cases by GEP did not seem feasible, as
they clustered together with the genetic subgroups of their non-DS ALL counterparts.43,53
This suggests that the cytogenetic mark adds stronger to the profile than the constitutional
chromosome 21.43,69 .
Altered gene expression levels still may play a role in DS ALL leukemogenesis, as an extra
copy of chromosome 21 disturbs hematopoietic regulating genes encoded by chromosome
21. Interestingly, in this thesis we show that as compared to non-DS patients, ETS-related
gene (ERG) has a reduced expression in non-leukemic DS samples, and a high expression in
leukemic DS ALL samples (Chapter 7). In healthy cells, activation of ERG also represses ERG
by an indirect and direct feedback loop. As ERG is a chromosome 21 localized transcriptional
regulator of hematopoiesis, the constitutional extra copy of the ERG gene, may result in dis-
ruption of this feedback loop and subsequently in deregulation of the hematopoietic stem
cell network.70-72
Our data suggest that ERG up-regulation occurs in the leukemic state and may play a role
in leukemogenesis. It is known that hematopoietic overexpression of ERG causes T-cell ALL in
mouse models,73,74 and, as ERG cooperates with the GATA1 mutated protein by immortalizing
megakaryocyte progenitors, it is suggested that the additional constitutional copy of ERG in
trisomy 21 may play a role in ML DS.74 In vitro experiments with induced ERG expression in
the B cell lineage, showed that ERG expression confers a differentiation arrest of pro-B cells
to pre-B cells, accompanied by enhanced proliferation of precursor B-cells.75 However, mouse
models overexpressing ERG, were incapable of inducing B cell ALL. 75 Further research of
molecular mechanisms regulating inhibition of differentiation and promoting proliferation
of B-cells through overexpression of ERG, is an important area of further investigations. If
silencing of ERG expression in B-cells attenuates proliferation or even induces apoptosis, ERG
might be an interesting target for molecular therapy.
161
CHAPTER 8
8
TreaTmenT STraTeGieS
It is well known that DS patients have a poor prognosis as compared to their non-DS ALL
counterparts.15-19,23,42 In addition, although overall prognosis improved significantly over
the past decades, we showed no improvement in survival for DS ALL patients treated from
2000-2005 as compared to patients treated from 1995-2000. This may be due to the delicate
balance between treatment intensity, which is required given the high-risk genetic profile
of many DS ALL cases, and treatment-related mortality. To improve outcome for DS ALL
patients, either different risk group stratification and/or novel treatment strategies need to
be considered for future treatment protocols, especially targeted treatment options which
specifically exert effect on the leukemic cell population, but not on healthy tissues.
The clinically favorable prognostic subgroup of DS-ALL patients, characterized by age <6
years and WBC <10x109/L, had an overall survival of 87%, but still a relatively high cumulative
incidence of relapse (17%) with a low rate of TRM (3%). This is inferior to what is reported for
non-DS ALL patients with NCI-SR,76-85 or SR patients in BFM protocols, which use a stratifica-
tion strategy based on MRD in 3 arms.86 This clinical subset of DS ALL patients may need an
intensification block following induction and CNS-directed therapy and might therefore be
classified into the intermediate MRD risk group.
However, although less common as compared to non-DS ALL, ETV6-RUNX1 fusions (in 8.3%)
and hyperdiploid (HeH) trisomies 4 and 10 (in 12%) predict an excellent outcome in DS ALL in
our large PdL working group study.23 Notably, TRM rather than relapse was the major cause of
treatment failure in these patients. Therefore, this group of DS ALL patients might be eligible
for treatment reduction rather than intensification, such as withholding from anthracyclines,
and/or stratification in the MRD SR group.
Contrary to this, IKZF1 deletions, which are present in 35% of the DS ALL patients, predict
for dismal outcome and in particular for an increased risk of relapse. This subset of patients
might benefit from treatment intensification, although therapy efficacy needs to be carefully
balanced against the enhanced toxicity. Notably, as a result of our studies in DS and non-DS
ALL patients,42,57 patients with IKZF1 deletions are now stratified in an intensified treatment
arm of the current DCOG ALL-11 treatment protocol.
fuTure perSpeCTiVeS fOr TreaTmenT STraTeGieS
In general, treatment intensification using conventional cytotoxic chemotherapy is not
preferred in DS ALL as they have an increased risk for TRM. To further improve prognosis in
DS ALL patients, novel non-myelosuppressive targeted therapies are an interestingly thera-
peutic option to be explored in the near future.

CHAPTER 8
162
First, a substantial proportion (~60%) of the DS ALL patients have genomic CRLF2 aber-
rations, which signals together with IL7R through JAK 1-2, the latter being mutated in 18%
of the DS ALL patients. The functional consequence of these abnormalities is a constitutive
activation of the JAK-STAT pathway, thereby promoting survival of leukemic cells, which
makes it an interesting target for inhibitors. However, the major side effect of JAK2 inhibitors
is myelosuppression, which is due to co-suppression of wildtype JAK2, and which is required
for normal hematopoiesis. This may render it difficult to combine JAK inhibitors with con-
ventional chemotherapy in DS-ALL patients who already suffer from higher TRM rates. At
this moment, the Children’s Oncology Group is completing phase I trials with JAK1/JAK2
inhibitors such as Ruxolitinib, for children with relapsed or refractory solid tumors, leukemia
or myeloproliferative disease (Clinical Trial NCT01164163).87,88 In addition, inhibitors of the
mTOR-signaling pathway, which is also activated through CRLF2/IL7 signaling, might be
another novel strategy in the subset of CRLF2 positive DS ALL patients, but it is remains to be
determined whether inhibiting these pathways will benefit DS ALL patients.
Deletion of IKZF1 is the only aberration that clearly predicts poor survival. However, to
date there is no targeted approach for IKZF1 deleted DS or non-DS ALL. Since IKZF1 dele-
tions are often found in ‘BCR-ABL1-like’ patients, this might be an interesting subgroup for
novel therapies. Recently, within ‘BCR-ABL1-like’ ALL, rearrangements of PDGFRB and other
drugable targets were identified.62 This is probably of clinical value, as for instance patients
with chronic myeloproliferative disease and activating PDGFRB rearrangements show com-
plete hematologic and molecular responses to Imatinib treatment.62 If so, the combination
of tyrosine kinase inhibitors such as Imatinib, Dasatinib, or Ruxolitinib and conventional
chemotherapeutics might improve outcome for ‘BCR-ABL1-like’ DS ALL patients.62,89 90 In ad-
dition, Blinatumomab which belongs to a new class of monoclonal antibodies, bi-specific
T-cell engagers, is a promising new drug in leukemia in general. Presently, phase 1 and phase
2 clinical trials in are ongoing for ALL patients.91 Blinatumomab enables the patient’s T cells to
recognize the malignant B cells by a linking molecule which binds to CD19 and CD3.92 Other
antibody options may be unlabeled anti-CD22 antibodies such as Epratuzumab or CD20-
antibodies such as Rituximab.
Notably, as a result of our PdL working group study, an initiative is underway to establish
an international prospective registry to collect demographic, biological and clinical outcome
data on a large group of DS ALL patients, and to establish uniform immune monitoring and
supportive care recommendations. The longer-term aspiration is to develop an international
treatment protocol for DS ALL patients, allowing sufficient power to prospectively evaluate
new risk-adjusted strategies, and aiming at improving prognosis of future DS ALL patients by
reducing both relapse and treatment related mortality (TRM).21

163
CHAPTER 8
8
The LimiTaTiOnS Of TreaTmenT inTenSifiCaTiOn Of aLL in dOwn SyndrOme
DS ALL patients are notorious for their enhanced vulnerability for chemotherapy-induced
side effects.11,48,93-95 Fatal infections are the major cause of TRM, of which the vast majority is of
bacterial origin.15,16,19,23,96 The causes of infectious toxicities are multifactorial and have been
linked to decreased phagocytic activity of granulocytes, lower number of B-cells, decreased
proliferation of T- cells, and low serum immunoglobulin levels in DS children.96,97 Further-
more, certain chemotherapeutic drugs, such as Methotrexate (MTX), can lead to breakdown
of cellular barriers, increasing the rate and severity of mucositis and creating a window of
opportunity for infectious diseases.
Intriguingly, the large sample size of our PdL cohort provided evidence that relapse and not
TRM was the major cause of treatment failure in children with DS ALL. Even in the 18 (2.8%)
patients who received a SCT, relapse was the main factor contributing to dismal outcome.
Furthermore, our large retrospective PdL working group study could not associate TRM
with any specific chemotherapeutic agent. For instance, the comparison between patients
treated on a 3-drug regimen (CCG/COG/UK, n=193) and patients treated on an anthracycline
containing 4-drug regimen (AIEOP/BFM, n=106), did not show differences in TRM, nor in
EFS, OS and CIR. Although there was a trend towards higher TRM for 4-drug induction, the
hypothesis that anthracycline containing induction regimens had higher rates of TRM could
not be clearly confirmed in the PdL study. In addition, in the same PdL working group study,
we could not specifically link high dose MTX courses to TRM. This was remarkable, as it is well
known that DS ALL patients are more susceptible to MTX-induced side effects than non-DS
ALL patients.11,48,93-95 One important caveat in interpreting the data from the PdL study is that
we cannot verify whether toxicity was really well documented in all patients in this retrospec-
tive study, and hence there may be underreporting.
Although TRM could not be related to a specific drug in our PdL working group study,
we showed in chapter 3 that grade 3-4 gastro intestinal toxicity was more frequent in DS
than in non-DS children (25% vs. 4%), but this was not related to differences in plasma MTX
concentrations between DS and non-DS ALL patients. Hence, these toxic effects are most
likely explained by differences in pharmacodynamics and not by pharmacokinetic effects
between DS and non-DS children. For instance, decreased folate levels resulting in enhanced
polyglutamation and MTX-induced cell kill,98,99 or polymorphisms in genes linked to the
pharmacodynamics of MTX100,101, or a gene dosage effect as the responsible MTX transport
folate carrier is localized on chromosome 21, could underlie the enhanced susceptibility of
the healthy tissues for MTX.11,99,102 The latter one perhaps being less likely as passive diffusion
of MTX across the cell-membrane also occurs using high-dose MTX schedules.103,104 Interest-
ingly, the Children’s Cancer Group-1991 study showed that DS ALL patients who received
intensified MTX therapy had better survival than those who did not.105 New developments,

CHAPTER 8
164
such as therapeutic drug monitoring, in which the dose of MTX is based on the clearance
from the prior course,106 could be a solution to balance enhanced toxicity against therapy
efficacy if TRM is also taken into account in the model.
Furthermore, we show in this thesis that TRM is not related to a certain phase of therapy,
but occurs throughout the treatment period, with about half of the deaths occurring dur-
ing maintenance therapy (Figure 3). We therefore recommend improving supportive care
measurements for DS ALL patients throughout therapy. The current DCOG ALL-11 treatment
protocol integrated specific supportive care guidelines for DS ALL patients, including better
surveillance during induction, such as admission in the hospital from diagnosis until in very
good clinical condition, and more frequent outpatient visits with additional blood tests.107
However, additional measurements during maintenance are lacking.
It is intended that DS ALL patients receive the same treatment intensity as non-DS ALL
patients. However, a study from the Nordic society of Pediatric Hematology and Oncology
(NOPHO) reported that the median administered dose of methotrexate (MTX) and 6-mercap-
topurine (6-MP) was 25% lower for DS as compared to non-DS ALL patients.48 As some study
suggest that DS patients (without leukemia) have lower median WBC and absolute neutrophil
count (ANC) values as compared to their healthy non-DS counterparts,97,108 chemotherapy
should result in lower WBC and ANC counts for DS ALL patients. However, Bohnstedt et al.
showed however that the median WBC and ANC were similar during maintenance in DS ALL
as compared to non-DS ALL patients.48 This is either the result of treatment reduction or it
reflects a reduced sensitivity for 6-MP and MTX in DS patients as compared to non-DS ALL
Figure 3. Distribution of treatment related mortality in relation to therapy phases for Down syndrome ALL patientsDistribution of treatment related mortality in the retrospective Ponte di Legno working group study. Treatment related mortality was cause of death in 50 patients and is depicted for 4 different time points on the X-axes. Y-axes shows the absolute number of patients. Infection is represented in red, other chemotherapy related toxicity in blue.

165
CHAPTER 8
8
patients,48 suggesting that in order for the treatment to be effective, a similar target WBC for
DS and non-DS patients may not be appropriate.
COnCLuSiOn
In this thesis we provided evidence that to date there is no evidence of a unique genetic
lesion occurring in DS and not in non-DS ALL patients. Moreover, we showed that DS ALL is a
genetically ‘high risk’ disease, as a substantial proportion of DS ALL patients has a ‘BCR-ABL1-
like’ gene expressions profile and/or IKZF1 deletions. We therefore recommend being cau-
tious in treatment reduction for DS ALL patients, as relapse and not TRM is the major cause of
treatment failure. The exception to this rule may be the small group of 12% of patients with
ETV6-RUNX1 rearrangements or hyperdiploid trisomies 4 and 10. To further improve outcome,
DS-ALL patients may benefit from 1) improved risk-group stratification with current available
therapy, 2) from the elucidation of the genetic background, especially in the normal karyo-
type cases, 3) the development of targeted therapies that improves prognosis and reduces
acute and long-term toxicity as well as TRM for all patients, and 4) from enhanced intensive
supportive care throughout treatment. This requires several novel studies, such as the role of
MRD in DS ALL, the role of JAK-inhibitors in DS ALL, unraveling the genetic background by
using novel deep-sequencing procedures, and studies evaluating antibiotic/antifungal and/
or immunoglobulin prophylaxis in DS ALL. As DS ALL is a rare disease, international collabora-
tion is essential to further elucidate the driving mutation or pathway.

CHAPTER 8
166
referenCeS
1. Weijerman ME, van Furth AM, Vonk Noor-degraaf A, van Wouwe JP, Broers CJ, Gemke RJ. Prevalence, neonatal characteristics, and first-year mortality of Down syndrome: a national study. J Pediatr. 2008; 152(1): 15-19.
2. Hasle H, Clemmensen IH, Mikkelsen M. Risks of leukaemia and solid tumours in individuals with Down’s syndrome. Lancet. 2000; 355(9199): 165-169.
3. Brewster HF, Cannon HE. Acute lymphatic leukemia: Report of case in eleventh month mongolian idiot. Med Surg J. 1930; 82: 872-873.
4. Fong CT, Brodeur GM. Down’s syndrome and leukemia: epidemiology, genetics, cytoge-netics and mechanisms of leukemogenesis. Cancer genetics and cytogenetics. 1987; 28(1): 55-76.
5. Ingalls TH. Pathogenesis of mongolism. Am J Dis Child. 1947; 73: 279-292.
6. Krivit W, Good RA. Simultaneous occurrence of mongolism and leukemia; report of a nationwide survey. AMA journal of diseases of children. 1957; 94(3): 289-293.
7. Lejeune J, Turpin R, Gautier M. [Chromo-somic diagnosis of mongolism]. Archives francaises de pediatrie. 1959; 16: 962-963.
8. Tunstall-Pedoe O, Roy A, Karadimitris A, et al. Abnormalities in the myeloid progenitor compartment in Down syndrome fetal liver precede acquisition of GATA1 mutations. Blood. 2008; 112(12): 4507-4511.
9. Rowley JD. Down Syndrome and acute leu-kaemia: increased risk may be due to trisomy 21. Lancet. 1981; 2(8254): 1020-1022.
10. Lyle R, Bena F, Gagos S, et al. Genotype-phenotype correlations in Down syndrome identified by array CGH in 30 cases of partial trisomy and partial monosomy chromosome 21. European journal of human genetics : EJHG. 2009; 17(4): 454-466.
11. Taub JW, Ge Y. Down syndrome, drug me-tabolism and chromosome 21. Pediatr Blood Cancer. 2005; 44(1): 33-39.
12. Raimondi SC, Roberson PK, Pui CH, Behm FG, Rivera GK. Hyperdiploid (47-50) acute lymphoblastic leukemia in children. Blood. 1992; 79(12): 3245-3252.
13. Forestier E, Izraeli S, Beverloo B, et al. Cyto-genetic features of acute lymphoblastic and myeloid leukemias in pediatric patients with Down syndrome: an iBFM-SG study. Blood. 2008; 111(3): 1575-1583.
14. Pui CH, Raimondi SC, Borowitz MJ, et al. Immunophenotypes and karyotypes of leu-kemic cells in children with Down syndrome and acute lymphoblastic leukemia. Journal of clinical oncology : official journal of the American Society of Clinical Oncology. 1993; 11(7): 1361-1367.
15. Chessells JM, Harrison G, Richards SM, et al. Down’s syndrome and acute lymphoblastic leukaemia: clinical features and response to treatment. Archives of disease in childhood. 2001; 85(4): 321-325.
16. Dordelmann M, Schrappe M, Reiter A, et al. Down’s syndrome in childhood acute lym-phoblastic leukemia: clinical characteristics and treatment outcome in four consecutive BFM trials. Berlin-Frankfurt-Munster Group. Leukemia. 1998; 12(5): 645-651.
17. Maloney KW, Carroll WL, Carroll AJ, et al. Down syndrome childhood acute lympho-blastic leukemia has a unique spectrum of sentinel cytogenetic lesions that influences treatment outcome: a report from the Chil-dren’s Oncology Group. Blood. 2010; 116(7): 1045-1050.
18. Whitlock JA, Sather HN, Gaynon P, et al. Clini-cal characteristics and outcome of children with Down syndrome and acute lympho-blastic leukemia: a Children’s Cancer Group study. Blood. 2005; 106(13): 4043-4049.
19. Zeller B, Gustafsson G, Forestier E, et al. Acute leukaemia in children with Down syndrome: a population-based Nordic study. Br J Haematol. 2005; 128(6): 797-804.

167
CHAPTER 8
8
20. Bassal M, La MK, Whitlock JA, et al. Lympho-blast biology and outcome among children with Down syndrome and ALL treated on CCG-1952. Pediatr Blood Cancer. 2005; 44(1): 21-28.
21. Izraeli S, Vora A, Zwaan CM, Whitlock J. How I treat ALL in Down’s syndrome: pathobiology and management. Blood. 2014; 123(1): 35-40.
22. Bloemers BL, Bont L, de Weger RA, Otto SA, Borghans JA, Tesselaar K. Decreased thymic output accounts for decreased naive T cell numbers in children with Down syndrome. Journal of immunology. 2011; 186(7): 4500-4507.
23. Buitenkamp TD, Izraeli S, Zimmermann M, et al. Acute lymphoblastic leukemia in children with Down syndrome: a retrospective analy-sis from the Ponte di Legno study group. Blood. 2013.
24. Pine SR, Guo Q, Yin C, Jayabose S, Druschel CM, Sandoval C. Incidence and clinical im-plications of GATA1 mutations in newborns with Down syndrome. Blood. 2007; 110(6): 2128-2131.
25. Baschat AA, Wagner T, Malisius R, Gembruch U. Prenatal diagnosis of a transient myelo-proliferative disorder in trisomy 21. Prenatal diagnosis. 1998; 18(7): 731-736.
26. Hojo S, Tsukimori K, Kitade S, et al. Prenatal sonographic findings and hematological abnormalities in fetuses with transient ab-normal myelopoiesis with Down syndrome. Prenatal diagnosis. 2007; 27(6): 507-511.
27. Zipursky A. Transient leukaemia--a benign form of leukaemia in newborn infants with trisomy 21. British journal of haematology. 2003; 120(6): 930-938.
28. Klusmann JH, Creutzig U, Zimmermann M, et al. Treatment and prognostic impact of transient leukemia in neonates with Down syndrome. Blood. 2008; 111(6): 2991-2998.
29. Smith M, Arthur D, Camitta B, et al. Uniform approach to risk classification and treatment assignment for children with acute lympho-blastic leukemia. J Clin Oncol. 1996; 14(1): 18-24.
30. Pui CH, Gajjar AJ, Kane JR, Qaddoumi IA, Pappo AS. Challenging issues in pediatric oncology. Nature reviews Clinical oncology. 2011; 8(9): 540-549.
31. Chessells JM, Harrison CJ, Watson SL, Vora AJ, Richards SM, Medical Research Council Working Party on Childhood L. Treatment of infants with lymphoblastic leukaemia: results of the UK Infant Protocols 1987-1999. Br J Haematol. 2002; 117(2): 306-314.
32. Buitenkamp. Acute lymphoblastic leukemia in children with Down syndrome: a retro-spective analysis from the Ponte di Legno study group. Pediatric Oncology/Hematol-ogy. Rotterdam: Erasmus Medical Center; 2013.
33. Bercovich D, Ganmore I, Scott LM, et al. Mu-tations of JAK2 in acute lymphoblastic leu-kaemias associated with Down’s syndrome. Lancet. 2008; 372(9648): 1484-1492.
34. Blink M, Buitenkamp TD, van den Heuvel-Eibrink MM, et al. Frequency and prognostic implications of JAK 1-3 aberrations in Down syndrome acute lymphoblastic and myeloid leukemia. Leukemia. 2011; 25(8): 1365-1368.
35. Gaikwad A, Rye CL, Devidas M, et al. Prevalence and clinical correlates of JAK2 mutations in Down syndrome acute lym-phoblastic leukaemia. Br J Haematol. 2009; 144(6): 930-932.
36. Kearney L, Gonzalez De Castro D, Yeung J, et al. Specific JAK2 mutation (JAK2R683) and multiple gene deletions in Down syndrome acute lymphoblastic leukemia. Blood. 2009; 113(3): 646-648.
37. Levine RL, Wadleigh M, Cools J, et al. Activat-ing mutation in the tyrosine kinase JAK2 in polycythemia vera, essential thrombocythe-mia, and myeloid metaplasia with myelofi-brosis. Cancer Cell. 2005; 7(4): 387-397.
38. Taub JW, Mundschau G, Ge Y, et al. Prenatal origin of GATA1 mutations may be an initiat-ing step in the development of megakaryo-cytic leukemia in Down syndrome. Blood. 2004; 104(5): 1588-1589.

CHAPTER 8
168
39. Wechsler J, Greene M, McDevitt MA, et al. Acquired mutations in GATA1 in the mega-karyoblastic leukemia of Down syndrome. Nat Genet. 2002; 32(1): 148-152.
40. Mullighan CG, Zhang J, Harvey RC, et al. JAK mutations in high-risk childhood acute lymphoblastic leukemia. Proc Natl Acad Sci U S A. 2009; 106(23): 9414-9418.
41. Mullighan CG. JAK2--a new player in acute lymphoblastic leukaemia. Lancet. 2008; 372(9648): 1448-1450.
42. Buitenkamp TD, Pieters R, Gallimore NE, et al. Outcome in children with Down syndrome and Acute Lymphoblastic Leukemia: role of IKZF1 deletions and CRLF2 aberrations. Leukemia. 2012.
43. Hertzberg L, Vendramini E, Ganmore I, et al. Down syndrome acute lymphoblastic leukemia, a highly heterogeneous disease in which aberrant expression of CRLF2 is associated with mutated JAK2: a report from the International BFM Study Group. Blood. 2010; 115(5): 1006-1017.
44. Russell LJ, Capasso M, Vater I, et al. Deregu-lated expression of cytokine receptor gene, CRLF2, is involved in lymphoid transforma-tion in B-cell precursor acute lymphoblastic leukemia. Blood. 2009; 114(13): 2688-2698.
45. Mullighan CG, Collins-Underwood JR, Phil-lips LA, et al. Rearrangement of CRLF2 in B-progenitor- and Down syndrome-associated acute lymphoblastic leukemia. Nat Genet. 2009; 41(11): 1243-1246.
46. Cario G, Zimmermann M, Romey R, et al. Presence of the P2RY8-CRLF2 rearrange-ment is associated with a poor prognosis in non-high-risk precursor B-cell acute lymphoblastic leukemia in children treated according to the ALL-BFM 2000 protocol. Blood. 2010; 115(26): 5393-5397.
47. Shochat C, Tal N, Bandapalli OR, et al. Gain-of-function mutations in interleukin-7 receptor-alpha (IL7R) in childhood acute lymphoblastic leukemias. The Journal of experimental medicine. 2011; 208(5): 901-908.
48. Bohnstedt C, Levinsen M, Rosthoj S, et al. Physicians compliance during maintenance therapy in children with Down syndrome and acute lymphoblastic leukemia. Leuke-mia. 2013; 27(4): 866-870.
49. Malinge S, Ben-Abdelali R, Settegrana C, et al. Novel activating JAK2 mutation in a patient with Down syndrome and B-cell precursor acute lymphoblastic leukemia. Blood. 2007; 109(5): 2202-2204.
50. Mori H, Colman SM, Xiao Z, et al. Chromo-some translocations and covert leukemic clones are generated during normal fetal development. Proceedings of the National Academy of Sciences of the United States of America. 2002; 99(12): 8242-8247.
51. Ensor HM, Schwab C, Russell LJ, et al. Demo-graphic, clinical, and outcome features of children with acute lymphoblastic leukemia and CRLF2 deregulation: results from the MRC ALL97 clinical trial. Blood. 2011; 117(7): 2129-2136.
52. Den Boer ML, van Slegtenhorst M, De Menezes RX, et al. A subtype of childhood acute lymphoblastic leukaemia with poor treatment outcome: a genome-wide clas-sification study. Lancet Oncol. 2009; 10(2): 125-134.
53. Loudin MG, Wang J, Eastwood Leung HC, et al. Genomic profiling in Down syndrome acute lymphoblastic leukemia identifies his-tone gene deletions associated with altered methylation profiles. Leukemia. 2011; 25(10): 1555-1563.
54. Mullighan CG, Goorha S, Radtke I, et al. Genome-wide analysis of genetic alterations in acute lymphoblastic leukaemia. Nature. 2007; 446(7137): 758-764.
55. Mullighan CG, Su X, Zhang J, et al. Deletion of IKZF1 and prognosis in acute lymphoblastic leukemia. N Engl J Med. 2009; 360(5): 470-480.
56. Harrison CJ. Targeting signaling pathways in acute lymphoblastic leukemia: new insights. Hematology / the Education Program of the American Society of Hematology American

169
CHAPTER 8
8
Society of Hematology Education Program. 2013; 2013: 118-125.
57. van der Veer A, Zaliova M, Mottadelli F, et al. IKZF1 status as a prognostic feature in BCR-ABL1-positive childhood ALL. Blood. 2013.
58. Kuiper RP, Waanders E, van der Velden VH, et al. IKZF1 deletions predict relapse in uniformly treated pediatric precursor B-ALL. Leukemia. 2010; 24(7): 1258-1264.
59. Ross ME, Zhou X, Song G, et al. Classification of pediatric acute lymphoblastic leukemia by gene expression profiling. Blood. 2003; 102(8): 2951-2959.
60. Yeoh EJ, Ross ME, Shurtleff SA, et al. Clas-sification, subtype discovery, and prediction of outcome in pediatric acute lymphoblastic leukemia by gene expression profiling. Cancer cell. 2002; 1(2): 133-143.
61. van der Veer A, Waanders E, Pieters R, et al. Independent prognostic value of BCR-ABL1-like signature and IKZF1 deletion, but not high CRLF2 expression, in children with B-cell precursor ALL. Blood. 2013; 122(15): 2622-2629.
62. Roberts KG, Morin RD, Zhang J, et al. Genetic alterations activating kinase and cytokine receptor signaling in high-risk acute lym-phoblastic leukemia. Cancer cell. 2012; 22(2): 153-166.
63. Zaliova M, Zimmermannova O, Dorge P, et al. ERG deletion is associated with CD2 and attenuates the negative impact of IKZF1 deletion in childhood acute lymphoblastic leukemia. Leukemia. 2014; 28(1): 182-185.
64. Clappier E, Auclerc MF, Rapion J, et al. An intragenic ERG deletion is a marker of an oncogenic subtype of B-cell precursor acute lymphoblastic leukemia with a favorable outcome despite frequent IKZF1 deletions. Leukemia. 2014; 28(1): 70-77.
65. Lundin C, Hjorth L, Behrendtz M, et al. High frequency of BTG1 deletions in acute lym-phoblastic leukemia in children with down syndrome. Genes, chromosomes & cancer. 2012; 51(2): 196-206.
66. Waanders E, Scheijen B, van der Meer LT, et al. The Origin and Nature of Tightly Clustered BTG1 Deletions in Precursor B-Cell Acute Lymphoblastic Leukemia Support a Model of Multiclonal Evolution. PLoS genetics. 2012; 8(2): e1002533.
67. Iacobucci I, Storlazzi CT, Cilloni D, et al. Iden-tification and molecular characterization of recurrent genomic deletions on 7p12 in the IKZF1 gene in a large cohort of BCR-ABL1-positive acute lymphoblastic leukemia pa-tients: on behalf of Gruppo Italiano Malattie Ematologiche dell’Adulto Acute Leukemia Working Party (GIMEMA AL WP). Blood. 2009; 114(10): 2159-2167.
68. Mullighan CG, Miller CB, Radtke I, et al. BCR-ABL1 lymphoblastic leukaemia is character-ized by the deletion of Ikaros. Nature. 2008; 453(7191): 110-114.
69. Loudin MG, Wang J, Leung HC, et al. Ge-nomic profiling in Down syndrome acute lymphoblastic leukemia identifies histone gene deletions associated with altered methylation profiles. Leukemia. 2011; 25(10): 1555-1563.
70. Bonzanni N, Garg A, Feenstra KA, et al. Hard-wired heterogeneity in blood stem cells revealed using a dynamic regulatory network model. Bioinformatics. 2013; 29(13): i80-88.
71. Goldberg L, Tijssen MR, Birger Y, et al. Genome-scale expression and transcription factor binding profiles reveal therapeutic targets in transgenic ERG myeloid leukemia. Blood. 2013; 122(15): 2694-2703.
72. Ng AP, Loughran SJ, Metcalf D, et al. Erg is required for self-renewal of hematopoietic stem cells during stress hematopoiesis in mice. Blood. 2011; 118(9): 2454-2461.
73. Carmichael CL, Metcalf D, Henley KJ, et al. Hematopoietic overexpression of the tran-scription factor Erg induces lymphoid and erythro-megakaryocytic leukemia. Proceed-ings of the National Academy of Sciences of the United States of America. 2012; 109(38): 15437-15442.
CHAPTER 8
170
74. Salek-Ardakani S, Smooha G, de Boer J, et al. ERG is a megakaryocytic oncogene. Cancer research. 2009; 69(11): 4665-4673.
75. Tsuzuki S, Taguchi O, Seto M. Promotion and maintenance of leukemia by ERG. Blood. 2011; 117(14): 3858-3868.
76. Conter V, Arico M, Basso G, et al. Long-term results of the Italian Association of Pediatric Hematology and Oncology (AIEOP) Studies 82, 87, 88, 91 and 95 for childhood acute lymphoblastic leukemia. Leukemia. 2010; 24(2): 255-264.
77. Gaynon PS, Angiolillo AL, Carroll WL, et al. Long-term results of the children’s cancer group studies for childhood acute lympho-blastic leukemia 1983-2002: a Children’s Oncology Group Report. Leukemia. 2010; 24(2): 285-297.
78. Kamps WA, van der Pal-de Bruin KM, Veer-man AJ, Fiocco M, Bierings M, Pieters R. Long-term results of Dutch Childhood Oncology Group studies for children with acute lymphoblastic leukemia from 1984 to 2004. Leukemia. 2010; 24(2): 309-319.
79. Mitchell C, Richards S, Harrison CJ, Eden T. Long-term follow-up of the United Kingdom medical research council protocols for childhood acute lymphoblastic leukaemia, 1980-2001. Leukemia. 2010; 24(2): 406-418.
80. Moricke A, Zimmermann M, Reiter A, et al. Long-term results of five consecutive trials in childhood acute lymphoblastic leukemia performed by the ALL-BFM study group from 1981 to 2000. Leukemia. 2010; 24(2): 265-284.
81. Pui CH, Pei D, Sandlund JT, et al. Long-term results of St Jude Total Therapy Studies 11, 12, 13A, 13B, and 14 for childhood acute lymphoblastic leukemia. Leukemia 2010; 24(2): 371-382.
82. Schmiegelow K, Forestier E, Hellebostad M, et al. Long-term results of NOPHO ALL-92 and ALL-2000 studies of childhood acute lymphoblastic leukemia. Leukemia 2010; 24(2): 345-354.
83. Stark B, Nirel R, Avrahami G, et al. Long-term results of the Israeli National Studies in child-hood acute lymphoblastic leukemia: INS 84, 89 and 98. Leukemia 2010; 24(2): 419-424.
84. Tsuchida M, Ohara A, Manabe A, et al. Long-term results of Tokyo Children’s Cancer Study Group trials for childhood acute lym-phoblastic leukemia, 1984-1999. Leukemia 2010; 24(2): 383-396.
85. Vilmer E, Suciu S, Ferster A, et al. Long-term results of three randomized trials (58831, 58832, 58881) in childhood acute lympho-blastic leukemia: a CLCG-EORTC report. Children Leukemia Cooperative Group. Leukemia. 2000; 14(12): 2257-2266.
86. Conter V, Bartram CR, Valsecchi MG, et al. Molecular response to treatment redefines all prognostic factors in children and ado-lescents with B-cell precursor acute lympho-blastic leukemia: results in 3184 patients of the AIEOP-BFM ALL 2000 study. Blood. 2010; 115(16): 3206-3214.
87. Maude SL, Tasian SK, Vincent T, et al. Target-ing JAK1/2 and mTOR in murine xenograft models of Ph-like acute lymphoblastic leukemia. Blood. 2012; 120(17): 3510-3518.
88. Tasian SK, Doral MY, Borowitz MJ, et al. Aber-rant STAT5 and PI3K/mTOR pathway signal-ing occurs in human CRLF2-rearranged B-precursor acute lymphoblastic leukemia. Blood. 2012; 120(4): 833-842.
89. Schultz KR, Bowman WP, Aledo A, et al. Improved early event-free survival with ima-tinib in Philadelphia chromosome-positive acute lymphoblastic leukemia: a children’s oncology group study. Journal of clinical on-cology : official journal of the American Society of Clinical Oncology. 2009; 27(31): 5175-5181.
90. Zwaan CM, Rizzari C, Mechinaud F, et al. Da-satinib in children and adolescents with re-lapsed or refractory leukemia: results of the CA180-018 phase I dose-escalation study of the Innovative Therapies for Children with Cancer Consortium. Journal of clinical oncol-ogy : official journal of the American Society of Clinical Oncology. 2013; 31(19): 2460-2468.

171
CHAPTER 8
8
91. Topp MS, Gokbuget N, Zugmaier G, et al. Long-term follow-up of hematologic relapse-free survival in a phase 2 study of blinatumomab in patients with MRD in B-lineage ALL. Blood. 2012; 120(26): 5185-5187.
92. Nagorsen D, Kufer P, Baeuerle PA, Bargou R. Blinatumomab: a historical perspective. Pharmacology & therapeutics. 2012; 136(3): 334-342.
93. Buitenkamp TD, Mathot RA, de Haas V, Pieters R, Zwaan CM. Methotrexate-induced side effects are not due to differences in pharmacokinetics in children with Down syndrome and acute lymphoblastic leuke-mia. Haematologica. 2010; 95(7): 1106-1113.
94. Peeters M, Poon A. Down syndrome and leukemia: unusual clinical aspects and unexpected methotrexate sensitivity. Eur J Pediatr. 1987; 146(4): 416-422.
95. Goto H, Inukai T, Inoue H, et al. Acute lym-phoblastic leukemia and Down syndrome: the collaborative study of the Tokyo Chil-dren’s Cancer Study Group and the Kyushu Yamaguchi Children’s Cancer Study Group. International journal of hematology. 2011; 93(2): 192-198.
96. Shah N, Al-Ahmari A, Al-Yamani A, Dupuis L, Stephens D, Hitzler J. Outcome and toxicity of chemotherapy for acute lymphoblastic leukemia in children with Down syndrome. Pediatr Blood Cancer. 2009; 52(1): 14-19.
97. Roizen NJ, Amarose AP. Hematologic abnor-malities in children with Down syndrome. American journal of medical genetics. 1993; 46(5): 510-512.
98. Garre ML, Relling MV, Kalwinsky D, et al. Pharmacokinetics and toxicity of methotrex-ate in children with Down syndrome and acute lymphocytic leukemia. J Pediatr. 1987; 111(4): 606-612.
99. Ueland PM, Refsum H, Christensen B. Metho-trexate sensitivity in Down’s syndrome: a hypothesis. Cancer Chemother Pharmacol. 1990; 25(5): 384-386.
100. de Jonge R, Tissing WJ, Hooijberg JH, et al. Polymorphisms in folate-related genes and
risk of pediatric acute lymphoblastic leuke-mia. Blood. 2009; 113(10): 2284-2289.
101. Huang L, Tissing WJ, de Jonge R, van Zelst BD, Pieters R. Polymorphisms in folate-related genes: association with side effects of high-dose methotrexate in childhood acute lymphoblastic leukemia. Leukemia. 2008; 22(9): 1798-1800.
102. Zwaan CM, Kaspers GJ, Pieters R, et al. Differ-ent drug sensitivity profiles of acute myeloid and lymphoblastic leukemia and normal pe-ripheral blood mononuclear cells in children with and without Down syndrome. Blood. 2002; 99(1): 245-251.
103. Belkov VM, Krynetski EY, Schuetz JD, et al. Reduced folate carrier expression in acute lymphoblastic leukemia: a mechanism for ploidy but not lineage differences in metho-trexate accumulation. Blood. 1999; 93(5): 1643-1650.
104. von Stackelberg A, Hartmann R, Buhrer C, et al. High-dose compared with intermediate-dose methotrexate in children with a first relapse of acute lymphoblastic leukemia. Blood. 2008; 111(5): 2573-2580.
105. Matloub Y, Bostrom BC, Hunger SP, et al. Escalating intravenous methotrexate im-proves event-free survival in children with standard-risk acute lymphoblastic leukemia: a report from the Children’s Oncology Group. Blood. 2011; 118(2): 243-251.
106. Pauley JL, Panetta JC, Crews KR, et al. Between-course targeting of methotrexate exposure using pharmacokinetically guided dosage adjustments. Cancer chemotherapy and pharmacology. 2013; 72(2): 369-378.
107. Pieters R, Bierings M, Haas de V, et al. PROTO-COL ALL-11. Treatment study protocol of the Dutch Childhood Oncology Group for chil-dren and adolescents (1-19 year) with newly diagnosed acute lymphoblastic leukemia. Vol. version 4.1. Den Haag: DCOG; 2013.
108. David O, Fiorucci GC, Tosi MT, et al. Hemato-logical studies in children with Down syn-drome. Pediatric hematology and oncology. 1996; 13(3): 271-275.


9 Summary
Samenvatting


175
CHAPTER 9
9
Summary
Children with DS have an increased risk in developing leukemia, including acute myeloid
(AML) as well as acute lymphoblastic leukemia (ALL). When assessing overall outcome, chil-
dren with DS-ALL have fared less well than their non-DS counterparts due to a high relapse
rate and an increased treatment related mortality (TRM) throughout the treatment period.
Hence, there is a need to unravel the biological background of DS ALL, which in turn may
lead to the development of new and non-myelosuppressive therapies for this vulnerable
group of patients. In this thesis we studied the clinical and biological features of DS ALL that
determine prognosis (chapter 2-3), and used several genome wide techniques to identify
molecular aberrations involved in the pathogenesis of DS ALL (chapter 4-7).
In chapter 2 we aimed at the identification of clinically relevant outcome parameters,
determination of the prognostic relevance of well-established and novel (cyto-) genetic aber-
rations, and at the detection of causes of treatment failure in DS ALL. As almost all published
series lack sufficient power to provide definitive answers to these issues, we undertook a
large retrospective study within the international Ponte di Legno (PdL) working group. We
included 653 DS-ALL patients enrolled in 16 international trials from 1995-2004, and used
non-DS BCP-ALL patients from the Dutch childhood oncology group (DCOG) and Berlin,
Frankfurt Münster (BFM) group as reference cohorts. DS-ALL patients had a higher 8-year
cumulative incidence of relapse (CIR) and treatment-related mortality (TRM) than non-DS
patients, resulting in lower event-free survival (and overall survival (OS), once more confirm-
ing the poor outcome of DS ALL in general.
Within DS-ALL, we identified good prognosis subgroups, i.e. ETV6-RUNX1 positive ALL or
ALL with hyperdiploid (HeH) ALL with trisomy 4&10 abnormalities. The CIR for both these
subgroups was very low and TRM was the major cause of dismal outcome patients with HeH
trisomy 4&10. This suggest that these patients might be eligible for treatment reduction
rather than intensification, such as withholding from anthracyclines, and/or stratification in
the National Cancer Institute standard risk group (NCI SR), preferably with minimal residual
disease (MRD) confirmation of excellent early response. In addition, we identified a novel
clinically favorable prognostic subgroup of DS-ALL patients, characterized by age <6 years
and with blood cell (WBC) count <10x109/L, which differs from the classical prognostic factors
in non-DS ALL according to the NCI criteria. However, these patients still had a relatively high
CIR, suggesting they may need an intensification block following induction and CNS-directed
therapy, and might therefore be classified into the intermediate MRD risk group.
In general, infection associated TRM was not related to a specific treatment-phase or regi-
men, but interestingly about half occurred during maintenance therapy. While relapse remains
the major cause of poor survival, vigilant supportive care is necessary to improve outcome. We
therefore recommend improving supportive care measurements for DS ALL patients through-
out therapy with aggressive treatment of infections. Moreover, DS ALL patients should receive

CHAPTER 9
176
the same treatment intensity as non-DS patients in order to prevent relapse but with prompt
interruptions for aplasia and with more intensive surveillance than non-DS children.
It is well known that DS ALL patients are vulnerable for excessive toxicity. Especially Metho-
trexate (MTX), which is a key agent in current ALL treatment, is notorious for its side effects in
DS ALL. In chapter 3 we describe the results of a retrospective case-control study in which we
used non-linear mixed effect modeling to study the pharmacokinetics and toxicity induced
by high dose (1-5 g/m2) MTX courses in 44 DS and 87 matched non-DS ALL patients. In total,
we analyzed 468 MTX courses and observed significantly more grade 3-4 gastro-intestinal
(GI) toxicity in DS patients as compared to non-DS ALL patients. Interestingly, the occurrence
of grade 3-4 GI toxicity was not related to plasma MTX area under the curve (AUC). MTX-
clearance was 5% lower in DS-ALL patients, however no significant differences in MTX plasma
levels were detected at T=24 and at T=48 hours. Therefore, we feel that this small difference
in clearance is probably clinically not relevant. In conclusion, we did not find evidence for
differences in MTX pharmacokinetics between DS and non-DS patients which could explain
the higher frequency of GI toxicity, and the greater need for MTX dose reductions. Hence,
these differences are most likely explained by differential pharmacodynamic effects in the
tissues between DS and non-DS children.
In chapter 4, we described mutations of the kinase and pseudokinase domain of Janus
Kinase 1-3 (JAK), identified with bi-directionally sequencing. We screened 6 DS patients with
transient myeloproliferative disease (TMD), 15 ML-DS and 35 DS ALL patients. JAK1 mutations
were found in 1 ML-DS patient and 1 DS ALL patient. JAK2 R683 mutations, which activate
the JAK-STAT pathway, were found in ~20% of the DS ALL patients, and JAK3 mutations were
found in 1 TMD and 1 ML-DS patient. JAK2 mutations lack prognostic significance in DS ALL,
as no relapses occurred. Furthermore, a meta-analysis of published data did not show any
differences in survival of JAK2 mutants compared to wildtype patients.
In chapter 5, we used array Comparative Genomic Hybridization (CGH) and Multiplex Ligation-
dependent Probe Amplification (MLPA) to find molecular aberrations in genes involved B-cell
development and differentiation. We studied a population-based cohort of 34 DCOG DS ALL
patients and validated our results in 84 DS ALL children from United Kingdom trials. In total,
50% of DS ALL patients had ≥1 deletion in a B-cell development or differentiation gene. Inter-
estingly, IKZF1 encoding the lymphoid transcription factor IKAROS, was deleted in 35% of all
DS ALL patients, which is a proportion similar to non-DS high-risk ALL patients. IKZF1 deletions
independently predicted dismal outcome. Remarkably, 62% of all patients had genomic Cytokine
Receptor Like Factor 2 (CRLF2) rearrangements but this abnormality lacked prognostic relevance.
In Chapter 6, we established the frequency and the prognostic significance of B-cell trans-
location gene 1 (BTG1) deletions in a large series of DS ALL patients. We found BTG1 aberra-
tions in ~7% of the DS ALL patients and they all showed a nearly identical deletion pattern
in which the BTG1 area 1, area 2, and exon 2 probes were deleted, while exon 1 was retained.
Interestingly, BTG1 deletions were mainly found in patients with ETV6-RUNX1 positive ALL.

177
CHAPTER 9
9
Moreover, BTG1 deletions did not predict for poor clinical outcome in DS ALL patients. In
short, we could not confirm the high frequency of BTG1 deletions previously described in
smaller series and found the prevalence to be similar to non-DS ALL patients.
In Chapter 7 we aimed at identifying genes differentially expressed between DS and non-DS ALL,
which are involved in DS ALL leukemogenesis. Therefore we compared global gene-expression
profiles (GEP) of 38 DS ALL with 502 non-DS BCP ALL patients. We identified 357 probe sets (307
genes) being significantly differentially expressed between DS and non-DS BCP-ALL. Interestingly,
the vast majority of genes overexpressed in DS as compared to non-DS ALL, are not differentially
expressed in differentiated hematopoietic (CD43+, CD41+ and CD235+) “induced pluripotent
stem cells (iPS)” derived from DS tissue. This indicates that differences in gene expression are not
only a consequence of a trisomy 21 but are related to the DS leukemogenesis. In addition, we
showed that as compared to non-DS patients, ETS-related gene (ERG) has a reduced expression in
DS bone marrow samples taken from DS children without leukemia, but is overexpressed in bone
marrow samples of DS ALL patients. As ERG is a chromosome 21 localized transcriptional regula-
tor of hematopoiesis, the constitutional extra copy of the ERG gene, may result in deregulation of
the hematopoietic stem cell network and therefore be an important driving event in DS BCP-ALL.
Furthermore, we showed that 25% of the DS ALL cases clustered together with ‘BCR-ABL1-like’
non-DS patients. Patients with a ‘BCR-ABL1-like’ profile cluster together with BCR-ABL1–posi-
tive cases, although the leukemic cells do not harbor the BCR-ABL1 translocation. Non-DS ALL
patients with a ‘BCR-ABL1 like’ signature denote a new clinically relevant entity having poor
outcome. The DS ALL patients with a ‘BCR-ABL1 like profile’ had a CIR of 30%, which is similar
to their non-DS counterparts. In addition, 50% of the ‘BCR-ABL1-like’ DS ALL patients have dele-
tions of IKZF1, providing further evidence that genetic make-up of DS ALL is unfavorable.
In conclusion, we provided evidence that to date there is no evidence of a unique genetic
lesion occurring in DS and not in non-DS ALL patients. Moreover, we showed that DS ALL is a
genetically ‘high risk’ disease, as a substantial proportion of DS ALL patients has a ‘BCR-ABL1-
like’ gene expressions profile and/or IKZF1 deletions. We therefore recommend being cautious
in treatment reduction for DS ALL patients, as relapse and not TRM is the major cause of treat-
ment failure. The only exception to this rule may be the small group of 12% of patients with
ETV6-RUNX1 rearrangements or hyperdiploid trisomies 4 and 10. To further improve outcome,
DS ALL patients may benefit from 1) improved risk-group stratification with current available
therapy, 2) from the elucidation of the genetic background, especially in the normal karyotype
cases, 3) the development of targeted therapies that improves prognosis and reduces acute
and long-term toxicity as well as TRM for all patients, and 4) from enhanced intensive sup-
portive care throughout treatment. This requires several novel studies, such as the role of MRD
in DS ALL, unraveling the genetic background by using novel deep-sequencing procedures,
the role of JAK-inhibitors in DS ALL, and studies evaluating antibiotic/antifungal and/or im-
munoglobulin prophylaxis in DS ALL. As DS ALL is a rare disease, international collaboration is
essential to achieve these goals.


179
CHAPTER 9
9
nederLandSe SamenVaTTinG
Kinderen met het syndroom van Down hebben een verhoogde kans op het krijgen van acute
lymfatische (ALL) en acute myeloide leukemie (AML). Ondanks een duidelijke verbetering in
de prognose van kinderen met ALL in de laatste 30 jaar, blijft het toekomstperspectief voor
leukemie patiënten met het syndroom van Down minder gunstig dan voor patiënten zonder
Down syndroom. Dit proefschrift behandeld de studies die we verricht hebben op basis van
klinische data van patiënten met DS ALL (hoofdstuk 2-3) en de moleculaire afwijkingen die
voorkomen bij DS ALL (hoofdstuk 4-7).
Hoofdstuk 2 beschrijft een grote internationale retrospectieve studie in samenwerking met
de Ponte di Legno (PdL) werkgroep. Doel van deze studie was om de prognostische waarde
van klinische en celbiologische kenmerken en oorzaken van falen van de behandeling te
bestuderen bij kinderen met DS ALL. In totaal hebben we 653 DS ALL patiënten geïncludeerd
die behandeld zijn tussen 1 januari 1995 en 1 januari 2005 en hebben deze vergeleken met
non-DS B cel voorloper (BCP) ALL van de Stichting Kinderoncologie Nederland (SKION) en
de Berlin Frankfurt Münster (BFM) groep. DS ALL patiënten hadden een hogere kans op het
krijgen van een recidief dan non-DS ALL patiënten en tevens een hogere kans op therapie-
gerelateerde mortaliteit [Treatment Related Mortality (TRM)] wat resulteerde in een lagere
gebeurtenis-vrije overleving’ [Event Free Survival (EFS)] en overleving [overall survival (OS)].
In de analyse kwam naar voren dat DS ALL patiënten met een leeftijd jonger dan 6 jaar
in combinatie met minder dan 10x109/L witte bloedcellen ten tijde van de diagnose, een
nieuwe groep patiënten vormden met een goede prognose (EFS: 78%, OS: 87%). Deze
afkappunten van leeftijd en aantal witte bloedcellen zijn anders dan de criteria van het
Amerikaanse National Cancer Institute (NCI), die boven of onder de 10 jaar en WBC groter
of kleiner dan 50x109/L gebruikt. Opvallend was echter dat patiënten <6 jaar met minder
dan 10x109/L witte bloedcellen nog een relatief hoge kans op het terugkeren van de ziekte
(CIR 17%) hadden. Dit suggereert dat zij na de inductie therapie nog een extra blok met
intensieve therapie nodig hebben, eventueel aangevuld met therapie voor leukemiecellen
in het centraal zenuwstelsel.
Tevens vonden we dat patiënten met ETV6-RUNX1 fusies in de leukemiecellen of een
hoog hyperdiploid (HeH) karyotype (≥51 chromosomen) een goede prognose hebben, wat
overeenkomt met ALL in kinderen zonder DS. Circa 45% van de HeH DS ALL patiënten had-
den zowel 3 kopieën van chromosoom 4 als van chromosoom 10. Deze laatste groep van
patiënten had een EFS van 88% en geen van hen kreeg een recidief. Ook het aantal kinderen
met ETV6-RUNX1 fusies had een zeer laag risico voor het recidiveren van de ALL. Dit sug-
gereert dat deze patiënten mogelijk in aanmerking zouden kunnen komen voor reductie
van therapie door bijvoorbeeld minder of geen anthracyclines toe te dienen. Een andere
strategie zou zijn om deze patiënten alleen te behandelen in de standaard risico arm van een
behandelprotocol, waarbij bij voorkeur de excellente respons op therapie bevestigd wordt

CHAPTER 9
180
met een snelle afname van minimale rest ziekte (minimal residual disease [MRD]) in het begin
van de behandeling.
Ook hebben we gevonden dat TRM niet gerelateerd was aan een specifieke fase van de
therapie maar werd gezien gedurende de hele behandelperiode. Tevens vonden we dat TRM
niet gerelateerd was aan een bepaald chemotherapeuticum. Opvallend was dat het gebruik
van toxische anthracyclines tijdens de inductie geen duidelijke invloed had op TRM. De
mortaliteit als gevolg van infectieuze TRM was ook verhoogd in DS ALL. Dit impliceert dat
betere ondersteunende behandelingen (supportive care) gedurende de hele behandelperi-
ode nodig zijn voor deze kwetsbare groep patiënten. Opvallend was echter dat recidiverende
ziekte en niet TRM de grootste factor van de slechtere prognose van DS ALL patiënten is. Om
het terugkeren van de ziekte te voorkomen zou het aantal witte bloedcellen gedurende de
therapie in DS ALL patiënten net zo laag moeten zijn als in ALL patiënten zonder DS, maar
met frequente controles en acute onderbreking van therapie indien er sprake is van aplasie.
Naar aanleiding van bovengenoemde resultaten is er een internationale werkgroep opgezet
die zich bezig houdt met het verzamelen van gegevens van DS ALL patiënten om van daaruit
een specifiek behandelprotocol voor kinderen met DS ALL te ontwikkelen.
Methotrexaat (MTX) is een van de belangrijkste componenten van de ALL behandeling
in Nederland. DS ALL patiënten ervaren meer MTX gerelateerde toxiciteit dan non-DS ALL
kinderen en met name de gastro-intestinale toxiciteit staat op de voorgrond. In hoofdstuk
3 wordt de retrospectieve case-control studie beschreven die verricht is op een groep van
44 DS ALL patiënten en 87 non-DS ALL controle patiënten. De ervaren toxiciteit tijdens
protocol M (meerdere kuren hoge dosis MTX intraveneus) en de bijhorende MTX-spiegels in
het bloed werden verzameld en geanalyseerd door gebruik te maken van non-linear mixed
effect modeling (NONMEM). Op deze manier wilden we onderzoeken of het mogelijk was om
de toxiciteit terug te voeren op een veranderde farmacokinetiek in DS ALL patiënten t.o.v.
non-DS ALL patiënten. In totaal verzamelden we gegevens van 468 MTX kuren variërend van
1-5 g/m2 in 44 DS en 87 non-DS ALL patiënten. Graad 3-4 gastro-intestinale toxiciteit werd
significant vaker waargenomen in DS patiënten in vergelijking met non-DS ALL patiënten
maar dit was niet gerelateerd aan de hoeveelheid plasma MTX onder de curve. De klaring van
MTX door DS ALL patiënten was 5% lager dan non-DS ALL patiënten. Echter dit verschil lijkt
klinisch niet relevant te zijn aangezien er geen verschil werd gezien in de MTX plasma spiegel
op tijdstip 24 en 48 uur na het starten van de hoge dosis MTX. Hieruit kan worden geconclu-
deerd dat het niet waarschijnlijk is dat DS ALL patiënten een andere farmacokinetiek hebben
die verantwoordelijk is voor de verhoogde toxiciteit. Het is dan ook meer waarschijnlijk dat
de farmacodynamiek in de verschillende lichaamsweefsels anders is in DS ALL kinderen t.o.v.
non-DS kinderen. Aangezien DS ALL kinderen die in ons cohort behandeld werden met een
gemiddelde dosis MTX (1-3 gram/m2) weinig toxische problemen ondervonden bevelen wij
deze dosis aan voor toekomstige behandelschema’s van DS ALL kinderen.

181
CHAPTER 9
9
Al geruime tijd spelen genetische afwijkingen van de leukemiecel een belangrijke rol in
prognose en maken ze deel uit van de classificatie voor het te volgen behandelprotocol.
Meer recent is het met nieuwe technieken mogelijk geworden om op moleculair niveau
afwijkingen van de leukemiecel te detecteren. Deze moleculaire afwijkingen gaan een
steeds belangrijker rol spelen in de moderne tijd waarin men streeft naar therapie op maat. In
hoofdstuk 4 hebben we de frequentie van mutaties van de Janus Kinase (JAK) familie genen
JAK1, JAK2 en JAK3 in kaart gebracht van 6 DS patiënten met transiënte myeloproliferatieve
leukemie (TMD), 15 ML-DS en 35 DS ALL patiënten. Veel studies richtten zich met name op
de reeds bekende mutaties waardoor het werkelijke aantal afwijkingen mogelijk onderschat
werd. Het volledige kinase en pseudokinase domein van JAK1, JAK2 en JAK3 werd met behulp
van polymerase chain reaction (PCR) geamplificeerd, gesequenced en geanalyseerd. JAK1
mutaties werden gevonden in 1 ML-DS patiënt en in 1 DS ALL patiënt. In JAK2, zijn in exon 16
op positie R683 mutaties gevonden in 6 (~20%) DS-ALL patiënten. Deze mutatie activeert het
JAK-STAT pathway en komt ook voor in een lagere frequentie in high risk non-down ALL. JAK3
mutaties werden aangetoond in 1 patiënt met TMD en in 1 ML-DS patiënt. Het muterende ef-
fect van de mutaties in zowel JAK1 als JAK3 is onbekend. De prognose van patiënten met een
JAK2 mutatie bleek niet beter of slechter te zijn dan voor patiënten zonder deze mutatie. De
’10-jaar gebeurtenis-vrije overleving’ [Event Free Survival (EFS)] was 100% voor patiënten met
een JAK2 mutatie versus 75% in patiënten zonder afwijking. Hierin worden alle gebeurtenis-
sen zoals refractaire ziekte, recidief, dood door welke oorzaak dan ook, verwerkt. Ook werd
geen verschil gezien in de 10-jaars OS en de cumulatieve incidentie van recidief (CIR) was
eveneens gelijkwaardig. Deze resultaten werden bevestigd door een meta-analyse van 171
DS ALL patiënten. Concluderend, JAK mutaties zijn zeldzaam in DS gerelateerde leukemie,
met uitzondering van JAK2 mutaties in DS ALL en deze hebben geen prognostische waarde.
Kinderen met DS ALL hebben een lagere frequentie van de veelvoorkomende (cyto-)
genetische afwijkingen bij non-DS ALL, waardoor we op zoek zijn gegaan naar moleculaire
afwijkingen die specifiek betrokken zijn bij de pathogenese van DS ALL. Hiervoor is gebruik
gemaakt van array Comparative Genomic Hybridization (CGH) and Multiplex Ligation-depen-
dent Probe Amplification (MLPA), waarvan de resultaten in hoofdstuk 5 worden beschreven.
Met zowel array-GCH als met MLPA is het mogelijk kleine amplificaties of deleties in het DNA
op te sporen die niet zichtbaar zijn met standaard genetisch onderzoek. Bij de analyse is met
name gekeken naar afwijkingen in genen die betrokken zijn bij de ontwikkeling van B-cellen
en naar afwijkingen van CRLF2 en JAK2. De resultaten voortvloeiend uit analyse van een
Dutch Childhood Oncology (DCOG) ‘population based’ cohort van 34 DS ALL samples werd
gevalideerd door een UK ‘population based’ cohort van 84 DS samples . In totaal had 50% van
de DS ALL patiënten ≥1 afwijking in een B-cel ontwikkelings-gen: PAX5 (12%), VPREB1 (18%),
en IKZF1 (35%). JAK2 was gemuteerd in 15% van de patiënten en gnomische afwijkingen
van CRLF2 werden gevonden bij 62% van de DS ALL patiënten. De overleving van patiënten
met een afwijking in IKZF1, dit is het gen dat codeert voor de transcriptiefacto IKAROS,

CHAPTER 9
182
was significant slechter dan voor patiënten zonder deze afwijking (6-year EFS 45±16% vs.
95±4%; p=0.002) en dit werd bevestigd in het validatiecohort van de UK (6-year EFS 21±12%
vs. 58±11%; p=0.002). In een multivariaat analyse bleek dat deleties van IKZF1 een sterke
voorspellende waarde hadden voor een slechte prognose. Dit zou kunnen betekenen dat DS
ALL patiënten gelijkenis vertonen met non-DS ALL patiënten met een high risk profiel en dat
we daar in de toekomst met de behandeling rekening mee moeten houden.
In hoofdstuk 6 wordt de frequentie en de prognostische relevantie van afwijkingen van het
B cel translocatie gen 1 (BTG1) in DS ALL besproken naar aanleiding van een publicatie waarin
werd beschreven dat deleties van dit gen vaak voorkomen in DS ALL, maar een klein aantal
patiënten had geïncludeerd. BTG1 speelt een cruciale rol in cel processen zoals proliferatie en
geprogrammeerde celdood. Dit gen werd onderzocht in een ‘population based’ cohort van
116 DS ALL patiënten van de DCOG en de UK. In totaal vonden we in 6.9% van de DS ALL
patiënten een deletie van BTG1, een frequentie die overeenkomt met non-DS ALL patiënten
en duidelijker lager dan beschreven in de kleine studie. Opvallend was dat alle afwijkingen
een nagenoeg identiek patroon van deleties lieten zien waarin de BTG1 regio 1 en 2 en exon
2 was gedeleteerd maar exon 1 nog in tact was. De mediane leeftijd van patiënten met een
BTG1 deletie was 5.4 jaar versus 12 jaar in de en 62% had het mannelijk geslacht wat duidelijk
verschilt van de resultaten in de gepubliceerde studie (12 jaar en 80% man). Mutaties van
BTG1 kunnen samen met andere (cyto-) genetische afwijkingen voorkomen en werden met
name gezien in de groep patiënten met een ETV6-RUNX1 afwijking. Afwijkingen van BTG1
hebben geen prognostische waarde wanneer ze vergeleken worden met DS ALL patiënten
met een normaal BTG1 gen. Concluderend konden we de hoge frequentie van BTG1 deleties
in een grote groep DS ALL patiënten niet bevestigen.
In hoofdstuk 7 hebben we gebruik gemaakt van ‘gen-expressie profiling’ (GEP). Met behulp
van deze gen expressie profielen hebben we gezocht naar nieuwe genen die karakteristiek
zijn voor DS ALL patiënten, en die ons mogelijkerwijs iets kunnen leren over de pathogenese
van DS ALL, en daardoor interessant zijn voor de ontwikkeling van specifiek gerichte therapie
(targeted therapy). In de analyse hebben we een groep van 38 DS ALL patiënten vergeleken
met 502 non-DS ALL patiënten. We vonden dat 357 probe sets (307 genen), ≥ 1.5 keer tot
expressie kwamen in de vergelijking tussen DS en non-DS patiënten. Opmerkelijk was dat de
genen die tot over-expressie kwamen in deze vergelijking niet tot over-expressie kwamen
in hematologische pluripotente stamcellen (CD43+, CD41+ and CD235+) afkomstig van DS
weefsel. Dit impliceert dat veranderingen in expressie van genen niet alleen veroorzaakt
worden door de extra kopie van chromosoom 21 in het DS, maar gerelateerd zijn aan het
ontstaan van leukemie. Verder hebben we aangetoond dat in vergelijking met non-DS ALL
patiënten, het ERG (ETS-related gene) gen een lagere expressie heeft in het beenmerg van
DS patiënten zonder leukemie, maar een hogere expressie in het beenmerg van DS patiënten
met leukemie. Aangezien ERG gelegen is op chromosoom 21 en de transcriptie van hemato-
poietische factoren reguleert, zou de extra kopie van ERG kunnen resulteren in het ontregelen

183
CHAPTER 9
9
van het hematopoietische netwerk waar ERG onderdeel van uitmaakt. Dit suggereert dat ERG
een belangrijke rol speelt in het ontstaan van ALL in kinderen met het syndroom van Down.
Tevens hebben we aangetoond dat 25% van de DS ALL patiënten samen clustert met
ALL patiënten zonder DS met een ‘BCR-ABL1-like’ profiel. Patiënten met dit profiel clusteren
samen met patiënten die een BCR-ABL1 translocatie hebben zonder dat deze afwijking in de
leukemiecellen wordt aangetoond. ALL patiënten zonder DS met het ‘BCR-ABL1-like’ profiel
vormen een groep met slechte prognostische vooruitzichten. De kans op het terugkeren
van de ziekte is voor zowel kinderen met het DS als kinderen zonder het DS ongeveer 30%.
Ten slotte zagen we dat 50% van de kinderen met een ‘BCR-ABL1-like’ profiel ook een deletie
van IKZF1 hebben. Dit ondersteunt de hypothese dat leukemie in kinderen met DS ALL een
ongunstig profiel heeft.
Concluderend hebben we aangetoond date er tot op heden geen bewijs is voor een unieke
mutatie die wel voorkomt in DS ALL maar niet in non-DS ALL. Verder hebben we aangetoond
dat DS ALL een ziekte is met een hoog risico profiel aangezien een substantieel deel van de
DS ALL patiënten een ‘BCR-ABL1-like’ profiel heeft en / of IKZF1 deleties. Terughoudendheid
ten aanzien van het reduceren van behandeling is dan ook geboden, temeer omdat in dit
proefschrift is aangetoond dat het recidiveren van de ziekte de belangrijkste oorzaak van het
falen van de behandeling is en niet de toxiciteit van de behandeling. De enige uitzondering
hierop zijn DS ALL patiënten met ETV6-RUNX1 fusies of met 3 kopieën van chromosoom 4 en
10. De prognose van DS ALL patiënten zou verbeterd kunnen worden indien zij zouden kun-
nen profiteren van 1) verbeterde stratificatie van DS ALL patiënten in de huidige behandel-
protocollen 2) opheldering van de genetische achtergrond van DS ALL en dan met name in de
groep van DS ALL patiënten waarin op dit moment nog geen afwijkingen zijn aangetoond, 3)
de ontwikkeling van doelgerichte (targeted) therapieën die de prognose verbeteren en tege-
lijkertijd de acute en lange termijn toxiciteit en mortaliteit verminderen en 4) van intensieve
‘supportive care’ gedurende de hele behandeling. Hiervoor zijn nieuwe studies nodig die de
waarde en de rol van MRD in DS ALL bepalen, studies die de met nieuwe technieken de ge-
netische achtergrond van DS ALL verder onderzoeken, studies naar de rol van JAK-inhibitors
in DS ALL en studies die de waarde van antibiotica, antischimmelmedicatie en immunoglo-
bulines als profylaxe in de behandeling van DS ALL evalueren. Aangezien DS ALL een zeld-
zame ziekte is, is internationale samenwerking nodig om bovenstaande te bewerkstelligen.


10 About the author


187
CHAPTER 10
10
CurriCuLum ViTae
Trudy Buitenkamp werd op 4 juni 1975 geboren te Ten Post. Na de middelbare school
startte zij de opleiding HBO-Verpleegkunde te Groningen, waarbij zij haar afstudeerstage
van 6 maanden in het ‘Holy Famlily Hospital’ te Berekum in Ghana deed. Na het voltooien
van de HBO-V ging zij in het najaar van 1998 als verpleegkundige aan het werk in het Sophia
Kinderziekenhuis te Rotterdam. Hier kwam zij in aanraking met het vakgebied kinderon-
cologie en al snel behaalde zij de specialistische vervolgopleidingen kinderverpleegkunde
en kinderoncologie. Tijdens haar werkzaamheden als kinderoncologie verpleegkundige
kwam zij in aanraking met wetenschappelijk onderzoek met als ultiem doel de overleving
en kwaliteit van leven te verbeteren van kinderen met een oncologische aandoening. Dit
was een belangrijke factor in het besluit om geneeskunde te gaan studeren. Na het behalen
van haar VWO certificaten startte zij in 2003 haar studie geneeskunde te Rotterdam. Vanaf
het derde jaar van de studie volgde zij daarnaast de master of science in “Clinical Research”
die zij in 2008 afrondde. Daarna startte zij haar promotietraject waarvan de resultaten zijn
beschreven in dit proefschrift. In april 2012 hervatte zij haar studie geneeskunde en startte
met de coschappen. Tevens heeft zij gedurende haar coschappen actief geparticipeerd in de
ontwikkeling van een internationaal behandelprotocol voor kinderen met het syndroom van
Down. Zij is getrouwd met Martijn Arkesteijn en samen hebben zij een dochter: Sterre (2010).


189
CHAPTER 10
10
LiST Of puBLiCaTiOnS
International publications
1. Buitenkamp Td, Mathôt RA, de Haas V, Pieters R, Zwaan CM. Methotrexate-induced side
effects are not due to differences in pharmacokinetics in children with Down syndrome
and acute lymphoblastic leukemia. Haematologica. 2010 Jul; 95(7): 1106-13
2. Blink M*, Buitenkamp Td*, van den Heuvel-Eibrink MM, Danen-van Oorschot AA, de Haas
V, Reinhardt D, Klusmann JH, Zimmermann M, Devidas M, Carroll AJ, Basso G, Pession A,
Hasle H, Pieters R, Rabin KR, Izraeli S, Zwaan CM. Frequency and prognostic implications
of JAK 1-3 aberrations in Down syndrome acute lymphoblastic and myeloid leukemia.
Leukemia. 2011 Aug; 25(8): 1365-8. *Shared first authorship
3. Buitenkamp Td, Pieters R, Gallimore NE, van der Veer A, Meijerink JP, Beverloo HB, Zim-
mermann M, de Haas V, Richards SM, Vora AJ, Mitchell CD, Russell LJ, Schwab C, Harrison
CJ, Moorman AV, van den Heuvel-Eibrink MM, den Boer ML, Zwaan CM. Outcome in chil-
dren with Down’s syndrome and acute lymphoblastic leukemia: role of IKZF1 deletions
and CRLF2 aberrations. Leukemia. 2012 Oct; 26(10): 2204-11.
4. Buitenkamp Td, Pieters R, Zimmermann M, de Haas V, Richards SM, Vora AJ, Mitchell
CD, Schwab C, Harrison CJ, Moorman AV, van den Heuvel-Eibrink MM, Zwaan CM. BTG1
deletions do not predict outcome in Down syndrome acute lymphoblastic leukemia.
Leukemia. 2013 Jan; 27(1): 251-2.
5. Trudy d. Buitenkamp, Shai Izraeli, Martin Zimmermann, Erik Forestier, Nyla A.Heerema,
Marry M. van den Heuvel-Eibrink, Rob Pieters, Carin M. Korbijn, Lewis B. Silverman, Kjeld
Schmiegelow8 Der-Cheng Liang, Keizo Horibe, Maurizio Arico, Andrea Biondi, Giuseppe
Basso, Karin R. Rabin, Martin Schrappe, G.unnar Cario, Georg Mann, Maria Morak, Renate
Panzer-Grümaye, Veerle Mondelaers, Tim Lammens, Helene Cave, Batia Stark, Ithamar
Ganmore, Anthony V. Moorman, Ajay Vora, Stephen P. Hunger, Ching-Hon Pui, Charles
G Mullighan, Atsushi Manabe, Gabriele Escherich, Jerzy R. Kowalczyk, James A. Whitlock,
and C. Michel Zwaan. Acute lymphoblastic leukemia in children with Down syndrome: a
retrospective analysis from the Ponte di Legno study group. Blood. 2014 Jan 2; 123(1):
70-7.
6. Blink M, van den Heuvel-Eibrink MM, Gallimore NE, Buitenkamp Td, den Boer ML,
Balgobind BV, Sanders MA, de Haas V, Klusmann JH, Reinhardt D, Hasle H, Muzikova K,
Pieters R, Zwaan CM. Gene expression profiling of transient myeloproliferative disorder
and myeloid leukemia of Down syndrome. Submitted.
7. T.d. Buitenkamp1, M.M. van den Heuvel – Eibrink1, M. Zimmerman2, J.M. Boer1, M. Blink1,
T.C.J.M. Arentsen-Peters1, V. de Haas3, R. Pieters1, M.L. den Boer1, M. Fornerod1, C.M. Zwaan1
Dow syndrome acute lymphoblastic leukemia is characterized by loss of ETS-related gene
repression Manuscript in preparation.

CHAPTER 10
190
National publications
1. Blink M, Buitenkamp Td, van Wering ER, Zwaan CM Down Syndroom en Leukemie. Down
Up (uitgave Stichting Down Syndroom) 2008.
2. Blink M, Buitenkamp Td, van Wouwe JP, van Wering ER, van der Velden VHJ, Zwaan CM.
Ontwikkelingen in de diagnostiek en behandeling van leukemia bij Kinderen met het
Down Syndroom. Tijdschrift voor Kindergeneeskunde. April 2009.

191
CHAPTER 10
10
phd pOrTfOLiO
Name PhD student: Trudy D. Buitenkamp
Erasmus MC department: Pediatric Oncology-Hematology
Research School: Molecular Medicine
PhD period: February 2008 – June 2014
Promotor: Prof. Dr. R. Pieters
Supervisors: Dr. C.M. Zwaan, Dr. M.M. van den Heuvel-Eibrink
General academic courses year
Classical Methods for Data Analysis (CC02) (NIHES) 2009
Biomedical English Writing and Communication 2011
Photoshop and illustrator (CS5) 2011
Specified courses
Basic and Translational Oncology (MM) 2008
Biomedical Research Techniques 2008
Basic course on Gene Expression Arrays 2009
Basic course on ‘R’ 2010
Seminars and workshops
Annual PhD day, Erasmus MC 2008
Annual Pediatric research Day, Erasmus MC 2008-2010
Annual Molecular Medicine Day, Erasmus MC 2008-2012
Annual Pediatric Oncology Symposium 2008-2011
2nd AML-BFM Research Symposium, Hannover, Germany 2008
International meeting Acute Lymphoblastic Leukemia, London, UK 2009
(inter)national conferences
International Symposium “Acute Leukemias XII”, Munich, Germany 2008
19th Annual Meeting of the I-BFM Study Group, Glasgow, UK (oral presentation) 2008
40th SIOP Annual Meeting, Berlin, Germany (oral presentation) 2008
6th Biennal I-BFM Childhood Leukemia Symposium, Glasgow, UK 2008
50th ASH annual Meeting, San Francisco, USA (2 poster presentations) 2008
51th ASH annual Meeting, New Orleans, USA (1 poster presentation) 2009
53rd ASH annual Meeting, San Diego, USA (1 poster presentation) 2011
43rd SIOP Annual Meeting, Auckland< New Zealand (oral presentation) 2011
22nd Annual Meeting of the I-BFM Study Group, Gdansk, Poland (oral presentation) 2011
8th Biennial Childhood Leukemia Symposium, Santiago, Chili (oral presentation) 2012
17th Congress of EHA, Amsterdam, The Netherlands (oral presentation) 2012
Other
Travel grant for the 50th and 51th ASH annual meeting awarded by the ASH committee 2008, 2009
Travel grant awarded by Erasmus MC Trustfonds2008. 2009, 20011


193
CHAPTER 10
10
dankwOOrd
Het is zover, het proefschrift is af en dat voelt goed! Hoogste tijd om alle mensen te bedanken
die hebben meegeholpen aan de totstandkoming van dit boekje, want zonder jullie was het
nooit gelukt.
Om te beginnen wil ik alle patiënten en hun ouders bedanken die in onzekere tijden
toestemming hebben gegeven voor deelname aan wetenschappelijk onderzoek. Door u is
het mogelijk om onderzoek te doen naar de oorzaken van leukemie bij kinderen met het
syndroom van Down, maar ook naar betere therapieën met minder bijwerkingen.
Natuurlijk ook een woord van dank voor alle mensen binnen de stichting kinderoncolo-
gie (SKION). Dank voor het beschikbaar stellen van samples, maar ook voor de registratie
van diagnoses, klinische informatie en behandelingen. Deze data is verweven in het hele
proefschrift en jullie werk is van groot belang voor alle kinderen met kanker in Nederland en
daarbuiten.
Mijn promotor, prof. dr. Pieters, beste Rob, ruim 15 jaar geleden leerde ik je kennen als het
nieuwe hoofd van de afdeling kinderoncologie in het Sophia Kinderziekenhuis en inmiddels
heb je je tomeloze energie gericht op het Prinses Maxima Centrum voor Kinderoncologie.
Jouw kritische blik was de eerste keer even schrikken en resulteerde in een nacht doorhalen
waarna de statistiek voor mijn eerste “oral presentation” gedegen was. Tot slot, dank voor
je humor waar ik met name tijdens de etentjes op congressen van mocht genieten. Mijn
co-promotor, dr C.M. Zwaan, beste Michel, de kaart op je kamer over hoe een zwaan gracieus
over het water glijdt, maar onder water driftig peddelt doet me nog altijd glimlachen. Dat
driftig peddelen zie ik bij jou terug in je strijdvaardigheid om de behandeling voor kinderen
met kanker te verbeteren en dat siert je. Echter deze zelfde gedrevenheid en vastberaden-
heid om de lat steeds een beetje hoger te leggen, dreef mij ook meer dan eens tot wanhoop,
maar het resultaat is dit proefschrift waar ik volgens jou trost op mag zijn. Dank voor het
vertrouwen in een goede afloop van dit project. Mijn tweede co-promotor, dr. M.M. van
den Heuvel-Eibrink, beste Marry, ook wij kennen elkaar al vanaf het eerste begin, van ver-
pleegkundige tot promovenda. Ik vind het bewonderingswaardig dat je zowel bij basaal als
klinisch onderzoek betrokken bent. Je ambitie en gedrevenheid zijn in die zin een voorbeeld
geweest. Daarnaast heb ik je aandacht mijn gezin en voor mij als persoon zeer gewaardeerd.
Ook jij bedankt voor het in mij gestelde vertrouwen.
De leden van de (lees)commissie: Dr. M. den Boer, dr. M. Fornerod en prof.dr. P. Huijgens,
hartelijk dank voor het met aandacht lezen en beoordelen van mijn proefschrift. Prof. dr. S.
Izraeli, prof.dr. E. Rings, en dr. M. Weijerman, dank voor het plaatsnemen in de commissie.
Prof. dr. Izraeli, dear Shai, thank you for your enthusiastic participation in the Ponte di Legno
study. Also thanks for introducing me to a significant number of researchers in the field, pro-
viding me with a huge professional network. I am really honored that you want to take place
in my committee, even while it is in the middle of your sabbatical. Dr. Zimmermann, dear
CHAPTER 10
194
Martin, despite a very busy agenda and the existence of corrupt excel files, you managed to
make an uncountable number of Kaplan Meier curves for me. Thank you once again.
Kinderoncologen, Auke, Max, Inge vd Sluis, Inge Appel, Andrica, Erna, Roel en Martine
dank voor jullie belangstelling en input tijdens de researchbesprekingen. Beste Inge Appel,
je hebt mijn loopbaan in het Sophia vanaf de eerste dag gevolgd, en meer dan eens heb ik
je om raad gevraagd en het gekregen. Vele jaren later ligt er dan dit proefschrift, wie had
dat ooit gedacht. Dank dat je me bij Michel hebt geïntroduceerd, maar bovenal dat je me
gemotiveerd en geïnspireerd hebt om dokter te worden. Andrica, samen konden we lachen
om en balen van onze onhandigheid op het lab. Maar ondanks dat, kwam je bevlogenheid
voor het onderzoek naar MDS en JMML tot uiting in hoe je altijd vol enthousiasme sprak
over “mijn familie” waarbij je doelde op een gezin met meerdere patiënten. Ik wens iedere
ouder en patiënt een betrokken dokter zoals jij! Dames van het Secretariaat Kinderoncologie,
Jacqueline, Jeanine† en Anita: dank voor jullie vlotte hulp bij alle regeldingen, maar vooral
ook dank voor jullie interesse in mij als persoon.
De werkgroep leiders en post-docs van de kinderoncologie, dank voor het delen van jullie
kennis tijdens de besprekingen en tussendoor. Succes met jullie onderzoekslijn. Maarten en
Judith, dank voor jullie pogingen om mij wegwijs te maken in de wondere wereld van probe
sets, fold changes en log ratios, ook al was dat voor beide partijen niet eenvoudig.
De AML groep waar ik als enige ALL’er deel van uit maakte: Iris, Brian, Susan, Lonneke,
Nicola, Marjolein, Eva C, Eva B, Jasmijn, Jenny, Andrica, Malou, Maarten, Astrid, Anna, Daria,
Askar, Noorjahan, Julia en Patty. Dank voor het delen van jullie kennis, dank voor alle onder-
steuning op het lab (ook nadat ik allang richting kliniek was verdwenen), maar natuurlijk ook
voor de gezelligheid op het lab en speciaal tijdens kook en cocktail workshops.
Kamergenootjes, Irene, Diana, Floor, Imbritt, Stephanie, Maartje, Eva, Jenny, Jasmijn, Lieke,
Emma, Eddy, Ingrid en Fahrad: Dank voor alle gezelligheid, ondanks dat onze kamer een
stiltekamer was, dank ook voor het beantwoorden van alle vragen, voor het delen van de
gezamenlijke frustraties, toch altijd fijn om te horen dat je niet de enige bent. Irene dank voor
het introduceren van “woensdag snoepjesdag”, al was het al snel iedere dag snoepjesdag en
later zelden meer snoepjesdag. Allemaal heel veel succes met jullie boekjes en loopbanen.
Alle andere collega onderzoekers veel succes de komende jaren, voor je het weet schrijf je je
eigen dankwoord.
Lieve Marjolein, samen deden we onderzoek doen naar leukemie bij kinderen met het syn-
droom van Down, dat betekende dat we naast pipetteren en papers schrijven ook regelmatig
samen naar congressen afreisden. Ondanks (of was het dankzij?) hotelkamers met vlekken
op de badkamermuur en liften waarvan de bodem aan een nadere inspectie onderworpen
moest worden, hadden we het vaak reuze naar onze zin. Ondertussen ben je gepromoveerd
en in opleiding tot kinderarts, wat heerlijk dat je je doel hebt bereikt. Lieve Emma, voordat
we elkaar kenden was er een gezamenlijke vriend die zei dat we erg op elkaar leken. In de
loop der jaren werd die uitspraak keer op keer bevestigd, en daardoor hadden we vaak aan

195
CHAPTER 10
10
een half woord genoeg. Alhoewel een half woord? Wat hebben wij veel geklets, gelachen
maar ook traantjes weg gepinkt! Jammer dat we elkaar nu zo weinig zien en spreken, toch
maar samen een praktijk beginnen? Veel geluk en geniet van de tijd in “The big Apple”. Lieve
Marieke, dank voor alle thermosflessen thee, maar vooral dank voor je luisterend oor! Je
positieve levenshouding is bewonderingswaardig, dank dat ik daar een graantje van mee
mocht pikken. Arian, je was mijn non-DS counterpart en als enige ALL’er in de AML-groep
was dat een prettig gegeven. Ik wens je een mooie toekomst in Maastricht, je hebt er hard
voor geknokt!
Echter zonder ontspanning, gezelligheid en steun van vrienden en familie was het schrij-
ven van dit proefschrift een nog grotere uitdaging geweest. Vera, Michelle, Leonora, Clara,
Mathilde en Marieke; dank voor alle vrolijke etentjes en de sauna-bijklets-weekendjes. Heel
veel geluk met jullie gezinnen en loopbanen. Lieve Michael en Janneke, laten we in dromen
blijven geloven en ondertussen genieten van wat we hebben. Bas, Lucine, Mark en Jasja,
samen delen we de mooie momenten, maar ook de verdrietige en het is fijn dat dat kan. De
vriendschap met jullie is er eentje met diepgang! Mark en Lucine, fijn dat jullie mijn paranim-
fen willen zijn. Yetje, je bent mijn “oudste” vriendin en wat voor één?! Eén met een vrolijke
kronkel in haar hoofd, ééntje die wedstrijdjes van me wint en bovenal ééntje die me nooit
iets verwijt als ik weer maanden niets van me laat horen. Die tijd is nu voorbij, hoogste tijd
voor een honkieponkie! Dear Daisy thank you for your loving care, not only for Sterre but also
for Martijn and me. From the first moment I felt it was good, and you proved that Sterre was
in perfect hands the last year. Marta, your laugh en positive energy was refreshing, your help
was really appreciated, and last but not least thank you for being a friend for Daisy. Diana,
thank you for making at least one part of my life easier, while your own life is so damn hard ;-).
Lieve zussen, lieve Louwra, Dieneke en Sebina bedankt dat jullie met me meeleefden, me
bemoedigden maar me ook wisten te wijzen op al het andere wat belangrijk is in het leven.
Ook al hadden jullie misschien vaak het idee dat het tegen dovemans oren gezegd werd,
ik hoorde jullie wel degelijk en het zette me meer dan eens met beide benen op de grond.
Lieve pap en mam, dank voor de ontelbare klusjes waar ik dacht geen tijd voor te hebben,
dank voor de zorg en liefde voor Sterre tijdens alle oppasdagen, maar vooral dank voor jullie
onvoorwaardelijke steun tijdens de afgelopen jaren op werk, studie en persoonlijk vlak.
The sun, the moon and the stars, lieve Martijn, lieve Sterre, raadt eens hou veel ik van jullie
hou? ii.
Trudy


197
CHAPTER 10
10
LiST Of aBBreViaTiOnS
Abbreviations
ABL1 C-abl oncogene 1, non-receptor tyrosine kinase (gene)
AEIOP Associazione Italiana di Ematologia ed Oncologia Pediatrica
ALL Acute Lymphoblastic Leukemia
AML Acute Myeloid Leukemia
ANC Absolute neutrophil count
AUC Area under the curve
B-other Genetically unclassified B-ALL
BCL2 B-cell lymphoma 2
BCP B cell precursor
BCR Breakpoint cluster region (gene)
BFM Berlin-Frankfurt-Münster
BM Bone marrow
BSA Body surface area
BTG1 B-cell translocation gene 1 (gene)
CCG North American Children’s Oncology Group including the Children’s Cancer Group and the Pediatric Oncology Group studies
CCLG Childhood Cancer and Leukaemia Group
CCR Continuous comple remission
CD Cluster of differentiation
CDKN2A/B Cyclin-Dependent Kinase Inhibitor (gene)
cDNA Complementary DNA
CEBPA CCAAT/enhancer binding proetin (C/EBP), alpha (gene)
CGH Comparative Genomic Hybridization
CI Confidence interval
CIR Cumulative incidence of relapse
CL Central compartment
CLL Chronic Lymphoblastic Leukemia
CML Chronic Myeloid Leukemia
CN Cytogenetically normal
CNS Central nervous system
CNV Copy number variation
CoALL Cooperative study-group for childhood acute lymphoblastic leukemia
Cobs Observed concentration
COG Children’s Oncology Group (North America)
Cpred Predicted concentration
CRCL Creatinine clearance
CRLF2 Cytokine Receptor Like Factor
Ct Cycle treshold

CHAPTER 10
198
CTCAE Common Toxicity Criteria for Adverse Events
DAVID Database for Annotation, Visualization, and Integrated Discovery
DCOG Dutch Childhood Oncology Group
DFCI Dana Faber Cancer Institute
DNA Deoxyribonucleic acid
DS Down Syndrome
DSCR Down syndrome critical region
E2A Transcription Factor E2-Alpha (gene)
EFS Event-free survival
EORTC European Organization for Research and Treatment of Cancer (Belgium)
ERG v-ETS erythroblstosis virus E26 oncogene homolog (gene)
ETV6 Ets variant 6 (gene)
FC Foldchange
FDR False discovery rate
FISH Fluorescence in situ hybridization
GATA1 Globin transcription factor 1 (gene)
GC Glucocorticoid
GEP Gene expression profiling
GO Gene Ontology
HB Hemoglobine
HeH High hyperdiploid
HR Hazard ratio
HR(G) High risk (group)
HSC Hematopoietic stem cell
HSCT Hematopoietic stem cell transplantation
IGH@ Immunoglobuline heavy chain (gene)
IKZF1 IKAROS family zinc finger 1
iPS Induced pluripotent stem cells
ISCN International System for Human Cytogenetic Nomenclature
ITT Intrathecal triple therapy
JACLS Japan Association of Childhood Leukemia Study
JAK Janus kinase (gene)
JMML Juvenile myelomonocytic leukemia
kDa kilo Dalton, measurement of atomic mass commonly used to indicate protein mass
KIKA KinderKankervrij
KOCR Kinderoncologisch centrum rotterdam (funding organization for pediatric oncology research and training)
LIMMA Llinear models for microarray analysis
MDS Myeodysplastic syndrome
ML Myeloid leukemia
MLL Myeloid/lymphoid or mixed -lineage leukemia

199
CHAPTER 10
10
MLPA Multiplex ligation-dependent probe amplification
6-MP 6-Mercaptopurine
MPD Myeloproliferative disorders
MPL Myeloproliferative leukemia virus oncogene (gene)
MPN Myeloproliferative neoplasms
MR(G) Medium risk (group)
MRC-UKALL Medical Research Council United Kingdom
MRD Minimal residual disease
MTX Methotrexate
MX1 Myxovirus Resistance 1 (gene)
NCI National Cancer Institute
NCRI National Cancer Research Institute
NK Natural killer
NONMEM Non-linear mixed effect modeling
NOPHO Nordic Society for Pediatric Hematology and Oncology
NR Non responder
OFV Objective function value
OS Overall survival
P2RY8- Purinergic Receptor P2Y, G-Protein Coupled, 8 (gene)
PAR1 Pseudoautosomal region 1
PAX5 Paired box 5 (gene)
PB Peripheral blood
PBX1 Pre-B-cell leukemia homeobox 1 (gene)
PCA Principal Component Analysis
PCR Polymerase chain reaction
PdL Ponte di Legno
PK Pharmacokinetics
POG Pediatric Oncology Group
PPLLSG Polish Paediatric Leukaemia and Lymphoma Study Group
PS Probe set
Q Inter-compartmental clearance
RFC Reduced folate carrier
RFS Relapse free survival
RNA Ribonucleic acid
RPS20 ribosomal protein S20 (gene)
RT-PCR Reverse transcription PCR
RT-qPCR Quantitative real time PCR
RUNX1 Runt-related transcription factor 1 (gene)
SCT Stem cell transplantation
SJCRH St. Jude Children’s Research Hospital
SNP Single-nucleotide polymorphism

CHAPTER 10
200
SR(G) Standard risk (group)
T Time point
TCCSG Tokyo Children’s Cancer Study Group
TCF3 Transcription factor 3 (gene)
TL Transient Leukemia
TMD Transient myeloproliferative disorder
TPOG Taiwan Pediatric Oncology Group
TRM Treatment related mortality
V1 Volume of distribution of the central compartment
V2 Volume of distribution of the peripheral compartment
VPREB1 Pre-B lymphocyte 1 (gene)
VSN Variance Stabilzation Normalization
WBC White blood cell count
WHO World Health Organization
WT Wild-type

201
CHAPTER 10
10
affiLiaTiOnS Of CO-auThOrS
T.C.J.M. Arentsen-Peters Paediatric Oncology/Haematology, Erasmus MC–Sophia Children’s Hospital, Rotterdam, the Netherlands
M. Arico Department Paediatric Haematology Oncology, Azienda Ospedaliero-Universitaria Meyer Children Hospital, Florence, Italy.
G. Basso Laboratory of Paediatric Onco-Haematology, Department of Paediatrics, University Hospital of Padova, Padova, Italy.
H.B. Beverloo Department of Clinical Genetics, Erasmus MC, Rotterdam, the Netherlands, and Working group hematologic genome diagnostics, The Netherlands.
A. Biondi Department of Paediatrics, University of Milano-Bicocca, Ospedale S. Gerardo, Monza, Italy.
M. Blink Paediatric Oncology/Haematology, Erasmus MC–Sophia Children’s Hospital, Rotterdam, the Netherlands.
J. Boer Paediatric Oncology/Haematology, Erasmus MC–Sophia Children’s Hospital, Rotterdam, the Netherlands.
M.L. den Boer Paediatric Oncology/Haematology, Erasmus MC–Sophia Children’s Hospital, Rotterdam, the Netherlands.
G. Cario Department of Paediatrics, University Medical Center Schleswig-Holstein, Campus Kiel, Kiel, Germany.
A.J. Carroll Department of Genetics, University of Alabama at Birmingham, Birmingham, AL, USA.
H. Cave Assistance publique—Hôpitaux de Paris, Hôpital Robert Debré, Département de Génétique Université Paris-Denis Diderot, Paris, France.
A.A. Danen-van Oorschot Paediatric Oncology/Haematology, Erasmus MC–Sophia Children’s Hospital, Rotterdam, the Netherlands.
M. Devidas College of Medicine, University of Florida, Gainesville, FL, USA.
G. Escherich Clinic of Paediatric Haematology and Oncology, University Medical Center Hamburg–Eppendorf, Hamburg, Germany.
E. Forestier Department of Medical Biosciences, University of Umeå, Umeå, Sweden.
M.W.J. Fornerod Paediatric Oncology/Haematology, Erasmus MC–Sophia Children’s Hospital, Rotterdam, the Netherlands.
N.E. Gallimore Paediatric Oncology/Haematology, Erasmus MC–Sophia Children’s Hospital, Rotterdam, the Netherlands.
I. Ganmore Department of Paediatric Haemato-Oncology, Edmond and Lily Safra Children’s Hospital, Sheba Medical Centre, Tel-Hashomer, Ramat Gan, and Tel Aviv University Medical School, Tel Aviv, Israel.
V. de Haas Dutch Childhood Oncology Group, Den Haag, the Netherlands.
C.J. Harrison Leukaemia Research Cytogenetics Group, Northern Institute for Cancer Research, Newcastle University, Newcastle, United Kingdom.

CHAPTER 10
202
H. Hasle Nordic Society for Paediatric Haematology and Oncology (NOPHO), Department of Paediatrics, Aarhus University Hospital Skejby, Aarhus, Denmark.
N.A. Heerema Department of Pathology, The Ohio State University, Columbus, USA.
M.M. van den Heuvel - Eibrink
Paediatric Oncology/Haematology, Erasmus MC–Sophia Children’s Hospital, Rotterdam, the Netherlands.
K. Horibe Clinical Research Center, National Hospital Organization, Nagoya Medical Center, Nagoya, Aichi, Japan.
M. A. Horstmann COALL study group, University Medical Center Hamburg, Germany, Research Institute and Clinic of Pediatric Oncology, Hamburg, Germany
S.P. Hunger Department of Paediatrics, University of Colorado School of Medicine and Children’s Hospital, Aurora, Colorado, USA.
S. Izraeli Department of Paediatric Haemato-Oncology, Edmond and Lily Safra Children’s Hospital, Sheba Medical Centre, Tel-Hashomer, Ramat Gan, and Tel Aviv University Medical School, Tel Aviv, Israel.
J.H. Klussman AML-BFM Study Group, Department of Paediatric Oncology/Haematology, Medical High School, Hannover, Germany.
C.M. Korbijn Dutch Childhood Oncology Group, Den Haag, the Netherlands.
J.R. Kowalczyk Department of Children’s Haematology and Oncology, Medical University, Lublin, Poland.
T. Lammens Department of Paediatric Hemato-Oncology, Ghent University Hospital, Belgium.
D.C. Liang Paediatric Haematology-Oncology Division, Mackay Memorial Hospital, Taipei, Taiwan.
A. Manabe Department of Paediatrics, St. Luke’s International Hospital, Tokyo, Japan.
G. Mann Children’s Cancer Research Institute, St Anna Children’s hospital, university medical school Vienna, Austria.
R.A.A. Mathôt Department of Hospital Pharmacy and Clinical Pharmacology, Erasmus MC, Rotterdam, the Netherlands.
J.P.P. Meijerink Paediatric Oncology/Haematology, Erasmus MC–Sophia Children’s Hospital, Rotterdam, the Netherlands.
C.D. Mitchell Department of Paediatric Haematology/Oncology, John Radcliffe Hospital, Oxford, United Kingdom.
V. Mondelaers Department of Paediatric Hemato-Oncology, Ghent University Hospital, Belgium.
A.V. Moorman Leukaemia Research Cytogenetics Group, Northern Institute for Cancer Research, Newcastle University, Newcastle, United Kingdom.
M. Morak Children’s Cancer Research Institute, St Anna Children’s hospital, university medical school Vienna, Austria.
C.G. Mullighan Department of Pathology, St. Jude Children’s Research Hospital, Memphis, Tennessee, United States.

203
CHAPTER 10
10
R. Panzer-Grümayer Children’s Cancer Research Institute, St Anna Children’s hospital, university medical school Vienna, Austria.
A. Pession Paediatric Oncology and Haematology Unit ‘Lalla Seràgnoli’, University of Bologna, Bologna, Italy.
R. Pieters Paediatric Oncology/Haematology, Erasmus MC–Sophia Children’s Hospital, Rotterdam, the Netherlands.
C.H. Pui Department of Oncology and Pathology, St. Jude Children’s Research Hospital, Memphis, Tennessee, USA.
K.R. Rabin Division of Paediatric Haematology/Oncology, Texas Children’s Cancer Center, Baylor College of Medicine, Houston, TX, USA.
D. Reinhardt AML-BFM Study Group, Department of Paediatric Oncology/Haematology, Medical High School, Hannover, Germany.
S.M. Richards Clinical Trial Service Unit, University of Oxford, Oxford, United Kingdom.
L.J. Russell Leukaemia Research Cytogenetics Group, Northern Institute for Cancer Research, Newcastle University, Newcastle, United Kingdom.
K. Schmiegelow Paediatric and Adolescent Medine, the Juliane Marie Centre, the University Hospital Rigshospitalet, Copenhagen, Denmark.
M. Schrappe Department of Paediatrics, University Medical Center Schleswig-Holstein, Campus Kiel, Kiel, Germany.
C. Schwab Leukaemia Research Cytogenetics Group, Northern Institute for Cancer Research, Newcastle University, Newcastle, United Kingdom.
L.B. Silverman Dana–Farber Cancer Institute, Boston, MA, USA.
B. Stark Center of Paediatric Haematology/Oncology, Schneider Children’s Medical Center of Israel, Petah Tiqwa, and Sackler Faculty of Medicine, Tel Aviv University, Tel Aviv, Israel.
A. van der Veer Paediatric Oncology/Haematology, Erasmus MC–Sophia Children’s Hospital, Rotterdam, the Netherlands.
A.J. Vora Department of Haematology, Sheffield Children s Hospital, Sheffield, United Kingdom.
J.A. Whitlock Division of Haematology/Oncology, the Hospital for Sick Children, University of Toronto, Canada.
M. Zimmermann AML-BFM Study Group, Department of Paediatric Oncology/Haematology, Medical High School, Hannover, Germany.
C.M. Zwaan Paediatric Oncology/Haematology, Erasmus MC–Sophia Children’s Hospital, Rotterdam, the Netherlands.
