cloning and transformation of candidate genes to study the
TRANSCRIPT

Cloning and transformation of candidate
genes to study the protein content in
potato (Solanum tuberosum L.)
B.Sc. P. G. Baldeón Mendoza
M.Sc. student Plant Sciences
Plant Breeding and Genetic Resources
Wageningen University & Research
April, 2017
Supervisors:
dr.ir. L. M. Trindade
ing. D. C. T. Dees
Examiners:
dr.ir. L. M. Trindade
ing. D. C. T. Dees

Cloning and transformation of candidate
genes to study the protein content in
potato (Solanum tuberosum L.)
B.Sc. P. G. Baldeón Mendoza
April 2017
M.Sc. thesis
Plant Sciences Group
Laboratory of Plant Breeding
Bio Based Economy Group
WAGENINGEN UNIVERSITY & RESEARCH
Supervisors:
dr.ir. L. M. Trindade
ing. D. C. T. Dees
Examiners:
dr.ir. L. M. Trindade
ing. D. C. T. Dees

2
Acknowledgments Working in the Laboratory of Plant Breeding has been an exciting and beautiful experience during
the last six months. Having little knowledge on the molecular aspects of plants and neither
cloning procedures, it was a challenge and a wonderful learning process.
I would like to thank Luisa Trindade, my supervisor, for giving me the opportunity to do my thesis
in the Bio based economy group. The weekly meetings and the monthly lunches were a very nice
motivation to get involved in the research topics within the group. The friendly environment and
willingness of all the people was very helpful, especially in the beginning when I was new within
the group and I felt a bit lost.
Thanks to Michiel Klaassen for providing background information about the candidate genes he
identified which without them it would not have been possible for me to do my thesis in the Bio
Based Economy group.
I want to especially thank Dianka Dees, my daily supervisor and my guide during the thesis period.
Dianka was always very kind and willing to solve any question I had during the project and her
supervision was tremendously valuable. Dianka really took the time and she had the patience to
explain everything to me even if I have asked a couple of times about the same thing. I also
appreciate that she didn’t answer my questions immediately, but she encouraged me to think by
myself enriching my learning experience. The briefly chats we had early in the morning together
with Charlotte were a very nice motivation to work with enthusiasm and joy during this time.
I would also like to thank Marjan Bergervoet and Isolde Pereira for helping me to arrange the stuff
needed for the tissue culture lab. Their support growing and taking care of the plants were crucial
to accomplish the biggest objective of this thesis. They were always kind and their help simplified
a lot of the work that was needed in the lab.
I also want to thank all my friends from the Plant Breeding department with whom I shared our
difficult and good times during the thesis. A special mention to Diego, who did his thesis in the
Bioinformatics group during the same period and with who I shared the same feelings and faced
similar problems during our thesis projects. It was very nice to share this time with him and
making jokes about whatever thing is something that will be kept in my mind.
Finally, to my parents Oswaldo and Nelly, my sisters Diana, Venus and Maria Fernanda, my aunt
Elsa and my niece Gabriela who are the biggest treasure I have. They have always supported my
decisions even though sometimes it meant being apart from each other. Special thanks to
Carolina, my future wife who has been always supporting me and walking alongside my path.
During my most difficult time, she always had words that made evaluate myself and even
sometimes her words were strong, they were meant to help me being a better man. The endless
love she gives me every day is the most important and priceless thing a man can have to stay
motivated, learning and improving day by day.

3
Table of Contents
Acknowledgments .................................................................................................................................. 2
Table of Contents ....................................................................................................................................3
Abbreviations...........................................................................................................................................5
Abstract ................................................................................................................................................... 6
1 Introduction ..................................................................................................................................... 7
Background .................................................................................................................................. 7 1.1
Candidate genes ..................................................................................................................... 8 1.2
Nitrate transporter (NRT). ................................................................................................. 8 1.2.1
Sulfate/bicarbonate/oxalate exchanger and transporter (STR). ..................................... 9 1.2.2
Ethylene receptor (ETR). ................................................................................................... 10 1.2.3
Lysine/histidine transporter (LHT). .................................................................................... 11 1.2.4
Hexose carrier protein (HCP). ........................................................................................... 12 1.2.5
Amino acid permease (AAP). ............................................................................................ 13 1.2.6
2 Materials and Methods ................................................................................................................. 15
cDNA synthesis ...................................................................................................................... 15 2.1
Primers design and testing ................................................................................................... 16 2.2
Gateway® cloning system ..................................................................................................... 16 2.3
Agrobacterium tumefaciens ................................................................................................. 17 2.4
Agrobacterium tumefaciens AGL1 strain .......................................................................... 17 2.4.1
Electroporation procedure ............................................................................................... 18 2.4.2
Agrobacterium-mediated transformation ....................................................................... 18 2.4.3
Verification of transgenic plants ................................................................................... 18 2.4.4
Medium and standard procedures ....................................................................................... 19 2.5
Medium for culturing and selecting bacterium colonies ................................................. 19 2.5.1
Colony PCR ........................................................................................................................ 20 2.5.2
Plasmid DNA isolation ...................................................................................................... 20 2.5.3
Sequencing ....................................................................................................................... 20 2.5.4
Enzymatic digestion ......................................................................................................... 20 2.5.5
3 Results ............................................................................................................................................ 22
Cloning and Transforming the candidate genes .................................................................. 22 3.1
4 Discussion ..................................................................................................................................... 28
5 Conclusion ..................................................................................................................................... 30
6 Recommendations ....................................................................................................................... 30
4
7 References ..................................................................................................................................... 31
8 Appendix ....................................................................................................................................... 36
High fidelity enzymes used for PCR and setup of the reaction ......................................... 36 8.1
Phusion® PCR ................................................................................................................... 36 8.1.1
Advantage® 2 PCR ............................................................................................................ 36 8.1.2
Dream taq polymerase PCR ............................................................................................. 36 8.1.3
Antibiotics .............................................................................................................................. 37 8.2
Plasmid DNA isolation and DNA purification ....................................................................... 37 8.3
Zymoclean™ Gel DNA Recovery Kit - ZYMORESEARCH ................................................... 37 8.3.1
DNA Clean & Concentrator™-5 - ZYMORESEARCH ..................................................... 38 8.3.2
QIAGEN® MinElute® gel extraction kit ....................................................................... 38 8.3.3
QIAGEN QIAprep® Spin Miniprep Kit .......................................................................... 39 8.3.4
Plasmid isolation from E. coli (Eric’s modification of original Birnboim method) .... 40 8.3.5
Gateway cloning protocols .................................................................................................. 40 8.4
pENTR™ TOPO® cloning protocol ................................................................................... 40 8.4.1
LR Clonase™ II Enzyme Mix cloning protocol ............................................................. 43 8.4.2
Modified Gateway® cloning and transformation procedures ........................................... 44 8.5
pENTR™ TOPO® cloning ................................................................................................... 44 8.5.1
LR cloning...................................................................................................................... 44 8.5.2
pENTR™ TOPO® and LR transformation procedure ................................................... 44 8.5.3

5
Abbreviations
AAP Amino acid permease gene family
BAP 6-Benzylaminopurine
bp Base pair
cDNA Complementary Deoxyribonucleic acid
DNA Deoxyribonucleic acid
EDTA Ethylenediaminetetra-acetic acid
ETR Ethylene receptor
GABA Gamma amino butiric acid
HCP Hexose carrier protein
LB Lysogeny Broth medium
LHT Lysine/histidine transporter
MS Murashige & Skoog growing medium for vegetal material
NAA 1-Naphthaleneacetic acid
NRT Nitrate transporter
ORF Open Reading Frame
PCR Polymerase Chain Reaction
pDNA Plasmid Deoxyribonucleic acid
pENTR Entry clone for the Gateway® system
PFJ Potato fruit juice
pH Potential Hydrogen
PINs Protease inhibitors potato proteins
QTL Quantitative trait locus
RNA Ribonucleic acid
RT-qPCR Reverse Transcriptase Quantitative Polymerase Chain Reaction
SOC Super Optimal Broth with Catabolite repression medium
STR Sulfate/bicarbonate/oxalate exchanger and transporter
TAE Tris-acetate-EDTA buffer
TE Tris-EDTA buffer
USDA United States Department of Agriculture
ZCVK Zeatin, Cefotaxime, Vancomycine and Kanamycin selection medium

6
Abstract Potato proteins have become highly valuable for the Chemical and Food industries in The
Netherlands. Protein content of potato (Solanum tuberosum L.) tubers is low (up to 3% in a fresh
weight basis) and whether the protein content can be increased and its implications is a current
research topic. Six candidate genes have been identified based on GWAS and homolog genes
from other crops studies to investigate the protein composition and its function in potato. This
work focused on the molecular cloning and transformation processes of the candidate genes
aiming to produce transgenic potato plants. Experiments were performed to amplify and clone
the candidate genes into the Gateway® cloning system which facilitates further transformation
into Agrobacterium tumefaciens. The Gateway® cloning system consists of an entry clone
(pENTR™ TOPO® vector) and a destination vector (PK7GW2,0 binary vector) which are
recombined to produce an expression clone with the gene of interest. Kanamycin resistant and
potential Nitrate transporter (NRT) transformed plants were generated through Agrobacterium-
mediated transformation. However, verification for the presence of the NRT construct remains to
be assessed. The new potential transgenic lines can be subjected to gene expression analysis to
evaluate the effect of the NRT gene in these plants. Sulfate/bicarbonate/oxalate exchanger and
transporter (STR) gene was partially confirmed in the pENTR™ TOPO® vector remaining for
verification before performing further cloning steps. Ethylene receptor (ETR) and Lysine/histidine
transporter (LHT) gene fragments were amplified from PCR. HCP and AAP genes were not
amplified from cDNA. Cloning and transformation of the candidate genes towards the acquisition
of valuable knowledge on the protein content in potato still remains to be completed.
Keywords: Agrobacterium tumefaciens, Agrobacterium-mediated transformation, Gateway,
Molecular cloning, Potato proteins.

7
1 Introduction
Background 1.1
Potato (Solanum tuberosum L.) is the fourth most important food crop in the world after rice,
wheat and maize (Camire, 2016). Its nutritional value has been described extensively and variation
can be found according the purpose of the cultivated varieties. Potatoes are mostly cultivated for
different market segments such as processing, French fries, crisps, starch and fresh consumption
(Singh et al., 2016). Among the qualities of starch potatoes, starch content is the most known and
studied property to date. Potatoes are known as a good source of energy as the predominant
components are carbohydrates as well as proteins, minerals and vitamins (Navarre et al., 2016).
According to the USDA, the average nutritional content of potatoes show the following values
per 100 grams of boiled potatoes with skin and peeled before consumption: water 77 grams;
carbohydrates 20 grams; energy 87 kilocalories; protein 1.87 grams; fat 0.1 grams; calcium 5
milligrams; potassium 379 milligrams; phosphorus 44 milligrams; iron 0.31 milligrams; niacin 1.44
milligrams; thiamin 0.106 milligrams; riboflavin 0.02 milligrams. In The Netherlands, potato is one
of the main starch producing crops for food processing with around 15% of the arable land
covered with potatoes (Eurostat, 2016).
Food and pharmaceutical industries use the starch as a basic component for the production of
several items and food specialties for human consumption by different processes (Survase, et al.,
2016). The process of starch extraction involves different biochemical processes and the use of
high amounts of water. In the past, after starch extraction, potato fruit juice (further referred as
PFJ) remained as a waste of the process. Nowadays, it is mostly a low-value side-stream with an
increasing value due to the protein content which can be extracted from the PFJ (Wageningen
University, 2016; Michiel Klaassen, personal communication). Besides starch, potatoes also
contain proteins which have been described to have interesting nutritional qualities when
compared to proteins from egg and soy. One remarkable property of potato proteins (such as
patatin – see paragraph below) is that it causes low allergic impact to humans in contrast to
gluten or casein from wheat and milk respectively (Alting et al., 2011).
The soluble protein content in potato is variable ranging from 1% up to 3% in some varieties on a
fresh weight basis. The protein content in potato is contained in the PFJ which remains after
starch extraction. Since approval of potato proteins as a source of food products, several
extraction techniques and methodologies have been developed. Three major classes of proteins
have been described for potato: Patatin, protease inhibitors (PINs) and other proteins (Waglay &
Karboune, 2016). Patatin and PIN proteins are the most abundant accounting for around 40% for
each of these classes of protein (Alting et al., 2011). When compared to vegetal proteins obtained
from crops such as wheat and soy, potato proteins have the highest quality and nutritional values.
The nutritional value of potato proteins is comparable to animal originating proteins such as egg
and milk proteins (Alting et al., 2011). Therefore, an increasing interest of the pharmaceutical and
food industries has arisen due to particular characteristic of potato proteins on their techno-
functional properties (Creusot et al., 2011), antioxidant behaviour (Kudo et al., 2009) and high
nutritional value (Bártová & Bárta, 2009).
8
For the food industry, protein from potatoes are becoming more and more important for many
companies especially in the European Union. One clear example is the Dutch company AVEBE
which mainly processes starch from potatoes. Their interest for the proteins contained in potato
have promoted serious efforts in research aiming to improve the protein content in potatoes
which have already started a couple of years ago (Rink Vegelin & Peter Bruinenberg, personal
communication). The aim of the project is to study the protein composition of potato and its
implications. To start investigating whether the protein content can be effected or not, cloning
and transformation of the different candidate genes are the first steps to take. This thesis report
focuses on aspects of molecular cloning and transformation of the candidate genes aiming to
produce transgenic plants which allow us to elucidate the functioning of potato proteins in
further studies.
Candidate genes 1.2
Genetic studies, functional genomics and proteomics analyses are available tools to study the
factors involved in the protein content of potatoes (Barsan, 2016). These factors are genes
present in the potato genome which have been identified within quantitative trait locus (QTLs)
and a couple of candidate genes have been identified (preliminary results at the Bio-based
Economy group). To date, two genetic studies have been reported on protein content in potato
(studies from Acharjee, 2013 and Werij, 2011). The QTLs identified in these genetic approaches
were shown to be present on chromosomes 1, 3 and 5. Based on GWAS studies in potato and
other crops, Nitrate transporter (NRT), Sulfate/bicarbonate/oxalate exchanger and transporter
(STR), Hexose carrier protein (HCP) and Ethylene receptor (ETR) genes were identified.
Lysine/histidine transporter (LHT) and Amino acid permease (AAP) genes were found by
searching for homologs in other crops (Wageningen University, 2016; Dianka Dees, personal
communication). Moreover, the identified candidate genes are thought to influence the protein
content in potato by different mechanisms. Research studies in the model plant Arabidopsis
thaliana, rice (Oriza sativa) and wheat (Triticum aestivum L.) have provided insight in the potential
roles of the candidate genes. Long transport of amino acids from source to sink organs or the
accumulation of amino acids in leaves for protein formation are some examples of the roles
identified for the different genes. In other crops, such as pea (Pisum sativum L.) and soy (Glycine
max L. Merr.), the genes responsible for the protein content are known. Orthologous genes from
pea and soy in potato have been selected to be studied on their role influencing the protein
content in potato. Further studies with these candidate genes are necessary to elucidate whether
the protein content can be effected. If protein content is increased in potato, one of the
questions to address is: at what extent the protein content can be increased? The present work
focuses on aspects of the molecular cloning of the six identified candidate genes.
Nitrate transporter (NRT). 1.2.1
Nitrate transporter genes belong to a big family composed by several genes with diversity of
functions. A profile study on the expression patterns in roots and shoot of three weeks old wheat
plants was performed by Buchner & Hawksford (2014). Transcript analysis showed differences
between the NRT gene family, for example, TaNPF6.1 and TaNPF6.2 genes were highly expressed
in the roots but in low amounts in the shoots whilst other genes showed similar transcript
quantities in roots and shoots (Buchner & Hawksford, 2014). Gene expression studies in potato

9
were performed by M’hamdi et al., (2016) using tubers for its assays. StNRT1.2, StNRT1.5 and
StNRT2.1 genes were tested in different cultivars and assessed for levels of nitrate accumulation.
The analysed genes were identified based on similarities with the Arabidopsis NRT homologs. At
harvesting time the expression of the genes mentioned above were also expressed in leaves and
tubers suggesting a role on mobilization of nitrate from source to sinks in potato (M’hamdi et al.,
2016). Starvation treatments to wheat seedlings revealed a reduction of nitrate content by 10% in
roots and less than 1% in shoots compared to the controls. Intriguingly, the expression of NRT1 in
roots was not affected by nitrate starvation nor induction. Moreover, the expression levels of NPF
(Nitrate Transporter 1/Peptide Transporter family) genes such as TaNPF6.3 was found to be
decreased in shoots treated with nitrate starvation. Conversely, the expression of TaNPF4.1 was
up-regulated by nitrate starvation as well as nitrate induction treatments (Buchner & Hawksford,
2014). Furthermore, genes AtNRT2.1, AtNRT2.4, AtNRT2.5 and AtNRT2.6 (NTR2 gene family) from
Arabidopsis were generally expressed in the roots. However, AtNRT2.7 was found to be expressed
in shoots and aerial plant parts (Orsel et al., 2002). These studies are examples of the importance
of NRT genes and the mobilization and allocation of nitrate through the whole plant system.
Wang et al., (2009) studied the NRT1.1 gene function in Arabidopsis mutants and concluded from
that NRT1.1 gene not only plays a role in transport of nitrate but also may function as a nitrate
sensor. These findings were supported by a reduction of nitrate uptake observed in the cells
where the nitrate sensors are located. Since NRT1.1 is able to transport and sense nitrate, a
proposed function as a “transceptor” was addressed. However, when nitrate-restricted
experiments were performed, the NRT1.1-dependent regulation was lost while expression of
endogenous genes was observed. The latter suggests the presence of other nitrate sensing
systems and nitrate sensing function of NRT1.1 could not be attributed only to this gene (Wang et
al., 2009). Accumulation of nitrate was credited to the expression levels of NRT genes, showing
differences between cultivars suggesting a potential function on nitrate accumulation in tubers
(M’hamdi et al., 2016). In potato, enhanced transport of nitrate likely influence the biomass of the
plants. Whether the protein content in tubers can be effected still needs to be evaluated.
Nevertheless, the findings from the study of M’hamdi et al., (2016) suggests that an increased
accumulation of nitrate in tubers possibly effects the protein content. Transgenic pea (P. sativum)
plants increased the biomass suggesting a modified metabolism in the Nitrogen uptake and
transport from roots to shoots. The NRT pea homolog of the NRT1 from Arabidopsis was
upregulated in transgenic plants by up to 14-fold. The total Nitrogen content in roots was
increased by 19% and the free amino acids content was enhanced to 22% and 56% higher than the
wild type in transgenic pea lines (Zhang et al., 2015). In case that enhanced accumulation of nitrate
in tubers or higher biomass production by higher uptake of nitrate were possible and the protein
content indeed were effected, the immediate question to address is what would be the impact
and counter effects of NRT genes in potato. Several NRT genes have been found to be active
within the whole plant, consequently, experiments with transgenic lines expressing one single
NRT gene from potato may not be sufficient to conclude a definitive role of NRT genes.
Sulfate/bicarbonate/oxalate exchanger and transporter (STR). 1.2.2
Sulfate/bicarbonate/oxalate exchanger and transporter STR genes are thought to be related to
transport activity of sulfate, to activate sulfate transmembrane transport and have been found in
plasmodesma and membrane (Spud DB, 2016). Genes related to sulfate/bicarbonate/oxalate
exchanger and transporters have been described in chickpea (Cicer arietinum), wheat (T.

10
aestivum), Indian mustard (Brassica juncea L.), tobacco (Nicotiana tabacum) and soybean (G. max).
The genes Ca_02835 and Ca_13487 were found to be expressed in roots, flower buds, mature
flowers, pods and stems (Li et al., 2012). In soybean, Glyma07g00840.1, Glyma08g22120.1,
Glyma13g43670.1 and Glyma15g.01710.1 were found to be expressed in roots, hypocotyls, seeds,
leaflets, seedlings, root hair cells, seed coats and few on mature leafs (Li et al., 2012). Sulfate
accumulation was assessed on 2 and 3 weeks old hydroponic wheat plants under sulfate-sufficient
and sulfate-restricted conditions. Generally, under sulfate-sufficient conditions the biomass was
increased 2 and 3-fold in shoots and roots respectively. Under sulfate-restricted conditions, only
the root biomass was found to be increased. The plants were grown until anthesis under sulfate-
sufficient conditions during four weeks to evaluate the gene expression. The four-week period
correspond to grain filling stage. After the first week from anthesis, a reduction of the sulfate
content in glume/lemma tissues was detected, however, the reduction of sulfate was not spotted
in leaf and sheath tissues until the second week after anthesis. When compared to the sulfate-
sufficient plants, sulfate-restricted conditions treated plants did not decrease the sulfate content
in grains, suggesting that accumulation of sulfate needed for grain filling occurred before anthesis
(Buchner et al., 2010).
Abdin et al., (2010) transferred the S. lycopersycum STR gene (LeST1.1) to indian mustard (Brassica
juncea L.) through Agrobacterium-mediated transformation. Almost all transformed plants were
found to be higher in sulfate uptake capacity compared to untransformed plants within three
sulfate concentrations (25, 50 and 1000 uM SO42-). One of the generated transgenic lines
presented a 2-fold increase in the sulfate uptake capacity which was suggested to be a
consequence of high expression levels of the LeST1.1 gene. The chlorophyll content was measured
to detect any possible symptom of sulfur deficiency. Transgenic plants showed no visible
symptoms whereas the untransformed plants presented severe deficiency symptoms (Abdin et
al., 2010). Similarly, Ding et al., (2016) studied the GmSULTR1;2b gene to elucidate the effect of
sulfate accumulation in soybean and tobacco. The expression of GmSULTR1;2b was upregulated 7-
fold under sulfate-restricted conditions compared to the controls. Quantitative real time PCR
revealed upregulation of the GmSULTR1;2b only in the roots. Transformed tobacco plants showed
an increase of 11% in seed yield from overexpressing GmSULTR1;2b plants. Moreover, the biomass
of two-month-old tobacco plants was 18% higher under sulfate-sufficient conditions compared to
control plants. Interestingly, the overexpressing GmSULTR1;2b plants showed less severe
chlorosis under sulfate-restricted conditions suggesting an enhanced sulfate uptake capacity of
the plants (Ding et al., 2016). Sulfate as an important nutrient in potato can be determinant under
low supply conditions causing yield losses. Sulfate deficiency in potato might affect negatively the
synthesis of sulfur-based amino acids altering the production of proteins. In contrast, enhanced
uptake and assimilation of sulfate might promote a better performance in potato. Besides playing
roles in the synthesis of amino acids, sulfate have also been related to tolerance under nutrient
limited conditions. Overexpressing STR genes in potato can be expected to enhance the biomass
production of the plants. Whether an increment in biomass might lead to higher protein
accumulation remains to be addressed.
Ethylene receptor (ETR). 1.2.3
Ethylene receptor genes (ETR) are known to be involved in several processes and different life
stages of plants from seed germination, root development to senescence of plants. In potato,
ETR genes have been reported to be expressed in tubers (young and mature), stolons, stems,

11
leaves and flower parts such as petals, sepals, petioles and stamen. Furthermore, ethylene
receptor genes might be also functioning in callus formation of young plantlets. ETR genes also
respond under abiotic stress for example to drought conditions (Spud DB, 2016). The hormone
ethylene has been described to function as a signal molecule under biotic stress caused by
wounding by insects or mechanical wounding and Ethylene receptors are classified in two
subfamilies (Spud DB, 2016). ETR1 genes have been described to be involved in signalling roles
related to defense responses of Arabidopsis (Pajerowska et al., 2005) and a wide range of studied
plants. Ethylene genes have also been studied for its influence and interaction with other genes.
For example, ethylene-mediated signalling pathways in Arabidopsis showed a similar phenotype in
wild type plants treated with ethylene and mutants lacking glucose sensitivity. Faster
germination, smaller plants and darker coloured rosettes were similar characteristics observed in
Arabidopsis. Contrasting to the insensitive glucose plants, mutants were found to be insensitive to
ethylene which were also demonstrated to be hypersensitive to glucose. The early study of Zhou
et al., (1998) already suggested a close interaction between the sugar and ethylene signalling
pathways, both playing roles in overall and initial stage performance of Arabidopsis mutants.
Phenotypic differences were found in transgenic rice overexpressing ETR2 genes, RNAi lines and
wild type plants. Overexpressing ETR2 plants were found to have shorter coleoptiles than the wild
type plants suggesting an important role of ethylene in coleoptile growth. Additionally, heading
time was evaluated resulting in a delay of 1 week on average for overexpressing ETR2 plants while
earlier heading time was observed for RNAi lines (Wuriyanghan et al., 2009). Furthermore,
overexpressing ETR2 showed a larger amount of starch nodules in analysed internodes compared
to the controls. In contrast, RNAi plants showed occasionally less or no difference in the starch
granules number compared to the control plants. However, the density of starch granules
measured by Iodine staining were found to be lower in the controls and RNAi plants
(Wuriyanghan et al., 2009). Gene expression studies of the ETR2 genes reported downregulation
of overexpressing lines, contrasting with upregulation of genes by RNAi lines. It was suggested
that ETR2 genes may play a role in gene expression by inhibition of a number of genes related to
Ethylene (Wuriyanghan et al., 2009). Since ETR genes have been shown to effect other genes, it
may be difficult to determine the influence of ETR genes in potato. Ethylene is known to play
diversity of functions in several stages of plant development and ETR genes might be important in
potato influencing the vegetative period as reported by Wuriyanghan et al., (2009) in rice plants.
The vegetative period is meant for the synthesis of substances required for development
including amino acids. Differences on the effects of ETR genes and the relation in expression of
other genes may serve as guide to elucidate the effects of ethylene in potato.
Lysine/histidine transporter (LHT). 1.2.4
Lysine/histidine transporter (LHT) genes have its place into a group of seven ancestry genes
closely related to AAP genes known to transport neutral and acid amino acids. Molecular studies
in Arabidopsis reported that a mutation of the LHT1 was strong enough to inhibit plant growth.
Mutant plants presented variation in phenotype and further studies demonstrated a ~20%
reduction of the amino acids uptake capacity compared to wild type plants. Consequently, it was
suggested that LHT1 genes may play a role in the uptake of amino acids from soil to the leaf
mesophyll (Hirner et al., 2006). LHT4 and LHT7 Arabidopsis genes were suggested to be involved
in reproduction, particularly in pollen and anthers development. Nevertheless, LHT4 gene was
observed to be expressed in roots and stems (Winter et al., 2007). LHT genes expression was also

12
reported in reproductive and floral tissue such as anthers, pollen tubes and pistils (Tegeder &
Ward, 2012). LHT1 genes were found mostly expressed in non-vascular tissue including leaf
mesophyll and root surfaces. Overexpressing Arabidopsis LHT1 mutants were observed with an
increased concentration of amino acids in the apoplasm (Hirner et al., 2006). Gene expression in
roots at early stages such as emerging roots and lateral roots excluding the principal root were
described for LHT1 by histochemical GUS studies. Other analysis showed stronger expression of
LHT1 in the mesophyll cells in mature leaves rather than in young leaves. Additionally,
overexpressing LHT1 Arabidopsis plants were found to grow bigger than wild types under
restricted nutrient conditions. These findings supported that overexpression of LHT1 genes can
maintain plant growth under limited nutrient conditions (Hirner et al., 2006). According to
Tegeder & Ward (2012), LHT gene expression was also found in sepals and petals of Arabidopsis.
However, no expression was detected in siliques and seeds highlighting the proposed role of LHT1
on the uptake of amino acids from soil to mesophyll (Hirner et al., 2006). LHT genes showing
influence in sexual reproductive parts are usually related to seed plants, whereas LHT genes with
expression in non-reproductive tissue have been found in algae suggesting high specificity of
these genes (Tegeder & Ward, 2012).
LHT genes encode proteins related to the transport of amino acids and transmembrane
interaction domains (EMBL-EBI, 2016). Including a vesicular amino butyric acid (GABA) transporter
predicted to have other transmembrane domains. Other proteins with this domain include proline
transporters and other amino acid transporters (Spud DB, 2016). Since LHT genes have been
found to be expressed in a great variety of tissues in Arabidopsis, it is possible that the effect of
LHT genes in potato responds and function in a similar fashion. LHT genes have been described to
be active not only in the transport of amino acids but also playing important roles under restricted
nutrient conditions. A second role of LHT1 was proposed in relation to cell uptake in leaves by an
increased amino acid content in the apoplasm where the amino acid composition was affected
causing an increase in total protein content of Arabidopsis leaves (Hirner et al., 2006). Higher
accumulation of amino acids may enhance the total protein formation in source tissues.
Moreover, due to the natural function of LHT genes, it might be possible to consider a major role
in the mobilization of amino acids from sources to sink tissues in potato. Furthermore, LHT genes
were shown to be important in reproductive organs rather than in sink organs. Reproduction in
potato is slightly different compared to other flowering plant species since the production of
seeds in potato is not as important as in Arabidopsis. Therefore, differences in the function of
LTH1 genes can be expected. Nevertheless, the accumulation of amino acids in potato leaves
might be as impacting as in Arabidopsis. Conversely, the LHT4 gene mainly expressed in the roots
and stems might play an important role in potato since high expression of LHT4 may enhance a
higher accumulation of amino acids (Winter et al., 2007). Together, LHT genes reported to be
expressed through the whole plant are interesting candidate genes to elucidate the mechanisms
involved in the formation and transport of proteins in potato.
Hexose carrier protein (HCP). 1.2.5
Hexose carrier protein genes (HCP) have been identified in big families of sugar transporter genes
in different crops. Among crops, it has been shown that HCP genes are expressed differentially in
sink and source tissues. HCP genes in potato are likely expressed in the following plant parts:
flowers, leaves, petioles, roots, shoot apex, stamens, stems, stolons, tuber cortex, tuber peel,
tuber pith, in vitro plants and young tubers (Spud DB, 2016). In tomato (S. lycopersicum), the sugar

13
transporters gene family is composed by 18 members including HCP genes (Reuscher et al., 2014).
Three hexose transporter genes (LeHT1, LeHT2 and LeTH3) were characterized and studied by
Gear et al., (2000). LeHT2 was able to encode a functional transporter of glucose as found in
functional analyses by complementation tests in a hexose transport-deficient yeast strain.
Moreover, expression of LeTH3 and LeHT1 was found in relatively high levels in young fruits (Gear
et al., 2000). Similarly, expression analysis of hexose transporter genes in grape (Vitis vinifera)
were carried out using a construct of the VvHT1 in tobacco (N. tabacum). GUS and VvTH1
promoters were used to generate transgenic plants. GUS activity was found in adult and young
leaves, stems and roots but none of the sink organs were spotted. Transgenic plants with the
VvHT1 promoter were found with sink organs such as roots, stems and young leaves (Atanassova
et al., 2003).
Molecular studies performed by McCurdy et al., 2010 aimed to expand the knowledge of the
LeHT1, LeHT2 and LeTH3 hexose transporter genes. The three cDNA sequences were cloned from
young fruits and flowers of tomato plants into a yeast strain able to grow in maltose but not in
sucrose or fructose medium (McCurdy et al., 2010). LeHT1 showed a restored growth under
glucose or fructose medium while LeHT3 was unable to rescue the yeast growing under fructose
or glucose suggesting a low-affinity transporter role of LeHT3. Interestingly, yeast colonies
containing the LeHT1 or LeHT2 were found in the plasma membrane of yeast by GFP expression.
Moreover, LeHT1 and LeHT2 yeast colonies were able to take up more glucose or fructose than
the untransformed colonies which are in agreement with the findings of Gear et al., (2000) on that
LeHT1 is able to transport glucose. Hexose accumulation was decreased in tomato fruits by RNAi
LeHT3 lines suggesting a role of HCP genes in plant performance (McCurdy et al., 2010). Similarly,
in cucumber (Cucumis sativus) complementary tests in yeast unable to grow in monosaccharides
were performed. CsHT1 was reported to have high affinity for glucose and lower preference for
galactose. CsHT1 expression levels was observed to be higher in anthers and pollen than in petals
or sepals suggesting a role of hexose transporters in seed development (Cheng et al., 2015).
Hexose carrier proteins have been also reported to be involved in phloem loading in several
plants. In potato, this might be important since the availability of sugars as energy source for
different biological process in planta are essential. Enhanced transport of sugars in the phloem
sap may influence the synthesis of elaborates including amino acids in potato. Additionally, the
biomass might be effected by higher availability of sugars leading subsequently to higher
accumulation of proteins.
Amino acid permease (AAP). 1.2.6
Genes from the amino acid permease family (AAP) are known to show a broad selectivity for
amino acids (Fischer et al., 2002; Tegeder & Ward, 2012; Tegeder et al., 2013). Studies related to
AAP genes have been performed in some legumes and Arabidopsis. AAP proteins have been
found in non-vascular plants (Physcomitrella patens), non-seed vascular plants (Selaginella
moellendorffii) and seed plants including Arabidopsis, O. sativa and Medicago truncatula (Tegeder
& Ward, 2012). An interesting study in Arabidopsis aiming to evaluate the aphid’s (Myzus persicae)
performance after knocking out the AAP6 gene provided valuable information on AAP genes. The
mutant plants were found to be significantly lower in amino acid content in sinks and through the
vascular system. The mutation in the AAP6 gene also affected the phenotype by increasing the
rosette diameter (measured at flowering time) and the number of cauline leaves in mutated
plants (Hunt et al., 2009). It is also known that AAP6 genes are responsible for allocation of amino

14
acids to seeds, although the number of seeds was not affected, the size and protein content of
seeds was recorded to be higher in mutated plants (Hunt et al., 2009). AAP transporters are
commonly found in the leaf phloem of legumes which supports the function of these genes in
phloem loading. Zhang et al., (2010) showed that AAPs are important genes involved in phloem
loading in vascular plants and it is consistent with the study by Hunt et al., (2009), which
suggested that AAPs genes play a role in the regulation of amino acid composition of sink and
sieve sap elements. In Arabidopsis, the AAP genes are often localized in phloem in roots, stem and
major veins from leaves where the main function is the transfer of amino acids from xylem to
phloem (Zhang et al., 2010).
Studies in pea (P. sativum) by overexpression of the AAP1 gene carrying the promoter from
Arabidopsis showed similar amino acid content as the model plant. Zhang et al., (2015) developed
two transgenic pea lines overexpressing the AAp1 genes. Total free amino acid content was
tremendously increased to 232% in pea. Individual amino acids content was analysed showing
increments above 100% for all the measured amino acids. Furthermore, comparison between the
pod phloem and leaf sap exudates revealed a constant increase in free amino acids content higher
than 190%. It was demonstrated that AAP1 transgenic pea plants had an enhanced phloem loading
capacity suggesting a role in transfer and delivery of amino acids to seeds by AAP1 genes.
Additionally, seed protein content was also tested resulting in an increment of up to 8% in total N
content and soluble protein was also improved in overexpressing AAP1 pea plants (Zhang et al.,
2015). AAP genes have been described to influence the protein content in pea at a great extent.
Potato might be also affected in a similar fashion as in pea since the accumulation of free amino
acids in the whole pea plants was increased. Differences in the allocation of proteins in seeds of
pea and tubers in potato may assist to address the impact of AAP genes in potato. Although the
results obtained from overexpressing AAP genes in pea provided great insight on the main roles
and function of AAP, similar approaches would serve to clarify the roles of AAP genes in potato.
Lastly, enhanced accumulation of amino acids in stems and leaves can be expected to happen in
potato. Of course, the influence of AAP genes in potato should not be anticipated nor considered
to be as influencing as reported in pea.

15
2 Materials and Methods cDNA from potato roots and tubers of cultivar Kardal were used for amplification and cloning of
the candidate genes through the Polymerase Chain Reaction (PCR). cDNA synthesis was
performed. Specific primers were design for different purposes such as amplification of the
candidate genes and colony PCR. High fidelity enzymes were used to amplify the genes from the
different cDNA sources. The cloning strategy relies on the Gateway® system from Thermo Fisher
Scientific which consists of a donor and destination vectors (pENTR™ TOPO® vector and
destination vector PK7GW2.0). The destination vector was later cloned into Agrobacterium AGL1
strain cells to complete Agrobacterium-mediated transformation. DNA recovery from gel
electrophoresis was performed to clean and purify DNA required for the different cloning steps
(DNA Clean & Concentrator kit from QIAGEN, Zymoclean™ Gel DNA Recovery Kit from
ZYMORESEARCH). Antibiotics were added for selection of bacterial colonies from the different
cloning approaches (Appendix 8.3). The different PCR reactions were performed using
GeneAmp™ PCR System 9700, GeneAmp™ PCR System 2700 and Veriti® 96-Well Thermal Cycler
machines from Thermo Fisher Scientific. Gel electrophoresis was performed with 1%, 1.5% or 2%
Agarose concentration in TAE buffer, depending on the size of the expected gene fragment to be
amplified. The larger the size of the gene fragment, the lower Agarose concentration used for
electrophoresis. Potato plants of cultivar Kardal were multiplied and grown for Agrobacterium-
mediated transformation aiming the creation of transgenic lines.
cDNA synthesis 2.1
The cDNA used to amplify the genes was obtained by cDNA synthesis using RNA from different
potato plant parts such as leaves, stems or tubers from cultivar Kardal. DNAse treatment was
required for the RNA to avoid any DNA contamination during the process before performing
cDNA synthesis. The DNAse treatment was done by adding 1 μg of RNA, 1 μl of a 10X DNAse I
reaction buffer, 1 μl of DNAse I and milli-Q water up to a final volume of 10 μl. The mixture was
kept at room temperature (~20 °C) for 15 minutes. Next, 1 μl of EDTA (25 Mm) was added to the
mixture and placed at 65 °C for 1o minutes. cDNA synthesis was performed according the protocol
iScript™ cDNA Synthesis Kit from BIO-RAD: 11 μl RNA (DNAse treated) followed by 4 μl 5x iScript™
reaction Mix, 1 μl iScript™ reverse transcriptase and finally 4 μl RNAse free water to a final volume
of 20 μl. The mixture was placed in a PCR machine programmed as follows: 5 minutes at 25 °C,
followed by 30 minutes at 42 °C, 5 minutes at 85 °C, 5 minutes at 4 °C, 5 minutes at 85 °C and finally
the reaction was held at 10 °C. The cDNA was tested using Dream Taq polymerase PCR.
For cloning purposes, it was aimed to amplify the full length of the gene of interest or the Open
Reading Frame (ORF). Specific primers were developed and tested beforehand. Amplification of
the gene fragments was achieved by using high fidelity enzymes for PCR (Phusion® or
Advantage® 2 PCR kits were used). Amplified gene fragments were confirmed in gel
electrophoresis from the PCR and purification of the DNA was performed. Two approaches for
DNA recovering and purification were used: a) DNA recovery from gel (MinElute® Gel Extraction
Kit from QIAGEN or Zymoclean™ Gel DNA Recovery Kit from ZYMORESEARCH); b) DNA
purification directly from PCR (DNA clean & concentrator kit ZYMORESEARCH). Both procedures
aimed to remove traces of the primers used for amplification and any other kind of

16
contamination. Finally, pure DNA was verified by measuring its concentration with a NanoDrop
ND-1000 spectrophotometer (NanoDrop Technologies). DNA concentration lower than 15 ng/μl
were not used for cloning into the pENTR™ TOPO® vector.
Primers design and testing 2.2
Most of the primers used during the project were developed by Dianka Dees at an earlier stage of
the process. Design of the primers was done using available online platforms from NCBI designing
primers tool, Primer3 (version 4.0) and PrimerPlus software. The transcript sequence of each
gene was used within these platforms to first identify the ORF of each gene. The different primers
combination was selected and tested in silico for primer pair dimers formation, hairpins structure
and the interaction between the forward and reverse primers using DNASTAR® Lasergene 13
software. A minimum of 20 nucleotides per primer was stablished as selectable for both Forward
and Reverse primers. Primers contained at least 50% of GC nucleotides, however, some primers
were selected when containing less than 50% GC but higher than 40% GC content. The melting
temperature was set at 55C as minimum and preferably higher than 60C. Higher melting
temperatures aimed to allow specificity of the Advantage® 2 PCR and Phusion® enzymes used for
amplification of the genes. Additionally, a CACC nucleotide sequence was added at the end of the
5’ end of the forward primers intended to amplify the genes for cloning in the pENTR™ TOPO®
vector (Table 1). The primers were synthetized by Biolegio B.V. (The Netherlands) and tested
afterwards with PCR. The best primer pair working combination were then selected for the
following steps.
Gateway® cloning system 2.3
The Gateway® cloning system uses
Escherichia coli plasmids for recombination
and transformation of the genes of interest.
Two type of bacterial cells can be used for
cloning: a) Chemically Competent E. coli
cells and; b) Electrocompetent E. coli cells.
Cloning and transformation protocols are
different depending on what kind of cells
were used for transformation. The system
relies on recombination of attachment sites
from a donor pENTR™ TOPO® vector (attL1
and attL2) with the attachment sites from a
destination vector PK7GW2.0 (attR1 and
attR2), mediated by the LR Clonase™ II
enzyme mix from Invitrogen®. First, the
gene of interest is cloned in between the
attachments sites in the pENTR™ TOPO®
vector (e.g. NRT gene, Figure 1) whilst a
ccdB gene is contained in between the
Figure 1. in-silico pENTR™ TOPO® vector containing the NRT gene built up with the DNASTAR® Lasergene 13 software.

17
attachment sites of the destination vector
PK7GW2.0 (Figure 2). Selection after
cloning in the pENTR™ TOPO® vector was
performed under plates containing
Kanamycin. The Gateway® system is
specific and allows recombination only of
attL1 with attR1 and only attL2 with attR2
(known as “LR cloning”). Therefore, the
gene of interest was integrated into the
destination vector PK7GW2.0 by exchange
of the ccdB gene and the gene of interest.
Selection after LR cloning and
transformation procedure was done under
plates containing Spectinomycine. Only
the bacterial plasmids containing the gene
of interest in the destination vector were
able to grow under Spectinomycine.
Cloning and transformation procedures
were carried out according the manufacturer’s protocols with some modifications.
Manufacturer’s originals and modified protocols for cloning into the pENTR™ TOPO® vector, LR
cloning and transformation procedures are detailed in Appendix 8.4. The colonies grown from the
LR reaction were confirmed by colony PCR. Furthermore, positive colonies from colony PCR were
subjected to pDNA isolation used to verify the insertion of the gene by sequencing. Confirmed
colonies from the destination vector were cultured and used for transformation to A. tumefaciens.
Agrobacterium tumefaciens 2.4
A. tumefaciens is a Gram-negative bacterium that has the ability to transfer and integrate a small
part of its own DNA to a limited number of plants. The transferred DNA from A. tumefaciens is
known as Ti-DNA because its excessive cellular growth inducing capacity which causes tumour
formations to infected plants. This is a natural occurring event being used by scientist for research
purposes at a great extent. It has been possible to replace this Ti-DNA with potentially any gene
and genetics studies have been speeded up since then. Currently, Agro-infiltration is a common
practice to scientists studying the effects of genes all around the globe and its procedure has
been standardized. Due to the relatively accurate and easy procedure for A. tumefaciens infection,
we have selected this method to create transgenic plants containing our genes of interest.
Agrobacterium tumefaciens AGL1 strain 2.4.1
A. tumefaciens strain AGL1 (Lazo, et al., 1991) was used for cloning the destination vector from the
Gateway® cloning system containing only one gene of interest per transformation. AGL1 strain
competent cells lacks the Ti-DNA fragment of natural Agrobacterium cells, however it carries on a
resistance gene to Carbenicilin which is meant for selection after cloning. Spectinomycine was
incorporated to the medium which allowed selection of the plasmids containing the genes of
interest from the destination vector. Additionally, Chloramphenicol was used to prevent
undesired colonies to grow from Agrobacterium plasmids carrying vir genes which are used to
Figure 2. PK7WG2.0 binary vector Gateway® System for Agrobacterium-mediated plant transformation (Karimi, M. et al, 2002).
18
check the viability of the AGL1 Agrobacterium plasmids. The expression vector was cloned to
Agrobacterium by electroporation. Once the expression vector was cloned to Agrobacterium, the
bacterial plasmids were cultured and selected in LB medium containing Carbenicilin,
Spectinomycine and Chloramphenicol.
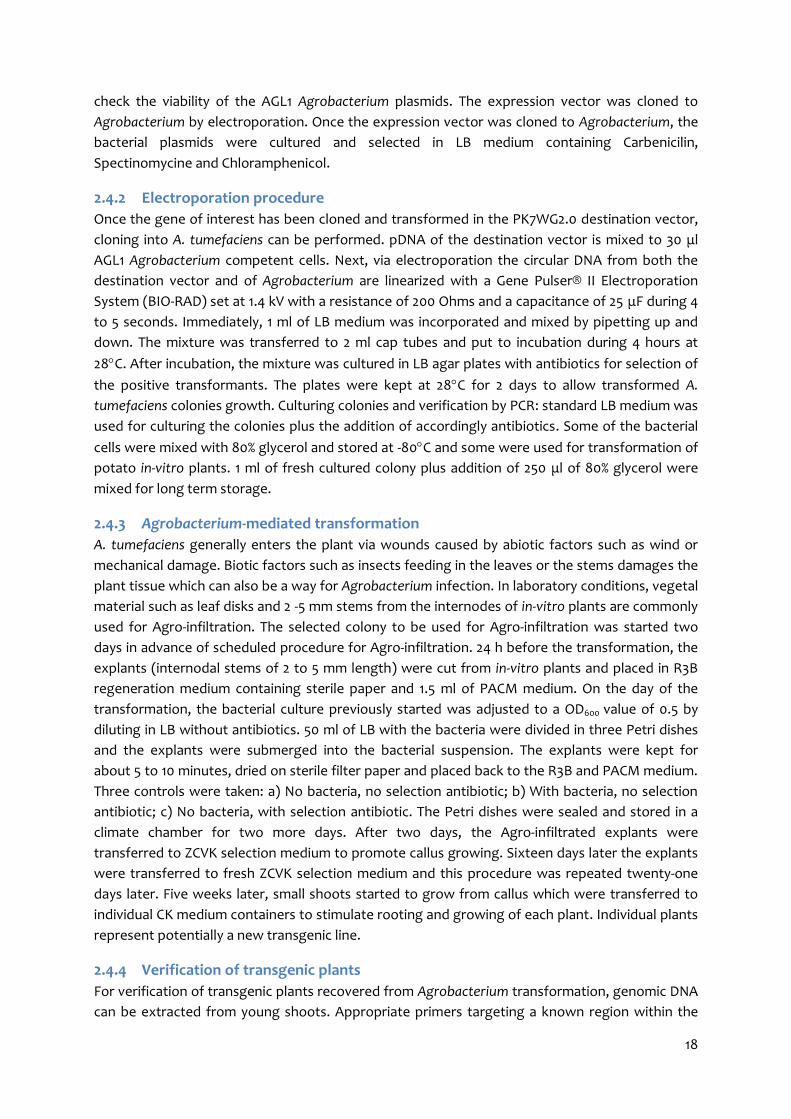
Electroporation procedure 2.4.2
Once the gene of interest has been cloned and transformed in the PK7WG2.0 destination vector,
cloning into A. tumefaciens can be performed. pDNA of the destination vector is mixed to 30 μl
AGL1 Agrobacterium competent cells. Next, via electroporation the circular DNA from both the
destination vector and of Agrobacterium are linearized with a Gene Pulser® II Electroporation
System (BIO-RAD) set at 1.4 kV with a resistance of 200 Ohms and a capacitance of 25 μF during 4
to 5 seconds. Immediately, 1 ml of LB medium was incorporated and mixed by pipetting up and
down. The mixture was transferred to 2 ml cap tubes and put to incubation during 4 hours at
28C. After incubation, the mixture was cultured in LB agar plates with antibiotics for selection of
the positive transformants. The plates were kept at 28C for 2 days to allow transformed A.
tumefaciens colonies growth. Culturing colonies and verification by PCR: standard LB medium was
used for culturing the colonies plus the addition of accordingly antibiotics. Some of the bacterial
cells were mixed with 80% glycerol and stored at -80C and some were used for transformation of
potato in-vitro plants. 1 ml of fresh cultured colony plus addition of 250 μl of 80% glycerol were
mixed for long term storage.
Agrobacterium-mediated transformation 2.4.3
A. tumefaciens generally enters the plant via wounds caused by abiotic factors such as wind or
mechanical damage. Biotic factors such as insects feeding in the leaves or the stems damages the
plant tissue which can also be a way for Agrobacterium infection. In laboratory conditions, vegetal
material such as leaf disks and 2 -5 mm stems from the internodes of in-vitro plants are commonly
used for Agro-infiltration. The selected colony to be used for Agro-infiltration was started two
days in advance of scheduled procedure for Agro-infiltration. 24 h before the transformation, the
explants (internodal stems of 2 to 5 mm length) were cut from in-vitro plants and placed in R3B
regeneration medium containing sterile paper and 1.5 ml of PACM medium. On the day of the
transformation, the bacterial culture previously started was adjusted to a OD600 value of 0.5 by
diluting in LB without antibiotics. 50 ml of LB with the bacteria were divided in three Petri dishes
and the explants were submerged into the bacterial suspension. The explants were kept for
about 5 to 10 minutes, dried on sterile filter paper and placed back to the R3B and PACM medium.
Three controls were taken: a) No bacteria, no selection antibiotic; b) With bacteria, no selection
antibiotic; c) No bacteria, with selection antibiotic. The Petri dishes were sealed and stored in a
climate chamber for two more days. After two days, the Agro-infiltrated explants were
transferred to ZCVK selection medium to promote callus growing. Sixteen days later the explants
were transferred to fresh ZCVK selection medium and this procedure was repeated twenty-one
days later. Five weeks later, small shoots started to grow from callus which were transferred to
individual CK medium containers to stimulate rooting and growing of each plant. Individual plants
represent potentially a new transgenic line.
Verification of transgenic plants 2.4.4
For verification of transgenic plants recovered from Agrobacterium transformation, genomic DNA
can be extracted from young shoots. Appropriate primers targeting a known region within the

19
construct can be used for screening plants using the PCR. Dream Taq polymerases can be used to
check the construct depending on the gene fragment we expect. Once a positive fragment is
observed in gel, the assessed plants can be said to be effectively transformed and further
experiments can be started. Experiments such as gene expression analysis, phenotyping and
growing performance are to be followed. However, this thesis was limited to design the primers
to verify the presence of the constructs.
Medium and standard procedures 2.5
Medium for culturing and selecting bacterium colonies 2.5.1
Growing and maintaining bacteria is essential for the different cloning steps since plasmid DNA
from E. coli and A. tumefaciens were used within different stages of the cloning strategy.
Lysogeny broth (LB) standard medium was used to culture both E. coli and A. tumefaciens from
the different cloning steps. LB liquid medium was used to grow selected colonies in tubes to
perform plasmid DNA isolation (pDNA). The LB liquid medium contained 20 grams of LB medium
dissolved in 1 litre of demineralized water. LB agar solid medium was used to culture bacteria in
plates after transformation. LB solid medium contained 20 grams of LB medium + 1.5% of Agar
bacteriological dissolved in 1 litre of demineralized water. All the different medium was sterilized
by autoclaving at 121C during 18 minutes, cooled down and stored at room temperature for liquid
medium and at 4C for solid medium. Additionally, antibiotics were incorporated to the medium
depending on the resistance gene of the pENTR™ TOPO® vector, the destination vector and the
A. tumefaciens strain used for the cloning procedure and selection after transformation.
Murashige & Skoog (4405.19 mg/l) + Vitamins (4.4 g/l) known as MS20 medium was used to
multiply the potato plants from in-vitro material to further use them in Agro-infiltration
procedure. MS20 medium mixture contained the following reagents in 1 litre of demineralized
water: 20 grams Sucrose, 8 grams Micro Agar (Duchefa Biochemie B. V.). The pH was stabilized at
5.8 by adding KOH when the pH was lower and HCl when it was higher than 5.8. For regeneration
of potato plants after transformation by Agro-infiltration, specific medium was used. LB liquid
medium with low concentration in salt was used to adjust the OD600 of the A. tumefaciens
bacterial culture. This medium contained 20 grams of LB low salt in 1 litre of demineralized water.
R3B medium was meant to stimulate the explants just after Agro-infiltration and contains in 1 litre
of demineralized water: 4.4 grams MS + vitamins, 30 grams Sucrose, 8 grams Agar bacteriological,
2 milligrams NAA and 1 milligram BAP.
PACM liquid medium was also used during transformation procedure and contained the
following: 4.4 grams MS + vitamins, 2 grams Caseine hydrolysate, 30 grams Sucrose, 200 μl2,4D (1
mg/l), 0.5 ml Kinetine (0.5 mg/l) and stabilized at pH 6.5. ZCVK medium was used for regeneration
and selection after Agro-infiltration in order to promote the growth of callus from transformed
explants. ZCVK medium contained 4.4 grams MS, Sucrose 20 grams, Agar bacteriological 8 grams,
Zeatine 1 milligram, Cefotaxime 200 milligrams, Vancomycine 200 milligrams and Kanamycin 100
milligrams per 1 litre of demineralized water. Lastly, CK medium containing 4.4 grams MS, 20
grams Sucrose, 8 grams Agar bacteriological, Cefotaxime 200 milligrams and Kanamycin 100

20
milligrams was used to continue with individual shoots regenerated from callus after
transformation.
Colony PCR 2.5.2
From the transformation procedures, a couple of colonies were picked up for analysis by colony
PCR with Dream Taq polymerase. Specific primers were used to confirm the presence of the gene
of interest in the colonies (Table 1). A toothpick was used to take a small portion of each colony
and placed for a few seconds in the PCR wells. After a few seconds, the toothpick was transferred
to 3 ml LB liquid with antibiotics and kept at 37C with shaking overnight. Culturing the bacteria
was done to obtain higher amounts of plasmid to further extract pDNA. The addition of
antibiotics depended on the origin of the cultured bacteria.
Plasmid DNA isolation 2.5.3
After culturing the bacteria in LB liquid medium, pDNA isolation was performed to use the
isolated pDNA in the following steps. Two methods were used to extract pDNA from bacterial
cultures: a) QIAprep® Spin Miniprep kit from QIAGEN and, b) Plasmid isolation from E. coli
protocol “Eric’s modification of original Birnboim method” (Appendixes 8.4.4 and 8.4.5
respectively). Both methods aimed to obtain pure pDNA for the different cloning steps. The
QIAprep® Spin Miniprep kit from QIAGEN provides clear instructions and supplies materials to
carry out the pDNA extraction which ensures the pDNA to be pure. However, the concentration
of DNA obtained with this method was usually low since high amounts of DNA are lost during the
filtering steps. The “Eric’s modification of original Birnboim method” in the other hand is more
rudimentary and has the advantage of recovering considerably more pDNA compared to the
QIAprep® Spin Miniprep kit.
Sequencing 2.5.4
After successful pDNA isolation, the samples containing the DNA both from the gene of interest
and the pENTR vector were confirmed by sequencing before continuing with further steps. The
Laboratory of Plant Breeding relies on the GATC BIOTECH sequencing service (https://www.gatc-
biotech.com/en/index.html). Each pDNA sample sent for sequencing normally contained 200, 400
or 500 ng of pDNA, 2.5 μl of only one single primer and milli-Q water up to a final volume of 10 μl
per sample. Once the results are ready, the DNA samples and a reference sequence belonging to
each gene of interest were aligned and checked for quality using the DNASTAR® Lasergene 13
software. Sequencing does not always work as desired due to different factors despite the fact
that the procedures are standardized. When the results from sequencing are not conclusive,
other methods may lend a hand to verify that the gene of interest has been cloned into the
vector.
Enzymatic digestion 2.5.5
Alongside DNA sequencing, verification for the presence of a gene can be done via enzymatic
digestion. Software and tools such as DNASTAR® Lasergene 13 served to identify the enzymes
that best suits our objectives. A set of different characteristics and features from DNASTAR®
Lasergene 13 made possible to integrate our gene of interest with the vector which was used for
cloning. An in-silico cloning approach containing the pENTR™ TOPO® vector and our genes of
interest were used as template to obtain the restriction enzymes. Amongst the parameters
facilitated by DNASTAR® Lasergene 13 software, unique cutting sites of the enzyme and six plus

21
cutters were considered for selection of the enzymes. AscI and ClaI enzymes were used for DNA
digestion to validate the presence of the STR gene after several attempts to clone the gene into
the pENTR™ TOPO® vector.
Table 1. List of relevant primers used during the project for different purposes.
5' - 3' SEQUENCE† CODE Cloning Amplification
Colony PCR
Gene presence
Sequencing
TCATTACATCATTCTACTTCCCCGTAGCAGA Pr13R1 + + caccACAGTAAATGGGCTGAAGACGAC Pr27F1 + + GGGCAAACCTGGCTCAAATC Pr29R1 + + GTGTTCTTAGCCCTGCTGTATCCT Pr40F1
+ +
CCCTGCCTTATAAACTCCACTCC Pr41R1
+ + TTAACCTTCCTCTTCTTTGATGATAACTTCA Pr09R2 +
CCACACCCTGTCCATTTTCTCAATAG Pr12R2 + caccGGCAGGGGGATTAGCAAATGA Pr35F2 + caccATGGCAGGGGGATTAGCA Pr36F2 + CCAAAACCTTCTCTTAACATCTTCT Pr37R2 + caccTCATTTGCAAACATGGTTTCATCTTCTC PR04F3 + +
TCAAATGTATTCTTCATGAATAGAACTCATAGG Pr05R3 + + TCATGAATAGAACTCATAGGAGGATGAATCAGC Pr06R3 + + ATTAGGATTGTTCCAAGCAGGTG Pr23F4
+
+
TCAGGATCTTCAATCATACAGGCTCT Pr24R4
+
+
caccTGTAAAAAAATGGAAGAAAATAGAGTTATAGATA PR18F5 + TCAAACATGTTCTGGTAGTTGATACTTTACAGT Pr19R5 + AGAACCAAATAGAATTACAAAGCTTATACAATAGAA Pr20R5 + CTGAAGGAATTGCAGTGGGGAGG Pr21F5
+
+
AGGGATGTCGATAAGTCCAATAACAGC Pr22R5 + +
GTAAAACGACGGCCAG M13F6 +
CAGGAAACAGCTATGAC M13R6 + †5’ - 3’ sequences are all shown in forward strand. + Indicates for what purpose the primers were used during the project. F=Forward primer; R=Reverse primer. 1Ethylene receptor gene primers. 2Hexose carrier protein gene primers. 3Lysine/histidine transporter gene primers. 4Nitrate transporter gene primers. 5Sulfate transporter and exchanger gene primers. 6Universal forward and reverse primers for sequencing from any vector containing the N-terminal coding sequence of the lacZ gene.

22
Figure 3. NRT Colony PCR with Dream Taq polymerase confirmation after transformation to A. tumefaciens. Primer pair Pr23F, Pr24R (163 bp). Numbers 1 to 10 are identifications for each selected colony.
3 Results
Cloning and Transforming the candidate genes 3.1
Experiments were performed aiming to amplify and clone the candidate genes into the Gateway®
cloning system which facilitates further cloning into A. tumefaciens. Four genes were subjected to
most of the experiments. Results of the Nitrate Transporter (NRT), Sulfate/bicarbonate/oxalate
exchanger and transporter (STR), Ethylene receptor (ETR) and Lysine/histidine transporter (LHT)
genes are presented and discussed. The Hexose carrier protein (HCP) and Amino acid permease
(AAP) genes were not amplified.
The nitrate transporter gene (NRT)
already cloned into the pENTR™ TOPO®
vector was the starting point. pDNA
isolation was performed resulting in two
samples (97.9 ng/μl and 122.7 ng/μl)
measured with a NanoDrop ND-1000
(NanoDrop Technologies) containing the
pENTR vector. Alongside, pDNA isolation of
the PK7GW2.0 binary vector was
performed (B3: 259.9 ng/μl; ANN: 277.9
ng/μl). Together, the pENTR plasmids and
the binary vector were used for the LR
cloning reaction. The resulting bacterial
colonies were cultured and selected in LB medium containing 200 μg/ml Spectinomycine. Primers
pair Pr23 with Pr24 (163 bp) shown in Table 1 and Figure 3 were used to verify positive colonies by
colony PCR after transformation. 12 colonies were then selected to perform the Forward
sequencing reaction (6 colonies from B3, 6 colonies from ANN). The 4 best resulting sequences
were then chosen to perform the Reverse sequencing reaction and Sanger alignment against the
reference transcript sequence of the NRT gene was performed. Sequencing results for the
selected colonies used for A. tumefaciens cloning showed a 100% match for the Forward
sequencing reaction and 98% match for the Reverse sequencing reaction. Together, the Forward
and Reverse sequencing reactions were able to cover the full transcript sequence of the NRT
gene. pDNA from these colonies was isolated and used for cloning into A. tumefaciens AGL1 strain
cells. Positive colonies from Agrobacterium cloning were able to grow in LB medium with 200
μg/ml Spectinomycin, 100 μg/ml Carbenicilin and 50 μg/ml Chloramphenicol as selection markers.
Confirmation of the positive colonies was done by PCR. One single colony was selected to
transform the potato plants via Agro-infiltration. Two weeks after Agro-infiltration, callus
formation was observed in explants placed under ZCVK selection medium, suggesting that the
transformation was successful. The controls were observed according to the expectations.
Control explants placed under ZCVK selection medium without A. tumefaciens showed a brownish
color and callus growth was not observed. Control explants inoculated with A. tumefaciens placed
under ZCV medium (no selection) presented callus overgrowth compared to explants under ZCVK
medium. Control explants placed under ZCV medium without inoculation of A. tumefaciens
presented poor callus growth and a light green color was observed. After five weeks from Agro-
infiltration, explants showing strong callus formation were kept and transferred to fresh selection

23
medium. 80 callus-growing explants were transferred to fresh ZCVK medium and 9 shoots were
transferred to individual containers with CK medium. The remaining explants stayed to allow
shoot growth aiming to recover a new potential plant. Each shoot was taken from a single callus
formation and represents a new possibly transgenic plant. 9 plants growing in individual
containers are ready to be checked for the presence of the NRT construct (Figure 7). Once the
NRT construct is confirmed in the plants, multiplication of the material can be performed to
continue with studies on the effects of expression of the gene.
STR 1808 bp gene fragment was amplified for cloning into the pENTR™ TOPO® vector. First, a
PCR using primer Pr18F with Pr20R (1990 bp) followed by a Nested PCR using primers Pr18F with
Pr19R (1808 bp) were performed to obtain enough product to continue with cloning into the
pENTR™ TOPO® vector. The transformation procedure after cloning in pENTR™ was carried out as
described in Materials and Methods. Primers pair Pr21F with Pr22R (310 bp) were used to confirm
the presence of the gene by colony PCR. The region covered by the primers used for colony PCR
targeted the positions 1013 bp to 1323 bp of the transcript sequence indicating that the gene
fragment indeed was present after cloning in the pENTR™ TOPO® vector. However, the number
of colonies obtained was low suggesting a poor transformation efficiency according to the
manufacturer. pDNA from three colonies was used for sequencing after the transformation
procedure using the primers Pr21F, Pr22R and the M13F and M13R universal primers from
Invitrogen®. 314 bp sequence resulted from pDNA samples with the M13F primer matching the
pENTR™ TOPO® vector and the STR transcript sequence (Sanger alignment, DNASTAR®
Lasergene 13). The first 86 bp belonged to the pENTR™ TOPO® vector (Figure 8). BLASTN analysis
with the remaining 228 bp sequence showed homology with a predicted STR 3.3 gene in S.
tuberosum, S. lycopersicum and other Solanaceae species. However, due to the short length of the
Figure 4. DNASTAR® Lasergene 13 partial output of the sequencing results from the NRT gene. The upper part in the figure shows the overlapping region of the two sequencing reactions in alignment with the reference transcript sequence of the NRT gene. Wavelength of the Forward and Reverse sequencing reactions give an indication of the quality of the sequence.

24
Figure 5. ETR cDNA amplification with Advantage® 2 PCR. Labels indicates the sample number and the primer pair producing a positive gene fragment. A = Pr27F, Pr13R. Samples 5A and 8A were recovered and purified to be used in the pENTR™ TOPO® cloning procedure.
Figure 6. LHT cDNA amplification with Advantage® 2 PCR. Labels indicates the sample number and the primer pair producing a positive gene fragment. B = Pr04F, Pr06R. All three samples were recovered and used for cloning in the pENTR™ TOPO® vector.
sequence it was not possible to confirm the presence of the gene from pDNA samples.
Verification for the presence of the gene must be done before continuing with cloning into the
destination vector.
Ethylene receptor (ETR) gene fragments of 2323 bp length were amplified from eight different
cDNA sources. Five positive bands were
observed in gel after performing
Advantage® 2 PCR and isolating from the
five positive samples. Two samples (5A:
35.1 ng/μl and 8A: 40.0 ng/μl, Figure 5) with
the highest DNA concentration were used
to perform the pENTR™ TOPO® cloning
reaction. Colony PCR results after TOPO®
transformation showed no presence of the
gene in any of the cloning reactions.
Several attempts to amplify the gene from
PCR using Advantage® 2 and Phusion® PCR
enzymes resulted in positive gene
fragments. However, weak gene fragments
were commonly found from the different PCR reactions. In addition, Advantage® 2 enzymes
seemed to be more compatible with the ETR gene than Phusion® enzymes since the clearest gene
fragments were found when Advantage® 2 enzymes were used. Aiming to obtain stronger gene
fragments from the PCR, gradient PCR was performed using Advantage® 2 PCR with primers
Pr27F and Pr13R (2323 bp). Weak gene fragments were observed in gel which led to increase the
number of cycles in the annealing phase (increased from 30 to 35 and 40 cycles). This produced
stronger bands (Figure 5) from five cDNA samples that were then recovered from gel using the
Eric’s modification method. After a couple of attempts to clone the gene in the pENTR™ TOPO®
vector with no success, further attempts to clone the ETR gene were not continued.
Lysine/histidine transporter (LHT) gene
fragments of 1351 bp were amplified from
PCR using Advantage® 2 enzymes. The
first attempt to retrieve the gene was
resulted in a weak signal observed in gel
after performing Advantage® 2 PCR
reaction. Next, eight different cDNA
sources were tested each one with two
primers combination (Pr04F, Pr05R -1364
bp and Pr04F, Pr06R -1351 bp). Three gene
fragments (Figure 6) were observed from
primer pair Pr04F with Pr06R. second
attempt with these gene fragments was
performed. DNA was recovered from the
second Advantage® 2 PCR reaction, however, the concentration of DNA from the three samples
were below 4 ng/μl. Third and fourth attempts with Phusion® PCR and Advantage® 2 PCR
respectively were carried out. Unfortunately, no gene fragments were observed after performing

25
these PCR reactions. Additionally, primers for cloning purposes and colony PCR to confirm the
presence of the gene were developed. Internal primers were not tested since DNA concentration
was not high enough to continue with cloning into the pENTR™ TOPO® vector.
Hexose carrier protein (HCP) gene is a small sized gene (237 bp based on transcript sequence
from the Spud DB for potato) and primers were mainly developed for cloning purposes and no
internal primers are available for this gene. First, Dream Taq polymerase PCR was used to amplify
a gene fragment with primer combinations Pr36F with Pr37R (199 bp), Pr36F with Pr09R (236 bp),
Pr35F with Pr37R (197 bp) and Pr36F with Pr12R (164 bp). Amplification of the gene fragment was
not possible since no bands were observed from the PCR reactions. Next, Phusion® enzymes
were used to attempt amplification of the gene fragments with the same primer combinations
used for Dream Taq polymerase. However, no bands were observed in a 2% Agarose gel after the
PCR reactions. Consequently, following steps within the cloning strategy were not performed.
Development of internal primers still needs to be done and will be useful to check for the
presence of the gene after TOPO® cloning and transformation procedures.

26
Figure 7. Chronological stages of A. tumefaciens-mediated transformation in potato. a) in-vitro plants used to obtain the explants for Agro-infiltration. b) Internodal stems 2 to 5 mm length inoculated with A. tumefaciens containing the NRT gene. c) Explants showing no callus formation after Agro-infiltration. d) Explants showing callus formation after Agro-infiltration. e) Five weeks after Agro-infiltration explants showing shoot growth. f) Seven weeks after Agro-infiltration shoots growing from callus ready for transferring to individual CK medium containers. g) & h) Small kanamycin resistant plants ready to be tested for the presence of the NRT construct.

27
Figure 9. The STR sequence was split and aligned against the in-silico sequence of the STR gene cloned with the pENTR™ TOPO® vector. Minimum match percentage for assembly was 60%. 1. Sample sequence of the pENTR™ TOPO® vector matches the end of the pENTR™ TOPO® vector (50 bp). 2. STR sequence aligned against the in-silico sequence of the STR gene cloned with the pENTR™ TOPO® vector matches with the STR transcript sequence (184 bp). Primer M13F was used for sequencing the 41JC58_G01 STR sample.
1
2
Figure 8. STR sequence results from pDNA after TOPO® transformation. The 314 bp sequence length was divided in the sequence from the pENTR™ TOPO® and from the STR gene. Highlighted in yellow: sequence of the pENTR™ TOPO® vector (86 bp). Highlighted in green: sequence of the STR transcript sequence (228 bp).

28
4 Discussion Cloning and transformation procedures for the NRT gene were carried out straight forward since
each step ran efficiently. Amplification of the expected gene fragments from the different PCR
setups was always possible. Maintenance of the bacteria carrying the NRT gene was an important
step to perform the Agro-infiltration process and was executed without complications. This gene
seemed to be very friendly for cloning and all further steps in colony PCR, pDNA isolation,
sequencing and cloning to Agrobacterium were executed smoothly. As shown in Figure 4, the gap
observed in the Reverse sequence and the NRT transcript and the addition of the nucleotide in
the Forward sequence are contradictory. Usually, the quality and accuracy of the data tend to be
lower at the beginning and the ends of the expected sequences causing misinterpretation of the
software used to sequence. Lastly, Agro-infiltration and the generation of potential transgenic
plants carrying the transformed NRT gene were successful. Positive plants were shown to be
Kanamycin resistant since they were able to grow after Agro-infiltration under ZCVK selection
medium. Small plants continue growing in a climate chamber to be confirmed for the presence of
the NRT construct. Genomic DNA extracted from young leaves and specific primers to verify the
presence of the construct remained to be performed. Afterwards, gene expression analysis
studies can be started from positive transformants. Generally, all the procedures for the NRT gene
worked out easily and according to schedule.
In contrast, the STR gene was difficult to clone since several attempts were required to obtain a
partial confirmation into pENTR™ TOPO® vector. Amplification of the gene was successful and
pDNA isolation resulted in enough DNA concentration for cloning. Despite that the cloning and
transformation procedures were performed according the manufacturer’s protocol, the results
obtained were not as expected. Usually, the pUC19 DNA used as the control yielded less number
of colonies than indicated by the manufacturer and low number of STR colonies were observed
after transformation. A new purchased cloning kit from Invitrogen® was and used with the STR
gene resulting in high number of colonies in the pUC19 DNA plates but low number of colonies
from the STR gene, suggesting a problem in the cloning and transformation events. Whether the
cloning step or the transformation procedure were the cause of the low number of colonies
obtained after the process needs to be elucidated. Nevertheless, positive STR colonies confirmed
by colony PCR were cultured for pDNA isolation were later sent for sequencing. Commonly,
sequences obtained from STR pDNA samples resulted in short sequences or bad quality data.
Additionally, the amount of pDNA sent for sequencing was varied (200, 400 and 500 ng) aiming to
obtain better sequencing results. Finally, sequencing results from 200 ng of sample 41JC58_G01
(Figure 9) revealed the presence of the pENTR™ TOPO® vector and part of the STR gene. The
sequence aligned with the STR gene showed homology with a predicted STR 3.3 gene from
potato and other Solanaceae species. However, these results were not conclusive and verification
for the presence of the STR gene in the pENTR™ TOPO® vector remains to be done.
Amplification of the gene fragments from the ETR and LHT genes was successful after several
attempts. Nevertheless, complications were faced during the experiments such as weak
fragments observed in gel for both ETR and LHT genes. First, the utilization of different PCR
machines may have influenced the results from the PCR reactions, despite the fact that the
reagents and procedure remained the same. Differences in the inner temperature of the PCR

29
machine may play a role in the different results obtained when trying to amplify any gene
fragment. Additionally, storage of the genetic material may influence the results since DNA is
stored at -20C and goes through a thawing-freezing step as for many times as the material was
being used. Regardless that DNA was always kept on ice after thawing, repeated thawing-
freezing-thawing manipulation may have influenced the quality of the DNA and consequently the
results. Furthermore, a test with internal primers used also for colony PCR was performed to
check the viability of the cDNA. The gene fragments observed in gel were positive according the
expected size, suggesting that DNA viability was good.
To contrast the results from DNA viability testing, cDNA synthesis was performed using the
iScript™ cDNA Synthesis Kit from BIO-RAD. Verification of the new cDNA was done by
Advantage® 2 PCR with primers used for colony PCR from the STR gene (Table 1). However,
amplification attempts of the STR, ETR and the LHT genes did not produce any of the expected
gene fragments from PCR. One possible explanation for these results would be the time of
storage of the RNA used for synthesis. When RNA is kept for a long period even under optimal
storage conditions, it may happen that the RNA partially degrades and some genes still may be
present. Therefore, some gene fragments can indeed be amplified after PCR. Alternatively,
testing the RNA before performing cDNA synthesis would be useful to estimate the status of the
material. In this way, several resources and time can be used more efficiently and in a more
precise manner. Lastly, if the RNA source is not good to continue with cDNA synthesis, new RNA
must be obtained from fresh potato plant parts such as leaves, stems, roots or tubers depending
on the purpose of the research. The cDNA synthesis should work smoothly if the protocol is
followed as recommended by the manufacturer. Verification by Dream Taq polymerase PCR as
well as Advantage® 2 or Phusion® PCR should yield enough PCR product to continue with either
DNA recovery from gel or DNA purification from PCR.
Finally, it would be advisable to keep the gene amplification and cloning processes using the same
instruments. The same holds for DNA material used for amplification of the genes and cloning
approaches. However, no real prove of the influence of performing the PCR reactions in different
machines or different DNA material can be assessed within the experience of this work.
Overcoming weak gene fragments from PCR can be addressed by testing different enzymes for
PCR since Advantage® 2 and Phusion® enzymes were found to work different for each gene.
Besides the type of enzymes used for amplification, the PCR setup also influenced the results
observed for ETR and LHT genes. Increasing the number of cycles to 40 during the annealing
phase resulted in stronger gene fragments of the ETR and LHT genes (Figure 5 and Figure 6
respectively). Additionally, Nested PCR was also useful to obtain stronger gene fragments from
the STR and ETR gene. Moreover, cloning and transformation complications seemed to be
improved when a ratio 3:1 (PCR ptoduct: pENTR™ TOPO® vector) was used for difficult genes such
as the STR and ETR. Whereas cloning and transformation problems may be overcome, the purity
of the pDNA sent for sequencing can also influence the results. In that sense, a combination of
the two methods used to extract pDNA was performed from STR bacterial cultures to minimize
the factors for the presented results. Higher amounts and highly pure pDNA were achieved from
the combination of pDNA extraction methods. Nevertheless, cloning requires the integration of
several steps and only a proper planning and the use of the same materials and methods may lead
to elucidate whether the unexpected results would be the product of one or more factors
effecting the experiments.

30
5 Conclusion Cloning and transformation of the candidate genes was the main objective of this thesis which
aimed to generate the starting material to study the protein content in potato. The cloning
approach was based on the PCR with high fidelity enzymes and the Gateway® cloning system.
Transformation of potato plants was performed by Agrobacterium-mediated transformation.
Kanamycin resistant plants are available to be tested for the presence of the NRT construct by
PCR using genomic DNA. New potential transgenic lines can be subjected to gene expression
analysis to assess the effect of the NRT gene in these plants. Further research with the NRT gene
will be determined depending on verification of the construct and gene expression analysis. The
STR gene was partially confirmed in the pENTR™ TOPO® vector remaining to be verified before
performing LR cloning and further steps. The ETR and LHT gene fragments were amplified from
PCR staying in the first stage of the process after several attempts to amplify the respective gene
fragments. HCP and AAP genes were not amplified from cDNA. Cloning genes from cDNA can be
laborious and time consuming, therefore, proper planning and awareness of the measurements
to be considered to achieve the objectives can speed up the process.
6 Recommendations The study of homolog genes in other crops may be helpful to understand the role of the genes in
potato. Various genes have several functions in other crops such as NRT genes in wheat and
Arabidopsis functioning not only in the transport of nitrate but also in signalling functions as
described previously. Similarly, ETR genes in plants have been described in relation to signalling
roles during interaction with pathogens and have been also described to be important in the
maturity and senescence of plants. It would be particularly interesting to study the effect of the
AAP genes in potato, since long distance mobilization of amino acids from source to sink tissue
may play a key role in the allocation of proteins in potato. Difficult genes to clone such as the STR
may be feasible to study by looking to alternatives such as the Arabidopsis homologs. The STR
gene from Arabidopsis are cloned into the pENTR™ TOPO® vector and they are available for
research purposes (Michiel Klaassen, personal communication). The process might be speeded up
by using the genes from the model plant and the first functional studies can be performed. Similar
approaches may be available for other genes and other options still need to be considered.
Although all the procedures are standardized in molecular cloning, a more precise way to work in
the laboratory is advisable. For example, limit to the use of one PCR machine for amplification of
the gene fragments. Long-time stored kits may have reduced its cloning and transformation
efficiency. Differences were noticed when a new cloning kit was purchased from Invitrogen®, as
the control plates contained considerably larger amounts of colonies from the pUC19 DNA than in
previous experiments, suggesting that storage time may affect the efficiency of the reagents.
Since the costs of the different kits and reagents used in the laboratory are expensive, it is
recommended to particularly test the primers for amplification of the gene fragments
beforehand. Finally, the different steps to clone and transform the genes are relatively easy to
follow, nonetheless, adaptations need to be done depending on laboratory conditions.

31
7 References Abdin, M. Z., Akmal, M., Ram, M., Nafis, T., Alam, P., Nadeem, M., Khan, M. A., Ahmad, A. (2010).
Constitutive expression of high-affinity sulfate transporter (HAST) gene in Indian mustard showed
enhanced sulfur uptake and assimilation. Springer – Protoplasma, 248:1, 591–600. DOI
10.1007/s00709-010-0216-7.
Alting, A. C., Pouvreau, L., Giuseppin, M. L. F., & van Nieuwenhuijzen, N. H. (2011). Potato proteins.
Handbook of Food Proteins (Vol. 2008). Woodhead Publishing Limited.
http://doi.org/10.1016/B978-1-84569-758-7.50012-5
Atanassova, R., Leterrier, M., Gaillard, C., Agasse, A., Sagot, E., Coutos-Thévenot, P. & Delrot, S.
(2003). Sugar-Regulated Expression of a Putative Hexose Transport Gene in Grape. Plant
Physiology, 131:1, 326-334. doi: http://dx.doi.org/10.1104/pp.009522.
Barsan, C. (2016). A new Approach for the Potato Processing Industry. Chapter 22 – Potato
Proteomics. Advances in Potato Chemistry and Technology (Second Edition). Academic Press,
Elsevier Inc. Doi: 10.1016/B978-0-12-800002-1.00022-4.
Bártová, V. & Bárta, J. (2009). Chemical Composition and Nutritional Value of Protein
Concentrates Isolated from Potato (Solanum tuberosum L.) Fruit Juice by Precipitation with
Ethanol or Ferric Chloride. Journal of Agricultural and Food Chemistry, 57:19, 9028–9034.
Doi:10.1021/jf900897b.
BIO-RAD (2016). Nucleic acid extraction & purification. iScript cDNA Synthesis Kit, iscript Select
cDNA Synthesis Kit, iScript Advanced cDNA Synthesis Kit for RT-qPCR, iProof DNA Polymerase.
Retrieved on 29 November 2016 from: http://www.bio-rad.com/en-nl/category/nucleic-acid-
extraction-purification.
Buchner, P. & Hawkesford, M. J. (2014). Complex phylogeny and gene expression patterns of
members of the NITRATE TRANSPORTER 1/PEPTIDE TRANSPORTER family (NPF) in wheat. Journal
of Experimental Botany, 65:19, 5697–5710. Doi:10.1093/jxb/eru231.
Buchner, P., Parmara, S., Kriegela, A., Carpentiera, M. & Hawkesforda M. J. (2010). The Sulfate
Transporter Family in Wheat: Tissue-Specific Gene Expression in Relation to Nutrition. Molecular
Plant, 3:2, 374–389. Doi: 10.1093/mp/ssp119.
Camire, M. E. (2016). Potatoes and Human Health. Advances in Potato Chemistry and Technology:
Second Edition (Second Edition). Elsevier Inc. http://doi.org/10.1016/B978-0-12-800002-1.00023-6
Cheng, J., Wang, Z., Yao, F., Gao, L., Ma, S., Sui, X. & Zhang, Z. (2015). Down-Regulating CsHT1, a
Cucumber Pollen-Specific Hexose Transporter, Inhibits Pollen Germination, Tube Growth, and
Seed Development. Plant Physiology, 168:1, 635–647. Doi: http://dx.doi.org/10.1104/pp.15.00290.
Creusot, N., Wierenga, P. A., Laus, M. C., Giuseppin, M. L. F. & Gruppen, H. (2010). Rheological
properties of patatin gels compared with β-lactoglobulin, ovalbumin, and glycinin. Journal of the
Science of Food and Agriculture, 91:1, 253–261. Doi 10.1002/jsfa.4178.

32
Ding, Y., Zhou, X., Zuo, L., Wang, H. & Yu, D. (2016). Identification and functional characterization
of the sulfate transporter gene GmSULTR1;2b in soybean. BMC Genomics, 17:1, 373. DOI:
10.1186/s12864-016-2705-3.
EMBL-EBI (2016). Amino acid transporter, transmembrane domain. Inter-pro: Protein sequence
analysis & classification. Retrieved on 25 November 2016 from:
http://www.ebi.ac.uk/interpro/entry/IPR013057
EMBL-EBI (2016). Transmembrane amino acid transporter protein. Pfam: Family Aa_trans
(PF01490). Retrieved on 25 November 2016 from: http://pfam.xfam.org/family/PF01490
Eurostat (2016). The EU potato sector - statistics on production, prices and trade. Retrieved on 10
November 2016 from: http://ec.europa.eu/eurostat/statistics-
explained/index.php/The_EU_potato_sector_statistics_on_production,_prices_and_trade
Fischer, W.N., Loo, D.D.F., Koch, W., Ludewig, U., Boorer, K.J., Tegeder, M., Rentsch, D., Wright,
E.M. & Frommer, W.B. (2002) Low and high affinity amino acid H+ -cotransporters for cellular
import of neutral and charged amino acids. Plant J. 29, 717–731.
Gear, M. L., McPhillips, M. L., Patrick J. W. & McCurdy, D. W. (2000). Hexose transporters of
tomato: molecular cloning, expression analysis and functional characterization. Plant Molecular
Biology, 44:5, 687–697. Doi:10.1023/A:1026578506625.
Hirner, A., Ladwig, F., Stransky, H., Okumoto S., Keinath, M., Harms, A., Frommer, W. B., and
Kocha, W. (2006). Arabidopsis LHT1 Is a High-Affinity Transporter for Cellular Amino Acid Uptake in
Both Root Epidermis and Leaf Mesophyll. The Plant Cell, Vol. 18, 1931–1946.
doi:10.1105/tpc.106.041012.
Hunt, E., Gattolin, S., Newbury, J. H., Bale, J. S., Tseng, H. M., Barrett, D. A., and Pritchard J.
(2009). A mutation in amino acid permease AAP6 reduces the amino acid content of the
Arabidopsis sieve elements but leaves aphid herbivores unaffected. Journal of Experimental
Botany, Vol. 61, No. 1: 55–64. doi:10.1093/jxb/erp274.
Karimi, M., Inzé, D. & Depicker, A. (2002). Gateway vectors for Agrobacterium-mediated plant
transformation. Trends Plant Sci. 7:5, 193-195.
Kudo K., Onodera S., Takeda Y., Benkeblia N. & Shiomi N. (2009): Antioxidative activities of some
peptides isolated from hydrolyzed potato protein extract. Elsevier, Journal of Functional Foods,
1:1, 170–176. Doi: 10.1016/j.jff.2009.01.006.
Lazo, G. R., Stein, P. A. & Ludwig, R. A. 1991: A DNA transformation-competent Arabidopsis
genomic library in Agrobacterium. Biotechnology 9: 963-967.
Li, J., Dai, X., Zhuang, Z., & Zhao, P. X. (2015). LegumeIP 2.0—a platform for the study of gene
function and genome evolution in legumes. Nucleic Acids Research, 44(D1).
doi:10.1093/nar/gkv1237

33
McCurdy, D. W., Dibley, S., Cahyanegara, R., Martin, A. & Patrick, J. W. (2010). Functional
Characterization and RNAi-Mediated Suppression Reveals Roles for Hexose Transporters in Sugar
Accumulation by Tomato Fruit. Molecular Plant, 3:6, 1049–1063. Doi: 10.1093/mp/ssq050.
Merck Millipore (2016). PCR & RT-PCR Kits & Reagents. KOD DNA Polymerase, KOD Hot Start DNA
Polymerase. Retrieved on 29 November 2016 from:
https://www.merckmillipore.com/NL/en/product/KOD-DNA-Polymerase,EMD_BIO-71085 and
https://www.merckmillipore.com/NL/en/product/KOD-Hot-Start-DNA-Polymerase,EMD_BIO-
71086?ReferrerURL=https%3A%2F%2Fwww.facebook.com%2F
M’hamdi, M., Abid, G., Chikh-Rouhou, H., Razgallah, N. & Hassen, A. (2016). Effect of genotype and
growing season on nitrate accumulation and expression patterns of nitrate transporter genes in
potato (Solanum tuberosum L.). Archives of Agronomy and Soil Science, 62:11, 1508-1520. DOI:
10.1080/03650340.2016.1154544.
Navarre, D. A., Shakya, R., & Hellmann, H. (2016). Vitamins, Phytonutrients, and Minerals in Potato.
Advances in Potato Chemistry and Technology: Second Edition (Second Edition). Elsevier Inc.
http://doi.org/10.1016/B978-0-12-800002-1.00006-6
Orsel, M., Krapp, A. & Vedele, F. D. (2002). Analysis of the NRT2 Nitrate Transporter Family in
Arabidopsis. Structure and Gene Expression. Plant Phylsiology, 129:2, 886-896. Doi:
http://dx.doi.org/10.1104/pp.005280.
Pajerowska, K. M., Parker, J. E., and Gebhardt, C. (2005). Potato Homologs of Arabidopsis thaliana
Genes Functional in Defense Signaling-Identification, Genetic Mapping, and Molecular Cloning.
MPMI Vol. 18, No. 10: 1107–1119. DOI: 10.1094 /MPMI -18-1107.
Reuscher, S., Akiyama, M., Yasuda, T., Makino, H., Aoki, K., Shibata, D. & Shiratake, K. (2014). The
Sugar Transporter Inventory of Tomato: Genome-Wide Identification and Expression Analysis.
Plant Cell Physiol 55:6, 1123-1141. doi: 10.1093/pcp/pcu052
Roche (2016). High Pure RNA Isolation Kit. Retrieved on 29 November 2016 from:
https://shop.roche.com/shop/products/high-pure-rna-isolation-kit
Singh, J., Colussi, R., McCarthy, O. J., & Kaur, L. (2016). Potato Starch and Its Modification.
Advances in Potato Chemistry and Technology: Second Edition (Second Edition). Elsevier Inc.
http://doi.org/10.1016/B978-0-12-800002-1.00008-X
Spud DB (2016). Ethylene Receptor. Potato Genomics Resource. Michigan State University.
Retrieved on 24 November 2016 from: http://potato.plantbiology.msu.edu/cgi-
bin/annotation_report.cgi?gene_id=PGSC0003DMG400016284
Spud DB (2016). Hexose carrier protein. Potato Genomics Resource. Michigan State University.
Retrieved on 24 November 2016 from: http://potato.plantbiology.msu.edu/cgi-
bin/gbrowse/potato/#search
Spud DB (2016). Lysine/histidine transporter. Potato Genomics Resource. Michigan State
University. Retrieved on 24 November 2016 from: http://potato.plantbiology.msu.edu/cgi-
bin/annotation_report.cgi?gene_id=PGSC0003DMG400000818

34
Survase, S. A., Singh, J. & Singhal, R. S. (2016). The Role of Potatoes in Biomedical/Pharmaceutical
and Fermentation Applications. Advances in Potato Chemistry and Technology: Second Edition
(Second Edition). Elsevier Inc. https://doi.org/10.1016/B978-0-12-800002-1.00020-0
Tegeder, M., Ruan, Y.L. & Patrick, J.W. (2013) Roles of membrane transporters in phloem
functions. In Biochemistry of Phloem (Thompson, G. and Van Bel, A., eds). Oxford: Wiley-
Blackwell, pp. 63–101.
Tegeder, M. & Ward, J.M. (2012) Molecular evolution of plant AAP and LHT amino acid
transporters. Front. Plant Physiol. 3, 1–11.
Thermo Fisher Scientific (2016). Gateway cloning enzymes. Phusion High-Fidelity DNA Polymerase,
Gateway BP Clonase Emnzyme mix, Gateway LR Clonase enzyme mix. Retrieved on 29 November
2016 from:
https://www.thermofisher.com/search/results?query=gateway%20cloning%20enzymes&resultPage
=1&resultsPerPage=15&autocomplete=
Uniprot (2016). Transmembrane. Retrieved on 23 November 2016 from:
http://www.uniprot.org/keywords/KW-0812
Uniprot (2016). Transmembrane helix. Retrieved on 23 November 2016 from:
http://www.uniprot.org/keywords/KW-1133
Untergasser A. “RNA Miniprep using CTAB” Untergasser's Lab” (2008). Retrieved on 22
November 2016 from: http://www.untergasser.de/lab/protocols/miniprep_rna_ctab_v1_0.htm
Waglay, A., & Karboune, S. (2016). Potato Proteins. Advances in Potato Chemistry and Technology
(Second Edition). Elsevier Inc. http://doi.org/10.1016/B978-0-12-800002-1.00004-2
Wang, R., Xing, X., Wang, Y., Tran, A. & Crawford. N. M. (2009). A Genetic Screen for Nitrate
Regulatory Mutants Captures the Nitrate Transporter Gene NRT1.1. Plant Physiology, 151:1, 472–
478. Doi: http://dx.doi.org/10.1104/pp.109.140434.
Winter, D., Vinegar, B., Nahal, H., Ammar, R., Wilson, G., and Provart, N. (2007). An “electronic
fluorescent pictograph” browser for exploring and analysing large-scale biological data sets.
PLoSONE 2, e718. doi:10.1371/journal.pone.0000718.
Wuriyanghan H, Zhang B, Cao W. H., Ma B., Lei G., Liu Y. F., Wei W., Wu H. J., Chen L. J., Chen H.
W., Cao Y. R., He S. J., Zhang W. K., Wang X. J., Chen S. Y., and Zhang J. S. (2009). The Ethylene
Receptor ETR2 Delays Floral Transition and Affects Starch Accumulation in Rice. The Plant Cell,
Vol. 21: 1473–1494. DOI: 10.1105/tpc.108.065391.
Zhang, L., Garneau, M. G., Majumdar, R., Grant, J., and Tegeder, M. (2015). Improvement of pea
biomass and seed productivity by simultaneous increase of phloem and embryo loading with
amino acids. The Plant Journal, 81, 134–146.
Zhang, L., Tan, Q., Lee, R., Trethewy, A., Lee, Y. H. & Tegeder, M. (2010). Altered xylem-phloem
transfer of amino acids affects metabolism and leads to increased seed yield and oil content in
Arabidopsis. Plant Cell, 22, 3603–3620.

35
Zhou L, Jang JC, Jones TL, Sheen J. 1998. Glucose and ethylene signal transduction crosstalk
revealed by an Arabidopsis glucose-insensitive mutant. Proc. Natl. Acad. Sci. USA 95:10294–99.
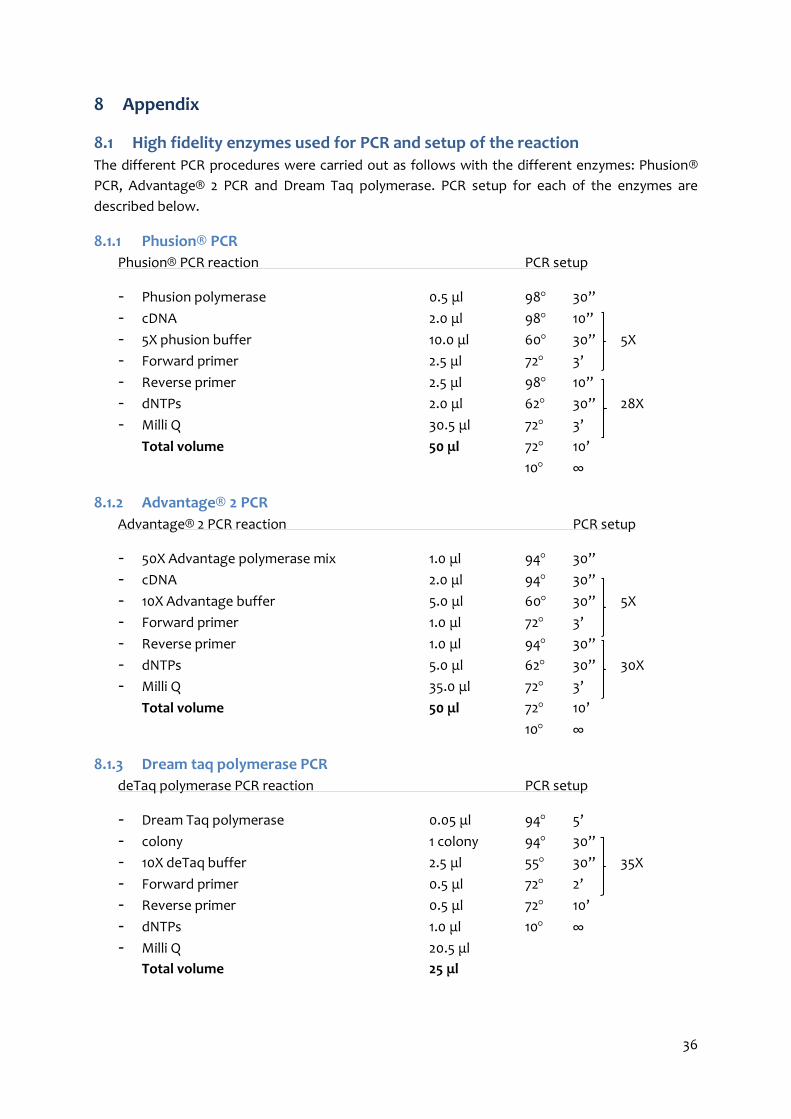
36
8 Appendix
High fidelity enzymes used for PCR and setup of the reaction 8.1
The different PCR procedures were carried out as follows with the different enzymes: Phusion®
PCR, Advantage® 2 PCR and Dream Taq polymerase. PCR setup for each of the enzymes are
described below.
Phusion® PCR 8.1.1
Phusion® PCR reaction PCR setup
- Phusion polymerase 0.5 μl 98 30’’
- cDNA 2.0 μl 98 10’’
- 5X phusion buffer 10.0 μl 60 30’’ 5X
- Forward primer 2.5 μl 72 3’
- Reverse primer 2.5 μl 98 10’’
- dNTPs 2.0 μl 62 30’’ 28X
- Milli Q 30.5 μl 72 3’
Total volume 50 μl 72 10’
10 ∞
Advantage® 2 PCR 8.1.2
Advantage® 2 PCR reaction PCR setup
- 50X Advantage polymerase mix 1.0 μl 94 30’’
- cDNA 2.0 μl 94 30’’
- 10X Advantage buffer 5.0 μl 60 30’’ 5X
- Forward primer 1.0 μl 72 3’
- Reverse primer 1.0 μl 94 30’’
- dNTPs 5.0 μl 62 30’’ 30X
- Milli Q 35.0 μl 72 3’
Total volume 50 μl 72 10’
10 ∞
Dream taq polymerase PCR 8.1.3
deTaq polymerase PCR reaction PCR setup
- Dream Taq polymerase 0.05 μl 94 5’
- colony 1 colony 94 30’’
- 10X deTaq buffer 2.5 μl 55 30’’ 35X
- Forward primer 0.5 μl 72 2’
- Reverse primer 0.5 μl 72 10’
- dNTPs 1.0 μl 10 ∞
- Milli Q 20.5 μl
Total volume 25 μl

37
Antibiotics 8.2
Table 2. List of antibiotics used for selection after transformation from different cloning steps and
regeneration of plants after Agrobacterium-mediated transformation.
Culturing bacteria Stock solution (mg/ml) Working dilution
Ampicillin 50 1/500
Carbenicilin 50 1/500
Chloramphenicol 50 1/1000
Kanamycin 50 1/1000
Spectinomycine 100 1/500
Regeneration of plants Final concentration (mg/l) Added to medium (ml/l)
Cefotaxime 100 2
Kanamycin 50 2
Vancomycine 100 2
Plasmid DNA isolation and DNA purification 8.3
Zymoclean™ Gel DNA Recovery Kit - ZYMORESEARCH 8.3.1
All centrifugation steps should be performed between 10,000 - 16,000 x g.
Step 1 Excise the DNA fragment1 from the agarose gel using a razor blade, scalpel or other
device and transfer it into a 1.5 ml microcentrifuge tube.
Step 2 Add 3 volumes of ADB to each volume of agarose excised from the gel (e.g. for 100 µl
(mg) of agarose gel slice add 300 µl of ADB).
Step 3 Incubate at 37-55 °C for 5-10 minutes until the gel slice is completely dissolved2.
For DNA fragments > 8 kb, following the incubation step, add one additional volume (equal to
that of the gel slice) of water to the mixture for better DNA recovery (e.g., 100 µl agarose, 300 µl
ADB, and 100 µl water).
Step 4 Transfer the melted agarose solution to a Zymo-Spin™ Column in a Collection Tube.
Step 5 Centrifuge for 30-60 seconds. Discard the flow-through3.
Step 6 Add 200 µl of DNA Wash Buffer to the column and centrifuge for 30 seconds. Discard the
flow-through. Repeat the wash step.
Step 7 Add ≥ 6 µl DNA Elution Buffer4 or water5 directly to the column matrix. Place column into
a 1.5 ml tube and centrifuge for 30-60 seconds to elute DNA.
Ultra-pure DNA is now ready for use.

38
DNA Clean & Concentrator™-5 - ZYMORESEARCH 8.3.2
Buffer Preparation. Add 24 ml 100% ethanol (26 ml 95% ethanol) to the 6 ml DNA Wash Buffer
concentrate. Add 96 ml 100% ethanol (104 ml 95% ethanol) to the 24 ml DNA Wash Buffer
concentrate.
Protocol
All centrifugation steps should be performed between 10,000 - 16,000 x g.
1. In a 1.5 ml microcentrifuge tube, add 2-7 volumes of DNA Binding Buffer to each volume of
DNA sample (see table below). Mix briefly by vortexing.
2. Transfer mixture to a provided Zymo-Spin™ Column2 in a Collection Tube.
Application DNA Binding Buffer : Sample Example
Plasmid, genomic DNA (>2 kb) 2 : 1 200 μl : 100 μl
PCR product, DNA fragment 5 : 1 500 μl : 100 μl
ssDNA (e.g. cDNA, M13 phage) 7 : 1 700 μl : 100 μl
3. Centrifuge for 30 seconds. Discard the flow-through.
4. Add 200 µl DNA Wash Buffer to the column. Centrifuge for 30 seconds. Repeat the wash
step.
5. Add ≥ 6 µl DNA Elution Buffer3 or water4 directly to the column matrix and incubate at
room temperature for one minute. Transfer the column to a 1.5 ml microcentrifuge tube
and centrifuge for 30 seconds to elute the DNA.
Ultra-pure DNA is now ready for use.
QIAGEN® MinElute® gel extraction kit 8.3.3
Notes before starting
This protocol is for clean-up of up to 5 μg DNA fragments (70 bp to 4 kb).
All centrifugation steps are carried out at 17,900 x g (13,000 rpm) in a conventional tabletop
microcentrifuge at room temperature (15–25°C).
1. Excise the DNA fragment from the agarose gel with a clean, sharp scalpel.
2. Weigh the gel slice in a colorless tube. Add 3 volumes of Buffer QG to 1 volume of
gel (100 mg gel ~ 100 μl). The maximum amount of gel slice per spin column is 400
mg. For >2% agarose gels, add 6 volumes Buffer QG.
3. Incubate at 50°C for 10 min (or until the gel slice has completely dissolved). Vortex the
tube every 2–3 min during incubation to help dissolve the gel.
4. After the gel slice has dissolved completely, check that the color of the mixture is yellow
(similar to Buffer QG without dissolved agarose). If the color of the mixture is orange or
violet, add 10 μl 3 M sodium acetate, pH 5.0, and mix. The color of the mixture will turn to
yellow.
39
5. Add 1 gel volume of isopropanol to the sample and mix by inverting.
6. Place a MinElute spin column in a provided 2 ml collection tube.
7. Apply sample to the MinElute column and centrifuge for 1 min. Discard flow-through and
place the MinElute column back into the same collection tube. For sample volumes of
more than 800 μl, simply load and spin again.
8. Add 500 μl Buffer QG to the MinElute column and centrifuge for 1 min. Discard flow-
through and place the MinElute column back into the same collection tube.
9. Add 750 μl Buffer PE to MinElute column and centrifuge for 1 min. Discard flow-through
and place the MinElute column back into the same collection tube.
10. Centrifuge the column in a 2 ml collection tube (provided) for 1 min. Residual ethanol from
Buffer PE will not be completely removed unless the flow-through is discarded before this
additional centrifugation.
11. Place each MinElute column into a clean 1.5 ml microcentrifuge tube. To elute DNA, add 10
μl Buffer EB (10 mM Tris-Cl, pH 8.5) or water to the center of the MinElute membrane.
(Ensure that the elution buffer is dispensed directly onto the membrane for complete
elution of bound DNA.) Let the column stand for 1 min, and then centrifuge the column for
1 min.
12. If purified DNA is to be analyzed on a gel, add 1 volume of Loading Dye to 5 volumes of
purified DNA, and mix by pipetting up and down before loading the gel.
QIAGEN QIAprep® Spin Miniprep Kit 8.3.4
1. Pellet 1–5 ml bacterial overnight culture by centrifugation at >8000 rpm (6800 x g) for 3
min at room temperature (15–25°C).
2. Re-suspend pelleted bacterial cells in 250 μl Buffer P1 and transfer to a micro-centrifuge
tube.
3. Add 250 μl Buffer P2 and mix thoroughly by inverting the tube 4–6 times until the solution
becomes clear. Do not allow the lysis reaction to proceed for more than 5 min.
4. Add 350 μl Buffer N3 and mix immediately and thoroughly by inverting the tube 4–6
times.
5. Centrifuge for 10 min at 13,000 rpm (~17,900 x g) 4C in a table-top microcentrifuge.
6. Apply 800 μl supernatant from step 5 to the QIAprep 2.0 spin column by pipetting.
Centrifuge for 60 s and discard the flow-through.
7. Recommended: Wash the QIAprep 2.0 spin column by adding 0.5 ml (500 μl) Buffer PB.
Centrifuge for 60 s and discard the flow-through.
8. Wash the QIAprep 2.0 spin column by adding 0.75 ml Buffer PE. Centrifuge for 60 s and
discard the flow-through. Transfer the QIAprep 2.0 spin column to the collection tube.
9. Centrifuge for 1 min to remove residual wash buffer.
10. Place the QIAprep 2.0 column in a clean 1.5 ml microcentrifuge tube. To elute DNA, add 50
μl Buffer EB (10 mM TrisCl, pH 8.5) or water to the center of the QIAprep 2.0 spin column,
let stand for 1 min, and centrifuge for 1 min.
11. If the extracted DNA is to be analyzed on a gel, add 1 volume of Loading Dye to 5 volumes
of purified DNA. Mix the solution by pipetting up and down before loading the gel.

40
Plasmid isolation from E. coli (Eric’s modification of original Birnboim method) 8.3.5
1. Take 1.5 ml of overnight E. coli culture in LB and spin at 12000 rpm for 3 minutes.
2. Discard the supernatant and add 200 μl TGE (solution I – P1 buffer).
3. Re-suspend the cells by vortexing and incubate 5 minutes on ice.
4. Add 400 μl lysis mix (solution II – P2 buffer), mix by inverting the tube and incubate 5
minutes on ice.
5. Add 300 μl KAc (solution III – P3 buffer), shake well and keep on ice for 9 minutes.
6. Centrifuge at 12000 rpm at 4C for 10 minutes.
7. Take 800 μl of supernatant and add 450 μl isopropanol, place them in new tubes, mix by
vortexing and keep for 5 minutes at room temperature.
8. Spin at 12000 rpm for 10 minutes and wash the pellet 2 times with 70% ethanol.
9. Dry (air or SpeedVac) the pellet of DNA and dissolve in 30 μl of milli-Q water or TE buffer.
Gateway cloning protocols 8.4
pENTR™ TOPO® cloning protocol 8.4.1
Use the following procedure to perform the TOPO® Cloning reaction. Set up the TOPO® Cloning
reaction depending on whether you plan to transform chemically competent E. coli or
electrocompetent E. coli. Reminder: For optimal results, be sure to use a 0.5:1–2:1 molar ratio of
PCR product:TOPO® vector in your TOPO® Cloning reaction.
Note: The blue colour of the TOPO® vector solution is normal and is used to visualize the solution.
Reagents* Chemically Competent E. coli Electrocompetent E. coli
Fresh PCR product 0.5 - 4 μl 0.5 - 4 μl
Salt Solution 1 μl -
Dilute Salt Solution (1:4) - 1 μl
Sterile Water add to a final volume of 5 μl add to a final volume of 5 μl
TOPO® vector 1 μl 1 μl
Final volume 6 μl 6 μl
*Store all reagents at –20°C when finished. Salt solution and water can be stored at room
temperature or 4°C.
1. Mix the reaction gently and incubate for 5 minutes at room temperature (22–23°C).
Note: For most applications, 5 minutes will yield a sufficient number of colonies for analysis.
Depending on your needs, the length of the TOPO®. Cloning reaction can be varied from 30
seconds to 30 minutes. For routine subcloning of PCR products, 30 seconds may be sufficient. For
large PCR products (> 1 kb) or if you are TOPO® Cloning a pool of PCR products, increasing the
reaction time may yield more colonies.
2. Place the reaction on ice and proceed to Transforming One Shot® Competent E. coli, page 13.
Note: You may store the TOPO® Cloning reaction at –20°C overnight.

41
Transform One Shot® Competent E. coli
After performing the TOPO® Cloning reaction, you will transform your pENTR™ TOPO® construct
into competent E. coli. One Shot® TOP10 or Mach1™-T1R. Chemically Competent E. coli (Box 2) are
included with the kit to facilitate transformation, however, you may also transform
electrocompetent cells (see page 22 for ordering information). Protocols to transform chemically
competent or electrocompetent E. coli are provided in this section.
Required materials
Components required but not supplied:
• TOPO® Cloning reaction (from step 2, page 12)
• 15-ml sterile, snap-cap plastic culture tubes (for electroporation only)
• LB plates containing 50 μg/ml kanamycin (2 for each transformation)
• LB plates containing 100 μg/ml ampicillin (if transforming pUC19 control)
• 37°C shaking and non-shaking incubator
• general microbiological supplies (i.e. plates, spreaders)
• 42°C water bath (or electroporator with cuvettes, optional)
Components supplied with the kit:
• One Shot® TOP10 or Mach1TM-T1R chemically competent E. coli (Box 2)
• S. O.C. Medium (Box 2)
• Optional: pUC19 positive control (Box 2)
There is no blue-white screening for the presence of inserts. Most transformants will contain
recombinant plasmids with the PCR product of interest cloned in the correct orientation.
Sequencing primers are included in the kit to sequence across an insert in the multiple cloning site
to confirm orientation and reading frame.
Prepare for transformation
For each transformation, you will need 1 vial of One Shot® competent cells and
2 selective plates.
• Equilibrate a water bath to 42°C (for chemical transformation) or set up your
electroporator if you are using electrocompetent E. coli.
• Warm the vial of S.O.C. Medium from Box 2 to room temperature.
• Warm selective plates at 37°C for 30 minutes.
• Thaw on ice 1 vial of One Shot® cells from Box 2 for each transformation.
One Shot® chemical transformation protocol
Use the following protocol to transform One Shot® TOP10 or Mach1™-T1R chemically competent E.
coli.

42
1. Add 2 μl of the TOPO® Cloning reaction from Performing the TOPO® Cloning Reaction, step 2,
page 12 into a vial of One Shot® Chemically Competent E. coli and mix gently. Do not mix by
pipetting up and down.
Note: If you are transforming the pUC19 control plasmid, use 10 pg (1 μl).
2. Incubate on ice for 5–30 minutes.
Note: Longer incubations on ice seem to have a minimal effect on transformation efficiency. The
length of the incubation is at the user’s discretion.
3. Heat-shock the cells for 30 seconds at 42°C without shaking.
4. Immediately transfer the tubes to ice.
5. Add 250 μl of room temperature S.O.C. Medium.
6. Cap the tube tightly and shake the tube horizontally (200 rpm) at 37°C for 1 hour.
7. Spread 50–200 μl from each transformation on a prewarmed selective plate and incubate
overnight at 37°C. We recommend that you plate 2 different volumes to ensure that at least 1
plate will have well-spaced colonies.
8. An efficient TOPO® Cloning reaction may produce several hundred colonies. Pick 5–10 colonies
for analysis.
Transformation by electroporation
Use ONLY electrocompetent cells for electroporation to avoid arcing. Do not use the One Shot®
TOP10 or Mach1™-T1R chemically competent cells for electroporation.
1. Add 2 μl of the TOPO® Cloning reaction from Performing the TOPO® Cloning Reaction, step 2,
page 12 into a sterile microcentrifuge tube containing 50 μl of electrocompetent E. coli and mix
gently. Do not mix by pipetting up and down. Avoid formation of bubbles. Transfer the cells to a
0.1-cm cuvette.
2. Electroporate your samples using your own protocol and your electroporator.
3. Immediately add 250 μl of room temperature S.O.C. Medium.
4. Transfer the solution to a 15-ml snap-cap tube (i.e. Falcon) and shake for at least 1 hour at 37°C
to allow expression of the kanamycin resistance gene.
5. Spread 20–100 μl from each transformation on a prewarmed selective plate and incubate
overnight at 37°C. To ensure even spreading of small volumes, add 20 μl of S.O.C. Medium. We
recommend that you plate 2 different volumes to ensure that at least 1 plate will have well-spaced
colonies.
43
6. An efficient TOPO® Cloning reaction may produce several hundred colonies. Pick 5–10 colonies
for analysis.
To prevent arcing of your samples during electroporation, the volume of cells should be between
50–80 μl (0.1-cm cuvettes) or 100–200 μl (0.2-cm cuvettes). If you experience arcing during
transformation, try one of the following suggestions:
• Reduce the voltage normally used to charge your electroporator by 10%
• Reduce the pulse length by reducing the load resistance to 100 ohms
• Ethanol precipitate the TOPO® Cloning reaction and resuspend in water prior to electroporation
LR Clonase™ II Enzyme Mix cloning protocol 8.4.2
Prepare LR Reaction
LR Clonase™ II enzyme mix is supplied as a 5X solution. If you wish to scale the reaction volume,
make sure the LR Clonase™ II enzyme mix is at a final concentration of 1X. For a positive control,
use 100 ng (2 μl) of pENTR™-gus.
1. Add the following components to a 1.5-ml microcentrifuge tube at room temperature and mix:
• 1–7 μl entry clone (50–150 ng)
• 1 μl destination vector (150 ng/μl)
• TE buffer pH 8.0, to 8 μl
2. Thaw on ice the LR Clonase™ II enzyme mix for about 2 minutes. Vortex the LR Clonase™ II
enzyme mix briefly twice (2 seconds each time).
3. To each sample (step 1), add 2 μl of LR Clonase™ II enzyme mix to the reaction and mix well by
vortexing briefly twice. Microcentrifuge briefly
4. Return LR Clonase™ II enzyme mix to –20°C or –80°C storage.
5. Incubate reactions at 25°C for 1 hour.
6. Add 1 μl of the Proteinase K solution to each sample to terminate the reaction.
Vortex briefly Incubate samples at 37°C for 10 minutes.
Transformation
1. Transform 1 μl of each LR reaction into 50 μl of One Shot™ OmniMAX™ 2 T1 Phage-Resistant
Cells (Cat. no. C8540-03). Incubate on ice for 30 minutes. Heatshock cells by incubating at 42°C for
30 seconds. Add 250 μl of S.O.C. Medium and incubate at 37°C for 1 hour with shaking. Plate 20 μl
and 100 μl of each transformation onto selective plates.
Note: Any competent cells with a transformation efficiency of >1.0 × 10⁸ transformants/μg may be
used.
44
2. Transform 1 μl of pUC19 DNA (10 ng/ml) into 50 μl of One Shot™ OmniMAX™ 2 T1 Phage-
Resistant Cells as described above. Plate 20 μl and 100 μl on LB plates containing 100 μg/ml
ampicillin.
Expected results
An efficient LR recombination reaction will produce >5000 colonies if the entire LR reaction is
transformed and plated.
Modified Gateway® cloning and transformation procedures 8.5
pENTR™ TOPO® cloning 8.5.1
Depending on what kind of E. coli cells were used for the transformation, the ligation process was
performed different. Two type of bacterial cells were used for cloning: a) Chemically Competent
E. coli cells and; b) Electrocompetent E. coli cells. According the manufacturer’s instructions, a
0.5:1 to 2:1 molar ratio of PCR product:Topo® vector are recommended for successful cloning and
transformation of the gene of interest. However, a 3:1 ratio was also performed during the
cloning processes. The cloning procedure is similar for Chemically and Electrocompetent E. coli
cells, except for the Electrocompetent E. coli cells which must be used with a diluted 1:4 salt
solution for electroporation. The cloning mixtures consist of the DNA (~40 ng/μl) from the PCR
with the gene of interest, Salt solution, milli-Q water and the Topo® vector (15-20 ng/μl) to a final
volume of 6 μl. The mixture is kept at 22C for 30 minutes before the transformation procedure.
The transformation protocol can be performed immediately after the ligation procedure or can be
stored at -20C.
LR cloning 8.5.2
After successful extraction of the pDNA from both, the pENTR™ TOPO® vector containing the
gene of interest and the destination vector (PK7GW2.0), LR cloning was performed. Performing
the reaction required 40 ng of the pENTR clone, 75 ng of the destination vector, TE buffer and 5X
LR Clonase® II mix reaction buffer and the LR Clonase® II enzyme. The reaction was carried out in
a final volume of 10 μl containing the pENTR clone and the destination vector, 2 μl of 5X LR
Clonase® II mix reaction buffer, 2 μl of LR Clonase® II enzyme and TE buffer up to a final volume
of 10 μl. The mixture is placed in a PCR machine set at 25C preferably running overnight. 1 μl of
proteinase K was added to the reaction and put at 37C for 10 minutes. After completion of the
process, the transformation procedure was performed.
pENTR™ TOPO® and LR transformation procedure 8.5.3
The transformation protocol was adapted from the original manufacturers protocol and the
quantity of competent cells and ligation product from the pENTR™ TOPO® and LR cloning
reactions were reduced. From the transformation procedure, a couple of colonies were picked up
for analysis by colony PCR with Dream Taq polymerase. Some colonies were further cultured in LB
liquid containing antibiotics for selection to obtain higher amounts of bacterial cells to perform
plasmid DNA isolation for the following steps. The description below details how the
transformation protocol was carried out during the project (see also Appendix). a) Chemically

45
competent E. coli cells transformed by heat-shock; b) Electrocompetent E. coli cells transformed
by electroporation.
a) 2 μl from the pENTR™ TOPO® and 1 μl from the LR cloning were mixed independently with
25 μl of Library Efficiency® DH5α™ Competent or One Shot® TOP10 Chemically Competent
cells and incubated on ice for 30 minutes. For control of the transformation efficiency,
pUC19 DNA (10 ng/μl) is provided with the Library Efficiency® DH5α™ Competent E. coli
cells and was performed along to check the efficiency of the transformation. Next, the
cells were heat-shocked for 30 seconds in a water bath at 42C and placed back to ice for 2
more minutes. 225 μl of room temperature S.O.C. medium was added to each cloning
reaction and incubated at 37C with shaking for 1 hour. The transformed cells were then
plated in Petri dishes containing 50 μg/ml of Kanamycin (pENTR™ TOPO® cloning), 200
μg/ml Spectynomicin (LR cloning - PK7GW2.0 destination vector) and 100 μg/ml Ampicillin
(pUC19 DNA) for selection and incubated at 37C overnight. Both, the transformation of
the genes of interest and the controls were plated in two different volumes (75 μl and 175
μl) to allow one of the plates to grow well spaced colonies. The transformed colonies
were later used for verification by colony PCR and culturing colonies for plasmid DNA
isolation.
b) 2 μl from the pENTR™ TOPO® reaction were added to 50 μl One Shot® TOP10
Electrocom™ E. coli cells and mixed. The cells were then transferred to a pre-chilled
electroporation cuvette. The electroporation took place using a Gene Pulser® II
Electroporation System (BIO-RAD) set at 2.0 kV with a resistance of 200 Ohms and a
capacitance of 25 μF during 4 to 5 seconds. Immediately 250 μl of S.O.C. medium was
incorporated to the cells and transferred to 1.5 ml tubes. The tubes were placed at 37C
with shaking for 1 hour. The transformed cells and the control pUC19 were then plated in
Petri dishes containing 50 μg/ml of Kanamycin and 100 μg/ml Ampicillin respectively.
Incubation at 37C overnight and the following steps were performed as mentioned for
Chemically Competent E. coli cells.