closing the gap between genome analysis …digitool.library.mcgill.ca/thesisfile114165.pdfthis...
TRANSCRIPT

CLOSING THE GAP BETWEEN GENOME ANALYSIS AND THE
BIOLOGIST
Vincenzo Forgetta
Faculty of Medicine
Department of Human Genetics
McGill University, Montreal, Quebec, Canada
June 2012
A thesis submitted to McGill University in partial fulfillment of the requirements
of the degree of Doctor of Philosophy
© Vincenzo Forgetta, 2012

ii
ABSTRACT
Bioinformatics is a crucial component of genomics research because it enables the
analyses of large and complex data sets. Conventionally, these analyses involve
the use of sophisticated software, and are largely performed by those with prior
experience in bioinformatics using adequate computational resources.
Massively parallel DNA sequencing (MPS) platforms have democratized genome
sequencing, making it affordable to the biologist. For many biologists this will be
their first venture into bioinformatics and genomics. Consequently, they may be
unfamiliar with bioinformatics or lack the necessary computer resources. For
these biologists, the potential of using MPS platforms for genome analysis is half
fulfilled; providing affordable genomic data without the means to easily analyze
it. One approach to close this gap is to build software oriented towards those with
limited bioinformatics expertise or resources.
This dissertation describes a paradigm to close the gap between genome analysis
and the biologist. Using this paradigm, I have developed software tools for three
bioinformatics tasks in genome analysis: [i] assessment of a genome assembly,
[ii] display and integrated analysis of genomic data, and [iii] deriving biological
insight using public information. The first tool I developed was cgb, a program
that creates custom UCSC Genome Browsers, allowing biologists to use this
browser for genome sequences obtained from MPS platforms. Using cgb for a
comparative genomics study of Clostridium difficile assisted us to identify
diagnostic DNA markers associated with disease severity and to estimate that the
pan-genome is larger than previously estimated. Next I developed contiGo, a
general purpose tool to inspect genome assemblies via a web browser, thus
bypassing the need for the biologist to install software, satisfy hardware
requirements, and download large datasets. Along with cgb, this program enabled
us to evaluate the performance of the Roche/454 Genome Sequencer-FLX MPS
platform across five sequencing core facilities, and to produce a high quality
genome sequence of the fungus Ophiostoma novo-ulmi. Lastly, I developed BL!P,
a program to automate NCBI BLAST searches and explore the results in a

iii
dynamic interface. This program was inspired by my work on characterizing the
genome of a multi-drug resistant and pathogenic strain of Escherichia fergusonii,
for which cgb and contiGo were also used in data analysis. These applications
have been used in other genomics projects by users with a range of bioinformatics
expertise and resources. Other data-intensive fields of science could benefit from
a similar software development paradigm.

iv
RÉSUMÉ
La bioinformatique fait maintenant partie intégrante de la recherche en
génomique, car elle permet des analyses de bases de données larges et complexes.
Conventionnellement, ces analyses impliquent l'utilisation de logiciels
sophistiqués et sont généralement faites par des personnes expérimentées en
bioinformatique qui utilisent des ressources informatiques adéquates.
Les plateformes de séquençage haut débit d'ADN ont démocratisé le séquençage
du génome, le rendant ainsi accessible aux biologistes. Pour de nombreux
biologistes, ce sera leur première incursion dans les domaines de la
bioinformatique et de la génomique. Par conséquent, ils ne sont probablement pas
familiers avec la bioinformatique ou n'ont pas les ressources informatiques
nécessaires afin d’analyser les résultats. Pour ces biologistes, l’utilisation des
plateformes de séquençage haut débit permet l’obtention abordable de données
génomiques, mais n’offre pas les outils pour les analyser facilement. Le
développement de logiciels ciblant les chercheurs ayant une expertise en
bioinformatique limitée ou avec peu de ressources permettrait de combler cet
écart.
Cette dissertation décrit un paradigme visant à réduire, voire même à fermer,
l’écart entre l'analyse du génome et le biologiste. En utilisant ce paradigme, j'ai
développé des outils informatiques pour trois tâches facilitant l'analyse
génomique : [i] l'évaluation de l’assemblage du génome, [ii] l’affichage et
l'analyse intégrée des données génomiques, et [iii] l’obtention de connaissances
biologiques utilisant de l'information publique. Le premier outil que j'ai développé
était cgb, un programme qui crée des navigateurs personnalisés « UCSC Genome
». Il permet aux biologistes d'utiliser ces navigateurs pour évaluer les séquences
obtenues à partir de plateformes de séquençage haut débit. L’utilisation de cgb
lors d’une étude génomique comparative de Clostridium difficile nous a permis
d’identifier des marqueurs diagnostics d'ADN associés à la gravité de la maladie
et de démontrer que son pan-génome est plus grand qu’estimé précédemment.
Ensuite, j'ai développé contiGo, un outil d'usage général pour réviser les

v
assemblages de séquences génomiques par l’intermédiaire d’un navigateur web.
Cette application permet aux biologistes de contourner la nécessité d’installer un
logiciel, de satisfaire les exigences de l’équipement informatique, et de
télécharger des larges bases de données. Conjointement avec cgb, ce programme
nous a permis d'évaluer la performance de la plateforme de séquençage haut débit
Roche/454 Genome Sequencer FLX, à travers cinq installations de séquençage,
ainsi qu’à générer une séquence génomique de grande qualité du champignon
Ophiostoma novo-ulmi. Finalement, j'ai développé BL!P, un programme pour
automatiser les recherches BLAST NCBI et pour explorer les résultats obtenus
dans une interface dynamique. Ce programme a été inspiré par mon travail sur la
caractérisation du génome d’une souche pathogène et multi résistante
d'Escherichia fergusonii, et pour laquelle cgb et contiGo ont également été
utilisés dans l'analyse des données. Ces applications ont été utilisées dans d'autres
projets de génomique par des utilisateurs possédant un éventail de compétences et
de ressources bioinformatiques. D'autres domaines scientifiques générant des
multitudes de données pourraient bénéficier d'un paradigme similaire de
développement de logiciel informatique.

vi
TABLE OF CONTENTS
ABSTRACT ..................................................................................................... ii
RÉSUMÉ ........................................................................................................ iv
TABLE OF CONTENTS .............................................................................. vi
LIST OF FIGURES ....................................................................................... ix
LIST OF TABLES ......................................................................................... xi
TABLE OF ABBREVIATIONS .................................................................. xii
ACKNOWLEDGEMENTS ........................................................................ xiii
ORIGINALITY AND CONTRIBUTIONS TO KNOWLEDGE ............ xiv
PART I: INTRODUCTION ........................................................................... 1
CHAPTER 1: BIOINFORMATICS AND GENOMICS ............................... 2
Concise History of Bioinformatics .............................................................. 2
Evolution of Genome Sequencing ............................................................... 4
Coevolution of Bioinformatics and Genome Analysis .............................. 12
Synthesis .................................................................................................... 26
Research Objectives ................................................................................... 27
Thesis Outline ............................................................................................ 28
PART II: DISPLAY AND INTEGRATED ANALYSIS OF GENOMIC
DATA ................................................................................................. 29
CONNECTING TEXT ................................................................................. 30
Contribution of Authors ............................................................................. 31
CHAPTER 2: CGB − A UNIX SHELL PROGRAM TO CREATE CUSTOM
INSTANCES OF THE UCSC GENOME BROWSER ................... 32
Abstract ...................................................................................................... 33
Introduction ................................................................................................ 34
Methods ...................................................................................................... 35
Results. ....................................................................................................... 35
Discussion .................................................................................................. 39
Acknowledgements .................................................................................... 39

vii
CHAPTER 3: FOURTEEN-GENOME COMPARISON IDENTIFIES DNA
MARKERS FOR SEVERE-DISEASE-ASSOCIATED STRAINS
OFCLOSTRIDIUM DIFFICILE ....................................................... 40
Abstract ...................................................................................................... 41
Introduction ................................................................................................ 42
Material and Methods ................................................................................ 44
Results. ....................................................................................................... 46
Discussion .................................................................................................. 60
Acknowledgements .................................................................................... 64
PART III: ASSESSMENT OF A GENOME ASSEMBLY ...................... 65
CONNECTING TEXT ................................................................................. 66
Contribution of Authors ............................................................................. 67
CHAPTER 4: CONTIGO -- A TOOL TO INSPECT GENOME ASSEMBLIES
IN A WEB BROWSER .................................................................... 68
Abstract ...................................................................................................... 69
Introduction ................................................................................................ 70
Methods ...................................................................................................... 71
Results. ....................................................................................................... 72
Discussion .................................................................................................. 76
Acknowledgments ...................................................................................... 76
CHAPTER 5: REPRODUCIBILITY OF THE ROCHE/454 GS-FLX
TITANIUM SYSTEM TO GENOME SEQUENCE THE DUTCH ELM
DISEASE PATHOGEN ................................................................... 77
Abstract ...................................................................................................... 78
Introduction ................................................................................................ 79
Methods ...................................................................................................... 80
Results. ....................................................................................................... 81
Discussion .................................................................................................. 97
Acknowledgements .................................................................................... 99
PART IV: DERIVING BIOLOGICAL INSIGHT USING PUBLIC
INFORMATION ............................................................................. 100

viii
CONNECTING TEXT ............................................................................... 101
Contribution of Authors ........................................................................... 102
CHAPTER 6: A TOOL TO AUTOMATE MULTIPLE BLAST SEARCHES
AND DYNAMICALLY EXPLORE RESULTS ........................... 103
Abstract .................................................................................................... 104
Introduction .............................................................................................. 105
Implementation ........................................................................................ 106
Results. ..................................................................................................... 108
Conclusions .............................................................................................. 110
Availability and Requirements ................................................................. 110
Authors' contributions .............................................................................. 110
Acknowledgements and Funding ............................................................. 111
CHAPTER 7: PATHOGENIC AND MULTIDRUG RESISTANT
ESCHERICHIA FERGUSONII FROM BROILER CHICKEN ..... 112
Abstract .................................................................................................... 113
Introduction .............................................................................................. 114
Materials and Methods ............................................................................. 115
Results and Discussion ............................................................................. 118
Conclusions .............................................................................................. 140
Acknowledgements .................................................................................. 140
PART V: DISCUSSION ............................................................................. 142
CHAPTER 8: IMPACT OF RESEARCH, FUTURE WORK, AND
CONCLUDING REMARKS ......................................................... 143
Impact of the Genome Sequencing Projects ............................................ 144
Bioinformatics Software .......................................................................... 145
Concluding Remarks ................................................................................ 150
REFERENCES ............................................................................................ 152

ix
LIST OF FIGURES
Figure 1. Improvements in DNA sequencing technology. ..................................... 7
Figure 2. Species counts from the NCBI genome project database. ..................... 10
Figure 3. The genome sequencing and assembly process. .................................... 14
Figure 4. A custom instance of the UCSC Genome Browser for C. difficile isolate
QCD-66c26. .......................................................................................................... 19
Figure 5. NCBI GenBank record for the clpA protein from E. fergusonii isolate
ECD227................................................................................................................. 23
Figure 6. Excerpt from the NCBI BLAST output for a protein sequence from E.
fergusonii isolate ECD227 against the GenBank non-redundant database. ......... 24
Figure 7. List of cgb commands for creating a custom UCSC Genome Browser. 38
Figure 8. Percent identity plot (top) and dot-plot (bottom) depicting the whole
genome pairwise alignments of a NAP1 isolate (QCD-66c26) versus a NAP7
isolate (QCD-23m63)............................................................................................ 50
Figure 9. a) Phylogenetic tree of 14 C. difficile genomes constructed using SNP
data. ....................................................................................................................... 52
Figure 10. Distribution of SNPs that uniquely identify the NAP1 group of isolates.
............................................................................................................................... 54
Figure 11. Correlation of disease severity with SNPs from the TCS-ABC locus or
existing diagnostic methodologies. ....................................................................... 57
Figure 12. A contiGo screenshot illustrating the E. fergusonii isolate ECD227
genome assembly. ................................................................................................. 73
Figure 13. Core facility read length distribution. .................................................. 84
Figure 14. Base quality per core facility. .............................................................. 86

x
Figure 15. The O. novo-ulmi strain H327 genome assembly. .............................. 90
Figure 16. Homopolymer counts and overall accuracy. ....................................... 94
Figure 17. Aspects of homopolymer accuracy. .................................................... 95
Figure 18. Substitution error rate. ......................................................................... 96
Figure 19. Test case study using BL!P for the analysis of 223 predicted proteins
from E. fergusonii ECD227. ............................................................................... 109
Figure 20. Phylogenetic tree of 110 enteric bacteria and E. fergusonii ECD-227.
............................................................................................................................. 120
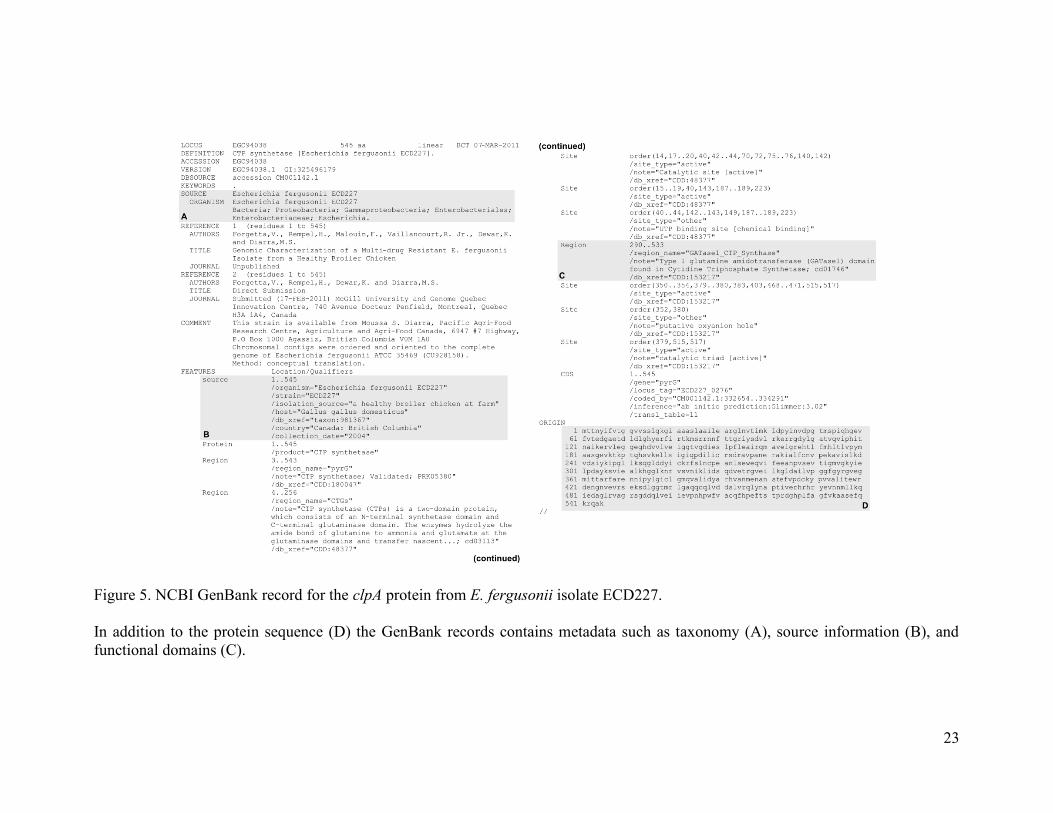
Figure 21. A linear representation of the ECD-227 chromosome. ..................... 123
Figure 22. Linear representation of the two largest ECD-227 plasmids;
pECD227_112 and pECD227_113. .................................................................... 125
Figure 23. Mortality rates (%) induced by ECD-227 compared to that induced by
clinically virulent E. coli D06-2195 and non-virulent E. coli K-12 in a day-old
chicks infection model. ....................................................................................... 139

xi
LIST OF TABLES
Table 1. Characteristics of DNA sequencing platforms. ........................................ 9
Table 2. List of cgb tasks and their commands ..................................................... 36
Table 3. Characteristics of C. difficile isolates used in this study......................... 48
Table 4. Characteristics of C. difficile genome assemblies used in this study...... 49
Table 5. Targets for species-level detection of C. difficile. .................................. 59
Table 6. Summary of participating core facilities and sequencing yield. ............. 83
Table 7. Overview of the O. novo-ulmi strain H327 genome assembly. .............. 88
Table 8. Homopolymer measurement statistics. ................................................... 93
Table 9. Overview of the ECD-227 genome. ..................................................... 122
Table 10. Minimal inhibitory concentrations (MICs) of 28 antibiotics against
ECD-227. ............................................................................................................ 128
Table 11. Antimicrobial resistance-associated genes of ECD-227. .................... 129
Table 12. Gene content of different genomic islands of ECD-227..................... 133
Table 13. Virulence-associated genes of ECD-227. ........................................... 137

xii
TABLE OF ABBREVIATIONS
ABI Applied Biosystems
ABRF Association of Biomolecular Resource Facilities
AJAX Asynchronous JavaScript and XML
AMR Antimicrobial resistance
APEC Avian pathogenic Escherichia coli
ATCC American Type Culture Collection
BLAST Basic Local Alignment Search Tool
BLAT BLAST-like alignment tool
bp base pair
CDI Clostridium difficile infection
CDN Canadian
CFU Colony-forming unit
DDBJ DNA Data Bank of Japan
DNA Deoxyribonucleic acid
DSRG DNA Sequencing Research Group
EHEC Enterohaemorrhagic Escherichia coli
EMBL European Molecular Biology Laboratory
EST Expressed sequence tag
FAQ Frequently Asked Questions
Gb giga base pairs
GS Genome Sequencer
HTML HyperText Markup Language
INSDC International Nucleotide Sequence Database Collaboration
JSON JavaScript Object Notation
kb kilo base pairs
Mb mega base pair
MPS Massively parallel DNA sequencing
MUGQIC McGill University and Génome Québec Innovation Centre
NCBI National Center for Biotechnology Information
nt nucleotide
OS Operating system
PCR Polymerase chain reaction
PDB Protein Data Bank
PFGE Pulsed-Field Gel Electrophoresis
PIR Protein Information Resource
PRF Protein Research Foundation
RNA Ribonucleic acid
SDA Severe disease-associated
SNP Single-nucleotide polymorphism
UCSC University of California, Santa Cruz
UK United Kingdom
UPEC Uropathogenic Escherichia coli
US United States
WGS Whole genome sequencing

xiii
ACKNOWLEDGEMENTS
Above all, I am grateful to my supervisor, Ken Dewar. His support,
encouragement, and (sometimes witty) comments enabled me to achieve a high
standard in scholarship and innovation. This dissertation benefited greatly from
his critique and drive for clarity, cohesion, and coherence. I value our friendship
and look forward to future collaborative endeavors.
I thank my supervisory committee, Joan Bartlett, Marcel Behr, Andre Dascal, and
Mathieu Blanchette, for their pertinent observations and guidance. I am also
thankful to Rob Sladek for his guidance during the early stages of thesis writing. I
am indebted to the DNA sequencing platform at the McGill University and
Genome Quebec Innovation Centre for their excellent work. Also at the Genome
Centre, I thank Gary Leveque, Pascale Marquis, and Jessica Wasserscheid for
testing and using my software programs and providing analytical support. Also, I
thank Kevin Ha, Tony Kwan, Sudeep Mehrotra, and Carl Murie, for helpful
bioinformatics discussions. I thank Joan Bartlett, Nikoleta Juretic, Caroline
Vincent, Sudeep Mehrotra and Carl Murie for thesis revisions and comments. I
thank Thomas Leslie and Kandace Springer of the Department of Human Genetics,
whose diligent administrative work made my graduates studies all the more
enjoyable. From Microsoft Research, I thank my mentor Simon Mercer for
offering me the opportunity to work/play in such a great environment. I thank the
Canadian Institutes of Health Research for awarding me a Doctoral Research
Award.
I am beholden to my parents, Anna and Giovanni, for providing the foundation
and support upon which this thesis is built. Also, I thank my three sisters Marisa,
Alba, and Valerie, who have been my personal cheerleaders from the start.
Lastly, I thank my wife, Zulay, for her endless love, support, and encouragement.
Our relationship began around the same time as this research began, and as this
thesis ends we embark on a new journey together as Mom and Dad. I dedicate this
thesis to our son Liam, who I will love and support forever.

xiv
ORIGINALITY AND CONTRIBUTIONS TO KNOWLEDGE
In this thesis I have developed three software tools. These tools were used to
analyze data from three genome projects. Each tool has an original element:
Cgb automates the creation of custom UCSC Genome Browsers. Cgb is available
at https://github.com/vforget/cgb and has a manuscript in preparation (Chapter 2).
ContiGo is a general purpose tool for the analysis of genome assemblies that
operates within a web browser. The program is available at https://github.com/
vforget/contigo and has a manuscript in preparation (Chapter 4).
BL!P is a program to automate NCBI BLAST search and dynamically explore
results. The program is available at http://blip.codeplex.com and has a manuscript
in preparation (Chapter 6).
Example demonstrations are made available on the website of each tool.
Combinations of these tools were used to analyze data from three genome
projects, leading to the following contributions to scientific knowledge:
The comparative genome analysis of Clostridium difficile discovered genetic
markers associated with severe disease strains or those that could detect C.
difficile at the species level. I also found that the C. difficile pan-genome is larger
than previously estimated. These finding are published in the Journal of Clinical
Microbiology (Forgetta et al., 2011) (Chapter 3).
This study determined that the Roche/454 GS-FLX Platform is reproducible
across tested core sequencing facilities. I also produced a high-quality genome
sequence of the fungal pathogen Ophiostoma novo-ulmi. These finding are in
preparation to be submitted for publication (Chapter 5).
I characterized the genome sequence of a pathogenic and multi-drug resistant
strain of E. fergusonii from poultry. These finding are published in Poultry
Science (Forgetta et al., 2012) (Chapter 7).

1
PART I: INTRODUCTION

2
CHAPTER 1: Bioinformatics and Genomics
Bioinformatics is intertwined throughout all aspects of genome analysis; from the
collection and processing of data to the analysis of results. Primarily, this is due to
the large data sets generated by high throughput DNA sequencing platforms.
Conventionally, genome analysis involves the use of sophisticated software, and
is largely performed by those with prior experience in bioinformatics using
adequate computational resources. This introduction aims to concisely describe
these three aspects — bioinformatics, genomic analysis, and DNA sequencing
platforms — and to demonstrate that a gap currently exists between genomic data
analysis and the biologist. First, I will concisely review the history of
bioinformatics; how it evolved from its early studies of molecular biology up to
its highly pervasive role in genomics research. Following this, I will review how
technological advancements in DNA sequencing platforms have transformed
genomic research, with particular emphasis on whole genome sequencing (WGS).
I will then continue to review the history of bioinformatics within the context of
WGS, focusing on three stages in a genome project: [i] assessment of a genome
assembly, [ii] display and integrated analysis of genomic data, and [iii] deriving
biological insight using public information. A short synthesis follow this
introduction, postulating as others have that there is a gap between biologists and
the ability to analyze large genomic data sets (McPherson, 2009; Morales &
Holben, 2011; Perez-Enciso & Ferretti, 2010; Stapley et al., 2010; Zhang et al.,
2011). The research objectives will state how I plan to address this gap between
genome analysis and the biologist. The introduction will conclude by outlining the
structure of this dissertation.
Concise History of Bioinformatics
Searls states that bioinformatics is the balanced combination of “episteme”, or
knowledge, and “techne”, or know-how (Searls, 2010). It is an interdisciplinary
enterprise that combines the fields of biology and computer science. As such,

3
bioinformatics concerns itself not only with the development of computational
tools, but also their use in deriving scientific knowledge from biological data.
During the late 1960s and early 1970s, when bioinformatics was in its infancy, it
was used primarily to understand aspects of molecular biology, such as phylogeny
(Fitch & Margoliash, 1967), evolution (Kimura, 1969), or the accessibility of
protein structures (Lee & Richards, 1971). The 1970s and 1980s saw further
developments in molecular biology, such as computing evolutionary distances
(Sellers, 1974) and approximate string matching (Ukkonen, 1985). But more
importantly, because we accumulated many nucleotide sequences, we developed
sequence alignment algorithms (Lipman & Pearson, 1985; Smith & Waterman,
1981; Wilbur & Lipman, 1983) and created resources for nucleotide data
submission such as GenBank (Bilofsky et al., 1986) and EMBL (Hamm &
Cameron, 1986), thus making this data publicly accessible and giving other
researchers the ability to analyze it. A few years later, the BLAST search tool was
created (Altschul et al., 1990) and its use via the internet to search GenBank
(Altschul et al., 1997) remains as the first foray into bioinformatics for many
biologists. Up to the early 1990s, bioinformatics was primarily used to analyze
data produced by a laboratory experiment, such as a DNA sequence obtained
from an autoradiograph using the Sanger sequencing method (Sanger & Coulson,
1975).
Approaching the new millennium, advances made in DNA sequencing technology
enabled us to sequence entire genomes (Fleischmann et al., 1995). During this
time, bioinformatics tools were employed in every step of a genome project; from
determining the nucleotide sequence from a chromatogram (Ewing & Green,
1998; Ewing et al., 1998), to assessing the quality of DNA sequences (Chou &
Holmes, 2001), to managing and storing data (Parsons et al., 1999), to assembling
the genome from sequence reads (Gordon et al., 1998), to predicting genes
(Delcher et al., 1999), and finally, to submission of data to public repositories
such as GenBank (http://www.ncbi.nlm.nih.gov/Sequin/). Because it provided a
myriad of tools that are necessary for the collection, processing, and analysis of

4
genomic data, bioinformatics became a sophisticated and necessary component of
genome analysis.
During the genomics era, the progression of bioinformatics was impacted greatly
by multiple technological advancements in DNA sequencing. Therefore, to
provide proper context, I will briefly review these advancements in technology
and their impact within the context of genome sequencing. Following this, I will
continue the review of bioinformatics with emphasis on genome analysis.
Evolution of Genome Sequencing
The history of genome sequencing spans roughly 40 years and includes multiple
technological advancements. It has continually strived towards a singular goal; to
rapidly and accurately determine the DNA sequence of an organism’s genome.
A genome is the complete genetically heritable information of an organism. It is
encoded as either RNA in some viruses, or as DNA in most other life forms. Most
often genomic DNA or RNA is present in double-stranded form, but some viruses
have single stranded DNA or RNA, such as the hepatitis C virus (Kato, 2000).
The genome plays a central role in determining the observable traits of an
organism, with genes and their regulators, known as transcription factors, being
the most well studied genomic elements that contribute to phenotype. The genome
is dynamic, with changes to the sequence occurring at varying scales. If these
changes occur within a functional element of a DNA sequence they may alter
phenotype. For example, single nucleotide changes are responsible for diseases
such as cystic fibrosis (Bobadilla et al., 2002), neurofibromatosis (MacCollin et
al., 1996), and sickle cell anemia (Rees et al., 2010) in humans. Alternatively,
short repetitive regions such as tri-nucleotide repeats, which are susceptible to
slippage during DNA replication, have been implicated in many human diseases
(Fu et al., 1991; Lindblad et al., 1996; Walker, 2007). At yet an even larger scale,
retrotransposons — genetic elements of hundreds to thousands of base pairs in
length — can amplify themselves and constitute a large portion of the mammalian
genome (Lander et al., 2001; Waterston et al., 2002). Most retrotransposons are

5
inactive, but studies suggest that they serve some functional role (Chueh et al.,
2009; Pi et al., 2010; Schmidt et al., 2012). Within a population genetic variants
can be common or rare. In humans, common variants associated with diseases,
such as Alzheimer’s (Sillen et al., 2008), are typically of low penetrance,
contributing to phenotype in combination with other genetic variants or the
environment. Conversely, genetic variants of low frequency that are associated
with disease are in general highly penetrant and include the diseases mentioned
previously (cystic fibrosis, Huntington’s, etc). Due to the genome’s importance in
determining phenotype, the scientific community has continually strived to
improve DNA sequencing technologies in order to determine the complete DNA
sequence of a genome. This has provided a foundation upon which we investigate
how the genome’s elements function and how this function is impacted by types
of DNA variation.
During the late 1970s, DNA sequencing became a mainstream laboratory method
because of advances made by Frederick Sanger (Sanger et al., 1977; Sanger &
Coulson, 1975). The throughput of the dideoxynucleotide sequencing method by
today’s standards is low, producing a few DNA sequence readouts (or reads) of a
few hundred bases per experiment. Nonetheless, this method was easy to use, and
lead to the genome sequence of the bacteriophage φX174 (5,375 nucleotides)
(Sanger, et al., 1977), the human mitochondrion (16,569 base pairs) (Anderson et
al., 1981) and bacteriophage λ (48,502 base pairs) (Sanger et al., 1982). Since that
time, there have been at least two technological advancements in DNA
sequencing technology, each of which has resulted in dramatic increases in
throughput (Stratton et al., 2009) (Figure 1).
The first major advancement was the optimization and automation of the
dideoxynucleotide DNA sequencing method into fluorescence-based capillary
sequencers such the ABI PRISM 3700/3730 DNA Analyzer from Applied
Biosystems. These platforms are still in use today and are capable of generating
hundreds of DNA sequence reads per instrument per day. The late 1990s’ were
highlighted by several laboratories implementing these platforms on a massive

6
scale (hundreds per lab), and with the aid of automated data collection, allowing
us to sequence the genome of reference organisms, such as human (Lander, et al.,
2001) and mouse (Waterston, et al., 2002). These projects employed a
hierarchical approach to genome sequencing (or hybrid thereof), where the
genome is fragmented into overlapping large-insert clones followed by shotgun
sequencing of these intermediates. This hierarchical process in combination with
the large number of DNA templates needed for shotgun sequencing made
sequencing entire genomes relatively costly and time consuming even for smaller
genomes. Even today, using the ABI 3730xl platform to obtain the DNA sequence
of a small bacterial genome (only 4 million base pairs (Mb)) using the shotgun
method would cost roughly C$240,000 and occupy four DNA sequencers for
about 5 weeks (computed using the Genome Project Cost Calculator (Forgetta &
Dewar, 2005)).

7
Figure 1. Improvements in DNA sequencing technology.
DNA sequencing technology has advanced considerably since dideoxynucleotide
method using manual gel slabs. Initial advancements refined and automated this
method into fluorescence-based capillary sequencers (blue). Massively parallel
sequencing (red) employed numerous new methods, increasing throughput
dramatically while also reducing cost. Single molecule sequencing platforms
promise further increases in throughput without DNA amplification. Reprinted by
permission from Macmillan Publishers Ltd: Nature (Stratton, et al., 2009),
copyright (2009).

8
With the advent of massively parallel DNA sequencing technologies (MPS) in
2005 this completely changed. These technologies combined advancements made
in DNA amplification and sequencing chemistries (Ronaghi et al., 1996; Ronaghi
et al., 1998; Shendure et al., 2005) with dramatic miniaturization and
parallelization of individual DNA sequencing reactions (Margulies et al., 2005;
Shendure, et al., 2005). These advancements were commercialized into DNA
sequencing platforms capable of generating hundreds of thousands to millions of
DNA sequence reads over a relatively short period of time, and at a substantially
lower cost than previous dideoxynucleotide-based technologies such as Applied
Biosystems ABI 3730xl (Table 1). Also, in contrast to the hierarchical strategy
used for past reference genomes, these technologies produce sequence data for an
entire genome.
In the 2006-2011 period, there were three MPS platforms in widespread use: the
Illumina®/Solexa Genome Analyzer (Bentley et al., 2008), the Roche/454
Genome Sequencer (GS) (Margulies, et al., 2005), and Applied Biosystems
SOLiD™ System (Shendure, et al., 2005). Each platform differs in cost and
throughput, but all are able to generate on average hundreds of thousands to
millions of sequence reads within a one to two week time frame (Table 1). For
example, as of late 2011, the cost to sequence a small bacterial genome (~4 Mb)
using the Roche/454 GS-FLX Titanium platform was below C$4,000 and could
be completed within one week. This platform was used to genome sequence the
bacterial strains in Chapter 3 (Forgetta, et al., 2011) and Chapter 7 (Forgetta, et
al., 2012), and the fungal genome in Chapter 5 (in preparation). This increased
throughput and reduced cost has led to a growing demand for whole genome
sequencing from biologists studying a diverse set of organisms. This growth can
be observed by the increasing number of new species being submitted to the
NCBI Genome database, as well as the increase in the cumulative total number of
genomes, which includes the sequencing of multiple strains from the same species
(Figure 2).

9
Table 1. Characteristics of DNA sequencing platforms.
System (Vendor/Version) Release
Date Reads
Read Length
(bp)
Output (Mb)
Run Time (hrs)
Cost/ Run ($)
Runs/ Genome*^
Time/ Genome
(hrs)
Cost/Mb ($)
Cost/ Genome
($)
Applied Biosystems(ABI)/3730xl 2003
96
700
0.0672
2
200
1,191
2,382
2,976.19
238,095.24
Roche/454 GS 20 2005
100,000
200
20
12 10,000
4
48
500.00
40,000.00
Illumina/GAIIx 2006
320,000,000
216
69,120
288 10,000
1
288
0.14
11.57
ABI/SOLiD 2007
1,000,000,000
85
85,000
360 20,000
1
360
0.24
18.82
Roche/454 GS FLX Titanium 2008
1,200,000
450
540
12 10,000
1
12
18.52
1,481.48
Illumina/HiSeq2000 2010
1,200,000,000
300
360,000
288 24,000
1
288
0.07
5.33
Life Technologies/Ion Torrent 2011
2,000,000
220
440
4 1,000
1
4
2.27
181.82
Illumina/MiSeq 2011
13,500,000
500
6,750
40 2,000
1
40
0.30
23.70
Pacific Biosciences/RS 2011
25,000
2,500
63
2 500
2
4
8.00
640.00
Roche/454 GS FLX+ 2012
1,200,000
650
780
26 10,000
1
26
12.82
1,025.64
Illumina/HiSeq2500 2012
300,000,000
300
90,000
40 6,000
1
40
0.07
5.33
Life Technologies/Ion Proton Q2-2012
500,000,000
220
110,000
12 1,500
1
12
0.01
1.09
* Genome size 4Mb, 20x depth of coverage, i.e., minimum 80Mb output required ^ Values rounded to integer, multiple genomes per run possible

10
Figure 2. Species counts from the NCBI genome project database.
As of 2011, the NCBI genome project database has accumulated genome
sequences from over 3,000 species (dotted line). The number of new species
deposited on a yearly basis has increased since 2003 (bars), with 910 new species
deposited in 2011 alone.
0
500
1,000
1,500
2,000
2,500
3,000
3,500
2003 2004 2005 2006 2007 2008 2009 2010 2011
Sp
ecie
s C
ou
nt
Year of Database Submission
11
Throughout this growth period and up to present today, MPS platforms are
continually being improved upon and include the release of a new platform, the
Ion Torrent by Life Technologies (Rothberg et al., 2011). In general, these
improvements are producing a greater number of longer reads for less cost. Also,
these platforms are increasingly being applied to other areas of research, such as
measuring gene expression (Morin et al., 2008), DNA methylation status
(Korshunova et al., 2008), and protein-DNA interactions (D. S. Johnson et al.,
2007).
In addition to differences in cost and throughput, current MPS platforms also vary
in their error profiles (Gilles et al., 2011; Nakamura et al., 2011; Victoria et al.,
2012). For instance, the Illumina®/Solexa Genome Analyzer is susceptible to
substitution-type error (Victoria, et al., 2012), whereas the Roche/454 Genome
Sequencer is prone to incorrectly sequencing long monomeric repeats (Balzer et
al., 2010; Gilles, et al., 2011; Margulies, et al., 2005)(Chapter 5). These platform-
specific error rates further complicate data analysis, particularly when sequence
data from these platforms are combined. As a result, multiple bioinformatics
tools begun to emerge that model these platform specific error rates (Balzer, et al.,
2010; McElroy et al., 2012; Richter et al., 2008).
Currently, we are witnessing yet another change in DNA sequencing technology.
In addition to providing even longer reads (>1000 bp), platforms such as the
Pacific Biosciences RS (Eid et al., 2009) and the upcoming Oxford Nanopore
(http://www.nanoporetech.com) will sequence single DNA molecules, which is in
contrast to existing MPS platforms that require DNA amplification to achieve
sufficient signal for nucleotide detection. Single molecule sequencing is
advantageous because it avoids potential bias caused by DNA amplification and
reduces costs further (Table 1). Also, these systems are able to directly detect
methylated nucleotides (Flusberg et al., 2010), measure enzyme kinetics of single
polymerase molecules (Metzker, 2009), or monitor in real-time tRNA transit
within ribosomes (Uemura et al., 2010). The Oxford Nanopore also has the

12
potential to identify proteins using aptamer oligonucleotides (Cheley et al., 2006;
Howorka et al., 2004).
Coevolution of Bioinformatics and Genome Analysis
Genome sequencing and analysis relies on computers and bioinformatics to
analyze large and complex datasets. For instance, DNA sequencing even a small
bacterial genome will generate a few hundred thousand sequence reads that will
assemble into a genome sequence that contains a few million base pairs and a few
thousands genes. Consequently, a myriad of sophisticated bioinformatics tools
have been developed to analyze data across the entire lifespan of a genome
project. During this lifespan, a genomic data passes through three important steps.
These three steps will be described in the sections that follow:
1. Assessment of a genome assembly; how well the genome was pieced
together from individual sequence reads;
2. Display and integrated analysis of genomic data; how we visualize and
interact with a genome sequence and its annotations;
3. Deriving biological insight using public information; how we compare
genomic data to information in public repositories.
Assessment of a Genome Assembly
In genomics, assembly is the process of piecing together a genome sequence from
the set of individual sequence reads. The algorithm utilized by many assembly
programs can be generalized to:
i. determine the pair-wise similarity between sequence reads,
ii. group sufficiently similar reads together, and,

13
iii. compute a consensus sequence from the read overlaps within each
group.
The resulting assembly will consist of contiguous DNA sequences called contigs,
which represent genomic regions where the assembly program was capable of
merging (or piling up) reads and computing a consensus sequence (Figure 3).

14
Figure 3. The genome sequencing and assembly process.
Whole genome sequencing begins with the fragmenting of the genome into small
DNA templates. Templates are DNA sequenced, producing a set of sequence
reads that are assembled into a set of contigs. Contigs are assembled by
computing the overlap between sequence reads, forming a pileup from which the
contig consensus sequence is determined.

15
Furthermore, contigs can be ordered and oriented into a draft genome sequence
using two methods. One method orders and orients contigs in relation to an
existing genome sequence (i.e., reference) of a similar strain or species. This was
the approach used for the Clostridium difficile strains in Chapter 3 (Forgetta, et
al., 2011) and Escherichia fergusonii ECD227 in Chapter 7 (Forgetta, et al.,
2012). The second method, which does not rely on a reference, incorporates pair-
end reads into the assembly process (Guillaume et al., 2009). This method was
used for the fungus Ophiostoma novo-ulmi in Chapter 5 (in preparation). This
draft genome sequence can be further refined in a process named genome
finishing. An important aspect of genome finishing is gap closure, where regions
between adjacent contigs (i.e., gaps) are resolved by designing primers to amplify
and DNA sequence the intervening region. This is followed by local re-assembly
of these read sequences with the adjacent contigs, resulting in a longer consensus
sequence. We utilized this gap closing procedure for several strains of C. difficile
in Chapter 3 (Forgetta, et al., 2011).
Multiple factors can negatively affect the quality of a genome assembly, because
of elements within the genome itself or the performance of the DNA sequencing
experiment. For example, if the genome contains elements such as repeats or
paralogous genes, the assembly process may falsely order these elements or
merge them into one contig (Phillippy et al., 2008). Errors such as these have
been observed in the human genome (Bailey et al., 2001; Eichler, 2001), and
when they occur in regions associated with human disease (Mazzarella &
Schlessinger, 1998) may lead to false associations. Another factor that can impact
the quality of an assembly is low read coverage, which can be due to insufficient
reads from the sequencing experiment, or the assembly process itself. Low read
coverage may produce erroneous base calls in the contig sequence (Hubisz et al.,
2011), which will negatively affect downstream analyses. For example, a
sequence error may falsely predict a stop codon within a coding region, resulting
in the false prediction of gene structure (Hoff, 2009).

16
In general, assessment of a genome assembly aims to answer the following
questions: “Is the assembly of sufficient coverage, or is more sequencing
required?”, “What is the high-quality portion of the assembly and what artifacts,
such as collapsed repeats, could impact downstream analysis?” Finding answers
to these types of questions is typically performed using an assembly viewer, as
well as additional methods such as spreadsheets that display statistics about
contigs, such as average size or average depth of read coverage. Other in silico
methods used to evaluate genome assemblies include the consistency of mate-pair
(or paired-end) insert sizes, the percentage of high quality bases, as well as
comparative analyses such as alignment of contigs or scaffolds to the genome
sequence of a closely related strain or species, or assessing the completeness of
gene content by aligning EST sequences. In addition to purely computational
analyses, traditional experimental methods can also be used to quality assess a
genome assembly, such as comparing chromosomal sizes as determined by PFGE
to scaffolds lengths, and the comparison of results from optical mapping or
restriction digests to their in silico predictions.
In the late 1990s, during the era of capillary-based fluorescence DNA sequencing
platforms, assembly viewers were developed to support reference genome
projects, and include programs such as Consed (Gordon, et al., 1998) and the
Staden sequence analysis package (Staden, 1996). Primarily, these programs were
used by bioinformaticians or genome analysts to refine the local assembly of
large-insert clones by correcting errors and incorporating additional sequence
reads to fill assembly gaps. At the time, these programs were compatible only
with Unix-like operating systems. The Staden package has since been ported to
other operating systems (Bonfield & Whitwham, 2010).
The high cost of genome finishing meant it was used for only small genomes or
for reference genome projects, such as human or mouse. As a result, many
genome assemblies were left in an unfinished draft stage, often containing errors
(Salzberg & Yorke, 2005). In response to this, Schatz et al. (2007) developed
Hawkeye, a program to assist genome finishing, and to increase the quality of

17
draft genome assemblies without finishing by identifying assembly errors. Like
Consed and the early Staden package, Hawkeye is compatible with Unix-like
operating systems, but uniquely offers numerous analytical views of the assembly
to aid in the detection of assembly errors. More modern assembly viewers support
other operating systems such as Microsoft Windows or Mac OS X (Bao et al.,
2009; Hou et al., 2010; Huang & Marth, 2008; Li et al., 2008; Milne et al., 2010).
Recent assembly viewers are tailored towards reference-based genome analyses,
such as identifying genetic variants from the mapping of sequence reads to a
reference genome (Bao, et al., 2009; Huang & Marth, 2008; Li, et al., 2008).
Other recent viewers, including Tablet (Milne, et al., 2010) and MagicViewer
(Hou, et al., 2010), support a more general analysis of a genome assembly;
however, they lack specific functionality to detect assembly errors or to assess the
quality of a genome assembly. All currently available assembly viewers require
installation onto a personal computer and a local copy of the genome assembly.
This quality assessed genome sequence is the foundation upon which we overlay
biological information such as the location of genes or repeats. The section that
follows describes tools that assist in the display and integrated analysis of a
genome sequence and the elements it contains.
Display and Integrated Analysis of Genomic Data
A genome sequence can be simply abstracted as the one-dimensional order of
nucleotides along a horizontal axis, with the position of nucleotides ordered
horizontally from left to right. Upon this coordinate system, we can position
genomic elements, such as genes, by defining where they start and end. This
process of giving meaning to regions in the genome sequence is defined as
annotation, and can represent static or dynamic content. Static elements include
genes, repeats, or transcription factor binding sites, and dynamic elements include
gene expression values from a particular tissue at a specific point in time. These
annotations can be represented as a second dimension to the genome sequence;
for any given position or range, there may exist one or more annotations, and
these annotations are vertically stacked from top to bottom as tracks of

18
information. Representing a genome sequence along with its annotations in this
manner is a fundamental feature of modern genome browsers (Hubbard et al.,
2002; Kent et al., 2002; Robinson et al., 2011; Stein et al., 2002); software
programs used to view and analyze genome annotations.
An example of using a genome browser to integrate and display genomic data is
presented in Figure 4. Using a custom instance of the UCSC Genome Browser
(created using cgb, see Chapter 2), this figure illustrates a region in the C. difficile
genome (Forgetta, et al., 2011) containing annotations for static elements such as
genes and cellular localization, as well as dynamic elements, such as peptides
from proteomics experiment on a cell-wall protein extract (LaBoissière et al.,
2005). Visualizing genomic data in this manner allows us to correlate information
across multiple annotations. For instance, in Figure 4 we observe that the slpA
gene (top-most track), which is predicted to be expressed in the bacterial cell wall
(middle track), has more peptides associated with it than the neighboring cell wall
genes (bottom track). Also, genes in the vicinity which are predicted to be
elsewhere in the cell have no mapped peptides (Figure 4). These observations
suggest that slpA is present in greater abundance on the cell-wall in relation to
other predicted cell wall proteins, and that our extraction method is specific to
proteins from this cellular location (LaBoissière, et al., 2005). In addition to these
types of correlation-based analyses, genome browsers can also be used to
visualize the genome-wide distribution of an annotation such as cross-species
sequence conservation, with areas in the genome with exceptional trends
indicating potentially biologically relevant events. For example, genome regions
with excessive conservation suggest evolutionary constraint (Bejerano et al.,
2004) and may possess biological function (Cheley, et al., 2006).

19
Figure 4. A custom instance of the UCSC Genome Browser for C. difficile isolate
QCD-66c26.
The screenshot depicts a 36kb region of the C. difficile genome containing the
slpA (name in black background) and neighboring genes. Each gene has a
prediction for protein localization (colored coded). Individual peptides from a
proteomics experiment that were mapped to the genome sequence are depicted
below the cellular localization track (black).

20
Available genome browsers can be divided into two categories; those that are
internet accessible, operating from within a web browser, and those that are
standalone desktop applications. Of the internet-based genome browsers created
to house reference genomes, such as human (Lander, et al., 2001) and mouse
(Waterston, et al., 2002), four are currently in widespread use; the UCSC Genome
Browser (Kent, et al., 2002), the Ensembl Genome Browser (Flicek et al., 2011),
the NCBI Map Viewer (NCBI, 2011) and the Generic Genome Browser (Stein, et
al., 2002). The desktop-based genome browsers are mainly used to assist the
manual curation of genome annotations (Lewis et al., 2002), or to visualize small
reference genomes (Rutherford et al., 2000). Genome browsers typically include
tools to search, mine, and filter the annotation database (Haider et al., 2009;
Karolchik et al., 2004), as well as tools for sequence alignment such as BLAST
(Altschul, et al., 1990; Kent, 2002) and BLAT (Kent, 2002). Also, the internet-
based genome browsers support custom annotations, such as loading results from
experiments, or the filtering and combining of existing annotations. Of the four
internet-based browsers mentioned, only the Generic Genome Browser is
designed to support non-reference genomes via a semi-guided installation of the
source code and genome data on a web server.
Up to this stage, genomic data analysis has relied chiefly on internally generated
data sets; a genome assembly and a genome sequence with annotations. However,
another important process in a genome project is comparing internally generated
genomic data to publicly available information. Performing such comparisons
allows us to investigate the genetic relationships to other species or strains
(phylogeny), and to validate or discover the function of genes and other genomic
elements (functional annotation).
Deriving biological insight using public information
In the biological sciences, public data repositories play a crucial role in storing,
disseminating, and curating information. This information includes the sequence
of genomes, genes, and proteins, as well as metadata about the biological function
and taxonomic information for each sequence. The largest public repository of

21
DNA and RNA sequences is organized by the International Nucleotide Sequence
Database Collaboration (INSDC), which is an international collaboration between
three organizations (DNA Databank of Japan (DDBJ) at the National Institute for
Genetics in Mishima, Japan; the European Molecular Biology Laboratory’s
European Bioinformatics Institute (EMBL-EBI) in Hinxton, UK; and the National
Center for Biotechnology Information (NCBI) in Bethesda, Maryland, USA) to
exchange biological sequence data. Within NCBI, biological sequences and
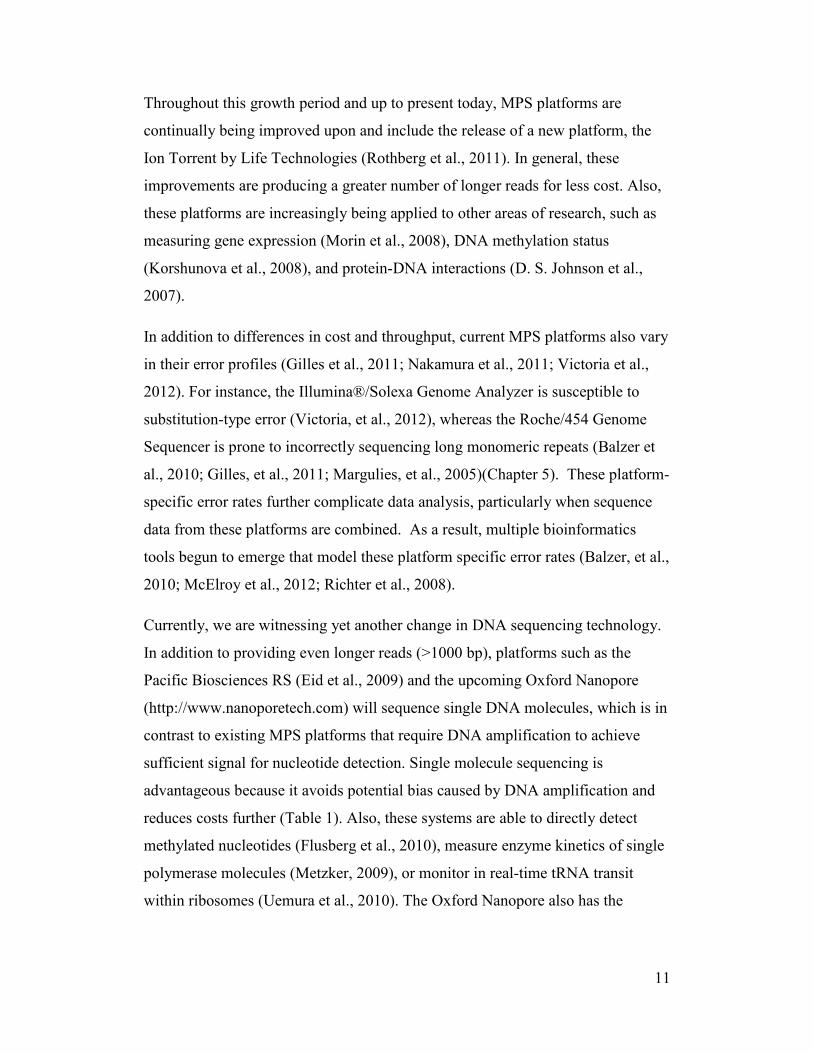
associated information are stored in the GenBank database (Benson et al., 2011).
Protein sequences stored in NCBI GenBank include records from the
UniProtKB/SwissProt (Magrane & Consortium, 2011), PIR (Wu et al., 2002),
PRF (http://www.prf.or.jp), and PDB (Berman et al., 2000) databases. As an
example, a GenBank record for the clpA protein from E. fergusonii isolate ECD-
227 (Forgetta, et al., 2012) is presented in Figure 5. In addition to the protein
sequence, such records typically contain metadata concerning the location of
functional domains, as well as information regarding the source of the sequence
(Figure 5). NCBI GenBank contains over 135 million sequence records (as of
May 2012), and is an invaluable asset to biomedical research because it allows
access to the combined knowledge of many researchers from around the world.
A common use of biological sequence databases such as GenBank is to
characterize a novel biological sequence, such as a predicted gene. Using
sequence similarity, the function and taxonomic classification of a biological
sequence can be inferred by comparing its sequence to those within public
repositories. For example, a predicted gene that is highly similar to an already
characterized sequence in a public repository may have a similar function or be of
a related species or strain. To enable this type of analysis, public repositories offer
the ability to perform sequence similarity searches against their biological
sequence databases. A leading method used for biological sequence search is
using the basic local alignment search tool (Altschul, et al., 1990), or BLAST,
against the NCBI sequence databases, such as GenBank. For example, the
annotation of the protease clpA protein from E. fergusonii (Figure 5) was based on
information gathered from comparison to the GenBank database using NCBI

22
BLAST (Forgetta, et al., 2012). The output of searching GenBank using the NCBI
BLAST web service for the clpA protein is presented in Figure 6. Additional
BLAST output formats are also available and are described on the NCBI website
(http://www.ncbi.nlm.nih.gov/books/NBK21097/).
The analysis of the results obtained from querying a few sequences can be
analyzed manually using the NCBI BLAST web service. However, when
analyzing the result from querying a larger sequence dataset, such as the entire
predicted protein set of a bacterial genome, this process becomes more difficult to
accomplish for at least two reasons. First, due to NCBI usage policies
(http://www.ncbi.nlm.nih.gov/blast/Blast.cgi?CMD=Web&PAGE_TYPE=BlastD
ocs&DOC_TYPE=FAQ#Queuetime), the querying of large sequence data sets
(thousands of sequences) is impractical using the NCBI BLAST web-browser
interface. As a result, this often requires us to download and install BLAST and
the NCBI databases locally. Second, querying a large sequence dataset will
undoubtedly result in a large set of alignment results. Manually inspecting these
results is time-consuming and tedious, and bias or error may result due to human
error. Numerous software applications have been developed to address one or
both of these concerns, with their evolution being gradual and towards the use of
graphical user interfaces and advanced data visualizations.
23
Figure 5. NCBI GenBank record for the clpA protein from E. fergusonii isolate ECD227.
In addition to the protein sequence (D) the GenBank records contains metadata such as taxonomy (A), source information (B), and
functional domains (C).

24
Figure 6. Excerpt from the NCBI BLAST output for a protein sequence from E.
fergusonii isolate ECD227 against the GenBank non-redundant database.
For each database hit (A), the NCBI BLAST output includes a one line
description composing the GenBank accession (hyperlinked), a short description
of the sequence, and the alignment statistics (e.g., score [maximum and total]).
The output also includes the pair-wise alignment between the query sequence and
the matched database sequence (B).

25
Developed in 2001, MuSeqBox (Xing & Brendel, 2001) is an application that
post-processes BLAST results obtained from the NCBI BLAST web service or a
local installation of the BLAST and a biological sequence database. It is a
command-line program that filters BLAST output on criteria, such as minimum
percent identity, producing an output in tabular format. Similar to MuSeqBox,
BioParser processes pre-computed BLAST results (Catanho et al., 2006).
However, BioParser stores BLAST results in a relational database, allowing for
the accumulation of results across many executions of the BLAST program and
the filtering of the results via a graphical user interface. The results are stored in
the relational database or can be exported to text files. Further improving the
automatic analysis and filtering of BLAST is the PLAN program (J. He et al.,
2007). This tool is a web browser-based program that uses a local installation of
BLAST. Unlike previously mentioned programs, PLAN is an end-to-end solution
that is accessible via the internet (http://bioinfo.noble.org/plan/). Installation of
the PLAN web platform requires a computer with the necessary software
programs and system administration expertise (see
http://bioinfo.noble.org/plan/docs/install.htm). The BLAST output viewer (BOV)
(Gollapudi et al., 2008) is also web-based and has functionality similar to
MuSeqBox and BioParser. However, unlike these programs it can visualize
multiple pair-wise alignments between two query sequences in graphical format
(for an example see http://cas-bioinfo.cas.unt.edu/cgi-bin/BOV/tutorial.cgi).
Advancing data visualization even further is Circoletto (Darzentas, 2010), which
utilizes the popular Circos (Krzywinski et al., 2009) program to visualize data
using circular organization. In general, these programs are sophisticated, requiring
prior experience in bioinformatics or specific computational resources.

26
Synthesis
The analysis of massive genomic datasets is possible only with the use of
bioinformatics tools, and MPS technologies have made genomics studies
affordable to individual biologists. For many of these biologists, this will be their
first foray into genomic analysis, which commonly involves using software that
requires bioinformatics experience and sufficient computer resources. As a result,
the promise that genome analysis brings to the biologist is only half fulfilled;
providing affordable whole genome data sets without the ability for
straightforward analysis. McPherson was the first to observe such a gap in 2009:
“… the gap between large-scale genome centers and individual investigators may
seem to be growing, not shrinking, as the next generation platforms’ apparent
promise of a ‘Genome Center in a box’ may have only been half delivered,
providing data without a full suite of tools.”
McPherson (2009)
Since 2009, others have commented about this gap in bioinformatics, either
involving an entire sub-field of biology (Morales & Holben, 2011) or more
specifically about computational bottlenecks (Perez-Enciso & Ferretti, 2010;
Zhang, et al., 2011), or concerning the interpretation of results (Stapley, et al.,
2010).

27
Research Objectives
This dissertation describes advances I have made to develop bioinformatics
applications that close this gap between genome analysis and the biologist. To
accomplish this goal, the thesis objectives were to develop applications that:
i. Are intended for researchers with limited computer or bioinformatics
expertise.
ii. Address the limitations of existing software to analyze genomic data from
individual genomics projects, and
iii. Encapsulate the bioinformatics know-how derived from the analytical
processes of real-world genome projects.
During my PhD research, I have conducted bioinformatics analyses across several
genome sequencing projects. These projects were used as vehicles to develop
applications for the following tasks in genome sequence analysis:
i. Display and integrated analysis of genomic data
ii. Assessment of a genome assembly, and
iii. Deriving biological insight using public information.

28
Thesis Outline
This dissertation contains six manuscripts (Chapters 2 to 7) for which I am the
first author. The manuscripts are paired into three parts representing the three
processes listed in the research objectives:
Display and integrated analysis of genomic data (Chapters 2 and 3)
Assessment of a genome assembly (Chapters 4 and 5),
Deriving biological insight using public information (Chapters 6 and 7).
Within each part, the first manuscript concerns the bioinformatics application I
developed (Chapters 2, 4, and 6). The second manuscript concerns the research
that I conducted in the genome sequencing project (Chapters 3, 5, and 7), which
also served as inspiration for the applications. Introducing each part is connecting
text, explaining how limitations I encountered during my genome analyses using
existing software inspired me to develop the application. To conclude the
dissertation (Chapter 8), I will describe the impact my genomics research and
applications have had beyond the scope of this thesis. Also, for each
bioinformatics application, I will discuss aspects for improvement, such as new
features, usability, and scalability to larger data sets.

29
PART II: DISPLAY AND INTEGRATED ANALYSIS OF GENOMIC
DATA

30
Connecting Text
My initial research coincided with a project that aimed to identify DNA-based
diagnostic targets of C. difficile using comparative genomics (Chapter 3)
(Forgetta, et al., 2011). At the time, the Roche/454 GS Platform (Margulies, et al.,
2005) was an emerging technology. As a result, my objective was to develop a
tool to support the assembly, annotation and comparative analyses of genomes
sequenced on this platform. I tested existing tools (Lewis, et al., 2002; Rutherford,
et al., 2000; Stein, et al., 2002), and chose to use the UCSC Genome Browser
(Kent, et al., 2002) because it had superior display capabilities, built-in sequence
analysis tools (i.e., BLAT (Kent, 2002)), advanced data filtering (i.e., the Table
Browser (Karolchik, et al., 2004) and custom annotations (custom tracks). Also,
because it was internet-accessible, it facilitated collaboration among the
researchers and technicians working on the project.
At the time, the UCSC Genome Browser was used to view and analyze publicly
available reference genomes, such as human and mouse, or to establish mirrors of
these genomes at different geographic locations. The UCSC Genome Browser did
not officially support the loading of non-reference genomes, such as multiple C.
difficile genomes. Also, it had no established security measures to restrict access,
a feature that was necessary to limit data access prior to peer-reviewed
publication. For these reasons, I developed automated methods to load non-
reference (or custom) genomes into a locally installed copy of the UCSC Genome
Browser, and to protect it using a username and password. To my knowledge, I
was the first to use the UCSC Genome Browser in this way. The methods I
developed are encapsulated into a program named cgb (Chapter 2, in preparation).
The publicly accessible custom UCSC Genome Browser for C. difficile is
available at http://genomequebec.mcgill.ca/compgen/browser/cgi-bin/hgGateway.
This resource assisted us to assemble, annotate, and analyze 10 C. difficile
genomes. The multiple genome analysis allowed us to identify 18 single
nucleotide polymorphisms that detected multiple severe-disease causing strains,
as well as 12 highly conserved genes that could detect C. difficile at the species

31
level. In addition, our whole genome multiple alignment-based analyses suggest
that the C. difficile pan-genome is three times larger than previously estimated
(Chapter 3) (Forgetta, et al., 2011).
Contribution of Authors
I created cgb and prepared and wrote the manuscript (Chapter 2). The C. difficile
study was conceived by the senior authors of the publication (Forgetta, et al.,
2011). I oversaw and conducted all the data analyses and prepared and wrote the
manuscript (Chapter 3). The sequencing teams at the Genome Center at
Washington University School of Medicine and the McGill University and
Genome Quebec Innovation Centre performed the sequencing of the C. difficile
isolates. The Matthew T. Oughton, M.D., FRCPC, performed aspects of genome
finishing and gap closure for some C. difficile strains, selected candidate genes for
re-sequencing, and designed PCR and sequencing primers. Pascale Marquis was
responsible for genome finishing and gap closure of the remaining C. difficile
strains, as well as aspects of genome annotation.

32
CHAPTER 2: Cgb − A Unix Shell Program to Create Custom Instances of
the UCSC Genome Browser
Vincenzo Forgetta1 & Ken Dewar
1
1Department of Human Genetics, McGill University, Montreal, Quebec, Canada
A modified version of this manuscript is published as an e-print at ArXiv and is
available at
http://arxiv.org/abs/1211.1607
The source code and documentation is available at
http://github.com/vforget/cgb

33
Abstract
The UCSC Genome Browser is a popular tool for the analysis of reference
genomes. Mirrors of the UCSC Genome Browser exist at multiple geographic
locations, and this mirror procedure has been modified to support custom genome
sequences. While straightforward, this procedure is lengthy and tedious and
would benefit from automation, especially when processing many genome
sequences. We present a Unix shell program that facilitates the creation of custom
UCSC Genome Browsers. It automates many steps of the browser creation
process, provides password protection for each browser instance, and automates
the creation of basic annotation tracks. As an example we generate a custom
UCSC Genome Browser for a bacterial genome obtained from a massively
parallel sequencing platform.

34
Introduction
In the past, large institutions sequenced de novo the genome of organisms such as
human (Lander, et al., 2001), mouse (Waterston, et al., 2002) and fly (Adams et
al., 2000), and bioinformatics tools were created to provide the scientific research
community with access to analyzing these reference genome resources. For
instance, the scientific community routinely uses genome browsers to visualize
and analyze a reference genome’s sequence and annotations, with popular
browsers being the UCSC Genome Browser (Kent, et al., 2002), the NCBI Map
Viewer (NCBI, 2011) and the Ensembl Genome Browser (Hubbard, et al., 2002).
These browsers provide a common set of functionality, such as data visualization
and text search, but each also offers functionality that makes them unique. For
example, the UCSC Genome Browser has tight integration with the BLAT
sequence alignment tool (Kent, 2002), advanced database search with the UCSC
Table Browser (Karolchik, et al., 2004), and extensibility via custom annotation
tracks (http://genome.ucsc.edu/FAQ/FAQcustom.html). These features make this
browser a leading resource for the analysis of over 40 reference genomes. As of
mid-2012, the UCSC Genome Browser receives over 600,000 hits per day
(http://genome.ucsc.edu/admin/stats/, accessed 28/05/12), and has been cited in
more than 2,000 peer-reviewed articles.
Today, massive parallel DNA sequencing (MPS) technology (Bentley, et al.,
2008; Margulies, et al., 2005; Shendure, et al., 2005) has reduced the cost of DNA
sequencing dramatically, allowing individual researchers to sequence the genome
of many organisms. However, the UCSC Genome Browser remains primarily as
community-based resource, thus excluding individual researchers from using this
tool in their analysis of non-reference genome sequences. Recently, the mirror site
installation procedure for the UCSC Genome Browser (http://genome.ucsc.edu/
admin/mirror.html) has been modified to support non-reference genome
sequences (http://genomewiki.ucsc.edu/index.php/Minimal_Browser_Installation),
but the procedure is lengthy and tedious, making it cumbersome to perform for
many genome sequences.

35
We have created a Unix shell program, cgb, which facilitates the creation of
custom instances of the UCSC Genome Browser. Each browser instance can be
password-protected and can contain multiple genome sequences. We also include
functionality to build genome sequences from contigs or scaffolds, and to
automatically create basic annotations. Here we briefly describe the
implementation and functionality of cgb, and provide an example usage case.
Methods
Cgb is written in the bash (Bourne-Again shell) scripting language. We chose this
language because of its ubiquity on Unix-like platforms and its ability to execute
the external programs required to setup an instance of the UCSC Genome
Browser. Cgb relies on a functional installation of the UCSC Genome Browser
(for more information see INSTALL.txt that is provided with cgb), but it does not
require reference genome sequences or annotations. Each custom browser
instance is secured using an Apache’s distributed configuration file (.htaccess
file).
We also provide programs to automate the building of a genome sequence from a
set of contigs or scaffolds, and to create browser tracks for contigs, scaffolds,
gaps, depth of read coverage, and GC content. This functionality was developed
in the Python programming language.
Results.
General Functionality
Cgb is a Unix shell program that presents the user with a series of tasks, with each
task pertaining to a particular step in the browser installation process (Table 2).
Prior to executing one or more tasks, the user specifies a new or existing identifier
for the browser instance by setting the CLIENT_NAME variable (for more detail
see Example Usage Case).

36
Table 2. List of cgb tasks and their commands
Task Command(s)
Manage an instance of a UCSC Genome Browser add, remove
Manage "Clade" entries add, remove, list
Manage "Genome" entries for a particular "Clade" add, remove, list
Manage "Build" entries for a particular "Genome" add, remove, list
Add a FASTA a sequence for a Genome Build add
Manage default Genome Builds add, remove, list
Manage BLAT servers for a Genome Build add, remove, list, restart
Add a contig assembly to a Genome Build add
Add a scaffold assembly to a Genome Build add
Add a depth of coverage annotation track to a Genome Build add

37
Each task has a set of commands (add, remove, list, or restart) to manage data
entries that describe each genome sequence (i.e., clade, genome, and build) or that
load a genome sequence and/or annotations into the browser instance (fasta,
contig, scaffold, etc.). The list and remove commands are useful in cases where
errors are committed or data is no longer required. Each command has a required
set of arguments that specify the value of database entries (e.g., build name) or
other properties pertaining to a genome sequence. A full description of these
arguments is available via the cgb help message or in the documentation.
We have also provided extra commands that automate the converting of contigs or
scaffolds into a genome build. By default, contigs or scaffolds are sorted by
decreasing length and merged into one sequence record.
Example Usage Case
To create a custom instance of the UCSC Genome Browser we would execute the
cgb commands listed in Figure 7.
The create_browser command adds a new instance (identified by
ExampleClient1) of the UCSC Genome Browser, and protects the browser
instance by prompting the user to set a username and password (not shown). The
subsequent 4 steps (add_clade, add_genome, add_build, and add_defaultdb)
created entries in the browser’s database. The add_fasta command loads a genome
sequence in FASTA format, and add_blat starts the BLAT servers for this genome
sequence.
Additional genome sequences can be added to the same browser instance (within
or outside the same clade and/or genome), or a new browser instances can be
created by setting a new CLIENT_NAME and repeating the tasks in Figure 7, but
with different values.

38
Figure 7. List of cgb commands for creating a custom UCSC Genome Browser.
Example describes the commands for creating a custom genome browser for the
C. difficile isolate QCD-66c26 chromosome (CM000441.2). Lines beginning with
a pound (#) or dollar sign ($) are comments or commands, respectively.

39
Discussion
By converting a lengthy and tedious procedure into a series of simple tasks, cgb
makes it easier to create custom instances of the UCSC Genome Browser.
Because many of the tasks are non-interactive they can be further automated and
customized by wrapping them into another Unix shell program, or more
interestingly, through a web-browser interface, allowing users with no knowledge
of Unix-like operating systems to create browser instances for non-reference
genome sequences. Cgb demonstrates that existing bioinformatics tools can be
adapted to address changes caused by MPS technologies, thereby reducing
resources needed to develop a new tool.
Acknowledgements
I thank Pascale Marquis and Gary Leveque for user testing. V.F. was the recipient
of a Canadian Institutes of Health Research Doctoral Research Award.

40
CHAPTER 3: Fourteen-Genome Comparison Identifies DNA Markers for
Severe-Disease-Associated Strains of Clostridium difficile
Copyright © 2011, American Society for Microbiology
Citation:
Vincenzo Forgetta, Matthew T. Oughton, Pascale Marquis, Ivan Brukner, Ruth
Blanchette, Kevin Haub, Vince Magrini, Elaine R. Mardis, Dale N. Gerding,
Vivian G. Loo, Mark A. Miller, Michael R. Mulvey, Maja Rupnik, Andre Dascal,
and Ken Dewar. (2011). "Fourteen-genome comparison identifies DNA markers
for severe-disease-associated strains of Clostridium difficile" Journal of Clinical
Microbiology 49(6): 2230-2238.
Reprinted with the permission of the Journal of Clinical Microbiology (JCM).
This is an author-created, uncopyedited electronic version of an article accepted
for publication in JCM. The American Society for Microbiology (ASM),
publisher of JCM, is not responsible for any errors or omissions in this version of
the manuscript or any version derived from it by third parties. The definitive
publisher-authenticated version is available at
http://jcm.asm.org/content/49/6/2230.

41
Abstract
Clostridium difficile is a common cause of infectious diarrhea in hospitalized
patients. Severe and increased incidence of C. difficile infection (CDI) is
associated predominantly with the strain NAP1; however, the existence of other
severe disease-associated (SDA) strains and the extensive genetic diversity across
C. difficile complicates reliable detection and diagnosis. Comparative genome
analysis of 14 sequenced genomes, including a subset of NAP1 isolates, allowed
the assessment of genetic diversity within and between strain types to identify
DNA markers that associate with severe disease. Comparative genome analysis of
14 isolates, including five publicly available strains, allowed the determination
that C. difficile has a core genome of 3.4 Mb, comprising ~3000 genes. Analysis
of the core genome identified candidate DNA markers that were subsequently
evaluated on a multi-strain panel of 177 isolates, representing more than 50
pulsovars and 8 toxinotypes. A subset of 117 isolates from the panel has
associated patient data which allowed assessment of an association between the
DNA markers and severe CDI. We identified 20 candidate DNA markers for
species-wide detection and 10,683 SNPs associated with the predominant SDA
strain (NAP1). A species-wide detection candidate marker, the gene sspA, was
found to be identical across 177 isolates sequenced and lacked significant
similarity to other species. Candidate SNPs in genes CD1269 and CD1265 were
found to associate better with disease severity than currently used diagnostic
markers, as they were also present in the A-B+ strain type. The genetic markers
identified illustrate the potential of comparative genomics for the discovery of
diagnostic DNA-based targets that are species-specific or associated with multiple
severe disease strains.

42
Introduction
Clostridium difficile is the most common cause of infectious diarrhea in
hospitalized patients in the industrialized world (Barbut et al., 1996; S. Johnson &
Gerding, 1998). With symptoms ranging from self-limited diarrhea to the life-
threatening fulminant colitis, C. difficile infection (CDI) has affected hundreds of
thousands of patients worldwide and substantially burdens healthcare resources
(L. Kyne et al., 2002). In particular, CDI has caused increased patient morbidity
and mortality in hospitals throughout the world since 2003, when outbreaks with
increased disease incidence and severity first emerged (Warny et al., 2005), and
from 2004 to 2007 contributed to almost 1000 deaths in the province of Quebec
(Gilca R, 2008). Investigations of these and other outbreaks across Canada, the
United States, and Western Europe led to the recognition of a severe disease-
associated (SDA) strain predominantly responsible for this epidemic (Kuijper et
al., 2006; Loo et al., 2005). This strain has been classified as North American
pulse field type 1 (NAP1), ribotype 027, toxinotype III, or restriction-
endonuclease type BI (McDonald et al., 2005), which we refer to as NAP1.
Outbreaks have also been associated with other SDA strains, such as the
NAP7/toxinotype V/ribotype 078 (NAP7) strain found in cases of human and
animal disease (Goorhuis et al., 2008; Mulvey et al., 2010), and multiple toxin A-
B+ pulsotypes/ribotypes responsible for CDI outbreaks in Ireland, UK, US, and
Canada (al-Barrak et al., 1999; Stabler et al., 2006).
To date, the monitoring of C. difficile infection in a hospital setting has been a
reactive process, where patients are tested after symptoms emerge, usually
employing methods that are time consuming, expensive, and/or lack sufficient
sensitivity (Eastwood et al., 2009; Killgore et al., 2008). Improved tests are
sought in which all at-risk patients can be tested in a rapid, reliable and cost
effective manner (Planche et al., 2008). To address this, DNA-based diagnostic
tests have been developed (Barbut et al., 2009; Sloan et al., 2008; Spigaglia et al.,
2010; Wolff et al., 2009), but they rely primarily on targets from previously
known genomic regions, such as the genes tcdC (Sloan, et al., 2008; Wolff, et al.,

43
2009), gyrA/gyrB (Spigaglia, et al., 2010), and includes numerous commercially
available assays [Xpect toxin A/B test (Remel, Inc., Lenexa, KS); BD GeneOhm™
Cdiff assay (BD Diagnostics, San Diego, CA); ProGastro Cd assay (Prodesse Inc.,
Waukesha, WI); Cepheid Xpert™
C. difficile (Cepheid, Sunnyvale, CA); and
illumigene™
C. difficile (Meridian Bioscience, Inc.)].
With the advent of massively parallel DNA sequencing (MPS) technology
(Margulies, et al., 2005), bacterial whole genome sequencing has become rapid
and affordable, and there are now well over 5,000 completed or in progress
microbial genomes in public databases such as NCBI Entrez. MPS-based genome
sequencing has been used in studies of C. difficile and other human pathogens,
including a comparative genome analysis of 25 isolates that was performed to
provide insight into the molecular evolution of C. difficile (M. He et al., 2010;
Scaria et al., 2010), and in a study of genome comparisons between 3 isolates that
was used to identify potential virulence mechanisms in the NAP1 strain (Stabler
et al., 2009). These studies have confirmed the mobile nature of the C. difficile
genome (Sebaihia et al., 2006) and that genetic diversity among strains is high. In
several studies (M. He, et al., 2010; Janvilisri et al., 2009; Scaria, et al., 2010) the
NAP7/8 strain type has been recognized as highly divergent from other strain
types and that the C. difficile core genome may only be comprised of ~1000 genes
(M. He, et al., 2010; Janvilisri, et al., 2009; Scaria, et al., 2010; Stabler, et al.,
2006). To date, MPS and comparative genome analyses of C. difficile have not
been applied to the search for additional DNA-based diagnostic targets, as has
been done for other human pathogens (Dai et al., 2011; Feng et al., 2011; Garcia
Pelayo et al., 2009; Kuroda et al., 2010).
In this report we describe the comparative analysis of the genomes of 14 isolates
of C. difficile. The genomes of nine isolates, including 6 Eastern Canadian and 3
reference isolates, were sequenced as part of this study, and the genome
sequences from 5 additional publicly available isolates were also used in the
analyses. Our main objective was to identify DNA targets potentially addressing
two major clinical questions: (i) Is the patient infected with C. difficile? and, if so

44
(ii) Is the patient infected with a strain associated with severe disease? We thus
identified DNA-based diagnostic sequences that could be used to detect any
isolate of C. difficile, as well as targets able to discriminate between SDA and
non-SDA strain types. We also used comparative genome analysis to study the
genetic diversity between strain types, estimate the size of the C. difficile core
genome, and begin to investigate the existence of additional loci responsible for
virulence. Candidate targets identified from the 14-genome analysis were
reconfirmed with a larger panel of 177 isolates. Clinical records available for 117
of these isolates were cross-referenced with target alleles to ascertain their
association to disease severity.
Material and Methods
Isolates for Whole Genome Sequencing
Within the available hospital collections, six isolates of the predominant SDA
strain of C. difficile (NAP1) were selected to emphasize variation across
geographic location and time of isolation (QCD-32g58, QCD-66c26, QCD-
97b34, QCD-37x79, QCD-76w55, CIP107932). The remaining three isolates
were a NAP2 strain (QCD-63q42), a SDA NAP7 strain (QCD-23m63), and
reference strain VPI10463 (ATCC43255). Isolates were incubated anaerobically
at 37 oC on 5% Columbia sheep’s blood agar in pure culture, and identified by
standard phenotypic criteria. Genomic DNA from each isolate was extracted
using a standard commercial column-based extraction (QIAamp DNA Mini Kit,
Qiagen, Mississauga, CA), stored in 1X TE buffer (pH 8.0), quantitated by
spectrophotometry (Bio Rad SmartSpec 3000 UV/Visible Spectrophotometer,
Mississauga, CA), visualized by 1% agarose gel electrophoresis and stored at -20
oC until further use.
Whole Genome Sequencing, Gap Closure and Comparative Genome Analysis
All DNA extractions and sequencing experiments were performed at separate
times to minimize the risk of cross-contamination. Isolate QCD-32g58 was

45
sequenced using the first generation Roche-454 GS system (GS20). The
remaining isolates were sequenced later on the second generation Roche/454 GS
GS-FLX system. Contigs (minimum size 500 bases) were ordered and oriented
based on alignment to the finished genome of C. difficile strain 630 (Sebaihia, et
al., 2006). Contigs that could not to be ordered and oriented were placed into
separate scaffolds. Assembly improvement was accomplished by designing
primers flanking each gap, and performing conventional or long-range PCR (as
required by predicted gap size) from the genomic DNA. Bidirectional sequencing
of resulting amplicons was performed on ABI 3730xl systems. Gaps were closed
by aligning genomic and gap-directed amplicon sequences with Consed (Gordon,
et al., 1998). Genes were predicted using GLIMMER 3.01 (Delcher et al., 2007).
Gene function was predicted by aligning its protein sequence against the NCBI nr
database (e-value < 1.0e-20). A whole genome multiple alignment was created
using Multiz-TBA (Blanchette et al., 2004). DNA variation was catalogued that
considered: [i] only alignment blocks with sequence from the 14 genomes, [ii] at
>80% pairwise identity and [iii] contained genotypes with a quality value of >63.
The bootstrap consensus tree was inferred from 100 replicates and constructed
using MEGA 4 (Tamura et al., 2007). The pair-wise genome comparison between
QCD-66c26 and QCD-23m63 was computed using lastz (Harris, 2007), and the
percent identity histogram was generated using a custom Python script.
Validation via Targeted Resequencing
Within available hospital collections, 177 isolates of C. difficile were selected to
assess genetic variation for each candidate locus within the NAP1 strain and
between strains of varying PFGE type. Of the 177 isolates, 170 (91%) were
successfully PCR amplified and DNA sequenced. We also included the 9 isolates
from the whole genome sequencing as sequencing accuracy controls. We also
included a species-level control [C. spiroforme (ATCC 29900)] and a phylum-
level control [Mycobacterium intracellulare (kindly provided by Dr. Marcel Behr,
McGill University Health Centre)]. Genomic DNA was extracted from isolates
using a standard lysis-based column extraction, and DNA yield estimated by

46
spectrophotometry. For each candidate locus primers were designed using
Primer3 (Rozen & Skaletsky, 2000) to amplify regions of roughly 700-1000bp.
PCR and bidirectional sequencing of resulting amplicons was performed on the
ABI 377 platform. Sequence chromatograms were base called using Phred
(Ewing & Green, 1998; Ewing, et al., 1998), and polymorphisms (Q > 39)
catalogued in reference to C. difficile VPI10463.
Results.
Genome Sequencing and Analysis
We performed whole genome sequencing and assembly for nine isolates of C.
difficile (Table 3). Six isolates were of the predominant SDA strain type (NAP1)
and ranged in collection date from 1984 to 2007. The international reference
isolate CIP 107932 (isolated in 1984) and the BI-1 isolate (isolated in Minnesota
in 1988(Razaq et al., 2007)) represented NAP1 isolates predating the 2003-2007
CDI epidemic. The other four NAP1 isolates (QCD-32g58, QCD-66c26, QCD-
37x79, QCD-97b34) were collected during the CDI epidemic from three locations
across Canada. In addition to the six NAP1 isolates, we sequenced and assembled
a SDA NAP7/toxinotype V/ribotype 078 (NAP7) isolate, QCD-23m63, collected
in 2007. The two non-SDA isolates sequenced were international reference strain
VPI10463 (ATCC43255) and a NAP2 isolate (QCD-63q42), collected in 1980
and 2005, respectively. We also used the publicly available genome assemblies of
another five isolates, including two additional NAP1 isolates (R20291 and CD196
(Stabler, et al., 2009)), NAP7 and NAP8 isolates (Human Microbiome Project),
and strain 630 (Sebaihia, et al., 2006) (Table 3). Genome assembly details and the
NCBI/GenBank accession numbers for all 14 isolates are given in Table 4.
The nine genomes sequenced in this study ranged in size from 3.94 Mb (QCD-
23m63) to 4.44 Mb (QCD-63q42) (Table 4), which corresponds to the range of
genome sizes (3.90 to 4.29 Mb) observed in other C. difficile genome sequencing
projects (Table 4). We generated 9 draft genome assemblies, where the contig
numbers in the assembly ranged from 16 (QCD-32g58) to 66 (BI-1). However,

47
the largest assembled contigs were >350 kb for all isolates, and the contig N80
calculation indicated that 80% of the assembled genomes was found in contigs of
>59 kb (BI-1) to contigs of >300 kb (QCD-32g58). Given that C. difficile has a
typical bacterial gene density (80-85%) and typical bacterial gene lengths (500-
2000 nt), our genome assemblies provided contigs that could support synteny
analyses combining sequence similarity in the context of information on gene
order and orientation. Draft assemblies from the Human Microbiome Project also
provided contigs of lengths (contig N80 > 30Kb) useful for gene annotation and
the derivation of local synteny relationships.
We used whole-genome alignments to determine that a core of 3.4 Mb of
orthologous genomic sequence was present in all of the 14 genomes. Within the
core genome, the NAP7/8 group of isolates tended to be the most divergent to all
other groups, with an average percent identity of 97% compared to the NAP1
group, although this included regions of lower percent identity embedded within
the syntenic regions (Figure 8). The non-core genome sequences represent strain
and isolate specific insertions and deletions, often due to mobile genetic elements
and possible extrachromosomal plasmids (data not shown).

48
Table 3. Characteristics of C. difficile isolates used in this study.
Isolate Year PFGE Type
Location Source Additional Characteristics Genome
Size Contigs
a Isolates sequenced in this study
QCD-66c26 2007 NAP11 Montreal, QC, CA 56 Yo male with severe CDI BT+; tcdC delta-117; 18bp del 4.13 45
QCD-32g58 2004 NAP1 Montreal, QC, CA 70 Yo male with CDI BT+; tcdC delta-117; 18bp del 4.11 18
BI-13 1988 NAP1
1 Minneapolis, MN, USA Non-epidemic strain BT+; tcdC delta-117; 18bp del 4.4 89
CIP 1079324 1984 NAP1
1 Reims, Marne, FR 28 Yo female with PMC reference strain for binary toxin 4.04 69
QCD-37x79 2005 NAP17 London, ON, CA 67 Yo patient with severe CDI BT+; tcdC delta-117; 18bp del 4.33 59
QCD-97b34 2004 NAP18 St. John's, NL, CA 70 Yo with severe CDI BT+; tcdC delta-117; 18bp del 4.07 74
QCD-63q42 2005 NAP2 Quebec, QC, CA 67 Yo male with severe CDI toxinotype 0 4.44 87
VPI 104634 1980
2 - - - reference strain from ATCC 4.21 88
QCD-23m63 2007 NAP7 Montreal, QC, CA male with severe CDI toxinotype V/ribotype 078 3.94 80
b Publicly available isolates
CD196 1985 NAP1 Paris, France non-epidemic strain - 4.11 1
R20291 20066 NAP1
Stoke Mandeville, England
outbreak-associated - 4.19 1
Strain 630 1980 - Zurich, Switzerland CDI and PMC - 4.29 2
NAP07 20085 NAP7 Unknown Human feces - 3.90 33
NAP08 20085 NAP8 Unknown Human feces - 4.08 24
1Predicted from sequence similarity
2Estimated year of isolation
3Razaq N, et al. (2007)
4Reference strain
5Estimated from date of sequencing
6Estimated from publication
7subtype b/006
8subtype a/001

49
Table 4. Characteristics of C. difficile genome assemblies used in this study.
Isolate Technology Status Genome
Size Contigs Largest_Contig Contig_N80 Accession Reference
a Isolates sequenced in this study
QCD-66c26 GS-FLX Draft 4,126,050 32 937.3 232.5 NZ_ABFD00000000 This study
QCD-32g58 GS-20 Draft 4,108,089 16 1247.0 302.3 NZ_AAML00000000 This study
BI-1 GS-FLX Draft 4,392,595 66 356.4 59.6 NZ_ABHE00000000 This study
CIP 1079324 GS-FLX Draft 4,032,580 55 354.2 81.1 NZ_ABKK00000000 This study
QCD-37x79 GS-FLX Draft 4,329,888 45 559.0 128.7 NZ_ABHG00000000 This study
QCD-97b34 GS-FLX Draft 4,059,010 60 366.6 76.7 NZ_ABHF00000000 This study
QCD-63q42 GS-FLX Draft 4,440,437 60 1027.2 101.2 NZ_ABHD00000000 This study
VPI 104634 GS-FLX Draft 4,204,780 55 1293.1 138.5 NZ_ABKJ00000000 This study
QCD-23m63 GS-FLX Draft 3,936,085 61 440.0 93.8 NZ_ABKL00000000 This study
b Publicly available isolates
CD196 GS-FLX Complete
4,110,554 1
4,110,554
4,110,554 FN538970 Stabler et al. (2009)
R20291 GS-20 Complete
4,191,339 1
4,191,339
4,191,339 FN545816 Stabler et al. (2009)
Strain 630 ABI377 Complete
4,290,252 1
4,290,252
4,290,252 NC_009089 Sebaihia et al. (2006)
NAP07 GS-FLX Draft 3,862,058 100 269.2 35.7 NZ_ADVM00000000 Human Microbiome
Project*
NAP08 GS-FLX Draft 4,022,033 111 169.7 32.3 NZ_ADNX00000000 Human Microbiome
Project*
*http://www.hmpdacc.org/

50
Figure 8. Percent identity plot (top) and dot-plot (bottom) depicting the whole
genome pairwise alignments of a NAP1 isolate (QCD-66c26) versus a NAP7
isolate (QCD-23m63).
The dotplot in the bottom panel depicts the colinearity of the two genomes, and
the percent identity plot in the upper panel depicts the level of nucleotide-level
similarity between the two genomes (red line indicates average percent identity).

51
Polymorphism Discovery
Within the 3.4 Mb core genome, we identified 127,442 single nucleotide
polymorphisms (SNPs). Although other types of genomic variation are present,
including insertions and deletions, they were not analyzed in this study as they
accounted for less than 3% (3,211) of all instances of nucleotide level variation. A
phylogenetic tree constructed using the SNPs clustered the isolates into three
distinct groups: the eight NAP1 isolates, the three NAP7/8 isolates, and the three
remaining isolates (ATCC43255, 630, and QCD-63q42) which we refer to as the
R group (Figure 9a). Genetic variation among these three groups is greater than
the level of variation within any one group (Figure 9b). The NAP1 isolates differ
from the NAP7/8 group at 104,853 SNP positions, and differ from the three
remaining isolates (R group) at 17,076 SNP positions. The NAP7/8 isolates differ
from the R group of isolates at 96,302 SNP positions.
The NAP1 group consisting of 8 isolates are highly identical within their core
genome, ranging from 9 to 62 polymorphic SNP positions between any two
members (Figure 9b). We identified 11 non-synonymous nucleotide substitutions
that distinguish a subset of Canadian NAP1 isolates (QCD-32g58 (Quebec, 2004),
QCD-66c26 (Quebec, 2007), QCD-37x79 (Ontario, 2005)) as well as the UK
outbreak strain R20291 (Stoke, Mandeville) from the others (QCD-97b34
(Newfoundland, 2004), BI-1 (Minnesota, 1988), CIP107932 (France, 1984), and
CD196 (France, 1985). This set of 11 SNPs includes the previously described
mutation responsible for resistance to fluoroquinolones (Drudy et al., 2007).
The group of three NAP7/NAP8 isolates are also highly similar to each other,
with at most 1,851 SNPs separating QCD-23m63 (NAP 7) from the HMP-NAP07
isolate. However, the two HMP isolates are very similar, with only 297 SNPs.
Variation between the three isolates in the R group is greater than variation within
the other two groups, with each of the 3 isolates in the group having over 11,000
SNPs.

52
Figure 9. a) Phylogenetic tree of 14 C. difficile genomes constructed using SNP data.
Branches corresponding to partitions reproduced in less than 50% bootstrap replicates are collapsed. The percentage of replicate trees
in which the associated taxa clustered together in the bootstrap test (100 replicates) are shown next to the branches. Genomes cluster
into 3 distinct groups: NAP1 isolates (red), NAP7/8 isolates (blue), and the 3 remaining isolates (black, R group); b) Number of
polymorphic SNPs observed between the three groups (large boxes), as well as variation observed between isolates from within each
group (remaining values). Also indicated are SNPs (text at center-bottom) that uniquely identify each group.

53
Genetic variations consistently present in a single group are candidate DNA
markers of potential diagnostic value. We found 10,683 SNPs that distinguish the
NAP1 group from the other two groups (Figure 9b). There were also 89,954 SNPs
that separated the NAP7/8 set from all others, and 6,342 SNPs that separated the
remainder (R group) from the NAP1 and NAP7/8 group.
The 10,683 SNPs that are specific to the NAP1 group have a genome-wide
distribution (Figure 10a) and includes a prominent cluster overlapping the
cytotoxin gene tcdB (Figure 10a). Among the other prominent clusters, 545 SNPs
were observed in a 5.8 kb region of 6 genes (CD1265-CD1270), annotated as a
two-component system (TCS) adjacent to an ABC transporter (TCS-ABC)
(Figure 10b). The predicted protein sequences across this TCS-ABC locus
showed no premature stop codons, providing preliminary evidence that these
remain functional genes despite the increased level of genetic variation. Other
prominent clusters include an ABC transporter (CD0336-CD0337), and a
hypothetical protein adjacent to a transcriptional regulator (CD3143-CD3144).

54
Figure 10. Distribution of SNPs that uniquely identify the NAP1 group of isolates.
a) Genome-wide distribution of SNPs that uniquely identify the NAP1 group of isolates. Prominent clusters overlap known (e.g., tcdB
in PaLoc) and unknown loci (indicated with arrows). b) Genomic intervals of 5 loci with prominent clusters of NAP1 SNPs. From top
to bottom: CD0366-CD0337, tcdB, TCS-ABC, and CD3143-CD3144. Annotations for each genomic interval depict (from top to
bottom): a scale, genomic position, pileup of NAP1 SNPs, and gene annotations (arrows indicate direction of gene).

55
Identification and Validation of Targets for SDA Strains
To investigate the potential of NAP1 SNPs in the TCS-ABC locus as diagnostic
targets associated with disease severity we selected 2 candidate genes, CD1265
and CD1269, for comparison against 9 putative or known virulence genes (tcdA,
tcdB, tcdC, tcdE, codY, fliC, groEL, gyrB, mviN). These genes were PCR
amplified and resequenced in a panel of 177 isolates of C. difficile. Isolates were
selected to assess genetic variation for each candidate locus within the NAP1
strain and between strains of varying PFGE type. The 177 isolates were collected
predominantly from Canadian hospital, provincial and national reference
collections, and chosen to sample variation in PFGE type. The isolates were also
selected to encompass different collection sites, and years of isolation. A second
set of international strains provided another survey of C. difficile diversity based
on toxinotyping (Rupnik, 2008). A total of 20 contributing sites were represented,
including 17 Canadian, 2 American, and one European institution. There were
163 isolates collected in or after 2002, with 22 isolated prior to 2002. Sixty-seven
isolates were classified as NAP1, 12 as NAP2 and 109 classified into more than
50 other pulsovars. Ten isolates were from the reference panel of toxinotyping
strains, and 50 were from 9 hospitals in the province of Quebec, Canada. 117
isolates were obtained from The Canadian Nosocomial Infection Surveillance
Program (CNISP) and have available patient data. Seventy of the 117 clinical
records reported severe CDI, which was defined as death associated to CDI, ICU
or colectomy due to CDI (all measured <= 30 days after diagnosis).
Our set included 10 A-B+ isolates, which are of PFGE type 00065 (NAP9,
personal communication), correlated with toxinotype VIII (Janvilisri, et al., 2009).
In patient data available for 100 of the isolates that were resequenced, SNP
genotypes in two genes (CD1269 and CD1265) associated with 70% (44/63) of
severe disease cases comprising three PFGE types (NAP1/NAP7/NAP9), whereas
existing typing methods, such as PFGE NAP1 classification or deletions in tcdC,
accounted for 52% (33/63) or 62% (39/63), respectively, and was limited to two
PFGE types (NAP1 and NAP7). For example, the G allele for SNP at genomic

56
location 1,387,666 in CD1269 (Figure 11) associates with more severe disease
cases than the single base deletion at position 117 (∆117) in tcdC due to the
observation that the A-B+ strains have the G allele but lack the tcdC deletion. In
contrast, the ∆117 deletion in tcdC detected 33 of 63 severe disease cases, and the
larger deletions of at least 18 bp in the 3' end of tcdC accounted for 39 of 63 of
severe disease cases. Deletions in tcdC were diagnostic for two of three strain
types previously associated with severe disease (NAP1 and NAP7), whereas
genotypes for each of 18 SNPs in CD1269 (1/18) and CD1265 (17/18) (the TCS-
ABC locus) detected 44 of 63 severe disease cases and specific alleles were
associated with three SDA strain types (NAP1, NAP7, and A-B+
(NAP9/toxinotype VIII)) (Figure 11). In addition, 5 of the SNPS in CD1265 are
tri-allelic and partition the SDA strains into two groups (NAP1 versus NAP7 and
A-B+ (NAP9/toxinotype VIII) (Figure 11). For example, the SNP at genomic
location 1,383,226 has three alleles C, T, and A. The A allele is associated with
the NAP1 strain, the T allele with the NAP7 and A-B+ strains, and the C allele
with all the others.

57
Figure 11. Correlation of disease severity with SNPs from the TCS-ABC locus or existing diagnostic methodologies.
The incidence of severe CDI outcome (SDA column, grey boxes) is higher for the NAP1 strain and occurs in 7/10 and 2/2 cases for the
A-B+ and NAP7 (+1 closely related, 11ACD0028) strains, respectively (genome sequenced isolates are not phenotyped and indicated
with an "x"). Molecular markers such as the PFGE type NAP1, and presence of binary toxin are diagnostic for NAP1, with deletions in
tcdC additionally capturing the NAP7 strain. Genotypes in SNPs identified in the TCS-ABC locus are diagnostic for three SDA strain
types; the NAP1 strain, NAP7, A-B+ strains, and includes 5 tri-allelic SNPs (the third allele is boxed).

58
Identification and Validation of Targets for Species-level Detection
We selected a set of 12 genes (spoIIIAG, CD0596, CD0117, CD3014, CD0279,
CD1795, CD2251, CD0017, cdd1, srlE, prdB and sspA) that displayed high
nucleotide level identity across all 14 sequenced genomes as species-wide
detection candidates (Table 5). After resequencing the panel of 177 isolates, sspA
was found to be 100% conserved at the nucleotide level for all isolates analyzed
(Table 5). The remaining 11 candidates contained a few polymorphisms, and did
not deviate substantially from what was originally observed in the 14 genome
analysis (Table 5). To further investigate whether these gene sequences could be
used as DNA based markers for specific detection of C. difficile (regardless of
strain type), yet remain specific to C. difficile but no other species, we aligned the
genomic sequence from each candidate gene region against the NCBI non-
redundant DNA sequence database. Database hits for all 12 gene regions were
well below 90% identity and/or 90% query coverage (Table 5). Furthermore, C.
difficile PCR primers for all 12 genes did not lead to amplification products from
Clostridium spiroforme and Mycobacterium intracellulare (data not shown).

59
Table 5. Targets for species-level detection of C. difficile.
Gene
Number of SNPs Most Similar Species using BLASTn (nr)
Query Coverage
(%)
Max. Identity
(%) 14 Reseq.
sspA 0 0 Alkaliphilus oremlandii OhILAs 94 74
prdB 2 5 Clostridium sticklandii 96 76
CD0017 2 6 Clostridium botulinum E3 str. Alaska E43 83 73
cdd1 2 6 Leptospira interrogans serovar lai str. 56601 39 74
srlE 6 6 Clostridium botulinum B str. Eklund 17B 97 83
CD2251 3 8 Trichomonas vaginalis 13 85
CD1795 4 9 Polistes sp. MD1 mitochondrion 16 84
CD0596 6 10 Brassica rapa subsp. Pekinensis 22 81
CD0117 6 10 Alkaliphilus metalliredigens QYMF 96 76
CD3014 6 10 Listeria welshimeri serovar 6b str. SLCC5334 96 86
CD0279 8 10 Clostridium acetobutylicum ATCC 824 45 67
spoIIIAG 8 14 Mycoplasma mycoides subsp. mycoides SC str. PG1 8 84

60
Discussion
The primary objective of this study was to identify DNA markers for C. difficile
that could be used to test stool samples of patients and determine: (i) whether they
are infected with C. difficile, and if they are infected (ii) whether the particular
strain has been associated with severe disease. Our strain selection, which was
influenced by the availability of isolates in well-characterized hospital collections,
such as the Canadian Nosocomial Infection Surveillance Program, included an
emphasis on isolates of the predominant epidemic strain (NAP1) as well as an
isolate of another SDA strain (NAP7) reported in literature (Goorhuis, et al.,
2008; Mulvey, et al., 2010). Our strain choices comprise the majority of severe
disease associated strain types (Hubert et al., 2007; Loo, et al., 2005; Quesada-
Gomez et al., 2010; Walkty et al., 2010) as well as two widely used research
reference isolates (CIP107932 and VPI10463). Our testing on an extended panel
of isolates, from an even wider diversity of strain types described here, further
demonstrate that we have analyzed a wide spectrum of naturally occurring C.
difficile genetic diversity.
Similar to previous studies, we observed variation in genome size that is largely
attributable to mobile genetic element activity (M. He, et al., 2010; Scaria, et al.,
2010; Sebaihia, et al., 2006; Stabler, et al., 2009). Mobile genetic elements in C.
difficile have been found to carry virulence factors (Stabler, et al., 2009), and as a
result, a more detailed comparative genome analysis of the NAP1 isolates from
this study and others may provide further insight into the differential virulence
observed within this strain. We observed 3.4 Mb of conserved sequence present in
all 14 genomes, comprising 3063 genes, which differs substantially from
observations made by other studies, which estimate a smaller core genome of less
than 1000 genes (M. He, et al., 2010; Janvilisri, et al., 2009; Scaria, et al., 2010;
Stabler, et al., 2006). We do not believe this is a reflection of strain choices, as
our most divergent pairs (NAP1 vs NAP7) were also recognized as being the most
highly divergent in other studies (M. He, et al., 2010). Rather, we believe the
differences in interpretation of core genome size are due to differences in

61
methodologies and analysis techniques. Given the high quality of the 3 completed
genomes and 11 draft genomes used in our analyses, we were able to combine
sequence comparisons and syntenic relationships to determine gene orthologs, and
observed that compared to NAP1 references, the NAP7/8 group displayed a
higher level of genetic diversity with an average of 97% identity. We believe that
in comparative genome hybridization (CGH) studies, for example, where probe
mismatches can affect hybridization (Naiser et al., 2008; Rennie et al., 2008), and
NAP1 or strain 630 genomes have been used as the reference, even a few
mismatches between the probe and target DNA can increase the false negative
rate (Machado & Renn, 2010; Renn et al., 2010). This leads us to suggest that the
C. difficile CGH arrays, which were designed using either strain 630 (R group) or
the NAP1 isolate QCD-32g58, may produce numerous false negative
hybridizations when tested using more a more distantly related strain (e.g., NAP7)
and has resulted in a calculation of a smaller core genome size. Other whole
genome sequence based studies have used differing analytical techniques to
determine the core genome size. For example, one study determined the core
genome to consist of 622 genes, but only after stringently considering the non-
recombining genes in the genome (M. He, et al., 2010). Another study estimated
the core genome to be comprised of 947 genes (Scaria, et al., 2010); however, as
it was a gene-centric analysis based on sequence identity without synteny
evaluation, the study may have considered genes of lower than average sequence
identity, such as those present in the NAP7/8 group, to be non-orthologous. Our
whole genome multiple alignment-based approach allowed the identification of
orthologous regions of lower sequence identity which might not have been
detectable using CGH arrays or considered to be below similarity thresholds
using a gene-centric approach.
At this time, our catalogue of genetic variation does not include insertions or
deletions. Future work may reveal insertions or deletions in severe disease
associated strains in addition to those previously identified in tcdC (Curry et al.,
2007; Loo, et al., 2005; MacCannell et al., 2006; McDonald, et al., 2005). Indeed,
while it has been shown that deletions in tcdC were hypothesized to lead to

62
increased toxin production (MacCannell, et al., 2006; Spigaglia & Mastrantonio,
2002; Warny, et al., 2005), a recent study (Murray et al., 2009) indicated that
deletions in tcdC do not predict the biological activity of the PaLoc toxin genes,
providing further motivation to identify all sources of genetic variation within the
C. difficile genomes that may correlate with disease severity.
There are 64 SNPs that discriminate isolates within the NAP1 strain type,
including 14 SNPs that separate eastern Canadian isolates from the others, and
these demonstrate the potential of massively parallel sequencing to identify SNPs
suitable for subsequent intra-strain typing and tracking. The SNPs that distinguish
the NAP1 strain from all other strains show an uneven genome-wide distribution
and cluster in known pathogenicity genes as well as in genes with currently
unrecognized roles in CDI. The other genes with clusters of NAP1 SNPs include a
general stress (CD2599) and carbon starvation (CD2600) gene, and an ABC
transporter. The most prominent cluster of SNPs that discriminate the epidemic
strain were observed in a genetic locus consisting of a two-component system
(CD1269-70) adjacent to an ABC transporter (CD1265-68). The adjacency of
these two loci has been shown to be functionally relevant in Bacillus, and is
present in other low-GC Gram-positive bacteria, including C. difficile (Joseph et
al., 2002). The function of the TCS-ABC system has been investigated previously
in B. subtilis, and includes detoxification of antimicrobial compounds (Ohki et al.,
2003). The function of any particular TCS-ABC system is primarily dictated by
the protein domains present in the histidine kinase gene (Jordan et al., 2008).
Sequence analysis of the histidine kinase gene (CD1270) in this TCS-ABC
system suggests that it plays a role in detoxification (data not shown). In silico
analysis indicates that this locus is not comprised of pseudo-genes, and as a result
may have a functional role. Future experiments are needed to confirm the
expression of genes in the TCS-ABC system and investigate their roles in CDI.
Enzyme-based strategies for the detection of C. difficile have limited sensitivity
and specificity (Eastwood, et al., 2009). To address this, alternative gene targets
have been investigated, such as the tpi housekeeping gene (Dhalluin et al., 2003).

63
While this assay is specific to C. difficile, it requires the additional procedure of
RFLP to achieve its specificity, making it less suitable in a clinical setting. Our
genome analysis has identified numerous highly conserved genes that may be
suitable for PCR-based specific detection of C. difficile. The 12 candidate genes
displayed a high level of sequence conservation across the 14 genomes as well as
a diverse population of 177 isolates, representing major PFGE and toxinotypes.
Moreover, our in silico analysis shows that many of these candidates have low
sequence identity to other bacterial species, and upon further experimental
validation and development may define a more rapid and specific clinical
detection assay.
The development of genetic markers to track severe disease-causing strains has
previously relied on variation in known pathogenicity genes, such as the detection
of deletions in tcdC (Wolff, et al., 2009). While deletions in tcdC are diagnostic
for the NAP1 strain and the SDA NAP7 strain they are not diagnostic for the A-
B+ isolates (NAP9/toxinotype VIII) that have been found in food animals (Pirs et
al., 2008) and retail meats (Rodriguez-Palacios et al., 2007). Using comparative
genome analysis with candidate gene resequencing, we have identified numerous
SNPs that detect these three SDA strain types and this in turn has led to an
increase in the detection of severe disease causing cases by almost 20%.
However, strains containing these SNPs do not always lead to CDI, and severe
CDI can be observed in cases of infection with non-SDA strains. Part of this may
be attributable to host factors that alter disease severity, such as variation in
immune response (Lorraine Kyne et al., 2000; L. Kyne et al., 2001), and exposure
to certain antibiotics (Loo, et al., 2005; Muto et al., 2005; Pepin et al., 2005) or
acid-reducing agents (Dial et al., 2004; Loo, et al., 2005; Pepin, et al., 2005).
Alternatively, as our resequencing of candidate regions was limited, the
resequencing of additional genes or loci may uncover SNPs that detected
additional severe disease causing isolates. Also, severe disease or outbreak size
and number may be caused by a constellation of genetic loci, such as those
responsible for sporulation (Merrigan et al., 2010) or gut survival, and

64
investigation of these other loci may identify SNPs that account for additional
severe disease cases.
This study demonstrates the utility of massively parallel DNA sequencing to
identify clinically relevant diagnostic markers of C. difficile. As the cost of whole
genome sequencing continues to decrease, we envision this approach being
applied to the study of other human pathogens.
Acknowledgements
We wish to thank the DNA sequencing teams at the Genome Center at
Washington University School of Medicine and the McGill University and
Genome Quebec Innovation Centre for the sequencing of the C. difficile isolates.
We thank Manon Lorange for the isolation of C. difficile QCD-63q42. We also
thank Dr. Marcel Behr for providing C. spiroforme and Mycobacterium
intracellulare control DNAs. We thank the Human Microbiome Project (HMP)
and the HMP DACC for pre-publication data release of the C. difficile NAP07
(ADVM00000000.1) and NAP08 (ADNX00000000.1) sequences. This study was
funded by Genome Canada and Genome Quebec (KD) and the NHGRI (EM). VF
is a recipient of a Canadian Institutes of Health Research Doctoral Research
Award. MO was the recipient of an AMMI Canada/CIHR/CFID/Bayer Healthcare
research fellowship.

65
PART III: ASSESSMENT OF A GENOME ASSEMBLY

66
Connecting Text
Genome browsers, including the UCSC Genome Browser (Kent, et al., 2002),
were designed to view and analyze genome annotations. They are limited in their
capacity to analyze the underlying genome assembly; how individual reads
contribute to the subsequent consensus sequence. In 2006, existing assembly
viewers (Gordon, et al., 1998; Huang & Marth, 2008; Schatz et al., 2007) did not
process MPS datasets due to their large size, or were limited in their ability to
assess the quality of an entire genome assembly. As a compromise, I used a
combination of cgb and other programs, such as a spreadsheet application, to view
and analyze the C. difficile genome assemblies (Chapter 3). This approach proved
to be cumbersome, and did not meet the need to easily inspect a genome assembly
from an MPS platform.
The need to have assembly assessment tools beyond a consensus-based browser
became evident in my next project, the multi-centre sequencing and analysis of
the O. novo-ulmi genome (Chapter 5) (in preparation). The goal of this project
was to determine if the Roche/454 GS platform was reproducible across
sequencing centers. To assess variation in sequencing error rates, or other sources
of center-specific bias such as genome coverage, we required a high-quality
genome assembly which we could use as a point of reference (Chapter 5). The
knowledge gained from assessing the quality of the genome assembly enabled me
to develop a new assembly viewer that addressed the limitations of existing
software programs. The program created from this endeavor was named contiGo
(Chapter 4), and was developed to specifically assist in the quality assessment and
analysis of genome assemblies. Among other features, it offers multiple views of
the assembly statistics via tables and charts, as well as a fully and fluidly
zoomable image of the read pileup for each contig. The program was used to
assess the quality of the genome assembly during the pilot stages of the project, as
well as identifying the presence of a mitochondrial genome and high copy number
rDNA sequences. Subsequent to analysis with contiGo, cgb was used to create a
custom UCSC Genome Browser to assist in the analysis of the reproducibility of

67
the Roche/454 GS-FLX Platform. This analysis allowed us to conclude that: [i]
the platform is reproducible; and [ii] the deviation in base-calling of monomeric
repeats is more pronounced at a length of 7 nt or greater. We also produced a
high-quality assembly of the O. novo-ulmi genome for use by the fungal research
community.
Contribution of Authors
I created contiGo and prepared and wrote the manuscript (Chapter 4). Gary
Leveque and Pascale Marquis assisted with user testing. The O. novo-ulmi project
(Chapter 5) was conceived by the DNA Sequencing Research Group (DSRG) of
the Association of Biomolecular Resource Facilities (ABRF) and DNA
sequencing was performed by participating DSRG core facilities. I oversaw and
conducted the analysis of the reproducibility of the Roche/454 GS-FLX Titanium
platform, performed the genome assembly and quality assessment, and prepared
and wrote the manuscript (Chapter 5).

68
CHAPTER 4: ContiGo -- A Tool to Inspect Genome Assemblies in a Web
Browser
Vincenzo Forgetta1 and Ken Dewar
1
1Department of Human Genetics, McGill University, Montreal, Quebec, Canada
This manuscript is in preparation for submission.
The source code and documentation is available at
http://github.com/vforget/Contigo

69
Abstract
Assembly viewers are software programs used to inspect genome assemblies,
determining their overall quality and identifying assembly artifacts such as
collapsed repeats and low-coverage contigs. Massively parallel DNA sequencing
platforms has made genome sequencing affordable to the biologist, who may be
tasked with inspecting the genome assembly. Currently available assembly
viewers require specific hardware or software or are limited in their analytical
capabilities, restricting their use to those with adequate expertise or resources, or
to specific types of projects. To address this need we created contiGo, a program
that offers multiple analytical views of a genome assembly from within a web
browser, bypassing the need to install software and download large data sets. We
demonstrate its general purpose functionality across various example usage cases.

70
Introduction
During the era of dye-terminator-based DNA sequencing technologies, whole
genome sequencing (WGS) was costly and laborious. Consequently, it was
performed by a few large institutions and limited to few organisms of high
importance, such as human (Lander, et al., 2001; Venter et al., 2001) and mouse
(Waterston, et al., 2002). Within this context, many software programs were
developed to assist in all aspects of producing a genome sequence. Assembly
editors were particularly important because they were used to inspect the genome
assembly in a process termed genome finishing, a process that corrects sequence
and assembly errors, and incorporates additional sequence information to fill in
sequence gaps. At the time, popular assembly editors were Consed (Gordon, et
al., 1998) and Staden (Staden, 1996), which were used to finish the human and the
nematode genome, respectively. As the cost of DNA sequencing dropped, the cost
of genome finishing became a limiting factor and was primarily used for
important model organisms. This left many genome assemblies in a draft stage,
consisting of a set of contigs that may contain undetected errors (Salzberg &
Yorke, 2005). To assist in the analysis of this large number of draft genomes,
Schatz et al. developed Hawkeye (Schatz, et al., 2007), an assembly viewer that
offered advanced analytical techniques to detect assembly errors. Regardless of
the software program used, the primary goal of WGS was to produce a high-
quality assembly upon which various annotations were predicted. The genome
sequence and annotations were then incorporated into genomic resources, such as
the UCSC Genome Browser (Kent, et al., 2002) and Ensembl Genome browser
(Hubbard, et al., 2002), for use by the scientific community. To date, more than
40 eukaryotic genomes are available via these online resources, with many more
prokaryotic and viral species. This has provided the scientific community a
foundation upon which they have conducted further research.
Massively parallel DNA sequencing technology (Bentley, et al., 2008; Margulies,
et al., 2005; Shendure, et al., 2005) has changed the process of WGS and analysis
in at least one important way. By dramatically reducing costs, MPS technology

71
has given individual researchers access to whole genome sequencing, often by
contracting the sequencing out to a third party. Similar to past model organism
genome projects, this genome sequencing service often produces a draft assembly.
However, unlike past genome projects, the initial analysis of the assembly is often
left to the individual researcher. While some of this analysis will include typical
genome finishing tasks, such as identifying low-quality contigs, or misassemblies
due to repeats, researchers may also want to inspect the genome assembly in more
specific ways; a need that requires a general purpose assembly viewer. Also,
because some researchers possess varied levels of computer expertise and
different operating systems, this tool should be cross-platform and present a short
barrier to entry, such as ease of installation and data access. Recently developed
assembly viewers (Hou, et al., 2010; Huang & Marth, 2008; Milne, et al., 2010)
address some of these issues because they are cross-platform, however, they are
mainly geared towards variant detection, choosing to focus on the inspection of
individual contigs. A more general analysis tool that includes contig level analysis
as well as the analysis of the entire assembly is needed as it would allow for a
more general and open-ended analysis.
To address this need we have created contiGo, a program that offers multiple
analytical views of a genome assembly from within a web browser. Here we
briefly describe the implementation and functionality of contiGo, and demonstrate
its functionality across multiple example usage cases.
Methods
ContiGo is implemented in the Python programming language
(http://www.python.org). As input, it accepts a genome assembly in ACE format,
and optionally other files generated by the Roche/454 GS Assembler. ContiGo
parses the input file(s), computes statistical values for the assembly, and produces
images of the read pileups for each contig. The statistical values, contig sequence,
and contig qualities, are stored as a HTML table and/or JSON-objects. Contig
images are converted to a format compatible with the Seadragon AJAX library
(http://expression.microsoft.com/en-us/gg413362). ContiGo’s web-browser

72
interface visualizes this information in a dynamic manner using freely available or
custom Javascript libraries. For more implementation details, please refer
ContiGo's website (https://github.com/vforget/Contigo).
Results.
General Functionality
The ContiGo interface consists of four sections: a summary, a table, a plot, and a
contig read pileup (Figure 12):
A. Summary: Displays basic assembly statistics, and provides links for the bulk
download of the contigs sequences, quality values or contig statistics.
B. Table: Lists statistics for each contig in the assembly in tabular format.
Some row values are hyperlinks (e.g., contig length) to download data for
individual contigs (e.g., sequences). Columns headers can be used to sort, search,
or filter the contents of the table.
C. Plot: Visualizes contig statistics using three plots: scatter, cumulative, and
count. The scatter plot displays two contig statistics against each other (e.g.,
contig length versus read depth of coverage). The count and cumulative plots
display for one statistic a histogram of counts or cumulative counts, respectively.
Clicking on values in the plots identifies the point by providing the contig name
and other information.
D. Pileup: Clicking the contig name in the table loads the read pileup, which is
visualized as a fully zoomable image (Figure 12). The status bar above the image
reports the base position and read depth at the current pointer position.

73
Figure 12. A contiGo screenshot illustrating the E. fergusonii isolate ECD227
genome assembly.
(A) Genome assembly statistics and download links for contig sequences, quality
values, and statistics in tabular format. (B) Table of contig statistics that can be
filtered or sorted by multiple columns (depicted here as sorted by length and
filtered for contigs >100,000nt). Underlined row values are links to data for each
contig (e.g., sequence, quality values. (C) Three dynamic plots of contig statistic
values; a scatter, cumulative and count plot. Values to plot are selected via pull-
down menus, and clicking individual points provides further details. (D) Read
pileup for contig00064 in the vicinity of 1,500nt. The read pileup is fully
zoomable, and position of the mouse pointer reports approximate location within
the contig sequence (bar above pileup).

74
Example Usage Cases
The table, plot, and pileup can be used individually or in combination to inspect
genome assembly. Using the bacterial genome assembly in Figure 12 as an
example, we demonstrate this functionality across multiple usage cases.
General Quality Assessment
The plot and table can be used to assess the overall quality of a genome assembly:
i. A counts plot of base quality can be used to determine that the majority of bases
in the assembly are of high quality (e.g., 4869631 bases at quality value 64).
ii. A cumulative plot of contig length can be used to obtain the amount of
sequence in contigs of a minimum length (e.g., N50 contig length of 156910 bp).
iii. A scatter plot of contig length versus read coverage determines that contigs
greater than 100 kb have a depth of coverage of approximately 14-21x.
iv. Applying these criteria (Contig Length >= 100,000 and Read Depth >= 14) to
the contig table shows that 13 contigs met this threshold, and that the all contigs
are of high quality (0.22-0.70 % in low quality bases) and between 48 and 51%
GC content.
Detect a High-Copy Number Plasmid
During DNA preparation, plasmid sequences are often isolated in higher copy
number than the chromosomal component of the genome. ContiGo can be used to
identify and download the sequence of putative plasmids.
i. The plot of Contig Length (x-axis) versus Read Depth (y-axis) identifies
numerous large (> 10kb) contigs with higher depth of coverage (> 28x) than most
other contigs (14-21x).
ii. These contigs can be identified on an individual basis by clicking the points in
the plot, or by applying a filter to the table. Using the plot, we can identify a

75
contig with a length of 38,412 and depth of 48x as contig000011, which can be
used to filter the table by contig name. Clicking the length value in the table
displays the contig sequence.
iii. An NCBI BLAST search using the contig sequence against the non-redundant
database identifies the contig as being similar plasmid sequences.
A similar procedure can be used to inspect other large high coverage contigs.
Alternatively, the table can be filtered for contigs > 10kb and > 28x depth of
coverage. Clicking on each contig length value in series will append these
sequences to the contig sequence display window.
Inspect a Mis-assembled Repeat
Repetitive elements are difficult to assemble, and often collapse into a single
contig with higher than expected depth of coverage. Because they are composed
of paralogous sequences, consensus positions within the contig may contain
multiple correlated mis-matches that result in low-quality positions. A
combination of the plot and the read pileup can be used to identify these contigs:
i. A plot of percent low quality bases (% < 64, x-axis) versus Read Depth (y-axis)
identifies a contig with high depth of coverage (129x) and 1.23% low quality
bases as contig00071. Alternatively, filtering the table for contigs with > 100x
depth of coverage identifies four contigs. The read pileup for these contigs can be
loaded by clicking on the contig name in the table.
ii. Inspecting the read pileup for contig00064 and contig00071 identifies
numerous consensus positions with correlated mismatches. For example,
contig00064 contains three such mismatches in the vicinity of position 1500.
iii. NCBI BLAST analysis of this contig reveals it to be the rRNA-16S ribosomal
RNA gene.

76
Discussion
We built contiGo as a general purpose tool to inspect genome assemblies from
within a web browser. It was designed to be suitable for use on a personal
computer or as part of a WGS analysis pipeline at a sequencing core facility.
Should third-party WGS platforms chose to incorporate contiGo into their
analysis pipelines, individuals researchers could remotely inspect genome
assembly data, thus bypassing the need to download data locally, install software,
and satisfy other software or hardware requirements. In addition to inspecting
genome assemblies, contiGo's general purpose functionality also lends itself to the
analysis transcriptome or metagenome assemblies.
Acknowledgments
I thank Pascale Marquis and Gary Leveque for user testing. V. . was the recipient
of a Canadian Institutes of Health Research Doctoral Research Award. I thank
Moussa Sory Diarra of Agriculture and Agri-Food Canada for permission to use
the genome assembly of E. fergusonii ECD-227 in the example usage cases.

77
CHAPTER 5: Reproducibility of the Roche/454 GS-FLX Titanium System to
Genome Sequence the Dutch Elm Disease Pathogen
Vincenzo Forgetta1, Gary Leveque
2, Joana Dias
2, Deborah Grove
3, Gregory
Grove3, Robert Lyons Jr.
4, Suzanne Genik
4, Chris Wright
5, Alvaro Hernandez
5,
Sharon Bachman5, Lorie Hetrick
5, Sushmita Singh
6, Nichole Peterson
6, Louis
Bernier7, Ken Dewar
1
1McGill University, Department of Human Genetics, Montreal, Canada,
2McGill
University and Génome Québec Innovation Center, Montreal, Canada,
3Pennsylvania State University, Huck Institutes of the Life Sciences, University
Park, Pennsylvania, United States, 4University of Michigan, DNA Sequencing
Core, Ann Arbor, Michigan, USA, 5University of Illinois, W.M. Keck Center,
Urbana, Illinois, United States, 6University of Minnesota, Biomedical Genomics
Center, St. Paul, Minnesota, USA, 7Centre de recherche en biologie forestière,
Pavillon C.-E. Marchand, Université Laval, Sainte-Foy, QC, Canada
A modified version of this manuscript has been submitted to the Journal of
Biomolecular Techniques.
All co-authors have consented to the release of data.

78
Abstract
In this study, we have tested the reproducibility of the Roche/454 GS-FLX
Titanium system at five core facilities. We evaluated a number of sequencing
yield and accuracy metrics using a single sample from O. novo-ulmi strain H327.
We have revealed that the Titanium system is reproducible, with some variation
detected in sequencing yield and homopolymer length accuracy. We demonstrate
that reads shorter than the expected minimum length are of lower quality. The O.
novo-ulmi H327 genome sequence we produced is of high-quality and of benefit
to the fungal and arboreal research community.
KEY WORDS: massively parallel DNA sequencing, whole genome sequencing
Roche/454 GS-FLX Titanium, O. novo-ulmi

79
Introduction
Massively parallel sequencing technology has dramatically reduced the cost of
DNA sequencing, thus enabling the biologist to conduct a genomic research
project. Within these projects, the DNA sequencing component is most often
conducted by a core facility, a laboratory that prepares and sequences the DNA
sample, finally providing the biologist with a genomic data set. Ideally, given the
same sample the resulting genomic data should be of comparable quality
regardless of the chosen facility, allowing the biologist to freely select a facility
based on the needs of the project.
The DNA Sequencing Research Group (DSRG) is a collaboration between
multiple core facilities (simply facility from here on), whose mandate includes
conducting studies to assess the capabilities of its member laboratories and to
promote excellence in DNA sequencing. In accordance with this mandate, the
DSRG sought to assess the performance of the Roche/454 GS sequencing
platform (Margulies, et al., 2005) across multiple member facilities in order to
determine the reproducibility of this instrument, its protocols, and reagents. While
we could assess reproducibility using existing genomic data sets derived from a
diverse set of samples, this would introduce additional experimental variation due
to the use of multiple sample preparation procedures and the DNA base
composition of the different samples. To limit extraneous sources of experimental
variation, we performed our assessment on a single DNA sample preparation and
distributed aliquots to participating member facilities. We chose to sequence the
genome of strain H327 of O. novo-ulmi, the fungal pathogen responsible for the
current pandemic of Dutch elm disease. O. novo-ulmi is a vegetatively haploid
ascomycetous fungus with an estimated genome size of 30-50 Mb2. Since very
few fungal genomes have been sequenced, and none from the Ophiostoma/
Ceratocystis group, none of the sequencing teams had previous experience to
draw from and all groups relied completely on standard protocols. Further, given
the 30-50 Mb genome size (Dewar et al., 1997), the sample was an appropriate
candidate where multiple runs would be required to gain a high level of genome

80
coverage. Also, as a de novo sequencing project, the genome assembly of this
organism would provide new biological knowledge in addition to our technical
evaluations.
In this study we present our assessment of the Roche/454 GS sequencing platform
across five member facilities, including comparisons of sequencing throughput as
well as accuracy. In addition, we present a the genome assembly of O. novo-ulmi
H327 for use by the fungal and arboreal research communities.
Methods
Isolation of O. novo-ulmi H327
O. novo-ulmi strain H327 was isolated and DNA extracted according to methods
described by Et-Touil et al. (1999).
Genome Sequencing and Assembly and Annotation
At each core facility, whole-genome shotgun library preparation and sequencing
was performed using the Roche/454 GS-FLX Titanium system following the
manufacturer’s protocols. A single paired-end library preparation and sequencing
was performed using the Roche/454 GS-FLX Titanium system following the
manufacturer’s protocols. Shotgun and paired-end reads were assembled using
Newbler version 2.3. Assembly errors were fixed manually and with the aid of
custom Python scripts. Gene predictions on the linear scaffolds were performed
using GeneMark-ES version 2.3 (Ter-Hovhannisyan et al., 2008). Gene
predictions for the mitochondrial sequence were performed using the web version
of Agustus (Candida tropicalis model) (Stanke et al., 2008). The EST sequences
(Hintz et al., 2011) were aligned to the genome using BLAT (Kent, 2002).
Sequencing Yield and Accuracy Analysis
Sequence reads were aligned to the genome using BLAT. All analyses were
conducted using custom Python scripts. This includes generating random
pyrosequencing reads, cataloguing of homopolymers from the genome sequence,

81
determining homopolymer accuracy and substitution error rates from the read
sequence alignments. Figures were generated using the Python module matplotlib
or R version 2.1 or greater.
Results.
DNA Sample
A single DNA sample of O. novo-ulmi strain H327 was prepared as a single
stranded DNA fragment library according to common protocols. Aliquots of this
single library were sequenced at the five facilities (identified here as A, B, C, D
and E) according to standard protocols. The size and experience of the sequencing
teams ranged from 2 to 7 technicians and from 5 to 345 runs, respectively (Table
6). The runs performed on the instruments used in this study ranged from 5 to
197. Sequence data was returned to one facility for centralized analysis. Using
this sequence data, we measured the reproducibility of the Roche/454 GS-FLX
Titanium System across several sequencing yield metrics: overall throughput
(Table 6), read length (Figure 13), and read quality (Figure 14). We then present
the O. novo-ulmi H327 genome assembly (Figure 15 and Table 7), and use it to
evaluate the homopolymer length (Figure 16, Figure 17, and Table 8) and the
substitution error rate (Figure 18).
Sequencing Yield
For each facility, we catalogued the read counts and bases sequenced for each
region of the two region sequencing plate (Table 6). Per region, all facilities
exceeded the minimum quality thresholds specified by Roche/454 (450k reads,
180 Mb of sequence and 300nt peak read length). Across facilities, the number of
reads and bases sequenced ranged from 1.05 to 1.56 million and 411 to 580 Mb,
respectively (Table 6). Site C was the top performer, with 21% and 15% above
average counts for reads and bases sequenced, respectively. Site E ranked fifth,
with 18% below average performance for reads and bases sequenced (1.04M
reads, 410Mb). Within each facility, the difference between the region 1 and 2

82
was below 10%, with the exception of facility D. For this facility, region 1 (743k
reads) exceeded region 2 (564k reads) by at least 25% for read count and bases
sequenced. The remaining three facilities (A, B and D) performed within 10% of
the average (Table 6). The average peak read length was 478 and varied from 473
to 481 nucleotides between facilities.
To compare sequence yield and read length performance to a standard measure,
we generated 500,000 random DNA sequences of 1200nt in length, and subjected
them to in-silico pyrosequencing (200 cycles). These random reads had a peak
read length of 531nt (2.6 in silico incorporations per cycle), with the shortest read
being 450nt (Figure 13). The lower peak read length for the experimental data
(478 nt) (Table 6 and Figure 13) is due to a combination of genome base
composition, as well as the trimming of low-quality sequence on the 3' end of
each read and the molecular identifier (MID) tag on the 5' end (data not shown).
Using the difference in peak to shortest read length for the random set (81nt), we
can estimate that the lower bound for an ideal read from the O. novo-ulmi genome
to be 397 nt (478 less 81) (Figure 13). Therefore, reads below 397nt are likely
truncated due to short DNA templates, failed sequencing reactions or other
phenomena that result in reads of less than minimal ideal length. Using this
threshold, we observe that at least 60% of reads from 4 of 5 facilities (A, B, D and
E) are of ideal length (Table 6). Contrary to its top rank in overall sequence yield,
facility C's performance is now below all other facilities, with ~50% of reads
being above ideal length. This is also evident as a larger leading tail of short reads
for facility C (Figure 13a). Notably, facility D has the highest proportion of reads
(74%) above the minimum ideal read length of 397 nt (Table 6). To confirm these
observations are free of potential bias caused by differences in sequencing yield,
we selected 1 million reads randomly from each facility. We observed that facility
C's leading tail remained substantial and that facility D had the lowest leading tail
of reads below 397nt and a higher peak than all other facilities (Figure 13b).

83
Table 6. Summary of participating core facilities and sequencing yield.
All Reads
Reads > 397nt
Site Team Size
Team Runs
Instrument Runs
Region Peak
Length Read Count (% Δ)$ Bases (% Δ)
$ Read Count (%)^ Bases (%)^
A 2 22 22
1 481 601,679 (-10.55) 238,617,862 (-10.45)
398,245 (66.19) 189,657,001 (79.48)
2 477 596,503 (-2.62) 235,886,896 (-1.52)
395,681 (66.33) 187,629,648 (79.54)
1 & 2 481 1,198,182 (-6.77) 474,504,758 (-6.22)
793,926 (66.26) 377,286,649 (79.51)
B 5 172 163
1 481 679,997 (1.10) 273,067,587 (2.48)
464,393 (68.29) 222,011,763 (81.30)
2 475 625,654 (2.14) 243,215,385 (1.54)
385,954 (61.69) 182,799,792 (75.16)
1 & 2 481 1,305,651 (1.59) 516,282,972 (2.04)
850,347 (65.13) 404,811,555 (78.41)
C 3 128 128
1 481 791,274 (17.64) 296,820,523 (11.4)
480,925 (60.78) 227,892,482 (76.78)
2 477 774,951 (26.51) 283,485,969 (18.35)
444,718 (57.39) 209,747,097 (73.99)
1 & 2 477 1,566,225 (21.87) 580,306,492 (14.69)
925,643 (59.10) 437,639,579 (75.42)
D 2 5 5
1 478 743,160 (10.49) 308,348,892 (15.72)
536,017 (72.13) 256,322,790 (83.13)
2 478 563,799 (-7.96) 239,814,876 (0.12)
425,479 (75.47) 204,793,870 (85.40)
1 & 2 478 1,306,959 (1.70) 548,163,768 (8.34)
961,496 (73.57) 461,116,660 (84.12)
E 7 345 197
1 475 546,931 (-18.69) 215,406,359 (-19.16)
346,190 (63.30) 163,197,131 (75.76)
2 473 501,900 (-18.07) 195,249,283 (-18.49)
309,626 (61.69) 145,532,130 (74.54)
1 & 2 473 1,048,831 (-18.39) 410,655,642 (-18.84) 655,816 (62.53) 308,729,261 (75.18) $ Percent deviation from average across all sites for that category
^Percent of total reads or bases for that region

84
Figure 13. Core facility read length distribution.
(A) Total read length distribution for the 5 core facilities (A-E) and 500,000
randomly generated reads. The peak read length for the 5 core facilities (478nt)
and the random sequences (531nt) is marked below the x-axis. The distance to the
shortest random sequence is marked (450nt) and was found to be 81nt. This same
distance from the peak read length for the 5 core facilities is also marked (397nt).
(B) Read length distribution for 1 million randomly selected reads from each core
facility (A-E) and 500,000 random pyrosequencing reads [same as (A)].

85
Next, we chose to investigate variation in base quality between facilities,
including whether reads of less than ideal length (i.e., < 397 nt) are of lower
quality that longer reads. For each facility, we catalogued the quality values of all
bases from reads below and above 397 nt separately. For reads below 397 nt, we
observed a peak quality value of 30 to 31 (Figure 14a), with on average 65% of
bases being above this peak value. This is in contrast to reads above 397 nt, where
the average peak quality value is 36 (Figure 14a) and at least 90% of bases are
above or equal to a quality value of 30. Notably, for facility C, reads >397 nt have
a peak quality value of 37, and there is a slight shift towards having a greater
number of higher quality bases. Extending the quality analysis further, we
catalogued the average quality of bases from reads below and above 397 nt by
read position (Figure 14b). We observed that the reads below 397nt are of lower
average quality across their entire length as compared to longer reads (Figure
14b). Also, longer reads maintain a minimum quality value of 35 up to 300 nt,
whereas shorter reads show a gradual decrease in average quality value across
their length.

86
Figure 14. Base quality per core facility.
(A) Percentage of total base quality values per core facility (A-E), divided by
reads above (solid lines) or below (dotted lines) 397nt in length. (B) Mean
quality values by read position per core facility (A-E), divided by reads above
(solid lines) or below (dotted lines) 397nt in length.

87
Overview of the H327 Genome Assembly
The O. novo-ulmi H327 genome was assembled using the combined read set from
all five facilities (6,425,848 reads, 2,529,913,632 bases), as well as 181,162
paired-end sequence reads (7 kb average insert size ± 2.5 kb). Using Newbler
version 2.3, this produced an initial assembly of 19 scaffolds at an average 61x
depth of read coverage. The 19 scaffolds consisted of 9 large multi-contig
scaffolds (> 500 kb), 9 single contig scaffolds (< 5 kb), and one scaffold of 2
contigs containing a partial sequence of the ribosomal gene (~9 kb). Paired-end
information linked either end of this ribosomal scaffold to two larger scaffolds,
leading us to merge these three scaffolds together (scaffold00010 in Table 7).
Also using paired-end information, we placed 7 of 9 small single contig scaffolds
into sequence gaps within large scaffolds (data not shown). Of the two remaining
small scaffolds, one had low read depth of coverage and was discarded (length
2187 nt), while the other of length 4,151 nt had higher than average read coverage
of 73x and was retained separately (Table 7). NCBI BLAST analysis of this
scaffold shows 39% amino acid similarity (e-value 3e-29) to a predicted protein
from the filamentous fungi Grosmannia clavigera (DiGuistini et al., 2011).
After applying these fixes, the genome assembly of O. novo-ulmi H327 consists
of 9 scaffolds containing 160 contigs, and totals 31,789,037 nucleotides (Table 7
and Figure 15a). The sizes of the eight largest scaffolds are consistent with what
was observed using pulse-field gel electrophoresis of chromosomes for other
strains of O. novo-ulmi (Figure 15b) (Et-Touil, et al., 1999). The absence of
paired-end information spanning the extremities of these scaffolds suggests they
are linear molecules. We also predict that the 8 large scaffolds contain a total of
8,613 genes (Table 7). To further assess the overall completeness of the genome
assembly, we aligned 3,309 EST sequences from Hintz et al. (2011) and
catalogued the number of unique high-scoring alignments. The vast majority of
ESTs (3,277, 99.01%) mapped to the assembly, suggesting that the coding portion
of the genome sequence is near complete.

88
Table 7. Overview of the O. novo-ulmi strain H327 genome assembly.
Name Read Depth Contigs Size Genes ESTs Structure
scaffold00005 60.87 34 6,937,932 (21.78) 1,854 (21.45) 697 (21.06) Linear
scaffold00011 60.7 26 6,817,711 (21.4) 1,827 (21.14) 772 (23.33) Linear
scaffold00002 60.99 17 3,669,772 (11.52) 985 (11.4) 517 (15.62) Linear
scaffold00018 61.05 18 3,419,703 (10.74) 968 (11.2) 335 (10.12) Linear
scaffold00012 61.25 12 2,848,703 (8.94) 794 (9.19) 241 (7.28) Linear
scaffold00008 61.3 17 2,801,594 (8.79) 766 (8.86) 232 (7.01) Linear
scaffold00010 60.91 22 2,758,224 (8.66) 756 (8.75) 246 (7.43) Linear
scaffold00015 61.14 13 2,531,247 (7.95) 663 (7.67) 237 (7.16) Linear
scaffold00004 73.81 1 4,151 (0.01) 1 (0.01) 0 (0) Linear
contig00013 31.18 1 66,357 (0.21) 28 (0.32) 1 (0.03) Circular

89
In addition to these linear scaffolds, we also assembled a 66,357 nt circular
scaffold, which has its origin spanned by multiple paired-ends and sequence reads
(Figure 15c) and is similar in size to known Ophiostoma mitochondria (Bates et
al., 1993). Also, NCBI BLAST alignment of the 28 predicted protein sequences
shows similarity to known mitochondrial protein sequences (data not shown).
The majority of assembled bases are covered by at least one read from each
facility (99.92%, 31,680,436 nt), with 94.06% of the assembled bases being
covered by 5 or more reads from each facility. Only 23,727 nt, or 0.074%, of the
genome is covered by different combinations of 4 facilities. Also, of the total
number of bases assembled, 99.93% (31,683,719) are at a quality value of 64.
These analyses of suggest that the assembly is an accurate and high-quality
representation of the O. novo-ulmi strain H327 genome.

90
Figure 15. The O. novo-ulmi strain H327 genome assembly.
(A) A custom UCSC Genome Browser screen capture of the O. novo-ulmi H327
assembly. Tracks from top to bottom are: (i) a 10Mb scale, (ii) a ruler, (iii)
scaffolds ordered by decreasing size (alternating black/grey), (iv) contigs (black),
(v), depth of read coverage (brown), (vi) GC percent (gray), (vii) gene
predictions, and (viii) EST alignments. (B) Pulse-field gel electrophoresis of 8
strains of O. novo-ulmi and O. ulmi. DNA ladder sizes are marked on the right
and estimated chromosome sizes are marked on the left. Reprinted from Et-Touil,
et al. (1999). (C) The mitochondrial genome assembly. Tracks from top to
bottom are: (i) a scale (20kb), (ii) a ruler, (iii) contig (black), (iv), whole genome
shotgun reads that span the origin, confirming circularity, (v) pair-end reads that
span the origin, conforming circularity.

91
Sequencing Accuracy
Using the genome sequence as a reference, we assessed the reproducibility of the
Roche/454 GS-FLX Titanium System across two sequencing accuracy metrics:
homopolymer length accuracy and substitution error rate.
In the O. novo-ulmi genome we catalogued a total of 408,315 homopolymers from
4 to 10 nt in length (Table 8). The majority (402,455, 98.5%) are less than 8 nt,
and there are roughly 2.8x as many A/T as there are C/G homopolymers (Figure
16a). Accuracy was measured by comparing homopolymer length from individual
reads to orthologous occurrence in the genome sequence. To perform this
analysis, we aligned the reads from each facility to the O. novo-ulmi H327
genome, retaining only unique alignment greater that 300nt. We then catalogued
within each alignment the homopolymer length from both the read sequence and
the orthologous genome sequence. We only considered homopolymer alignments
that had flanking nucleotides that matched between the read and genome
sequence. Due to these criteria, we were able to measure homopolymer accuracy
for a roughly 65-85% of all catalogued homopolymers (Table 8). Within this set,
we observed that accuracy decreases with increasing homopolymer length (Figure
16b). We also observed that while facilities B, C, D and E performed similarly
and maintained above 50% accuracy for all homopolymer lengths considered, the
performance for facility A was below that of the other facilities, achieving 65%
accuracy for homopolymers of length 7, and below 50% for homopolymers of
length 9 and 10. This lower accuracy for facility A was observed for all four
nucleotides (A, C, G and T), with some improvement in accuracy for guanine and
cytosine homopolymers (Figure 17a). This improvement is marginal, and
variation in homopolymer accuracy between bases for any a single facility is
fairly consistent (Figure 17b). We next sought to determine whether inaccuracies
in homopolymer length where due to the under calling or overcalling of
homopolymer length in individual reads. Figure 17c demonstrates that the
majority of errors across all facilities are due to under calls, and that facility A

92
tends to under call homopolymers of length 9 or 10 at an equal or greater
proportion as compared to correct calls (Figure 17c).
Similar to the homopolymer analysis, we conducted the substitution error rate
analysis using only unique alignments of > 300 nt. In addition, we only
considered alignments that had one or two mismatches to the genome sequence,
and only substitutions (not gaps) that appeared more than 5 nucleotides from the
end of the read or another mismatch. Using these criteria we catalogued 135,037
substitutions, and observed that 94.9% (128,201) occurred once per read. Within
each substitution type (e.g., T>C or A>G), the substitution error rate per facility
shows slight variation (Figure 18), with facility E having a slightly higher rate for
C>T or G>A substitutions, and facility B having a higher rate for G>T or C>A
substitutions. The most marked variation is the elevated error rates across all
facilities for T>C or A>G and C>T or G>A substitutions (Figure 18). This has
been observed previously for this platform (Campbell et al., 2008), and is
attributable to PCR fidelity during library preparation (Bracho et al., 1998;
Dunning et al., 1988; Ennis et al., 1990). Notwithstanding these polymerase-based
substitutions, the substitution error rate is below 0.4 per 1000 sequenced bases for
the other 4 substitution types and is similar to previously published observations
for pyrosequencing (Campbell, et al., 2008).

93
Table 8. Homopolymer measurement statistics.
Measured Hompolymers per Site (%)
Homopolymer Length
Genome A B C D E
4 294,261 251,918 (85.61) 253,370 (86.1) 254124 (86.36) 255884 (86.96) 251041 (85.31)
5 79,130 64,110 (81.02) 64,569 (81.6) 64609 (81.65) 65265 (82.48) 63792 (80.62)
6 20,974 15,758 (75.13) 15,873 (75.68) 15718 (74.94) 16093 (76.73) 15618 (74.46)
7 8,090 5,544 (68.53) 5,650 (69.84) 5405 (66.81) 5723 (70.74) 5510 (68.11)
8 3,381 2,173 (64.27) 2,192 (64.83) 2018 (59.69) 2249 (66.52) 2144 (63.41)
9 1,654 1,083 (65.48) 1,129 (68.26) 935 (56.53) 1138 (68.8) 1065 (64.39)
10 825 547 (66.3) 570 (69.09) 411 (49.82) 589 (71.39) 532 (64.48)

94
Figure 16. Homopolymer counts and overall accuracy.
(A) Counts of homopolymers of length 4 to 10 in the O. novo-ulmi H327 genome.
(B) Homopolymer accuracy per core facility (A-E).

95
Figure 17. Aspects of homopolymer accuracy.
(A) Trend of facility accuracy per nucleotide. The leftmost plot is overall
accuracy per facility (identical to Figure 16B), with subsequent plots depicting
accuracy for each nucleotide separately. (B) Trend of nucleotide accuracy per
facility. Each chart depicts overall accurate per facility and each plot line depicts
accuracy for each nucleotide. (C) Homopolymer overcall and under call rates. The
chart depicts for each facility the percent agreement (diagonal), under call (below
diagonal), and overcall (above diagonal) of homopolymers from read sequences
to the genome sequence.

96
Figure 18. Substitution error rate.
For each facility, the substitution rate of a nucleotide in read sequence as
compared to the genome sequence.

97
Discussion
The primary objective of this study was to test the reproducibility of the
Roche/454 GS-FLX Titanium platform across DSRG member facilities. Because
using existing data sets would introduce experimental noise, we chose to whole
genome sequence a single sample from O. novo-ulmi strain H327. Consequently,
we had the opportunity to provide the genome sequence of an important pathogen
to the fungal and arboreal research communities.
We have produced a high-quality assembly of the O. novo-ulmi H327 genome.
The multiple large linear scaffolds are similar in length and number to what was
observed previously (Dewar, et al., 1997) and the number of predicted genes is
similar to related fungi (Diguistini et al., 2009). Also, the near complete mapping
of ESTs from Hintz et al. (2011) suggests that the coding portion of the genome is
well represented. In addition to the chromosomes, we fully assembled the
mitochondrial genome into a single contig, and confirmed its circularity using
both read sequence and paired-end information. This genome sequence provides a
foundation to conduct further research, such as EST sequencing experiments
similar to Hintz et al. (2011), as well as other functional genomics experiments
such as RNAseq or proteomics. Also, this genome assembly will complement
phenotypic and genetic studies, such as those that investigate the pathogenicity of
this organism (C. M. Brasier, 1996; Clive M. Brasier & Kirk, 2001; Et-Touil, et
al., 1999).
In general, the Roche/454 GS-FLX Titanium System was found to be
reproducible across the five facilities tested in this study, with no facility
performing below the minimum throughput limits specified by Roche/454.
However, some cross-facility variation does exist, which has the potential to
impact downstream genomic analyses. This variation was observed at the
sequencing yield and accuracy level.
During this study, reproducibility was tested using several sequencing yield
metrics, including the partitioning of reads below and above an ideal length. This

98
metric has revealed that facilities that produce higher number of sequence reads
(e.g., facility C) may also be producing a higher proportion of low-quality short
reads as compared to other facilities (i.e., facility D). Depending on the goal of the
genomic project, using a higher proportion of lower-quality reads may impact
downstream analysis. For genome assembly, these short low-quality reads will
remain useful, contributing to overall genome coverage; however, for
metagenomics projects, where individual reads are used to identify species,
sequencing errors in short low-quality reads may result in false species or strain
identifications. As a result, a prudent method would be to apply both of these
metrics, thus providing an overall assessment of the sequencing run and how
much of it is of high quality.
To investigate sequencing quality at the nucleotide level we tested the
reproducibility of homopolymer lengths as well as determined the substitution
error rate. The five facilities tested equally well for homopolymers below 7 nt,
achieving above 75% accuracy. Above this length all facilities showed a decrease
in accuracy, calling homopolymer lengths below what was observed in the
genome sequence (under call). Notably, facility A showed the most predominant
decrease in homopolymer accuracy, with less than 50% accuracy for
homopolymers of length 9 or 10 nt. Assembling the genome using only reads
from this facility would have incorrectly determined the length of about 2,400
homopolymers, accounting for 0.008% of the genome sequence. This decrease in
accuracy would be significant for genomic samples with larger proportions of
long homopolymers, or where individual reads are of importance, such as in
metagenomics studies. Compared to the homopolymer error rate, the substitution
error rate due to pyrosequencing is much lower occurring once for every 2,500
sequenced nucleotides. For particular substitutions, the error rate is higher due to
PCR fidelity during library preparation (Campbell, et al., 2008), yet remains
below that of homopolymers, at a rate of approximately 3.25 in 2,500 sequenced
nucleotides. This higher substitution error rate may introduce bias in
metagenomics experiments, where we would expect at least one error per 2-3 read
sequences of 450nt. For metagenomic samples, simulating the effect that

99
increases in homopolymer and substitution error rates have on species
identification would be informative.
Among the facilities tested in this study, we found no correlation between the size
or experience of the sequencing team and sequencing yield or accuracy. For
instance, facility D was the least experienced (lowest number of runs) but
produced the highest quality data, whereas teams with roughly equal experience
(B, C and E) varied in performance. For example, facility E had the lowest overall
sequence yield, whereas facility C had the highest, but both teams have over 100
runs of experience. Other factors not considered in this study, such as instrument
maintenance schedules, may show correlation with reproducibility.
Our study suggests that the Roche/454 GS-FLX Titanium System is reproducible
across member facilities, with some variation is sequence yield and homopolymer
length accuracy. This study demonstrates that a more detailed analysis of
sequence yield and quality would provide greater insight into performance of the
instrument.
Acknowledgements
V. . was the recipient of a Canadian Institutes of Health Research Doctoral
Research Award. We thank Clotilde Teiling and Tim Harkins at Roche/454 for
donating the GS-FLX Titanium reagents. We are thankful to Louis Bernier
(Centre d'étude de la forêt, Université Laval, Québec, Québec) for providing the
strain of O. novo-ulmi H 7.

100
PART IV: DERIVING BIOLOGICAL INSIGHT USING PUBLIC
INFORMATION

101
Connecting Text
My work to this point was largely focused on comparisons within internal
datasets, a genome assembly or a genome sequence and annotations. However,
another important aspect to genome analysis is relating these internally generated
sequences and annotations to those in public repositories. In Chapter 6 I have
collaborated with an investigator from Agriculture and Agri-Food Canada (Dr.
Moussa S. Diarra), and used a summer internship at Microsoft® Research
(mentored by Dr. Simon Mercer) to develop a software application that mines
biological sequence annotations in public repositories.
Dr. Diarra previously isolated an antimicrobial resistant (AMR) strain of E. coli
(ECD-227) from broiler chicken (Diarrassouba et al., 2007). We used genome
sequencing and annotation to identify determinants responsible for this phenotype
(Chapter 7) (Forgetta, et al., 2012) . During this project, we used contiGo and a
custom UCSC Genome Browser of ECD-227 to analyze the genome assembly
and annotations, and found that this strain had numerous virulence and AMR
genes, some of which were located on plasmids found to be from a Salmonella
enterica serovar. Also, the genome analysis determined that ECD-227 is an E.
fergusonii species, correcting the E. coli typing performed previously using other
typing methods (Diarrassouba, et al., 2007). This study is the first to report a
multi-drug resistant E. fergusonii strain from a broiler chicken.
The analysis of ECD-227 included data mining the protein annotations for terms
associated with AMR and virulence, as well as determining whether or not these
genes were acquired from other species or strains. The annotations were obtained
by using a local installation of NCBI BLAST (Altschul, et al., 1997) to compare
the protein sequences to the NCBI non-redundant protein database. Although this
analysis was facilitated by using the UCSC Genome Browser, it was primarily
conducted by me using computer programming and high performance servers;
skills and resources that most microbiologists do not possess. This experience
inspired me to develop a software application, BLAST in Pivot (BL!P) (Chapter
6), that completely automates the alignment of biological sequences using NCBI

102
BLAST and presents the results for data exploration in a program called Pivot
(Chapter 6). Unlike existing applications (Catanho, et al., 2006; Gollapudi, et al.,
2008; J. He, et al., 2007; Xing & Brendel, 2001), BL!P does not require a local
installation of the NCBI BLAST programs or databases and allows for data
mining capabilities beyond the simple filters found in these programs.
Contribution of Authors
I created BL!P and prepared and wrote the manuscript (Chapter 6). The E.
fergusonii study was conceived by Moussa S. Diarra, and the bacterial strain
isolation and antibiotic profiling was performed by the other authors of the
publication (Forgetta, et al., 2012). The team at the McGill University and
Genome Quebec Innovation Centre performed the sequencing of the bacterial
strain. I conducted all the genome analyses and prepared and wrote the
manuscript (Chapter 7) (Forgetta, et al., 2012).

103
CHAPTER 6: A Tool to Automate Multiple BLAST Searches and
Dynamically Explore Results
Vincenzo Forgetta1, Moussa S. Diarra
2, Ken Dewar
1, and Simon Mercer
3
1Department of Human Genetics, McGill University, 740 Dr. Penfield Avenue,
Montreal, QC, H3A 1A4, Canada. 2Pacific Agri-Food Research Centre,
Agriculture and Agri-Food Canada, PO Box 1000, Agassiz, BC, V0M 1A0,
Canada. 3Microsoft Research, One Microsoft Way, Redmond, WA 98052, USA.
This work was performed by Vincenzo Forgetta during a Microsoft Research
internship from June to September, 2010. His mentor was Simon Mercer, Ph.D.,
Director of Health and Wellbeing, Microsoft External Research.
A modified version of this manuscript has been submitted to PLOS ONE.
The source code, binaries, and documentation is available at
http://blip.codeplex.com

104
Abstract
NCBI BLAST is a tool widely used to annotate biological sequences. Current
limitations in the annotation process are in part dictated by the methodology used.
The manual inspection of BLAST results is slow, tedious and limited to static
analysis of textual output, while automated analyses typically discard useful
information in favor of increased speed and simplicity of analysis. These
limitations can be addressed using novel data exploration and visualization
methods. We have created a program that automates NCBI BLAST searches,
fetches associated GenBank records, and dynamically explores the results. It also
provides an interface to create customized images for each BLAST match,
allowing the user to perform further customizations to meet their data exploration
objectives.

105
Introduction
An NCBI BLAST (Altschul, et al., 1997) search of available biological sequence
databases is a leading method used for biological sequence comparison and
annotation. The method consists of two tasks: querying one or more sequences
against a biological sequence database, followed by the analysis of significant
alignments to suggest the origin and function of the query sequences. The
majority of users perform a BLAST analysis using the web servers available at
NCBI (http://blast.ncbi.nlm.nih.gov/Blast.cgi) followed by manual inspection of
the results. This approach entails reading or scanning the BLAST results web
page for each query separately and browsing to individual records in GenBank
(Benson et al., 1997) to obtain further information regarding the matched target
sequence. For a larger number of query sequences manual inspection is not
feasible, and numerous computer programs were developed to automate the
querying and analysis of a large number of BLAST records (Catanho, et al., 2006;
Darzentas, 2010; Gollapudi, et al., 2008; J. He, et al., 2007; Xing & Brendel,
2001). These programs require the local installation of the BLAST programs and
databases or process pre-computed BLAST results, and are available as a web-
service or can be downloaded and installed on a local server.
The analysis of BLAST results involves filtering for significant hits followed by a
more detailed analysis of the resulting output for biologically relevant results.
This analysis can be conducted using text-based and/or graphical representations
of the BLAST results. Currently available programs present results primarily in
tabular format, supplemented with simple graphical views that summarize the
pair-wise alignment for each hit. In general, these programs facilitate the post-
processing of BLAST results; however, limitations still exist for their use by some
biologists. These limitations include: (i) the need to install and operate BLAST
locally, (ii) the absence of additional information provided in GenBank for the
target sequence of each BLAST hit, (iii) the query-centric analysis hinders the
ability to detect patterns that exist across multiple query sequences, and (iv) the
inability to customize aspects of the data analysis.

106
To address these limitations we have created a desktop application to
automatically query NCBI BLAST and allow for the dynamic exploration of the
results across multiple query sequences. Our goal was to create an application that
automates the NCBI BLAST search of hundreds, and potentially thousands, of
biological sequences, including multiple matches per query, as well as
incorporating information from the GenBank records. Because BLAST results are
textual, our aim included the development of a user interface to create custom
image layouts for each BLAST hit to allow the user to customize the visual
representation of the individual BLAST matches. The resulting application has
been named BL!P (pronounced \blip\), or BLAST in Pivot.
This report describes how we created BL!P and demonstrates its use in exploring
and visualizing the attributes contained within the BLAST and GenBank data
across multiple query sequences. As a test case example, we demonstrate the use
of BL!P in assessing the evolutionary origins of predicted proteins from a
genomic region of an E. coli-like strain isolated from broiler chicken (Forgetta, et
al., 2012), as well as detecting the presence of an introgressed bacteriophage
within this genomic region.
Implementation
The process for generating the output is straightforward and is similar to other
programs known as wizards; programs that instruct the user to complete a task,
such as the installation of a program, through a series of linear steps. The input is
a file with either DNA or protein sequences in FASTA format. In addition, the
user is prompted to specify a project name, a location in which to store the results,
as well as the BLAST parameters used to query the database and filter the results
(for further information see documentation on the BL!P website). To avoid the
inefficient use of time, internet bandwidth, and computational resources at NCBI,
the BLAST results and GenBank records are saved to disk. This enables BL!P to
resume an interrupted process, and is particularly important when processing
large numbers of query sequences that have lengthy BLAST execution times. To
further avoid inefficiency, the similarity searches are performed using the default

107
e-value parameter (10.0), with filters being applied to these results and used to
obtain a list of GenBank identifiers to download from NCBI. This version of
BL!P gathers 21 attributes from the BLAST match and associated GenBank
record. Following successful completion of the BLAST search and GenBank
download, the user is allowed to customize the image that will represent each
BLAST hit. The customized image consists of textual elements from the BLAST
and GenBank record. Each element can be positioned within the image layout and
its appearance modified (font size, font color, font family, etc) to accentuate its
importance. The background color of the image varies according to the species or
genus of the BLAST hit's target sequence.
Following generation of the images for each BLAST hit, the user is directed to
visualize their results using the PivotViewer web-browser plugin. PivotViewer is
a data exploration program that allows for the seamless exploration of large
datasets that consist of text and images, and includes real-time text search and
filtering functionality. The list of BLAST hits, represented as images, is updated
in real-time based on the text search and filter criteria specified by the user.
In addition, the set of BLAST hit images can be navigated with the mouse as well
as zoomed in and out. Selecting a BLAST hit image raises an information panel
that contains the detailed information parsed from the BLAST result and
GenBank record. Individual details can be selected to further filter the BLAST hit
images by that value (e.g., Identity), navigate to a web resource (e.g., Gene), or
link to the pairwise alignment in text format (e.g., AlignLen). Double-clicking the
matches’ image will navigate to the GenBank record in NCBI. Tabular results can
be exported in text format for either the entire set of BLAST results or the
currently filtered set of hits via links in the title bar.
BL!P was developed in C# using .NET 4.0 and the Microsoft Biology Foundation
(MBF) open-source bioinformatics toolkit (http://research.microsoft.com/bio).
The graphical user interface was created using Windows Presentation Foundation
version 4. The MBF toolkit was used to access NCBI resources such as BLAST
and GenBank, as well as parsing biological sequence data. Submissions to

108
BLAST and data from GenBank are accessed according to NCBI recommended
usage policies. Freely available dynamically linked libraries were also used (see
BL!P website). BL!P requires Microsoft Windows XP or better, .NET 4.0, and the
Silverlight PivotViewer web browser plugin (see http://blip.codeplex.com for
more information).
Results.
Functionality in BL!P is demonstrated in Figure 19 using a real world example of
223 predicted proteins from a 228 Kb genomic region of ECD227. Prior to
genome sequencing, conventional tests indicated an ambiguity in its taxonomy,
with ECD227 either belonging to E. coli or a closely related genera. Figure 19a
demonstrates the two steps required to visualize the distribution of bacterial
species names among the top-scoring matches for each query. The resulting data
visualization shows that this region in ECD227 contains a roughly equal number
of genes that are most similar to either E. coli or E. fergusonii. Figure 19b shows
refinement of this analysis, demonstrating that the interspersed positional
distribution matches for each predicted gene indicates that this is not due to the
insertion of one or more genomic islands, but that isolate ECD227 is closely
related to both species. Figure 19c demonstrates how to assess for the presence of
horizontally transferred sequences using the text search capabilities built within
Pivot. The procedure is similar to Figure 19a; however, the data is sorted using a
different category (input order), and not filtered for rank. Also in this example, the
keyword “phage” was used to filter the matches accordingly, and illustrates that
there is a bacteriophage present in the centre of this genomic region.

109
Figure 19. Test case study using BL!P for the analysis of 223 predicted proteins
from E. fergusonii ECD227.
(A) Pivot image demonstrating the distribution of species names among the top-scoring matches:
(1) sliders in the Rank filter were used to limit rank value to 1; (2) the histogram was sorted by
species; (3) two predominant peaks that represent top-scoring matches for Escherichia coli (left,
white) and E. fergusonii ECD227 (right, light-brown) were observed. (B) Pivot image
demonstrating the input order of top-scoring matches: (1) the histogram was sorted by input order
and filtered for matches from E. coli or E. fergusonii (2). The interspersed distribution of E. coli
and E. fergusonii matches was observed. (3) Individual matches are represented by an image,
which contains additional BLAST/GenBank detail and can be customized prior to analysis in
Pivot (Fig 1D). Selecting the image in the PivotViewer raises a panel with additional
BLAST/GenBank details (not shown). (C) Pivot image demonstrating the positional distribution
of the top 5 matches for each predicted gene, filtered for the keyword “phage”: (1) the keyword
“phage” was entered using the search box; ( ) histogram was sorted by input order; ( ) a peak of
matches indicating the presence of a phage was observed. (D). BL!P image of the custom image
layout creator displaying information for the top-scoring match for query sequence 17. The image
layout (6) is a dynamic interface that allows items to be moved (not shown) and their appearance
modified (3). Selecting a category dictates the background color scheme (1) (set to species in this
example). Attributes are added to the image (2) and their appearance is modified using the controls
(3). The currently displayed item can be changed (4), with details for each item appearing on the
right (5).

110
Because BLAST results and GenBank records consist entirely of textual
information, an interface was created enabling the user to create their own image
layout (Figure 19d). The image layout is created by selecting filters from the list
and adding them to the image preview; filters are deleted from the preview using
the delete or backspace key. The value for the particular BLAST hit appear in the
image preview; alternate BLAST hits can be previewed using the interface. The
filter value for the BLAST hit in the image preview can be moved with the mouse
and the fonts’ appearance can be modified to accentuate its relative importance or
provide aesthetic appeal. The background color of the image varies according to
the species or genus of the matches target sequence. For more detail please refer
to the BL!P User Guide.
Conclusions
BL!P attempts to make the process of BLAST search of many query sequences
trivial and customizable, allowing a biologist to explore BLAST results in a
timely manner. The example of ECD-227 shown in the present work demonstrates
only few of BL!P capabilities, and interested researchers are invited to try the
sample dataset available for download on the BL!P website, or to create
collections using their own DNA or amino acid sequences.
Availability and Requirements
This software is open source and is available for free at http://blip.codeplex.com
under the Microsoft Public License (Ms-PL). BL!P requires Microsoft Windows
XP or better.
Authors' contributions
VF conceived, designed and developed the software program and wrote the
manuscript; MSD was responsible for isolating and typing E. coli ECD-227. KD
revised the manuscript and provided intellectual content; SM was important in the
conception and design of the software program. All authors read and approved the
final manuscript.

111
Acknowledgements and Funding
We are grateful to Xin-Yi Chua for comments and C# expertise. We also thank
the developers of the MBF and PivotViewer for their technical support, and Bob
Silverstein and Xiaoji Chen from the EPX User Experience group for comments
and suggestions.
VF was a summer intern at Microsoft Research (Redmond, WA, USA). VF
received a standard intern salary and benefits from the Microsoft Corporation
during this time. VF is a recipient of a Canadian Institutes of Health Research
Doctoral Research Award. The bacterial typing and genome sequencing of
ECD227 was funded by the Agriculture and Agri-Food Canada (MSD) and the
genome sequencing was performed at the McGill University and Genome Quebec
Innovation Centre (KD).

112
CHAPTER 7: Pathogenic and Multidrug Resistant Escherichia fergusonii
from Broiler Chicken
Copyright © 2012, Federation of Animal Science Societies.
Citation:
Vincenzo Forgetta, Heidi Rempel, François Malouin, Rolland Jr.
Vaillancourt, Edward Topp, Ken Dewar and Moussa S. Diarra. (2012).
"Pathogenic and multidrug-resistant Escherichia fergusonii from broiler chicken."
Poultry Science 91(2): 512-525.
Reprinted with the permission of Poultry Science (PS).
This is an author-created, uncopyedited electronic version of an article accepted
for publication in PS. The Federation of Animal Science Society, publisher of PS,
is not responsible for any errors or omissions in this version of the manuscript or
any version derived from it by third parties. The definitive publisher-authenticated
version is available at
http://ps.fass.org/content/91/2/512.

113
Abstract
An Escherichia spp. isolate, ECD-227, was previously identified from broiler
chicken as a phylogenetically divergent and multidrug resistant E. coli
(Diarrassouba, et al., 2007) possessing numerous virulence genes (Lefebvre et al.,
2008; Lefebvre et al., 2009). In this study, whole genome sequencing and
comparative genome analysis were used to further characterize this isolate. The
presence of known and putative antibiotic resistance and virulence open reading
frames (ORFs) were determined by comparison to pathogenic (E. coli O157:H7
TW14359, APEC O1:K1:H7, and UPEC UTI89) and non-pathogenic species (E.
coli K-12 MG1655 and E. fergusonii ATCC 35469). The assembled genome size
of 4.87 Mb was sequenced to 18-fold depth of coverage and predicted to contain
4,376 ORFs. Phylogenetic analysis of 537 ORFs present across 110 enteric
bacterial species identifies ECD-227 to be E. fergusonii. The genome of ECD-227
contains five plasmids showing similarity to known E. coli and Salmonella
enterica plasmids. The presence of virulence and antibiotic resistance genes were
identified and localized to the chromosome and plasmids. The mutation in gyrA
(S83L) involved in fluoroquinolone resistance was identified. The Salmonella-
like plasmids harbor antibiotic resistance genes on a class I integron (aadA,
qacE-sul1, aac3-VI, and sulI) as well as numerous virulence genes (iucABCD,
sitABCD, cib, traT). In addition to the genome analysis, the virulence of ECD-227
was evaluated in a day-old chick model. In the virulence assay, ECD-227 was
found to induce 18 to 30% mortality in day old chicks after 24 h and 48 h
infection, respectively. This study documents an avian multidrug resistant and
virulent E. fergusonii. The existence of several resistance genes to multiple
classes of antibiotics indicates that infection caused by ECD-227 would be
difficult to treat using antimicrobials currently available for poultry.
Key words: Genome sequence, Escherichia fergusonii, broiler chicken, virulence,
multidrug resistance.

114
Introduction
Escherichia are found in many environments, including the digestive tracts of
mammals and birds. In the gut, most are part of the normal microflora; however,
certain strains can be pathogenic and able to induce intra-intestinal or extra-
intestinal disease, and can thus pose significant risks to health. Furthermore,
pathogenic strains of poultry and livestock can be transmitted to humans where
they may cause disease (Rodriguez-Siek et al., 2005; Ron, 2006). The genomes of
numerous pathogenic Escherichia coli strains have been sequenced, including
enterohaemorrhagic E. coli (EHEC) strain O157:H7 (Kulasekara et al., 2009;
Perna et al., 2001) that causes intestinal disease, uropathogenic E. coli (UPEC)
(Chen et al., 2006; Welch et al., 2002) strains that cause urinary tract infections,
and the avian pathogenic E. coli (APEC) strain O1:K1:H7 that causes
colibacillosis in poultry (T. J. Johnson et al., 2007). E. fergusonii is a new species
identified by Farmer et al. in 1985 (Farmer et al., 1985), and the genome sequence
for a non-pathogenic strain was made available as part of a survey of E. coli
genome evolution (Touchon et al., 2009). E. fergusonii has recently been shown
to cause disease in animals (Bangert et al., 1988; Hariharan et al., 2007; Herraez
et al., 2005) and humans (Bain & Green, 1999; Funke et al., 1993; Mahapatra &
Mahapatra, 2005), and it possesses an extended spectrum of resistance to
antibiotics (Lagace-Wiens et al., 2010; Savini et al., 2008).
In North America, sub-therapeutic doses of antimicrobial agents continue to be
used in livestock and poultry feed to prevent and control infections, resulting in
improved weight gain and enhanced feed efficiency. This practice is known to
modify the intestinal micro-flora and create selective pressure favoring the
emergence of antibiotic resistant strains (Aarestrup et al., 2001). The emergence
of antimicrobial resistant and pathogenic bacteria in food producing animals
represents a serious food safety concern and is a threat to public health. In
bacteria isolated from poultry, determinants of antibiotic resistance have been
identified on mobile genetic elements such as plasmids, transposons and
integrons, thus potentially allowing these determinants to be spread between

115
species (Fricke et al., 2009). A study conducted by Diarrassouba et al. in 2007
(Diarrassouba, et al., 2007) on antibiotic resistance and virulence determinants
across multiple broiler chicken farms isolated several antibiotic resistant E. coli.
One of these isolates, ECD-227, was found to be resistant to 22 of 25 antibiotics
tested. Subsequent studies conducted by Lefebvre et al. (Lefebvre, et al., 2008;
Lefebvre, et al., 2009) using DNA array hybridization showed that ECD-227
possessed numerous E. coli virulence genes, but this isolate was genetically
distant to most known E. coli strains, suggesting that it could be a divergent E.
coli strain or a closely related species.
Whole genome sequencing followed by comparative genome analysis allows the
comprehensive determination of evolutionary relationships among bacterial
species, and permits the identification and localization of candidate genes
involved in antibiotic resistance and/or virulence. The objective of this study was
to sequence the genome of ECD-227 in order to clarify its evolutionary
relationship with other enteric bacteria, and to assess them for the presence of
determinants responsible for antibiotic resistance of this isolate. In addition, the
level of virulence of ECD-227 was assessed in a day old chick model.
Materials and Methods
Bacterial Strains
The isolation and original characterization of ECD-227 has been described
previously (Diarrassouba, et al., 2007; Lefebvre, et al., 2009). E. coli D06-2195
(isolated from a broiler septicemia case) and E. coli K-12 MG1655 (American
Type Culture Collection) (Ngeleka et al., 2002) were used as positive and
negative controls, respectively, in the in vivo virulence assay.

116
Whole Genome Sequencing and Assembly
Genomic DNA was extracted from a single colony culture of stock kept at -80 oC
in 25% glycerol using a standard commercial column-based extraction method
(QIAamp DNA Mini Kit, Qiagen, Mississauga, CA). DNA was stored in 1X TE
buffer (pH 8.0), quantified by spectrophotometry (Bio-Rad SmartSpec 3000
UV/Visible Spectrophotometer, Mississauga, CA), visualized by 1% agarose gel
electrophoresis, and stored at -20 oC until further use. Whole-genome shotgun
library preparation and sequencing was performed using the Roche/454 GS-FLX
Titanium system following manufacturer protocols and shotgun reads were
assembled using Newbler version 2.3. Contigs of minimum size of 500
nucleotides were ordered and oriented based on alignment to the finished genome
of E. fergusonii ATCC 35469 (GenBank Accession CU928158). Plasmid contigs
were ordered and oriented based on the most similar plasmid sequences found in
NCBI GenBank.
Annotation and Comparative Analysis
Open reading frames (ORFs) were predicted using Glimmer 3.02 (Delcher, et al.,
2007). ORFs less than 200 nt were excluded from further analysis. Translated
ORFs were compared to all known protein sequences using NCBI BLAST
(Altschul, et al., 1990) (April 2010 version of the nr database). Amino acid
alignments below 60% identity or 80% query coverage were excluded from
further analysis. Protein alignments to representative pathogenic (E. coli APEC
O1:K1:H7 (T. J. Johnson, et al., 2007), UTI89 (Chen, et al., 2006), and O157:H7
TW14359 (Kulasekara, et al., 2009)) and non-pathogenic (E. coli K-12 MG1655
(Blattner et al., 1997) and E. fergusonii ATCC 35469 (Touchon, et al., 2009))
bacteria were extracted from the BLAST results. The GC content of the genome
was computed in 2000 nt windows that where staggered by 1000 nt. Putative
virulence and antimicrobial resistance genes were identified and positioned on the
genome by alignment of protein sequences obtained from Bruant et al. (2006) or
through manual inspection of the BLAST results. Linear representations of the

117
genome and plasmids were generated using a custom instance of the UCSC
Genome Browser (Kent, et al., 2002) housing the ECD-227 genome and
annotations.
Phylogenetic Analysis
A total of 110 enteric bacterial species were selected from the NCBI BLAST
results, from which 537 homologous ORFs were found to be present in all
members. An amino acid multiple alignment was generated for each of the 537
ORFs using MAFFT (Katoh et al., 2002), and informative alignment columns
were extracted and merged. Phylogenetic analyses were conducted in MEGA4
(Tamura, et al., 2007) as follows: the evolutionary history was inferred using the
Neighbor-Joining method; the bootstrap consensus tree was inferred from 100
replicates; and branches corresponding to partitions reproduced in less than 95%
bootstrap replicates were collapsed. All positions containing gaps and missing
data were eliminated from the dataset (Complete deletion option) giving a total of
23,813 positions in the final dataset.
Nucleotide Sequence Accession Numbers
The sequence and annotation of the ECD-227 chromosome and plasmids has been
deposited in NCBI GenBank under the accession numbers CM001142,
CM001143, CM001144, CM001145, CM001146, and CM001147.
Antibiotic Resistance Profiling
The antibiotic resistance profile for ECD-227 was determined for 18 antibiotics
previously (Diarrassouba, et al., 2007). Additional susceptibility of ECD-227 to
10 antibiotics and to imipenem, meropenem, lincomycin and rifampin was
determined using sensititre as described previously (Diarrassouba, et al., 2007)
and by disk diffusion assays according to Clinical Laboratory and Standards
Institute (CLSI) guidelines (CLSI, 2008).

118
Virulence in Day-old Chicks
The virulence of ECD-227 was tested by subcutaneous inoculation of day-old
broiler chicks obtained from a local hatchery (Western Hatchery, Abbotsford, BC,
Canada). ECD-227 and the control strains were grown in Tryptic Soy broth (TSB,
Becton Dickinson, Mississauga, ON, Canada) for 18 hr at 37oC and re-suspended
in the TSB (Becton Dickinson) at a concentration of 1.2 × 10⁷ CFU/ml
(confirmed by viable bacterial count). Groups of 40 day-old chicks were
subcutaneously inoculated with 0.25 ml/bird (approximately 3 × 10⁶ CFU) and
divided in four cages (10 birds per cage). Care was taken to assure that similar
CFUs were subcutaneously inoculated for all tested isolates. Clinical symptoms
and mortality were first monitored hourly for 12 h and thereafter at 24 h and 48 h.
Birds in discomfort (signs of severe disease such as a drop in food consumption,
listless appearance with ruffled feathers, head drawn into their bodies, rapid
labored breathing, gasping or other respiratory distress) were removed and
euthanized. Two birds per cage from the remaining birds at the end of the
experiment were euthanized with carbon dioxide for necropsy. After 48 h, isolates
that killed more than 50%, 10-50% and less that 10% of chicks were classified
virulent, moderately virulent and non-virulent, respectively. During necropsies,
livers, spleens, hearts and lungs were taken for bacterial isolation. All
experimental procedures performed with chicks were approved by the Animal
Care Committee of the Pacific Agri-Food Research Center (Agassiz, British
Columbia, Canada) according to guidelines described by the Canadian Council on
Animal Care (CCAC, 1993).
Results and Discussion
Phylogenetic Assessment of ECD-227
Analyses of 537 homologous protein sequences were conducted against 110
bacterial species, encompassing E. fergusonii (ATCC 35469), 74 E. coli, 29
Salmonella, and 6 other enteric bacterial species. ECD-227 was more similar to E.
fergusonii ATCC 35469 than to any other enteric bacteria analyzed (Figure 20)

119
In addition, analysis of the BLAST results for the chromosomal predicted protein
set (4,058 protein sequences) against the NCBI nr database showed that 2006
protein sequences (49%) had greater similarity to E. fergusonii ATCC 35469 than
to E. coli K-12 MG1655. Another 515 sequences (12%) were equally similar
between E. fergusonii ATCC 35469 and E. coli K-12 MG1655. Only 581 (14%)
had greater similarity to E. coli K-12 MG1655. Of the 956 predicted proteins
(23%) that were not present in both E. fergusonii ATCC 35469 and E. coli K-12
MG1655 there were 677 (16%) that had significant alignment to E. fergusonii
ATCC 35469 only. The remaining group of 279 (6%) predicted proteins were
either similar to E. coli K-12 MG1655 only (48 ORFs), pathogenic E. coli strains
(90 ORFs), or had no significant alignment and where unique to ECD-227 (141
ORFs).

120
Figure 20. Phylogenetic tree of 110 enteric bacteria and E. fergusonii ECD-227.
The tree was constructed using protein sequences from 537 genes. The bootstrap
consensus tree was inferred from 100 replicates, and branches corresponding to
partitions reproduced in less than 95% bootstrap replicates are collapsed. ECD-
227 is more closely related to E. fergusonii (boxed) than to other E. coli (dark
gray) or Salmonella enterica (light gray) strains.

121
Biochemical Typing
Initially, ECD-227 tested negative for sorbitol (SOR), arginine dihydrolase
(ADH), ornithine decarboxylase (ODC) and fermentation of amygdalin (AMY),
and was identified as E. coli (97.2% accuracy) with API 20E and APILAB
software (version 3.3.3) (Diarrassouba, et al., 2007). However, subsequent DNA
hybridization studies (Lefebvre, et al., 2008; Lefebvre, et al., 2009) showed that
ECD-227 clustered distantly from the other E. coli isolates, indicating its
divergence from other E. coli strains. Due to the discrepancy between the API
20E test and the whole genome analysis, the API 20E test was repeated and now
identified ECD-227 as SOR negative, but positive for ADH, ODC, and AMY.
Using APIWEB version 4.1 (http://apiweb.biomerieux.com) ECD-227 was
identified as E. fergusonii (99.8% accuracy, but with the ADH result not matching
the identification). The difference between the initial API identification and the
one conducted as part of this study may be due to the improved API 20E
identification system and/or misinterpretations of the original tests of ECD-227 in
the ADH, ODC, and AMY reactions. Our whole genome sequence analysis
allowed us to comprehensively determine the phylogenetic relationship of ECD-
227 as compared to other enteric bacteria. To the our knowledge, our study is the
first report of E. fergusonii in commercial broilers in Canada, although there is
previous report of the presence of E. fergusonii in processed poultry meat from
New Zealand (Millar, 2007).
Overview of the ECD-227 Genome
The draft-quality genome assembly of ECD-227 was sequenced to an average
read depth of 18x and assembled into 83 contigs. The genome is comprised of a
chromosome of 4,509,764 nt (Table 9 and Figure 21) and five plasmids
(pEDC227), ranging in size from 4,716 to 113,116 nt (Table 9). The entire
assembly possesses 4,376 predicted ORFs, with 4,058 ORFs on the 4.51 Mb
chromosome.

122
Table 9. Overview of the ECD-227 genome.
Size (nt)
No.
ORFs
No.
Contigs
G+C Content
% (± 1 std)
Average
ORF Length
(nt)
Coding
Density
(%)
Read Depth
(± 1 std)
Est.
Plasmid
Copy No.
Most similar plasmid (GenBank)
Chromosome 4,509,764 4,058 59 50.1 ± 4.1 978 88.0 16.9 ± 6.1
Plasmids
pECD227_5 4,716 2 1 59.1 ± 5.2 923 39.1 63.4 ±
16.2 4 pColG (NC_010904)
pECD227_46 45,563 29 7 58.0 ± 8.2 787 50.1 57.4 ±
23.8 3 pCVM29188_46 (NC_011078.1)
pECD227_80 80,153 74 3 52.4 ± 2.8 874 80.7 20.4 ± 5.3 1 pO111-2 (NC_013370.1)
pECD227_112 112,296 109 6 47.1 ± 6.9 788 76.5 37.1 ±
10.9 2 pCVM29188_101 (NC_011077.1)
pECD227_113 113,116 104 7 50.5 ± 5.8 801 73.6 25.8 ± 7.0 2 pCVM29188_146 (NC_011076.1)
Genome 4,865,608 4,376 83
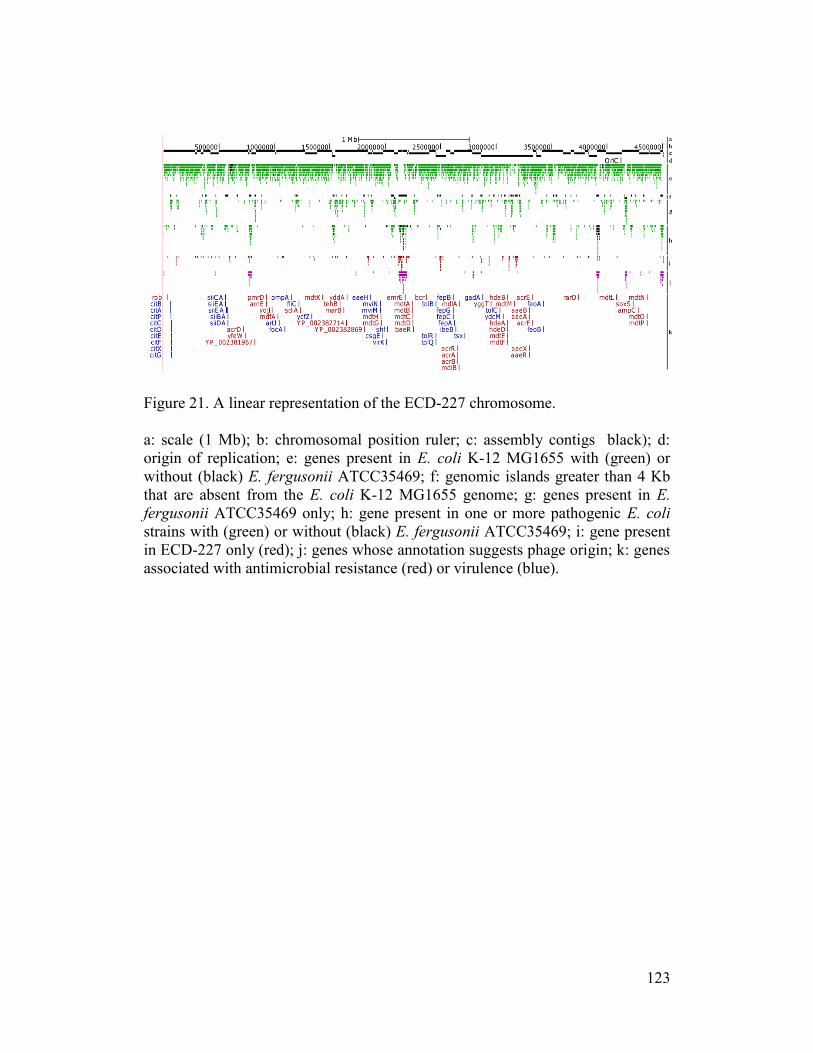
123
Figure 21. A linear representation of the ECD-227 chromosome.
a: scale (1 Mb); b: chromosomal position ruler; c: assembly contigs black); d:
origin of replication; e: genes present in E. coli K-12 MG1655 with (green) or
without (black) E. fergusonii ATCC35469; f: genomic islands greater than 4 Kb
that are absent from the E. coli K-12 MG1655 genome; g: genes present in E.
fergusonii ATCC35469 only; h: gene present in one or more pathogenic E. coli
strains with (green) or without (black) E. fergusonii ATCC35469; i: gene present
in ECD-227 only (red); j: genes whose annotation suggests phage origin; k: genes
associated with antimicrobial resistance (red) or virulence (blue).

124
The GC content of the ECD-227 chromosome is 50.1%, which is similar to E.
fergusonii strain ATCC 35469 and other enteric bacteria. The plasmids had a
variable GC content ranging from 47.1 to 59.1%. The ECD-227 plasmids tend to
have higher depths of read coverage, lower average ORF length, and lower coding
density (Table 9).
All five ECD-227 plasmids had high similarity to known circular plasmids.
Plasmid alignments indicate that the ECD-227 plasmids are also circular.
Plasmids pECD227_5 and pECD227_80 are more than 97% identical to pColG
(Avgustin & Grabnar, 2007) and pO111-2 (similar to prophage plasmid P1)
(Ogura et al., 2009), respectively, and do not possess any large insertions or
deletions. Plasmids pECD227_46, pECD227_112 and pECD227_113 are more
than 97% identical to Salmonella plasmids (Fricke, et al., 2009) (Table 9).
Plasmid pECD227_46 is similar to pCVM29188_46 (NC_011078.1) which has
little similarity to other known plasmids (Fricke, et al., 2009). The sequence of
pECD227_112 is highly similar to that of pCVM29188_101 (NC_011077.1), with
the exception of an extra 28 Kb region. Analysis of this 28 Kb region indicated
that it was composed of a transposon similar to Tn21 harboring a class I integron
(Figure 22a). The largest plasmid, pECD227_113, is highly similar to
pCVM29188_146 (NC_011076.1), with the exception of one region that
possesses sporadic similarity and contains a putative adhesin and some putative
invasion genes (Figure 22b). This plasmid has a backbone that is highly similar to
the E. coli APEC plasmids pAPEC-O1-ColBM (T. J. Johnson, Johnson, et al.,
2006) and pAPEC-O2-ColV (T. J. Johnson, Siek, et al., 2006). The ability of the
ECD-227 plasmids to be transferred to other Enterobacteriaceae such as
Salmonella and E. coli has not been evaluated in this study. However, to our
knowledge this is the first study reporting an E. fergusonii isolate from chicken
that possesses multiple plasmids similar to those from a Salmonella species.

125
Figure 22. Linear representation of the two largest ECD-227 plasmids;
pECD227_112 and pECD227_113.
From the top to bottom: a: a scale (50 Kb); b: chromosomal position ruler; c:
assembly contigs (black); d: position of ORFs (black); e: ORFs associated with
antimicrobial resistance (red) or virulence (blue); f: similarity to transposon tn21
(purple); g: similarity to the most similar plasmid from NCBI GenBank.

126
Antimicrobial Resistance of ECD-227
Results combined from this study and a previous study (Diarrassouba, et al.,
2007) found that ECD-227 is resistant to several structural classes of antibiotics
(Table 10). In addition, ECD-227 is resistant to lincomycin and rifampin but
susceptible to imipenem and meropenem.
Acquired multidrug resistance in bacteria may be a result of accumulation of
multiple genes, each coding for resistance to a single drug, or of the increased
expression of genes coding for multi-drug efflux pumps, extruding a wide range
of drugs (Nikaido, 2009). The ECD-227 efflux pump and resistance genes are
presented in Table 11. The genomic loci for the multi-drug resistance were found
across the chromosome (Figure 21) and plasmid pECD227_112 (Figure 22).
Chromosomal loci include the multi-drug efflux acrABDEFR, ampC/yfeW and
rarD genes conferring resistance to aminoglycosides, beta-lactams, macrolides,
and phenicol antimicrobials, respectively (Nikaido, 2009). The acrABDEFR
efflux pump, belonging to the resistance-nodulation-division family (RND), is
known to play a prominent role in multi-drug resistance in Gram negative bacteria
(Nikaido, 2009). The presence of such a system in ECD-227 would be expected to
contribute to the multi-drug resistance phenotype of this isolate. Another RND-
type efflux pump cluster, mdtABCDEFGHKLMNOP, involved in the resistance to
novobiocin in E. coli, has been detected in ECD-227 (Baranova & Nikaido,
2002). A multidrug efflux pump emrABDER, of the major facilitator superfamily
(MFS) has also been identified on the chromosome of ECD-227. This MFS pump
with 14 transmembrane domains confers resistance to nalidixic acid which could
contribute to the elevated MICs (>32 µg/ml) of this antibiotic against ECD-227.
Numerous other loci associated with multi-drug efflux systems including the arnE
of the small multidrug resistance (SMR) family were also found on the
chromosome (Table 11). The plasmid pECD227_112 bears a class I integron that
contains genes aadA/aacA, qacEΔ1, sulI, and tetAR which confer resistance to
aminocyclitols/aminoglycosides, sulfamides, and tetracyclines, respectively
(Figure 22a). The class I integron is present within a transposon similar to Tn21,

127
which contains the mercuric transport system (merACDRT). The chloramphenicol
acetyltransferase (cat) gene conferring resistance to chloramphenicol resistance
was not detected on this plasmid suggesting that the reduced susceptibility
(intermediary resistance) of ECD-227 to this antibiotic might be related to the
chromosomal efflux pump mdfA, which can also confer resistance to cationic dyes
and fluoroquinolones (Nikaido, 2009). In addition to the presence of antibiotic
resistance genes, we also detected the serine to leucine mutation at codon 83
(S83L) of the gyrA gene that confers resistance to quinolones (Hopkins et al.,
2005). This mutation was not detected in the E. coli strains or E. fergusonii ATCC
35469. Further work is needed to determine how much of the resistance profile is
accounted for by chromosomal or plasmid resistance genes and to further validate
the function of each resistance gene.

128
Table 10. Minimal inhibitory concentrations (MICs) of 28 antibiotics against
ECD-227.
Class Antibiotic MIC (µg/ml)a Phenotypeb Reference
Beta-lactam amoxicillin > 16 R Diarrassouba et al. (2007)
amoxicillin-clavulanic acid 32 R This study.
ampicillin > 32 R This study.
cefoxitin 32 R This study.
ceftiofur > 4 R Diarrassouba et al. (2007)
ceftriaxone 0.5 S This study.
penicillin > 8 R Diarrassouba et al. (2007)
Phenicol choramphenicol 16 I This study.
Quinolone ciprofloxacin ≤ 0.015 S This study.
clindamycin > 4 R Diarrassouba et al. (2007)
enrofloxacin 1 I Diarrassouba et al. (2007)
nalidixic acid > 32 R This study.
novobiocin > 4 R Diarrassouba et al. (2007)
sarafloxacin > 0.25 R Diarrassouba et al. (2007)
Macrolide erythromycin > 4 R Diarrassouba et al. (2007)
tylosin > 20 R Diarrassouba et al. (2007)
Aminocyclitol spectinomycin > 64 R Diarrassouba et al. (2007)
Aminoglycoside amikacin 4 S This study.
gentamicin > 8 R Diarrassouba et al. (2007)
kanamycin > 64 R This study.
neomycin 32 R Diarrassouba et al. (2007)
streptomycin 64 R Diarrassouba et al. (2007)
Tetracycline oxytetracycline > 8 R Diarrassouba et al. (2007)
tetracycline > 8 R Diarrassouba et al. (2007)
Sulfamide sulfizoxazole > 256 R This study.
sulphadimethoxime > 256 R Diarrassouba et al. (2007)
sulphathiazole > 256 R Diarrassouba et al. (2007)
trimethoprim/sulphamethoxazole 0.5 S Diarrassouba et al. (2007) a, Breakpoints of Clinical Laboratory Standards Institute and the Canadian Integrated Program for Antimicrobial Resistance
Surveillance. b I = intermediary resistant; R = resistant; S = susceptible.

129
Table 11. Antimicrobial resistance-associated genes of ECD-227.
Presence in:
Gene(s) Description Class APEC
O1:K1:H7
UPEC
UTI89
O157:H7
TW14359
K-12
MG1655
E. fergusonii
ATCC 34569
Chromosomal
aae(ABRX) pHBA resistance + + + + +
acr(ABDEFR) multidrug efflux system Aminoglycoside + + + + +
ampC beta-lactamase Beta-lactam + + + + +
arnE multidrug resistance protein, SMR family - + + + +
baeR DNA-binding transcriptional regulator + + + + +
bcr bicyclomycin/multidrug efflux system + + + + +
emrC multidrug-resistance antiporter Macrolide + + + + -
gyrA codon 83 (Ser>Leu) gyrase A Quinilone - - - - -
hde(ABD) acid-resistance protein + + + + +
marB Multiple antibiotic resistance protein, putative
exported protein
- - - - +
mdfA multidrug efflux system + + + + +
mdl(AB) putative multidrug transport system + + + + +
mdt(ABCDEFGHKLMNOP) multidrug efflux system + + + + +
pmrD polymyxin resistance protein B + + + + +
rarD putative chloramphenicol resistance permease Phenicol + + + + +
rob DNA-binding transcriptional activator + + + + +
sdiA DNA-binding transcriptional activator + + + + +
soxS DNA-binding transcriptional regulator - + + + +
tehB tellurite resistance protein TehB + + + + +
yddA putative multidrug transporter + + + + +
yfeW putative hydrolase/beta lactamase fusion protein Beta-lactam - - + + +
yggT putative resistance protein + + + + +
yojI multidrug transporter membrane component/ATP-
binding component
+ + + + +
YP_002381967 putative transcriptional repressor of for multidrug
resistance pump (MarR family)
- - - - +
YP_002382714 hypothetical protein, putative transcriptional
activator for multiple antibiotic resistance
- - - - +
pECD227_112 (tn21 and class I integron)
aadA* Aminoglycoside Aminocyclitol, + - - - -

130
Aminoglycoside
mer(ACDRT) mercuric transport system - - - - -
qacEΔ1* & sulI* sulfonamide Sulfamide + - - - -
tetA* & tetR tetracylcline Tetracycline + - - - -
aacC aminoglycoside 3-N-acetyltransferase Aminoglycoside + - - - -
*, previously reported by Diarrassouba et al., 2007.

131
Analysis of Virulence Genes
Comparative genome analysis was performed to investigate the existence of
putative virulence genes, and to determine whether they have been acquired via
lateral gene transfer from other pathogenic bacterial strains. The protein
sequences from E. coli strains APEC O1:K1:H7 (T. J. Johnson, et al., 2007),
UTI89 (Chen, et al., 2006), as well as O157:H7 (Kulasekara, et al., 2009) were
used as comparators. The E. coli K-12 MG1655 (Blattner, et al., 1997), and the E.
fergusonii strain ATCC 35469 (Touchon, et al., 2009) (isolated from human stool)
were also included in the analysis.
Of the 4058 ORFs identified on the ECD-227 chromosome (Figure 21), 3150
(77%) were present in E. coli K-12 MG1655 (Figure 21). Of these 3150 ORFs,
3102 (76%) were also present in E. fergusonii ATCC 35469, and 2731 (67%)
were present in all five strains analyzed. The remaining 908 (22.4%) ORFs were
present in different combinations of the pathogenic E. coli strains and/or E.
fergusonii, or were unique to this genome (Figure 21). A large proportion of these
ORFs, 410 (10.1%), were specific to E. fergusonii ATCC 35469 (Figure 21) and
includes a diverse set of functions such as the metabolism of propanediol,
benzoate, citrate, oxalacetate (Table 12 and Table 13) suggesting the ability of
ECD-227 to adapt and to use a number of strategies to meet its growth
requirements in environments having these various compounds. Relatively few
genes were specific to ECD-227 (141, 3.5%) and these were interspersed
throughout the genome (Figure 21), with the exception of four clusters (Table 12).
Two of these four clusters overlap a region associated with a phage as well as a
region having sequence similarity to the dnd sulfur modification operon of E. coli
B7A (GenBank Accession AAJT00000000.2). The second largest group of 357
(8.8%) ORFs was present in a combination of extra-intestinal pathogenic E. coli
(ExPEC) or EHEC strains and/or E. fergusonii, but absent from K-12 MG1655
(Figure 21). Some of these ORFs, including a putative adhesin operon
sii(EA/BA/CA/DA), two putative intimin or invasin proteins, and the auf fimbriae
operon are well known virulence factors of ExPEC and EHEC (Table 12 and

132
Table 13). Numerous other ORFs found in ECD-227 that are also present in
ExPEC/EHEC could be involved in metabolism and/or virulence of this
bacterium. Overall, the ECD-227 genome contains 57 islands of greater than 4 Kb
that are absent from the K-12 genome (Figure 21 and Table 12). We identified
one CRISPR-element that appears to be derived from the E. coli O157:H7
genome. Six of the larger islands were composed of ORFs with similarity to
phage elements, four of which appeared to be derived from pathogenic E. coli
strains (Table 12). We did not identify putative virulence genes associated with
these mobile elements. We also identified ORFs associated with virulence that are
present in K-12 (Table 13), suggesting that they either have no role in virulence or
are under altered regulatory control that enables pathogenesis, which ultimately
warrants further study. The genome characteristics of E. fergusonii ECD-227
suggest that it is a species with a more complex lifestyle than E. coli.

133
Table 12. Gene content of different genomic islands of ECD-227.
Island
no.
Start
(nt) End (nt) Island Type/Gene Content Size (nt)
Presence in:
APEC
O1:K1:H7
UPEC
UTI89
O157:H7
TW14359
K-12
MG1655
E. fergusonii
ATCC 34569
1 58607 71748 E. fergusonii island: Oxalacetate decarboxylase and
citrate lyase proteins
13,141
- - - - +
2 116722 121895 E. fergusonii island
5,173
- - - - +
3 347577 354887 CRISPR-element
7,310
- - + - -
4 374915 385596 E. fergusonii island: erythritol phosphase/kinase and
sugar transporters
10,681
- - - - +
5 467335 475780 E. fergusonii island: Virulence protein msgA and
sugar isomerases/transporters
8,445
- - - - +
6 554368 580706 siiCA/EA/BA; adhesin for cattle intestine
colonization, type I secretion system outer
membrane protein
26,338
- - + - +
7 657665 669091 putative intimin (attaching and effacing protein)
11,426
+ + - - +
8 765422 792533 Prophage
27,111
+ + - - +
9 818394 829464 E. fergusonii island
11,070
- - - - +
10 877239 882488 E. fergusonii island: Phosphotransferase transport
system
5,249
- - - - +
11 1186459 1191659 E. fergusonii island
5,200
- - - - +
12 1197745 1202023 E. fergusonii island
4,278
- - - - +
13 1206828 1214908 E. fergusonii island: Cellulose synthase and
regulator of cellulose synthase
8,080
- - - - +
14 1524525 1537916 Putative multidrug resistance proteins; a
transcriptional regulator (tetR family)
13,391
- + - - +
15 1539135 1547437 E. fergusonii island: Propanediol utilization
8,302
- - - - +
16 1559875 1567082 E. fergusonii island: Benzoate 1,2-dioxygenase/
Muconolactone isomerases
7,207
- - - - +
17 1604765 1611475 E. fergusonii island: TRAP dicarboxylate transporter
locus
6,710
- - - - +
18 1644938 1648925 E. fergusonii island: putative transcriptional activator
for multiple antibiotic resistance; putative invasin-
like protein
3,987
- - - - +

134
19 1803892 1810774 E. fergusonii island: conserved hypothetical proteins;
putative metallo-beta-lactamase
6,882
- - - - +
20 1839545 1849418 E. fergusonii ECD227 island, adjacent to putative
integrase
9,873
- - - - -
21 1872157 1877266 E. fergusonii island: ABC-type transport system,
adjacent to putative integrase
5,109
- - - - +
22 2047591 2078493 Conserved hypothetical proteins
30,902
+ + + - +
23 2079486 2090458 E. fergusonii island: Propanediol utilization
10,972
- - - - +
24 2116623 2194456 Prophage
77,833
Partial Partial Partial - Partial
25 2255244 2266222 E. fergusonii island: Ribitol kinase and transporters
10,978
- - - - +
26 2467532 2475188 Methylaspartate utilization
7,656
- - + - +
27 2491220 2499032 E. fergusonii ECD227 island
7,812
- - - - -
28 2690056 2699367 E. fergusonii island
9,311
- - - - +
29 2771035 2775565 E. fergusonii island
4,530
- - - - +
30 2782291 2791622 Prophage remnant
9,331
+ + - - +
31 2857150 2876371 E. fergusonii island: phage remnant
19,221
- - - - +
32 2931454 2937429 E. fergusonii ECD227 island
5,975
- - - - -
33 2974993 2982753 Putative type II secretion proteins
7,760
+ + - - +
34 3012149 3019625 Putative TRAP-type C4-dicarboxylate transport
system proteins; putative dehydrogenases
7,476
+ + - - +
35 3042628 3047606 ygiL/G/H, fimbral-like adhesin/usher/chaperone
proteins
4,978
+ + - - +
36 3074079 3083856 E. fergusonii island: Glycine/Thioredoxin reductases
9,777
- - - - +
37 3110307 3117540 E. fergusonii ECD227 island
7,233
- - - - -
38 3130279 3147202 E. fergusonii island: 4HPA-hydroxylase operon
16,923
- - - - +
39 3152246 3157999 Restriction modification system proteins
5,753
- - + - -
40 3169948 3193236 E. fergusonii ECD227 island: DND sulfur-
modification system
23,288
- - - - -
41 3205317 3217344 E. fergusonii island: Malonate utilization system
12,027
- - - - +
42 3452481 3459670 auf fimbriae system proteins
7,189
+ + - - +

135
43 3508317 3523346 fatty acid degradation; acyl carrier proteins
15,029
- - + - +
44 3525681 3531290 putative phosphotransferase system proteins
5,609
+ + + - +
45 3539005 3552722 E. fergusonii island: siiEB/CB/BB/DB; adhesin for
cattle intestine colonization, type I secretion system
proteins
13,717
- - - - +
46 3622078 3626265 E. fergusonii island
4,187
- - - - +
47 3670114 3675130 haemagglutinins/invasins protein
5,016
+ + + - -
48 3721148 3726588 acidic carbohydrate kinase/aldolase
5,440
+ + - - +
49 3903191 3927849 Prophage
24,658
+ - + - -
50 3970143 3975678 E. fergusonii island
5,535
- - - - +
51 4030655 4036860 E. fergusonii island; chitobiose/cellobiose
phosphotransferase system
6,205
- - - - +
52 4151194 4156909 sorbitol/sorbose operon proteins
5,715 + + + - +
53 4158916 4178573 E. fergusonii island: Prophage
19,657
- - - - +
54 4213335 4226729 Succinyl-CoA synthetases and C4-dicarboxylate
transporters
13,394
+ + - - +
55 4258515 4260470 E. fergusonii island
1,955
+ - - +
56 4325898 4334798 TRAP transporter; putative oxidoreductase/CoA
transferase/endonuclease/dehydrogenase
8,900
+ + - - +
57 4479722 4504975 Prophage
25,253
+ + + - +

136
Apart from the chromosome, virulence genes were also present on the plasmids of
ECD-227 (Table 13, Figure 22). As characterized previously (Fricke, et al., 2009),
pECD227_46, which was found to be similar to pCVM29188_46 (NC_011078.1),
contains the cytotoxic protein ccdB. The plasmid pECD227_112, which is similar
to pCVM29188_101, possesses the colicin Ib gene (cib) and the complement
resistance traT gene. The largest plasmid, pECD227_113, contains the aerobactin
siderophore system encoded by iutA and iucABCD, as well as an iron/manganese
transport system encoded by sitABCD. The virulence-associated iron uptake
systems present on this plasmid as well as chromosomally-derived iron-related
genes (Table 13) suggest that ECD-227 has the potential to survive in an iron-
poor environment such as the host, and may possibly survive outside of the gut.
The pathogenic potential or capacity for horizontal transfer of these plasmids has
not been verified experimentally; however, the pathogenicity and transmissibility
of similar plasmids has been observed previously between Salmonella and E. coli
(T. J. Johnson et al., 2010), and the contribution of plasmids present in pathogenic
strains as also been demonstrated (T. J. Johnson, et al., 2010; Mellata et al., 2010).

137
Table 13. Virulence-associated genes of ECD-227.
Presence in:
Gene(s) Description APEC
O1:K1:H7
UPEC
UTI89
O157:H7
TW14359
K-12
MG1655
E. fergusonii
ATCC 34569
Chromosomal
cit(ABCDEFGPX) citrate two-component system and lyase - - - - +
eaeH putative attaching and effacing protein - - - - +
feoA ferrous iron transport - + + + +
feoB ferrous iron transport + + + + +
fep(ABCG) ferrienterobactin uptake + + + + +
focA formate transporter + + + + +
sii(EA/CA/BA/DA) adhesin for cattle intestine colonization - - + - +
tol(BCQR) receptor and inner membrane complex of the Tol system + + + + +
tsx nucleoside-specific channel-forming protein + + + + +
csgE assembly/transport component in curli production + + + + +
fliC flagellin + + + + +
gadA glutamate decarboxylase A, PLP-dependent + + + + +
ibeB IbeB invasion gene locus, ibeB, required for penetration of
brain microvascular endothelial cells
+ + + + +
ompA ompA protein outer membrane protein II + + + + +
artJ arginine ABC transporter, periplasmic arginine-binding
protein ArtJ
+ + + + +
ycfZ Hypothetical protein ycfZ putative factor + - - + +
ydcM Hypothetical protein ydcM putative factor - - - - -
mviM putative virulence factor + + + + +
mviN putative virulence factor + + + + +
shf putative virulence factor (plasmid pAA2), similar to Shigella
flexneri Shf
- + - - +
virK VirK- similar to Shigella flexneri VirK - - - - +
pECD227_46
ccdB cytotoxic protein - + + - -
pECD227_112
cib colicin Ib - - - - -
traT complement resistance protein - - - - -
pECD227_113
iutA & iuc(ABCD) aerobactin receptor and biosynthesis + - - - -
sit(ABCD) iron periplasmic binding protein, ATP-binding protein, and
iron permeases
+ + - - -
traT complement resistance protein + + - - -

138
Virulence Assay in Day-old Chicks
Due to the presence of several virulence genes detected in the present and
previous studies (Diarrassouba, et al., 2007; Lefebvre, et al., 2009), we evaluated
and compared the in vivo virulence of EDC-227 to that of a clinically virulent
isolate (D06-2195) in day-old chicks (106 CFU/birds). As expected the clinical
isolate D06-2195 killed 40% and 51% of chicks after 24 and 48 h post
inoculation, respectively (Figure 23). In contrast no mortality was recorded when
E. coli K-12 was inoculated, whereas ECD-227 showed moderate virulence
according to our classification, inducing 18% and 30% of mortality after 24h and
48h post infection, respectively (Figure 23). Moreover, both D06-2195 and ECD-
227, but not K-12, were detected in internal tissues of all diseased and dead birds
suggesting that ECD-227 is likely to induce septicemia in young chicks. The
determination of the contribution of specific genes in ECD-227 pathogenesis is
beyond the scope of this study. However, our findings demonstrated the in vivo
virulence of ECD-227 and that further study is warranted to investigate which
virulent determinants directly contribute to its pathogenic ability and extra-
intestinal survivability.

139
Figure 23. Mortality rates (%) induced by ECD-227 compared to that induced by
clinically virulent E. coli D06-2195 and non-virulent E. coli K-12 in a day-old
chicks infection model.

140
Conclusions
Since E. fergusonii was first identified as a species of the family
Enterobacteriaceae by Farmer et al. in 1985 (Farmer, et al., 1985) numerous
studies have demonstrated its capacity to cause disease in both humans (Bain &
Green, 1999; Funke, et al., 1993; Lagace-Wiens, et al., 2010; Mahapatra &
Mahapatra, 2005; Savini, et al., 2008) and animals (Bangert, et al., 1988;
Hariharan, et al., 2007; Herraez, et al., 2005). This study provided the first
genome sequence of a multi-drug resistant and pathogenic E. fergusonii isolated
from a broiler chicken. This isolate causes disease and mortality in chicks and
surviving chicks may be a reservoir for further infection. Numerous antimicrobial
and virulence determinants are present on mobile genetic elements potentially
acquired from related species, further demonstrating that transfer of mobile
genetic elements from other bacterial species can lead to the emergence of
potentially new multidrug resistant pathogenic strains. Further study of the
numerous antibiotic and virulence determinants should elucidate their precise role
and whether or not their regulation plays an important role. Our findings are of
concern to poultry health because such strains, if involved in infection, would be
difficult to treat with antibiotics currently available for poultry. Furthermore the
potential for infection of such a strain to humans represents a public health
concern. This study provides the first documentation that an E. fergusonii isolated
from poultry has accrued multiple resistance and virulence genes and that the
isolate has an elevated level of pathogenicity.
Acknowledgements
This study was supported by Agriculture and Agri-Food Canada (AAFC) through
the Sustainable Agriculture Environmental Systems (SAGES) program. We also
acknowledge funding support from grant 89758-2010 from the Natural Sciences
and Engineering Research Council of Canada to FM. We recognize the technical
assistance of Andrew Metcalfe (AAFC, Agassiz, BC). The genome sequencing
was performed at the McGill University and Genome Quebec Innovation Centre.

141
VF was the recipient of a Canadian Institutes of Health Research Doctoral
Research Award. We are thankful to M. Ngeleka (University of Saskatchewan,
SK, Canada) for providing E. coli strain D06-2195. Pacific Agri-Food Research
Center contribution: #803.

142
PART V: DISCUSSION

143
CHAPTER 8: Impact of Research, Future Work, and Concluding Remarks
Bioinformatics has become an integral part of genomics, intertwining itself
throughout all aspects of genomic data analysis. Primarily, this interdependence
began with the use of modern DNA sequencing platforms, which required the use
of computers and software to collect, process, and analyze large and complex
genomic data sets. Moreover, recently established MPS platforms have
democratized genome sequencing, giving biologists access to a method that was
previously limited to large laboratories for the study of reference genomes. This
democratization has yet to spread to bioinformatics, leaving many biologists new
to genomic data analysis to struggle with sophisticated software that requires
bioinformatics expertise or resources. Consequently, I chose to address this gap
between genome analysis and the biologist by developing bioinformatics tools
intended for them to use. Specifically, my aim was to develop tools for three
analytical steps in a genome sequencing project: [i] display and integrated
analysis of genomic data, [ii] assembly quality assessment, and [iii] deriving
biological insight using public information. In large part, I was inspired by
research that I conducted in actual genome projects.
I developed three innovative applications. They have been published via the
internet (http://github.com/vforget/ or http://blip.codeplex.com/) and prepared as
manuscripts for peer-reviewed publication. My research also included scientific
investigations in three genome sequencing projects, which has led me to prepare
three manuscripts for peer-reviewed publication. Two of these manuscripts are
already published in scientific journals (Forgetta, et al., 2011; Forgetta, et al.,
2012). The applications and genome projects are discussed individually within
each of the manuscripts. What follows is a discussion of the impact of my
research findings that extend beyond this thesis. I also discuss future
improvements to each bioinformatics application with regards to other features,
usability and scalability.

144
Impact of the Genome Sequencing Projects
Fourteen-Genome Comparison Identifies DNA Markers for Severe-Disease-
Associated Strains of C. difficile
This comparative genomics study has had impact in private and public research.
The 18 SNPs and 12 conserved genes have garnered the interest of the MultiGen
biotechnology company (http://www.multigen-diagnostics.com/) for development
into a medical diagnostic test. In addition, this genome sequencing project has
given our group the opportunity to collaborate with other researchers, which
includes the investigation of intestinal microbiome of patients infected with C.
difficile (Prof. Amee Manges).
Reproducibility of the Roche/454 GS-FLX Titanium System to Genome Sequence
the Dutch Elm Disease Pathogen
The impact of this study has been two-fold. Firstly, the O. novo-ulmi custom
UCSC Genome Browser (http://www.genomequebec.mcgill.ca/compgen/browser-
ophiostoma/cgi-bin/hgGateway) continues to be used by researchers at Université
de Laval in Quebec City (Prof. Louis Bernier) to investigate the evolution of the
lipoxygenase genes. Secondly, additional tools were developed to assess the
performance of the Roche/454 GS Platform. One such tool converts the raw data
from the instrument into a movie, which has been used to confirm the fluidics
problems with the instrument (for example see http://www.genomequebec.
mcgill.ca/compgen/public/meetings/ABRF2010/bubble1.avi).
Pathogenic and Multidrug Resistant E. fergusonii from Broiler Chicken
This research has spurred the further development of means to investigate the
prevalence of antimicrobial and virulence genes in poultry. I continue to
collaborate with Dr. Moussa S. Diarra, and we are currently investigating the
metagenomic profile of the gut microbiome in food safety.

145
Bioinformatics Software
This section discusses the adoption of each bioinformatics tool by our research
group, and by others in the scientific community. Following this, I will discuss
each tool with regards to features to be implemented, usability testing, and the
scalability of the programs to analyze human-sized datasets.
Adoption
Overall, the adoption of each application varies according to time since initial
release. For instance, cgb, which I developed early on in my research, has been
used more often, whereas BL!P and contiGo have been used less frequently.
Cgb has been used to create custom browser instances for the three genome
sequencing projects presented in this thesis, assisting in the analysis and
visualization of results, and ultimately contributing to preparation of three
manuscripts (Chapter 3 (Forgetta, et al., 2011), Chapter 5 (in preparation), and
Chapter 7 (Forgetta, et al., 2012)). In addition, cgb has been used to create custom
browser instances for more than 50 genome sequencing projects at the McGill
University and Genome Quebec Innovation Centre (MUGQIC) (personal
communication with research staff, Gary Leveque and Pascal Marquis). This
includes two large genome sequencing projects, a fungal genomics projects
(http://www.fungalgenomics.ca/wiki/Main_Page) and a vervet monkey genome
project (http://www.genomequebec.mcgill.ca/compgen/vervet_research/
genomics_genetics/). Cgb is being considered for use as a service offered to
clients of the MUGQIC.
ContiGo has been used to assess genome assemblies across two projects in this
thesis (Chapter 5 (Forgetta, et al., 2011) and Chapter 7 (Forgetta, et al., 2012)). It
is also being used by our group to analyze metagenomic assemblies of the vervet
gut microbiome (Sudeep Mehrotra, PhD candidate). Outside of our group, it has
been used to present genome assembly data to more than 20 clients of the

146
MUGQIC. ContiGo is also being considered for use as a service offered to clients
of the MUGQIC.
BL!P is published online (http://blip.codeplex.com), and is part of the Microsoft
Biology Tools collection (http://research.microsoft.com/en-us/projects/bio
/mbt.aspx). As of early 2012, the program has been downloaded over 800 times
(http://blip.codeplex.com/stats).
Features
It is common practice to update software programs because new needs arise or
existing needs change. Over the course of my PhD, the bioinformatics tools that I
developed were continually improved based upon the requirements of the genome
projects or users, including myself. What follows are features that will be
implemented to address the most recent needs I have encountered.
Currently, cgb populates the browser with a basic set of annotations, including
contigs, scaffolds, depth of read coverage, and GC percent. Future work includes
increasing the number of automated annotations, such as gene predictions, cellular
localization, and functional categories. Also, my plan is to collaborate with the
UCSC Genome Browser software development team to provide others to
download and use cgb via the UCSC Genome Browser web portal and to extend
cgb’s functionality by incorporating their expertise into its development.
ContiGo’s interface was developed from scratch by combining basic components
(table, plots, and a read pileup) into a novel graphical interface. My fellow lab
members or members of the MUQGIC (Gary Leveque, Pascale Marquis, and
Sudeep Mehrotra) have used it to analyze over 50 genome or metagenome
assemblies, but further improvement is needed in some regards. For instance,
greater interactivity between the different elements of the display (e.g., selecting
points in charts identifies them in the tables) will be implemented. Also, contiGo
does not visualize paired-end information, limiting its ability to detect certain
types of assembly errors, such as internal re-arrangements (Phillippy, et al., 2008).

147
Future work will involve extending contiGo to support paired-end information in
the quality assessment process.
I have demonstrated BL!P’s functionality at five scientific conferences, as well as
its use within our group, and have received positive feedback particularly with
respect to its data exploration capabilities. Requests for improvement largely
entail the support for different input and output formats or methods. For example,
the ability to load pre-computed BLAST results will be implemented, as well as
the ability to incrementally add new query sequences.
Usability
The degree of usability of the tools varies, and is dependent on their overall
novelty and their frequency of user testing.
The UCSC Genome Browser (Kent, et al., 2002) is a popular community-based
resource, receiving over 600,000 requests per day (http://genome.ucsc.edu/admin/
stats/, accessed 28/05/12). Cgb takes this popular and widely used tool and brings
it to a new audience, such as biologists studying non-reference genomes.
Usability with regards to the UCSC Genome Browser is handled by support staff
at UCSC, who collect and assess comments from all its users
(http://genome.ucsc.edu/contacts.html). With respect to cgb, user feedback has
largely come from the analysts that prepare the custom genome browser instances.
According to their recommendations I will automate more downstream analyses,
such as gene prediction. Furthermore, I will streamline the browser creation
process by removing superfluous error messages and detecting incorrect program
inputs.
ContiGo’s interface is unique and was initially developed to meet the needs of the
various genome projects reported in this thesis. As a result, of the three
applications developed in this context, it would benefit most from usability
testing. Multiple strategies could be used to test the usability of contiGo. One
approach would test the program using methods similar to previously published
usability studies of bioinformatics software (Bolchini et al., 2009). This would

148
require building a usage scenario within which a user performs a specific task and
the observer watches and takes notes. Results from this type of study would allow
me to determine which parts of the interface need refinement or what features are
missing. The second approach would be to discover new usage cases beyond what
I encountered during my PhD studies. Similar to a previous study (Stevens et al.,
2001), we could create a questionnaire that classifies tasks that one or more
biologists complete during genome assembly analysis. Also, similar to a study
conducted by Bartlett and Toms (2005), we could interview biologists with the
goal of modelling the process they use to analyze a genome assembly. Either of
these approaches would be beneficial, leading to contiGo being a more useful
tool.
During a previous internship at Microsoft Research, I had the opportunity to
collaborate with Bob Silverstein and Xiaoji Chen from the EPX User Experience
group, with whom I surveyed academic researchers in the Seattle area concerning
BL!P’s usage scenarios. These surveys were similar to those conducted by Bartlett
and Toms (2005) in that we used semi-structured interviews to ask a series of
questions concerning each researcher’s project and responses were grouped in
categories from which a set of actions for improving BL!P were devised. Results
from these sessions were instrumental in BL!P’s development. For instance, the
program was originally designed as a gene-centric analysis tool. Only protein
level alignments were supported and the image that represents each BLAST result
was pre-determined and focused on presenting information pertaining to gene
function. When users were confronted with this scenario, they saw little need for
it in their daily work, but remained impressed by the automation of BLAST and
the data exploration capabilities of Pivot. As a result, I generalized BL!P to
support multiple BLAST algorithms and to create a custom image layout for the
BLAST results.
Usability is an important aspect of any bioinformatics tool. A recent survey
conducted by Bartlett et al. (2012) found that laboratory-focused users (e.g.
biologists) prefer tools that are easy to use and install, and perform the types of

149
analyses they want. The objectives of this thesis have strived towards satisfying
these preferences; tools were intended for use by the biologist and inspiration was
drawn from actual genome projects. Performing even small usability studies of a
few users would allow these tools to more closely match the biologists’
preferences.
Scalability
In 2006, when I started my PhD, the throughput and cost of genome sequencing
on MPS platforms geared it towards the study of microbial genomes. Further
reductions in cost and increases in throughput have enabled the study of larger
genomes, requiring an assessment of the scalability of the programs developed in
this thesis.
Cgb relies on the UCSC Genome Browser, a tool that was developed to browse
mammalian-sized genomes. Because of this, cgb scales easily to larger datasets.
As mentioned previously, it has been used to house multiple fungal genomes,
each being tens of Mb in size, and the vervet monkey genome assembly, which is
about four gigabases.
To date, contiGo has been tested on assemblies of up to tens of Mb in size. Larger
assemblies will require some performance tuning, such as re-factoring the
algorithm for drawing the read pileup or, should the need arise, rewriting in a
more high performance programming language such as C or Java. Also, because
contiGo stores read-pileups as images on disk, improvements to reduce disk usage
can be made by reducing the pixel usage per base. For example, instead of
presenting each nucleotide by a character image, storage space could be reduced
by representing each nucleotide as a smaller color-coded glyph (e.g., A is red, C is
yellow, etc).
The largest dataset used with BL!P has been the complete set of 4,376 proteins
from E. coli isolate ECD-227 (Forgetta, et al., 2012). To process larger datasets,
scalability of the alignment procedure and the visualization in Pivot will need to
be addressed. Support for local BLAST would help alleviate the alignment
150
bottleneck for users with sufficient resources, whereas a cloud-based solution,
such as AzureBLAST (http://research.microsoft.com/en-us/projects/ncbi-
blast/default.aspx), would provide high performance computing to those without
the necessary computing resources. Faster sequence alignment algorithms (Edgar,
2010) are another possible avenue for improving speed during the alignment step.
The performance of the Pivot visualization will be improved by loading subsets of
the results on-demand. For example, multiple hits per query sequence could be
grouped and only expanded when selected.
As genomic datasets increase in size, the scalability of existing applications will
continue to be an important problem. Existing programs can be modified to
address this concern, as was the case with the Artemis genome browser (Carver et
al., 2012), or new programs can be created, such as the Integrated Genome
Viewer (Robinson, et al., 2011).
Concluding Remarks
Genomics continues to be applied to other areas of science and industry. For
instance, in the field of medicine, personalized genomics promises to
revolutionize the healthcare system, where genetic testing is used to catalogue
genetic variants associated with disease or adverse drug effects for individual
patients. Personalized genomics is currently offered as a service by companies
such as 23andMe and deCODE genetics, which use SNP genotyping platforms,
such as Illumina bead arrays (http://www.ncbi.nlm.nih.gov/projects/genome/
probe/doc/TechBeadArray.shtml), to assay millions of genetic variants. The
genotypes from these genetic variants are then compared to those in published
literature and associations to disease risk are assessed. Compared to the size of the
human genome, the resolution of the SNP genotyping assay is relatively low (1
SNP every few thousand nucleotides) and typically considers only variants that
are common in the population. Full human genome sequencing would provide a
more complete catalogue of an individual’s genotypes, including rare variants, but
due to higher cost, has been used in only a few individuals (Bentley, et al., 2008;
Ley et al., 2008; Wheeler et al., 2008) or within the context of large studies, such

151
as the 1000 Genome Project Consortium (2010). However, the cost for whole
genome sequencing continues to decrease (Wetterstrand, 2012), and may soon
become cost effective for the population in general. Anticipating this, vendors of
current MPS technologies are commercializing full human genome sequencing
(e.g., Complete Genomics), and companies such as Knome and HelloGenome are
starting to offer full-genome sequencing and interpretation of results. Therefore, it
is foreseeable that personalized genomics will become commonplace, and will
create yet another challenge for bioinformatics to process and interpret this data in
meaningful ways. For instance, how do medical professionals such as physicians
or genetic counselors present such complex datasets to patients, particularly when
either one may have limited computer skills or knowledge of biology or genetics?
How do we process these complex data sets into simple yet informative
abstractions, and offer a level of interactivity that facilitates communication
between the medical professional and the patient?
The paradigm used in this thesis can also be applied to address this potential gap
between patients or clinicians and genomic data. By basing software development
on multiple real-world personal genomics experiments, as well as targeting usage
to particular audiences, we can encapsulate sophisticated bioinformatics processes
into tools intended for common use, with the ultimate goal of allowing as many
people as possible to benefit from the bioinformatician’s expertise and abilities.

152
REFERENCES
Aarestrup, F. M., Seyfarth, A. M., Emborg, H. D., Pedersen, K., Hendriksen, R.
S., & Bager, F. (2001). Effect of abolishment of the use of antimicrobial agents
for growth promotion on occurrence of antimicrobial resistance in fecal
enterococci from food animals in Denmark. Antimicrobial Agents and
Chemotherapy, 45(7), 2054-2059.
Adams, M. D., Celniker, S. E., Holt, R. A., Evans, C. A., Gocayne, J. D.,
Amanatides, P. G., et al. (2000). The genome sequence of Drosophila
melanogaster. Science, 287(5461), 2185-2195.
al-Barrak, A., Embil, J., Dyck, B., Olekson, K., Nicoll, D., Alfa, M., et al. (1999).
An outbreak of toxin A negative, toxin B positive Clostridium difficile-associated
diarrhea in a Canadian tertiary-care hospital. Can Commun Dis Rep, 25(7), 65-69.
Altschul, S. F., Gish, W., Miller, W., Myers, E. W., & Lipman, D. J. (1990).
Basic local alignment search tool. Journal of molecular biology, 215(3), 403-410.
Altschul, S. F., Madden, T. L., Schaffer, A. A., Zhang, J., Zhang, Z., Miller, W.,
et al. (1997). Gapped BLAST and PSI-BLAST: a new generation of protein
database search programs. Nucleic Acids Res, 25(17), 3389-3402.
Anderson, S., Bankier, A. T., Barrell, B. G., de Bruijn, M. H., Coulson, A. R.,
Drouin, J., et al. (1981). Sequence and organization of the human mitochondrial
genome. Nature, 290(5806), 457-465.
Avgustin, J. A., & Grabnar, M. (2007). Sequence analysis of the plasmid pColG
from the Escherichia coli strain CA46. Plasmid, 57(1), 89-93.
Bailey, J. A., Yavor, A. M., Massa, H. F., Trask, B. J., & Eichler, E. E. (2001).
Segmental duplications: organization and impact within the current human
genome project assembly. Genome Res, 11(6), 1005-1017.
Bain, M. S., & Green, C. C. (1999). Isolation of Escherichia fergusonii in cases
clinically suggestive of salmonellosis. Vet Rec, 144(18), 511.
Balzer, S., Malde, K., Lanzen, A., Sharma, A., & Jonassen, I. (2010).
Characteristics of 454 pyrosequencing data--enabling realistic simulation with
flowsim. Bioinformatics, 26(18), i420-425.
Bangert, R. L., Ward, A. C., Stauber, E. H., Cho, B. R., & Widders, P. R. (1988).
A survey of the aerobic bacteria in the feces of captive raptors. Avian Dis, 32(1),
53-62.
Bao, H., Guo, H., Wang, J., Zhou, R., Lu, X., & Shi, S. (2009). MapView:
visualization of short reads alignment on a desktop computer. Bioinformatics,
25(12), 1554-1555.

153
Baranova, N., & Nikaido, H. (2002). The baeSR two-component regulatory
system activates transcription of the yegMNOB (mdtABCD) transporter gene
cluster in Escherichia coli and increases its resistance to novobiocin and
deoxycholate. J Bacteriol, 184(15), 4168-4176.
Barbut, F., Braun, M., Burghoffer, B., Lalande, V., & Eckert, C. (2009). Rapid
detection of toxigenic strains of Clostridium difficile in diarrheal stools by real-
time PCR. J Clin Microbiol, 47(4), 1276-1277.
Barbut, F., Corthier, G., Charpak, Y., Cerf, M., Monteil, H., Fosse, T., et al.
(1996). Prevalence and pathogenicity of Clostridium difficile in hospitalized
patients. A French multicenter study. Arch Intern Med, 156(13), 1449-1454.
Bartlett, J. C., Ishimura, Y., & Kloda, L. A. (2012). Scientists’ Preferences for
Bioinformatics Tools: The Task-based Selection of Information Retrieval Systems.
Paper presented at the Fourth Information Interaction in Context conference (IIiX
2012), Nijmegen, the Netherlands.
Bartlett, J. C., & Toms, E. G. (2005). Developing a protocol for bioinformatics
analysis: An integrated information behavior and task analysis approach. Journal
of the American Society for Information Science and Technology, 56(5), 469-482.
Bates, M. R., Buck, K. W., & Brasier, C. M. (1993). Molecular relationships of
the mitochondrial DNA of Ophiostoma ulmi and the NAN and EAN races of O.
novo-ulmi determined by restriction fragment length polymorphisms. Mycological
Research, 97(9), 1093-1100.
Bejerano, G., Pheasant, M., Makunin, I., Stephen, S., Kent, W. J., Mattick, J. S.,
et al. (2004). Ultraconserved elements in the human genome. Science, 304(5675),
1321-1325.
Benson, D. A., Boguski, M. S., Lipman, D. J., & Ostell, J. (1997). GenBank.
Nucleic Acids Res, 25(1), 1-6.
Benson, D. A., Karsch-Mizrachi, I., Lipman, D. J., Ostell, J., & Sayers, E. W.
(2011). GenBank. Nucleic Acids Res, 39(Database issue), D32-37.
Bentley, D. R., Balasubramanian, S., Swerdlow, H. P., Smith, G. P., Milton, J.,
Brown, C. G., et al. (2008). Accurate whole human genome sequencing using
reversible terminator chemistry. Nature, 456(7218), 53-59.
Berman, H. M., Westbrook, J., Feng, Z., Gilliland, G., Bhat, T. N., Weissig, H., et
al. (2000). The Protein Data Bank. Nucleic Acids Res, 28(1), 235-242.
Bilofsky, H. S., Burks, C., Fickett, J. W., Goad, W. B., Lewitter, F. I., Rindone,
W. P., et al. (1986). The GenBank genetic sequence databank. Nucleic acids
research, 14(1), 1-4.

154
Blanchette, M., Kent, W. J., Riemer, C., Elnitski, L., Smit, A. F., Roskin, K. M.,
et al. (2004). Aligning multiple genomic sequences with the threaded blockset
aligner. Genome Res, 14(4), 708-715.
Blattner, F. R., Plunkett, G., 3rd, Bloch, C. A., Perna, N. T., Burland, V., Riley,
M., et al. (1997). The complete genome sequence of Escherichia coli K-12.
Science, 277(5331), 1453-1462.
Bobadilla, J. L., Macek, M., Jr., Fine, J. P., & Farrell, P. M. (2002). Cystic
fibrosis: a worldwide analysis of CFTR mutations--correlation with incidence
data and application to screening. Human mutation, 19(6), 575-606.
Bolchini, D., Finkelstein, A., Perrone, V., & Nagl, S. (2009). Better
bioinformatics through usability analysis. Bioinformatics, 25(3), 406-412.
Bonfield, J. K., & Whitwham, A. (2010). Gap5--editing the billion fragment
sequence assembly. Bioinformatics, 26(14), 1699-1703.
Bracho, M. A., Moya, A., & Barrio, E. (1998). Contribution of Taq polymerase-
induced errors to the estimation of RNA virus diversity. The Journal of general
virology, 79 ( Pt 12), 2921-2928.
Brasier, C. M. (1996). Low Genetic Diversity of the Ophiostoma novo-ulmi
Population in North America. Mycologia, 88(6), 951-964.
Brasier, C. M., & Kirk, S. A. (2001). Designation of the EAN and NAN races of
Ophiostoma novo-ulmi as subspecies. Mycological Research, 105(05), 547-554.
Bruant, G., Maynard, C., Bekal, S., Gaucher, I., Masson, L., Brousseau, R., et al.
(2006). Development and validation of an oligonucleotide microarray for
detection of multiple virulence and antimicrobial resistance genes in Escherichia
coli. Appl Environ Microbiol, 72(5), 3780-3784.
Campbell, P. J., Pleasance, E. D., Stephens, P. J., Dicks, E., Rance, R., Goodhead,
I., et al. (2008). Subclonal phylogenetic structures in cancer revealed by ultra-
deep sequencing. Proceedings of the National Academy of Sciences of the United
States of America, 105(35), 13081-13086.
Carver, T., Harris, S. R., Berriman, M., Parkhill, J., & McQuillan, J. A. (2012).
Artemis: an integrated platform for visualization and analysis of high-throughput
sequence-based experimental data. Bioinformatics, 28(4), 464-469.
Catanho, M., Mascarenhas, D., Degrave, W., & de Miranda, A. B. (2006).
BioParser: a tool for processing of sequence similarity analysis reports. Appl
Bioinformatics, 5(1), 49-53.
CCAC. (1993). Guide to the Care and Use of Experimental Animals (2nd ed.).
CCAC, Ottawa, ON: Canadian Council on Animal Care.

155
Cheley, S., Xie, H., & Bayley, H. (2006). A genetically encoded pore for the
stochastic detection of a protein kinase. Chembiochem, 7(12), 1923-1927.
Chen, S. L., Hung, C. S., Xu, J., Reigstad, C. S., Magrini, V., Sabo, A., et al.
(2006). Identification of genes subject to positive selection in uropathogenic
strains of Escherichia coli: a comparative genomics approach. Proc Natl Acad Sci
U S A, 103(15), 5977-5982.
Chou, H. H., & Holmes, M. H. (2001). DNA sequence quality trimming and
vector removal. Bioinformatics, 17(12), 1093-1104.
Chueh, A. C., Northrop, E. L., Brettingham-Moore, K. H., Choo, K. H., & Wong,
L. H. (2009). LINE retrotransposon RNA is an essential structural and functional
epigenetic component of a core neocentromeric chromatin. PLoS genetics, 5(1),
e1000354.
CLSI. (2008). Performance standards for antimicrobial disk and dilution
susceptibility tests for bacteria isolated from animals: approved standard - Third
Edition. CLSI document M31-A3 (ISBN 1-56238-659-X).
Consortium, T. G. P. (2010). A map of human genome variation from population-
scale sequencing. Nature, 467(7319), 1061-1073.
Curry, S. R., Marsh, J. W., Muto, C. A., O'Leary, M. M., Pasculle, A. W., &
Harrison, L. H. (2007). tcdC genotypes associated with severe TcdC truncation in
an epidemic clone and other strains of Clostridium difficile. J Clin Microbiol,
45(1), 215-221.
Dai, J., Chen, Y., Dean, S., Morris, J. G., Salfinger, M., & Johnson, J. A. (2011).
Multiple-genome comparison reveals new Loci for mycobacterium species
identification. J Clin Microbiol, 49(1), 144-153.
Darzentas, N. (2010). Circoletto: visualizing sequence similarity with Circos.
Bioinformatics, 26(20), 2620-2621.
Delcher, A. L., Bratke, K. A., Powers, E. C., & Salzberg, S. L. (2007). Identifying
bacterial genes and endosymbiont DNA with Glimmer. Bioinformatics, 23(6),
673-679.
Delcher, A. L., Harmon, D., Kasif, S., White, O., & Salzberg, S. L. (1999).
Improved microbial gene identification with GLIMMER. Nucleic acids research,
27(23), 4636-4641.
Dewar, K., Bousquet, J., Dufour, J., & Bernier, L. (1997). A meiotically
reproducible chromosome length polymorphism in the ascomycete fungus
Ophiostoma ulmi (sensu lato). Molecular & general genetics : MGG, 255(1), 38-
44.
156
Dhalluin, A., Lemee, L., Pestel-Caron, M., Mory, F., Leluan, G., Lemeland, J. F.,
et al. (2003). Genotypic differentiation of twelve Clostridium species by
polymorphism analysis of the triosephosphate isomerase (tpi) gene. Syst Appl
Microbiol, 26(1), 90-96.
Dial, S., Alrasadi, K., Manoukian, C., Huang, A., & Menzies, D. (2004). Risk of
Clostridium difficile diarrhea among hospital inpatients prescribed proton pump
inhibitors: cohort and case-control studies. CMAJ, 171(1), 33-38.
Diarrassouba, F., Diarra, M. S., Bach, S., Delaquis, P., Pritchard, J., Topp, E., et
al. (2007). Antibiotic resistance and virulence genes in commensal Escherichia
coli and Salmonella isolates from commercial broiler chicken farms. J Food Prot,
70(6), 1316-1327.
Diguistini, S., Liao, N. Y., Platt, D., Robertson, G., Seidel, M., Chan, S. K., et al.
(2009). De novo genome sequence assembly of a filamentous fungus using
Sanger, 454 and Illumina sequence data. Genome biology, 10(9), R94.
DiGuistini, S., Wang, Y., Liao, N. Y., Taylor, G., Tanguay, P., Feau, N., et al.
(2011). Genome and transcriptome analyses of the mountain pine beetle-fungal
symbiont Grosmannia clavigera, a lodgepole pine pathogen. Proceedings of the
National Academy of Sciences of the United States of America, 108(6), 2504-
2509.
Drudy, D., Kyne, L., O'Mahony, R., & Fanning, S. a. (2007). gyrA Mutations in
Fluoroquinolone-resistant Clostridium difficile PCR-027 Emerging Infectious
Diseases (Vol. 13, pp. 504-505): Centers for Disease Control & Prevention
(CDC).
Dunning, A. M., Talmud, P., & Humphries, S. E. (1988). Errors in the polymerase
chain reaction. Nucleic Acids Research, 16(21), 10393.
Eastwood, K., Else, P., Charlett, A., & Wilcox, M. (2009). Comparison of nine
commercially available Clostridium difficile toxin detection assays, a real-time
PCR assay for C. difficile tcdB, and a glutamate dehydrogenase detection assay to
cytotoxin testing and cytotoxigenic culture methods. J Clin Microbiol, 47(10),
3211-3217.
Edgar, R. C. (2010). Search and clustering orders of magnitude faster than
BLAST. Bioinformatics, 26(19), 2460-2461.
Eichler, E. E. (2001). Segmental duplications: what's missing, misassigned, and
misassembled--and should we care? Genome Res, 11(5), 653-656.
Eid, J., Fehr, A., Gray, J., Luong, K., Lyle, J., Otto, G., et al. (2009). Real-time
DNA sequencing from single polymerase molecules. Science, 323(5910), 133-
138.

157
Ennis, P. D., Zemmour, J., Salter, R. D., & Parham, P. (1990). Rapid cloning of
HLA-A,B cDNA by using the polymerase chain reaction: frequency and nature of
errors produced in amplification. Proceedings of the National Academy of
Sciences of the United States of America, 87(7), 2833-2837.
Et-Touil, A., Brasier, C. M., & Bernier, L. (1999). Localization of a Pathogenicity
Gene in Ophiostoma novo-ulmi and Evidence That It May Be Introgressed from
O. ulmi. Molecular Plant-Microbe Interactions, 12(1), 6-15.
Ewing, B., & Green, P. (1998). Base-calling of automated sequencer traces using
phred. II. Error probabilities. Genome research, 8(3), 186-194.
Ewing, B., Hillier, L., Wendl, M. C., & Green, P. (1998). Base-calling of
automated sequencer traces using phred. I. Accuracy assessment. Genome
research, 8(3), 175-185.
Farmer, J. J., 3rd, Fanning, G. R., Davis, B. R., O'Hara, C. M., Riddle, C.,
Hickman-Brenner, F. W., et al. (1985). Escherichia fergusonii and Enterobacter
taylorae, two new species of Enterobacteriaceae isolated from clinical
specimens. J Clin Microbiol, 21(1), 77-81.
Feng, Y., Yang, W., Ryan, U., Zhang, L., Kvac, M., Koudela, B., et al. (2011).
Development of a Multilocus Sequence Tool for Typing Cryptosporidium muris
and Cryptosporidium andersoni. J Clin Microbiol, 49(1), 34-41.
Fitch, W. M., & Margoliash, E. (1967). Construction of phylogenetic trees.
Science, 155(3760), 279-284.
Fleischmann, R. D., Adams, M. D., White, O., Clayton, R. A., Kirkness, E. F.,
Kerlavage, A. R., et al. (1995). Whole-genome random sequencing and assembly
of Haemophilus influenzae Rd. Science, 269(5223), 496-512.
Flicek, P., Amode, M. R., Barrell, D., Beal, K., Brent, S., Chen, Y., et al. (2011).
Ensembl 2011. Nucleic acids research, 39(Database issue), D800-806.
Flusberg, B. A., Webster, D. R., Lee, J. H., Travers, K. J., Olivares, E. C., Clark,
T. A., et al. (2010). Direct detection of DNA methylation during single-molecule,
real-time sequencing. Nature methods, 7(6), 461-465.
Forgetta, V., & Dewar, K. (2005). Genome Project Cost Calculator, from
http://genomequebec.mcgill.ca/compgen/cgc.html
Forgetta, V., Oughton, M. T., Marquis, P., Brukner, I., Blanchette, R., Haub, K.,
et al. (2011). Fourteen-genome comparison identifies DNA markers for severe-
disease-associated strains of Clostridium difficile. Journal of clinical
microbiology, 49(6), 2230-2238.

158
Forgetta, V., Rempel, H., Malouin, F., Vaillancourt, R., Jr., Topp, E., Dewar, K.,
et al. (2012). Pathogenic and multidrug-resistant Escherichia fergusonii from
broiler chicken. Poultry science, 91(2), 512-525.
Fricke, W. F., McDermott, P. F., Mammel, M. K., Zhao, S., Johnson, T. J., Rasko,
D. A., et al. (2009). Antimicrobial resistance-conferring plasmids with similarity
to virulence plasmids from avian pathogenic Escherichia coli strains in
Salmonella enterica serovar Kentucky isolates from poultry. Appl Environ
Microbiol, 75(18), 5963-5971.
Fu, Y. H., Kuhl, D. P., Pizzuti, A., Pieretti, M., Sutcliffe, J. S., Richards, S., et al.
(1991). Variation of the CGG repeat at the fragile X site results in genetic
instability: resolution of the Sherman paradox. Cell, 67(6), 1047-1058.
Funke, G., Hany, A., & Altwegg, M. (1993). Isolation of Escherichia fergusonii
from four different sites in a patient with pancreatic carcinoma and
cholangiosepsis. J Clin Microbiol, 31(8), 2201-2203.
Garcia Pelayo, M. C., Uplekar, S., Keniry, A., Mendoza Lopez, P., Garnier, T.,
Nunez Garcia, J., et al. (2009). A comprehensive survey of single nucleotide
polymorphisms (SNPs) across Mycobacterium bovis strains and M. bovis BCG
vaccine strains refines the genealogy and defines a minimal set of SNPs that
separate virulent M. bovis strains and M. bovis BCG strains. Infection &
Immunity, 77(5), 2230-2238.
Gilca R, F. E., Hubert B et al. (2008). Surveillance des diarrhées associées à
Clostridium difficile au Québec : bilan du 22 août 2004 au 18 août 2007
Retrieved October 5, 2010, 2010, from
http://www.inspq.qc.ca/pdf/publications/745_Cdifficile_bilan2004-2007.pdf
Gilles, A., Meglecz, E., Pech, N., Ferreira, S., Malausa, T., & Martin, J. F. (2011).
Accuracy and quality assessment of 454 GS-FLX Titanium pyrosequencing. BMC
Genomics, 12, 245.
Gollapudi, R., Revanna, K. V., Hemmerich, C., Schaack, S., & Dong, Q. (2008).
BOV--a web-based BLAST output visualization tool. BMC Genomics, 9, 414.
Goorhuis, A., Bakker, D., Corver, J., Debast, S. B., Harmanus, C., Notermans, D.
W., et al. (2008). Emergence of Clostridium difficile Infection Due to a New
Hypervirulent Strain, Polymerase Chain Reaction Ribotype 078. Clinical
Infectious Diseases, 47(9), 1162-1170.
Gordon, D., Abajian, C., & Green, P. (1998). Consed: a graphical tool for
sequence finishing. Genome Res, 8(3), 195-202.
Guillaume, B., Montpetit, A., Forgetta, V., Leveque, G., Attiya, S., Dias, J., et al.
(2009). Accurate genome Assembly Using Long Insert Libraries and Next-
generation Sequencing Genome Quebec Technical Application Note.

159
Haider, S., Ballester, B., Smedley, D., Zhang, J., Rice, P., & Kasprzyk, A. (2009).
BioMart Central Portal--unified access to biological data. Nucleic acids research,
37(Web Server issue), W23-27.
Hamm, G. H., & Cameron, G. N. (1986). The EMBL data library. Nucleic acids
research, 14(1), 5-9.
Hariharan, H., Lopez, A., Conboy, G., Coles, M., & Muirhead, T. (2007).
Isolation of Escherichia fergusonii from the feces and internal organs of a goat
with diarrhea. Can Vet J, 48(6), 630-631.
Harris, R. S. (2007). Improved pairwise alignment of genomic DNA. Pennsylvania
State University.
He, J., Dai, X., & Zhao, X. (2007). PLAN: a web platform for automating high-
throughput BLAST searches and for managing and mining results. BMC
Bioinformatics, 8, 53.
He, M., Sebaihia, M., Lawley, T. D., Stabler, R. A., Dawson, L. F., Martin, M. J.,
et al. (2010). Evolutionary dynamics of Clostridium difficile over short and long
time scales. Proc Natl Acad Sci U S A, 107(16), 7527-7532.
Herraez, P., Rodriguez, A. F., Espinosa de los Monteros, A., Acosta, A. B., Jaber,
J. R., Castellano, J., et al. (2005). Fibrino-necrotic typhlitis caused by Escherichia
fergusonii in ostriches (Struthio camelus). Avian Dis, 49(1), 167-169.
Hintz, W., Pinchback, M., de la Bastide, P., Burgess, S., Jacobi, V., Hamelin, R.,
et al. (2011). Functional categorization of unique expressed sequence tags
obtained from the yeast-like growth phase of the elm pathogen Ophiostoma novo-
ulmi. BMC genomics, 12, 431.
Hoff, K. J. (2009). The effect of sequencing errors on metagenomic gene
prediction. BMC Genomics, 10, 520.
Hopkins, K. L., Davies, R. H., & Threlfall, E. J. (2005). Mechanisms of quinolone
resistance in Escherichia coli and Salmonella: recent developments. Int J
Antimicrob Agents, 25(5), 358-373.
Hou, H., Zhao, F., Zhou, L., Zhu, E., Teng, H., Li, X., et al. (2010).
MagicViewer: integrated solution for next-generation sequencing data
visualization and genetic variation detection and annotation. Nucleic acids
research, 38(Web Server issue), W732-736.
Howorka, S., Nam, J., Bayley, H., & Kahne, D. (2004). Stochastic detection of
monovalent and bivalent protein-ligand interactions. Angew Chem Int Ed Engl,
43(7), 842-846.

160
Huang, W., & Marth, G. (2008). EagleView: a genome assembly viewer for next-
generation sequencing technologies. Genome Res, 18(9), 1538-1543.
Hubbard, T., Barker, D., Birney, E., Cameron, G., Chen, Y., Clark, L., et al.
(2002). The Ensembl genome database project. Nucleic acids research, 30(1), 38-
41.
Hubert, B., Loo, V. G., Bourgault, A.-M., Poirier, L., Dascal, A., Fortin, E., et al.
(2007). A Portrait of the Geographic Dissemination of the Clostridium difficile
North American Pulsed-Field Type 1 Strain and the Epidemiology of C. difficile-
Associated Disease in Quebec. Clin Infect Dis, 44(2), 238-244.
Hubisz, M. J., Lin, M. F., Kellis, M., & Siepel, A. (2011). Error and error
mitigation in low-coverage genome assemblies. PLoS One, 6(2), e17034.
Janvilisri, T., Scaria, J., Thompson, A. D., Nicholson, A., Limbago, B. M.,
Arroyo, L. G., et al. (2009). Microarray identification of Clostridium difficile core
components and divergent regions associated with host origin. Journal of
Bacteriology, 191(12), 3881-3891.
Johnson, D. S., Mortazavi, A., Myers, R. M., & Wold, B. (2007). Genome-wide
mapping of in vivo protein-DNA interactions. Science, 316(5830), 1497-1502.
Johnson, S., & Gerding, D. N. (1998). Clostridium difficile-associated diarrhea.
Clin Infect Dis, 26, 1027 - 1034.
Johnson, T. J., Johnson, S. J., & Nolan, L. K. (2006). Complete DNA sequence of
a ColBM plasmid from avian pathogenic Escherichia coli suggests that it evolved
from closely related ColV virulence plasmids. J Bacteriol, 188(16), 5975-5983.
Johnson, T. J., Kariyawasam, S., Wannemuehler, Y., Mangiamele, P., Johnson, S.
J., Doetkott, C., et al. (2007). The genome sequence of avian pathogenic
Escherichia coli strain O1:K1:H7 shares strong similarities with human
extraintestinal pathogenic E. coli genomes. J Bacteriol, 189(8), 3228-3236.
Johnson, T. J., Siek, K. E., Johnson, S. J., & Nolan, L. K. (2006). DNA sequence
of a ColV plasmid and prevalence of selected plasmid-encoded virulence genes
among avian Escherichia coli strains. J Bacteriol, 188(2), 745-758.
Johnson, T. J., Thorsness, J. L., Anderson, C. P., Lynne, A. M., Foley, S. L., Han,
J., et al. (2010). Horizontal gene transfer of a ColV plasmid has resulted in a
dominant avian clonal type of Salmonella enterica serovar Kentucky. PLoS One,
5(12), e15524.
Jordan, S., Hutchings, M. I., & Mascher, T. (2008). Cell envelope stress response
in Gram-positive bacteria. FEMS Microbiol Rev, 32(1), 107-146.

161
Joseph, P., Fichant, G., Quentin, Y., & Denizot, F. (2002). Regulatory
relationship of two-component and ABC transport systems and clustering of their
genes in the Bacillus/Clostridium group, suggest a functional link between them.
J Mol Microbiol Biotechnol, 4(5), 503-513.
Karolchik, D., Hinrichs, A. S., Furey, T. S., Roskin, K. M., Sugnet, C. W.,
Haussler, D., et al. (2004). The UCSC Table Browser data retrieval tool. Nucleic
Acids Res, 32(Database issue), D493-496.
Kato, N. (2000). Genome of human hepatitis C virus (HCV): gene organization,
sequence diversity, and variation. Microbial & comparative genomics, 5(3), 129-
151.
Katoh, K., Misawa, K., Kuma, K., & Miyata, T. (2002). MAFFT: a novel method
for rapid multiple sequence alignment based on fast Fourier transform. Nucleic
Acids Res, 30(14), 3059-3066.
Kent, W. J. (2002). BLAT--the BLAST-like alignment tool. Genome Res, 12(4),
656-664.
Kent, W. J., Sugnet, C. W., Furey, T. S., Roskin, K. M., Pringle, T. H., Zahler, A.
M., et al. (2002). The human genome browser at UCSC. Genome Res, 12(6), 996-
1006.
Killgore, G., Thompson, A., Johnson, S., Brazier, J., Kuijper, E., Pepin, J., et al.
(2008). Comparison of seven techniques for typing international epidemic strains
of Clostridium difficile: restriction endonuclease analysis, pulsed-field gel
electrophoresis, PCR-ribotyping, multilocus sequence typing, multilocus variable-
number tandem-repeat analysis, amplified fragment length polymorphism, and
surface layer protein A gene sequence typing. J Clin Microbiol, 46(2), 431-437.
Kimura, M. (1969). The rate of molecular evolution considered from the
standpoint of population genetics. Proceedings of the National Academy of
Sciences of the United States of America, 63(4), 1181-1188.
Korshunova, Y., Maloney, R. K., Lakey, N., Citek, R. W., Bacher, B., Budiman,
A., et al. (2008). Massively parallel bisulphite pyrosequencing reveals the
molecular complexity of breast cancer-associated cytosine-methylation patterns
obtained from tissue and serum DNA. Genome research, 18(1), 19-29.
Krzywinski, M., Schein, J., Birol, I., Connors, J., Gascoyne, R., Horsman, D., et
al. (2009). Circos: an information aesthetic for comparative genomics. Genome
research, 19(9), 1639-1645.
Kuijper, E. J., Coignard, B., & Tull, P. (2006). Emergence of Clostridium
difficile-associated disease in North America and Europe. Clinical Microbiology
and Infection, 12(s6), 2-18.

162
Kulasekara, B. R., Jacobs, M., Zhou, Y., Wu, Z., Sims, E., Saenphimmachak, C.,
et al. (2009). Analysis of the genome of the Escherichia coli O157:H7 2006
spinach-associated outbreak isolate indicates candidate genes that may enhance
virulence. Infect Immun, 77(9), 3713-3721.
Kuroda, M., Serizawa, M., Okutani, A., Sekizuka, T., Banno, S., & Inoue, S.
(2010). Genome-wide single nucleotide polymorphism typing method for
identification of Bacillus anthracis species and strains among B. cereus group
species. J Clin Microbiol, 48(8), 2821-2829.
Kyne, L., Hamel, M. B., Polavaram, R., & Kelly, C. P. (2002). Health care costs
and mortality associated with nosocomial diarrhea due to Clostridium difficile.
Clin Infect Dis, 34, 346-353.
Kyne, L., Warny, M., Qamar, A., & Kelly, C. P. (2000). Asymptomatic Carriage
of Clostridium difficile and Serum Levels of IgG Antibody against Toxin A. N
Engl J Med, 342(6), 390-397.
Kyne, L., Warny, M., Qamar, A., & Kelly, C. P. (2001). Association between
antibody response to toxin A and protection against recurrent Clostridium difficile
diarrhoea. Lancet, 357, 189 - 193.
LaBoissière, S., Forgetta, V., Blanchette, R., Kriazhev, L., Roy, L., Boismenu, D.,
et al. (2005). Mass Spectrometry Based Approach for Gene Annotation of
Bacterial Genomes—A Case Study on Cell-Wall Surface Proteins From C.
difficile. Genome Quebec Technical Application Note.
Lagace-Wiens, P. R., Baudry, P. J., Pang, P., & Hammond, G. (2010). First
description of an extended-spectrum-beta-lactamase-producing multidrug-
resistant Escherichia fergusonii strain in a patient with cystitis. J Clin Microbiol,
48(6), 2301-2302.
Lander, E. S., Linton, L. M., Birren, B., Nusbaum, C., Zody, M. C., Baldwin, J.,
et al. (2001). Initial sequencing and analysis of the human genome. Nature,
409(6822), 860-921.
Lee, B., & Richards, F. M. (1971). The interpretation of protein structures:
estimation of static accessibility. Journal of molecular biology, 55(3), 379-400.
Lefebvre, B., Diarra, M. S., Moisan, H., & Malouin, F. (2008). Detection of
virulence-associated genes in Escherichia coli O157 and non-O157 isolates from
beef cattle, humans, and chickens. J Food Prot, 71(9), 1774-1784.
Lefebvre, B., Gattuso, M., Moisan, H., Malouin, F., & Diarra, M. S. (2009).
Genotype comparison of sorbitol-negative Escherichia coli isolates from healthy
broiler chickens from different commercial farms. Poult Sci, 88(7), 1474-1484.

163
Lewis, S. E., Searle, S. M., Harris, N., Gibson, M., Lyer, V., Richter, J., et al.
(2002). Apollo: a sequence annotation editor. Genome Biol, 3(12),
RESEARCH0082.
Ley, T. J., Mardis, E. R., Ding, L., Fulton, B., McLellan, M. D., Chen, K., et al.
(2008). DNA sequencing of a cytogenetically normal acute myeloid leukaemia
genome. Nature, 456(7218), 66-72.
Li, H., Ruan, J., & Durbin, R. (2008). Mapping short DNA sequencing reads and
calling variants using mapping quality scores. Genome research, 18(11), 1851-
1858.
Lindblad, K., Savontaus, M. L., Stevanin, G., Holmberg, M., Digre, K., Zander,
C., et al. (1996). An expanded CAG repeat sequence in spinocerebellar ataxia
type 7. Genome research, 6(10), 965-971.
Lipman, D. J., & Pearson, W. R. (1985). Rapid and sensitive protein similarity
searches. Science, 227(4693), 1435-1441.
Loo, V. G., Poirier, L., Miller, M. A., Oughton, M., Libman, M. D., Michaud, S.,
et al. (2005). A Predominantly Clonal Multi-Institutional Outbreak of Clostridium
difficile-Associated Diarrhea with High Morbidity and Mortality. N Engl J Med,
353(23), 2442-2449.
MacCannell, D. R., Louie, T. J., Gregson, D. B., Laverdiere, M., Labbe, A.-C.,
Laing, F., et al. (2006). Molecular Analysis of Clostridium difficile PCR Ribotype
027 Isolates from Eastern and Western Canada. J. Clin. Microbiol., 44(6), 2147-
2152.
MacCollin, M., Braverman, N., Viskochil, D., Ruttledge, M., Davis, K., Ojemann,
R., et al. (1996). A point mutation associated with a severe phenotype of
neurofibromatosis 2. Annals of neurology, 40(3), 440-445.
Machado, H. E., & Renn, S. C. (2010). A critical assessment of cross-species
detection of gene duplicates using comparative genomic hybridization. BMC
Genomics, 11, 304.
Magrane, M., & Consortium, U. (2011). UniProt Knowledgebase: a hub of
integrated protein data. Database (Oxford), 2011, bar009.
Mahapatra, A., & Mahapatra, S. (2005). Escherichia fergusonii: an emerging
pathogen in South Orissa. Indian J Med Microbiol, 23(3), 204.
Margulies, M., Egholm, M., Altman, W. E., Attiya, S., Bader, J. S., Bemben, L.
A., et al. (2005). Genome sequencing in microfabricated high-density picolitre
reactors. Nature, 437(7057), 376-380.

164
Mazzarella, R., & Schlessinger, D. (1998). Pathological consequences of
sequence duplications in the human genome. Genome Res, 8(10), 1007-1021.
McDonald, L. C., Killgore, G. E., Thompson, A., Owens, R. C., Jr., Kazakova, S.
V., Sambol, S. P., et al. (2005). An Epidemic, Toxin Gene-Variant Strain of
Clostridium difficile. N Engl J Med, 353(23), 2433-2441.
McElroy, K. E., Luciani, F., & Thomas, T. (2012). GemSIM: general, error-model
based simulator of next-generation sequencing data. BMC Genomics, 13, 74.
McPherson, J. D. (2009). Next-generation gap. Nat Methods, 6(11 Suppl), S2-5.
Mellata, M., Ameiss, K., Mo, H., & Curtiss, R., 3rd. (2010). Characterization of
the contribution to virulence of three large plasmids of avian pathogenic
Escherichia coli chi7122 (O78:K80:H9). Infection and immunity, 78(4), 1528-
1541.
Merrigan, M., Venugopal, A., Mallozzi, M., Roxas, B., Viswanathan, V. K.,
Johnson, S., et al. (2010). Human hypervirulent Clostridium difficile strains
exhibit increased sporulation as well as robust toxin production. J Bacteriol,
192(19), 4904-4911.
Metzker, M. L. (2009). Sequencing in real time. Nat Biotechnol, 27(2), 150-151.
Millar, J. R. (2007). The relationship between use of apramycin in the poultry
industry and the detection of gentamicin resistant E. coli in processed chickens.
The Free Librar.
Milne, I., Bayer, M., Cardle, L., Shaw, P., Stephen, G., Wright, F., et al. (2010).
Tablet--next generation sequence assembly visualization. Bioinformatics, 26(3),
401-402.
Morales, S. E., & Holben, W. E. (2011). Linking bacterial identities and
ecosystem processes: can 'omic' analyses be more than the sum of their parts?
FEMS Microbiol Ecol, 75(1), 2-16.
Morin, R., Bainbridge, M., Fejes, A., Hirst, M., Krzywinski, M., Pugh, T., et al.
(2008). Profiling the HeLa S3 transcriptome using randomly primed cDNA and
massively parallel short-read sequencing. BioTechniques, 45(1), 81-94.
Mulvey, M. R., Boyd, D. A., Gravel, D., Hutchinson, J., Kelly, S., McGeer, A., et
al. (2010). Hypervirulent Clostridium difficile strains in hospitalized patients,
Canada. Emerg Infect Dis, 16(4), 678-681.
Murray, R., Boyd, D., Levett, P. N., Mulvey, M. R., & Alfa, M. J. (2009).
Truncation in the tcdC region of the Clostridium difficile PathLoc of clinical
isolates does not predict increased biological activity of Toxin B or Toxin A.
BMC Infect Dis, 9, 103.

165
Muto, C. A., Pokrywka, M., Shutt, K., Mendelsohn, A. B., Nouri, K., Posey, K.,
et al. (2005). A Large Outbreak of Clostridium difficile -Associated Disease With
an Unexpected Proportion of Deaths and Colectomies at a Teaching Hospital
Following Increased Fluoroquinolone Use. Infect Control Hosp Epidemiol, 26(3),
273-280.
Naiser, T., Kayser, J., Mai, T., Michel, W., & Ott, A. (2008). Position dependent
mismatch discrimination on DNA microarrays - experiments and model. BMC
Bioinformatics, 9, 509.
Nakamura, K., Oshima, T., Morimoto, T., Ikeda, S., Yoshikawa, H., Shiwa, Y., et
al. (2011). Sequence-specific error profile of Illumina sequencers. Nucleic Acids
Res, 39(13), e90.
NCBI. (2011). NCBI Map Viewer Retrieved December 20, 2011, 2011, from
http://www.ncbi.nlm.nih.gov/projects/mapview/
Ngeleka, M., Brereton, L., Brown, G., & Fairbrother, J. M. (2002). Pathotypes of
avian Escherichia coli as related to tsh-, pap-, pil-, and iuc-DNA sequences, and
antibiotic sensitivity of isolates from internal tissues and the cloacae of broilers.
Avian Dis, 46(1), 143-152.
Nikaido, H. (2009). Multidrug resistance in bacteria. Annu Rev Biochem, 78, 119-
146.
Ogura, Y., Ooka, T., Iguchi, A., Toh, H., Asadulghani, M., Oshima, K., et al.
(2009). Comparative genomics reveal the mechanism of the parallel evolution of
O157 and non-O157 enterohemorrhagic Escherichia coli. Proc Natl Acad Sci U S
A, 106(42), 17939-17944.
Ohki, R., Giyanto, Tateno, K., Masuyama, W., Moriya, S., Kobayashi, K., et al.
(2003). The BceRS two-component regulatory system induces expression of the
bacitracin transporter, BceAB, in Bacillus subtilis. Mol Microbiol, 49(4), 1135-
1144.
Parsons, J. D., Buehler, E., & Hillier, L. (1999). DNA sequence chromatogram
browsing using JAVA and CORBA. Genome research, 9(3), 277-281.
Pepin, J., Saheb, N., Coulombe, M. A., Alary, M. E., Corriveau, M. P., Authier,
S., et al. (2005). Emergence of fluoroquinolones as the predominant risk factor for
Clostridium difficile-associated diarrhea: a cohort study during an epidemic in
Quebec. Clin Infect Dis, 41(9), 1254-1260.
Perez-Enciso, M., & Ferretti, L. (2010). Massive parallel sequencing in animal
genetics: wherefroms and wheretos. Anim Genet, 41(6), 561-569.

166
Perna, N. T., Plunkett, G., 3rd, Burland, V., Mau, B., Glasner, J. D., Rose, D. J., et
al. (2001). Genome sequence of enterohaemorrhagic Escherichia coli O157:H7.
Nature, 409(6819), 529-533.
Phillippy, A. M., Schatz, M. C., & Pop, M. (2008). Genome assembly forensics:
finding the elusive mis-assembly. Genome biology, 9(3), R55.
Pi, W., Zhu, X., Wu, M., Wang, Y., Fulzele, S., Eroglu, A., et al. (2010). Long-
range function of an intergenic retrotransposon. Proceedings of the National
Academy of Sciences of the United States of America, 107(29), 12992-12997.
Pirs, T., Ocepek, M., & Rupnik, M. (2008). Isolation of Clostridium difficile from
food animals in Slovenia. J Med Microbiol, 57(Pt 6), 790-792.
Planche, T., Aghaizu, A., Holliman, R., Riley, P., Poloniecki, J., Breathnach, A.,
et al. (2008). Diagnosis of Clostridium difficile infection by toxin detection kits: a
systematic review. Lancet Infect Dis, 8(12), 777-784.
Quesada-Gomez, C., Rodriguez, C., Gamboa-Coronado Mdel, M., Rodriguez-
Cavallini, E., Du, T., Mulvey, M. R., et al. (2010). Emergence of Clostridium
difficile NAP1 in Latin America. J Clin Microbiol, 48(2), 669-670.
Razaq, N., Sambol, S., Nagaro, K., Zukowski, W., Cheknis, A., Johnson, S., et al.
(2007). Infection of hamsters with historical and epidemic BI types of Clostridium
difficile. J Infect Dis, 196(12), 1813-1819.
Rees, D. C., Williams, T. N., & Gladwin, M. T. (2010). Sickle-cell disease.
Lancet, 376(9757), 2018-2031.
Renn, S. C., Machado, H. E., Jones, A., Soneji, K., Kulathinal, R. J., & Hofmann,
H. A. (2010). Using comparative genomic hybridization to survey genomic
sequence divergence across species: a proof-of-concept from Drosophila. BMC
Genomics, 11, 271.
Rennie, C., Noyes, H. A., Kemp, S. J., Hulme, H., Brass, A., & Hoyle, D. C.
(2008). Strong position-dependent effects of sequence mismatches on signal ratios
measured using long oligonucleotide microarrays. BMC Genomics, 9, 317.
Richter, D. C., Ott, F., Auch, A. F., Schmid, R., & Huson, D. H. (2008).
MetaSim: a sequencing simulator for genomics and metagenomics. PLoS One,
3(10), e3373.
Robinson, J. T., Thorvaldsdottir, H., Winckler, W., Guttman, M., Lander, E. S.,
Getz, G., et al. (2011). Integrative genomics viewer. Nature biotechnology, 29(1),
24-26.

167
Rodriguez-Palacios, A., Staempfil, H. R., Duffield, T., & Weese, J. S. (2007).
Clostridium difficile in Retail Ground Meat, Canada. Emerging Infectious
Diseases, 13(3), 485-487.
Rodriguez-Siek, K. E., Giddings, C. W., Doetkott, C., Johnson, T. J., Fakhr, M.
K., & Nolan, L. K. (2005). Comparison of Escherichia coli isolates implicated in
human urinary tract infection and avian colibacillosis. Microbiology, 151(Pt 6),
2097-2110.
Ron, E. Z. (2006). Host specificity of septicemic Escherichia coli: human and
avian pathogens. Curr Opin Microbiol, 9(1), 28-32.
Ronaghi, M., Karamohamed, S., Pettersson, B., Uhlen, M., & Nyren, P. (1996).
Real-time DNA sequencing using detection of pyrophosphate release. Analytical
biochemistry, 242(1), 84-89.
Ronaghi, M., Uhlen, M., & Nyren, P. (1998). A sequencing method based on real-
time pyrophosphate. Science, 281(5375), 363, 365.
Rothberg, J. M., Hinz, W., Rearick, T. M., Schultz, J., Mileski, W., Davey, M., et
al. (2011). An integrated semiconductor device enabling non-optical genome
sequencing. Nature, 475(7356), 348-352.
Rozen, S., & Skaletsky, H. (2000). Primer3 on the WWW for general users and
for biologist programmers. Methods Mol Biol, 132, 365-386.
Rupnik, M. (2008). Heterogeneity of large clostridial toxins: importance of
Clostridium difficile toxinotypes. FEMS Microbiol Rev, 32(3), 541-555.
Rutherford, K., Parkhill, J., Crook, J., Horsnell, T., Rice, P., Rajandream, M. A.,
et al. (2000). Artemis: sequence visualization and annotation. Bioinformatics,
16(10), 944-945.
Salzberg, S. L., & Yorke, J. A. (2005). Beware of mis-assembled genomes.
Bioinformatics, 21(24), 4320-4321.
Sanger, F., Air, G. M., Barrell, B. G., Brown, N. L., Coulson, A. R., Fiddes, C.
A., et al. (1977). Nucleotide sequence of bacteriophage phi X174 DNA. Nature,
265(5596), 687-695.
Sanger, F., & Coulson, A. R. (1975). A rapid method for determining sequences
in DNA by primed synthesis with DNA polymerase. Journal of molecular
biology, 94(3), 441-448.
Sanger, F., Coulson, A. R., Hong, G. F., Hill, D. F., & Petersen, G. B. (1982).
Nucleotide sequence of bacteriophage lambda DNA. Journal of molecular
biology, 162(4), 729-773.

168
Savini, V., Catavitello, C., Talia, M., Manna, A., Pompetti, F., Favaro, M., et al.
(2008). Multidrug-resistant Escherichia fergusonii: a case of acute cystitis. J Clin
Microbiol, 46(4), 1551-1552.
Scaria, J., Ponnala, L., Janvilisri, T., Yan, W., Mueller, L. A., & Chang, Y. F.
(2010). Analysis of ultra low genome conservation in Clostridium difficile. PLoS
One, 5(12), e15147.
Schatz, M. C., Phillippy, A. M., Shneiderman, B., & Salzberg, S. L. (2007).
Hawkeye: an interactive visual analytics tool for genome assemblies. Genome
Biol, 8(3), R34.
Schmidt, D., Schwalie, P. C., Wilson, M. D., Ballester, B., Goncalves, A., Kutter,
C., et al. (2012). Waves of retrotransposon expansion remodel genome
organization and CTCF binding in multiple mammalian lineages. Cell, 148(1-2),
335-348.
Searls, D. B. (2010). The roots of bioinformatics. PLoS computational biology,
6(6), e1000809.
Sebaihia, M., Wren, B. W., Mullany, P., Fairweather, N. F., Minton, N., Stabler,
R., et al. (2006). The multidrug-resistant human pathogen Clostridium difficile has
a highly mobile, mosaic genome. Nature Genetics, 38(7), 779-786.
Sellers, P. H. (1974). On the Theory and Computation of Evolutionary Distances.
SIAM Journal on Applied Mathematics, 26(4), 787-793.
Shendure, J., Porreca, G. J., Reppas, N. B., Lin, X., McCutcheon, J. P.,
Rosenbaum, A. M., et al. (2005). Accurate multiplex polony sequencing of an
evolved bacterial genome. Science, 309(5741), 1728-1732.
Sillen, A., Andrade, J., Lilius, L., Forsell, C., Axelman, K., Odeberg, J., et al.
(2008). Expanded high-resolution genetic study of 109 Swedish families with
Alzheimer's disease. Eur J Hum Genet, 16(2), 202-208.
Sloan, L. M., Duresko, B. J., Gustafson, D. R., & Rosenblatt, J. E. (2008).
Comparison of real-time PCR for detection of the tcdC gene with four toxin
immunoassays and culture in diagnosis of Clostridium difficile infection. J Clin
Microbiol, 46(6), 1996-2001.
Smith, T. F., & Waterman, M. S. (1981). Identification of common molecular
subsequences. Journal of molecular biology, 147(1), 195-197.
Spigaglia, P., Carattoli, A., Barbanti, F., & Mastrantonio, P. (2010). Detection of
gyrA and gyrB mutations in Clostridium difficile isolates by real-time PCR. Mol
Cell Probes, 24(2), 61-67.

169
Spigaglia, P., & Mastrantonio, P. (2002). Molecular analysis of the pathogenicity
locus and polymorphism in the putative negative regulator of toxin production
(TcdC) among Clostridium difficile clinical isolates. J Clin Microbiol, 40(9),
3470-3475.
Stabler, R. A., Gerding, D. N., Songer, J. G., Drudy, D., Brazier, J. S., Trinh, H.
T., et al. (2006). Comparative Phylogenomics of Clostridium difficile Reveals
Clade Specificity and Microevolution of Hypervirulent Strains. J. Bacteriol.,
188(20), 7297-7305.
Stabler, R. A., He, M., Dawson, L., Martin, M., Valiente, E., Corton, C., et al.
(2009). Comparative genome and phenotypic analysis of Clostridium difficile 027
strains provides insight into the evolution of a hypervirulent bacterium. Genome
Biol, 10(9), R102.
Staden, R. (1996). The Staden sequence analysis package. Molecular
biotechnology, 5(3), 233-241.
Stanke, M., Diekhans, M., Baertsch, R., & Haussler, D. (2008). Using native and
syntenically mapped cDNA alignments to improve de novo gene finding.
Bioinformatics, 24(5), 637-644.
Stapley, J., Reger, J., Feulner, P. G., Smadja, C., Galindo, J., Ekblom, R., et al.
(2010). Adaptation genomics: the next generation. Trends Ecol Evol, 25(12), 705-
712.
Stein, L. D., Mungall, C., Shu, S., Caudy, M., Mangone, M., Day, A., et al.
(2002). The generic genome browser: a building block for a model organism
system database. Genome Res, 12(10), 1599-1610.
Stevens, R., Goble, C., Baker, P., & Brass, A. (2001). A classification of tasks in
bioinformatics. Bioinformatics, 17(2), 180-188.
Stratton, M. R., Campbell, P. J., & Futreal, P. A. (2009). The cancer genome.
Nature, 458(7239), 719-724.
Tamura, K., Dudley, J., Nei, M., & Kumar, S. (2007). MEGA4: Molecular
Evolutionary Genetics Analysis (MEGA) software version 4.0. Mol Biol Evol,
24(8), 1596-1599.
Ter-Hovhannisyan, V., Lomsadze, A., Chernoff, Y. O., & Borodovsky, M.
(2008). Gene prediction in novel fungal genomes using an ab initio algorithm
with unsupervised training. Genome research, 18(12), 1979-1990.
Touchon, M., Hoede, C., Tenaillon, O., Barbe, V., Baeriswyl, S., Bidet, P., et al.
(2009). Organised genome dynamics in the Escherichia coli species results in
highly diverse adaptive paths. PLoS Genet, 5(1), e1000344.

170
Uemura, S., Aitken, C. E., Korlach, J., Flusberg, B. A., Turner, S. W., & Puglisi,
J. D. (2010). Real-time tRNA transit on single translating ribosomes at codon
resolution. Nature, 464(7291), 1012-1017.
Ukkonen, E. (1985). Algorithms for approximate string matching. Inf. Control,
64(1-3), 100-118.
Venter, J. C., Adams, M. D., Myers, E. W., Li, P. W., Mural, R. J., Sutton, G. G.,
et al. (2001). The sequence of the human genome. Science, 291(5507), 1304-
1351.
Victoria, X. W., Blades, N., Ding, J., Sultana, R., & Parmigiani, G. (2012).
Estimation of sequencing error rates in short reads. BMC Bioinformatics, 13(1),
185.
Walker, F. O. (2007). Huntington's disease. Lancet, 369(9557), 218-228.
Walkty, A., Boyd, D. A., Gravel, D., Hutchinson, J., McGeer, A., Moore, D., et
al. (2010). Molecular characterization of moxifloxacin resistance from Canadian
Clostridium difficile clinical isolates. Diagn Microbiol Infect Dis, 66(4), 419-424.
Warny, M., Pepin, J., Fang, A., Killgore, G., Thompson, A., Brazier, J., et al.
(2005). Toxin production by an emerging strain of Clostridium difficile associated
with outbreaks of severe disease in North America and Europe. The Lancet,
366(9491), 1079-1084.
Waterston, R. H., Lindblad-Toh, K., Birney, E., Rogers, J., Abril, J. F., Agarwal,
P., et al. (2002). Initial sequencing and comparative analysis of the mouse
genome. Nature, 420(6915), 520-562.
Welch, R. A., Burland, V., Plunkett, G., 3rd, Redford, P., Roesch, P., Rasko, D.,
et al. (2002). Extensive mosaic structure revealed by the complete genome
sequence of uropathogenic Escherichia coli. Proc Natl Acad Sci U S A, 99(26),
17020-17024.
Wetterstrand, K. (2012). DNA Sequencing Costs: Data from the NHGRI Large-
Scale Genome Sequencing Program Retrieved April 22, 2012, from
www.genome.gov/sequencingcosts
Wheeler, D. A., Srinivasan, M., Egholm, M., Shen, Y., Chen, L., McGuire, A., et
al. (2008). The complete genome of an individual by massively parallel DNA
sequencing. Nature, 452(7189), 872-876.
Wilbur, W. J., & Lipman, D. J. (1983). Rapid similarity searches of nucleic acid
and protein data banks. Proceedings of the National Academy of Sciences of the
United States of America, 80(3), 726-730.

171
Wolff, D., Bruning, T., & Gerritzen, A. (2009). Rapid detection of the
Clostridium difficile ribotype 027 tcdC gene frame shift mutation at position 117
by real-time PCR and melt curve analysis. Eur J Clin Microbiol Infect Dis.
Wu, C. H., Huang, H., Arminski, L., Castro-Alvear, J., Chen, Y., Hu, Z. Z., et al.
(2002). The Protein Information Resource: an integrated public resource of
functional annotation of proteins. Nucleic Acids Res, 30(1), 35-37.
Xing, L., & Brendel, V. (2001). Multi-query sequence BLAST output
examination with MuSeqBox. Bioinformatics, 17(8), 744-745.
Zhang, J., Chiodini, R., Badr, A., & Zhang, G. (2011). The impact of next-
generation sequencing on genomics. J Genet Genomics, 38(3), 95-109.

172
1 0 1
C A T
0 | | | 0
T | | | G
1 | | | | | 1 T | | | | | T
B I O I N F O R M A T I C S
C | | | | | G 1 | | | | | 1
A | | | T
0 | | | 0
T A C
1 0 1