closing the sdg budget gap...govex(sdgs) = capex(budget) + opex(budget) + transfers(budget) there...
TRANSCRIPT
Closing the SDG Budget Gap

Prepared by the SDSN Costing and Financing team:
Professor Jeffrey Sachs
Ms. Vanessa Fajans-Turner
Ms. Taylor Smith
Ms. Cara Kennedy-Cuomo
Ms. Teresa Parejo
Mr. Siamak Sam Loni
The team gratefully acknowledges the partnership and initiative taken by the Human Act Foundation, especially its founder Mr. Djaffar Shalchi. Moreover, the team is exceptionally grateful for the outstanding work by the Fiscal Affairs Department of the International Monetary Fund in making significant advances in quantifying the budgetary need for the SDGs. Last, but by no means least, the team would like to thank Dr. Belay Begashaw, and Mr. Djibril Diallo for the extensive discussions and guidance.
Closing the SDG Budget GapBy
© Move Humanity, December 2018
Design and Layout by Pica Publishing Ltd – www.pica-publishing.com
ContentsExecutive Summary 1
List of Acronyms 3
1. Introduction 5
2. Public Outlays for the SDGs 9
3. Recognizing the Special Needs of LIDCs 11
4. Calculating SDG Budget Needs for LIDCs 12
5. Budget Revenue in LIDCs 16
6. The SDG Financing Gap in LIDCs 18
7. Increased Domestic Revenues 19
8. Development Assistance 218.1 Business as Usual 218.2 New Approaches to SDG Financing 228.3 The Move Humanity Initiative 28
9. Practices for Deploying Increased ODA and PDA 31Improving Donor Reporting 31Pooled-Financing Mechanisms 32
10. Conclusions: Finance and Leadership in Achieving the SDGs 34
Bibliography 35
Appendix A. Country Income Group Categories 38
Appendix B. Source List for Table 4: Required SDG Budget Outlays 41
Appendix C. Move Humanity: A Justice and Wealth Initiative 42

1
The Sustainable Development Goals (SDGs) require major societal transformations that will depend on significant fiscal outlays and private investments. The fiscal outlays cover public investments, the public provision of social services, and social protection for vulnerable populations. The key message of this report is that the governments of the Low-Income Developing Countries (LIDCs) require a substantial, yet achievable, increase in international development assistance, from both official sources and private philanthropists, to reach the SDGs.
This report examines the fiscal burdens facing the LIDCs, a group of 59 low-income countries with annual incomes below US$2,700 per capita and which are eligible for International Monetary Fund (IMF) concessional assistance. In line with recent findings of the IMF Fiscal Affairs Department (FAD), and building on sector cost estimates for health, education, infrastructure, biodiversity conservation, and social protection, we demonstrate that governments of LIDCs will have to increase budget outlays significantly to achieve the SDGs, vastly outstripping their current and potential domestic revenues.
There are three ways to close the resulting budget gap:
1. increased domestic revenues
2. increased Official Development Assistance (ODA) to governments
3. increased Private Development Assistance (PDA) to governments
This report shows that increased domestic revenues can and will cover only part of the necessary SDG budget spending of the LIDCs. Achieving the SDGs in the LIDCs will also require increases of both Official Development Assistance (ODA) and Private Development Assistance (PDA) to reach aggregate levels of SDG-directed development aid on the order of US$300-400 billion USD per year. Fortunately, increases of such a scale are within reach, as they represent a small share of the incomes of donor countries and the world’s wealthiest individuals. We also emphasize that precise estimates of SDG financing needs will necessarily be based on country-specific analyses rather than the across-the-board illustrative calculations used in this report. We therefore urge that governments in the LIDCs undertake detailed and comprehensive SDG costing as a matter of priority.
We note that fulfillment of the long-standing target of 0.7 percent of donor GNI allocated to ODA, with ODA directed to the SDGs, would reduce the SDG funding gap in LIDCs by much more than half. We also suggest several new taxes, such as a much-needed carbon tax, that could be earmarked for the SDGs to further bolster ODA flows.
Executive Summary
This report focuses on the fiscal challenges facing Low-Income Developing Countries (LIDCs) to achieve the SDGs, building on prior studies including two working papers published by the UN Sustainable Development Solutions Network (SDSN) in 2015 – “Financing for Sustainable Development: Implementing the SDGs through Effective Investment Strategies” and “Partnerships and Investment Needs to Achieve the Sustainable Development Goals: Understanding the Billions and Trillions”.
2
CLOSING THE SDG BUDGET GAP
Even with increased ODA, we estimate that an additional US$100 billion or so can and should be mobilized as Private Development Assistance. Specifically, we suggest that the world’s 2,208 billionaires, with a combined net worth of approximately US$10 trillion, should be called upon to close the remaining gap. An SDG wealth tax of one percent per annum would yield around US$100 billion from these 2,208 billionaires (Forbes, 2018). Alternatively, billionaires could contribute the required funding as voluntary philanthropy and receive a credit against a one percent SDG wealth tax.
The US$300-400 billion of official and private development assistance for the 59 LIDCs will be effective only if the funds are used responsibly. This report argues that an effective deployment of funds is indeed feasible along the lines demonstrated during the past 15 years by the pooled financing mechanisms such as the Global Fund to Fight AIDS, TB, and Malaria (GFATM) and the Global Alliance on Vaccines and Immunizations (GAVI). These pooled financing mechanisms have demonstrated how to pool donor funds effectively and how to manage the resulting outlays with professionalism and oversight (Sachs and Schmidt-Traub, 2017).
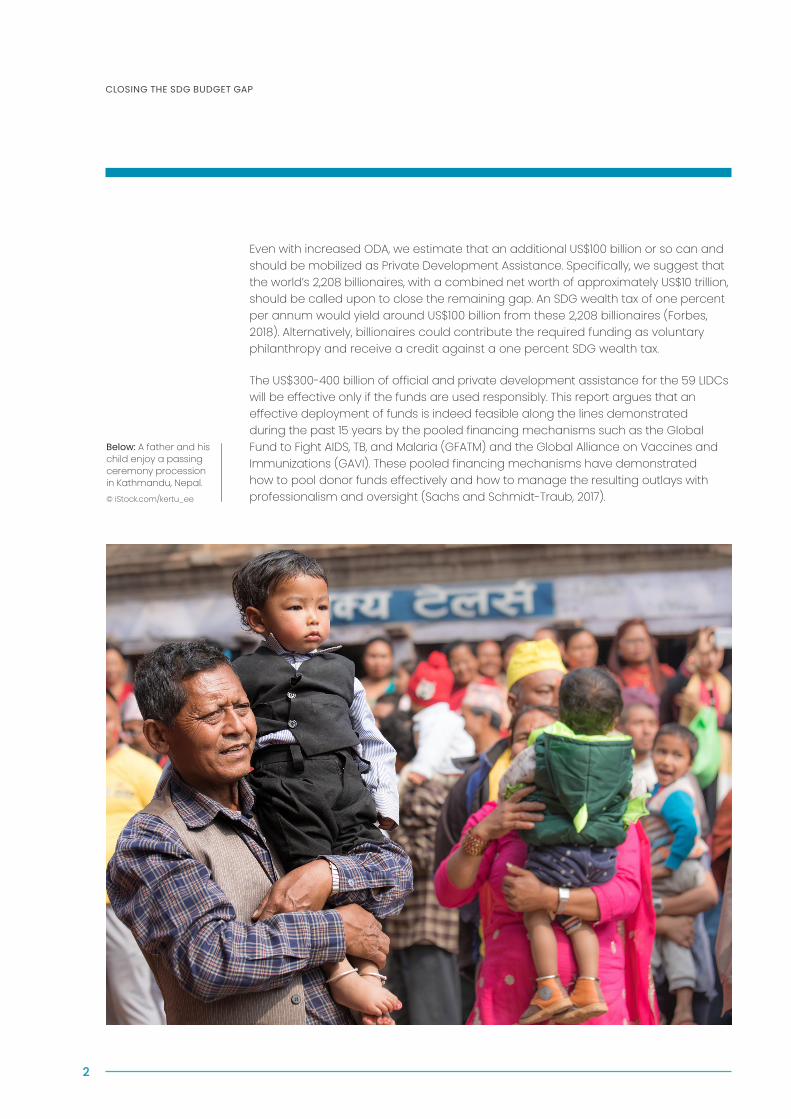
Below: A father and his child enjoy a passing ceremony procession in Kathmandu, Nepal. © iStock.com/kertu_ee
3
List of Acronyms
AEOI Automatic Exchange of Financial Account Information
BEPS Base Erosion and Profit Shifting
BAU Business-as-Usual
CAPEX Capital Expenditure
DBR Domestic Budget Revenue
DSA Debt Sustainability Analysis
FAD IMF Fiscal Affairs Department
FTT Financial Transaction Tax
GAVI Global Alliance on Vaccines and Immunizations
GFATM Global Fund to Fight AIDS, TB, and Malaria
GOVEX Government Budgetary Expenditures Required to Reach the Goals
GNI Gross National Income
HICs High Income Countries
HIPCs Heavily Indebted Poor Countries
IFFed International Financing Facility for Education
IMF International Monetary Fund
LIDCs Low-Income Developing Countries
LMICs Lower Middle-Income Countries
OLIDCs Other Low-Income Developing Countries
OPEX Operational Expenditure
ODA Official Development Assistance
PDA Private Development Assistance
PPPs Public-Private Partnerships
SDGs Sustainable Development Goals
SDSN UN Sustainable Development Solutions Network
UNCTAD United Nations Conference on Trade and Development
UNDP United Nations Development Programme

5
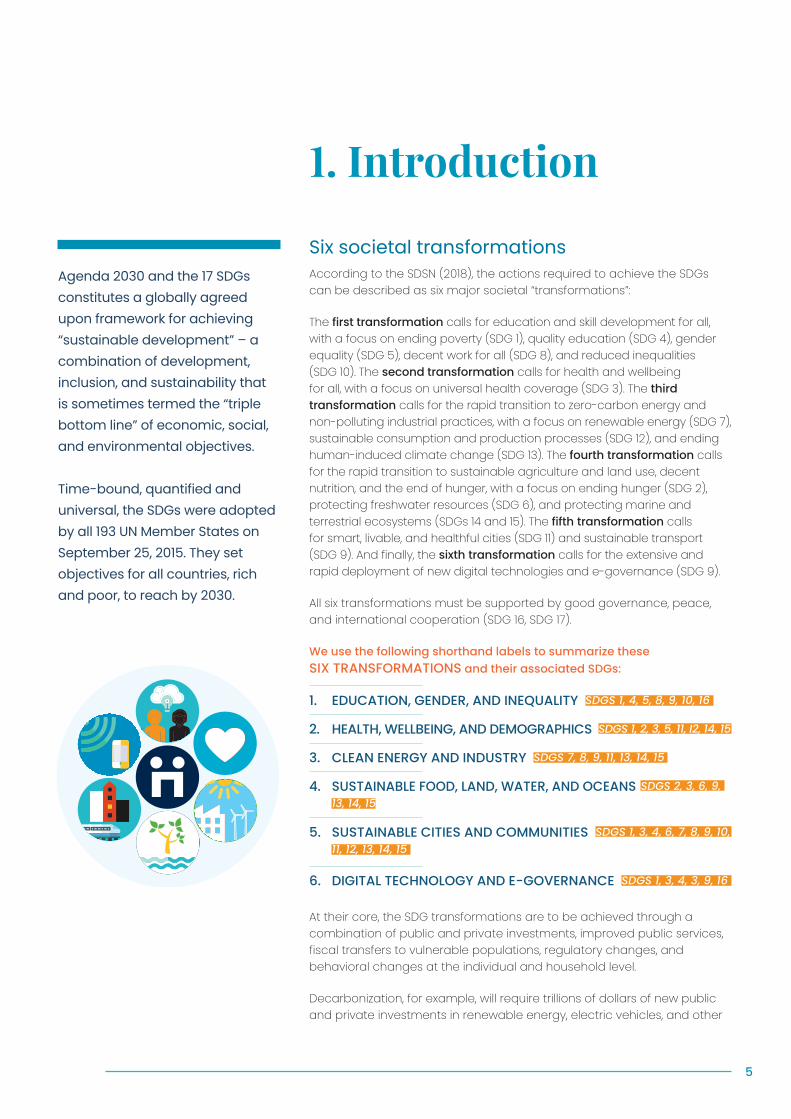
Six societal transformations According to the SDSN (2018), the actions required to achieve the SDGs can be described as six major societal “transformations”:
The first transformation calls for education and skill development for all, with a focus on ending poverty (SDG 1), quality education (SDG 4), gender equality (SDG 5), decent work for all (SDG 8), and reduced inequalities (SDG 10). The second transformation calls for health and wellbeing for all, with a focus on universal health coverage (SDG 3). The third transformation calls for the rapid transition to zero-carbon energy and non-polluting industrial practices, with a focus on renewable energy (SDG 7), sustainable consumption and production processes (SDG 12), and ending human-induced climate change (SDG 13). The fourth transformation calls for the rapid transition to sustainable agriculture and land use, decent nutrition, and the end of hunger, with a focus on ending hunger (SDG 2), protecting freshwater resources (SDG 6), and protecting marine and terrestrial ecosystems (SDGs 14 and 15). The fifth transformation calls for smart, livable, and healthful cities (SDG 11) and sustainable transport (SDG 9). And finally, the sixth transformation calls for the extensive and rapid deployment of new digital technologies and e-governance (SDG 9).
All six transformations must be supported by good governance, peace, and international cooperation (SDG 16, SDG 17).
We use the following shorthand labels to summarize these SIX TRANSFORMATIONS and their associated SDGs:
1. EDUCATION, GENDER, AND INEQUALITY SDGS 1, 4, 5, 8, 9, 10, 16
2. HEALTH, WELLBEING, AND DEMOGRAPHICS SDGS 1, 2, 3, 5, 11, I2, 14, 15
3. CLEAN ENERGY AND INDUSTRY SDGS 7, 8, 9, 11, 13, 14, 15
4. SUSTAINABLE FOOD, LAND, WATER, AND OCEANS SDGS 2, 3, 6, 9, 13, 14, 15
5. SUSTAINABLE CITIES AND COMMUNITIES SDGS 1, 3, 4, 6, 7, 8, 9, 10, 11, 12, 13, 14, 15
6. DIGITAL TECHNOLOGY AND E-GOVERNANCE SDGS 1, 3, 4, 3, 9, 16
At their core, the SDG transformations are to be achieved through a combination of public and private investments, improved public services, fiscal transfers to vulnerable populations, regulatory changes, and behavioral changes at the individual and household level.
Decarbonization, for example, will require trillions of dollars of new public and private investments in renewable energy, electric vehicles, and other
Agenda 2030 and the 17 SDGs constitutes a globally agreed upon framework for achieving “sustainable development” – a combination of development, inclusion, and sustainability that is sometimes termed the “triple bottom line” of economic, social, and environmental objectives.
Time-bound, quantified and universal, the SDGs were adopted by all 193 UN Member States on September 25, 2015. They set objectives for all countries, rich and poor, to reach by 2030.
1. Introduction

6
CLOSING THE SDG BUDGET GAP
zero-carbon technologies in all countries of the world, from the poorest to the richest. Decarbonization will also require new and improved public services, such as improved public transport; new and improved economic policies (e.g. a carbon tax); and changes in personal behavior (e.g. more reliance on walking, biking, and public transport, and changes in some dietary practices as well, such as reduced beef consumption).
Investing in the SDGsIn addition to the outlay of both public and private investments for SDG success, some types of SDG spending (notably on the provision of health and education services) are counted as consumption spending in the national accounts though they are, in fact, investments in human capital. We can designate capital expenditures for the SDGs – ‘CAPEX(SDGs)’ – as the sum of public and private investments:
CAPEX(SDGs) = CAPEX(Public) + CAPEX(Private)
While capital outlays are very important for SDG achievement, this report’s focus is on the government budgetary expenditures required to reach the Goals – ‘GOVEX(SDGs)’. We focus on three categories of budget outlays: capital expenditures (CAPEX), operating costs of public services such as public healthcare and public education (OPEX), and transfer payments (TRANSFERS), especially for social protection. Thus:
GOVEX(SDGs) = CAPEX(Budget) + OPEX(Budget) + TRANSFERS(Budget)
There are a growing number of estimates of the costs for meeting the SDGs, according to different definitions of costs and different coverage of countries. UNCTAD (2014) focused on CAPEX(SDGs), and estimated the annual global SDG capital expenditure needs to be US$5-7 trillion. With current CAPEX(SDGs) estimated to be US$3-4 trillion per year, annual incremental CAPEX needs were estimated to be US$2-3 trillion. Of this world total, UNCTAD estimated that US$3.3-4.5 trillion is needed annually in the developing countries, with incremental CAPEX of US$1.9-3.1 trillion.
The SDSN has reviewed incremental CAPEX plus OPEX for all developing countries, summing across key SDG sectors and public and private outlays (Schmidt-Traub and Sachs, 2015). The SDSN estimated incremental annual CAPEX+OPEX for the developing countries to be US$2-3 trillion. SDSN also examined the incremental needs for a poorer subset of the developing countries, namely the Low-Income Countries (LICs) and Lower Middle-Income Countries (LMICs), estimating the incremental annual outlays to be US$1.4 trillion (Schmidt-Traub, 2015).
The focus of this paper will be on SDG budget outlays (GOVEX) for a subset of developing countries, namely the Low-Income Developing Countries (LIDCs) as classified by the IMF. The LIDCs are 59 countries eligible for IMF
7
1. Introduction
concessional financing (listed in Appendix A). The LIDCs include all Low-Income Countries (LICs), with the exception of North Korea and Syria, and a subset of the Lower Middle-Income Countries, generally those with gross national incomes per capita below US$2,700, though excluding a few countries in that range.
We focus on LIDCs because these are the countries that cannot finance the SDGs out of their own domestic resources. Put more simply, the LIDCs are the countries that need international development assistance. Our purpose is to estimate the scale of the international development assistance these countries need, and to suggest how to mobilize this amount as Official Development Assistance and Private Development Assistance.
To do so, we estimate the total GOVEX needed to achieve the SDGs in the LIDCs and compare that total with the domestic budget revenues potentially available to the LIDCs. We call this the SDG budget gap. A key conclusion of this paper is that the SDG Budget Gap for the LIDCs is on the order of US$300-400 billion annually.
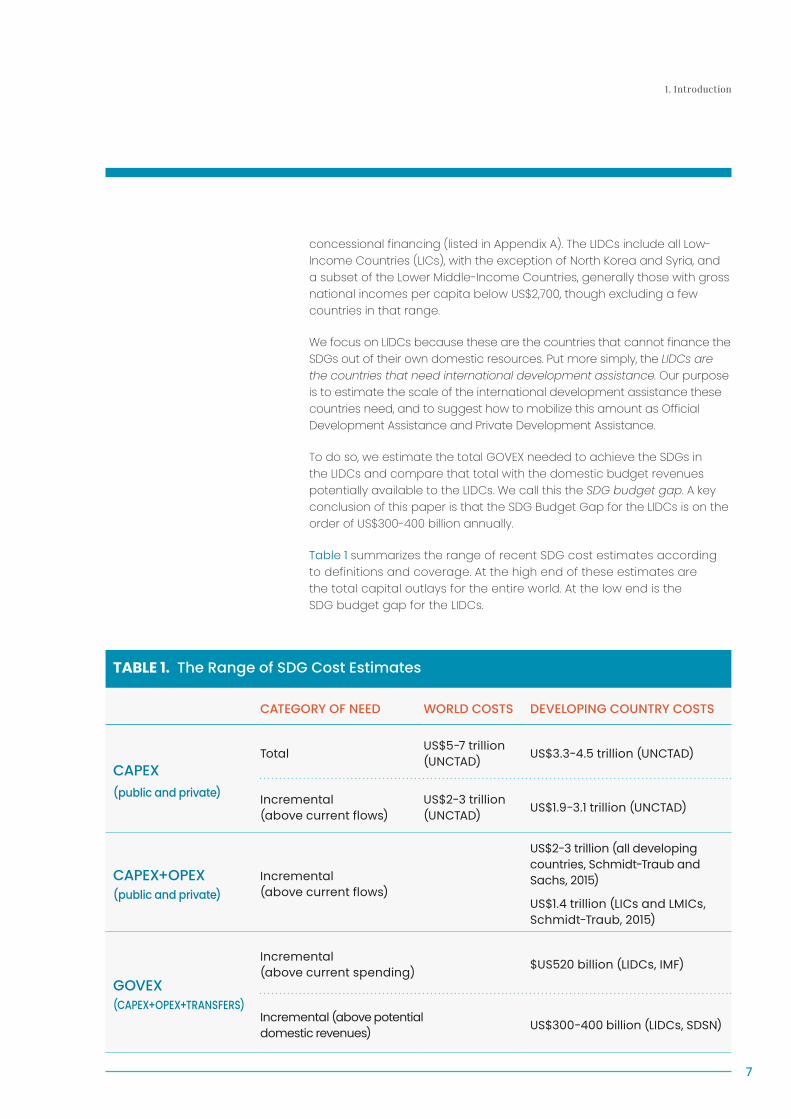
Table 1 summarizes the range of recent SDG cost estimates according to definitions and coverage. At the high end of these estimates are the total capital outlays for the entire world. At the low end is the SDG budget gap for the LIDCs.
TABLE 1. The Range of SDG Cost Estimates
CATEGORY OF NEED WORLD COSTS DEVELOPING COUNTRY COSTS
CAPEX (public and private)
Total US$5-7 trillion (UNCTAD) US$3.3-4.5 trillion (UNCTAD)
Incremental (above current flows)
US$2-3 trillion (UNCTAD) US$1.9-3.1 trillion (UNCTAD)
CAPEX+OPEX (public and private)
Incremental (above current flows)
US$2-3 trillion (all developing countries, Schmidt-Traub and Sachs, 2015)
US$1.4 trillion (LICs and LMICs, Schmidt-Traub, 2015)
GOVEX
(CAPEX+OPEX+TRANSFERS)
Incremental (above current spending) $US520 billion (LIDCs, IMF)
Incremental (above potential domestic revenues) US$300-400 billion (LIDCs, SDSN)
8
CLOSING THE SDG BUDGET GAP
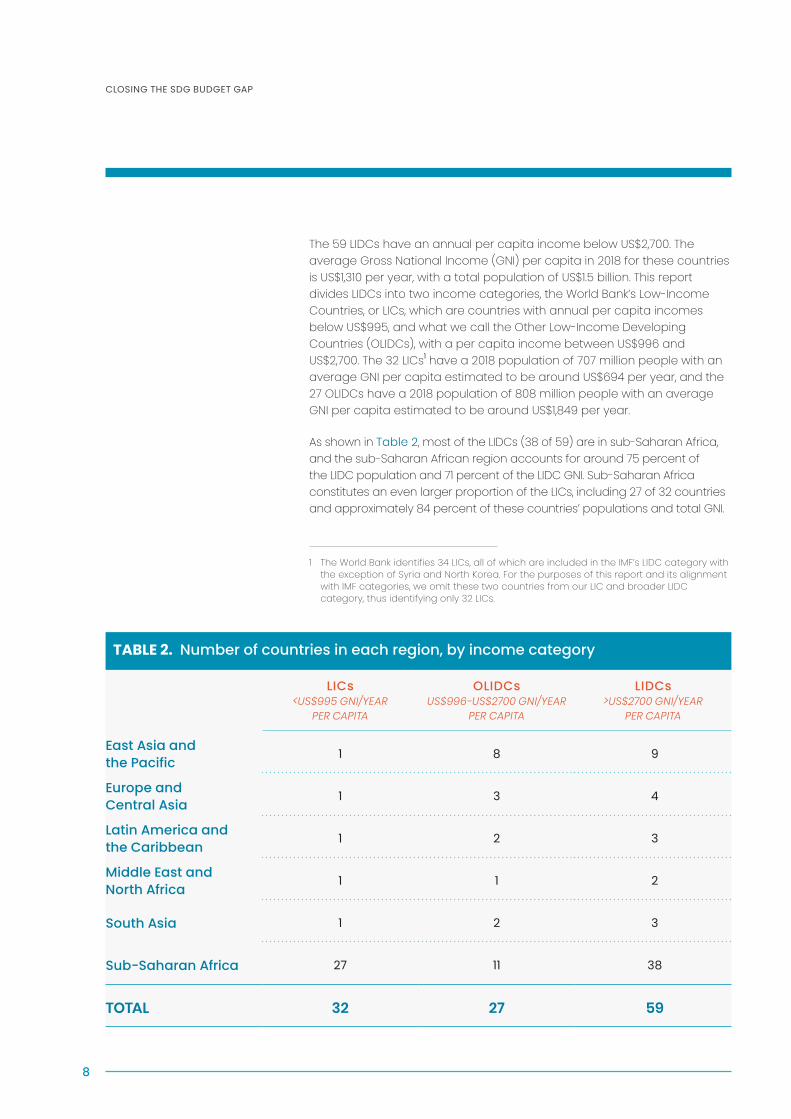
The 59 LIDCs have an annual per capita income below US$2,700. The average Gross National Income (GNI) per capita in 2018 for these countries is US$1,310 per year, with a total population of US$1.5 billion. This report divides LIDCs into two income categories, the World Bank’s Low-Income Countries, or LICs, which are countries with annual per capita incomes below US$995, and what we call the Other Low-Income Developing Countries (OLIDCs), with a per capita income between US$996 and US$2,700. The 32 LICs1 have a 2018 population of 707 million people with an average GNI per capita estimated to be around US$694 per year, and the 27 OLIDCs have a 2018 population of 808 million people with an average GNI per capita estimated to be around US$1,849 per year.
As shown in Table 2, most of the LIDCs (38 of 59) are in sub-Saharan Africa, and the sub-Saharan African region accounts for around 75 percent of the LIDC population and 71 percent of the LIDC GNI. Sub-Saharan Africa constitutes an even larger proportion of the LICs, including 27 of 32 countries and approximately 84 percent of these countries’ populations and total GNI.
1 The World Bank identifies 34 LICs, all of which are included in the IMF’s LIDC category with the exception of Syria and North Korea. For the purposes of this report and its alignment with IMF categories, we omit these two countries from our LIC and broader LIDC category, thus identifying only 32 LICs.
TABLE 2. Number of countries in each region, by income category
LICs<US$995 GNI/YEAR
PER CAPITA
OLIDCsUS$996-US$2700 GNI/YEAR
PER CAPITA
LIDCs>US$2700 GNI/YEAR
PER CAPITA
East Asia and the Pacific
1 8 9
Europe and Central Asia
1 3 4
Latin America and the Caribbean
1 2 3
Middle East and North Africa
1 1 2
South Asia 1 2 3
Sub-Saharan Africa 27 11 38
TOTAL 32 27 59
9
There are three major categories of goods and services that call for government (budget) expenditures (GOVEX).
The first category is Merit Goods, which are goods recognized to be of fundamental significance for the wellbeing and dignity of every individual. Merit goods are Economic Rights according to international law, in the framework of the UN Declaration of Human Rights and the UN Covenant on Economic, Social and Cultural Rights. Such economic rights include the rights to an adequate standard of living (food, clothing, shelter), health, and education.
The second category is Public Goods, which are goods that are largely non-rival and non-excludable and are therefore under-provided by the marketplace. Public goods include environmental protection, infectious disease control, basic scientific research, the administration of justice, the rule of law, and national security.
The third category is Natural Monopolies (or Network Infrastructure), wherein a single monopoly provider or small number of oligopoly providers offer the least-cost way to provide the services in question for an economy. Classic examples of natural monopolies are the ground transport system (road and rail) and the power transmission and distribution system.
Roads and power transmission and distribution are almost universally provided by the public sector, or if by the private sector (e.g. a toll road or a private utility), then under strong public regulation. Natural monopolies are also emerging in the new “winner-take-all” information technology sectors, like Google’s search engine, Facebook’s social network, Amazon’s e-commerce platform, and Uber’s ride-hailing service. These information-based networks, though privately provided, are likely to require new public regulation and taxation to ensure their efficient and equitable management.
The six SDG transformations are replete with merit goods, public goods, and natural monopolies, and therefore will require ample public investments and direct provision of public services. For the same reason, achieving the SDGs will depend on mobilizing adequate flows of public finance, including budgetary revenues and public and private international assistance as needed.
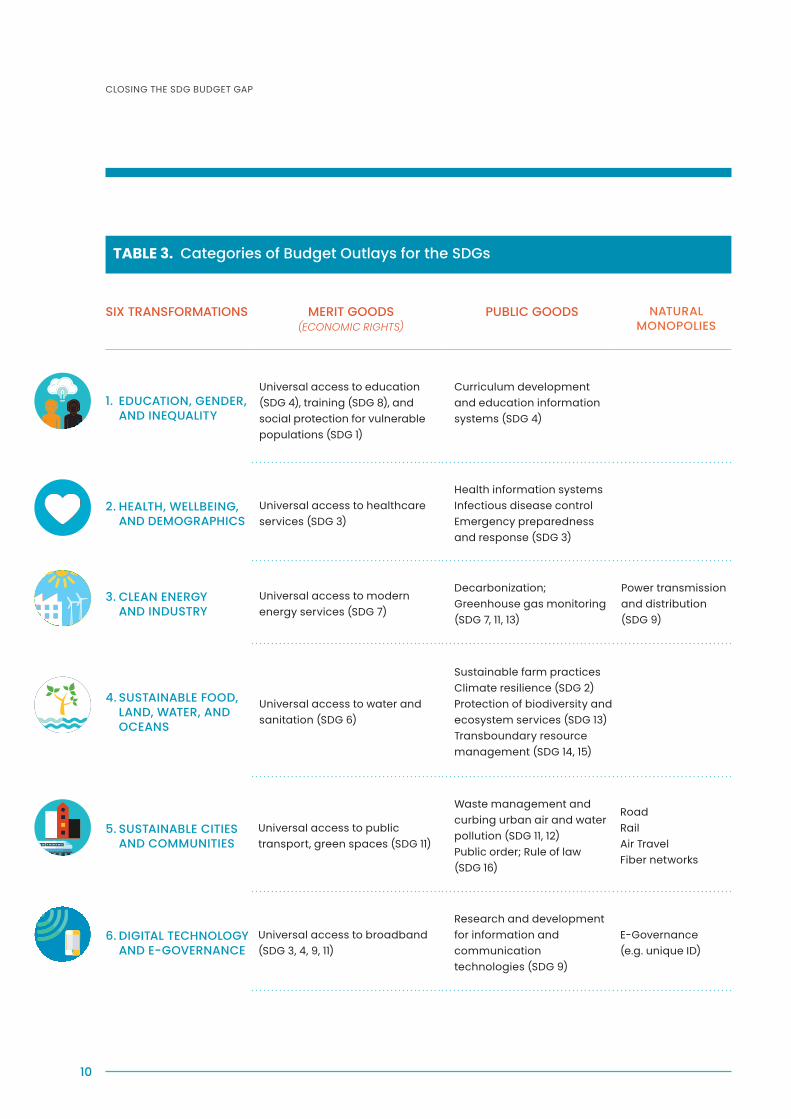
Table 3 highlights some of the merit goods, public goods, and natural monopolies in the SDGs. The table is a mere partial listing of areas where public outlays for the SDGs are likely to be critical.
2. Public Outlays for the SDGs
MERIT GOODS, PUBLIC GOODS, AND NATURAL MONOPOLIES
10
CLOSING THE SDG BUDGET GAP
TABLE 3. Categories of Budget Outlays for the SDGs
SIX TRANSFORMATIONS MERIT GOODS (ECONOMIC RIGHTS)
PUBLIC GOODS NATURAL MONOPOLIES
1. EDUCATION, GENDER, AND INEQUALITY
Universal access to education (SDG 4), training (SDG 8), and social protection for vulnerable populations (SDG 1)
Curriculum development and education information systems (SDG 4)
2. HEALTH, WELLBEING, AND DEMOGRAPHICS
Universal access to healthcare services (SDG 3)
Health information systemsInfectious disease control Emergency preparedness and response (SDG 3)
3. CLEAN ENERGY AND INDUSTRY
Universal access to modern energy services (SDG 7)
Decarbonization; Greenhouse gas monitoring (SDG 7, 11, 13)
Power transmission and distribution (SDG 9)
4. SUSTAINABLE FOOD, LAND, WATER, AND OCEANS
Universal access to water and sanitation (SDG 6)
Sustainable farm practicesClimate resilience (SDG 2)Protection of biodiversity and ecosystem services (SDG 13)Transboundary resource management (SDG 14, 15)
5. SUSTAINABLE CITIES AND COMMUNITIES
Universal access to public transport, green spaces (SDG 11)
Waste management and curbing urban air and water pollution (SDG 11, 12)Public order; Rule of law (SDG 16)
Road Rail Air Travel Fiber networks
6. DIGITAL TECHNOLOGY AND E-GOVERNANCE
Universal access to broadband (SDG 3, 4, 9, 11)
Research and development for information and communication technologies (SDG 9)
E-Governance (e.g. unique ID)
11
LIDCs share the crucial and distinctive challenge that their domestic budgetary resources are inadequate to cover the needed SDG-related budget outlays. This SDG budget shortfall is “structural,” in that it does not reflect a lack of political will to meet the SDGs, but rather a lack of budgetary means.
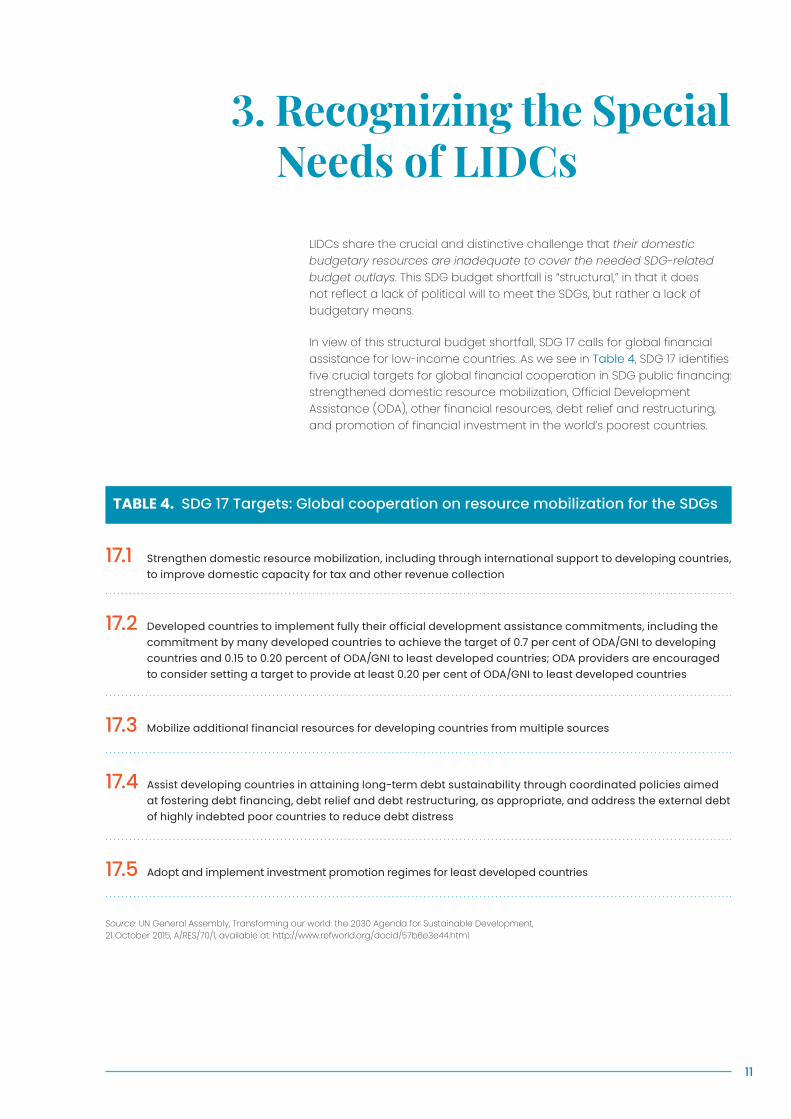
In view of this structural budget shortfall, SDG 17 calls for global financial assistance for low-income countries. As we see in Table 4, SDG 17 identifies five crucial targets for global financial cooperation in SDG public financing: strengthened domestic resource mobilization, Official Development Assistance (ODA), other financial resources, debt relief and restructuring, and promotion of financial investment in the world’s poorest countries.
3. Recognizing the Special Needs of LIDCs
TABLE 4. SDG 17 Targets: Global cooperation on resource mobilization for the SDGs
17.1 Strengthen domestic resource mobilization, including through international support to developing countries, to improve domestic capacity for tax and other revenue collection
17.2 Developed countries to implement fully their official development assistance commitments, including the commitment by many developed countries to achieve the target of 0.7 per cent of ODA/GNI to developing countries and 0.15 to 0.20 percent of ODA/GNI to least developed countries; ODA providers are encouraged to consider setting a target to provide at least 0.20 per cent of ODA/GNI to least developed countries
17.3 Mobilize additional financial resources for developing countries from multiple sources
17.4 Assist developing countries in attaining long-term debt sustainability through coordinated policies aimed at fostering debt financing, debt relief and debt restructuring, as appropriate, and address the external debt of highly indebted poor countries to reduce debt distress
17.5 Adopt and implement investment promotion regimes for least developed countries
Source: UN General Assembly, Transforming our world: the 2030 Agenda for Sustainable Development, 21 October 2015, A/RES/70/1, available at: http://www.refworld.org/docid/57b6e3e44.html

12
Now we turn to estimates of the budget needs to achieve the SDGs. In order to do this, we estimate the costs of a national budget with SDG-based public spending as well as adequate spending on other budget categories such as public administration and servicing of the public debt. Our estimates are based on a growing literature that examines the key costs of providing particular SDG-based goods and services, such as healthcare, education, and basic infrastructure. We underscore that this paper merely offers rough estimates of the budget needs, since precise cost estimates will have to be made country by country, taking into account the local context.
Our key budget assumptions are shown in Table 5, with detailed data sources provided in Appendix B. All figures are in USD for 2018.
For health, we estimate a cost of US$110 per person for Low-Income Developing Countries (LICs) and US$175 per person for the Other Low-Income Developing Countries (OLIDCs).
For education we estimate a cost of US$330 per student for LICs and US$525 per student in OLIDCs. We also assume that the student-aged population (age 4-18) is approximately one-third of the total population, so that the costs per-capita are one-third of the costs per student, in other words US$110 in the LICs and US$175 in the OLIDCs.
Estimates for infrastructure, biodiversity conservation, and social protection are also shown in the table. Once again, we underscore that these point estimates in fact reflect a range of costs that will differ country by country and vary over time.
The budget needs for infrastructure are complex. Recent estimates of SDG-related infrastructure costs show that the needs vary widely by country but are typically on the order of 12-15 percent of GDP per year during 2018-2030 for LIDCs for which calculations have been made. Yet only a portion of those needs will be met through budget outlays, with other parts being raised through market borrowing or mixed public-private provision of public services, such as in PPPs. We do not yet have precise estimates of how much of the overall infrastructure needs can realistically be mobilized through market financing and how much will require domestic budget financing. We use a rounded number, 10 percent of GDP per year, as the estimate for the budgetary needs for infrastructure, assuming that the budget must be the main source, in order to ensure universal access to modern infrastructure services. While the private sector could cover some of the costs, the government is ultimately responsible for the most basic aspects of national infrastructure. More precise estimates will have to be made in the future on a country-by-country basis.
4. Calculating SDG Budget Needs for LIDCs
DOMESTIC BUDGET REVENUES
IN LICs & LIDs ARE NOT ENOUGH TO ACHIEVE
THE SDGs

13
4. Calculating SDG Budget Needs for LIDCs
We note that while rather detailed estimates have been made for health, education, infrastructure and social protection (see Appendix B), there are not yet many reliable estimates for the budgetary costs for biodiversity conservation and climate adaptation. We use the best available estimates to arrive at a budget cost of 1 percent of GDP in LICs and OLIDCs (Appendix B).
This is probably an underestimate of the actual budgetary needs for this category and much more work is needed on the costs of meeting biodiversity conservation and climate adaptation at the country level.
We turn the dollar-based estimates into shares of GDP by assuming that the average income per capita will be US$1,100 in LICs and US$2,500 in OLIDCs for the period 2018-2030. We arrive at this number by boosting the current 2018 per capita GNI levels, US$694 in LICs and US$1,849 in OLIDCs, by an assumed rate of economic growth of 7 percent for LICs and 5 percent for the OLIDCs during 2018-2030. We then calculate the average annual income for the period 2018-2030, which yields approximately US$1,100 for LICs and US$2,500 for LIDCs. We then calculate the resulting outlays as a share of GDP, as in Table 5.
TABLE 5. Required SDG Budget Outlays by Category for LICs and OLIDCs
SDG BUDGET CATEGORIES
LIC (US$1,100) OLIDC (US$2,500)
PER CAPITA % GDP PER CAPITA % GDP
Health $110 10% $175 7%
Education $110 10% $175 7%
Infrastructure $110 10% $250 10%
Biodiversity Conservation and Climate Adaption
$10 1% $25 1%
Social Protection $55 5% $100 4%
14
CLOSING THE SDG BUDGET GAP
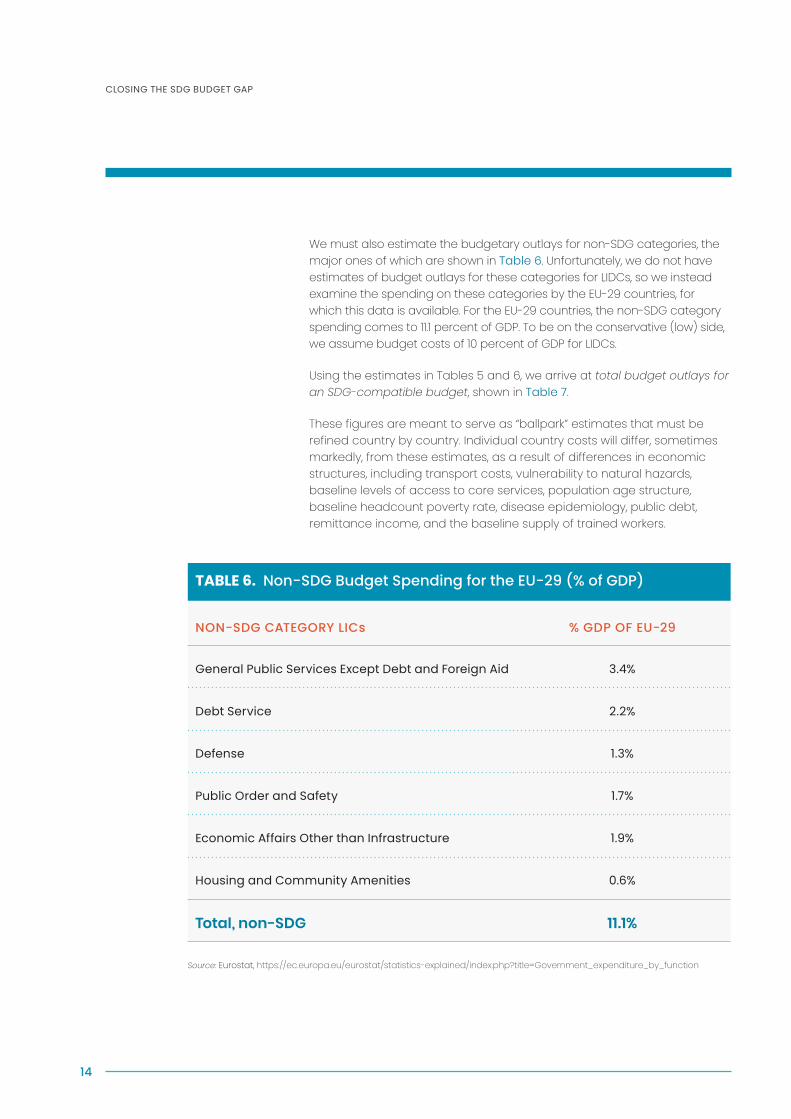
We must also estimate the budgetary outlays for non-SDG categories, the major ones of which are shown in Table 6. Unfortunately, we do not have estimates of budget outlays for these categories for LIDCs, so we instead examine the spending on these categories by the EU-29 countries, for which this data is available. For the EU-29 countries, the non-SDG category spending comes to 11.1 percent of GDP. To be on the conservative (low) side, we assume budget costs of 10 percent of GDP for LIDCs.
Using the estimates in Tables 5 and 6, we arrive at total budget outlays for an SDG-compatible budget, shown in Table 7.
These figures are meant to serve as “ballpark” estimates that must be refined country by country. Individual country costs will differ, sometimes markedly, from these estimates, as a result of differences in economic structures, including transport costs, vulnerability to natural hazards, baseline levels of access to core services, population age structure, baseline headcount poverty rate, disease epidemiology, public debt, remittance income, and the baseline supply of trained workers.
TABLE 6. Non-SDG Budget Spending for the EU-29 (% of GDP)
NON-SDG CATEGORY LICs % GDP OF EU-29
General Public Services Except Debt and Foreign Aid 3.4%
Debt Service 2.2%
Defense 1.3%
Public Order and Safety 1.7%
Economic Affairs Other than Infrastructure 1.9%
Housing and Community Amenities 0.6%
Total, non-SDG 11.1%
Source: Eurostat, https://ec.europa.eu/eurostat/statistics-explained/index.php?title=Government_expenditure_by_function
15
4. Calculating SDG Budget Needs for LIDCs
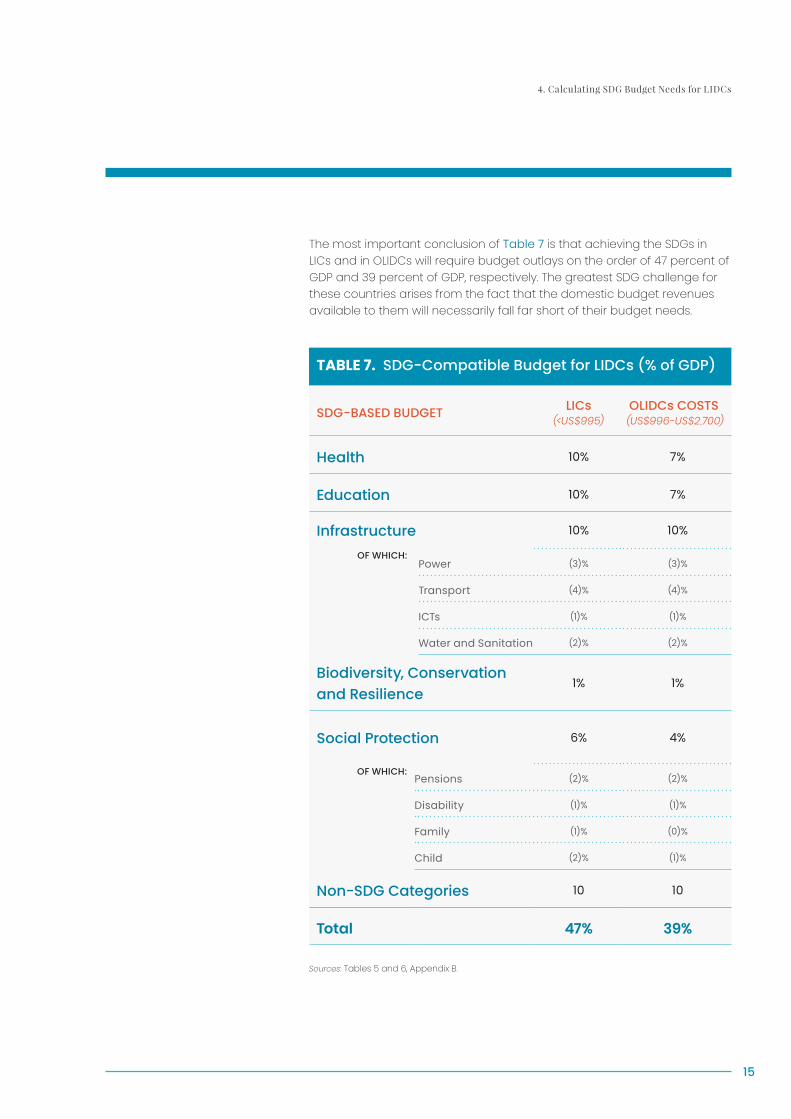
The most important conclusion of Table 7 is that achieving the SDGs in LICs and in OLIDCs will require budget outlays on the order of 47 percent of GDP and 39 percent of GDP, respectively. The greatest SDG challenge for these countries arises from the fact that the domestic budget revenues available to them will necessarily fall far short of their budget needs.
Sources: Tables 5 and 6, Appendix B.
TABLE 7. SDG-Compatible Budget for LIDCs (% of GDP)
SDG-BASED BUDGET LICs(<US$995)
OLIDCs COSTS (US$996-US$2,700)
Health 10% 7%
Education 10% 7%
Infrastructure 10% 10%
OF WHICH:Power (3)% (3)%
Transport (4)% (4)%
ICTs (1)% (1)%
Water and Sanitation (2)% (2)%
Biodiversity, Conservation and Resilience
1% 1%
Social Protection 6% 4%
OF WHICH:Pensions (2)% (2)%
Disability (1)% (1)%
Family (1)% (0)%
Child (2)% (1)%
Non-SDG Categories 10 10
Total 47% 39%
16
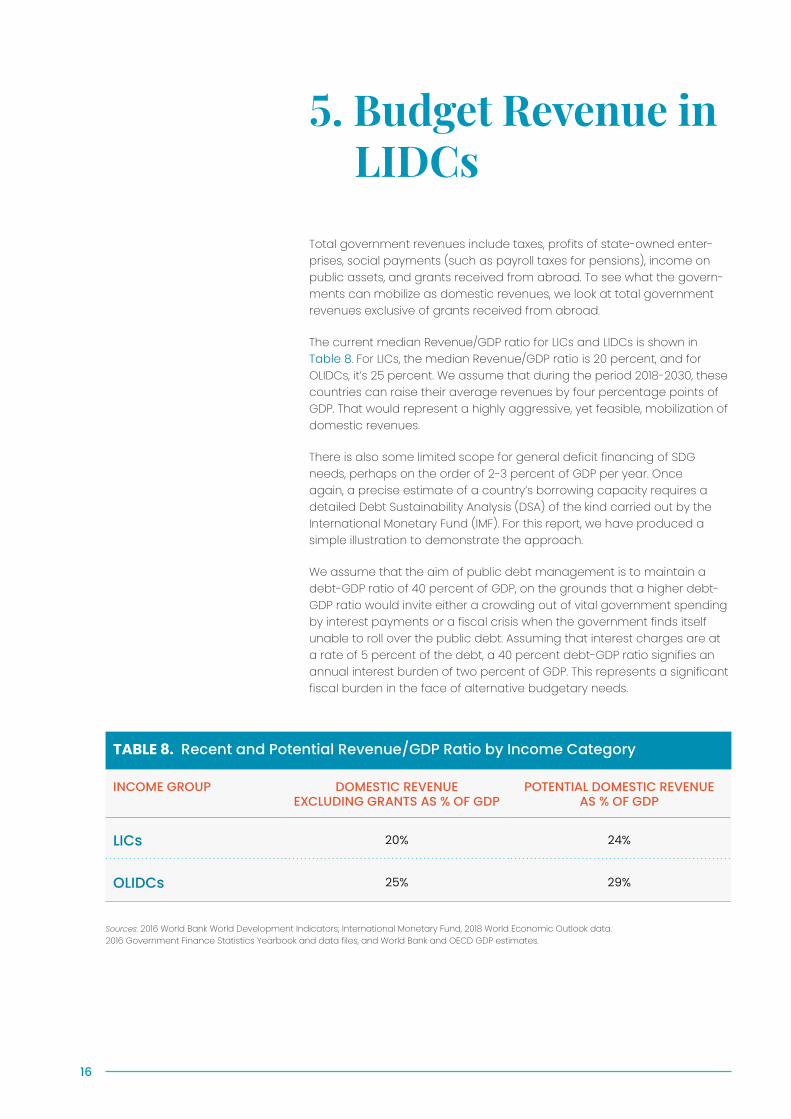
Total government revenues include taxes, profits of state-owned enter-prises, social payments (such as payroll taxes for pensions), income on public assets, and grants received from abroad. To see what the govern-ments can mobilize as domestic revenues, we look at total government revenues exclusive of grants received from abroad.
The current median Revenue/GDP ratio for LICs and LIDCs is shown in Table 8. For LICs, the median Revenue/GDP ratio is 20 percent, and for OLIDCs, it’s 25 percent. We assume that during the period 2018-2030, these countries can raise their average revenues by four percentage points of GDP. That would represent a highly aggressive, yet feasible, mobilization of domestic revenues.
There is also some limited scope for general deficit financing of SDG needs, perhaps on the order of 2-3 percent of GDP per year. Once again, a precise estimate of a country’s borrowing capacity requires a detailed Debt Sustainability Analysis (DSA) of the kind carried out by the International Monetary Fund (IMF). For this report, we have produced a simple illustration to demonstrate the approach.
We assume that the aim of public debt management is to maintain a debt-GDP ratio of 40 percent of GDP, on the grounds that a higher debt-GDP ratio would invite either a crowding out of vital government spending by interest payments or a fiscal crisis when the government finds itself unable to roll over the public debt. Assuming that interest charges are at a rate of 5 percent of the debt, a 40 percent debt-GDP ratio signifies an annual interest burden of two percent of GDP. This represents a significant fiscal burden in the face of alternative budgetary needs.
5. Budget Revenue in LIDCs
TABLE 8. Recent and Potential Revenue/GDP Ratio by Income Category
INCOME GROUP DOMESTIC REVENUE EXCLUDING GRANTS AS % OF GDP
POTENTIAL DOMESTIC REVENUE AS % OF GDP
LICs 20% 24%
OLIDCs 25% 29%
Sources: 2016 World Bank World Development Indicators; International Monetary Fund, 2018 World Economic Outlook data. 2016 Government Finance Statistics Yearbook and data files, and World Bank and OECD GDP estimates.
17
5. Budget Revenue in LIDCs
Assuming a stable debt-GDP ratio of 40 percent, the amount of permissible borrowing is determined by the growth rate of the economy. Let g signify the annual growth rate of GDP, with ∆GDP/GDP = g. Debt (D) can grow at the same rate so as to maintain D/GDP = 40 percent. In that case, ∆Debt/Debt = g. Therefore, we find that permissible borrowing, given as ∆Debt/GDP, equals (∆Debt/Debt) x (Debt/GDP) = g x 40 percent. We can then directly calculate the permissible borrowing per year as a share of GDP.
Specifically, we assume that the LICs will grow at the rate of 7 percent per annum, so that the permissible borrowing would be on the order of 2.8 percent of GDP each year (= 7 percent x 40 percent). We round this up to 3 percent per year in permissible borrowing as a share of GDP. We assume that the OLIDCs will grow on the order of 5 percent per year, so that the permissible borrowing per year would be on the order of 2 percent of GDP. We note that in addition to general government borrowing, there may be additional project financing of infrastructure projects that produce future revenue streams for direction towards debt servicing.
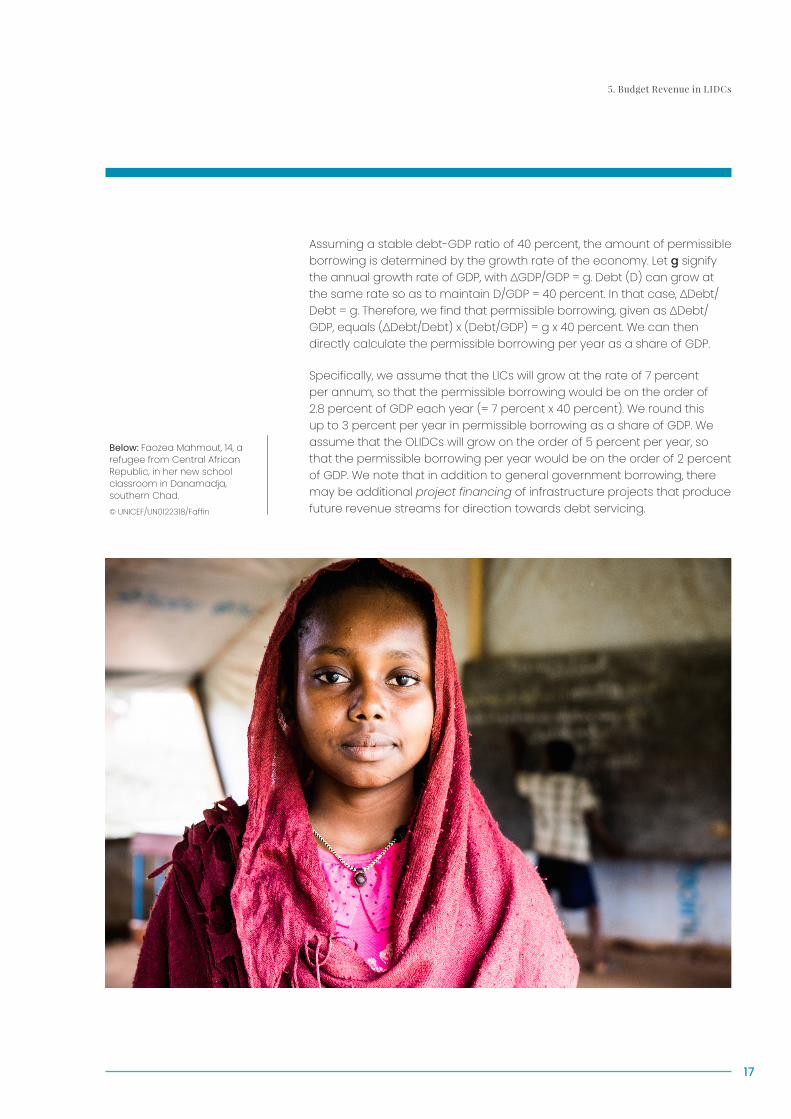
Below: Faozea Mahmout, 14, a refugee from Central African Republic, in her new school classroom in Danamadja, southern Chad.© UNICEF/UN0122318/Faffin
18
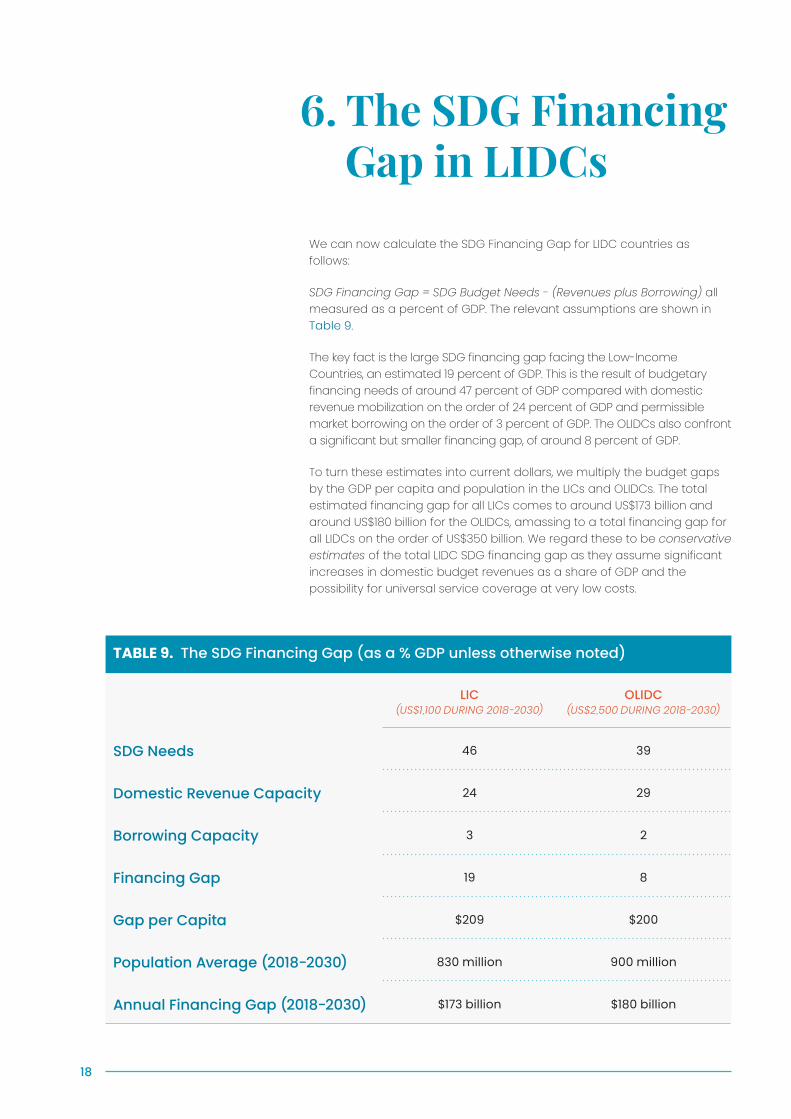
We can now calculate the SDG Financing Gap for LIDC countries as follows:
SDG Financing Gap = SDG Budget Needs - (Revenues plus Borrowing) all measured as a percent of GDP. The relevant assumptions are shown in Table 9.
The key fact is the large SDG financing gap facing the Low-Income Countries, an estimated 19 percent of GDP. This is the result of budgetary financing needs of around 47 percent of GDP compared with domestic revenue mobilization on the order of 24 percent of GDP and permissible market borrowing on the order of 3 percent of GDP. The OLIDCs also confront a significant but smaller financing gap, of around 8 percent of GDP.
To turn these estimates into current dollars, we multiply the budget gaps by the GDP per capita and population in the LICs and OLIDCs. The total estimated financing gap for all LICs comes to around US$173 billion and around US$180 billion for the OLIDCs, amassing to a total financing gap for all LIDCs on the order of US$350 billion. We regard these to be conservative estimates of the total LIDC SDG financing gap as they assume significant increases in domestic budget revenues as a share of GDP and the possibility for universal service coverage at very low costs.
TABLE 9. The SDG Financing Gap (as a % GDP unless otherwise noted)
LIC(US$1,100 DURING 2018-2030)
OLIDC(US$2,500 DURING 2018-2030)
SDG Needs 46 39
Domestic Revenue Capacity 24 29
Borrowing Capacity 3 2
Financing Gap 19 8
Gap per Capita $209 $200
Population Average (2018-2030) 830 million 900 million
Annual Financing Gap (2018-2030) $173 billion $180 billion
6. The SDG Financing Gap in LIDCs
19
We have assumed that LICs can raise up to 24 percent of GDP in domestic budget revenues, and that OLIDCs can raise up to 29 percent of GDP. However, lower income countries have the capacity to generate significantly more from taxes than the current rate in order to fund and accelerate their SDG progress (IMF, 2016).
There are several ways that LIC and OLIDC countries can increase their domestic tax revenues even before raising tax rates or expanding their tax bases. Governments stand to mobilize hundreds of billions of dollars by addressing key failures in tax policy implementation and enforcement both domestically and at a global scale.
Over the last few decades, data show diminishing tax contributions from multinational companies. This is the result of governments’ “race to the bottom” corporate tax strategies designed to attract new investments. As an illustration, global corporate tax rates have fallen from an average of 27.5 percent twelve years ago to 22.9 percent in 2017 (Tax Foundation, 2017). These decreases come as the net profits of the world’s top ten corporations have more than tripled in real terms, generating profits larger than the combined domestic revenues of 180 of the world’s poorest countries (McKinsey 2015, Global Justice Now 2015). The downward pressure on corporate tax rates and collection is out of step with the scale of these companies’ profits and a product of evasive practices like profit-shifting and use of tax havens.
Profit-shifting is the process by which multinational companies move profits from their subsidiaries in higher-tax countries, where a dominant proportion of their economic activity takes place, to subsidiaries in low-tax “havens” (UN, 2013). Profit-shifting through creative accounting and transfer pricing with affiliated firms costs host countries upwards of an estimated US$500 billion per year worldwide. These losses are more pronounced for LICs and OLIDCs as a proportion of tax revenues (Cobham et al, 2017).
Losses from tax evasion in the extractive sector are particularly notable. Countries rich in oil, gas and minerals often fail to capture a fair share of their natural resource wealth. Reliable data is scarce on the scale of potential revenue loss from extractive sector tax evasion, though the estimates suggest that the lost taxes are many billions of dollars per year (PWYP, 2011). Revenue losses to governments from this sector occur through three main paths: 1) under-reporting of project revenues; 2) over-reporting of project costs; and 3) shifting profits through transfer pricing. Addressing these evasive practices requires strengthened tax administration and infrastructure as well as oversight, increased transparency and international cooperation to reduce access to tax shelters.
In an effort to help countries increase compliance and improve tax administration, the Addis Tax Initiative was launched in 2015 at the Financing for Development 3 Conference. This initiative aims to build local
...lower income countries have the capacity to generate significantly more from taxes than the current rate in order to fund and accelerate their SDG progress...
“
7. Increased Domestic Revenues
20
CLOSING THE SDG BUDGET GAP
capacity to implement relevant reforms, improve domestic governance to enforce them, and catalyze greater political will to pass them. The initiative was launched in recognition that domestic budget revenue mobilization is a critical pillar for development financing and one with which LICS and OLIDCs face particular challenges.
DAC donor countries have shown particular interest in supporting domestic budget revenue (DBR) programs due to compelling evidence that DBR assistance can yield returns on their funding equal to many multiples of their initial investments. In fact, sustained DBR financial support, when coupled with relevant political commitments, has reportedly resulted in revenue gains of more than US$20 for every US$1 initially invested (USAID, 2015). The increased revenues that improved tax collections have generated have been used to fund essential SDG advancements, including child vaccinations, literacy programs and hunger interventions.
Several international initiatives have been launched to assist LICs and OLIDCs in improving their tax collections, including the Standard for Automatic Exchange of Financial Account Information in Tax Matters (AEOI); the UN Tax Committee; and the Base Erosion and Profit Shifting (BEPS) program of the OECD. Several OECD initiatives have been directly focused on the extractive industries in particular. These initiatives create new opportunities for the enhanced participation of developing countries in international tax policy discussions and institutions. Furthermore, the IMF, OECD, UN and World Bank have joined together in a collective effort known as the Platform for Collaboration on Tax in order to better support governments in addressing the tax challenges they face.
Rarely popular, the passage and implementation of reforms to increase tax revenues are dependent on substantial political will, middle-to-long-term planning horizons, and especially on international cooperation to cut illicit flows and tax evasion. We should not underestimate the extent to which the richest countries facilitate the tax evasion by powerful multinational companies operating in the world’s poorest countries. Nevertheless, improving a country’s ability to collect domestic taxes and spend those resources effectively will be crucial for SDG financing and for long-term equitable and sustainable growth.
...Rarely popular, the passage and implementation of reforms to increase tax revenues are dependent on substantial political will...
“
21
Even after very significant increases in domestic revenues, the LIDCs SDG Financing Gap will still be on the order of US$300-400 billion per year. There are currently four Business-as-Usual (BAU) approaches to this financing gap: ignore it; privatize it; borrow; or await a technology miracle. All four BAU approaches are bound to fail. We must instead turn to three realistic options: increased Official Development Assistance for the SDGs; earmarked Taxation directed towards the SDGs; and increased Private Development Assistance for the SDGs.
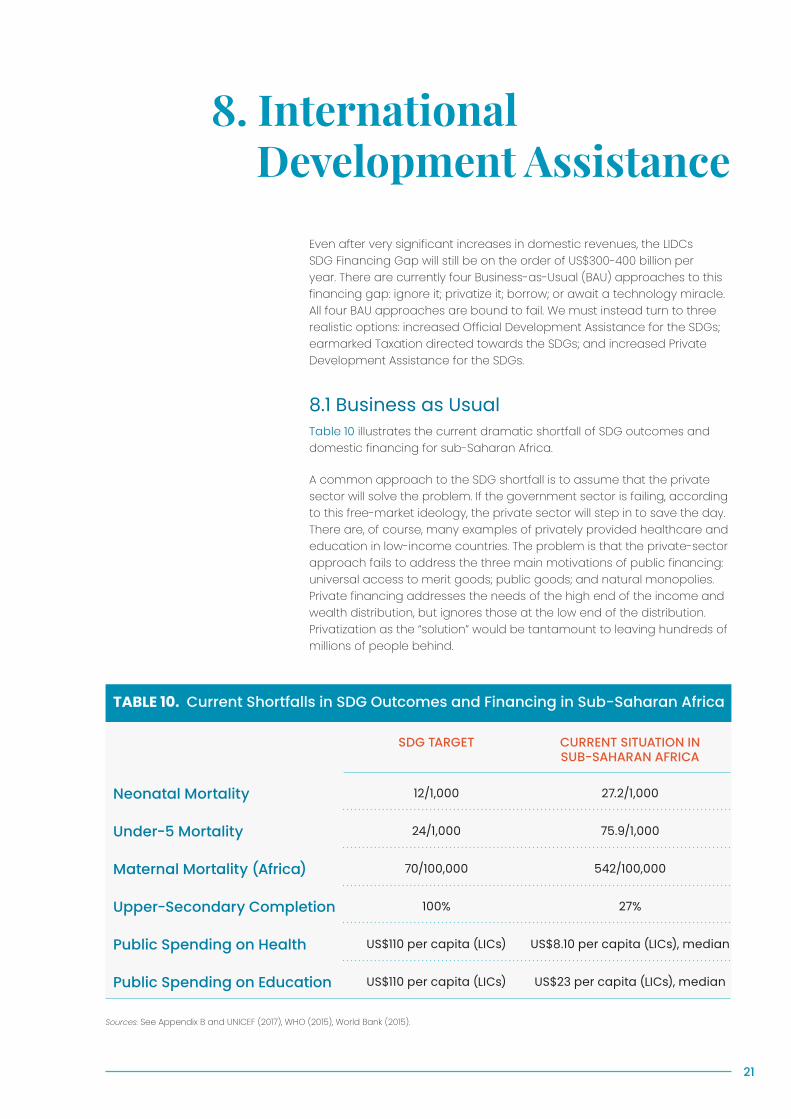
8.1 Business as UsualTable 10 illustrates the current dramatic shortfall of SDG outcomes and domestic financing for sub-Saharan Africa.
A common approach to the SDG shortfall is to assume that the private sector will solve the problem. If the government sector is failing, according to this free-market ideology, the private sector will step in to save the day. There are, of course, many examples of privately provided healthcare and education in low-income countries. The problem is that the private-sector approach fails to address the three main motivations of public financing: universal access to merit goods; public goods; and natural monopolies. Private financing addresses the needs of the high end of the income and wealth distribution, but ignores those at the low end of the distribution. Privatization as the “solution” would be tantamount to leaving hundreds of millions of people behind.
8. International Development Assistance
TABLE 10. Current Shortfalls in SDG Outcomes and Financing in Sub-Saharan Africa
SDG TARGET CURRENT SITUATION IN SUB-SAHARAN AFRICA
Neonatal Mortality 12/1,000 27.2/1,000
Under-5 Mortality 24/1,000 75.9/1,000
Maternal Mortality (Africa) 70/100,000 542/100,000
Upper-Secondary Completion 100% 27%
Public Spending on Health US$110 per capita (LICs) US$8.10 per capita (LICs), median
Public Spending on Education US$110 per capita (LICs) US$23 per capita (LICs), median
Sources: See Appendix B and UNICEF (2017), WHO (2015), World Bank (2015).

22
CLOSING THE SDG BUDGET GAP
Another purported solution to the SDG financing gap is private capital: governments will borrow their way to SDG financing. There are many policy proposals to expand the level of borrowing by LIDCs. Initiatives such as the Belt and Road Initiative, to build infrastructure in low-income Africa and Asia, have so far relied heavily on debt financing. Proposals such as the International Financing Facility for Education (IFFed) similarly seek to tap the lending capacity of the multilateral development banks. Our warning is this: such approaches threaten to stoke the next developing-country debt crisis. There are already signs of debt distress among LIDCs, as pointed out by the IMF’s recent macroeconomic report (IMF, 2018). Several African and Asian governments have similarly expressed their alarm at rapidly growing debt/GDP ratios.
Yet another purported solution is cost-saving through new technologies. The digital revolution will indeed offer low-cost solutions for many SDGs. Yet the cost estimates that we have used in this paper, e.g. that quality healthcare and education can each be provided for around US$100 per capita of budget outlays, already assumes the deployment of low-cost ICT-based solutions. We are skeptical that technology miracles will lower the costs of high-quality service provision below the very low-cost estimates we have already adopted.
8.2 New Approaches to SDG FinancingFor these reasons, we must turn to more realistic approaches to close the SDG financing gap. We identify three ways forward.
8.2.1 Increased and Better Targeted ODAOfficial Development Assistance (ODA) currently totals around US$146 billion per year to recipient countries, but only a small fraction of that helps to meet the SDG financing needs of LICs and OLIDCs. As a rough estimate, only around US$37.5 billion of the overall ODA was directed towards LIDCs in 2016 (OECD, 2016), with the remainder going to Other Middle-Income Countries with incomes above US$2,700 per capita as well as to domestic outlays in the donor countries themselves (e.g. for refugees, tuitions of visiting students, administrative expenses, and others).
Of the assistance directed to LICs and OLIDCs, only a part of that is currently directed towards SDG budget needs, with the rest allocated to other purposes (disaster relief, war reconstruction, public administration, NGO activities other than SDGs, etc.).
The first order of business, therefore, is a thorough redirection of existing ODA flows towards LIDCs and away from outlays in the donor countries or ODA for politically influential but less needy higher-income countries. We believe that the donor countries could improve ODA quality sufficiently to

23
8. International Development Assistance
achieve at least an incremental US$40 billion per year of the current ODA flows that are truly directed towards the SDGs in LIDCs.
The need for increased ODA is also urgent and realistic. As we see in Figure 1, only five of the DAC countries (the UK, Denmark, Norway, Luxembourg, and Sweden) currently achieves the 0.7 percent of GNI target for ODA. For the DAC donors as a whole, a rise in ODA from 0.32 percent of GNI to the target of 0.70 percent of GNI would raise an additional US$175 billion per year in ODA, most of which could be directed towards the SDG financing gap. The United States, while being the largest donor in absolute terms, at US$31 billion, is one of the lowest as a share of GNI, just 0.17 percent. If the US alone were to meet the 0.7 percent standard, US and overall ODA would rise by another US$100 billion per year!
We should also recognize the existing ODA and potentially increased ODA coming from new donor countries, both HICs that are not part of the DAC and Upper-Middle Income Countries such as China. One of the limitations on
FIGURE 1. ODA as Share of Donor Gross National Income
UN
Target 0.7%
0% 0.2% 0.4% 0.6% 0.8% 1%Hungary
Slovak RepublicPoland
Czech RepublicKorea
GreeceSloveniaPortugal
United StatesSpain
AustraliaJapan
New ZealandCanadaIcelandItaly
IrelandAustria
DAC TotalFinlandFrance
BelgiumSwitzerlandNetherlands
GermanyUnited Kingdom
DenmarkNorway
LuxembourgSweden
0.110.12
0.130.13
0.140.15
0.160.17
0.180.19
0.220.22
0.230.26
0.280.290.29
0.300.31
0.410.43
0.450.45
0.600.65
0.690.72
0.990.99
1.01
Source: OECD, 2018. DAC Statistics.Percent of GNI

24
CLOSING THE SDG BUDGET GAP
this additional ODA to date is that it is mostly in the form of loans rather than grants, meaning that it is already threatening to unleash a new debt crisis in many of LICs. Therefore, as we mobilize additional ODA from new donors, the emphasis should be on grant assistance directed towards the SDGs in LIDCs.
8.2.2 New ODA by Earmarking New Taxes for the SDGsThe UN member states should also adopt several new forms of taxation in a coordinated manner to mobilize additional SDG financing and to address other urgent SDG-related needs. These new forms of taxation, if earmarked in part towards increased ODA for the SDGs, would improve global resource allocation, bolster economic fairness, and help to close the SDG financing gap for LIDCs.
Carbon TaxA fitting example of an SDG-fit tax policy would be a worldwide implementation of a carbon tax. A globally coordinated carbon tax would be effective both in raising revenues for new programs for the SDGs, and in reducing CO2 emissions.
According to the World Bank’s Carbon Pricing Dashboard, carbon pricing initiatives currently cover 45 national jurisdictions and 25 subnational jurisdictions, representing 20 percent of global GHG emissions. These will generate a projected US$82 billion in revenue in 2018 (World Bank, 2017). Yet much more could be done.
The annual emissions of HICs currently stand at around 40 percent of the world’s emission, or roughly 14 billion tons of CO2 per year. At a rate of taxation of just US$10 per ton (far below the estimated Social Cost of Carbon of at least US$40 per ton CO2), revenues collected in the HICs would amount to around US$140 billion per year, roughly equal to the current level of all ODA flows of the DAC countries. In other words, a modest carbon levy imposed on HICs could double ODA, and more than double the ODA directed towards the SDGs.
Financial Transactions TaxFinancial markets around the world trade hundreds of billions of dollars in stocks and bonds—collectively referred to as securities— on a typical business day. A Financial Transaction Tax (FTT) would impose a levy on the purchase of securities and on transactions involving derivatives.
Many prominent economies have considered such a tax, and some have already implemented one, like Brazil, India, and South Africa. The G20 failed to pass a FTT tax in 2011. However, the EU is reportedly restarting negotiations for a potential FTT within the EU (Kirwin, 2018).
25
8. International Development Assistance
In the United States, a one-basis-point transaction tax (0.01 percent) would raise US$185 billion over 10 years, according to estimates by the Tax Policy Center. For reference, such a transaction tax would cost a stock trader a dime on the trade of US$1,000 worth of stock. A US$100,000 trade would incur a tax of US$10.
The financial transaction tax would be highly progressive. According to the Tax Policy Center, for a FTT in the US, 75 percent of the liability from the tax would fall on the top fifth of taxpayers, and 40 percent on the top 1 percent. The same report finds that a relatively broad-based FTT in the United States, at a base rate of 0.34 percent, could raise a maximum of about 0.4 percent of GDP (US$75 billion in 2017) (Burman et al., 2016). The Congressional Budget Office (2016) finds a 0.10 percent tax would increase revenues by US$707 billion from 2017 through 2026, according to estimates by the staff of the Joint Committee on Taxation.
Additionally, a financial transaction tax could significantly reduce the amount of high-frequency trading. This trading, most of it automated, is used to make windfall profits through arbitrage in milliseconds. It does nothing to help ordinary investors and can destabilize financial markets (Bernstein, 2015).
Offshore Accounts TaxIt is estimated that tax havens are home to US$20 trillion or more in offshore deposits. If loopholes in the global corporate-tax system were closed, global corporate taxation could be boosted by some US$240 billion annually (OECD, 2014b). The corrosive effects of the world’s tax havens are increasingly understood: tax evasion, capital flight, mass illegality (trafficking in drugs, arms, people), and a massive loss of vital tax revenues in the developing nations.
The world needs decisive, corrective action on this front. The long-term goal should be to close the tax and secrecy havens. As a stop-gap “fourth-best” solution, the world could agree on taxing offshore accounts at a modest rate, for instance 1 percent per annum. This would partly compensate for the global tax evasion, and could if properly implemented steer some US$100-200 billion per year towards the SDGs.
High-Net Worth TaxationWe have already described the goal of holding the world’s billionaires accountable for SDG financing equal to at least one percent per annum of their net worth. We encourage these funds to be given philanthropically, with the interest and engagement of the billionaires. But the Move Humanity Initiative believes that if billionaires fail to give philanthropically, then they should be taxed by their respective national authorities in order to collect urgently needed, life-saving revenues. Moreover, such an
26
CLOSING THE SDG BUDGET GAP
SDG tax should be introduced in a coordinated manner across the world, so that billionaires are not able merely to shift their legal residence or balances in order to evade responsibilities.
There are currently 2,208 billionaires with a combined net worth in March 2018 of US$9.1 trillion (Forbes, 2018). With capital gains enjoyed since March 2018, the net worth of the billionaires in September 2018 likely tops US$10 tril-lion. A one percent tax on this net worth would therefore collect on the order of US$100 billion per year if successfully levied on all 2,208 billionaires. We might consider collecting even more by reaching a larger base. As described below, one definition of ultra-high-net worth is US$30 million up to US$1 billion, a category of wealth that includes an estimated 256,000 individuals with a combined net worth of around US$32 trillion (Table 11, below). A one percent wealth tax on ultra-high-net worth individuals would therefore raise on the order of US$320 billion per year, assuming no change in the ultra-high-net-wealth tax base and full tax compliance.
Other New TaxesWith far less precision at this early stage of analysis, we should also mention three other potential areas of taxation. The first is a new Tech Tax on the technology giants (Alphabet, Amazon, Facebook, Microsoft, and others) so that they share with the general public more of the winner-take-all monopoly profits they are enjoying. The European Union is currently exploring the feasibility of such a new range of tech taxes. A second possibility would be a range of luxury taxes on yachts, mansions, luxury automobiles, luxury watches, and other forms of “conspicuous consumption,” or at least ultra-luxury consumption. A third possibility would be a new round of “sumptuary taxes” on harmful and addictive substances and behaviors, including tobacco, sugar additives, gambling, and the like. Many jurisdictions are well underway in raising taxes on such products, but other than for tobacco there has been little coordinated effort at the global level.
8.2.3 Debt ReliefDebt Relief OperationsThe era of the Millennium Development Goals launched an initiative to relieve the debts of the Heavily Indebted Poor Countries (HIPCs). The HIPC initiative is widely seen to have been successful, both in reducing the overhang of unpayable debt of the poorest countries, and in directing savings on debt servicing towards the MDG priorities. The SDGs similarly have envisaged a role for debt relief operations as part of the SDG architecture, as noted in Target 17.4. As of yet, there is no organized initiative to evaluate current debt capacities relative to the SDGs. During 2019, a high priority should be to examine, on a country-by-country basis among the LIDCs, the potential case for debt relief as a means or
27
8. International Development Assistance
redirecting scarce fiscal resources towards the SDGs. This effort should focus especially on the accumulated debts owed to official creditors such as the multilateral development banks and bilateral donor governments.
8.2.4 Increased PDA Volume and CoordinationOverall, Private Development Assistance has been increasing at a faster rate than Official Development Assistance, with PDA provided by corporations and foundations growing particularly fast. There are no authoritative global measurements of PDA, and data is poor because of low reporting levels, a lack of accountability structures for private donors, and an absence of estab-lished transparency and reporting standards. Based on available data from 143 foundations, an OECD survey found that private foundations provided US$23.9 billion for development from 2013 to 2015, averaging US$7.96 billion per year (OECD, 2018c). Out of this survey sample of foundations, the Gates Foundation’s giving accounted for 49 percent of total giving in support of development worldwide.
According to this survey, the top ten recipients of philanthropic funding were India, Nigeria, Mexico, China, Ethiopia, South Africa, Kenya, Brazil, Tanzania and Turkey. Middle-income countries received 67 percent of country allocable philanthropic funding and least developed countries received just one-third.
Philanthropic flows are still modest in volume compared to ODA, but in key sectors, private foundations are significant players. For example, in the health and reproductive health sectors in 2013-15, foundations’ support was the third-largest source of financing for developing countries, following that of the United States and the Global Fund to Fight AIDS, Tuberculosis and Malaria (OECD, 2018c). Focusing on the health sector alone, private foundations constituted the most significant source of development finance.
A key explanation for the rise in PDA levels is that private wealth is soaring. Between 2003 and 2017, the global number of high-net-worth individuals, defined as those with US$1 million or more in assets, rose from 7.7 million to 21.9 million, and their net wealth skyrocketed from US$28.8 trillion to US$60 trillion, equivalent to over 45 percent of the world’s capital (Wealth-X, 2018).
According to Forbes, there are now a record 2,208 ultra-ultra-high-net-worth individuals (defined as individuals with a net worth of US$1 billion or more) around the world (Forbes, 2018). These individuals possess a collective net worth of US$9.1 trillion, an 18 percent increase over 2017.
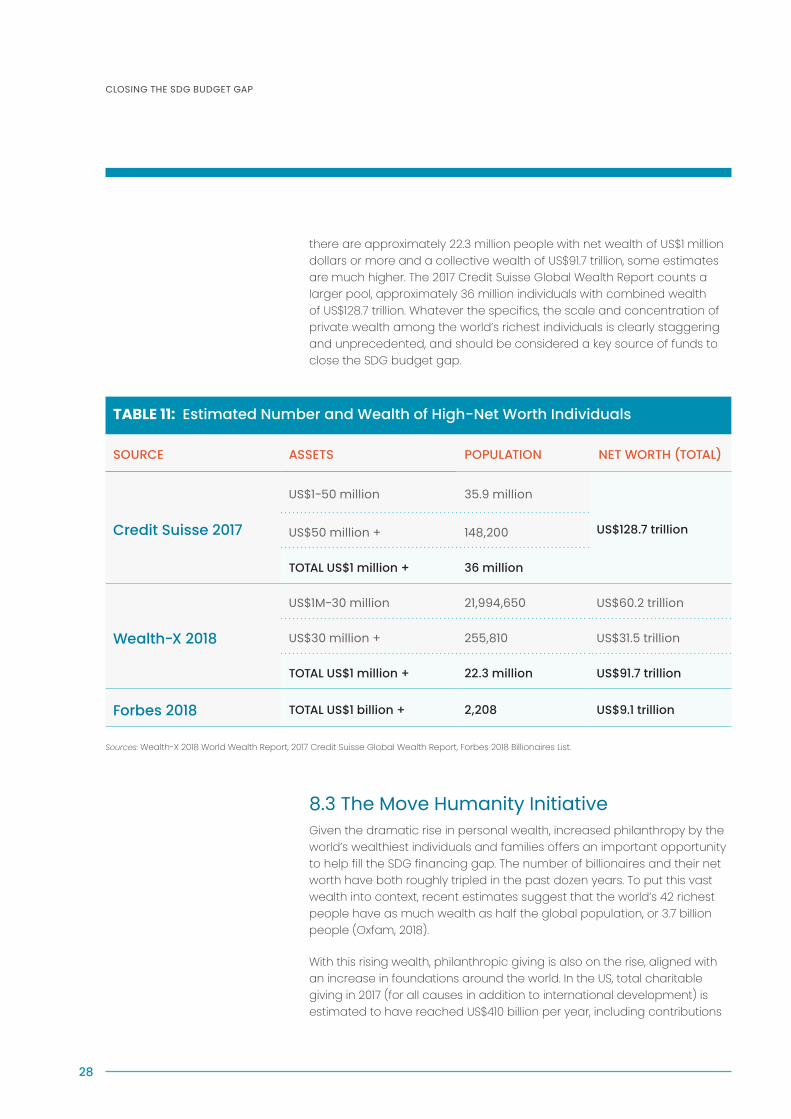
There is a range of estimates for high-net worth individuals’ net wealth. Table 11 summarizes the 2017 estimates from Wealth-X, a wealth-tracking firm, Credit Suisse, and Forbes Magazine. While Wealth-X estimates that
28
CLOSING THE SDG BUDGET GAP
there are approximately 22.3 million people with net wealth of US$1 million dollars or more and a collective wealth of US$91.7 trillion, some estimates are much higher. The 2017 Credit Suisse Global Wealth Report counts a larger pool, approximately 36 million individuals with combined wealth of US$128.7 trillion. Whatever the specifics, the scale and concentration of private wealth among the world’s richest individuals is clearly staggering and unprecedented, and should be considered a key source of funds to close the SDG budget gap.
8.3 The Move Humanity InitiativeGiven the dramatic rise in personal wealth, increased philanthropy by the world’s wealthiest individuals and families offers an important opportunity to help fill the SDG financing gap. The number of billionaires and their net worth have both roughly tripled in the past dozen years. To put this vast wealth into context, recent estimates suggest that the world’s 42 richest people have as much wealth as half the global population, or 3.7 billion people (Oxfam, 2018).
With this rising wealth, philanthropic giving is also on the rise, aligned with an increase in foundations around the world. In the US, total charitable giving in 2017 (for all causes in addition to international development) is estimated to have reached US$410 billion per year, including contributions
TABLE 11: Estimated Number and Wealth of High-Net Worth Individuals
SOURCE ASSETS POPULATION NET WORTH (TOTAL)
Credit Suisse 2017
US$1-50 million 35.9 million
US$128.7 trillionUS$50 million + 148,200
TOTAL US$1 million + 36 million
Wealth-X 2018
US$1M-30 million 21,994,650 US$60.2 trillion
US$30 million + 255,810 US$31.5 trillion
TOTAL US$1 million + 22.3 million US$91.7 trillion
Forbes 2018 TOTAL US$1 billion + 2,208 US$9.1 trillion
Sources: Wealth-X 2018 World Wealth Report, 2017 Credit Suisse Global Wealth Report, Forbes 2018 Billionaires List.
29
8. International Development Assistance
from individuals (US$286 billion), foundations (US$66.9 billion), corporations (US$20.7 billion), and bequests (US$35.7 billion) (Giving USA Foundation, 2018). In China, the number of foundations has grown from fewer than 200 in 2012 to 5,454 in 2016 (UNDP and China Foundation Center, 2017). Philanthropic giving levels are also on the rise in India and Pakistan (OECD, 2018c). Yet, in spite of the proliferation of new actors, philanthropic flows remain highly concentrated, with 81 percent of 2013-2015 totals coming from just 20 foundations (OECD, 2018c).
The largest of these donors is the Bill and Melinda Gates Foundation. Yet even though Bill and Melinda Gates, the greatest philanthropists of our age, have donated several billion dollars each year to fight disease and hunger, their wealth has not been depleted, but rather has continued to soar as the annual returns on their investments outpace their philanthropic giving. In 2010, Gates pledged to give away at least half his wealth and called on other rich individuals to do the same. At that time his net worth was estimated at US$53 billion. Today, after having given away upwards of US$50 billion, his net worth has still risen to an astounding
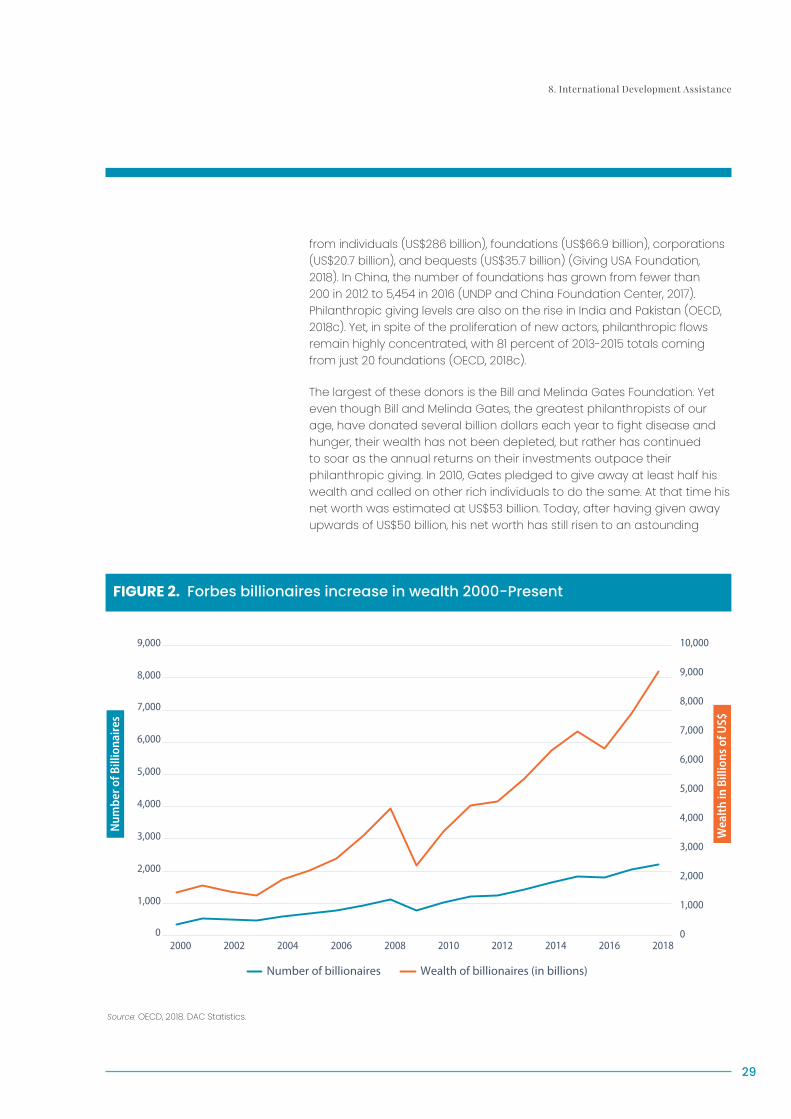
FIGURE 2. Forbes billionaires increase in wealth 2000-Present
0
1,000
2,000
3,000
4,000
5,000
6,000
7,000
8,000
9,000
10,000
0
1,000
2,000
3,000
4,000
5,000
6,000
7,000
8,000
9,000
2000 2002 2004 2006 2008 2010 2012 2014 2016 2018
Wea
lth
in B
illio
ns o
f US$
Num
ber o
f Bill
iona
ires
Number of billionaires Wealth of billionaires (in billions)
Source: OECD, 2018. DAC Statistics.
30
CLOSING THE SDG BUDGET GAP
US$94.8 billion (Forbes, 2018). Similarly, Warren Buffett, another leading philanthropist, has given away around US$46 billion in his lifetime and yet has a 2018 net worth estimated to equal US$84 billion (Forbes, 2018).
A new global movement, Move Humanity, led by the Danish NGO Human Act in partnership with SDSN, proposes to mobilize the wealth of the world’s billionaires by establishing a new global norm: each billionaire should give at least one percent of net worth per year for the SDGs. This should be mobilized either as voluntary philanthropy or through the high-net worth wealth tax, as described earlier. Either way, the SDG-related contributions of the billionaires should be publicly reported in order to ensure accountability for their contributions to the SDGs.
The Move Humanity proposal would raise around US$100 billion per year at the current net worth of the world’s 2,208 billionaires. This is roughly a third of the SDG financing gap of the 59 LIDCs. When combined with increased ODA, the SDG financing gap could be closed.
The Move Humanity proposal builds strongly upon the Gates-Buffett Giving Pledge. In 2010, Bill Gates and Warren Buffett teamed up to call upon ultra-high-net-worth individuals to donate their wealth to charitable causes. Specifically, the Giving Pledge asks each individual to “give the majority of their wealth to philanthropic causes or charitable organizations either during their lifetime or in their will” (The Giving Pledge, 2018).
The Pledge currently has 184 signatories. About 150 of these are billionaires according to the Foundation Center, and therefore the total represents a bit under 7 percent of the 2,208 billionaires identified by Forbes Magazine. The Giving Pledge, although a very worthy cause, has not yet been successful in mobilizing most of the world’s billionaires. Furthermore, for those who have made the pledge, signatories are under no legal obligation to donate any money currently, nor is there any attempt to date to steer the philanthropy towards the SDGs. There have been accusations in the press that Giving Pledge signatories have allocated funds towards family trusts rather than to charitable causes. Moreover, there is no requirement for reporting or accountability of their actual giving. With no reporting mechanism, there is also no way to monitor the impact of the Giving Pledge. Therefore, the general public does not know whether dollars have been donated, where they have gone, or what difference they have made.
The Giving Pledge also does not carry direction or guidance for giving. To optimize the potential impact of this vast wealth, it should be targeted towards the world’s largest and globally agreed challenges, namely the SDGs. These assets should be directed most urgently to end the millions of needless deaths caused by extreme poverty and to help bring quality schooling to the hundreds of millions of children who currently are unable to access a decent education.

31
There are two central areas that need attention for improving the overall efficacy of aid: donor reporting and pooling of resources.
Improving Donor ReportingTransparency and the availability of comparable and reliable data are central to more effective coordination, partnerships and other forms of cross-sector collaboration. The philanthropic sector should be encouraged to share information and help make data a global public good, as it will bring many tangible benefits. In a 2013 survey by the Institute for Philanthropy, donors reported that the greatest benefit of sharing more information about giving was that it “facilitates collaboration.”
Better data and reporting mechanisms can be mutually beneficial to both donors and country recipients and should therefore be in both their common interest. Firstly, they provide essential data and insights for drawing lessons, priority setting and forward planning. Secondly, they offer the assurance that funds are used for agreed purposes, a necessary condition for carrying out sustained cooperation. Thirdly, they supply information on whether a development strategy, program or project is being implemented as planned and is reaching its objectives.
There are currently no mechanisms or large-scale systems in place for monitoring and reporting on philanthropic giving for the SDGs. While there are surveys and reports which attempt to quantify individual PDA for SDGs, none really capture the full picture. For example, the OECD conducted a survey on SDG focused philanthropy, but it only focused on and was able to gather data from a select number of foundations, while individual actors were not included in the mix. Similarly, there are global philanthropy reports such as ‘Giving USA’, which focus on one country alone. Overall, there is an incomplete picture of global giving for the SDGs, especially when it comes to ultra-high-net worth individuals.
Therefore, it is imperative that a framework is put in place that both guides individual donors and foundations on their own monitoring and reporting, while simultaneously providing a platform for them to report into where the data can be aggregated, synthesized and presented as a complete overview. When this information is shared in publications that provide greater contextual understanding, the utility of the grant data rises, and it helps to inform a shared understanding of not only what gets funded, but also why, and how funders adapt based on evidence of what is working or not. Reporting by foundations and individual donors will require a certain level of data standardization at the international level, allowing for comparability with other international standards such as ODA. Accordingly, this must be factored into the design of any new framework.
9. Best Practices for Deploying Increased ODA and PDA
IMPROVING DONOR REPORTING
POOLED-FINANCING MECHANISMS
32
CLOSING THE SDG BUDGET GAP
Pooled-Financing MechanismsPrivate funding should be directed largely towards pooled SDG funds that support national SDG strategies and ensure rigorous monitoring and evalu-ation of all funding. Pooled financing mechanisms have proven to be more effective than fragmented efforts for delivering results at scale. Achieving education, health and climate adaptation outcomes in LICs requires well designed aid programs which embrace innovative models of financing.
Effective pooled financing mechanisms can be a great model for the international community. These global funds focus on some key design features to succeed and be effective.
First, they deploy independent experts to judge the technical soundness of programs and their compliance with best practice. This not only grants technical integrity to the programs, but also removes the influence of politically motivated interventions and corruption. They also provide effective forums for rapid learning and knowledge transfer across coun-tries. Such capacity building and training becomes increasingly effective because it is tied to the prospect of mobilizing the resources to implement programs at scale.
Second, they disburse funds directly to government agencies as well as civil society organizations, or the private sector, allowing for flexible approaches that are highly innovative and disbursement channels which are competitive.
Third, they work closely with business to harness innovation and ensure well-functioning markets, which can in-turn result in rapid cost reductions for major commodities. Instead of having to negotiate with a large number of bilateral provider agencies, private investors deal with one pooled financing mechanism for each sector. This increases competition among private providers and lowers the cost of private blending.
Fourth, they allow for systematic review and independent evaluation of their core operations and major programs by uncovering weaknesses and addressing implementation gaps. This greatly improves the transparency, effectiveness, and results of programs, but also allows for effective knowledge transfer and lessons learned for the future.
Fifth, the financing decisions are made on the basis of clear country-by-country assessments, using per-capita income levels and total national income as guidelines. This data enables the funds to make financing decisions that are fair and effective.
Sixth, they act as global voices and advocates for mobilizing resources at scale and meeting the SDGs. They mobilize political commitments, civil society partners and advocates who in turn lead advocacy for increased funding in their own countries, recipient and provider countries alike.

33
9. Best Practices for Deploying Increased ODA and PDA
Seven, they offer predictable funding over several years. Such predictable funding is critical for the effective programming of resources and public financial expenditure management. The need for medium-term predictability is particularly important in the social sectors where recurrent salaries and other operating expenditures require visibility of available resources so that delivery systems can be strengthened and expanded.
Eight, they co-finance technology transfer, either as part of their program funding or through dedicated financing windows that are adapted to the types of technologies and applications financed by the pooled financing mechanism. Additionally, they have a dedicated financing window to support R&D and the deployment of pre-commercial technologies. These windows support the diffusion of technologies, particularly to LICs.
Global funds and other pooled financing mechanisms have faced unfair criticisms from some members of the international community. Common criticisms include the idea that global funds are simply extra entities that create additional transactions costs. However, the opposite is true with well-designed pooled financing mechanisms. The transaction costs of passing provider resources through a single mechanism are vastly lower than passing funds through dozens of bilateral arrangements. Second, concerns have been expressed that global funds shift the focus away from domestic budget revenues in recipient countries. However, in practice, large pooled financing mechanisms are in fact better placed to promote a reasonable division of domestic and international financing than large numbers of bilateral and multilateral ODA programs would be.
Pooled financing mechanisms are a central component of achieving the SDGs in LICs and LIDCs. The importance of pooled disbursement has been widely recognized by many experts and celebrated in many international forums.
Some notable pooled funds include:
• Global Fund to Fight AIDS, TB, and Malaria (GFATM)
• Global Alliance for Vaccines and Immunizations (GAVI)
• Global Environment Facility (GEF)
• Green Climate Fund (GCF)
• Fund for African Secondary Education (FASE) (under review by the African Union)
• Fund for African Health Delivery (FAHD) (under review by the African Union)
• Caritas Internationalis
• Islamic Development Bank Partnership for the SDGs
34
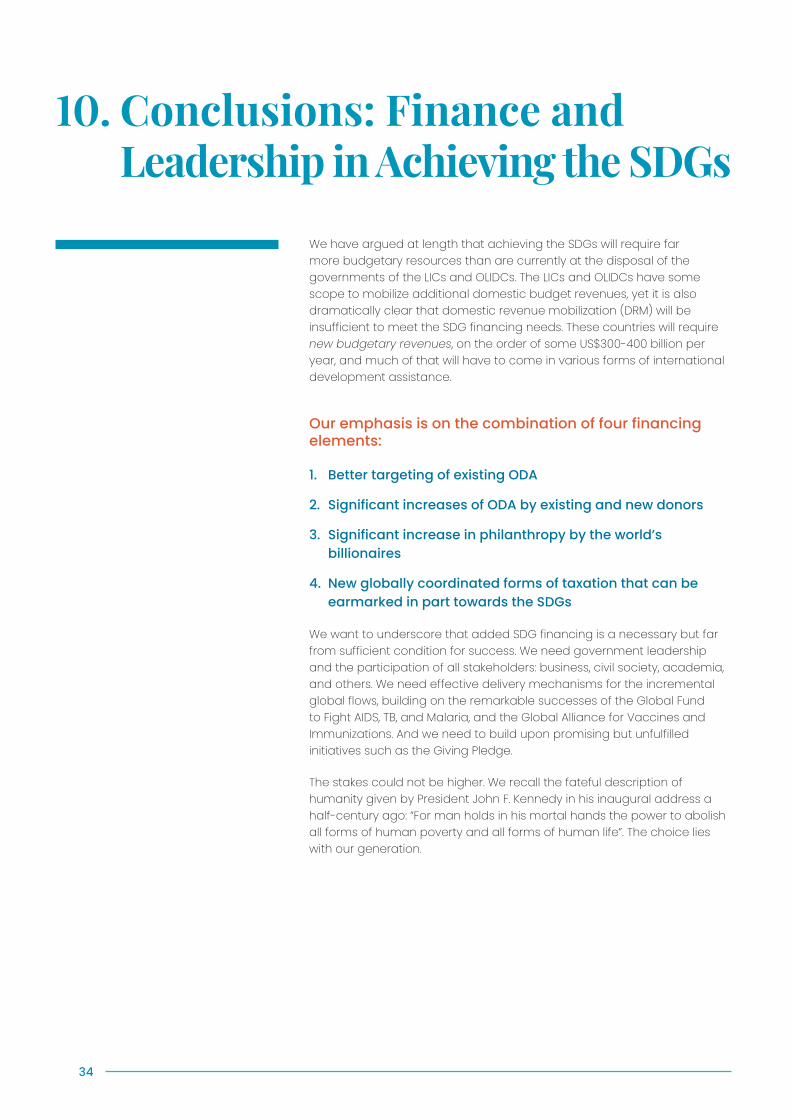
We have argued at length that achieving the SDGs will require far more budgetary resources than are currently at the disposal of the governments of the LICs and OLIDCs. The LICs and OLIDCs have some scope to mobilize additional domestic budget revenues, yet it is also dramatically clear that domestic revenue mobilization (DRM) will be insufficient to meet the SDG financing needs. These countries will require new budgetary revenues, on the order of some US$300-400 billion per year, and much of that will have to come in various forms of international development assistance.
Our emphasis is on the combination of four financing elements:
1. Better targeting of existing ODA
2. Significant increases of ODA by existing and new donors
3. Significant increase in philanthropy by the world’s billionaires
4. New globally coordinated forms of taxation that can be earmarked in part towards the SDGs
We want to underscore that added SDG financing is a necessary but far from sufficient condition for success. We need government leadership and the participation of all stakeholders: business, civil society, academia, and others. We need effective delivery mechanisms for the incremental global flows, building on the remarkable successes of the Global Fund to Fight AIDS, TB, and Malaria, and the Global Alliance for Vaccines and Immunizations. And we need to build upon promising but unfulfilled initiatives such as the Giving Pledge.
The stakes could not be higher. We recall the fateful description of humanity given by President John F. Kennedy in his inaugural address a half-century ago: “For man holds in his mortal hands the power to abolish all forms of human poverty and all forms of human life”. The choice lies with our generation.
10. Conclusions: Finance and Leadership in Achieving the SDGs
35
Alvaredo, Chancel, Piketty, Saez, and Zucman, 2018. World Inequality Report. Publication. Available at: https://wir2018.wid.world/files/download/wir2018-full-report-english.pdf
Alvaredo, Facundo, Anthony B. Atkinson, Thomas Piketty, and Emmanuel Saez, 2013. “The Top 1 percent in International and Historical Perspective.” Journal of Economic Perspectives, 27(3): 3 20.
Benn, Julia, Cecile Sangare, Tomas Hos, 2018. Private Foundations Giving for Development 2013-2015. Ongoing efforts to better reflect private philanthropy giving in OECD-DAC statistics on development finance. OECD Development Co-operation Working Paper 44.
Bernardin, Akitoby, 2018. Raising Revenue: Five country cases illustrate how best to improve tax collection. IMF, Finance & Development Magazine, March 2018, VOL. 55, No. 1.
Brindley, Callum; Meshreky, Andreia; Rosen, James E.; Stover, John; Verboom, Paul; Sanders; Rachel and Agnès Soucat, 2017. Financing transformative health systems towards achievement of the health Sustainable Development Goals: a model for projected resource needs in 67 low-income and middle-income countries. Geneva, Switzerland. Lancet Global Health; 5: e875–87. Published Online July 17, 2017. Available at: http://dx.doi.org/10.1016/ S2214-109X(17)30263-2
Burman, Leonard E., William G. Gale, Sarah Gault, Bryan Kim, Jim Nunns, and Steve Rosenthal, 2016. “Financial transaction taxes in theory and practice.” National Tax Journal 69, No. 1: 171.
Coady, David, Ian WH Parry, Louis Sears, and Baoping Shang, 2015. How large are global energy subsidies? No. 15-105. International Monetary Fund.
Coady, David, Valentina Flamini and Louis Sears, 2015. The Unequal Benefits of Fuel Subsidies Revisited. No. 15-250. International Monetary Fund.
Cobham, A. & Janský, P., 2017. Global distribution of revenue loss from tax avoidance: Re-estimation and country results. WIDER Working Paper 2017/55. Helsinki: UNU-WIDER.
Credit Suisse, 2017. Global Wealth Report 2017. Zurich. Available at: https://www.credit-suisse.com/corporate/en/research/research-institute/global-wealth-report.html
Deloitte, 2018. Corporate Tax Rates 2018. Updated February 2018.
Available at: https://www2.deloitte.com/content/dam/Deloitte/global/Documents/Tax/dttl-tax-corporate-tax-rates.pdf
Development Initiatives, 2015. Private Development Assistance. State of Civil Society Report 2015: Guest Essay. Sarah Henon and Chloe Stirk. London: Development Initiatives.
Era Dabla-Norris & Kalpana Kochhar & Nujin Suphaphiphat & Frantisek Ricka & Evridiki Tsounta, 2015. “Causes and Consequences of Income Inequality; A Global Perspective,” IMF Staff Discussion Notes 15/13, International Monetary Fund.
Forbes, 2018. The World’s Billionaires. Available at: https://www.forbes.com/billionaires/list/
Foundation Center, 2018. Glasspockets, Eye on the Giving Pledge. Available at: http://glasspockets.org/philanthropy-in-focus/eye-on-the-giving-pledge
Giving USA Foundation, 2018. Giving USA 2018: The Annual Report on Philanthropy for the Year 2017, researched and written by the Indiana University Lilly Family School of Philanthropy.
Global Justice Now, 2015. 10 biggest corporations make more money than most countries in the world combined. Available at: https://www.globaljustice.org.uk//sites/default/files/files/resources/corporations_vs_governments_final.pdf
Grady, Heather, 2014. Philanthropy as an Emerging Contributor to Development Cooperation. UNDP. Background Paper for the conference International Development Cooperation: Trends and Emerging Opportunities – Perspectives of the New Actors in Istanbul, June 2014.
International Aid Transparency Initiative, 2018, Official website, www.aidtransparency.net (accessed 4 August 2018).
Bibliography

36
CLOSING THE SDG BUDGET GAP
International Monetary Fund (IMF), 2016. Government Finance Statistics Yearbook and data files, and World Bank and OECD GDP estimates.
International Monetary Fund (IMF), 2018. Macroeconomic Developments and Prospects in Low-Income Developing Countries-2018. IMF Policy Paper. Washington D.C. Available at: https://www.imf.org/en/Publications/Policy-Papers/Issues/2018/03/22/pp021518macroeconomic-developments-and-prospects-in-lidcs
Kirwin, Joe, 2018. EU to Restart Financial Transactions Tax Negotiations. Bloomberg Tax. Available at: https://www.bna.com/eu-restart-financial-n57982091709/
Martinez-Vazquez, Vulovic and Moreno Dodson, 2014. ‘The Impact of Tax and Expenditure Policies on Income Distribution: Evidence from a Large Panel of Countries’. http://scholarworks.gsu.edu/cgi/viewcontent.cgi?article=1036&context=econ_facpub
McCarthy, D., Paul F. Donald, Jörn P.W. Scharlemann, Graeme M. Buchanan, Andrew Balmford, Jonathan M. H. Green, Leon A. Bennun, et al, 2012. Financial Costs of Meeting Global Biodiversity Conservation Targets: Current Spending and Unmet Needs. Science, November 16, 2012.
OECD, 2014a. Development Co-operation Report 2014. Mobilizing Resources for Sustainable Development, Paris.
OECD, 2014b. Report to G20 Development Working Group on the impact on BEPS in Low Income Countries, Pari. Available at: http://www.oecd.org/tax/tax-global/report-to-g20-dwg-on-the-impact-of-beps-in-low-income-countries.pdf
OECD, 2016a. Taking stock of aid to least developed countries (LDCs). Available at: https://www.oecd.org/dac/financing-sustainable-development/Taking-stock-of-aid-to-least-developed-countries.pdf
OECD, 2016b. Development Assistance Committee. Geographical Distribution of Financial Flows to Developing Countries, Development Co-operation Report, and International Development Statistics database. World Bank GNI estimates are used for the denominator. Data available at: www.oecd.org/dac/stats/idsonline
OECD, 2017. Development Co-operation Report 2017: Data for Development (Paris, OECD Publishing, 2017). Available at: http://www.oecd.org/dac/development-co-operation-report-20747721.htm
OECD, 2018a. Official Development Assistance: What is ODA? April 2018. Available at: http://www.oecd.org/dac/stats/What-is-ODA.pdf
OECD, 2018b. DAC Statistics. Available at: http://www.oecd.org/dac/stats/idsonline.htm
OECD, 2018c, Private Philanthropy for Development, The Development Dimension, OECD Publishing, Paris, Available at: https://doi.org/10.1787/9789264085190-en
OECD, 2018d. The Role and Design of Net Wealth Taxes in the OECD, OECD Tax Policy Studies, No. 26, OECD Publishing, Paris, Available at: https://doi.org/10.1787/9789264290303-en
Publish What You Pay (PWYP), 2011. Piping Profits. Norway. Mapping the 6,038 subsidiaries owned by ten of the world’s most powerful Extractive Industry giants and the quest by Latin American journalists to find out more. Written and researched by Nick Mathiason.
Sachs, J.D. and G. Schmidt-Traub, 2017. Global Fund Lessons for Sustainable Development. Science, 7 Apr 2017: Vol. 356, Issue 6333, pp. 32-33. Available at: http://science.sciencemag.org/content/356/6333/32
Schmidt-Traub, G., and J.D. Sachs, 2015. “Financing for Sustainable Development: Implementing the SDGs through Effective Investment Strategies and Partnerships,” SDSN Working Paper, Sustainable Development Solutions Network, Paris and New York. Available at: http://unsdsn.org/wp-content/uploads/2015/04/150408-SDSN-Financing-Sustainable-Development-Paper.pdf
Schmidt-Traub, G., 2015, “Investment Needs to Achieve the Sustainable Development Goals,” SDSN Working Paper, Sustainable Development Solutions Network, Paris. Available at: http://unsdsn.org/wp-content/uploads/2015/09/151112-SDG-Financing-Needs.pdf
37
Bibliography
Tax Foundation, 2018a. Data compiled from numerous sources including: PwC, KPMG, Deloitte, and the U.S. Department of Agriculture. Available at: https://taxfoundation.org/corporate-income-tax-rates-around-the-world-2017/
Tax Foundation, 2018b. Corporate Income Tax Rates around the World, 2017. Data compiled from numerous sources including: PwC, KPMG, Deloitte, and the U.S. Department of Agriculture. No. 559. Washington, D.C.
The Giving Pledge, 2018. About the Pledge. Available at: https://givingpledge.org/
The Global Fund, 2018. Focus On: The Fight Against Malaria. Available at: https://www.theglobalfund.org/media/7491/publication_malaria_focuson_en.pdf
The Philanthropy Workshop, 2013. Towards Greater Transparency in Philanthropy. Available at: www.tpw.org/news/entry/towards_greater_transparency_in_philanthropy_full
UNCTAD, 2014. World Investment Report 2014. Investing in the SDGs: An Action Plan. New York and Geneva.
UNDP and China Foundation Center, 2017. Philanthropy for Sustainable Development in China. Beijing.
UNESCO, 2015. Pricing the right to education: The cost of reaching new targets by 2030. Education for All Global Monitoring Report. Policy Paper 18. Paris, France.
UN General Assembly, Transforming our world: the 2030 Agenda for Sustainable Development, 21 October 2015, A/RES/70/1. Available at: http://www.refworld.org/docid/57b6e3e44.html [accessed 24 July 2018].
United Nations, 1970. ‘Committee for Development Planning: Report on the Sixth Session (5-15 January 1970),’ New York, Economic and Social Council, Official Records: Forty-Ninth Session, Supplement no.7.
United Nations, 2013. Secretariat Report on the Expert Group Meeting on Extractive Industries Taxation. Available at: http://www.un.org/esa/ffd/wp-content/uploads/2014/09/9STM_CRP19_ExtractiveIndustries.pdf
United Nations Environment Programme (UN Environment), 2016. The Adaptation Finance Gap Report. Available at: http://www.unepdtu.org/newsbase/2016/05/uneps-adaptation-finance-gap-report-released?id=377aa3d4-32c1-4100-8bee-ae65390b60000ba
USAID, 2015. Domestic Resource Mobilization- Financing Country-Led Development. Washington, D.C. Available at: https://www.usaid.gov/sites/default/files/documents/1865/120314_E3_Brochure_Trifold_L_singles_JRV3.pdf
Wealth-X, 2018. World Ultra Wealth Report 2018. Lead Authors: White, Vincent; Imberg, Maya; Chesterfield, Winston; Shaban, Maeen.
Williamson, Driver and Kenway, 2014. Beyond Shareholder Value: The reasons and choices for corporate governance reform. London: TUC. Available at: http://www.npi.org.uk/files/3814/0482/3043/Beyond_Shareholder_Value_FINAL.pdf
World Bank; Ecofys, 2017. Carbon Pricing Watch 2017. Washington, DC: World Bank. © World Bank. Available at: https://openknowledge.worldbank.org/handle/10986/26565 License: CC BY 3.0 IGO
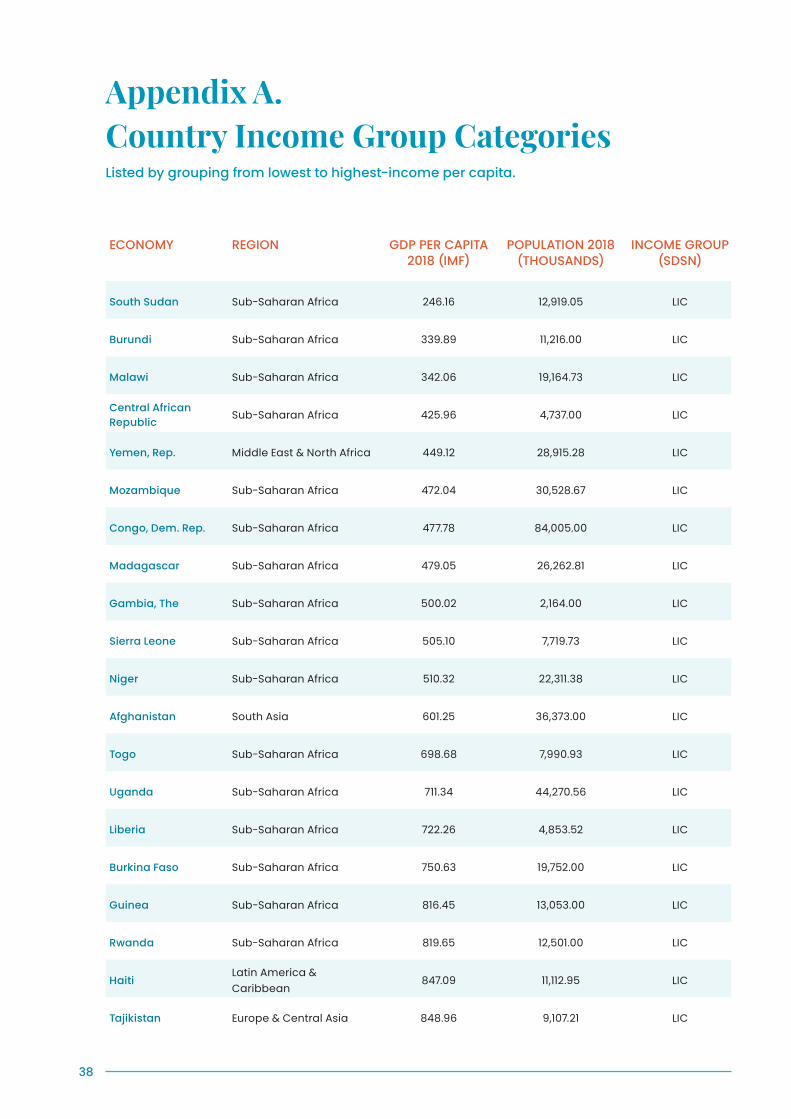
38
ECONOMY REGION GDP PER CAPITA2018 (IMF)
POPULATION 2018(THOUSANDS)
INCOME GROUP(SDSN)
South Sudan Sub-Saharan Africa 246.16 12,919.05 LIC
Burundi Sub-Saharan Africa 339.89 11,216.00 LIC
Malawi Sub-Saharan Africa 342.06 19,164.73 LIC
Central African Republic Sub-Saharan Africa 425.96 4,737.00 LIC
Yemen, Rep. Middle East & North Africa 449.12 28,915.28 LIC
Mozambique Sub-Saharan Africa 472.04 30,528.67 LIC
Congo, Dem. Rep. Sub-Saharan Africa 477.78 84,005.00 LIC
Madagascar Sub-Saharan Africa 479.05 26,262.81 LIC
Gambia, The Sub-Saharan Africa 500.02 2,164.00 LIC
Sierra Leone Sub-Saharan Africa 505.10 7,719.73 LIC
Niger Sub-Saharan Africa 510.32 22,311.38 LIC
Afghanistan South Asia 601.25 36,373.00 LIC
Togo Sub-Saharan Africa 698.68 7,990.93 LIC
Uganda Sub-Saharan Africa 711.34 44,270.56 LIC
Liberia Sub-Saharan Africa 722.26 4,853.52 LIC
Burkina Faso Sub-Saharan Africa 750.63 19,752.00 LIC
Guinea Sub-Saharan Africa 816.45 13,053.00 LIC
Rwanda Sub-Saharan Africa 819.65 12,501.00 LIC
HaitiLatin America & Caribbean
847.09 11,112.95 LIC
Tajikistan Europe & Central Asia 848.96 9,107.21 LIC
Appendix A. Country Income Group CategoriesListed by grouping from lowest to highest-income per capita.
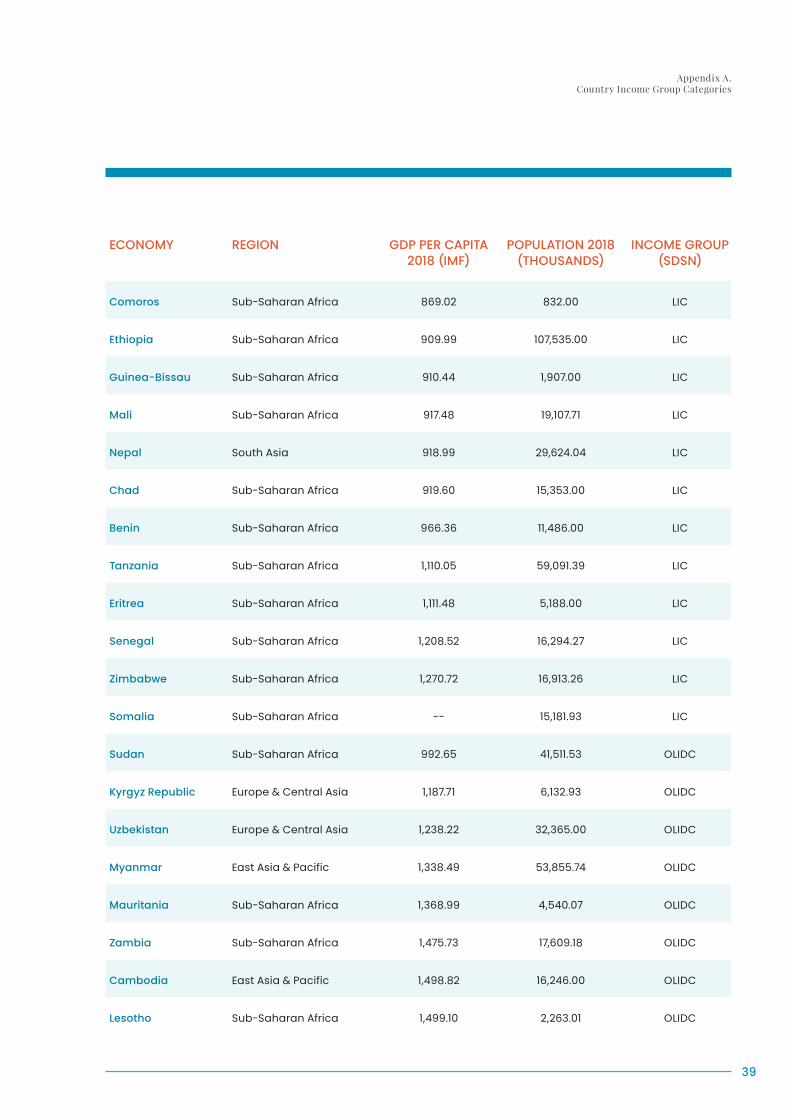
39
Appendix A. Country Income Group Categories
ECONOMY REGION GDP PER CAPITA2018 (IMF)
POPULATION 2018(THOUSANDS)
INCOME GROUP(SDSN)
Comoros Sub-Saharan Africa 869.02 832.00 LIC
Ethiopia Sub-Saharan Africa 909.99 107,535.00 LIC
Guinea-Bissau Sub-Saharan Africa 910.44 1,907.00 LIC
Mali Sub-Saharan Africa 917.48 19,107.71 LIC
Nepal South Asia 918.99 29,624.04 LIC
Chad Sub-Saharan Africa 919.60 15,353.00 LIC
Benin Sub-Saharan Africa 966.36 11,486.00 LIC
Tanzania Sub-Saharan Africa 1,110.05 59,091.39 LIC
Eritrea Sub-Saharan Africa 1,111.48 5,188.00 LIC
Senegal Sub-Saharan Africa 1,208.52 16,294.27 LIC
Zimbabwe Sub-Saharan Africa 1,270.72 16,913.26 LIC
Somalia Sub-Saharan Africa -- 15,181.93 LIC
Sudan Sub-Saharan Africa 992.65 41,511.53 OLIDC
Kyrgyz Republic Europe & Central Asia 1,187.71 6,132.93 OLIDC
Uzbekistan Europe & Central Asia 1,238.22 32,365.00 OLIDC
Myanmar East Asia & Pacific 1,338.49 53,855.74 OLIDC
Mauritania Sub-Saharan Africa 1,368.99 4,540.07 OLIDC
Zambia Sub-Saharan Africa 1,475.73 17,609.18 OLIDC
Cambodia East Asia & Pacific 1,498.82 16,246.00 OLIDC
Lesotho Sub-Saharan Africa 1,499.10 2,263.01 OLIDC
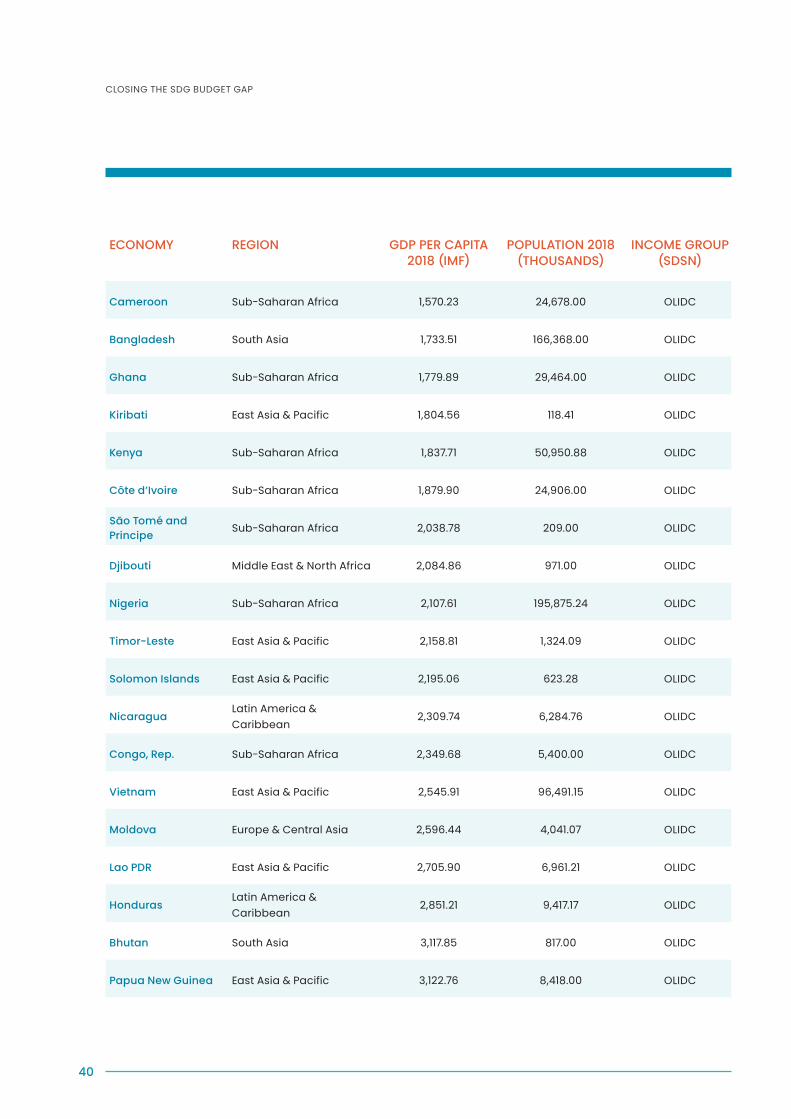
40
CLOSING THE SDG BUDGET GAP
ECONOMY REGION GDP PER CAPITA2018 (IMF)
POPULATION 2018(THOUSANDS)
INCOME GROUP(SDSN)
Cameroon Sub-Saharan Africa 1,570.23 24,678.00 OLIDC
Bangladesh South Asia 1,733.51 166,368.00 OLIDC
Ghana Sub-Saharan Africa 1,779.89 29,464.00 OLIDC
Kiribati East Asia & Pacific 1,804.56 118.41 OLIDC
Kenya Sub-Saharan Africa 1,837.71 50,950.88 OLIDC
Côte d’Ivoire Sub-Saharan Africa 1,879.90 24,906.00 OLIDC
São Tomé and Principe Sub-Saharan Africa 2,038.78 209.00 OLIDC
Djibouti Middle East & North Africa 2,084.86 971.00 OLIDC
Nigeria Sub-Saharan Africa 2,107.61 195,875.24 OLIDC
Timor-Leste East Asia & Pacific 2,158.81 1,324.09 OLIDC
Solomon Islands East Asia & Pacific 2,195.06 623.28 OLIDC
NicaraguaLatin America & Caribbean
2,309.74 6,284.76 OLIDC
Congo, Rep. Sub-Saharan Africa 2,349.68 5,400.00 OLIDC
Vietnam East Asia & Pacific 2,545.91 96,491.15 OLIDC
Moldova Europe & Central Asia 2,596.44 4,041.07 OLIDC
Lao PDR East Asia & Pacific 2,705.90 6,961.21 OLIDC
HondurasLatin America & Caribbean
2,851.21 9,417.17 OLIDC
Bhutan South Asia 3,117.85 817.00 OLIDC
Papua New Guinea East Asia & Pacific 3,122.76 8,418.00 OLIDC

41
Health Costs World Bank, 2015. Domestic general government health expenditure per capita (current $US). Available at: https://data.worldbank.org/indicator/SH.XPD.GHED.PC.CD?locations=NG-GH-KE-ZA-1W Sourced from World Health Organization Global Health Expenditure database. Available at: apps.who.int/nha/database
Watkins, D., J. Qi, and S. Horton, 2017. Costing Universal Health Coverage: the DCP3 Model: DCP3 Working Paper Series. Vol. 20. Working Paper. Available at: http://dcp-3.org/resources/costs-and-affordability-essential-universal-health-coverage-low-and-middle-income
Education Costs United Nations Educational, Scientific and Cultural Organization, 2015. Education for All Global Monitoring Report. Pricing the right to education: The cost of reaching new targets by 2030. Policy Paper 18. Available at: http://unesdoc.unesco.org/images/0023/002321/232197E.pdf
International Commission on Financing Global Education Opportunity, 2016. “The Learning Generation: Investing in Education for a Changing World.” Available at: http://report.educationcommission.org/
Infrastructure Costs
Global Infrastructure Hub, Oxford Economics, 2017. Global Infrastructure Outlook. Infrastructure Investment Needs: 50 Countries, 7 Sectors to 2040. Available at: https://outlook.gihub.org/
Global Infrastructure Hub, Oxford Economics, 2018. Global Infrastructure Outlook. Infrastructure Investment Needs in the Compact with Africa Countries. Available at: https://outlook.gihub.org/
Social Protection Costs
International Labour Office, 2017. Universal Social Protection Floors: Costing Estimates and Affordability in 57 Lower Income Countries/ Isabel Ortiz, Fabio Duran-Valverde, Karuna Pal, Christina Behrendt, Andres Acuna-Ulate. Geneva. (Extension of Social Security Series No. 58). Available at: https://www.ilo.org/secsoc/information-resources/publications-and-tools/Workingpapers/WCMS_614407/lang--en/index.htm
Biodiversity and Environmental Control Costs
United Nations Environment Programme (UNEP), 2016. The Adaptation Finance Gap Report. Available at: http://www.unepdtu.org/newsbase/2016/05/uneps-adaptation-finance-gap-report-released?id=377aa3d4-32c1-4100-8bee-ae65390b60ba
McCarthy, D., Paul F. Donald, Jörn P.W. Scharlemann, Graeme M. Buchanan, Andrew Balmford, Jonathan M. H. Green, Leon A. Bennun, et al. Financial Costs of Meeting Global Biodiversity Conservation Targets: Current Spending and Unmet Needs. Science, November 16, 2012. Available at: http://science.sciencemag.org/content/338/6109/946
Appendix B. Source List for Table 4: Required SDG Budget Outlays

42
Mission StatementMove Humanity aims to mobilize at least 1 percent of the wealth of the world’s billionaires each year on behalf of the SDGs.
About Move HumanityMove Humanity is a new global initiative aiming to establish SDG-focused philanthropy as a global norm. It highlights the power and potential that the world’s wealthiest individuals can have by donating just 1 percent of their wealth each year to addressing this century’s most pressing challenges. The initiative aims to help close the SDG financing gap in low-income countries (LICs) by mobilizing greater private funding for basic health and education, critical infrastructure, and environmental conservation priorities.
Sustainable Development Goals (SDGs)The Sustainable Development Goals (SDGs) are a set of 17 objectives - negotiated and agreed to by all 193 world governments in 2015 - to end extreme poverty, achieve decent work for all, promote justice, peace and prosperity, and protect the natural environment from human-caused harms. Highlighting both challenges and opportunities, they are a practical tool for governments, institutions, local communities, civil society organizations and businesses to work together towards a common and clear set of targets. The SDGs are time-bound, represent a universal agenda for every country rich and poor, and are to be monitored annually.
The SDG Financing GapThe SDGs constitute a bold, ambitious, yet feasible agenda that require funding outlays that are large in absolute terms but equal to only a modest percentage of Gross World Income (GWI). The total incremental costs for achieving the SDGs are on the order of US$2–3 trillion per year, which constitutes just 2–3 percent of global annual output at US$100 trillion. While this is a large sum in absolute terms, it is just a modest percentage of GWI. In low-income countries, the SDG financing gap is much smaller, between US$300–400 billion per year.
Closing the GapAchieving the SDGs will require rapid mobilization of financial resources from all sectors of the global economy. Move Humanity aims to help close the Goals’ financing gap in LICs by mobilizing greater funding from the private sector.
The Rise of Private WealthThe philanthropic sector has the capacity to fill a significant percentage of the SDG financing gap. Forbes reports that there are now a record 2,208 billionaires in the world. These individuals possess a collective net worth of US$9.1 trillion USD and their wealth increases daily. In fact, 42 people now hold as much wealth as the 3.7 billion who make up the poorest half of the world’s population. The capacity of the world’s wealthiest individuals to help bridge the financing gap and achieve the goals is significant and would strengthen the healthcare systems of over 70 countries and save more than 6 million children a year, secure an education for over 200 million children and provide clean water for millions more.
Through its efforts to create a greater culture of giving among the world’s wealthiest individuals, Move Humanity builds on a long tradition of large-scale philanthropy in the U.S. and around the world. The collective generosity of individuals like Andrew Carnegie, John D. Rockefeller, Andrew Mellon, Henry Ford, Bill and Melinda Gates, John D. and Catherine T. MacArthur, Gordon and Betty Moore, William and Flora Hewlett, Robert Wood Johnson, Oprah Winfrey, Elon Musk, George Soros, and Warren Buffet, among many others, has had and continues to have immense global impact. The results of their pioneering philanthropic work include cutting-edge contributions to governance, health care, education, environmental conservation, technological advancement, and other areas of great social significance.
The Plan to Move HumanityMove Humanity is calling upon the world’s highest net worth individuals – those with wealth of US$1 billion or more – to direct at least 1 percent of their net worth each year towards the SDGs. Many donors will answer this invitation voluntarily
Appendix C. Move Humanity: A Justice and Wealth Initiative
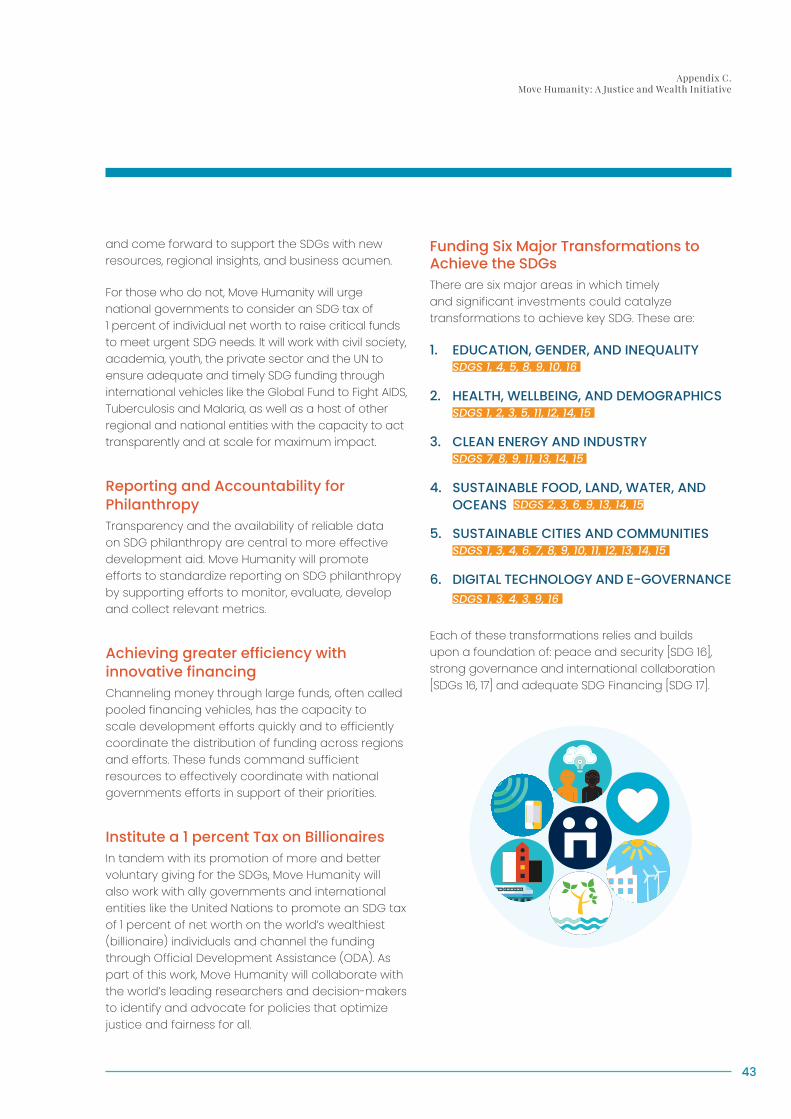
43
Appendix C. Move Humanity: A Justice and Wealth Initiative
and come forward to support the SDGs with new resources, regional insights, and business acumen.
For those who do not, Move Humanity will urge national governments to consider an SDG tax of 1 percent of individual net worth to raise critical funds to meet urgent SDG needs. It will work with civil society, academia, youth, the private sector and the UN to ensure adequate and timely SDG funding through international vehicles like the Global Fund to Fight AIDS, Tuberculosis and Malaria, as well as a host of other regional and national entities with the capacity to act transparently and at scale for maximum impact.
Reporting and Accountability for PhilanthropyTransparency and the availability of reliable data on SDG philanthropy are central to more effective development aid. Move Humanity will promote efforts to standardize reporting on SDG philanthropy by supporting efforts to monitor, evaluate, develop and collect relevant metrics.
Achieving greater efficiency with innovative financingChanneling money through large funds, often called pooled financing vehicles, has the capacity to scale development efforts quickly and to efficiently coordinate the distribution of funding across regions and efforts. These funds command sufficient resources to effectively coordinate with national governments efforts in support of their priorities.
Institute a 1 percent Tax on BillionairesIn tandem with its promotion of more and better voluntary giving for the SDGs, Move Humanity will also work with ally governments and international entities like the United Nations to promote an SDG tax of 1 percent of net worth on the world’s wealthiest (billionaire) individuals and channel the funding through Official Development Assistance (ODA). As part of this work, Move Humanity will collaborate with the world’s leading researchers and decision-makers to identify and advocate for policies that optimize justice and fairness for all.
Funding Six Major Transformations to Achieve the SDGsThere are six major areas in which timely and significant investments could catalyze transformations to achieve key SDG. These are:
1. EDUCATION, GENDER, AND INEQUALITY SDGS 1, 4, 5, 8, 9, 10, 16
2. HEALTH, WELLBEING, AND DEMOGRAPHICS SDGS 1, 2, 3, 5, 11, I2, 14, 15
3. CLEAN ENERGY AND INDUSTRY SDGS 7, 8, 9, 11, 13, 14, 15
4. SUSTAINABLE FOOD, LAND, WATER, AND OCEANS SDGS 2, 3, 6, 9, 13, 14, 15
5. SUSTAINABLE CITIES AND COMMUNITIES SDGS 1, 3, 4, 6, 7, 8, 9, 10, 11, 12, 13, 14, 15
6. DIGITAL TECHNOLOGY AND E-GOVERNANCE SDGS 1, 3, 4, 3, 9, 16
Each of these transformations relies and builds upon a foundation of: peace and security [SDG 16], strong governance and international collaboration [SDGs 16, 17] and adequate SDG Financing [SDG 17].

44
MOVE HUMANITY IS ORGANIZED AROUND THE FOLLOWING 10 GUIDING PRINCIPLES:
01 The 17 SDGs are the world’s global development priorities, constituting the globally-agreed framework for the years 2015–2030.
02 The Low-Income Countries (LICs) require development assistance, both public and private, to achieve the SDGs.
03 Development assistance should be complementary with domestic financing and contingent on strong national financing efforts.
04 Development assistance should prioritize funding for LICs in order to close the SDG financing gaps where there are limited resource alternatives.
05 Each donor country should honor their long-standing commitment to allocating at least 0.7% of Gross National Income (GNI).
06 Donor Countries’ ODA commitments should be complemented by private sector contributions of 0.3% of national income as Private Development Assistance (PDA).
07 The world’s wealthiest individuals, those with US$1 billion or more, should make annual philanthropic contributions to SDG-focused efforts that equal at least 1 % of their net worth.
08 Private philanthropic contributions for international development and the SDGs should be monitored and reported on annually for greater transparency, coordination and impact.
09 All Private Development Assistance should be directed largely towards pooled SDG funds that national evaluation to decrease funding redundancies and optimize distribution and efficiency.
10 There are two pathways for mobilizing increased SDG funding from the world’s wealthiest individuals: via voluntary philanthropic giving each year or with an SDG wealth tax on billionaires who do not contribute voluntarily.
0 1
02
0 3
0 4
05
06
07
0 8
09
1 0
Guiding Principles of

Let’s move humanity together www.movehumanity.org
Move Humanity was conceptualized and founded in Copenhagen, Denmark by Djaffar Shalchi, Founder and Chair of the Board of the Human Act Foundation.
The initiative is a partnership between Human Act and the UN Sustainable Development Solution Network.
Human beings are members of a whole
In creation of one essence and soul
If one member is afflicted with pain
Other members uneasy will remain
If you have no sympathy for human pain
The name of human you cannot retain.
Human beings are members of a whole
In creation of one essence and soul
If one member is afflicted with pain
Other members uneasy will remain
If you have no sympathy for human pain
The name of human you cannot retain.
“Human beings are members of a whole
In creation of one essence and soul
If one member is afflicted with pain
Other members uneasy will remain
If you have no sympathy for human pain
The name of human you cannot retain.
Saadi
“