cloud-point extraction and characterization of nanomaterials from water
TRANSCRIPT

Cloud-point Extraction and
Characterization of Nanomaterials
from Waterfrom Water
Yu Yanga, Paul Westerhoffa, Kiril Hristovskib
aSchool of Sustainable Engineering and the Built Environment,
Arizona State University, Tempe, Arizona 85287-5306, United States
bCollege of Technology and Innovation, Arizona State University at the
Polytechnic Campus, Mesa, AZ 85212,United States
1

Outline
• Introduction of Cloud-point Extraction (CPE)
• Demonstration of CPE on Extraction of Gold
Nanoparticles
• CPE on a Variety of Water and Characterization • CPE on a Variety of Water and Characterization
of Nanoparticles
• Summary
• Future Work & Potential Application
2

Potential Release of Nanomaterial from
Semiconductor Industry
• The use of chemical-mechanical polishing (CMP) agents
may lead to potential release of nanoparticles to water.
• Some existing methods are capable of detecting nano • Some existing methods are capable of detecting nano
particles (e.g. single particle ICP-MS), but still needs
development to count small nanoparticles (NPs) of Al or
Si based CMP.
• To characterize nanomaterials in the water, an enrichment
method may be beneficial.
3

Benefits of Pretreatment Method for
Nanomaterial Characterization1) Enrichment of nanoparticles into a clean phase to facilitate analysis.
2) Separation of nanoparticle from metallic ions
3) Non invasive method (i.e. does not change size or shape of nanoparticles)
4)Currently such methods are lacking for nanomaterials in aqueous systems or biological fluids, perhaps with exception of ultra-high speed centrifugation.
4
What is Cloud-point Extraction (CPE)?
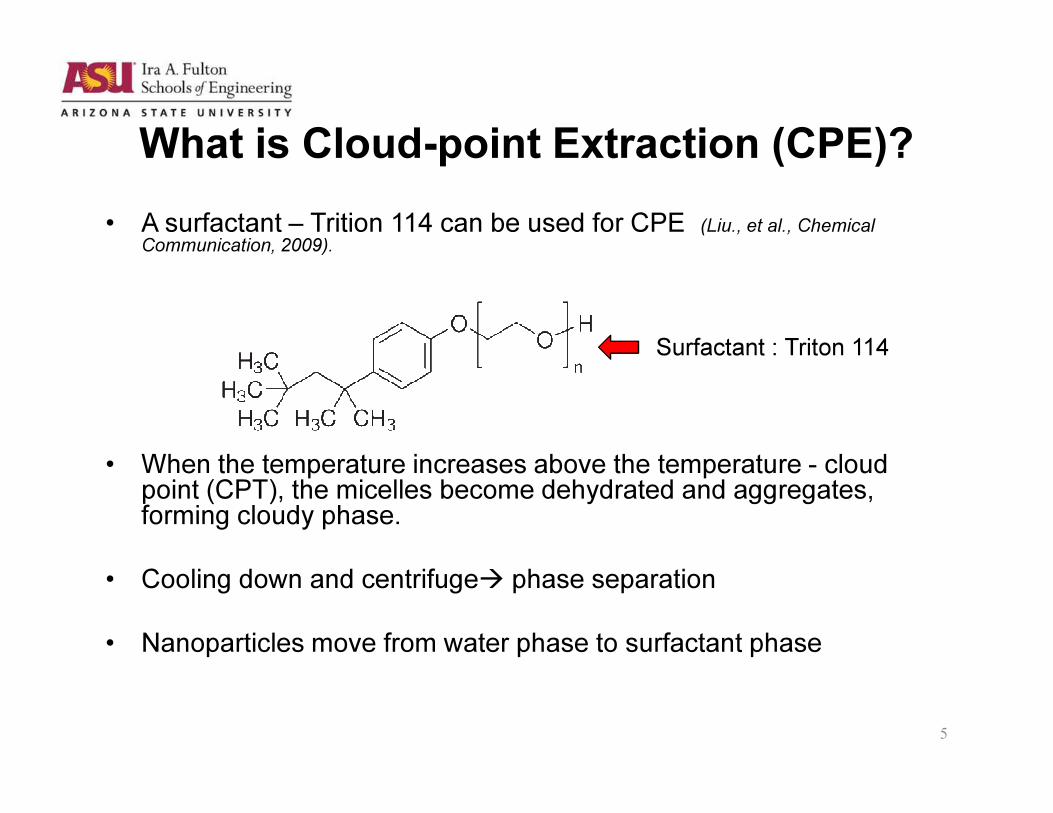
• A surfactant – Trition 114 can be used for CPE (Liu., et al., Chemical Communication, 2009).
Surfactant : Triton 114
• When the temperature increases above the temperature - cloud point (CPT), the micelles become dehydrated and aggregates, forming cloudy phase.
• Cooling down and centrifuge� phase separation
• Nanoparticles move from water phase to surfactant phase
5

Demonstration of CPE on Nanomaterial
Extraction• Effectively used in a variety of nanoparticles suspended in
deionized water, including CdSe/ZnS, Fe3O4, TiO2, Ag, Au,
C60,SWCNT.
• No size change of nanoparticles (e.g. silver nanoparticles)TEM Images
Before Centrifugation After Centrifugation
TEM Images
Chao et al., Analytical Chemistry, 20116
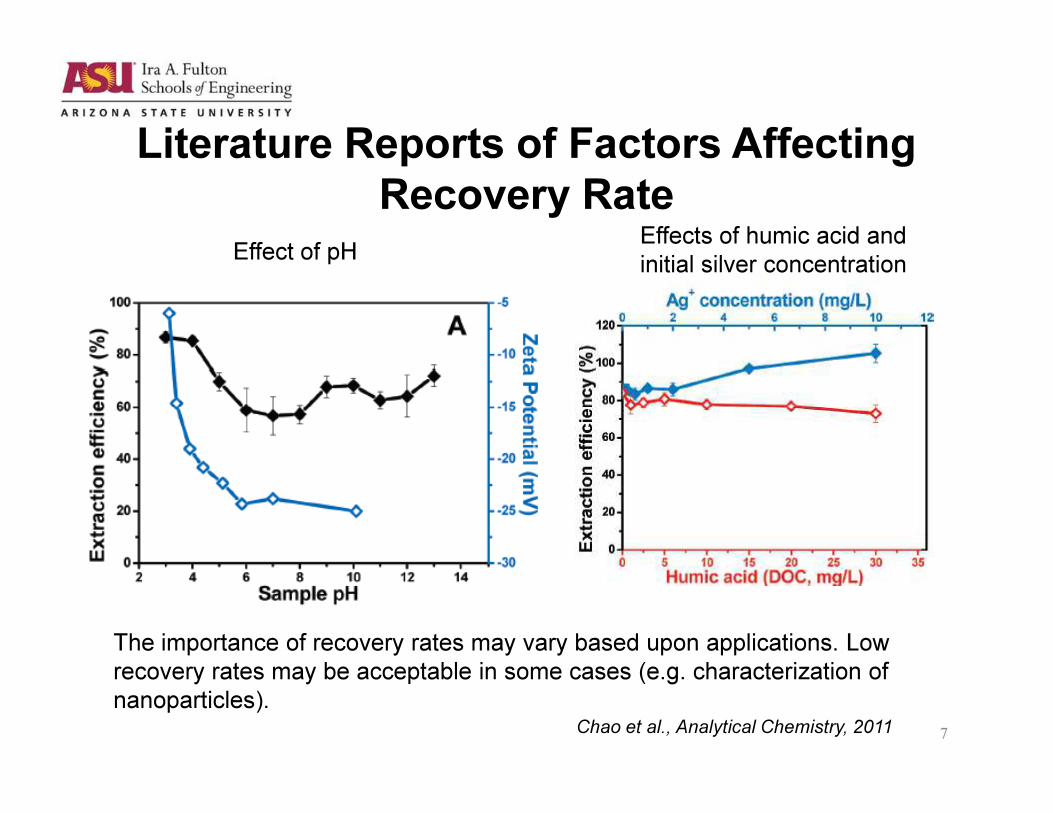
Literature Reports of Factors Affecting
Recovery Rate
Effect of pHEffects of humic acid and
initial silver concentration
7Chao et al., Analytical Chemistry, 2011
The importance of recovery rates may vary based upon applications. Low
recovery rates may be acceptable in some cases (e.g. characterization of
nanoparticles).

Objectives and Approach
1. Objective: To extract nanoparticles existing in
rivers, tap, and waste waters (i.e., prospecting
for nanoparticles in water)
2. Approach: Apply CPE to nanopure water with
known nanoparticles and then to characterize
NPs by electron microscopes in more complex
“real” matrix after CPE.
8

Cloud-point Extraction Process
22oC
Supernatant
Step 1.
Adding
surfactant
(Triton 114) to
get a final
concentration of
5% (W/V)
Step2.
Water bath
at 40 °C for
30 minutes
(Ojeda.,et.al., Microchimica Acta, 2012)
Surfactant
Phase
Step 3.
Cooling down,
and centrifuge
9
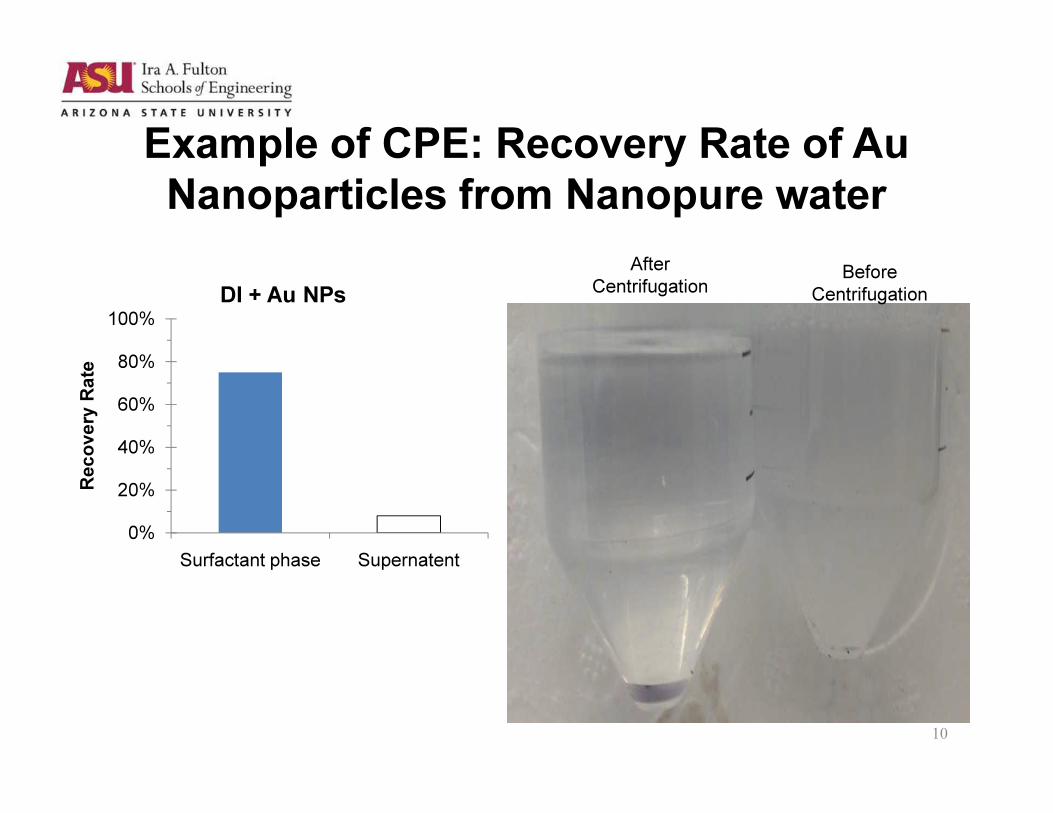
Example of CPE: Recovery Rate of Au
Nanoparticles from Nanopure water
After
CentrifugationBefore
Centrifugation
60%
80%
100%
Reco
very
Rate
DI + Au NPs
0%
20%
40%
60%
Surfactant phase Supernatent
Reco
very
Rate
10

Characterization Results
• Nanoparticles in river water after CPE
• Nanoparticles in drinking tap water after CPE
• Nanoparticles in treated wastewater after CPE
11

Salt River Sample
Energy (keV)
Counts
108642
2000
1500
1000
500
0
C
Cu
CuCu
O
FeFe SiAlK Mn
Mn
Mn
Mg
Na
Ca
Ti
Ti
Ti
Ti
SP
Zn
Zn
Cl
EDX (R1-10-3-2txt.txt)
Ti
Ca
Cu
Fe
O
60 ± 12 nm
12

Verde River Sample
202 nm
Fe +C +O, 93 nm
Energy (keV)
Counts
12108642
6000
4000
2000
0
C
Cu
CuCu
O
Fe
Fe
Si
Al
KMn
Mn
MgNa
Ca
Ti
Ti
Ti
Ti
SP
EDX (R25-05-03.txt)
Ti
Ca
Cu
Fe
O
13
Si

Water Sample from Tempe Canal
4 nm
The smallest particle containing
high concentration of Ti
Energy (keV)
Counts
6.04.02.0
5000
4000
3000
2000
1000
0
C
Cu
O
FeFe
Si
Al
KMn
Mn
Mn
MgNa
Ca
Ti
Ti
Ti
Ti
SP
EDX (HTC-04.txt)
Ti
K Ca
Si
FeAl
high concentration of Ti
14
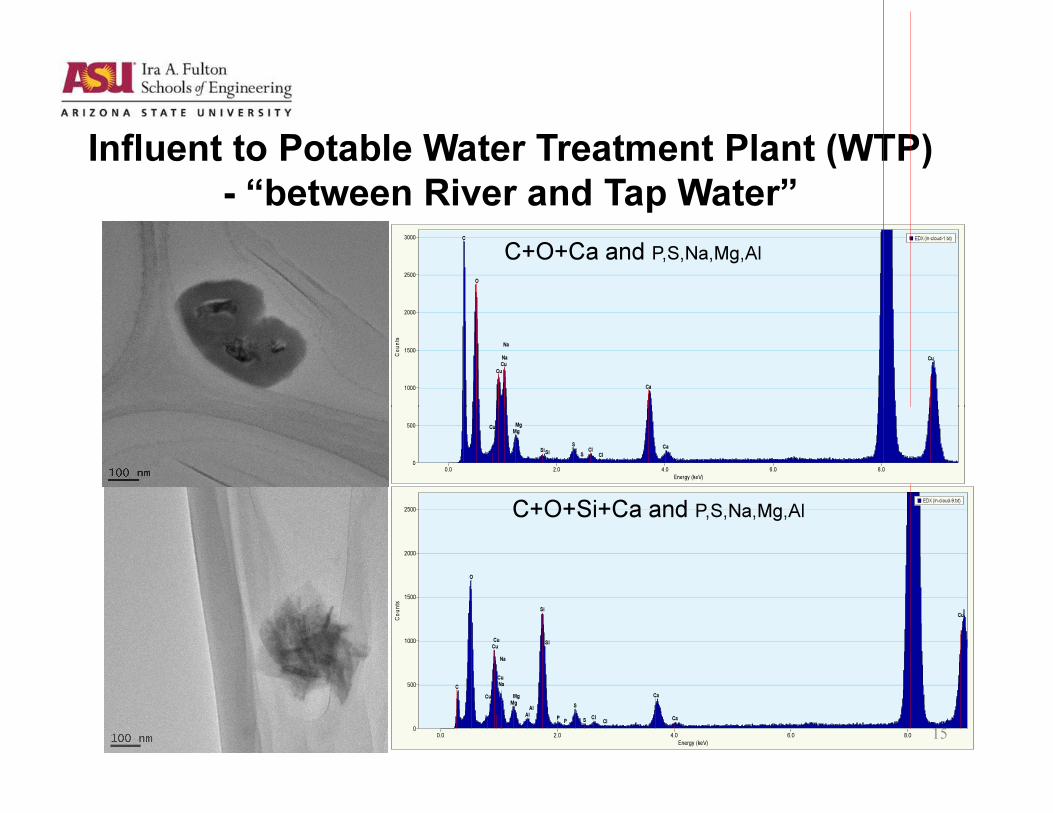
Influent to Potable Water Treatment Plant (WTP)
- “between River and Tap Water”
Counts
3000
2500
2000
1500
1000 Ca
Cu
Cu
Cu
C
O
Na
Na
EDX (In-cloud-1.txt)
C+O+Ca and P,S,Na,Mg,Al
Energy (keV)
Counts
8.06.04.02.00.0
2500
2000
1500
1000
500
0
Ca
Ca
Cu
CuCu
Cu
Cu
C
O
Mg
Mg
S
SCl
Cl
Si
Si
Na
Na
Al
Al
PP
EDX (In-cloud-9.txt)
C+O+Si+Ca and P,S,Na,Mg,Al
Energy (keV)
8.06.04.02.00.0
500
0
Ca
CuMgMg
S
SCl
ClSiSi
15

Particles in Tap Water
Si+O
•One major
advantages of
Ti+O
Zr+Mn+Ca + O
advantages of
CPE in
characterization:
particle
enrichment
•Titanium and
silicon containing
particles were
frequently found.
16

Nanoparticles from Arizona Wastewater Treatment
Plants
78 nm
140 nm
Silica containing particles. The atomic ratios of elements �
80 nm
C O Si S Ca
29 16 4 2 117

More Nano- and Micron- Silica particles
in Wastewater
50 nm
Si + O
18

Summary of all the Particles Found
Major elements detected by EDX of
particulates(likely material)
Approximate
Particulate
Diameter (nm)
Location
Ti + O (Titanium dioxide) 4, 60 ± 12, 108 Salt, Verde River,
Canal, and tap water
Si + O (Silica) 50 - 220 wastewaterSi + O (Silica) 50 - 220 wastewater
C + Ca + O (Calcium carbonate) 61 - 109 River and tap water
Fe + C + O 93 River water
C+O+Si+Ca (Amorphous) 200 - 377 River, tape water, and
wastewater
* No silver/gold particles were identified.
19
Benefits over sp-ICP-MS : entire composition, shape, morphology of particles.

� Cloud-point extraction (CPE) by Triton 114 demonstrated the
ability to enrich gold nanoparticle from nanopure water about
18 times while preserving the size and shape.
� The most abundant nanoparticles identified so far were silica
and titanium containing particles with diameter in the range 4-
Conclusions
and titanium containing particles with diameter in the range 4-
99 nm.
� Other nanoparticles ranged from 30-65 nm contained a list of
major elements, including
calcium, magnesium, aluminum, iron, oxygen, sulfur, carbon,
and chloride.
20

Future Work
• To determine the total metal concentration in cloud phase by ICP-OES, prospecting nanomaterial concentration in water.
(e.g. concentration of silica NPs = Total concentration of silica × number of nano silica/ total concentration of silica × number of nano silica/ total number of silica particles).
• Apply CPE to semi-conductor waste streams, using simulated CMP wasted fluids after laboratory jar tests.
21

Acknowledgements
• SRC Funding: Task # 425.040
• NSF: CBET 1336542
22