clumped isotope composition of cold-water corals: a · pdf filewhereas corals that lack algal...
TRANSCRIPT

Spooner, P. T., Guo, W., Robinson, L. F., Thiagarajan, N., Hendry, K.,Rosenheim, B., & Leng, M. (2016). Clumped isotope composition of cold-water corals: A role for vital effects? Geochimica et Cosmochimica Acta,179, 123-141. DOI: 10.1016/j.gca.2016.01.023
Publisher's PDF, also known as Version of record
License (if available):CC BY
Link to published version (if available):10.1016/j.gca.2016.01.023
Link to publication record in Explore Bristol ResearchPDF-document
University of Bristol - Explore Bristol ResearchGeneral rights
This document is made available in accordance with publisher policies. Please cite only the publishedversion using the reference above. Full terms of use are available:http://www.bristol.ac.uk/pure/about/ebr-terms

Clumped isotope composition of cold-water corals: A rolefor vital effects?
Peter T. Spooner a,b,⇑, Weifu Guo a, Laura F. Robinson b, Nivedita Thiagarajan c,Katharine R. Hendry b, Brad E. Rosenheim d,1, Melanie J. Leng e
aWoods Hole Oceanographic Institution, Woods Hole, MA 02543, USAbUniversity of Bristol, Bristol BS8 1RJ, UK
cCalifornia Institute of Technology, Pasadena, CA 91125, USAdTulane University, New Orleans, LA 70118, USA
eBritish Geological Survey, Keyworth NG12 5GG, UK
Received 8 May 2015; accepted in revised form 12 January 2016; available online 2 February 2016
Abstract
The carbonate clumped isotope thermometer is a promising tool for determining past ocean temperatures. It is based onthe temperature dependence of rare isotopes ‘clumping’ into the same carbonate ion group in the carbonate mineral lattice.The extent of this clumping effect is independent of the isotope composition of the water from which carbonate precipitates,providing unique advantages over many other paleotemperature proxies. Existing calibrations of this thermometer in cold-water and warm-water corals suggest clumped isotope ‘vital effects’ are negligible in cold-water corals but may be significantin warm-water corals. Here, we test the calibration of the carbonate clumped isotope thermometer in cold-water corals with arecently collected and well characterised sample set spanning a range of coral genera (Balanophyllia, Caryophyllia, Dasmos-
milia, Desmophyllum, Enallopsammia and Javania). The clumped isotope compositions (D47) of these corals exhibit systematicdependences on their growth temperatures, confirming the basis of the carbonate clumped isotope thermometer. However,some cold-water coral genera show D47 values that are higher than the expected equilibrium values by up to 0.05‰ (equivalentto underestimating temperature by �9 �C) similar to previous findings for some warm-water corals. This finding suggests thatthe vital effects affecting corals D47 are common to both warm- and cold-water corals. By comparison with models of the coralcalcification process we suggest that the clumped isotope offsets in these genera are related to the kinetic isotope effects asso-ciated with CO2 hydration/hydroxylation reactions in the corals’ calcifying fluid. Our findings complicate the use of the car-bonate clumped isotope thermometer in corals, but suggest that species- or genus-specific calibrations could be useful for thefuture application of this paleotemperature proxy.� 2016 The Authors. Published by Elsevier Ltd. This is an open access article under the CC BY license (http://creativecommons.org/licenses/by/4.0/).
1. INTRODUCTION
Scleractinia or ‘stony corals’ precipitate aragonite skele-tons and range from small, solitary corals to hermatypic or‘reef-building’ colonial corals that can support extremelybiodiverse ecosystems. Many species living in shallow seashost photosynthesising algae, which provide the corals withcarbon for metabolisation (Falkowski et al., 1984; Porteret al., 1984). Such corals are known as zooxanthellate,
http://dx.doi.org/10.1016/j.gca.2016.01.023
0016-7037/� 2016 The Authors. Published by Elsevier Ltd.
This is an open access article under the CC BY license (http://creativecommons.org/licenses/by/4.0/).
⇑ Corresponding author at: School of Earth Sciences, Universityof Bristol, Bristol BS8 1RJ, UK. Tel.: +44 7902008694.
E-mail address: [email protected] (P.T. Spooner).1 Present address: University of South Florida, St. Petersburg,
FL 33701, USA.
www.elsevier.com/locate/gca
Available online at www.sciencedirect.com
ScienceDirect
Geochimica et Cosmochimica Acta 179 (2016) 123–141

whereas corals that lack algal symbionts are known asazooxanthellate. Around 90% of azooxanthellate sclerac-tinian corals live in cold/dark water and as such are oftenreferred to as cold-water or deep-water corals (Robertset al., 2009). The term ‘cold-water coral’ is also used to referto animals from two further orders (Gorgonacea andAnthoathecata) that can have differing skeletal mineralogy.In this study we use the term ‘cold-water coral’ to referspecifically to azooxanthellate scleractinian corals(Roberts et al., 2006; Roberts and Cairns, 2014).
Cold-water corals are found in all major ocean basins atdepths from the surface to deeper than 4000 m (Stanleyand Cairns, 1988; Roberts et al., 2006; Cairns, 2007). Theirskeletons can be collected from the seafloor and preciselydated using uranium-series techniques (Cheng et al., 2000).As such, they are a promising target as an archive of pastocean dynamics and properties, particularly for regions lack-ing sediment-core climate records (Robinson et al., 2014).
Given the important role of temperature in governingseawater density, circulation and heat transport, numerousgeochemical proxy-methods have been developed andapplied to reconstruct past ocean temperature (eg.McCrea, 1950; Alibert and McCulloch, 1997; Barkeret al., 2005; Rueggeberg et al., 2008; Thiagarajan et al.,2014). However, many paleotemperature proxies usedsuccessfully in other archives (eg. d18O and Mg/Ca inforaminiferal tests) cannot be straightforwardly applied incold-water corals (eg. Smith et al., 2000; Adkins et al.,2003; Gagnon et al., 2007; Case et al., 2010). This compli-cation is due to the presence of ‘vital effects’, i.e. biologicalprocesses that cause deviations of coral geochemical com-positions from thermodynamic equilibrium values. Forexample, the stable isotope compositions (d18O and d13C)of cold-water coral skeletons are known to be depleted rel-ative to the expected carbonate-seawater equilibrium valuesby up to 6–12‰ (Adkins et al., 2003; Lopez Correa et al.,2010; Lutringer et al., 2005; Mortensen and Rapp, 1998;Smith et al., 2000; Spiro et al., 2000; Rollion-Bard et al.,2003, 2010; Marali et al., 2013). The magnitude of thesestable isotope vital effects varies even within a coralskeleton and is thought to be related to kinetic and/orpH-driven processes during coral calcification (eg.McConnaughey, 1989; Adkins et al., 2003). A proxy thatis neither affected by biological mediation nor requiresknowledge of the seawater isotopic composition would bea valuable tool for the paleoceanographic community.
A promising paleotemperature proxy in this regard isthe clumped isotope composition of coral skeletal carbon-ate (Ghosh et al., 2006; Thiagarajan et al., 2011; Saengeret al., 2012). It is based on the homogeneous isotope equi-librium within the carbonate lattice, and thus can constraincarbonate formation temperature without knowledge of theisotopic composition of the water from which the carbonategrew. An example of such an isotope equilibrium is:
Ca13C16O3 þ Ca12C18O16O2 () Ca13C18O16O2 þ Ca12C16O3
Under thermodynamic equilibrium, 13C and 18O in thecarbonate lattice have a tendency to clump into the samecarbonate ion group, leading to a relative enrichment inthe abundance of the 13C18O16O2
2� isotopologue over that
which would be expected if all isotopes were randomly dis-tributed. The magnitude of this enrichment varies as a func-tion of the carbonate formation temperature and can thusbe used as a geothermometer.
In practice this enrichment is quantified by measuringthe abundance anomalies of the mass 47 isotopologues(mostly 13C18O16O) in CO2 derived from phosphoric aciddigestion of carbonates, which is proportional to the enrich-ment of the 13C18O16O2
2� isotopologue in the carbonatemineral (Ghosh et al., 2006; Guo et al., 2009b):
D47 ¼ R47
R�47
� 1
� �� R46
R�46
� 1
� �� R45
R�45
� 1
� �� �� 1000;
where R47, R46, and R45 are the measured abundance ratiosof masses 47, 46 and 45 relative to mass 44, and the denom-inator terms R* are the expected ratios if all isotopes wererandomly distributed (i.e. if the sample had the stochasticdistribution of isotopologues based on its measured d18Oand d13C values) (Eiler and Schauble, 2004; Huntingtonet al., 2009).
Ghosh et al. (2006) first calibrated the carbonateclumped isotope thermometer by precipitating syntheticcalcites in the lab, yielding a temperature relationship ofD47 = 0.0592 � 106/T2 � 0.02 (T in kelvin). Subsequently,Dennis and Schrag (2010) precipitated calcites and founda D47 temperature dependence of D47 = 0.0337 � 106/T2 + 0.247, significantly different from that of Ghoshet al. (2006). We refer to these contrasting calibrations asthe Ghosh calibration line and the Dennis calibration linethroughout this study. The discrepancies between these cal-ibration lines are not resolved by converting the measuredD47 values to the absolute reference frame (ARF) (Denniset al., 2011). Recently Zaarur et al. (2013) repeated similarprecipitation experiments to Ghosh et al. (2006) and founda temperature dependence close to the Ghosh calibrationline for calcite and aragonite. In contrast, weaker tempera-ture dependences of the clumped isotope thermometer inaragonite similar to the Dennis calibration line have alsosince been reported (Kim et al., 2010; Defliese et al.,2015). The causes of the different calibration slopes – whichalso exist in the calibration of some biogenic carbonates,e.g. brachiopods (Henkes et al., 2013; Came et al., 2014;Petrizzo et al., 2014) – are a matter of current debate withinthe clumped isotope community. It has been postulated thatthese inter-laboratory differences are related to differencesin the analytical protocols in different labs, e.g. the extentof equilibration between the produced CO2 and the waterassociated with the digestion acid (Came et al., 2014;Defliese et al., 2015).
Despite the complications described above, calibrationsof the clumped isotope thermometer in many (although notall) biogenic carbonates appear to agree closely with theGhosh calibration line (Came et al., 2007; Tripati et al.,2010; Thiagarajan et al., 2011; Zaarur et al., 2011; Eagleet al., 2013). However, with the exception of Eagle et al.(2013), these studies used the same analytical methods asGhosh et al. (2006). Confidence in the application of thecarbonate clumped isotope thermometer in cold-water cor-als increased with the finding that the relationship between
124 P.T. Spooner et al. /Geochimica et Cosmochimica Acta 179 (2016) 123–141

their clumped isotope compositions and growth tempera-ture was indistinguishable from the Ghosh calibration line(Thiagarajan et al., 2011). This result highlighted the possi-bility that the processes generating large vital effects in corald18O and d13C did not affect clumped isotope fractionationsin cold-water corals. The carbonate clumped isotope ther-mometer has since then been applied to the cold-water coralDesmophyllum dianthus, to explore past ocean temperatures(Thiagarajan et al., 2014). In contrast, the clumped isotopecompositions of some warm-water scleractinian corals wereshown to be systematically offset from the Ghosh calibra-tion line by �0.04‰ (Saenger et al., 2012). Such clumpedisotope vital effects in warm-water corals did not seem tobe related to the presence or absence of algal symbionts(Saenger et al., 2012). In this study we increase the sampledensity of the calibration of the clumped isotope thermome-ter in cold-water corals with a new, recently-collected andwell- characterised sample set spanning a range of coralgenera. We test and correct for inter-laboratory differencesin clumped isotope measurements, allowing direct compar-ison of our results with results from previous studies, andwe further evaluate the possible causes of clumped isotopevital effects in scleractinian corals.
2. MATERIALS AND METHODS
2.1. Coral samples
Corals analysed in this study were either collected dur-ing recent cruises to the Atlantic and Southern Oceans(Table S1), or have been measured before (Thiagarajanet al., 2011). Samples from the tropical Atlantic Oceanwere collected during the JC094 cruise (Oct–Nov 2013,Robinson, 2014) by Remote Operated Vehicle (ROV)from the flanks of seamounts or fracture zone escarp-ments, with the depth of collection ranging from 200 mto 2500 m. These samples were all living immediately priorto collection. Coral samples from the Southern Oceanwere collected during three cruises to the Drake Passage(NBP-0805, NBP-1103 and LMG-0605) (Burke et al.,2010; Margolin et al., 2014). These samples were collectedusing dredge or trawl deployments, on the flanks of sea-mounts, fracture zones and the continental marginbetween 330 m and 1879 m. The corals were not alivewhen collected, but were determined to be less than1000 years old using uranium-series and/or reconnaissanceradiocarbon dating (Burke and Robinson, 2012; Margolinet al., 2014). If necessary, coral samples were bleachedand then rinsed with fresh water while on board ship toremove organic tissue and were stored at roomtemperature.
We analysed a total of six genera of corals from theserecent collections, with four of them from the AtlanticOcean collection: Caryophyllia (solitary); Dasmosmilia
(solitary); Enallopsammia (colonial); Javania (solitary),and two from the Southern Ocean collection: Balanophyllia(solitary) and Desmophyllum (solitary) (Tables 1, S1). Wealso analysed new subsamples from five coral specimenspreviously measured by Thiagarajan et al. (2011) (Tables 1,S1).
2.2. Seawater properties
2.2.1. Temperature
Temperature estimates at each sample site were derivedfrom at least two (up to three) different sources: (1) annualaverage temperature data from the Levitus94 (Levitus andBoyer, 1994) database from within 0.5� latitude and longi-tude, and extrapolated to the depth of sample collection; (2)ROV CTD data at the sample collection site (JC094 cruiseonly, including the maximum and minimum ROV CTDtemperature recorded within ±3 m depth of the collectionsite) and (3) rosette CTD data taken near the sample siteand extrapolated to the depth of sample collection (in somecases two rosette casts were available from differentcruises). For most cases, data from the available sourcesagreed to within ±0.4 �C and we take this to be the uncer-tainty on our estimates of coral growth temperature(Table S1). The exceptions were for samples JC094-B0457-Daslm-001 and JC094-B0468-Daslm-001 collectedfrom within the Atlantic thermocline. The rosette CTDmeasured temperatures were 1 �C and 2 �C warmer thanthose measured using the ROV for the two samples respec-tively, while the Levitus94 temperatures agreed with theROV data to within 0.2 �C. The differing temperature esti-mates here are likely due to changes in the thermoclinedepth with proximity to the seamount and/or diurnalchanges. It is also possible that seasonal variation in thethermocline is important for this site. This uncertainty doesnot alter our conclusions. In all figures and tables we reportthe temperatures measured by the CTD mounted on theROV or rosettes.
2.2.2. Carbon and oxygen isotopic compositions of seawater
The isotopic compositions of seawater were determinedbased on waters collected in Niskin bottles during allcruises, which were attached to either the rosette system(12 collections per deployment) or the ROV (JC094 cruiseonly, up to 5 collections per deployment).
For d13C measurements, unfiltered seawater sampleswere collected in 250 ml acid-cleaned and ashed glass bot-tles from the Niskin bottles using acid-cleaned silicone tub-ing, first rinsing and then overfilling the bottle by at least50%. The sample, leaving head-space, was poisoned with50 ll of saturated mercuric chloride solution, and the bottlewas then sealed with a plastic screwcap lid and o-ring. Thed13C of dissolved inorganic carbon (DIC, 1 standarddeviation S.D. = 0.1‰) was analysed at the University ofCalifornia (Irvine) for tropical Atlantic samples (Gao et al.,2014), and at the National Ocean Sciences AcceleratorMass Spectrometry facility (NOSAMS) of Woods HoleOceanographic Institution for Southern Ocean samples.The speciation of DIC in the seawater was calculated basedon the seawater alkalinity and total DIC concentration esti-mated from the GLODAP database and measured temper-atures, using the CO2SYS program (van Heuven et al.,2011). The d13C of the dissolved HCO3
� was then calculatedbased on the measured d13CDIC and published carbon iso-tope fractionation factors (Mook et al., 1974). The calcu-lated d13CHCO�
3is typically 0.1–0.2‰ greater than the
P.T. Spooner et al. /Geochimica et Cosmochimica Acta 179 (2016) 123–141 125

Table 1Stable isotope compositions of seawater and cold-water coral samples analysed in this study.
Sample info. Seawater properties Sample isotope data
Sample label and genus T (�C) d18O VSMOW (‰) d13C VPDB HCO�3 (‰) n D47 (‰) Err. (‰) d18O VPDB (‰) Err. (‰) d13C VPDB (‰) Err. (‰)
NBP1103-DH07-Bc-02 (B) 4.8 �0.76 1.59 3 0.862 0.002 1.50 0.02 �4.57 0.04NBP1103-DH14-Bn-282 (B) 3.9 �0.66 1.21 3 0.866 0.010 1.13 0.02 �6.15 0.06NBP1103-DH16-Bn-11 (B) 2.6 �0.52 0.76 3 0.875 0.010 2.12 0.02 �5.33 0.01LMG06-05-3-2 (B) 5.2 �0.57 1.65 3 0.857 0.021 1.18 0.02 �5.49 0.0849020 (C) 17.4 0.91 – 4 0.773 0.011 1.64 0.01 0.17 0.01JC094-B0040-Carlm-001 (C) 3.0 0.23 1.14 8 0.823 0.003 3.82 0.01 �0.09 0.04JC094-B0244-Carls-001 (C) 7.9 0.18 0.61 8 0.814 0.005 2.39 0.04 �2.19 0.05JC094-B0561-Carlm-001 (C) 4.3 0.24 0.56 8 0.806 0.003 3.41 0.04 �0.93 0.15JC094-B0579-Carlm-001 (C) 4.4 0.24 0.56 5 0.145 0.013 2.99 0.23 �1.46 0.40JC094-B0579-Carlm-002 (C) 4.4 0.24 0.56 5 0.818 0.011 3.73 0.02 0.16 0.02JC094-B0597-Carls-001 (C) 6.1 0.11 0.6 8 0.819 0.007 2.68 0.01 �2.27 0.01JC094-B2242-Carlm-001 (C) 4.4 0.26 0.84 19 0.800 0.005 4.09 0.02 1.38 0.02JC094-B0457-Daslm-001 (Da) 10.6 0.35 0.37 8 0.815 0.005 �0.52 0.02 �8.37 0.02JC094-B0468-Daslm-001 (Da) 12.2 0.40 0.35 8 0.798 0.005 0.14 0.02 �5.85 0.0247413 (De) 7.9 �0.44 – 4 0.802 0.006 0.80 0.01 �5.49 0.0380404 (De) 13.1 0.25 – 4 0.797 0.003 0.14 0.02 �6.24 0.03NBP1103-DH22-Dc(f)6 (De) 2.3 �0.57 0.65 3 0.833 0.010 2.90 0.05 �2.71 0.08NBP1103-DH97-Dp-1 (De) 2.7 �0.47 0.89 3 0.821 0.010 2.61 0.03 �3.64 0.05NBP0805-TB04-DpA-003 (De) 3.7 �0.66 1.21 3 0.820 0.004 1.42 0.03 �5.73 0.06NBP1103-TB10-Dp-1 (De) 3.9 �0.66 1.21 3 0.832 0.006 1.57 0.02 �4.97 0.04JC094-B0141-Enall-001 (E) 4.3 0.24 0.56 6 0.842 0.004 0.89 0.05 �5.06 0.03JC094-B1030-Enall-001 (E) 7.3 0.14 0.89 4 0.837 0.011 2.47 0.02 �1.52 0.03JC094-B1054-Enall-001 (E) 3.7 0.26 1.14 4 0.846 0.009 2.84 0.04 �1.69 0.0947531 (E) 7.5 �0.14 – 4 0.832 0.004 1.28 0.001 �2.22 0.0377019 (E) 14.3 0.95 – 4 0.806 0.005 1.13 0.03 �6.01 0.03JC094-B0023JaA-lm-001 (J) 4.4 0.24 0.56 5 0.815 0.005 3.79 0.02 0.09 0.02JC094-B0030-JaCls-001 (J) 3.1 0.23 1.14 3 0.805 0.007 4.02 0.03 0.31 0.09JC094-B0561-JaClm-001 (J) 4.3 0.24 0.56 8 0.834 0.006 2.83 0.02 �1.38 0.04JC094-B2245-JaClm-001 (J) 5.5 0.20 1.16 4 0.827 0.002 2.98 0.03 �1.06 0.01JC094-B1866-Javls-001 (J) 4.4 0.25 0.95 4 0.826 0.006 3.65 0.03 0.24 0.01JC094-B2067-Javls(f)-001 (J) 7.4 0.20 0.79 4 0.821 0.003 3.34 0.01 0.33 0.03JC094-B2095-Javlm-001 (J) 6.0 0.12 0.89 4 0.817 0.005 3.24 0.005 �0.23 0.05
Genera are labelled according to the following abbreviations: Balanophyllia (B), Caryophyllia (C), Dasmosmilia (Da), Desmophyllum (De), Enallopsammia (E) and Javania (J). n indicates thenumber of replicate measurements for each sample, excluding cleaned aliquots. Data presented are the averages of all measurements for each coral which in some cases are from more than onesubsample (i.e. theca and septa), excluding cleaned aliquots. Corals 49,020, 47,413, 80,404, 47,531 and 77,019 were also measured by Thiagarajan et al. (2011). Errors are ±1 S.E.
126P.T.Spooner
etal./
Geochim
icaet
Cosm
ochim
icaActa
179(2016)
123–141

corresponding d13CDIC. All d13C values are reported rela-tive to Vienna Pee-Dee Belemnite (VPDB).
For d18O measurements, unfiltered 60 ml subsampleswere sealed using rubber stoppers and aluminium crimpseals in glass bottles and stored in cool (�4 �C), dark con-ditions for transportation. For the tropical Atlantic sam-ples, the d18O measurements were conducted using theIsoPrime100 with Aquaprep system at the NERC IsotopeGeosciences Laboratory, with typical precisions of±0.02‰ (1 S.D.). For Southern Ocean samples, the d18Omeasurements were conducted using the Isoprime Mul-tiprep system at Tulane University, with precisions of±0.24‰ (1 S.D.). In the tropical Atlantic, measurementsof d18O had poorer spatial coverage than measurementsof d13C. We therefore elected to calculate the ocean atlas-derived seawater d18O for sample sites from this cruise, fol-lowing the methods in Thiagarajan et al. (2011). A regionalrelationship between d18O and salinity was establishedusing the NASA Global Seawater Oxygen-18 Database –v1.21 (Schmidt et al., 1999). The more finely gridded Levi-tus94 salinity database was then used to estimate d18O nearthe sample site. Where possible, the calculated d18O valueswere compared with the values derived from measurementsof water samples at the respective sites. The maximum off-set between the ocean atlas estimate and in-situ measuredd18O was 0.1‰, about equal to the error on the ocean atlasestimate (Thiagarajan et al., 2011) and small compared tothe range of d18O variability we observed amongst differentcorals (�4‰). Such small uncertainties in seawater d18Oshall not affect our conclusions. The d18O of the seawatersamples are reported relative to Vienna Standard MeanOcean Water (VSMOW).
2.3. Stable isotope measurements of coral skeletons
The surfaces of each coral sample were scraped with adremel tool to remove residual organic material(Thiagarajan et al., 2011). Aliquots of approximately30 mg were cut from each specimen with a diamond blade,rinsed with 18 MX cm water and ground to powders/finegrains with a pestle and mortar. For seven solitary corals,subsamples were taken from both the theca and septa ofthe skeleton to assess any systematic differences in theclumped isotope composition between these two importantskeletal architectures (Table 2). We also carried out anexperiment on NBS-19 and two coral samples to evaluatethe impact of oxidative cleaning on the measured D47
(Table 3). For this experiment, crushed samples were sub-jected to water rinses, a 15 min wash in 30% H2O2 + 1 MNaOH (mixed in the ratio 1:1) at 40 �C, and a rinse lasting1–2 min in (0.1 M) perchloric acid, similar to methodsdesigned to vigorously remove organic material in prepara-tion for uranium-series dating of cold-water coral skeletons(Cheng et al., 2000). Both cleaned and uncleaned powdersof these samples were analysed. Except for samplesemployed in this experiment, all other samples in this studywere not chemically cleaned prior to analysis, consistentwith the procedure of previous clumped isotope studies ofcorals (Thiagarajan et al., 2011; Saenger et al., 2012).
Multiple aliquots (�4 mg each) of each coral samplewere weighed into silver capsules and added to an autosam-pler in a random order. This randomising procedure wasused in order to reduce the possibility of systematic instru-mental effects affecting repeat measurements of a singlesample. Each aliquot of a single powdered sample was gen-erally analysed within a single measurement session, overthe course of 3–4 days. An aliquot of one of two in-housecarbonate standards (NBS-19 or 102-GC-AZ01) was anal-ysed after every �7 coral aliquots. Between 3 and 5 aliquotswere analysed for the majority of coral subsamples, result-ing in 8 or more replicate measurements of many coralspecimens (where the theca and septa of the same specimenwere sampled).
Clumped isotope analyses were performed at WoodsHole Oceanographic Institution (WHOI), within two mea-surement sessions (May–July 2014 and September 2014), ona Thermo Scientific MAT-253 mass spectrometer coupledto a custom-built automated acid reaction and gas purifica-tion line. The purification line is similar to the one describedby Henkes et al. (2013), except both heated gases and equi-librated gases were introduced by first freezing them in liq-uid nitrogen (LN2) as opposed to directly injecting theminto a helium stream.
Aliquots of carbonate samples and standards weredigested in 103% H3PO4 (q = 1.92 g/cm3) at 90 �C andevolved CO2 was purified by passing through several cryo-genic traps (�78 �C dry ice/ethanol slush, and liquid nitro-gen trap) and a custom-built packed 60 cm-long gaschromatograph column (Porapak Q, 50–80 mesh) held at�20 �C. Purified CO2 gases were then expanded into thesample bellow of the mass spectrometer and analysed at abellow gas pressure corresponding to a signal of 12 V onthe Faraday cup measuring mass 44 of CO2. A bottle ofOztech CO2 (d13CVPDB = �3.63‰, d18OVSMOW =+25.04‰) was used as the working reference gas during iso-tope measurements. Each measurement sequence consistedof six acquisitions, and each acquisition consisted of 9cycles of sample-reference comparison with 20 or 26 s ofintegration time.
The d18O and d13C values of carbonates were calculatedusing the working reference gas and then normalised by ref-erence to the NBS-19 standard analysed in the same mea-surement session. CO2 gases equilibrated at 1000 �C and25 �C (i.e. ‘heated gases’ and ‘equilibrated gases’) were pro-cessed using the same purification line and analysed regu-larly to convert all clumped isotope values to the absolutereference frame (Dennis et al., 2011). An acid digestionfractionation of 0.092‰ was applied to normalise theclumped isotope composition of all carbonate standardsand samples to acid extractions at 25 �C (Henkes et al.,2013). The analytical precision of each measurement sessionwas ±0.016‰, ±0.13‰ and ±0.06‰ (1 S.D.) for D47, d
18Oand d13C respectively, based on repeated measurements ofthe two in-house carbonate standards. Where n subsamplesof a coral were measured, standard errors (1 S.E.) on iso-tope ratios were calculated by dividing the 1 S.D. of thosemeasurements by
pn.
In addition to isotope measurements made at WHOI,homogenised powders of five coral specimens were shared
P.T. Spooner et al. /Geochimica et Cosmochimica Acta 179 (2016) 123–141 127
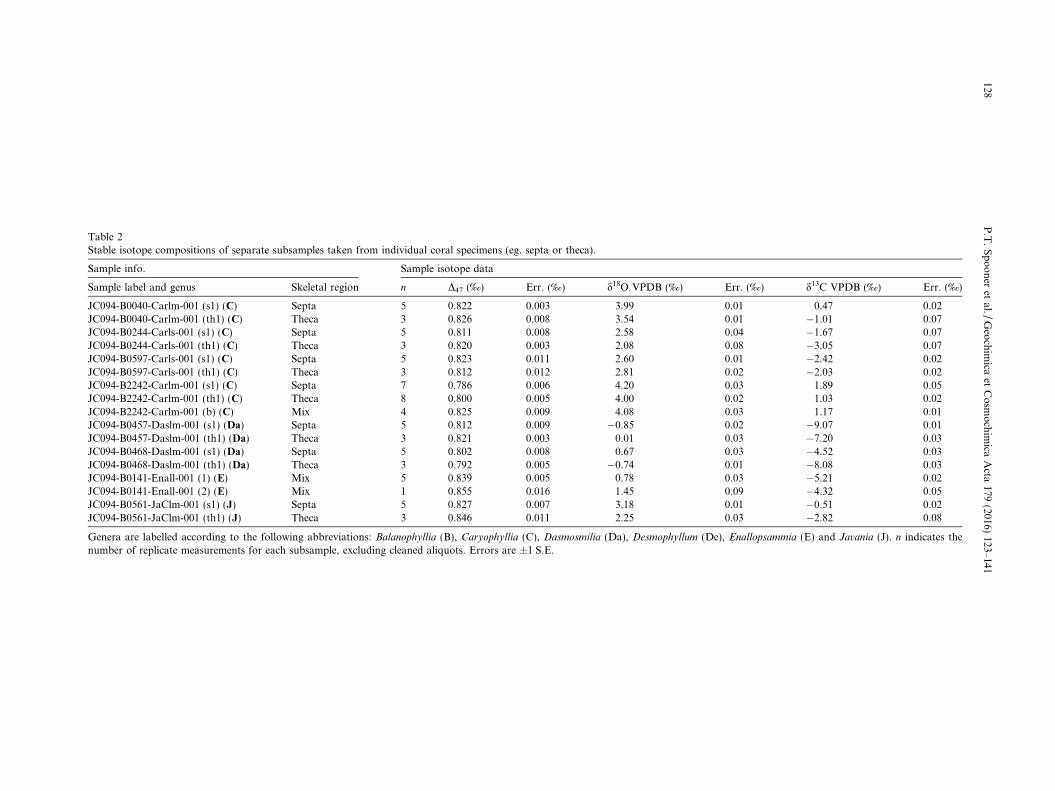
Table 2Stable isotope compositions of separate subsamples taken from individual coral specimens (eg. septa or theca).
Sample info. Sample isotope data
Sample label and genus Skeletal region n D47 (‰) Err. (‰) d18O VPDB (‰) Err. (‰) d13C VPDB (‰) Err. (‰)
JC094-B0040-Carlm-001 (s1) (C) Septa 5 0.822 0.003 3.99 0.01 0.47 0.02JC094-B0040-Carlm-001 (th1) (C) Theca 3 0.826 0.008 3.54 0.01 �1.01 0.07JC094-B0244-Carls-001 (s1) (C) Septa 5 0.811 0.008 2.58 0.04 �1.67 0.07JC094-B0244-Carls-001 (th1) (C) Theca 3 0.820 0.003 2.08 0.08 �3.05 0.07JC094-B0597-Carls-001 (s1) (C) Septa 5 0.823 0.011 2.60 0.01 �2.42 0.02JC094-B0597-Carls-001 (th1) (C) Theca 3 0.812 0.012 2.81 0.02 �2.03 0.02JC094-B2242-Carlm-001 (s1) (C) Septa 7 0.786 0.006 4.20 0.03 1.89 0.05JC094-B2242-Carlm-001 (th1) (C) Theca 8 0.800 0.005 4.00 0.02 1.03 0.02JC094-B2242-Carlm-001 (b) (C) Mix 4 0.825 0.009 4.08 0.03 1.17 0.01JC094-B0457-Daslm-001 (s1) (Da) Septa 5 0.812 0.009 �0.85 0.02 �9.07 0.01JC094-B0457-Daslm-001 (th1) (Da) Theca 3 0.821 0.003 0.01 0.03 �7.20 0.03JC094-B0468-Daslm-001 (s1) (Da) Septa 5 0.802 0.008 0.67 0.03 �4.52 0.03JC094-B0468-Daslm-001 (th1) (Da) Theca 3 0.792 0.005 �0.74 0.01 �8.08 0.03JC094-B0141-Enall-001 (1) (E) Mix 5 0.839 0.005 0.78 0.03 �5.21 0.02JC094-B0141-Enall-001 (2) (E) Mix 1 0.855 0.016 1.45 0.09 �4.32 0.05JC094-B0561-JaClm-001 (s1) (J) Septa 5 0.827 0.007 3.18 0.01 �0.51 0.02JC094-B0561-JaClm-001 (th1) (J) Theca 3 0.846 0.011 2.25 0.03 �2.82 0.08
Genera are labelled according to the following abbreviations: Balanophyllia (B), Caryophyllia (C), Dasmosmilia (Da), Desmophyllum (De), Enallopsammia (E) and Javania (J). n indicates thenumber of replicate measurements for each subsample, excluding cleaned aliquots. Errors are ±1 S.E.
128P.T.Spooner
etal./
Geochim
icaet
Cosm
ochim
icaActa
179(2016)
123–141

between WHOI and the California Institute of Technology(Caltech) to evaluate potential inter-laboratory differencesin clumped isotope measurements. These samples werefrom four different coral genera (Table 4).
2.4. Processing of coral clumped isotope data from previous
studies
Clumped isotope compositions of coral skeletons havebeen reported in previous studies, e.g. Thiagarajan et al.(2011) and Saenger et al. (2012). Saenger et al. (2012) pre-sented their data in the ARF based on a secondary transferfunction constructed from three in-house standards (aCarrara marble, corn CO2, and CO2 equilibrated withwater at 25 �C). The data from Thiagarajan et al. (2011)were not originally reported in the ARF. Previous attemptsto convert the Thiagarajan et al. (2011) data were based onmeasurements of heated gases and NBS-19 made aroundthe time of the study, and used the ‘tertiary reference frame’approach in Dennis et al. (2011), also often used to convertthe original Ghosh et al. (2006) data (Dennis et al., 2011;Saenger et al., 2012; Eagle et al., 2013).
Recently, four of the corals measured in Thiagarajanet al. (2011) have been re-sampled and analysed at Caltechin the ARF. Together with another cold-water coral thathas previously been measured in the ARF (Dennis et al.,2011), these data enable us to provide an updated conver-sion of the Thiagarajan et al. (2011) data to the ARF.Our approach is the same as the ‘tertiary reference frame’approach above, with the exception that we use there-analysed corals as additional carbonate standards tobetter-constrain the conversion. In addition, rather than asingle conversion for data generated during multiple ses-sions, we use a session-by-session conversion for each ofthe seven sessions in 2008 in which cold-water corals weremeasured for Thiagarajan et al. (2011). For each session,we constructed an empirical transfer function based onthe known ARF D47 values for heated gases, NBS-19and/or re-analysed corals run during that session. If a coralwas not re-analysed in the ARF, this function was used toconvert the clumped isotope data reported in Thiagarajanet al. (2011) to the ARF. For corals that were re-analysedin the ARF, we use the measured ARF value. The updatedcoral data, including the standards/corals used for the con-versions, are presented in Table S4.
3. RESULTS
3.1. Oxygen and carbon isotope compositions
Coral d18OVPDB ranged from �0.85‰ to 4.2‰, andd13CVPDB ranged from �9.07‰ to 1.89‰ (sample averages,Tables 1 and 2). The coral genera Caryophyllia and Javania
typically contained the most enriched isotopic compositions(d18OVPDB �2‰ to 4‰, d13CVPDB � �3‰ to 2‰) and thegenus Dasmosmilia contained the most depleted composi-tions (d18OVPDB � �1‰ to 1‰, d13CVPDB � �9‰ to�4‰). The maximum difference in d18OVPDB between twosubsamples of a single specimen was 1.5‰ in the coralJC094-B0468-Daslm-001 (Dasmosmilia sp.), accompaniedby a difference in d13CVPDB of 3.5‰. Differences withinother coral specimens ranged from 0.2‰ to 1‰ ford18OVPDB and 0.4‰ to 2.5‰ for d13CVPDB.
For each coral analysed, we estimated the expected d18Oand d13C values if they had formed in isotope equilibriumwith seawater, based on seawater data for the sample site(T, d18Osw, d13CHCO�
3) and published equilibrium isotope
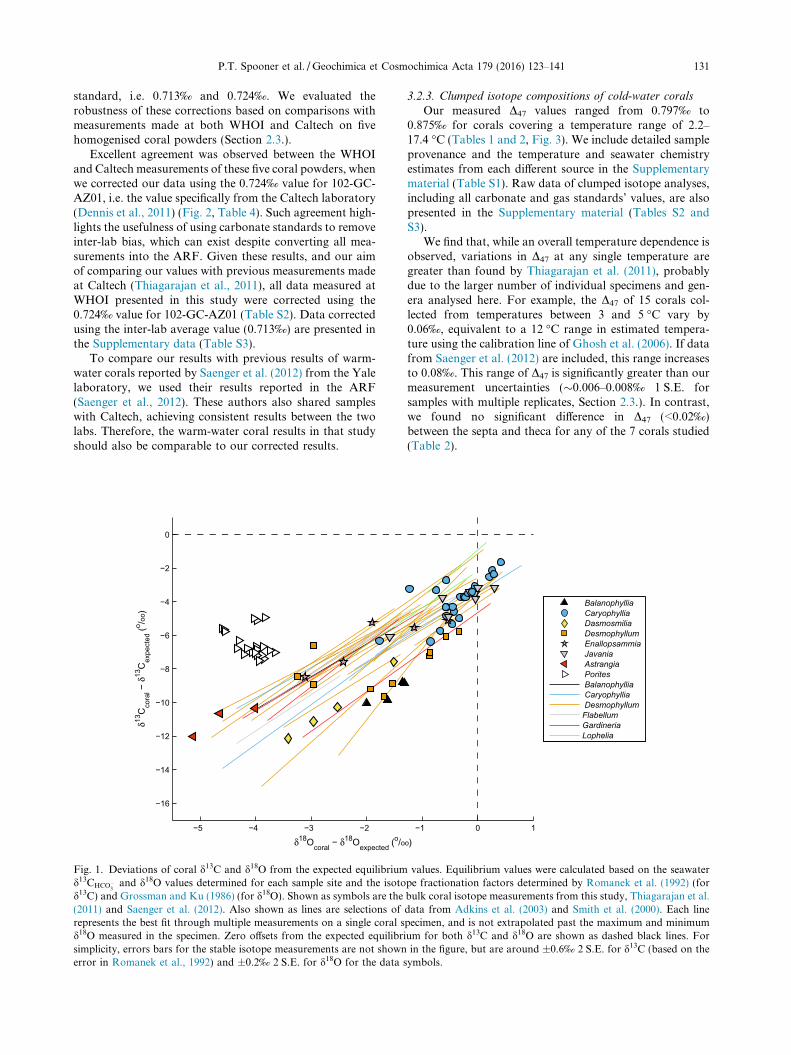
fractionation factors (Grossman and Ku, 1986; Romaneket al., 1992). The d18O and d13C of the majority of sampleswere depleted with respect to the expected equilibrium val-ues, consistent with findings from previous studies (Fig. 1,Table 1, Table S1) (Adkins et al., 2003; Lutringer et al.,2005; Mortensen and Rapp, 1998; Smith et al., 2000;Rollion-Bard et al., 2003, 2010). Oxygen and carbon iso-tope depletions (i.e. Dd18O and Dd13C) are known to be lin-early correlated across most parts of a cold-water coralskeleton, with Dd13C/Dd18O slopes typically around 2.3and intercepts ranging from �5‰ to �1‰ (Adkins et al.,2003; Lutringer et al., 2005; Mortensen and Rapp, 1998;Smith et al., 2000; Rollion-Bard et al., 2003, 2010). The iso-topic compositions of corals measured in this study fallwithin the region covered by these previously-determinedslopes and intercepts, with the magnitude of the disequilib-rium effects varying amongst different coral genera (Fig. 1).For example, the majority of data for the generaCaryophyllia and Javania fall within 1‰ of the expectedequilibrium d18O values, whereas the majority of data forBalanophyllia, Dasmosmilia and Enallopsammia are morethan 1‰ from the expected equilibrium values, with thespecies D. dianthus straddling these two extremes. However,previous micro-sampling measurements of Caryophyllia
Table 3Effects of oxidative cleaning on the measured clumped isotope composition of carbonates.
Cleaning protocol Sample D47 (‰) References
Uncleaned Cleaned Diff.
15 min 1:1 NaOH (1 M) + H2O2 (30%),followed by 1–2 min HClO4 (0.1 M)
NBS-19 0.442 ± 0.004 0.430 ± 0.003 �0.012 This studyJC094-B0561-JaClm-001(th1) 0.846 ± 0.010 0.830 ± 0.006 �0.016JC094-B0561-Carlm-001 0.813 ± 0.005 0.815 ± 0.004 0.002
30 min H2O2 (3%) JR-126 0.716 ± 0.005 0.716 ± 0.012 0.000 Eagle et al. (2013)JR-131 0.714 ± 0.005 0.709 ± 0.002 �0.005
4 h H2O2 (10%) RIB-B54 0.732 ± 0.011 0.750 ± 0.015 0.018 Saenger et al. (2012)
D47 values are reported in the absolute reference frame. ±Values are 1 S.E.
P.T. Spooner et al. /Geochimica et Cosmochimica Acta 179 (2016) 123–141 129
and Desmophyllum corals show that both genera can con-tain the entire range of isotopic depletion observed forcold-water corals (Smith et al., 2000; Adkins et al., 2003).It therefore seems probable that the differences we observebetween genera are due to sampling biases, rather than thetrue extent of d18O and d13C disequilibrium.
3.2. Clumped isotope compositions
3.2.1. Effect of oxidative cleaning
We compared measurements of both cleaned anduncleaned powders from one carbonate standard (NBS-19) and two coral samples (Table 3). Each powder was mea-sured 3 times, with the exception of the uncleaned NBS-19,which was measured 12 times. The maximum difference inD47 between cleaned and uncleaned powders was 0.016‰for the coral JC094-B0561-JaClm-001 (Javania) and theminimum was 0.002‰ for the coral JC094-B0561-Carlm-001 (Caryophyllia). T-tests indicated that there was no sig-nificant difference between the D47 of cleaned and uncleanedpowders for any of the samples (p = 0.10 for NBS-19,p = 0.20 for JC094-B0561-JaClm-001 and p = 0.63 forJC094-B0561-Carlm-001). Two previous studies of biogenicaragonites, employing only H2O2 treatment, also indicatedthat oxidative cleaning does not have a statistically signifi-cant effect on measured D47 values (Table 3, Saengeret al., 2012; Eagle et al., 2013). Therefore coral samples inthis study were not cleaned prior to isotope analysis withthe exception of shipboard bleaching, water rinses andphysical scraping, consistent with the procedure ofThiagarajan et al. (2011) and Saenger et al. (2012).
3.2.2. Inter-laboratory comparison
Measurements of two carbonate standards at WHOI(NBS19 and 102-GC-AZ01) yielded consistent D47 valuesbetween the two measurement sessions, with averages of
0.438 ± 0.011‰ (1 S.D., n = 12) and 0.749 ± 0.016‰(n = 13) during the first measurement session (May–July,2014), and 0.432 ± 0.023‰ (n = 10) and 0.740 ± 0.013‰(n = 9) during the second measurement session (September,2014). These values are however systematically higher thanthe mean values reported in recent studies, i.e. 0.392± 0.017‰ and 0.713 ± 0.012‰ for NBS-19 (a Carrara mar-ble) and 102-GC-AZ01 respectively (Dennis et al., 2011;Zaarur et al., 2013).
The magnitudes of our observed offsets (0.027–0.046‰)relative to the mean values reported in previous studies areclose to the range of inter-laboratory difference observed inprevious studies, which are up to 0.031‰ for NBS19(0.057‰ for Carrara marble) and 0.023‰ for 102-GC-AZ01 (Dennis et al., 2011; Rosenheim et al., 2013; Zaaruret al., 2013; Tang et al., 2014). The exact cause of these off-sets could be related to the differences in our analytical pro-cedure and/or the phosphoric acid digestion fractionationfactor (0.092‰) we adopted, and warrants further investi-gation. In this study, we corrected our clumped isotopedata based on the linear function required to bring the val-ues of these in-house standards measured at WHOI intoagreement with their previously reported values (see detailsbelow). This linear function is a D47-dependent empiricaltransfer function, equivalent to that described in Denniset al. (2011), but applied after the ‘heated gas’, ‘equilibratedgas’ and acid digestion corrections that transfer data intothe ARF. Therefore, this additional correction means thatour reported clumped isotope data are no longer strictlyin the ARF.
Note that the clumped isotope value of the 102-GC-AZ01 standard reported by the Caltech laboratory inDennis et al. (2011) was greater than the inter-lab averagevalue (0.724‰ vs. 0.713‰). We therefore corrected ourinter-laboratory comparison dataset in two ways, byassuming two different values for the 102-GC-AZ01
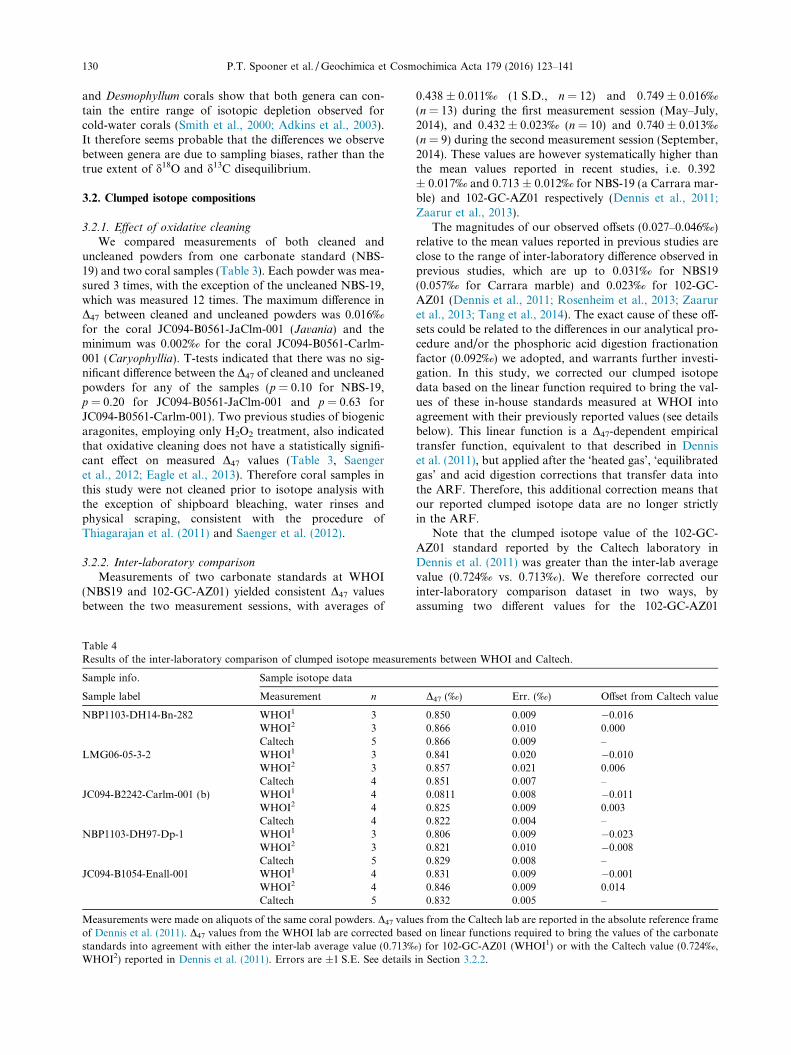
Table 4Results of the inter-laboratory comparison of clumped isotope measurements between WHOI and Caltech.
Sample info. Sample isotope data
Sample label Measurement n D47 (‰) Err. (‰) Offset from Caltech value
NBP1103-DH14-Bn-282 WHOI1 3 0.850 0.009 �0.016WHOI2 3 0.866 0.010 0.000Caltech 5 0.866 0.009 –
LMG06-05-3-2 WHOI1 3 0.841 0.020 �0.010WHOI2 3 0.857 0.021 0.006Caltech 4 0.851 0.007 –
JC094-B2242-Carlm-001 (b) WHOI1 4 0.0811 0.008 �0.011WHOI2 4 0.825 0.009 0.003Caltech 4 0.822 0.004 –
NBP1103-DH97-Dp-1 WHOI1 3 0.806 0.009 �0.023WHOI2 3 0.821 0.010 �0.008Caltech 5 0.829 0.008 –
JC094-B1054-Enall-001 WHOI1 4 0.831 0.009 �0.001WHOI2 4 0.846 0.009 0.014Caltech 5 0.832 0.005 –
Measurements were made on aliquots of the same coral powders. D47 values from the Caltech lab are reported in the absolute reference frameof Dennis et al. (2011). D47 values from the WHOI lab are corrected based on linear functions required to bring the values of the carbonatestandards into agreement with either the inter-lab average value (0.713‰) for 102-GC-AZ01 (WHOI1) or with the Caltech value (0.724‰,WHOI2) reported in Dennis et al. (2011). Errors are ±1 S.E. See details in Section 3.2.2.
130 P.T. Spooner et al. /Geochimica et Cosmochimica Acta 179 (2016) 123–141
standard, i.e. 0.713‰ and 0.724‰. We evaluated therobustness of these corrections based on comparisons withmeasurements made at both WHOI and Caltech on fivehomogenised coral powders (Section 2.3.).
Excellent agreement was observed between the WHOIand Caltech measurements of these five coral powders, whenwe corrected our data using the 0.724‰ value for 102-GC-AZ01, i.e. the value specifically from the Caltech laboratory(Dennis et al., 2011) (Fig. 2, Table 4). Such agreement high-lights the usefulness of using carbonate standards to removeinter-lab bias, which can exist despite converting all mea-surements into the ARF. Given these results, and our aimof comparing our values with previous measurements madeat Caltech (Thiagarajan et al., 2011), all data measured atWHOI presented in this study were corrected using the0.724‰ value for 102-GC-AZ01 (Table S2). Data correctedusing the inter-lab average value (0.713‰) are presented inthe Supplementary data (Table S3).
To compare our results with previous results of warm-water corals reported by Saenger et al. (2012) from the Yalelaboratory, we used their results reported in the ARF(Saenger et al., 2012). These authors also shared sampleswith Caltech, achieving consistent results between the twolabs. Therefore, the warm-water coral results in that studyshould also be comparable to our corrected results.
3.2.3. Clumped isotope compositions of cold-water corals
Our measured D47 values ranged from 0.797‰ to0.875‰ for corals covering a temperature range of 2.2–17.4 �C (Tables 1 and 2, Fig. 3). We include detailed sampleprovenance and the temperature and seawater chemistryestimates from each different source in the Supplementarymaterial (Table S1). Raw data of clumped isotope analyses,including all carbonate and gas standards’ values, are alsopresented in the Supplementary material (Tables S2 andS3).
We find that, while an overall temperature dependence isobserved, variations in D47 at any single temperature aregreater than found by Thiagarajan et al. (2011), probablydue to the larger number of individual specimens and gen-era analysed here. For example, the D47 of 15 corals col-lected from temperatures between 3 and 5 �C vary by0.06‰, equivalent to a 12 �C range in estimated tempera-ture using the calibration line of Ghosh et al. (2006). If datafrom Saenger et al. (2012) are included, this range increasesto 0.08‰. This range of D47 is significantly greater than ourmeasurement uncertainties (�0.006–0.008‰ 1 S.E. forsamples with multiple replicates, Section 2.3.). In contrast,we found no significant difference in D47 (<0.02‰)between the septa and theca for any of the 7 corals studied(Table 2).
−5 −4 −3 −2 −1 0 1
−16
−14
−12
−10
−8
−6
−4
−2
0
δ18Ocoral − δ18Oexpected (o/oo)
δ13C
cora
l − δ
13C
expe
cted
(o /oo)
Balanophyllia Caryophyllia Dasmosmilia Desmophyllum Enallopsammia Javania Astrangia Porites Balanophyllia Caryophyllia DesmophyllumFlabellumGardineriaLophelia
Fig. 1. Deviations of coral d13C and d18O from the expected equilibrium values. Equilibrium values were calculated based on the seawaterd13CHCO�
3and d18O values determined for each sample site and the isotope fractionation factors determined by Romanek et al. (1992) (for
d13C) and Grossman and Ku (1986) (for d18O). Shown as symbols are the bulk coral isotope measurements from this study, Thiagarajan et al.(2011) and Saenger et al. (2012). Also shown as lines are selections of data from Adkins et al. (2003) and Smith et al. (2000). Each linerepresents the best fit through multiple measurements on a single coral specimen, and is not extrapolated past the maximum and minimumd18O measured in the specimen. Zero offsets from the expected equilibrium for both d13C and d18O are shown as dashed black lines. Forsimplicity, errors bars for the stable isotope measurements are not shown in the figure, but are around ±0.6‰ 2 S.E. for d13C (based on theerror in Romanek et al., 1992) and ±0.2‰ 2 S.E. for d18O for the data symbols.
P.T. Spooner et al. /Geochimica et Cosmochimica Acta 179 (2016) 123–141 131
4. DISCUSSION
4.1. Inter-genus variations in cold-water coral D47
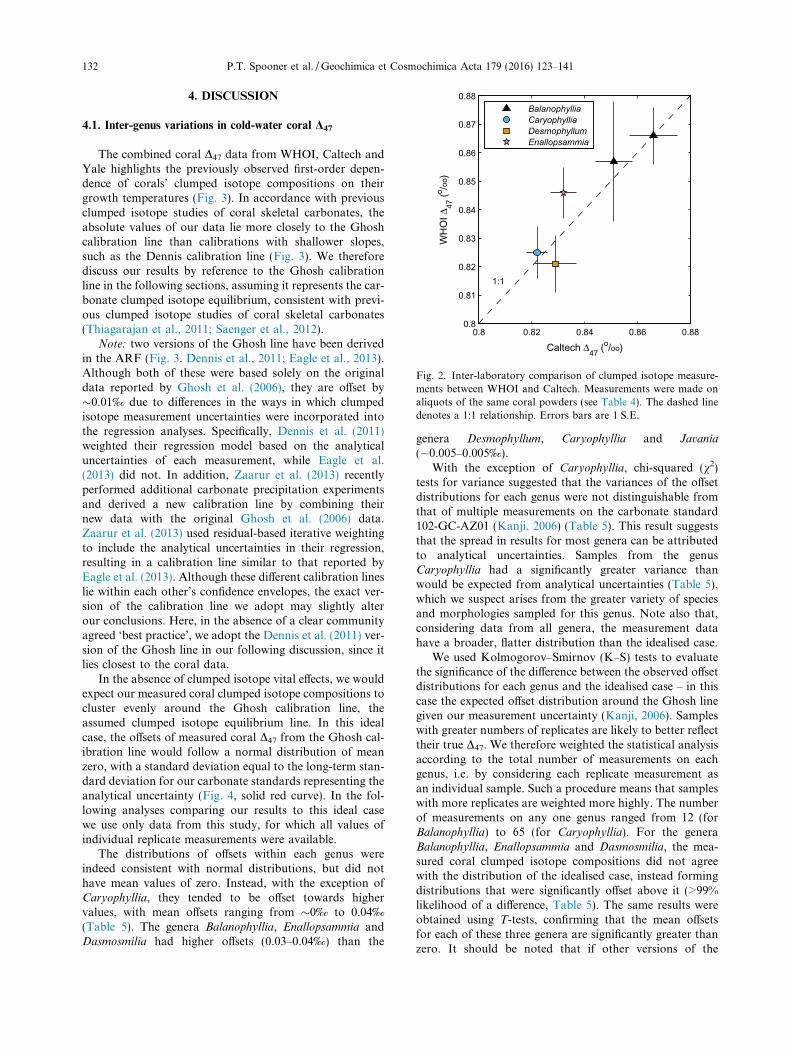
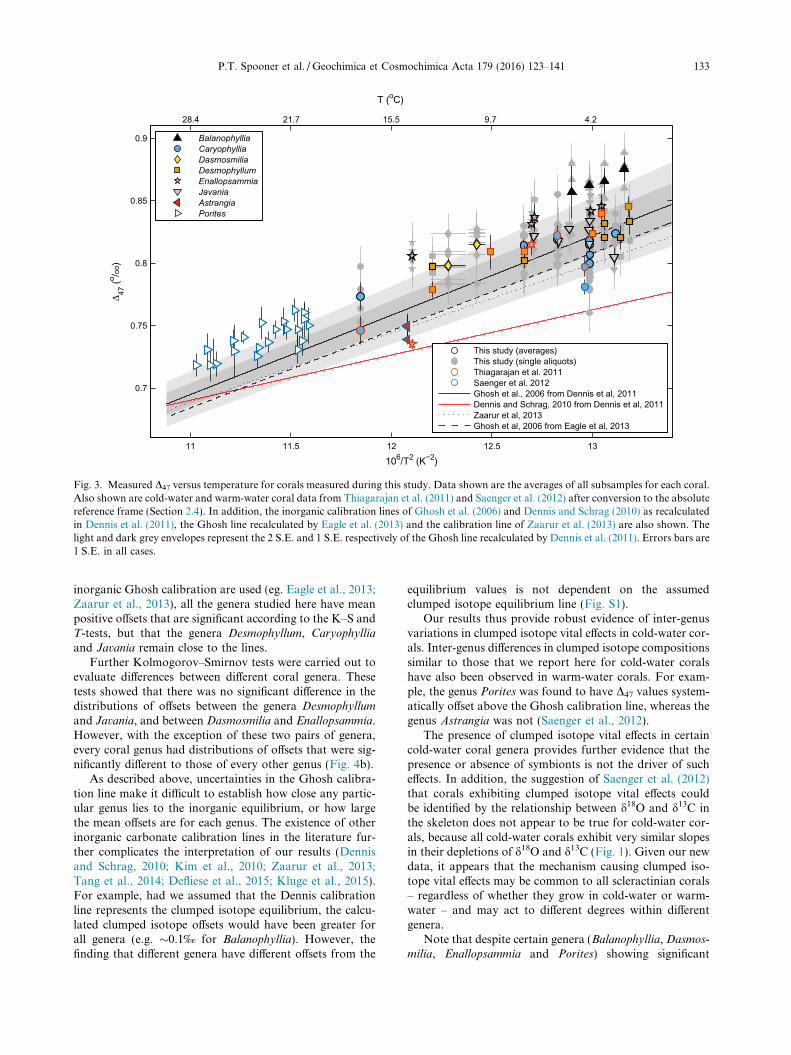
The combined coral D47 data from WHOI, Caltech andYale highlights the previously observed first-order depen-dence of corals’ clumped isotope compositions on theirgrowth temperatures (Fig. 3). In accordance with previousclumped isotope studies of coral skeletal carbonates, theabsolute values of our data lie more closely to the Ghoshcalibration line than calibrations with shallower slopes,such as the Dennis calibration line (Fig. 3). We thereforediscuss our results by reference to the Ghosh calibrationline in the following sections, assuming it represents the car-bonate clumped isotope equilibrium, consistent with previ-ous clumped isotope studies of coral skeletal carbonates(Thiagarajan et al., 2011; Saenger et al., 2012).
Note: two versions of the Ghosh line have been derivedin the ARF (Fig. 3. Dennis et al., 2011; Eagle et al., 2013).Although both of these were based solely on the originaldata reported by Ghosh et al. (2006), they are offset by�0.01‰ due to differences in the ways in which clumpedisotope measurement uncertainties were incorporated intothe regression analyses. Specifically, Dennis et al. (2011)weighted their regression model based on the analyticaluncertainties of each measurement, while Eagle et al.(2013) did not. In addition, Zaarur et al. (2013) recentlyperformed additional carbonate precipitation experimentsand derived a new calibration line by combining theirnew data with the original Ghosh et al. (2006) data.Zaarur et al. (2013) used residual-based iterative weightingto include the analytical uncertainties in their regression,resulting in a calibration line similar to that reported byEagle et al. (2013). Although these different calibration lineslie within each other’s confidence envelopes, the exact ver-sion of the calibration line we adopt may slightly alterour conclusions. Here, in the absence of a clear communityagreed ‘best practice’, we adopt the Dennis et al. (2011) ver-sion of the Ghosh line in our following discussion, since itlies closest to the coral data.
In the absence of clumped isotope vital effects, we wouldexpect our measured coral clumped isotope compositions tocluster evenly around the Ghosh calibration line, theassumed clumped isotope equilibrium line. In this idealcase, the offsets of measured coral D47 from the Ghosh cal-ibration line would follow a normal distribution of meanzero, with a standard deviation equal to the long-term stan-dard deviation for our carbonate standards representing theanalytical uncertainty (Fig. 4, solid red curve). In the fol-lowing analyses comparing our results to this ideal casewe use only data from this study, for which all values ofindividual replicate measurements were available.
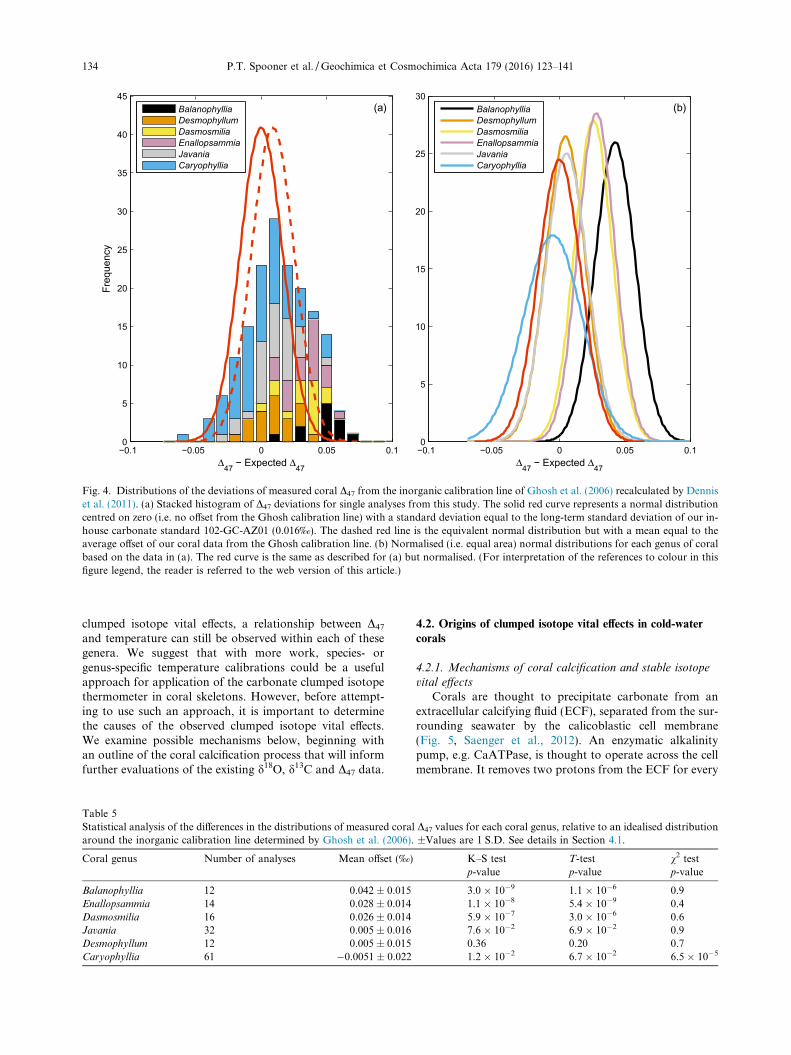
The distributions of offsets within each genus wereindeed consistent with normal distributions, but did nothave mean values of zero. Instead, with the exception ofCaryophyllia, they tended to be offset towards highervalues, with mean offsets ranging from �0‰ to 0.04‰(Table 5). The genera Balanophyllia, Enallopsammia andDasmosmilia had higher offsets (0.03–0.04‰) than the
genera Desmophyllum, Caryophyllia and Javania
(�0.005–0.005‰).With the exception of Caryophyllia, chi-squared (v2)
tests for variance suggested that the variances of the offsetdistributions for each genus were not distinguishable fromthat of multiple measurements on the carbonate standard102-GC-AZ01 (Kanji, 2006) (Table 5). This result suggeststhat the spread in results for most genera can be attributedto analytical uncertainties. Samples from the genusCaryophyllia had a significantly greater variance thanwould be expected from analytical uncertainties (Table 5),which we suspect arises from the greater variety of speciesand morphologies sampled for this genus. Note also that,considering data from all genera, the measurement datahave a broader, flatter distribution than the idealised case.
We used Kolmogorov–Smirnov (K–S) tests to evaluatethe significance of the difference between the observed offsetdistributions for each genus and the idealised case – in thiscase the expected offset distribution around the Ghosh linegiven our measurement uncertainty (Kanji, 2006). Sampleswith greater numbers of replicates are likely to better reflecttheir true D47. We therefore weighted the statistical analysisaccording to the total number of measurements on eachgenus, i.e. by considering each replicate measurement asan individual sample. Such a procedure means that sampleswith more replicates are weighted more highly. The numberof measurements on any one genus ranged from 12 (forBalanophyllia) to 65 (for Caryophyllia). For the generaBalanophyllia, Enallopsammia and Dasmosmilia, the mea-sured coral clumped isotope compositions did not agreewith the distribution of the idealised case, instead formingdistributions that were significantly offset above it (>99%likelihood of a difference, Table 5). The same results wereobtained using T-tests, confirming that the mean offsetsfor each of these three genera are significantly greater thanzero. It should be noted that if other versions of the
0.8 0.82 0.84 0.86 0.880.8
0.81
0.82
0.83
0.84
0.85
0.86
0.87
0.88
Caltech Δ47 (o/oo)
WH
OIΔ
47 (o /o
o)
1:1
Balanophyllia Caryophyllia Desmophyllum Enallopsammia
Fig. 2. Inter-laboratory comparison of clumped isotope measure-ments between WHOI and Caltech. Measurements were made onaliquots of the same coral powders (see Table 4). The dashed linedenotes a 1:1 relationship. Errors bars are 1 S.E.
132 P.T. Spooner et al. /Geochimica et Cosmochimica Acta 179 (2016) 123–141
inorganic Ghosh calibration are used (eg. Eagle et al., 2013;Zaarur et al., 2013), all the genera studied here have meanpositive offsets that are significant according to the K–S andT-tests, but that the genera Desmophyllum, Caryophyllia
and Javania remain close to the lines.Further Kolmogorov–Smirnov tests were carried out to
evaluate differences between different coral genera. Thesetests showed that there was no significant difference in thedistributions of offsets between the genera Desmophyllum
and Javania, and between Dasmosmilia and Enallopsammia.However, with the exception of these two pairs of genera,every coral genus had distributions of offsets that were sig-nificantly different to those of every other genus (Fig. 4b).
As described above, uncertainties in the Ghosh calibra-tion line make it difficult to establish how close any partic-ular genus lies to the inorganic equilibrium, or how largethe mean offsets are for each genus. The existence of otherinorganic carbonate calibration lines in the literature fur-ther complicates the interpretation of our results (Dennisand Schrag, 2010; Kim et al., 2010; Zaarur et al., 2013;Tang et al., 2014; Defliese et al., 2015; Kluge et al., 2015).For example, had we assumed that the Dennis calibrationline represents the clumped isotope equilibrium, the calcu-lated clumped isotope offsets would have been greater forall genera (e.g. �0.1‰ for Balanophyllia). However, thefinding that different genera have different offsets from the
equilibrium values is not dependent on the assumedclumped isotope equilibrium line (Fig. S1).
Our results thus provide robust evidence of inter-genusvariations in clumped isotope vital effects in cold-water cor-als. Inter-genus differences in clumped isotope compositionssimilar to those that we report here for cold-water coralshave also been observed in warm-water corals. For exam-ple, the genus Porites was found to have D47 values system-atically offset above the Ghosh calibration line, whereas thegenus Astrangia was not (Saenger et al., 2012).
The presence of clumped isotope vital effects in certaincold-water coral genera provides further evidence that thepresence or absence of symbionts is not the driver of sucheffects. In addition, the suggestion of Saenger et al. (2012)that corals exhibiting clumped isotope vital effects couldbe identified by the relationship between d18O and d13C inthe skeleton does not appear to be true for cold-water cor-als, because all cold-water corals exhibit very similar slopesin their depletions of d18O and d13C (Fig. 1). Given our newdata, it appears that the mechanism causing clumped iso-tope vital effects may be common to all scleractinian corals– regardless of whether they grow in cold-water or warm-water – and may act to different degrees within differentgenera.
Note that despite certain genera (Balanophyllia, Dasmos-
milia, Enallopsammia and Porites) showing significant
106/T2 (K−2)
Δ 47 (o /o
o)4.29.715.521.728.4
T (oC)
11 11.5 12 12.5 13
0.7
0.75
0.8
0.85
0.9 Balanophyllia Caryophyllia Dasmosmilia Desmophyllum Enallopsammia Javania Astrangia Porites
This study (averages)This study (single aliquots)Thiagarajan et al. 2011Saenger et al. 2012Ghosh et al., 2006 from Dennis et al, 2011Dennis and Schrag, 2010 from Dennis et al, 2011Zaarur et al, 2013Ghosh et al, 2006 from Eagle et al, 2013
Fig. 3. Measured D47 versus temperature for corals measured during this study. Data shown are the averages of all subsamples for each coral.Also shown are cold-water and warm-water coral data from Thiagarajan et al. (2011) and Saenger et al. (2012) after conversion to the absolutereference frame (Section 2.4). In addition, the inorganic calibration lines of Ghosh et al. (2006) and Dennis and Schrag (2010) as recalculatedin Dennis et al. (2011), the Ghosh line recalculated by Eagle et al. (2013) and the calibration line of Zaarur et al. (2013) are also shown. Thelight and dark grey envelopes represent the 2 S.E. and 1 S.E. respectively of the Ghosh line recalculated by Dennis et al. (2011). Errors bars are1 S.E. in all cases.
P.T. Spooner et al. /Geochimica et Cosmochimica Acta 179 (2016) 123–141 133
clumped isotope vital effects, a relationship between D47
and temperature can still be observed within each of thesegenera. We suggest that with more work, species- orgenus-specific temperature calibrations could be a usefulapproach for application of the carbonate clumped isotopethermometer in coral skeletons. However, before attempt-ing to use such an approach, it is important to determinethe causes of the observed clumped isotope vital effects.We examine possible mechanisms below, beginning withan outline of the coral calcification process that will informfurther evaluations of the existing d18O, d13C and D47 data.
4.2. Origins of clumped isotope vital effects in cold-water
corals
4.2.1. Mechanisms of coral calcification and stable isotope
vital effects
Corals are thought to precipitate carbonate from anextracellular calcifying fluid (ECF), separated from the sur-rounding seawater by the calicoblastic cell membrane(Fig. 5, Saenger et al., 2012). An enzymatic alkalinitypump, e.g. CaATPase, is thought to operate across the cellmembrane. It removes two protons from the ECF for every
−0.1 −0.05 0 0.05 0.10
5
10
15
20
25
30
35
40
45
Δ47 − Expected Δ47
Freq
uenc
y(a)Balanophyllia
DesmophyllumDasmosmiliaEnallopsammiaJavaniaCaryophyllia
−0.1 −0.05 0 0.05 0.10
5
10
15
20
25
30
Δ47 − Expected Δ47
(b)BalanophylliaDesmophyllumDasmosmiliaEnallopsammiaJavaniaCaryophyllia
Fig. 4. Distributions of the deviations of measured coral D47 from the inorganic calibration line of Ghosh et al. (2006) recalculated by Denniset al. (2011). (a) Stacked histogram of D47 deviations for single analyses from this study. The solid red curve represents a normal distributioncentred on zero (i.e. no offset from the Ghosh calibration line) with a standard deviation equal to the long-term standard deviation of our in-house carbonate standard 102-GC-AZ01 (0.016‰). The dashed red line is the equivalent normal distribution but with a mean equal to theaverage offset of our coral data from the Ghosh calibration line. (b) Normalised (i.e. equal area) normal distributions for each genus of coralbased on the data in (a). The red curve is the same as described for (a) but normalised. (For interpretation of the references to colour in thisfigure legend, the reader is referred to the web version of this article.)
Table 5Statistical analysis of the differences in the distributions of measured coral D47 values for each coral genus, relative to an idealised distributionaround the inorganic calibration line determined by Ghosh et al. (2006). ±Values are 1 S.D. See details in Section 4.1.
Coral genus Number of analyses Mean offset (‰) K–S testp-value
T-testp-value
v2 testp-value
Balanophyllia 12 0.042 ± 0.015 3.0 � 10�9 1.1 � 10�6 0.9Enallopsammia 14 0.028 ± 0.014 1.1 � 10�8 5.4 � 10�9 0.4Dasmosmilia 16 0.026 ± 0.014 5.9 � 10�7 3.0 � 10�6 0.6Javania 32 0.005 ± 0.016 7.6 � 10�2 6.9 � 10�2 0.9Desmophyllum 12 0.005 ± 0.015 0.36 0.20 0.7Caryophyllia 61 �0.0051 ± 0.022 1.2 � 10�2 6.7 � 10�2 6.5 � 10�5
134 P.T. Spooner et al. /Geochimica et Cosmochimica Acta 179 (2016) 123–141
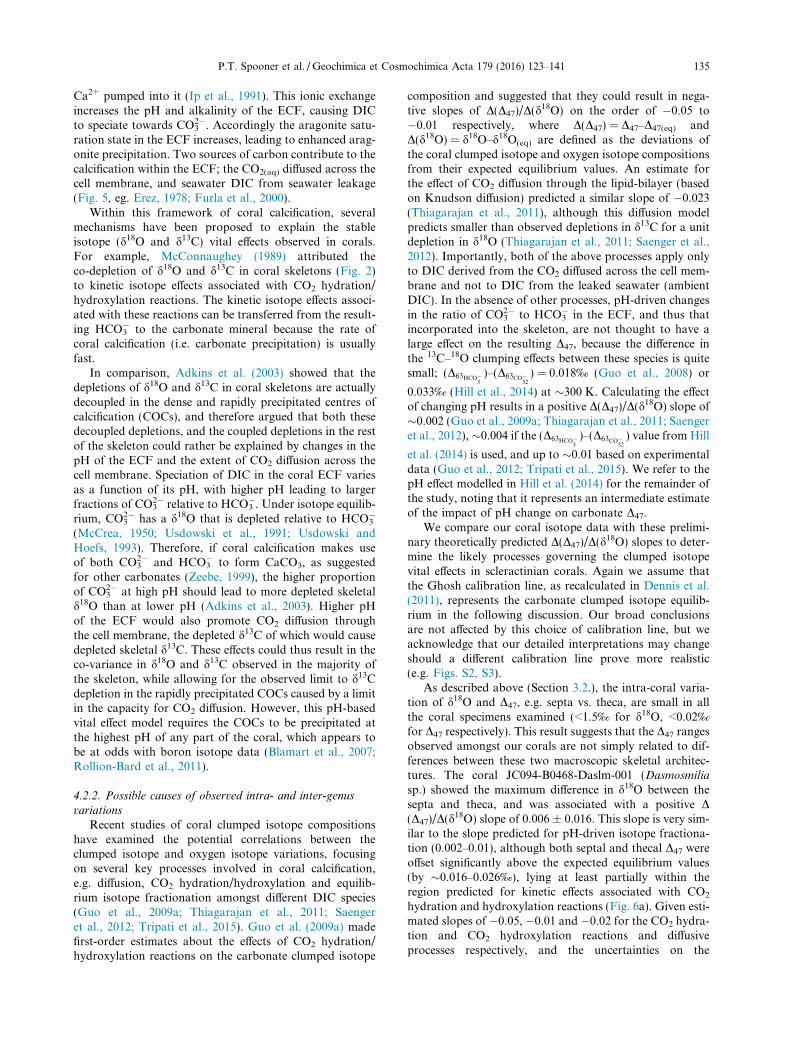
Ca2+ pumped into it (Ip et al., 1991). This ionic exchangeincreases the pH and alkalinity of the ECF, causing DICto speciate towards CO3
2�. Accordingly the aragonite satu-ration state in the ECF increases, leading to enhanced arag-onite precipitation. Two sources of carbon contribute to thecalcification within the ECF; the CO2(aq) diffused across thecell membrane, and seawater DIC from seawater leakage(Fig. 5, eg. Erez, 1978; Furla et al., 2000).
Within this framework of coral calcification, severalmechanisms have been proposed to explain the stableisotope (d18O and d13C) vital effects observed in corals.For example, McConnaughey (1989) attributed theco-depletion of d18O and d13C in coral skeletons (Fig. 2)to kinetic isotope effects associated with CO2 hydration/hydroxylation reactions. The kinetic isotope effects associ-ated with these reactions can be transferred from the result-ing HCO3
� to the carbonate mineral because the rate ofcoral calcification (i.e. carbonate precipitation) is usuallyfast.
In comparison, Adkins et al. (2003) showed that thedepletions of d18O and d13C in coral skeletons are actuallydecoupled in the dense and rapidly precipitated centres ofcalcification (COCs), and therefore argued that both thesedecoupled depletions, and the coupled depletions in the restof the skeleton could rather be explained by changes in thepH of the ECF and the extent of CO2 diffusion across thecell membrane. Speciation of DIC in the coral ECF variesas a function of its pH, with higher pH leading to largerfractions of CO3
2� relative to HCO3�. Under isotope equilib-
rium, CO32� has a d18O that is depleted relative to HCO3
�
(McCrea, 1950; Usdowski et al., 1991; Usdowski andHoefs, 1993). Therefore, if coral calcification makes useof both CO3
2� and HCO3� to form CaCO3, as suggested
for other carbonates (Zeebe, 1999), the higher proportionof CO3
2� at high pH should lead to more depleted skeletald18O than at lower pH (Adkins et al., 2003). Higher pHof the ECF would also promote CO2 diffusion throughthe cell membrane, the depleted d13C of which would causedepleted skeletal d13C. These effects could thus result in theco-variance in d18O and d13C observed in the majority ofthe skeleton, while allowing for the observed limit to d13Cdepletion in the rapidly precipitated COCs caused by a limitin the capacity for CO2 diffusion. However, this pH-basedvital effect model requires the COCs to be precipitated atthe highest pH of any part of the coral, which appears tobe at odds with boron isotope data (Blamart et al., 2007;Rollion-Bard et al., 2011).
4.2.2. Possible causes of observed intra- and inter-genus
variations
Recent studies of coral clumped isotope compositionshave examined the potential correlations between theclumped isotope and oxygen isotope variations, focusingon several key processes involved in coral calcification,e.g. diffusion, CO2 hydration/hydroxylation and equilib-rium isotope fractionation amongst different DIC species(Guo et al., 2009a; Thiagarajan et al., 2011; Saengeret al., 2012; Tripati et al., 2015). Guo et al. (2009a) madefirst-order estimates about the effects of CO2 hydration/hydroxylation reactions on the carbonate clumped isotope
composition and suggested that they could result in nega-tive slopes of D(D47)/D(d
18O) on the order of �0.05 to�0.01 respectively, where D(D47) = D47–D47(eq) andD(d18O) = d18O–d18O(eq) are defined as the deviations ofthe coral clumped isotope and oxygen isotope compositionsfrom their expected equilibrium values. An estimate forthe effect of CO2 diffusion through the lipid-bilayer (basedon Knudson diffusion) predicted a similar slope of �0.023(Thiagarajan et al., 2011), although this diffusion modelpredicts smaller than observed depletions in d13C for a unitdepletion in d18O (Thiagarajan et al., 2011; Saenger et al.,2012). Importantly, both of the above processes apply onlyto DIC derived from the CO2 diffused across the cell mem-brane and not to DIC from the leaked seawater (ambientDIC). In the absence of other processes, pH-driven changesin the ratio of CO3
2� to HCO3� in the ECF, and thus that
incorporated into the skeleton, are not thought to have alarge effect on the resulting D47, because the difference inthe 13C–18O clumping effects between these species is quitesmall; (D63HCO�
3)–(D63CO�
32) = 0.018‰ (Guo et al., 2008) or
0.033‰ (Hill et al., 2014) at �300 K. Calculating the effectof changing pH results in a positive D(D47)/D(d
18O) slope of�0.002 (Guo et al., 2009a; Thiagarajan et al., 2011; Saengeret al., 2012), �0.004 if the (D63HCO�
3)–(D63CO�
32) value from Hill
et al. (2014) is used, and up to �0.01 based on experimentaldata (Guo et al., 2012; Tripati et al., 2015). We refer to thepH effect modelled in Hill et al. (2014) for the remainder ofthe study, noting that it represents an intermediate estimateof the impact of pH change on carbonate D47.
We compare our coral isotope data with these prelimi-nary theoretically predicted D(D47)/D(d
18O) slopes to deter-mine the likely processes governing the clumped isotopevital effects in scleractinian corals. Again we assume thatthe Ghosh calibration line, as recalculated in Dennis et al.(2011), represents the carbonate clumped isotope equilib-rium in the following discussion. Our broad conclusionsare not affected by this choice of calibration line, but weacknowledge that our detailed interpretations may changeshould a different calibration line prove more realistic(e.g. Figs. S2, S3).
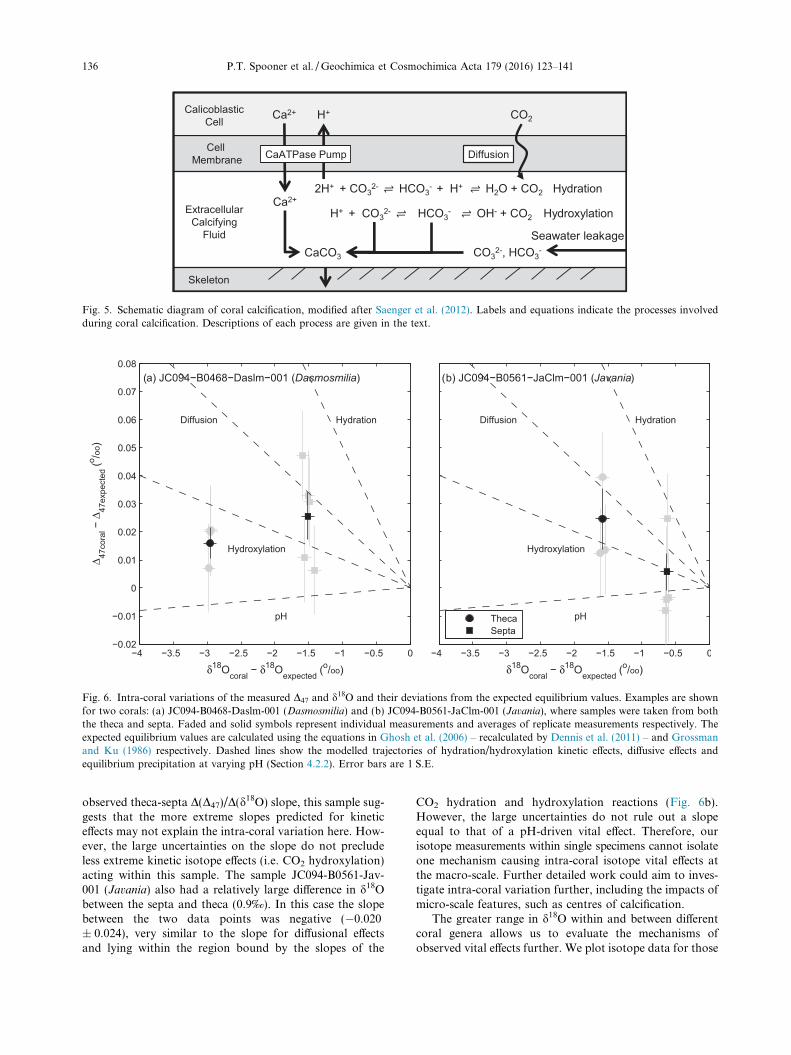
As described above (Section 3.2.), the intra-coral varia-tion of d18O and D47, e.g. septa vs. theca, are small in allthe coral specimens examined (<1.5‰ for d18O, <0.02‰for D47 respectively). This result suggests that the D47 rangesobserved amongst our corals are not simply related to dif-ferences between these two macroscopic skeletal architec-tures. The coral JC094-B0468-Daslm-001 (Dasmosmilia
sp.) showed the maximum difference in d18O between thesepta and theca, and was associated with a positive D(D47)/D(d
18O) slope of 0.006 ± 0.016. This slope is very sim-ilar to the slope predicted for pH-driven isotope fractiona-tion (0.002–0.01), although both septal and thecal D47 wereoffset significantly above the expected equilibrium values(by �0.016–0.026‰), lying at least partially within theregion predicted for kinetic effects associated with CO2
hydration and hydroxylation reactions (Fig. 6a). Given esti-mated slopes of �0.05, �0.01 and �0.02 for the CO2 hydra-tion and CO2 hydroxylation reactions and diffusiveprocesses respectively, and the uncertainties on the
P.T. Spooner et al. /Geochimica et Cosmochimica Acta 179 (2016) 123–141 135
observed theca-septa D(D47)/D(d18O) slope, this sample sug-
gests that the more extreme slopes predicted for kineticeffects may not explain the intra-coral variation here. How-ever, the large uncertainties on the slope do not precludeless extreme kinetic isotope effects (i.e. CO2 hydroxylation)acting within this sample. The sample JC094-B0561-Jav-001 (Javania) also had a relatively large difference in d18Obetween the septa and theca (0.9‰). In this case the slopebetween the two data points was negative (�0.020± 0.024), very similar to the slope for diffusional effectsand lying within the region bound by the slopes of the
CO2 hydration and hydroxylation reactions (Fig. 6b).However, the large uncertainties do not rule out a slopeequal to that of a pH-driven vital effect. Therefore, ourisotope measurements within single specimens cannot isolateone mechanism causing intra-coral isotope vital effects atthe macro-scale. Further detailed work could aim to inves-tigate intra-coral variation further, including the impacts ofmicro-scale features, such as centres of calcification.
The greater range in d18O within and between differentcoral genera allows us to evaluate the mechanisms ofobserved vital effects further. We plot isotope data for those
Fig. 5. Schematic diagram of coral calcification, modified after Saenger et al. (2012). Labels and equations indicate the processes involvedduring coral calcification. Descriptions of each process are given in the text.
Fig. 6. Intra-coral variations of the measured D47 and d18O and their deviations from the expected equilibrium values. Examples are shownfor two corals: (a) JC094-B0468-Daslm-001 (Dasmosmilia) and (b) JC094-B0561-JaClm-001 (Javania), where samples were taken from boththe theca and septa. Faded and solid symbols represent individual measurements and averages of replicate measurements respectively. Theexpected equilibrium values are calculated using the equations in Ghosh et al. (2006) – recalculated by Dennis et al. (2011) – and Grossmanand Ku (1986) respectively. Dashed lines show the modelled trajectories of hydration/hydroxylation kinetic effects, diffusive effects andequilibrium precipitation at varying pH (Section 4.2.2). Error bars are 1 S.E.
136 P.T. Spooner et al. /Geochimica et Cosmochimica Acta 179 (2016) 123–141

genera that exhibit d18O depletions large enough to estab-lish relationships between D(D47) and D(d18O) in Fig. 7a,and plot data for the other genera separately in Fig. 7b.In general, warm-water corals appear to exhibit a largerdepletion in d18O than cold-water corals despite similarranges in D(D47). All genera appear to be consistentwith near-zero slopes of D(D47)/D(d
18O), but as previously
highlighted, different genera have different offsets from theexpected D47 equilibrium, suggesting differences in the vitaleffect mechanisms between them. For example, a line ofbest fit through the Desmophyllum data (WHOI andCaltech) has a slope of �0.0013 ± 0.0024 and an interceptof 0.0066 ± 0.0045, suggesting variations in the pH of theECF are a primary control on the variability of d18O and
(a)
(b)
Fig. 7. Deviations of the measured coral D47 and d18O from the expected equilibrium values for different coral genera. (a) Subsample (i.e.theca or septa) averages for coral genera with >1‰ depletions in d18O. (b) Subsample (i.e. theca or septa) averages for coral genera with <1‰depletions in d18O; other genera are shown as faded symbols. Also shown are cold-water and warm-water coral data from Thiagarajan et al.(2011) and Saenger et al. (2012) after conversion to the absolute reference frame (Section 2.4). The expected equilibrium values are calculatedusing the equations in Ghosh et al. (2006) – recalculated by Dennis et al. (2011) – and Grossman and Ku (1986) respectively. Dashed linesshow the modelled trajectories of hydration/hydroxylation kinetic effects, diffusive effects and equilibrium precipitation at varying pH(Section 4.2.2). Error bars are 1 S.E.
P.T. Spooner et al. /Geochimica et Cosmochimica Acta 179 (2016) 123–141 137
D47 amongst the different individuals of this genus. Thewarm-water genus Astrangia could also be consistent withthis pattern. However, given the uncertainties associatedwith the Ghosh line described previously, it is possible thatthe D47 of the genus Desmophyllum may also be systemati-cally above the clumped isotope equilibrium (Figs. S2, S3).Better constraints on the inorganic equilibrium line will beneeded to fully address this question.
The cold-water genera Balanophyllia, Dasmosmilia andEnallopsammia seem to be inconsistentwith pHbeing the soledriver of isotope variations, lying in the region broadly cov-ered by the first-order models of the effects of CO2 hydra-tion/hydroxylation and/or diffusion (Fig. 7a). Thisobservation is also true for the two data points for the generaCaryophyllia and Javania that have d18O depletions of >1‰(Fig. 7b). The warm-water genus Porites exhibits similarD47 offsets to the cold-water corals in Fig. 7a, ranging from�0–0.04‰, suggesting that a similar range of D47 vital effectscould be in operation for both groups of corals. As notedabove, the diffusion model predicts smaller than observeddepletions in d13C per unit depletion in d18O (Thiagarajanet al., 2011; Saenger et al., 2012). Therefore, kinetic effectsassociated with CO2 hydration/hydroxylation reactionswould appear to be the more likely candidate for causingthe clumped isotope vital effects observed for these samples.
Of course, it is likely that multiple processes act in con-cert during coral calcification and simultaneously affect theisotope composition of coral skeleton, producing the wholerange of isotope signatures observed, including the genus-specific differences observed here. If true, this may compli-cate the comparison between the experimental data and themodel predicted D(D47)/D(d
18O) slopes for each individualprocess acting independently. Future modelling workshould aim to systematically take into account the effectsof multiple processes in order to more accurately constrainthe role of each process in determining the isotope compo-sition of coral skeletons, and to test whether species- orgenus-specific calibration of clumped isotope thermometerswould be appropriate.
5. CONCLUSIONS
We have tested the calibration of the carbonate clumpedisotope thermometer in cold-water scleractinian corals,using a new set of samples that includes six of coral genera.We validated our clumped isotope data by directly compar-ing measurements made in two different laboratories(WHOI and Caltech) on the same sample powders. Wefound excellent agreement between laboratories once thedata were normalised with reference to the in-house carbon-ate standards, suggesting that this normalisation may be auseful way to remove inter-laboratory biases which werenot removed by converting clumped isotope data into theabsolute reference frame.
We show that some cold-water coral genera exhibitclumped isotope vital effects, with their D47 values consis-tently higher than the expected equilibrium values, similarto findings for some warm-water corals (Saenger et al.,2012). The similarity between cold-water and warm-water
corals with respect to the ranges of clumped isotope vitaleffects observed supports previous suggestions that thepresence or absence of symbiotic algae is not a governingfactor for clumped isotope vital effects in scleractiniancorals. Instead, we suggest that these vital effects aremost likely related to kinetic effects associated with CO2
hydration/hydroxylation reactions within the extracellularcalcifying fluid of the corals and are common to bothwarm- and cold-water corals. We found no significantdifference in D47 between the theca and septa of individualspecimens, suggesting that macro-scale skeletal features arenot related to variations in D47. Current uncertainty in theappropriate clumped isotope equilibrium line complicatesthe detailed interpretations of our results. However, the factthat the magnitudes of the clumped isotope offsets fromexpected equilibrium vary between different coral generais not dependent on the choice of clumped isotopeequilibrium line, and suggests that clumped isotope vitaleffects are present and expressed more in some genera thanothers. Further research into the differences betweendifferent inorganic calibration lines will be important indetermining the presence and causes of clumped isotopevital effects in any given coral genus.
Our data complicate the use of the carbonate clumpedisotope thermometer in corals, suggesting that it cannotbe straightforwardly applied across all species of cold-water coral without introducing significant uncertainty intoreconstructed temperatures. However, given the apparenttemperature dependence of D47, even in genera exhibitingsignificant clumped isotope vital effects, we suggest thatthe use of species-specific calibrations could still be a usefulapproach. In order to determine the reliability of this ther-mometer back through time, further work should also testit in fossil samples by comparison with other, independenttemperature proxies, such as the Li/Mg ratio in corals (Caseet al., 2010; Hathorne et al., 2013; Raddatz et al., 2013;Montagna et al., 2014).
ACKNOWLEDGEMENTS
We thank Prof. Benjamin H. Passey for generously providingthe 102-GC-AZ01 carbonate standard and help during the con-struction of the automated clumped isotope analysis system atWHOI and Professors John Eiler and Jess Adkins for providingthe facilities at Caltech for the inter-laboratory comparison studyand for helpful discussion. This work was supported by a BritishNational Environment Research Council studentship to P. Spooner(NE/K500823/1), National Science Foundation Grant NSF-ANT-1246387 and The Penzance Endowed Fund in Support of AssistantScientists (WHOI) to W. Guo, and by funds from the EuropeanResearch Council, the Leverhulme Trust and a Marie Curie Rein-tegration grant. Oxygen isotope analyses of seawater samples atBGS were funded by the NERC Isotope Geosciences FacilitiesSteering Committee.
APPENDIX A. SUPPLEMENTARY DATA
Supplementary data associated with this article can befound, in the online version, at http://dx.doi.org/10.1016/j.gca.2016.01.023.
138 P.T. Spooner et al. /Geochimica et Cosmochimica Acta 179 (2016) 123–141
REFERENCES
Adkins J. F., Boyle E. A., Curry W. B. and Lutringer A. (2003)Stable isotopes in deep-sea corals and a new mechanism for‘‘vital effects”. Geochim. Cosmochim. Acta 67, 1129–1143.
Alibert C. and McCulloch M. T. (1997) Strontium/calcium ratiosin modern Porites corals from the Great Barrier Reef as a proxyfor sea surface temperature: calibration of the thermometer andmonitoring of ENSO. Paleoceanography 12, 345–363.
Barker S., Cacho I., Benway H. and Tachikawa K. (2005)Planktonic foraminiferal Mg/Ca as a proxy for past oceanictemperatures: a methodological overview and data compilationfor the Last Glacial Maximum. Quat. Sci. Rev. 24, 821–834.
Blamart D., Rollion-Bard C., Meibom A., Cuif J. P., Juillet-LeclercA. and Dauphin Y. (2007) Correlation of boron isotopiccomposition with ultrastructure in the deep-sea coral Lopheliapertusa: implications for biomineralization and paleo-pH.Geochem. Geophys. Geosyst. 8, Q12001.
Burke A. and Robinson L. F. (2012) The Southern Ocean’ role incarbon exchange during the last deglaciation. Science 335, 557–561.
Burke A., Robinson L. F., McNichol A. P., Jenkins W. J., ScanlonK. M. and Gerlach D. S. (2010) Reconnaissance dating: a newradiocarbon method applied to assessing the temporal distri-bution of Southern Ocean deep-sea corals. Deep-Sea Res. Part
I-Oceanogr. Res. Pap. 57, 1510–1520.Cairns S. D. (2007) Deep-water corals: an overview with special
reference to diversity and distribution of deep-water Sclerac-tinian corals. Bull. Mar. Sci. 81, 311–322.
Came R. E., Eiler J. M., Veizer J., Azmy K., Brand U. andWeidman C. R. (2007) Coupling of surface temperatures andatmospheric CO2 concentrations during the Palaeozoic era.Nature 449, 198–201.
Came R. E., Brand U. and Affek H. P. (2014) Clumped isotopesignatures in modern brachiopod carbonate. Chem. Geol. 377,20–30.
Case D. H., Robinson L. F., Auro M. E. and Gagnon A. C. (2010)Environmental and biological controls on Mg and Li in deep-sea scleractinian corals. EPSL 300, 215–225.
Cheng H., Adkins J., Edwards R. L. and Boyle E. A. (2000) U–Thdating of deep-sea corals. Geochim. Cosmochim. Acta 64, 2401–2416.
Defliese W. F., Hren M. T. and Lohmann K. C. (2015) Compo-sitional and temperature effects of phosphoric acid fractiona-tion on D47 analysis and implications for discrepantcalibrations. Chem. Geol. 396, 51–60.
Dennis K. J. and Schrag D. P. (2010) Clumped isotope thermom-etry of carbonatites as an indicator of diagenetic alteration.Geochim. Cosmochim. Acta 74, 4110–4122.
Dennis K. J., Affek H. P., Passey B. H., Schrag D. P. and Eiler J.M. (2011) Defining an absolute reference frame for ‘clumped’isotope studies of CO2. Geochim. Cosmochim. Acta 75, 7117–7131.
Eagle R. A., Eiler J. M., Tripati A. K., Ries J. B., Freitas P. S.,Hiebenthal C., Wanamaker, Jr., A. D., Taviani M., Elliot M.,Marenssi S., Nakamura K., Ramirez P. and Roy K. (2013) Theinfluence of temperature and seawater carbonate saturationstate on C-13–O-18 bond ordering in bivalve mollusks.Biogeosciences 10, 4591–4606.
Eiler J. M. and Schauble E. (2004) (OCO)-O-18-C-13-O-16 inEarth’s atmosphere. Geochim. Cosmochim. Acta 68, 4767–4777.
Erez J. (1978) Vital effect on stable-isotope composition seen inforaminifera and coral skeletons. Nature 273, 199–202.
Falkowski P. G., Dubinsky Z., Muscatine L. and Porter J. W.(1984) Light and the bioenergetics of a symbiotic coral.Bioscience 34, 705–709.
Furla P., Galgani I., Durand I. and Allemand D. (2000) Sourcesand mechanisms of inorganic carbon transport for coralcalcification and photosynthesis. J. Exp. Biol. 203, 3445–3457.
Gagnon A. C., Adkins J. F., Fernandez D. P. and Robinson L. F.(2007) Sr/Ca and Mg/Ca vital effects correlated with skeletalarchitecture in a scleractinian deep-sea coral and the role ofRayleigh fractionation. EPSL 261, 280–295.
Gao P., Xu X., Zhou L., Pack M. A., Griffin S., Santos G. M.,Southon J. R. and Liu K. (2014) Rapid sample preparation ofdissolved inorganic carbon in natural waters using a headspace-extraction approach for radiocarbon analysis by acceleratormass spectrometry. Limnol. Oceanogr. 12, 174–190.
Ghosh P., Adkins J., Affek H., Balta B., Guo W. F., Schauble E.A., Schrag D. and Eller J. M. (2006) (13)C–(18)O bonds incarbonate minerals: a new kind of paleothermometer. Geochim.
Cosmochim. Acta 70, 1439–1456.Grossman E. L. and Ku T. L. (1986) Oxygen and carbon isotopic
fractionation in biogenic aragonite – temperature effects. Chem.
Geol. 59, 59–74.Guo W., Daeron M., Niles P., Genty D., Kim S. T., Vonhof H.,
Affek H., Wainer K., Blamart D. and Eiler J. (2008) C-13–O-18bonds in dissolved inorganic carbon: implications for carbonateclumped isotope thermometry. Geochim. Cosmochim. Acta 72.A336.
Guo W., Kim S., Thiagarajan N., Adkins J. F. and Eiler J. M.(2009) Mechanisms for ‘‘vital effects” in biogenic carbonates:new perspectives based on abundances of 13C–18O bonds. EosTrans. AGU 90, Fall Meet. Suppl. PP34B-07 (abstr.).
Guo W., Mosenfelder J. L., Goddard, III, W. A. and Eiler J. M.(2009b) Isotopic fractionations associated with phosphoric aciddigestion of carbonate minerals: insights from first-principlestheoretical modeling and clumped isotope measurements.Geochim. Cosmochim. Acta 73, 7203–7225.
Guo W., Kim S. T., Yuan J. and Farquhar J. B. P. (2012) 13C–18Obonds in dissolved inorganic carbon: toward a better under-standing of clumped isotope thermometer in biogenic carbon-ates. Mineral. Mag. 76, 1791.
Hathorne E. C., Felis T., Suzuki A., Kawahata H. and Cabioch G.(2013) Lithium in the aragonite skeletons of massive Poritescorals: A new tool to reconstruct tropical sea surface temper-atures. Paleoceanography 28, 143–152.
Henkes G. A., Passey B. H., Wanamaker, Jr., A. D., Grossman E.L., Ambrose, Jr., W. G. and Carroll M. L. (2013) Carbonateclumped isotope compositions of modern marine mollusk andbrachiopod shells. Geochim. Cosmochim. Acta 106, 307–325.
Hill P. S., Tripati A. K. and Schauble E. A. (2014) Theoreticalconstraints on the effects of pH, salinity, and temperature onclumped isotope signatures of dissolved inorganic carbonspecies and precipitating carbonate minerals. Geochim. Cos-
mochim. Acta 125, 610–652.Huntington K. W., Eiler J. M., Affek H. P., Guo W., Bonifacie M.,
Yeung L. Y., Thiagarajan N., Passey B., Tripati A., Daeron M.and Came R. (2009) Methods and limitations of ‘clumped’ CO2
isotope (Delta(47)) analysis by gas-source isotope ratio massspectrometry. J. Mass Spectr. 44, 1318–1329.
Ip Y. K., Lim A. L. L. and Lim R. W. L. (1991) Some properties ofcalcium-activated adenosine-triphosphate from the hermatypiccoral Galxea-fascicularis. Mar. Biol. 111, 191–197.
Kanji G. K. (2006) 100 Statistical Tests, 3 ed. SAGE PublicationsLtd.
Kim S. T., Guo W., Coplen T. B., Farquhar J. and Eiler J. M.(2010) Temperature dependence of C-13–O-18 clumping insynthetic aragonite: laboratory calibration. Geochim. Cos-
mochim. Acta 74. A517-A517.Kluge T., John C. M., Jourdan A. L., Davis S. and Crawshaw J.
(2015) Laboratory calibration of the calcium carbonate
P.T. Spooner et al. /Geochimica et Cosmochimica Acta 179 (2016) 123–141 139
clumped isotope thermometer in the 25–250 �C temperaturerange. Geochim. Cosmochim. Acta 157, 213–227.
Levitus S., Boyer T. P. (1994) World Ocean Atlas 1994 Volume 4:Temperature, number 4.
Lopez Correa M., Montagna P., Vendrell-Simon B., McCullochM. and Taviani M. (2010) Stable isotopes (delta O-18 and deltaC-13), trace and minor element compositions of recent scler-actinians and Last Glacial bivalves at the Santa Maria di Leucadeep-water coral province, Ionian Sea. Deep-Sea Res. Part Ii-
Topical Stud. Oceanogr. 57, 471–486.Lutringer A., Blamart D., Frank N. and Labeyrie L. (2005)
Paleotemperatures from deep-sea corals: scale effects. In 2nd
International Symposium on Deep-Sea Corals, Erlangen, Ger-
many. pp. 1081–1096.Marali S., Wisshak M., Lopez Correa M. and Freiwald A. (2013)
Skeletal microstructure and stable isotope signature of threebathyal solitary cold-water corals from the Azores. Palaeo-
geogr. Palaeoclimatol. Palaeoecol. 373, 25–38.Margolin A., Robinson L. F., Burke A., Waller R. G., Scanlon K.
M., Roberts M. L., Auro M. E. and van de Flierdt T. (2014)Temporal and spatial distributions of cold-water corals in theDrake Passage: insights from the last 35,000 years. Deep Sea
Res. Part II: Topical Stud. Oceanogr. 99, 237–248.McConnaughey T. (1989) 13C and 18O isotopic disequilibrium in
biological carbonates. 1. Patterns. Geochim. Cosmochim. Acta
53, 151–162.McCrea J. M. (1950) On the isotopic chemistry of carbonates and a
paleotemperature scale. J. Chem. Phys. 18, 849–857.Montagna P., McCulloch M., Douville E., Lopez Correa M.,
Trotter J., Rodolfo-Metalpa R., Dissard D., Ferrier-Pages C.,Frank N., Freiwald A., Goldstein S., Mazzoli C., Reynaud S.,Ruggeberg A., Russo S. and Taviani M. (2014) Li/Mgsystematics in scleractinian corals: calibration of the thermome-ter. Geochim. Cosmochim. Acta 132, 288–310.
Mook W. G., Bommerso J. C. and Staverma W. H. (1974) Carbonisotope fractionation between dissolved bicarbonate and gas-eous carbon-dioxide. EPSL 22, 169–176.
Mortensen P. B. and Rapp H. T. (1998) Oxygen and carbonisotope ratios related to growth line patterns in skeletons ofLophelia pertusa (L.) (Anthozoa, Scleractinia): implications fordetermination of linear extension rates. Sarsia 83, 433–446.
Petrizzo D. A., Young E. D. and Runnegar B. N. (2014)Implications of high-precision measurements of C-13–O-18bond ordering in CO2 for thermometry in modern bivalvedmollusc shells. Geochim. Cosmochim. Acta 142, 400–410.
Porter J. W., Muscatine L., Dubinsky Z. and Falkowski P. G.(1984) Primary production and photoadaptation in light-adapted and shade-adapted colonies of the sybiotic coral,Stylophora-pistillata. Proc. R. Soc. Lond. B-Biol. Sci. 222, 161–180.
Raddatz J., Liebetrau V., Rueggeberg A., Hathorne E., Krabben-hoeft A., Eisenhauer A., Boehm F., Vollstaedt H., Fietzke J.,Lopez Correa M., Freiwald A. and Dullo W. C. (2013) StableSr-isotope, Sr/Ca, Mg/Ca, Li/Ca and Mg/Li ratios in thescleractinian cold-water coral Lophelia pertusa. Chem. Geol.
352, 143–152.Roberts J. M. and Cairns S. D. (2014) Cold-water corals in a
changing ocean. Curr. Opin. Environ. Sustain. 7, 118–126.Roberts J. M., Wheeler A. J. and Freiwald A. (2006) Reefs of the
deep: the biology and geology of cold-water coral ecosystems.Science 312, 543–547.
Roberts J. M., Wheeler A. J., Freiwald A. and Cairns S. D. (2009)Cold-Water Corals: The Biology and Geology of Deep-Sea Coral
Habitats. Cambridge University Press, 368 p.Robinson L.F. (2014) RRS James Cook Cruise JC094, October 13–
November 30 2013, Tenerife-Trinidad. TROPICS, Tracing
Oceanic Processes using Corals and Sediments. Reconstructingabrupt changes in chemistry and circulation of the equatorialAtlantic Ocean: implications for global climate and deep-waterhabitats.
Robinson L. F., Adkins J. F., Frank N., Gagnon A. C., Prouty N.G., Roark E. B. and van de Flierdt T. (2014) The geochemistryof deep-sea coral skeletons: a review of vital effects andapplications for palaeoceanography. Deep-Sea Res. Part II-
Topical Stud. Oceanogr. 99, 184–198.Rollion-Bard C., Blamart D., Cuif J. P. and Juillet-Leclerc A.
(2003) Microanalysis of C and O isotopes of azooxanthellateand zooxanthellate corals by ion microprobe. Coral Reefs 22,405–415.
Rollion-Bard C., Blamart D., Cuif J.-P. and Dauphin Y. (2010) Insitu measurements of oxygen isotopic composition in deep-seacoral, Lophelia pertusa: re-examination of the current geochem-ical models of biomineralization. Geochim. Cosmochim. Acta
74, 1338–1349.Rollion-Bard C., Blamart D., Trebosc J., Tricot G., Mussi A. and
Cuif J.-P. (2011) Boron isotopes as pH proxy: a new look atboron speciation in deep-sea corals using B-11 MAS NMR andEELS. Geochim. Cosmochim. Acta 75, 1003–1012.
Romanek C. S., Grossman E. L. and Morse J. W. (1992) Carbonisotopic fractionation in synthetic aragonite and calcite – effectsof temperature and precipitation rate. Geochim. Cosmochim.
Acta 56, 419–430.Rosenheim B. E., Tang J. and Fernandez A. (2013) Measurement
of multiply substituted isotopologues (‘clumped isotopes’) ofCO2 using a 5 kV compact isotope ratio mass spectrometer:performance, reference frame, and carbonate paleothermome-try. Rapid Commun. Mass Spectrom. 27, 1847–1857.
Rueggeberg A., Fietzke J., Liebetrau V., Eisenhauer A., DulloW.-C. and Freiwald A. (2008) Stable strontium isotopes (deltaSr-88/86) in cold-water corals – a new proxy for reconstruc-tion of intermediate ocean water temperatures. EPSL 269,569–574.
Saenger C., Affek H. P., Felis T., Thiagarajan N., Lough J. M. andHolcomb M. (2012) Carbonate clumped isotope variability inshallow water corals: temperature dependence and growth-related vital effects. Geochim. Cosmochim. Acta 99, 224–242.
Schmidt G. A., Bigg G. R. and Rohling E.J. (1999) GlobalSeawater Oxygen-18 Database – v1.21. http://data.giss.nasa.-gov/o18data/.
Smith J. E., Schwarcz H. P., Risk M. J., McConnaughey T. A. andKeller N. (2000) Paleotemperatures from deep-sea corals:overcoming ‘vital effects’. Palaios 15, 25–32.
Spiro B., Roberts M., Gage J. and Chenery S. (2000) O-18/O-16and C-13/C-12 in an ahermatypic deepwater coral Lophelia
pertusa from the North Atlantic: a case of disequilibriumisotope fractionation. Rapid Commun. Mass Spectrom. 14,1332–1336.
Stanley G. D. J. and Cairns S. D. (1988) Constructional azoox-anthellate coral communities: an overview with implications forthe fossil record. Palaios 3, 233–242.
Tang J., Dietzel M., Fernandez A., Tripati A. K. and RosenheimB. E. (2014) Evaluation of kinetic effects on clumped isotopefractionation (Delta(47)) during inorganic calcite precipitation.Geochim. Cosmochim. Acta 134, 120–136.
Thiagarajan N., Adkins J. and Eiler J. (2011) Carbonate clumpedisotope thermometry of deep-sea corals and implications forvital effects. Geochim. Cosmochim. Acta 75, 4416–4425.
Thiagarajan N., Subhas A. V., Southon J. R., Eiler J. M. andAdkins J. F. (2014) Abrupt pre-Bolling-Allerod warming andcirculation changes in the deep ocean. Nature 511, 75–78.
Tripati A. K., Eagle R. A., Thiagarajan N., Gagnon A. C., BauchH., Halloran P. R. and Eiler J. M. (2010) C-13–O-18 isotope
140 P.T. Spooner et al. /Geochimica et Cosmochimica Acta 179 (2016) 123–141

signatures and ‘clumped isotope’ thermometry in foraminiferaand coccoliths. Geochim. Cosmochim. Acta 74, 5697–5717.
Tripati A. K., Hill P. S., Eagle R. A., Mosenfelder J. L., Tang J.,Schauble E. A., Eiler J. M., Zeebe R. E., Uchikawa J., CoplenT. B., Ries J. B. and Henry D. (2015) Beyond temperature:clumped isotope signatures in dissolved inorganic carbonspecies and the influence of solution chemistry on carbonatemineral composition. Geochim. Cosmochim. Acta 166, 344–371.
Usdowski E. and Hoefs J. (1993) Oxygen-isotope exchangebetween carbonic-acid, bicarbonate, carbonate, and water – areexamination of the data of McCrea (1950) and an expressionfor the overall partitioning of oxygen isotopes between thecarbonate species and water. Geochim. Cosmochim. Acta 57,3815–3818.
Usdowski E., Michaelis J., Bottcher M. E. and Hoefs J. (1991)Factors for the oxygen isotope equilibrium fractionationbetween aqueous and gaseous CO2, carbonic acid, bicarbonate,carbonate and water (19-degrees-C). J. Phys. Chem. Chem.
Phys. 170, 237–249.
van Heuven S., Pierrot D., Rae J. W. B., Lewis E. and Wallace D.W. R. (2011) MATLAB program developed for CO2 system
calculations. ORNL/CDIAC-105b. Carbon Dioxide Informa-tion Analysis Centre, Oak Ridge National Laboratory, U.S.Department of Energy, Oak Ridge, Tennessee.
Zaarur S., Olack G. and Affek H. P. (2011) Paleo-environmentalimplication of clumped isotopes in land snail shells. Geochim.
Cosmochim. Acta 75, 6859–6869.Zaarur S., Affek H. P. and Brandon M. T. (2013) A revised
calibration of the clumped isotope thermometer. EPSL 382, 47–57.
Zeebe R. E. (1999) An explanation of the effect of seawatercarbonate concentration on foraminiferal oxygen isotopes.Geochim. Cosmochim. Acta 63, 2001–2007.
Associate editor: Claire Rollion-Bard
P.T. Spooner et al. /Geochimica et Cosmochimica Acta 179 (2016) 123–141 141