clustering and turbulence modulation in particle laden
TRANSCRIPT

Journal of Physics Conference Series
OPEN ACCESS
Clustering and turbulence modulation in particleladen shear flowsTo cite this article P Gualtieri et al 2011 J Phys Conf Ser 333 012007
View the article online for updates and enhancements
You may also likeGilles Canova (1954-1997)Y Brechet J Y Cavaille R Dendievel et al
-
The effects of back-reaction on turbulencemodulation in shear flows a new exactregularized point-particle methodP Gualtieri F Picano G Sardina et al
-
Shock-turbulence interaction What weknow and what we can learn from peta-scale simulationsSanjiva K Lele and Johan Larsson
-
This content was downloaded from IP address 3652126238 on 23022022 at 2123
Clustering and turbulence modulation in particle
laden shear flows
P Gualtieri F Picano G Sardina amp CM CasciolaDipartimento di Ingegneria Meccanica e Aerospaziale Universita di Roma La Sapienza ViaEudossiana 18 00184 Roma Italy
E-mail paologualtieriuniroma1it
Abstract Turbulent fluctuations induce the commonplace phenomenology on the transportof small inertial particles known as clustering Particles spread disuniformly and form aggregateswhere their local concentration is much higher than it is in nearby rarefaction regions the voidswhere in extreme cases not even a single particle can be found The underlying physics has beenexhaustively analyzed in statistically homogeneous and isotropic flows under the so called one-way coupling regime ie in conditions where the momentum exchange between the carrierfluid and the disperse phase is negligible Recently it has been shown that the addition of amean flow might have dramatic effects on the disperse phase ie the mean flow through itslarge scale anisotropy induces a preferential orientation of the clusters Due to inertial effectstheir directionality can even increase in the smallest scales contrary to the expectation basedon the isotropy recovery behavior of velocity fluctuations This finding opens new issues inpresence of large mass loads when the momentum exchange between the two phases becomessignificant and the back-reaction of the particles on the carrier flow cannot be neglected Theseaspects are discussed here by addressing direct numerical simulation data of particle ladenhomogeneous shear flow in the two-way coupling regime Consistently with previous findingswe observe an overall depletion of turbulent fluctuations In particular particles with orderKolmogorov scale relaxation time induce the energy depletion of the classical inertial scales andthe amplitude increase of the smallest ones where the particle back-reaction pumps energy intothe turbulent eddies increasing their energy content We find that increased mass loads resultin the substantial broadening of the energy co-spectrum thereby extending the range of scalesdriven by anisotropic production mechanisms This is due to the clusters which form the spatialsupport of the back-reaction field and give rise to a highly anisotropic forcing active down tothe smallest scales
1 IntroductionTransport of inertial particles is involved in several fields of science such as droplets growth andcollisions in clouds [1 2] the plankton accumulation in the oceans [3 4] or the plume formationin the atmosphere [5] At the same time multiphase flows are the base of several technologicalapplications The inertial particles dynamics is crucial in designing injection systems of internalcombustion engines [6] to prevent sediment accumulation in pipelines [7 8] or for the appropriatedimensioning of several industrial devices [9]
The relevant physical aspect in particles dynamics consists in their finite inertia whichprevents them from following the fluid trajectories Most evident is the ldquopreferentialaccumulationrdquo which in inhomogeneous flows such as wall bounded flows occurs in the formof the so called ldquoturbophoresisrdquo ie preferential localization of particles in the near wall region
Particles in Turbulence 2011 IOP PublishingJournal of Physics Conference Series 333 (2011) 012007 doi1010881742-65963331012007
Published under licence by IOP Publishing Ltd 1
[10 11] An exhaustive review of the subject can be found eg in [12] see also [13] and the recentpaper [14] for a physical explanation in terms of statistical properties of velocity fluctuations inthe near wall region
When the idealized conditions of isotropic turbulence are addressed preferential accumulationmanifests itself in the form of small scale clustering The disperse phase forms small scaleaggregates where most particles concentrate separated by void regions of small particle densitysee eg [15] and references therein
So far the effect of turbulent transport on particle dynamics has been studied extensively inmany flow configurations Much less is known about the effect the disperse phase may have onthe carrier flow demanding for a renewed effort in this direction see eg [16 17] It is expectedthat under proper coupling conditions the momentum exchange between the two phases mightbecome relevant in driving the turbulent fluctuations away from their universal equilibriumstate predicted by Kolmogorov in the early forties Clearly in contrast to the one-way couplingregime addressing these effects calls into play the more realistic two-way coupling mechanismwhere the disperse phase provides an active modulation of velocity fluctuations
In this context many authors first studied the simplest flow configuration ie decayinghomogeneous isotropic turbulence [18 19 20 21 22] by addressing the decay rate of turbulenceintensity and the modification of the energy spectra under two-way coupling regime Othernumerical investigations analyzed the statistically steady state of isotropic turbulence [23]showing a non uniform distortion of the energy spectra ie a damping of turbulent fluctuationsat large scales and a relative enhancement at the smallest ones In some cases the overall effectof back reaction on the carrier phase is reported as an attenuation of turbulence fluctuationscontrolled by the mass load ratio defined as the ratio of total disperse phase mass to fluid masssee eg [24 25] Similar effects have also been observed for particles larger than the Kolmogorovscale showing that the crossover wavenumber characterizing the transition between dumped andenhanced energy modes is related to the particles finite size [26] Other important issues such asthe increase of the particles settling velocity under gravity have been addressed both numerically[27] and experimentally [28] By breaking isotropy gravity leads to a preferential augmentation ofturbulence intensities along the vertical direction while in the transverse directions augmentationis only observed below the Taylor scale Other interesting effects of the momentum exchangebetween the carrier fluid and the disperse phase is observed in the context of grid generatedspatially decaying turbulence In fact starting from an isotropic state the feedback of theparticles seems to lead to an anisotropic flow as turbulent fluctuations develop downstream[29 30] An extensive review of the back-reaction effects on isotropic turbulence might be foundin Ref [31] Concerning wall bounded flows many authors considered the classical geometry ofthe channel [32 33 34] or of the pipe flow [35 36] Due to inhomogeneity and anisotropy newfeatures emerge such as the preferential suppression of turbulence intensities in the wall normaldirection [34] the enhancement of large scale anisotropy as measured by velocity variances [33]or even the occurrence of drag reduction [32] A substantial modification of turbulent kineticenergy production has been reported in Ref [37] in the context of a time evolving homogeneousshear flow
In any case as isotropy is broken by the presence of gravity or by the mean streamwiseadvection the back-reaction of the disperse phase seems to immediately originate stronganisotropies in the carrier phase Motivated by recent findings in the context of anisotropicclustering [38 39] we consider here the modulation of turbulence by transported particlesaddressing the particle laden homogeneous shear flow in the two-way coupling regime Such flowcan be considered as a sort of bridge between the idealized conditions of isotropic turbulenceand the more realistic geometries of wall bounded flows since it preserves spatial homogeneityand retains the anisotropy of shear flows
It is worth recalling that under shear turbulent fluctuations are strongly anisotropic at
Particles in Turbulence 2011 IOP PublishingJournal of Physics Conference Series 333 (2011) 012007 doi1010881742-65963331012007
2
the largest scales due to production of turbulent kinetic energy via interaction of the meanvelocity gradient and turbulent fluctuations At smaller scales below the so-called shear scaleLS =
radicεS3ndashwhere ε is the energy dissipation rate and S the mean shearndashinertial energy
transfer usually prevails In such conditions re-isotropization of turbulent fluctuation takesplace following a route described in [40 41 42] However turbulent fluctuations in the one-way coupling regime are found to induce an anisotropic clustering of the disperse phase whichpersists down to the smallest scales [38] Actually in contrast to the small scale behavior ofvelocity fluctuations particles aggregates do not lose their directionality Their anisotropy evenincreases down to the viscous scales where clusters still keep memory of the spatial orientationof the large scale coherent motions
Here we consider the same flow under the two-way coupling scenario In this more complexcase the physical result we achieve consists in a view of multi-phase turbulent flows consistentwith the multiscale forcing addressed in [43] Small scales anisotropic clusters acts as asourcesink of momentum for the turbulent motions distributed all along the range of scaleThey deplete the energy from the largest inertial scales which is in part retrieved in the low-inertialdissipative range Here the clusters keep the velocity fluctuations to a higher excitationstate than expected on the basis of the standard Kolmogorov theory As we will see suchback energy scatter is highly anisotropic in shear flow hence the small scales fluid motions areprevented from recovering isotropy and eventually increment their anisotropy
2 MethodologyConcerning the carrier fluid the velocity field v is decomposed into a mean flow U = Sx2 e1 anda fluctuation u where e1 is the unit vector in the streamwise direction x2 denote the coordinatein the direction of the mean shear S and x3 is in the spanwise direction Rogallorsquos technique[44] is employed to rewrite the Navier-Stokes equations for velocity fluctuations in a deformingcoordinate system convected by the mean flow according to the transformation of variablesξ1 = x1 minus Stx2 ξ2 = x2 ξ3 = x3 τ = t The resulting system
nabla middot u = 0 partupartτ
= (utimes ζ)minusnablaπ + νnabla2uminus Su2e1 + F (1)
is numerically integrated by a pseudo-spectral method combined with a fourth order Runge-Kutta scheme for temporal evolution In equations (1) ζ is the curl of u π is the modifiedpressure which includes the fluctuating kinetic energy |u|22 ν is the kinematic viscosity andF denote the back-reaction due to the disperse phase The latter consists of diluted particleswith mass density ρp much larger than the carrier fluid ρf The approximation of point particlescan be adopted whenever the particle diameter dp is much smaller than the typical turbulencescales It follows that the only relevant force is the Stokes drag [45] Accordingly the equationsfor particles position xpi (t) and velocity vpi (t) read
dxpidt
= vpi dvpidt
=1τp
[vi(xp t)minus vpi (t)] (2)
where vi(xp t) is the instantaneous fluid velocity evaluated at xpi (t) and τp = ρpd2p(18νρf ) is
the Stokes relaxation time Particlesrsquo velocities are decomposed as vpi = Ui[xpk(t)] + upi where upi
denotes the particle velocity deviation with respect to the local mean flow of the carrier fluidFinally by using Rogallorsquos transformation eqs (2) can be written as
dξpidτ
= upi minus Sτup2δi1
dupidτ
= fpi (3)
Equations (1) and (3) are integrated in computational space In fact the computational boxgets distorted in physical space by the mean flow advection The re-meshing procedure is
Particles in Turbulence 2011 IOP PublishingJournal of Physics Conference Series 333 (2011) 012007 doi1010881742-65963331012007
3
periodically applied to allow long time integrations By exploiting periodicity in the ξ1 directionthe computational domain is transformed back into a non skewed domain every ∆tr = 2Spreventing the unbounded growth of the wavenumbers see [46] for further details on the numericsadopted In equation (3) fpi = τminus1
p [ui(ξp τ)minus upi (τ)] minus Sup2δi1 is the expression of the Stokesdrag acting on the pth particle In the so-called two way coupling regime an equal and oppositeforce acts on the carrier fluid accounting for the momentum exchange between the two phases
Modeling the back reaction in numerical simulations is an issue [47] The local distortion ofturbulence due to the disperse phase can be captured only resolving the boundary of each particleon the computational grid In the so-called resolved particle simulations several approacheshave been proposed ranging from finite volume schemes [48] to Lattice Boltzman Methods [49]However other approaches are possible once it has been recognized that the flow close to a smallparticle can be locally approximated as a Stokes Flow In Ref [50] the Stokes solution is used toprovide appropriate boundary conditions to the Navier-Stokes equations close to each particleClearly these approaches even though they provide the exact momentum coupling betweenthe carrier and the disperse phase are feasible only for a relatively small number of particlesWhen particles are much smaller than the turbulent scales they can be considered as materialpoints ie as point sourcesinks of momentum for the carrier fluid Within this approximationseveral other methodologies are available For instance in the force coupling method [51] thedisturbance flow produced by the particles is modeled as a regularized steady Stokes solutioncorresponding to a force monopole and quadrupole while the singular steady Stokes solution isemployed in Ref [34] In our case we adopt the particle in cell method introduced in Ref [52]where the particle is regarded as a point source of momentum for the carrier fluid This is thesimplest approach to model the two way coupling regime widely adopted in the literature evenif the methodology might suffer of lack of numerical convergence in estimating the interphasemomentum transfer [53] Accordingly the resulting force on the fluid is computed as
F = minusNc
NpΦn(ξ)sump
fp (4)
where the sum is extended to all the n(ξ) particles belonging to the computational cell centeredat point ξ In eq (4) Nc denote the number of Eulerian cells Np is the total number ofparticles and Φ denote the mass load ratio ie the ratio between the mass of the disperse phaseMp = Npπρpd
3p6 and the carrier fluid Mf = ρfVf where Vf is the volume of the computational
box Fluid properties are known in an Eulerian frame while particles evolve along their ownLagrangian trajectories requiring a first interpolation when the fluid velocity is computed at theparticle position namely ui(ξp τ) An other interpolation is required when the back-reaction onthe fluid is computed since fpi is known at the particle position In fact the force acting on thepth particle is re-distributed via inverse interpolation to the nearest Eulerian grid points wherethe fluid velocity is defined Equations (3) are integrated by the same fourth order Runge-Kuttascheme used for the Navier-Stokes equations and the interpolation adopt a tri-linear scheme
The data we analyze come from a statistically steady Direct Numerical Simulation (DNS)of a homogeneous shear flow The mean shear induces velocity fluctuations which are stronglyanisotropic at the larger scales driven by production while at smaller separations the classicalenergy transfer mechanisms become effective in inducing re-isotropization The position of theshear scale LS was found crucial to determine whether small scale isotropy recovery eventuallyoccurs For these reasons LS plays an important physical role in shear turbulence where itenters the two basic control parameters [54 55] The first one is the Corrsin parameter Slowastc =S(νε)12 = (ηLS)23 where η =
(ν3ε
)14 is the Kolmogorov scale The Corrsin parametercan be recast in terms of the Taylor-Reynolds number 1Slowastc prop Reλ =
radic5(νε)〈uαuα〉 where
Particles in Turbulence 2011 IOP PublishingJournal of Physics Conference Series 333 (2011) 012007 doi1010881742-65963331012007
4
uα is the αth Cartesian component of the velocity fluctuation and the angular brackets denoteensemble averaging The second parameter is the shear strength Slowast = S〈uαuα〉ε = (L0LS)23with L0 = 〈uαuα〉32ε the integral scale of the flow The former determines the extension ofthe range of scales below the shear scale and above the Kolmogorov length η When this rangeis sufficiently extended ie the Taylor-Reynolds number is large enough small scale isotropyrecovery is likely to occur in the fluid velocity field The latter instead fixes the range of scalesdirectly affected by the geometry of the forcing This is the anisotropic range between integraland shear scale
The Navier-Stokes equations are integrated in a 4π times 2π times 2π periodic box see table 1 for afull description of the dataset The Kolmogorov scale is η = 007 which corresponds to Kmaxηranging from 58 to 155 Note the very accurate resolution of the smallest scales required tohave smooth fields in view of accurate interpolations and re-distribution of the back-reaction onthe carrier fluid Accurate resolution of the smallest scales is also crucial when addressing thestatistical properties of the viscous dissipation field [56 57]
Concerning the disperse phase the dynamics is controlled by the ratio of the particlesrelaxation time τp to a characteristic flow time scale typically the Kolmogorov time scaleτη = (νε)12 ie the relevant control parameter is the Stokes number Stη = τpτη Whenthe two-way coupling regime is considered other non dimensional parameters are required todescribe the momentum exchange between the two phases namely the density ratio ρpρf ndashassumed to be much larger than unityndash and the mass load fraction Φ = MpMf In fact themass load can be expressed as Φ = (ρpρf ) Φv where Φv = VpVf is the volume fraction Whenρpρf 1 the mass load Φ can be order one when the volume fraction is still very small order10minus3 in the present case In such conditions inter-particles collisions might be safely neglectedsee eg [16] while the momentum coupling between the two phases must be retained For thesimulations summarized in table 1 particles are injected in an already fully developed turbulentflow Their position is initialized at random homogeneous points with initial velocity matchingthe fluid velocity at particle position The total number of particles is changed to achievedifferent values of the mass load parameter while the Stokes number is kept constant To thispurpose after discarding an initial transient 150 statistically independent snapshots are usedto compute the relevant statistical observables The snapshots are collected at each remesh time
run Nx timesNy timesNz Φ Np
a 192times 96times 96 minus minusb 384times 192times 192 02 327500c 384times 192times 192 04 655000d 384times 192times 192 08 1310000dl 192times 96times 96 08 1310000dh 512times 256times 256 08 1310000
Table 1 Direct Numerical Simulation dataset Navier-Stokes equations are integrated in a4πtimes 2πtimes 2π periodic box with a resolution of NxtimesNy timesNz Fourier modes The 32 dealiasingrule is adopted to compute the non linear terms The Taylor Reynolds number is Reλ = 50 andthe shear parameter is Slowast = 7 Np is the number of particles whose Stokes number based on theKolmogorov time is Stη 1 with τp = 04 The mass load parameter (see text for definition) isdenoted by Φ ρpρf = 2000 indicate the density ratio between the disperse and carrier phaseIn our case dpη 01 The first four entries of the table provide for the effect of increasing themass load ratio for a given grid resolution runs a minus d Comparison of run dl and dh with thereference case d provide the sensitivity to grid resolution for a given mass load ratio
Particles in Turbulence 2011 IOP PublishingJournal of Physics Conference Series 333 (2011) 012007 doi1010881742-65963331012007
5
when the computational box comes back to its unskewed configuration
3 Particles ClusteringA visual impression of instantaneous particlesrsquo configurations is provided in figure 1 where slicesof the domain in selected coordinate planes are displayed for different values of the mass loadparameter Φ at Stη = 105 Hereafter the Stokes number is defined with respect the Kolmogorovtime of the simulation operated in the one-way coupling regime In fact as we will see insect4 the back-reaction leads to an overall depletion of the viscous energy dissipation rate andconsequently to an alteration of the Kolmogorov time-scale τη = (νε)12 In all the four cases
Figure 1 Snapshots of particle positions for increasing values of the mass load parameterΦ = 0 02 04 08 from top to bottom For all the datasets Stη = 1 Left column thin slicein the y minus z plane right column slice in the xminus y plane The slice thickness is of the order of afew Kolmogorov scales
Particles in Turbulence 2011 IOP PublishingJournal of Physics Conference Series 333 (2011) 012007 doi1010881742-65963331012007
6
reported in figure 1 the disperse phase is characterized by a multi-scale distribution of particlesconcentration and voids From the figure the shear induced orientation of the clusters is apparenteven though the concentration of the particles in the accumulation regions seems to be reducedas the coupling effects become relevant At a first sight this effect might be explained in termsof an alteration of the Kolmogorov time scale resulting in a smaller effective Stokes number iefor a given relaxation timendashτp = 04 in our casendashparticles might be expected to behave more liketracers in the two-way coupling regime However a more quantitative analysis shows that this isnot the case The modification of the Kolmogorov time-scale even though the energy dissipationrate is significantly changed at high mass loads is small and corresponds to an alteration ofthe Stokes number which can not explain the observed depletion of the clustering intensity inthe two-way coupling regime For instance the Stokes number ranges from Stη = 105 whenturbulence is not modified by the particles to Stη = 090 in the most severe coupling conditionsat Φ = 08 In conclusion the observed depletion of the clustering intensity calls into play nontrivial physical effects which are more likely related to an overall alteration turbulent fluctuationsrather than an oversimplified explanation in terms of an alteration of the Stokes number
In this paper we limit ourselves to the description of anisotropic clustering under the two-waycoupling conditions by considering the Angular Distribution Functions (ADF) introduced in [38]Essentially the ADF measures the number of particlesrsquo pairs at separation r in the direction rand is defined as
g(r r) =1r2
dνrdr
1n0
(5)
where n0 = 05Np(Np minus 1)Vf is the volume density of particlesrsquo pairs and νr(r r)dΩ is thenumbers of particlesrsquo pairs contained in the spherical cone of radius r with axis along r andamplitude dΩ The spherical average of the ADF g00(r) = 1(4π)
intΩ g(r r)dΩ is called the Radial
Distribution Function (RDF) and has been already used to characterize particles clustering inisotropic conditions The ADF extend the tool to anisotropic conditions retaining informationon the directionality of the clusters The behavior of the RDF near the origin g00(r) prop rminusα
10shy2
10shy1
100
101
102
100
101
102
oneshywayΦ=02Φ=04Φ=08Φ=005
rη
N=192
N=384
10shy2
10shy1
100
101
102
100
101
102
oneshywayN=192N=384N=512
Φ=08
Figure 2 Projection of the ADF in the isotropic sector g00 as a function of separation Themain panel address the effect of an increasing mass load for a given resolution of the carrierphase The inset provides sensitivity of the data to the grid resolution for the highest mass loadΦ = 08 Error-bars (not shown) are of the order of the symbols size in the entire range of scales
Particles in Turbulence 2011 IOP PublishingJournal of Physics Conference Series 333 (2011) 012007 doi1010881742-65963331012007
7
can be shown to be related to important geometrical features of the clusters In particularD2 = 3 minus α is the so-called correlation dimension [58] of the multi-fractal measure associatedwith the particle density A positive α indicates the occurrence of small scale clustering
The RDF is shown in figure 2 for the different values of the mass load parameter Φ Thedata show the quantitative alteration of the clustering intensity In fact the back-reactionprogressively attenuates the particles concentration at small scales leading to a smaller valueof the scaling exponent α The modification is substantial As the mass load is progressivelyincreased the number of particles pairs at small scales is reduced about seven times as inferredby comparing the small scale values of g00 obtained in the one-way coupling simulation (solidline) against the two-way coupling data at Φ = 08 (open circles) in figure 2 The plot showsthe smooth convergence of the two-way coupled simulation to the uncoupled case for very smallvalues of the mass load see for instance the data at Φ = 005 in comparison with those atΦ = 0 Concerning statistical accuracy in the case of the isotropic projection of the ADF shownin figure 2 the error-bars (not shown) are smaller than the symbol size In conclusion thebehavior confirms the qualitative impressions gained by simple inspection of the instantaneousparticles patterns reported in figure 1 where the clusters are definitely less defined in the caseΦ = 08 than at Φ = 0 compare bottom and top panels of the figure respectively In any caseclustering though partially attenuated is a persistent feature of the two-way coupling regimeas measured by the exponent α In order to exclude any bias in our results due to the numericsin the inset of figure 2 we address the RDF in the most severe coupling conditions For thehighest mass load Φ = 08 we have performed two additional simulations with a coarser andfiner resolution with respect to the reference case of run d namely run dl and dh of table 1respectively The data confirm that the attenuation of the clustering is a genuine physical effectresulting from the momentum exchange between the carrier and disperse phase
In view of turbulence modification the anisotropy of particlesrsquo clusters will play a crucial roleto be discussed in the next section where the analysis of the back-reaction effects on the carrier
10shy2
10shy1
100
101
10210
shy2
10shy1
100
101
102
oneshywayΦ=02Φ=04Φ=08Φ=005
rη
N=384
N=192
10shy2
10shy1
100
101
10210
shy2
10shy1
100
101
102
oneshywayN=192N=384N=512
Φ=08
Figure 3 Projection of the ADF in the most energetic anisotropic sector g2minus2 as a functionof separation The main panel addresses the effect of the mass load for a given resolution ofthe carrier phase The inset provides the sensitivity to the grid resolution for the highest massload Φ = 08 Error-bars for the data at Φ = 005 02 04 (not shown) are of the same order ofthose reported for the most severe coupling case at Φ = 08
Particles in Turbulence 2011 IOP PublishingJournal of Physics Conference Series 333 (2011) 012007 doi1010881742-65963331012007
8
fluid is addressed For this reason we complete the analysis of clustering under two-way couplingregime by characterizing the anisotropy of the aggregates This can be done by exploiting thedirectionality properties of the ADF Its angular dependence g(r r) can be resolved in terms ofspherical harmonics
g(r r) =infinsumj=0
jsumm=minusj
gjm(r)Yjm(r) (6)
achieving a systematic description both in terms of separation r accounted for by the coefficientsgjm(r) and in terms of directions described by the shape of the basis functions Yjm(r) Eachsuccessive subspace here labeled j accounts for increasing levels of anisotropy consistently withthe geometrical meaning of the spherical harmonics This tool introduced by [59] allowed forthe systematic study of small scale isotropy recovery see for instance [60 61 62 40] and theexhaustive review in [63]
In figure 3 we show the most energetic anisotropic projection of the ADF namely g2minus2 Asin the one-way coupling regime by reducing the scale separation the intensity of the anisotropicprojection increases indicating directionality in the particles aggregates As for the RDF thesmall scale behavior of g2minus2 is controlled by the mass load ratio while the numerical resolutionseems to play a negligible role see the right panel of figure 3 where g2minus2 is shown for Φ = 08and different resolutions The statistical convergence of this observable might be an issue sinceit samples only few preferential directions The error-bars on the data for the worse case atΦ = 08 are always smaller than the symbol size up to rη = 01 below which the error becomesappreciable on the scale of the plot To correctly infer about the persistency of directionalityat small scales in figure 4 we show the most energetic anisotropic projection normalized bythe RDF namely the ratio g2minus2g00 This indicator quantifies the average level of anisotropyof particlesrsquo clusters at that particular scale We observe that the back-reaction on the carrierfluid partially reduces the small scale anisotropy of the disperse phase when compared with
10shy2
10shy1
100
101
102
02
0406 oneshyway
Φ=02Φ=04Φ=08Φ=005
rη
N=384
N=192
10shy2
10shy1
100
101
102
10shy2
10shy1
oneshywayN=192N=384N=512
Φ=08
Figure 4 Normalized anisotropic projection of the ADF g2minus2g00 as a function of separationThe left panel addresses the effect of the mass load for a given resolution of the carrier phaseThe right panel show the sensitivity to the grid resolution for the highest mass load Φ = 08 Theerror-bars for the data at Φ = 005 02 04 (not shown) are of the same order of those reportedfor the most severe coupling case at Φ = 08
Particles in Turbulence 2011 IOP PublishingJournal of Physics Conference Series 333 (2011) 012007 doi1010881742-65963331012007
9
the one-way coupling regime In contrast to the saturation observed under one-way couplingconditions (solid line) the ratio g2minus2g00 seems to slightly decrease to eventually saturate to alower value when the smallest scales are approached In any case going down the scale rangethe anisotropy of the clusters is still present also in the two-way coupling regime The overallbehavior is not substantially altered from what we already described in previous papers [38]on the one-way coupling regime denoting a persistency of the clustersrsquo directionality up to thesmallest viscous scales
4 Turbulence ModulationIn presence of two-way coupling the support of the particle reaction field on the fluid is mainlygiven by the sets where most of the disperse phase concentrate Actually clusters are organizedin multi-scale sets whose orientation is controlled by the large scales anisotropy [38] The effectis strong and the particles never achieve small scale isotropy despite the Richardson cascadein absence of back reaction drives the fluid velocity fluctuations towards an isotropic stateWe infer that the fluid is excited by a highly anisotropic spectrally non-compact forcing quitean unusual circumstance in turbulence In these conditions the back-reaction of the dispersephase is expected to deeply alter the structure of turbulence Energy extractioninjection is nowstrongly anisotropic and active from the largest down to the smallest scales of the flow leavingno opportunity for a classical inertial range
We start our description of turbulence modulation observing that in the homogeneous shearflow the mean velocity profile is imposed both in the one-way and the two-way coupling regimesThis excludes the modification of the mean flow itself as it could happen instead in channelsor jet flows Any alteration of turbulence can be directly ascribed to an intrinsic distortion ofvelocity fluctuations due to the inter-phase momentum exchange The simplest quantities which
Φ0 02 04 06 08 1
04
06
08
1
12
Φ
Loss
Gai
n
0 02 04 06 08 1-1
-05
0
05
1
Figure 5 Left effect of the mass load Φ on the turbulent fluctuations Data normalized withthe corresponding values of the un-coupled case Open symbols refers to simulations a minus d intable 1 Filled symbols refers to cases dl (grey) and dh (black) 〈u2
1〉 (square) 〈u22〉 (delta) 〈u2
3〉(diamond) 12〈ui ui〉 (gradient) minus〈u1 u2〉 (circle) The vertical tick of amplitude 004 providesthe statistical error of the data Right turbulent kinetic energy budget Data normalized withthe production rate of the un-coupled case P0 Production P (circles) viscous energy dissipationε (squares) energy flux intercepted by particles εp (delta) The algebraic sum P minus εminus εp is alsoreported (diamonds) to check the quality of the budget Filled symbols refers to cases dl (grey)and dh (black) Error-bars are of the order of the symbol size
Particles in Turbulence 2011 IOP PublishingJournal of Physics Conference Series 333 (2011) 012007 doi1010881742-65963331012007
10
characterize the response of turbulence are single point statistics such as the turbulent kineticenergy the energy dissipation rate and as always for shear flows the Reynolds shear stress Theturbulent kinetic energy is addressed in figure 5 as a function of the mass load ratio In additionin the same figure data at fixed mass load Φ = 08 and different grid resolutions namely rundl and dh are reported to check the grid sensitivity Consistently with previous findings in thecontext of isotropic turbulence and wall bounded shear flows by increasing the mass load ratiothe turbulent fluctuations are found to be progressively attenuated
The directionality of the mean flow leads to a significant difference in the three normalizedvelocity variances The streamwise component 〈u2
1〉ndashsquares in figure 5ndashis the least affected bythe back-reaction Nonetheless the trend is toward its slight increase in comparison with the un-coupled case The other two components 〈u2
2〉 (delta) and 〈u23〉 (diamonds) are progressively
attenuated as the coupling becomes more relevant The depletionndashup to 50 at Φ = 08ndashoverwhelms the slightly increasing trend of the streamwise variance leading to an overallreduction of turbulent kinetic energy The resolution check for case Φ = 08 (gray and black filledsquares in the figure) confirms the quality of the results The impression is that the back-reactionenhances the large scale anisotropy of the flow The concurrent depletion of the Reynolds shearstress is noteworthy since it drags along the reduction of turbulent kinetic energy production
The steady state turbulent kinetic energy balance in the two-way coupling regime P = ε+εpinvolves a new term the energy exchanged with the particles through the Stokes drag εp =〈F middot u〉 whereas the production term P0 = minusS〈u1 u2〉0 simply balances the viscous dissipationε0 in the uncoupled case (the subscript stands for Φ = 0 no back-reaction) Actually at steadystate the average particle kinetic energy is constant implying εp = 〈F middot u〉 gt 0 since 〈F middot vp〉 = 0Hence the energy provided by the Reynolds stress work is partially intercepted by the back-reaction field which represents an alternative dissipation channel see [64 65 66] for a similarmechanism in the context of polymer laden flows and [67 68] for more recent work on the
Kη10-1 100 10110-10
10-8
10-6
10-4
10-2
100
one-wayΦ=02Φ=04Φ=08
N=384
10-1 100 10110-10
10-8
10-6
10-4
10-2
100
one-wayN=192N=384N=512
Φ=08
Kη10-1 100 10110-10
10-8
10-6
10-4
10-2
100
one-wayΦ=02Φ=04Φ=08
N=384
10-1 100 10110-10
10-8
10-6
10-4
10-2
100
one-wayN=192N=384N=512
Φ=08
Figure 6 Effects of the mass load on the energy spectrum (left) and cospectrum (right)for a fixed spectral resolution of the carrier phase Data of the one-way coupled simulationrun a (solid line) are compared with two-way coupled simulations operated for incresing massloads Φ = 02 04 08 (symbols) which correspond to run b (square) c (delta) and d (circle)respectively see table 1 In the inset effect of the grid resolution at the fixed mass load ratioΦ = 08 Data of the one-way coupled simulation (solid line run a in table 1) are comparedagainst two-way coupled data at Φ = 08 obtained with different resolutions of the carrier phaseSymbols correspond to runs dl d and dh of table 1
Particles in Turbulence 2011 IOP PublishingJournal of Physics Conference Series 333 (2011) 012007 doi1010881742-65963331012007
11
subject The energy budget is addressed in graphical form in figure 5 The striking effect of thecoupling is the considerable reduction of the production rate Pndash20 at Φ = 08ndashwhich entailsthe reduction of the viscous dissipation ε Although typically smaller than ε intriguing is alsothe behavior of the Stokes dissipation εp (deltas in figure 5) which achieves its maximumndashorder15ndashat intermediate mass loads
A more detailed analysis of turbulence modulation calls into play the spectral distribution ofturbulent kinetic energy In the spectra shown in figure 6 as Φ increases turbulent fluctuationsare first attenuated in an intermediate range of scales to be eventually enhanced at small scalesbefore being shut down by viscosity In other words the Stokes drag intercepts energy from theclassical cascade at intermediate scales where velocity fluctuations are damped The interceptedenergy is partly pumped back to the fluid at small scales increasing the energy content by ordersof magnitude compare solid line (one-way coupling) and open symbols (two-way coupling) infigure 6 The overall effect is a reduction of turbulent kinetic energy essentially given by the lowwave number part of the spectrum The emerging picture of particle-laden turbulence amountsto a standard transfer across the inertial range a partial removal of energy from the cascadeby the Stokes drag and its partial re-injection in the small scales Under certain respects theconceptual framework is similar to that operating in polymeric solutions
The cospectrum figure 6 shows a definite alteration of the spectral distribution of theturbulent shear stress and allows to identify the scales affected by the shear stress forcingThough hardly appreciable in log scale the cospectrum slightly decreases at large scales as themass load ratio increases consistently with the overall reduction of the shear stress Meanwhilethe range affected by production is progressively enlarged These are the back reaction effectsof the highly directional multi-scale clusters which force anisotropic motions in a progressivelywider range of scales see figure 6 Results at Φ = 02 present only small deviations from caseΦ = 0 Increasing the mass load Φ = 04 divide 08 the back-reaction excites the Reynolds shearstress in almost the entire range of scales The cospectrum vanishes much more slowly at highwave numbers resulting in unexpected energy injection at small scales This keeps the turbulentfluctuation excited at scales much smaller than expected on the sole basis of the overall energy
Φ0 02 04 06 08 11
15
2
25
3
35
4
Φ0 02 04 06 08 103
04
05
06
07
08
09
1
1
15
2
25
Figure 7 Left normalized norm of the deviatoric component of the Reynolds stresses tensorbb0 (open circles) and of the pseudo dissipation tensor aa0 (open squares) as afunction of the mass load ratio Φ For comparison data at Φ = 08 namely runs dl and dh(grey and black symbols) have been reported Right ratio r = ab (circles left axis) andrr0 (circles right axis) as a function of the mass load ratio Filled symbols as in the left panel
Particles in Turbulence 2011 IOP PublishingJournal of Physics Conference Series 333 (2011) 012007 doi1010881742-65963331012007
12
production which as already recalled diminishes The insets in figure 6 illustrate the results ofgrid refinement tests
The present results apparently question the small scale isotropy assumption for particle-laden flows under considerable mass loads which were classically motivated by the orientationalrandomization expected of the Richardson cascade
Concerning the large scales their anisotropy is quantified by the deviatoric component of theReynolds stresses tensor bij = 〈ui uj〉〈uk uk〉 minus 13δij Since anisotropy is already present atlarge scales in the Newtonian case (no back-reaction) to isolate the effect of the back-reactionwe address shown by open circles in the left panel of figure 7 the ratio bb0 where thesubscript stands for Φ = 0 and the norm is b =
radicbij bij As anticipated in the discussion
of figure 5 the back-reaction enhances the anisotropy This mainly occurs by the attenuationof the transversal velocity variances 〈u2
2〉 and 〈u23〉 associated with a slight augmentation of the
longitudinal fluctuation 〈u21〉 Concerning the dissipative scales their anisotropy shown by open
squares in the left panel of figure 7 is analogously quantified by the deviatoric component of thepseudo-dissipation tensor εij = 2 ν〈partkui partkuj〉 ie by computing aij = εijεkk minus 13δij and itsnorm a = radicaij aij The data show a dramatic growth of the gradient anisotropy which underthe most severe coupling conditions increases by 350 with respect to the reference Newtoniancase Two features emerge First the disperse phase is able to alter the anisotropy of the largestscale Second the small scale anisotropy level normalized with the Newtonian value increaseseven more steeply with the mass load due to the spectrally non compact anisotropic forcingoperated by the disperse phase on the carrier fluid Actually the ratio r = ab of small tolarge scale anisotropy right panel of figure 7 almost doubles going from r = 04 for Φ = 0 tor = 07 for Φ = 08 scale on the left axis of the plot
5 Final RemarksClustering is a well known feature of inertial particle configurations in turbulent flows Theclassical explanation of this small scale behavior is the centrifugal effect due to the vorticalstructures that populate a turbulent flow which tend to expel heavy inertial particles fromthe vortex cores to localize in the interstices between the vortices The resulting segregationmay be extremely intense for particles at Stokes number order one A peculiar feature of thesesystems is their response to the anisotropy of the flow In recent investigations of a particle-ladenhomogeneous shear flow it was found [38] that particle clusters maintain the anisotropy downto their smallest scales in ranges where typically the carrier velocity field already recoveredisotropy under the action of the Richardson cascade
When the mass load ratio is increased the back-reaction of the suspended phase on the carrierfluid can be no longer neglected opening the issue of the ultimate fate of the clusters in thestrong two-way coupling regime and poses the question as to how the structure of the turbulenceis altered in the carrier phase This is the regime we have explored in the present paper Asmain results we find that the coupling of the carrier fluid with the suspended phase leads toless pronounced segregation effects with the clusters that tend to become progressively smearedand less neatly defined with respect to the Newtonian simulation with advected passive inertialparticles At the same time the anisotropy of the clusters is also reduced Overall the trendseems to proceed towards a reduction of the peculiar segregation and anisotropy amplificationeffects recently described for vanishingly small mass loads
The intriguing aspect is here the response of the carrier fluid to the particle back-reactionThe oriented clusters though fatter and more isotropic than in the one-way coupling regimeconstitute the geometrical support of the force field exerted back on the fluid This forcingis distributed on the entire range of scales spanned by the clusters and present significantanisotropic features at all active scales The result is an increased large scale anisotropy ofthe carrier fluid turbulence manifested by the Reynolds stress anisotropy indicator The effect
Particles in Turbulence 2011 IOP PublishingJournal of Physics Conference Series 333 (2011) 012007 doi1010881742-65963331012007
13
consists in the alteration of the energy carrying large scales of the fluid which is accompanied bya reduction of turbulent kinetic energy The Reynolds shear stress also diminishes though lessthan its isotropic component resulting in the increase of the anisotropy indicator mentionedabove It follows the reduction in the turbulent kinetic energy production rate which atequilibrium entails a lowering of turbulent energy dissipation rate
The observation that the back-reaction forcing occurs throughout the range of scales spannedby the clusters implies that a non-negligible amount of forcing takes place also in the smallestscales of the turbulence which are usually passively fed only by the energy cascade from largerscales Consistently the energy spectrum is broadened with the excitation of scales significantlysmaller than the Kolmogorov scale expected from the energy content of the system As wehave shown the clusters retain their anisotropy down to the smallest scales Consistentlythe Reynolds shear stress forcing is also much less compact in spectral space than found inclassical shear turbulence This leads to a substantial increase of anisotropy at the level ofthe instantaneous velocity gradients as measured by the anisotropy indicator of the pseudo-dissipation tensor
In conclusion the structure of the system of particles and fluid is significantly altered by thecoupling an effect which clearly increases with the amount of mass loading of the suspensionOur findings could have a certain impact on turbulence modeling of multiphase flows whichboth in the context of Reynolds averaged (RANS) and filtered equations (LES) heavily relyupon the concepts of inertial energy cascade and of a presumed universal small scale statisticsActually we have shown that the cornerstone Kolmogorov theory no longer safely applies sincethe classical energy cascade is overwhelmed by the anisotropy-enhancing back-reaction of theparticles
6 AcknowledgmentsAuthors thanks the COST Action MP0806 ldquoParticles in Turbulencerdquo for supporting the presentwork and the CASPUR consortium where the simulations were performed
[1] Falkovich G Fouxon A and Stepanov M 2002 Nature 419 151[2] Wang L Ayala O Rosa B and Grabowski W 2008 New J of Phys 10 1ndash40[3] Karolyi G Pentek A Scheuring I Tel T and Toroczkai Z 2002 Proc Natl Acad Sci 97 13661[4] Lewis D and Pedley T 2000 J Thoretical Biology 205 377ndash408[5] Woods W A 2010 Ann Rev Fluid Mech 42 391ndash412[6] Post S and Abraham J 2002 Int Journal Mult Flows 28 997ndash1019[7] Rouson D and Eaton J 2001 J Fluid Mech 428 149[8] Portela L Cota P and Oliemans R 2002 Powder Technology 125 149ndash157[9] Derksen J Sundaresan S and Akker H V D 2006 Powd Tech 163 59ndash68
[10] Reeks M 1983 J Aerosol Sci 14 729ndash739[11] Brooke J Kontomaris K Hanratty T and McLaughlin J 1992 Phys Fluids A 6 825ndash834[12] Soldati A and Marchioli C 2009 Int J Multiphase flow 35(9) 827ndash839[13] Marchioli C and Soldati A 2002 J Fluid Mech 468 283[14] Picano F Sardina G and Casciola C 2009 Phys Fluids 21 093305[15] Bec J Biferale L Cencini M Lanotte A Musacchio S and Toschi F 2007 Phys Rev Lett 98(8) 084502[16] Balachandar S and Eaton J 2010 Ann Rev Fluid Mech 42 111ndash133[17] Eaton J 2009 Int J Multiphase flow 35(9) 792ndash800[18] Elghobash S and Truesdell G 1993 Physics of Fluids A Fluid Dynamics 5(7) 1790ndash1801[19] Druzhinin O and Elghobashi S 1999 Physics of Fluids 11(3) 602ndash610[20] Druzhinin O 2001 Physics of Fluids 13(12) 3738ndash3755[21] Sundaram S and Collins L 1999 J Fluid Mech 379 105ndash143[22] Ferrante A and Elghobashi S 2003 Physics of Fluids 15(2) 315ndash329[23] Boivin M Simonin O and Squires K 1998 J Fluid Mech 375 235ndash263[24] Hwang W and Eaton J 2006 Int J Multiphase flow 32 1386ndash1396[25] Hwang W and Eaton J 2006 J Fluid Mech 564 361ndash393
Particles in Turbulence 2011 IOP PublishingJournal of Physics Conference Series 333 (2011) 012007 doi1010881742-65963331012007
14
[26] Yeo K Dong S Climent E and Maxey M 2010 Int J Mult Flow 36(3) 221ndash233[27] Bosse T Kleiser L and Meiburg E 2006 Phys Fluids 18 0271021[28] Yang T and Shy S 2005 J Fluid Mech 526 171ndash216[29] Geiss S Dreizler A Stojanovic Z Chrigui M Sadiki A and Janicka J 2004 Exp Fluids 36 344ndash354[30] Poelma C Westerweel J and Ooms G 2007 J Fluid Mech 589 315[31] Poelma C and Ooms G 2006 Appl Mech Rev 50 78ndash90[32] Zhao L Andersson H and Gillisen J 2010 Phys Fluids 22 0817021[33] Yiming L McLaughlin J Kontomaris K and Portela L 2001 Phys Fluids 13(10) 2957ndash2967[34] Pan Y and Banerjee S 2001 Phys Fluids 8(10) 2733ndash2755[35] Rani S Winkler C and Vanka S 2004 Powder Tech 141 80ndash99[36] Ljus C Johansson B and Almsedt A 2002 Int J Multiphase flow 28 1075ndash1090[37] Ahmed A and Elghobashi S 2000 Phys Fluids 12(11) 2906ndash2930[38] Gualtieri P Picano F and Casciola C 2009 J Fluid Mech 629 25ndash39[39] Shotorban B and Balachandar S 2006 Phys Fluids 18 065105[40] Casciola C Gualtieri P Jacob B and Piva R 2007 Phys Fluids 19 101704[41] Casciola C Gualtieri P Jacob B and Piva R 2005 Phys Rev Lett 95 024503[42] Jacob B Casciola C Talamelli A and Alfredsson P 2008 Phys Fluids 20(4) 045101[43] Stresing R Peinke J Seoud R and Vassilicos J 2010 Physical Review Letters 104 194501 ISSN 1079-7114[44] Rogallo R 1981 Nasa T-M 81315[45] Maxey M and Riley J 1983 Phys Fluids 26 2437[46] Gualtieri P Casciola C Benzi R Amati G and Piva R 2002 Phys Fluids 14(2) 583ndash596[47] der Hoef M V Annald M V S Deen N and Kuipers J 2008 Ann Rev Fluid Mech 40 47ndash70[48] Burton T and Eaton J 2005 J Fluid Mech 545 67ndash111[49] Poesio P Ooms G Cate A T and Hunt J 2006 J Fluid Mech 555 113ndash130[50] Zhang Z and Prosperetti A 2005 J Comp Phys 210 292ndash324[51] Lomholt S and Maxey M 2003 J Comp Phys 184 381ndash405[52] Crowe C Sharma M and Stock D 1977 J Fluid Eng 99 325[53] Garg R Narayanan C and Subramaniam S 2009 Int J Mult Flow 35 376ndash388[54] Gualtieri P Casciola C M Benzi R Amati G and Piva R 2002 Physics of Fluids 14 583ndash596[55] Shumacher J 2004 Phys Fluids 16(8) 3094ndash3102[56] Shumacher J Eckhardt B and Doering C 2010 Phys Lett A 374 871[57] Boeck T Krasnov D and Schumacher J 2010 Physca D 239 1258[58] Grassberger P and Procaccia I 1983 Phys Rev Lett 50 346[59] Arad I Lrsquovov V and Procaccia I 1999 Phys Rev E 59 6753[60] Biferale L and Toschi F 2001 Phys Rev Lett 86 4831[61] Biferale L Boffetta G Celani A Lanotte A Toschi F and Vergassola M 2003 Phys Fluids 15 2105ndash2112[62] Chen S Dhruva B Kurien S Sreenivasan K and Taylor M 2005 J Fluid Mech 533 183[63] Biferale L and Procaccia I 2005 Phys Rep 414 43[64] De Angelis E Casciola C Benzi R and Piva R 2005 J Fluid Mech 531 1ndash10[65] Casciola C and De Angelis E 2007 J Fluid Mech 581 419ndash436[66] Vaithianathan T Robert A Brasseur J and Collins L 2006 J Non-Newtonian Fluid Mech 140 3[67] Cai W Li F and Zhang H 2010 J Fluid Mech 665 334[68] Perlekar P Mitra D and Pandit R 2010 Phys Rev E 82 066313
Particles in Turbulence 2011 IOP PublishingJournal of Physics Conference Series 333 (2011) 012007 doi1010881742-65963331012007
15
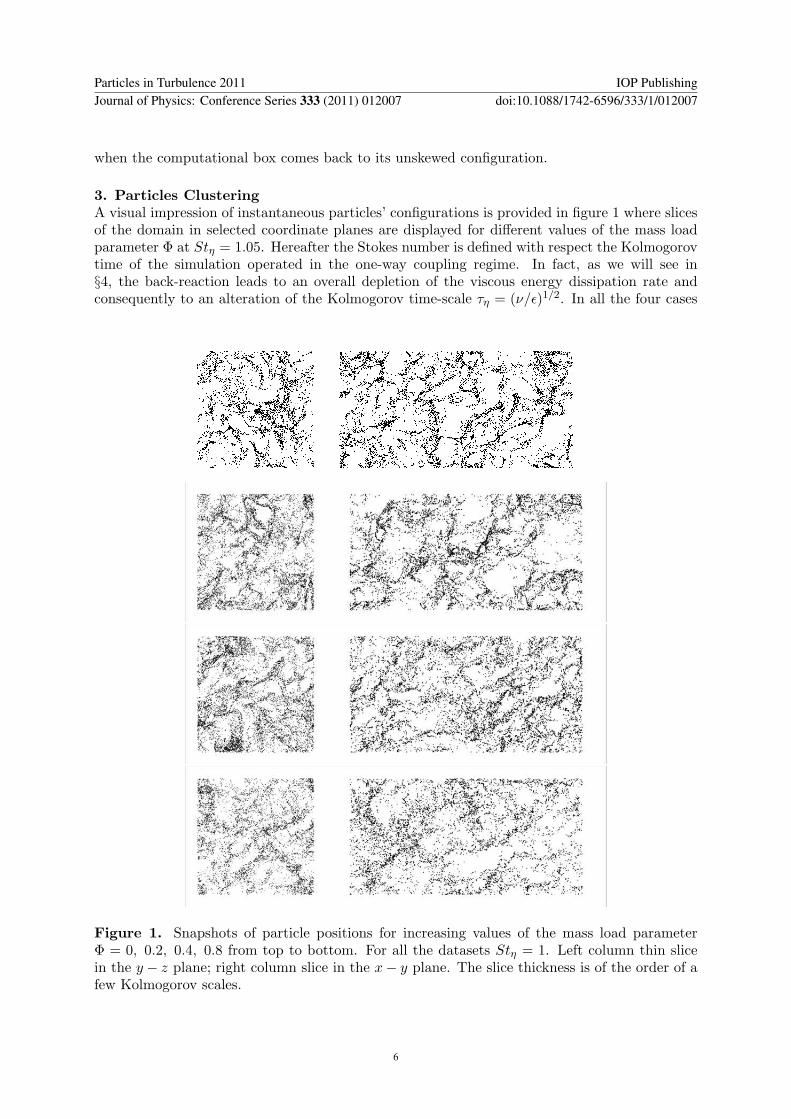
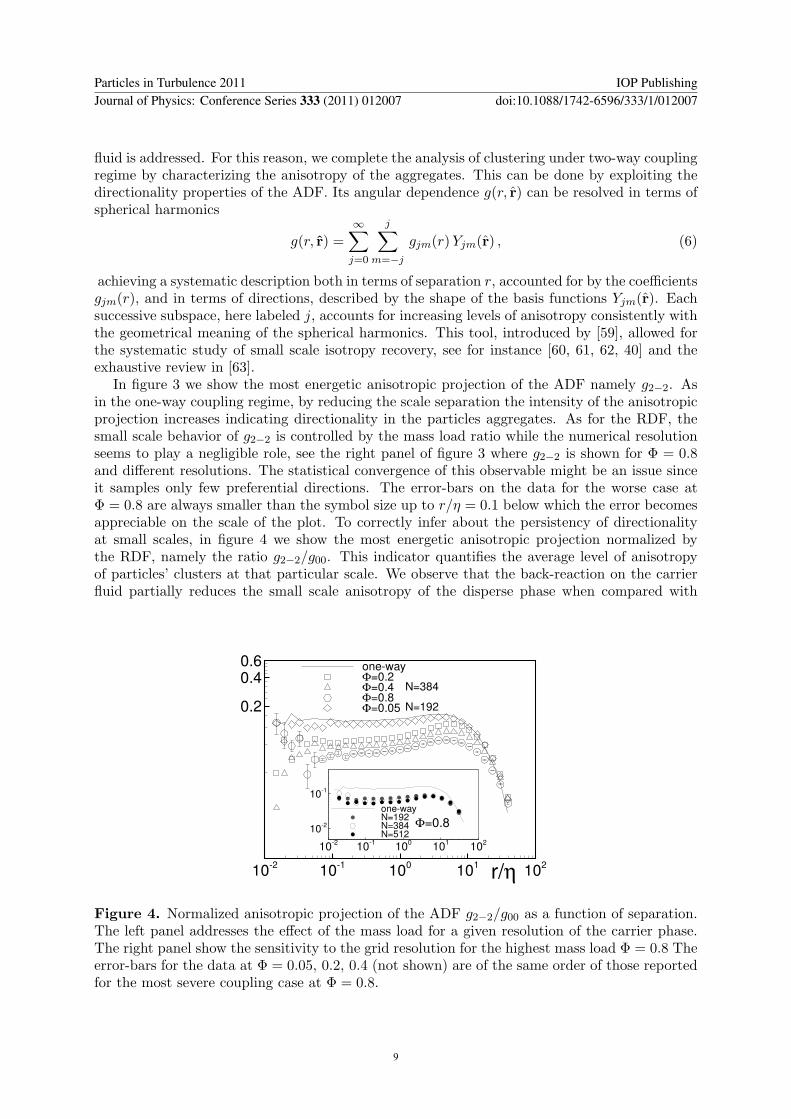
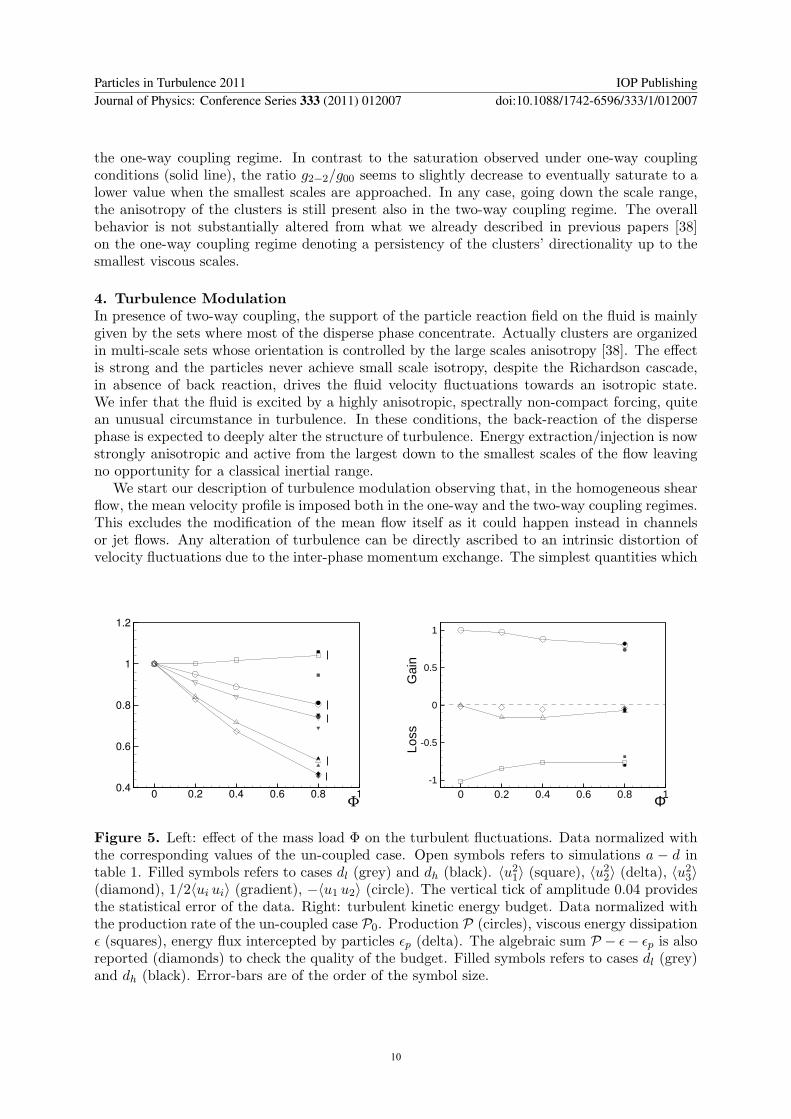