cm 1502 lab 3
TRANSCRIPT

NATIONAL UNIVERSITY OF SINGAPORE
CM1502
LABORATORY REPORT
EXPERIMENT 3: Potentiometric Titration
Name: Chai Mei Xian Audrey
Matriculation number: U075391A
Laboratory Group: 3A

Introduction
Many chemical systems involve oxidation and reduction reactions which refer to the loss and gain of electrons, in other words they are electrochemical. The electrochemistry in those reactions is that they are produced by electricity or are used to produce electricity. The rusting of iron, the photosynthesis occurring in green plants, and the conversion of food to energy in our body are all examples of chemical changes that involve the transfer of electrons from one chemical species to another. When such reactions can be made to cause electrons to flow through a wire or when a flow of electrons makes a redox reaction happen, the processes are referred to as electrochemical changes. The study of these changes is called electrochemistry.
The applications of electrochemistry are extensive. Batteries, which produce electrical energy by means of inner chemical reactions, are required in most portable and electronic devices. In the laboratory, electrical measurements enable us to monitor chemical reactions of all sorts, even for systems as tiny as a living cell. In the industry, many important chemicals, such as liquid bleach (sodium hypochlorite) and lye (sodium hydroxide) are manufactured by electrochemical means.
In this experiment, we will determine the oxidative – reductive (redox) potential of the ferrous/ferric or the Fe(II)/Fe(III) system and the cell reaction,
Ce4+ (aq) + Fe2+ (aq) → Ce3+ (aq) + Fe3+ (aq), by titrating an iron(II) sulfate (Fe2SO4) solution potentiometrically with cerium(IV) sulfate (Ce(SO4)2) solution.
Aims
1) To study and discuss the redox reaction between acidified ferrous ammonium sulfate Fe(NH4)2(SO4)2 and cerium(IV) sulfate Ce(SO4)2 dissolved in 1M sulfuric acid.
2) To determine the formal redox potentials of the Fe2+/Fe3+ system and of the cell
reaction, Ce4+ (aq) + Fe2+ (aq) → Ce3+ (aq) + Fe3+ (aq).
Apparatus used
100-mL beakers, burette, pipette, pipette filler, pH/mV meter, magnetic stirrer, dropper, filter funnel, 100-mL volumetric flasks, measuring cylinder
2

Experimental techniques
Calculation of the mass of (NH4)2.Fe(SO4)2.6H2O to be used to make 100cm3 of 0.01M solution
Mr of Fe(NH4)2(SO4)2.6H2O = 392.14[Fe(NH4)2(SO4)2.6H2O] = no. of moles / volumeno. of moles = 0.01 mol/dm3 x 0.100dm3
= 0.001 molesMass of Fe(NH4)2(SO4)2.6H2O to be used = 0.001 x 392.14 = 0.3921g
Calculation of the mass of Ce(SO4)2).4H2O to be used to make 100cm3 of 0.05M
solution
Mr of Ce(SO4)2).4H2O = 404.30[Ce(SO4)2).4H2O] = no. of moles / volumeNo. of moles = 0.05 mol/dm3 x 0.100 dm3
= 0.005 moles.Mass of Ce(SO4)2).4H2O to be used = 0.005 x 404.30 = 2.022g
Procedure1) Approximately 0.3921g of Fe(NH4)2(SO4)2 was weighed and dissolved in excess de-
ionized water.2) The solution was transferred into a 100-mL volumetric flask and topped up to the
mark with de-ionized water. The resulting solution will contained approximately 0.01M Fe(NH4)2(SO4)2.
3) Similarly, approximately 2.022g of Ce(SO4)2 was weighed and dissolved in excess 1M H2SO4 .
4) The solution was transferred into a 100-mL volumetric flask and topped up to the mark with 1M H2SO4. The resulting solution contained approximately 0.05M Ce(SO4)2.
5) 25 mL of the 0.01M Fe(NH4)2(SO4)2 was pipetted into a 100 mL beaker, followed by the addition of approximately 10mL of 1M H2SO4 to the solution to prevent hydrolysis.
6) The burette was filled up with 0.05M Ce(SO4)2 dissolved in excess 1M H2SO4.
7) The titration was carried out while measuring the electrochemical potential or the electromotive force (emf) with a pH/mV meter.
8) Readings were taken from 0mL to 8mL, with an interval of 0.50 mL between each reading. Within a close region of the equivalence point, the intervals reduced to 0.20mL between each reading. The equivalence point, where the emf drastically changes between the 2 readings at V1 and V2, was noted.
9) The titration was repeated; still taking readings from 0mL to 8mL, with an interval of 0.50mL between each reading, except this time, readings were taken at 0.04mL intervals between V1 and V2.
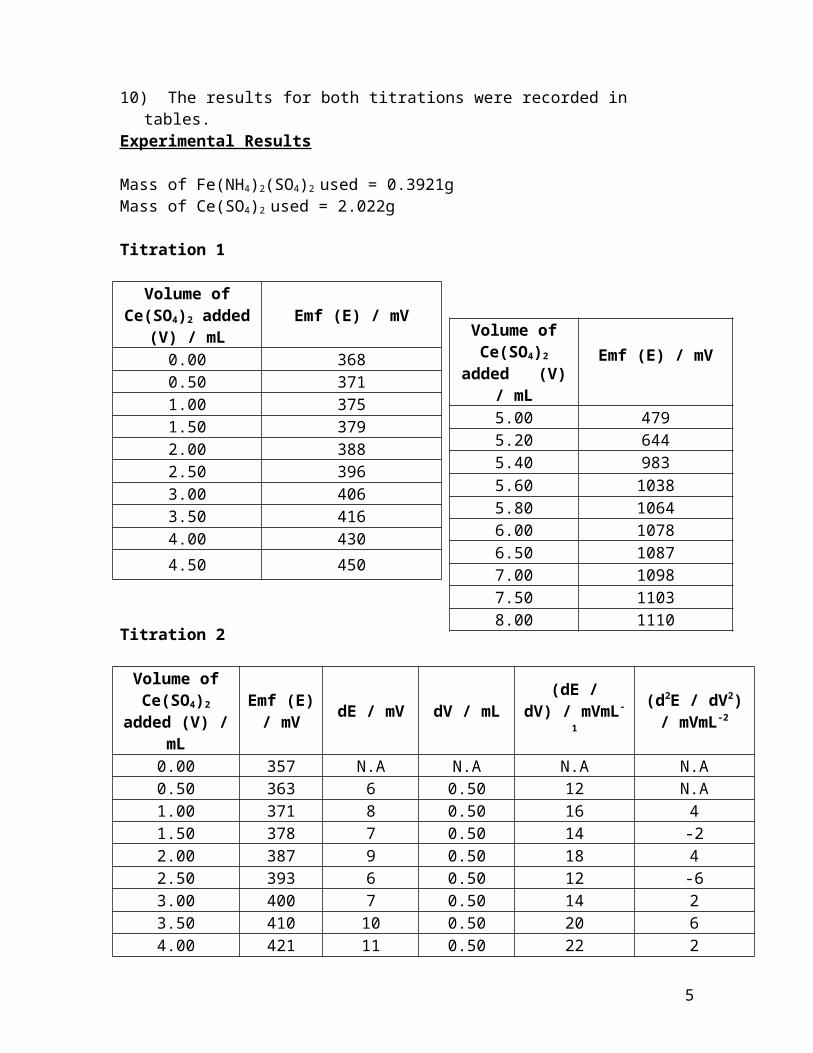
10) The results for both titrations were recorded in tables.
3

Experimental Results
Mass of Fe(NH4)2(SO4)2 used = 0.3921gMass of Ce(SO4)2 used = 2.022g
Titration 1
Volume of Ce(SO4)2
added (V) / mLEmf (E) / mV
0.00 3680.50 3711.00 3751.50 3792.00 3882.50 3963.00 4063.50 4164.00 430
4.50 450
Titration 2
Volume of Ce(SO4)2 added
(V) / mL
Emf (E) / mV
dE / mV dV / mL(dE / dV) / mVmL-1
(d2E / dV2) / mVmL-2
0.00 357 N.A N.A N.A N.A0.50 363 6 0.50 12 N.A1.00 371 8 0.50 16 41.50 378 7 0.50 14 -22.00 387 9 0.50 18 42.50 393 6 0.50 12 -63.00 400 7 0.50 14 23.50 410 10 0.50 20 64.00 421 11 0.50 22 24.50 433 12 0.50 24 25.00 453 20 0.50 40 165.04 455 2 0.04 50 105.08 459 4 0.04 100 505.12 462 3 0.04 75 -255.16 463 1 0.04 25 -505.20 469 6 0.04 150 1255.24 474 5 0.04 125 -255.28 480 6 0.04 150 25
4
Volume of Ce(SO4)2 added
(V) / mLEmf (E) / mV
5.00 4795.20 6445.40 983
5.60 10385.80 10646.00 10786.50 10877.00 10987.50 11038.00 1110
5.32 482 2 0.04 50 -1005.36 491 9 0.04 225 1755.40 509 18 0.04 450 2255.44 511 2 0.04 50 -4005.48 647 136 0.04 3400 33505.52 852 205 0.04 5125 17245.56 951 99 0.04 2475 -26505.60 979 28 0.04 700 -17755.64 999 20 0.04 500 -2005.68 1015 16 0.04 400 -1005.72 1032 17 0.04 425 255.76 1037 5 0.04 125 -3005.80 1048 11 0.04 275 1505.84 1058 10 0.04 250 -255.88 1059 1 0.04 25 -2255.92 1061 2 0.04 50 255.96 1070 9 0.04 225 1756.00 1079 8 0.04 200 -25
6.50 1088 9 0.50 18 -182 7.00 1101 13 0.50 26 8 7.50 1107 6 0.50 12 -14
8.00 1112 5 0.50 10 -2
Analysis1) Graph of emf, E, against the volume, V, of Ce(SO4)2
A
B
C
(2.76, 399)
5

There are 3 main regions in the graph, and they have been labeled as region A, B and C respectively as partitioned by the red dotted lines in the graph.
Region AIn this portion of the graph, all of the Ce4+ that is being added to the solution reacts with the Fe2+ in the solution. Ce4+ will oxidize Fe2+ to Fe3+ with itself being reduced to Ce3+ as according to the following reaction:
Ce4+ (aq) + Fe2+ (aq) → Ce3+ (aq) + Fe3+ (aq)
This is because the redox potential of Ce4+/Ce3+ is much more positive than that of Fe3+/Fe2+, meaning that there is a higher tendency for Ce4+ to be reduced to Ce3+. Thus, as Ce4+ is being reduced, there is no significant amount of Ce4+ present in the solution. There is not much change in the emf of the solution which explains the gentle gradient of the graph in this region. The emf that is measured will be due primarily to the following two equations:
Fe3+ (aq) + e- → Fe2+ (aq)½ Hg2Cl2 (s) + e- → Hg (l) + Cl- (aq)(This is assuming a calomel electrode is used as the reference electrode.)
By the Nerst equation and the known fact that Ecell = Eind – Eref + Ej,E = Eo (Fe3+/Fe2+) – Eo(calomel) – (RT / nF) ln ([Fe2+] / [Fe3+])
Letting T to be rm temperature of 298K, R = 8.314 J mol-1 K-1, n= 1, and F = 96485 C, we obtain
E = Eo (Fe3+/Fe2+) – Eo(calomel) – 0.025678 ln ([Fe2+] / [Fe3+]) = Eo (Fe3+/Fe2+) – Eo(calomel) – (0.025678 / log e) log10 ([Fe2+] / [Fe3+]) = Eo (Fe3+/Fe2+) – Eo(calomel) – 0.0591 log ([Fe2+] / [Fe3+]).
Since [Fe2+] decreases while [Fe3+] increases, log ([Fe2+] / [Fe3+]) decreases. Also, [Fe2+] < [Fe3+] and so [Fe2+] / [Fe3+] < 1. Thus, log ([Fe2+] / [Fe3+]) becomes more and more negative and E increases relative to Eo (Fe3+/Fe2+) as volume of Ce(SO4)2 increases. This explains why the slope of the graph is an increasing one.
Region BThis portion of the graph contains the equivalence point, where the emf changes rapidly. By definition, the point occurs when [Fe2+] / [Fe3+] = [Ce4+] / [Ce3+] and also correponds to the moment when all of the Fe2+ has been oxidized to Fe3+.
Region CIn this portion, there is no Fe2+ present as all of the Fe2+ would have been oxidized to Fe3+ at the equivalence point. Thus, only Ce4+ and Ce3+ ions remain in the solution. The emf measured by the pH/mV meter would be due to the following two reactions:
6

Ce4+ (aq) + e- → Ce3+ (aq)½ Hg2Cl2 (s) + e- → Hg (l) + Cl- (aq)
Again, by the Nerst equation and the fact that Ecell = Eind – Eref + Ej,E = Eo (Ce4+/Ce3+) – Eo
(calomel) – 0.0591 log ([Ce3+] / [Ce4+])
As [Ce4+] increases due to the addition of Ce(SO4)2 and [Ce3+] decreases as no further Ce3+ ions are being produced, log ([Ce3+]/[Ce4+]) decreases. Also, [Ce3+] < [Ce4+] so [Ce3+] / [Ce4+] < 1. Thus, log([Ce3+] / [Ce4+]) becomes more and more negative and E increases relative to Eo (Ce4+/Ce3+) as volume of Ce(SO4)2 increases. This explains why the slope of the graph is an increasing one, similiar to region A.
2) Graph of ∆E/∆V against volume, V, of Ce(SO4)2
This graph shows the change in the value E as V increases. From the graph, we can see that there is a global maximum point at V = 5.52 mL. This point corresponds to the equivalence point where the change in emf is the greatest. Thus, the volume of Ce(SO4)2 required to reach the equivalence point, V0 = 5.52 mL.
Therefore,V0/2 = 2.76 mL
(5.52, 5125)
7

3) Graph of ∆2E/∆V2 against volume, V, of Ce(SO4)2
This graph shows the change in the increase of emf. There is one global maximum and one global minimum point in the graph as shown on the graph, circled in red. These two points correspond to the most positive and most negative change in the value of ∆E/∆V. Hence, these two points are representations of the equivalence point, whereby the emf increases drastically to a point and when the volume of Ce(SO4)2 added exceeds the equivalence point, the rate of change of emf experiences a severe drop.
The points above help us to confirm our earlier findings that the equivalence points does indeed occur at V = 5.52 mL.
4)The determination of formal redox potentials
i) Determination of formal redox potential of Fe3+/Fe2+ system
At the equivalence point when volume of Ce(SO4)2 = Vo, all of the Fe2+ is being oxidized to Fe3+. Thus, at V0/2, it is taken that half of the number of moles of Fe2+ is being oxidized to Fe3+. Hence at V0/2, n Fe2+ = n Fe3+ and [Fe2+] = [Fe3+].
(5.48, 3350)
(5.56, -2650)
8
Volume of Ce(SO4)2 (V) / mL
Emf (E) / mV
dE / mV dV / mL (dE / dV) / mVmL-1
(d2E / dV2) / mVmL-2
5.44 511 2 0.04 50 -4005.48 647 136 0.04 3400 33505.52 852 205 0.04 5125 17245.56 951 99 0.04 2475 -2650

E = Eo (Fe3+/Fe2+) – Eo (calomel) - 0.0591 lg([Fe2+] / [Fe3+]),Since [Fe2+] = [Fe3+], lg([Fe2+] / [Fe3+]) = lg 1 = 0Thus, E = Eo (Fe3+/Fe2+) – Eo (calomel)
½ Hg2Cl2 (s) + e- → Hg (l) + Cl- (aq), Eo = 0.268 VThus, Eo (calomel) = 0.268 V and from the graph of emf against the volume of Ce(SO4)2 is, E = 399 mV at 2.76mL(V0/2)
Eo (Fe3+/Fe2+) = E + Eo (calomel) = 0.399 + 0.268 = 0.667 V
This value is much lower than the theoretical value of 0.771 V and this could be due to experimental errors which will be discussed later.
ii) Determination of the formal redox potential of the cell reaction: Ce4+ (aq) + Fe2+ (aq) → Ce3+ (aq) + Fe3+ (aq)
To determine the formal redox potential of the cell reaction we must first calculate Eo (Ce4+/Ce3+).
To calculate Eo (Ce4+/Ce3+), we consider when volume of Ce(SO4)2 = 8.00 mL
Volume of Ce(SO4)2 added (V) / mL
Emf (E) / mV
dE / mV dV / mL(dE / dV) / mVmL-1
(d2E / dV2) / mVmL-2
8.00 1112 5 0.50 10 -2
V = 8.00 mL, n Ce4+ = 8.00 x 10-3 x 0.05 – 25 x 10-3 x 0.01 = 0.00015 moln Ce3+ = 8.00 x 10-3 x 0.05 = 0.00040 mol(where n is the number of moles.)
½ Hg2Cl2 (s) + e- → Hg (l) + Cl- (aq), Eo = 0.268 VThus, Eo (calomel) = 0.268 V and E = 1.112 V,Eo (Ce4+/Ce3+) = E + Eo (calomel) + 0.0591 lg ([Ce3+] / [Ce4+])
= 1.112 + 0.268 + 0.0591 lg (0.00040/ 0.00015)= 1.41 V
This value is slightly lower than the theoretical value of 1.61V and that could be due to experimental errors which will be discussed later.
From the values obtained from the calculations above,Fe3+ (aq) + e- Fe2+ (aq) Eo= + 0.667 VCe4+ (aq) + e- Ce3+ (aq) Eo= +1.41 V
9

Eocell= Eo
cathode - Eoanode
= 1.41 – 0.677 = 0.733 V
This value differs from the theoretical value of 0.84V, which again could be due to experimental errors which will be discussed later.
5) Graph of emf against log ([Fe2+] / [Fe3+])The balanced redox reaction for the experiment is,
Ce4+ (aq) + Fe2+ (aq) → Ce3+ (aq) + Fe3+ (aq)
No. of moles of Fe2+ present in the beaker at any time= no. of moles of Fe2+ in 25cm3 of the solution – no. of moles of Fe2+ that reacted= (25 x 10-3 x 0.01) – (0.05 x 10⁻³ x V)
No. of moles of Fe3+ produced in the beaker at any time = no. of moles of Ce4+ added= 0.05 x 10⁻³ x V
(where V is the volume of Ce(SO4)2 added.)
Therefore,[Fe2+] / [Fe3+] = ( n Fe2+ / V) / (n Fe3+ / V)
= n Fe2+ / n Fe3+
(where n is the number of moles.)
10
Volume of Ce(SO4)2 added (V) / mL
Emf (E) / mV
nFe2+ / mol
nFe3+ / mol
[Fe2+] / [Fe3+] = nFe2+ / nFe3+ log ([Fe2+] / [Fe3+])
2.00 387 0.000150 0.000100 1.5 0.1762.50 393 0.000125 0.000125 1 03.00 400 0.000100 0.000150 0.667 -0.1763.50 410 0.000075 0.000175 0.429 -0.368

The graph obtained is as expected, a straight line graph with a negative gradient.
According to the equation,E = Eo (Fe3+/Fe2+) – Eo (calomel) – 0.0591 lg ([Fe2+] / [Fe3+])The expected graph of E against log ([Fe2+] / [Fe3+]) is a linear graph with y-intercept = Eo
(Fe3+/Fe2+) – Eo (calomel) and gradient = -0.0591
From the graph, y-intercept = 393.62 mVThus, 0.394= Eo (Fe3+/Fe2+) – Eo (calomel)Eo (Fe3+/Fe2+) = 0.394+ Eo (calomel)
= 0.394 + 0.268 = 0.662 V
This value differs from the theoretical value of 0.771 V and this could be due to experimental errors which will be discussed later.
It can be seen that plotting the graph of E against log([Fe2+] / [Fe3+]) will yield a straight line with negative gradient. This graph therefore provides us with another method to obtain Eo (Fe3+/Fe2+) as compared to the previous method of utilising the first derivative graph and the graph of emf against volume of Ce(SO4)2 added.
11

Discussion
1) Possible experimental errors
The experiment should be carried out under constant temperature because the value of Eredox is taken at the standard temperature of 25oC. Therefore if temperature is not kept constant, the value of Eredox will not be constant throughout the experiment.
Time is required for stirring to ensure that the reagents are mixed homogeneously, thus the emf reading is taken some time after the addition of the Ce(SO4)2 from the burette into the beaker containing (NH4)2.Fe(SO4)2.6H2O to allow the reading to stop fluctuating. However, the time interval between the addition of Ce(SO4)2
and taking the emf reading is different each time the reagent is added. Hence, some readings may be inaccurate due to poor mixing of the reagents at the time the emf was read off the pH/mV meter.
Parallax error in reading off the burette might have occurred during the addition of the Ce(SO4)2 from the burette into the beaker containing (NH4)2.Fe(SO4)2.6H2O. In the 2nd titration where Ce(SO4)2 is added at 0.04mL intervals between each reading, it is difficult to accurately add 0.04mL of the reagent. Thus, resulting in either the under-adding or over-adding of the reagent.
The mass of Ce(SO4)2.4H2O and (NH4)2.Fe(SO4)2.6H2O used may be slightly more or less than the exact mass to be weighed, therefore the resulting solution may not have an exact concentration of 0.05M and 0.01M respectively. Hence, affecting the accuracy of our calculations..
2) Electrochemistry involved in the combination electrode
Legend
1. a sensing part of electrode, a bulb made from specific glass
2. sometimes electrode contain small amount of AgCl precipitate inside the glass electrode
3. internal solution, usually 0.1M HCl for pH electrodes
4. internal electrode, usually silver chloride electrode or calomel electrode
5. Body of electrode, made from non-conductive glass or plastics.
6. reference electrode, usually the same type as 47. junction with studied solution, usually made from
ceramics or capillary with asbestos or quartz fiber.
12

The principle behind the pH meter is the generation of an electric potential by a chemical reaction in an electrochemical cell. Such a cell consists of two different half cells (in terms of materials or concentration) which are separated by a semi-permeable membrane. The membrane allows the two solutions to contact but prevents mixing and direct reaction of the substances in the two half cells. The voltage is measured across the two electrodes in the half cells.
The system consists of namely two components; a pH sensor - a pH half cell whose voltage varies proportionately to the hydrogen ion activity of the solution, and a reference electrode(a reference half cell) which provides a constant and stable reference voltage.
The pH half cell (pH electrode), is made up of a thin membrane of hydrogen sensitive glass blown on the end of an inert glass tube making the bulb very fragile thus, great care must be exercised in handling it. This tube is filled with an electrolyte, and the signal is carried through Ag/AgCl wire.
A similar system but without the hydrogen sensitive glass is used as a reference. A small filter (diaphragm) connects this tube to the external liquid and this system is known as the reference half cell. There are different reference half cells available, namely the pH Reference Electrode, the Calomel Reference Electrode, and the pH double junction Reference Electrode.
Overall, this device is essentially a galvanic cell. The reference end is essentially the inner tube of the pH meter, which cannot lose ions to the surrounding environment (as a reference is good only so long as it stays static through the duration of the measurement). The outer tube contains the medium, which is allowed to mix with the outside environment.
The Combination pH Electrode
13

The Calomel Reference Electrode
A combination electrode is as its name suggest, a combination of the glass pH electrode and the reference electrode into a single probe, which is constructed with the reference surrounding the glass electrode.
The main advantage of a combination electrode is its ability to measure the pH of a small volume of sample or one that enclosed in a small restricted container. However, the electrode suffers a drawback in the sense that the internal elements are confined to a
14

limited selection (most only have a silver-silver chloride internal reference) and they are very costly.
To protect it from damage, some combination electrodes on pH meters may even have a plastic shield around the glass bulb as shown below
The electric potential or emf developed across the two electrodes can be measured by a voltmeter and can correspond to the pH of the solution. The high electrical resistance across the glass membrane only allows a small current to be produced. Thus, a relatively sophisticated voltmeter is needed to measure the voltage and it is expressed in terms of millivolts DC. This reading read by the unit can be displayed in mV or pH.
The potential difference of a pH electrode varies linearly with pH units. At room temperature, a change of 1 pH unit brings about a potential difference of about 60 mV while at zero degrees centigrade, 1 pH unit change causes a 54 mV change. At one hundred degrees centigrade, a 1 pH unit change causes a 70 mV change. A well-designed pH meter will thus have a temperature dial which varies the sensitivity of the meter to match the voltage between the electrodes.
Conclusion
From our experiment, we can conclude that potentiometric titration is a fairly reliable means of determining the equivalence point of a redox reaction as indicated by a sharp rise in the curve that is of higher accuracy and precision when determining the end point. Furthermore, no external indicator is required for this method. Potentiometric titration can also be easily adapted to automation which allows for larger volumes of samples to be processed at one time resulting in minimal analyst involvement. In this experiment, we are able to utilize the above-mentioned method to determine the redox potential of 2 reacting mixtures and hence, graphically verify the equivalence point.
15

References
http://en.wikipedia.org/wiki/Saturated_calomel_electrode
http://en.wikipedia.org/wiki/PH_glass_electrode
http://www.chem.usu.edu/~sbialkow/Classes/3600/Overheads/pH/ionselctive.html
http://www.greenair.com/techtips.htm#pH%20Measurement%20and%20Control
http://www.umd.umich.edu/casl/natsci/slc/slconline/PHM/theory.html
http://www.ktf-split.hr/glossary/en_o.php?def=potentiometric%20titration
16