cmon limited - hkej.com
TRANSCRIPT

Hong Kong Exchanges and Clearing Limited and The Stock Exchange of Hong Kong
Limited take no responsibility for the contents of this announcement, make no
representation as to its accuracy or completeness and expressly disclaim any liability
whatsoever for any loss howsoever arising from or in reliance upon the whole or any part of
the contents of this announcement.
This announcement is for information purpose only and does not constitute an invitation or
offer to acquire, purchase or subscribe for any securities of the Company.
CMON LIMITED(Incorporated in the Cayman Islands with limited liability)
(Stock Code on Main Board: 1792)
(Stock Code on GEM: 8278)
TRANSFER OF LISTING
FROM GEM TO THE MAIN BOARD OF
THE STOCK EXCHANGE OF HONG KONG LIMITED
Joint Sponsors
On 6 July 2018, an application was made by the Company to the Stock Exchange for
the Transfer of Listing of the Shares from GEM to the Main Board and such
application was renewed on 4 April 2019 and 18 October 2019, respectively. The
Company has applied for the listing of, and permission to deal in, (i) 1,806,000,000
Shares in issue; and (ii) 180,600,000 Shares which may fall to be issued pursuant to the
exercise of the share options which have been granted or may be granted under the
Share Option Scheme, on the Main Board by way of Transfer of Listing from GEM to
the Main Board.
The approval-in-principle has been granted by the Stock Exchange on 8 November
2019 for the Shares to be listed on the Main Board and de-listed from GEM. The last
day of dealings in the Shares on GEM (stock code: 8278) will be 18 November 2019.
Dealings in the Shares on the Main Board (stock code: 1792) will commence at 9 : 00
a.m. on 19 November 2019. All pre-conditions for the Transfer of Listing have, insofar
as applicable, been fulfilled in relation to the Company and the Shares as at the date of
this announcement.
– 1 –

The Transfer of Listing will have no effect on the existing share certificates in respect
of the Shares which will continue to be good evidence of legal title and be valid for
delivery, trading, settlement and registration purposes and will not involve any
transfer or exchange of the existing share certificates. No change will be made to the
stock short names of the Company, the existing share certificates, the board lot size,
the trading currency of the Shares and the share registrars and transfer offices of the
Company following the Transfer of Listing.
The price and trading volume of the Shares have been volatile since the Company’s listing
on GEM. The Board is not aware of any reason for such volatility and the price and
trading volume of the Shares may continue to be volatile. Attention of the Shareholders
and potential investors of the Company is drawn to the potential risk and they are advised
to exercise caution when dealing in the Shares.
References are made to the announcements of the Company dated 6 July 2018, 9 January
2019, 4 April 2019, 4 October 2019 and 18 October 2019 in relation to the formal
application submitted to the Stock Exchange for the Transfer of Listing pursuant to the
relevant provisions of the GEM Listing Rules and the Main Board Listing Rules.
TRANSFER OF LISTING OF THE SHARES FROM GEM TO THE MAIN BOARD
On 6 July 2018, an application was made by the Company to the Stock Exchange for the
listing of, and permission to deal in, (i) 1,806,000,000 Shares in issue; and (ii) 180,600,000
Shares which may fall to be issued pursuant to the exercise of the share options which
have been granted or may be granted under the Share Option Scheme, on the Main Board
by way of Transfer of Listing from GEM to the Main Board and such application was
renewed on 4 April 2019 and 18 October 2019, respectively.
The approval-in-principle has been granted by the Stock Exchange on 8 November 2019
for the Shares to be listed on the Main Board and de-listed from GEM. All pre-
conditions for the Transfer of Listing have, insofar as applicable, been fulfilled in
relation to the Company and the Shares as at the date of this announcement.
REASONS FOR THE TRANSFER OF LISTING
The Company has been listed on GEM since 2 December 2016. The Group is a hobby
games publisher specialising in developing and publishing mainly tabletop games
(including board games and miniature war games). The Group has also started
developing and launching mobile games since 2015. In 2018, the Group launched its
first computer game.
The Directors believe that the Transfer of Listing will further enhance the profile, brand
and product awareness of the Group, which in turn will facilitate the Group to realise its
objectives to continuously expand its sales and marketing capabilities and reach out to
more gamers and at the same time, publish more high-quality tabletop games, mobile
– 2 –

games and computer games. Besides, a Main Board listing status will help the Group to
explore future possible partnership opportunities with more sizable and reputable
targets, which is favourable to the long-term business growth of the Group. Apart from
business related advantages, the Transfer of Listing may also help to strengthen the
Shareholders base and value of the Group through improvement in the trading liquidity
of the Shares, strengthening of confidence of the existing Shareholders as well as
enhancing recognition by potential investors, in particular institutional investors.
Therefore, the Directors consider that the listing of the Shares on the Main Board will
be beneficial to the future growth and business developments of the Group and is in the
interest of the Company and its Shareholders as a whole.
As at the date of this announcement, the Board has no immediate plans to change the
nature of the business of the Group following the Transfer of Listing.
The Transfer of Listing does not involve any issue of new Shares by the Company.
DEALINGS IN THE SHARES ON THE MAIN BOARD
The Shares have been accepted as eligible securities by HKSCC for deposit, clearance and
settlement in CCASS with effect from 2 December 2016, the date on which the Shares
were first listed on GEM. Subject to the continued compliance with the stock admission
requirements of HKSCC, the Shares will continue to be accepted as eligible securities by
HKSCC for deposit, clearance and settlement in CCASS once dealings in the Shares on
the Main Board commence, and that all activities under CCASS are subject to the
General Rules of CCASS and CCASS Operational Procedures in effect from time to time.
The last day of dealings in the Shares on GEM (stock code: 8278) will be 18 November
2019. Dealings in the Shares on the Main Board (stock code: 1792) will commence at
9 : 00 a.m. on 19 November 2019.
The Transfer of Listing will have no effect on the existing share certificates in respect of
the Shares which will continue to be good evidence of legal title and be valid for delivery,
trading, settlement and registration purposes and will not involve any transfer or
exchange of the existing share certificates. Currently, the Shares are traded in board lot
of 10,000 Shares each and are traded in Hong Kong dollars. The principal share registrar
and transfer office of the Company is Conyers Trust Company (Cayman) Limited and the
Hong Kong branch share registrar and transfer office of the Company is Tricor Investor
Services Limited. No change will be made to the stock short names of the Company, the
existing share certificates, the board lot size, the trading currency of the Shares and the
abovementioned share registrars and transfer offices of the Company following the
Transfer of Listing.
– 3 –

SHARE OPTION SCHEME
The Share Option Scheme was conditionally adopted by the Company on 17 November
2016 and took effect on 2 December 2016 to provide the Company with a flexible means
of incentivising and/or to recognise and acknowledge the contributions that eligible
persons have made or may make to the Group. Pursuant to the Share Option Scheme, the
Board may, at its absolute discretion, make an offer to any employee (whether full time
or part-time employee) of the Group including any executive Directors, non-executive
Directors and independent non-executive Directors, advisers and consultants of the
Group to take up share options to subscribe for Shares in accordance with the terms of
the Share Option Scheme.
On 13 August 2018 and 25 September 2019, a total of 74,620,000 share options and
17,000,000 share options were granted under the Share Option Scheme with exercise price
of HK$0.232 per Share and HK$0.112 per Share, respectively. As at the date of this
announcement, no share options have been exercised, cancelled or lapsed. Therefore, a
total of 180,600,000 Shares, representing 10% of the issued share capital of the
Company, may fall to be issued upon exercise of the share options that have been granted
or may be but not yet granted under the Share Option Scheme.
The Share Option Scheme will remain effective following the Transfer of Listing and will
be implemented in compliance with the requirements of Chapter 17 of the Main Board
Listing Rules. The listing of the Shares to be issued under the Share Option Scheme will
also be transferred to the Main Board pursuant to Rule 9A.10 of the Main Board Listing
Rules.
– 4 –

SHAREHOLDING STRUCTURE OF THE COMPANY AND PUBLIC FLOAT
The following table sets out the shareholding structures of the Company as at the date of
Listing and the date of this announcement:
Shareholders
As at the date of Listing and the date of this
announcement
No. of Shares Approximate %
(Note 1)
Non-public Shareholders
CA SPV (Note 2) 609,173,654 33.73%
DD SPV (Note 2) 261,074,424 14.45%
Magic Carpet Pre-IPO Fund (Note 3) 322,669,232 17.87%
Sub-total 1,192,917,310 66.05%
Public Shareholders
Magumaki Limited (Note 4) 116,033,076 6.42%
Other Shareholders 497,049,614 27.52%
Sub-total 613,082,690 33.94%
Total 1,806,000,000 100.00%
Notes:
1. This column represents the actual number of Shares registered under the name of the respective
Shareholders and does not include any deemed interests in the Shares and underlying Shares by virtue
of the SFO.
2. The issued share capital of CA SPV is wholly-owned by Mr. Ng, an executive Director and the sole
director of CA SPV. The issued share capital of DD SPV is wholly-owned by Mr. Doust, an executive
Director and the sole director of DD SPV. Pursuant to the Acting-in-Concert Arrangement, Mr. Ng
and Mr. Doust are deemed to be interested in the Shares and underlying Shares held by CA SPV, DD
SPV and each other by virtue of the SFO. As at the date of this announcement, CA SPV and DD SPV
are beneficially interested in 609,173,654 Shares and 261,074,424 Shares, respectively, and each of Mr.
Ng and Mr. Doust is beneficially interested in 15,500,000 share options of the Company.
3. Magic Carpet Pre-IPO Fund is a private equity investment fund managed by Quantum Asset
Management Pte. Ltd. (‘‘Quantum Asset’’) on a discretionary basis. Quantum Asset holds the only
issued ordinary share of Magic Carpet Pre-IPO Fund and the preference shares in the capital of
Magic Carpet Pre-IPO Fund are held by investors. Mr. Chua, a non-executive Director, beneficially
owns approximately 99.99% of the issued share capital of Quantum Asset and is therefore deemed to
be interested in the Shares held by Quantum Asset by virtue of the SFO. Mr. Chua is a director of
Magic Carpet Pre-IPO Fund and is beneficially interested in 5,580,000 share options of the Company.
– 5 –

4. The issued share capital of Magumaki Limited is wholly-owned by Mr. David Preti, a senior
management of the Group. Therefore, Mr. Preti is deemed to be interested in the Shares held by
Magumaki Limited by virtue of the SFO. As at the date of this announcement, Mr. Preti is
beneficially interested in 15,500,000 share options of the Company.
5. Certain percentage figures included in this table are subject to rounding adjustments. Accordingly,
figures shown as totals may not be an arithmetic aggregation of the figures preceding them.
Since Listing and up to the date of this announcement, there has been no change in the
controlling shareholders of the Company, namely, Mr. Ng, Mr. Doust, CA SPV and DD
SPV.
As at the date of this announcement, save as 91,620,000 share options granted under the
Share Option Scheme, the Company has not issued any options, warrants or similar
rights or convertible securities which will be transferred to the Main Board.
To the best of the Directors’ knowledge, information and belief, having made all
reasonable enquiries, as at the latest practicable date for the purpose of compiling the
shareholding analysis, i.e. 4 July 2019, the top three largest Shareholders were CA SPV,
DD SPV and Magic Carpet Pre-IPO Fund, which, in aggregate, held 1,192,917,310
Shares, representing approximately 66.05%, of the issued share capital of the Company,
whereas the top 20 and 25 Shareholders, in aggregate, held 1,534,860,000 Shares and
1,551,600,000 Shares, representing approximately 84.99% and 85.91% of the issued share
capital of the Company, respectively. Save for the Shares held by CA SPV, DD SPV and
Magic Carpet Pre-IPO Fund, to the best of the Directors’ knowledge, information and
belief, having made all reasonable enquiries, the remaining top 22 Shareholders, are all
Independent Third Parties, collectively held 358,682,690 Shares, representing
approximately 19.86% of the issued share capital of the Company, and the 3 largest
public Shareholders, in aggregate, held 232,066,152 Shares, representing approximately
37.85% of the Shares in the public hands. Accordingly, not less than 25% of the total
issued Shares were held by the public (as defined in the Main Board Listing Rules) and
not more than 50% of the Shares in the public hands were beneficially owned by the three
largest public Shareholders as at such date. Therefore, assuming there will be no
substantial change in the shareholding of the Company, the Directors are of the view that
the Company will comply with the minimum 25% public float requirement and the
requirement of having not more than 50% of the Shares in the public hands being
beneficially owned by the three largest public Shareholders under Rule 8.08(3) of the
Main Board Listing Rules when the Company is listed on the Main Board.
To the best of the Directors’ knowledge, information and belief, having made all
reasonable enquiries, as at 4 July 2019, the Company had not less than 300 Shareholders.
Therefore, assuming there will be no substantial change in the shareholding of the
Company, the Directors are of the view that the Company will comply with the
requirement of having not less than 300 Shareholders under Rule 8.08(2) of the Main
Board Listing Rules when the Company is listed on the Main Board.
– 6 –

GENERAL MANDATES TO ISSUE AND REPURCHASE SHARES
Pursuant to Rule 9A.12 of the Main Board Listing Rules, the general mandates granted
by the Shareholders at the annual general meeting of the Company held on 2 May 2019 to
the Directors to (i) allot and issue new Shares; (ii) repurchase Shares; and (iii) extend the
general mandate granted to the Directors to issue new Shares by the number of the issued
Shares repurchased by the Company will continue to be valid and remain in effect until
the earliest of:
(a) the conclusion of the next annual general meeting of the Company; or
(b) the expiry of the period within which the next annual general meeting of the
Company is required by any applicable laws or the Articles of Association to be held;
or
(c) the passing of an ordinary resolution by the Shareholders in general meeting
revoking or varying the authority given to the Directors under the relevant
resolutions.
PUBLICATION OF RESULTS
Upon completion of the Transfer of Listing, the Company will cease the practice of
reporting financial results on a quarterly basis and will follow the relevant requirements
of the Main Board Listing Rules, which include publishing its interim results and annual
results within two months and three months from the end of the relevant period or
financial year, respectively. The Board is of the view that the investors and the
Shareholders will continue to have access to relevant information on the Company
following the reporting requirements under the Main Board Listing Rules.
COMPETING BUSINESSES
To the best knowledge of the Directors, as at the date of this announcement, none of the
Directors and the controlling shareholders of the Company and their respective close
associates has any interest in any business which competes or is likely to compete, either
directly or indirectly, with the business of the Group which would be required to be
disclosed pursuant to paragraph 10(11) of Appendix 28 to the Main Board Listing Rules.
Non-competition undertakings by the controlling shareholders of the Company
Pursuant to the deed of non-competition dated 17 November 2016 (the ‘‘Original Non-
Competition Deed’’) executed by Mr. Ng, Mr. Doust, CA SPV and DD SPV (being the
controlling shareholders of the Company and as covenantors), they have given certain
non-competition undertakings in favour of the Company (details of which please refer to
the section headed ‘‘Relationship with Controlling Shareholders’’ in the Prospectus).
Taking into consideration that the obligations of the covenantors, namely, Mr. Ng, Mr.
Doust, CA SPV and DD SPV, under the Original Non-Competition Deed will cease upon
the Transfer of Listing taking place by which the Shares will be delisted from GEM, the
– 7 –

parties have agreed to execute a new deed of non-competition (the ‘‘New Non-
Competition Deed’’) prior to the Transfer of Listing with terms materially the same as
in the Original Non-Competition Deed, such that any references to the GEM Listing
Rules in the Original Non-Competition Deed shall be amended as references to the Main
Board Listing Rules (together with other consequential changes due to the Transfer of
Listing as well as some other clerical changes). The New Non-Competition Deed will take
effect from the date on which the Shares are first traded on the Main Board, i.e., from 19
November 2019. Save for the aforesaid amendments, all the provisions of the Original
Non-Competition Deed (in particular the non-competition undertakings given by Mr.
Ng, Mr. Doust, CA SPV and DD SPV) shall remain the same.
WAIVER FROM STRICT COMPLIANCE WITH RULE 8.12 OF THE MAIN BOARD
LISTING RULES
Pursuant to Rule 8.12 of the Main Board Listing Rules, a new applicant for primary
listing on the Stock Exchange must have a sufficient management presence in Hong Kong
and, in normal circumstances, at least two of the issuer’s executive directors must be
ordinarily resident in Hong Kong. Given that the Group’s core business and operations
are based, managed and conducted in places outside Hong Kong, and none of the
executive Directors is ordinarily resident in Hong Kong, the Company does not and will
not, in the foreseeable future, have a management presence in Hong Kong. Accordingly,
the Company has applied to the Stock Exchange for a waiver from strict compliance with
the requirements under Rule 8.12 of the Main Board Listing Rules. The Stock Exchange
has granted a waiver to the Company from strict compliance with the requirements under
Rule 8.12 of the Main Board Listing Rules on the condition that the Company will put in
place the following measures in order to ensure that regular communication is
maintained between the Stock Exchange and the Company:
(a) the Company has appointed two authorised representatives pursuant to Rule 5.24 of
the GEM Listing Rules (equivalent to Rule 3.05 of the Main Board Listing Rules),
who have and will continue to act as the Company’s principal channel of
communication with the Stock Exchange and ensure that the Group complies with
the Main Board Listing Rules at all times. The two authorised representatives are
Mr. Koh Zheng Kai, an executive Director and one of the joint company secretaries
of the Company, and Ms. Ng Sau Mei, the other joint company secretary of the
Company. Ms. Ng is ordinarily resident in Hong Kong. Although Mr. Koh resides in
Singapore, he possesses valid travel documents and is able to renew such travel
documents when they expire in order to visit Hong Kong. Each of the authorised
representatives will be available to meet with the Stock Exchange within a reasonable
time frame upon the request of the Stock Exchange and will be readily contactable
by telephone, facsimile and email. Each of the authorised representatives is duly
authorised to communicate on behalf of the Company with the Stock Exchange. The
Company has been registered as a non-Hong Kong company under Part 16 of the
Companies Ordinance (Chapter 622 of the Laws of Hong Kong) and Ms. Ng has
been authorised to accept service of legal process and notices in Hong Kong on
– 8 –

behalf of the Company. The contact details of each of the authorised representatives
have been provided to the Stock Exchange. The Company will keep the Stock
Exchange up to date in respect of any change to such details. The Company will only
change the authorised representatives after notifying the Stock Exchange of such
change and the reasons and having made appropriate replacement arrangements;
(b) each of the authorised representatives has means to contact all members of the Board
(including the independent non-executive Directors) promptly at all times as and
when the Stock Exchange wishes to contact the Directors for any matters. To
enhance the communication between the Stock Exchange, the authorised
representatives and the Directors, the Company will implement a policy that (i)
each Director will have to provide his office phone number, mobile phone number
and email address to the authorised representatives; (ii) in the event that a Director
expects to travel or is out of office, he will endeavour to provide the phone number
of the place of his accommodation to the authorised representatives or maintain an
open line of communication via his mobile phone; and (iii) each of the Directors and
authorised representatives of the Company will provide his mobile phone number,
office phone number and email address to the Stock Exchange;
(c) each of the Directors (including the independent non-executive Directors) not being
ordinarily resident in Hong Kong has confirmed that he possesses or can apply for
valid travel documents to visit Hong Kong for business purpose and will be able to
come to Hong Kong and meet with the relevant officers of the Stock Exchange
within a reasonable period of time, when required; and
(d) the Company will retain legal advisers to advise on ongoing compliance
requirements and issues arising under the Main Board Listing Rules as well as
other applicable laws and regulations in Hong Kong after the Transfer of Listing.
WAIVER FROM STRICT COMPLIANCE WITH RULE 8.17 OF THE MAIN BOARD
LISTING RULES
Pursuant to Rule 3.28 and Rule 8.17 of the Main Board Listing Rules, the secretary of
the Company must be an individual who, by virtue of his academic or professional
qualifications or relevant experience, is, in the opinion of the Stock Exchange, capable of
discharging the functions of company secretary.
Mr. Koh has been appointed as one of the joint company secretaries since Listing. Mr.
Koh joined the Group in October 2014 and is also an executive Director and the financial
controller of the Group primarily responsible for the accounting and tax management of
the Group. Mr. Koh has over 10 years of experience in accounting and finance. Mr.
Koh’s biographical details are set forth in the paragraph headed ‘‘Biographical
Information of Directors and Senior Management’’ in this announcement.
– 9 –

Although Mr. Koh has over 10 years of accounting related experience, at the time of the
Listing in 2016, he did not possess the qualifications and sufficient relevant experience as
stipulated in Notes to Rule 5.14 of the GEM Listing Rules (equivalent to Rule 3.28 of the
Main Board Listing Rules). As such, the Company has appointed and engaged Ms. Ng
who possesses the requisite qualifications and experience as required under Rule 5.14 of
the GEM Listing Rules as the other joint company secretary so that Mr. Koh and Ms. Ng
will jointly discharge their duties and responsibilities with reference to their past
experience and education background.
In this connection, the Company had, prior to the Listing, applied to the Stock Exchange
for, and the Stock Exchange has granted, the waiver from strict compliance with Rule
5.14 and Rule 11.07(2) under the GEM Listing Rules (equivalent to Rule 3.28 and Rule
8.17 of the Main Board Listing Rules, respectively) for a period of three years
commencing from the date of Listing on 2 December 2016, on the condition that the
Company engages Ms. Ng, who meets the requirements under Rule 5.14 of the GEM
Listing Rules, as a joint company secretary to assist Mr. Koh in the discharge of his
duties and responsibilities as a joint company secretary and in gaining the relevant
experience as required under Rule 5.14 of the GEM Listing Rules. Since Listing, Mr. Koh
has worked and will continue to work closely with Ms. Ng, who has provided and will
continue to provide assistance to Mr. Koh in the discharge of his duty as company
secretary.
Pursuant to Rule 9A.12 of the Main Board Listing Rules, the effect of the above waiver
granted by the Stock Exchange from strict compliance with Rule 5.14 and Rule 11.07(2)
under the GEM Listing Rules (equivalent to Rule 3.28 and Rule 8.17 of the Main Board
Listing Rules) shall, notwithstanding the Transfer of Listing, continue until its original
expiry date, i.e. 1 December 2019.
– 10 –

CORPORATE STRUCTURE
The corporate structure of the Group on the date of Listing is set out below:
Company(Cayman Islands)
CMON Productions Limited(British Virgin Islands)
CMON Global Limited(Cayman Islands)
100% 100% 100%
100%
100%
CMON Inc.(State of Delaware, USA)
CMON Pte. Ltd.(Singapore)
CMON Conventions Inc.(State of Delaware, USA)
The corporate structure of the Group as at the date of this announcement is set out
below:
Company (Cayman Islands)
CMON Productions Limited(British Virgin Islands)
CMON Global Limited(Cayman Islands)
CMON Games Inc.(Canada)
CMON Hong Kong Limited
(Hong Kong)
CMON Inc.(State of Delaware,
USA)
CMON Conventions Inc. (State of
Delaware, USA) CMON Pte. Ltd.
(Singapore)
CMON Foshan(PRC)
CMON Pte. Ltd.
(Italy) (Note)
100%
100%
100% 100% 100% 100% 100%
100% 100%
Geekfunder Inc. (State of
Delaware, USA)
100%
Note: It is a representative office of CMON Pte. Ltd. in Italy. Up to the date of this announcement, it has
only carried out marketing and promotional activities.
– 11 –

BUSINESS OF THE GROUP
The Group is a hobby games publisher specialising in developing and publishing mainly
tabletop games (including board games and miniature war games). Since 2015, the Group
had also started developing and launching mobile games. In 2018, the Group launched its
first computer game.
The Group publishes both self-owned games and licensed games, as well as distributes
third party games. The Group sells its games mainly through Kickstarter and to
wholesalers. The Group also sells directly to end users through its own online store and
at game conventions.
As at the date of this announcement, the Group offered a total of 90 games, comprising
84 board games, three miniature war games, two mobile games and one computer game.
Strategies
The Group strives to become a leading developer and publisher of quality games in the
hobby games industry. Save as nine pipeline games disclosed in the Prospectus which
launch were either delayed or cancelled after assessing the expected market reaction and
demand on the products based on the latest industry environment and performance of
similar products, the Group has generally followed the business strategies and
implementation plans as stated in the Prospectus since the Listing. For details of the
nine delayed and/or cancelled games, please refer to the section headed ‘‘Comparison
between Expected Implementation Plans with Actual Business Progress’’ in this
announcement.
In particular, the Group targets to achieve long-term growth through product
diversification and channel diversification. The Group plans to refocus its marketing
efforts on its end users and gamers, and further strengthen its game design, licensing and
IP creation capabilities to enhance the experience and satisfaction of the end users and
gamers towards the Group’s products. This is critical to the continual development of the
business of the Group as demand from end users and gamers will directly affect the
Kickstarter performance of the Group as well as orders from wholesalers. Therefore,
while the Group will continue to expand its wholesale network, it will simultaneously
allocate more resources in direct marketing to end users and gamers, such as the
enhancement of the Group’s own annual CoolMiniOrNot Expo and provision of more
support to the legion, an individuals’ volunteer network programme of the Group, details
of which are included in the paragraph headed ‘‘Business — Marketing — Tabletop
games — The Legion’’ in the Prospectus. Besides, the Group has successfully hired
various award winning creatives since the Listing to enhance its design and creation
capabilities. The Group will also expand into the largely untapped markets of Asia,
particularly the PRC. In view of this, Mr. Doust, one of the co-founders of the Group
and the controlling shareholders of the Company, has moved to Singapore to oversee
sales and marketing in China and East Asia markets during the year ended 31 December
– 12 –

2017. The above strategies are in line with the Group’s objective to continuously expand
its sales and marketing capabilities and to reach out to more gamers and at the same
time, publish more high-quality tabletop games, mobile games and computer games.
To strengthen its sales efforts, the Group had set up a sales office in Canada, which
commenced operation in October 2017. To improve its marketing capability, the Group
had also set up a representative office in Italy in September 2017. Besides, in order to
increase its presence in China, the Group has set up CMON Foshan which has already
commenced operation in October 2018. Up to the date of this announcement, CMON
Foshan has only carried out marketing and promotional activities.
Since April 2017, the Group’s operation in the USA has moved from the property at 1290
Old Alpharetta Road, Forsyth County, Georgia to the property at Ridgeland Parkway,
Forsyth County, Alpharetta, Georgia with total gross floor area of 85,800 square feet.
Games
As at the date of this announcement, the Group had 38 self-owned games, 27 licensed
games and 25 third party games.
Self-owned games
During the period from 1 January 2016 to the date of this announcement, the Group had
launched 21 new self-owned games, namely Arcadia Quest: Riders, Council of Four,
Foodies, HATE, Masmorra: Dungeons of Arcadia, Massive Darkness, Richard the
Lionheart, Rising Sun, Rum & Bones: Second Tide, Sheriff of Nottingham, Sherlook,
Starcadia Quest, Ta-Da!, The Grizzled: Armistice Edition, The World of SMOG: Rise of
Moloch, Victorian Masterminds, XenoShyft: Dreadmire, Zombicide: 2nd Edition,
Zombicide: Green Horde, Zombicide: Invader and Zombicide: Tactics & Shotguns.
Licensed games
During the period from 1 January 2016 to the date of this announcement, the Group had
launched 25 new licensed games. The following table sets out the key terms of the
licensing agreements the Group had entered into for its licensed games launched during
the period from 1 January 2016 to the date of this announcement.
Game Expiration Licensor background Exclusivity Territory
Option to renew/
Renewal conditions
1. A Song of Ice & Fire:
Tabletop Miniatures
Game
November 2019 (Note 5) Game developer
incorporated in the
United States
Exclusive Worldwide Yes/The term of license may
extend or modify upon
mutual written agreement
by the parties.
2. a. Bloodborne: The
Card Game
June 2021 (Note 2) Video interactive
entertainment
console developer
incorporated in the
United States
Non-exclusive United States,
Canada and
Brazil
Not applicable
b. Bloodborne: The
Board Game
– 13 –

Game Expiration Licensor background Exclusivity Territory
Option to renew/
Renewal conditions
3. Blue Moon City December 2021 Game developer
residing in Germany
Exclusive Worldwide
(excluding
Poland)
Not specified (Note 3)
4. Cthulhu: Death May
Die
Three years from the
last sale of the
products (Note 1)
Game developer based
in the United States
Exclusive Worldwide Not specified (Note 3)
5. Dojo Kun Three years from the
last sale of the
products (Note 1)
Game developer
incorporated in Italy
Exclusive Worldwide Not specified (Note 3)
6. Dream On Three years from the
last sale of the
products (Note 1)
Game developers based
in France
Non-exclusive Unspecified Not specified (Note 3)
7. Ethnos Three years from the
last sale of the
products (Note 1)
Game developer based
in Italy
Exclusive Worldwide Not specified (Note 3)
8. Gateway Uprising Three years from the
last sale of the
products (Note 1)
Game developer
incorporated in the
United States
Exclusive Worldwide Not specified (Note 3)
9. Gekido: Bot Battles Three years from the
last sale of the
products (Note 1)
Game developer
incorporated in
Brazil
Non-exclusive Unspecified Not specified (Note 3)
10. Gizmos Three years from the
last sale of the
products (Note 1)
Game developer based
in Australia
Exclusive Worldwide Not specified (Note 3)
11. God of War: The Card
Game
December 2021 Video interactive
entertainment
console developer
incorporated in the
United States
Non-exclusive Worldwide Not specified (Note 3)
12. Kick-Ass August 2021 Game developer
incorporated in the
United Kingdom
Exclusive Worldwide Not specified (Note 3)
13. Kronia February 2026 Game developers based
in Brazil and the
Czech Republic
Exclusive Worldwide Yes/Automatic renewal for
further 10 year periods,
unless either party gives
notice at least six months
in writing in advance to
not extend the agreement.
14. Looterz Three years from the
last sale of the
products (Note 1)
Game developer
incorporated in
Brazil
Non-exclusive Not specified Not specified (Note 3)
15. Masques Three years from the
last sale of the
products (Note 1)
Game developer
incorporated in
France
Exclusive Not specified Not specified (Note 3)
16. Modern Art December 2021 Game developer based/
residing in Germany
Exclusive Worldwide Yes/The term of license will
renew automatically from
year to year, unless either
party gives notice in
writing six months in
advance to terminate the
license.
17. Munchkin Dungeon December 2022 Game developer
incorporated in the
United States
Exclusive Not specified Yes/The term of license will
renew for a further three
year periods upon making
a further advance payment
of US$100,000 by the
Group.
18. Narcos April 2021 Game developer based
in the United States
Non-exclusive United States,
Canada,
EU, United
Kingdom
Not specified (Note 3)
– 14 –

Game Expiration Licensor background Exclusivity Territory
Option to renew/
Renewal conditions
19. Play Me November 2021 Game developer
incorporated in
France
Exclusive Worldwide Yes/The term of license will
continue to renew
automatically for a further
consecutive three year
periods upon the
completion of each three
year period unless either
party gives notice six
months in advance to
terminate or renegotiate
the terms of the license.
20. Project: ELITE Three years from the
last sale of the
products (Note 1)
Game developer located
in Greece
Exclusive Not specified Not specified (Note 3)
21. Sugarblast Three years from the
last sale of the
products (Note 1)
Game developer
residing in the
United States
Exclusive Worldwide Not specified (Note 3)
22. The Godfather:
Corleone’s Empire
July 2019 Game developer
incorporated in the
United States
Non-exclusive Worldwide Not specified (Note 4)
23. Trudvang Legends Three years from the
last sale of the
products (Note 1)
Game developer located
in Sweden
Exclusive Worldwide Not specified (Note 3)
24. Wacky Races December 2020 Entertainment company
based in the United
States
Non-exclusive United States,
Canada, EU,
Middle East,
Africa
Not specified (Note 3)
Notes:
1. The terms of these licenses depend on the last use of the licenses, which is defined as the last sale of
the products based on the IPs under the relevant licensing agreements by the Group. During the six
months ended 30 June 2019, except for (i) Project: ELITE, a Kickstarter game which was launched in
the fourth quarter of 2018; (ii) Sugarblast, a game launched in 2018 but the production of which is
still in progress; and (iii) Trudvang Legends, a Kickstarter game which was launched in July 2019, the
Group recorded sales from games under all these licenses. The Kickstarter products of Project:
ELITE shipped in the third quarter of 2019 and the Group has started to record sales from this game.
2. This license was renewed in May 2019.
3. These licenses have not yet expired since the first entering into of the license agreements by the
Group. It is the current plan of the Group to renew the respective licenses upon expiry.
4. This license expired in July 2019.
5. The license expired on 1 November 2019. The Group is currently under negotiation with the licensor
for the renewal terms. It is the intention of both the Group and the licensor to renew the license.
Since 1 January 2016 to the date of this announcement, save for (i) Sedition Wars: Battle
for Alabaster the license of which expired in January 2016; (ii) B-Sieged: Sons of the
Abyss the license of which expired in August 2018; and (iii) The Godfather: Corleone’s
Empire the license of which expired in July 2019 that the Group decided not to renew the
licenses after considering the sales performance of these games, the Group had not
terminated or decided not to renew any licensing agreements upon expiry. The Directors
– 15 –

consider that the non-renewal of the above-mentioned licensing agreements has no
material adverse impact on the financial and operational position of the Group. The
revenue contributed by the licensed games which the Group decided not to renew was
US$195,752, US$973,668, US$202,380 and US$132,626 for the year ended 31 December
2016, 2017 and 2018 and the six months ended 30 June 2019, respectively, representing
approximately 0.9%, 3.3%, 0.7% and 1.0% of the total revenue of the Group during the
respective year/period.
In general, around three months prior to the expiry of the licenses, the Group will decidewhether to renew or extend the licenses after taking into account factors including butnot limited to, historical and expected sales performance of the relevant games, and thebusiness relationship with the licensors, etc.
Third party games
Since 1 January 2016 to the date of this announcement, the Group had launched 25 newthird party games, including five board games namely Krosmaster Arena, KrosmasterQuest, 75 Gnom’ Street, Gang Rush: Breakout and Kingz, under the distributionagreement with a licensor. Although the Group has decided not to renew the distributionagreement with such licensor upon its expiry in January 2017 after taking intoconsideration of the sales performance of the products, as the Group continues to sellthe remaining stocks which have already been purchased from the licensor, the fiveabove-mentioned board games were still included in the Group’s game portfolio as at thedate of this announcement. The Directors consider that the non-renewal of the above-mentioned distribution agreement has no material adverse impact on the financial andoperational position of the Group. Save as disclosed herein, the Group had notterminated or decided not to renew any other distribution agreements upon expiry duringthe period from 1 January 2016 to the date of this announcement.
The following table sets out the key terms of the distribution agreements the Group had
entered into for its third party games launched during the period from 1 January 2016 to
the date of this announcement.
Licensor Expiration Products covered Option to renew/Renewal conditions
1. Licensor A Terminated as at the date of
this announcement
Krosmaster Quest, Krosmaster Arena, 75 Gnom’
Street, Gang Rush: Breakout and Kingz
Not specified
2. Licensor B 2021 English language version of Kreus and WakaTanka
Not specified
3. Licensor C 2020 English and Chinese language version of Way ofthe Panda
Not specified
4. Licensor D 2021 English language version of Unusual Suspects Not specified5. Licensor E 2021 English, French and Spanish language versions
of Kaleidos
Not specified
6. Licensor F 2019 (Note) English language version of Cthulhu in the Houseand Rumble in the Dungeon
Not specified
7. Licensor G 2021 Potion Explosion Not specified8. Licensor H 2019 (Note) English language version of Meeple War Not specified9. Licensor I 2021 English language version of Banana Bandits Not specified
10. Licensor J 2020 English language version of 13 Clues Yes/Automatic renewal from yearto year, unless either party givesnotice in writing 90 days in
advance to terminate the license.
– 16 –

Note: It is the current intention of the Group to renew the distribution agreements upon expiry.
Save as disclosed above, during the period from 1 January 2016 to the date of this
announcement, the Group has also distributed other third party games, namely Dragon
Castle, Lorenzo il Magnifico, Monstrous, Newton, Railroad Ink, Raise your Goblets,
Unfair and Walls of York by ordering the games from the relevant publishers without
entering into any distribution agreement.
Besides, the Group entered into a license agreement with a reputable game company for
the development, publishing and distribution of Blood Rage Digital, a computer game
developed based on the Group’s self-owned IP of Blood Rage licensed to the game
company. As the game company holds all proprietary rights in and to the computer
game, Blood Rage Digital is classified as a third party game of the Group. The agreement
is effective for seven years from the last launch date of the game. The Group launched
Blood Rage Digital via Kickstarter in December 2018 with fund raising amount of
US$769,502.
The table below sets out the detailed information of the games that the Group launched
during the period from 1 January 2016 to the date of this announcement:
No. Game Launch date
Expected
game life
applicable
to the Group
(not less
than)(Note 1)
Genre Game type Language(s) MSRP
Ownership as at
the date of
this announcement
(US$)
1. 13 Clues 2018 3 years Deduction Board game English 29.99 Third party
2. 75 Gnom’ Street 2017 1 year Strategy Board game English 49.99 Third party
3. A Song of Ice & Fire:
Tabletop Miniatures Game
2017 4 years Fantasy Tabletop miniature game English, French, German,
Italian, Mandarin
Chinese, Russian, Spanish
149.99 Licensed
4. Arcadia Quest: Riders 2018 10 years Adventure Board game English, French, German,
Portuguese, Spanish
64.99 Self-owned
5. Banana Bandits 2017 5 years Strategy Board game English 29.99 Third party
6. Bloodborne: The Card Game 2016 6 years Fantasy Board game Czech, English, French,
Italian, Polish,
Portuguese, Russian,
Spanish
34.99 Licensed
7. Bloodborne: The Board Game 2019 2 years Fantasy Board game English 99.99 Licensed
8. Blood Rage Digital 2018 7 years Fantasy Computer game English 59.99 Third party
9. Blue Moon City 2018 6 years Strategy Board game English, Japanese, Portuguese 39.99 Licensed
10. Council of Four 2018 10 years Strategy Board game English, Italian 59.99 Self-owned
11. Cthulhu: Death May Die 2018 4 years Fantasy Board game English 99.99 Licensed
12. Cthulhu in the House 2016 3 years Party Board game English 24.99 Third party
13. Dojo Kun 2017 5 years Strategy Board game English, Spanish 49.99 Licensed
14. Dragon Castle 2018 3 years Family Board game English, Mandarin Chinese 49.99 Third party
15. Dream On 2017 5 years Storytelling Board game Czech, English, French,
Hungarian, Italian,
Polish, Spanish, Thai
19.99 Licensed
16. Ethnos 2017 5 years Strategy Board game Czech, English, French,
German, Hungarian,
Italian, Korean,
Mandarin Chinese, Polish,
Portuguese, Russian/
Serbian, Spanish
39.99 Licensed
17. Foodies 2019 10 years Family Board game English 39.99 Self-owned
18. Gang Rush: Breakout 2017 1 year Strategy Board game English 74.99 Third party
– 17 –

No. Game Launch date
Expected
game life
applicable
to the Group
(not less
than)(Note 1)
Genre Game type Language(s) MSRP
Ownership as at
the date of
this announcement
(US$)
19. Gateway Uprising 2017 5 years Fantasy Board game English, French, Spanish 34.99 Licensed
20. Gekido: Bot Battles 2017 3 years Fighting Board game English 64.99 Licensed
21. Gizmos 2018 4 years Family Board game Czech, English, French,
German, Hungarian,
Italian, Korean,
Mandarin Chinese, Polish,
Portuguese, Romanian,
Russian, Spanish, Thai
34.99 Licensed
22 God of War: The Card Game 2019 3 years Strategy Board game Czech, English, French,
German, Italian,
Portuguese, Romanian,
Russian, Spanish
39.99 Licensed
23. HATE 2018 10 years Fantasy Board game English 120.00 Self-owned
24. Kaleidos 2016 5 years Party Board game English 39.99 Third party
25. Kick-Ass 2018 3 years Strategy Board game English, Hungarian, Italian,
Portuguese, Spanish
59.99 Licensed
26. Kingz 2016 1 year Strategy Board game English 24.99 Third party
27. Kreus 2016 5 years Fantasy Board game English 24.99 Third party
28. Kronia 2017 10 years Fantasy Board game English, Hungarian, Mandarin
Chinese
24.99 Licensed
29. Krosmaster Arena 2016 1 year Fantasy Board game English 69.99 Third party
30. Krosmaster Quest 2016 1 year Fantasy Board game English 89.99 Third party
31. Looterz 2016 6 years Family Board game English, French, Hebrew,
Hungarian, Italian,
Korean, Mandarin
Chinese, Polish,
Portuguese, Spanish
24.99 Licensed
32. Lorenzo il Magnifico 2017 3 years Strategy Board game English 59.99 Third party
33. Masmorra: Dungeons of
Arcadia
2016 10 years Chibi fantasy Board game English, French, German,
Spanish
64.99 Self-owned
34. Masques 2016 5 years Fantasy Board game English 24.99 Licensed
35. Massive Darkness 2016 10 years Fantasy Board game English, French, German,
Italian, Mandarin
Chinese, Portuguese,
Russian, Spanish
119.99 Self-owned
36. Meeple War 2017 3 years Strategy Board game English 39.99 Third party
37. Modern Art 2017 4 years Strategy Board game English 29.99 Licensed
38. Monstrous 2016 3 years Strategy Board game English 29.99 Third party
39. Munchkin Dungeon 2019 3 years Adventure Board game English 59.99 Licensed
40. Narcos 2018 5 years Strategy Board game Czech, English, French,
Italian, Russian
54.99 Licensed
41. Newton 2018 3 years Strategy Board game English 59.99 Third party
42. Play Me 2016 3 years Fantasy Board game English 24.99 Licensed
43. Potion Explosion 2016 5 years Family Board game English 49.99 Third party
44. Project: ELITE 2018 3 years Strategy Board game English 99.99 Licensed
45. Railroad Ink 2018 3 years Family Board game English 19.99 Third party
46. Raise Your Goblets 2017 3 years Deduction Board game English 49.99 Third party
47. Richard the Lionheart 2017 10 years Medieval Board game English, French, Hungarian,
Portuguese, Spanish
69.99 Self-owned
48. Rising Sun 2017 10 years Strategy Board game Czech, English, French,
German, Hungarian,
Italian, Japanese,
Mandarin Chinese,
Portuguese, Polish,
Russian, Spanish
99.99 Self-owned
49. Rum & Bones: Second Tide 2016 10 years Fantasy Board game English, Russian 99.99 Self-owned
50. Rumble in the Dungeon 2016 3 years Family Board game English 24.99 Third party
– 18 –

No. Game Launch date
Expected
game life
applicable
to the Group
(not less
than)(Note 1) Genre Game type Language(s) MSRP
Ownership as at
the date of
this announcement
(US$)
51. Sheriff of Nottingham 2016 10 years Medieval Board game Bulgarian, Danish, English,
French, Hungarian,
Italian, Latvian,
Mandarin Chinese, Polish,
Portuguese, Romanian,
Russian, Spanish, Thai
34.99 Self-owned
52. Sherlook 2017 10 years Strategy Board game English 29.99 Self-owned
53. Starcadia Quest 2018 10 years Adventure Board game English 79.99 Self-owned
54. Sugarblast 2018 3 years Family Board game English 39.99 Licensed
55. Ta-Da! 2016 10 years Family Board game English 24.99 Self-owned
56. The Godfather:
Corleone’s Empire(2)2017 4 years Strategy Board game Czech, English, French,
German, Italian, Polish,
Portuguese, Russian,
Spanish
79.99 N/A
57. The Grizzled: Armistice
Edition
2018 10 years Strategy Board game English, French, Portuguese 49.99 Self-owned
58. The World of SMOG:
Rise of Moloch
2017 10 years Adventure Board game English, German, Hungarian 99.99 Self-owned
59. Trudvang Legends 2019 3 years Fantasy Board game English 100.00 Licensed
60. Unfair 2017 3 years Family Board game English 49.99 Third party
61. Unusual Suspects 2016 5 years Family Board game English, French, Spanish 29.99 Third party
62. Victorian Masterminds 2018 10 years Strategy Board game French, German, Hungarian,
Italian, Portuguese,
Spanish
49.99 Self-owned
63. Wacky Races 2019 3 years Strategy Board game English 44.99 Licensed
64. Waka Tanka 2016 5 years Family Board game English 24.99 Third party
65. Walls of York 2019 3 years Family Board game English 39.99 Third party
66. Way of the Panda 2018 4 years Strategy Board game English, French, German,
Italian, Mandarin
Chinese, Spanish
79.99 Third party
67. XenoShyft: Dreadmire 2016 10 years Science fiction Board game English, French, Spanish 59.99 Self-owned
68. Zombicide: 2nd Edition 2019 10 years Post-apocalyptic Board game English 100.00 Self-owned
69. Zombicide: Green Horde 2017 10 years Fantasy Board game Czech, English, French,
German, Hungarian,
Italian, Mandarin
Chinese, Polish,
Portuguese, Russian,
Spanish, Thai
99.99 Self-owned
70. Zombicide: Invader 2018 10 years Science Fiction Board game English, French, German,
Polish, Portuguese,
Spanish
100.00 Self-owned
71. Zombicide: Tactics & Shotguns 2019 10 years Post-apocalyptic Mobile game English 4.99 Self-owned
Notes:
1. Save for Zombicide: Black Plague, the Directors estimate the expected game life of each of the self-
owned games to be 10 years based on (i) the performance of the self-owned games according to their
respective track records; (ii) the thematic element of the self-owned games supported by the artwork
and design of each game; and (iii) the launching of sequel games to the original for some of the self-
owned games as an extension strategy. This is a base estimate by the Directors and may be extended.
The expected game lives of licensed games and third party games are principally based on the relevant
licensing agreements and distribution agreements and may be extended accordingly based on the last
major use of the licence or after renewal.
2. The licensing agreement for The Godfather: Corleone’s Empire expired in July 2019.
– 19 –

For each of the three years ended 31 December 2018 and the six months ended 30 June
2019, the game which contributed the highest revenue was Arcadia Quest: Inferno,
Zombicide: Green Horde, Zombicide: Invader and Zombicide: Invader, respectively. Please
refer to the above table for the details of Arcadia Quest: Inferno, Zombicide: Green Horde
and Zombicide: Invader.
During the year ended 31 December 2018, the Group has further expanded into the
computer game market by launching the Group’s first computer game, Blood Rage
Digital, based on the Group’s self-owned IP of Blood Rage on Kickstarter.
The Group partnered with a reputable game company, an Independent Third Party, for
the development, publishing and distribution of Blood Rage Digital. Pursuant to the
agreement with the game company, (i) the Group licenses its self-owned IP of Blood Rage
to the game company for the development of the computer game; (ii) the Group and the
game company will each share 50% of the development cost of the game; (iii) the net
revenue generated from the computer game will be shared between the Group and the
game company based on pre-determined ratios; and (iv) the game company will hold all
proprietary rights in and to the computer game. The Directors are of the view that this
arrangement is beneficial to the Group as the Group can leverage the expertise of the
game company in the development of computer game and therefore enter into this new
market with lower investment cost as compared with formulating its own development
team.
The Group launched Blood Rage Digital on Kickstarter in December 2018 in the form of
computer game and tabletop game package. Backers can either subscribe for the Blood
Rage computer game or Blood Rage tabletop game or a combination of both. The total
fund raising amount of Blood Rage Digital is US$769,502. The shipment of the tabletop
game products has been completed as at the Latest Practicable Date. Although it is stated
on the Kickstarter website that the expected shipment of the Blood Rage computer game
products will take place in the second half of 2019, the Directors expect that the actual
shipment will be delayed to 2020. For the computer game products, an instruction with
passcode will be sent to backers for them to download the game.
The Group believes computer game is an extension of its existing tabletop game business
and mobile game business. Besides, the Group believes that computer games and mobile
games are complementary to each other in nature, and will serve as a driving force for the
demand and sale of the tabletop games of the Group, as customers of computer games
and mobile games may become potential players of tabletop games, and vice-versa. Most
importantly, level of loyalty of customers to the Group’s brand and tabletop games may
be enhanced when customers play computer games or mobile games of the same title as
the tabletop games. Therefore, although the revenue contribution from mobile games and
computer games may not be very significant, the Directors are of the view that it is
necessary and beneficial to the Group to continue to explore the mobile games as well as
– 20 –

computer games market. Based on the latest development progress, it is expected that the
shipment of Blood Rage computer game products will take place in 2020 as mentioned
above.
Sales channels
The Group sells its games mainly through Kickstarter and to wholesalers. Save as the
continuous expansion in the wholesale network due to business development by
leveraging the success of the games launched through Kickstarter, there has been no
material changes to the sales channels of the Group since the Listing.
The table below sets out the breakdown of revenue of the Group by sales channels during
the three years ended 31 December 2018 and the six months ended 30 June 2018 and
2019 :
Year ended 31 December Six months ended 30 June
2016 2017 2018 2018 2019
US$ % US$ % US$ % US$ % US$ %
(Unaudited) (Unaudited)
Direct
Kickstarter 11,468,346 54.7 20,597,558 69.1 15,237,000 54.0 3,156,427 33.0 1,938,301 15.1
Online store and game
conventions 848,312 4.1 870,213 2.9 1,235,755 4.4 455,250 4.8 57,173 0.5
Mobile games 23,501 0.1 9,098 — 4,007 — 2,834 — 727 —
Wholesalers 8,623,976 41.1 8,339,871 28.0 11,730,649 41.6 5,936,415 62.2 10,823,809 84.4
Total 20,964,135 100.0 29,816,740 100.0 28,207,411 100.0 9,550,926 100.0 12,820,010 100.0
– 21 –
Kickstarter
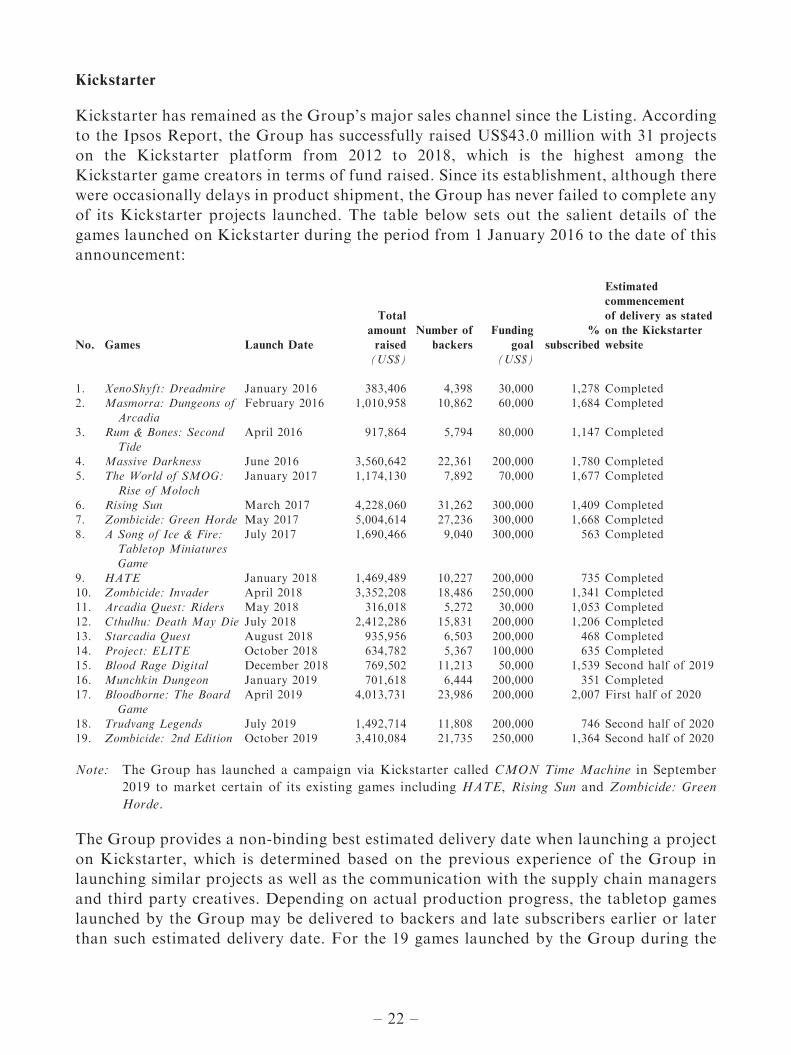
Kickstarter has remained as the Group’s major sales channel since the Listing. According
to the Ipsos Report, the Group has successfully raised US$43.0 million with 31 projects
on the Kickstarter platform from 2012 to 2018, which is the highest among the
Kickstarter game creators in terms of fund raised. Since its establishment, although there
were occasionally delays in product shipment, the Group has never failed to complete any
of its Kickstarter projects launched. The table below sets out the salient details of the
games launched on Kickstarter during the period from 1 January 2016 to the date of this
announcement:
No. Games Launch Date
Total
amount
raised
Number of
backers
Funding
goal
%
subscribed
Estimated
commencement
of delivery as stated
on the Kickstarter
website
(US$) (US$)
1. XenoShyft: Dreadmire January 2016 383,406 4,398 30,000 1,278 Completed2. Masmorra: Dungeons of
ArcadiaFebruary 2016 1,010,958 10,862 60,000 1,684 Completed
3. Rum & Bones: Second
Tide
April 2016 917,864 5,794 80,000 1,147 Completed
4. Massive Darkness June 2016 3,560,642 22,361 200,000 1,780 Completed5. The World of SMOG:
Rise of Moloch
January 2017 1,174,130 7,892 70,000 1,677 Completed
6. Rising Sun March 2017 4,228,060 31,262 300,000 1,409 Completed7. Zombicide: Green Horde May 2017 5,004,614 27,236 300,000 1,668 Completed
8. A Song of Ice & Fire:Tabletop MiniaturesGame
July 2017 1,690,466 9,040 300,000 563 Completed
9. HATE January 2018 1,469,489 10,227 200,000 735 Completed10. Zombicide: Invader April 2018 3,352,208 18,486 250,000 1,341 Completed11. Arcadia Quest: Riders May 2018 316,018 5,272 30,000 1,053 Completed12. Cthulhu: Death May Die July 2018 2,412,286 15,831 200,000 1,206 Completed
13. Starcadia Quest August 2018 935,956 6,503 200,000 468 Completed14. Project: ELITE October 2018 634,782 5,367 100,000 635 Completed15. Blood Rage Digital December 2018 769,502 11,213 50,000 1,539 Second half of 2019
16. Munchkin Dungeon January 2019 701,618 6,444 200,000 351 Completed17. Bloodborne: The Board
GameApril 2019 4,013,731 23,986 200,000 2,007 First half of 2020
18. Trudvang Legends July 2019 1,492,714 11,808 200,000 746 Second half of 202019. Zombicide: 2nd Edition October 2019 3,410,084 21,735 250,000 1,364 Second half of 2020
Note: The Group has launched a campaign via Kickstarter called CMON Time Machine in September
2019 to market certain of its existing games including HATE, Rising Sun and Zombicide: Green
Horde.
The Group provides a non-binding best estimated delivery date when launching a project
on Kickstarter, which is determined based on the previous experience of the Group in
launching similar projects as well as the communication with the supply chain managers
and third party creatives. Depending on actual production progress, the tabletop games
launched by the Group may be delivered to backers and late subscribers earlier or later
than such estimated delivery date. For the 19 games launched by the Group during the
– 22 –

period from 1 January 2016 to the date of this announcement, 15 of them have
successfully finished shipping and completed. Among the 15 games which have finished
shipping, 12 of them had shipped on or before the estimated delivery date and three of
them had experienced delays ranging from one month to three months due to additional
time required for production of multiple Kickstarter games concurrently.
Unless otherwise provided and mutually agreed upon by all relevant parties,
Kickstarter’s terms of use constitute the entire agreement among Kickstarter, a project
creator and its backers and set forth each party’s rights and obligations with regard to
the use of Kickstarter website and the services provided by Kickstarter. Kickstarter’s
terms of use do not stipulate a specific date by which project creators must fulfill the
rewards or require project creators to update backers on the progress of a project.
Rather, project creators provide an estimated delivery date, which is a best estimate that
project creators make a good faith effort to meet. Kickstarter’s terms of use stipulate that
the estimated delivery date is not a guarantee to fulfill the rewards by such date and ask
the project creators to communicate with backers about any changes to the estimated
delivery date. Although the estimated delivery date is not a guarantee but a non-binding
best estimated delivery date by the Group, it is not guaranteed that the backers will not
take any legal action against the Group if there is any delay in delivery.
If the project creator is unable to complete the project and fulfill rewards, it must make
every reasonable effort to bring the project to the best possible conclusion, including
(amongst others) (i) explaining what work has been done, how funds were used, what
prevented the project creator from finishing the project as planned; (ii) demonstrating
that they have used the funds appropriately and made every reasonable effort to complete
the project as promised; and (iii) offering to return any remaining funds to backers who
have not received their products under the projects. According to Kickstarter’s terms of
use, it does not get involved in disputes between a project creator and its backers.
The Group receives complaints from time to time from backers and late subscribers in
relation to delay in delivery which takes place after the estimated delivery date. On the
relevant Kickstarter page for the Group’s games, the Group explicitly informs potential
and actual backers of the risks of delay. In order to engage the backers and late
subscribers and enhance customers’ satisfaction, the Group provides regular update on
the development progress, including shipping update of the games on the relevant
Kickstarter page. Besides, the Group allows backers to request for refund anytime before
the products are packaged for shipment. During the period from 1 January 2016 to the
date of this announcement, the Group had not experienced any material claims or
complaints, or received substantial amount of refund request, from the backers and late
subscribers as a result of delay in delivery.
Wholesalers
Other than the above Kickstarter games launched, the Group had also launched through
wholesalers a total of 51 new games during the period from 1 January 2016 to the date of
this announcement.
– 23 –

Thetable
below
sets
outthereven
ueco
ntributionoftheGroup’s
games
bysalesch
annelsduringthethreeyears
ended
31
Decem
ber
2018andthesixmonthsen
ded
30Ju
ne2018and2019:
Salesofourgames
bychannels
For
theye
aren
ded31
Decem
ber
For
theye
aren
ded31
Decem
ber
For
theye
aren
ded31
Decem
ber
2016
2017
2018
Direct
Direct
Direct
Kickstarter
Onlinestore
andga
me
conv
ention
sM
obilega
me
Who
lesalers
Total
Kickstarter
Onlinestore
andga
me
conv
ention
sM
obilega
me
Who
lesalers
Total
Kickstarter
Onlinestore
andga
me
conv
ention
sM
obilega
me
Who
lesalers
Total
US$
US$
US$
US$
US$
US$
US$
US$
US$
US$
US$
US$
US$
US$
US$
13Clues
——
——
——
——
——
—3,90
5—
23,793
27,698
75Gno
m’Street
——
——
——
969
—26
,241
27,210
——
——
—A
Son
gof
Ice&
Fire:
Tab
letop
MiniaturesGam
e—
——
——
——
——
—2,69
1,34
510
5,70
5—
1,59
1,24
04,38
8,29
0Arcad
iaQue
st—
41,846
—36
5,70
540
7,55
1—
28,518
—52
1,46
154
9,97
9—
63,904
—52
0,07
858
3,98
2Arcad
iaQue
st:Inferno
3,72
9,15
6—
——
3,72
9,15
614
,488
7,26
0—
298,92
532
0,67
3—
——
——
Arcad
iaQue
st:Riders
——
——
——
——
——
456,92
0—
—57
,327
514,24
7Ban
anaBan
dits
——
——
——
2,40
0—
35,934
38,334
—10
2—
825
927
Blood
Rag
e10
1,48
520
,425
—1,88
1,40
72,00
3,31
7—
15,566
—72
0,40
273
5,96
8—
40,921
—17
3,38
921
4,31
0Blood
borne:
The
CardGam
e—
32,070
—22
4,02
125
6,09
1—
9,74
4—
372,67
938
2,42
3—
25,740
—31
9,36
834
5,10
8BlueM
oonCity
——
——
——
——
——
—2,48
0—
42,259
44,739
B-S
iege
d:Son
sof
theAby
ss62
,865
5,24
4—
125,69
819
3,80
7—
3,58
0—
6,02
69,60
6—
9,39
9—
5,73
115
,130
Cou
ncil
ofFou
r—
——
——
——
——
——
10,049
—94
,897
104,94
6Cthulhu
intheHou
se—
1,43
0—
11,450
12,880
—88
6—
22,209
23,095
—35
5—
840
1,19
5Cthulhu
:Dea
thM
ayDie
——
——
——
——
——
3,20
6,41
360
,806
——
3,26
7,21
9Dark
Age
—52
,435
—23
,164
75,599
—16
8,93
0—
74,735
243,66
5—
64,605
—42
,314
106,91
9Dog
sof
War
—54
8—
6,96
67,51
4—
4,58
0—
7,54
312
,123
—99
3—
2,44
13,43
4DojoKun
——
——
——
65—
34,587
34,652
—79
1—
19,131
19,922
Drago
nCastle
——
——
——
——
——
—30
,744
—28
1,67
531
2,41
9Dream
On
——
——
——
1,18
8—
8,78
09,96
8—
8,39
7—
108,36
911
6,76
6Ethno
s—
——
——
—10
,991
—29
1,05
830
2,04
9—
23,450
—19
9,05
322
2,50
3Gan
gRush:
Break
out
——
——
——
814
—54
,327
55,141
——
——
—Gatew
ayUprising
——
——
——
5,49
2—
19,314
24,806
—85
6—
30,450
31,306
Gek
ido:
Bot
Battles
——
——
——
9,27
6—
39,524
48,800
—1,72
3—
1,62
23,34
5Gizmos
——
——
——
——
——
—37
,302
—36
8,29
240
5,59
4Guildsof
Cad
wallon
—83
0—
775
1,60
5—
123
—60
472
7—
311
—25
856
9HATE
——
——
——
——
——
2,28
9,68
3—
——
2,28
9,68
3Kaleido
s—
1,56
0—
13,708
15,268
—31
8—
2,33
32,65
1—
252
—77
21,02
4Kao
sball
—4,71
0—
14,490
19,200
—5,86
4—
1,39
17,25
5—
8,93
0—
11,288
20,218
Kick-Ass
——
——
——
——
——
—17
,177
—61
,411
78,588
Kingz
—10
——
10—
496
—9,14
09,63
6—
——
——
Kreus
—2,21
0—
—2,21
0—
335
—15
,386
15,721
—25
4—
—25
4Kronia
——
——
——
580
—35
,738
36,318
—24
1—
493
734
Krosm
asterArena
—4,48
0—
49,343
53,823
—2,25
5—
43,382
45,637
——
——
—Krosm
asterQue
st—
7,43
4—
154,52
616
1,96
0—
2,11
9—
2,81
54,93
4—
——
——
Loo
terz
—2,87
2—
40,920
43,792
—1,67
0—
23,755
25,425
—1,92
5—
16,106
18,031
Loren
zoil
Mag
nifico
——
——
——
6,30
0—
104,89
311
1,19
3—
59,446
—59
,587
119,03
3M
asmorra:Dun
geon
sof
Arcad
ia1,85
9,91
78,37
8—
139,10
02,00
7,39
515
,366
5,09
0—
143,99
416
4,45
0—
2,90
1—
17,756
20,657
Masqu
es34
7—
10,320
10,667
—26
8—
2,58
72,85
5—
207
—72
279
Massive
Darkn
ess
——
——
—4,46
5,53
524
,917
—57
8,82
95,06
9,28
1—
38,001
—49
2,91
053
0,91
1M
eepleW
ar—
——
——
—12
4—
30,488
30,612
—1,12
1—
4,20
15,32
2M
odernArt
——
——
——
3,68
9—
63,682
67,371
—3,78
6—
35,480
39,266
Mon
strous
—60
——
60—
420
—16
,915
17,335
—10
0—
810
8Narco
s—
——
——
——
——
——
3,32
0—
31,762
35,082
New
ton
——
——
——
——
——
—13
,175
—10
3,69
611
6,87
1
– 24 –

Salesofourgames
bychannels(continued)
For
theye
aren
ded31
Decem
ber
For
theye
aren
ded31
Decem
ber
For
theye
aren
ded31
Decem
ber
2016
2017
2018
Direct
Direct
Direct
Kickstarter
Onlinestore
andga
me
conv
ention
sM
obilega
me
Who
lesalers
Total
Kickstarter
Onlinestore
andga
me
conv
ention
sM
obilega
me
Who
lesalers
Total
Kickstarter
Onlinestore
andga
me
conv
ention
sM
obilega
me
Who
lesalers
Total
US$
US$
US$
US$
US$
US$
US$
US$
US$
US$
US$
US$
US$
US$
US$
PlayM
e—
2,39
6—
19,016
21,412
—1,39
7—
1,07
02,46
7—
535
—53
71,07
2PotionExp
losion
—28
,049
—18
8,96
021
7,00
9—
21,783
—42
1,42
844
3,21
1—
28,505
—25
6,13
828
4,64
3Que
en’s
Necklac
e—
323
—3,32
43,64
7—
396
—2,04
82,44
4—
546
—2,07
22,61
8Railroa
dInk
——
——
——
——
——
——
—12
6,44
112
6,44
1Raise
You
rGob
lets
—1,14
0—
201,16
0—
4,75
8—
75,427
80,185
—2,09
4—
22,780
24,874
Richa
rdtheLionh
eart
——
——
——
805
—43
,480
44,285
—4,71
3—
116,23
612
0,94
9RisingSun
——
——
—6,04
0,10
1—
——
6,04
0,10
144
,970
82,970
—1,54
9,92
81,67
7,86
8Rivet
Wars
—12
,995
—24
,988
37,983
—34
,396
—7,33
141
,727
—24
,630
—5,17
829
,808
Rum
&Bon
es91
,296
19,243
—13
5,68
224
6,22
1—
15,494
—52
,587
68,081
—5,68
2—
3,54
69,22
8Rum
&Bon
es:Secon
dTide
1,86
7,66
1—
——
1,86
7,66
117
,798
14,455
—23
7,16
926
9,42
2—
14,135
—47
,596
61,731
Rum
blein
theDun
geon
—1,45
0—
7,35
08,80
0—
600
—21
,184
21,784
—40
9—
2,41
92,82
8Sed
itionW
ars:
Battlefor
Alaba
ster
—16
9—
1,77
61,94
5—
——
——
——
——
—She
riff
ofNotting
ham
——
—15
5,75
015
5,75
0—
——
117,02
511
7,02
5—
665
—86
,120
86,785
She
rloo
k—
——
——
—60
0—
20,315
20,915
—27
4—
2,28
92,56
3Starcad
iaQue
st—
——
——
——
——
—1,50
1,30
6—
——
1,50
1,30
6Ta-Da!
—6,26
9—
13,515
19,784
—2,99
9—
4,55
47,55
3—
1,13
6—
6,36
97,50
5The
God
father:Corleon
e’s
Empire
——
——
——
15,156
—94
8,90
696
4,06
2—
9,59
5—
177,65
518
7,25
0The
Grizzled
—8,90
7—
259,32
726
8,23
4—
——
159,59
215
9,59
2—
35,613
—14
3,47
617
9,08
9The
GrizzledArm
istice
Edition
——
——
——
——
——
—6,02
4—
73,277
79,301
The
Others:
7Sins
2,54
3,01
915
,379
—75
9,70
43,31
8,10
219
,757
16,702
—24
4,98
328
1,44
2—
10,801
—11
1,79
512
2,59
6The
World
ofSM
OG:OnHer
Majesty’s
Service
—4,34
4—
12,354
16,698
—3,09
0—
5,47
48,56
4—
1,85
2—
6,17
38,02
5The
World
ofSM
OG:Riseof
Moloc
h—
——
——
1,90
1,31
8—
—12
,348
1,91
3,66
678
,787
7,82
0—
61,179
147,78
6Unfair
——
——
——
5,96
5—
135,86
014
1,82
5—
3,17
5—
32,650
35,825
Unu
sual
Suspe
cts
—9,38
0—
59,196
68,576
—1,77
1—
10,486
12,257
—1,74
9—
17,472
19,221
Victorian
Masterm
inds
——
——
——
——
——
—1,57
4—
3,48
05,05
4W
akaTan
ka—
550
—2,59
53,14
5—
108
—44
955
7—
55—
285
340
Way
ofthePan
da—
——
——
——
——
——
8,09
4—
74,428
82,522
Wrath
ofKings
—44
,999
—68
,393
113,39
2—
74,882
—46
,912
121,79
4—
57,136
—31
,064
88,200
Xen
oShy
ft(m
obile)
——
23,501
—23
,501
——
9,09
8—
9,09
8—
—4,00
7—
4,00
7Xen
oShy
ft:Dread
mire
713,07
23,24
0—
2471
6,33
613
,271
5,98
2—
49,340
68,593
—1,98
5—
3,53
85,52
3Xen
oShy
ft:Onslaug
ht—
6,98
5—
79,403
86,388
—5,91
6—
19,463
25,379
—2,63
6—
14,370
17,006
Zom
bicide
—11
,357
—81
2,35
082
3,70
7—
1,49
0—
510,29
051
1,78
0—
182,54
5—
1,50
9,05
91,69
1,60
4Zom
bicide
:Black
Plagu
e49
8,25
747
,759
—2,36
7,21
22,91
3,22
8—
199,12
1—
1,18
7,85
31,38
6,97
4—
24,849
—38
8,52
241
3,37
1Zom
bicide
:Green
Horde
——
——
—8,10
9,92
4—
——
8,10
9,92
411
6,40
689
9—
1,31
6,12
11,43
3,42
6Zom
bicide
:Inva
der
——
——
——
——
——
4,85
1,17
016
,246
——
4,86
7,41
6Zom
bicide
:Sea
son2
—9,43
9—
232,63
624
2,07
5—
2,66
2—
201,69
520
4,35
7—
——
287,95
228
7,95
2Zom
bicide
:Sea
son3
1,61
826
5,98
0—
253,85
252
1,45
0—
4,12
0—
163,20
616
7,32
6—
——
226,76
522
6,76
5
Total
revenu
efrom
games
11,468
,346
687,24
223
,501
8,51
9,02
020
,698
,109
20,597
,558
759,47
59,09
88,31
0,15
229
,676
,283
15,237
,000
1,18
2,31
64,00
711
,425
,804
27,849
,127
Other
prod
ucts
—16
1,07
0—
104,95
626
6,02
6—
110,73
8—
29,719
140,45
7—
53,439
—30
4,84
535
8,28
4
Total
11,468
,346
848,31
223
,501
8,62
3,97
620
,964
,135
20,597
,558
870,21
39,09
88,33
9,87
129
,816
,740
15,237
,000
1,23
5,75
54,00
711
,730
,649
28,207
,411
– 25 –

Salesofourgames
bychannels(continued)
For
thesix
mon
thsen
ded30
Jun
eFor
thesix
mon
thsen
ded30
Jun
e
2018
2019
Direct
Direct
Kickstarter
Onlinestorean
d
gameco
nven
tion
sM
obilega
me
Who
lesalers
Total
Kickstarter
Onlinestorean
d
gameco
nven
tion
sM
obilega
me
Who
lesalers
Total
US$
US$
US$
US$
US$
US$
US$
US$
US$
US$
(Una
udited
)(U
naud
ited
)(U
naud
ited
)(U
naud
ited
)(U
naud
ited
)(U
naud
ited
)(U
naud
ited
)(U
naud
ited
)(U
naud
ited
)(U
naud
ited
)
13Clues
—2,46
6—
23,771
26,237
——
—7,72
67,72
675
Gno
m’Street
——
——
——
——
156,09
715
6,09
7A
Son
gof
Ice&
Fire:
Tab
letopM
iniaturesGam
e2,67
3,69
3—
—41
9,63
03,09
3,32
3—
30,058
—96
6,46
599
6,52
3Arcad
iaQue
st—
13,702
—22
9,91
924
3,62
1—
2,16
1—
187,10
618
9,26
7Arcad
iaQue
st:Inferno
——
——
——
——
120,12
612
0,12
6Arcad
iaQue
st:Riders
456,92
0—
——
456,92
0—
——
——
Ban
anaBan
dits
—10
2—
8018
2—
30—
105
135
Blood
Rag
e—
9,01
5—
173,38
918
2,40
4—
162
—12
1,13
112
1,29
3Blood
borne:
The
CardGam
e—
11,303
—15
0,31
916
1,62
2—
593
—14
7,92
114
8,51
4BlueM
oonCity
——
——
——
——
84,930
84,930
B-S
iege
d:Son
sof
theAby
ss—
3,33
7—
5,73
19,06
8—
——
——
Cou
ncil
ofFou
r—
10,049
—87
,881
97,930
—12
—11
0,39
611
0,40
8Cthulhu
intheHou
se—
260
—56
882
8—
——
7,79
07,79
0Cthulhu
:Dea
thM
ayDie
——
——
—57
4,84
1—
—20
9,36
178
4,20
2Dark
Age
—60
,315
—38
,652
98,967
—12
—22
,169
22,181
Dog
sof
War
—65
5—
2,44
13,09
6—
12—
456
468
DojoKun
—79
1—
17,319
18,110
——
—67
,537
67,537
Drago
nCastle
—4,90
2—
165,13
117
0,03
3—
20—
32,418
32,438
Dream
On
—52
4—
108,36
910
8,89
3—
232
—36
,642
36,874
Ethno
s—
3,45
4—
90,141
93,595
—1,02
0—
161,64
716
2,66
7Foo
dies
——
——
——
——
57,483
57,483
Gan
gRush:
Break
out
——
——
——
——
141,38
214
1,38
2Gatew
ayUprising
—37
2—
30,450
30,822
——
—12
,534
12,534
Gek
ido:
Bot
Battles
—1,45
3—
1,61
73,07
0—
——
191,41
119
1,41
1Gizmos
——
—43
,395
43,395
—21
3—
153,78
415
3,99
7God
ofW
ar:The
CardGam
e—
——
——
——
—34
,473
34,473
Guildsof
Cad
wallon
—28
3—
258
541
——
—1,27
41,27
4HATE
——
——
—54
5,60
547
2—
27,123
573,20
0Kaleido
s—
252
—77
21,02
4—
——
49,247
49,247
Kao
sball
—4,43
0—
4,82
89,25
8—
102
—32
,640
32,742
Kick-Ass
——
——
——
2,71
5—
73,864
76,579
Kreus
—18
6—
—18
6—
5—
—5
Kronia
—24
1—
6330
4—
5—
123
128
Krosm
asterQue
st—
——
——
——
—14
6,41
414
6,41
4Loo
terz
—1,03
4—
10,463
11,497
——
—40
,847
40,847
Loren
zoil
Mag
nifico
—11
,217
—59
,587
70,804
—62
—30
,231
30,293
Masmorra:Dun
geon
sof
Arcad
ia—
2,64
3—
10,434
13,077
—52
—5,98
76,03
9M
asqu
es—
126
—72
198
——
——
—M
assive
Darkn
ess
—10
,824
—25
6,96
026
7,78
4—
393
—87
,235
87,628
MeepleW
ar—
1,03
2—
3,20
24,23
4—
8—
63,294
63,302
Mod
ernArt
—1,08
6—
32,864
33,950
——
—34
,411
34,411
Mon
strous
—10
0—
810
8—
30—
104,46
310
4,49
3Narco
s—
——
——
—96
0—
227,80
122
8,76
1New
ton
——
——
——
68—
110,93
011
0,99
8PlayM
e—
535
—36
289
7—
43—
57,473
57,516
– 26 –

Salesofourgames
bychannels(continued)
For
thesix
mon
thsen
ded30
Jun
eFor
thesix
mon
thsen
ded30
Jun
e
2018
2019
Direct
Direct
Kickstarter
Onlinestorean
d
gameco
nven
tion
sM
obilega
me
Who
lesalers
Total
Kickstarter
Onlinestorean
d
gameco
nven
tion
sM
obilega
me
Who
lesalers
Total
US$
US$
US$
US$
US$
US$
US$
US$
US$
US$
(Una
udited
)(U
naud
ited
)(U
naud
ited
)(U
naud
ited
)(U
naud
ited
)(U
naud
ited
)(U
naud
ited
)(U
naud
ited
)(U
naud
ited
)(U
naud
ited
)
PotionExp
losion
—9,33
1—
244,11
625
3,44
7—
873
—20
1,84
320
2,71
6Que
en’s
Necklac
e—
546
—1,72
82,27
4—
6—
222
228
Railroa
dInk
——
—16
,721
16,721
——
—7
7Raise
You
rGob
lets
——
——
——
148
—8,40
38,55
1Richa
rdtheLionh
eart
—1,66
6—
116,23
611
7,90
2—
——
8,02
48,02
4RisingSun
—82
,970
—1,29
7,82
21,38
0,79
2—
603
—22
9,01
122
9,61
4Rivet
Wars
—13
,764
—5,17
818
,942
——
—68
7,54
768
7,54
7Rum
&Bon
es—
3,02
4—
3,54
66,57
0—
1,06
0—
9,93
610
,996
Rum
&Bon
es:Secon
dTide
—7,80
1—
47,596
55,397
—61
—16
5,01
616
5,07
7Rum
blein
theDun
geon
—40
9—
866
1,27
5—
——
68,971
68,971
She
riff
ofNotting
ham
——
—10
,500
10,500
——
—85
,849
85,849
She
rloo
k—
274
—64
692
0—
——
776
776
Starcad
iaQue
st—
——
——
196,16
5—
——
196,16
5Ta-Da!
—1,13
6—
3,69
04,82
6—
25—
616
641
The
God
father:Corleon
e’sEmpire
—4,48
4—
51,949
56,433
—52
—13
2,57
413
2,62
6The
Grizzled
—89
0—
74,121
75,011
—1,58
4—
66,986
68,570
The
Grizzled:
Arm
istice
Edition
——
——
——
313
—23
6,96
123
7,27
4The
Others:
7Sins
—3,44
1—
60,288
63,729
—67
3—
119,47
112
0,14
4The
World
ofSM
OG:OnHer
Majesty’s
Service
—1,42
1—
5,00
06,42
1—
——
766
766
The
World
ofSM
OG:Riseof
Moloc
h—
7,78
3—
54,686
62,469
——
—55
,676
55,676
Unfair
—1,21
0—
22,240
23,450
—10
—12
313
3Unu
sual
Suspe
cts
—79
7—
12,523
13,320
—10
2—
3,17
23,27
4Victorian
Masterm
inds
——
——
——
2,59
7—
273,17
227
5,76
9W
acky
Rac
es—
——
——
—1,59
5—
134,26
313
5,85
8W
akaTan
ka—
55—
216
271
——
——
—W
alls
ofYork
——
——
——
8—
1,13
31,14
1W
ayof
thePan
da—
3,32
2—
74,428
77,750
——
—40
840
8W
rath
ofKings
—17
,835
—28
,629
46,464
—44
2—
325,02
632
5,46
8Xen
oShy
ft(m
obile)
——
2,83
4—
2,83
4—
—72
7—
727
Xen
oShy
ft:Dread
mire
—76
1—
2,46
33,22
4—
56—
217,52
021
7,57
6Xen
oShy
ft:Onslaug
ht—
841
—10
,198
11,039
——
—7,77
07,77
0Zom
bicide
—10
5,42
8—
800,74
690
6,17
4—
518
—31
8,51
831
9,03
6Zom
bicide
:Black
Plagu
e—
18,991
—38
8,52
240
7,51
3—
1,40
2—
247,27
824
8,68
0Zom
bicide
:Green
Horde
25,814
899
—27
7,65
230
4,36
5—
695
—50
1,65
950
2,35
4Zom
bicide
:Inva
der
——
——
—62
1,69
0—
—1,27
5,19
71,89
6,88
7Zom
bicide
:Sea
son2
——
—21
5,19
221
5,19
2—
136
—26
5,83
526
5,97
1Zom
bicide
:Sea
son3
——
—11
0,60
311
0,60
3—
312
—12
5,40
512
5,71
7
Total
revenu
efrom
games
3,15
6,42
744
5,76
82,83
45,90
6,77
79,51
1,80
61,93
8,30
152
,711
727
9,89
9,58
111
,891
,320
Other
prod
ucts
—9,48
2—
29,638
39,120
—4,46
2—
924,22
892
8,69
0
Total
3,15
6,42
745
5,25
02,83
45,93
6,41
59,55
0,92
61,93
8,30
157
,173
727
10,823
,809
12,820
,010
– 27 –

The Group’s games were mainly sold through Kickstarter and wholesalers, which in
aggregate accounted for approximately 95.8%, 97.1%, 95.6% and 99.5% of the Group’s
total revenue for the three years ended 31 December 2018 and the six months ended 30
June 2019, respectively.
The Group’s tabletop games that are launched through Kickstarter generally record
higher revenue during the first year of shipping as all funds received in advance from the
Kickstarter backers and late subscribers are recognised as revenue once the products are
shipped. When all the orders from the Kickstarter have been fulfilled, the Group usually
will not record any sales from Kickstarter for a particular game and subsequent sales of
the game will be generated from wholesalers, game conventions and online stores.
However, in September 2019, the Group launched a Kickstarter campaign called CMON
Time Machine to market certain of its existing games including HATE, Rising Sun and
Zombicide: Green Horde. Therefore, it is expected that the Group will record sales from
Kickstarter for those games for the year ending 31 December 2019.
Upon the games being launched through Kickstarter, the Group will contact the
wholesalers to gauge their level of interest in a new game. To the best knowledge,
information and belief of the Directors, the wholesalers usually decide the size of their
first few orders of each game with reference to its sales performance on Kickstarter. After
that, the wholesalers will decide subsequent order size based on the actual sales
performance of the game. As tabletop games usually attract higher awareness and
interest from players at the beginning, orders from wholesalers usually show a decreasing
trend and tend to stabilise in one to two years’ time after the game was first available for
sale. However, a successful or popular tabletop game may enjoy sustained demand from
the market over a long period of time, especially when the sequel products are launched.
Therefore, the Group still records sales from some of its tabletop games which were
launched several years ago.
Sales of games launched through Kickstarter with products being shipped during the
Reporting Period
(i) Kickstarter games first shipped during the year ended 31 December 2016
For Arcadia Quest: Inferno, Masmorra: Dungeons of Arcadia, Rum & Bones: Second
Tide and The Others: 7 Sins, their respective game products were first shipped during
the year ended 31 December 2016. In particular, except for The Others: 7 Sins, the
shipment of the other three games took place by the end of 2016 and therefore all
these three games continued to record sales from Kickstarter during the year ended
31 December 2017 as the Group continued to fulfill the Kickstarter orders in 2017.
Besides, as the shipment in 2016 was mainly for the purpose of fulfilling Kickstarter
orders, minimal or even no sales from wholesalers were recorded from Arcadia
Quest: Inferno, Masmorra: Dungeons of Arcadia and Rum & Bones: Second Tide
during the year ended 31 December 2016. The Group continued to generate revenue
from these games through sales to wholesalers during the two years ended 31
December 2018 and the six months ended 30 June 2019. Kickstarter games first
– 28 –

shipped during the year ended 31 December 2016 generated revenue from
Kickstarter and wholesalers of approximately US$10.0 million and US$898,804
for the year ended 31 December 2016, US$67,409 and US$925,071 for the year ended
31 December 2017, nil and US$177,147 for the year ended 31 December 2018 and nil
and US$410,600 for the six months ended 30 June 2019, respectively.
(ii) Kickstarter games first shipped during the year ended 31 December 2017
For Massive Darkness, Rising Sun, The World of SMOG: Rise of Moloch and
Zombicide: Green Horde, their respective game products were first shipped during
the year ended 31 December 2017. In particular, except for Massive Darkness, the
shipment of the other three games took place and completed by the end of 2017 and
therefore minimal or even no sales from wholesalers were recorded during the year
ended 31 December 2017. Kickstarter games first shipped during the year ended 31
December 2017 generated revenue from Kickstarter and wholesalers of
approximately US$20.5 million and US$591,177 for the year ended 31 December
2017, US$240,163 and approximately US$3.4 million for the year ended 31
December 2018 and nil and US$873,581 for the six months ended 30 June 2019,
respectively.
(iii)Kickstarter games first shipped during the year ended 31 December 2018
During the year ended 31 December 2018, the Group first shipped the game products
of A Song of Ice & Fire: Tabletop Miniatures Game, Arcadia Quest: Riders, Cthulhu:
Death May Die, HATE, Starcadia Quest and Zombicide: Invader. Therefore, most of
their sales for the year ended 31 December 2018 were contributed by Kickstarter
sales with Cthulhu: Death May Die, HATE, Starcadia Quest and Zombicide: Invader
had not yet commenced their wholesalers’ sales. Revenue generated from these
games from Kickstarter and wholesalers amounted to approximately US$15.0
million and US$1.6 million for the year ended 31 December 2018 and approximately
US$1.9 million and US$2.5 million for the six months ended 30 June 2019,
respectively.
(iv) Kickstarter games first shipped during the six months ended 30 June 2019
No new Kickstarter game was first shipped during the six months ended 30 June
2019.
Sales of games launched through wholesalers during the Reporting Period
Games launched through wholesalers during the Reporting Period included 13 Clues, 75
Gnom’ Street, Banana Bandits, Bloodborne: The Card Game, Blue Moon City, Council of
Four, Cthulhu in the House, Dojo Kun, Dragon Castle, Dream On, Ethnos, Foodies, Gang
Rush: Breakout, Gateway Uprising, Gekido: Bot Battles, Gizmos, God of War: The Card
Game, Kaleidos, Kick-Ass, Kingz, Kreus, Kronia, Krosmaster Arena, Krosmaster Quest,
Looterz, Lorenzo il Magnifico, Masques, Meeple War, Modern Art, Monstrous, Narcos,
– 29 –

Newton, Play Me, Potion Explosion, Railroad Ink, Raise Your Goblets, Richard the
Lionheart, Rumble in the Dungeon, Sheriff of Nottingham, Sherlook, Sugarblast, Ta-Da!,
The Godfather: Corleone’s Empire, The Grizzled: Armistice Edition, Unfair, Unusual
Suspects, Victorian Masterminds, Wacky Races, Waka Tanka, Walls of York and Way of
the Panda, which together accounted for approximately 5.0%, 10.6%, 11.1% and 27.4%
of the total revenue from games of the Group for the three years ended 31 December 2018
and the six months ended 30 June 2019, respectively.
For games launched through wholesalers, their sales performances were relatively even
for their respective first launches except for (i) The Godfather: Corleone’s Empire which
recorded revenue of US$964,062 for its first launch in 2017, representing approximately
3.2% of the total revenue for the year ended 31 December 2017; and (ii) Dragon Castle
and Gizmos which recorded revenue of US$312,419 and US$405,594 for its first launch in
2018, respectively, together representing approximately 2.5% of the total revenue for the
year ended 31 December 2018.
Sales of games with products already available for sale before 1 January 2016
According to the report from Ipsos dated 25 November 2016, the extract of which is
included in the Prospectus, it is estimated that the average life cycle for tabletop games is
generally more than 8 years however with product extensions this timeframe may be
extended. Publishers often extend the life of the successful games by introducing sequels,
expansions or limited edition to the game titles. Therefore, although sales of tabletop
games usually decrease gradually over its product life cycle, they still have their value and
supporters over the years and it is possible to boost up the sales again by implementing
extension strategies. As a result, the Group continued to record sales from games with
products already available for sale before 1 January 2016 during the Reporting Period.
For all the games with products already available for sale before 1 January 2016,
majority of their sales during the Reporting Period was contributed by wholesalers. In
general, save for Arcadia Quest and Zombicide, all the games with products already
available for sale before 1 January 2016 recorded a decreasing trend in sales during the
Reporting Period although there was occasional increase in sales in a particular year for
certain games mainly due to restocking of the products by wholesalers during the relevant
year.
Arcadia Quest recorded an increase in revenue from US$407,551 for the year ended 31
December 2016 to US$549,979 for the year ended 31 December 2017, and to US$583,982
for the year ended 31 December 2018, mainly due to the effect of the shipment of its
sequel Arcadia Quest: Inferno in late 2016 and Arcadia Quest: Riders in 2018 which
boosted the sales of Arcadia Quest. Zombicide recorded an increase in revenue from
US$511,780 for the year ended 31 December 2017 to approximately US$1.7 million for
the year ended 31 December 2018, mainly due to the effect of the shipment of its sequel
Zombicide: Green Horde and Zombicide: Invader in late 2017 and late 2018, respectively,
which boosted the sales of Zombicide.
– 30 –

Game pipeline
The Group’s future growth will depend in part on its ability to continuously launch new
games that are able to meet the changing preferences of players.
As at the date of this announcement, the Group had 14 board games in its pipeline,
details of which are set out below:
No. Project title of games in development Expected launch date Genre Game type Ownership
1 Project A Second half of 2019 Strategy Board game Self-owned
2 Project B Second half of 2019 Strategy Board game Licensed
3 Project C Second half of 2019 Family Board game Self-owned
4 Project D Second half of 2019 Family Board game Self-owned
5 Project E Second half of 2019 Fantasy Board game Self-owned
6 Project F Second half of 2019 Family Board game Licensed
7 Project G Second half of 2019 Family Board game Licensed
8 Project H Second half of 2019 Strategy Board game Self-owned
9 Project I Second half of 2019 Family Board game Self-owned
10 Project J First half of 2020 Fantasy Board game Self-owned
11 Project K First half of 2020 Fantasy Board game Self-owned
12 Project L First half of 2020 Fantasy Board game Licensed
13 Project M First half of 2020 Fantasy Board game Self-owned
14 Project N Second half of 2020 Family Board game Self-owned
Top customers
For the three years ended 31 December 2018 and the six months ended 30 June 2019, the
Group’s top five largest customers accounted for approximately 22.8%, 16.0%, 20.9%
and 39.5% of the total revenue of the Group, respectively, with the largest customer
accounting for approximately 9.1%, 6.2%, 7.2% and 21.1% of the total revenue of the
Group, respectively. All the top five largest customers of the Group were wholesalers
based in the United States, EU, Brazil and Canada.
As at the date of this announcement, none of the Directors, their associates, or any
Shareholders (which to the knowledge of the Directors owned more than 5% of the
Company’s issued share capital) had any interest in any of the top five largest customers
of the Group.
– 31 –

The following tables set out the details of the five largest customers of the Group duringthe Reporting Period:
For the six months ended 30 June 2019
Rank Customer
Background and principal
business Products purchased Location
Year(s) of
business
relationship
Percentage
of total
revenue
1 Customer A Customer A is a game
wholesaler incorporated in
1995. It has been operating
a publishing, sales,
marketing and distribution
business in the United
States handling products
from more than 30
publishers. Customer A
was acquired by a leading
global game company in
2014.
Tabletop games under
wholesale channel
United
States
1 21.1%
2 Customer G Customer G is a game
wholesaler incorporated in
2004. It has been a game
publisher and wholesaler
focusing on localization of
products from
international publishers
they represent to French
and production of its own
games in French.
Customer G was acquired
by the parent company of
Customer A in 2016.
Tabletop games under
wholesale channel
France 7 5.3%
3 Customer C Customer C is a game
wholesaler incorporated in
2012. It is a Brazilian
game wholesaler with a
network of more than 500
partner stores established
in all the states of Brazil.
Customer C was acquired
by the parent company of
Customer A in 2018.
Tabletop games under
wholesale channel
Brazil 2 5.3%
– 32 –
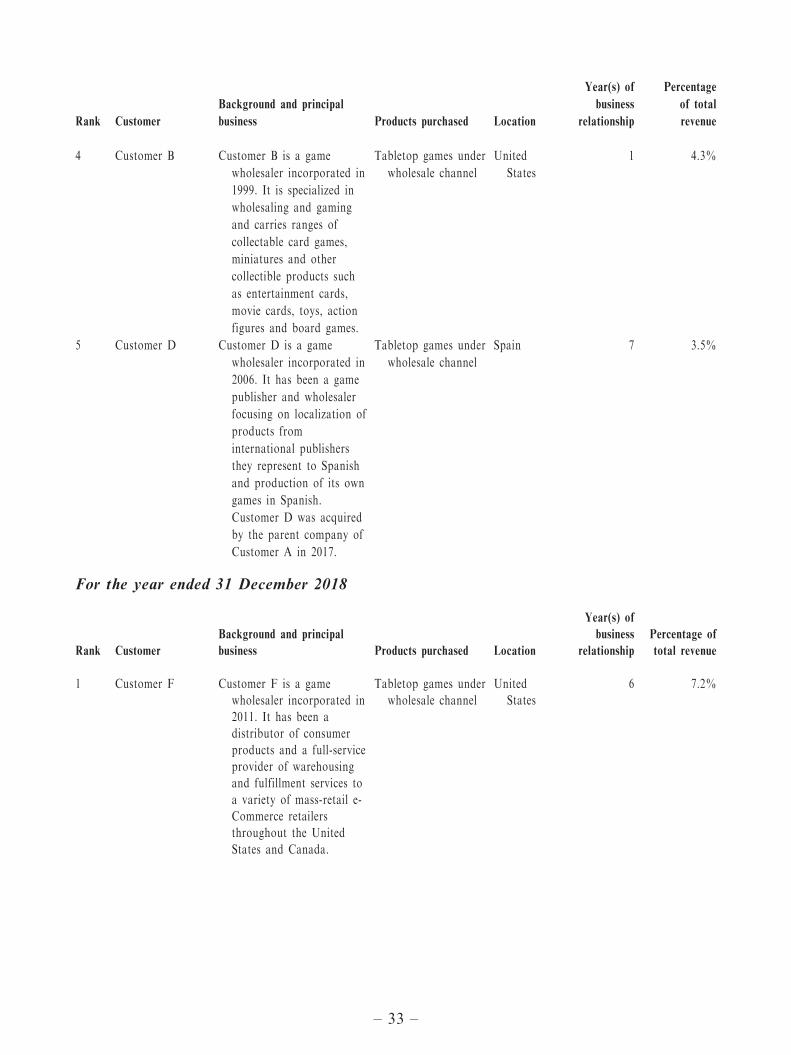
Rank Customer
Background and principal
business Products purchased Location
Year(s) of
business
relationship
Percentage
of total
revenue
4 Customer B Customer B is a game
wholesaler incorporated in
1999. It is specialized in
wholesaling and gaming
and carries ranges of
collectable card games,
miniatures and other
collectible products such
as entertainment cards,
movie cards, toys, action
figures and board games.
Tabletop games under
wholesale channel
United
States
1 4.3%
5 Customer D Customer D is a game
wholesaler incorporated in
2006. It has been a game
publisher and wholesaler
focusing on localization of
products from
international publishers
they represent to Spanish
and production of its own
games in Spanish.
Customer D was acquired
by the parent company of
Customer A in 2017.
Tabletop games under
wholesale channel
Spain 7 3.5%
For the year ended 31 December 2018
Rank Customer
Background and principal
business Products purchased Location
Year(s) of
business
relationship
Percentage of
total revenue
1 Customer F Customer F is a game
wholesaler incorporated in
2011. It has been a
distributor of consumer
products and a full-service
provider of warehousing
and fulfillment services to
a variety of mass-retail e-
Commerce retailers
throughout the United
States and Canada.
Tabletop games under
wholesale channel
United
States
6 7.2%
– 33 –

Rank Customer
Background and principal
business Products purchased Location
Year(s) of
business
relationship
Percentage of
total revenue
2 Customer E Customer E is a game
wholesaler incorporated in
1995. It has been an
established distributor of
games, collectibles and
toys in UK. Customer E
was acquired by the parent
company of Customer A in
2010.
Tabletop games under
wholesale channel
UK 7 4.8%
3 Customer G Customer G is a game
wholesaler incorporated in
2004. It has been a game
publisher and wholesaler
focusing on localization of
products from
international publishers
they represent to French
and production of its own
games in French.
Customer G was acquired
by the parent company of
Customer A in 2016.
Tabletop games under
wholesale channel
France 7 3.6%
4 Customer H Customer H is a game
wholesaler incorporated in
1982. It has been a United
States game wholesaler
specialized in the
distribution of board
games, card games,
miniatures, role playing
games, gaming tolls and
accessories to retailers
around the world. It has a
network of over 250
vendors and 5 warehouses
across the United States.
Tabletop games under
wholesale channel
United
States
8 3.1%
5 Customer I Customer I is a game
wholesaler incorporated in
1989. It has been a
Canadian game wholesaler
of tabletop games, comics,
collectible toys & figurines,
sports and non-sports
cards, collectible card
games, and role-playing
games. It has distribution
centers in Montreal,
Toronto, and Vancouver in
Canada.
Tabletop games under
wholesale channel
Canada 7 2.2%
– 34 –

For the year ended 31 December 2017
Rank Customer
Background and principal
business Products purchased Location
Year(s) of
business
relationship
Percentage
of total
revenue
1 Customer F Customer F is a game
wholesaler incorporated in
2011. It has been a
distributor of consumer
products and a full-service
provider of warehousing
and fulfillment services to
a variety of mass-retail e-
Commerce retailers
throughout the United
States and Canada.
Tabletop games under
wholesale channel
United
States
6 6.2%
2 Customer E Customer E is a game
wholesaler incorporated in
1995. It has been an
established distributor of
games, collectibles and
toys in UK. Customer E
was acquired by the parent
company of Customer A in
2010.
Tabletop games under
wholesale channel
UK 7 3.2%
3 Customer H Customer H is a game
wholesaler incorporated in
1982. It has been a United
States game wholesaler
specialized in the
distribution of board
games, card games,
miniatures, role playing
games, gaming tolls and
accessories to retailers
around the world. It has a
network of over 250
vendors and 5 warehouses
across the United States.
Tabletop games under
wholesale channel
United
States
8 2.4%
– 35 –

Rank Customer
Background and principal
business Products purchased Location
Year(s) of
business
relationship
Percentage
of total
revenue
4 Customer J Customer J is a game
wholesaler incorporated in
2007. It has been a United
States game wholesaler in
the toy and hobby gaming
industries offering over
20,000 products from over
400 publishers and
manufacturers. Customer J
has 3 warehouses in the
United States.
Tabletop games under
wholesale channel
United
States
8 2.3%
5 Customer G Customer G is a game
wholesaler incorporated in
2004. It has been a game
publisher and wholesaler
focusing on localization of
products from
international publishers
they represent to French
and production of its own
games in French.
Customer G was acquired
by the parent company of
Customer A in 2016.
Tabletop games under
wholesale channel
France 7 1.9%
For the year ended 31 December 2016
Rank Customer
Background and principal
business Products purchased Location
Year(s) of
business
relationship
Percentage of
total revenue
1 Customer F Customer F is a game
wholesaler incorporated in
2011. It has been a
distributor of consumer
products and a full-service
provider of warehousing
and fulfillment services to
a variety of mass-retail e-
Commerce retailers
throughout the United
States and Canada.
Tabletop games under
wholesale channel
United
States
6 9.1%
– 36 –

Rank Customer
Background and principal
business Products purchased Location
Year(s) of
business
relationship
Percentage of
total revenue
2 Customer E Customer E is a game
wholesaler incorporated in
1995. It has been an
established distributor of
games, collectibles and
toys in UK. Customer E
was acquired by the parent
company of Customer A in
2010.
Tabletop games under
wholesale channel
UK 7 4.1%
3 Customer K Customer K is a game
wholesaler incorporated in
2008. It has been a
German game wholesaler
and publisher of board
games working together
with around 30 partner
publishers worldwide.
Customer K handles the
entire spectrum of
publishing, editorial,
marketing and sales of
board games in Germany
for the parent company of
Customer A. It has a
warehouse in Walldurn,
Germany and other
editorial and
administration areas in
Germany.
Tabletop games under
wholesale channel
Germany 5 3.8%
4 Customer G Customer G is a game
wholesaler incorporated in
2004. It has been a game
publisher and wholesaler
focusing on localization of
products from
international publishers
they represent to French
and production of its own
games in French.
Customer G was acquired
by the parent company of
Customer A in 2016.
Tabletop games under
wholesale channel
France 7 3.6%
– 37 –

Rank Customer
Background and principal
business Products purchased Location
Year(s) of
business
relationship
Percentage of
total revenue
5 Customer J Customer J is a game
wholesaler incorporated in
2007. It has been a United
States game wholesaler in
the toy and hobby gaming
industries offering over
20,000 products from over
400 publishers and
manufacturers. Customer J
has 3 warehouses in the
United States.
Tabletop games under
wholesale channel
United
States
8 2.2%
As at the Latest Practicable Date, Customer A, Customer C, Customer D, Customer E,
Customer G and Customer K are all under the same parent company (together with its
subsidiaries, the ‘‘Top Customers Group’’) which is a leading global game company.
Customer A, Customer C, Customer D, Customer E, Customer G and Customer K are
primarily responsible for the North American, Brazilian, Spanish, UK, French and
German market of the Top Customers Group, respectively. Despite all of them are owned
by the same company, their sales and operation are independent from each other. Each of
them has its own responsible market in terms of the language of the game products or
geography which do not overlap with each other. Besides, each of them makes its own
purchase decisions and separately places purchase orders with the Group. In return, the
Group issues separate invoices to each of them. Since April 2019, due to internal policy
changes of the Top Customers Group, Customer A has started to coordinate the
distribution of the English language version of the games of the Group for itself and
Customer E. Therefore, Customer A consolidates the orders from Customer E and makes
bulk purchase request to the Group. Despite the above changes in the order arrangement,
the sales and operation of Customer A and Customer E remain as independent.
The Group also had business relationship with companies in the Top Customers Group
other than those which were top five largest customers of the Group during the
Reporting Period as discussed above. For the three years ended 31 December 2018 and
the six months ended 30 June 2019, the aggregated sales to companies in the Top
Customers Group amounted to approximately US$3.5 million, US$2.7 million, US$3.9
million and US$6.0 million respectively, representing approximately 16.9%, 9.2%, 13.8%
and 47.0% of the total revenue of the Group, respectively. The relatively high
concentration on sales to the Top Customers Group for the six months ended 30 June
2019 was mainly due to the relatively high contribution from wholesale sales and the low
contribution from Kickstarter sales as there had been no shipment of new Kickstarter
games during the period. The identification of the customers of the Group which are in
the Top Customers Group is conducted on best effort basis based on the best knowledge
– 38 –

and information of the Directors as well as public information retrieved from desktop
search. For the avoidance of doubt, the above sales to individual customers are
aggregated based on their shareholding as at the Latest Practicable Date.
There was a relatively substantial change in the composition of the top five largest
customers of the Group for the six months ended 30 June 2019 because three new
customers (i.e. Customer A, Customer B and Customer C), which have business
relationship of 2 years or less with the Group, became the top five largest customers of
the Group during the period. The Group became acquainted with Customer A and
Customer C through their parent company as the Group has business relationship with
other companies within the Top Customers Group. The Group became acquainted with
Customer B at a game convention held in 2018.
Before 2019, the Group did not have any sales to companies within the Top Customers
Group for the North American market as the Top Customers Group only focused on
distributing its own games in this particular geographical market in the past. However, in
early 2019, the Top Customers Group decided to expand its business in North America
by carrying games of other publishers on top of its own games. Therefore, Customer A,
which is responsible for the North American market of the Top Customers Group, was
very active in building up its game portfolio at the beginning of 2019 by purchasing
games of other publishers. As a result, for the six months ended 30 June 2019, the Group
recorded sales of 21 games with total amount of approximately US$2.7 million from
Customer A, resulting in it became the top customer of the Group for the six months
ended 30 June 2019. Customer C has only been acquired by the parent company of Top
Customer Group and become a member of the Top Customers Group in 2018. Customer
C is responsible for the Brazilian market, a new market that the Top Customers Group
wants to develop as it did not have significant presence in this market before the
acquisition. Therefore, with the support from the parent company, Customer C was also
very active in expanding its game distribution business in Brazil by purchasing games
from different publishers, including the Group, and became the third largest customer of
the Group for the six months ended 30 June 2019.
Customer B did not carry any of the Group’s games before it started the business
relationship with the Group in 2019. Therefore, as a game wholesaler, it placed its first
order to the Group during the six months ended 30 June 2019 to build up its portfolio of
the Group’ products which Customer B did not previously have. As a result, for the six
months ended 30 June 2019, the Group recorded sales of 12 games and other products
with total amount of US$552,889 from Customer B.
To the best knowledge of the Directors, save for (i) Mr. David Preti, a senior
management of the Group, held 25% of the issued share capital of Customer C before it
was acquired by the parent company of Customer A in 2018; and (ii) normal business
relationship, each of Customer A, Customer B and Customer C does not have any past or
– 39 –

present relationship, including but not limited to, employment, financing, or family
relationship with the Group, its directors, substantial shareholders, senior management
and any of their respective associates.
Business model, marketing, after sales services, quality control and information technology
There has been no material change to the business model, marketing, after sales services,
quality control and information technology of the Group since the Listing and up to the
date of this announcement.
Production
There has been no material change to the production of the Group since the Listing. The
Group outsources the production of its self-owned and licensed tabletop games to supply
chain managers, allowing the Group to focus its resources on product development and/
or marketing, and to operate the business in a cost-effective manner. The supply chain
managers are responsible for the entire production process of the Group’s self-owned and
licensed tabletop games strictly according to the specifications and requirements
provided by the Group. For selection of the supply chain managers, the management
assesses and takes into account various factors such as price, projected timeline, quality,
work portfolio, reputation and previous working experience.
The supply chain managers give input to issues such as commercial feasibility, product
costing, technical specifications, and project timelines. They are also responsible for
procuring the necessary raw materials and will, where necessary, sub-contract parts of
the production process to various manufacturers. Where there are unique requirements
of a specific component of a tabletop game, the supply chain managers will seek approval
from the management of the Group on the appropriate sub-contractor to be engaged.
The supply chain managers will also arrange for the packaging and delivery of final
products to the shipment point designated by the Group. The management and
production team of the Group make periodic site visits to the supply chain managers
to discuss production matters, ensure quality control and discuss operational matters
where required.
During the Reporting Period, the Group engaged four supply chain managers (Supplier
G, Supplier H, Supplier F and Supplier A as mentioned in the paragraph headed ‘‘Top
Suppliers’’ in this section), accounting for approximately 35.9%, 21.2%, nil and nil of its
total cost of sales for the year ended 31 December 2016, approximately 13.0%, 10.5%,
23.4% and nil of its total cost of sales for the year ended 31 December 2017, nil, nil, nil
and approximately 22.8% of its total cost of sales for the year ended 31 December 2018
and nil, nil, nil and approximately 46.5% of its total cost of sales for the six months
ended 30 June 2019, respectively. The Group has maintained a business relationship of
one to seven years with the four supply chain managers. To the best knowledge of the
Directors, there is no relationship (whether past or present) between the Group and its
supply chain managers other than normal business relationship.
– 40 –

As illustrated in the paragraph headed ‘‘Business of the Group — Top suppliers’’ in this
announcement, the top supply chain manager changed from ‘‘Supplier G’’ for the year
ended 31 December 2016 to ‘‘Supplier F’’ for the year ended 31 December 2017 and
‘‘Supplier A’’ for the year ended 31 December 2018 and the six months ended 30 June
2019. The Group’s projects undertaken by Supplier G were principally overseen and
managed by an account manager (‘‘Account Manager’’) who was the general manager of
Supplier G. Given the fact that the Account Manager started to serve Supplier F in 2017
in the capacity as an agent due to the scale down of business in the PRC by Supplier G,
the Group decided to gradually engage Supplier F to take up more projects in 2017 and
Supplier F became the top supplier of the Group in 2017 accordingly. In 2018, the
Account Manager joined Supplier A as the general manager and Supplier A is willing to
offer relatively more favourable prices to the Group in terms of lower unit costs for
certain bulk orders after taking into account the recent downward price trend of paper,
the reputation of the Group, the order size and the intention to develop long term
business relationship with the Group. Therefore, the Group assigned most of the
production to Supplier A and Supplier A became the top supplier of the Group for the
year ended 31 December 2018. The Group continued to engage Supplier A as supply
chain manager in 2019. For further discussion on the favourable prices offered to the
Group, please refer to the paragraph headed ‘‘Financial Information of the Group —
Cost of sales’’ in this announcement.
Supplier A is a Hong Kong supply chain manager incorporated in 2017 and is wholly
owned by a Hong Kong citizen who is also the sole director of Supplier A. Supplier A has
been focusing on production and logistic management services which assist its worldwide
clients to source, design and locate manufacturers to produce products according to
designated specifications and standards. Supplier A has less than 20 staff in total in its
Hong Kong and PRC offices. The Group is one of the largest customers of Supplier A
but Supplier A is not completely reliant on the Group. To the best knowledge of the
Directors, except that the beneficial owner of Supplier A is also the sole shareholder and
sole director of Supplier D and has recently become one of the directors of Supplier F,
the beneficial owner of Supplier A does not have any other past or present relationship,
including, but not limited to, employment, financing, or family relationship with the
Group, its directors, substantial shareholders, senior management, or any of their
respective associates.
The Group does not enter into any long term master supply or production agreement
with any of the supply chain managers, and engages them only on a project by project
basis. Similarly, the production cost per game is negotiated between the Group and the
supply chain managers on project basis. The supply chain managers usually request for
advance payment before production, which is not uncommon according to the Ipsos
Report. For the three years ended 31 December 2018 and the six months ended 30 June
2019, the percentage of total advance paid to supply chain managers to total amount of
purchase orders placed were nil, approximately 36.8%, 47.1% and 53.7%, respectively.
As at 31 December 2016, 31 December 2017, 31 December 2018 and 30 June 2019, thebalance of advance to suppliers, which mainly comprised advance to supply chain
– 41 –

managers and suppliers of third party games, amounted to US$638,673, approximatelyUS$1.2 million, approximately US$3.7 million and approximately US$3.5 million,respectively. The increase in the balance as at 31 December 2017 as compared to 31December 2016 was due to the advance paid for the production of games, includingadvance of US$456,925 paid to a supply chain manager for the production of MassiveDarkness and Arcadia Quest: Inferno and advance of US$442,478 paid to another supplychain manager for the production of Rising Sun and Zombicide: Green Horde. Thebalance of advance to suppliers further increased from approximately US$1.2 million asat 31 December 2017 to approximately US$3.7 million as at 31 December 2018 mainlydue to the advance paid for the production of games, including total advance ofapproximately US$2.5 million paid for the production of Kickstarter games launched orfirst shipped in 2018 including A Song of Ice & Fire: Tabletop Miniatures Game, BloodRage board game for Blood Rage Digital, Munchkin Dungeon, Project: ELITE andZombicide: Invader. The balance of advance to suppliers decreased to approximatelyUS$3.5 million as at 30 June 2019, which mainly represented approximately US$2.4million for the production of Bloodborne: The Board Game and US$874,576 for theproduction of Munchkin Dungeon and Project: ELITE. It is the usual practice of supplychain managers to request for advance for the production of games. Therefore, thebalance of advance to suppliers mainly fluctuated in accordance with the productionneeds of the Group, which in turn was principally affected by the shipment schedule ofKickstarter games, launch schedule of new games and restocking orders from wholesalersfor existing games. The increase in advance to suppliers as at each year/period end duringthe Reporting Period was mainly due to (i) the increased demand for the production ofthe Group’s games, especially those newly launched Kickstarter games; and (ii) change ofsupply chain managers. As discussed above, the Group has changed its major supplychain manager to Supplier A since 2018. Although Supplier A is willing to offer relativelymore favourable prices to the Group in terms of lower unit costs for certain bulk ordersafter taking into account the recent downward price trend of paper, the reputation of theGroup, the order size and the intention to develop long term business relationship withthe Group, Supplier A also requests for a higher portion of advance to reduce thecashflow pressure imposed by the production of the Group’s products.
The Account Manager is a Hong Kong citizen with over 10 years of experience in supplychain management for the production of tabletop games. Before he joined the tabletopgame supply chain management industry, the Account Manager was a product designer.The Group became acquainted with the Account Manager through Mr. Doust, one of thefounders of the Group and an executive Director, as the Account Manager is an oldfriend of his. In addition to typical supply chain management services provided by othersupply chain managers in the market, the Account Manager leverages on his expertise inproduct design and industry experience to provide value added services to the Groupsuch as advising on product packaging to save cost and increase users’ experience. TheAccount Manager is also experienced in fulfilling Kickstarter projects. The Group’sultimate users are satisfied with the products manufactured under the supervision andmanagement of the Account Manager over the years and therefore, the Group hasdeveloped over 8 years of business relationship with him.
– 42 –

Taking into account (i) Supplier A is willing to offer relatively more favourable prices tothe Group in terms of lower unit costs for certain bulk orders; (ii) the long termrelationship with the Account Manager who is familiar with the Group’s products andoperation, and most importantly, has been overseeing the Group’s production pipelineseffectively and efficiently over the years; and (iii) the switching costs and time involved inidentifying another person who can provide similar services with comparable level ofquality, the Directors are of the view that it is beneficial for the Group to continue towork with the Account Manager by changing key supply chain manager during the pasttwo years, even though Supplier A requested for a higher portion of advance.
To the best knowledge of the Directors, except for being an old friend of Mr. Doust, theAccount Manager does not have any other past or present relationship, including, butnot limited to employment, financing, or family relationship with the Group, itsDirectors, substantial shareholders, senior management, or any of their respectiveassociates. Besides, the Account Manager and the Group do not have any otherunderstanding or side arrangement or agreement in respect of their other businesses orotherwise.
As the production lead time usually takes six to nine months, the turnover for theutilization of advance to suppliers was not high. As at 31 October 2019, approximately100.0% and 47.3% of the advance to suppliers as at 31 December 2018 and 30 June 2019have been utilised, respectively.
Top suppliers
For the three years ended 31 December 2018 and the six months ended 30 June 2019, theGroup’s top five largest suppliers accounted for approximately 91.5%, 91.1%, 97.6%and 92.2% of the total purchases of the Group, respectively, with the largest supplieraccounting for approximately 43.0%, 32.2%, 45.1% and 55.2% of the total purchases ofthe Group, respectively. The top five largest suppliers of the Group were supply chainmanagers, miniatures producers and game developers who supplied third party games tothe Group.
The Group has a relatively high supplier concentration as it outsources the production ofself-owned and licensed games to supply chain managers. The Group maintained a totalof four supply chain managers during the Reporting Period, which together accountedfor approximately 68.4%, 64.5%, 45.1% and 55.2% of the total purchases of the Groupfor the three years ended 31 December 2018 and the six months ended 30 June 2019,respectively. The contribution to total purchases from each of the supplier chainmanagers fluctuate significantly during the Reporting Period. Please refer to theparagraph headed ‘‘Business of the Group — Production’’ for details. According to theIpsos Report, it is not uncommon for tabletop games publishers which outsource theproduction to have a relatively high supplier concentration.
As at the date of this announcement, none of the Directors, their associates, or anyShareholders (which to the best knowledge of the Directors owned more than 5% of theCompany’s issued share capital) had any interest in any of the top five largest suppliers ofthe Group.
– 43 –

The following tables set out details of the five largest suppliers of the Group during the
Reporting Period:
For the six months ended 30 June 2019
Rank Supplier Background and principal business Items supplied Location
Year(s) of
business
relationship
Credit
period
Percentage of
total purchases
1. Supplier A (Note 2) Supplier A is a Hong Kong supply chain
manager incorporated in 2017. It has been
focusing on production and logistic
management services which assist its
clients to source, design and locate
manufacturers to produce products
according to designated specifications and
standards.
Supply chain
management
Hong Kong 1 year 7 days 55.2%
2. Supplier B (Note 1) Supplier B is a Hong Kong game designer
and manufacturer incorporated in 2006. It
has been focusing on mold engineering,
molding and plastic manufacturing.
Production of
miniatures
Hong Kong 8 years 14 days 24.5%
3. Supplier K Supplier K is a Hong Kong board game
miniatures manufacturer incorporated in
2017. It has been focusing on board game
plastic components and action figures
manufacturing. It has a factory in
Dongguan, the PRC.
Production of
miniatures
Hong Kong 1 year 7 days 8.2%
4. Supplier E Supplier E is an Italian game designer and
manufacturer incorporated in 2014. It has
been focusing on development and
production of tabletop games.
Third-party board
games
Italy 3 years 30 days 2.3%
5. Supplier C Supplier C is an Italian game designer and
manufacturer incorporated in 2016. It has
been focusing on development and
production of tabletop games.
Third-party board
games
Italy 3 years 30 days 2.0%
For the year ended 31 December 2018
Rank Supplier Background and principal business Items supplied Location
Year(s) of
business
relationship
Credit
period
Percentage of
total purchases
1. Supplier A (Note 2) Supplier A is a Hong Kong supply chain
manager incorporated in 2017. It has been
focusing on production and logistic
management services which assist its
clients to source, design and locate
manufacturers to produce products
according to designated specifications and
standards.
Supply chain
management
Hong Kong 1 year 7 days 45.1%
2. Supplier B (Note 1) Supplier B is a Hong Kong game designer
and manufacturer incorporated in 2006. It
has been focusing on mold engineering,
molding and plastic manufacturing.
Production of
miniatures
Hong Kong 8 years 14 days 35.3%
– 44 –

Rank Supplier Background and principal business Items supplied Location
Year(s) of
business
relationship
Credit
period
Percentage of
total purchases
3. Supplier C Supplier C is an Italian game designer and
manufacturer incorporated in 2016. It has
been focusing on development and
production of tabletop games.
Third-party board
games
Italy 3 years 30 days 8.7%
4. Supplier D (Note 2) Supplier D is a Hong Kong game
manufacturer incorporated in 2015. It has
been focusing on production of tabletop
games.
Production of
miniatures
Hong Kong 1 year 15 days 6.7%
5. Supplier E Supplier E is an Italian game designer and
manufacturer incorporated in 2014. It has
been focusing on development and
production of tabletop games.
Third party games Italy 1 year 30 days 1.8%
For the year ended 31 December 2017
Rank Supplier Background and principal business Items supplied Location
Year(s) of
business
relationship
Credit
period
Percentage of
total purchases
1. Supplier F Supplier F is a Hong Kong supply chain
manager incorporated in 2015. It has been
focusing on production and logistic
management services, which assist its
clients to source, design and locate
manufacturers to produce products
according to designated specifications and
standards.
Supply chain
management
Hong Kong 2 years 80 days 32.2%
2. Supplier B (Note 1) Supplier B is a Hong Kong game designer
and manufacturer incorporated in 2006. It
has been focusing on mold engineering,
molding and plastic manufacturing.
Production of
miniatures
Hong Kong 8 years 14 days 24.5%
3. Supplier G Supplier G is a Hong Kong supply chain
manager incorporated in 2005. It has been
focusing on production and logistic
management services, which assist its
clients to source, design and locate
manufacturers to produce products
according to designated specifications and
standards. Supplier G was wholly-owned
by a company incorporated in Germany.
Supply chain
management
Hong Kong 7 years 60 days 17.8%
4. Supplier H Supplier H is a PRC supply chain manager
incorporated in 2014. It has been focusing
on production management services in
relation to board games, card games and
miniatures.
Supply chain
management
PRC 5 years 10 days 14.5%
5. Supplier C Supplier C is an Italian game designer and
manufacturer incorporated in 2016. It has
been focusing on development and
production of tabletop games.
Third-party board
games
Italy 3 years 30 days 2.1%
– 45 –

For the year ended 31 December 2016
Rank Supplier Background and principal business Items supplied Location
Year(s) of
business
relationship
Credit
period
Percentage of
total purchases
1. Supplier G Supplier G is a Hong Kong supply chain
manager incorporated in 2005. It has been
focusing on production and logistic
management services, which assist its
clients to source, design and locate
manufacturers to produce products
according to designated specifications and
standards. Supplier G was wholly-owned
by a company incorporated in Germany.
Supply chain
management
Hong Kong 7 years 60 days 43.0%
2. Supplier H Supplier H is a PRC supply chain manager
incorporated in 2014. It has been focusing
on production management services in
relation to board games, card games and
miniatures.
Supply chain
management
PRC 5 years 10 days 25.4%
3. Supplier B (Note 1) Supplier B is a Hong Kong game designer
and manufacturer incorporated in 2006. It
has been focusing on mold engineering,
molding and plastic manufacturing.
Production of
miniatures
Hong Kong 8 years 14 days 15.5%
4. Supplier I Supplier I is a French game designer and
manufacturer incorporated in 2001. It has
been focusing on development, production
and distribution of board games, video
games, animation and manga.
Third-party board
games
France 3 years 7 days 5.0%
5. Supplier J Supplier J is a French game designer and
manufacturer incorporated in 2010. It has
been focusing on development and
production of tabletop games in French
language.
Third-party board
games
France 4 years 7 days 2.6%
Notes:
1. Mr. David Preti, a senior management of the Group, held 3% of the issued share capital in Supplier B
before 2016. As at the date of this announcement, Mr. Preti was no longer a shareholder of Supplier
B.
2. Supplier A and Supplier D have common sole shareholder and director, who has also recently become
one of the directors of Supplier F since October 2018. Despite the above, each of Supplier A, Supplier
D and Supplier F has its own sales, finance and operation which are independent from each other.
The Group negotiated the business terms with and place orders to Supplier A and Supplier D
separately. In return, each of them takes orders individually and issues separate invoices to the
Group.
To the best knowledge of the Directors, except that the beneficial owner of Supplier A is
also the sole shareholder and sole director of Supplier D and has recently become one of
the directors of Supplier F since October 2018, none of the top five suppliers of the
Group during the Reporting Period have any relationships (whether past or present) with
each other.
– 46 –

Save for the more favourable prices in terms of lower unit costs for certain bulk orders
offered by Supplier A as discussed in the paragraph headed ‘‘Business of the Group —
Production’’ above, to the best of the knowledge, information and belief of the Directors,
the pricing terms offered by the top five largest suppliers of the Group was comparable to
other independent suppliers of the Group during the Reporting Period.
To manage the supplier concentration risk, the Group has a practice of maintaining a
good working relationship with the suppliers, especially supply chain managers, by,
among others, creating goodwill and honouring payments. Besides, the Group continues
to explore and develop business relationship with other suitable suppliers as part of its
contingency planning. As at the date of this announcement, the Group has maintained
direct contact with over 10 suppliers and manufacturers. By adopting the
abovementioned measures and taking into account that alternative suppliers are
readily available, the Directors are of the view that the supplier concentration risk of
the Group can be managed.
Intellectual properties
During the Reporting Period, the Group recognised various IPs which primarily
comprising Blood Rage, Council of Four, Massive Darkness, Rising Sun, The Grizzled, The
Others: 7 Sins, The World of SMOG and Zombicide series at the cost of US$620,280,
US$33,978, US$801,145, US$920,000, US$55,950, US$895,000, US$500,000 and
US$888,400, respectively.
Properties
During the year ended 31 December 2017, the Group acquired two properties within the
same building in Singapore with one as its global head office for business expansion and
the other one as a retail shop, show room and play test centre for image and brand
building, details of which were disclosed in the announcements of the Company dated 3
April 2017 and 6 October 2017.
Employees
The Group had 52 employees as at the date of this announcement, as compared to 47, 66
and 51 employees as at 31 December 2016, 31 December 2017 and 31 December 2018,
respectively.
During the year ended 31 December 2017, the Group has successfully hired luminaries
including Mr. Eric Lang (designer of the Group’s hit titles Arcadia Quest, Blood Rage and
The Others: 7 Sins) and Mr. Mike McVey (the artistic director behind many of the
Group’s fantastic miniatures), which has significantly strengthened the Group’s game
design capabilities.
In addition, Mr. Doust, one of the co-founders of the Group and the controllingshareholders of the Company, has moved to Singapore to oversee sales and marketing inChina and East Asia markets during the year ended 31 December 2017.
– 47 –

TABLETOP GAME INDUSTRY
For the year ended 31 December 2018, North America and Europe remained as the majormarkets of the Group, with North American and European sales made up approximately76.7% and 16.1% of the Group’s total revenue, respectively.
Tabletop game industry in the USA
The USA tabletop game industry continued to grow in 2018 and it is expected that thegrowth trend will continue. According to the Ipsos Report, the market size for thetabletop game industry in the USA increased by approximately 8.3% from approximatelyUS$2,513.0 million in 2017 to approximately US$2,721.1 million in 2018. It is expectedthat the market will maintain stable growth from 2019 to 2021 with annual growth ratesranging from approximately 7.5% to 7.6% and reach approximately US$3,401.5 millionin 2021. The following chart sets forth the historical and forecast market size of thetabletop game industry in the USA from 2012 to 2021.
0.0
500.0
1,000.0
1,500.0
2,000.0
2,500.0
3,000.0
3,500.0
0%
5%
10%
15%
20%
25%
30%
Market Size of the Tabletop Game Industry in the USA from 2012 to 2021
2012
CAGR ’2012-2018 9.5%
CAGR ’2019-2021 7.6%
2013 2014 2015 2016 2017 2018 2019F 2020F 2021F
1,577.6 1,715.01,915.0
2,085.02,324.1
2,513.02,721.1
2,938.93,163.7
3,401.5
US$
mill
ion
Ann
ual g
row
th r
ate
8.7%11.7%
8.9%11.5%
8.1% 8.3% 7.6% 7.5% 7.5%
Source: Ipsos Report
As illustrated above, it is forecasted that the CAGR of the market size of the tabletopgame industry in the USA of approximately 7.6% from 2019 to 2021 is lower than theCAGR of approximately 9.5% from 2012 to 2018, which is mainly due to the weakergrowth of sub-categories such as non-hobby games, the relatively mature market, and acontinued shift to augmented or virtual reality based games after the fast pacedevelopment of tabletop games in the past few years.
Despite that there is a continued shift to augmented or virtual reality based games, it isthe Group’s strategy to continue to focus its resources on its core strength of tabletopgame business, the game segment which the Group possesses the expertise, professionals,
– 48 –

reputation and track record. Comparing with tabletop games, augmented or virtualreality based games in general require a higher amount of initial investment in researchand development, and more importantly, a specialized team with professional knowledgein information technology and digital application. Besides, although there is an expectedslow-down in CAGR of the market size of the tabletop game industry in the USA, theabsolute market size of the industry is expected to maintain a stable annual growth ofapproximately 7.5% to 7.6% from 2019 to 2021. Comparing the Group’s revenue fromNorth America for the year ended 31 December 2018 to the market size of the tabletopgame industry in the USA in 2018, the market share of the Group was lower than 1%.Therefore, after taking into account the above, the Directors are of the view that there isstill plenty of room for the Group to grow and expand its market share in the tabletopgame industry and the continued shift to augmented or virtual reality based games willnot have any material adverse impact on the Group. Besides, the Group will not changeits business focus as it may not be beneficial to the Group to diversify its financial andhuman resources in new game categories (other than tabletop games, mobile games andcomputer games) too aggressively in the foreseeable future.
Tabletop game industry in the EU
The EU tabletop game industry experienced a slightly growth in 2018 and it is expectedthat growth pace will gradually pick up in the next few years. According to the IpsosReport, the market size for the tabletop game industry in the EU increased byapproximately 4.1% from approximately US$2,823.5 million in 2017 to approximatelyUS$2,939.6 million in 2018. It is expected that the market will grow with annual growthrates ranging from approximately 3.5% to 4.4% in 2019 to 2021 and reach approximatelyUS$3,305.5 million in 2021. The following chart sets forth the historical and forecastmarket size of the tabletop game industry in the EU from 2012 to 2021.
0.0
500.0
1,000.0
1,500.0
2,000.0
2,500.0
3,000.0
3,500.0
Market Size of the tabletop game industry in the EU from 2012 to 2021
2012
CAGR ’2012-2018 1.1%
CAGR ’2019-2021 4.0%
2013 2014 2015 2016 2017 2018 2019F 2020F 2021F
2,748.3 2,841.1 2,951.22,629.9 2,710.5 2,823.5 2,939.6 3,058.8 3,194.3 3,305.5
US$
mill
ion
Ann
ual g
row
th r
ate
-15%
-10%
-5%
0%
5%
10%
15%
3.4% 4.4% 3.5%4.1%4.1%4.2%3.1%
-10.9%
3.9%
Source: Ipsos Report
– 49 –

As illustrated above, it is forecasted that the CAGR of the market size of the tabletop
game industry in the EU of approximately 4.0% from 2019 to 2021 is much higher than
the CAGR of approximately 1.1% from 2012 to 2018, which is mainly due to the gradual
recovery of economy as well as the expected contribution from online retail channel
which enhances the diversity of distribution model of the tabletop games and encourages
more end users to make purchases.
Tabletop game industry in the PRC
On the other hand, it is the Group’s strategy to expand into the largely untapped markets
of Asia, particularly the PRC. In order to achieve this, the Group has set up a subsidiary
in the PRC to increase its presence in this target market. The subsidiary has already
commenced operation in October 2018. Besides, Mr. Doust, one of the co-founders of the
Group and the controlling shareholders of the Company, has moved to the Company’s
headquarters in Singapore to oversee sales and marketing in China and East Asia
markets during the year ended 31 December 2017. The following chart sets forth the
historical and forecast market size of the tabletop game industry in the PRC from 2012 to
2021.
0.0
20.0
40.0
60.0
80.0
100.0
120.0
140.0
160.0
Market Size of the Tabletop Game Industry in the PRC from 2012 to 2021
2012
CAGR ’2012-2018 9.9%
CAGR ’2019-2021 13.6%
2013 2014 2015 2016 2017 2018 2019F 2020F 2021F
61.2 66.4 71.978.6
86.996.0
107.8121.7
138.2
157.2
8% 8%9%
11% 10%12%
13% 14% 14%
US$
mill
ion
Ann
ual g
row
th r
ate
0.0%
5.0%
10.0%
15.0%
20.5%
25.0%
30.0%
Source: Ipsos Report
Despite the relatively small market size, the PRC tabletop game industry experienced
continuous growth from 2012 to 2018 and it is expected that the growth trend will
continue. According to the Ipsos Report, the market size for the tabletop game industry
in the PRC increased by approximately 12.3% from approximately US$96.0 million in
2017 to approximately US$107.8 million in 2018. It is expected that the market will enjoy
– 50 –

accelerating growth from 2019 to 2021 with annual growth rate ranging from
approximately 13% to 14% in 2019 to 2021. The market size of the PRC tabletop
game industry is expected to reach approximately US$157.2 million in 2021.
In terms of CAGR, it is forecasted that the tabletop game industry in the PRC will enjoy
growth with CAGR of approximately 13.6% from 2019 to 2021 as compared with CAGR
of approximately 9.9% from 2012 to 2018. According to the Ipsos Report, the growth
will be mainly driven by (i) the expected shift of gaming behaviour from digital game to
physical game; (ii) the increasing significance of tabletop games in consumers’ social and
entertainment life in the PRC as the level of social connection and interaction with
tabletop games expected to improve with the help of technology advancements such as
artificial reality and 3-dimensional printing; and (iii) the increasing popularity of
tabletop games benefited by the booming pan-entertainment industry in the PRC.
REGULATORY DEVELOPMENT
This section summarises the development and update (if any) of the material laws and
regulations in the United States, Singapore and the EU as set out in the section headed
‘‘Regulatory Overview’’ in the Prospectus that are relevant to the Group’s operations in
these jurisdictions since Listing. Please read in conjunction with the section headed
‘‘Regulatory Overview’’ in the Prospectus. This section also summarises the material laws
and regulations in Canada, the PRC and Italy that may be relevant to the Group since
Listing.
United States
Taxation
On 22 December 2017, the USA President signed into law Public Law 115–97, informally
known as the Tax Cuts and Jobs Act (the ‘‘TCJA’’). The TCJA contains significant
changes to USA federal corporate income taxation, including reduction of the corporate
tax rate from 35% to 21%, elimination of the corporate alternative minimum tax,
limitation of the tax deduction for interest expense to 30% of taxable income (with
certain adjustments), limitation of the deduction for net operating losses to 80% of
current year taxable income for losses arising in taxable years beginning after 31
December 2017 and elimination of net operating loss carrybacks, deemed repatriation,
resulting in one-time taxation of previously accumulated offshore earnings of foreign
subsidiaries at reduced rates, elimination of USA tax on foreign earnings of foreign
subsidiaries (subject to certain important exceptions), and immediate deductions for
certain new investments instead of deductions for depreciation expense over time. As a
result of the TCJA, an adjustment to USA deferred tax liability resulted in a reduction in
income tax expense for the period ending 31 December 2017. The Group believes its
primary benefit from the TCJA will arise from the TCJA’s reduction in USA federal
corporate income tax rates.
– 51 –

On 21 June 2018, the United States Supreme Court held in South Dakota v. Wayfair, Inc.,
that a state is not forbidden by the Commerce Clause of the United States Constitution
to require out-of-state vendors with no physical presence in the state to collect and remit
sales tax on sales of taxable property and services made to in-state customers. Currently,
the Group is only physically present in the USA in the State of Georgia. Since the
Wayfair case removes the requirement to have a physical presence in a state, the Group
potentially could be required to collect and remit sales tax to be charged to its customers
in states in the USA other than Georgia.
It should be noted that although the Wayfair decision only addresses sales tax and does
not address other taxes in the USA, such as income tax or profits tax, states are
beginning to apply Wayfair principles beyond sales tax. Sales tax is a tax assessed by
states and local jurisdictions and is not affected by federal income tax law nor
international tax treaties. Sales tax is charged to the end user of products and, in some
jurisdictions, services (i.e., the ultimate customer) and is at a rate applied to the sales
price of the good or service sold. When the sales tax is collected by a vendor, the vendor
should remit the same to the relevant state or local tax authority. It is neither income nor
expense of the Group and does not affect the Group’s income tax rate and taxable
income.
Sales tax is only collected for sales to retail customers and not collected for sales to
wholesale customers. For the year ended 31 December 2017, the Group’s retail sales in
the USA amounted to US$367,846 and only represented approximately 7% of total sales
in the USA. For the year ended 31 December 2018, retail sales in the USA amounted to
US$480,150 and only represented approximately 7% of total sales in the USA. For the
six months ended 30 June 2019, the Group’s retail sales in the USA amounted to
US$45,501 and only represented approximately 0.4% of total sales in the USA. Since
sales tax is charged differently for each state and local jurisdiction, and is often based
upon a shipping address, out-of-state vendors potentially face additional compliance and
administrative costs as a result of the Wayfair decision.
As mentioned above, sales tax is imposed and administered at the state and local level
and not by federal tax authorities. At the time the Wayfair case was decided, most states
have yet implemented any rules and regulations to handle a new approach towards sales
tax collection. Nevertheless, most states determined that it would be very unfair to
taxpayers to apply a new approach retrospectively after the long-standing physical
presence rules had been in place. A number of states have passed legislation or adopted
regulations that established rules beginning from 1 October 2018 through 1 January
2019. Out of the states that have passed legislation or adopted regulations, most states
apply a revenue or transaction threshold before requiring an out-of-state vendor to
register and to start collecting sales tax. The thresholds are often US$100,000 or more of
in-state sales or 200 or more in-state transactions typically, but not always, in the
previous or current calendar year. The sales threshold may be calculated based on sales
to both retail and wholesale customers, but even if such an expanded sales threshold is
met, it triggers a sales tax registration requirement; sales tax is only collected on retail
– 52 –

sales. Thus, it is expected that the amount and number of transactions possibly subject to
sales tax collection in the USA will be low. Accordingly, the additional compliance and
administrative costs are expected to be immaterial.
In summary, the Wayfair decision does not directly relate to income tax but to sales tax
only which is to be charged to ultimate retail customers of the Group, and will not impact
the net taxable income nor tax rate of the Group. Based on the state guideline as at the
Latest Practicable Date, the Group is only responsible for collecting the sales tax from its
ultimate retail customers and remitting the same to the relevant state or local tax
authority. Although additional compliance and administrative costs are expected, the
amount is considered as immaterial after taking into account the historical sales
transactions of the Group in the USA.
Singapore
Employment Matters
After Listing and for the Group’s administrative purposes and business development in
Singapore, CMON Pte. Ltd., an indirect wholly-owned subsidiary of the Company
incorporated in Singapore, started recruiting employees. Below is a brief summary of the
relevant acts in Singapore relevant to the Group’s operations as at the date of this
announcement.
Employment Act
The Employment Act (Chapter 91, the laws of Singapore) (the ‘‘EA’’) sets out the basic
terms and conditions of employment (such as entitlements as to paid public holidays and
sick leave for employees covered under the EA), and the respective rights and
responsibilities of employers and employees covered under the EA. The EA is
administered by the Ministry of Manpower of Singapore (the ‘‘MOM’’). With effect
from 1 April 2019, the EA covers every employee regardless of nationality who is under a
contract of service with an employer, including persons employed in a managerial and
executive position, except for public servants, domestic workers and seafarers.
In particular, Part IV of the EA, which applies only to (a) workmen who are in receipt of
basic monthly salaries of not more than S$4,500; and (b) employees (other than workmen
or persons employed in managerial or executive positions) who are in receipt of basic
monthly salaries of not more than S$2,600 (each a ‘‘Part IV Employee’’), sets out
requirements as to rest days, hours of work and other conditions of service. Section 38(1)
of the EA provides that, except in specified circumstances, a Part IV Employee shall not
be required under his contract of service to work more than 6 consecutive hours without
a period of leisure, and more than 8 hours in 1 day or more than 44 hours in 1 week.
Section 38(8) of the EA provides that a Part IV Employee shall not work for more than
12 hours in any 1 day except in specified circumstances, such as where the work is
– 53 –

essential to the life of the community, defence or security, or in the case of urgent work to
be done to machinery or plant. In addition, Section 38(5) of the EA provides that a Part
IV Employee shall not be permitted to work overtime for more than 72 hours a month.
Employers must seek the prior approval of the Commissioner for Labour for an
exemption if they require, inter alia, a Part IV Employee or class of Part IV Employees to
work for more than 12 hours a day or more than 72 hours of overtime in a month. The
Commissioner for Labour may, after considering the operational needs of the employer
and the health and safety of the Part IV Employee or class of Part IV Employees, exempt
such employees from the overtime limits subject to such conditions as the Commissioner
for Labour thinks fit. Where such exemptions have been granted, the employer shall
display the order or a copy thereof conspicuously in the place where such employee or
class of employees are employed.
Following the amendments to the EA in effect from 1 April 2016, all employers must
issue key employment terms (the ‘‘KETs’’) in writing to employees covered under the EA.
Such employees include employees who:
(a) enter into a contract of service with the company on or after 1 April 2016; and
(b) are employed for 14 days or more in relation to the length of contract (and not in
relation to the number of days of work).
The KETs include, inter alia, full name of employer and employee, job title, duties and
responsibilities, date of start of employment, duration of employment, basic salary, fixed
allowances, fixed deductions, overtime rate of pay, leave entitlements, medical benefits,
probation period and notice period.
Employment of Foreign Manpower Act
The employment of foreign employees in Singapore is governed by the Employment of
Foreign Manpower Act (Chapter 91A, the laws of Singapore) (the ‘‘EFMA’’). The EFMA
is also administered by the MOM.
Under Section 5(1) of the EFMA, no person shall employ a foreign employee in
Singapore unless he has obtained in respect of the foreign employee a valid work pass
from the MOM in accordance with the regulations prescribed pursuant to the EFMA.
Work passes include, amongst others, Employment Pass, S Pass and Work Permits. The
Employment Pass is for foreign professionals who (a) have a job offer in Singapore; (b)
work in a managerial, executive or specialised job; (c) earn a fixed monthly salary of at
least S$3,600; and (d) have acceptable qualifications. The S Pass is for mid-level skilled
foreign employees who earn a fixed monthly salary of at least S$2,300 and meet the
assessment criteria. The Work Permit is for foreign workers from approved source
countries working in the construction, manufacturing, marine shipyard, process or
services sector, and there is no requirement for minimum qualifying salary. As at the
Latest Practicable Date, the Group had 2 S Pass and 2 Work Permit holders.
– 54 –

The Directors confirm that the Group has complied with the MOM’s requirements in
relation to its employment of such foreign workers in all material respects.
In addition to the EFMA, an employer of foreign workers is also required to comply
with, inter alia, the provisions in the EA, the Immigration Act (Chapter 133, the laws of
Singapore), and the regulations issued pursuant to the aforesaid Acts.
Work Injury Compensation Act
The Work Injury Compensation Act (Chapter 354, the laws of Singapore) (the ‘‘WICA’’)
applies to all employees in all industries engaged under a contract of service (save for
certain limited exceptions) in respect of injury suffered by them in the course of their
employment and sets out, amongst others, the amount of compensation they are entitled
to and the method(s) of calculating such compensation. The relevant regulatory body is
the MOM.
The WICA provides that the employer shall be liable to pay compensation in accordance
with the provisions of the WICA if personal injury by accident arising out of and in the
course of the employment is caused to an employee.
Employers are required to maintain work injury compensation insurance for all
employees doing manual work regardless of salary level and for all non-manual
employees (‘‘NMEs’’) earning S$1,600 or less a month and who are engaged under
contracts of service (unless waived by the Minister by notification in the Gazette). With
effect from 1 April, 2020 and 1 April, 2021, the salary threshold for all NMEs will be
raised to S$2,100 and S$2,600, respectively.
The Directors confirm that the Group has complied with the MOM’s requirements in
relation to work injury compensation in all material respects.
The EU
Anti-dumping/Anti-subsidy
The section headed ‘‘Regulatory Overview’’ in the Prospectus contains, under the heading
‘‘The EU’’, a general summary of certain anti-dumping and anti-subsidy rules. Although
the specific EU legislation referred to in that summary has been rewritten, amended and
consolidated, in substance, the outline of the anti-dumping and anti-subsidy regime
contained in the Prospectus remains materially accurate.
Brexit
On 23 June 2016, the UK electorate, by way of referendum, voted to leave the EU. Until
the UK leaves the EU, EU law will continue to apply to the UK in the normal way. On
leaving the EU, it is anticipated that most relevant EU law as it applies at the date of the
UK’s exit from the EU will be adopted as UK national law. Thereafter, the UK would in
– 55 –

principle be free to amend or repeal such laws. As such, the full legal, tax and regulatory
consequences of the UK leaving the EU, including as regards the incidence of import
duties and taxes, remain uncertain.
Canada
During the year ended 31 December 2017, CMON Games Inc., an indirect wholly-owned
subsidiary of the Company, has been incorporated in Quebec, Canada, with an aim to
administer the Group’s sales and marketing activities. As at the date of this
announcement, CMON Games Inc. has various sales and marketing staff. Since its
incorporation, CMON Games Inc. has not generated any revenue.
Taxation and employment matters
Payroll taxes and various source deductions must be remitted by employers (resident or
non-resident) on behalf of their employees (resident or non-resident) to the tax
authorities on the employment income performed in Quebec, Canada. Employers are
also required to make contributions in respect of certain social programs for the benefit
of their employees.
In addition to contributions to the Canadian Employment Insurance program, employers
established in Quebec are required to make contributions to the following plan, program
or funds:
Relevant plan/program/funds Rates and limits for 2018 Quebec payroll taxes
Canadian Employment Insurance 1.3% of insurable earnings (maximum insurable earnings
of C$51,700)
Employee maximum contribution: C$672.10
1.3% of insurable earnings (maximum insurable earnings
of C$51,700)
Employer maximum contribution: C$940.94
Quebec Pension Plan Employee contribution: 5.4% of pensionable earnings less
basic exemption of C$3,500 (maximum pensionable
earnings is C$52,400 per employee)
Employee maximum contribution: C$2,829.60
Employer contribution: equal to employee contributions.
Employer maximum contribution: C$2,829.60
Quebec Parental Insurance Plan Employee contribution: 0.548% of insurable earnings
(maximum insurable earnings is C$74,000 per employee).
Employee maximum contribution: C$405.52
Employer contribution: 0.767% of insurable earnings.
Employer maximum contribution: C$567.58
– 56 –

Relevant plan/program/funds Rates and limits for 2018 Quebec payroll taxes
Commission des normes du travail
(labour standards)
0.07% of payroll subject to employer contribution
(maximum insurable remuneration of C$74,000 per
employee).
Health Services Fund Employer minimum contribution varies between 2.3% and
4.26% of eligible payroll according on the classification
of the employer.
Commission de la sante et de la
securite au travail
The employer contribution rate varies according to the
type of activity undertaken by the employee.
Workforce skills development and
recognition fund (for any
employer’s total payroll exceeds
C$2 million)
If the employer’s total payroll exceeds C$2 million, 1% of
the total payroll is required to be spent on eligible
training expenditures.
PRC
During the year ended 31 December 2018, CMON Foshan was established with an aim to
increase the Group’s presence in the PRC market. CMON Foshan has commenced
operation in October 2018 with principal business scope of, among others, research and
sale of board game products, and carrying on cultural promotion services in relation to
board game products and import and export businesses. As a trading company carrying
out import and export of board game products, except for the necessary registrations or
filings with Customs, competent local branch of State Administration of Foreign
Exchange or other relevant bureaus in the PRC, no special consent, license or approval is
required to be obtained by CMON Foshan to conduct the activities within its scope of
business.
Enterprise Income Tax
According to the Enterprise Income Tax Law enacted by the National People’s Congress
of the PRC on 16 March 2007 and amended on 24 February 2017 and relevant
implementation rules enacted by the State Council of the PRC on 28 November 2007,
both in effect from 1 January 2008, a uniform income tax rate of 25% is applied to
foreign-invested enterprises like WFOE.
Value Added Tax (‘‘VAT’’)
According to the Interim Regulation on the Value Added Tax of the PRC (‘‘中華人民共
和國增值稅暫行條例’’) enacted by the State Council of the PRC on 13 December 1993
(and its amendments on 5 November 2008, 6 February 2016 and 19 November 2017) and
its implementation rules enacted on 18 December 2008 and amended on 28 October 2011,
– 57 –

the Notice of the Ministry of Finance, the State Administration of Taxation on Adjusting
Value-added Tax Rates (‘‘財政部、稅務總局關於調整增值稅稅率的通知’’) promulgated
on 4 April 2018 and effective on 1 May 2018, and the Announcement on Relevant
Policies of Deepening the Value-Added Tax Reform (‘‘關於深化增值稅改革有關政策的公
告’’) promulgated by Ministry of Finance, State Taxation Administration and General
Administration of Customs on 30 March 2019 and effective on 1 April 2019, any entity or
individual engaged in the sales of goods, the provision of specified services or the
importation of goods in the PRC is generally required to pay VAT on the added value
derived during the process of manufacturing, sale or service provided.
There are two types of VAT payers, namely, general VAT payers and small-scale VAT
payers. For general VAT payers, the applicable VAT rates are 0%, 2%, 5%, 6%, 9% and
13%, subject to the nature of taxable transaction. For small-scale VAT payers, the
applicable VAT rates are 0%, 2%, 3% and 5%, subject to the nature of the taxable
transaction.
Employment matters
As at the date of this announcement, there are six employees hired by CMON Foshan.
Under PRC law, an employer is required to enter into a written agreement with its
employee within 30 days from the date that the employee starts working for the
employer. Further, the employer should make social benefits contribution for its eligible
employees, which generally consists of endowment insurance, medical insurance,
unemployment insurance, employment injury insurance, maternity insurance and
housing provident fund based on their actual monthly salaries.
Italy
During the year ended 31 December 2017, CMON Pte. Ltd. has set up a representative
office in Italy, which only carries out marketing and promotional activities. According to
the Italian law (art. 162 of Testo Unico delle Imposte sui Redditi, D.P.R. 917/1986 as
amended according to the Organisation for Economic Co-operation and Development
Model Tax Convention), an Italian representative office could be set up exclusively for
promotional and research reasons on the Italian market by those foreign parent
companies willing to develop their activities in Italy. As an Italian representative office is
not performing any activity that may lead to a profit, all the costs of the representative
office are fully deductible for the foreign parent company in the place of incorporation of
the foreign parent company.
COMPLIANCE WITH LAWS AND REGULATIONS
To the best of the Directors’ knowledge, information and belief having made all
reasonable enquiry, save and except for the Company’s delay in making the
announcement in relation to the acquisition of the property in Singapore which
constituted a discloseable transaction of the Company under Chapter 19 of GEM Listing
Rules (details of which have been set out in the announcement of the Company dated 3
– 58 –

April 2017), since Listing and up to the Latest Practicable Date, the Group has complied
with the GEM Listing Rules as well as all material laws and regulations applicable to its
business operations in all material respects.
In order to prevent the recurrence of similar incidents in the future (i.e. delay in making
announcement as required under the GEM Listing Rules or Main Board Listing Rules)
and to strengthen the internal control of the Group, the Company has adopted a series of
remedial measures, for instance, (i) the Company’s Hong Kong legal adviser has
provided two trainings to all the Directors and senior management of the Company to
strengthen their knowledge on the GEM Listing Rules and the Main Board Listing Rules;
(ii) further trainings will be provided to the Directors on a regular basis so as to keep
them abreast of the latest change in the relevant rules and regulations; (iii) any
transaction not in the ordinary course of business of the Group should be reviewed by
and discussed among all executive Directors, the financial controller and the joint
company secretaries of the Company as well as consulting the legal adviser of the
Company before entering into any formal agreements; and (iv) the Company will
continue to engage Stephenson Harwood as its Hong Kong legal adviser to advise on
ongoing compliance requirements and issues arising under the GEM Listing Rules (or the
Main Board Listing Rules after the Transfer of Listing). By doing so, the Board believes
that the Company will be able to identify and ascertain any announcement and other
compliance requirements under the GEM Listing Rules (or the Main Board Listing Rules
after the Transfer of Listing) and be able to comply with any announcement and other
compliance requirements in a timely manner.
FINANCIAL INFORMATION OF THE GROUP
The following sets out the management discussion and analysis on the audited
consolidated financial information of the Group for the three years ended 31
December 2018 and the unaudited consolidated financial information of the Group for
the six months ended 30 June 2019. Investors are reminded to read the following in
conjunction with the consolidated financial information included in the annual reports of
the Company for the years ended 31 December 2016, 2017 and 2018 and the interim
report of the Company for the six months ended 30 June 2019, copies of which are made
available for viewing on the respective websites of the Company at
http://cmon.com and of the Stock Exchange at http://www.hkexnews.hk.
– 59 –

Summary of results of operations
The following table sets forth the consolidated statements of comprehensive income of
the Group for the three years ended 31 December 2018 and the six months ended 30 June
2018 and 2019.
Year ended 31 December
Six months ended
30 June
2016 2017 2018 2018 2019
US$ US$ US$ US$ US$
(Unaudited) (Unaudited)
Revenue 20,964,135 29,816,740 28,207,411 9,550,926 12,820,010
Cost of sales (10,259,875) (15,432,416) (13,405,569) (4,966,935) (6,948,961)
Gross profit 10,704,260 14,384,324 14,801,842 4,583,991 5,871,049
Other income 219,602 111,502 80,232 316,899 236,533
Other (losses)/gains — (73,530) 4,562 17,504 (297,843)
Selling and distribution expenses (2,317,478) (4,618,091) (5,747,190) (1,592,133) (2,216,477)
General and administrative expenses
— Others (3,676,329) (5,420,655) (5,633,085) (2,825,948) (3,351,542)
— Professional service fees in respect of
Listing preparation (3,052,277) — — — —
— Professional service fees in respect of the
Transfer of Listing — — (949,756) (449,174) (1,053,546)
Operating profit/(loss) 1,877,778 4,383,550 2,556,605 51,139 (811,826)
Finance costs — (35,621) (229,650) (42,038) (270,225)
Profit/(loss) before income tax 1,877,778 4,347,929 2,326,955 9,101 (1,082,051)
Income tax expense (860,158) (851,310) (258,685) (91,655) (65,562)
Profit/(loss) for the year/period attributable to
equity holders of the Company 1,017,620 3,496,619 2,068,270 (82,554) (1,147,613)
Other comprehensive (loss)/profit
Items that may be reclassified to profit or loss
Exchange difference on translation on
foreign operations — (994) (21,325) 1,671 —
Other comprehensive (loss)/profit, net of tax — (994) (21,325) 1,671 —
Profit/(loss) and total comprehensive income/
(loss) for the year/period attributable to
equity holders of the Company 1,017,620 3,495,625 2,046,945 (80,883) (1,147,613)
Note: The Company has adopted the transitional arrangement as permitted by IFRS 16 and no
restatement of prior year financial is required.
– 60 –

Revenue
The Group’s revenue increased by approximately 41.9% from approximately US$21.0
million for the year ended 31 December 2016 to approximately US$29.8 million for the
year ended 31 December 2017, mainly due to the increase in Kickstarter sales. For the
year ended 31 December 2018, the Group’s revenue was approximately US$28.2 million,
representing a decrease of approximately 5.4% from approximately US$29.8 million for
the year ended 31 December 2017, mainly due to the decrease in Kickstarter sales. The
Group’s revenue increased by approximately 33.3% from approximately US$9.6 million
for the six months ended 30 June 2018 to approximately US$12.8 million for the six
months ended 30 June 2019, mainly due to the increase in wholesalers’ sales.
Revenue by sales channels
The following table sets out a breakdown of the Group’s revenue by sales channels for
the three years ended 31 December 2018 and the six months ended 30 June 2018 and
2019 :
Year ended 31 December Six months ended 30 June
2016 2017 2018 2018 2019
US$ % US$ % US$ % US$ % US$ %(Unaudited) (Unaudited)
DirectKickstarter 11,468,346 54.7 20,597,558 69.1 15,237,000 54.0 3,156,427 33.0 1,938,301 15.1Online store and game
conventions 848,312 4.1 870,213 2.9 1,235,755 4.4 455,250 4.8 57,173 0.5Mobile games 23,501 0.1 9,098 — 4,007 — 2,834 — 727 —
Wholesalers 8,623,976 41.1 8,339,871 28.0 11,730,649 41.6 5,936,415 62.2 10,823,809 84.4
Total 20,964,135 100.0 29,816,740 100.0 28,207,411 100.0 9,550,926 100.0 12,820,010 100.0
Revenue via Kickstarter increased from approximately US$11.5 million for the year
ended 31 December 2016 to approximately US$20.6 million for the year ended 31
December 2017, mainly due to the shipment of Kickstarter projects including Massive
Darkness, Rising Sun, The World of SMOG: Rise of Moloch and Zombicide: Green Horde
with total fund raising amount of approximately US$14.0 million in 2017. Revenue via
Kickstarter for the year ended 31 December 2018 was mainly contributed by the
shipment of A Song of Ice & Fire: Tabletop Miniatures Game, Arcadia Quest: Riders,
Cthulhu: Death May Die, HATE, Starcadia Quest and Zombicide: Invader with total fund
raising amount of approximately US$10.2 million. Therefore, revenue via Kickstarter
decreased from approximately US$20.6 million for the year ended 31 December 2017 to
approximately US$15.2 million for the year ended 31 December 2018. Revenue via
Kickstarter for the six months ended 30 June 2019 was mainly contributed by the
shipment of the outstanding orders of Cthulhu: Death May Die, HATE, Starcadia Quest
and Zombicide: Invader during the period.
– 61 –

Revenue from wholesalers’ sales remained relatively stable at approximately US$8.6
million for the year ended 31 December 2016 and approximately US$8.3 million for the
year ended 31 December 2017. The relatively stable revenue from wholesalers’ sales for
the year ended 31 December 2017 was mainly due to the fact that most of the new
Kickstarter games, namely Rising Sun, The World of SMOG: Rise of Moloch and
Zombicide: Green Horde, were shipped near the year end with less significant
contribution from wholesalers’ sales. Revenue from wholesalers’ sales increased from
approximately US$8.3 million for the year ended 31 December 2017 to approximately
US$11.7 million for the year ended 31 December 2018, mainly due to (i) the recognition
of wholesalers’ sales of those new Kickstarter games shipped in late 2017 which
contributed an aggregate of wholesalers’ sales of approximately US$2.9 million; (ii) the
recognition of wholesalers’ sales of approximately US$1.6 million of A Song of Ice &
Fire: Tabletop Miniatures Game, a Kickstarter game which was launched in 2017 and
shipped in 2018; (iii) the increase in wholesalers’ sales of Zombicide from US$510,290 for
the year ended 31 December 2017 to approximately US$1.5 million for the year ended 31
December 2018; and (iv) the recognition of wholesalers’ sales of the new games launched
in 2018. Revenue from wholesalers’ sales increased from approximately US$5.9 million
for the six months ended 30 June 2018 to approximately US$10.8 million for the six
months ended 30 June 2019, mainly due to the recognition of sales of the increased orders
from wholesalers for 75 Gnom’ Street, A Song of Ice & Fire: Tabletop Miniatures Game,
Arcadia Quest: Inferno, Council of Four, Cthulhu: Death May Die, Ethnos, Gang Rush:
Breakout, Gekido: Bot Battles, Gizmos, Krosmaster Quest, Monstrous, Narcos, Newton,
River Wars, Rum & Bones: Second Tide, The Godfather: Corleone’s Empire, The Grizzled:
Armistice Edition, The Others: 7 Sins, Victorian Masterminds, Wacky Races, Wrath of
Kings and XenoShyft: Dreadmire. Wholesalers’ sales from each of the above games were
above US$100,000, which together contributed approximately US$5.1 million wholesale
sales for the six months ended 30 June 2019. Besides, the Group recorded wholesale sales
from Zombicide series of approximately US$2.7 million for the six months ended 30 June
2019. During the six months ended 30 June 2019, out of the five largest customers, three
of them were new customers with two years of business relationship with the Group or
less. The three new customers which together accounted for approximately 80.5% of the
increase in wholesalers’ sales during the period, as such customers decided to build up
their portfolio of the Group’s games during the period. Please refer to the paragraph
headed ‘‘Business — Top customers’’ in this announcement for details. Revenue from
such three new customers was approximately US$3.9 million, representing approximately
30.7% of the Group’s total revenue for the six months ended 30 June 2019.
Revenue from online store and game conventions remained relatively stable at
US$848,312 and US$870,213 for the two years ended 31 December 2017, respectively.
Revenue from online store and game conventions increased from US$870,213 for the year
ended 31 December 2017 to approximately US$1.2 million for the year ended 31
December 2018, mainly due to (i) the recognition of sales from those new Kickstarter
games shipped since late 2017, namely A Song of Ice & Fire: Tabletop Miniatures Game,
Cthulhu: Death May Die, Rising Sun, The World of SMOG: Rise of Moloch, Zombicide:
Green Horde and Zombicide: Invader, with aggregate revenue of US$274,446; and (ii) the
– 62 –

increase in sales of Zombicide from US$1,490 for the year ended 31 December 2017 to
US$182,545 for the year ended 31 December 2018. Revenue from online store and game
conventions decreased from US$455,250 for the six months ended 30 June 2018 to
US$57,173 for the six months ended 30 June 2019. As the Group reduced its resources in
attending game conventions during the six months ended 30 June 2019, there was a
significant reduction in sales from game conventions during the period. Sales from online
store and game conventions for the six months ended 30 June 2019 was mainly
contributed by the sales of US$30,058 of A Song of Ice & Fire: Tabletop Miniatures Game.
Sales from mobile games for the three years ended 31 December 2018 and the six months
ended 30 June 2019 represented sales of the mobile game XenoShyft (mobile), which was
launched in June 2015.
Revenue by categories
The following table sets out the breakdown of the Group’s revenue by categories for the
three years ended 31 December 2018 and the six months ended 30 June 2018 and 2019 :
Year ended 31 December Six months ended 30 June
2016 2017 2018 2018 2019
US$ % US$ % US$ % US$ % US$ %(Unaudited) (Unaudited)
Board games 20,485,617 97.7 29,301,745 98.3 23,261,711 82.5 6,270,218 65.7 10,546,421 82.3Miniatures war games 188,991 0.9 365,440 1.2 4,583,409 16.2 3,238,754 33.9 1,344,172 10.5Mobile games 23,501 0.1 9,098 — 4,007 — 2,834 — 727 —
Sub-total 20,698,109 98.7 29,676,283 99.5 27,849,127 98.7 9,511,806 99.6 11,891,320 92.8Other products 266,026 1.3 140,457 0.5 358,284 1.3 39,120 0.4 928,690 7.2
Total 20,964,135 100.0 29,816,740 100.0 28,207,411 100.0 9,550,926 100.0 12,820,010 100.0
The Group’s revenue was mainly derived from board games, which accounted for
approximately 97.7%, 98.3%, 82.5% and 82.3% of the total revenue for the three years
ended 31 December 2016, 2017 and 2018 and the six months ended 30 June 2019,
respectively.
Revenue from board games increased from approximately US$20.5 million for the year
ended 31 December 2016 to approximately US$29.3 million for the year ended 31
December 2017 mainly because of the recognition of sales from board games launched
since the second half of 2016, including Massive Darkness, Rising Sun, The World of
SMOG: Rise of Moloch and Zombicide: Green Horde. Revenue from board games
decreased from approximately US$29.3 million for the year ended 31 December 2017 to
approximately US$23.3 million for the year ended 31 December 2018, which was mainly
due to the decrease in the recognition of sales from new Kickstarter board games for the
year ended 31 December 2018. During the year ended 31 December 2017, the Group
recognised revenue from Kickstarter board game projects including Massive Darkness,
Rising Sun, The World of SMOG: Rise of Moloch and Zombicide: Green Horde with total
fund raising amount of approximately US$14.0 million. However, during the year ended
– 63 –

31 December 2018, the Group recognised revenue from Kickstarter board game projects
including Arcadia Quest: Riders, Cthulhu: Death May Die, HATE, Starcadia Quest and
Zombicide: Invader with total fund raising amount of approximately US$8.5 million only.
Revenue from board games increased from approximately US$6.3 million for the six
months ended 30 June 2018 to approximately US$10.5 million for the six months ended
30 June 2019, which was mainly due to the (i) the recognition of revenue of
approximately US$1.9 million from Kickstarter board game projects including
Cthulhu: Death May Die, HATE, Starcadia Quest and Zombicide: Invader during the
six months ended 30 June 2019 while Kickstarter sales of US$482,734 from Arcadia
Quest: Riders and Zombicide: Green Horde was recorded during the same period in 2018;
and (ii) the increased orders from wholesalers for 75 Gnom’ Street, Arcadia Quest:
Inferno, Council of Four, Cthulhu: Death May Die, Ethnos, Gang Rush: Breakout, Gekido:
Bot Battles, Gizmos, Krosmaster Quest, Monstrous, Narcos, Newton, River Wars, Rum &
Bones: Second Tide, The Godfather: Corleone’s Empire, The Grizzled: Armistice Edition,
The Others: 7 Sins, Victorian Masterminds, Wacky Races, XenoShyft: Dreadmire,
Zombicide: Green Horde, Zombicide: Invader, Zombicide: Season 2 and Zombicide:
Season 3 with total amount of approximately US$6.0 million. Wholesalers’ sales from
each of the above games were above US$100,000.
No new miniature war game was shipped during the two years ended 31 December 2017.
Revenue from miniature war games for the two years ended 31 December 2017 mainly
represented revenue from the previously launched miniature war games including Dark
Age and Wrath of Kings. Revenue of miniature war games for the year ended 31
December 2018 and the six months ended 30 June 2019 mainly comprised revenue of
approximately US$4.4 million and approximately US$1.0 million, respectively, from A
Song of Ice & Fire: Tabletop Miniatures Game, which was a Kickstarter miniature war
game launched in 2017 and shipped in 2018.
Other products mainly consist of revenue from sales at the online store or wholesalers’
sale of accessories and other game products that the Group sourced from other third
party publishers and game companies. Revenue from such third party accessories and
other game products fluctuated according to the demand from the Group’s customers
and the level of inventories that the Group stocked from time to time as part of the
Group’s strategy to identify customer trends and market preferences.
– 64 –

Revenue by geographical markets
The following table sets forth a breakdown of the Group’s revenue by geographical
markets based on location of the customers for the three years ended 31 December 2018
and the six months ended 30 June 2018 and 2019 :
Year ended 31 December Six months ended 30 June
2016 2017 2018 2018 2019
US$ % US$ % US$ % US$ % US$ %(Unaudited) (Unaudited)
North America 11,546,173 55.1 15,602,540 52.3 21,638,549 76.7 5,553,747 58.2 6,018,363 46.9Europe 7,829,071 37.3 11,230,864 37.7 4,553,980 16.1 2,876,315 30.1 3,919,533 30.6
Asia 626,047 3.0 1,156,739 3.9 1,542,619 5.5 433,139 4.5 1,814,969 14.2Oceania 794,214 3.8 1,439,011 4.8 416,832 1.5 592,260 6.2 308,561 2.4South America 152,212 0.7 373,586 1.3 37,231 0.1 79,868 0.8 758,584 5.9
Africa 16,418 0.1 14,000 — 18,200 0.1 15,597 0.2 — —
Total 20,964,135 100.0 29,816,740 100.0 28,207,411 100.0 9,550,926 100.0 12,820,010 100.0
North America and Europe (in particular Germany, France and the UK) remained as the
Group’s key markets. North America accounted for approximately 55.1%, 52.3%, 76.7%
and 46.9% of the Group’s total revenue for the three years ended 31 December 2018 and
the six months ended 30 June 2019, respectively, whilst Europe accounted for
approximately 37.3%, 37.7%, 16.1% and 30.6% of the Group’s total revenue for the
three years ended 31 December 2018 and the six months ended 30 June 2019, respectively.
The Group served these markets directly (mainly via Kickstarter and the Group’s online
store) and via its network of wholesalers. For relatively new markets such as Asia and
Oceania, the Group typically sells the games via wholesalers based in the respective
geographical areas. Other markets besides North America and Europe contributed in
aggregate approximately 7.6%, 10.0%, 7.2% and 22.5% of the total revenue for the three
years ended 31 December 2018 and the six months ended 30 June 2019, respectively.
– 65 –

Revenue by ownership
The following table sets forth a breakdown of the Group’s revenue by ownership for the
three years ended 31 December 2018 and the six months ended 30 June 2018 and 2019 :
Year ended 31 December Six months ended 30 June
2016 2017 2018 2018 2019
US$ % US$ % US$ % US$ % US$ %
(Unaudited) (Unaudited)
Self-owned games 19,582,259 93.4 26,639,265 89.3 17,434,363 61.8 5,165,002 54.1 6,686,362 52.2
Licensed games 570,949 2.7 1,955,700 6.6 9,253,219 32.8 3,686,934 38.6 4,069,437 31.7Third party games 544,901 2.6 1,081,318 3.6 1,161,545 4.1 659,870 6.9 1,135,521 8.9
Revenue from games 20,698,109 98.7 29,676,283 99.5 27,849,127 98.7 9,511,806 99.6 11,891,320 92.8Other products 266,026 1.3 140,457 0.5 358,284 1.3 39,120 0.4 928,690 7.2
Total 20,964,135 100.0 29,816,740 100.0 28,207,411 100.0 9,550,926 100.0 12,820,010 100.0
During the three years ended 31 December 2018 and the six months ended 30 June 2019,the Group’s revenue was mainly derived from self-owned games, which accounted forapproximately 93.4%, 89.3%, 61.8% and 52.2% of the Group’s total revenue,respectively.
The Group’s revenue from self-owned games increased by approximately 35.7% fromapproximately US$19.6 million for the year ended 31 December 2016 to approximatelyUS$26.6 million for the year ended 31 December 2017, which was mainly due to therecognition of (i) revenue of approximately US$5.1 million from Massive Darkness, aKickstarter game launched in June 2016 and shipped in 2017; and (ii) revenue fromvarious new self-owned games launched in 2017 namely, Rising Sun, The World ofSMOG: Rise of Moloch and Zombicide: Green Horde, which together contributed revenueof approximately US$16.1 million for the year ended 31 December 2017. The Group’srevenue from self-owned games decreased by approximately 34.6% from approximatelyUS$26.6 million for the year ended 31 December 2017 to approximately US$17.4 millionfor the year ended 31 December 2018, which was mainly due to the decrease in sales fromnew self-owned Kickstarter projects for the year ended 31 December 2018. During theyear ended 31 December 2017, the Group recognised revenue from new self-ownedKickstarter projects namely Massive Darkness, Rising Sun, The World of SMOG: Rise ofMoloch and Zombicide: Green Horde with total fund raising amount of approximatelyUS$14.0 million. However, during the year ended 31 December 2018, the Grouprecognised revenue from new self-owned Kickstarter projects namely Arcadia Quest:Riders, HATE, Starcadia Quest and Zombicide: Invader with total fund raising amount ofapproximately US$6.1 million only. The Group’s revenue from self-owned gamesincreased from approximately US$5.2 million for the six months ended 30 June 2018 toapproximately US$6.7 million for the six months ended 30 June 2019, which was mainlycontributed by the recognition of revenue from (i) new self-owned Kickstarter projectsfirst shipped in the second half of 2018, namely HATE, Starcadia Quest and Zombicide:Invader, with total revenue of approximately US$2.7 million; and (ii) the sales fromgames in the Zombicide series (other than Zombicide: Invader) with total revenue ofapproximately US$1.5 million.
– 66 –

The Group’s revenue from licensed games increased by approximately 250.3% fromUS$570,949 for the year ended 31 December 2016 to approximately US$2.0 million forthe year ended 31 December 2017 mainly due to the recognition of revenue from the newlicensed games namely, Ethnos and The Godfather: Corleone’s Empire, which in aggregatecontributed revenue of approximately US$1.3 million for the year ended 31 December2017. The Group’s revenue from licensed games further increased by approximately365.0% from approximately US$2.0 million for the year ended 31 December 2017 toapproximately US$9.3 million for the year ended 31 December 2018, which was mainlydue to the recognition of (i) revenue of approximately US$4.4 million from A Song of Ice& Fire: Tabletop Miniatures Game, which was a Kickstarter miniature war game launchedin 2017 and shipped in 2018; and (ii) revenue of approximately US$3.3 million fromCthulhu: Death May Die, which was a Kickstarter board game launched and shipped in2018. The Group’s revenue from licensed games increased from approximately US$3.7million for the six months ended 30 June 2018 to approximately US$4.1 million for thesix months ended 30 June 2019, which was mainly due to the recognition of (i) revenue ofUS$996,523 from A Song of Ice & Fire: Tabletop Miniatures Game, which was aKickstarter miniature war game launched in 2017 and shipped in 2018; (ii) revenue ofUS$784,202 from Cthulhu: Death May Die, which was a Kickstarter board gamelaunched and shipped in 2018; and (iii) revenue of US$687,547 from Rivet Wars due tothe increased orders from wholesalers.
The Group’s revenue from third party games increased by approximately 101.9% fromUS$544,901 for the year ended 31 December 2016 to approximately US$1.1 million forthe year ended 31 December 2017. Majority of the revenue from third party games for thetwo years ended 31 December 2017 was contributed by Potion Explosion, whichaccounted for approximately 39.8% and 41.0% of the total revenue from third partygames for the two years ended 31 December 2017, respectively. The increase in therevenue from third party games for the year ended 31 December 2017 was mainlyattributed to the increase in revenue from Potion Explosion from US$217,009 for the yearended 31 December 2016 to US$443,211 for the year ended 31 December 2017 and thecontribution from new third party games namely, Lorenzo il Magnifico and Unfair, whichin aggregate contributed revenue of US$253,018 for the year ended 31 December 2017.The Group’s revenue from third party games remained relatively stable at approximatelyUS$1.1 million for the year ended 31 December 2017 and approximately US$1.2 millionfor the year ended 31 December 2018. The Group’s revenue from third party gamesincreased from US$659,870 for the six months ended 30 June 2018 to approximatelyUS$1.1 million for the six months ended 30 June 2019, which was mainly due to theincrease in orders from wholesalers for 75 Gnom’ Street, Gang Rush: Breakout,Krosmaster Quest, Monstrous and Newton with total revenue of US$659,286 for the sixmonths ended 30 June 2019.
– 67 –

Revenue by games
The following table sets forth a breakdown of the Group’s revenue by games for the three
years ended 31 December 2018 and the six months ended 30 June 2018 and 2019 :
For the year ended 31 December
Six months ended
30 June
2016 2017 2018 2018 2019
US$ US$ US$ US$ US$
(Unaudited) (Unaudited)
Self-owned games
Arcadia Quest 407,551 549,979 583,982 243,621 189,267
Arcadia Quest: Inferno 3,729,156 320,673 — — 120,126
Arcadia Quest: Riders — — 514,247 456,920 —
Blood Rage 2,003,317 735,968 214,310 182,404 121,293
Council of Four — — 104,946 97,930 110,408
Dark Age 75,599 243,665 106,919 98,967 22,181
Dogs of War 7,514 12,123 3,434 3,096 468
Foodies — — — — 57,483
HATE — — 2,289,683 — 573,200
Kaosball 19,200 7,255 20,218 9,258 32,742
Masmorra: Dungeons of
Arcadia 2,007,395 164,450 20,657 13,077 6,039
Massive Darkness — 5,069,281 530,911 267,784 87,628
Richard the Lionheart — 44,285 120,949 117,902 8,024
Rising Sun — 6,040,101 1,677,868 1,380,792 229,614
Rum & Bones 246,221 68,081 9,228 6,570 10,996
Rum & Bones: Second Tide 1,867,661 269,422 61,731 55,397 165,077
Sheriff of Nottingham 155,750 117,025 86,785 10,500 85,849
Sherlook — 20,915 2,563 920 776
Starcadia Quest — — 1,501,306 — 196,165
Ta-Da! 19,784 7,553 7,505 4,826 641
The Grizzled 268,234 159,592 179,089 75,011 68,570
The Grizzled: Armistice Edition — — 79,301 — 237,274
The Others: 7 sins 3,318,102 281,442 122,596 63,729 120,144
The World of SMOG: On Her
Majesty’s Service 16,698 8,564 8,025 6,421 766
The World of SMOG: Rise of
Moloch — 1,913,666 147,786 62,469 55,676
Victorian Masterminds — — 5,054 — 275,769
Wrath of Kings 113,392 121,794 88,200 46,464 325,468
XenoShyft: Dreadmire 716,336 68,593 5,523 3,224 217,576
XenoShyft (mobile) 23,501 9,098 4,007 2,834 727
XenoShyft: Onslaught 86,388 25,379 17,006 11,039 7,770
Zombicide 823,707 511,780 1,691,604 906,174 319,036
Zombicide: Black Plague 2,913,228 1,386,974 413,371 407,513 248,680
Zombicide: Green Horde — 8,109,924 1,433,426 304,365 502,354
Zombicide: Invader — — 4,867,416 — 1,896,887
Zombicide: Season 2 242,075 204,357 287,952 215,192 265,971
Zombicide: Season 3 521,450 167,326 226,765 110,603 125,717
– 68 –

For the year ended 31 December
Six months ended
30 June
2016 2017 2018 2018 2019
US$ US$ US$ US$ US$
(Unaudited) (Unaudited)
Licensed games
A Song of Ice & Fire: Tabletop
Miniatures Game — — 4,388,290 3,093,323 996,523
B-Sieged: Sons of
the Abyss (Note) 193,807 9,606 15,130 9,068 —
Bloodborne: The Card Game 256,091 382,423 345,108 161,622 148,514
Blue Moon City — — 44,739 — 84,930
Cthulhu: Death May Die — — 3,267,219 — 784,202
Dojo Kun — 34,652 19,922 18,110 67,537
Dream On — 9,968 116,766 108,893 36,874
Ethnos — 302,049 222,503 93,595 162,667
Gateway Uprising — 24,806 31,306 30,822 12,534
Gekido: Bot Battles — 48,800 3,345 3,070 191,411
Gizmos — — 405,594 43,395 153,997
God of War: The Card Game — — — — 34,473
Guilds of Cadwallon 1,605 727 569 541 1,274
Kick-Ass — — 78,588 — 76,579
Kronia — 36,318 734 304 128
Looterz 43,792 25,425 18,031 11,497 40,847
Masques 10,667 2,855 279 198 —
Modern Art — 67,371 39,266 33,950 34,411
Narcos — — 35,082 — 228,761
Play Me 21,412 2,467 1,072 897 57,516
Queen’s Necklace 3,647 2,444 2,618 2,274 228
Rivet Wars 37,983 41,727 29,808 18,942 687,547
Sedition Wars: Battle for
Alabaster(Note) 1,945 — — — —
The Godfather: Corleone’s
Empire(Note) — 964,062 187,250 56,433 132,626
Wacky Races — — — — 135,858
– 69 –

For the year ended 31 December
Six months ended
30 June
2016 2017 2018 2018 2019
US$ US$ US$ US$ US$
(Unaudited) (Unaudited)
Third party games
13 Clues — — 27,698 26,237 7,726
75 Gnom’ Street — 27,210 — — 156,097
Banana Bandits — 38,334 927 182 135
Cthulhu in the House 12,880 23,095 1,195 828 7,790
Dragon Castle — — 312,419 170,033 32,438
Gang Rush: Breakout — 55,141 — — 141,382
Kaleidos 15,268 2,651 1,024 1,024 49,247
Kingz 10 9,636 — — —
Kreus 2,210 15,721 254 186 5
Krosmaster Arena 53,823 45,637 — — —
Krosmaster Quest 161,960 4,934 — — 146,414
Lorenzo il Magnifico — 111,193 119,033 70,804 30,293
Meeple War — 30,612 5,322 4,234 63,302
Monstrous 60 17,335 108 108 104,493
Newton — — 116,871 — 110,998
Potion Explosion 217,009 443,211 284,643 253,447 202,716
Railroad Ink — — 126,441 16,721 7
Raise Your Goblets 1,160 80,185 24,874 — 8,551
Rumble in the Dungeon 8,800 21,784 2,828 1,275 68,971
Unfair — 141,825 35,825 23,450 133
Unusual Suspects 68,576 12,257 19,221 13,320 3,274
Waka Tanka 3,145 557 340 271 —
Walls of York — — — — 1,141
Way of the Panda — — 82,522 77,750 408
Total revenue from games 20,698,109 29,676,283 27,849,127 9,511,806 11,891,320
Revenue contributed by the top
game 3,729,156 8,109,924 4,867,416 3,093,323 1,896,887
Revenue contributed by the top
10 games 18,307,903 25,724,946 22,231,705 7,529,131 6,626,957
Revenue contributed by new
games shipped during the
year/period 12,691,047 23,090,513 18,247,416 3,982,309 228,955
Total number of games with
revenue contribution
in the relevant year/period 43 62 74 63 78
Note: The licensing agreements for B-Sieged: Sons of the Abyss, Sedition Wars: Battle for Alabaster and
The Godfather: Corleone’s Empire expired in August 2018, January 2016 and July 2019,
respectively. For details, please refer to the paragraph headed ‘‘Business of the Group — Games
— Licensed games’’ in this announcement.
– 70 –
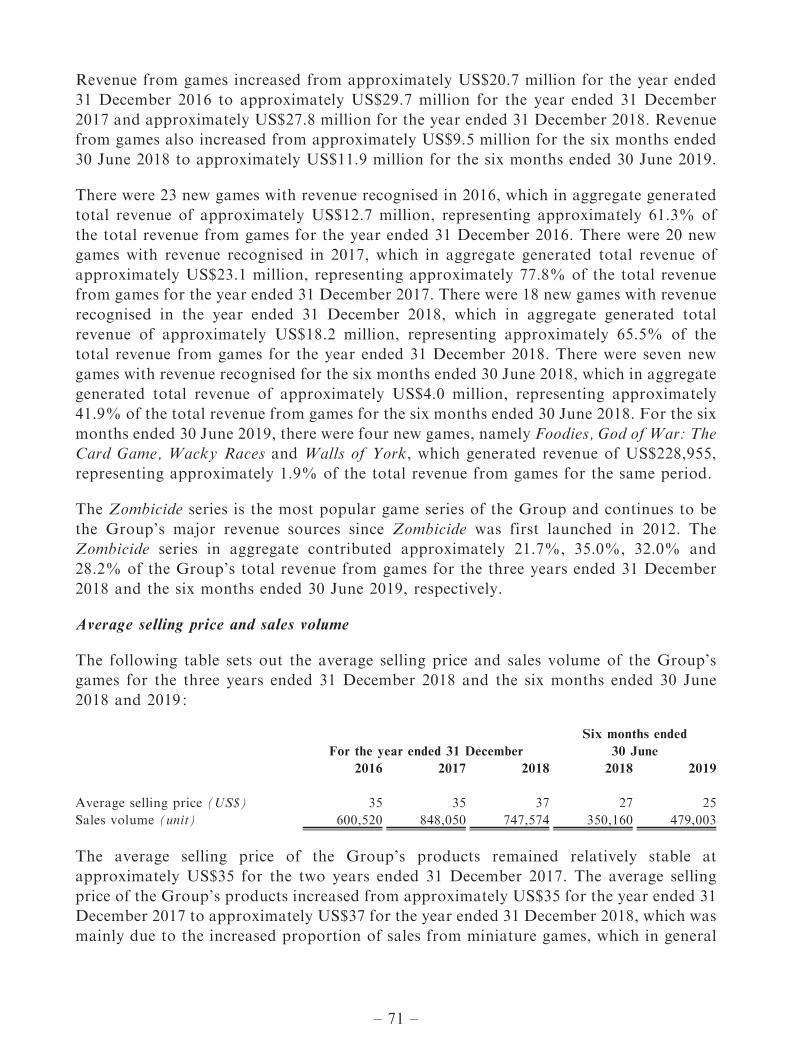
Revenue from games increased from approximately US$20.7 million for the year ended
31 December 2016 to approximately US$29.7 million for the year ended 31 December
2017 and approximately US$27.8 million for the year ended 31 December 2018. Revenue
from games also increased from approximately US$9.5 million for the six months ended
30 June 2018 to approximately US$11.9 million for the six months ended 30 June 2019.
There were 23 new games with revenue recognised in 2016, which in aggregate generated
total revenue of approximately US$12.7 million, representing approximately 61.3% of
the total revenue from games for the year ended 31 December 2016. There were 20 new
games with revenue recognised in 2017, which in aggregate generated total revenue of
approximately US$23.1 million, representing approximately 77.8% of the total revenue
from games for the year ended 31 December 2017. There were 18 new games with revenue
recognised in the year ended 31 December 2018, which in aggregate generated total
revenue of approximately US$18.2 million, representing approximately 65.5% of the
total revenue from games for the year ended 31 December 2018. There were seven new
games with revenue recognised for the six months ended 30 June 2018, which in aggregate
generated total revenue of approximately US$4.0 million, representing approximately
41.9% of the total revenue from games for the six months ended 30 June 2018. For the six
months ended 30 June 2019, there were four new games, namely Foodies, God of War: The
Card Game, Wacky Races and Walls of York, which generated revenue of US$228,955,
representing approximately 1.9% of the total revenue from games for the same period.
The Zombicide series is the most popular game series of the Group and continues to be
the Group’s major revenue sources since Zombicide was first launched in 2012. The
Zombicide series in aggregate contributed approximately 21.7%, 35.0%, 32.0% and
28.2% of the Group’s total revenue from games for the three years ended 31 December
2018 and the six months ended 30 June 2019, respectively.
Average selling price and sales volume
The following table sets out the average selling price and sales volume of the Group’s
games for the three years ended 31 December 2018 and the six months ended 30 June
2018 and 2019 :
For the year ended 31 December
Six months ended
30 June
2016 2017 2018 2018 2019
Average selling price (US$) 35 35 37 27 25
Sales volume (unit) 600,520 848,050 747,574 350,160 479,003
The average selling price of the Group’s products remained relatively stable at
approximately US$35 for the two years ended 31 December 2017. The average selling
price of the Group’s products increased from approximately US$35 for the year ended 31
December 2017 to approximately US$37 for the year ended 31 December 2018, which was
mainly due to the increased proportion of sales from miniature games, which in general
– 71 –

carry higher selling prices than board games and mobile games. For the year ended 31
December 2018, sales from miniature games accounted for approximately 16.2% of the
total revenue of the Group as compared to approximately 1.2% for the year ended 31
December 2017. The average selling price of the Group’s products decreased from
approximately US$27 for the six months ended 30 June 2018 to approximately US$25 for
the six months ended 30 June 2019, which was mainly due to the sale of some inventories
by the Group at higher discount to MSRP during the period.
Sales volume increased from 600,520 for the year ended 31 December 2016 to 848,050 for
the year ended 31 December 2017, which was in line with the Group’s expansion in
business scale and game portfolio. The decreasing trend in sales volume to 747,574 for
the year ended 31 December 2018 was mainly due to the decrease in revenue during the
year. Sales volume increased from 350,160 for the six months ended 30 June 2018 to
479,003 for the six months ended 30 June 2019, which was in line with the increase in
revenue during the period.
Cost of sales
The Group’s cost of sales primarily consists of cost of inventories, shipping and handling
charges, depreciation and amortisation. The following table sets out a breakdown of the
Group’s cost of sales for the three years ended 31 December 2018 and the six months
ended 30 June 2018 and 2019 :
For the year ended 31 December
Six months ended
30 June
2016 2017 2018 2018 2019
US$ US$ US$ US$ US$
(Unaudited) (Unaudited)
Cost of inventories 7,213,575 10,459,716 7,592,042 2,680,440 4,388,334
Shipping and handling charges 2,046,461 3,358,625 3,374,618 1,135,068 1,286,573
Depreciation 480,398 658,533 823,683 408,643 391,523
Amortisation 509,441 852,810 1,415,226 742,784 882,531
Other expenses 10,000 102,732 200,000 — —
Total 10,259,875 15,432,416 13,405,569 4,966,935 6,948,961
The cost of inventories consist of cost of finished products charged by the Group’s supply
chain managers and other suppliers, which increased over the two years ended 31
December 2017 as a result of the increase in the Group’s game portfolio and revenue. The
decrease in cost of inventories for the year ended 31 December 2018 as compared to the
same period in 2017 was mainly due to the decrease in revenue as well as the more
favourable prices in terms of lower unit costs for certain bulk orders offered by Supplier
A after taking into account of the recent downward price trend of paper, the reputation
of the Group, the order size, expected business growth and the intention to develop long-
term business relationship with the Group. The average cost of inventories per unit (cost
of inventories divided by sales volume) decreased from approximately US$12.3 for the
year ended 31 December 2017 to approximately US$10.2 for the year ended 31 December
– 72 –

2018. The increase in cost of inventories from approximately US$2.7 million for the six
months ended 30 June 2018 to approximately US$4.4 million for the six months ended 30
June 2019 was in line with the increase in revenue during the period. The average cost of
inventories per unit (cost of inventories divided by sales volume) increased from
approximately US$7.7 for the six months ended 30 June 2018 to approximately US$9.2
for the six months ended 30 June 2019, respectively, which was higher than the average
cost of inventories per unit for the year ended 31 December 2018. As the products sold
during the six months ended 30 June 2019 consisted of a larger portion of old stocks
brought forward from previous financial years with higher average cost, the favourable
effect of lower average cost of inventories per unit brought by Supplier A was diluted. As
discussed in the paragraph headed ‘‘Financial Information of the Group — Revenue —
Revenue by sales channels’’ in this announcement, the Group’s top customers during the
six months ended 30 June 2019 made orders covering material number of games carried
by the Group, including the old stocks of some games launched in previous years. As a
result, approximately 47.5% of the sales for the six months ended 30 June 2019 was
attributable to stocks brought forward from 31 December 2018. For the six months
ended 30 June 2018, only approximately 29.6% of the sales was attributable to stocks
brought forward from 31 December 2017.
Although there is no guarantee that there will not be any upward price adjustment by
Supplier A, it is the current intention of both the Group and Supplier A to maintain a
long term business relationship and there has not been any material price adjustment
made by Supplier A since the co-operation in 2018. Besides, Supplier A is still offering
favourable prices to the Group for bulk order purchase made by the Group since 1
January 2019. Therefore, the Directors are of the view that the favourable terms are
sustainable for the near future, taking into account the order size of the Group, the
bargaining power of the Group and the established business relationship with Supplier A.
Shipping and handling charges are incurred when the Group’s supply chain managers
deliver the products to the Group’s office and warehouse at the United States. The
Group also incurs shipping and handling charges when the Group delivers the goods to
Kickstarter backers, late subscribers and direct customers from the Group’s online store
from the office and warehouse of the Group at the United States. During the three years
ended 31 December 2018, changes in shipping and handling charges were relatively stable
except for the year ended 31 December 2016 due to the temporary change in the Group’s
delivery logistics to wholesalers in the United States during the first four months in 2016.
It is the usual practice of the Group’s wholesalers to collect the products themselves when
the products are shipped from the supply chain managers to the Group’s office and
warehouse in the United States. Therefore, costs of shipping products from the supply
chain managers to the office and warehouse at the United States are classified as cost of
sales as they are incurred to bring the related inventories to their present location and
condition ready for sale. However, during the period from January 2016 to April 2016,
the Group tried to adopt a new delivery logistics by shipping the goods directly to the
wholesalers in the United States from the supply chain managers with an aim to reduce
storage time and related costs. The relevant shipping charges did not fall within the
– 73 –

definition of cost of sales and were classified as selling and distribution expenses because
they were costs incurred for delivering the products directly to the customers due to sales
to customers. As the total costs incurred for this new delivery logistics were substantially
higher, the Group has aborted this trial logistics method since May 2016 and re-adopted
the original model. As a result of the classification of the shipping and handling charges
in relation to sales to wholesalers in the United States as selling and distribution expenses
during the first four months of 2016, the Group’s recorded lower shipping and handling
charges in cost of sales for the year ended 31 December 2016. The increase in shipping
and handling charges for the six months ended 30 June 2019 as compared with the same
period in 2018 was mainly due to the increase in revenue during the period.
Total depreciation and amortisation increased throughout the Reporting Period, which
was generally in line with the increase in the scale of operation and game portfolio; and
the addition of IP rights for Blood Rage, Council of Four, Massive Darkness, Rising Sun,
The Grizzled, The Others: 7 Sins, The World of SMOG and Zombicide and capitalisation
of product development costs.
Gross profit and gross profit margin
The Group’s gross profit increased from approximately US$10.7 million for the year
ended 31 December 2016 to approximately US$14.4 million for the year ended 31
December 2017, and further increased to approximately US$14.8 million for the year
ended 31 December 2018. Gross profit margin was approximately 51.1%, 48.2% and
52.5% for the three years ended 31 December 2018, respectively. The increase in gross
profit margin for the year ended 31 December 2018 was mainly due to the decrease in cost
of inventories primarily resulting from the more favourable prices in terms of lower unit
costs for certain bulk orders offered by Supplier A as discussed in the paragraph headed
‘‘Cost of sales’’ above. The Group’s gross profit increased from approximately US$4.6
million for the six months ended 30 June 2018 to approximately US$5.9 million for the
six months ended 30 June 2019, mainly due to the increase in revenue during the period.
Gross profit margin decreased from approximately 48.0% for the six months ended 30
June 2018 to approximately 45.8% for the six months ended 30 June 2019, mainly due to
the lower contribution from Kickstarter sales which in general enjoy higher margin than
sales via other channels.
– 74 –

The Group’s gross profit and gross profit margin fluctuated according to product mix in
terms of the type and nature of games sold. The following table is a summary of the gross
profit and gross profit margin by sales channels, category of games and game ownership
during the three years ended 31 December 2018 and the six months ended 30 June 2018
and 2019 :
Year ended 31 December Six months ended 30 June
2016 2017 2018 2018 2019
US$ % US$ % US$ % US$ % US$ %
(Unaudited) (Unaudited)
By sales
channels (Note)
Kickstarter 5,766,873 50.3 9,819,956 47.7 8,204,105 53.8 1,470,853 46.6 966,602 49.9
Wholesalers 4,430,771 51.4 4,056,569 48.6 5,831,361 49.7 2,853,471 48.1 4,864,383 44.9
Online store and game
conventions 489,460 57.7 501,198 57.6 763,437 61.8 257,598 56.6 39,433 69.0
Mobile games 17,156 73.0 6,601 72.6 2,939 73.3 2,069 73.0 631 86.8
By category of games
Board games 10,438,843 51.0 14,102,589 48.1 11,587,102 49.8 2,821,430 45.0 4,776,986 45.3
Miniature war games 103,743 54.9 198,119 54.2 3,116,142 68.0 1,738,901 53.7 715,414 53.2
Mobile games 17,156 73.0 6,601 72.6 2,939 73.3 2,069 73.0 631 86.8
Other products 144,518 54.3 77,015 54.8 95,659 26.7 21,591 55.2 378,018 40.7
By game ownership
Self-owned games 10,078,044 51.5 13,022,521 48.9 8,636,348 49.5 2,522,947 48.8 3,069,441 45.9
Licensed games 230,269 40.3 788,024 40.3 5,670,986 61.3 1,766,504 47.9 1,946,795 47.8
Third party games 251,429 46.1 496,764 45.9 398,849 34.3 272,948 41.4 476,795 42.0
Other products 144,518 54.3 77,015 54.8 95,659 26.7 21,592 55.2 378,018 40.7
Note: For the purpose of arriving at the respective gross profits by sales channels, depreciation and
amortisation are allocated according to the relative revenue ratio of the sales channels.
Gross profit and gross profit margin by sales channels
Revenue from Kickstarter in general enjoy higher gross profit margin than revenue from
other sales channels as sales via Kickstarter are charged at MSRP while sales via other
sales channels are charged at a discount to MSRP. Besides, the Group charges backers
and late pledgers shipping fee for Kickstarter sales, but the Group needs to pay for the
expenses for shipping the products from supply chain managers to the Group’s office and
warehouse in the United States for its US wholesale sales.
Gross profit for revenue from Kickstarter increased by approximately 69.0% from
approximately US$5.8 million for the year ended 31 December 2016 to approximately
US$9.8 million for the year ended 31 December 2017, which was in line with the growth
in revenue from Kickstarter during the years. Gross profit margin decreased from
approximately 50.3% for the year ended 31 December 2016 to approximately 47.7% for
the year ended 31 December 2017, which was mainly due to the increased depreciation
and amortisation of IPs which were relatively fixed cost in nature. Gross profit for
revenue from Kickstarter decreased from approximately US$9.8 million for the year
– 75 –

ended 31 December 2017 to approximately US$8.2 million for the year ended 31
December 2018, which was in line with the decrease in revenue from Kickstarter during
the year ended 31 December 2018. Gross profit margin increased from approximately
47.7% for the year ended 31 December 2017 to approximately 53.8% for the year ended
31 December 2018 mainly due to (i) the increased contribution from the sale of miniature
games which in general have higher gross margin; and (ii) the decrease in cost of
inventories resulting from the more favourable prices in terms of lower unit costs for
certain bulk orders offered by Supplier A as discussed in the paragraph headed ‘‘Cost of
sales’’ above. Gross profit margin for sales via Kickstarter for the six months ended 30
June 2019 of approximately 49.9% was lower than the gross profit margin of
approximately 53.8% for the year ended 31 December 2018 because there was no
contribution from sale of miniature games via Kickstarter during the six months ended
30 June 2019.
Gross profit for revenue from wholesalers was approximately US$4.4 million for the year
ended 31 December 2016 and decreased slightly by approximately 6.8% to approximately
US$4.1 million for the year ended 31 December 2017, which was in line with the
movement in revenue from wholesalers during the years. Gross profit margin was
approximately 51.4% for the year ended 31 December 2016 and slightly decreased to
approximately 48.6% for year ended 31 December 2017, which was mainly due to the (i)
increased contribution from licensed games, which in general have lower gross profit
margin than self-owned games and third party games; and (ii) the effect of the temporary
change in delivery logistics to wholesalers in 2016 as discussed in the paragraph headed
‘‘Cost of sales’’ above. Gross profit for revenue from wholesalers increased from
approximately US$4.1 million for the year ended 31 December 2017 to approximately
US$5.8 million for the year ended 31 December 2018, which was in line with the increase
in revenue from wholesalers during the year ended 31 December 2018. Gross profit
margin increased from approximately 48.6% for the year ended 31 December 2017 to
approximately 49.7% for the year ended 31 December 2018 mainly due to the decrease in
cost of inventories resulting from the more favourable prices in terms of lower unit costs
for certain bulk orders offered by Supplier A as discussed in the paragraph headed ‘‘Cost
of sales’’ above. Gross profit for revenue from wholesalers increased from approximately
US$2.9 million for the six months ended 30 June 2018 to approximately US$4.9 million
for the six months ended 30 June 2019, which was in line with the increase in revenue
from wholesalers. Gross profit margin decreased from approximately 48.1% for the six
months ended 30 June 2018 to approximately 44.9% for the six months ended 30 June
2019 mainly as a result of the increased average cost of inventories per unit as discussed
in the paragraph headed ‘‘Cost of sales’’ above.
– 76 –

Gross profit for games sold at the Group’s online store and game conventions increased
from US$489,460 for the year ended 31 December 2016 to US$501,198 for the year ended
31 December 2017 and US$763,437 for the year ended 31 December 2018, which was in
line with the movement in revenue from online store and game conventions during the
years. Gross profit margin remained fairly stable at approximately 57.7% and 57.6% for
the two years ended 31 December 2017, respectively and increased to approximately
61.8% for the year ended 31 December 2018, which was mainly due to the decrease in
cost of inventories resulting from the more favourable prices in terms of lower unit costs
for certain bulk orders offered by Supplier A as discussed in the paragraph headed ‘‘Cost
of sales’’ above. Gross profit for revenue from online store and game conventions
decreased from US$257,598 for the six months ended 30 June 2018 to US$39,433 for the
six months ended 30 June 2019, which was in line with the decrease in revenue from
online store and game conventions. Gross profit margin increased from approximately
56.6% for the six months ended 30 June 2018 to approximately 69.0% for the six months
ended 30 June 2019 as majority of the revenue from the Group’s online store and game
conventions for the six months ended 30 June 2019 was contributed by A Song of Ice &
Fire: Tabletop Miniatures Game, which is a miniature game which in general enjoys
higher margin than other categories of game.
Gross profit and gross profit margin by category of games
Miniature war games in general enjoy higher gross profit margin than other game
categories as the production of miniature war games involves less paper and printing
which result in lower cost of inventories and at the same time, miniature war games
usually carry higher MSRP than other game categories.
Gross profit for board games was approximately US$10.4 million for the year ended 31
December 2016 and increased by approximately 35.6% to approximately US$14.1 million
for the year ended 31 December 2017, which was in line with the growth in revenue from
board games during the years. Gross profit margin was approximately 51.0% for the year
ended 31 December 2016 and slightly decreased to approximately 48.1% for the year
ended 31 December 2017, which was mainly due to the increased amortisation of IPs in
relation to board games of the Group in 2017 as well as the effect of the temporary
change in delivery logistics to wholesalers in 2016 as discussed in the paragraph headed
‘‘Cost of sales’’ above. Gross profit for board games decreased by approximately 17.7%
from approximately US$14.1 million for the year ended 31 December 2017 to
approximately US$11.6 million for the year ended 31 December 2018, which was in
line with the decrease in revenue from board games during the year ended 31 December
2018. Gross profit margin increased from approximately 48.1% for the year ended 31
December 2017 to approximately 49.8% for the year ended 31 December 2018, which was
mainly due to the combined effect of (i) the decrease in cost of inventories resulting from
the more favourable prices in terms of lower unit costs for certain bulk orders offered by
Supplier A as discussed in the paragraph headed ‘‘Cost of sales’’ above; and (ii) increased
depreciation and amortisation of IPs in relation to board games of the Group during the
year ended 31 December 2018. Gross profit for board games increased from
– 77 –

approximately US$2.8 million for the six months ended 30 June 2018 to approximately
US$4.8 million for the six months ended 30 June 2019, which was in line with the growth
in revenue from board games. Gross profit margin remained fairly stable at
approximately 45.0% and 45.3% for the six months ended 30 June 2018 and 2019,
respectively.
Gross profit for miniature war games was US$103,743 for the year ended 31 December
2016 and increased by approximately 91.0% to US$198,119 for the year ended 31
December 2017, which was in line with the growth in revenue from miniature war games
during the years. Gross profit margin remained fairly stable at approximately 54.9% and
54.2% for the two years ended 31 December 2017, respectively. Gross profit for
miniature war games increased by approximately 1,464.7% from US$198,119 for the year
ended 31 December 2017 to approximately US$3.1 million for the year ended 31
December 2018, which was mainly due to the shipment of A Song of Ice & Fire: Tabletop
Miniatures Games, a Kickstarter miniature war game launched in 2017 and shipped in
2018. Gross profit margin increased from approximately 54.2% for the year ended 31
December 2017 to approximately 68.0% for the year ended 31 December 2018, which was
mainly due to the shipment of A Song of Ice & Fire: Tabletop Miniatures Games in 2018 as
sales via Kickstarter in general have higher gross margin. Gross profit for miniature war
games decreased from approximately US$1.7 million for the six months ended 30 June
2018 to US$715,414 for the six months ended 30 June 2019, which was in line with the
decrease in revenue from miniature war games. Gross profit margin remained fairly
stable at approximately 53.7% and 53.2% for the six months ended 30 June 2018 and
2019, respectively.
Gross profit for mobile game was US$17,156 for the year ended 31 December 2016 and
decreased to US$6,601 for the year ended 31 December 2017 and US$2,939 for the year
ended 31 December 2018, which was in line with the movement in revenue from mobile
game during the years. Gross profit margin remained fairly stable at approximately
73.0%, 72.6% and 73.3% for the three years ended 31 December 2018, respectively.
Gross profit for mobile game decreased from US$2,069 for the six months ended 30 June
2018 to US$631 for the six months ended 30 June 2019, which was in line with the
decrease in revenue from mobile game. Gross profit margin increased from
approximately 73.0% for the six months ended 30 June 2018 to approximately 86.8%
for the six months ended 30 June 2019 as no manpower has been assigned to XenoShyft
(mobile) in 2019 given its low revenue contribution.
Gross profit for other products was US$144,518 for the year ended 31 December 2016
and decreased by approximately 46.7% to US$77,015 for the year ended 31 December
2017, which was in line with the movement in revenue from other products during the
year. Gross profit margin remained relatively stable at approximately 54.3% and 54.8%
for the two years ended 31 December 2017, respectively. Gross profit for other products
increased from US$77,015 for the year ended 31 December 2017 to US$95,659 for the
year ended 31 December 2018, which was in line with the increase in revenue from other
products during the year. Gross profit margin from other products decreased from
– 78 –

approximately 54.8% for the year ended 31 December 2017 to approximately 26.7% for
the year ended 31 December 2018, which was mainly due to the increased sales of third
party accessories and other game products with relatively low margin during the year.
Gross profit for other products increased from US$21,592 for the six months ended 30
June 2018 to US$378,018 for the six months ended 30 June 2019, which was in line with
the increase in revenue from other products. Gross profit margin decreased from
approximately 55.2% for the six months ended 30 June 2018 to approximately 40.7% for
the six months ended 30 June 2019, which was mainly due to increased sales of third party
accessories and other game products with relatively low margin during the period.
Gross profit and gross profit margin by game ownership
Gross profit for self-owned games was approximately US$10.1 million for the year ended
31 December 2016 and increased by approximately 28.7% to approximately US$13.0
million for the year ended 31 December 2017, which was in line with the growth in
revenue from self-owned games during the years. Gross profit margin was approximately
51.5% for the year ended 31 December 2016 and slightly decreased to approximately
48.9% for the year ended 31 December 2017, which was mainly due to the increased
amortisation of IPs in relation to the self-owned games of the Group during the year as
well as the effect of the temporary change in delivery logistics to wholesalers in 2016 as
discussed in the paragraph headed ‘‘Cost of sales’’ above. Gross profit for self-owned
games decreased by approximately 33.8% from approximately US$13.0 million for the
year ended 31 December 2017 to approximately US$8.6 million for the year ended 31
December 2018, which was in line with the decrease in revenue from self-owned games
during the year ended 31 December 2018. Gross profit margin increased slightly from
approximately from 48.9% for the year ended 31 December 2017 to approximately 49.5%
for the year ended 31 December 2018, which was the combined effect of (i) the decrease in
cost of inventories resulting from the more favourable prices in terms of lower unit costs
for certain bulk orders offered by Supplier A as discussed in the paragraph headed ‘‘Cost
of sales’’ above; and (ii) the increased depreciation and amortisation of IPs in relation to
self-owned games of the Group during the year ended 31 December 2018. Gross profit for
self-owned games increased from approximately US$2.5 million for the six months ended
30 June 2018 to approximately US$3.1 million for the six months ended 30 June 2019,
which was in line with the increase in revenue from self-owned games. Gross profit
margin decreased from approximately 48.8% for the six months ended 30 June 2018 to
approximately 45.9% for the six months ended 30 June 2019 mainly due to the increased
average cost of inventories per unit as discussed in the paragraph headed ‘‘Cost of sales’’
above and the increased depreciation and amortization of IPs in relation to self-owned
games of the Group during the period.
Gross profit for licensed games was US$230,269 for the year ended 31 December 2016
and increased by approximately 242.2% to US$788,024 for the year ended 31 December
2017, which was in line with the movement in revenue from licensed games during the
years. Gross profit margin remained fairly stable at approximately 40.3% and 40.3% for
the two years ended 31 December 2017, respectively. Gross profit for licensed games
– 79 –

increased by 623.3% from US$788,024 for the year ended 31 December 2017 to
approximately US$5.7 million for the year ended 31 December 2018, which was mainly
due to the shipment of A Song of Ice & Fire: Tabletop Miniatures Games, a licensed
Kickstarter miniature war game launched in 2017 and shipped in 2018, during the year
ended 31 December 2018. Gross profit margin increased from approximately 40.3% for
the year ended 31 December 2017 to approximately 61.3% for the year ended 31
December 2018, which was mainly due to (i) the contribution from A Song of Ice & Fire:
Tabletop Miniatures Games, which is a miniature war game which in general enjoys a
higher gross profit margin than board games; and (ii) the decrease in cost of inventories
resulting from the more favourable pries in terms of lower unit costs for certain bulk
orders offered by Supplier A as discussed in the paragraph headed ‘‘Cost of sales’’ above.
Gross profit for licensed games increased from approximately US$1.8 million for the six
months ended 30 June 2018 to approximately US$1.9 million for the six months ended 30
June 2019, which was in line with the increase in revenue from licensed games. Gross
profit margin remained fairly stable at approximately 47.9% and 47.8% for the six
months ended 30 June 2018 and 2019, respectively.
Gross profit for third party games increased by approximately 97.6% from US$251,429
for the year ended 31 December 2016 to US$496,764 for the year ended 31 December
2017, which was in line with the movement in revenue from third party games for the two
years ended 31 December 2017. Gross profit margin remained fairly stable at
approximately 46.1% and 45.9% for the two years ended 31 December 2017,
respectively. Gross profit for third party games decreased by approximately 19.7%
from US$496,764 for the year ended 31 December 2017 to US$398,849 for the year ended
31 December 2018, which was mainly due to the bargain sales conducted by the Group
towards the end of 2018 to clear some of the underperforming games. As a result, gross
profit margin from third party games also decreased from approximately 45.9% for the
year ended 31 December 2017 to approximately 34.3% for the year ended 31 December
2018. Gross profit for third party games increased from US$272,948 for the six months
ended 30 June 2018 to US$476,795 for the six months ended 30 June 2019, which was in
line with the increase in revenue from third party games. Gross profit margin remained
fairly stable at approximately 41.4% and 42.0% for the six months ended 30 June 2018
and 2019, respectively.
Other income
The Group’s other income mainly represents income from sales of advertising space on
the Group’s website, royalty income received from Independent Third Parties as well as
the income from recharge of mobile app development costs of Zombicide: Tactics &
Shotguns to a business partner according to a future revenue sharing arrangement.
Other income decreased from US$219,602 for the year ended 31 December 2016 to
US$111,502 for the year ended 31 December 2017 mainly due to the decrease in the
amount of mobile app development costs of Zombicide: Tactics & Shotguns being
recharged to the business partner in 2017.
– 80 –

Other income further decreased from US$111,502 for the year ended 31 December 2017
to US$80,232 for the year ended 31 December 2018, which was mainly attributable to the
decrease in sales of advertising space on the Group’s website.
Other income decreased from US$316,899 for the six months ended 30 June 2018 to
US$236,533 for the six months ended 30 June 2019. For the six months ended 30 June
2018, there was a recharge for the mobile app development costs to a business partner for
the completion of Zombicide: Tactics & Shotguns and there was no such item for the six
months ended 30 June 2019, hence resulting in the decrease.
Other (losses)/gains
The Group’s other (losses)/gains mainly represents exchange (losses)/gains resulted from
operations and losses on investments in insurance contracts.
The Group recorded exchange losses of US$73,530 for the year ended 31 December 2017
as compared to nil for the year ended 31 December 2016, which was mainly resulted from
the translation of the salaries of the Canadian office which are denominated in Canadian
dollars.
The Group recorded exchange gains of US$4,562 for the year ended 31 December 2018 as
compared to exchange losses of US$73,530 for the year ended 31 December 2017, which
was mainly resulted from the translation of loan repayments which are denominated in
Singapore dollars.
The Group recorded other losses of US$297,843 for the six months ended 30 June 2019 as
compared to other gains of US$17,504 for the six months ended 30 June 2018, which was
mainly due to one-off losses of US$272,711 on investments in insurance contracts.
Selling and distribution expenses
The Group’s selling and distribution expenses for the year ended 31 December 2017 were
approximately US$4.6 million, nearly doubled from approximately US$2.3 million for
the year ended 31 December 2016. This was primarily due to (i) an increase in employee
benefit expenses from US$203,296 for the year ended 31 December 2016 to
approximately US$1.7 million for the year ended 31 December 2017 as a result of the
increased headcount in sales team; and (ii) an increase in merchant account fees to
approximately US$1.3 million for the year ended 31 December 2017 from US$685,704 for
the year ended 31 December 2016 resulting from the increase in the amount of funding
received from the Kickstarter projects launched during 2017.
The Group’s selling and distribution expenses increased from approximately US$4.6
million for the year ended 31 December 2017 to approximately US$5.7 million for the
year ended 31 December 2018, which was mainly due to (i) an increase in employee
benefit expenses from approximately US$1.7 million for the year ended 31 December
2017 to approximately US$2.3 million for the year ended 31 December 2018 mainly
– 81 –

resulting from the increased headcount in the marketing team during the first half of the
year; (ii) an increase in royalty expenses from US$95,560 for the year ended 31 December
2017 to US$423,129 for the year ended 31 December 2018 resulting from the recognition
of sales of A Song of Ice & Fire: Tabletop Miniatures Game in 2018; and (iii) an increase in
marketing expenses from US$691,670 for the year ended 31 December 2017 to
US$832,703 for the year ended 31 December 2018 resulting from the increased
marketing activities, such as the participation in large scale game conventions to raise
brand awareness of the Group.
The Group’s selling and distribution expenses increased from approximately US$1.6
million for the six months ended 30 June 2018 to approximately US$2.2 million for the
six months ended 30 June 2019, which was mainly due to the increase in royalty expenses
from US$45,093 for the six months ended 30 June 2018 to US$287,178 for the six months
ended 30 June 2019 resulting from the recognition of sales of A Song of Ice & Fire:
Tabletop Miniatures Game and Cthulhu: Death May Die during the period, the increase in
marketing and travelling expenses for business development activities and increased
marketing expenses for the launch of Zombicide: Tactics & Shotguns.
General and administrative expenses
The Group’s general and administrative expenses for the year ended 31 December 2017
were approximately US$5.4 million, representing a decrease of approximately 19.4%
from approximately US$6.7 million for the year ended 31 December 2016. The decrease
was primarily due to the absence of professional service fees in respect of the Listing
preparation for the year ended 31 December 2017 as the Company has successfully listed
on GEM in December 2016, netted off by (i) an increase in games development expenses
from US$97,740 for the year ended 31 December 2016 to US$675,967 for the year ended
31 December 2017 primarily due to more intensive game development work for new
games; and (ii) an increase in other professional fees from US$82,477 for the year ended
31 December 2016 to US$639,736 for the year ended 31 December 2017 primarily due to
legal fee incurred for the acquisition of the two properties in Singapore, fees related to
consultants engaged for development of the China market and other professional
services.
The Group’s general and administrative expenses for the year ended 31 December 2018
were approximately US$6.6 million, representing an increase of approximately 22.2%
from approximately US$5.4 million for the year ended 31 December 2017, which was
primarily due to (i) the professional service fees in respect of the Transfer of Listing of
US$949,756 incurred for the year ended 31 December 2018; and (ii) an increase in games
development expenses from US$675,967 for the year ended 31 December 2017 to
US$911,523 for the year ended 31 December 2018 resulting from more intensive game
development work for new games.
The Group’s general and administrative expenses for the six months ended 30 June 2019
was approximately US$4.4 million, representing an increase of approximately 33.3%
from approximately US$3.3 million for the six months ended 30 June 2018. The increase
– 82 –

was primarily due to (i) the increase in the professional service fees in respect of the
Transfer of Listing from US$449,174 for the six months ended 30 June 2018 to
approximately US$1.1 million for the six months ended 30 June 2019; (ii) share-based
expense of US$200,949 incurred for the six months ended 30 June 2019, which were not
charged for the six months ended 30 June 2018; and (iii) the increase in games
development expenses from US$473,841 for the six months ended 30 June 2018 to
US$604,104 for the six months ended 30 June 2019 resulting from more intensive game
development work for new games.
Finance costs
The Group did not have any bank borrowings during the year ended 31 December 2016
and therefore did not incur any finance costs. Since 2017, the Group has started to
finance the acquisition of properties and daily operation by bank borrowings. Besides,
finance cost in relation to lease payment has been charged since 1 January 2019 following
the adoption of IFRS 16 on 1 January 2019. As a result, the Group incurred finance costs
of US$35,621, US$229,650 and US$270,225 for the two years ended 31 December 2017
and 2018 and the six months ended 30 June 2019, respectively.
Income tax expense
Despite an approximately 131.5% increase in profit before income tax for the year ended
31 December 2017, the income tax expenses of the Group decreased by approximately
1.0% from US$860,158 for the year ended 31 December 2016 to US$851,310 for the year
ended 31 December 2017. This was mainly due to the non tax-deductible nature of the
professional service fees incurred in respect of the Listing preparation for the year ended
31 December 2016.
Income tax expense decreased by approximately 69.6% from US$851,310 for the year
ended 31 December 2017 to US$258,685 for the year ended 31 December 2018 mainly due
to the decrease in profit before income tax and decrease in United States corporate tax
rate applicable to the Group.
Income tax expenses decreased by approximately 28.5% from US$91,655 for the six
months ended 30 June 2018 to US$65,562 for the six months ended 30 June 2019 mainly
due to the decrease in profit before income tax excluding the professional service fees in
respect of the Transfer of Listing for the six months ended 30 June 2019 which were non
tax-deductible.
Profit/(loss) and total comprehensive income/(loss) for the year/period attributable to
equity holders of the Company
The profit and total comprehensive income for the year attributable to equity holders of
the Company increased by approximately 250.0% from approximately US$1.0 million
for the year ended 31 December 2016 to approximately US$3.5 million for the year ended
31 December 2017 mainly due to the increases in revenue and gross profit as well as the
– 83 –

absence of professional service fees in respect of the Listing for the year ended 31
December 2017, offset by the increase in selling and distribution expenses, and other
general and administrative expenses as mentioned above.
Without taking into account the professional service fees in respect of Listing
preparation, the profit and total comprehensive income for the year attributable to
equity holders of the Company decreased from approximately US$4.1 million for the
year ended 31 December 2016 to approximately US$3.5 million for the year ended 31
December 2017. Despite the increase in gross profit of approximately US$3.7 million, the
profit and total comprehensive income for the year attributable to equity holders of the
Company (before taking into account the professional service fees in respect of Listing
preparation) decreased by approximately US$0.6 million during the year mainly due to
the increase in selling and distribution expenses by approximately US$2.3 million and the
increase in general and administrative expenses by approximately US$1.7 million. In
particular, the increase in selling and distribution expenses was mainly due to (i) an
increase in employee benefit expenses by approximately 736.2%, or approximately
US$1.5 million, from US$203,296 for the year ended 31 December 2016 to approximately
US$1.7 million for the year ended 31 December 2017 as a result of the increased
headcount in sales team from 3 to 8 during the same period, which in turn was mainly
attributable to the set up of sales office in Canada in 2017 and the increased sales efforts
of the Group; and (ii) an increase in merchant account fees by approximately 89.6%, or
approximately US$0.6 million, from US$685,704 for the year ended 31 December 2016 to
approximately US$1.3 million for the year ended 31 December 2017 resulting from the
increase in the fund raising amount from the Kickstarter projects from approximately
US$5.9 million for the year ended 31 December 2016 to approximately US$12.1 million
for the year ended 31 December 2017. On the other hand, the increase in general and
administrative expenses was mainly due to (i) the increase in games development expenses
by approximately 591.6%, or US$578,227, from US$97,740 for the year ended 31
December 2016 to US$675,967 for the year ended 31 December 2017 primarily due to
more intensive game development work for new games including A Song of Ice & Fire:
Tabletop Miniatures Game, Rising Sun and Zombicide: Green Horde; and (ii) the increase
in other professional fees by approximately 675.7%, or US$557,259, from US$82,477 for
the year ended 31 December 2016 to US$639,736 for the year ended 31 December 2017
primarily due to legal fee incurred for the acquisition of the two properties in Singapore,
fees related to consultants engaged for development of the China market and other
professional services, all of which were for the purpose of business expansion of the
Group.
The profit and total comprehensive income for the year attributable to equity holders of
the Company decreased by approximately 42.9% from approximately US$3.5 million for
the year ended 31 December 2017 to approximately US$2.0 million for the year ended 31
December 2018, which was mainly due to the increase in selling and distribution
expenses, and other general and administrative expenses as well as the recognition of the
professional service fees in respect of the Transfer of Listing as mentioned above.
– 84 –

Without taking into account the professional service fees in respect of the Transfer of
Listing, the profit and total comprehensive income for the year attributable to equity
holders of the Company decreased by approximately 14.3% from approximately US$3.5
million for the year ended 31 December 2017 to approximately US$3.0 million for the
year ended 31 December 2018. Similar to the previous year, despite the increase in gross
profit of US$417,518, the profit and total comprehensive income (excluding the
professional service fees in respect of Transfer of Listing) for the year attributable to
equity holders of the Company decreased by approximately US$0.5 million during the
year ended 31 December 2018 mainly due to the increase in selling and distribution
expenses by approximately US$1.1 million, which in turn was mainly due to (i) an
increase in employee benefit expenses by approximately 35.3%, or approximately US$0.6
million, from approximately US$1.7 million for the year ended 31 December 2017 to
approximately US$2.3 million for the year ended 31 December 2018 mainly resulting
from the increased headcount in the marketing team from 18 as at 31 December 2017 to
27 as at 31 December 2018 because of the increased marketing effort; and (ii) an increase
in royalty expenses by approximately 342.8%, or US$327,569, from US$95,560 for the
year ended 31 December 2017 to US$423,129 for the year ended 31 December 2018
resulting from the recognition of sales of approximately US$4.4 million of a licensed
game namely A Song of Ice & Fire: Tabletop Miniatures Game in 2018; and (iii) an
increase in marketing expenses by approximately 20.4%, or US$141,033, from
US$691,670 for the year ended 31 December 2017 to US$832,703 for the year ended
31 December 2018 resulting from the increased marketing activities.
The loss and total comprehensive loss for the period attributable to equity holders of the
Company increased from US$80,883 for the six months ended 30 June 2018 to
approximately US$1.1 million for the six months ended 30 June 2019, which was
mainly attributable to the increase in selling and distribution expenses and other general
and administrative expenses as well as the recognition of the professional service fees in
respect of the Transfer of Listing as mentioned above.
– 85 –

Without taking into account the professional service fees in respect of the Transfer of
Listing and the one-off loss on investments in insurance contracts of US$272,711
included in other losses for the six months ended 30 June 2019, the Group would record
the profit and total comprehensive profit for the period attributable to equity holders of
the Company of US$178,644 for the six months ended 30 June 2019 as compared to the
profit and total comprehensive income for the period attributable to equity holders of the
Company of US$368,291 for the six months ended 30 June 2018. Despite the increase in
gross profit of approximately US$1.3 million, the profit and total comprehensive income
(excluding the professional service fees in respect of Transfer of Listing and one-off loss
on investments in insurance contracts) for the period attributable to equity holders of the
Company for the six months ended 30 June 2019 decreased by US$189,647 mainly due to
the increase in selling and distribution expenses by US$624,344, the increase in general
and administrative expenses (other than professional service fees in respect of Transfer of
Listing) by US$525,594 and the increase in finance costs by US$228,187. In particular,
the increase in selling and distribution expenses was mainly due to (i) an increase in
royalty expenses from US$45,093 for the six months ended 30 June 2018 to US$287,178
for the six months ended 30 June 2019 resulting from the recognition of sales of A Song of
Ice & Fire: Tabletop Miniatures Game and Cthulhu: Death May Die; (ii) an increase in
marketing and travelling expenses from US$188,821 for the six months ended 30 June
2018 to US$578,769 for the six months ended 30 June 2019 resulting from the increased
marketing activities in Europe and Asia; and (iii) marketing expenses of US$110,072 for
the marketing of Zombicide: Tactics & Shotguns. On the other hand, the increase in
general and administrative expenses (other than professional service fees in respect of
Transfer of Listing) was mainly due to (i) share-based expenses of US$200,949 incurred
for the six months ended 30 June 2019, which were not charged for the six months ended
30 June 2018; and (ii) the increase in games development expenses from US$473,841 for
the six months ended 30 June 2018 to US$604,104 for the six months ended 30 June 2019
resulting from more intensive game development work for new games including
Bloodborne: The Board Game, Trudvang Legends and Zombicide: 2nd Edition.
– 86 –

Net current assets
The following sets out the current assets and liabilities of the Group as at 31 December
2016, 31 December 2017, 31 December 2018 and 30 June 2019 :
As at
31 December
2016
31 December
2017
31 December
2018 30 June 2019
US$ US$ US$ US$
(Unaudited)
Current assets
Inventories 3,660,247 4,423,442 3,567,678 5,045,393
Trade and other receivables 2,192,927 841,526 1,105,242 4,453,360
Prepayments and deposits 1,896,905 2,398,535 4,862,240 5,609,471
Income tax recoverable 32,000 — — —
Pledged deposit — 200,000 200,000 200,000
Cash and cash equivalents 6,612,768 2,850,318 2,849,799 1,549,397
Total current assets 14,394,847 10,713,821 12,584,959 16,857,621
Current liabilities
Trade payables 1,062,005 1,917,091 72,385 1,800
Accruals and other payables 1,173,549 1,774,894 1,088,823 997,921
Borrowings — 134,774 3,864,897 5,661,782
Amount due to ultimate holding company 3 3 3 2
Income tax payable 2,043,195 2,372,464 2,174,295 2,067,285
Deferred revenue/contract liabilities 4,509,222 3,265,709 3,691,363 8,906,316
Lease liability — — — 428,065
Total current liabilities 8,787,974 9,464,935 10,891,766 18,063,171
Net current assets/(liabilities) 5,606,873 1,248,886 1,693,193 (1,205,550)
As at 30 June 2019, the Group recorded net current liabilities of approximately US$1.2
million, which was mainly due to the utilisation of cash and cash equivalents to pay for
the non-current assets, including the investments in insurance contracts.
Inventories
Inventories increased from approximately US$3.7 million as at 31 December 2016 to
approximately US$4.4 million as at 31 December 2017 and decreased to approximately
US$3.6 million as at 31 December 2018. Inventories as at each year end mainly
represented inventories for new games launched in order to fulfil new orders from
wholesalers and inventories for existing games in order to fulfil the restocking orders
from the wholesalers. As at 31 December 2018, the Group’s inventories mainly comprised
the inventories of existing games in order to fulfill the restocking orders from the
wholesalers. The relevant games primarily included Zombicide, Rivet Wars, Wrath of
Kings, Arcadia Quest, The Others: 7 Sins, Potion Explosion, Rum & Bones and The
– 87 –

Grizzled, which together accounted for approximately US$2.2 million worth of
inventories as at 31 December 2018. The Group’s inventories increased to
approximately US$5.0 million as at 30 June 2019, mainly due to (i) increased
inventories for new Kickstarter games to be shipped in the second half of 2019
including the tabletop game of Blood Rage Digital and Project ELITE; and (ii) increased
inventories for existing games in order to fulfil the orders form the wholesalers, which
mainly included A Song of Ice & Fire: Tabletop Miniatures Game and Zombicide: Invader.
The average inventory turnover days (representing the average of the opening and closing
balances of inventories for the relevant year, divided by cost of inventories and multiplied
by 365 days) decreased from approximately 151 days for the year ended 31 December
2016 to approximately 141 days for the year ended 31 December 2017 mainly due to more
stringent inventory control and monitoring during the year. The average inventory
turnover days significantly increased to approximately 192 days for the year ended 31
December 2018 primarily due to (i) the accumulated inventories balance towards the end
of 2017 and 2018 to fulfill the expected orders from wholesalers for the Group’s games in
the first quarter of the respective coming year; and (ii) the lower cost of inventories for
the year ended 31 December 2018 resulting from the more favourable prices in terms of
lower unit costs for certain bulk orders offered by Supplier A. During the six months
ended 30 June 2019, the Group recorded an average inventory turnover days
(representing the average of the opening and closing balances of inventories for the
relevant period, divided by cost of inventories and multiplied by 181 days) of
approximately 178 days for the six months ended 30 June 2019.
Despite that the business of the Group is not subject to material seasonality as a majority
of the Group’s revenue was generated from Kickstarter sales which are more affected by
the shipping schedule than seasonality, it was the management’s decision to accumulate
more inventories towards the end of 2017 and 2018 after taking into account (i) the
expected restocking needs by wholesalers for existing games resulting from the sales of
inventories during the Thanksgiving and Christmas holidays in the fourth quarter; and
(ii) the expected demand from wholesalers for new games launched or first shipped at the
relevant time. Although the management had made reference to orders on hand and
historical sales when deciding the level of accumulated stock, it was more an estimation
and did not necessarily reflect the actual sales for the coming quarter. For the six months
ended 30 June 2018 and 2019, approximately 26.4% and 71.2% of the inventories as at 31
December 2017 and 31 December 2018 was used up, respectively.
As at 31 October 2019, approximately US$3.1 million (79.9%) and US$0.5 million
(10.0%) of the inventories as at 31 December 2018 and 30 June 2019 have been sold or
used up, respectively. Save for the write-down of inventories of US$200,000 for the year
ended 31 December 2018, the Directors confirm that there have not been any material
obsolete or slow-moving stocks during the Reporting Period.
– 88 –

Trade and other receivables
The Group’s trade and other receivables mainly consist of trade receivables due from
wholesalers.
Total trade receivables was approximately US$2.2 million as at 31 December 2016 and
decreased to US$723,840 as at 31 December 2017 as the Group recorded a significant
amount of sales from wholesalers during the last quarter of 2016. The total trade
receivables increased to US$995,242 as at 31 December 2018 due to increased sales to
wholesalers towards the end of 2018. The increase in the total trade receivables to
approximately US$4.3 million as at 30 June 2019 was mainly due to the material amount
of sales to wholesalers recognised near the end of the second quarter of the year.
The average trade receivable turnover days (representing the average of the opening and
closing balances of trade receivables for the relevant year, divided by revenue from sales
to wholesalers and multiplied by 365 days) of the Group was approximately 63 days for
the year ended 31 December 2016 and remained relatively stable at approximately 64
days for the year ended 31 December 2017. The average trade receivable turnover days of
the Group decreased to approximately 27 days for the year ended 31 December 2018
primarily due to the more stringent credit control measures implemented by the Group by
requesting all new wholesalers to settle the bill before product delivery. The average trade
receivable turnover days (representing the average of the opening and closing balances of
trade receivables for the relevant period, divided by revenue from sales to wholesalers
and multiplied by 181 days) of the Group was approximately 44 days for the six months
ended 30 June 2019. The increase in turnover days was mainly due to material amount of
sales to wholesalers recognised near the end of the second quarter of the year, resulting in
large balance of trade receivables as mentioned above.
As at 31 October 2019, approximately US$1.0 million (100.0%) and US$3.3 million
(76.1%) of the trade receivables as at 31 December 2018 and 30 June 2019 have been
settled, respectively.
Prepayments and deposits
Prepayments and deposits are primarily related to prepayments paid to suppliers as well
as prepayments for royalties and game development costs for new games. The increase in
prepayments and deposits from approximately US$1.9 million as at 31 December 2016 to
approximately US$2.4 million as at 31 December 2017 was mainly due to the increased
prepayments to suppliers. Prepayments and deposits further increased to approximately
US$4.9 million as at 31 December 2018 as a result of the further increase in prepayments
to suppliers as well as the increase in prepaid royalties for licensed games and game
development costs for games under development. Prepayments and deposits as at 30 June
2019 was approximately US$5.6 million, the increase of which was mainly due to the
further increase in prepaid royalties for licensed games and game development costs for
games under development.
– 89 –

As at 31 October 2019, approximately US$4.8 million (98.4%) and US$2.0 million
(35.3%) of the prepayments as at 31 December 2018 and 30 June 2019 have been utilised,
respectively.
Trade payables
The Group’s trade payables primarily related to payables to suppliers. Trade payables
increased from approximately US$1.1 million as at 31 December 2016 to approximately
US$1.9 million as at 31 December 2017, which was in line with the increase in the
business scale and operations. The trade payables balance decreased to US$72,385 as at
31 December 2018 as (i) the Group used the trade facilities granted by the bank to settle
the supplier bills; and (ii) part of the supplier bills were settled by the advance to
suppliers. The trade payables balance further decreased to US$1,800 as at 30 June 2019
as the supplier bills during the period were mostly offset by the advance paid.
The average trade payables turnover days (representing the average of the opening and
closing balances of trade payables for the relevant year, divided by cost of inventories
and multiplied by 365 days) of the Group were approximately 41 days, 52 days and 48
days for the three years ended 31 December 2018, respectively. The average trade
payables turnover days increased from approximately 41 days for the year ended 31
December 2016 to approximately 50 days for the two years ended 31 December 2018 was
mainly due to longer average credit terms provided by certain suppliers. The Group
recorded a very minimal average trade payable turnover days (representing the average of
the opening and closing balances of trade payables for the relevant period, divided by
cost of inventories and multiplied by 181 days) of approximately 2 days for the six
months ended 30 June 2019 as the supplier bills during the period were mostly offset by
the advance paid and a minimal amount of trade payable balance was recorded as at 30
June 2019.
As at 31 October 2019, US$72,385 (100.0%) and US$1,800 (100.0%) of the trade
payables as at 31 December 2018 and 30 June 2019 have been settled, respectively.
Accruals and other payables
Accruals and other payables was approximately US$1.2 million as at 31 December 2016
and increased to approximately US$1.8 million as at 31 December 2017, which was
mainly due to the outstanding acquisition consideration payable (the ‘‘IPs Consideration
Payable’’) of approximately US$1.2 million in relation to the IPs of Rising Sun and The
World of SMOG. The balance then decreased to approximately US$1.1 million as at 31
December 2018, which was mainly due to the partial settlement of approximately
US$870,000 of the IPs Consideration Payable. Accruals and other payables remained
relatively stable at approximately US$1.0 million as at 30 June 2019.
– 90 –

Contract liabilities and deferred revenue
Contract liabilities mainly represent amount received from Kickstarter backers and late
subscribers and wholesalers for which the products have not been shipped. The following
table sets out details of the contract liabilities as at 31 December 2016, 31 December
2017, 31 December 2018 and 30 June 2019 :
As at
31 December
2016
31 December
2017
31 December
2018
30 June
2019
US$ US$ US$ US$
(Unaudited)
Games
A Song of Ice & Fire: Tabletop Miniatures
Game — 2,814,189 — —
Blood Rage Digital — — 1,268,130 1,681,648
Bloodborne: The Board Game — — — 4,825,347
Cthulhu: Death May Die — — 371,129 —
HATE — — 260,954 —
Masmorra: Dungeons of Arcadia 235 — — —
Massive Darkness 4,315,472 — — —
Munchkin Dungeon — — — 1,110,410
Project: ELITE — — 988,519 1,002,986
Rum & Bones: Second Tide 10,450 — — —
Starcadia Quest — — 149,846 —
The Others: 7 Sins 19,757 — — —
XenoShyft: Dreadmire 13,706 — — —
Zombicide: Black Plague 149,602 — — —
Zombicide: Invader — — 366,858 —
Subtotal 4,509,222 2,814,189 3,405,436 8,620,391
Advance received from wholesalers — 451,520 80,333 —
Others — — 205,594 285,925
Total 4,509,222 3,265,709 3,691,363 8,906,316
Approximately US$1.1 million of the contract liabilities as at 31 December 2018 had beenrealised as revenue during the six months ended 30 June 2019 while approximatelyUS$3.6 million of the contract liabilities as at 30 June 2019 had been realised as revenueduring the four months ended 31 October 2019.
According to the estimated commencement of delivery date as disclosed in the paragraphheaded ‘‘Business of the Group — Sales channels — Kickstarter’’ in this announcementand the best estimate by the management of the Group, except for contract liabilities inrelation to Blood Rage Digital computer game it is expected that all of the Kickstarterrelated contract liabilities as at 30 June 2019 will be realised as revenue by 31 December2019.
– 91 –

The following sets out the movement of deferred revenue during the Reporting Period:
As at
31 December
2016
31 December
2017
31 December
2018
30 June
2019
US$ US$ US$ US$(Unaudited)
Beginning of the year 4,464,508 4,509,222 3,265,709 3,691,363Amounts received from customers through
Kickstarter 11,620,728 18,775,050 15,749,566 4,478,972Amount received from customers through
other channels — 451,520 80,333 2,674,282Revenue recognised upon delivery of
products (11,220,892) (19,929,816) (15,149,363) (1,938,301)Refunds (160,958) (173,999) — —Forfeiture revenue (194,164) (366,268) (254,882) —
At the end of the year/period 4,509,222 3,265,709 3,691,363 8,906,316
Non-current assets and liabilities
The following sets out the details of the Group’s non-current assets and liabilities as at 31
December 2016, 31 December 2017, 31 December 2018 and 30 June 2019 :
As at
31 December
2016
31 December
2017
31 December
2018
30 June
2019
US$ US$ US$ US$(Unaudited)
Non-current assetsProperty, plant and equipment 3,787,396 11,032,337 12,346,061 12,540,553Investments in insurance contracts — — — 1,167,710Intangible assets 7,576,596 11,472,024 13,128,860 12,974,008Right-of-use asset — — — 1,229,984
11,363,992 22,504,361 25,474,921 27,912,255Non-current liabilitiesBorrowings — 3,271,182 4,408,357 4,081,580Deferred income tax liabilities 265,722 281,297 265,458 257,539Lease liability — — — 822,300
265,722 3,552,479 4,673,815 5,161,419
Property, plant and equipment
The Group’s property, plant and equipment principally comprise office units, ‘‘art,
painting and sculpts’’ as well as ‘‘displays, moulds and tools’’, which has estimated useful
lives of 50 years, three to 10 years and three to five years, respectively.
– 92 –

The Directors determined the estimated useful lives of office units as 50 years with
reference to the tenure and condition of the properties. The Directors applied judgements
on the estimated useful lives after considering the expected usage and related wear and
tear of the office units.
The Directors determined the estimated useful lives of ‘‘art, painting and sculpts’’ as 3 to
10 years and ‘‘displays, moulds and tools’’ as 3 to 5 years with reference to actual useful
lives, including the wear and tear, of assets of similar attributes. The Directors applied
judgements on the estimated useful lives after considering the historical and forecasted
sales and profit margin of the game products produced by these assets, their product life
cycles, industry trends as well as the estimated useful lives of the assets with similar
attributes adopted by other companies in the same industry.
The Group’s property, plant and equipment increased from approximately US$3.8
million as at 31 December 2016 to approximately US$11.0 million as at 31 December
2017, approximately US$12.3 million as at 31 December 2018 and approximately
US$12.5 million as at 30 June 2019 mainly due to the acquisition of two properties in
Singapore in 2017 with aggregate net book value of approximately US$4.4 million as at
30 June 2019 as well as the addition of art, painting and sculpts and displays, moulds and
tools for new games during the years.
The depreciation charge of the Group amounted to US$696,330, approximately US$1.2
million and approximately US$1.8 million for the three years ended 31 December 2018,
respectively. Despite the significant increase in the balance of property, plant and
equipment by approximately 189.5% from US$3.8 million as at 31 December 2016 to
approximately US$11.0 million as at 31 December 2017, the depreciation charge only
increased by approximately 72.3% during the relevant years, as the acquisition of the two
properties with cost of approximately US$2.1 million and US$2.5 million took place in
April 2017 and December 2017, respectively, and therefore not full year depreciation was
charged for the year ended 31 December 2017. Besides, useful life of 50 years is applied
on each of the two properties acquired which reduced the impact of the relevant
depreciation charges. The depreciation charge of the Group amounted to US$842,613
and US$970,296 for the six months ended 30 June 2018 and 2019, respectively.
– 93 –

Intangible assets
The Group’s intangible assets comprise IPs, product development costs and computer
software.
The table below sets out the breakdown of the carrying values of the Group’s IPs by
games as at 31 December 2016, 31 December 2017, 31 December 2018 and 30 June 2019.
As at
31 December
2016
31 December
2017
31 December
2018
30 June
2019
US$ US$ US$ US$
(Unaudited)
Zombicide series 4,229,196 4,510,661 4,466,902 4,281,273
The Others: 7 Sins 895,000 805,500 716,000 671,250
Rising Sun — 897,000 805,000 759,000
Massive Darkness — 767,764 687,649 647,592
The World of SMOG — 498,333 448,333 423,333
Blood Rage 547,914 485,886 423,858 392,844
The Grizzled — 53,153 47,558 44,760
Dark Age 39,289 35,560 31,431 29,466
Council of Four — 31,996 28,598 26,899
Others 83,018 72,600 61,405 56,957
Total 5,794,417 8,158,453 7,716,734 7,333,374
The IPs of Blood Rage, Council of Four, Rising Sun, The Grizzled, The Others: 7 Sins,
Massive Darkness and The World of SMOG were recognised during the Reporting Period
at historical costs.
IPs and licences have finite useful lives and are carried at cost less accumulated
amortisation and impairment losses, if any. Amortisation is calculated using the straight-
line method to allocate the cost of IPs and licences over the estimated useful lives, which
are determined after considering the (i) industry trends of similar game products
produced under these IPs; (ii) the business plans on how to utilise the IPs (including the
product life cycles, the feasibility to develop further series of products under the IPs and
the possibility to launch products using different entertainment platforms); (iii) the
historical and forecasted sales and profit margins of the game products produced under
the IPs; and (iv) the estimated useful lives of the IPs adopted by other companies in the
same industry and with similar attributes. A very substantial portion of the carrying
amounts of the Group’s IPs is attributable to Zombicide series. The Directors considered
the estimated useful life of the IP of Zombicide to be 20 years as the launching of various
seasons of Zombicide had received overwhelming response from the market which
demonstrated an increasing trend of the popularity of Zombicide. The Directors expected
that the IP would enable the Group to continue to introduce future seasons of games
under this theme. The Group has invested significantly on arts, painting, sculpts,
displays, moulds and tools on Zombicide. The subsequent sales of Zombicide products
– 94 –

under different seasons amounted to approximately US$4.5 million, US$10.4 million and
US$8.9 million and US$3.4 million for the three years ended 31 December 2018 and the
six months ended 30 June 2019, respectively, which have proven the continual success of
this IP. The Group will continue to invest in this IP and believes that such continual
investments will further enhance the popularity of this IP and thus its useful life. For the
subsequent addition to the IP of Zombicide due to the launch of sequel products, a more
conservative approach has been adopted by the Group by estimating a shorter useful life
of 10 years after taking into account that Zombicide was first launched in 2012 and it may
not be prudent enough to assume the expiry of the useful life of its sequel products to be
later than the original IPs that the sequel products are based on.
When estimating the useful lives of the IP of Zombicide, the Directors also made
reference to the life cycles of other games in the market with similar attributes as follows:
Game Launch date
Number of years since the
launch date up to 2013
Magic the Gathering 1993 20
Settlers of Catan 1995 18
During the Reporting Period, sales of the above two games have been popular in the
market. The useful life of each of Blood Rage, Council of Four, Massive Darkness, Rising
Sun, The Grizzled, The Others: 7 Sins and The World of SMOG was estimated by the
Directors as 10 years. Although the theme and genres of the above-mentioned IPs are
similar to Zombicide, these games are less popular as reflected in the number of
Kickstarter backers and sales volume in the past. Compared with Zombicide series which
generated revenue of approximately US$27.2 million during the Reporting Period, the
above-mentioned IPs generated less revenue. For instance, Blood Rage, Massive
Darkness, Rising Sun, and The Others: 7 Sins generated approximately US$3.1 million,
US$5.7 million, US$7.9 million, US$3.8 million of revenue during the Reporting Period.
After taking into account these factors but with an expectation that possible future
sequels under those themes would extend the popularity of the whole series, a shorter
useful life of 10 years is estimated.
The Group’s intangible assets was approximately US$7.6 million as at 31 December 2016
and increased to approximately US$11.5 million as at 31 December 2017, mainly due to
the recognition of the IPs of Council of Four, Rising Sun, The Grizzled, Massive Darkness,
The World of SMOG and Zombicide series during the year ended 31 December 2017 as
well as the capitalisation of expenditures incurred for Zombicide: Green Horde. The
balance further increased to approximately US$13.1 million as at 31 December 2018
mainly due to (i) the purchase of software in relation to the expected implementation of
the enterprise resources planning (ERP) system in the near future; (ii) the capitalisation
of expenditures incurred for games including Cthulhu: Death May Die and Zombicide:
Invader; and (iii) the recognition of the IPs of Zombicide series. The balance decreased to
– 95 –

approximately US$13.0 million as at 30 June 2019 mainly due to the combined effect of
the amortization charged and the capitalization of expenditures incurred for games
during the six months ended 30 June 2019.
The amortisation charge of the Group amounted to US$566,860, US$924,702 andapproximately US$1.6 million for the three years ended 31 December 2018, respectively,the increase of which was generally in line with the addition to the intangible assetsduring the relevant years. The amortization charge of the Group amounted toUS$839,010 and US$994,283 for the six months ended 30 June 2018 and 2019,respectively.
Deferred income tax liabilities
Deferred income tax assets and liabilities are offset when there is a legally enforceableright to offset current income tax assets against current income tax liabilities and whenthe deferred income taxes relate to the same fiscal authority. After appropriate offsetting,the Group recorded deferred income tax liabilities of US$265,722, US$281,297,US$265,458 and US$257,539 as at 31 December 2016, 31 December 2017, 31December 2018 and 30 June 2019, respectively.
Right-of-use assets and lease liabilities
The Group has changed its accounting policies following the adoption of IFRS 16 on 1January 2019. The Group leases office under non-cancellable operating leases expiringwithin 5 years. The lease agreements do not impose any covenants, but leased assets maynot be used as security for borrowing purposes. A leases is recognised as a right-of-useasset and a corresponding liability at the date at which the leased asset is available for useby the Group. Each lease payment is allocated between the liability and finance cost. Thefinance cost is charged to profit or loss over the lease period so as to produce a constantperiodic rate of interest on the remaining balance of the liability for each period. Theright-of-use asset is depreciated over the shorter of the asset’s useful life and the leaseterm on a straight-line basis.
As a result of the adoption of IFRS 16 on 1 January 2019, the Group recorded right-of-use assets of approximately US$1.2 million, current portion of lease liabilities ofUS$428,065 and non-current portion of lease liabilities of US$822,300 as at 30 June 2019.Save as the above, the adoption of IFRS 16 has no significant impact on the financialposition and performance of the Group.
Liquidity and financial resources
The Group did not have any bank borrowings during the year ended 31 December 2016and financed the operations primarily through cash generated from internally generatedfunds, pre-Listing investment funds as well as the net proceeds received from the Placing.During the two years ended 31 December 2018, the Group financed the operationsprimarily through cash generated from internally generated funds, the net proceedsreceived from the Placing and bank borrowings.
– 96 –

As at 31 December 2016, 31 December 2017, 31 December 2018 and 30 June 2019, theGroup had cash and cash equivalents of approximately US$6.6 million, US$2.9 million,US$2.8 million and US$1.5 million, respectively, which were cash at banks and on hand,denominated in United States dollars, Canadian dollars, Singapore dollars, Hong Kongdollars and Euro.
The decrease in cash and cash equivalent from approximately US$2.8 million as at 31December 2018 to approximately US$1.5 million as at 30 June 2019 was mainly due tothe payment for addition of intangible assets and property, plants and equipment and theinvestments in insurance contracts.
As at 31 December 2016, there were no short-term and long-term bank borrowings of theGroup. As at 31 December 2017, 31 December 2018 and 30 June 2019, the balance ofshort-term bank borrowings increased to US$134,774, approximately US$3.9 million andapproximately US$5.7 million, respectively, while the balance of long-term bankborrowings increased to approximately US$3.3 million, approximately US$4.4 millionand approximately US$4.1 million, respectively. The increase in bank borrowings as at31 December 2017 was due to the application of the proceeds of the bank borrowings bythe Group to finance the acquisition of two properties in Singapore during the year ended31 December 2017. The further increase in bank borrowings as at 31 December 2018 and30 June 2019 was mainly due to the application of short term facilities to finance theadvance to suppliers, trade payables due to suppliers and operating expenses. Inparticular, advance to suppliers increased from approximately US$1.2 million as at 31December 2017 to approximately US$3.7 million as at 31 December 2018 andapproximately US$3.5 million as at 30 June 2019. For details of the increase inadvance to suppliers, please refer to the paragraph headed ‘‘Business of the Group —Production’’ in this announcement. The bank borrowings as at 31 December 2017, 31December 2018 and 30 June 2019 were secured by the properties acquired, a corporateguarantee from the Company and a charge over all fixed deposits placed with the relevantbank. The bank borrowings as at 30 June 2019 were further secured by the investments ininsurance contracts. As at 30 June 2019, the Group’s total bank borrowings ofapproximately US$9.7 million consisted of (i) approximately US$3.4 million which weredenominated in Singapore dollars, with a tenor of 20 years and interests charged at fixedrates from drawdown date till the end of the second year from the respective dates of thebanking facility letters and at floating rates for subsequent years; and (ii) approximatelyUS$6.3 million which were denominated in United States dollars, with a tenor of 120days to 4 years and interests charged at floating rates. As at 31 December 2017, 31December 2018 and 30 June 2019, the Group’s borrowings were repayable as follows:
– 97 –

As at
31 December
2017
31 December
2018
30 June
2019
US$ US$ US$(Unaudited)
Within 1 year 134,774 3,864,897 5,661,782Between 1 and 2 years 116,312 579,200 650,015Between 2 and 5 years 252,191 1,017,223 924,716Over 5 years 2,902,679 2,811,934 2,506,849
Total 3,405,956 8,273,254 9,743,362
The Group intends to continue to use external bank borrowings and internally generated
funds to fund the working capital, game development activities, acquisition of IPs as well
as the expansion plans as stated in the Prospectus.
Summary of consolidated statements of cashflows
The following table sets forth the consolidated statements of cashflows for the three years
ended 31 December 2018 and the six months ended 30 June 2018 and 2019.
For the year ended
31 December
Six months ended
30 June
2016 2017 2018 2018 2019
US$ US$ US$ US$ US$
(Unaudited) (Unaudited)
Net cash generated from operating
activities before changes in
working capital 3,140,968 6,628,333 6,284,637 1,755,634 1,957,494
Net cash generated from operating
activities 1,826,365 5,064,083 2,288,927 686,534 1,157,483
Net cash used in investing activities (4,825,899) (11,995,874) (6,905,769) (3,265,630) (3,444,140)
Net cash generated from financing
activities 6,983,335 3,170,335 4,637,648 1,468,481 988,604
Net cash generated from operating activities before changes in working capital
The Group’s net cash generated from operating activities before changes in working
capital increased from approximately US$3.1 million for the year ended 31 December
2016 to approximately US$6.6 million for the year ended 31 December 2017 mainly due
to the increase in profit before income tax from approximately US$1.9 million for the
year ended 31 December 2016 to approximately US$4.3 million for the year ended 31
December 2017.
– 98 –

The Group’s net cash generated from operating activities before changes in working
capital decreased from approximately US$6.6 million for the year ended 31 December
2017 to approximately US$6.3 million for the year ended 31 December 2018, which was
mainly due to the decrease in profit before income tax during the year.
The Group’s net cash generated from operating activities before changes in working
capital remained fairly stable at approximately US$1.8 million and US$2.0 million for
the six months ended 30 June 2018 and 2019, respectively.
Net cash generated from operating activities
For the year ended 31 December 2016, the Group recorded net cash inflow from
operating activities of approximately US$1.8 million, which mainly comprised profit
before income tax of approximately US$1.9 million, adjusted by add-back of non-cash
items relating to depreciation as to US$696,330 and amortisation as to US$566,860 and
adjusted by changes in working capital attributable to the combined effect of an increase
in trade payables of US$516,946, an increase in accruals and other payables of
US$584,028 and a decrease in amount due from a related company of US$266,459, offset
by an increase in trade and other receivables by approximately US$1.4 million, an
increase in inventories of approximately US$1.4 million and income tax paid of
US$100,010.
For the year ended 31 December 2017, the Group recorded net cash inflow from
operating activities of approximately US$5.1 million, which mainly comprised profit
before income tax of approximately US$4.3 million, adjusted by add-back of non-cash
items relating to depreciation as to approximately US$1.2 million, amortisation as to
US$924,702, provision for doubtful debt of US$34,597, bad debt written off of
US$31,949, inventory written off of US$102,732 and interest expenses of US$35,621
and adjusted by changes in working capital attributable to the combined effect of an
increase in trade payables of US$855,086, a decrease in trade and other receivables of
approximately US$1.3 million, offset by an increase in inventories by US$865,927,
increase in prepayments and deposits of US$501,630, a decrease in accruals and other
payables of US$618,655 and decrease in deferred revenue of approximately US$1.2
million and income tax paid of US$474,466.
For the year ended 31 December 2018, the Group recorded net cash inflow from
operating activities of approximately US$2.3 million, which mainly comprised profit
before income tax of approximately US$2.3 million adjusted by add-back of non-cash
items relating to depreciation as to approximately US$1.8 million, amortisation as to
approximately US$1.6 million, write-down of inventories of US$200,000 and interest
expenses of US$229,650 and adjusted by changes in working capital attributable to the
combined effect of an increase in contract liabilities of approximately US$425,654 and
decrease in inventories of US$655,764 and, offset by the increase in trade and other
receivables by US$289,048, the increase in prepayments and deposits of approximately
US$2.4 million and the decrease in trade payables by approximately US$1.8 million and
income tax paid in the amount of US$472,693.
– 99 –

For the six months ended 30 June 2019, the Group recorded net cash inflow from
operating activities of approximately US$1.2 million, which mainly comprised loss before
income tax of approximately US$1.1 million adjusted by add-back of non-cash items
relating to depreciation as to approximately US$1.2 million, amortization as to
approximately US$1.0 million, interest expenses of US$270,225, loss on investments in
insurance contracts of US$272,211 and share-based expenses of US$200,949 and adjusted
by changes in working capital attributable to the combined effect of an increase in
contract liabilities of approximately US$5.2 million and, offset by the increase in trade
and other receivables of approximately US$3.3 million, the increase in inventories of
approximately US$1.5 million and the increase in prepayments and deposits of
US$747,231 and income tax paid in the amount of US$180,491.
Net cash used in investing activities
The Group’s net cash used in investing activities increased from approximately US$4.8
million for the year ended 31 December 2016 to approximately US$12.0 million for the
year ended 31 December 2017 mainly due to the acquisition of the two properties in
Singapore with total consideration of approximately US$4.6 million, addition of art,
painting and sculpts and displays, moulds and tools for new games with total amount of
approximately US$2.8 million and the acquisition or payment of outstanding
consideration of various IPs with total consideration of approximately US$3.6 million.
The Group’s net cash used in investing activities decreased from approximately US$12.0
million for the year ended 31 December 2017 to approximately US$6.9 million for the
year ended 31 December 2018 mainly due to the decrease in purchase of property, plant
and equipment by approximately US$5.3 million during the year.
The Group’s net cash used in investing activities remained fairly stable at approximately
US$3.3 million and US$3.4 million for the six months ended 30 June 2018 and 2019,
respectively.
Net cash generated from financing activities
The Group’s net cash generated from financing activities decreased from approximately
US$7.0 million for the year ended 31 December 2016 to approximately US$3.2 million
for the year ended 31 December 2017. The higher net cash generated from financing
activities for the year ended 31 December 2016 was mainly due to the receipt of the
proceeds from the Placing during the year.
The Group’s net cash generated from financing activities increased from approximately
US$3.2 million for the year ended 31 December 2017 to approximately US$4.6 million
for the year ended 31 December 2018, which was mainly due to the drawdown of bank
borrowings to finance the operation in 2018.
– 100 –

The Group’s net cash generated from financing activities remained fairly stable atapproximately US$1.5 million and US$1.0 million for the six months ended 30 June 2018and 2019, respectively.
Working capital
The Directors are of the opinion that, and the Joint Sponsors concur, after taking intoaccount the financial resources presently available to the Group, including internallygenerated funds, the remaining proceeds from the Placing and the available bankingfacilities, the Group has sufficient working capital for its present working capitalrequirements for at least the next 12 months from the date of this announcement.
MATERIAL ACQUISITIONS AND DISPOSALS SINCE LISTING
Save as (i) the acquisitions of the properties as the Group’s headquarters and global headoffice as well as its retail shop, show room and play test centre in 2017 with totalconsideration of approximately S$5.9 million (representing approximately 7.6% of thetotal assets of the Group as at 30 June 2019), details of which were disclosed in theCompany’s announcements dated 3 April 2017 and 6 October 2017; and (ii) theacquisition of IPs with total cost of US$4.7 million (representing approximately 10.5% ofthe total assets of the Group as at 30 June 2019) as disclosed in this announcement, bothof which are considered to be material by the Directors taking into account thetransaction amount and/or importance to the Group’s business, the Group had nomaterial acquisition or disposal since the Listing and up to the date of thisannouncement.
NO MATERIAL ADVERSE CHANGE AND RECENT DEVELOPMENT
To the best of the knowledge, information and belief of the Directors after taking intoconsideration of the Ipsos Report, the Directors are of the view that the tabletop gameindustry in the USA and the EU has remained relatively stable since 31 December 2018.The Board intends to continue to grow the Group’s game portfolio, launch the Group’sgames on Kickstarter and rely on both Kickstarter and wholesalers to sell games. Since 1January 2019 and up to the date of this announcement, the Group has launched fourKickstarter games, namely Bloodborne: The Board Game, Munchkin Dungeon, TrudvangLegends and Zombicide: 2nd Edition, with total fund raising size of approximatelyUS$9.6 million.
As at 30 June 2019, the Group had contract liabilities of approximately US$8.9 million,of which approximately US$3.6 million has been realized as revenue during the fourmonths ended 31 October 2019 primarily due to the shipment of the Kickstarter projectsof Blood Rage Digital tabletop game, Munchkin Dungeon and Project: ELITE, during theperiod. Since 1 July 2019 to the date of this announcement, the Group launched TrudvangLegends and Zombicide: 2nd Edition on Kickstarter with fund raising size ofapproximately US$1.5 million and US$3.4 million, respectively. According to theKickstarter website, it is excepted that the shipment of both games will take place in thesecond half of 2020. Besides, in September 2019, the Group launched a campaign calledCMON Time Machine to market certain of its existing games, the shipment of which is
– 101 –

expected to take place before end of 2019 according to the Kickstarter website. As at thedate of this announcement, in addition to Trudvang Legends and Zombicide: 2nd Editionas mentioned above, the Group had two more outstanding Kickstarter games pending forshipment, namely Blood Rage Digital computer game and Bloodborne: The Board Game.According to the Kickstarter website, it is expected that the shipment of both games willtake place before the first half of 2020. Once the shipment takes place, the relevantcontract liabilities of the five Kickstarter projects (including Blood Rage Digitalcomputer game, Bloodborne: The Board Game, CMON Time Machine, TrudvangLegends and Zombicide: 2nd Edition) amounted to approximately US$11.6 million as at31 October 2019 will be realised as revenue of the Group.
The Group has also successfully launched Zombicide: Tactics & Shotguns in April 2019.Zombicide: Tactics & Shotguns is a mobile game developed based on the Group’s populartitle Zombicide. It is expected that the launch of Zombicide: Tactics & Shotguns will helpto boost the sales of the Zombicide series and at the same time increase the players’loyalty to this popular series. For details of the games launched by the Group during theperiod from 1 January 2016 to the date of this announcement, please refer to theparagraph headed ‘‘Business of the Group — Games’’ in this announcement.
For the year ended 31 December 2018 and the six months ended 30 June 2019, the Groupincurred professional fees in relation to the Transfer of Listing of US$949,756 andapproximately US$1.1 million, respectively. It is expected that additional approximatelyUS$0.8 million of professional fees will be charged for the six months ending 31December 2019. The professional fees in relation to the Transfer of Listing is expected toaffect the financial performance of the Group for the year ending 31 December 2019.Save as disclosed in the interim results announcement for the six months ended 30 June2019 and in this announcement, the Directors confirm that subsequent to 31 December2018, being the date to which the latest published and audited consolidated financialinformation of the Group were made up, and up to the date of this announcement, therehas been no material adverse change in the financial or trading position or prospects ofthe Group.
MANAGEMENT OF THE COMPANY SINCE LISTING
There has been no change in the members of the Board and the Board committees of theCompany since Listing and up to the date of this announcement.
In June 2018, Mr. Jules Vautour resigned as the chief operating officer and sales directorof the Group and Ms. Roumpini Nikolopaolou resigned as the marketing director of theGroup in order to pursue their personal commitments. Their jobs and duties have beentaken up by other senior management and staff who have relevant experiences. Each ofMr. Jules Vautour and Ms. Roumpini Nikolopaolou has confirmed that he/she has nodisagreement with the Board and there is no matter relating to his/her resignation thatneeds to be brought to the attention of the Shareholders and/or the Stock Exchange. Mr.David Preti, our former creative director, was appointed in December 2018 as the chiefoperating officer to fill the vacancy after the resignation of Mr. Jules Vautour. Save asthe above, since Listing and up to the date of this announcement, there has been nochange in the senior management of the Company.
– 102 –

BIOGRAPHICAL INFORMATION OF DIRECTORS AND SENIOR MANAGEMENT
Set out below is the biological information of each Director and senior managementmember of the Company:
Executive Directors
Mr. Ng Chern Ann (黃成安), aged 45, has been appointed as an executive Director,chairman and chief executive officer of the Company since 2 December 2016. Mr. Ng isprimarily responsible for developing ideas for new games, corporate strategic planningand overall business development of the Group. Mr. Ng also oversees sales, marketingand logistic for the Group’s global operations.
Prior to founding the Group in September 2009, Mr. Ng co-founded Razer (Asia Pacific)Pte. Ltd. (‘‘Razer’’), a company engaged in the business of designing and manufacturinggaming peripherals, including mice, keyboards and laptops, in December 2003. FromApril 2005 to August 2006, Mr. Ng was the chief executive officer of Razer, where he wasresponsible for commencing its business operations. From September 2006 to May 2008,Mr. Ng was the chief technology officer of Razer, where he was responsible for sourcingfor new technology, managing technical abilities, conceptualising new products andcreating various inventions which were patented. Mr. Ng left Razer in May 2008 andsince then, Mr. Ng has mainly devoted his time and resources in setting up, developingand overseeing the business of the Group.
Mr. Ng graduated from the University of Birmingham, UK with a Bachelor of Lawsdegree in July 2001, and was admitted to be an advocate and solicitor of the SupremeCourt in Singapore in May 2003.
Mr. Ng was a director of the following companies which were incorporated in Singapore
and were struck off voluntarily, and the owner of the following sole proprietorship
registered in Singapore which was terminated. It is confirmed by Mr. Ng that the
following companies and sole-proprietorship were struck off or terminated for the
reasons below which were not due to his wrongful act and these companies and sole-
proprietorship were solvent immediately prior to their struck-off or termination. The
relevant details are as follows:
Name of
company/business Relevant date Nature of business Reasons
Visual Link
Services Pte Ltd
6 June 2009
(struck off)
Management consultant
for computing and
related services
Ceased to carry on
business and struck
off voluntarily
5 Houses Pte. Ltd. 6 September 2013
(struck off)
Art and graphic design
services
Ceased to carry on
business and struck
off voluntarily
Visual Link
Services
6 April 1998 (sole
proprietorship
terminated)
Software development
and programming
activities
Ceased to carry on
business and struck
off voluntarily
– 103 –

Mr. Ng entered into a service agreement with the Company for an initial term of three
years commencing from 2 December 2016 until terminated by either party by giving not
less than three months’ notice in writing to the other, and subject to the relevant
provisions of retirement and re-election at annual general meetings of the Company in
accordance with the Articles of Association. Mr. Ng is currently entitled to a monthly
director’s fee of US$16,667 and is also entitled to a discretionary bonus to be determined
by the Board. The remuneration of Mr. Ng was determined on the basis of his
performance, responsibilities and commitment and the basis of salaries paid by
comparable companies and tenure.
As at the date of this announcement, pursuant to the Acting-in-Concert Arrangement,
Mr. Ng has an interest in 901,248,078 Shares and underlying Shares (within the meaning
of Part XV of the SFO), representing approximately 49.90% of the issued share capital of
the Company.
Saved as disclosed above, as at the date of this announcement, (i) Mr. Ng does not hold
any other position in the Group; (ii) Mr. Ng did not hold any directorship in any other
listed companies in Hong Kong or overseas in the last three years; (iii) save as the acting-
in-concert relationship with Mr. Doust under the Acting-in-Concert Arrangement, Mr.
Ng has no relationship with any Director, senior management, substantial shareholders
or controlling shareholders of the Company; (iv) Mr. Ng does not have any other interest
or short position in the Shares, underlying Shares or debentures within the meaning of
Part XV of the SFO; and (v) there is no other information relating to Mr. Ng that is
required to be disclosed pursuant to Rule 13.51(2)(h) to (v) of the Main Board Listing
Rules.
Mr. David Doust (建邦), aged 55, has been appointed as an executive Director since
December 2016. Mr. Doust is also the head of Asia of the Group. Mr. Doust oversees
sales, marketing and logistics for the Group’s Asia operations. Mr. Doust is a serial
entrepreneur as he was a director of Fishworld Aquariums, Inc. from 1988 to 1992; a
director of Doust Corporation from 1988 to 1994; and a director of Atlantis Pets, Inc.
from 1991 to 1993. Mr. Doust also has over 10 years of experience in the gaming
industry. He registered and operated the website www.coolminiornot.com in 2001. He
also founded and served as an officer of Dark Age Games, Inc. in 2002 and published a
miniature war game, Dark Age, in the same year. In 2009, he became a shareholder of
CoolMiniOrNot Inc. and worked as a distributor and publisher of tabletop games.
Mr. Doust graduated from the University of Miami, USA, with a Bachelor in Business
Administration degree in May 1987.
Mr. Doust filed a voluntary bankruptcy petition under chapter 7 of the US Bankruptcy
Code in the United States Bankruptcy Court — Southern District of Florida in May
1996. The relevant debts were discharged in September 1996 and the case was closed.
– 104 –

Mr. Doust was a director of the following corporations incorporated in the USA which
had been administratively dissolved. It is confirmed by Mr. Doust that the following
corporations were administratively dissolved for the reasons below which were not due to
his wrongful act and these corporations were solvent immediately prior to their
dissolution. The relevant details are as follows:
Name of company/
business Relevant date Nature of business Reasons
Dark Age Games,
Inc.
4 September 2010 Sales, research and
development of games
Administratively
dissolved for failure
to file annual
registration
War Zone, Inc 9 November 2002 Marketing games from
retail stores
Administratively
dissolved as it
ceased to do
business
Doust
Corporation
26 August 1994 No business commenced Administratively
dissolved as annual
report was not filed
Atlantis Pets, Inc 13 August 1993 No business commenced Administratively
dissolved as annual
report was not filed
Fishworld
Aquariums, Inc
9 October 1992 Aquarium and aquatic
pets
Administratively
dissolved as annual
report was not filed
Mr. Doust entered into a service agreement with the Company for an initial term of three
years commencing from 2 December 2016 until terminated by either party by giving not
less than three months’ notice in writing to the other, and subject to the relevant
provisions of retirement and re-election at annual general meetings of the Company in
accordance with the Articles of Association. Mr. Doust is currently entitled to a monthly
director’s fee of US$16,667 and is also entitled to a discretionary bonus to be determined
by the Board. The remuneration of Mr. Doust was determined on the basis of his
performance, responsibilities and commitment and the basis of salaries paid by
comparable companies and tenure.
As at the date of this announcement, pursuant to the Acting-in-Concert Arrangement,
Mr. Doust has an interest in 901,248,078 Shares and underlying Shares (within the
meaning of Part XV of the SFO), representing approximately 49.90% of the issued share
capital of the Company.
– 105 –

Saved as disclosed above, as at the date of this announcement, (i) Mr. Doust does not
hold any other position in the Group; (ii) Mr. Doust did not hold any directorship in any
other listed companies in Hong Kong or overseas in the last three years; (iii) save as the
acting-in-concert relationship with Mr. Ng under the Acting-in-Concert Arrangement,
Mr. Doust has no relationship with any Director, senior management, substantial
shareholders or controlling shareholders of the Company; (iv) Mr. Doust does not have
any other interest or short position in the Shares, underlying Shares or debentures within
the meaning of Part XV of the SFO; and (v) there is no other information relating to Mr.
Doust that is required to be disclosed pursuant to Rule 13.51(2)(h) to (v) of the Main
Board Listing Rules.
Mr. Koh Zheng Kai (許政開), aged 40, has been appointed as an executive Director,
financial controller and one of the joint company secretaries of the Company since 2
December 2016. Mr. Koh has over 10 years of experience in accounting and finance. Mr.
Koh joined the Group in October 2014 and is primarily responsible for the accounting
and tax management of the Group. Prior to joining the Group, Mr. Koh has held various
positions in areas relating to accounting, finance and company secretarial work. He
worked as an audit graduate assistant and associate at KPMG in Singapore from 2004 to
2005, and as an assurance staff at Ernst & Young in Houston, USA from 2005 to 2006.
Thereafter, he joined KPMG LLP in New York, USA as an audit associate from 2006 to
2008. From 2008 to 2010 he worked as a financial analyst at Investment Technology
Group Inc., an independent execution broker and research provider. From 2011 to 2014,
Mr. Koh worked in Opes Services Pte. Ltd., a company based in Singapore founded by
Mr. Koh, which provides tax, accounting and secretarial services.
In June 2004, Mr. Koh completed all the required examinations of the Association of
Chartered Certified Accountants. He has been admitted as a member of the Institute of
Singapore Chartered Accountants (formerly known as Institute of Certified Public
Accountants of Singapore) since September 2011. Mr. Koh graduated with a Bachelor
degree in Science in Applied Accounting from Oxford Brookes University in association
with the Association of Chartered Certified Accountants in January 2007 through
distance learning.
– 106 –

Mr. Koh was a director of the following companies which were incorporated in
Singapore and Hong Kong and were struck off voluntarily, and a partner of the
following partnership registered in Singapore which was cancelled. It is confirmed by Mr.
Koh that the following companies and partnership were struck off or cancelled for the
reasons below which were not due to his wrongful act and these companies and
partnership were solvent immediately prior to their struck-off or cancellation. The
relevant details are as follows:
Name of company/
business Relevant date Nature of business Reasons
Geofield Energy’s
Pte. Ltd.
10 July 2014
(struck off)
Petroleum, mining and
prospecting services
Ceased to carry on
business and struck
off voluntarily
TKL Ventures 3 May 2012
(partnership
cancelled)
Mail order and internet
retail sales
Ceased to carry on
business and
cancelled
voluntarily
Profitland Pte.
Ltd.
13 October 2015
(struck off)
Investment holding and
wholesale trade
Ceased to carry on
business and struck
off voluntarily
Zenith Global
Technologies
Pte. Ltd.
4 July 2017
(struck off)
Investment holding and
general wholesale
trade
Ceased to carry on
business and struck
off voluntarily
Richester Pte.
Ltd.
4 December 2017
(struck off)
Investment holding Ceased to carry on
business and struck
off voluntarily
Vas Technologies
Pte. Ltd.
5 April 2018
(struck off)
Other information
technology and
computer service
activities and general
wholesale trade
Ceased to carry on
business and struck
off voluntarily
Giant Profit
International
Limited
5 July 2019
(struck off)
Investment holding Ceased to carry on
business and struck
off voluntarily
Mr. Koh entered into a service agreement with the Company for an initial term of three
years commencing from 2 December 2016 until terminated by either party by giving not
less than three months’ notice in writing to the other, and subject to the relevant
provisions of retirement and re-election at annual general meetings of the Company in
accordance with the Articles of Association. Mr. Koh is currently entitled to a monthly
director’s fee of S$16,000 and is also entitled to a discretionary bonus to be determined
by the Board. The remuneration of Mr. Koh was determined on the basis of his
performance, responsibilities and commitment and the basis of salaries paid by
comparable companies and tenure.
– 107 –

As at the date of this announcement, Mr. Koh has an interest in 5,800,000 underlying
Shares (within the meaning of Part XV of the SFO), representing approximately 0.32% of
the issued share capital of the Company.
Saved as disclosed above, as at the date of this announcement, (i) Mr. Koh does not hold
any other position in the Group; (ii) Mr. Koh did not hold any directorship in any other
listed companies in Hong Kong or overseas in the last three years; (iii) Mr. Koh has no
relationship with any Director, senior management, substantial shareholders or
controlling shareholders of the Company; (iv) Mr. Koh does not have any other
interest or short position in the Shares, underlying Shares or debentures within the
meaning of Part XV of the SFO; and (v) there is no other information relating to Mr.
Koh that is required to be disclosed pursuant to Rule 13.51(2)(h) to (v) of the Main
Board Listing Rules.
Non-executive Director
Mr. Frederick Chua Oon Kian (formerly known as ‘‘Chua Oon Kian’’) (蔡穩健), aged 54,
has been appointed as a non-executive Director since 2 December 2016. Mr. Chua is the
director and chief executive officer of Quantum Asset Management Pte. Ltd., a company
providing fund management services to high net worth individuals and institutional
investors since March 2004. He has also participated in various pre-IPO investments in
companies that were successfully listed on both the Stock Exchange and the Singapore
Exchange Securities Trading Limited.
Mr. Chua graduated from Indiana University, USA, with a Bachelor of Arts degree in
December 1990.
Mr. Chua was a director of the following companies which were incorporated in
Singapore and were struck off voluntarily. It is confirmed by Mr. Chua that the following
companies were struck off for the reasons below which were not due to his wrongful act
and these companies were solvent immediately prior to their struck-off. The relevant
details are as follows:
Name of company/
business Relevant date Nature of business Reasons
China Chemical
Holdings Pte.
Ltd.
6 December 2006
(struck off)
Investment holding
company
Ceased to carry on
business and struck
off voluntarily
Quantum GIP
Fund Pte. Ltd.
6 September 2013
(struck off)
Investment holding
company
Ceased to carry on
business and struck
off voluntarily
Mr. Chua entered into a letter of appointment with the Company for an initial term of
three years commencing from 2 December 2016 until terminated by either party by giving
not less than three months’ notice in writing to the other, and subject to the relevant
– 108 –

provisions of retirement and re-election at annual general meetings of the Company in
accordance with the Articles of Association. Mr. Chua is currently entitled to a monthly
director’s fee of US$3,000, which was determined on the basis of his performance,
responsibilities and commitment and the basis of salaries paid by comparable companies
and tenure.
As at the date of this announcement, Mr. Chua has an interest in 328,249,232 Shares and
underlying Shares (within the meaning of Part XV of the SFO), representing
approximately 18.18% of the issued share capital of the Company.
Saved as disclosed above, as at the date of this announcement, (i) Mr. Chua does not hold
any other position in the Group; (ii) Mr. Chua did not hold any directorship in any other
listed companies in Hong Kong or overseas in the last three years; (iii) Mr. Chua has no
relationship with any Director, senior management, substantial shareholders or
controlling shareholders of the Company; (iv) Mr. Chua does not have any other
interest or short position in the Shares, underlying Shares or debentures within the
meaning of Part XV of the SFO; and (v) there is no other information relating to Mr.
Chua that is required to be disclosed pursuant to Rule 13.51(2)(h) to (v) of the Main
Board Listing Rules.
Independent non-executive Directors
Mr. Chong Pheng (鍾平), aged 53, has been appointed as an independent non-executive
Director, the chairman of the remuneration committee and a member of each of the audit
committee and the nomination committee of the Company since 2 December 2016. He
has been an independent director of CDW Holding Limited (SP: BXE), a company listed
on the Singapore Exchange Limited, since May 2011. He has been a director of Zhong
Xing Venture (Pte) Ltd. since 2007, the owner and a director of Blue Forest Echo Pte.
Ltd. since 2009 and a director of Share Taxi Pte. Ltd. since 2015. From 2011 to 2014, he
was director of sales and vice president of Microlight Sensors Pte Ltd. He was also a
director of Eurock Limited from 2007 to 2011.
Mr. Chong completed the regular course and obtained his academic accomplishment
which is equivalent to the degree of Bachelor of Engineering (Electrical Engineering), at
the National Defense Academy, Japan in March 1989; and obtained the Degree of Master
of Science from Cranfield University, the UK in July 1995. He completed the Command
and General Staff Course from the Japan Ground Self Defense Force Staff College in
July 1999. He also obtained a graduate diploma in Organisational Learning at Civil
Service College, Singapore in May 2003.
– 109 –

Mr. Chong was a director of the following companies which were incorporated in
Singapore and were struck off voluntarily, and the owner of the following sole
proprietorship registered in Singapore which was terminated. It is confirmed by Mr.
Chong that the following companies and sole-proprietorship were struck off or
terminated for the reasons below which were not due to his wrongful act and these
companies and sole-proprietorship were solvent immediately prior to their struck-off or
termination. The relevant details are as follows:
Name of company/
business Relevant date Nature of business Reasons
Sinkpia
International
Pte. Ltd.
4 November 2019
(struck off)
Manufacture and
repair of other
special purpose
machinery
Ceased to carry on
business and struck
off voluntarily
Eu-Pure Pte. Ltd. 19 February 2016
(struck off)
Sale of household and
office appliances
and equipment
Ceased to carry on
business and struck
off voluntarily
Eurock Resources
Pte. Ltd.
9 October 2013
(struck off)
Shipping and
commodities
trading
Ceased to carry on
business and struck
off voluntarily
HDJ Pte. Ltd. 12 May 2014
(struck off)
Trading of foodstuff Ceased to carry on
business and struck
off voluntarily
Boko Pte. Ltd. 10 December
2015
(struck off)
Wholesale trade and
business support
services
Ceased to carry on
business and struck
off voluntarily
Blue Forest Echo
(Sole
proprietorship)
7 May 2009
(terminated)
Eco-adventure
activities
Business was
incorporated as Blue
Forest Echo Pte Ltd
Mr. Chong entered into a letter of appointment with the Company for an initial term of
three years commencing from 2 December 2016 until terminated by either party by giving
not less than three months’ notice in writing to the other, and subject to the relevant
provisions of retirement and re-election at annual general meetings of the Company in
accordance with the Articles of Association. Mr. Chong is currently entitled to a monthly
director’s fee of US$3,000, which was determined on the basis of his performance,
responsibilities and commitment and the basis of salaries paid by comparable companies
and tenure.
As at the date of this announcement, Mr. Chong has an interest in 5,580,000 underlying
Shares (within the meaning of Part XV of the SFO), representing approximately 0.31% of
the issued share capital of the Company.
– 110 –

Saved as disclosed above, as at the date of this announcement, (i) Mr. Chong does not
hold any other position in the Group; (ii) Mr. Chong did not hold any directorship in any
other listed companies in Hong Kong or overseas in the last three years; (iii) Mr. Chong
has no relationship with any Director, senior management, substantial shareholders or
controlling shareholders of the Company; (iv) Mr. Chong does not have any other
interest or short position in the Shares, underlying Shares or debentures within the
meaning of Part XV of the SFO; and (v) there is no other information relating to Mr.
Chong that is required to be disclosed pursuant to Rule 13.51(2)(h) to (v) of the Main
Board Listing Rules.
Mr. Tan Lip-Keat, aged 45, has been appointed as an independent non-executive
Director, the chairman of the audit committee, and a member of each of the
remuneration committee and the nomination committee of the Company since 2
December 2016. He has been the financial controller of Blamey & Saunders Hearing
Pty Ltd in Australia since January 2018. Prior to that, he was the finance manager and
company secretary of Amneal Pharmaceuticals Pty Ltd in Australia from March 2014 to
January 2018 and held various positions in the Bristol-Myers Squibb Group, as the
finance director (Malaysia & Singapore, Hong Kong) of Mead Johnson Nutrition, the
senior finance manager (Asia Pacific Region) of Mead Johnson Nutrition, the senior
financial planning manager (Malaysia & Singapore) of Mead Johnson Nutrition and
finance controller (Vietnam) of Mead Johnson Nutrition from January 2006 to June
2013, where he was responsible for the finance lead for Asia Pacific projects and made
key expansion decisions for the finance function of the Asia Pacific region. Also, he was
the financial accountant of Bristol-Myers Squibb Pharmaceutical from April 2004 to
December 2005. Prior to joining the Bristol- Myers Squibb Group, Mr. Tan was the
financial accountant of Mayne Group from June 2002 to April 2004.
Mr. Tan graduated with a Bachelor of Commerce (Accounting & Finance) degree from
Monash University, Melbourne, Australia in April 1998. He became a certified practicing
accountant in Australia in August 2001, and currently holds the status of fellow certified
practising accountant of CPA Australia.
Mr. Tan entered into a letter of appointment with the Company for an initial term of
three years commencing from 2 December 2016 until terminated by either party by giving
not less than three months’ notice in writing to the other, and subject to the relevant
provisions of retirement and re-election at annual general meetings of the Company in
accordance with the Articles of Association. Mr. Tan is currently entitled to a monthly
director’s fee of US$3,000, which was determined on the basis of his performance,
responsibilities and commitment and the basis of salaries paid by comparable companies
and tenure.
As at the date of this announcement, Mr. Tan has an interest in 5,580,000 underlying
Shares (within the meaning of Part XV of the SFO), representing approximately 0.31% of
the issued share capital of the Company.
– 111 –

Saved as disclosed above, as at the date of this announcement, (i) Mr. Tan does not hold
any other position in the Group; (ii) Mr. Tan did not hold any directorship in any other
listed companies in Hong Kong or overseas in the last three years; (iii) Mr. Tan has no
relationship with any Director, senior management, substantial shareholders or
controlling shareholders of the Company; (iv) Mr. Tan does not have any other
interest or short position in the Shares, underlying Shares or debentures within the
meaning of Part XV of the SFO; and (v) there is no other information relating to Mr. Tan
that is required to be disclosed pursuant to Rule 13.51(2)(h) to (v) of the Main Board
Listing Rules.
Mr. Seow Chow Loong Iain (蕭兆隆), aged 53, has been appointed as an independent non-
executive Director, the chairman of the nomination committee, and a member of each of
the audit committee and the remuneration committee of the Company since 2 December
2016. Mr. Seow is currently the General Counsel & Company Secretary of Shangri-la
Asia Limited where he manages and renders in-house legal and corporate secretarial
services for the Shangri-la Group since November 2011. Prior to that, Mr. Seow was a
Partner, and Of Counsel in the Litigation Group in Jones Day in Hong Kong, from
September 2001 to November 2007. From March 1994 to August 2001, he was an
Associate in the Litigation Practice Group at Baker McKenzie, Hong Kong. He was also
an advocate and solicitor in Khattar Wong & Partners in Singapore from January 1993 to
February 1994.
Mr. Seow graduated from King’s College London with a Bachelor of Laws degree with
2nd Class Honours (Upper Division) in August 1990. He was called to the Bar in England
& Wales in November 1991, admitted as an advocate and solicitor of the Supreme Court
of Singapore in January 1993, admitted as a solicitor of England & Wales in May 1995,
and he is currently a solicitor of the High Court of Hong Kong.
Mr. Seow entered into a letter of appointment with the Company for an initial term of
three years commencing from 2 December 2016 until terminated by either party by giving
not less than three months’ notice in writing to the other, and subject to the relevant
provisions of retirement and re-election at annual general meetings of the Company in
accordance with the Articles of Association. Mr. Seow is currently entitled to a monthly
director’s fee of US$3,000, which was determined on the basis of his performance,
responsibilities and commitment and the basis of salaries paid by comparable companies
and tenure.
As at the date of this announcement, Mr. Seow has an interest in 5,580,000 underlying
Shares (within the meaning of Part XV of the SFO), representing approximately 0.31% of
the issued share capital of the Company.
Saved as disclosed above, as at the date of this announcement, (i) Mr. Seow does not hold
any other position in the Group; (ii) Mr. Seow did not hold any directorship in any other
listed companies in Hong Kong or overseas in the last three years; (iii) Mr. Seow has no
relationship with any Director, senior management, substantial shareholders or
controlling shareholders of the Company; (iv) Mr. Seow does not have any other
– 112 –

interest or short position in the Shares, underlying Shares or debentures within the
meaning of Part XV of the SFO; and (v) there is no other information relating to Mr.
Seow that is required to be disclosed pursuant to Rule 13.51(2)(h) to (v) of the Main
Board Listing Rules.
Directors’ service contracts and letters of appointment
In light of the Transfer of Listing, the Company will enter into an amendment deed with
each of the Directors prior to the Transfer of Listing with terms materially the same as
the original service contract or letter of appointment (as the case may be) entered into
between the Company and the relevant Director in order to amend any references to the
GEM Listing Rules in the original service contract or letter of appointment (as the case
may be) to references to the Main Board Listing Rules.
Senior management
Mr. David Preti, aged 49, has become the chief operating officer of the Company since
December 2018. Mr. Preti joined the Group in April 2016. He is currently primarily
responsible for overseeing game development and production. Mr. Preti has over 10 years
of experience in the gaming industry. From 2007 to 2016, Mr. Preti was a director and
shareholder of Dustgame Limited, a board game publisher. From 2012 to 2018, Mr. Preti
was been a director and shareholder of Guillotine Games Limited. Mr. Preti also has over
10 years of experience in re-insurance. He worked as a senior underwriter and Brazilian
chief representative officer of Partner Reinsurance Europe SE from 2003 to February
2016. Mr. Preti graduated with a Bachelor in History degree from the University of
Genua in June 2001.
Mr. David Preti did not hold any directorship in any other listed companies in Hong
Kong or overseas in the last three years immediately preceding the date of this
announcement.
Joint company secretaries
Ms. Ng Sau Mei (伍秀薇), aged 42, is one of the joint company secretaries of the
Company. Ms. Ng is a senior manager of TMF Hong Kong Limited and is responsible
for provision of corporate secretarial services to listed company clients. She has
professional and in-house experience in the company secretarial field as she has worked
for various companies that are listed on the Main Board of the Stock Exchange. Ms. Ng
currently serves as the joint company secretary for various public listed companies in
Hong Kong, including Tian Ge Interactive Holdings Limited (stock code: 1980),
Ourgame International Holdings Limited (stock code: 6899) and Niraku GC Holdings,
Inc. (stock code: 1245). Ms. Ng obtained a Bachelor’s Degree in Laws from City
University of Hong Kong in November 2001 and was qualified as an associate member of
the Hong Kong Institute of Chartered Secretaries and the Institute of Chartered
Secretaries and Administrators in the UK in September 2007.
– 113 –

Mr. Koh Zheng Kai (許政開) is an executive Director and one of the joint company
secretaries of the Company. For more information on Mr. Koh’s qualifications and
experience, please see the sub-paragraph headed ‘‘Executive Directors’’ above.
BOARD DIVERSITY
The Board comprises seven members, including three executive Directors, one non-
executive Director and three independent non-executive Directors. The Board is
characterised by significant diversity, whether considered in terms of age, educational
background, ethnicity, professional experience, skills, knowledge and length of service.
In particular, the Directors have a balanced mix of knowledge, skills and experience,
including the areas of tabletop games, corporate management, accounting, finance and
legal. Besides, the Board has a relatively wide range of age, ranging from 40 years old to
55 years old.
The Company has taken, and will continue to take steps to promote gender diversity of
the Board. While the Company recognizes that the gender diversity of the Board can be
improved given its current composition of all male Directors, the Company will continue
to apply the principle of appointments based on meritocracy with reference to its board
diversity policy. The nomination committee of the Company will use its best efforts to
identify and recommend suitable female candidates to the Board for its consideration and
the Company aims to appoint at least one female Director by the end of 2022.
Going forward, to develop a pipeline of potential successors to the Board that could
ensure gender diversity of the Board, the Company will (i) consider the possibility of
nominating at least one female Director to the Board or female senior management who
has the necessary skills and experience; (ii) ensure that there is gender diversity when
recruiting staff at mid to senior level; and (iii) devote more resources in training female
staff with the aim of promoting them to the senior management or directorship of the
Company.
– 114 –

COMPARISON BETWEEN EXPECTED IMPLEMENTATION PLANS WITH
ACTUAL BUSINESS PROGRESS
An analysis comparing the implementation plans as set out in the Prospectus with the
Group’s actual business progress for the period from 15 November 2016, being the latest
practicable date as defined in the Prospectus, to the date of this announcement is set out
below:
Strategy Business objectives
Actual business progress for the period
from 15 November 2016 to the date of
this announcement
Achieve organic growth
by developing more
high-quality games
. Develop, launch and deliver the
games as set out in the
paragraph headed ‘‘Business —
Game Pipeline’’ in the
Prospectus (the ‘‘Game
Pipeline’’) and fulfil the
outstanding Kickstarter
projects which products have
not yet been shipped as at 15
November 2016 (the
‘‘Outstanding Kickstarter
Projects’’)
. Develop, launch and deliver at
least four new games
. Maintain two newly hired in-
house game developers
. Continued to develop the games
as set out in the Game Pipeline,
save as nine pipeline games which
launch were either delayed or
cancelled after assessing the
expected market reaction and
demand on the products
. Shipped all the Outstanding
Kickstarter Projects namely
Arcadia Quest: Inferno,
Masmorra: Dungeons of Arcadia,
Rum & Bones: Second Tide and
Massive Darkness
. Launched and shipped 11
Kickstarter projects namely A
Song of Ice & Fire: Tabletop
Miniatures Game, Arcadia Quest:
Riders, Cthulhu: Death May Die,
HATE, Munchkin in Dungeon,
Project: ELITE, Rising Sun,
Starcadia Quest, The World of
SMOG: Rise of Moloch,
Zombicide: Green Horde and
Zombicide: Invader
. Launched four Kickstarter
projects namely Blood Rage
Digital, Bloodborne: The Board
Game, Trudvang Legends and
Zombicide: 2nd Edition
. Maintained the two newly hired
in-house game developers
– 115 –

Strategy Business objectives
Actual business progress for the period
from 15 November 2016 to the date of
this announcement
Further strengthen the
sales and marketing
capability and
broaden reach into
new markets
. Maintain seven newly hired
staff in the sales and
marketing team
. Set up and maintain the
existing sales office in Canada
. Increase publicity across all of
the existing marketing
channels, including
participation in game
conventions, advertisements
and cooperation with online
game websites
. Increase or initiate contact with
existing or new wholesalers to
enhance or initiate business
relationships
. The Group has successfully
maintained five staff (Note 1)
. The Group has set up its sales
office in Canada, which
commenced operation in October
2017
. Continued to promote the
Company’s products through
online advertising and social
networking websites
. Maintained regular contact with
existing wholesalers
. Initiated contact with five new
wholesalers
. The Group has set up CMON
Foshan in China, which
commenced to conduct marketing
activities in China in the second
half of 2018
Further expansion into
the mobile game
market
. Develop the second mobile
game, Zombicide (mobile)
(which is renamed as
Zombicide: Tactics & Shotguns)
. Continued to market Zombicide
(mobile) (which is renamed as
Zombicide: Tactics & Shotguns),
which has been launched in 2019
Notes:
1. The Group had successfully maintained seven staff up to the resignation of Mr. Jules Vautour as chief
operating officer and Ms. Roumpini Nikolopaolou as marketing director in June 2018 due to their
personal commitments. Their jobs and duties have been taken up by other senior management who
have relevant experiences. Please refer to the paragraph headed ‘‘Management of the Company since
Listing’’ of this announcement for more details.
For the nine pipeline games stated in the Prospectus, the launch of which were either
delayed or cancelled, (i) one of them was a third party game under the distribution
agreement with a licensor which the Group has decided not to renew upon its expiry in
January 2017. Therefore, the launch of this game was cancelled. As a third party game,
the Group did not make any investment in the development of the game; (ii) one of them
was Zombicide: Tactics & Shotguns, which was referred as Zombicide (mobile) in the
Prospectus. Zombicide: Tactics & Shotguns has been officially launched in April 2019. As
the development costs incurred for Zombicide: Tactics & Shotguns since the Listing have
– 116 –

been recharged to a business partner which has agreed (contractually) to pay for such
development costs in return for a future revenue sharing arrangement, no material
investment or expenditure had been incurred by the Group; (iii) one of them was Kick-
Ass, which was launched in 2018 with revenue contribution of US$78,588 and US$76,579
for the year ended 31 December 2018 and the six months ended 30 June 2019,
respectively; (iv) one of them was Trudvang Legends, a Kickstarter game launched in 2019
with fund raising size of approximately US$1.5 million. Up to the Latest Practicable
Date, US$214,008 has been invested in the development of this game; and (v) currently
the remaining five games do not have any concrete launch schedule. Up to the Latest
Practicable Date, US$24,588 has been invested in the development of these games.
Except for Zombicide: Tactics & Shotguns and Trudvang Legends which are expected to
be more significant to the Group in terms of market position and revenue contribution,
the Directors do not expect the revenue contribution from the other seven delayed or
cancelled games to be material. Besides, taking into account the total amount invested in
the delayed or cancelled games and the revenue contribution by Kick-Ass for the year
ended 31 December 2018 and the six months ended 30 June 2019, the Directors are of the
view that there is no material impact on the Group’s business and financial performance
due to the delay and/or cancellation of the nine pipeline games.
USE OF NET PROCEEDS FROM THE PLACING
The net proceeds received by the Company from the Placing, after deducting
underwriting commission and professional expenses in relation to the Placing,
amounted to approximately HK$53.8 million, which were higher than the estimated
net proceeds of approximately HK$49.3 million as disclosed in the Prospectus. An
estimated amount of approximately HK$21.1 million of underwriting fees and other
listing expenses in aggregate were deducted from the gross proceeds of approximately
HK$70.4 million for the purpose of calculating the estimated net proceeds of
approximately HK$49.3 million as disclosed in the Prospectus. However, after
finalisation of all the fees and expenses with the professional parties involved in the
Placing, the actual total underwriting fees and other listing expenses was only
approximately HK$16.6 million. Therefore, the actual net proceeds received by the
Company from the Placing were higher than the amount disclosed in the Prospectus.
– 117 –

During the period from 15 November 2016, being the latest practicable date as defined in
the Prospectus, to 30 June 2019, the Group has utilised approximately HK$53.1 million
of the net proceeds as follows:
Adjusted use of
proceeds in the
proportion as
stated in the
Prospectus
Actual use of
proceeds up to
30 June 2019
HK$ million HK$ million
Developing high-quality tabletop games 21.5 21.5
Strengthening sales and marketing capability and
broadening reach into new markets 17.2 17.2
Expanding into the mobile game market 1.6 0.9
Pursuing acquisition and licensing opportunities 8.6 8.6
Working capital and other general corporate
purposes 4.9 4.9
Total 53.8 53.1
The Group has applied approximately HK$8.3 million of the net proceeds for the
acquisition of the IPs of The Others: 7 Sins, The Grizzled and The World of SMOG
during the period from 15 November 2016 to 30 June 2019.
Save as disclosed above, the Directors confirm that there were no material discrepancies
between the progress of actual and proposed use of proceeds from the Placing. The
Directors intend to continue to apply the remaining net proceeds from the Placing of
approximately HK$0.7 million in accordance with the uses and in the proportions as
stated in the Prospectus.
DOCUMENTS AVAILABLE FOR INSPECTION
Copies of the following documents will be made available for viewing on the respective
websites of the Company at http://cmon.com and of the Stock Exchange at
http://www.hkexnews.hk:
(a) the interim report of the Company for the six months ended 30 June 2019;
(b) the first quarterly report of the Company for the three months ended 31 March 2019;
(c) the annual report of the Company for the year ended 31 December 2018;
(d) the Memorandum and Articles of Association;
– 118 –

(e) the circulars of the Company dated 23 March 2018 and 29 March 2019 in relation to,
among other things, the proposals for general mandates to issue Shares and to
repurchase Shares, and re-election of retiring Directors; and
(f) each of the announcements and other corporate communications made by the
Company prior to the date of this announcement as required under the GEM Listing
Rules.
DEFINITIONS
In this announcement, the following expressions have the following meanings unless the
context requires otherwise:
‘‘Acting-in-Concert
Arrangement’’
the acting-in-concert confirmation letter dated 15 July 2015
executed by Mr. Ng and Mr. Doust, pursuant to which Mr. Ng
and Mr. Doust confirm, among other things, that they would
and will continue to act in concert in exercising their voting
rights over any company in the Group of which both of them are
ultimate or beneficial owners, details of which please refer to the
section headed ‘‘Relationship with Controlling Shareholders —
Controlling Shareholders Acting In Concert’’ in the Prospectus
‘‘Articles of
Association’’
the articles of association of the Company as adopted by the
Company from time to time
‘‘associate(s)’’ has the meaning ascribed to it under the Main Board Listing
Rules
‘‘Board’’ the board of Directors
‘‘C$’’ Canadian dollars, the lawful currency of Canada
‘‘CA SPV’’ Cangsome Limited, a limited liability company incorporated in
the British Virgin Islands on 1 July 2015, which is wholly-owned
by Mr. Ng
‘‘CAGR’’ compound annual growth rate
‘‘CCASS’’ the Central Clearing and Settlement System established and
operated by HKSCC
‘‘China Galaxy
International’’
China Galaxy International Securities (Hong Kong) Co.,
Limited, a corporation licensed to carry on Type 1 (dealing in
securities), Type 4 (advising on securities) and Type 6 (advising
on corporate finance) regulated activities under the SFO
– 119 –

‘‘close associate(s)’’ has the meaning ascribed to it under the Main Board Listing
Rules
‘‘CMON Foshan’’ Foshan CMON Tabletop Games Trading Co., Ltd.* (佛山戲夢
桌游貿易有限公司), a wholly foreign owned enterprise
established in the PRC on 18 April 2018 with limited liability
and an indirect wholly-owned subsidiary of the Company
‘‘Company’’ CMON Limited, an exempted company incorporated under the
laws of the Cayman Islands on 16 June 2015 with limited liability
‘‘connected
person(s)’’
has the meaning ascribed to it under the Main Board Listing
Rules
‘‘controlling
shareholder(s)’’
has the meaning ascribed to it under the Main Board Listing
Rules
‘‘DD SPV’’ Dakkon Holdings Limited, a limited liability company
incorporated in the British Virgin Islands on 3 July 2015,
which is wholly-owned by Mr. Doust
‘‘Director(s)’’ the director(s) of the Company
‘‘EU’’ the European Union consisting a group of 28 European
countries
‘‘GEM’’ GEM of the Stock Exchange
‘‘GEM Listing Rules’’ the Rules Governing the Listing of Securities on GEM (as may
be amended from time to time)
‘‘Group’’ the Company and its subsidiaries from time to time
‘‘HKSCC’’ Hong Kong Securities Clearing Company Limited
‘‘HK$’’ Hong Kong dollars, the lawful currency of Hong Kong
‘‘Hong Kong’’ the Hong Kong Special Administrative Region of the PRC
‘‘Independent Third
Party(ies)’’
person(s) or company(ies) which, to the best of the knowledge of
the Directors having made all reasonable enquiries, is/are
independent from the Company and its connected persons
‘‘IP(s)’’ intellectual property(ies)
– 120 –

‘‘Ipsos’’ Ipsos Limited, a market research and industry consultant
commissioned by the Company to prepare the Ipsos Report
and an Independent Third Party
‘‘Ipsos Report’’ the industry report dated 11 November 2019 prepared by Ipsos
Business Consulting, a strategy consulting arm of Ipsos, in
relation to the tabletop games industry in the USA, EU and PRC
‘‘Joint Sponsors’’ China Galaxy International and Lego Corporate Finance
‘‘Kickstarter’’ an online funding platform for creative projects, with its website
at http://www.kickstarter.com
‘‘Latest Practicable
Date’’
4 November 2019, being the latest practicable date for
ascertaining certain information in this announcement
‘‘Lego Corporate
Finance’’
Lego Corporate Finance Limited, a corporation licensed to carry
on Type 6 (advising on corporate finance) regulated activity
under the SFO
‘‘Listing’’ listing of the Shares on GEM on 2 December 2016
‘‘Main Board’’ the stock market operated by the Stock Exchange prior to the
establishment of GEM (excluding the options market), which
continues to be operated by the Stock Exchange in parallel with
GEM, and for the avoidance of doubt, the Main Board excludes
GEM
‘‘Main Board Listing
Rules’’
the Rules Governing the Listing of Securities on the Stock
Exchange (as may be amended from time to time)
‘‘Memorandum’’ the memorandum of the Company as adopted by the Company
from time to time
‘‘Mr. Chua’’ Mr. Frederick Chua Oon Kian (蔡穩健), the non-executive
Director
‘‘Mr. Doust’’ Mr. David Doust (建邦), an executive Director and a controlling
shareholder of the Company
‘‘Mr. Koh’’ Mr. Koh Zheng Kai (許政開), an executive Director and one of
the joint company secretaries of the Company
‘‘Mr. Ng’’ Mr. Ng Chern Ann (黃成安), the chairman, chief executive
officer, executive Director and a controlling shareholder of the
Company
– 121 –

‘‘Ms. Ng’’ Ms. Ng Sau Mei (伍秀薇), the joint company secretary of the
Company
‘‘MSRP’’ manufacturer’s suggested retail price
‘‘Placing’’ the placing of 306,000,000 Shares at a price of HK$0.23 per
Share on GEM on 2 December 2016
‘‘PRC’’ the People’s Republic of China and for the purpose of this
announcement, excluding Hong Kong, Macau Special
Administrative Region of the PRC and Taiwan
‘‘Prospectus’’ prospectus of the Company dated 25 November 2016
‘‘Reporting Period’’ the three financial years ended 31 December 2018 and the six
months ended 30 June 2019
‘‘S$’’ Singapore dollars, the lawful currency of Singapore
‘‘SFO’’ the Securities and Futures Ordinance, Chapter 571 of the Laws
of Hong Kong, as amended from time to time
‘‘Share(s)’’ ordinary share(s) of HK$0.00005 each in the share capital of the
Company
‘‘Share Option
Scheme’’
the share option scheme of the Company conditionally adopted
by the Company on 17 November 2016
‘‘Shareholder(s)’’ holder(s) of the Share(s)
‘‘Singapore’’ Republic of Singapore
‘‘Stock Exchange’’ The Stock Exchange of Hong Kong Limited
‘‘substantial
shareholder(s)’’
has the meaning ascribed to it under the Main Board Listing
Rules
‘‘Transfer of Listing’’ the transfer of listing of the Shares from GEM to Main Board
‘‘US$’’ United States Dollars, the lawful currency of the USA
‘‘USA’’ or ‘‘United
States’’ or ‘‘U.S.’’
the United States of America
– 122 –

‘‘UK’’ the United Kingdom
‘‘%’’ per cent
* For identification purpose only
On behalf of the Board
CMON Limited
Ng Chern Ann
Chairman, Chief Executive Officer and Executive Director
Singapore, 11 November 2019
As at the date of this announcement, the executive Directors are Mr. Ng Chern Ann, Mr.
David Doust and Mr. Koh Zheng Kai; the non-executive Director is Mr. Frederick Chua
Oon Kian; and the independent non-executive Directors are Mr. Chong Pheng, Mr. Tan
Lip-Keat and Mr. Seow Chow Loong Iain.
This announcement, for which the Directors collectively and individually accept full
responsibility, includes particulars given in compliance with the GEM Listing Rules and
Main Board Listing Rules for the purpose of giving information with regard to the
Company. The Directors, having made all reasonable enquiries, confirm that to the best of
their knowledge and belief the information contained in this announcement is accurate and
complete in all material respects and not misleading or deceptive, and there are no other
matters the omission of which would make any statement herein or this announcement
misleading.
This announcement will remain on the ‘‘Latest Company Announcements’’ page of the GEM
website at www.hkgem.com for a minimum period of 7 days from the date of publication and
on the website of the Company at http://cmon.com.
– 123 –