cms annual report july 1, 2014 june 30, 2015 demonstration ...€¦ · july 1, 2014 – june 30,...
TRANSCRIPT

1
CMS Annual Report
July 1, 2014 – June 30, 2015
Demonstration Year 18
In June 2013, Maryland applied for the fifth extension of its §1115 HealthChoice demonstration
waiver. It was approved for the period beginning November 1, 2013 through December 31, 2016.
This extension assures Maryland will continue to implement provisions to meet the requirements
of the Affordable Care Act (ACA); in addition, Maryland opted to expand Medicaid coverage to
include adults with incomes up to 138 percent of the Federal Poverty Level (FPL).
Also a result of Medicaid expansion, the Department of Health and Mental Hygiene (“the
Department”) no longer operates the Primary Adult Care program (PAC). As of January 1, 2014,
former PAC recipients were transitioned from a partial benefit package to the full benefit
Medicaid package under the ACA expansion. The number of childless adults and families now
eligible for Medicaid benefits also increased significantly. This Medicaid expansion is
complemented by a state-based marketplace that includes an insurance exchange offering
qualified health plans. Maryland has prioritized ensuring that the existing HealthChoice program
remains stable and actuarially-sound to withstand the program growth that will continue to occur
with healthcare reform.
Under the §1115 managed care waiver rules, the HealthChoice program changed the payment
structure and delivery of health services for certain populations in Maryland’s Medicaid
Program. In July 1996, Maryland adopted a prospective capitated monthly payment structure as
authorized under §1115, replacing the traditional fee-for-service payment structure while moving
the health service delivery model toward a managed care model administered by managed care
organizations (MCOs). The goals for the State under HealthChoice are to increase efficiency and
improve health outcomes by:
Providing a patient-focused system with a medical home for all beneficiaries;
Building on the strengths of the established Maryland health care system;
Providing comprehensive, prevention-oriented systems of care;
Holding MCOs accountable for high-quality care; and
Achieving better value and predictable expenses.
Since the initial approval and implementation, Maryland subsequently requested and received
several three-year extensions, in June 2002, June 2005, August 2008 and June 2011. In
Demonstration Year 16 Maryland applied for, and CMS granted, its fifth extension.
As of the end of Demonstration Year 18, more than 217,000 Marylanders had enrolled for health
coverage as part of the Medicaid expansion. These new enrollments have propelled Maryland to
substantial improvement in providing coverage to the uninsured. According to the Kaiser Family
2
Foundation, the rate of uninsured in Maryland dropped from 13.3 percent in 2013 to 6.5 percent
by mid-2014.1 This decrease of 6.7 percent was found to be statistically-significant.
ELIGIBILITY AND ENROLLMENT
In the past year, the HealthChoice program saw increases across several eligibility categories,
most prominently within the ACA Expansion Adults and MCHP Premium groups but also within
Supplemental Security Income-supported (SSI) and blind and disabled (BD) adults, MCHP and
Family Planning. More information on changes in enrollment can be found in Tables 1-3 and
Chart 1.
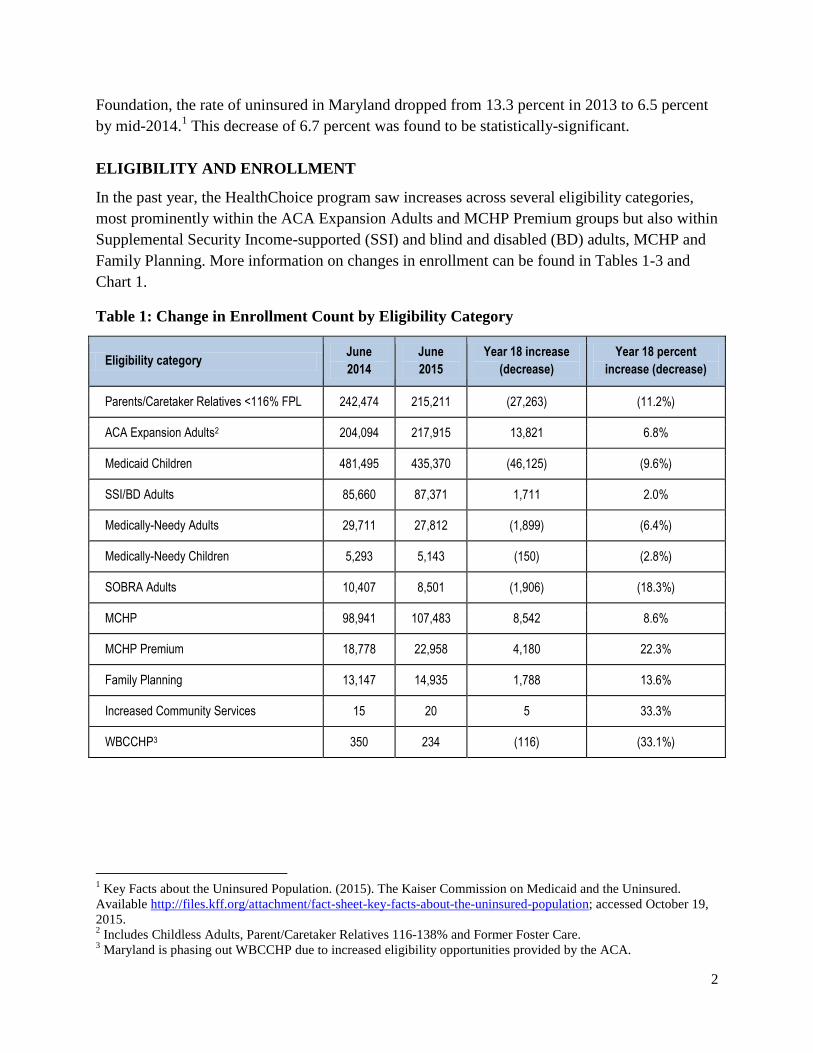
Table 1: Change in Enrollment Count by Eligibility Category
Eligibility category June
2014
June
2015
Year 18 increase
(decrease)
Year 18 percent
increase (decrease)
Parents/Caretaker Relatives <116% FPL
242,474 215,211 (27,263) (11.2%)
ACA Expansion Adults2 204,094 217,915 13,821 6.8%
Medicaid Children 481,495 435,370 (46,125) (9.6%)
SSI/BD Adults 85,660
87,371 1,711 2.0%
Medically-Needy Adults 29,711 27,812 (1,899) (6.4%)
Medically-Needy Children 5,293 5,143 (150) (2.8%)
SOBRA Adults 10,407 8,501 (1,906) (18.3%)
MCHP 98,941 107,483 8,542 8.6%
MCHP Premium 18,778 22,958 4,180 22.3%
Family Planning 13,147 14,935 1,788 13.6%
Increased Community Services 15 20 5 33.3%
WBCCHP3 350 234 (116) (33.1%)
1 Key Facts about the Uninsured Population. (2015). The Kaiser Commission on Medicaid and the Uninsured.
Available http://files.kff.org/attachment/fact-sheet-key-facts-about-the-uninsured-population; accessed October 19,
2015. 2 Includes Childless Adults, Parent/Caretaker Relatives 116-138% and Former Foster Care.
3 Maryland is phasing out WBCCHP due to increased eligibility opportunities provided by the ACA.

3
Table 2: Enrollment Share as compared to Total Medicaid Enrollment by Eligibility
Category
Eligibility category
Percentage of total
program enrollment
June 2014
Percentage of total
program enrollment
June 2015
Share
increase
(decrease)
Parent/Caretaker Relatives <116% FPL
20.4% 18.8% (1.5%)
ACA Expansion Adults 17.1% 19.1% 1.9%
Medicaid Children 40.4% 38.1% (2.4%)
SSI/BD Adults 7.2% 7.6% 0.4%
Medically-Needy Adults 2.5% 2.4% (0.1%)
Medically-Needy Children 0.4% 0.4% 0.0%
SOBRA Adults 0.9% 0.7% (0.1%)
MCHP 8.3% 9.4% 1.1%
MCHP Premium 1.6% 2.0% 0.4%
Family Planning 1.1% 1.3% 0.2%
Increased Community Services 0.0% 0.0% 0.0%
WBCCHP 0.0% 0.0% 0.0%
Table 3: Average Quarterly Member Months
Eligibility category First
Quarter
Second
Quarter
Third
Quarter
Fourth
Quarter
Percent
Change
Parent/Caretaker Relatives <116% FPL
235,258 221,014 231,751 219,442 (6.7%)
ACA Expansion Adults 206,485 206,672 249,570 219,229 6.2%
Medicaid Children 473,694 447,747 457,642 442,197 (6.6%)
SSI/BD Adults 86,504 86,152 86,342 86,891 0.4%
Medically-Needy Adults 28,024 33,054 30,499 26,237 (6.4%)
Medically-Needy Children 5,268 5,321 5,044 5,094 (3.3%)
SOBRA Adults 10,522 10,320 9,878 8,539 (18.8%)
MCHP 98,211 95,598 104,625 106,899 8.8%
4
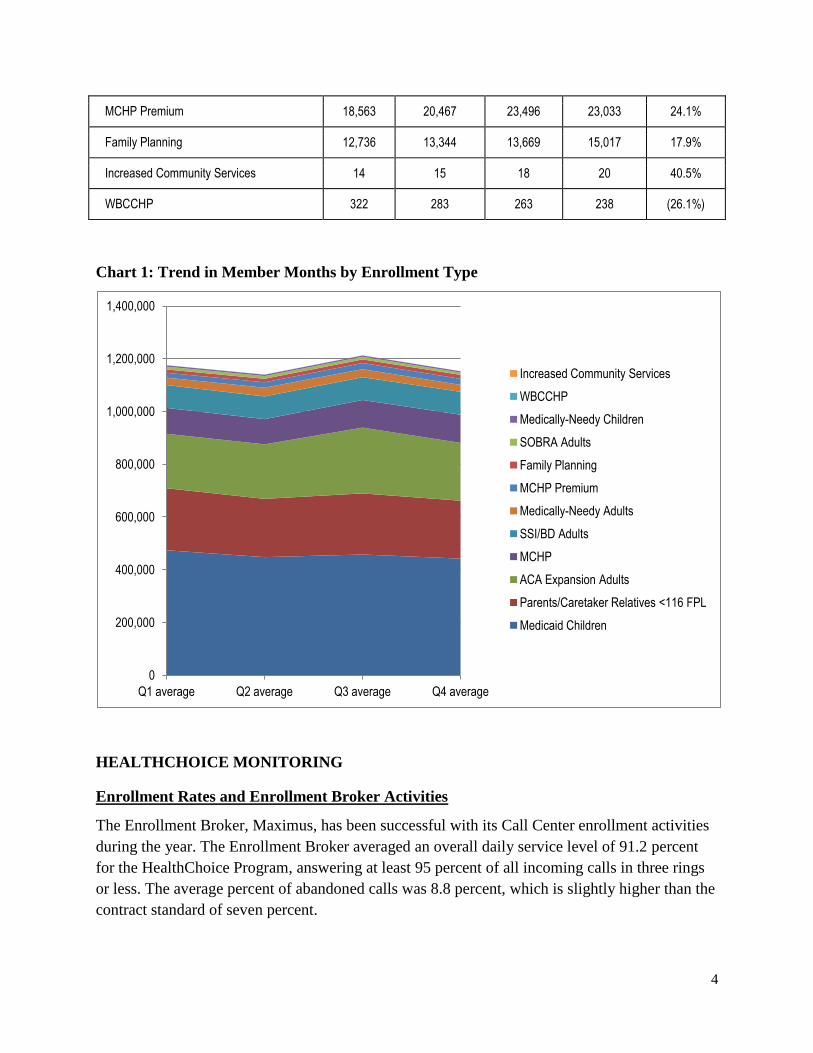
Chart 1: Trend in Member Months by Enrollment Type
HEALTHCHOICE MONITORING
Enrollment Rates and Enrollment Broker Activities
The Enrollment Broker, Maximus, has been successful with its Call Center enrollment activities
during the year. The Enrollment Broker averaged an overall daily service level of 91.2 percent
for the HealthChoice Program, answering at least 95 percent of all incoming calls in three rings
or less. The average percent of abandoned calls was 8.8 percent, which is slightly higher than the
contract standard of seven percent.
0
200,000
400,000
600,000
800,000
1,000,000
1,200,000
1,400,000
Q1 average Q2 average Q3 average Q4 average
Increased Community Services
WBCCHP
Medically-Needy Children
SOBRA Adults
Family Planning
MCHP Premium
Medically-Needy Adults
SSI/BD Adults
MCHP
ACA Expansion Adults
Parents/Caretaker Relatives <116 FPL
Medicaid Children
MCHP Premium 18,563 20,467 23,496 23,033 24.1%
Family Planning 12,736 13,344 13,669 15,017 17.9%
Increased Community Services 14 15 18 20 40.5%
WBCCHP 322 283 263 238 (26.1%)

5
Because of the Medicaid expansion implemented January 1, 2014, the HealthChoice program has
seen approximately 18,000 newly eligible recipients each month. As a result of the increased
number of new enrollments each month, the voluntary enrollment rate (VER) for the Enrollment
Broker contract has been 67.5 percent, which is lower than the required 80 percent contract
standard. Subsequently, the Department has issued a service level/performance waiver to the
Enrollment Broker for the reporting period.
Additionally, in June 2014, Kaiser Permanente joined the family of MCOs participating in the
HealthChoice Program, bringing the total number of MCOs to eight. As of June 30, 2015, there
were 1,001,595 recipients participating in the HealthChoice Program, with 21,322 enrolled in the
new Kaiser Permanente MCO.
Maryland Children’s Health Program
Effective June 1, 2008, Maryland moved MCHP—its separate CHIP program—and MCHP
Premium into the Medicaid expansion CHIP waiver, allowing Maryland’s entire CHIP program
to be operated as a Medicaid expansion. As of the June 30, 2015, the Premium program had
22,958 enrollees, with MCHP at 107,483 enrollees.
Medicaid Eligibility Quality Control
During state fiscal year (SFY) 2015, MEQC assisted with the testing of 18 Round 1 PERM Test
Cases for SFY 2014 – 2016. The test cases were conducted in the User Acceptance Testing
environment. The team used an analysis tool supplied by CMS to compare the determinations
completed by the Maryland Health Connection with the expected results. Reporting for Round 1
had not concluded as of SFY 2015.
MCO QUALITY ASSURANCE AUDITS
Systems Performance Review
As required by Federal regulations, the State contracts with Delmarva Foundation to serve as
Maryland’s External Quality Review Organization (EQRO) to conduct a Systems Performance
Review (SPR), an annual assessment of the structure, process and outcome of each MCO’s
internal quality assurance (QA) programs. Through the SPR, the team is able to identify,
validate, quantify and monitor problem areas.
All seven MCOs have demonstrated the ability to implement effective QA systems; this excludes
Kaiser Permanente, who was not yet participating in HealthChoice. The calendar year (CY) 2013
annual SPR consists of 8 to 11 standards, depending on the MCO, with a compliance threshold
of 100 percent across the standards for all MCOs with the exception of Riverside Health of
Maryland (RHMD), for whom the compliance threshold was 80 percent for its first year. The CY

6
2013 SPR assessment determined that all seven MCOs demonstrated the ability to implement
effective QA systems. Table 4 shows the CY 2013 MCO Compliance Rates.
Table 4: CY 2013 MCO SPR Compliance Rates
Standard Description Elements
Reviewed
MD MCO
Compliance
Rate
ACC JMS MPC MSFC PPMCO RHMD** UHC
1 Systematic
Process 33 100% Exempt Exempt Exempt Exempt Exempt 100% Exempt
2 Governing Body 10 100% 100% 100% 100% 100% 100% 100% 100%
3
Oversight of
Delegated
Entities
7 83%* 100% 100% 100% 100% 100% 36%* 71%*
4 Credentialing 38 98%* 100% 100% 100% 100% 100% 98%* 100%
5 Enrollee Rights 21 96%* 100% 100% 100% 100% 90%* 94%* 90%*
6 Availability and
Access 10 96%* 100% 100% 100% 100% 95%* 80%* 100%
7 Utilization
Review 24 90%* 100% 100% 100% 100% 80%* 67%* 85%*
8 Continuity of
Care 4 100% 100% 100% 100% 100% 100% 100% 100%
9 Health
Education Plan 12 88%* Exempt Exempt Exempt Exempt Exempt 88%* Exempt
10 Outreach Plan 14 93%* Exempt Exempt Exempt Exempt Exempt 93%* Exempt
11 Fraud and
Abuse 19 98%* 100% 100% 100% 100% 100% 89%* 100%
*Denotes that the minimum compliance rate of 100% was unmet.
**RHMD’s minimum compliance threshold is set at 80%, as this was the MCO’s first SPR.
Early and Periodic Screening, Diagnosis and Treatment Review
The Early and Periodic Screening, Diagnosis and Treatment (EPSDT) program is the federally-
mandated program for screening, prevention, diagnosis and treatment for children and
adolescents through 20 years of age. For CY 2013, Delmarva’s Review Nurses used criteria
developed by the Department’s EPSDT Certification Nurses, reviewing a total of 2,366 medical
records randomly selected from CY 2013 encounter data.
7
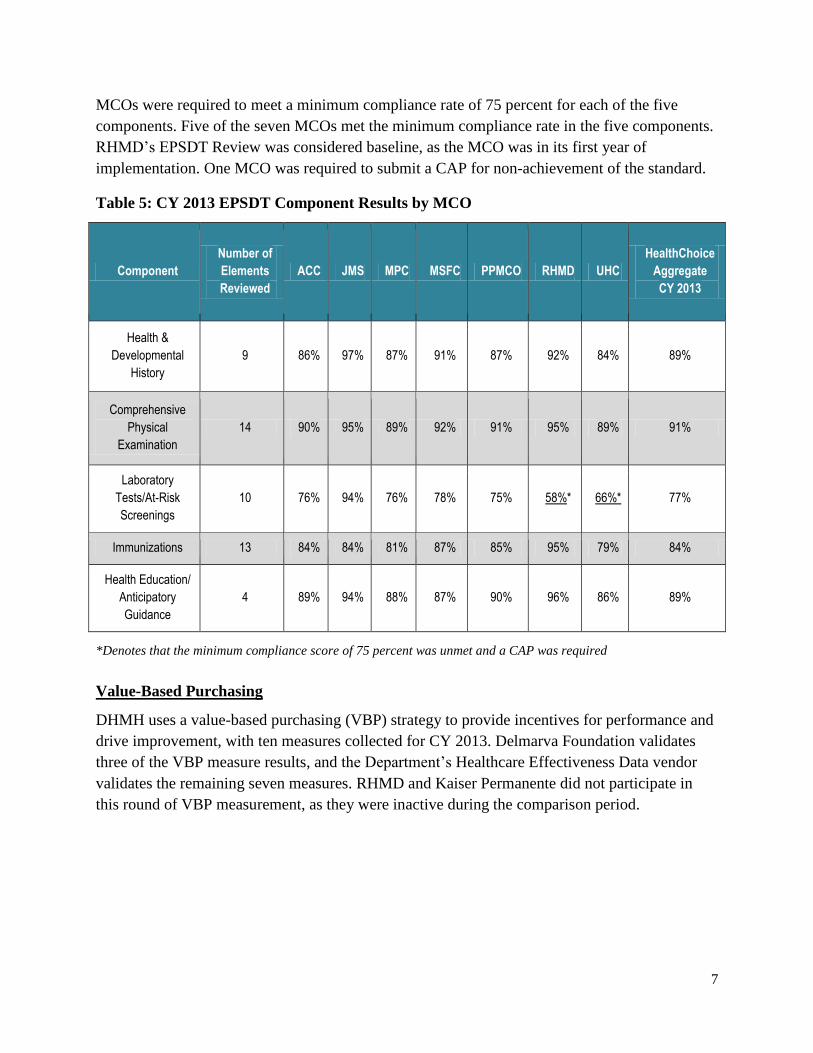
MCOs were required to meet a minimum compliance rate of 75 percent for each of the five
components. Five of the seven MCOs met the minimum compliance rate in the five components.
RHMD’s EPSDT Review was considered baseline, as the MCO was in its first year of
implementation. One MCO was required to submit a CAP for non-achievement of the standard.
Table 5: CY 2013 EPSDT Component Results by MCO
Component
Number of
Elements
Reviewed
ACC JMS MPC MSFC PPMCO RHMD UHC
HealthChoice
Aggregate
CY 2013
Health &
Developmental
History
9 86% 97% 87% 91% 87% 92% 84% 89%
Comprehensive
Physical
Examination
14 90% 95% 89% 92% 91% 95% 89% 91%
Laboratory
Tests/At-Risk
Screenings
10 76% 94% 76% 78% 75% 58%* 66%* 77%
Immunizations 13 84% 84% 81% 87% 85% 95% 79% 84%
Health Education/
Anticipatory
Guidance
4 89% 94% 88% 87% 90% 96% 86% 89%
*Denotes that the minimum compliance score of 75 percent was unmet and a CAP was required
Value-Based Purchasing
DHMH uses a value-based purchasing (VBP) strategy to provide incentives for performance and
drive improvement, with ten measures collected for CY 2013. Delmarva Foundation validates
three of the VBP measure results, and the Department’s Healthcare Effectiveness Data vendor
validates the remaining seven measures. RHMD and Kaiser Permanente did not participate in
this round of VBP measurement, as they were inactive during the comparison period.
8
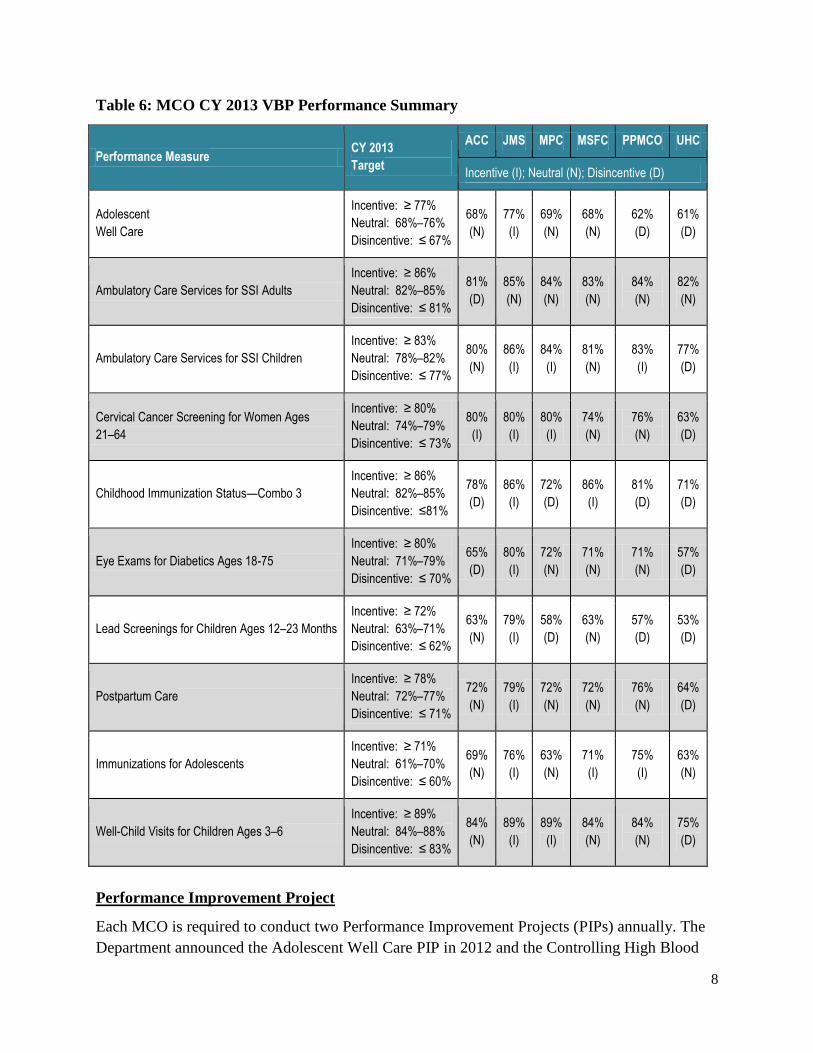
Table 6: MCO CY 2013 VBP Performance Summary
Performance Measure CY 2013
Target
ACC JMS MPC MSFC PPMCO UHC
Incentive (I); Neutral (N); Disincentive (D)
Adolescent
Well Care
Incentive: ≥ 77%
Neutral: 68%–76%
Disincentive: ≤ 67%
68%
(N)
77%
(I)
69%
(N)
68%
(N)
62%
(D)
61%
(D)
Ambulatory Care Services for SSI Adults
Incentive: ≥ 86%
Neutral: 82%–85%
Disincentive: ≤ 81%
81%
(D)
85%
(N)
84%
(N)
83%
(N)
84%
(N)
82%
(N)
Ambulatory Care Services for SSI Children
Incentive: ≥ 83%
Neutral: 78%–82%
Disincentive: ≤ 77%
80%
(N)
86%
(I)
84%
(I)
81%
(N)
83%
(I)
77%
(D)
Cervical Cancer Screening for Women Ages
21–64
Incentive: ≥ 80%
Neutral: 74%–79%
Disincentive: ≤ 73%
80%
(I)
80%
(I)
80%
(I)
74%
(N)
76%
(N)
63%
(D)
Childhood Immunization Status—Combo 3
Incentive: ≥ 86%
Neutral: 82%–85%
Disincentive: ≤81%
78%
(D)
86%
(I)
72%
(D)
86%
(I)
81%
(D)
71%
(D)
Eye Exams for Diabetics Ages 18-75
Incentive: ≥ 80%
Neutral: 71%–79%
Disincentive: ≤ 70%
65%
(D)
80%
(I)
72%
(N)
71%
(N)
71%
(N)
57%
(D)
Lead Screenings for Children Ages 12–23 Months
Incentive: ≥ 72%
Neutral: 63%–71%
Disincentive: ≤ 62%
63%
(N)
79%
(I)
58%
(D)
63%
(N)
57%
(D)
53%
(D)
Postpartum Care
Incentive: ≥ 78%
Neutral: 72%–77%
Disincentive: ≤ 71%
72%
(N)
79%
(I)
72%
(N)
72%
(N)
76%
(N)
64%
(D)
Immunizations for Adolescents
Incentive: ≥ 71%
Neutral: 61%–70%
Disincentive: ≤ 60%
69%
(N)
76%
(I)
63%
(N)
71%
(I)
75%
(I)
63%
(N)
Well-Child Visits for Children Ages 3–6
Incentive: ≥ 89%
Neutral: 84%–88%
Disincentive: ≤ 83%
84%
(N)
89%
(I)
89%
(I)
84%
(N)
84%
(N)
75%
(D)
Performance Improvement Project
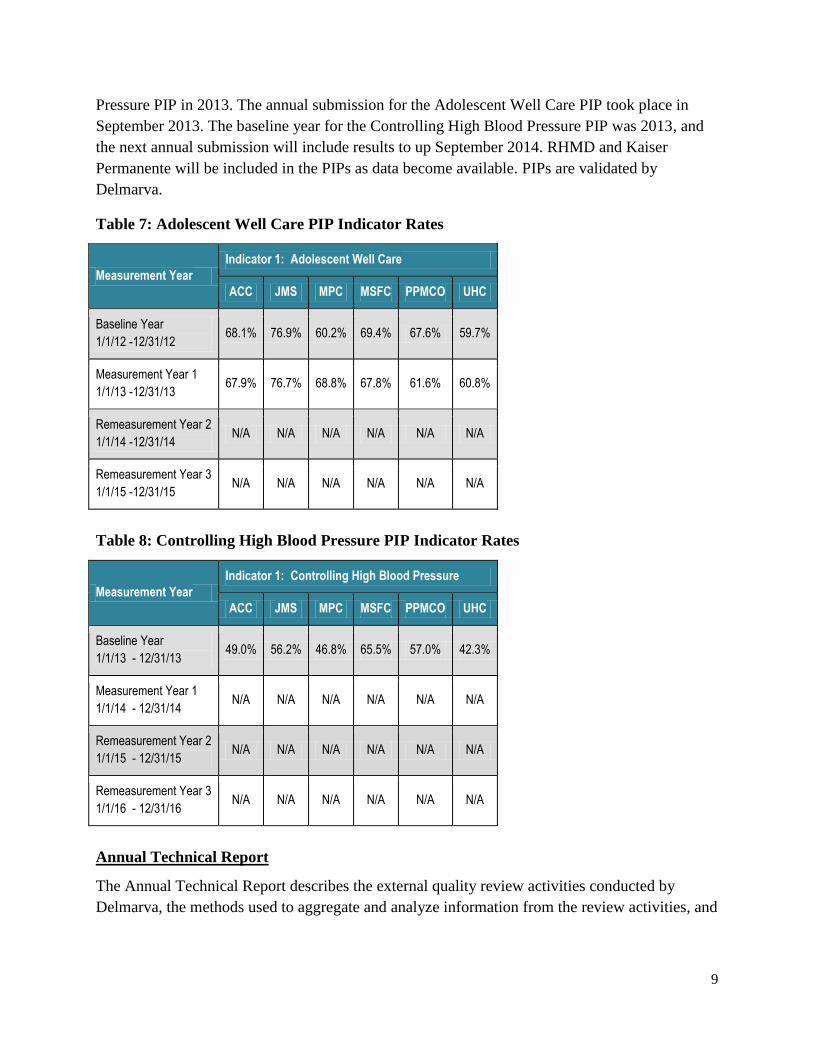
Each MCO is required to conduct two Performance Improvement Projects (PIPs) annually. The
Department announced the Adolescent Well Care PIP in 2012 and the Controlling High Blood
9
Pressure PIP in 2013. The annual submission for the Adolescent Well Care PIP took place in
September 2013. The baseline year for the Controlling High Blood Pressure PIP was 2013, and
the next annual submission will include results to up September 2014. RHMD and Kaiser
Permanente will be included in the PIPs as data become available. PIPs are validated by
Delmarva.
Table 7: Adolescent Well Care PIP Indicator Rates
Measurement Year
Indicator 1: Adolescent Well Care
ACC JMS MPC MSFC PPMCO UHC
Baseline Year
1/1/12 -12/31/12 68.1% 76.9% 60.2% 69.4% 67.6% 59.7%
Measurement Year 1
1/1/13 -12/31/13 67.9% 76.7% 68.8% 67.8% 61.6% 60.8%
Remeasurement Year 2
1/1/14 -12/31/14 N/A N/A N/A N/A N/A N/A
Remeasurement Year 3
1/1/15 -12/31/15 N/A N/A N/A N/A N/A N/A
Table 8: Controlling High Blood Pressure PIP Indicator Rates
Measurement Year
Indicator 1: Controlling High Blood Pressure
ACC JMS MPC MSFC PPMCO UHC
Baseline Year
1/1/13 - 12/31/13 49.0% 56.2% 46.8% 65.5% 57.0% 42.3%
Measurement Year 1
1/1/14 - 12/31/14 N/A N/A N/A N/A N/A N/A
Remeasurement Year 2
1/1/15 - 12/31/15 N/A N/A N/A N/A N/A N/A
Remeasurement Year 3
1/1/16 - 12/31/16 N/A N/A N/A N/A N/A N/A
Annual Technical Report
The Annual Technical Report describes the external quality review activities conducted by
Delmarva, the methods used to aggregate and analyze information from the review activities, and

10
draws conclusions as to the quality, timeliness, and access to healthcare services furnished by
HealthChoice Program in CY 2013. The report is available via the following link:
https://mmcp.dhmh.maryland.gov/healthchoice/Documents/2013%20Maryland%20Annual%20T
echnical%20Report.pdf
Health Risk Assessments
The Department continues to perform reviews of the timely provision of MCO services in
response to a positive health risk assessment of newly enrolled HealthChoice recipients who are
pregnant and/or in need of prescription medicines.
Consumer Report Card
Delmarva, in conjunction with the National Committee for Quality Assurance (NCQA),
produces a consumer report card that compares MCOs against each other. The consumer report
card provides Medicaid recipients with the information necessary to make informed choices
regarding MCO selection. An updated consumer report card is produced each year in December
and included in enrollment packets throughout the following calendar year and posted on the
HealthChoice website in English and Spanish.
HealthChoice Enrollee Satisfaction Survey
The Department uses a National Committee for Quality Assurance (NCQA)-certified survey
vendor, WBA, to conduct annual enrollee surveys to assess satisfaction with the HealthChoice
Program. Separate surveys are conducted for adults and children and include a Spanish option.
The child survey includes a measurement set to assess the experience of care for special needs
children with chronic conditions (CCC).
In SFY 2014, the Department’s contracted NCQA-certified survey vendor administered the
Consumer Assessment of Healthcare Providers and Systems® (CAHPS) 5.0H Medicaid Adult
and Child Member with Chronic Conditions Satisfaction Surveys to eligible enrollees for CY
2013 data. A total of 11,421 Adult Member Satisfaction Surveys were mailed to enrollees; 3,600
responses were received, yielding a response rate of 32 percent. The vendor mailed 13,179 Child
Member Satisfaction Surveys to enrollees and received 4,489 responses, a response rate of 34
percent. This reflects an increase for the adult (one percentage point) and child (two percentage
points) surveys when compared with the CY 2012 data results.
11
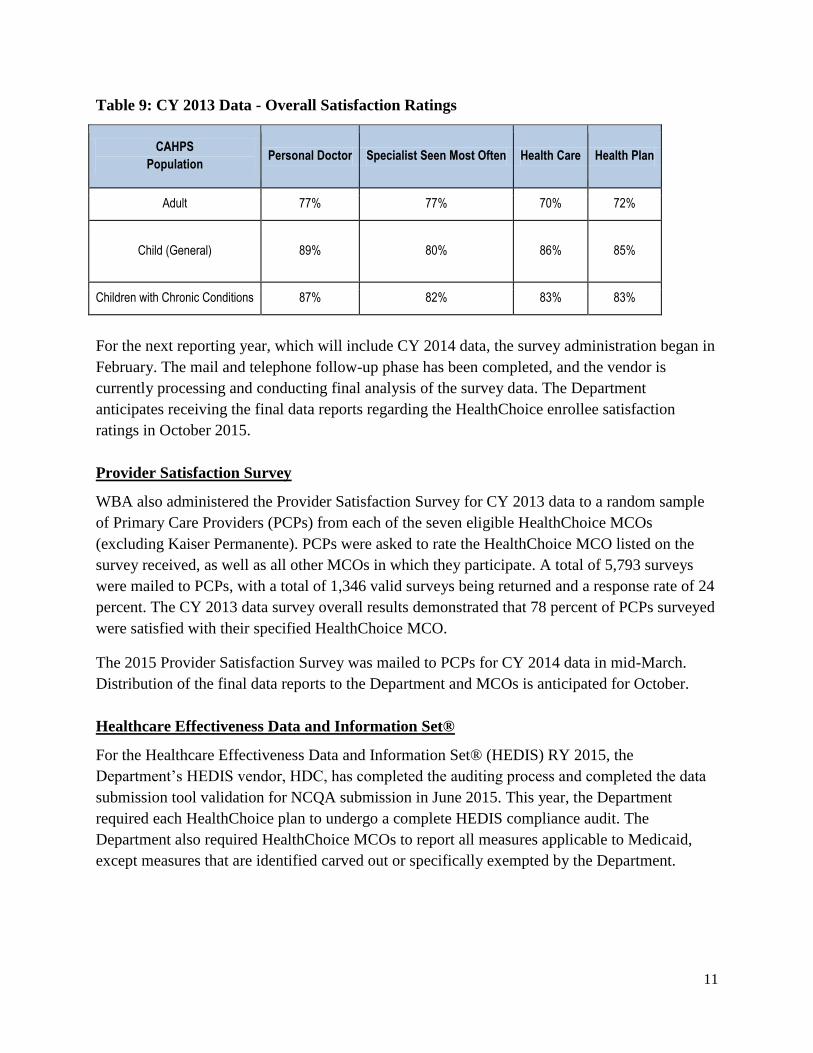
Table 9: CY 2013 Data - Overall Satisfaction Ratings
CAHPS
Population Personal Doctor Specialist Seen Most Often Health Care Health Plan
Adult 77% 77% 70% 72%
Child (General) 89% 80% 86% 85%
Children with Chronic Conditions 87% 82% 83% 83%
For the next reporting year, which will include CY 2014 data, the survey administration began in
February. The mail and telephone follow-up phase has been completed, and the vendor is
currently processing and conducting final analysis of the survey data. The Department
anticipates receiving the final data reports regarding the HealthChoice enrollee satisfaction
ratings in October 2015.
Provider Satisfaction Survey
WBA also administered the Provider Satisfaction Survey for CY 2013 data to a random sample
of Primary Care Providers (PCPs) from each of the seven eligible HealthChoice MCOs
(excluding Kaiser Permanente). PCPs were asked to rate the HealthChoice MCO listed on the
survey received, as well as all other MCOs in which they participate. A total of 5,793 surveys
were mailed to PCPs, with a total of 1,346 valid surveys being returned and a response rate of 24
percent. The CY 2013 data survey overall results demonstrated that 78 percent of PCPs surveyed
were satisfied with their specified HealthChoice MCO.
The 2015 Provider Satisfaction Survey was mailed to PCPs for CY 2014 data in mid-March.
Distribution of the final data reports to the Department and MCOs is anticipated for October.
Healthcare Effectiveness Data and Information Set®
For the Healthcare Effectiveness Data and Information Set® (HEDIS) RY 2015, the
Department’s HEDIS vendor, HDC, has completed the auditing process and completed the data
submission tool validation for NCQA submission in June 2015. This year, the Department
required each HealthChoice plan to undergo a complete HEDIS compliance audit. The
Department also required HealthChoice MCOs to report all measures applicable to Medicaid,
except measures that are identified carved out or specifically exempted by the Department.

12
For RY 2014—measuring CY 2013 HEDIS data—the following observations were noted:
The Controlling Blood Pressure measure Maryland Average Reportable Rate (MARR) is
still 3.5 percentage points, which is below the National HEDIS® Mean (NHM);
Customer Service, as reflected in the Call Answer Timeliness (CAT) measure, is still
above the NHM; however, there was a slight decrease in the MARR;
For the Use of Appropriate Medications for People with Asthma (ASM) measure the
overall performance score for the age group 5-50 is 87.5 percent, a decrease of 2.5
percentage points;
The HealthChoice plans had a substantial increase in the performance score for the Adult
BMI Assessment (ABA) measure, which increased 11 percentage points; the increase
was attributed to increased emphasis on supplemental data and a good medical record
hybrid review program;
The specifications for the Cervical Cancer Screening (CCS) measure changed this year;
however, the NHM is based on prior specifications—the MARR still increased 1.5
percentage points and remains above the NHM; and
A new measure this year was Weight Assessment and Counseling for Nutrition and
Physical Activity for Children/Adolescents (WCC); while no trend in the MARR is
available, the MARR is above the NHM in all three indicators.
HealthChoice MARR Highlights
Significant changes for the MARR from HEDIS® RY 2013 to HEDIS® RY 2014 include:
Childhood Immunization Status (CIS) Combo 10 (all immunizations): Increase of 3.5
percentage points;
Adult BMI Assessment: Increase of 11 percentage points;
ASM (5-50): Decrease of 2.5 percentage points;
Breast Cancer Screening (BCS): Increase of 7.3 percentage points;
Timeliness of Prenatal Care (TPC): Decrease of 11.8 percentage points;
Post-Partum Care (PPC): Decrease of 8.9 percentage points; and
Immunizations for Adolescents (IMA), Combo 1: Increase of 3.5 percentage points.
HealthChoice MARR Comparison to NHM
Maryland scored above the NHM in the following measures:
Call Answer Timeliness (CAT);
Persistence of Beta-Blocker Treatment After a Heart Attack (PBH);
Breast Cancer Screening (BCS);
Appropriate Testing for Children with Pharyngitis (CWP);
Adolescent Well-Care Visits (AWC);
Well-Child Visits in the Third, Fourth, Fifth and Sixth Years of Life (W34); and
Well-Child Visits in the First 15 Months of Life (W15) (6+ visits).
13
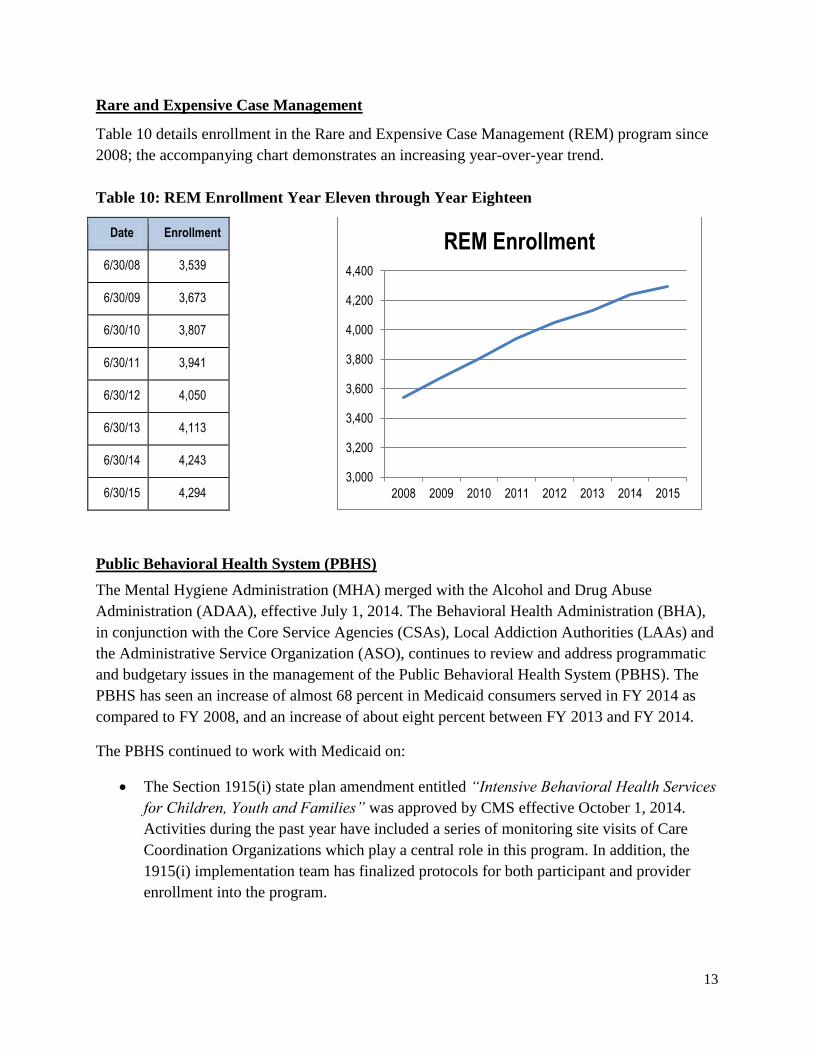
Rare and Expensive Case Management
Table 10 details enrollment in the Rare and Expensive Case Management (REM) program since
2008; the accompanying chart demonstrates an increasing year-over-year trend.
Table 10: REM Enrollment Year Eleven through Year Eighteen
Date Enrollment
6/30/08 3,539
6/30/09 3,673
6/30/10 3,807
6/30/11 3,941
6/30/12 4,050
6/30/13 4,113
6/30/14 4,243
6/30/15 4,294
Public Behavioral Health System (PBHS)
The Mental Hygiene Administration (MHA) merged with the Alcohol and Drug Abuse
Administration (ADAA), effective July 1, 2014. The Behavioral Health Administration (BHA),
in conjunction with the Core Service Agencies (CSAs), Local Addiction Authorities (LAAs) and
the Administrative Service Organization (ASO), continues to review and address programmatic
and budgetary issues in the management of the Public Behavioral Health System (PBHS). The
PBHS has seen an increase of almost 68 percent in Medicaid consumers served in FY 2014 as
compared to FY 2008, and an increase of about eight percent between FY 2013 and FY 2014.
The PBHS continued to work with Medicaid on:
The Section 1915(i) state plan amendment entitled “Intensive Behavioral Health Services
for Children, Youth and Families” was approved by CMS effective October 1, 2014.
Activities during the past year have included a series of monitoring site visits of Care
Coordination Organizations which play a central role in this program. In addition, the
1915(i) implementation team has finalized protocols for both participant and provider
enrollment into the program.
3,000
3,200
3,400
3,600
3,800
4,000
4,200
4,400
2008 2009 2010 2011 2012 2013 2014 2015
REM Enrollment

14
Implementation of telemental health services in designated jurisdictions. The BHA
submitted a state plan amendment submitted to CMS to reimburse psychiatrists and
originating sites in designated rural counties for certain telemental health services. CMS
has reviewed and approved Maryland’s state plan amendment. In the 2014 Maryland
legislative session, the General Assembly passed legislation to permit telehealth services
state-wide, including mental health services. Addiction services are not yet included. The
Department will be drafting regulations on this issue.
In collaboration with the Office of Long Term Care and Waiver Services, the
identification of non-institutional long-term support services which may be eligible for
enhanced matching payments under the Balancing Incentives Program (BIP). The BHA
is continuing to review its assessment instruments to see which meet the BIP criteria.
Participation in a statewide multi-agency process to improve the integration of care
across the behavioral and somatic domains. The process reforms the way the State
finances operate, in an effort to support reimbursement based on prevention and value
while strengthening clinical outcomes for Maryland consumers and their families. The
Department selected ValueOptions as the ASO to administer mental health and substance
use disorder services—ValueOptions also held the previous ASO contract, for specialty
mental health services. The new integrated system began January 1, 2015.
The BHA continues to collaborate with Maryland Medicaid on the implementation of a Health
Home SPA to serve those with serious and persistent mental illness, serious emotional
disturbances, and/or an opioid substance use disorder. The state began enrolling Health Home
providers in August 2013 and initiated service delivery during the last quarter of 2013. As of
June 2015, DHMH had approved 75 Health Home site applications. The Health Home sites
include 60 psychiatric rehabilitation programs, ten mobile treatment providers and five opioid
treatment programs. Current enrollment in the program exceeds 5,000 people. Ongoing analysis
of the program has identified possible positive trends in inpatient admissions and Emergency
Department visits among Health Homes participants. After six quarters of operation, rates for
both types of hospital encounters were lower among participants that had been in the Health
Homes continuously compared to those who had joined more recently. While the data remain
preliminary at this point, these findings suggest the program may be beginning to produce the
desired positive outcomes.
In mid-September 2008, the MHA launched the initial phase of its Outcomes Measurement
System (OMS) Datamart. The OMS was developed to collect information on individuals, ages 6
– 64, who are receiving outpatient mental health services from Maryland’s Public Mental Health
System. The Mental Hygiene Administration worked with ValueOptions, representatives from
the provider community and the University of Maryland, Systems Evaluation Center (SEC) to
implement an enhanced OMS Datamart, which became available in June 2012. The enhanced
Datamart includes outcome information at the provider, county and statewide levels. The data

15
that are currently available through the publically-accessible Datamart are aggregated responses
from consumers’ most recent OMS interviews, as well as change-over-time outcomes
information. In addition, an interface to allow provider access to OMS data for their own
programs is accessible to providers through a secure log-in process. Starting in January 2015,
several revisions were made to the OMS questionnaires, and Level 1 outpatient services for
Substance Related Disorders were included in the OMS workflow.
The BHA’s Office of Managed Care Operations and Compliance continues to review provider
billings and refers providers of concern to Maryland Medicaid Fraud Control Unit and Maryland
Office of the Inspector General.
The BHA continues to monitor the admission of consumers aged 21 – 64 with emergency
psychiatric conditions for inclusion in the Medicaid Emergency Psychiatric Demonstration
(MEPD). Maryland was one of 11 states selected to participate in the MEPD, which provides
reimbursement for certain services delivered by private psychiatric hospitals, for which Medicaid
reimbursement has historically been unavailable.
State Contact
Ms. Alice Middleton, Deputy Director
Office of Planning, Maryland Medicaid Administration
201 W. Preston Street, Rm. 223
Baltimore, Maryland 21201
(410) 767-3419