cms data for examining chronic conditions · • ims health’s uniform system of classification...
TRANSCRIPT

CMS DATA FOR EXAMINING
CHRONIC CONDITIONS Kimberly Lochner, Sc.D. – [email protected]
September 11, 2014

CMS - Medicare & Medicaid
• CMS is the insurance provider for over 100
million people in the U.S.
• ≈ over 50 million Medicare beneficiaries
• 9 million < 65 years (disabled)
• Over 40 million 65+ years
• ≈ 60 million Medicaid beneficiaries
• 29 million children
• 15 million adults
• 10 million disabled
• 5 million elderly
2

CMS Data for Research
• Medicare administrative data • Eligibility
• Age or disability
• Dual eligible for Medicaid
• Enrollment • Fee-for-Service (FFS) also known as “Original Medicare” or
Medicare Advantage Plan (HMO or PPO)
• Claims data • Derived from reimbursement information (the payment of bills)
• Available for FFS beneficiaries only
• Includes information on Medicare covered services - diagnoses/procedure codes, admission and discharge dates, charges and payments, place of service
3

Chronic Condition Public Use Files
• Prevalence, utilization indicators, and Medicare
spending (parts A/B) for FFS beneficiaries with
chronic conditions and multiple chronic conditions
• Aggregated to several geographic areas
• National
• State
• County
• Hospital referral region (HRR)
4

Chronic Conditions
• Conditions identified through Medicare claims
• 100% administrative data for Medicare beneficiaries enrolled in the FFS program
• Exclusions
• Beneficiaries with any Medicare Advantage enrollment
• Beneficiaries enrolled in Part A only or Part B only
• Alzheimer’s Disease/Dementia
• Diabetes
• Arthritis (OA/RA)
• Heart Failure
• Asthma
• Hyperlipidemia
• Atrial Fibrillation
• Hypertension
• Autism Spectrum Disorders
• Ischemic Heart Disease • Cancer (breast, colorectal, lung, and
prostate)
• Osteoporosis
• Chronic Kidney Disease • Schizophrenia/ Psychotic Disorders
• COPD • Stroke
• Depression
5

6

7
Excel
tables for
download

8


11

12


14

15

16
Selected Condition:
14
Selected Year:
Condition 2 Condition 3
Per capita
Medicare
spending ($):
Overall
Prevalence (%):
Overall
Per capita
Medicare
spending ($):
Males
Per capita
Medicare
spending ($):
Females
Prevalence (%):
Males
Prevalence (%):
Females
Per capita
Medicare
spending ($):
< 65
Per capita
Medicare
spending ($):
65+
Prevalence (%):
< 65
Prevalence (%):
65 +
Per capita
Medicare
spending ($):
Non dual
Per capita
Medicare
spending ($):
Dual
Prevalence (%):
Non dual
Prevalence (%):
Dual
Stroke Alzheimer's Disease/Dementia 39,478 2.2 42,257 37,726 1.9 2.3 53,591 38,667 0.9 2.4 37,325 42,226 1.6 3.8
Stroke Arthritis 36,238 3.0 38,631 34,938 2.4 3.4 44,012 35,467 1.9 3.1 33,050 42,879 2.7 3.8
Stroke Asthma 45,717 0.5 49,063 44,192 0.4 0.7 52,676 44,144 0.7 0.5 40,048 54,254 0.4 0.9
Stroke Atrial Fibrillation 40,950 1.6 42,399 39,828 1.6 1.6 60,259 40,062 0.5 1.8 37,475 51,368 1.6 1.6
Stroke Autism Spectrum Disorders 51,734 0.0 49,838 54,799 0.0 0.0 50,578 52,787 0.0 0.0 51,691 51,751 0.0 0.0
Stroke Cancer 39,065 0.8 39,016 39,116 1.0 0.7 51,795 38,480 0.3 0.9 36,148 49,372 0.8 0.7
Stroke Chronic Kidney Disease 46,969 2.5 47,743 46,287 2.8 2.4 63,210 44,854 2.1 2.6 42,029 55,757 2.2 3.7
Stroke COPD 47,913 1.6 49,416 46,667 1.7 1.5 55,881 46,751 1.5 1.6 43,776 54,291 1.3 2.5
Stroke Depression 43,562 2.2 47,571 41,276 1.8 2.4 47,790 42,747 2.5 2.1 41,260 46,709 1.7 3.7
Stroke Diabetes 38,256 3.0 38,911 37,711 3.2 2.9 46,562 36,910 3.0 3.0 33,769 45,467 2.5 4.6
Stroke Heart Failure 45,852 2.6 47,786 44,412 2.6 2.6 61,407 44,069 1.9 2.7 42,246 51,839 2.2 3.9
Stroke Hyperlipidemia 32,303 4.8 33,041 31,718 5.0 4.7 39,550 31,427 3.8 5.0 28,688 41,395 4.6 5.5
Stroke Ischemic Heart Disease 37,318 4.0 37,276 37,356 4.4 3.7 48,191 36,084 3.0 4.2 33,393 45,551 3.6 5.2
Stroke Osteoporosis 38,317 0.8 46,489 37,116 0.2 1.2 51,260 37,701 0.3 0.8 36,127 43,260 0.7 0.9
Stroke Schizophrenia and Other Psychotic Disorders 50,416 0.7 53,621 48,199 0.7 0.7 57,997 49,130 0.7 0.7 47,871 53,029 0.5 1.4
Chronic Condition Triads among Medicare Beneficiaries with at Least Three Chronic Conditions: Prevalence and Medicare Spending, 2008 - 2012Notes: This worksheet includes macros that enable the drop down selector for “Condition” and “Year”. Changing
column headings, adding columns, or changing the worksheet name can disable the macros, resulting in lost
functionality. If you would like to view all 680 triads at the same time, the file “Table Chronic Condition triads 2008-
2012.xlsx” provides that information.

OTHER PUBLIC CMS DATA
17

Geographic Variation Public Use Files
• Demographic, Medicare spending, utilization and
quality indicators
• Tabular data in Excel
• Dashboards
18

Geographic Variation: State-Level Dashboard
19

Geographic Variation: County-Level Dashboard
20

Medicare Provider Utilization and
Payment Data
• Hospital Inpatient
• Source: CMS Medicare Provider Analysis and Review
(MEDPAR) inpatient data
• Hospital Outpatient
• Source: CMS Medicare claims for hospital outpatient
services contained in the Medicare National Claims
History
• Physician and Other Supplier Data
• Source: final-action physician/supplier Part B non-
institutional line items
21

Average Hospital Inpatient Charges for
MS-DRG 286 for Hospitals in Manhattan, NY
22
MS-DRG 286: Circulatory Disorders except AMI with Cardiac Catheter with
Major Complications or Comorbidities

DISSEMINATING CMS
NON PUBLIC-USE DATA
23

Data Dissemination
• Research Data Assistance Center (ResDAC)
• Virtual Research Data Center (VRDC)
• Access CMS data virtually from your own workstation
• Only download aggregate results from the analyses
• Physical data provision
• Files created, encrypted, and copied to portable media
by CMS
• CMS ships files to researchers who must ensure the
security of the data at the researcher’s site
24

CMS Administrative Data for Research
• Medicare beneficiary demographics and
enrollment (1999-current)
• Medicare fee-for-service (FFS) claims (1999-
current)
• Medicare Part D event data (2006-current)
• Medicaid eligibility and claims (1999-2009)
• Medicare-Medicaid linked files (2006-2008)
• Assessment data (instrument inception-current)
25

Estimate Cohort Size and Cost –
www.ccwdata.org
26

Resources
CMS Chronic Conditions PUFs
www.cms.gov/Research-Statistics-Data-and-Systems/Statistics-Trends-and-Reports/Chronic-Conditions/index.html
CMS Geographic Variation PUFs
www.cms.gov/Research-Statistics-Data-and-Systems/Statistics-Trends-and-Reports/Medicare-Geographic-Variation/index.html
Medicare Provider Utilization and Payment Data
http://www.cms.gov/Research-Statistics-Data-and-Systems/Statistics-Trends-and-Reports/Medicare-Provider-Charge-Data/index.html
Technical Assistance
ResDAC – www.resdac.org
CCW – www.ccwdata.org
27

Matthew Ritchey, PT, DPT, OCS, MPH; [email protected]
Using administrative claims data for public health surveillance
Division for Heart Disease and Stroke Prevention
National Center for Chronic Disease Prevention and Health Promotion
Measuring antihypertensive medication (AHM) adherence
State Public Health Actions to Prevent and Control Diabetes, Heart Disease,
Obesity and Associated Risk Factors and Promote School Health (1305)
Grantee Meeting
September 11, 2014
Atlanta, GA

Purpose: Using the 1305 medication adherence
measure profile as a platform
Discuss the main decision points state public health staff
should consider when doing medication adherence analyses
Provide an overview of potential data sets states can explore
using to perform medication adherence analyses
Provide an overview of current medication adherence analyses
the Division for Heart Disease and Stroke Prevention (DHDSP)
is conducting, and discuss:
How they can help inform work at the state level
Need for data triangulation to understand a more complete picture of
adherence across the U.S. (and within states)

Measure: Proportion of patients with high blood
pressure adherent to medication regimens
Assess rates of AHM adherence among adult patients with high
blood pressure
Intermediate effect of interventions to increase:
Implementation of quality improvement processes
Team-based care in health systems
Use of health-care extenders to support self-management
In the US, CDC funded grantees worked to increase the
proportion of adult patients with high blood pressure in
adherence to AHM regimens from __% to __%

Who is this measure among?
Adults ≥18 years of age with high blood pressure who have
been prescribed AHMs
At least two fills for either the same AHM or AHMs in the same
drug class during the one year period
Clarification/decision points
Defining who is hypertensive?1
Prescribed and filled: measure of secondary adherence, not primary
adherence
Why at least two fills?
How do I define my AHMs?
1 https://www.ccwdata.org/web/guest/condition-categories

What medications are we following?
AHMs include:
Beta blockers; diuretics; calcium channel blockers (CCBs); angiotensin
converting enzyme inhibitor (ACEI); angiotensin receptor blocker (ARB);
other medications, including combinations
Clarification/decision points
How do we defined AHMs? What classification schema do we use to
properly categorize medications by their National Drug Code1 (NDC)?
• IMS Health’s Uniform System of Classification (USC)
• Truven Health’s Red Book: MarketScan
• Cerner’s Multum Lexicon: CDC’s national surveys (e.g., NHANES)
• First Databank and Medi-Span’s Master Drug Database: Centers for
Medicare and Medicare Services (CMS)
• Homegrown version
Do we follow all AHM use or just use of select AHMs as a proxy?
1 http://www.fda.gov/drugs/informationondrugs/ucm142438.htm

What adherence methodology do I use?
Two “main” adherence measures1:
Medication possession ratio
Proportion of days covered (PDC)
This measure uses the PDC methodology
Endorsed by the Pharmacy Quality Alliance (PQA)2 and National Quality
Forum3 (NQF); used by CMS for their Star Rating reporting4
Proportion of days in the eligibility period “covered” by prescription
claims for the same medication or another in its therapeutic category
Adequate adherence is defined for this performance measure as having
a PDC ≥80%4
1 Sattler, E. L., Lee, J. S., & Perri, M., 3rd. (2013). Medication (re)fill adherence measures derived from pharmacy claims data in older
Americans: a review of the literature. Drugs Aging, 30(6), 383-399.
2 http://pqaalliance.org/measures/default.asp; http://www.pqaalliance.org/images/uploads/files/PQA%20PDC%20vs%20%20MPR.pdf
3 http://www.qualityforum.org/QPS/0541
4 http://www.cms.gov/Medicare/Prescription-Drug-Coverage/PrescriptionDrugCovGenIn/PerformanceData.html

How do we determine our numerator?
1) Determine the patient’s measurement period
Index prescription date to the end of the calendar year, disenrollment, or
death
Clarification/decision points
Do we censor (exclude) the periods when people were hospitalized, in skilled
nursing facilities or were on hospice care?1
1 Attachment L: Medication Adherence Measure Calculations; CMS Star Ratings Technical Note:
http://www.cms.gov/Medicare/Prescription-Drug-Coverage/PrescriptionDrugCovGenIn/PerformanceData.html

How do we determine our numerator?
2) Within the measurement period, count the number of days the
patient was covered by at least one drug in the class based on
the prescription fill date and days of supply
If fills for the same drug overlap (generic level of active ingredient), then
adjust the prescription start date to be the day after the previous fill ended
If fills for a difference drug within the same class/category, then the
prescription start date is the date of the new fill

How do we determine our numerator?
3) Divide the number of covered days found in Step 2 by the
number of days found in Step 1
Multiply this number by 100 to obtain the PDC (as a percentage) for
each patient
4) Count the number of patients who had a PDC ≥80%
Clarification/decision points
How do we account for switching to/addition or use of other AHM
classes?
How do we account for gaps in coverage?

Simplified option
Follow the criteria outlined in the CMS Star Rating methodology
for “Measure D13”1
Adherence to prescribed drug therapy for renin angiotensin system
(RAS) antagonists
• ACEI, ARBs, or direct renin inhibitor medications; typically not prescribed
together
• List of RAS-related NDC codes are provided
Patients are only included if the first AHM fill occurs at least 91 days
before the end of the enrollment period
Value is weighted based on the total number of enrollment years the
patient meets the measure criteria (e.g., enrolled 6 months = 0.5 weight)
Acceptable option for initial reporting on the 1305 AHM
adherence measure
1 http://www.cms.gov/Medicare/Prescription-Drug-Coverage/PrescriptionDrugCovGenIn/PerformanceData.html; See “2015 Star
Ratings Technical Notes [PDF, 1MB] and 2015 Star Ratings Measures List [ZIP, 10KB]

Complex option(s)
Involves:
Developing algorithms to deal with switching1
Performing concurrent adherence measures, including weighted
analyses2
Not required for initial 1305 reporting
Explore as you develop expertise
Outside of the scope of this presentation
1 Chu et al. http://www.wuss.org/proceedings11/Papers_Chu_L_74886.pdf
Wang et al. http://support.sas.com/resources/papers/proceedings13/168-2013.pdf
Martin et al. http://aop.sagepub.com/content/43/1/36.full.pdf+html
Leslie et al. http://www.wuss.org/proceedings08/08WUSS%20Proceedings/papers/anl/anl09.pdf
2 Choudhry et al. http://www.ncbi.nlm.nih.gov/pmc/articles/PMC2873865/pdf/nihms183026.pdf

How do we determine our denominator?
Total number of adult patients who were dispensed
antihypertensive medications on two unique dates of service
during the one year measurement period within health care
systems in the state (or at the highest level possible)
Clarification/decision points
What data source(s) do I use?

Potential administrative claims data resources
Billing data, submitted with the intention of getting reimbursed
for services
Hospital and emergency department (ED) discharge data
Prescription medication fill claims data
Payer-specific claims data
Multi-payer claims data
State-based all payer claims databases (APCD)
Other data sources

Data source: Prescription medication fill claims data
Currently tracking use of AHMs using IMS Health’s Rx Factory
(a.k.a., National Prescription Audit) data
Lacks unique patient identifiers
No longitudinal analyses, including for adherence
Using near real-time data to track some potential predictors of
high adherence

Draft figures; preliminary data

Data source: Payer-specific prescription claims data
Potential sources:
Medicare Part D
State Medicaid program
Other proprietary health plan data within your state
Usually includes basic demographics, date of fill, supply, and
possibly referring physician and cost data

Data source: Payer-specific prescription claims data
To perform adherence analyses need access to patient
identifiers
May lack diagnosis information with medication data; if possible,
need to link with other files
Example: only able to do hypertension-specific AHM adherence
measures among Medicare Fee-for-service beneficiaries, not Medicare
Advantage beneficiaries
Issues with how to capture data on medications that are not billed for
(e.g., $4 generics)

Access to payer-specific claims data
Medicaid
State agency, often separate from the health department
Medicare
Virtual Research Data Center seat licenses
Relationships with regional payers, data aggregators, university
faculty

Data source: Multi-payer administrative claims data
CDC
Truven Health MarketScan data
• Commercial: employer-based private insurance
• Medicaid: 11 unidentified states
States
Uniquely positioned to take advantage of All Payer Claims Databases
(APCD)
• Compilation of all payers’ administrative claims data for all levels of service
(e.g., outpatient, inpatient, pharmacy) within a state
• Often includes a unique identification number for each patient and provider
• May not include Medicaid or Medicare data
• Likely does not include Tricare or Veteran Affairs (VA) data

Current APCD activity by state
http://www.apcdcouncil.org/state/map

How do you access your state’s APCD?
Steward depends on the state
Continuum of access
Direct queries of the system to submission of project-specific requests
Often about 1 year lag time until claims are adjudicated and
permitted for use
May need to improve IT infrastructure to handle large datasets
Hardware (e.g., server capacity)
Software (e.g., statistical software)
Develop analytic samples for exploratory analyses

Other potential data sources
Electronic Health Record (EHR) system data, including data
from health information exchanges, that are linked with
pharmacy data EHR data
May not be reliable unless has bidirectional information sharing
capabilities with local pharmacies
Community health centers (CHC) who report on NQF 05411
However, data from multiple CHCs is not mutually exclusive
Utilization Review Accreditation Commission (URAC)2
Accredits pharmacy quality management programs
National Business Coalition on Health (NBCH)3
Evaluates health plans
Patient-centric pharmacy claims data
1 http://www.qualityforum.org/QPS/0541
2 https://www.urac.org/accreditation-and-measurement/measurement/performance-measurement/specifications-overview/
3 http://www.nbch.org/eValue8

• Department of Defense (?)
• MarketScan Private Insurers
• Medicare Part D
• MarketScan Medicaid
Ages 18-64; public
insurance
Ages ≥65; Medicare coverage (FFS and
MA)
Current/ retired
uniformed service
members and their families
Ages 18-64; employer-
based private
insurance Adherence
predictors
Data: IMS
DHDSP’s “triangulation” of medication adherence data
Medicare Fee-for-service (FFS)
Medicare Advantage (MA) (limited)
TIME (historical) (current)

• ? • All Payer Claim Data
• Medicare Part D
• APDC?
• State Medicaid
• APCD?
Ages 18-64; public
insurance
Ages ≥65; Medicare coverage (FFS and
MA)
Current/ retired
uniformed service
members and their families
Ages 18-64; employer-
based private
insurance Adherence
predictors
Data: ?
TIME
Your state’s “triangulation” of medication adherence data
Medicare Fee-for-service (FFS)
Medicare Advantage (MA) (limited?)
(historical) (current)
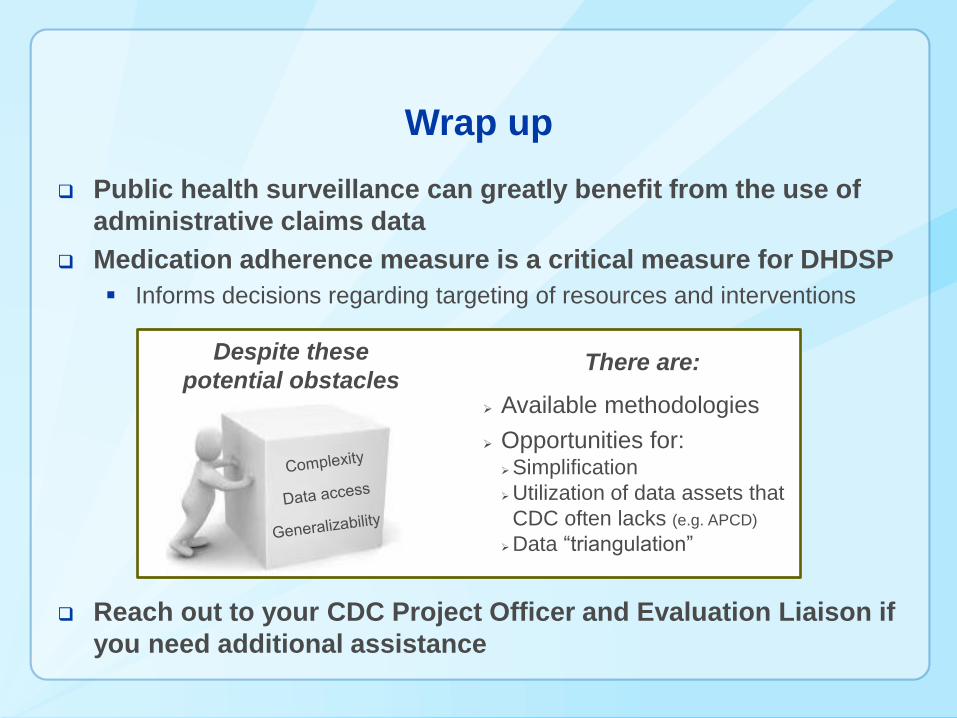
Public health surveillance can greatly benefit from the use of
administrative claims data
Medication adherence measure is a critical measure for DHDSP
Informs decisions regarding targeting of resources and interventions
Reach out to your CDC Project Officer and Evaluation Liaison if
you need additional assistance
Wrap up
Available methodologies
Opportunities for: Simplification
Utilization of data assets that
CDC often lacks (e.g. APCD)
Data “triangulation”
Despite these
potential obstacles There are:

Using State Medicaid Data to Measure Medication Adherence to Inform State
Actions to Control HBP: An Example from NY
Rachael Ruberto, MPH, CPH
Bureau of Chronic Disease Evaluation & Research
New York State Department of Health
Payer Systems, Payer Data and HTN Control CDC 1305 Grantee Meeting 9.11.14

54
Outline • Overview of Medication Adherence
– Definition and Public Health Problem
• Project Context
• Project Goal
• Key Components of the Project
– Partners, Measure Development, Programming Measures, Producing Rates/Metrics
• Limitations/Challenges
• Key Themes
• Where We Are
• Next Steps

55
Medication Adherence
• Patient’s conformance with the provider’s recommendation with respect to timing, dosage and frequency of medication-taking during the prescribed length of time (CDC, 2013)
• Medication adherence has been called “the next frontier” in clinical quality improvement (Ho et al, 2009)

56
What is the Problem?
Non-adherence is prevalent
Associated with adverse outcomes
↑ aging population with chronic disease
Higher costs of care

57
Gap between Written Rx and Actual Use

58
Context
Improving Rx and adherence to appropriate medications for the ABCs is a key aim of Million Hearts
FQHC clinicians identified pharmacy data as a key gap in conducting local QI projects to improve HBP control
Aligns with CDC Performance Measures for Domains 3 & 4

59
What is our Goal?
Goal: Integrate information on medication adherence from Medicaid and other payers into initiatives to
improve high blood pressure control among New Yorkers
Conduct public health surveillance
on medication adherence for hypertension
Establish a data source for ongoing
performance measurement and reporting to CDC
Support local evaluation of clinical quality improvement
initiatives

60
Key Components of the Project
Project Partners
Measure Development
Producing Rates/Metrics
Programming Measures

61
Component 1: Critical Partners
NYSDOH Division of
Chronic Disease Prevention
Health Center
Network of NY
FQHCs
IPRO
(QIO) Office of
Quality and Patient Safety
CDC
ASTHO · Care providers · Clinical experts
· Subject matter experts · Programmers
· EHR experts · Clinical support
· Data owners · Subject matter experts
· Funder · Measurement
steward
· Funder
𝐶𝑜𝑛𝑣𝑒𝑛𝑒𝑟

62
Component 2: Measure Development
Conceptual agreement
Clinical agreement
Identify and adapt technical definitions of metrics

63
Treated patients
Never fill the Rx
Primary non-adherent
Fill Rx once
When 1 or more refill is prescribed
Early stop
When no refill is prescribed
Maybe adherent
Fill Rx 2+ times
MPR PDC
Diagram of Potential Measures of Adherence for Patients Prescribed Medications

64
Measure Development - Specifications
Available PQA specifications for
measure of primary-non adherence to
chronic disease medications (based
on e-prescribing data)
Modified specifications for
(any) fill rate measure: percentage of Medicaid patients prescribed an AHM that had a claim for the Rx drug during
measurement period
What we started with….
…where we ended up

65
Component 3: Programming Measures
Programming measures into SAS to run on Medicaid data
Determining appropriate NDC drug lists to include*
Modifying specifications as programming issues occur

66
Programming Measures: HTN Medications
Start with most comprehensive drug
list available
Clinical review by pharmacy
team
Ensure alignment with CG
Clinical review by Health
Center MDs
CDC-L-2014 MPM-C-2014 PBH-B-2014
NDC Code
Active Ingredient

67
Component 4: Development of Rates/Metrics
Determining types of adherence rates to calculate (statewide, practice site)
Generate lists of Medicaid recipients who are numerator/ denominator compliant
Link practice and provider NPIs to Medicaid data to create adherence rates

68
Development of Rates/Metrics
Statewide: • Key for surveillance of medication adherence and
monitoring 1305 performance measures on regular basis • Expand to county and regional (DSRIP) level rates
Practice Site Locations: • FQHCs supply crosswalk of provider and practice NPIs • Attribute patients to practice based on NPI associated
with most recent face-to-face medical visit in claims data
Provider Level: • Did not generate based on complexity of attributing
patients to individual providers within health centers

69
Limitations/Challenges
• Existing standards are not “one size fits all”
• New terminology
• Secondary claims data analysis
• Population covered
• Data structure
• Timeliness
• Complexity

70
Key Themes From NY Experience Working With Payer Data
What Changed What Didn’t
Key Partners New partners with subject matter expertise, new people
from existing partnerships
DOH plays convening role to engage the right partners around
the table
Measures New pharmacy metrics, terminology and technical
specifications
Process of identifying measures, achieving consensus and
modifying specs as necessary
Datasets/data structure
New data (Medicaid/clinic) and structural considerations for
programming/linkage
Programming measures to fit large, complex health data sets;
identifying linkage variables
Measurement process
New clarification/ decision points around who is included and which meds to consider
Still concerned with finding who is in the numerator and
denominator to calculate rates

71
Project Status: Where We Are
• Finalized NDC drug lists and specifications
• Programmed PDC 2012 Medicaid data for Statewide and practice location rates (IPRO) – Fill rate measure programming initiated
• HCNNY/ Health Center clinicians reviewing and grouping Rx data to support generating lists of patient adherence
• Expected by project deadline (9/30/14): – Reports and lists of medication adherence statewide and for each of
the 3 participating Health Centers • # and % of HTN patients meeting PDC adherence threshold (80%)
• # and % with HTN with a claim for an AHM (and without)
– Final SAS code for continued programming of adherence measures in future years
– Standardized medication groupings for HCNNY Health Centers

72
Working with Payer Data: Next Steps
• Sustainability: Shared BCDER/OQPS Research Scientist starting Sept 2014
• Expand use of medication adherence data for program planning and establishing and tracking performance standards
• Expand medication adherence analyses to additional payer data sources, NYS All Payer Database (NY APD)
• Explore the use of alternative sources (non-payer) to generate medication adherence rates, RHIOs (e-pharmacy + claims)

73
Acknowledgements
• BCDER:
– Ian Brissette
• BCCDP:
– Tiana Wyrick
– Pat Waniewski
• Office of Quality and Patient Safety:
– Lindsay Cogan
• IPRO
– Paul Henfield
– Mary Dramatinos
– Jeanne Alicandro
– Darren Triller
– Anne Myrcka
– Susan Wymer
• ASTHO
• HCNNY
– Meg Meador
– Sandy Carfachio
• FQHCs
– Whitney Young
– HRHC
– Finger Lakes

Questions??
Rachael Ruberto Bureau of Chronic Disease Evaluation and Research
Division of Chronic Disease Prevention
New York State Department of Health
Contact: