cmt 4q 2017 sgx(breaklink)cmt.listedcompany.com/newsroom/20180123_cmt_annc_4q2017_results.pdf · 18...
TRANSCRIPT

_____________________________________________________________________
CAPITALAND MALL TRUST
2017 FULL YEAR UNAUDITED FINANCIAL STATEMENT AND DISTRIBUTION ANNOUNCEMENT
_____________________________________________________________________
TABLE OF CONTENTS
Item No. Description Page No.
- Summary of CMT Results 2
- Introduction 3
1(a) Statements of Total Return & Distribution Statements 4-9
1(b)(i) Statements of Financial Position 10-11
1(b)(ii) Aggregate Amount of Borrowings and Debt Securities 12
1(c) Statements of Cash Flow 13-14
1d(i) Statements of Movements in Unitholders’ Funds 15-16
1d(ii) Details of Any Change in the Units 17
2 & 3 Audit Statement 17-18
4 & 5 Changes in Accounting Policies 17-18
6 Earnings Per Unit and Distribution Per Unit 18
7 Net Asset Value / Net Tangible Asset Per Unit 19
8 Review of the Performance 20-21
9 Variance from Previous Forecast / Prospect Statement 21
10 Outlook & Prospects 21
11 & 12 Distributions 22-23
13 Interested Person Transactions 23
14 & 15 Segmental Information 24-25
16 Breakdown of Revenue and Net Income 25
17 Breakdown of Total Distribution 25
18 Confirmation Pursuant to Rule 720(1) of the Listing Manual 25
19 Confirmation Pursuant to Rule 704(13) of the Listing Manual 25

CAPITALAND MALL TRUST 2017 FULL YEAR UNAUDITED FINANCIAL STATEMENT & DISTRIBUTION ANNOUNCEMENT
_____________________________________________________________________
Page 2 of 25
Summary of CMT Results
FY 2016 FY 2017
2017
1 July to 30 September
1 October to 31 December
Actual Actual Actual Actual
Gross Revenue (S$’000) 689,732 682,469 169,405 172,402
Net Property Income (S$’000) 479,679 478,234 121,365 119,258
Amount Available for Distribution (S$’000) 424,368 413,003 105,257 100,131
Distributable Income (S$’000) 394,3231 395,8242 98,6802 102,9333
Distribution Per Unit (“DPU”) (cents)
For the period 11.13¢ 11.16¢ 2.78¢ 2.90¢
Annualised 11.13¢ 11.16¢ 11.03¢ 11.51¢
Footnotes:
1. Capital distribution and tax-exempt income of S$12.9 million received from CapitaLand Retail China Trust
(“CRCT”) in FY 2016 had been retained for general corporate and working capital purposes. Following the completion of the sale of the office strata units of Westgate Tower on 20 October 2016, CapitaLand Mall Trust (“CMT”) received S$17.1 million of capital distribution from Infinity Office Trust (“IOT”), which had also been retained for general corporate and working capital purposes.
2. Capital distribution and tax-exempt income of S$17.2 million received from CRCT in FY 2017 had been retained for general corporate and working capital purposes. For 3Q 2017, capital distribution received from CRCT of S$6.6 million had been retained for general corporate and working capital purposes.
3. In 4Q 2017, CMT had released S$7.6 million of its taxable income available for distribution retained in 1H 2017 to holders of units in CMT (“Units” and holder of units, “Unitholders”). Advanced distribution comprising tax-exempt income of S$4.8 million received from CRCT in respect of the period from 1 July 2017 to 6 December 2017 had been retained for general corporate and working capital purposes.
DISTRIBUTION & BOOKS CLOSURE DATE
Distribution For 1 October 2017 to 31 December 2017
Distribution type Taxable income
Distribution rate Taxable income distribution of 2.90 cents per Unit
Books closure date 1 February 2018
Payment date 28 February 2018

CAPITALAND MALL TRUST 2017 FULL YEAR UNAUDITED FINANCIAL STATEMENT & DISTRIBUTION ANNOUNCEMENT
_____________________________________________________________________
Page 3 of 25
INTRODUCTION
CMT was constituted under a trust deed dated 29 October 2001 entered into between CapitaLand Mall Trust Management Limited (as manager of CMT) (the “Manager”) and HSBC Institutional Trust Services (Singapore) Limited (as trustee of CMT) (the “Trustee”), as amended.
CMT is the first Real Estate Investment Trust (“REIT”) listed on Singapore Exchange Securities Trading Limited (the “SGX–ST”) in July 2002.
The principal activity of CMT is to own and invest in quality income producing real estate, which is used or substantially used for retail purposes with the primary objective of achieving an attractive level of return from rental income and for long term capital growth.
CMT’s current portfolio comprises 16 shopping malls which are strategically located in the suburban areas and downtown core of Singapore - Tampines Mall, Junction 8, Funan (formerly known as Funan DigitaLife Mall), IMM Building (“IMM”), Plaza Singapura, Bugis Junction, Sembawang Shopping Centre, JCube, a 40.0% stake in Raffles City Singapore (“RCS”) held through RCS Trust, Lot One Shoppers’ Mall, 90 out of 91 strata lots in Bukit Panjang Plaza, The Atrium@Orchard, Clarke Quay, Bugis+, a 30.0% stake in Westgate held through Infinity Mall Trust (“IMT”) and Bedok Mall held through Brilliance Mall Trust (“BMT”).
In relation to the redevelopment of Funan, three private trusts, namely Victory Office 1 Trust (“VO1T”), Victory Office 2 Trust (“VO2T”) and Victory SR Trust (“VSRT”) (collectively, the “Victory Trusts”) were constituted on 30 August 2016 by CMT. CMT, together with Victory Trusts, jointly own and undertake to redevelop Funan which comprises a retail component (held through CMT), two office towers and serviced residences.
On 31 October 2017, CMT divested all of the units held in VSRT, which holds the serviced residence component of Funan, to Victory SR Pte. Ltd.
CMT owns approximately 12.7% interest in CRCT, the first China shopping mall REIT listed on the SGX-ST in December 2006.
On 10 November 2017, CMT MTN Pte. Ltd. (“CMT MTN”), a wholly owned subsidiary of CMT, issued fixed rate notes of S$100 million due 10 November 2027 through its S$3.5 billion Multicurrency Medium Term Note Programme (“MTN Programme”) at 2.88% per annum. The proceeds from this issuance had been used to refinance the existing borrowings of CMT.

CAPITALAND MALL TRUST 2017 FULL YEAR UNAUDITED FINANCIAL STATEMENT & DISTRIBUTION ANNOUNCEMENT
_____________________________________________________________________
Page 4 of 25
1(a)(i) Statements of Total Return and Distribution Statements (4Q 2017 vs 4Q 2016)
Group Trust
Statements of Total Return 4Q 2017 4Q 2016 % 4Q 2017 4Q 2016 %
S$’000 S$’000 Change S$’000 S$’000 Change
Gross rental income 158,226 156,742 0.9 145,258 142,745 1.8
Car park income 5,232 4,227 23.8 4,741 4,227 12.2
Other income 8,944 8,377 6.8 8,176 7,823 4.5
Gross revenue 172,402 169,346 1.8 158,175 154,795 2.2
Property management fees (6,498) (6,390) 1.7 (5,978) (5,843) 2.3
Property tax (14,049) (11,771) 19.4 (12,737) (10,455) 21.8
Other property operating expenses 1 (32,597) (34,993) (6.8) (29,975) (31,971) (6.2)
Property operating expenses (53,144) (53,154) (0.0) (48,690) (48,269) 0.9
Net property income 119,258 116,192 2.6 109,485 106,526 2.8
Interest and other income 2 3,238 2,542 27.4 8,084 6,918 16.9
Investment income 3 - - - 25,922 39,032 (33.6)
Management fees (11,326) (11,031) 2.7 (10,272) (9,953) 3.2
Trust expenses (981) (1,221) (19.7) (931) (737) 26.3
Finance costs (26,106) (26,911) (3.0) (26,191) (26,911) (2.7)
Net income before share of results of associate and joint ventures
84,083 79,571 5.7 106,097 114,875 (7.6)
Share of results (net of tax) of:
- Associate 4 7,444 2,412 NM - - -
- Joint ventures 5 10,812 6,172 75.2 - - -
Net income 102,339 88,155 16.1 106,097 114,875 (7.6)
Net change in fair value of investment properties
25,471 13,056 95.1 25,357 13,081 93.8
Net change in fair value of investment properties under development
(516) - NM (281) - NM
Gain on divestment of subsidiary 6 - - - 19,678 - NM
Impairment loss written back 7 - - - 2,129 2,245 (5.2)
Dilution (loss)/gain of interest in associate
(23) 134 NM - - -
Total return for the period before taxation
127,271 101,345 25.6 152,980 130,201 17.5
Taxation 8 (159) (1,026) (84.5) (159) (1,026) (84.5)
Total return for the period 127,112 100,319 26.7 152,821 129,175 18.3
Distribution Statements
Net income before share of results of associate and joint ventures
84,083 79,571 5.7 106,097 114,875 (7.6)
Net effect of non-tax chargeable items 9
(5,955) (7,328) (18.7) (5,966) (7,706) (22.6)
Distributions from associate 4,798 - NM - - -
Distributions from joint ventures 10 16,940 33,848 (50.0) - - -
Net loss from subsidiaries 11 265 1,078 (75.4) - - -
Amount available for distribution to Unitholders
100,131 107,169 (6.6) 100,131 107,169 (6.6)
Distributable income to Unitholders 12
102,933 102,069 0.8 102,933 102,069 0.8

CAPITALAND MALL TRUST 2017 FULL YEAR UNAUDITED FINANCIAL STATEMENT & DISTRIBUTION ANNOUNCEMENT
_____________________________________________________________________
Page 5 of 25
Footnotes:
1. Included as part of the other property operating expenses are the following:
Group Trust
4Q 2017 4Q 2016 % 4Q 2017 4Q 2016 %
S$’000 S$’000 Change S$’000 S$’000 Change
Depreciation and amortisation 163 253 (35.6) 158 186 (15.1)
Allowance for doubtful debts and bad debts written off
22 2 NM 22 2 NM
2. At Group level, it includes interest income on the unitholders’ loans extended to IMT. At Trust level, it includes interest income on the unitholders’ loans to BMT, Victory Trusts and IMT.
3. For 4Q 2017, this relates to distributions from BMT, RCS Trust, IMT and CRCT. For 4Q 2016, this relates to
distributions from BMT, RCS Trust as well as IMT and IOT (collectively, the “Infinity Trusts”).
4. Share of result of associate relates to the equity accounting of CRCT’s result on a 3-month lag basis.
5. This relates to the Group’s 40.0% interest in RCS Trust and 30.0% interest in the Infinity Trusts. Details are as follows:
Group
4Q 2017 4Q 2016 %
S$’000 S$’000 Change
Share of results (net of tax) of joint ventures
- Gross revenue 28,417 29,229 (2.8)
- Property operating expenses (7,302) (8,427) (13.3)
- Net property income 21,115 20,802 1.5
- Finance costs (4,975) (4,936) 0.8
- Net change in fair value of investment properties (4,480) (8,136) (44.9)
- Others (A) (848) (1,558) (45.6)
10,812 6,172 75.2
(A) Included management fees of RCS Trust.
6. This relates to the gain arising from the divestment of VSRT which was completed on 31 October 2017.
7. For 4Q 2017, this relates to write back of impairment loss in respect of CMT’s interest in BMT and IMT. For 4Q
2016, this relates to write back of impairment loss in respect of CMT’s interest in IMT partially offset by impairment loss recognised in respect of CMT’s interest in BMT.
8. For 4Q 2017, this relates to tax assessed on CMT by the Inland Revenue Authority of Singapore (“IRAS”) for year of assessment (“YA”) 2013. For 4Q 2016, this relates to tax assessed for YA 2012. The IRAS has disallowed certain expenses incurred in the year ended 31 December 2012 and 31 December 2011 and did not allow such adjustments to be included under the Rollover Income Adjustment (“RIA”).
9. Included in the non-tax chargeable items are the following:
Group Trust
4Q 2017 4Q 2016 % 4Q 2017 4Q 2016 %
S$’000 S$’000 Change S$’000 S$’000 Change
Non-tax chargeable items
- Trustee’s fees 320 310 3.2 319 310 2.9
- Temporary differences and other adjustments (A)
(6,275) (7,638) (17.8) (6,285) (8,016) (21.6)
Net effect of non-tax chargeable items
(5,955) (7,328) (18.7) (5,966) (7,706) (22.6)
(A) Includes capital allowances claim on assets that qualify as plant and machinery under the Income Tax Act.
CAPITALAND MALL TRUST 2017 FULL YEAR UNAUDITED FINANCIAL STATEMENT & DISTRIBUTION ANNOUNCEMENT
_____________________________________________________________________
Page 6 of 25
10. Distributions from joint ventures relate to CMT’s 40.0% interest in RCS Trust and 30.0% interest in the Infinity Trusts.
11. This relates to CMT MTN and the Victory Trusts. For VSRT, it relates to the loss for the period up to 31 October 2017.
12. In 4Q 2017, CMT had released S$7.6 million of its taxable income available for distribution retained in 1H 2017 to Unitholders. Advanced distribution comprising tax-exempt income of S$4.8 million received from CRCT for the period from 1 July 2017 to 6 December 2017 had been retained for general corporate and working capital purposes. In 4Q 2016, CMT had released S$12.0 million of its taxable income available for distribution to Unitholders. S$17.1 million of capital distribution received from IOT had been retained for general corporate and working capital purposes. NM – not meaningful

CAPITALAND MALL TRUST 2017 FULL YEAR UNAUDITED FINANCIAL STATEMENT & DISTRIBUTION ANNOUNCEMENT
_____________________________________________________________________
Page 7 of 25
1(a)(i) Statements of Total Return and Distribution Statements (FY 2017 vs FY 2016)
Group Trust
Statements of Total Return FY 2017 FY 2016 % FY 2017 FY 2016 %
S$’000 S$’000 Change S$’000 S$’000 Change
Gross rental income 629,366 639,598 (1.6) 577,953 583,465 (0.9)
Car park income 19,954 17,111 16.6 19,018 17,111 11.1
Other income 33,149 33,023 0.4 31,093 31,033 0.2
Gross revenue 682,469 689,732 (1.1) 628,064 631,609 (0.6)
Property management fees (26,002) (26,142) (0.5) (23,923) (23,891) 0.1
Property tax (56,928) (56,104) 1.5 (51,851) (50,968) 1.7
Other property operating expenses 1 (121,305) (127,807) (5.1) (111,146) (119,016) (6.6)
Property operating expenses (204,235) (210,053) (2.8) (186,920) (193,875) (3.6)
Net property income 478,234 479,679 (0.3) 441,144 437,734 0.8
Interest and other income 2 10,078 11,331 (11.1) 29,073 27,211 6.8
Investment income 3 - - - 97,829 115,784 (15.5)
Management fees (45,051) (44,619) 1.0 (40,788) (40,671) 0.3
Trust expenses (3,871) (4,367) (11.4) (3,612) (3,806) (5.1)
Finance costs (104,099) (106,318) (2.1) (104,300) (106,318) (1.9)
Net income before share of results of associate and joint ventures
335,291 335,706 (0.1) 419,346 429,934 (2.5)
Share of results (net of tax) of:
- Associate 4 18,832 14,504 29.8 - - -
- Joint Ventures 5 51,541 52,347 (1.5) - - -
Net income 405,664 402,557 0.8 419,346 429,934 (2.5)
Net change in fair value of investment properties
233,012 68,503 NM 232,167 68,469 NM
Net change in fair value of investment properties under development
19,681 - NM (281) - NM
Gain on divestment of subsidiary 6 - - - 19,678 - NM
Impairment loss (recognised)/ written back 7
- - - (26,328) 1,268 NM
Dilution loss of interest in associate (550) (634) (13.2) - - -
Total return for the year before taxation
657,807 470,426 39.8 644,582 499,671 29.0
Taxation 8 (159) (1,026) (84.5) (159) (1,026) (84.5)
Total return for the year 657,648 469,400 40.1 644,423 498,645 29.2
Distribution Statements
Net income before share of results of associate and joint ventures
335,291 335,706 (0.1) 419,346 429,934 (2.5)
Net effect of non-tax chargeable items 9
(6,421) (5,418) 18.5 (6,472) (5,992) 8.0
Distributions from associate 17,179 12,945 32.7 - - -
Distributions from joint ventures 10 63,891 79,632 (19.8) - - -
Rollover adjustment 11 129 426 (69.7) 129 426 (69.7)
Net loss from subsidiaries 12 2,934 1,077 NM - - -
Amount available for distribution to Unitholders
413,003 424,368 (2.7) 413,003 424,368 (2.7)
Distributable income to Unitholders 13
395,824 394,323 0.4 395,824 394,323 0.4

CAPITALAND MALL TRUST 2017 FULL YEAR UNAUDITED FINANCIAL STATEMENT & DISTRIBUTION ANNOUNCEMENT
_____________________________________________________________________
Page 8 of 25
Footnotes:
1. Included as part of the other property operating expenses are the following:
Group Trust
FY 2017 FY 2016 % FY 2017 FY 2016 %
S$’000 S$’000 Change S$’000 S$’000 Change
Depreciation and amortisation 704 1,114 (36.8) 685 772 (11.3)
Allowance for doubtful debts and bad debts written off
24 17 41.2 24 17 41.2
2. At Group level, this includes interest income on the unitholders’ loans to IMT. At Trust level, it includes interest
income on the unitholders’ loans to BMT, Victory Trusts and IMT.
3. Investment income relates to distributions from BMT, RCS Trust, the Infinity Trusts and CRCT.
4. Share of result of associate relates to the equity accounting of CRCT’s results on a 3-month lag basis.
5. This relates to the Group’s 40.0% interest in RCS Trust and 30.0% interest in the Infinity Trusts. Details are as follows:
Group
FY 2017 FY 2016 %
S$’000 S$’000 Change
Share of results (net of tax) of joint ventures
- Gross revenue 112,967 117,769 (4.1)
- Property operating expenses (28,167) (31,102) (9.4)
- Net property income 84,800 86,667 (2.2)
- Finance costs (19,197) (21,563) (11.0)
- Net change in fair value of investment properties (8,543) (7,578) 12.7
- Others (A) (5,519) (5,179) 6.6
51,541 52,347 (1.5)
(A) Includes management fees of RCS Trust.
6. This relates to the gain arising from the disposal of VSRT which was completed on 31 October 2017.
7. For FY 2017, this relates to impairment loss recognised in respect of CMT’s interest in IMT partially offset by write
back of impairment loss in respect of CMT’s interest in BMT. FY 2016, it relates to write back of impairment loss in respect of CMT’s interest in IMT partially offset by impairment loss recognised in respect of CMT’s interest in BMT.
8. For FY 2017, this relates to tax assessed on CMT by IRAS for YA 2013. For FY 2016, this relates to tax assessed for YA 2012. The IRAS has disallowed certain expenses incurred in the year ended 31 December 2012 and 31 December 2011 and did not allow such adjustments to be included under the RIA.
9. Included in the non-tax chargeable items are the following:
Group Trust
FY 2017 FY 2016 % FY 2017 FY 2016 %
S$’000 S$’000 Change S$’000 S$’000 Change
Non-tax chargeable items
- Trustee’s fees 1,257 1,255 0.2 1,255 1,253 0.2
- Temporary differences and other adjustments (A)
(7,678) (6,673) 15.1 (7,727) (7,245) 6.7
Net effect of non-tax chargeable items
(6,421) (5,418) 18.5 (6,472) (5,992) 8.0
(A) Includes capital allowances claim on assets that qualify as plant and machinery under the Income Tax Act.

CAPITALAND MALL TRUST 2017 FULL YEAR UNAUDITED FINANCIAL STATEMENT & DISTRIBUTION ANNOUNCEMENT
_____________________________________________________________________
Page 9 of 25
10. For FY 2017, distributions from joint ventures relate to CMT’s 40.0% interest in RCS Trust and 30.0% interest in IMT. For FY 2016, distributions from joint ventures relate to CMT’s 40.0% interest in RCS Trust and 30.0% interest in Infinity Trusts.
11. This relates to the difference between taxable income previously distributed and the quantum finally agreed with IRAS. For FY 2017, it relates to the taxable income for YA 2014 and YA 2015. For FY 2016, it relates to the taxable income for YA 2014.
12. This relates to CMT MTN and the Victory Trusts. For VSRT, it relates to the loss for the period up to 31 October 2017.
13. For FY 2017, capital distribution and tax-exempt income of S$17.2 million received from CRCT for the period from 1 July 2016 to 6 December 2017 had been retained for general corporate and working capital purposes. For FY 2016, CMT had retained S$12.9 million of capital distribution and tax-exempt income received from CRCT for general corporate and working capital purposes. In addition, S$17.1 million of capital distribution received from IOT had also been retained for general corporate and working capital purposes.
NM – not meaningful
CAPITALAND MALL TRUST 2017 FULL YEAR UNAUDITED FINANCIAL STATEMENT & DISTRIBUTION ANNOUNCEMENT
_____________________________________________________________________
Page 10 of 25
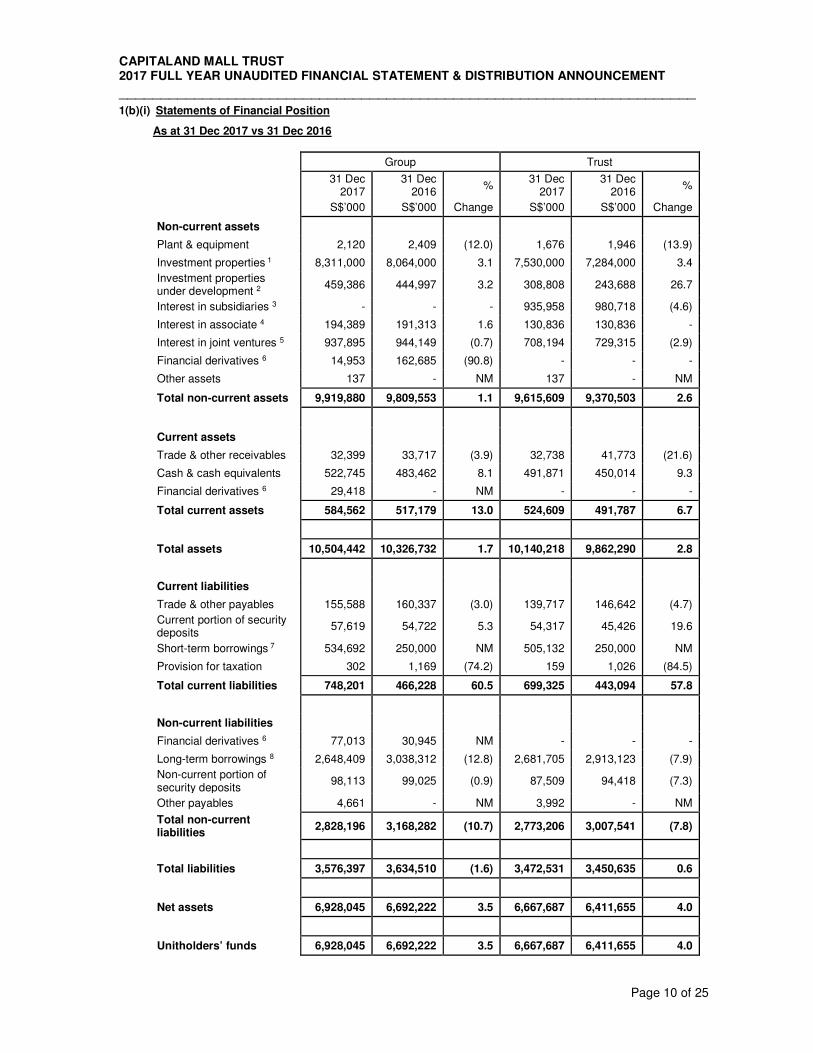
1(b)(i) Statements of Financial Position
As at 31 Dec 2017 vs 31 Dec 2016
Group Trust
31 Dec
2017 31 Dec
2016 %
31 Dec 2017
31 Dec 2016
%
S$’000 S$’000 Change S$’000 S$’000 Change
Non-current assets
Plant & equipment 2,120 2,409 (12.0) 1,676 1,946 (13.9)
Investment properties 1 8,311,000 8,064,000 3.1 7,530,000 7,284,000 3.4
Investment properties under development 2
459,386 444,997 3.2 308,808 243,688 26.7
Interest in subsidiaries 3 - - - 935,958 980,718 (4.6)
Interest in associate 4 194,389 191,313 1.6 130,836 130,836 -
Interest in joint ventures 5 937,895 944,149 (0.7) 708,194 729,315 (2.9)
Financial derivatives 6 14,953 162,685 (90.8) - - -
Other assets 137 - NM 137 - NM
Total non-current assets 9,919,880 9,809,553 1.1 9,615,609 9,370,503 2.6
Current assets
Trade & other receivables 32,399 33,717 (3.9) 32,738 41,773 (21.6)
Cash & cash equivalents 522,745 483,462 8.1 491,871 450,014 9.3
Financial derivatives 6 29,418 - NM - - -
Total current assets 584,562 517,179 13.0 524,609 491,787 6.7
Total assets 10,504,442 10,326,732 1.7 10,140,218 9,862,290 2.8
Current liabilities
Trade & other payables 155,588 160,337 (3.0) 139,717 146,642 (4.7)
Current portion of security deposits
57,619 54,722 5.3 54,317 45,426 19.6
Short-term borrowings 7 534,692 250,000 NM 505,132 250,000 NM
Provision for taxation 302 1,169 (74.2) 159 1,026 (84.5)
Total current liabilities 748,201 466,228 60.5 699,325 443,094 57.8
Non-current liabilities
Financial derivatives 6 77,013 30,945 NM - - -
Long-term borrowings 8 2,648,409 3,038,312 (12.8) 2,681,705 2,913,123 (7.9)
Non-current portion of security deposits
98,113 99,025 (0.9) 87,509 94,418 (7.3)
Other payables 4,661 - NM 3,992 - NM
Total non-current liabilities
2,828,196 3,168,282 (10.7) 2,773,206 3,007,541 (7.8)
Total liabilities 3,576,397 3,634,510 (1.6) 3,472,531 3,450,635 0.6
Net assets 6,928,045 6,692,222 3.5 6,667,687 6,411,655 4.0
Unitholders’ funds 6,928,045 6,692,222 3.5 6,667,687 6,411,655 4.0

CAPITALAND MALL TRUST 2017 FULL YEAR UNAUDITED FINANCIAL STATEMENT & DISTRIBUTION ANNOUNCEMENT
_____________________________________________________________________
Page 11 of 25
Footnotes:
1. Investment properties are stated at valuations performed by independent professional valuers as at 31 December 2017.
2. Investment properties under development refer to Funan which is undergoing redevelopment into an integrated development, the carrying amount reflects the valuation of the total land value and the capital expenditure capitalised.
3. Interests in subsidiaries as at 31 December 2017 include cost of investments in BMT, CMT MTN, VO1T and
VO2T (including the loans to subsidiaries). VSRT was divested on 31 October 2017.
4. Interest in associate consists of investment in CRCT. Aggregate investment in CRCT amounts to 122,705,000 units in CRCT at cost of S$130.8 million.
5. These relate to 40.0% interest in RCS Trust and 30.0% interest in Infinity Trusts (including the unitholders’ loans to IMT).
6. Financial derivative assets and liabilities as at 31 December 2017 relate to the fair value of the cross currency
swaps.
7. This relates to Euro-Medium Term Note (“EMTN”) of US$400.0 million due in 1Q 2018.
8. These relate mainly to the fixed and floating rates notes issued by CMT MTN through its US$3.0 billion EMTN Programme and S$3.5 billion MTN Programme, the S$350.0 million 7-year retail bonds issued under the S$3.5 billion retail bond programme by CMT as well as unsecured bank borrowings.
NM – not meaningful

CAPITALAND MALL TRUST 2017 FULL YEAR UNAUDITED FINANCIAL STATEMENT & DISTRIBUTION ANNOUNCEMENT
_____________________________________________________________________
Page 12 of 25
1(b)(ii) Aggregate Amount of Borrowings and Debt Securities
Group Trust
31 Dec 2017 31 Dec 2016 31 Dec 2017 31 Dec 2016
S$’000 S$’000 S$’000 S$’000
Unsecured borrowings
Amount repayable after one year 2,653,588 3,044,142 2,686,884 2,918,953
Less: Unamortised transaction costs (5,179) (5,830) (5,179) (5,830)
2,648,409 3,038,312 2,681,705 2,913,123
Amount repayable within one year 534,760 250,000 505,200 250,000
Less: Unamortised transaction costs (68) - (68) -
534,692 250,000 505,132 250,000
Total unsecured borrowings 3,183,101 3,288,312 3,186,837 3,163,123
All 14 properties directly and indirectly held by CMT are unencumbered. For information only As at 31 December 2017, CMT’s 40.0% share of RCS Trust’s and 30.0% share of IMT’s aggregate amount of borrowings are as follows:
For information only
31 Dec 2017 31 Dec 2016
S$’000 S$’000
Secured borrowings
Amount repayable after one year 162,000 162,000
Less: Unamortised transaction costs (325) (500)
Total secured borrowings 1 161,675 161,500
Unsecured borrowings
Amount repayable after one year 352,400 440,000
Less: Unamortised transaction costs (689) (993)
351,711 439,007
Amount repayable within one year 99,948 -
Total unsecured borrowings 2 451,659 439,007
Grand Total 613,334 600,507
Footnotes:
1. Relates to CMT’s 30.0% share of IMT’s aggregate amount of borrowings.
2. Relates to CMT’s 40.0% share of RCS Trust’s aggregate amount of borrowings.

CAPITALAND MALL TRUST 2017 FULL YEAR UNAUDITED FINANCIAL STATEMENT & DISTRIBUTION ANNOUNCEMENT
_____________________________________________________________________
Page 13 of 25
1(c) Statements of Cash Flow (4Q 2017 vs 4Q 2016)
Group
4Q 2017 4Q 2016
S$’000 S$’000
Operating activities
Net Income 102,339 88,155
Adjustments for:
Interest and other income (3,238) (2,542)
Finance costs 26,106 26,911
Assets written off 1 7
Depreciation and amortisation 163 253
Allowance for doubtful debts and bad debts written off 22 2
Share of result of associate (7,444) (2,412)
Share of results of joint ventures (10,812) (6,172)
Operating income before working capital changes 107,137 104,202
Changes in working capital:
Trade and other receivables (663) 1,756
Trade and other payables 7,486 8,217
Security deposits 1,157 (2,522)
Cash flows from operating activities 115,117 111,653
Investing activities
Interest received 2,966 4,259
Distribution received from associate 4,798 -
Distributions received from joint ventures 16,093 33,018
Capital expenditure on investment properties (8,999) (7,570)
Capital expenditure on investment properties under development (37,294) (18,640)
Purchase of plant and equipment (5) (144)
Proceeds from disposal of plant and equipment - 7
Proceeds from disposal of subsidiary, net of cash disposed 1 98,487 -
Cash flows from investing activities 76,046 10,930
Financing activities
Payment of issue and financing expenses (787) (1,704)
Proceeds from interest bearing loans and borrowings 135,266 -
Repayment of interest bearing loans and borrowings (198,235) (80,000)
Distribution paid to Unitholders 2 (98,573) (98,487)
Interest paid (13,877) (12,770)
Cash flows used in financing activities (176,206) (192,961)
Increase/(decrease) in cash and cash equivalents 14,957 (70,378)
Cash and cash equivalents at beginning of the period 507,788 553,840
Cash and cash equivalents at end of the period 522,745 483,462
Footnote:
1. The proceeds from the divestment of VSRT had been used to repay the bank borrowings in November 2017.
2. Distributions for 4Q 2017 is for the period from 1 July 2017 to 30 September 2017 paid in November 2017. Distributions for 4Q 2016 is for the period from 1 July 2016 to 30 September 2016 paid in November 2016.

CAPITALAND MALL TRUST 2017 FULL YEAR UNAUDITED FINANCIAL STATEMENT & DISTRIBUTION ANNOUNCEMENT
_____________________________________________________________________
Page 14 of 25
1(c) Statements of Cash Flow (FY 2017 vs FY 2016)
Group
FY 2017 FY 2016
S$’000 S$’000
Operating activities
Net Income 405,664 402,557
Adjustments for:
Interest and other income (10,078) (11,331)
Finance costs 104,099 106,318
Assets written off 2 26
Gain on disposal of plant and equipment (2) (3)
Depreciation and amortisation 704 1,114
Allowance for doubtful debts and bad debts written off 24 17
Share of result of associate (18,832) (14,504)
Share of results of joint ventures (51,541) (52,347)
Operating income before working capital changes 430,040 431,847
Changes in working capital:
Trade and other receivables (1,936) (4,955)
Trade and other payables (1,333) 16,341
Security deposits 1,985 (6,954)
Income tax paid (1,026) (3,421)
Cash flows from operating activities 427,730 432,858
Investing activities
Interest received 9,138 11,763
Distributions received from associate 17,179 12,945
Distributions received from joint ventures 63,699 79,136
Capital expenditure on investment properties (29,072) (57,370)
Capital expenditure on investment properties under development (69,889) (18,640)
Purchase of plant and equipment (371) (521)
Proceeds from disposal of plant and equipment 3 10
Proceeds from disposal of subsidiary, net of cash disposed 1 98,487 -
Cash flows from investing activities 89,174 27,323
Financing activities
Payment of issue and financing expenses (1,541) (3,614)
Proceeds from interest bearing loans and borrowings 471,366 349,008
Repayment of interest bearing loans and borrowings (448,235) (431,008)
Distributions paid to Unitholders 2 (394,889) (394,226)
Interest paid (104,322) (101,189)
Cash flows used in financing activities (477,621) (581,029)
Increase/(decrease) in cash and cash equivalents 39,283 (120,848)
Cash and cash equivalents at beginning of the year 483,462 604,310
Cash and cash equivalents at end of the year 522,745 483,462
Footnote:
1. The proceeds from the divestment of VSRT had been used to repay the bank borrowings in November
2017. 2. Distributions for FY 2017 is for the period from 1 October 2016 to 31 December 2016, 1 January 2017 to 31
March 2017, 1 April 2017 to 30 June 2017 and 1 July 2017 to 30 September 2017 paid in February 2017, May 2017, August 2017 and November 2017 respectively. Distributions for FY 2016 is for the period from 1 October 2015 to 31 December 2015, 1 January 2016 to 31 March 2016, 1 April 2016 to 30 June 2016 and 1 July 2016 to 30 September 2016 paid in February 2016, May 2016, August 2016 and November 2016 respectively.

CAPITALAND MALL TRUST 2017 FULL YEAR UNAUDITED FINANCIAL STATEMENT & DISTRIBUTION ANNOUNCEMENT
_____________________________________________________________________
Page 15 of 25
1(d)(i) Statements of Movements in Unitholders’ Funds (4Q 2017 vs 4Q 2016)
Group Trust
4Q 2017 4Q 2016 4Q 2017 4Q 2016
S$'000 S$'000 S$'000 S$'000
Balance as at beginning of the period 6,912,783 6,689,965 6,612,158 6,380,164
Operations
Total return for the period 127,112 100,319 152,821 129,175
Movement in hedging reserves 1 (19,486) (285) - -
Movement in foreign currency translation reserves 2
4,730 (251) - -
Movement in general reserves 2 198 158 - -
Unitholders’ transactions
Creation of Units
- Units issued in respect of RCS Trust’s management fees 3
829 803 829 803
- For payment of divestment fees 4 452 - 452 -
Distributions to Unitholders 5 (98,573) (98,487) (98,573) (98,487)
Net decrease in net assets resulting from Unitholders’ transactions
(97,292) (97,684) (97,292) (97,684)
Balance as at end of the period 6,928,045 6,692,222 6,667,687 6,411,655
Footnotes:
1. This includes movements in hedging reserves of CMT MTN and the Group’s share in RCS’s, IMT’s as
well as CRCT’s hedging reserves.
2. This includes the Group’s share in CRCT’s foreign currency translation reserves and general reserves.
3. For 4Q 2017, it relates to payment of base component of management fees for 3Q 2017 which were issued in October 2017. For 4Q 2016, it relates to payment of base component of management fees for 3Q 2016 which were issued in November 2016.
4. 222,665 new Units were issued to the Manager as payment for divestment fee in respect of the
divestment of all the units in VSRT.
5. Distributions for 4Q 2017 is for the period from 1 July 2017 to 30 September 2017 paid in November 2017. Distributions for 4Q 2016 is for the period from 1 July 2016 to 30 September 2016 paid in November 2016.
.
CAPITALAND MALL TRUST 2017 FULL YEAR UNAUDITED FINANCIAL STATEMENT & DISTRIBUTION ANNOUNCEMENT
_____________________________________________________________________
Page 16 of 25
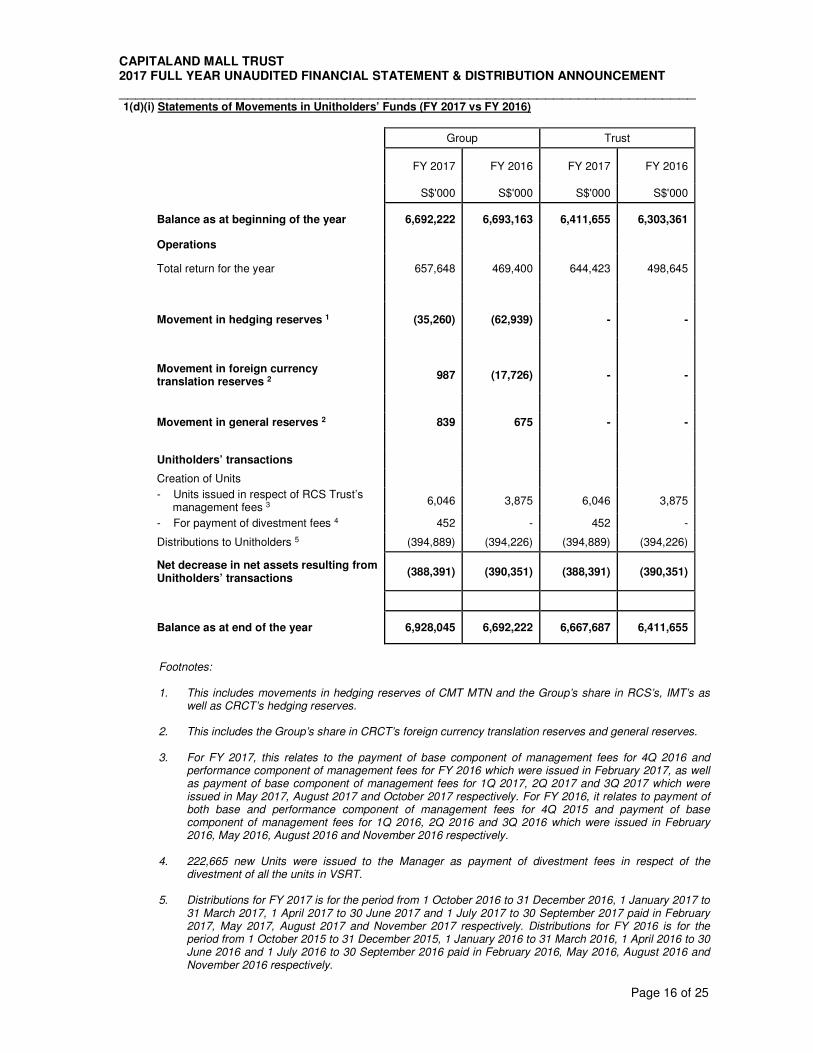
1(d)(i) Statements of Movements in Unitholders’ Funds (FY 2017 vs FY 2016)
Group Trust
FY 2017 FY 2016 FY 2017 FY 2016
S$'000 S$'000 S$'000 S$'000
Balance as at beginning of the year 6,692,222 6,693,163 6,411,655 6,303,361
Operations
Total return for the year 657,648 469,400 644,423 498,645
Movement in hedging reserves 1 (35,260) (62,939) - -
Movement in foreign currency translation reserves 2
987 (17,726) - -
Movement in general reserves 2 839 675 - -
Unitholders’ transactions
Creation of Units
- Units issued in respect of RCS Trust’s management fees 3
6,046 3,875 6,046 3,875
- For payment of divestment fees 4 452 - 452 -
Distributions to Unitholders 5 (394,889) (394,226) (394,889) (394,226)
Net decrease in net assets resulting from Unitholders’ transactions
(388,391) (390,351) (388,391) (390,351)
Balance as at end of the year 6,928,045 6,692,222 6,667,687 6,411,655
Footnotes:
1. This includes movements in hedging reserves of CMT MTN and the Group’s share in RCS’s, IMT’s as
well as CRCT’s hedging reserves.
2. This includes the Group’s share in CRCT’s foreign currency translation reserves and general reserves.
3. For FY 2017, this relates to the payment of base component of management fees for 4Q 2016 and performance component of management fees for FY 2016 which were issued in February 2017, as well as payment of base component of management fees for 1Q 2017, 2Q 2017 and 3Q 2017 which were issued in May 2017, August 2017 and October 2017 respectively. For FY 2016, it relates to payment of both base and performance component of management fees for 4Q 2015 and payment of base component of management fees for 1Q 2016, 2Q 2016 and 3Q 2016 which were issued in February 2016, May 2016, August 2016 and November 2016 respectively.
4. 222,665 new Units were issued to the Manager as payment of divestment fees in respect of the
divestment of all the units in VSRT.
5. Distributions for FY 2017 is for the period from 1 October 2016 to 31 December 2016, 1 January 2017 to 31 March 2017, 1 April 2017 to 30 June 2017 and 1 July 2017 to 30 September 2017 paid in February 2017, May 2017, August 2017 and November 2017 respectively. Distributions for FY 2016 is for the period from 1 October 2015 to 31 December 2015, 1 January 2016 to 31 March 2016, 1 April 2016 to 30 June 2016 and 1 July 2016 to 30 September 2016 paid in February 2016, May 2016, August 2016 and November 2016 respectively.

CAPITALAND MALL TRUST 2017 FULL YEAR UNAUDITED FINANCIAL STATEMENT & DISTRIBUTION ANNOUNCEMENT
_____________________________________________________________________
Page 17 of 25
1(d)(ii) Details of any change in the issued Units (4Q 2017 vs 4Q 2016)
Trust
4Q 2017 4Q 2016
Units Units
Issued Units as at beginning of the period 3,545,794,411 3,542,691,786
New Units issued:
- As payment of management fees in relation to 40% interest in RCS Trust 1
405,967 377,770
- For payment of divestment fees 2 222,665 -
Issued Units as at end of the period 3,546,423,043 3,543,069,556
Footnotes:
1. For 4Q 2017, it relates to payment of base component of management fees for 3Q 2017 which were issued in October 2017. For 4Q 2016, it relates to payment of base component of management fees for 3Q 2016 which were issued in November 2016.
2. Units issued to the Manager as payment of divestment fees in respect of the divestment of VSRT.
1(d)(ii) Details of any change in the issued Units (FY 2017 vs FY 2016)
Trust
FY 2017 FY 2016
Units Units
Balance as at beginning of the year 3,543,069,556 3,541,168,714
New Units issued:
- As payment of management fees in relation to 40% interest in RCS Trust 1
3,130,822 1,900,842
- For payment of divestment fees 2 222,665 -
Total issued Units as at end of the year 3,546,423,043 3,543,069,556
Footnotes:
1. For FY 2017, it relates to payment of base component of management fees for 4Q 2016 and performance component of management fees for FY 2016 which were issued in February 2017, as well as payment of base component of management fees for 1Q 2017, 2Q 2017 and 3Q 2017 which were issued in May 2017, August 2017 and October 2017 respectively. For FY 2016, it relates to payment of both base and performance component of management fees for 4Q 2015 and payment of base component of management fees for 1Q 2016, 2Q 2016 and 3Q 2016 which were issued in February 2016, May 2016, August 2016 and November 2016 respectively.
2. Units issued to the Manager as payment of divestment fees in respect of the divestment of VSRT.
2 Whether the figures have been audited or reviewed, and in accordance with which auditing standard or practice.
The figures have not been audited nor reviewed by our auditors.
3 Where the figures have been audited or reviewed, the auditor’s report (including any qualifications or emphasis of matter)
Not applicable.
4 Whether the same accounting policies and methods of computation as in the issuer’s most recent audited annual financial statements have been complied
The Group has applied the same accounting policies and methods of computation in the preparation of the financial statements for the current reporting period as compared with the audited financial statements for the year ended 31 December 2016.

CAPITALAND MALL TRUST 2017 FULL YEAR UNAUDITED FINANCIAL STATEMENT & DISTRIBUTION ANNOUNCEMENT
_____________________________________________________________________
Page 18 of 25
5 If there are any changes in the accounting policies and methods of computation, including any required by an accounting standard, what has changed, as well as the reasons for, and the effect of, the change
Nil
6 Earnings per Unit (“EPU”) and DPU for the financial period
In computing the DPU, the number of Units as at the end of each period was used.
Group Trust
4Q 2017 4Q 2016 4Q 2017 4Q 2016
EPU
Basic and Diluted EPU
Weighted average number of Units in issue
3,546,196,272 3,542,942,264 3,546,196,272 3,542,942,264
Based on weighted average number of Units in issue 1
3.58¢ 2.83¢ 4.31¢ 3.65¢
DPU
Number of Units in issue at end of the period
3,546,423,043 3,543,069,556 3,546,423,043 3,543,069,556
Based on the number of Units in issue at end of the period
2.90¢ 2.88¢ 2.90¢ 2.88¢
Footnote: 1. In computing the EPU, total returns for the period after tax and the weighted average number of Units at the
end of the period were used.
Group Trust
FY 2017 FY 2016 FY 2017 FY 2016
EPU
Basic and Diluted EPU
Weighted average number of Units in issue
3,545,201,968 3,542,346,255 3,545,201,968 3,542,346,255
Based on weighted average number of Units in issue 1
18.55¢ 13.25¢ 18.18¢ 14.08¢
DPU
Number of Units in issue at end of the year
3,546,423,043 3,543,069,556 3,546,423,043 3,543,069,556
Based on the number of Units in issue at end of the year
11.16¢ 11.13¢ 11.16¢ 11.13¢
Footnote: 1. In computing the EPU, total returns for the year after tax and the weighted average number of Units at the end
of the year were used.

CAPITALAND MALL TRUST 2017 FULL YEAR UNAUDITED FINANCIAL STATEMENT & DISTRIBUTION ANNOUNCEMENT
_____________________________________________________________________
Page 19 of 25
7 Net asset value (“NAV”) / Net tangible asset (“NTA”) per Unit based on issued Units at end of the year
Group Trust
31 Dec 2017 31 Dec 2016 31 Dec 2017 31 Dec 2016
Number of Units issued at end of the year
3,546,423,043 3,543,069,556 3,546,423,043 3,543,069,556
NAV / NTA ($’000) 6,928,045 6,692,222 6,667,687 6,411,655
NAV / NTA per Unit 1 ($) 1.95 1.89 1.88 1.81
Adjusted NAV / NTA per Unit (excluding the distributable income) ($)
1.92 1.86 1.85 1.78
Footnote: 1. NAV / NTA per Unit is computed based on net asset value / net tangible asset over the issued Units at the
end of the year.

CAPITALAND MALL TRUST 2017 FULL YEAR UNAUDITED FINANCIAL STATEMENT & DISTRIBUTION ANNOUNCEMENT
_____________________________________________________________________
Page 20 of 25
8 Review of the performance
Group
4Q 2017 4Q 2016 FY 2017 FY 2016
S$’000 S$’000 S$’000 S$’000
Income Statements
Gross revenue 172,402 169,346 682,469 689,732
Property operating expenses (53,144) (53,154) (204,235) (210,053)
Net property income 119,258 116,192 478,234 479,679
Interest and other income 3,238 2,542 10,078 11,331
Management fees (11,326) (11,031) (45,051) (44,619)
Trust expenses (981) (1,221) (3,871) (4,367)
Finance costs (26,106) (26,911) (104,099) (106,318)
Net income before share of results of associate and joint ventures
84,083 79,571 335,291 335,706
Group
4Q 2017 4Q 2016 FY 2017 FY 2016
S$’000 S$’000 S$’000 S$’000
Distribution Statements
Net income before share of results of associate and joint ventures
84,083 79,571 335,291 335,706
Net effect of non-tax chargeable items (5,955) (7,328) (6,421) (5,418)
Distribution from associate 4,798 - 17,179 12,945
Distributions from joint ventures 16,940 33,848 63,891 79,632
Rollover adjustment - - 129 426
Net loss from subsidiaries 265 1,078 2,934 1,077
Amount available for distribution to Unitholders
100,131 107,169 413,003 424,368
Distributable income to Unitholders 102,9331 102,0692 395,8243 394,3234
DPU (in cents)
For the period 2.90 2.88 11.16 11.13
Annualised 11.51 11.46 11.16 11.13
Footnotes:
1. In 4Q 2017, CMT had released S$7.6 million of its taxable income available for distribution retained in 1H 2017 to Unitholders. S$4.8 million of tax-exempt income received from CRCT had been retained for general corporate and working capital purposes.
2. In 4Q 2016, CMT had released S$12.0 million of its taxable income available for distribution to Unitholders.
S$17.1 million of capital distribution from IOT had been retained for general corporate and working capital purposes.
3. Capital distribution and tax-exempt income of S$17.2 million received from CRCT in FY 2017 had been
retained for general corporate and working capital purposes.
4. For FY 2016, CMT had retained S$12.9 million of capital distribution and tax-exempt income received from CRCT for general corporate and working capital purposes. In addition, S$17.1 million of capital distribution received from IOT had also been retained for general corporate and working capital purposes.

CAPITALAND MALL TRUST 2017 FULL YEAR UNAUDITED FINANCIAL STATEMENT & DISTRIBUTION ANNOUNCEMENT
_____________________________________________________________________
Page 21 of 25
4Q 2017 vs 4Q 2016
Gross revenue for 4Q 2017 was S$172.4 million, an increase of S$3.1 million or 1.8% from 4Q 2016. The increase was mainly due to higher occupancy for Bugis Junction and The Atrium@Orchard as well as higher carpark income. The increase was partially offset by lower gross revenue from Bedok Mall due to lower rental rates achieved for new and renewed leases and lower occupancy.
Property operating expenses for 4Q 2017 were S$53.1 million, a marginal decrease from 4Q 2016.
Management fees at S$11.3 million were S$0.3 million or 2.7% higher than 4Q 2016. Finance costs for 4Q 2017 of S$26.1 million were S$0.8 million or 3.0% lower than the same quarter last year. This was mainly due to refinancing of MTN of S$150.0 million at a lower interest rate in September 2017 and utilisation of the proceeds from the divestment of VSRT to repay the bank borrowings in November 2017. FY 2017 vs FY 2016
Gross revenue for FY 2017 was S$682.4 million, a decrease of S$7.3 million or 1.1% from FY 2016. The decrease was mainly due to Funan as the mall ceased its operations for redevelopment from 1 July 2016 and lower rental rates achieved for new and renewed leases as well as lower occupancy for Bedok Mall. This was partially offset by higher rental achieved for IMM, JCube and Clarke Quay.
Property operating expenses for FY 2017 were S$204.2 million, a decrease of S$5.8 million or 2.8% from FY 2016. Excluding Funan, the property operating expenses were S$1.6 million lower than FY 2016. This was mainly due to lower utilities expenses partially offset by higher property tax.
Management fees at S$45.1 million were S$0.4 million or 1.0% higher than FY 2016. Finance costs for FY 2017 of S$104.1 million were S$2.2 million or 2.1% lower than FY 2016. This was mainly due to refinancing of MTNs of S$100.0 million and S$150.0 million in March 2017 and September 2017 respectively at lower interest rates and utilisation of the proceeds from the divestment of VSRT to repay the bank borrowings in November 2017.
9 Variance from Previous Forecast / Prospect Statement
CMT has not disclosed any forecast to the market.
10 Commentary on the competitive conditions of the industry in which the Group operates and any known factors or events that may affect the Group in the next reporting period and the next 12 months
According to advance estimates by the Ministry of Trade and Industry (MTI), the Singapore economy grew by 3.1% on a year-on-year basis in 4Q 2017, easing from the 5.4% growth in the previous quarter. On a quarter-on-quarter seasonally-adjusted annualised basis, the economy expanded by a slower pace of 2.8%, easing from the 9.4% growth in the preceding quarter. For the whole of 2017, the economy grew by 3.5%. This is in line with MTI’s earlier announced GDP growth forecast of “3.0% to 3.5%”.
Based on figures released by Singapore Department of Statistics, the retail sales index (excluding motor vehicle sales) increased 0.7% and 4.7% on a year-on-year basis in October and November 2017 respectively. CMT has a strong portfolio of quality shopping malls which are well-connected to public transportation hubs and are strategically located either in areas with large population catchments or within Singapore’s popular shopping and tourist destinations. This, coupled with the large and diversified tenant base of the portfolio, will contribute to the stability and sustainability of the malls’ occupancy rates and rental revenues. Going forward, the Manager of CMT will continue to focus on sustaining DPU.

CAPITALAND MALL TRUST 2017 FULL YEAR UNAUDITED FINANCIAL STATEMENT & DISTRIBUTION ANNOUNCEMENT
_____________________________________________________________________
Page 22 of 25
11 Distributions
11(a) Current financial period
Any distributions declared for the current financial period? Yes.
Name of distribution : Distribution for 1 October 2017 to 31 December 2017
Distribution Type Distribution Rate Per Unit (cents)
Taxable Income 2.90
Total 2.90
Par value of Units : NA
Tax rate
: Taxable Income Distribution
Qualifying investors and individuals (other than those who hold their Units through a partnership) will generally receive pre-tax distributions. These distributions are exempt from Singapore income tax in the hands of individuals unless such distributions are derived through a Singapore partnership or from the carrying on of a trade, business or profession.
Qualifying foreign non-individual investors will receive their distributions after deduction of tax at the rate of 10%. All other investors will receive their distributions after deduction of tax at the rate of 17%.
Remarks : NA
11(b) Corresponding period of the preceding financial period
Any distributions declared for the corresponding period of the immediate preceding financial period?
Yes.
Name of distribution : Distribution for 1 October 2016 to 31 December 2016
Distribution Type Distribution Rate Per Unit (cents)
Taxable Income 2.88 Total 2.88
Par value of Units : NA
Tax rate : Taxable Income Distribution
Qualifying investors and individuals (other than those who hold their Units through a partnership) will generally receive pre-tax distributions. These distributions are exempt from Singapore income tax in the hands of individuals unless such distributions are derived through a Singapore partnership or from the carrying on of a trade, business or profession.
Qualifying foreign non-individual investors will receive their distributions after deduction of tax at the rate of 10%.
All other investors will receive their distributions after deduction of tax at the rate of 17%.
Remarks
: NA
11(c)
Date payable
: 28 February 2018
11(d) Books closure date : 1 February 2018

CAPITALAND MALL TRUST 2017 FULL YEAR UNAUDITED FINANCIAL STATEMENT & DISTRIBUTION ANNOUNCEMENT
_____________________________________________________________________
Page 23 of 25
12 If no distribution has been declared/recommended, a statement to that effect
NA
13 Interested Person Transactions
CMT has not obtained a general mandate from Unitholders for Interested Person Transactions.

CAPITALAND MALL TRUST 2017 FULL YEAR UNAUDITED FINANCIAL STATEMENT & DISTRIBUTION ANNOUNCEMENT
_____________________________________________________________________
Page 24 of 25
14 Segmental Results Total gross revenue
Group
FY 2017 FY 2016 %
S$’000 S$’000 Change
Tampines Mall 79,291 79,256 0.0
Junction 8 58,759 58,842 (0.1)
Funan 1 - 11,369 NM
IMM Building 82,930 80,668 2.8
Plaza Singapura 89,673 90,136 (0.5)
Bugis Junction 84,764 83,854 1.1
Lot One Shoppers' Mall 44,221 44,256 (0.1)
Bukit Panjang Plaza 28,651 28,399 0.9
The Atrium@Orchard 49,520 49,213 0.6
Clarke Quay 38,462 36,543 5.3
Bugis+ 32,884 32,616 0.8
Sembawang Shopping Centre, JCube and Rivervale Mall 2
38,909 36,457 6.7
Bedok Mall 54,405 58,123 (6.4)
Gross revenue 682,469 689,732 (1.1)
Net property income Group
FY 2017 FY 2016 %
S$’000 S$’000 Change
Tampines Mall 58,250 58,798 (0.9)
Junction 8 42,072 41,847 0.5
Funan 1 (3,447) 3,795 NM
IMM Building 57,225 54,070 5.8
Plaza Singapura 66,691 67,486 (1.2)
Bugis Junction 61,093 60,774 0.5
Lot One Shoppers' Mall 30,928 30,760 0.5
Bukit Panjang Plaza 18,363 18,336 0.1
The Atrium@Orchard 37,885 37,762 0.3
Clarke Quay 23,519 21,260 10.6
Bugis+ 23,562 22,348 5.4
Sembawang Shopping Centre, JCube and Rivervale Mall 2
22,738 19,707 15.4
Bedok Mall 39,355 42,736 (7.9)
Net property income 478,234 479,679 (0.3)
Footnotes:
1. Funan ceased operations from 1 July 2016. On 1 November 2016, CMT, together with Victory Trusts, jointly own and undertake to redevelop Funan which comprises a retail component (held through CMT), two office towers and serviced residences. On 31 October 2017, CMT divested all of the units held in VSRT, which holds the serviced residence component of Funan, to Victory SR Pte. Ltd.
2. The sale of Rivervale Mall was completed on 15 December 2015.
NM – not meaningful

CAPITALAND MALL TRUST 2017 FULL YEAR UNAUDITED FINANCIAL STATEMENT & DISTRIBUTION ANNOUNCEMENT
_____________________________________________________________________
Page 25 of 25
15 In the review of performance, the factors leading to any material changes in contributions to turnover and earnings by the business or geographical segments
Please refer to paragraph 8 on the review.
16 A breakdown of revenue and net income as follows:-
Group
FY 2017 FY 2016 %
S$’000 S$’000 Change
Gross revenue reported for first half year 340,662 350,722 (2.9)
Net income after tax for first half year 198,950 210,158 (5.3)
Gross revenue reported for second half year 341,807 339,010 0.8
Net income after tax for second half year 206,555 191,373 7.9
17 A breakdown of the total annual distribution for the current full year and its previous full year is as
follows:-
1 Jan 17 - 30 Sep 17
1 Oct 17 - 31 Dec 17
FY 2017 1 Jan 16 - 30 Sep 16
1 Oct 16 - 31 Dec 16
FY 2016
S$’000 S$’000 S$’000 S$’000 S$’000 S$’000
Annual distribution to Unitholders
292,849 - 1 292,849 292,241 102,040 394,281
Footnote: 1. Please refer to para 11(a).
18 Confirmation pursuant to Rule 720(1) of the Listing Manual
The Manager confirms that it has procured undertakings from all its Directors and Executive Officers in the format set out in Appendix 7.7 of the Listing Manual of the SGX-ST (the “Listing Manual”), as required by Rule 720(1) of the Listing Manual.
19
Confirmation pursuant to Rule 704(13) of the Listing Manual Pursuant to Rule 704(13) of the Listing Manual of the Singapore Exchange Securities Trading Limited, CapitaLand Mall Trust Management Limited (the "Company"), being the manager of CapitaLand Mall Trust ("CMT"), confirms that there is no person occupying a managerial position in the Company or in any of CMT's principal subsidiaries who is a relative of a director, chief executive officer, substantial shareholder of the Company or substantial unitholder of CMT.
BY ORDER OF THE BOARD CAPITALAND MALL TRUST MANAGEMENT LIMITED (Company registration no. 200106159R) (as Manager of CapitaLand Mall Trust) Lee Ju Lin, Audrey Company Secretary 24 January 2018
This release may contain forward-looking statements that involve assumptions, risks and uncertainties. Actual future performance, outcomes and results may differ materially from those expressed in forward-looking statements as a result of a number of risks, uncertainties and assumptions. Representative examples of these factors include (without limitation) general industry and economic conditions, interest rate trends, cost of capital and capital availability, competition from other developments or companies, shifts in expected levels of occupancy rate, property rental income, charge out collections, changes in operating expenses (including employee wages, benefits and training costs), governmental and public policy changes and the continued availability of financing in the amounts and the terms necessary to support future business. You are cautioned not to place undue reliance on these forward-looking statements, which are based on the current view of management on future events.