c.n. dennis, c.d. slabaugh, i.g. boxx, w. meier, r.p...
TRANSCRIPT
1
C.N. Dennis, C.D. Slabaugh, I.G. Boxx, W. Meier, R.P. Lucht, 5 kHz
thermometry in a swirl-stabilized gas turbine model combustor using chirped
probe pulse femtosecond CARS. Part 1: Temporally resolved swirl-flame
thermometry, Combust. Flame 173 (2016) 441-453
The original publication is available at www.elsevier.com http://dx.doi.org/10.1016/j.combustflame.2016.02.033

1
5 kHz Thermometry in a Swirl-Stabilized Gas Turbine Model Combustor
using Chirped Probe Pulse Femtosecond CARS. Part 1: Temporally Resolved Swirl-Flame
Thermometry
Claresta N. Dennisa,1
, Carson D. Slabaugha, Isaac G. Boxx
b, Wolfgang Meier
b, Robert P. Lucht
a
a School of Mechanical Engineering, Purdue University, 585 Purdue Mall, West Lafayette, Indiana
47906, USA
bGerman Aerospace Center (DLR), Institute of Combustion Technology, Pfaffenwaldring 38-40, 70569
Stuttgart, Germany
Corresponding Author: Claresta N. Dennis
Phone: 760-939-4050
Email: [email protected]
1 Present address: Naval Air Warfare Center Weapons Division, 1900 N Knox Rd, China Lake, CA 93555, USA

2
Abstract
Single-laser-shot temperature measurements at 5 kHz were performed in a gas turbine model
combustor using femtosecond (fs) coherent anti-Stokes Raman scattering (CARS). The combustor was
operated at two conditions; one exhibiting a low level of thermoacoustic instability and the other a high
level of instability. Measurements were performed at 73 locations within each flame in order to resolve
the spatial flame structure and compare to previously published studies. The measurement procedures,
including the procedure for calibrating the laser system parameters, are discussed in detail. Despite the
high turbulence levels in the combustor, signals were obtained on virtually every laser shot, and these
signals were strong enough for spectral fitting analysis for determination of flames temperatures. The
spatial resolution of the single-laser shot temperature measurements was approximately 600 µm, the
precision was approximately ±2%, and the estimated accuracy was approximately ±3%. The dynamic
range was sufficient for temperature measurements ranging from 300 K to 2200 K, although some
detector saturation was observed for low temperature spectra. These results demonstrate the usefulness
of fs-CARS for the investigation of highly turbulent combustion phenomena. In a companion paper, the
time-resolved fs CARS data are analyzed to provide insight into the temporal dynamics of the gas
turbine model combustor flow field.
Keywords
laser diagnostics; coherent anti-Stokes Raman scattering; ultrafast spectroscopy; gas turbine combustion;
turbulent swirl flame
1. Introduction
The goal of performing high-repetition rate (HRR) laser measurements in turbulent combustion
systems is to provide insight into unsteady combustion phenomena such as autoignition, extinction,
stabilization, and thermo-acoustic interactions. Turbulent combustion is complex to study

3
experimentally due to broad ranges of length and timescales over which these processes occur. This
characteristic places high spatial and temporal resolution requirements on the applied measurement
techniques. Despite the challenges, various laser-based optical techniques have been developed and
successfully applied to turbulent flames for measurements of flow field velocity, atomic and molecular
species concentrations, temperature, and soot volume fraction [1]. Techniques such as particle imaging
velocimetry (PIV) [2,3], laser-induced fluorescence (LIF) [4], Raman scattering [5], laser-induced
incandescence (LII) [6,7], laser induced breakdown spectroscopy (LIBS) [8,9], and coherent anti-Stokes
Raman scattering (CARS) [10], have been used alone or in combination [11] to provide information
about flame structure and its dynamics, the progress of chemical reactions, combustion efficiency, and
the formation of pollutants in practical turbulent combustion systems. Statistically correlated and
spatially resolved flame temperature measurements provide additional insight into locations of heat
release combustor dynamics [12].
Raman scattering and CARS have been applied extensively for gas phase combustion diagnostics
and temperature measurements. The coherent anti-Stokes process is nonlinear and generates signals over
five orders of magnitude stronger relative to that of spontaneous Raman scattering, without interference
from a single-photon excited fluorescence background [13]. CARS experiments and theory, including
spectral modeling techniques, are discussed in literature reviews and textbooks [14, 15]. A 2010 survey
of applications of CARS spectroscopy for reacting flow diagnostics by Roy et al. highlights the many
potential advantages of fs-CARS over traditional ns- and ps-CARS techniques [15]. Solid-state
femtosecond lasers operate at high repetition rates, offer excellent shot-to-shot spectral stability, and the
nearly Fourier-transform limited broadband femtosecond laser pulses enable simultaneous excitation of
numerous Raman transitions, creating a strong coherence in the sample medium [16-19]. Then following
this impulsive pump-Stokes excitation, as first described by Lucht et al. [16], frequency-spread
dephasing occurs and flame temperature can be determined from the decay rate of this initial coherence.
If one uses a chirped-probe-pulse (CPP), a method introduced by Lang et al. [20], single-laser-shot gas
4
phase temperature measurements are possible. Experiments have shown the fs-CARS signal is nearly
independent of molecular collisions after the initial excitation of the coherence and the initial decay rate
of the Raman coherence in gas phase measurements depends only on temperature [16,19]. Comparison
of the measured experimental spectra with computed theoretical spectra using temperature as a variable
in the least squares fitting process allows the flame temperature to be determined. The chirped-probe-
pulse fs-CARS approach simplifies theoretical modeling of CARS spectra and improves accuracy by
eliminating the need for Raman linewidth information [15,16,19].
Recently variations on the fs-CARS technique have been demonstrated for combustion
diagnostics which have been gaining interest. Hybrid fs/ps-CARS uses a nearly transform-limited
narrowband picosecond probe pulse and enables single-shot thermometry through frequency-domain
signal detection [21]. Second-harmonic bandwidth compression (SHBC) is the preferred method to
generate picosecond probe pulses as it produces high energy pulses in an efficient manner as
demonstrated by Kearney et al [22,23]. The hybrid fs/ps pure-rotational CARS technique using the
SHBC and spectral focusing methods was demonstrated on a H2 and a C2H4 flame [24]. An excellent
thermometric precision of 1-1.5% for lean flames at temperatures up to 1550 K was reported,
comparable to the best reported vibrational fs-CARS measurements. Above 1550 K precision degraded
but remained at 3-4%. Thermometry over a wide range of temperatures from 298 to 2300 K has been
demonstrated with simultaneous pure-rotational and ro-vibrational hybrid fs/ps-CARS [24]. Hybrid
approaches have gained popularity largely due to their frequency-domain signal detection as opposed to
CPP fs-CARS signals which are generated in the time-domain and require knowledge of the electric
field of each laser beam. Methods have been demonstrated which improve the accuracy and precision of
hybrid fs/ps-CARS to levels similar to those of vibrational fs-CARS over a wide range of temperatures,
298 to 2400 K [21,23]. The hybrid technique has also proven useful for accurate relative concentration
measurements [24,25].
5
CPP fs-CARS has previously been applied only in mildly turbulent flames [26,27]. The purpose
of the present work is to demonstrate the application of 5 kHz CPP fs-CARS thermometry to swirl
stabilized model combustors with very high levels of turbulence. In a collaborative effort with the
German Aerospace Center (DLR), CPP fs-CARS measurements were performed on the DLR Dual-Swirl
Gas Turbine Model Combustor (GTMC). The GTMC is a research-scale swirl burner designed to study
thermo-acoustic oscillatory effects in combustion for technically relevant operating conditions. The
burner has been extensively characterized over a wide range of operating conditions using many
different spectroscopic and imaging techniques in previous studies [2, 5, 29-34].
CPP fs-CARS measurements were successfully performed at 73 locations throughout the highly
turbulent reacting flow field of the GTMC. Two different burner operating conditions were investigated,
exhibiting low (Flame V) and high (Flame B) levels of thermo-acoustic instability. Some of the initial
measurements from Flame V were described in a previous paper published in the Proceedings of the
Combustion Institute (PCI) [28]. The CPP fs CARS measurements in Flame V are discussed in more
detail in this paper, along with the measurements from Flame B, which were not discussed in the PCI
paper.
The CPP fs-CARS measurements in both Flames V and B were successful in spite of the very
high turbulence and noise levels for the flames. High levels of turbulence, often associated with
variations in refractive index, did not cause noticeable changes in the spatial or temporal overlap of the
CARS laser beams as expected. The spatial resolution of the technique was measured and found to be
much better than previously reported for typical ns-CARS experiments. The accuracy and precision of
these results is estimated to be better than ±3%. Beam steering effects were minimal and were never
observed to be significant enough that single-shot spectra could not be analyzed. Significant CPP fs-
CARS signals were observed on almost every laser shot. Some difficulties with signal dynamic range
and with the interference from pump beam scattering during Flame V measurements were encountered
and will be described in detail, along with potential approaches to overcome these difficulties. The
6
temperature measurements revealed very different temporal structure at different spatial locations in the
flow. High-frequency acoustic measurements were also performed simultaneously with the CPP fs-
CARS measurements. The acoustic and CARS signals were recorded using the same data acquisition
time base for later synchronization. The insight provided by the synchronized acoustic and temperature
measurements is discussed in detail in the Part 2 companion paper.
2. Experimental System
2.1 Femtosecond CARS Optical System
The laser, optical, and detection systems used for this experiment have been described previously
[28]. A mode-locked Ti:Sapphire oscillator (Coherent Model Mantis) was used to seed a Ti:Sapphire
amplifier (Coherent Model Legend Elite Duo) with a stretcher, a regenerative amplifier stage, a single
pass amplifier stage, and a compressor. The pulses from the Mantis oscillator were directed through a
pulse shaper (Coherent Model Silhouette) before being used to seed the Legend amplifier. The Legend
amplifiers were pumped by a pulsed, Q-switched Nd:YLF laser (Coherent Evolution). The fundamental
output of the Ti:Sapphire amplifier, 2 mJ per pulse at a repetition rate of 5 kHz, was used to pump an
optical parametric amplifier (OPA) (Coherent Model OPerA Solo) and also to provide the laser pulses
for the CARS probe and Stokes beams. Beam splitters were used to direct 90% of the amplifier energy
to pump the OPA, 6% through a dispersive rod (30 cm, SF-10) to produce the chirped probe beam, and
the remaining 4% to be used directly as the Stokes beam. The spectral bandwidths (FWHM) of the
pump, Stokes, and CPP beams were 260 cm-1
, 410 cm-1
, and 420 cm-1
, respectively. The laser beam
energies were 55, 60, and 140 µJ for the pump, Stokes, and chirped probe beams.
7
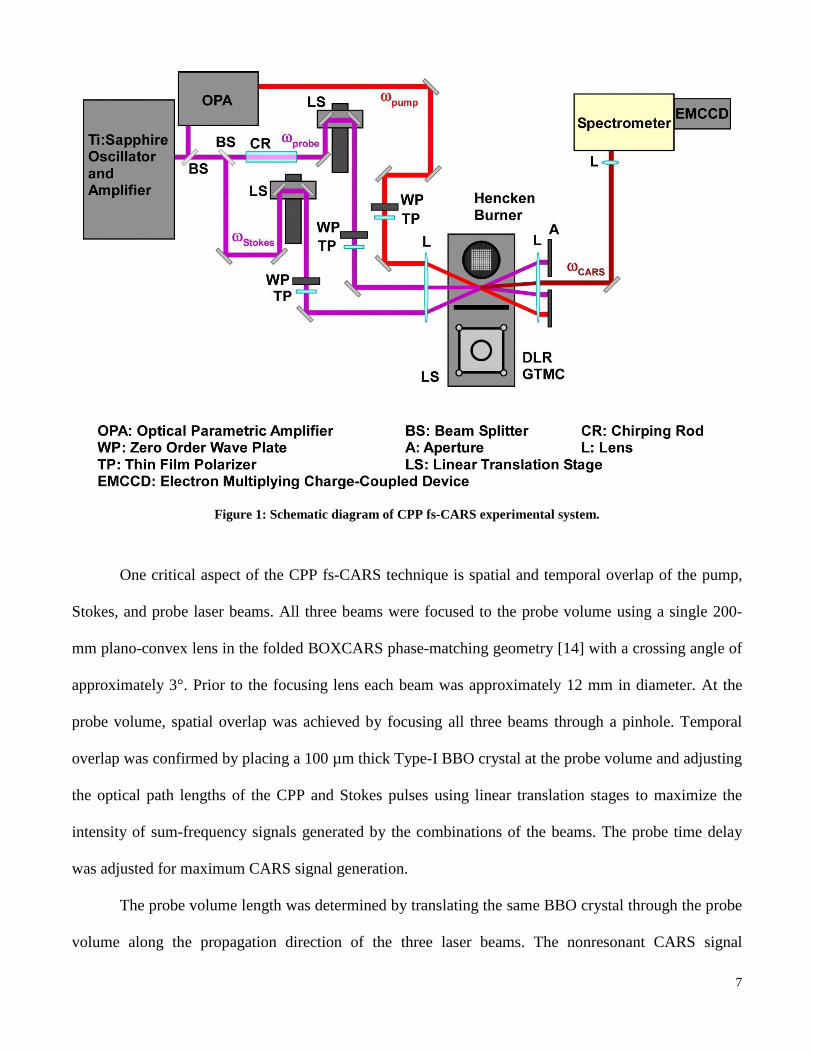
Figure 1: Schematic diagram of CPP fs-CARS experimental system.
One critical aspect of the CPP fs-CARS technique is spatial and temporal overlap of the pump,
Stokes, and probe laser beams. All three beams were focused to the probe volume using a single 200-
mm plano-convex lens in the folded BOXCARS phase-matching geometry [14] with a crossing angle of
approximately 3°. Prior to the focusing lens each beam was approximately 12 mm in diameter. At the
probe volume, spatial overlap was achieved by focusing all three beams through a pinhole. Temporal
overlap was confirmed by placing a 100 µm thick Type-I BBO crystal at the probe volume and adjusting
the optical path lengths of the CPP and Stokes pulses using linear translation stages to maximize the
intensity of sum-frequency signals generated by the combinations of the beams. The probe time delay
was adjusted for maximum CARS signal generation.
The probe volume length was determined by translating the same BBO crystal through the probe
volume along the propagation direction of the three laser beams. The nonresonant CARS signal
8
generated inside the crystal was recorded, and the normalized CARS signal strength was determined as a
function of crystal position. The probe volume length was approximately 400 µm, corresponding to the
FWHM, or 600 µm, for the width of the region from 10% to 10% of the maximum [28]. The excellent
spatial resolution of these measurements is attributed to the low beam divergence and excellent Gaussian
mode quality of the ultrafast laser beams.
The Hencken burner calibration flame and DLR GTMC are shown in Fig. 1. These burners are
described in sections 2.2 and 2.3 respectively. The burners were moved vertically and horizontally with
respect to the fixed CARS probe volume location. Both devices were mounted on the same set of linear
translation stages, allowing CPP fs-CARS measurements to be performed in each flame, in quick
succession. Calibration measurements were taken for every 25 locations measured in the DLR GTMC,
or approximately every 15 minutes during data acquisition. Due to the excellent stability of the laser
system this frequency may not have been required, though it provided a way to monitor the beam
overlap and the CPP fs-CARS signal intensity.
The CPP fs-CARS signal beam, generated by the combination of spatially and temporally
overlapped CPP, Stokes, and pump pulses, was then focused onto the entrance slit of a 0.25 m
spectrometer (SPEX) with 1200 g/mm grating. The CARS signal was recorded using an electron
multiplying charged coupled device camera system (Andor iXon EMCCD), equipped with an optical
mask to limit the signal illumination region to the bottom 50 rows of pixels, with each pixel row
containing 1024 pixels (columns). The charge in each of the 50-pixel-high 1024 columns was then
binned vertically into the serial register, producing a CPP fs-CARS spectrum with 1024 spectral points.
The EMCCD camera was fast enough that these 1024-point spectra were acquired at 5 kHz. The
resulting spectral dispersion through the detection channel was approximately 0.98 cm-1
per pixel.
2.2 Calibration Flame
9
The ‘Hencken burner’ is a commonly used reference flame for combustion diagnostics [35]. This
burner features a stainless steel honeycomb plate through which the oxidizer flows, and hypodermic
needles are placed in every third honeycomb opening to carry the fuel flow. Just downstream of the
burner face, the fuel and oxidizer flows rapidly mix and react to produce a uniform flow of product
gases near adiabatic equilibrium. When hydrogen is used as the fuel and air as the oxidizer, the Hencken
burner produces very stable flames. Thus, the Hencken burner was utilized to provide a range of known
temperatures to calibrate the CPP fs-CARS spectra. Digital mass flow controllers (Porter Series 200)
were calibrated and used to control the volumetric flow rates of each of the gases. Hydrogen-air
equivalence ratios of 0.3, 0.5, and 0.8 provided temperature standards at 1189, 1643, and 2168 K
respectively. These standard temperatures were measured using the combined pure rotational/pure
vibrational ns-CARS experiment developed by Satija and Lucht [36], located in the same laboratory.
Their measured values are in agreement to within 1% of the calculated adiabatic flame temperature. The
probe volume for the CARS measurements in the Hencken burner was located 35 mm above the center
of the burner where the flame is most stable and product gases have reached equilibrium. To account for
effects of the DLR GTMC optical access windows, an identical set of windows was placed in the beam
path, one on each side of the Hencken burner in the laser propagation direction, to ensure a
representative calibration dataset.
The Hencken burner and the DLR GTMC were mounted on the same translation stage in close
proximity, separated by about 200 mm. The operation of the DLR GTMC caused significant
perturbations in the Hencken calibration flame, presumably due to the high radiant heat flux or the
significant acoustic pulsations from the GTMC burner. Due to the sensitivity of the DLR GTMC flame
to thermal conditions, we could not turn the DLR GTMC flame off during the Hencken burner
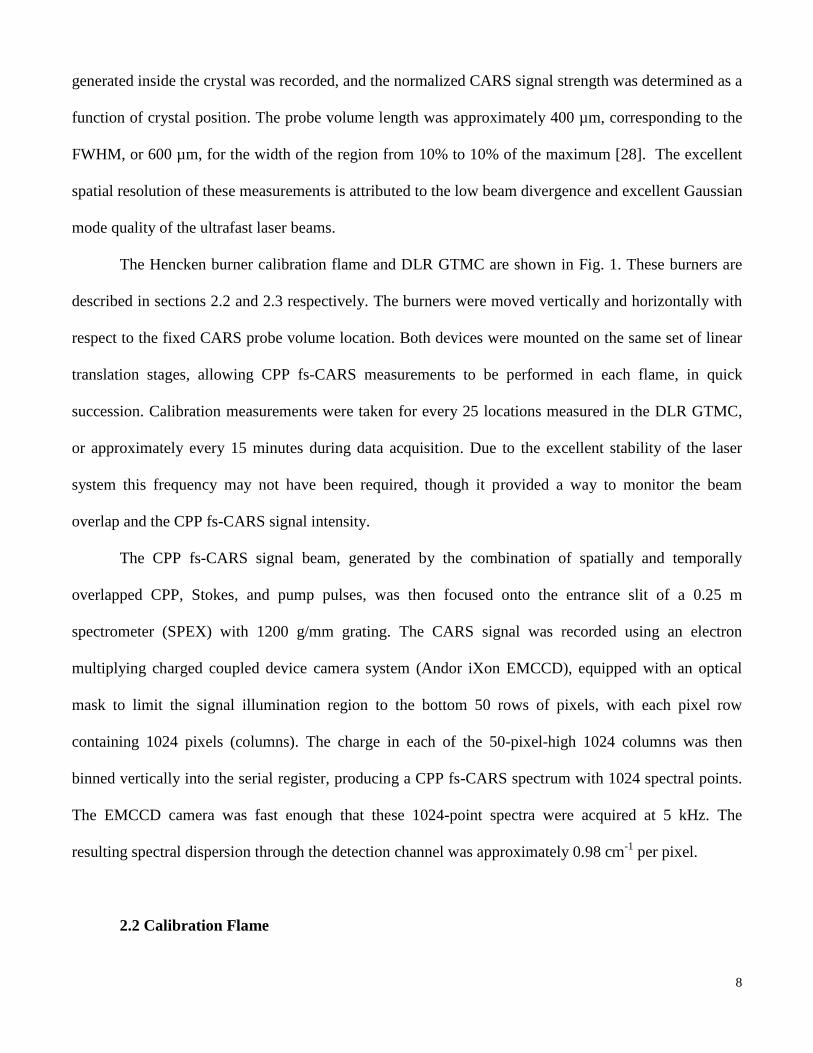
calibration measurements (the Hencken burner was off during the GTMC measurements). Figure 2
shows the Hencken burner calibration flame fluctuations induced by the operation of the GTMC. On the
left are 2000 sequential single-laser-shot CPP fs-CARS temperature measurements, and on the right is
10
the resulting histogram. With the GTMC in operation, the measured temperatures in the calibration
flame were approximately 150 K higher than the expected adiabatic flame temperature. To be able to
switch back and forth between the burners quickly, an aluminum baffle and thermal insulating
plasterboard were installed between the two burners, and this minimized or eliminated the effect of the
DLR GTMC operation on the Hencken burner results.
Figure 2: 2000 single-laser-shot temperature measurements in Hencken burner flame Φ= 0.5 with the DLR GTMC in
operation (A) without the baffles in place and (B) with the baffles in place.
Analysis of the CPP fs-CARS spectra from the Hencken burner measurements at known flame
temperatures provided the laser parameters required to theoretically model the CPP fs-CARS spectra
obtained from the DLR GTMC flames. The unknown laser parameters requiring calibration are variables
which define the electric field of each laser beam allowing a theoretical CARS spectrum to be
calculated. Due to the very stable nature of the Hencken burner, 2000 single laser shot spectra were
11
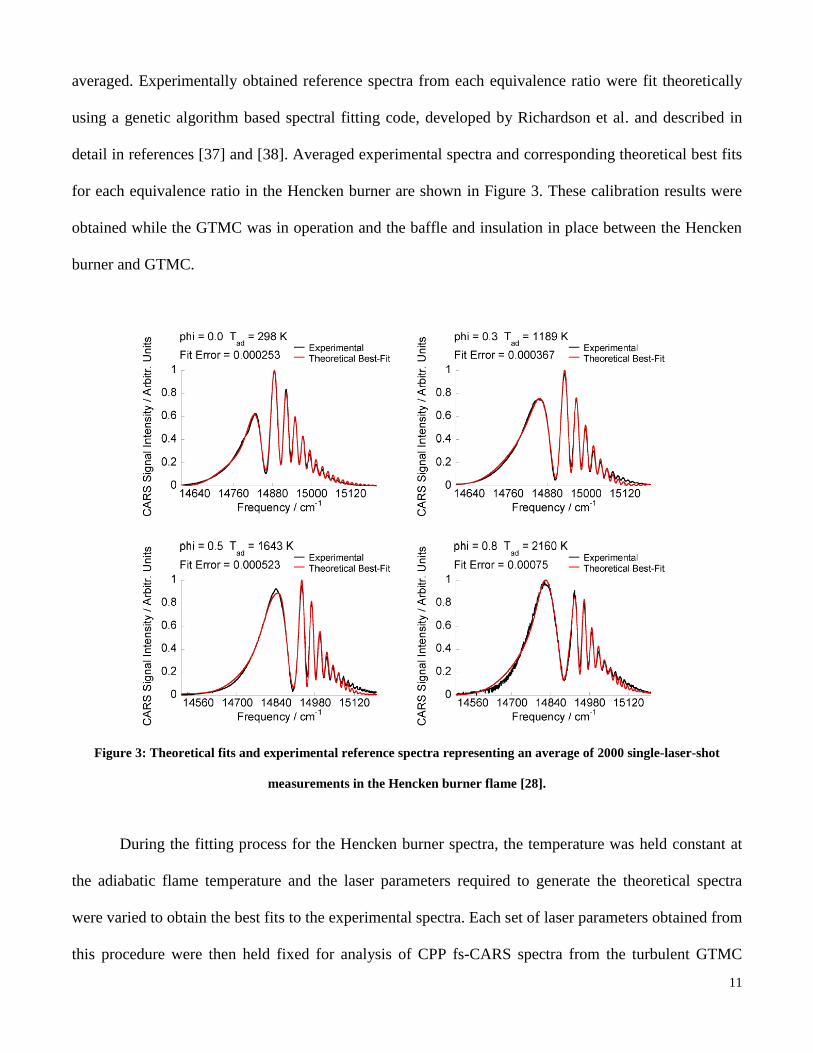
averaged. Experimentally obtained reference spectra from each equivalence ratio were fit theoretically
using a genetic algorithm based spectral fitting code, developed by Richardson et al. and described in
detail in references [37] and [38]. Averaged experimental spectra and corresponding theoretical best fits
for each equivalence ratio in the Hencken burner are shown in Figure 3. These calibration results were
obtained while the GTMC was in operation and the baffle and insulation in place between the Hencken
burner and GTMC.
Figure 3: Theoretical fits and experimental reference spectra representing an average of 2000 single-laser-shot
measurements in the Hencken burner flame [28].
During the fitting process for the Hencken burner spectra, the temperature was held constant at
the adiabatic flame temperature and the laser parameters required to generate the theoretical spectra
were varied to obtain the best fits to the experimental spectra. Each set of laser parameters obtained from
this procedure were then held fixed for analysis of CPP fs-CARS spectra from the turbulent GTMC
12
flame. During the analysis of CARS spectra from the GTMC, only the temperature, the ratio of the
resonant and nonresonant susceptibilities, and a linear scaling factor for intensity were allowed to vary.
For each single-shot, CPP fs-CARS spectrum, fitting was performed using all four sets of laser
parameters from room air and the reference flames. The temperature was determined for each laser shot
by comparing the analysis from each set of laser parameters and selecting the one with the best spectral
fit which resulted in the lowest least-squares error between the experimental and theoretical spectra.
The correlation of the laser parameters with temperature is a result of not including (mistakenly)
the instrument function associated with the spectrometer and the EMCCD detector in the spectral
analysis, this is discussed in detail by Dennis et al. [39]. Without the inclusion of the instrument
function, the spectral fitting code had to adjust the laser parameters differently at each flame temperature
to obtain a good fit to the calibration spectrum. The inclusion of the instrument function in the analysis
greatly minimized the variation of the laser parameters for the different calibration flames. Although
inclusion of the instrument function in the analysis does minimize or eliminate the dependence of laser
parameters on flame temperature, it does not significantly affect the calculated temperatures; the mean
temperature and RMS temperature fluctuation values are the same to within 1-2% with or without
inclusion of the instrument function. In future work, we hope to eliminate the need for the Hencken
burner calibration flames completely and determine the laser parameters from room temperature
nitrogen CARS spectra and nonresonant argon spectra.
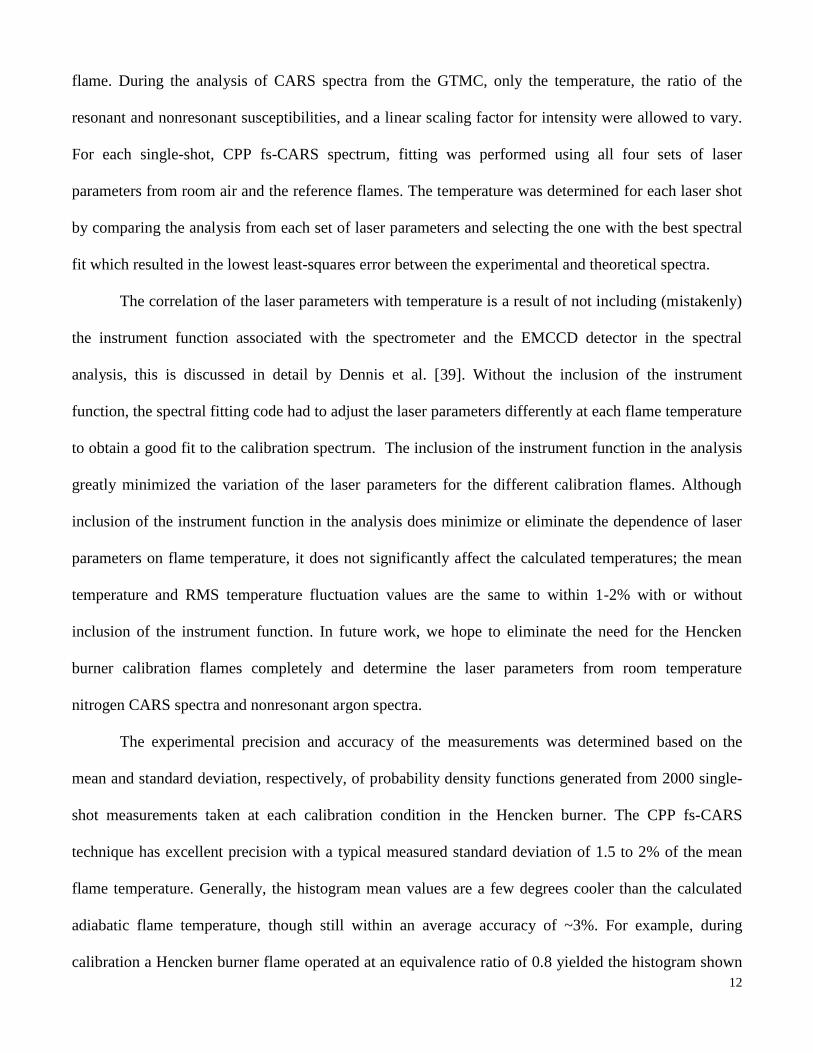
The experimental precision and accuracy of the measurements was determined based on the
mean and standard deviation, respectively, of probability density functions generated from 2000 single-
shot measurements taken at each calibration condition in the Hencken burner. The CPP fs-CARS
technique has excellent precision with a typical measured standard deviation of 1.5 to 2% of the mean
flame temperature. Generally, the histogram mean values are a few degrees cooler than the calculated
adiabatic flame temperature, though still within an average accuracy of ~3%. For example, during
calibration a Hencken burner flame operated at an equivalence ratio of 0.8 yielded the histogram shown
13
in Figure 4. The mean temperature at 2101 K was 3.0% below the adiabatic flame temperature of 2168
K and the standard deviation was 38 K or 1.7%. Adiabatic calibration temperature uncertainty as a result
of the mass flow controllers used ranged from 2.5% down to 1.6% as Φ was varied from 0.3 to 0.8.
Figure 4: Histograms resulting from 2000 single laser shot temperature measurements in the Hencken burner flame
operated at φ = 0.0, 0.3, 0.5, and 0.8.
2.3 Gas Turbine Model Combustor (GTMC)
The DLR GTMC used in this work has been the subject of numerous previous studies in which the
geometry is described in detail [34, 40-44], only a brief overview is provided here. A schematic
diagram of the burner is shown in Figure 5. The window material is fused silica, which was anti-
reflection coated for two 60nm bandwidths (FWHM) centered on 675 nm and 800 nm and specially

14
designed for the high temperature operation of the GTMC. The custom dielectric coating was designed
to have a minimum in its reflectivity curve at 1000 K, the estimated window temperature reached during
burner operation.
Figure 5: Schematic diagram of DLR Dual-Swirl GTMC. [39]
Dry air was supplied to the plenum through an acoustic isolation section with an upstream choked
orifice. Fuel and oxidizer flows were controlled by electromechanical mass flow controllers (Porter
Series 200) with a flow rate accuracy of ±1.0% full scale output. A microphone (Bruel and Kjaer, Type
4939) was installed in the upstream plenum to monitor chamber acoustics [41]. The microphone signal
was acquired simultaneously with the laser pulse and the EMCCD gate signals to synchronize the
acoustic signals with the CARS measurements.
Two flames were studied in this work, similar to conditions studied previously in the work of Stohr
et al. [41]. Parameters of the two flames are shown in Table 1.

15
Table 1: Parameters of the two flames investigated.
Flame Case Air (g/min) CH4 (g/min) Pth (kW) Φglob Tglob ad (K)
V 324 12 10 0.63 1726
B 281 12.3 10 0.75 1915
Each flame was named based on its characteristic flow-field pattern. Flame V exhibited a low level
of thermoacoustic instability while Flame B exhibited a high level of self-excited thermoacoustic
instability. The burner was operated at each condition for thirty minutes, prior to data collection, to
allow for thermal stabilization.
The time-averaged flow field corresponding to the Flame V condition was measured by Stohr et al.
[41] and is shown in Figure 6. The contours are streamlines representing the mean velocity field
determined by extensive PIV characterization of the burner and the color scale indicates velocity
magnitude in meters per second. The CPP fs-CARS measurement locations are indicated by black
squares in Figure 6. These locations were selected to resolve the spatial structure of the flame and
coincide with previous Raman scattering probe volume locations [5]. The demonstration of the
temporally-resolved CARS temperature measurements in the highly turbulent shear layers near the
flame base was of principal interest. At locations near the flame base, the mean axial velocity is on the
order of 12 m/s [33] and in 0.2 ms, corresponding to the laser repetition rate, a distance of 2.4 mm is
covered. At each location 5000 sequential single-laser-shot measurements were acquired, at select
locations 25,000 sequential measurements were acquired for additional analysis presented in the part 2
companion paper.

16
Figure 6: CARS probe-volume locations with respect to mean flow field for the flame V operating condition.
3. Results
3.1 Flame V
CPP fs-CARS measurements were performed at each of the 73 grid locations shown in Figure 6.
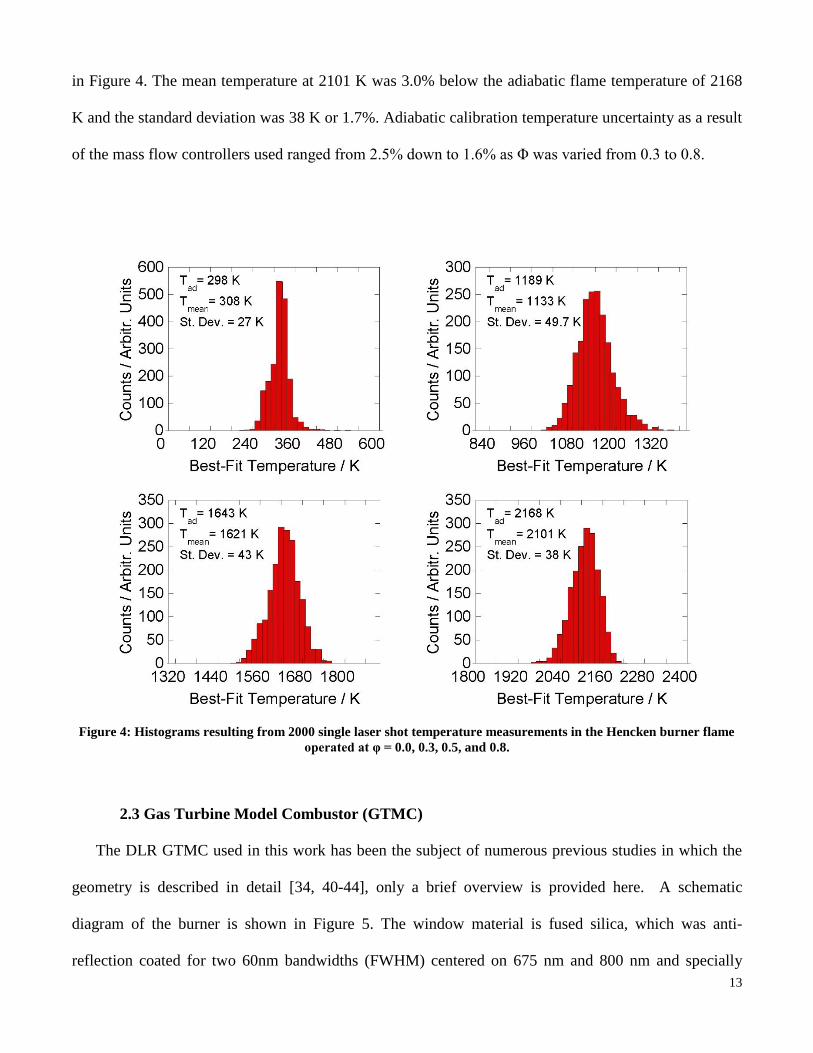
Results from 12 locations in Flame V are shown in Figure 7. Each data point represents a temperature
measurement from a single laser shot. The time history plots show 4000 sequential temperature
measurements for a specific probe volume location in the flame. For each location the mean temperature
is also reported. The lower and upper temperature limits used for the spectral fitting process was set to
300 and 2200 K respectively.
17
Figure 7: Temperature measurements from 4000 consecutive single-laser-shots for 12 different probe volume
locations in Flame V.
The probe volume locations shown in Fig. 7, plot L (x = 9 mm, y = 10 mm), H (x = 8 mm, y = 20
mm), E (x = 15 mm, y = 30 mm), F (x = 15 mm, y = 40 mm), and D (x = 0 mm, y = 30 mm) are located
within the inner recirculation zone. In this recirculation zone, the measured temperatures near the burner
exit vary greatly from shot-to-shot; the shot-to-shot variation in temperature decreases with axial
distance for y = 30 mm and higher. Probe volume locations shown in plot G (x = 21 mm, y = 15 mm)
and I (x = 20 mm, y = 20 mm) are located in the inner shear layer. Temperature measurements at those
locations vary more rapidly compared to that of other radial locations at those heights above the burner
exit. As expected, the temperature increases with axial distance from the burner exit as combustion
products reach equilibrium. The Flame V operating conditions corresponded to a global adiabatic flame
temperature of 1726 K. The uncertainty in calculated equilibrium temperature is 2.1%, associated with
the accuracy of the mass flow controllers used to set the fuel and air flow rates. At the locations 40 mm
18
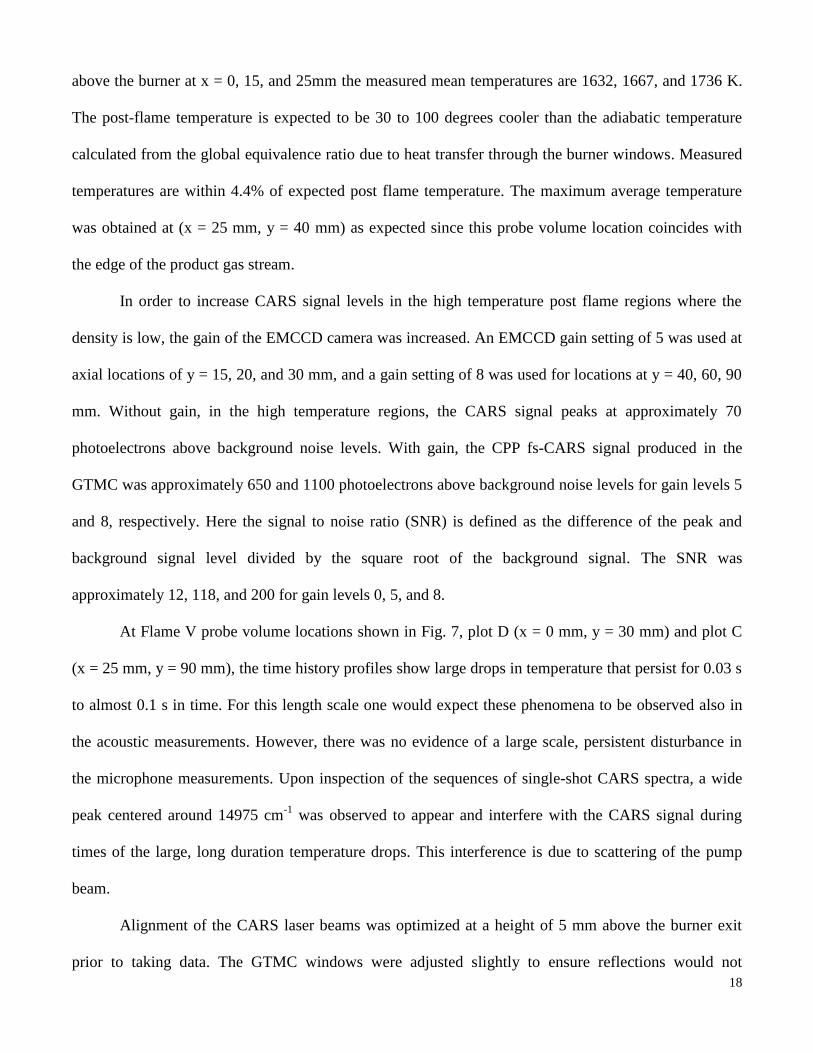
above the burner at x = 0, 15, and 25mm the measured mean temperatures are 1632, 1667, and 1736 K.
The post-flame temperature is expected to be 30 to 100 degrees cooler than the adiabatic temperature
calculated from the global equivalence ratio due to heat transfer through the burner windows. Measured
temperatures are within 4.4% of expected post flame temperature. The maximum average temperature
was obtained at (x = 25 mm, y = 40 mm) as expected since this probe volume location coincides with
the edge of the product gas stream.
In order to increase CARS signal levels in the high temperature post flame regions where the
density is low, the gain of the EMCCD camera was increased. An EMCCD gain setting of 5 was used at
axial locations of y = 15, 20, and 30 mm, and a gain setting of 8 was used for locations at y = 40, 60, 90
mm. Without gain, in the high temperature regions, the CARS signal peaks at approximately 70
photoelectrons above background noise levels. With gain, the CPP fs-CARS signal produced in the
GTMC was approximately 650 and 1100 photoelectrons above background noise levels for gain levels 5
and 8, respectively. Here the signal to noise ratio (SNR) is defined as the difference of the peak and
background signal level divided by the square root of the background signal. The SNR was
approximately 12, 118, and 200 for gain levels 0, 5, and 8.
At Flame V probe volume locations shown in Fig. 7, plot D (x = 0 mm, y = 30 mm) and plot C
(x = 25 mm, y = 90 mm), the time history profiles show large drops in temperature that persist for 0.03 s
to almost 0.1 s in time. For this length scale one would expect these phenomena to be observed also in
the acoustic measurements. However, there was no evidence of a large scale, persistent disturbance in
the microphone measurements. Upon inspection of the sequences of single-shot CARS spectra, a wide
peak centered around 14975 cm-1
was observed to appear and interfere with the CARS signal during
times of the large, long duration temperature drops. This interference is due to scattering of the pump
beam.
Alignment of the CARS laser beams was optimized at a height of 5 mm above the burner exit
prior to taking data. The GTMC windows were adjusted slightly to ensure reflections would not

19
propagate backward towards the ultrafast laser system. The background signal level was constant across
the detector chip for the probe volume location 5 mm above the nozzle exit. At higher locations above
the burner exit, light from scattered pump beam was detected with the greatest scattering interference
occurring at a height of 90 mm above the nozzle exit. This indicates long duration temperature
anomalies are not due to the physics of the flow-field and should be ignored. If laser shots exhibiting
interference from scattering pump light are not omitted from analysis, resultant mean flame temperature
measurements may be affected.
The ability of the current spectral fitting algorithm to accurately model experimental data and
determine flame temperature is greatly reduced by the pump beam interference with the CARS signal.
Figure 8 shows single-shot CPP fs-CARS spectra and associated theoretical best fit for laser shots #700
and #900 taken in Flame V at probe volume location (x = 0 mm, y = 30 mm). During laser shot #700 the
pump beam was scattered through the detection channel resulting in a wide peak interfering with the
frequency spread dephasing of the CARS signal at the high frequency side of the spectrum. This
interference resulted in a poor theoretical fit of the experimental result. Laser shot #900, on the right
hand side of Figure 8 does not show evidence of scattered light and there is good agreement between the
experimental and theoretical spectra. The intermittent nature of the pump scattering interference leads us
to conclude that a loose fit of the GTMC windows was responsible; at times the angle of the windows
was such that pump laser light was scattered or reflected into the detection channel and at other times no
scattering interference was observed.

20
Figure 8: Experimental and theoretical spectrum from laser shot #700 (left) and #900 (right) at x = 0 mm, y = 30 mm
in Flame V.
For the laser shots where pump scatter occurred, the least squares error calculated between
theoretical and experimental spectra were much higher than the error calculated where scattering did not
occur. Figure 9 shows the temperature measurements from 5000 sequential single laser shots at (x = 0
mm, y = 30 mm) as well as the least squares error calculated for the theoretical spectral fit of each single
laser shot.
Figure 9: Temperature measurements and least squares error between experimental and theoretical spectra for probe
volume location x = 0 mm, y = 30 mm in Flame V.
This indicates least squares error of the theoretical fit may be used to determine which shots are
acceptable and free of interference. The theoretical fit error is the sum over the least squares error
calculated between the experimental CARS signal intensity and the theoretically predicted signal
21
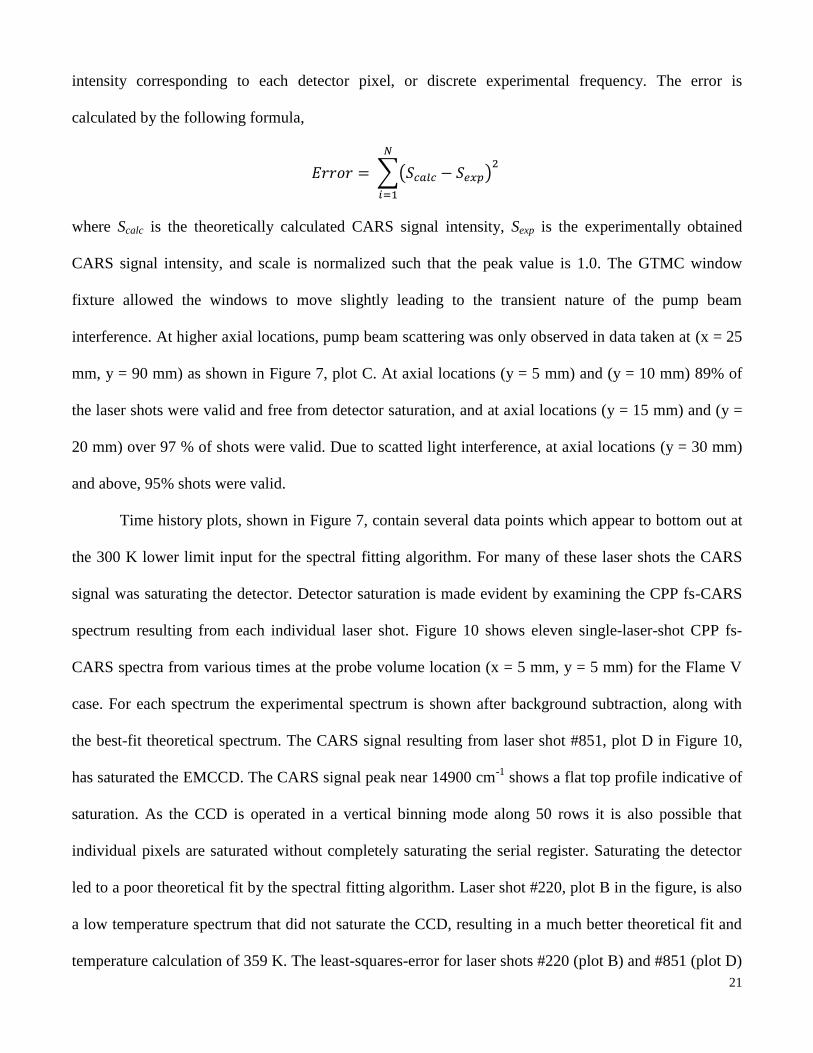
intensity corresponding to each detector pixel, or discrete experimental frequency. The error is
calculated by the following formula,
𝐸𝑟𝑟𝑜𝑟 = ∑(𝑆𝑐𝑎𝑙𝑐 − 𝑆𝑒𝑥𝑝)2
𝑁
𝑖=1
where Scalc is the theoretically calculated CARS signal intensity, Sexp is the experimentally obtained
CARS signal intensity, and scale is normalized such that the peak value is 1.0. The GTMC window
fixture allowed the windows to move slightly leading to the transient nature of the pump beam
interference. At higher axial locations, pump beam scattering was only observed in data taken at (x = 25
mm, y = 90 mm) as shown in Figure 7, plot C. At axial locations (y = 5 mm) and (y = 10 mm) 89% of
the laser shots were valid and free from detector saturation, and at axial locations (y = 15 mm) and (y =
20 mm) over 97 % of shots were valid. Due to scatted light interference, at axial locations (y = 30 mm)
and above, 95% shots were valid.
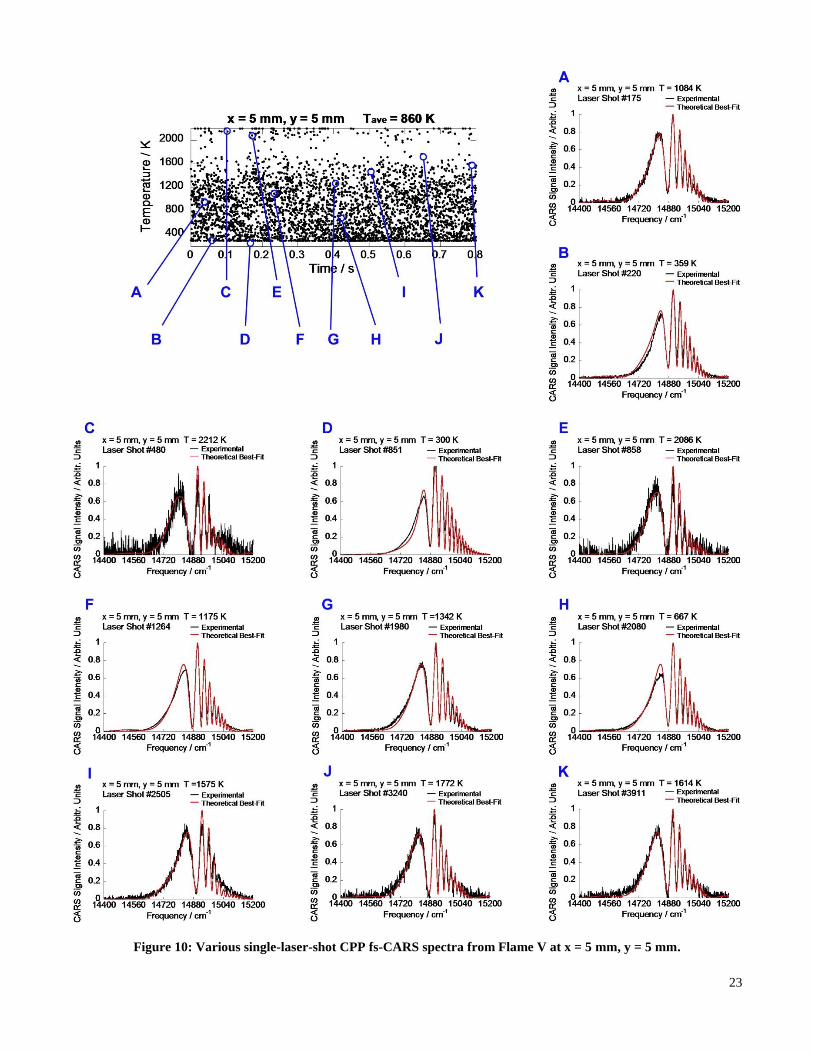
Time history plots, shown in Figure 7, contain several data points which appear to bottom out at
the 300 K lower limit input for the spectral fitting algorithm. For many of these laser shots the CARS
signal was saturating the detector. Detector saturation is made evident by examining the CPP fs-CARS
spectrum resulting from each individual laser shot. Figure 10 shows eleven single-laser-shot CPP fs-
CARS spectra from various times at the probe volume location (x = 5 mm, y = 5 mm) for the Flame V
case. For each spectrum the experimental spectrum is shown after background subtraction, along with
the best-fit theoretical spectrum. The CARS signal resulting from laser shot #851, plot D in Figure 10,
has saturated the EMCCD. The CARS signal peak near 14900 cm-1
shows a flat top profile indicative of
saturation. As the CCD is operated in a vertical binning mode along 50 rows it is also possible that
individual pixels are saturated without completely saturating the serial register. Saturating the detector
led to a poor theoretical fit by the spectral fitting algorithm. Laser shot #220, plot B in the figure, is also
a low temperature spectrum that did not saturate the CCD, resulting in a much better theoretical fit and
temperature calculation of 359 K. The least-squares-error for laser shots #220 (plot B) and #851 (plot D)

22
were found to be 0.0060 and 0.0182, respectively; the error was significantly higher when the signal
saturated the camera. We plan to employ a two CCD, two spectrometer system with 10% of the signal
directed to one spectrometer-CCD system and 90% to the other to overcome this current dynamic range
limitation. This will greatly improve the fidelity of our measurements in the low temperature regions of
the turbulent flame in addition to allowing higher EMCCD gain levels to be used improving signal-to-
noise ratio in higher temperature flame regions.
23
Figure 10: Various single-laser-shot CPP fs-CARS spectra from Flame V at x = 5 mm, y = 5 mm.

24
Each single-laser-shot measurement unaffected by scattered pump beam interference resulted in
a CPP fs-CARS signal above the noise floor adequate for spectral fitting. In general, the SNR is much
higher for low temperature flame regions due to the number density of nitrogen in the probe volume
contributing to a stronger coherent CARS signal. For example the spectrum shown in plot C has a peak
SNR of approximately 5 and a calculated temperature 2212 K, and the spectrum in plot H has a peak
SNR of 67 and a calculated temperature of 667 K. We did not observe any clear indications of beam
steering, and signal drop-outs did not occur. Beam steering may have resulted in decreased signal levels,
but it did not impede the ability to make temperature measurements from resulting CARS spectra. As
the peak SNR is expected to decrease with increasing temperature, any beam steering effects could
disrupt this relationship. One possible example is laser shot #175, shown in plot A. The calculated
temperature is 1084 K though the data shows more noise than in plots F and G where the calculated
temperatures are 1175 and 1342 K respectively.
3.2 Flame B
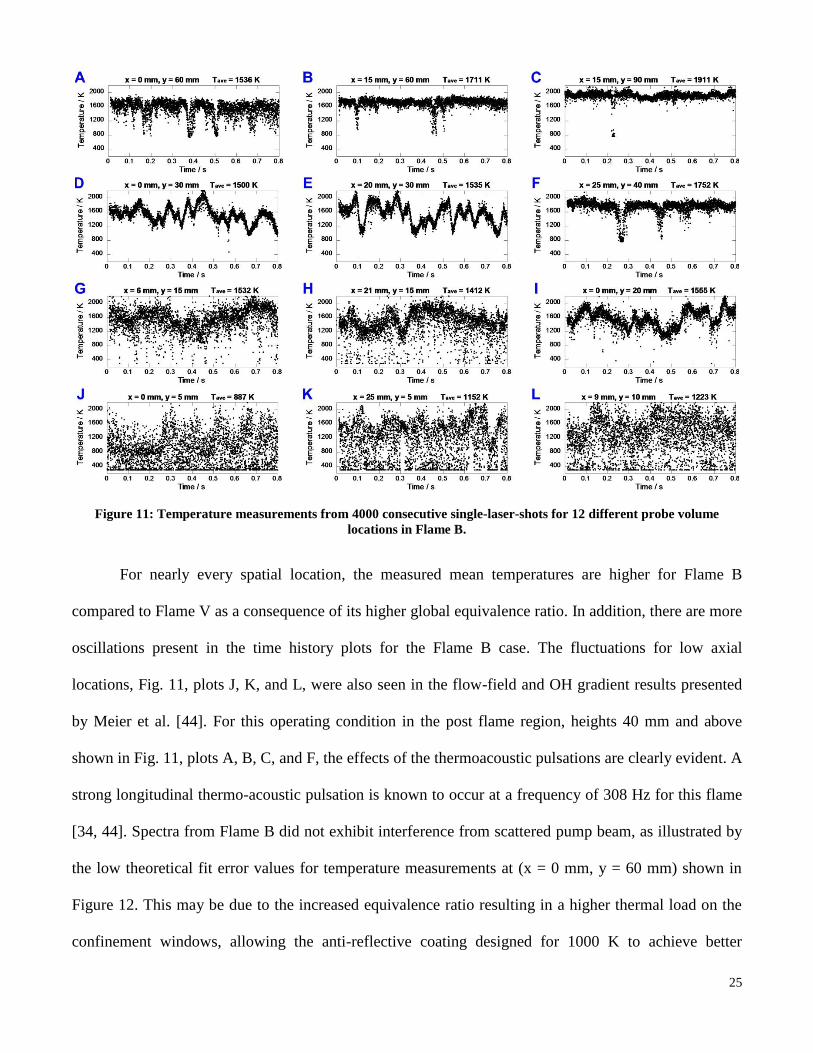
Temperature measurements obtained from 12 locations for the Flame B operating condition are
shown in Figure 11. Previously, simultaneous OH PLIF and PIV measurements were performed at 5
kHz by Meier et al. in this flame [44]. The reference contains figures and a discussion of the flow field
and phase-correlated flame structure as determined by experiment. Flame V exhibited a characteristic V-
shaped flow-field as shown in Fig. 6, as the air mass flow rate was decreased during transition to the
richer operating condition of Flame B. The flow-field for Flame B is shown in Figure 3 of part 2 of this
work entitled; “Analysis of Swirl Flame Dynamics”.
25
Figure 11: Temperature measurements from 4000 consecutive single-laser-shots for 12 different probe volume
locations in Flame B.
For nearly every spatial location, the measured mean temperatures are higher for Flame B
compared to Flame V as a consequence of its higher global equivalence ratio. In addition, there are more
oscillations present in the time history plots for the Flame B case. The fluctuations for low axial
locations, Fig. 11, plots J, K, and L, were also seen in the flow-field and OH gradient results presented
by Meier et al. [44]. For this operating condition in the post flame region, heights 40 mm and above
shown in Fig. 11, plots A, B, C, and F, the effects of the thermoacoustic pulsations are clearly evident. A
strong longitudinal thermo-acoustic pulsation is known to occur at a frequency of 308 Hz for this flame
[34, 44]. Spectra from Flame B did not exhibit interference from scattered pump beam, as illustrated by
the low theoretical fit error values for temperature measurements at (x = 0 mm, y = 60 mm) shown in
Figure 12. This may be due to the increased equivalence ratio resulting in a higher thermal load on the
confinement windows, allowing the anti-reflective coating designed for 1000 K to achieve better

26
performance or the windows never were in a position allowing pump laser light to be scattered into the
detection channel. For Flame B, at axial locations (y = 5 mm) and (y = 10 mm) at least 92% of laser
shots were valid and free from detector saturation, at (y = 15 mm) and (y= 20 mm) 98 % of shots were
valid, and at axial locations (y = 30 mm) and above greater than 99% shots were valid.
Figure 12: Temperature measurements and least squares error between experimental and theoretical spectra for
probe volume location x = 0 mm, y = 60 mm in Flame B.
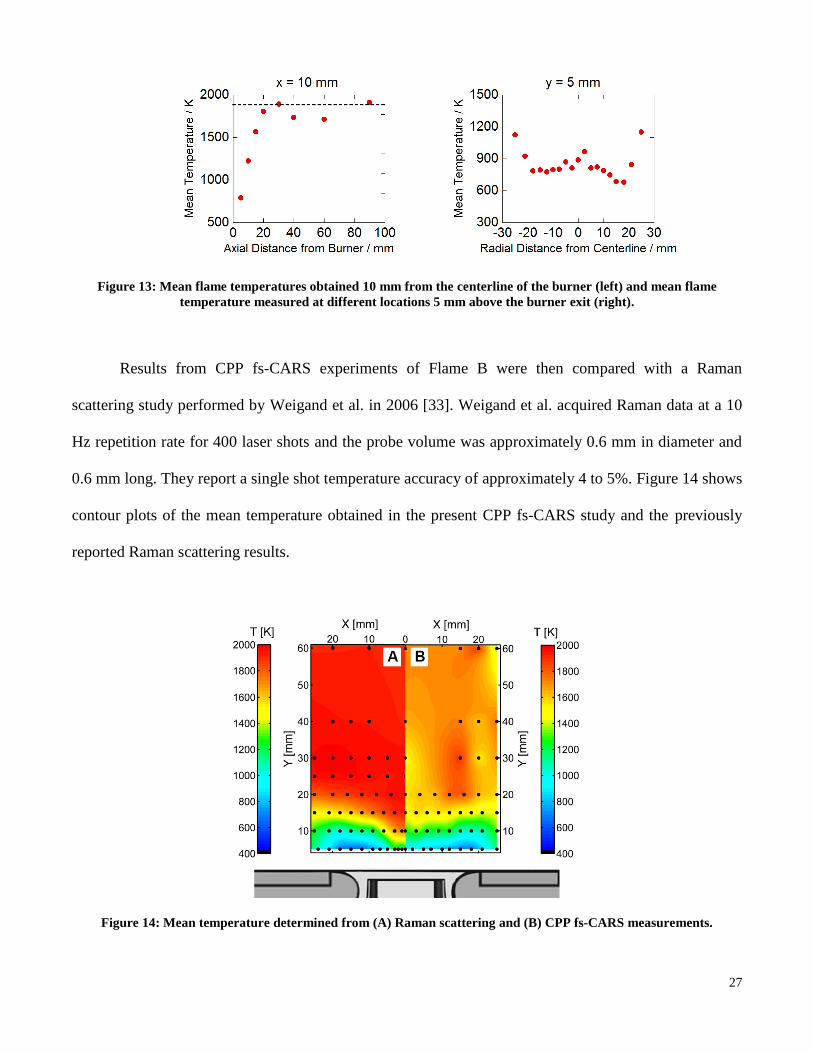
The Flame B operating conditions corresponded to a global adiabatic flame temperature of 1915
K. Figure 13 shows the measured mean temperatures obtained approximately 10 mm from the GTMC
centerline and mean temperatures at different horizontal locations 5 mm above the burner.
Measurements at the radial location x = 10 mm were not obtained for axial heights y = 30, 40, 60, 90
mm, the mean temperatures shown in Figure 13 are from the x = 15 mm location. The maximum
average temperature obtained 90 mm above the burner was within 5 K of the global adiabatic flame
temperature as indicated by the dashed line. Mean temperatures at y = 40 and 60 mm are low and do not
follow the expected trend however the values are within 3.6% of the expected post flame temperature.
The radial profile of mean temperatures obtained across the burner shows good symmetry despite the
high level of turbulence present.
27
Figure 13: Mean flame temperatures obtained 10 mm from the centerline of the burner (left) and mean flame
temperature measured at different locations 5 mm above the burner exit (right).
Results from CPP fs-CARS experiments of Flame B were then compared with a Raman
scattering study performed by Weigand et al. in 2006 [33]. Weigand et al. acquired Raman data at a 10
Hz repetition rate for 400 laser shots and the probe volume was approximately 0.6 mm in diameter and
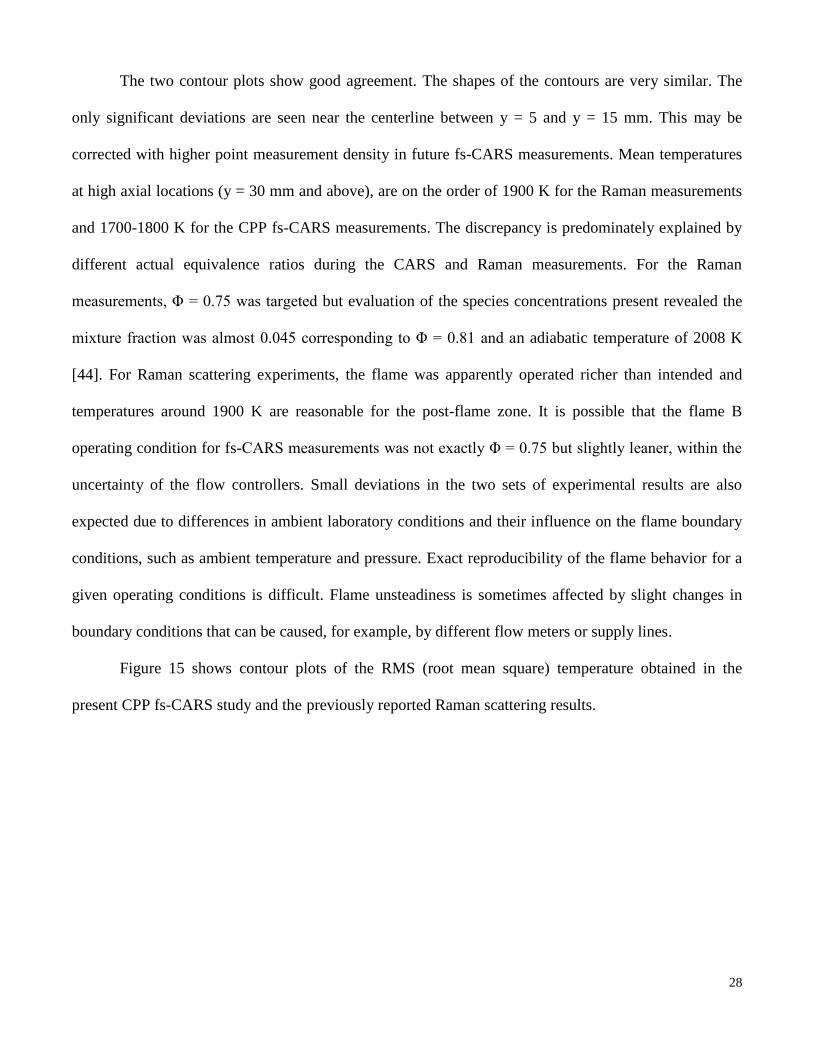
0.6 mm long. They report a single shot temperature accuracy of approximately 4 to 5%. Figure 14 shows
contour plots of the mean temperature obtained in the present CPP fs-CARS study and the previously
reported Raman scattering results.
Figure 14: Mean temperature determined from (A) Raman scattering and (B) CPP fs-CARS measurements.
28
The two contour plots show good agreement. The shapes of the contours are very similar. The
only significant deviations are seen near the centerline between y = 5 and y = 15 mm. This may be
corrected with higher point measurement density in future fs-CARS measurements. Mean temperatures
at high axial locations (y = 30 mm and above), are on the order of 1900 K for the Raman measurements
and 1700-1800 K for the CPP fs-CARS measurements. The discrepancy is predominately explained by
different actual equivalence ratios during the CARS and Raman measurements. For the Raman
measurements, Φ = 0.75 was targeted but evaluation of the species concentrations present revealed the
mixture fraction was almost 0.045 corresponding to Φ = 0.81 and an adiabatic temperature of 2008 K
[44]. For Raman scattering experiments, the flame was apparently operated richer than intended and
temperatures around 1900 K are reasonable for the post-flame zone. It is possible that the flame B
operating condition for fs-CARS measurements was not exactly Φ = 0.75 but slightly leaner, within the
uncertainty of the flow controllers. Small deviations in the two sets of experimental results are also
expected due to differences in ambient laboratory conditions and their influence on the flame boundary
conditions, such as ambient temperature and pressure. Exact reproducibility of the flame behavior for a
given operating conditions is difficult. Flame unsteadiness is sometimes affected by slight changes in
boundary conditions that can be caused, for example, by different flow meters or supply lines.
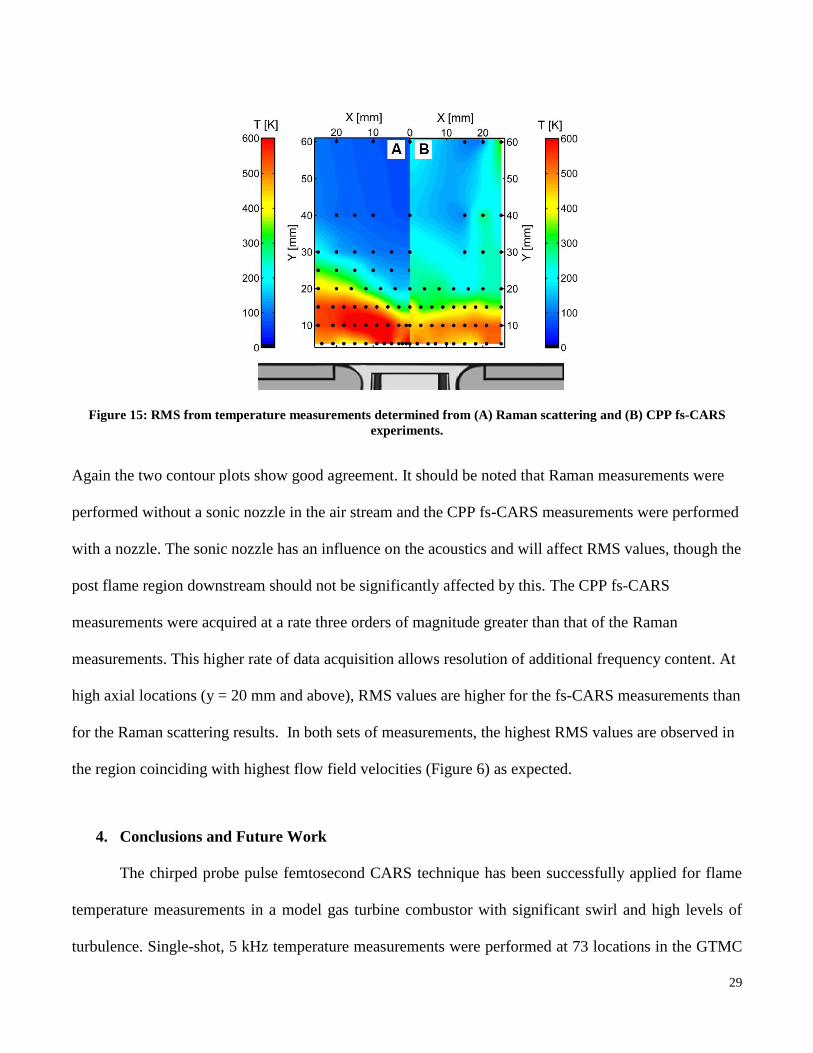
Figure 15 shows contour plots of the RMS (root mean square) temperature obtained in the
present CPP fs-CARS study and the previously reported Raman scattering results.
29
Figure 15: RMS from temperature measurements determined from (A) Raman scattering and (B) CPP fs-CARS
experiments.
Again the two contour plots show good agreement. It should be noted that Raman measurements were
performed without a sonic nozzle in the air stream and the CPP fs-CARS measurements were performed
with a nozzle. The sonic nozzle has an influence on the acoustics and will affect RMS values, though the
post flame region downstream should not be significantly affected by this. The CPP fs-CARS
measurements were acquired at a rate three orders of magnitude greater than that of the Raman
measurements. This higher rate of data acquisition allows resolution of additional frequency content. At
high axial locations (y = 20 mm and above), RMS values are higher for the fs-CARS measurements than
for the Raman scattering results. In both sets of measurements, the highest RMS values are observed in
the region coinciding with highest flow field velocities (Figure 6) as expected.
4. Conclusions and Future Work
The chirped probe pulse femtosecond CARS technique has been successfully applied for flame
temperature measurements in a model gas turbine combustor with significant swirl and high levels of
turbulence. Single-shot, 5 kHz temperature measurements were performed at 73 locations in the GTMC

30
for two different operating conditions. Somewhat to our surprise, nearly every laser shot produced
significant CARS signal; no significant loss of signal due to beam steering, pressure fluctuations, or
shear layer density gradients was observed. The technique demonstrated excellent accuracy producing
maximum mean post flame temperature measurements within 15 K of the adiabatic flame temperature
calculated from the global equivalence ratio of each operating condition and Flame B results show good
agreement with previous Raman scattering measurements. In sequences of consecutive single-shot
temperature measurements from the Flame B operating condition, influence of the longitudinal
thermoacoustic pulsation is observable in the post flame region. The high-repetition-rate CPP fs-CARS
measurements highlight rapid fluctuations in local flow temperature due to oscillations generated by the
nonlinear interaction of turbulence and combustion reactions. Extensive analysis of these thermoacoustic
instabilities, including phase-locked coupling of the CPP fs-CARS results with the acoustic response of
the GTMC, and implications for advanced swirling flow combustor designs are discussed in part 2 of
this work; “Analysis of Swirl Flame Dynamics”. Results presented here demonstrate the usefulness of
high repetition rate CPP fs-CARS for the study of highly turbulent flames of practical interest.
For future experiments we would like to eliminate interference caused by scattering of the pump laser
beam which was observed on an intermittent basis in the Flame V measurements at locations greater
than 20 mm above the nozzle exit, however not an issue for the Flame B measurements. To accomplish
this, one possible approach for future CPP fs-CARS experiments is to use a three-color CARS process in
which the pump and probe wavelengths will be 800 nm, the Stokes beam will be tuned to 983 nm with
the OPA, and the resulting CARS signal will occur at 675 nm. The disadvantage of this approach is that
the OPA conversion efficiency is lower at 983 nm. This will reduce the available pump laser energy
compared to the current scheme and reduce the CPP fs-CARS signal strength. In addition, modification
to the post processing calculations in order to account for scattered light may be explored. By employing
a two detection channel scheme, the dynamic range of the technique can be improved, eliminating

31
detector saturation, and allow for increased sensitivity of the CARS signal measurements. This was
demonstrated recently in our laboratory using a borrowed EMCCD camera and spectrometer [39].
Acknowledgements
Funding for this work was provided by the U.S. Department of Energy, Division of Chemical Sciences,
Geosciences and Biosciences under Grant No. DE-FG02-03ER15391 and by the King Abdullah
University of Science and Technology under CCF sub-award No. 1975-01. The ultrafast laser system
was purchased with funding from AFOSR DURIP Grant No. FA9550-09-1-0387. Support for
manuscript preparation was provided by Office of Naval Research NSTAR under ID No. ILIR-4767.
References
1 G. J. Nathan, P. A. M. Kalt, Z. T. Alwahabi, B. B. Dally, P. R. Medwell, Q. N. Chan, Recent advances in the measurement
of strongly radiating, turbulent reacting flows, Prog. Energ. Combust. 38 (2012) 41-61. 2 I. Boxx, C. D. Carter, M. Stohr, W. Meier, Study of the mechanisms for flame stabilization in gas turbine model combustors
using kHz laser diagnostics, Exp. Fluids 54 (2013) 1532-1549. 3 I. Boxx, C. Slabaugh, P. Kutne, R. P. Lucht, W. Meier, 3 kHz PIV/OH-PLIF measurements in a gas turbine combustor at
elevated pressure, Proc. Combust. Inst. 35 (2015) 3793-3802. 4 R. Giezendanner, O. Keck, P. Weigand, W. Meier, U. Meier, W. Stricker, M. Aigner, Periodic combustion instabilities in a
swirl burner studied by phase-locked planar laser-induced fluorescence, Combust. Sci. Technol. 175 (2003) 721-741. 5 X.R. Duan, W. Meier, P. Weigand, B. Lehmann, Phase-resolved laser Raman scattering and laser Doppler velocimetry
applied to periodic instabilities in a gas turbine model combustor, Appl. Phys. B 80 (2005) 389-396. 6 J. D. Black, M. P. Johnson, In-situ laser-induced incandescence of soot in an aero-engine exhaust: Comparison with
certification style measurements, Aerosp. Sci. Technol. 14 (2010) 329-337. 7 T.R. Meyer, S. Roy, V. M. Belovich, E. Corporan, J. R. Gord, Simultaneous planar laser-induced incandescence, OH planar
laser-induced fluorescence, and droplet Mie scattering in swirl-stabilized spray flames, Appl. Opt. 44 (2005) 445–454. 8 M. M. Tripathi, K. K. Srinivasan, S. R. Krishnan, F. Yueh, J. P. Singh, A comparison of multivariate LIBS and
chemiluminescence-based local equivalence ratio measurements in premixed atmospheric methane-air flames, Fuel 106
(2013) 318-326. 9 L. Zimmer, S. Tachibana, Laser induced plasma spectroscopy for local equivalence ratio measurements in an oscillating
combustion environment, Proc. Combust. Inst. 31 (2007) 737-745. 10 T. R. Meyer, S. Roy, R. P. Lucht, J. R. Gord, Dual-pump dual-broadband CARS for exhaust-gas temperature and CO2–O2–
N2 mole-fraction measurements in model gas-turbine combustors, Combust. Flame 142 (2005) 52-61. 11 U. Stopper, W. Meier, R. Sadanandan, M. Stohr, M. Aigner, G. Bulat, Experimental Study of Industrial Gas Turbine
Flames Including Quantification of Pressure Influence on Flow Field, Fuel/Air Premixing and Flame Shape, Combust.
Flame 160 (2013) 2103-2118. 12 B. Bohm, C. Heeger, R. L. Gordon, A. Dreizler, New perspectives on turbulent combustion: multi-parameter high-speed
planar laser diagnostics, Flow Turbul. Combust. 86 (2011) 313-341. 13 R. F. Begley, A. B. Harvey, R. L. Byer, Coherent anti‐Stokes Raman spectroscopy, Appl. Phys. Lett. 25 (1974) 387-390. 14 A.C. Eckbreth, Laser Diagnostics for Combustion Temperature and Species, Abacus Press, UK, 1988.

32
15 S. Roy, J. R. Gord, A. K. Patnaik, Recent advances in coherent anti-Stokes Raman scattering spectroscopy: Fundamental
developments and applications in reacting flows, Prog. Energy Combust. Sci. 36 (2010) 280-306. 16 R. P. Lucht, S. Roy, T. R. Meyer, J. R. Gord, Femtosecond coherent anti-Stokes Raman scattering measurement of gas
temperatures from frequency-spread dephasing of the Raman coherence, Appl. Phys. Lett. 89 (2006) 251112. 17 S. Roy, P. J. Kinnius, R. P. Lucht, J. R. Gord, Temperature measurements in reacting flows by time-resolved femtosecond
coherent anti-Stokes Raman scattering (fs-CARS) spectroscopy, Opt. Comm. 281 (2008) 319-325. 18 J. R. Gord, T. R. Meyer, S. Roy, Applications of Ultrafast Lasers for Optical Measurements in Combusting Flows, Annu.
Rev. Anal. Chem. 1 (2008) 663-687. 19 R. P. Lucht, P. J. Kinnius, S. Roy, J. R. Gord, Theory of femtosecond coherent anti-Stokes Raman scattering spectroscopy
of gas-phase transitions, J. Chem. Phys. 127 (2007) 044316. 20 T. Lang, M. Motzkus, Single-shot femtosecond coherent anti-Stokes Raman-scattering thermometry, J. Opt. Soc. Am. B 19
(2002) 340-344. 21 J. D. Miller, C. E. Dedic, T. R. Meyer, Vibrational femtosecond/picosecond coherent anti-Stokes Raman scattering with
enhanced temperature sensitivity for flame thermometry from 300 to 2400 K, J. Raman Spectrosc. 46 (2015) 702-707. 22 S. P. Kearney, D. J. Scoglietti, Hybrid femtosecond/picosecond rotational coherent anti-Stokes Raman scattering at flame
temperatures using a second-harmonic bandwidth-compressed probe, Opt. Lett. 38 (2013) 833-835. 23 S. P. Kearney, Bandwidth optimization of femtosecond pure-rotational coherent anti-Stokes Raman scattering by
pump/Stokes spectral focusing, Appl. Opt. 53 (2014) 6579-6585. 24 S. P. Kearney, Hybrid fs/ps rotational CARS temperature and oxygen measurements in the product gases of canonical flat
flames, Combust. Flame 162 (2015) 1748-1758. 25 C. E. Dedic, J. D. Miller, T. R. Meyer, Dual-pump vibrational/rotational femtosecond/picosecond coherent anti-Stokes
Raman scattering temperature and species measurements, Opt. Lett. 39 (2014) 6608-6611. 26 D. R. Richardson, R. P. Lucht, S. Roy, W. D. Kulatilaka, J. R. Gord, Single-Laser-Shot Femtosecond Coherent Anti-Stokes
Raman Scattering Thermometry at 1000 Hz in Unsteady Flames, Proc. Combust. Inst. 33 (2011) 839-845. 27 D. Bangar, C. N. Fineman, R. P. Lucht, Flame Thermometry and Concentration Measurements at 5 kHz Using
Femtosecond Coherent Anti-Stokes Raman Scattering, 51st AIAA Aerospace Sciences Meeting, (2013) AIAA 2013-0336.
28 C. N. Dennis, C. D. Slabaugh, I. G. Boxx, W. Meier, R. P. Lucht, Chirped probe pulse femtosecond coherent anti-Stokes
Raman scattering thermometry at 5 kHz in a Gas Turbine Model Combustor, Proc. Combust. Inst. 35 (2015) 3731-3738. 29 R. Giezendanner, P. Weigand, X.R. Duan, W. Meier, U. Meier, M. Aigner, B. Lehmann, Laser-Based Investigations of
Periodic Combustion Instabilities in a Gas Turbine Model Combustor, J. Eng. Gas Turbul. Power 127 (2005) 492-496. 30 R. Giezendanner, U. Meier, W. Meier, M. Aigner, Phase-Locked Temperature Measurements by Two-Line OH PLIF
Thermometry of a Self-Excited Combustion Instability in a Gas Turbine Model Combustor, Flow Turbul. Combust. 75
(2005) 317-333. 31 R. Giezendanner, U. Meier, W. Meier, J. Heinze, M. Aigner, Phase-locked two-line OH planar laser-induced fluorescence
thermometry in a pulsating gas turbine model combustor at atmospheric pressure, Appl. Opt. 44 (2005) 6565-6577. 32 P. Weigand, W. Meier, X.R. Duan, R. Giezendanner-Thoben, U. Meier, Laser Diagnostic Study of the Mechanism of a
Periodic Combustion Instability in a Gas Turbine Model Combustor, Flow Turbul. Combust. 75 (2005) 275-292. 33 P. Weigand, W. Meier, X.R. Duan, W. Stricker, M. Aigner, Investigations of swirl flames in a gas turbine model
combustor: I. Flow field, structures, temperature, and species distributions, Combust. Flame 144 (2006) 225-236. 34 I. Boxx, M. Stöhr, C. Carter, W. Meier, Temporally resolved planar measurements of transient phenomena in a partially
pre-mixed swirl flame in a gas turbine model combustor, Combust. Flame 157 (2010) 1510-1525. 35 W. D. Kulatilaka, R. P. Lucht, S. F. Hanna, V. R. Katta, Two-color, two-photon laser-induced polarization spectroscopy
(LIPS) measurements of atomic hydrogen in near-adiabatic, atmospheric pressure hydrogen/air flames, Combust. Flame
137 (2004) 523-537. 36 A. Satija, R. P. Lucht, Development of a combined pure rotational and vibrational coherent anti-Stokes Raman scattering
system, Opt. Lett. 38 (2013) 1340-1342. 37 D. R. Richardson, R. P. Lucht, W. D. Kulatilaka, S. Roy, J. R. Gord, Theoretical modeling of single-laser-shot, chirped-
probe-pulse femtosecond coherent anti-Stokes Raman scattering thermometry, Appl. Phys. B 104 (2011) 699-714. 38 D. R. Richardson, D. Bangar, R. P. Lucht, Polarization suppression of the nonresonant background in femtosecond
coherent anti-Stokes Raman scattering for flame thermometry at 5 kHz, Opt. Express 20 (2012) 21495-21504. 39 C. N. Dennis, A. Satija, R. P. Lucht, High dynamic range thermometry at 5 kHz in hydrogen–air diffusion flame using
chirped-probe-pulse femtosecond coherent anti-stokes Raman scattering, J. Raman Spec. (2015) In press, available
online doi: 10.1002/jrs.4773. 40 M. Stöhr, W. Meier, Investigation of a Periodic Combustion Instability in a Swirl Burner Using Phase-Resolved PIV, Proc.
3rd
European Combustion Meeting (2007), paper 18-10. 41 M. Stöhr, I. Boxx, C. D. Carter, W. Meier, Experimental study of vortex-flame interaction in a swirl combustor, Combust.
Flame 159 (2012) 2636-2649.

33
42 A. M. Steinberg, I. Boxx, M. Stöhr, C. D. Carter, W. Meier, Flow-flame interactions causing acoustically coupled heat
release fluctuations in a thermo-acoustically unstable gas turbine model combustor, Combust. Flame 157 (2010) 2250-
2266. 43 M. Stöhr, R. Sadanandan, W. Meier, Phase-resolved characterization of vortex–flame interaction in a turbulent swirl flame,
Exp. Fluids 51(2011) 1153-1167. 44 W. Meier, I. Boxx, M. Stöhr, C. D. Carter, Laser-based investigations in gas turbine model combustors, Exp. Fluids 49
(2010) 865-882.