co apcd annual report wer cost - civhc.org · 2016 co apcd annual report ... colorado division of...
TRANSCRIPT

CO APCD ANNUAL REPORT2016 LOW
ER COST
IMPROVED C
ARE
BETTER HEALT
H

2016 CO APCD ANNUAL REPORTWho is CIVHC? ........................1What is the CO APCD?...........1-2Successes......................................3-5Opportunities..............................5Costs..............................................6Future Enhancements.................6-7
OV
ERV
IEW
Featured Change Agents| National Bureau of Economic Research......................9 | Network for Regional Healthcare Improvement.......10| Colorado Division of Insurance.....................................11
Data to Support Change Agents| Regional Payment Variation..............................................12
LOW
ER
CO
ST
Featured Change Agents| Oregon State University College of Pharmacy...............13| Denver Regional Council of Governments.....................14| Chronic Care Collaborative Colorado............................15
Data to Support Change Agents| Free Standing Emergency Departments...........................16-17
IMP
RO
VE
D C
AR
E
Featured Change Agents| Brigham and Women’s Hospital...................18| Colorado State Innovation Model..............19-20| Susan G. Komen ® Colorado.......................21
Data to Support Change Agents| Hepatitis C in Colorado................................22
BE
TT
ER
HE
ALT
H
AP
PE
ND
ICE
S Recommendations to General AssemblySpot Analysis Publications
| Payment Variation by Payer| Free Standing Emergency Department
Hepatitis C InfographicData Bytes
| Trends in Teen Pregnancy Rates| EpiPen Prescription Cost Trends
CO APCD CapabilitiesData Requests Fulfilled - 2016

Change Agent • nounIndividual or organization working to lower costs, improve care, and make Colorado healthier.
Change Agents across Colorado break down barriers firmly entrenched in our health care system. With boundless passion and limited resources, they increase access to care, implement innovative ways to deliver high quality care at affordable prices, and day in and day out, fight to keep Coloradans healthy.
It is CIVHC’s privilege to serve all those who strive toward a better health system for us all.

Who is CIVHC?What is the CO APCD?SuccessesOpportunitiesCostsFuture Enhancements
OV
ERV
IEW
WHO IS CIVHC?The Center for Improving Value in Health Care (CIVHC) is a non-partisan, not-for-profit organization. We believe that individuals and organizations can alter the trajectory of health care.
In 2010, the Executive Director of the Colorado Department of Health Care Policy and Financing (HCPF) appointed CIVHC the Administrator of the Colorado All Payer Claims Database (CO APCD). Recommended by the Blue Ribbon Commission for Health Care Reform and enabled by House Bill 10-1330, the CO APCD is the state’s most comprehensive claims data set. It can provide insights into the health of Coloradans as well as health care utilization, quality, outcomes, and cost.
The CO APCD is a unique data resource that provides an additional way for CIVHC to support the work of collaborators, beyond consensus building, connection, and promotion of their programs and innovations. Prepared for the Colorado Legislature, this report not only explores the current status of the CO APCD but also details how some of these extraordinary individuals and organizations are using insights from this state resource to change the trajectory of Colorado’s health care system.
WHAT IS THE CO APCD?The CO APCD is a secure database compliant with all federal privacy laws; at the end of 2016 it contained over 510 million health insurance claims from over 21 commercial health insurance companies, Medicare, Medicare Advantage, and Health First Colorado (Colorado’s Medicaid Program). The complexity and scale of the database grow each month. It is the only claims repository in the state that represents the majority of insured lives in Colorado, with more than five years of data, it offers a more complete picture of our health care system than other available sources of claims information.
Coloradans both generate and benefit from CO APCD data. Coloradans who have health insurance generate CO APCD data when they receive a health care service at their provider’s office, a clinic, a hospital, laboratory, or pharmacy. After they receive the service, their provider files a claim with an insurance company. This claim contains important information including cost, location, diagnosis, and services rendered. Once the insurance company pays the claim to the provider, the insurance company then securely submits the paid, adjudicated claim to the CO APCD in keeping with patient privacy laws. Once the claim has been processed and analyzed, it goes into the CO APCD data warehouse with patient identifier information removed. These claims can provide valuable insights on how Colorado is paying for and using health care. CIVHC then makes this information available to Colorado researchers, state agencies, advocacy organizations, consumers, nonprofits, and others working to improve health care and lower costs for the benefit of Colorado residents.
CIVHC’s mission is to support initiatives working to advance the Triple Aim of lower costs, improved care, and better health for Coloradans. Initially, CIVHC served solely as a convener of diverse stakeholders committed to changing the way care is paid for and delivered. Through work groups and task forces, CIVHC cultivated relationships with likeminded partners who continue to make improvements throughout the state.
1

Who is CIVHC?What is the CO APCD?SuccessesOpportunitiesCostsFuture Enhancements
OV
ERV
IEW
Public CO APCD AnalysisOne of CIVHC’s primary roles as the Administrator of the CO APCD is to normalize and make sense of the millions of lines of claims data received every month and turn them into actionable information. Increasing access to transparent health care data is foundational to CIVHC’s work and to Coloradans’ ability to make informed decisions that will have lasting benefit to their overall health. Public data releases, interactive maps and charts, and analyses available on the CO APCD Website (www.comedprice.org) are some of the tools CIVHC employs to bring transparency to the health care marketplace. The CO APCD website also enables Coloradans to shop for location-specific price and quality information for services like having a baby or getting a knee replacement.
Custom CO APCD AnalysisCIVHC provides custom data sets and reports to requestors seeking to advance the Triple Aim. Every release of data must benefit Colorado, as mandated by the enabling statute of the CO APCD. Entities across the health care spectrum have used CO APCD data to improve the lives of Coloradans; examples include Denver Health, Children’s Hospital, Colorado Health Institute, and Health First Colorado.
Health Plans •1
Data Requestors in 2016
Hospitals & Providers • 6
Academics & Researchers • 7
Non-Profits & Other • 28
State Agencies • 72
Total Requests Fulfilled:
114
2016 was focused on enhancing the foundation of the CO APCD and clearing the way for future innovation. CIVHC strengthened internal data quality and analytics capabilities while gaining external input on how to elevate the value of the CO APCD to the Colorado health care landscape.
22 data requests received CO APCD scholarship funding
2

Who is CIVHC?What is the CO APCD?SuccessesOpportunitiesCostsFuture Enhancements
OV
ERV
IEW
SUCCESSESNew Data VendorsCIVHC’s nationwide search for new vendors for data warehouse management and analytics reporting spanned both 2015 and 2016. After a robust RFP and search committee process, the Human Services Research Institute (HSRI) and the independent research organization, NORC, at the University of Chicago, were selected to provide data processing and storage as well as advanced analytics for the CO APCD. The CIVHC team spent the final months of 2016 working to ensure a seamless transition between vendors and establishing new analytic rules, expanded reporting capabilities, and benchmarks.
New CO APCD Vendor Comparison (Full transition planned for July 2017)
3

Who is CIVHC?What is the CO APCD?SuccessesOpportunitiesCostsFuture Enhancements
OV
ERV
IEW
Scholarship RenewedThe Colorado General Assembly renewed the CO APCD Scholarship Fund established in 2014, allocating funds to offset the cost of data for requestors with limited resources. The Colorado Department of Health Care Policy and Financing administers the funds, and requestors must meet specific criteria in order to be considered for the scholarship.
Scholarship Recipients for 2016*University of Colorado Department of Health Care Policy and Financing Colorado Department of Public Health and the Environment Colorado Commission for Affordable Health CareChildren’s Hospital Northwest Colorado Community Health PartnershipColorado Office of Behavioral Health
Pueblo Triple AimAurora Research Institute Coalition for Sepsis SurvivalProject Angel HeartSenator KefalasLiver Health ConnectionMesa County
Participation in National GrantsCO APCD data informed local and national efforts including Colorado’s State Innovation Model supported by the Center for Medicare & Medicaid Innovation as well as studies funded by the Robert Wood Johnson Foundation and the National Bureau of Economic Research.
Public ReportingIn 2016, CIVHC released three impactful Spot Analyses identifying health care cost drivers and opportunities to save money. These publications help inform Change Agents across the spectrum and provide concrete examples of the power and value of the CO APCD. Copies of each are included in the Appendices of this report.
Consumers and those working in public or population health got new CO APCD data in 2016 to help them advance the Triple Aim. CIVHC added new measures to the CO APCD website and updated the years for which data is available.
2013-2014 Medicaid and Commercial Claims
New Features and MeasuresViews by Health Statistics RegionsObservation StaysChronic Condition Prevalence (Hypertension and Depression)Preventive Care Measures (Breast Cancer, Cervical Cancer, Colorectal Screening, and Diabetes Care LDL-C Testing)
2016 Website Updates
4
*22 total data requestors received scholarship funding in 2016. Some entities received multiple awards.

Who is CIVHC?What is the CO APCD?SuccessesOpportunitiesCostsFuture Enhancements
OV
ERV
IEW
National Recognition for Price TransparencyThe breadth of information that CIVHC provides, publicly and through custom requests, surpasses that of most state APCDs. Colorado ranks in the top three states for the degree of consumer access to price information available on www.comedprice.org and received an “A” grade in pricing transparency from the Catalyst for Payment Reform and Healthcare Cost Incentives Improvement Institute in 2016. i
OPPORTUNITIESData DiscoveryCIVHC implemented the CO APCD in 2012 and established specific rules regarding what information would be included on the claims submitted by the payers and the procedures for processing claims for inclusion in the data warehouse. The CIVHC Data and Analytics team evaluates and refines these rules each year, streamlining procedures and ensuring that the CO APCD contains the highest quality data possible.
In 2015, CIVHC added quality control analysts who applied greater levels of quality review to identify any discrepancies in payer submission and processing that required attention. The CIVHC team worked with the data warehouse manager and the payers to develop and apply solutions necessary to meet CIVHC’s rigorous data quality standards. CIVHC continues to enhance this stringent review of data while digging deeper into all levels of the data. Further improvements in upfront payer submission processing, business rules, and analytic expansions have been incorporated with the new data vendors.
Self-Insured Supreme Court DecisionSelf-insured claims represent approximately 30 percent of insured lives in Colorado and historically have posed a significant gap for the CO APCD. Via a rule change promulgated by the Department of Health Care Policy and Financing (HCPF) in June 2015, the definition of “payer” in the CO APCD statute was expanded to include self-insured employers.
Submission of self-insured claims to the CO APCD began in January 2016. However, on March 1, 2016, the United States Supreme Court ruled that states could not mandate submission of claims data from self-insured Employee Retirement Income Security Act (ERISA) plans to APCDs. CIVHC worked with HCPF and the Colorado Attorney General to bring the 2015 rule regarding self-insured payers into compliance with the Federal decision. The updated rule removes the mandate that self-insured ERISA employer plans must submit to the CO APCD. Non-ERISA employer plans (e.g. state, city and school district employers) must continue to submit to the CO APCD. The updated rule was effective July 31, 2016.
Though the ruling reduces the mandated number of claims to be submitted by self-insured ERISA employers, they are still able to voluntarily submit data to the CO APCD. To this end, CIVHC continues to educate employers on the value of submitting claims to the CO APCD via one-to-one outreach and alignment with employer-focused community organizations and health plan brokers.
A
5

Who is CIVHC?What is the CO APCD?SuccessesOpportunitiesCostsFuture Enhancements
OV
ERV
IEW
COST OF ADMINISTERING THE CO APCD
CO APCD Earned Revenue - $2.4 millionCO APCD Grant Revenue - $1.4 millionTotal CO APCD Revenue Taken In - $3.8 million
GRANTS EARNED$1.4M $2.4M
Cost of administering the CO APCD FY16 - $3.8 million
Standard Reports (NEW) - Start at $500Custom Reports - $1,500 - $20,000De-Identified & Limited Datasets - $15,000 - $50,000
Revenue Data Access Fee Schedule
The CO APCD receives no direct, ongoing operational state funding; the enabling statute specifies that all funds must be raised by the Administrator. Generous capacity-building grants from HCPF, The Colorado Trust, and the Colorado Health Foundation have enabled CIVHC to develop, implement, and grow the CO APCD, contingent on its becoming a self-sustainable resource. CIVHC is pleased that the funding of the transition to the new data vendor, new reporting capabilities, and processing enhancements are all being funded with CIVHC reserves and are expected to be completed by June 2017.
As the demand for data has increased, so have operational costs. The CO APCD operating budget was $2.7 million in fiscal year 2015 (July 2014 – June 2015) and increased to $3.8 million in fiscal years 2016 and 2017. Annual operating costs cover maintenance, analytics, data and analytic staff, continued data onboarding, and developing and releasing CO APCD public resources. Additional operational and programmatic funding from the Colorado Health Foundation and The Colorado Trust continues through 2018, offering a glide path to full sustainability. CIVHC strives to address operational funding shortfalls through delivery of non-public releases of data including providing data to local and national grant projects.
While the number of custom requests for data increases annually, and financial assistance provided by the CO APCD scholarship fund greatly supports organizations with resource limitations, it remains difficult for many organizations to cover the costs associated with data extracts, analytics, and services. As a result, there continues to be an inherent tension between CIVHC’s desire and mandate to make data available and the need to create a sustainable CO APCD business model.
THE CO APCD IN 2017Since implementation in 2012, the CO APCD has received national recognition for its design and capabilities. This national recognition continues, and as we look toward 2017, CIVHC is committed to maximizing the value of this important state resource and implementing new ways to provide actionable CO APCD data to Colorado.
New Data VendorsCIVHC’s new data vendors, HSRI and NORC, will be fully in place and operating in the spring of 2017. These new additions to the CIVHC team will bring quicker database updates and increased analytic capabilities. As data vendors to Maine’s APCD, they both have extensive experience implementing an APCD and will apply new, nationally accepted data processing rules to the CO APCD, thus increasing the power and complexity of the
6

Who is CIVHC?What is the CO APCD?SuccessesOpportunitiesCostsFuture Enhancements
OV
ERV
IEW
More Custom FulfillmentsAs capacity of the CO APCD grows, so does CIVHC’s ability to provide data to local and national projects. The CIVHC and HSRI/NORC teams and other partners are already hard at work developing new analytic tools, reports, and accessible data portals to help advance the Triple Aim.
Enhanced Public CO APCD DataCIVHC is excited to announce that plans are underway for a new website, combining www.civhc.org, www.comedprice.org, and www.comedpriceshowcase.org, as well as a new non-public data portal, into a one-stop shop for information and CO APCD data. The new site will have a fresh and exciting user experience, new measures and updated public information, and will allow stakeholders across the full continuum of health care to access data and investigate ways to better the health care system.
Cross-sector Feedback and Collaboration on Public ReportingBeginning in 2017, CIVHC is working with the HCPF-appointed CO APCD Advisory Committee to develop topics for public reporting including Spot Analyses and interactive website measures. The Committee iscomprised of consumers and stakeholders across the health care spectrum, and their knowledge and expertise will help ensure that publicly available data and reports address topics of high value and importance to Colorado.
Adding Critical Data Sources
The potential of the CO APCD is tremendous, yet CIVHC realizes that claims data only tells part of the health care story in Colorado. By aligning claims data with clinical, socio-economic, geographic, and environmental information, it may be possible to see how the circumstances in patients’ lives affect their health. To increase opportunities for such valuable analysis, CIVHC is collaborating with other organizations to identify ways to marry claims data with non-claims data sources.
Necessary InnovationThe CO APCD provides a neutral, non-partisan guide to help navigate Colorado’s health care landscape. Such a guide is necessary, as major changes in the nation’s health care system loom on the horizon. More than ever before, data and information are increasingly critical for adaptability and survival. CIVHC is proud to serve Change Agents, large or small, as we all work toward lower costs, better care, and a healthier Colorado.
7

LOWER COST
IMP
RO
VE
D C
AR
EBETTER HEALTH
OV
ERV
IEW
LOWER COST
IMP
RO
VE
D C
AR
EO
VE
RVIE
WBETTER HEALTH
CHANGE AGENT GALLERYChange Agents come in all shapes and sizes. From public health organizations to rural physician practices, from policymakers in state agencies to consumers hunting for health care at the kitchen table, CIVHC strives to serve each and every one.
The following gallery highlights those using CO APCD data for the betterment of all Coloradans.
2016
8

Featured Change Agents| National Bureau of Economic Research | Network for Regional Healthcare Improvement| Colorado Division of Insurance
Data to Support Change Agents| Regional Payment Variation
LOW
ER
CO
ST
The national health care system is rooted in traditional Fee for Service (FFS) payment models that drive up the cost of care without necessarily improving quality and health outcomes. The practice of paying for volume, not value, often results in expensive and unnecessary tests or services instead of more effective and strategic actions to keep patients healthy. In recent years, stakeholders have used CO APCD data to investigate the reasons behind rising health care costs and to find ways to stem the tide.
LOWER COST
National Change AgentNATIONAL BUREAU OF ECONOMIC RESEARCH
ProfileThe National Bureau of Economic Research (NBER) was founded in 1920, and is the nation’s leading nonprofit economic research organization. Twenty-four Nobel Prize winners in Economics and thirteen past chairs of the President’s Council of Economic Advisers have been researchers at the NBER. ii
Project SummaryThis project is helping researchers understand how Medicare reimbursement rates impact the prices set by commercial health insurance plans. CO APCD data is being used to identify scenarios where commercial payments are closely tied to Medicare reimbursement rates. Results of this research will provide insights regarding how private health insurance payers set reimbursement rates, potentially leading to a better understanding of the reasons for significant variation in prices for the same service.
Benefit to ColoradoColorado is an excellent place to study the rate-setting behavior of commercial payers given the large number of insurers and a generally competitive marketplace. A study of reimbursement rate-setting practices has the potential to positively change the health care system by uncovering the reasons for observed price variation. A better understanding of how rate-setting works in Colorado can help policymakers identify potential opportunities to make changes that lower overall health care costs.
Members’ medical care in 2015...
US commercial health insurance companies spent more than
Medicare paid out over
6 billion
1 trillion dollars
9

Featured Change Agents| National Bureau of Economic Research | Network for Regional Healthcare Improvement| Colorado Division of Insurance
Data to Support Change Agents| Regional Payment Variation
LOW
ER
CO
ST
National Change AgentNETWORK FOR REGIONAL HEALTHCARE IMPROVEMENT
ProfileThe Network for Regional Healthcare Improvement (NRHI) is a coalition of 35 Regional Health Improvement Collaboratives (RHICs), including CIVHC, spanning the United States. NRHI is committed to supporting RHICs and leading to collaborative, innovative projects that help members improve care in their regions. iii
Project SummaryThe Total Cost of Care project implemented standard methods to measure variation in the total cost of care and use of health care services at the practice level across different regions of the U.S. to help physicians identify ways to improve quality and lower costs. iv Using a standard methodology, participating RHICs were able to evaluate which regions have the highest and lowest total costs and the primary factor driving those costs – e.g., utilization or prices. CIVHC participated in this national project by analyzing commercial health plan claims data from the CO APCD data for adult primary care and pediatric physician groups. Over 100 provider groups across the state received detailed reports allowing them to understand how their cost and efficiency performance compares to broader averages and to identify where opportunities may exist to change practice patterns in ways that improve quality and lower costs.
Benefit to ColoradoThe scatterplot shows where medical service use (RUI) and the prices paid for care (PI) of participating practices fall in relation to other practices and the statewide average. The intersection of the horizontal and vertical lines indicates the statewide average for both measures. High-performing practices will have low values for both price index and resource use and occupy the lower left quadrant.
As one of seven states participating in this project, Colorado has a lot to gain from the analysis. This information is invaluable, as it provides physicians with data they’ve never had which helps them identify ways they can lower costs and improve care for their patients.
Price Index vs. Resource Use Comparison(2014, Commercial Claims, CO APCD)
10

Featured Change Agents| National Bureau of Economic Research | Network for Regional Healthcare Improvement| Colorado Division of Insurance
Data to Support Change Agents| Regional Payment Variation
LOW
ER
CO
ST
Colorado State Agency Change AgentCOLORADO DIVISION OF INSURANCE
ProfileThe Division of Insurance (DOI) regulates and monitors the fully insured, commercial health insurance industry in Colorado. In addition to ensuring that insurance companies and agents abide by all laws, they help consumers understand their insurance. v
Project SummaryThe DOI used CO APCD data in three ways:1. To determine and analyze medical service and pharmacy trends in order to ensure that rate-setting bench-
marks for 2017 were accurate.2. To evaluate the nine current geographic regions that determine residents’ insurance rates against different
configurations, including one region for the entire state.3. To analyze what is driving health care costs at a county level.
Benefit to ColoradoTotal cost of care per member per year (PMPY) is calculated by adding the total amount of payments made by payers to health care providers to the total amount paid by the member (deductibles, copays, and coinsurance). The DOI analysis indicates that the during both 2014 and 2015 there was significant variation in the cost to treat patients in Boulder and how much it costs to treat patients annually in the Western portion of the state.vi
These types of analyses help the DOI safeguard Coloradans’ health insurance by providing necessary information for the rate-review process. Without these benchmarks, it would be difficult to determine whether proposed rates by health insurance payers were equitable for each particular region.
Commercial Insurance Total Health Cost Comparisons (CO APCD)
11

Featured Change Agents| National Bureau of Economic Research | Network for Regional Healthcare Improvement| Colorado Division of Insurance
Data to Support Change Agents| Regional Payment Variation
LOW
ER
CO
ST
Public CO APCD Data to Support Change AgentsREGIONAL PAYMENT VARIATION
Recent studies have shown that residents in certain areas of Colorado pay more for certain procedures, and based on this information, it is tempting to conclude that all health care costs in those regions are higher than those in the rest of the state. vii
However, a CIVHC analysis of CO APCD data demonstrates that it is impossible to draw general conclusions about health care prices based on geography or volume of services performed. Median payments made by commercial health insurance companies and their members suggest that while one health care service may be particularly high-cost for one region in the state, other services in that region may be right in line with or actually lower than the state average.
The table below shows that while Coloradans living in the Northeast region of the state paid over $15,000 more than the statewide median for dorsal/lumbar spinal surgery, and over $36,200 and $25,000 more than the statewide average for hip and knee replacement respectively, they were not the highest-cost region for colonoscopies or head CTs. Additionally, the table also reflects that, despite conventional wisdom, prices were highest in the lowest-volume regions for only six of the ten services analyzed, and only five of the ten lowest cost regions reflected the highest volumes.
These analyses indicate that there is more driving health care prices than simply geography and procedure volume. Payments vary based on an assortment of factors in addition to geography and volume: including cost of living, demographics of the population, extent of provider networks, and degree of health plan and provider competition. This data allows stakeholders to understand where geographic payment discrepancies exist for specific service categories and informs community-level discussions aimed at reducing prices for all Coloradans.
Colorado Counties Represented in Geographic Groupings
Highest and Lowest Median Paid Amount Regions Compared to CO Statewide Median, CO APCD 2014
12

Featured Change Agents| Oregon State University College of Pharmacy| Denver Regional Council of Governments| Chronic Care Collaborative Colorado
Data to Support Change Agents| Free Standing Emergency Departments
IMP
RO
VE
D C
AR
E
The United States spends more money on health care than any other nation in the world, yet outcomes are worse than those of other countries. viii In essence, for all the money spent, Americans are no healthier. Organizations and individuals work tirelessly to change the way care is delivered, so that it focuses on improving patient health and outcomes, is coordinated and timely, and is provided in the most appropriate setting.
IMPROVED CARE
National Change AgentOREGON STATE UNIVERSITY COLLEGE OF PHARMACY
ProfileThe College of Pharmacy is affiliated with both Oregon State University (OSU) and Oregon Health and Sciences University (OHSU).
Project SummaryWith opioid overdose deaths rising every year, OSU researchers are investigating ways to end the epidemic. Oregon Medicaid has a daily dose limit on prescribing opioid painkillers to members. Colorado does not. Researchers compared opioid prescription and adverse outcome information between the two states to see if there was a correlation between the prescription restriction and opioid abuse. Results of the study indicated that while the prescription restriction did not reduce opioid overdoses, it did reduce the number of opioid prescriptions.
Benefit to ColoradoThis study provides Health First Colorado (Colorado’s Medicaid Program) with evidence of whether a dose restriction policy has any effect on the opioid crisis. Information such as this can inform policy designed to make Coloradans healthier.
In Colorado, the number of
opioid-related deaths tripled between 2000
and 2015.
13

Featured Change Agents| Oregon State University College of Pharmacy| Denver Regional Council of Governments| Chronic Care Collaborative Colorado
Data to Support Change Agents| Free Standing Emergency Departments
IMP
RO
VE
D C
AR
E
Colorado State Agency Change AgentDENVER REGIONAL COUNCIL OF GOVERNMENTS
ProfileThe Denver Regional Council of Governments (DRCOG) brings together officials from Adams, Arapahoe, Broomfield, Boulder, Clear Creek, Denver, Douglas, Gilpin, and Jefferson counties, working together to improve the quality of life for all the region’s residents. DRCOG is the federally designated Area Agency on Aging (AAA) and provides services designed to help senior Coloradans live full and healthy lives. ix DRCOG sets policy, creates guidelines, and allocates funding for three focus areas:
Project SummaryBy analyzing CO APCD data from a group of individuals who do not receive AAA services compared to those who do, DRCOG is working to determine the influence their work has on the health care utilization and the quality of life of Older Coloradans.
Benefit to ColoradoData detailing the value of these important services allows DRCOG to be more effective financial stewards of the public dollars they receive each year by making adjustments to existing services. This data supports their ability to demonstrate the financial and health benefits of expanding offerings like Meals on Wheels, respite care, and medical transportation to more Coloradans.
In 2030, over 1.2 million Coloradans will be 65+.
Transportation and Personal Mobility
Growth and Development
Aging and Disability Resources x
14

Featured Change Agents| Oregon State University College of Pharmacy| Denver Regional Council of Governments| Chronic Care Collaborative Colorado
Data to Support Change Agents| Free Standing Emergency Departments
IMP
RO
VE
D C
AR
E
Non-Profit Change AgentCHRONIC CARE COLLABORATIVE COLORADO
ProfileThe Chronic Care Collaborative (CCC) is a coalition made up of 34 advocacy organizations representing Coloradans with a range of chronic conditions. The CCC works to improve access to quality, affordable, and integrated health care. xi
Project SummaryMember organizations of the CCC are receiving customized drug dashboards, populated with CO APCD data specific to the drugs that are most relied on and utilized to treat a particular condition. These interactive dashboards display how much Colorado is spending for certain prescription drugs and whether prices are going up or down for health plans and patients.
Benefit to ColoradoThe graphics below show the member liability (patient responsibility) trends for one drug being evaluated by a CCC organization between 2012 and 2015. Member liability (total payments made by patients), deductibles, and copays are all trending upwards from 2012 to 2013. Member liability drops in 2015 but still hovers over $4 more per day than in 2012. Coinsurance per day, however, trends downward during all four years analyzed.
This type of trend information helps CCC assess whether costs for their constituents are going up significantly, thereby negatively impacting the patients’ ability to receive the drugs they need. The CCC organizations plan to use this information to advocate for policies and legislative changes that can lower or reduce the cost burden for patients with chronic diseases, ultimately leading to better health.
Member Liability Total Spend Member Liability Trends
15

Featured Change Agents| Oregon State University College of Pharmacy| Denver Regional Council of Governments| Chronic Care Collaborative Colorado
Data to Support Change Agents| Free Standing Emergency Departments
IMP
RO
VE
D C
AR
E
Public CO APCD Data to Support Change AgentsFREE STANDING EMERGENCY DEPARTMENTS
Different health care settings (physician offices, emergency departments, hospitals, etc.) are designed to treat specific health conditions, and costs between settings reflect the level of care available. Many Coloradans are using emergency departments for non-emergent needs, which costs them and their health plans millions of dollars extra each year.
Free Standing Emergency Departments (FSED) are designed to provide similar levels of emergency care as their hospital-based ED counterparts. xii Consistent with national trends, Colorado’s FSEDs are primarily located in affluent suburban areas relatively close to Urgent Care centers and traditional emergency departments. xiii
Top 10 Reasons (not ordered by frequency) Colorado Patients Seek Immediate Care Across Settings (2014, Commercial Payers, CO APCD)
CIVHC’s analysis of commercial claims in the CO APCD indicates that of the top 10 reasons Coloradans sought immediate care in identifiable FSEDs in 2014, seven visits were for non-life threatening events. This is in contrast to three out of 10 hospital-based ED visits being non-emergent, suggesting that patients are using FSEDs in ways more similar to urgent care centers than to hospital-based EDs.
16

Featured Change Agents| Oregon State University College of Pharmacy| Denver Regional Council of Governments| Chronic Care Collaborative Colorado
Data to Support Change Agents| Free Standing Emergency Departments
IMP
RO
VE
D C
AR
E
Using median payments made by health insurance payers and the median of any deductible, co-pay, or co-insurance paid by patients, CIVHC evaluated costs at Emergency Facilities (FSEDs and hospital-based EDs) compared with those at Urgent Care centers. Results suggest that patients could pay substantially more for treatment at Emergency Facilities.
Receiving care for bronchitis, for example, can cost nearly ten times more at an Emergency Facility. For all non-emergent conditions evaluated, the price tag at an Emergency Facility is at least $400 more than at Urgent Care centers.
Proponents of FSEDs explain that these facilities provide communities essential access to emergency care. Opponents argue that due to their stand-alone buildings and similarity to non-emergency facilities, it is possible for consumers to mistake an FSED for an Urgent Care center and wind up with an unexpectedly large bill. These analyses are vital for stakeholders working to educate Coloradans regarding when and where to seek care, as well as the potential cost implications of their decisions. In fact, a multi-stakeholder group used this analysis and requested a deeper dive analysis under the leadership of Senator John Kefalas in late 2016 to help inform potential legislation being considered in the 2017 Colorado legislative session.
Comparison of Median Treatment Costs: Emergency Facility and Urgent Care Center, 2014
17

Featured Change Agents| Brigham and Women’s Hospital| Colorado State Innovation Model| Susan G. Komen ® Colorado
Data to Support Change Agents| Hepatitis C in Colorado
BE
TT
ER
HE
ALT
H
In 2011, 33 percent of all Coloradans had at least two chronic diseases,and 26 percent of all deaths were due to cardiovascular disease. xiv The health of Coloradans is as varied as the diverse terrain across the state. In order to improve health, researchers and public health agencies are identifying where disparities in chronic diseases and other health conditions exist and are working to design programs geared toward the unique needs of each community.
BETTER HEALTH
National Change AgentBRIGHAM AND WOMEN’S HOSPITAL
ProfileLocated in Boston, Brigham and Women’s Hospital (BWH) is a major teaching facility affiliated with Harvard University. BWH is an internationally renowned organization, serving patients around the world. xv
Project SummaryResearchers at BWH are estimating the occurrence, treatment, and cost of skin cancer in the United States. CO APCD data is being combined with data from other APCDs and the Centers for Medicare & Medicaid Services. Analysis of the data will indicate the economic impact of skin cancer, determine any care and outcome disparities between regions, and identify possible trends in prevalence and treatment.
Benefit to ColoradoColorado’s incidence of skin cancer is higher than the nationwide average. xvi BWH’s analysis will be an excellent tool to help inform targeted action to reduce the prevalence of the disease and aid in cost reduction strategies.
Estimates suggest that over 76,000 new
cases of skin cancer were diagnosed in the United States in 2016.
18

Featured Change Agents| Brigham and Women’s Hospital| Colorado State Innovation Model| Susan G. Komen ® Colorado
Data to Support Change Agents| Hepatitis C in Colorado
BE
TT
ER
HE
ALT
H
Colorado State Agency Change AgentCOLORADO STATE INNOVATION MODEL
ProfileThe Center for Medicare & Medicaid Innovation funded Colorado’s State Innovation Model (SIM) program to enhance community health while improving the quality and costs of health care services across the state. Due in great part to our state’s national reputation for broad collaboration, Colorado is one of several states receiving large-scale federal funding over four years to design and implement innovations in local health delivery.
Each Colorado community is unique in its approach to health and health care services. Across the state, the Colorado SIM program seeks to simultaneously engage and assist consumers, providers, and other stakeholders to improve their local health and health care systems. With many local activities happening at the same time, SIM identifies best practices. Spreading best practices across SIM-participating providers, and then to the whole state, can help Coloradans be healthier and have access to better health care services, sooner rather than later.
The Colorado SIM program has four specific goals:◊ Provide better access to integrated primary care and behavioral health services in coordinated community
systems◊ Apply value-based provider payments that reward better care and service◊ Expand information technology efforts so that vital health information is ready at the right time and place ◊ Finalize a statewide plan to improve population health, both locally and statewide
Project SummaryAs administrator of the Colorado All-Payer Claims Database, CIVHC provides large data sets with up to 500 million records that enable SIM state and national evaluators to objectively measure the trends in incremental value created by SIM innovations.
In addition to big data, CIVHC provides complex analytics and data arrays as directed by the SIM Office and informed by the SIM Evaluation Workgroup. As an example, CIVHC’s expert analysts developed and programmed the SIM primary care Patient Attribution Model that helps to identify over 3 million consumers with their primary care providers.
In addition, CIVHC developed fifteen (15) claims-based clinical quality measures. These measures provide ongoing benchmarking and progress reporting, addressing health issues ranging from chronic conditions like diabetes and asthma to behavioral health concerns such as depression. This project demonstrates how claims data can augment other measures to provide actionable views for many populations in Colorado.
19
Featured Change Agents| Brigham and Women’s Hospital| Colorado State Innovation Model| Susan G. Komen ® Colorado
Data to Support Change Agents| Hepatitis C in Colorado
BE
TT
ER
HE
ALT
H
Benefit to ColoradoCIVHC provides uniform data and analytics from the comprehensive Colorado All-Payer Claims Database (CO APCD), allowing for better align-ment of program evaluation processes and trend reporting.
With CIVHC’s single SIM patient attribution method applied across the state, local improvement teams can compare their populations to help determine when SIM activities are effective in improving health and lowering costs.
SIM clinical proxy measures provide performance trends in patient population health, and can bring attention to opportunities to improve evidence-based care. Proxy measures portray the clinical performances of SIM program participants compared with the larger Colorado population. In the diabetes-testing measure shown, the early pre-intervention baseline comparison shows almost matching performance by both groups (73.4% vs. 72.3%). Over the four-year SIM program, trends should show a growing performance difference between the SIM participants and the greater Colorado population.
Improving the rate of these basic preventive services allow patients and providers to catch and treat complications early, and can have enormous impacts on individual lives and community health.
DIABETES HA1c Testing
SIM Cohort
State-wide
73.4% 72.3%
Anxiety: Screening and Follow-up PlanAsthma: Use of Appropriate MedicationsBreast Cancer ScreeningChildhood: Developmental Screening in the First Three Years of LifeColorectal Cancer ScreeningDepression: Screening and Follow-up PlanDiabetes: Poor Control and Folllow-up PlanScreening for Future Fall Risk
High Blood Pressure: Follow-up and Medication ComplianceImmunization: Annual Influenza ImmunizationLow Back Pain: Use of Imaging StudiesMaternal Depression ScreeningObesity: Adult ScreeningSubstance Use: Screening and InterventionWeight Assessment and Counseling for Nutrition/ Physical Activity for Children and Adolescents
List of Claims-based Quality Measures
20

Featured Change Agents| Brigham and Women’s Hospital| Colorado State Innovation Model| Susan G. Komen ® Colorado
Data to Support Change Agents| Hepatitis C in Colorado
BE
TT
ER
HE
ALT
H
Non-Profit Change AgentSUSAN G. KOMEN® COLORADO
ProfileSusan G. Komen Colorado (Komen Colorado) is an affiliate of the Dallas-based Susan G. Komen Foundation, a non-profit working to find a cure for breast cancer. They serve 22 counties and 73 percent of the state’s population, advocating for those with breast cancer and funding non-profits devoted to screening and research. xvii
Project SummaryWith this project, Komen Colorado is analyzing breast cancer screening and treatments costs, as many individuals have identified high prices as a major barrier to care. Additionally, they are investigating geographic variation in breast cancer related expenses.
Benefit to ColoradoThe findings of Komen’s analysis will allow the organization to focus their advocacy efforts around cost and efficacy for breast cancer care and to help Coloradans understand costs of breast cancer screening and treatment across the state, giving them the opportunity to seek out care at the best value.
one woman will be diagnosed with breast cancer in Colorado in 2017
Every 2.3 hours...
21

Featured Change Agents| Brigham and Women’s Hospital| Colorado State Innovation Model| Susan G. Komen ® Colorado
Data to Support Change Agents| Hepatitis C in Colorado
BE
TT
ER
HE
ALT
H
Public CO APCD Data to Support Change AgentsHEPATITIS C IN COLORADO
Hepatitis C is a virus transferred through the blood that can lead to severe liver complications and death. Figure X indicates that the majority of Coloradans with Hepatitis C are between the ages of 51 and 71. The largest portion of the population with the condition lives in urban parts of Colorado, and slightly more men (54 percent) have been diagnosed than women (46 percent). Since the virus often has few noticeable symptoms, the Centers for Disease Control and Prevention (CDC) recommends that everyone in the United States born between 1945 and 1965 be tested. xviii It is estimated that the majority of people with the virus do not know they are infected.
Until recently, the most common treatment for Hepatitis C had significant side effects and was difficult for many patients to tol-erate. At the end of 2013, oral medications with fewer serious side effects became available that not only treat but eliminate symptoms. Sovaldi was the first medication to hit the market, and later in 2014, Harvoni became available as the first drug that could eliminate symptoms without the need for a second drug. Both Solvadi and Harvoni have made headlines for being among the most expensive drugs sold in America.
Treatment trends explored in Figure X show that in 2013, four percent of Coloradans received medication for Hepatitis C prior to the release of the new treatments. When the new drugs entered the marketplace, the number of Coloradans receiving drug treatment increased substantially, with seven percent on the new treatment and four percent remaining on the old regimen.
While the CO APCD does not capture instances when patients receive treatment that is not paid for by a health insurer, this information supports those working in Colorado to reduce the prevalence of Hepatitis C. CIVHC is currently partnering with stakeholders in the field to generate an additional analysis of Hepatitis C in Colorado in order to bring to light the many perspectives surrounding the disease and to investigate barriers to care. Publica-tion is anticipated in spring of 2017.
Pre & Post New Treatment Trends2013 - 2014
Gender
Location
22

i Catalyst for Payment Reform; Health Care Incentives Improvement Institute. (2016). 2016 Report Card on State Transparency Laws. Retrieved January 2017, from http://catalyzepaymentreform.org/images/documents/2016%20Price%20Transparency%20Report%20Card.pdf
ii The National Bureau of Economic Research. About the NBER. Retrieved January 2017, from NBER.org: http://www.nber.org/info.html
iii Network for Regional Healthcare Improvement. About NRHI. Retrieved January 2017, from NRHI.org: http://www.nrhi.org/about-nrhi/
iv Network for Regional Healthcare Improvement. Getting to Affordability: Total Cost of Care. Retrieved February 2017, from www.nrhi.org: http://www.nrhi.org/work/multi-region-innovation-pilots/tcoc/
v Colorado Department of Regulatory Agencies. Division of Insurance. Retrieved January 2017, from Colorado.gov: https://www.colorado.gov/pacific/dora/division-insurance
vi Brown, FSA, MAAA, M. A., Huckaba, ASA, CERA, MAAA, A., & Louden, S. (2016). Colorado Total Health Cost and Geographic Areas 2016 Study. Denver: Lewis & Ellis, Inc. Actuaries & Consultants. Retrieved 2017 January, from https://www.colorado.gov/pacific/sites/default/files/9%20-%20DOI%20-%20Single%20Geographic%20Area%20Study.pdf
vii Quealy, K., & Sanger-Katz, M. (2015, December 15). The Experts Were Wrong About the Best Places for Better and Cheaper Health Care. The New York Times. Retrieved November 2016, from http://www.nytimes.com/interactive/2015/12/15/upshot/the-best-places-for-better-cheaper-health-care-arent-what-experts-thought.html?_r=0
viii Davis, K., Stremikis, K., Squires, D., & Schoen, C. (2014). Mirror, Mirror on the Wall, 2014 Update: How the U.S. Health Care System Compares Internationally. The Commonwealth Fund. Retrieved February 2016, from http://www.commonwealthfund.org/publications/fund-reports/2014/jun/mirror-mirror
ix Denver Regional Council of Governments. Area Agency on Aging. Retrieved January 2017, from DRCOG.org: https://drcog.org/programs/area-agency-aging
x Denver Council of Regional Governments. About DRCOG. Retrieved January 2017, from DRCOG.org: https://drcog.org/about-drcog/about-drcog
xi Chronic Care Collaborative. Overview. Retrieved January 2017, from ChronicCareCollaborative.org: http://www.chroniccarecollab-orative.org/about/index.php
xii UC Health, as quoted to The Denver Channel. (2016). Trip to Freestanding Emergency Room for the Flu Ends with a $5,000 Bill. Denver 7 ABC News. Retrieved May 2016, from http://www.thedenverchannel.com/news/local-news/trip-to-freestanding-er-for-the-flu-ends-with-a-5000-bill?autoplay=true
xiii Carrier, E. R., Dowling, M., & Berenson, R. A. (2012). Hospitals’ Geographic Expansion In Quest Of Well-Insured Patients: Will The Outcome Be Better Care, More Cost, Or Both? Health Affairs, 31(4 ), 827-835. doi:doi: 10.1377/hlthaff.2011.1085
xiv Colorado Department of Public Health and Environment. (2014). Colorado Chronic Disease State Plan: A Coordinated Approach to Chronic Disease. Retrieved April 2016, from https://www.colorado.gov/pacific/sites/default/files/DC_Colorado-Chronic-Dis-ease-Plan-2013-17.pdf
xv Brigham and Women’s Hospital. The History of Brigham and Women’s Hospital. Retrieved January 2017, from BrighamandWomens.org: http://www.brighamandwomens.org/about_bwh/about_us.aspx
xvi U.S. Cancer Statistics Working Group. (2016). United States Cancer Statistics: 1999–2013 Incidence and Mortality Web-based Report. U.S. Department of Health and Human Services, Centers for Disease Control and Prevention and National Cancer Institute. Retrieved January 2017, from https://nccd.cdc.gov/uscs/statevsnational.aspx
xvii Susan G. Komen Colorado. Komen Colorado. Retrieved January 2017, from komencolorado.org: http://www.komencolorado.org/komen-colorado/
xviii Centers for Disease Control and Prevention. Viral Hepatitis - Hepatitis C Information - Testing Recommendations for Hepatitis C Virus Infection. Retrieved January 2017, from cdc.gov: https://www.cdc.gov/hepatitis/hcv/guidelinesc.html
SOURCES
23

National Bureau of Economic Research (NBER) pg. 9 – Kaiser Family Foundation. Peterson-Kaiser Health System Tracker. Retrieved January 2017, from healthsystemtracker.org: http://www.healthsystemtracker.org/interactive/health-spend-ing-explorer/?display=U.S.%2520%2524%2520Billions&service=All%2520Types%2520of%2520Services&source=Out%2520of%-2520Pocket%252CHealth%2520Insurance%253A%253APriAvate%2520Health%2520Insurance%252CHea
Oregon State University College of Pharmacy pg. 13 – Rosenthal, MPH, A., Bol, MSPH, K., & Gabella, MSPH, B. (2016, Novem-ber). Examining Opioid and Heroin-Related Drug Overdose in Colorado. Health Watch(100). Retrieved January 2017, from http://www.chd.dphe.state.co.us/Resources/pubs/Colorado-Opioid-and-Heroin-Overdose.pdf
Denver Regional Council of Governments (DRCOG) pg. 14 – DeGroen, C. (2013, July). Aging and Poverty in Colorado. State Demography Office. Retrieved January 2017, from https://www.colorado.gov/pacific/sites/default/files/13EconPov0729-%20Presenta-tionAging%20and%20Poverty%20in%20Colorado%202013.pdf
Brigham and Women’s Hospital pg. 18 – National Cancer Institute Surveillance, Epidemiology, and End Results Program. Cancer Statistics. Retrieved January 2017, from cancer.gov: https://seer.cancer.gov/statfacts/html/melan.html
Susan G. Komen® Colorado pg. 21 – American Cancer Society. (2017). Cancer Facts & Figures 2017. Retrieved February 2017, from https://www.cancer.org/content/dam/cancer-org/research/cancer-facts-and-statistics/annual-cancer-facts-and-figures/2017/cancer-facts-and-figures-2017.pdf
CHANGE AGENT GRAPHIC SOURCES
24

AP
PE
ND
ICE
S Recommendations to the General AssemblySpot Analysis Publications
| Payment Variation by Payer| Free Standing Emergency Department
Hepatitis C InfographicData Bytes
| Trends in Teen Pregnancy Rates| EpiPen Prescription Cost Trends
Hepatitis C InfographicCO APCD Capabilities
The CO APCD grows in scope and value each year, and as the Administrator, CIVHC continually looks for ways to evolve the database and realize the full potential of this powerful asset. To that end, CIVHC suggests the following regulatory changes:
Proposed CO ACPD Rule Changes• 1.2000.3.D. Payers to submit 30 days after the end of the reporting month (currently 45 days)• 1.200.5.A. A state agency or private entity engaged in efforts to improve health care quality, value or public
health outcomes for Colorado residents may request a specialized report or data set from the APCD by submitting to the administrator a written request detailing the purpose of the project, the methodology, the qualifications of the research entity, and by executing a data use agreement, to comply with the requirements of HIPAA.
• 1.200.5.B. A data release review committee shall review those requests for reports or data sets contain-ing protected health information and shall advise the administrator on whether release of the data is consistent with the statutory purpose of the APCD, will contribute to efforts to improve health care quality, value or public health outcomes for Colorado residents and complies with the requirements of HIPAA. The administrator shall include a representative of a physician organization, hospital organization, non-physician provider organization and a payer organization on the data release review committee.
Proposed Changes to the CO APCD Data Submission Guide
Member attributed PCP NPI• Assignment of PCP/NPI to members (when available) allows for reporting accurate attribution for state and
federal programs such as HCPF ACC, SIM, TCPI, CPCi, CPCi+. Total monthly premium amount • Without the premium information, CIVHC can’t do any analysis to determine what may be driving rises in
premium costs. By marrying cost of care with premiums, CIVHC will be able to do more comprehensive analysis of rising premiums, utilization and cost of care.
Premium flag• Without the premium information, CIVHC can’t do any analysis to determine what may be driving rises in
premium costs. By marrying cost of care with premiums, CIVHC will be able to do more comprehensive analysis of rising premiums, utilization and cost of care.
NDC code on inpatient claims• CIVHC currently cannot identify medications prescribed in the hospital and costs associated with those
medications. CIVHC has had requests to understand what is being prescribed in hospitals (opioids, for exam-ple) and can’t fulfill it. Also, being able to analyze any inpatient pharmacy costs in general would be extremely beneficial.
Self-funded claim indicator, claim level• Benchmarking for self-insured vs. other markets isn’t possible right now, and research and analysis of cost/
utilization of dental services. CIVHC only has it at the eligibility file level right now which makes it difficult to match it back to the claims and conduct research and analysis.
Dental claim indicator, claim level
RECOMMENDATIONS TO THE GENERAL ASSEMBLY

Cost Driver Spot Analysis: Payment Variation by PayerFebruary 2016
Some Coloradans Pay Significantly More than Medicare for the Same ServiceCommercial insurance payments for hip and knee replacement are as much as 232% higher, or $55,000 more than Medicare.
Recent national studies have revealed little to no correlation between Medicare and commercial payer health care spending in the same region.i In particular, areas like Grand Junction, Colorado, historically praised for their low cost to treat Medicare populations, have come under recent scrutiny for higher than average commercial health care costs relative to other areas in the state and nation.
Discrepancies in health care spending across payers have led to inquiries regarding the drivers of cost variation between the public and private sector.
Joint replacements are not a Medicare issue alone as over 1.2 million people across the U.S. in 2014 had a knee replacement or a total or partial hip replacement resulting in $18 billion in costs to the health care system. ii iii The cost of a knee replacement for commercially insured Coloradans varies from $19,000 - $48,000, while hip replacement costs can be as low as $18,000 or as high as $40,000 across Colorado hospitals.iv
The Colorado All Payer Claims Database (CO APCD) provides a unique opportunity to analyze payments for specific services by payer type and identify areas of cost savings potential.
Price variation for hip and knee joint replacement in particular has become a recent focus for Medicare, which is aiming to reduce spending and improve quality by paying hospitals one “bundled” price for the entire episode of care (e.g., the surgical procedure and all post-acute care up to 90 days).
Median Event Price: Commercially Insured Hip Replacement
Median Event Price: Commercially Insured Knee Replacement
950 S. CHERRY ST., SUITE 208 | DENVER, COLORADO 80246 | PHONE 720.583.2095 | FAX 720.549.9189 | WWW.CIVHC.ORG
For the two graphs above, prices represent median paid event amounts for services based on 2014 commercial claims data from the CO All Payer Claims Database, www.comedprice.org. Estimates include insurance payments and patient responsibility (copay, deductible,etc.).
Colorado Hip/Knee Replacement Average Total Episode PaymentsMedicare vs. Commercial

These figures raise questions such as:
• Why are joint replacement costs for commercially insured Coloradans in the Northeast $55,000, or 232% more than for Medicare recipients in the same region, and so much more than their geographically comparable neighbors in the southeast?• How are providers in Denver and Colorado Springs able to keep costs for their commercially insured population much lower at approximately 78% more than Medicare?
Such dramatic fluctuations suggest that higher-cost regions have opportunities to explore what drives increased spending locally, and to investigate what practices lower-cost regions use to keep costs down.
Alternative payment models such as Medicare’s Comprehensive Care for Joint Replacement program are designed “to encourage hospitals, physicians, and post-acute care providers to work together to improve the quality and coordination of care from the initial hospitalization through recovery.”v Additionally, some self-insured employers have partnered with hospitals to develop bundled payment programs for knee and hip replacements in an effort to reduce price variation and provide excellent care.
In 2014, over 24,300 Coloradans received a new hip or knee; not surprising given Colorado is the most physically active state in the nation. vii viii The number of joint replacements is likely to continue to rise as the population over the age of 65 is anticipated to increase by 150% by 2030. ix Reducing Medicare and commercial price variation could result in significant savings now and in the future and could provide a prime opportunity for Colorado to improve care and lower costs.
PERCENT VARIATION IN COMMERCIAL VS. MEDICARE PAYMENTS
Knee & Hip Replacement Episodes
Deeper CO APCD-based analysis of episode costs show variation across Colorado regions of over $39,000 in the commercial market. Some variation in costs across regions is expected; however, while there is relatively little variation in Medicare prices across Colorado ($22,000-$26,000), costs for commercially insured patients in the northeast are double those of their neighbors in Denver, $78,000 and $39,000 respectively.
Variation among provider types is also notable across regions. Costs related to the hospital portion of hip and knee replacements differs by $25,000 in the commercial market between Denver and the northeast, and post-acute care varies by $17,000 from the southeast to the northeast.
Sources: i The New York Times, 2015, “The Experts Were Wrong About the Best Places for Bet-
ter and Cheaper Health Care” http://www.nytimes.com/interactive/2015/12/15/upshot/the-best-places-for-better-cheaper-health-care-arent-what-experts-thought.html?_r=0iiAgency for Healthcare Research and Quality, Healthcare Cost and Utilization Project,
2015, HCUP Faststats; The Most Common Operations During Inpatient Stays https://www.hcup-us.ahrq.gov/faststats/NationalProceduresServlet iii
Centers for Disease Control, Health, United States, 2014, Table 105, accessed via http://www.cdc.gov/nchs/fastats/inpatient-surgery.htm iv
Colorado All Payer Claims Database, www.comedprice.org v
Centers for Medicare & Medicaid, 2015, Comprehensive Care for Joint Replacement Model https://innovation.cms.gov/initiatives/cjr vi
CIVHC, 2015, Spotlight on Innovation: Colorado’s Knees and Hips, http://civhc.org/News-Events/News/Spotlight-on-Innovation--Colorados-Knee-and-Hips-P.aspx/ vii
Colorado Department of Public Health and the Environment, 2015,Colorado Facility Specific Health Care-Acquired Infection Data – Surgical Site Infection Overview, https://www.colorado.gov/pacific/sites/default/files/DC_ComDis-HAI-2015-Hip-replace-ment-Procedures.pdf viii
The State of Obesity, States with the Highest Rates of Physical Inactivity 2014, http://stateofobesity.org/lists/least-physically-active-states/ ix
Colorado Commission on Aging, 2015, Colorado Aging Framework: A Guide for Policymakers, Providers, and Others for Aging Well in Colorado https://drive.google.com/file/d/0B3CfrbDUN0fyRDJHYXNmTHdZR1pTOGY4VGhOSGpUdGxLWDBj/view?pref=2&pli=1
Western Slope129%
Colorado Springs 78%
Denver77%
Northeast Colorado
232%
Southeast Colorado
110%
Mountain165%
Colorado Hip/Knee Replacement Average Episode PaymentsFacility vs. Other Costs

Powered, in part, by generous grants from: The Colorado Health Foundation | The Colorado Trust
TREATMENT
A Snapshot of Hepatitis C in Colorado
54% MALE
46% FEMALE
Hepatitis C is a liver infection caused by the Hepatitis C virus (HCV) and is transmitted through the blood. For some people, HCV is a short-term illness, but for 70% - 85% of people who become infected, it becomes a serious, long-term, chronic infection. The majority of infected persons might not be aware of their infection because they are not clinically ill.i HCV is now the leading infectious disease killer in the US, claiming approximately 20,000 American lives in 2014. iii
Below is a snapshot of HCV prevalence in Colorado for 2013-2014 using claims data from the Colorado All Payer Claims Database (CO APCD). Data reflects Coloradans with claims filed through commercial payers (excluding self-insured lines of business), Medicaid, and Medicare Advantage. The largest age demographic diagnosed is the baby-boomer generation (51-71 years old) with the majority of individuals living in urban parts of the state. In spite of new, easy to administer treatment options that essentially eliminate symptoms, many Coloradans are still not receiving any treatment for HCV.
Age Breakout
Born before 1945Born between 1945 and 1965Born after 1965
Age Breakout
Born before 1945Born between 1945 and 1965Born after 1965
GENDER
LOCATION*
AGE
Although the release of Sovaldi and other curative HCV drugs in recent years have eliminated the complexity and length of treatment, the vast majority of those diagnosed in Colorado remain untreated. In 2014, only 0.005% of individuals diagnosed with HCV moved from conventional treatment methods to new. Understanding what is available and making treatment affordable and accessible is the first step toward reducing HCV in Colorado.
CONVENTIONAL - Many older, conventional treatment options available are hard to tolerate, long, and complex. Until recently, the most common treatment was a combination of Pegylated interferon (Peg-IFN), an injectable treatment, and Ribavirin (RBV). In 2011, the release of triple therapy agents with Peg-IFN and RBV somewhat increased effectiveness of treating HCV. However, side effects for Peg-IFN are so significant, that many have to stop using the drug. ii
NEW - At the end of 2013 and in early 2014, oral drugs became available for the first time that essentially eliminate signs and symptoms of HCV and are much easier to tolerate. Sovaldi was the first new drug to hit the market in 2013, and has been shown to treat most HCV cases successfully, including those with HIV-HCV co-infection, when taken with RBV (an earlier treatment). In 2014, Harvoni became available as the first drug that could cure certain HCV cases without the need for co-treatment. ii
The picture of HCV in Colorado is complex. In future publications, CIVHC will dig deeper into the affected patient populations, efficacy of treatments, and the costs associated with chronic infection.
Developed with input from the Skaggs School of Pharmacy and Pharmaceutical Sciences at the University of Colorado Anschutz Medical Campus.
PRE & POST NEW TREATMENT TRENDS, 2013-2014
RURAL URBAN15% 85%
BORN AFTER 1965
BORN BETWEEN 1945-1965
BORN BEFORE 1945
2014
2013
Sourcesi Centers for Disease Control and Prevention (CDC)(2016, April).
ii Hepatitis C - Liver Foundation. (2016, April). Retrieved from: http://hepc.liverfoundation.org/treatment/the-basics-about-hepatitis-c-treatment/advances-in-medications/
iii Centers for Disease Control and Prevention. (2016, May). CDC Newsroom: Hepatitis C Kills More Americans than Any Other Infectious Disease. Retrieved from Centers
for Disease Control: http://www.cdc.gov/media/releases/2016/p0504-hepc-mortality.html*Rural and Frontier classifications from the Colorado Rural Health Center, have been combined for this graph.
72 years and older
51-71 years old
50 years and
younger
NEW TREATMENT OLD TREATMENT NO TREATMENT
NEW TREATMENT OLD TREATMENT NO TREATMENT
89%4%7%
96%4%
70%
20%10%
NEW TREATMENT CONVENTIONAL TREATMENT NO TREATMENT

Utilization Spot Analysis: Free Standing Emergency DepartmentsJuly 2016
How Coloradans are using these new facilities and the potential cost implications
Free Standing Emergency Departments (FSED) are designed to provide similar levels of emergency care as their hospital-based ED counterparts. i Consistent with national trends, Colorado’s FSEDs are primarily located in affluent suburban areas relatively close to urgent care centers and traditional emergency departments. ii
Proponents of FSEDs explain that these facilities provide communities essential access to emergency care. Opponents argue that due to their stand-alone buildings and similarity to non-emergency facilities, it is possible for consumers to mistake an FSED for an urgent care center and wind up with an unexpectedly large bill.
To inform the conversation, understand how Coloradans are using FSEDs, and explore potential cost implications, the Center for Improving Value in Health Care (CIVHC) analyzed 2014 claims data from the Colorado All Payer Claims Database (CO APCD). 1
Results indicate that of the top 10 reasons Coloradans sought immediate care in 2014, seven of the 10 reasons for FSED visits were for non-life threatening events. This is in contrast to three out of 10 hospital-based ED visits being non-emergent, suggesting that patients are using FSEDs in ways more similar to urgent care centers than hospital-based EDs.
When are Coloradans using FSEDs?At least 37 FSEDs are currently operating in Colorado (map above shows only Denver
Metro area); nearly triple the number in 2014. Several more are slated to open in 2016.
Top 10 Reasons (not ordered by frequency) Colorado Patients Seek Immediate Care Across Settings (2014, Commercial Payers, CO APCD)

i UC Health, as quoted to The Denver Channel. (2016). Trip to Freestanding Emergency Room for the Flu Ends with a $5,000 Bill. Denver 7 ABC News. Retrieved May
2016, from http://www.thedenverchannel.com/news/local-news/trip-to-freestanding-er-for-the-flu-ends-with-a-5000-bill?autoplay=true ii Health Affairs; http://content.healthaffairs.org/content/31/4/827.full.pdf+html
iii National Institutes of Health; https://www.nlm.nih.gov/medlineplus/ency/patientinstructions/000593.htm
1 This analysis reflects eight FSEDs identifiable in the 2014 CO APCD data and does not include all FSEDs in Colorado. The majority of Colorado FSEDs are owned by
and billed under a parent hospital or system and cannot be identified in claims submitted to the CO APCD. As a result, data in this analysis for hospital-based EDs may include hospital owned FSED information.
According to the Colorado Hospital Association, hospitals who own FSEDs are likely to charge the same amount for care at their free standing emergency departments as their hospital-based EDs. Using median payments made by health insurance payers and any deductible, co-pay, or co-insurance paid by patients, CIVHC evaluated costs at emergency facilities (FSEDs and hospital-based EDs) compared with those at urgent care centers. Results suggest that patients could pay substantially more for treatment at emergency facilities.
Receiving care for bronchitis, for example, can cost nearly ten times more at an emergency facility. For all non-emergent conditions evaluated, the price tag at an emergency facility is at least $400 more than at urgent care centers.
FSEDs are new players in the on-demand health care market and many consumers have simply not heard of them. It is vital to educate Coloradans regarding when and where to seek care, as well as the potential cost implications of their decisions.
Previous CO APCD analyses explored Avoidable Emergency Department Use in Colorado and the associated costs for non-emergent ED visits compared to waiting for a doctor’s office visit. Additionally, the National Institutes of Health provide detailed guidelines regarding what constitutes an emergency and when an urgent care or doctor’s visit is appropriate.
In the last two Colorado legislative sessions, General Assembly members introduced bills intending to increase consumer transparency regarding FSEDs. For numerous reasons, the bills did not pass. However, as plans are in place to build more FSEDs across the state, educating Coloradans remains critical with or without legislation.
Sources
Cost Implications of Using Emergency Facilities for Non-Urgent Care
Powered, in part, by generous grants from: The Colorado Health Foundation | The Colorado Trust
$1,060 $980
$740
$520
$980
$650 $760
$300
$100 $200
$100 $100 $100 $100
$-
$200
$400
$600
$800
$1,000
$1,200
Sprain/Strain ofAnkle
Bronchitis Open Woundon Finger(s)
UpperRespiratory
Infection
Urinary TractInfection
Sore Throat Ear Infection
Emergency Facility Urgent Care
Median Treatment Costs: Emergency Facility (FSED and hospital-based ED)and Urgent Care Center (2014, Commercial Payers, CO APCD)
Educating Consumers

AP
PE
ND
ICE
S Spot Analysis Publications| Payment Variation by Payer| Free Standing Emergency Department
Hepatitis C InfographicData Bytes
| Trends in Teen Pregnancy Rates| EpiPen Prescription Cost Trends
Hepatitis C InfographicCO APCD CapabilitiesData Requests Fulfilled - 2016

Capabilities of the Colorado All Payer Claims Database
11.2016 | 1
Type of Information
What You Can’t Do With Claims Alone
What You Can’t Do With the CO APCD Currently*
What You CAN Do With the CO APCD Right Now
Claim Type and Specifics
Denied claims Un-adjudicated claims
Substance abuse claims (including Marijuana); dependent on Federal rule change (42 CFR, Part 2) and local payer participation
Worker’s Compensation claims; does not require rule change, but dependent on payer participation
Adjudicated medical, pharmacy, provider-level, and member-level claims
Behavioral health claims (in process, not currently available) Dental claims**
Insurance Type
Services provided to uninsured or self-pay
Services provided through TriCare, the Veterans Administration, Indian Health Service, Federal Employee Health Benefits (FEHB) or other Federally sponsored programs (other than Medicare)
Medicare Fee-for-Service (FFS) Medicare Advantage Health First Colorado (Colorado’s Medicaid Program) Commercial Payer Dual Eligible (Medicare/Medicaid or two or more
commercial health plans e.g. primary and supplemental) *** Non-ERISA based self-insured employer plans Voluntarily submitted ERISA-based self-insured employer
plans Plan Details Plan benefit design information
(high deductible, premium information, etc.)
Plan benefit design information (high deductible, etc., premium information)
Payer line of business (Commercial, Health First Colorado, Medicare FFS, Medicare Advantage)
Payer names for Commercial (Anthem, Humana, etc.) Connect for Health Colorado product and metallic levels:
Gold, Silver and Bronze Commercial product line (PPO, HMO, etc.) Benefits richness, e.g., ratio of plan paid to total allowed
amount Payments Costs for services paid for out
of pocket or without submission of a claim
Premiums paid by an employer or member
Administrative fees Back-end payment amounts (i.e.
Medicaid receives rebates from pharmaceutical companies for use of certain drugs)
Retroactive payments from the provider to CMS or vice versa
Capitation fees and provider incentive payments
Charged amount Total Allowed Amount (amount paid by both the payer and
the patient) Plan paid amount Member liability in total and specific breakouts of:
Coinsurance Deductible Co-pay

Capabilities of the Colorado All Payer Claims Database
11.2016 | 2
Type of Information
What You Can’t Do With Claims Alone
What You Can’t Do With the CO APCD Currently*
What You CAN Do With the CO APCD Right Now
(i.e. CMS payments to Critical Access Hospitals after cost report submission)
Providers Referrals between providers Provider network analysis Provider affiliation (i.e. hospital
owned)
Provider, organization, or facility name Taxonomy (provider specialty) National Provider Identifier (national standard identification
number for providers) Provider office address
Service Site Pharmacy chain name Free-standing Emergency Department
claims billed under parent hospital
Place of service code (ER, Home Health, Hospice, Urgent Care, Hospital, Long-term Care, etc.)
Member details
Identify claims by employer name – requestor must provide group policy number
De-identified member information: Unique member and person ID Gender Age 3-digit zip
Protected Health Information (PHI only available after detailed review by Data Release Review Committee for compliance with HIPAA/HITECH and CO APCD rules):
Names (first, last, middle) Street Address City Zip DOB
Medical History
Personally reported medical history (i.e. had hysterectomy 15 years ago, or family history of breast cancer)
Identify an individual’s diagnoses, labs or tests performed, cost of care, pharmacy, provider, and history of accessing the health care system (facilities/providers/physician offices, etc.) from 2009 forward for most major payers
Diagnosis, Service and Preventive Services
Results of lab tests – information not included in claims
Preventive services, screenings, etc. that are not paid for by an insurance payer (Health Fair
Mental health/substance abuse diagnosis (see above, pending behavioral health organization submission through HCPF/Medicaid, commercial payer willingness and Federal rule change)
Chronic disease prevalence, service utilization and cost to treat information (asthma, diabetes, etc.)
Evaluate effectiveness of programs not covered fully by insurance (i.e. palliative care, nutritional meals, care coordination, etc.)

Capabilities of the Colorado All Payer Claims Database
11.2016 | 3
Type of Information
What You Can’t Do With Claims Alone
What You Can’t Do With the CO APCD Currently*
What You CAN Do With the CO APCD Right Now
screenings, out-of-pocket flu shots, etc.)
Service-specific price information by region and provider group/facility (cost for knee replacement, imaging services, office visits, etc.)
Preventive care and screening rates and associated costs (breast cancer screening, colonoscopy, mammography, annual preventive services, etc.)
Pharmacy Prescriptions issued but not filled
Drugs received through discount program that does not have a claim associated
100% self-pay medications
Pharmacy chain identification (i.e. Walmart, Walgreens, etc.)
Prescriptions reimbursed by insurance – allowed amount and utilization by patient residence, trends
Drug Trade Name, specific strength and dosage form based on NDC code on the pharmacy file (not on the claim)
Dosage information; days supply/number of pills or other units
Drugs administered during inpatient hospital stays**** Medication adherence rates and trends
Diagnostic Testing & Labs
Specific results of labs or other diagnostic tests.
Cost and utilization for people receiving labs or diagnostic test that generate a claim.
Quality of Care
Identify clinical outcomes of treatment or specific services provided
Process quality measures (National Quality Forum, etc.) – i.e. standards of care such as appropriate testing for diabetes patients and other “proxy” measures
Readmissions, observation stays Hospital-acquired infections/conditions Potentially avoidable costs – based on episode analytics
* Possible with a change to the Data Submission Guide and/or legislative rule or partner collaboration ** Currently in Quality Assurance and Validation testing *** Available with new data warehouse vendor in 2017 **** Will be included in the next Data Submission Guide, available fall of 2017

CO APCD Data Requests Fulfilled, Calendar Year 2016
Stakeholder Type
Scholarship Recipient
Project Purpose Product
Type HIPAA Regulation Pursuant
to Approval DUA in Place
Payer Build a credible data to provide benchmarks for use in improving the existing small employer and large employer value-based arrangements with physicians and hospitals.
Limited Data Set
Data released under multi-party business associate agreements consistent with HITECH
Yes
Non Profit Help Coloradans make informed decisions and improve transparency by analyzing the cost of specialty prescription drugs.
Standard Report
N/A aggregated de-identified data only
Yes
Non Profit Yes
The data from this request will be used to determine if, how, and to what extent providing integrated physical and mental healthcare services is reducing healthcare expenditures for clients of this integrated care program.
Limited Data Set
Data released under multi-party business associate agreements consistent with HITECH
Yes
Hospital Yes
This stakeholder leverages CO APCD data to assess variation in care for high risk populations in which our services must interface with other health systems, such as home health, mental health services, durable medical equipment, pharmacy, other ancillary services and community providers.
Fully-Identifiable Data Set
Data released under multi-party business associate agreements consistent with HITECH
Yes
Non Profit Help Coloradans make informed decisions and improve transparency by analyzing the cost of specialty prescription drugs.
Standard Report
N/A aggregated de-identified data only
Yes
Vendor Yes To significantly impact sepsis morbidity and mortality by leading state initiatives to build sepsis awareness and best practice treatment.
Custom Report
Data released under multi-party business associate agreements consistent with HITECH
Yes
State Agency Yes
This stakeholder will use the data to ensure Medicaid is the payer of last resort.
Fully-Identifiable Data Set
Data released under multi-party business associate agreements consistent with HITECH
Yes
State Agency
Yes This stakeholder is using CO APCD data to determine the usual and customary commercial rates for a select set of services.
De-Identified Data Set
N/A aggregated de-identified data only
Yes
State Agency Yes
This project will be used to study and analyze the types of users who are enrolled in the Colorado Indigent Care Program and to make recommendations to the Cost Commission.
Limited Data Set
Data released under multi-party business associate agreements consistent with HITECH
Yes
State Agency
To find common solutions to workforce data needs and form effective collaborations for the collection, management, sharing, and distribution of health professional workforce data among members of the Health Professional Workforce Data Consortium.
Limited Data Set
Data released under multi-party business associate agreements consistent with HITECH
Yes
State Agency
Yes Identifying rates of diabetes medication adherence by county. Limited Data Set
Data released under multi-party business associate agreements consistent with HITECH
Yes
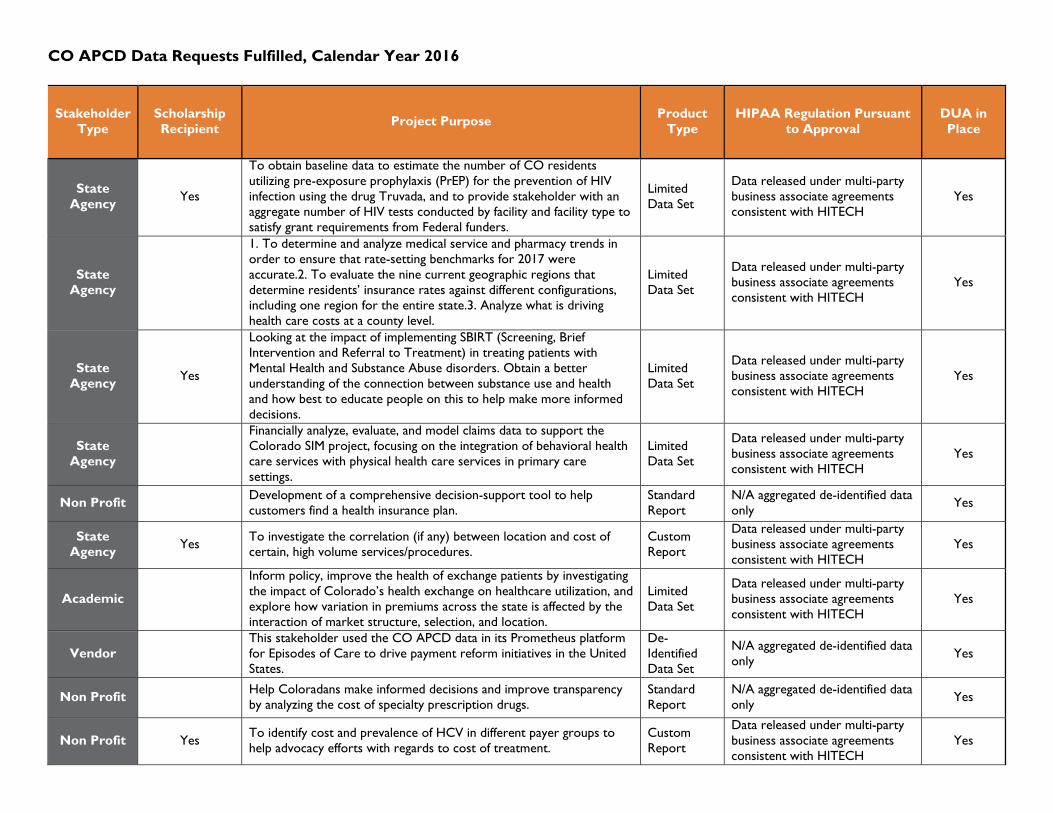
CO APCD Data Requests Fulfilled, Calendar Year 2016
Stakeholder Type
Scholarship Recipient
Project Purpose Product
Type HIPAA Regulation Pursuant
to Approval DUA in Place
State Agency
Yes
To obtain baseline data to estimate the number of CO residents utilizing pre-exposure prophylaxis (PrEP) for the prevention of HIV infection using the drug Truvada, and to provide stakeholder with an aggregate number of HIV tests conducted by facility and facility type to satisfy grant requirements from Federal funders.
Limited Data Set
Data released under multi-party business associate agreements consistent with HITECH
Yes
State Agency
1. To determine and analyze medical service and pharmacy trends in order to ensure that rate-setting benchmarks for 2017 were accurate.2. To evaluate the nine current geographic regions that determine residents’ insurance rates against different configurations, including one region for the entire state.3. Analyze what is driving health care costs at a county level.
Limited Data Set
Data released under multi-party business associate agreements consistent with HITECH
Yes
State Agency
Yes
Looking at the impact of implementing SBIRT (Screening, Brief Intervention and Referral to Treatment) in treating patients with Mental Health and Substance Abuse disorders. Obtain a better understanding of the connection between substance use and health and how best to educate people on this to help make more informed decisions.
Limited Data Set
Data released under multi-party business associate agreements consistent with HITECH
Yes
State Agency
Financially analyze, evaluate, and model claims data to support the Colorado SIM project, focusing on the integration of behavioral health care services with physical health care services in primary care settings.
Limited Data Set
Data released under multi-party business associate agreements consistent with HITECH
Yes
Non Profit Development of a comprehensive decision-support tool to help customers find a health insurance plan.
Standard Report
N/A aggregated de-identified data only
Yes
State Agency
Yes To investigate the correlation (if any) between location and cost of certain, high volume services/procedures.
Custom Report
Data released under multi-party business associate agreements consistent with HITECH
Yes
Academic
Inform policy, improve the health of exchange patients by investigating the impact of Colorado’s health exchange on healthcare utilization, and explore how variation in premiums across the state is affected by the interaction of market structure, selection, and location.
Limited Data Set
Data released under multi-party business associate agreements consistent with HITECH
Yes
Vendor This stakeholder used the CO APCD data in its Prometheus platform for Episodes of Care to drive payment reform initiatives in the United States.
De-Identified Data Set
N/A aggregated de-identified data only
Yes
Non Profit Help Coloradans make informed decisions and improve transparency by analyzing the cost of specialty prescription drugs.
Standard Report
N/A aggregated de-identified data only
Yes
Non Profit Yes To identify cost and prevalence of HCV in different payer groups to help advocacy efforts with regards to cost of treatment.
Custom Report
Data released under multi-party business associate agreements consistent with HITECH
Yes

CO APCD Data Requests Fulfilled, Calendar Year 2016
Stakeholder Type
Scholarship Recipient
Project Purpose Product
Type HIPAA Regulation Pursuant
to Approval DUA in Place
Hospital
The objective of the outmigration report is to inform the stakeholder of patient migration trends that are going away from their own facility, and to produce demographic data and pricing information that can be used to identify cost savings initiatives.
Standard Report
N/A aggregated de-identified data only
Yes
Non Profit Help Coloradans make informed decisions and improve transparency by analyzing the cost of specialty prescription drugs.
Standard Report
N/A aggregated de-identified data only Yes
Non Profit Help Coloradans make informed decisions and improve transparency by analyzing the cost of specialty prescription drugs.
Standard Report
N/A aggregated de-identified data only Yes
Non Profit
This project implemented standard methods to measure variation in the total cost of care and use of health care services at the practice level across different regions of the U.S. to help physicians identify ways to improve quality and lower costs. Using a standard methodology, participating RHICs were able to evaluate which regions have the highest and lowest total costs and the primary factor driving those costs – e.g., utilization or prices.
Data released under multi-party business associate agreements consistent with HITECH
Yes
Non Profit Yes To look at ED visits and potentially avoidable costs in northwest Colorado, Grand, Jackson, Moffat, Rio Blanco, and Routt Counties. Please see the attached excel spreadsheet for zip codes.
Custom Report
Data released under multi-party business associate agreements consistent with HITECH
Yes
Non Profit Help Coloradans make informed decisions and improve transparency by analyzing the cost of specialty prescription drugs.
Standard Report
N/A aggregated de-identified data only
Yes
Non Profit Yes
To identify the relationship between customized nutrition and the overall health and well-being of individuals, a relationship that reduces healthcare costs through fewer hospital readmissions, fewer complications, and reduced overall utilization.
Limited Data Set
Data released under multi-party business associate agreements consistent with HITECH
Yes
Non Profit Yes Use CO APCD data to identify areas to reduce inappropriate ED use through implementation of “upstream” interventions, which will connect health care entities with community services.
Custom Report
Data released under multi-party business associate agreements consistent with HITECH
Yes
Vendor To provide payers and providers with actionable analytics in order to improve care coordination for the Colorado residents involved in the Colorado Comprehensive Primary Care Initiative.
Fully-Identifiable Data Set
Data released under multi-party business associate agreements consistent with HITECH
Yes
Non Profit
In order to provide insight to the variation on utilization and cost for high volume procedures/services, this stakeholder developed an employer-based analysis showing a Boulder employer's median paid amounts compared to the Denver and Boulder markets.
Custom Report
Data released under multi-party business associate agreements consistent with HITECH
Yes
State Agency
Yes Analysis of cost, utilization and claim volume for stand-alone EDs in the State of Colorado.
Custom Report
Data released under multi-party business associate agreements consistent with HITECH
Yes

CO APCD Data Requests Fulfilled, Calendar Year 2016
Stakeholder Type
Scholarship Recipient
Project Purpose Product
Type HIPAA Regulation Pursuant
to Approval DUA in Place
Academic Yes
The overall goal of the research is to improve outcomes for children with TBI in Colorado and elsewhere. The knowledge gap that this project will address is that little is known about the medical needs of children with TBI who suffer a TBI, are hospitalized, and return to their community.
Limited Data Set
Data released under multi-party business associate agreements consistent with HITECH
Yes
Academic Yes This study will examine the role of health insurance in access to genetic tests for breast cancer patients.
Fully-Identifiable Data Set
Data released under multi-party business associate agreements consistent with HITECH
Yes
Academic Yes
1) Validate methods to identify low-value cardiac stress tests (i.e., tests that provide no benefit to patients and can sometimes lead to patient harm), and 2) identify effective ways to reduce low-value stress tests, thereby improving patient outcomes and reducing healthcare expenditures.
Fully-Identifiable Data Set
Data released under multi-party business associate agreements consistent with HITECH
Yes
Academic Yes
Examine the effect of the ACC program’s care coordination on post-discharge care utilization as compared to Medicaid clients that are enrolled in the traditional Medicaid program. The project aims to answer the following research question: What is the effect of the ACC on post-discharge care utilization in relationship to the reduction of 30-day hospital readmissions?
Limited Data Set
Data released under multi-party business associate agreements consistent with HITECH
Yes