co-benefits reaped from energy planning and energy ... slide co-benefits reaped from energy planning...
TRANSCRIPT
2_Title Slide
Co-benefits Reaped from Energy Planning and Energy Efficiency Technology Tad Aburn, Maryland Department of the Environment Elaine Chang, South Coast Air Quality Management District, CA Robyn DeYoung, EPA Sara Hayes, American Council for an Energy-Efficient Economy

Department of the Environment
Tad Aburn, Air Director, MDE Better Buildings Summit, May 8, 2014
Air Quality and Climate Benefits from Energy Planning & Energy Efficiency
“Show Me the Credit”

Presentation Overview
• A little background on air quality in Maryland
• The challenges in building a clean air plan (also called the “SIP”)
• Maryland’s effort to link our energy efficiency initiatives and other energy programs to the air quality planning process – Maryland was part of the EPA
“Roadmap” pilot program • Focused on the Weight-of-
Evidence (WOE) pathway
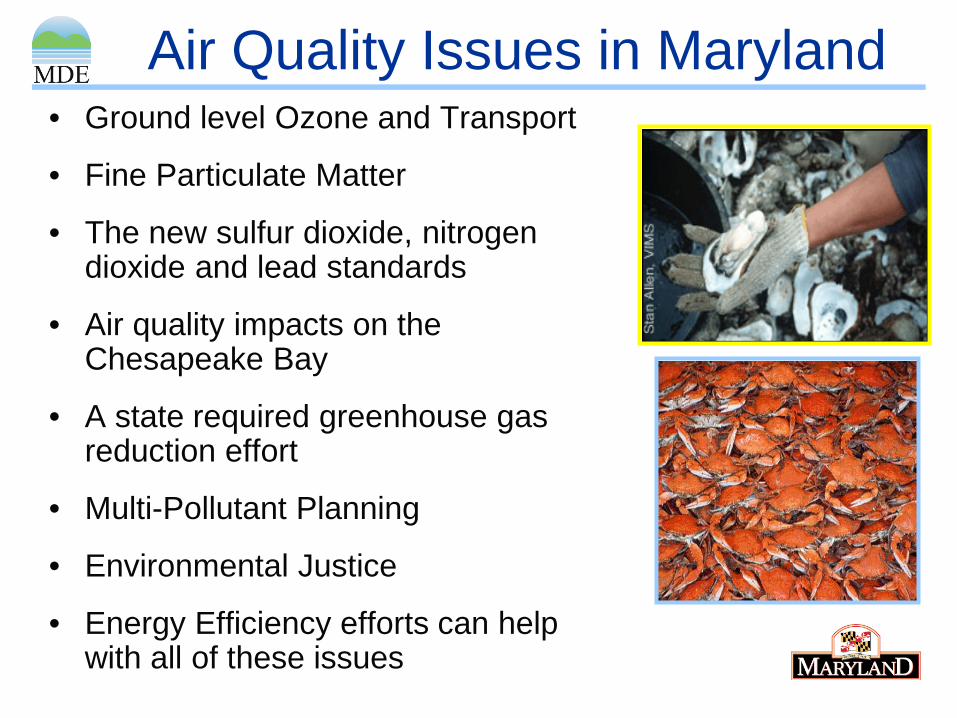
Air Quality Issues in Maryland • Ground level Ozone and Transport
• Fine Particulate Matter
• The new sulfur dioxide, nitrogen dioxide and lead standards
• Air quality impacts on the Chesapeake Bay
• A state required greenhouse gas reduction effort
• Multi-Pollutant Planning
• Environmental Justice
• Energy Efficiency efforts can help with all of these issues

5
Parts per Billion (ppb)
<71
71-73
74-75
76-85 (mar)
>85 (mod)
States with Nonattainment Monitors
Baltimore – The Last Purple Dot • Our biggest problem is ozone
• Still struggling with the old, 85 ppb ozone standard
• Only area in the east designated by EPA as a “moderate” nonattainment area for the 75 ppb Ozone standard

Progress in Cleaning Maryland’s Air 152 153 149 143
126 129 121
0
40
80
120
160
1997 1999 2001 2003 2005 2007 2009
1-H
our O
zone
(ppb
)
1-Hour Ozone
15.8 15.914.5
11.6
17.1
12.915.616.215.9
0
4
8
12
16
20
2002 2003 2004 2005 2006 2007 2008 2009 2010
Ann
ual P
M2.
5 (u
g/m
3 )
Annual Fine Particulate 41 41 39
3530
42 4137
33
2002 2003 2004 2005 2006 2007 2008 2009 2010
Dai
ly P
M2.
5 (u
g/m
3 )
0
10
20
30
40
50Daily Fine Particulate
8-Hour Ozone 110 110 106 103
91 94 89919394104107107
87
1997 1999 2001 2003 2005 2007 2009
8-H
our O
zone
(ppb
)
0
40
80
120
What Have We Learned from All of This?

So What Else Can MD Do? • MDE has worked with the
University of Maryland for over 20 years to study where our air pollution problem comes from
• It’s not all that complicated – Just very, very difficult
• There are two basic pieces: – Maryland’s emissions – Emissions in upwind states
• On certain days sources in upwind states are responsible for 70% to 90% of our problems

So is Maryland Still Pushing Local Controls? • Yes – For example, the Maryland Health Air Act
– It’s a $2.6 Billion power plant control program
– Single sources in upwind states now emit more NOx than all of MDs sources combined
• We are also a California Car State – Toughest car standards allowed by law
• New local rules on everything we can find – Cement kilns to perfume
– Even pushing crazy – nontraditional - stuff • Voluntary programs, outreach programs, incentive programs • Outside-the-box transportation initiatives … and so on
• This is where our efforts on getting energy efficiency and renewable energy (EE/RE) programs into our clean air planning process fit – It’s one of the crazy – nontraditional – approaches we’re
pushing to further clean the air

What Have We Done so Far? • We are working with the Northeast States
for Coordinated Air Use Management (NESCAUM) to build the analytical framework that will allow us to take a different approach to AQ planning
• The new approach can: – Quantify the emission reductions of
multiple pollutants for a broad suite of energy programs
– Model the reductions in ozone, fine particulate and other pollutants
– Estimate the public health benefits associated with those reductions, and
– Quantify the economic benefits and costs

Multi-Pollutant Planning • Maryland sees this as a critical piece of how we do
air quality planning in the future – Under the Clean Air Act states are required to adopt
State Implementation Plans (SIPs)
• Unfortunately, the laws do not drive multi-pollutant planning – They have more of a single pollutant focus
• Our approach: – Use the single pollutant mandates – but always look
at the multi-pollutant benefits • 2010 Ozone SIP • 2012 Greenhouse Gas SIP (State law) • 2015 Ozone SIP • Post 2015 SIPs
– Address our pollution problem in a more strategic and resource-efficient manner
– Include the benefits from our EE/RE initiatives as part of this multi-pollutant planning process

Our “Credit for EE/RE” Approach • Build technical capabilities to analyze
and evaluate the emission benefits and air quality improvements associated with EE/RE programs
• Have partnered with the NESCAUM, EPA and other states, like NY and MA, to build these technical tools
• Looking at benefits from reductions in: – Greenhouse gas (GHG) emissions – Nitrogen oxide (NOx) emissions
• Number 1 pollutant for ozone
– Sulfur dioxide (SO2) emissions • Number 1 pollutant for fine particulate
and regional haze
– Mercury emissions – Other emissions

The Modeling Framework The Workhorse
• NE-MARKAL model – an energy model that we now use to analyze the energy implications and emission reductions from a “bundled” suite of selected energy programs
Linked models • The photochemical – “air
quality” model (CMAQ) • An economic model (REMI) • A cost-benefit model (BenMAP)

The Programs We Have Analyzed So Far
• At this time, we have focused on a package of our highest priority energy initiatives in Maryland – The Regional Greenhouse Gas
Initiative (RGGI) – The EmPOWER Maryland program – The Maryland Renewable Portfolio
Standards (RPS) program – The Maryland Clean Cars program – Electric Vehicle Initiatives – Zero Waste – Building and Trade Codes – Gas Tax
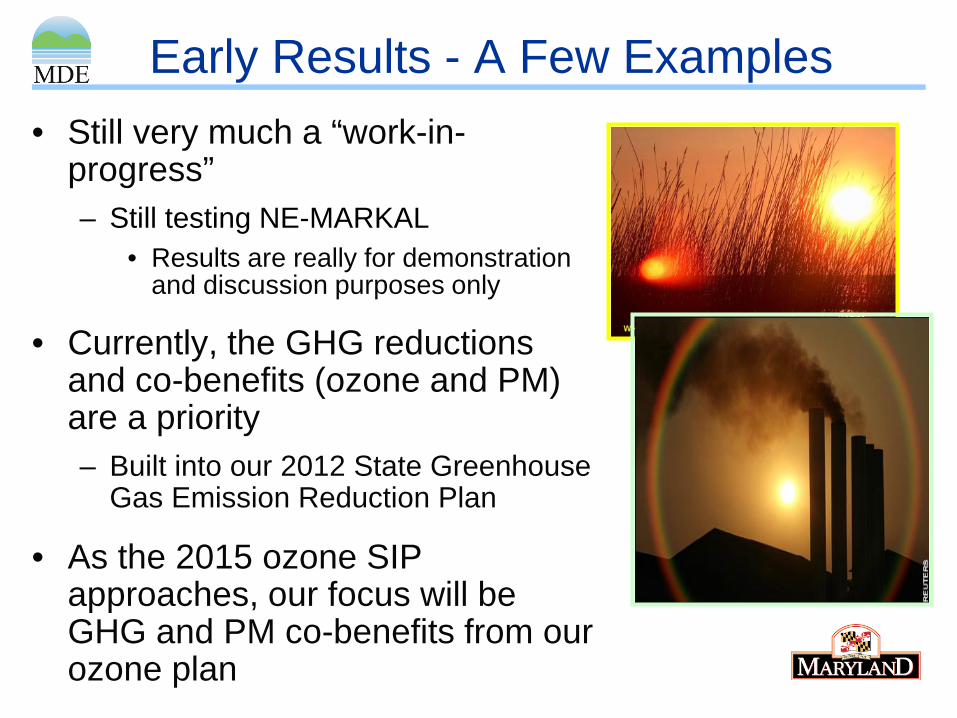
Early Results - A Few Examples • Still very much a “work-in-
progress” – Still testing NE-MARKAL
• Results are really for demonstration and discussion purposes only
• Currently, the GHG reductions and co-benefits (ozone and PM) are a priority – Built into our 2012 State Greenhouse
Gas Emission Reduction Plan
• As the 2015 ozone SIP approaches, our focus will be GHG and PM co-benefits from our ozone plan

Greenhouse Gas Emission Reductions
• Over half of the GHG reductions in the State law mandated GHG reduction plan come from EE/RE measures – EmPOWER Maryland
– The Maryland RPS Program
– RGGI

Energy Sector Emission Reductions
16
… including energy programs
Preliminary Results

17
… including energy programs
Transportation Sector Emission Reductions
Preliminary Results

18
… including energy programs
Building Sector Emission Reductions
Preliminary Results

Additional Reductions from Energy Programs
• Current analyses indicate that the additional reductions from the non-traditional, “energy” programs are very meaningful
• Still a work in progress

20
Modeled Ozone Benefits … from energy programs
Preliminary Results

21
Modeled Fine Particulate Benefits … from energy programs
Preliminary Results

Incidence Valuation (millions $)
Mortality (All Cause)
Morbidity
Mortality Morbidity State (Abbrev.) Ac
ute
Res
pira
tory
Sy
mpt
oms
Emer
genc
y Ro
om
Visit
s, R
espi
rato
ry
Hosp
ital A
dmiss
ions
, Re
spira
tory
Scho
ol L
oss
Days
CT - 52 - - 15 - 35 0.2 - 0.3 0.0 DC - 260 - 0 - 1 76 - 181 1.0 - 1.4 0.0 DE - 643 - 1 - 3 201 - 479 2.5 - 3.5 0.1 MA - 12 - - 3 - 8 0.1 0.0 MD 3 - 5 6,853 3 - 6 3 - 20 2,107 - 5,020 24.9 - 35.1 0.6 - 0.7 ME - (84) - - (53) – (22) (0.6) – (0.4) 0.0 NH - 3 - - 1 - 3 0.0 0.0 NJ 1 1,806 1 - 2 1 - 6 542 - 1,292 7.0 - 9.9 0.2 NY 2 3,731 3 - 6 2 - 10 1,095 - 2,613 12.2 - 17.2 0.3 - 0.4 PA 2 - 3 2,939 1 - 3 2 - 13 873 - 2,083 13.8 - 19.4 0.3 RI - - - - 2 - 5 0.0 0.0 VA 1 2,151 1 - 2 2 - 9 676 - 1,613 6.7 - 9.4 0.2 - 0.3 VT - (16) - - (10) – (4) (0.1) 0.0
22
Public Health Impacts – Ozone
Preliminary Results

23
Public Health Impacts – Fine Particulate
Preliminary Results

• Jobs – On average a net increase of
4,300 jobs per year through 2020
• Wages – Average increase in direct
wages of $131 million/year • Associated with technology
transition
• Household Income – Average savings of $80 per
year
Economic Benefits
Preliminary Results

Next Steps • Working with NESCAUM and other
partners to enhance emission reduction calculations and modeling that identifies air quality and public heath benefits – Will be included in the June 2015
ozone SIP that Maryland must submit
– Will also play a role in a 2015 update of GHG emission reduction progress required by State law
– Also becoming an issue that will be included in Maryland’s efforts to comply with new Section 111(d) requirements for reducing GHG emissions from existing power plants

Lessons Learned • It’s a “win-win”
– Enhancing EE/RE efforts is a theme across the U.S. – Build partnerships
• Energy folks want to understand the environmental benefits
• Air quality folks need all the help we can get in reducing emissions
• Looking at energy programs first may be an important piece of Multi-Pollutant Planning
• Our current work is not simple … – Having EPA continue to invest in
analysis tools and to “bless” approaches like our NE-MARKAL driven “linked modeling” package will be important


Elaine Chang, DrPH Deputy Executive Officer South Coast Air Quality Management District
U.S. Department of Energy Better Buildings Summit
May 8, 2014
Co-Benefits from Energy Planning And
Energy Efficient Technology

L o s A n g e l e s C o u n t y
O r a n g e C o u n t y
R i v e r s i d e C o u n t y
S a n B e r n a r d i n o C o u n t y • 4-county region
• 10,000 sq. miles • Almost 16 million residents • Hundreds of thousands of
diesel vehicles • Millions of gasoline vehicles • Combined Ports of Long Beach and
Los Angeles = nation's largest cargo gateway
South Coast Air Basin

0.00
0.10
0.20
0.30
0.40
0
50
100
150
200
250
Max
imum
Con
cent
ratio
n (
ppm
)
Basi
n-Da
ys E
xcee
ding
Fed
eral
Sta
ndar
d
Days Exceeding Federal Ozone Standard (0.075 ppm)Maximum 8-Hour Ozone Concentration (ppm)
Federal Standard
South Coast Air Basin Ozone Trend

Annual PM2.5 Trend
0
5
10
15
20
25
30
35
1999 2001 2003 2005 2007 2009 2011 2013
PM2.
5 Co
ncen
trat
ion,
µg/
m3
Year
PM2.5 Annual Standard
Annual PM2.5 Trend

0
50
100
150
200
250
300
350HD Diesel Trucks
Offroad Equipment
Ships & Commercial Boats
RECLAIM
Locomotives
Aircraft
Residential Fuel Combustion
Heavy-Duty Gasoline Trucks
Passenger Cars
Med. Duty Gasoline Vehicles
Light Duty Trucks & SUVs
Manufacturing & Industrial
Service & Commercial
Other
Needed by 2023
Needed by 2032
NOx Reductions Needed Beyond Adopted Standards

Separate Solutions
Mobility Energy Climate Change
Air Quality
Climate Change
Air Quality
Energy Mobility

Integrated Solution
Global Warming
Mobility
Air Quality
Energy
Air Quality Improvement Needs
Energy Reliability and Security
Climate Change
Transportation & Land Use


0
500
1,000
1,500
2,000
2,500
3,000
CO2 NOx
SoCal Gas
SouthernCalifornia Edison
Tons
Emission Reductions from
2010-2012 CPUC Ratepayer Programs
Source: CPUC

• Projects ($45 million) Residential Weatherization ($3.6 mil) Renewable Energy Projects ($19.8 mil) Boiler Economizers ($100k) Thermal Load Shifting ($1 mil) Storage ($12.4 mil) Combined Heat and Power ($4.5 mil) Tree Planting ($3.6 mil) Heat Island
What SCAQMD is Doing

Lessens Learned
• Project Types Information Sources
o Independent auditors o Costs
Utility Rate Structures o Deciphering Utility Bills
Cost Effectiveness o Air Quality Benefits
• Project Oversight 3rd Party Inspections Monitoring Benefits
• Funding Mechanisms Upfront Capital Costs Financing Options
o HEROES Program Utility Rebates Tax Incentives
Lessons Learned

Next Steps
• Coordinating Efforts SIP Credits Local Programs State Programs Utility Needs
• Existing Buildings Business Structures
o Energy Disclosures o Distributed Generation
Electric Vehicle Integration
• Education and Outreach Understanding Utility Bills Low Income Assistance
Programs and other financing programs
Challenges

EPA’s new tool to Incorporate Energy Efficiency & Renewable Energy (EE/RE) Programs in Air Quality Plans
Robyn DeYoung, US EPA May 2014

Enhancing EE/RE and Air Quality Plan Resources In 2009, EPA: • Began to renew our effort to encourage and
remove barriers to EE/RE and CHP – Initial effort started early 2000’s
• Looked for ways to make it easier to include emission benefits of EE/RE and CHP to meet clean air goals
• Wanted to be clear that these are viable, cost effective emission reduction strategies – Focused our efforts on air quality plans (e.g., State
Implementation Plans (SIPs) for National Ambient Air Quality Standards (NAAQS))
41
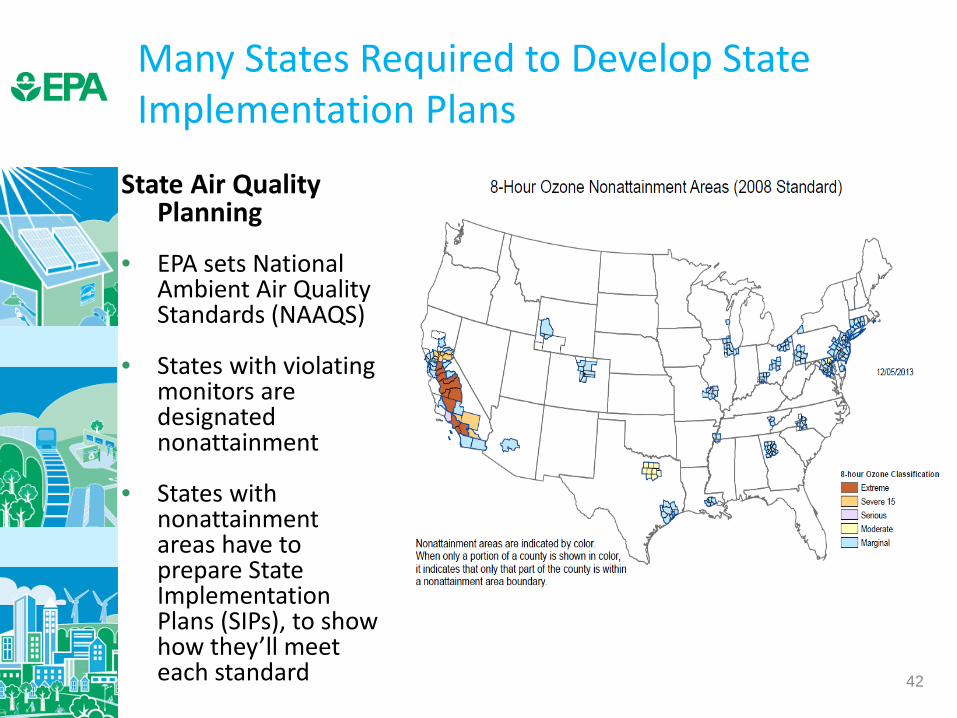
Many States Required to Develop State Implementation Plans State Air Quality
Planning
• EPA sets National Ambient Air Quality Standards (NAAQS)
• States with violating monitors are designated nonattainment
• States with nonattainment areas have to prepare State Implementation Plans (SIPs), to show how they’ll meet each standard
42

Capturing the AQ Benefits of Energy Efficiency and Renewable Energy (EE/RE) • State air regulators looking
for new ways to lower emissions, improve air quality
• Meanwhile, PUCs and SEOs advancing proven EE/RE policies and programs
• Opportunity for states to include the emissions benefits in air quality plans
• In 2012, EPA released the EE/RE SIP Roadmap and began to develop AVERT.
43
Source: ACEEE, 2012 “2012 State EE Scorecard”
Energy Efficiency Resource Standards
Source: CE2S

44
Background on AVERT Development for EE/RE programs
AVERT (AVoided Emissions and geneRation Tool) translates the energy savings of state EE policies into emission reductions for NAAQS compliance – It addresses a key reason states have not implemented previous EE/RE
SIP guidance • AVERT has been thoroughly reviewed, well documented and
tested – Conducted external and internal peer review – Benchmarked AVERT against industry standard electric power sector
model – PROSYM – States beta-tested tool for functionality, appropriate uses, and clarity
of user manual • AVERT was built to be
– straightforward, – transparent and – credible

Emission Quantification Methods – Basic to Sophisticated
Basic Method eGRID region non-baseload
emission rates
Sophisticated Method Energy Modeling
45
End use demand
Energy Model
User defined constraints
Technology data Fuel
data
Emission factors
Environmental regulations
Economic parameters
Intermediate Method
Historically Hourly emission
rates

AVERT Avoided Emissions and geneRation Tool
46
Overview: • Uses historical EGU behavior to simulate hourly changes in
generation and air emissions (NOx, SO2 and CO2) resulting from EE/RE policies and programs – AVERT processes actual data reported to CAMD through Acid Rain Program – Users enter annual MWhs or select from EE/RE options in tool – View emission outputs at regional, state and county level
When to Use: NAAQS SIP credit with the concurrence of EPA Regional office Analyze emission impacts of an EE/RE program portfolio Promote emission benefits of EE/RE with easy-to-interpret maps and
charts
Status: • Available on line at: www.epa.gov/avert

AVERT’s Advantages and Limitations
Advantages: Uses actual unit level historical
generation behavior User can compare emission
impacts of energy efficiency, wind and solar programs
Analyze emissions during High Electric Demand Days
Limitations: Is not useful for small, local
programs There are no transmission
constraint assumptions This is not a projection tool,
not intended for analysis more than 5 yrs from baseline.
Northeast(NE)
Southeast(SE)
Great Lakes / Mid-Atlantic (EMW)
Texas(TX)
Upper Midwest(WMW)
Lower Midwest
(SC)Southwest(SW)
Northwest(NW)
Rocky Mountains
(RM)California(CA)
47
AVERT Regions

AVERT Main Module Step-by-Step Overview
Step 1. Load Regional Data File for historical baseline year
Step 2. Set energy efficiency and renewable energy data
Step 3. Run displacement Step 4. Display outputs

AVERT Main Module Step 1. Load Regional Data File
Regions represent relatively autonomous electricity production zones, and are based on electricity market module regions. Regions include • California • Great Lakes/Mid-Atlantic • Lower Midwest • Northeast • Northwest • Rocky Mountains • Southeast • Southwest • Texas • Upper Midwest
Northeast(NE)
Southeast(SE)
Great Lakes / Mid-Atlantic (EMW)
Texas(TX)
Upper Midwest(WMW)
Lower Midwest
(SC)Southwest(SW)
Northwest(NW)
Rocky Mountains
(RM)California(CA)

AVERT Main Module Step 2. Set EE and RE Data • This page leads you through the process of creating a
load impact profile depicting the load reductions expected from an EE/RE program.

AVERT Main Module Step 3. Run Displacement • Run displacement by selecting the button entitled “Click
here to calculate displaced generation and emissions.”

AVERT Main Module Step 4. Display Outputs
Annual regional displacements • This table displays the total annual generation and emissions as reported for the region
in the base year (“Original”) and as calculated by AVERT’s Main Module after the EE/RE reduction (“Post-EERE”).

AVERT Main Module Step 4. Display Outputs
Displaced generation and emissions map • This dynamic map allows the user to view where emissions have been displaced within
the selected region. Users can view changes in generation, heat input, SO2, NOX, and CO2.

AVERT Main Module Step 4. Display Outputs
Displacement data by month Monthly output can be viewed over the entire region, or a specific state or county within the region. • First select region, state,
or county in the top dropdown menu.
• If selecting a state, choose the state in the next dropdown menu.
• If selecting a county, choose both the state and the county in the next two dropdown menus.

Key Considerations when Quantifying EE/RE Emission Impacts
• Understand baseline parameters to avoid double counting impacts
• Start a dialogue between state environment and energy agencies to: – Build common ground – Exchange data (e.g., energy impacts for EE, wind and
solar programs) • Focus on larger EE/RE policy impacts or bundle
smaller EE/RE programs • Analysis should cover a region – similar to grid
operations
55

AVERT Outreach
Status: • Publically released on Feb 18, 2014 • Over 200 downloads • National Webinar Tuesday March 18th
– Recording: http://epa.gov/statelocalclimate/web-podcasts/forum.html
• Online training available in late May 2014 • Available on line at: www.epa.gov/avert
56

Thank you AVERT Robyn DeYoung U.S. EPA [email protected]
EM&V and EE Policies Niko Dietsch U.S. EPA [email protected] 202-343-9299
57
Roadmap and SIP related questions Angie Shatas U.S. EPA [email protected] 919-541-5454

Change is in the Air: How States Can Harness Energy Efficiency to Fortify the Economy and Reduce Pollution Sara Hayes May 8, 2014
58

The American Council for an Energy-Efficient Economy (ACEEE) • ACEEE is a nonprofit 501(c)(3) that acts as a
catalyst to advance energy efficiency policies, programs, technologies, investments & behaviors
• Nearly 50 staff based in Washington, D.C. • Focus on end-use efficiency in industry,
buildings, utilities & transportation • Other research in economic analysis; behavior;
national, state, & local policy • Funding:
◦ Foundation Grants (52%) ◦ Contract Work & Gov. Grants (20%) ◦ Conferences and Publications (20%) ◦ Contributions and Other (8%)
www.aceee.org

The Opportunity EPA will regulate CO2 from the power
sector • Proposal early June
Potential role for end-use energy efficiency
• Could be used to set the standard - “beyond the fence-line”
• Could be used for compliance with rule
60

Levelized electricity resource costs
61
Source: Energy efficiency data represent the results from Molina 2014 for utility program costs (range of four-year averages for 2009-2012); supply costs are from Lazard 2013.

Levelized Utility CSE 2005-2012
62
Source: Data for 2005-2008 are from Friedrich et al. 2009 (designated by unfilled markers). Data for 2009-2012 are from Molina 2014.

What We Did and Why Top down policy analysis of EE potential in
all 50 states To find out: • Electricity savings available from proven,
in-practice technologies and policies • Cost, economic impact, jobs and
pollution
63

Approach
Evaluated biggest EE opportunities available to states • Energy savings target of 1.5% annually
• Building codes for residential and commercial
buildings
• Combined heat and power
• Appliance standards adopted by states for 5
products
64

Results - Electricity savings • 925 million MWh in 2030
• Note: this is not all EE possible, but is based on what is tested and proven in states
• Savings in 2030 are a 25% reduction relative to 2012 consumption
• 247 GW of avoided capacity • nearly 500 power plants
Percentage of electricity savings relative to 2012 consumption, by census region
65
Region Total (all four policies) New England 30% Middle Atlantic 28% South Atlantic 24% East South Central 23% West South Central 24% East North Central 22% West North Central 22% Mountain 30% Pacific 27%

Jobs and Economic Analysis Dynamic Energy Efficiency Policy Evaluation Routine,
or DEEPER model. • An ACEEE input-output model
• National and state-by-state net jobs impact • National and state GDP/GSP impacts
• The model has a 20-year history of use and development, • 15-sector input-output (I/O) model • Core data based on IMPLAN • Energy consumption and cost data from AEO • Labor and employment data from the Bureau of Labor Statistics
66
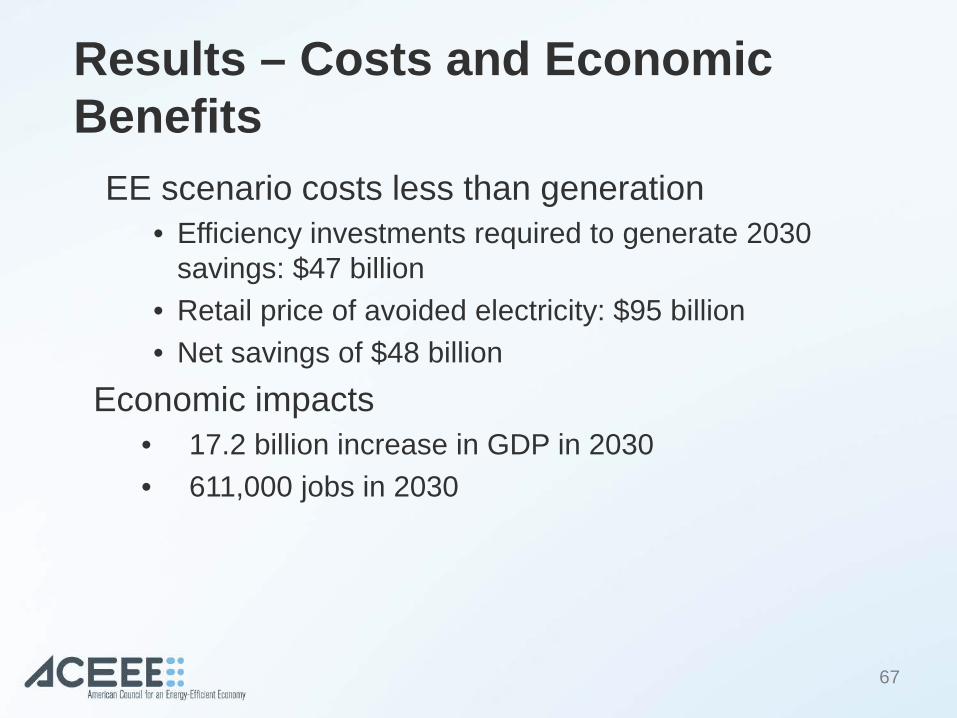
Results – Costs and Economic Benefits
EE scenario costs less than generation • Efficiency investments required to generate 2030
savings: $47 billion • Retail price of avoided electricity: $95 billion • Net savings of $48 billion
Economic impacts • 17.2 billion increase in GDP in 2030 • 611,000 jobs in 2030
67

Results – Pollution Reductions Carbon dioxide
• 3 high-level approaches used to develop a range • >25% reduction from 2012 levels • About 600 million tons avoided in 2030 • Range 23-30% in 2030, relative to 2012 baseline
Sulfur dioxide: 980,000 tons in 2030 Nitrogen oxides: 527,000 tons in 2030
68

69

Conclusions If states adopt EE policies and programs already
in use, we could reduce 2030 electricity demand and carbon dioxide emissions by 25% or more (relative to 2012) • States can begin implementing immediately, and many are already
doing many of these things • Policies aren’t a guarantee (Indiana, Ohio) and even states that
have taken action could benefit from a “back stop”
The economic and employment impacts of this amount of EE would be positive in all states. • Note: There are market barriers to EE and if the standard isn’t
aggressive enough states could fall back to more expensive compliance options (as they have done in NAAQS SIPs)
70
71
Resources for States Change Is in the Air: How States Can Harness Energy Efficiency to Strengthen the Economy and Reduce Pollution: http://aceee.org/research-report/e1401 ACEEE 123 Solutions for States website: http://aceee.org/123-solutions State Toolkit: http://aceee.org/sector/state-policy/toolkit Coming soon…
•State by state results available •Working on Excel-based calculator for states •Developing website and technical resources on 111(d) with NASEO
