co-designing interactive spaces for and with designers: supporting mood-board making ·...
TRANSCRIPT

Co-designing interactive spaces for and with designers :supporting mood-board makingCitation for published version (APA):Lucero Vera, A. A. (2009). Co-designing interactive spaces for and with designers : supporting mood-boardmaking. Eindhoven: Technische Universiteit Eindhoven. https://doi.org/10.6100/IR641288
DOI:10.6100/IR641288
Document status and date:Published: 01/01/2009
Document Version:Publisher’s PDF, also known as Version of Record (includes final page, issue and volume numbers)
Please check the document version of this publication:
• A submitted manuscript is the version of the article upon submission and before peer-review. There can beimportant differences between the submitted version and the official published version of record. Peopleinterested in the research are advised to contact the author for the final version of the publication, or visit theDOI to the publisher's website.• The final author version and the galley proof are versions of the publication after peer review.• The final published version features the final layout of the paper including the volume, issue and pagenumbers.Link to publication
General rightsCopyright and moral rights for the publications made accessible in the public portal are retained by the authors and/or other copyright ownersand it is a condition of accessing publications that users recognise and abide by the legal requirements associated with these rights.
• Users may download and print one copy of any publication from the public portal for the purpose of private study or research. • You may not further distribute the material or use it for any profit-making activity or commercial gain • You may freely distribute the URL identifying the publication in the public portal.
If the publication is distributed under the terms of Article 25fa of the Dutch Copyright Act, indicated by the “Taverne” license above, pleasefollow below link for the End User Agreement:www.tue.nl/taverne
Take down policyIf you believe that this document breaches copyright please contact us at:[email protected] details and we will investigate your claim.
Download date: 21. May. 2020

Co-designing interactive spaces for and with designers: supporting mood-board making
andres lucero vera

Co-designing interactive spaces for and with designers: supporting mood-board making
andres lucero vera
This thesis explores why and how designers use mood boards in the early stages of the design process, and how augmented reality can support mood boarding by following a user-centered design approach. The main research questions in this thesis are: 1) what are mood boards and why do designers use them, and 2) how can augmented reality tools provide support for professional users in their work. Mood boarding is explored in depth by means of interviews with Dutch and Finnish practicing designers. The knowledge gained in these interviews is fed into co-design sessions with Dutch and Finnish designers in which researchers and end-users (i.e. designers) create augmented reality tools that support mood boarding. The co-designed tools are later evaluated to address the two research questions. In terms of the complete research process, this work also leads to an improved understanding of using different user-centered design methods (i.e. cultural probes, workshops, contextual inquiries, interviews, co-design sessions, prototyping) when trying to unveil the needs of users.

Co-Designing Interactive Spacesfor and with Designers:
Supporting Mood-Board Making

© Andrés Antonio Lucero Vera
Cover Design: Rodrigo Zuloaga
Graphic Design: Andrés Lucero
Paper: Munken Pure 120 g/m2 and 300 g/m2
Font Family: Chaparral Pro
Accompanying website: www.funkydesignspaces.com
All photographs by the author, unless stated otherwise.
All photographs published with permission.
A catalogue record is available from the Eindhoven University of Technology Library
ISBN: 978-90-386-1602-5
Gummerus Printing
Printed in Vaajakoski, 2009
Finland

Co-Designing Interactive Spacesfor and with Designers:
Supporting Mood-Board Making
PROEFONTWERP
ter verkrijging van de graad van doctor aan de
Technische Universiteit Eindhoven, op gezag van de
Rector Magnificus, prof.dr.ir. C.J. van Duijn, voor een
commissie aangewezen door het College voor
Promoties in het openbaar te verdedigen
op dinsdag 31 maart 2009 om 16.00 uur
door
Andrés Antonio Lucero Vera
geboren te Santiago, Chili

De documentatie van het proefontwerp is goedgekeurd door de promotoren:
prof.dr.ir. J.-B.O.S. Martensenprof.dr. C.J. Overbeeke

To Sole, to Rayen, to Antü
Co
-Desi
gn
ing
In
ter
ac
tiv
e S
pac
es.
.. 6
ACKnowledgements

Ac
kn
ow
led
gem
en
ts
7Acknowledgements
Guidance
Jean-Bernard Martens gave me the chance to start my PhD project. At different
times in this process, we had (apparently) opposing views on which way the re-
search should continue. However, we always had fruitful and respectful discussions
that helped me contrast my ideas. He ultimately trusted me on my decisions and
then challenged me to take the chosen research path to the limit. Thanks for your
trust, understanding and for Saturday tennis.
Throughout my work, Kees Overbeeke was my link to the world of design:
design thinking, design practice, design research. He constantly challenged me to see
things from a broader perspective, suggesting including new theories as part of my
work. His sometimes-hard comments were always aiming for quality, “always for the
best.” Thank you for your honesty, dedication and for Saez.
I would like to thank the members of my committee, Pieter Jan Stappers, Ilpo
Koskinen, and Bauke de Vries who critically commented my manuscript. The discus-
sions that emerged from their comments have improved this work. It will be nice to
see together at my defense people that have inspired different parts of this work.
Participation
The designers who participated in the studies were the main source of inspiration
for this work. I want to thank the 50 practicing designers who generously allowed
me to enter their design studios to observe and interview them at work. Fons, Arni,
Cindy, Sander, you participated in several studies and I am extremely grateful for it.
Making
Multi-cultural interdisciplinary collaboration is the key to success in a design
research thesis like this. Several friends and colleagues in the Netherlands and
Finland have helped me along the way.
I never would have been able to complete my PhD within four years without
the invaluable help of Selene Mota, Kirsikka Vaajakallio and Dzmitry Aliakseyeu.
Selene helped me with the analysis of the contextual inquiries, spending endless
hours watching video recordings and creating affinity diagrams. She taught me how
to do qualitative research in a rigorous way (the MIT rigor). Second, together with
Kirsikka we co-created, prepared and conducted the dialogue-labs (though the name
is purely Kirsikka’s creation). She introduced me to the wonderful world of participa-
tory design. Last, but definitely not least, Dzmitry (Dima) allowed me to bring my
designerly interaction ideas to life by closely discussing and implementing them.
Besides that, Dima and I shared the same office for four years and became friends in
the process.

Co
-Desi
gn
ing
In
ter
ac
tiv
e S
pac
es.
.. 8 Thanks to everyone at the departments of Industrial Design (TU/e), and Prod-
uct and Strategic Design (TAIK). Special thanks to Javed, Natalia, Evan, Oscar, Peter,
Evelien, Berry, Ilpo, Tuuli, Salu, Salil, and Osse.
Learning
It has been an honor to teach to and learn from my Industrial Design students at
the Eindhoven University of Technology. I was able to discover the wonders and
challenges of the competency-based educational model used in our department. I
also worked with a great variety of teachers (coaches), which made the interim and
final presentations never dull. A special mention goes to my colleagues at the good
old Work domain Mark, Fons, Frans, Maartje, Holger, and my IBP students Chris
and Eveline.
I have also been able to keep on collaborating with colleagues and students at
Universidad Tecnológica Metropolitana (UTEM) in spite of the physical distance.
Special thanks to Felipe, Katherine, Julio, Mario, Carlos, Tomás and Eduardo.
Present
The last part of this PhD was completed while working at Nokia Research Center
in Tampere. I would like to thank my new colleagues for a warm and safe arrival in
Finland. Special thanks to Marion, Severi, Jaakko.
Love
It is not easy to pack your things, leave your friends and family behind, and begin a
four-year adventure in a foreign country. It only becomes more difficult when you
also leave a comfortable lifestyle and your successful career behind too. These are
the things my wife Sole has had to sacrifice for us to be on the verge of finishing
this adventure. On the bright side, our two wonderful children were born during
this adventure and so Sole has had the chance to take care of them and see their
everyday development. Sole, thanks for your love, support and dedication to me, Rayen,
and Antü. All this would not have been possible without you. Gracias Sole por tu cariño,
apoyo y dedicación hacia mí, hacia Rayen y hacia Antü. Esto no se hacía sin tí.
I would like to thank my parents for always believing in me. Papo, mami, su
gollito los quiere mucho. I want to also thank my brother and his family, my sister, and
Sole’s family for welcoming me into their large group. Sergio, Pao, Fran, Wilson, Cloti,
Coca, Emilio, Wilsito, la próxima será en La Palmera.
Thanks to all my friends who are near and far. Although we do not get to see
each other as often as we would want, you all make it count when we actually do. The
memories of those encounters allowed me to keep on advancing. Daniel, Mauricio,
Nadia, Rodri, Parrilla, nos vemos pronto.

Ac
kn
ow
led
gem
en
ts
9Finally
Halfway through this PhD, Sole and I were blessed with our beautiful daughter
Rayen. She became our traveling companion hopping on planes, trains and cars
whenever I needed to attend a conference, go for six months to Finland, or take
holidays in Chile. Then came our ever-smiling son Antü in the last year of the PhD,
when I was in the middle of writing this thesis and looking for a new job. He was
only one week old when I went to Finland for the job interview with Nokia. They
both brought joy into our lives and allowed us to put things, including this thesis,
into perspective. Niños, gracias por llegar a nuestras vidas y por ser compañeros y cóm-
plices de esta aventura que ahora sigue en Finlandia. Este trabajo está dedicado a ustedes,
y a la mamu.

Co
-Desi
gn
ing
In
ter
ac
tiv
e S
pac
es.
.. 10 Contents
Acknowledgements 7
1 Introduction 131.1 Designers and their mood boards 131.2 User-driven innovation 131.3 Goal and relevance 141.4 Design paradigms 151.5 Research approach 171.6 About this thesis 191.7 Outline of this thesis 21
2 Design Practice 232.1 Problem 232.2 Related work 232.3 Probes study 252.4 Workshops 402.5 Student project 502.6 Discussion 612.7 Conclusions 63
3 Mood Boards 653.1 Problem 653.2 Related work 653.3 Approach 673.4 Dutch contextual inquiries 673.5 Finnish MB interviews 833.6 Discussion 953.7 The essence of MBs 963.8 Considerations for a MB making tool 1013.9 Conclusions 102

Co
nt
en
ts
11
4 Co-Design 1054.1 Problem 1054.2 Related work 1054.3 Approach 1064.4 Finnish co-design sessions 1094.5 Dutch co-design sessions 1254.6 Overall findings (FI + NL) 1374.7 Discussion 1444.8 Conclusions 146
5 Augmented Reality Tools 1495.1 Problem 1495.2 Related work 1505.3 Approach 1535.4 First tool: The Funky Coffee Table 1545.5 Second tool: The Funky Wall 1695.6 Discussion 1835.7 Conclusions 188
6 Reflections 1916.1 On the research questions 1916.2 On the process 1946.3 On the limitations and future work 198
References 207
Summary 215Publications 219Curriculum Vitae 223

Co
-Desi
gn
ing
In
ter
ac
tiv
e S
pac
es.
.. 12
introduction

Int
ro
du
ct
ion
13Introduction1
Designers and their mood boards1.1 As a trained graphic designer and as a teacher in a design school in Chile, I had
never come across mood boards (MBs) before. I had made collages and used images
as part of a design process, however, there seemed to be something about MBs that
was different from the collages I used to make.
I first heard about MBs in Philips Research Eindhoven. An industrial design
student from TU Delft who was working on her graduation project presented some
MBs she had made for herself, “for my own inspiration”. As she was presenting her
work, people around the table were divided among those who seemed to understand
and respect what she had done and why she had done it, and the other half did not
seem to get it. Among the latter, one person asked her with a sarcastic tone: “So, you
picked these images yourself, you decided where the images would go (layout), and finally
you glued them to this board. And you made all this to find inspiration for yourself?” This
comment shows that people know very little about what MBs are and why designers
use them. I was among those who did not get it.
When I later joined Industrial Design at the Eindhoven University of Technol-
ogy (TU/e) and came into contact with other designers from Philips and TU Delft, I
became more aware of MBs. For some reason, whenever I spoke to designers, MBs
seemed to naturally pop into the discussion. On a visit to ID-StudioLab in Delft, a
professor there started talking about MBs. “MBs seem to be very important to de-
signers, but we have no overview or theory of how precisely they are made and used,
and how they should be supported.” There was something about MBs that I was not
aware of and I wanted to know exactly what.
Later on, at a Human-Computer Interaction (HCI) conference, we were discuss-
ing our experiences working in multi-disciplinary teams with a Finnish researcher
from the Helsinki University of Technology, when he made this observation: “…you
know designers and how they like their MBs!” Around that time I decided to look closer
into MBs.
These three examples show that 1) designers use MBs for their work, 2) design-
ers are very fond of them, and 3) that there is very little understanding of why
designers use MBs.
User-driven innovation1.2 The field of HCI has been investigating how people interact with computer sys-
tems at work (and more recently at home), trying to help them achieve their goals.
Within HCI, researchers have already identified the potential behind interactive
vertical and horizontal surfaces as a more natural and familiar setting to design
(collaborative) interactions. Some notable examples of interactive tables include the

Co
-Desi
gn
ing
In
ter
ac
tiv
e S
pac
es.
.. 14 DigitalDesk [Wellner 1993], DiamondTouch [Dietz & Leigh 2001], Sensetable [Pat-
ten et al. 2001], Lumisight [Matsushita et al. 2004], and more recently Microsoft’s
Surface [Surface 2007]. Prominent examples of interactive wall displays include
Tivoli [Pedersen et al. 1993], Flatland [Mynatt et al. 1997], Hello.Wall [Prante et al.
2003], and the prototype developed by Vogel to study interactive public ambient
displays [Vogel & Balakrishnan 2004]. Although initially research in this area was
mostly driven by technology, we have slowly started to witness a user-perspective
approach, studying the needs and aspirations of users.
Within our User Centered Engineering (UCE) group, we had built augmented
reality (AR) systems, which allowed us to gain experience on aspects such as technol-
ogy and usability. Previous designs were mostly based on relevant literature of work
practices and less so on active user exploration. Our group had been following the
traditional technology push approach that is commonly taken by computer science
departments when working on HCI. For sure, the technology push approach is one
good way of doing research and fostering innovation. However, it is not the only one.
Before starting my PhD I spent one year in Philips Research Eindhoven, working
on a project that involved the design and evaluation of an interaction solution for
an advanced ambient lighting system for the bathroom in HomeLab. In the project
at Philips, I followed a user-centered design (UCD) approach that led to user-driven
innovation. In this thesis, I take a similar approach that consists of letting potential
users guide the innovation process. Basically, it implies conducting a series of user
studies (i.e. cultural probes, workshops, contextual inquiries, interviews, video ob-
servations) to first explore the work (i.e. design practice) of professional users, then
identify a relevant task for these professional users (i.e. industrial designers), and
finally try to understand the essence of this task before making any attempt of pro-
viding support for it with new technologies. Finally, the results of these studies are
fed into co-design sessions in which end-users actively create sensible solutions and
tools that support their work and in their real context. In this thesis UCD is used as
a research methodology [Spinuzzi 2005].
Goal and relevance1.3 People have different ways of communicating with each other and building an
understanding in the context of professional work (e.g. face-to-face meetings,
phone calls, email, videoconference, etc.). Designers use mood boards as means to
communicate and reach agreements with their clients (or within a design team)
in the beginning of the design process. Mood boarding helps explore the available
design space or range of possibilities that emerge from the design brief. It does so
by visualizing rough and undefined ideas using mostly visual materials (i.e. images
from books or magazines). A MB defines and communicates the direction for a
design project. But what is our understanding of design practice in relation to MBs?

Int
ro
du
ct
ion
15This work creates a deeper understanding of design practice or how designers work
in general, and specifically on why and how designers use MBs for their work. As
practitioners, researchers and teachers in design we believe there are still aspects
behind MBs that need to be discovered.
HCI researchers have already identified the potential behind interactive vertical
and horizontal surfaces as a more natural and familiar setting to design (collabora-
tive) interactions. Traditionally, research in the area of AR has been mostly driven
by technology. As a result, one fundamental facet has been missing: the user. In this
thesis we follow an alternative UCD approach that leads to user-driven innovation.
This thesis explores why and how designers use MBs in the early stages of the
design process, and how AR can support mood boarding by following a UCD ap-
proach. The main research questions in this thesis are: 1) what are MBs and why do
designers use them, and 2) how can AR tools provide support for professional users in their
work. We address these two questions by co-designing and evaluating AR tools that
support mood boarding for designers.
In terms of the complete research process, this work also leads to an improved
understanding of using different UCD methods (i.e. cultural probes, workshops,
contextual inquiries, interviews, co-design sessions) when trying to unveil the needs
of users.
Design paradigms1.4 Our understanding on the notion and practice of design has historically been linked
to the disciplines of graphic and industrial design. In this traditional conception of
design, the designer is mostly interested in the relationship between people and the
resulting products, be it a poster, a sign, or a piece of furniture. Two design para-
digms naturally belong to this old notion of design: design as rational problem solving
and design as reflective practice.
A first paradigm of design methodology, design as rational problem solving, con-
sists of a basic design cycle of four main sequential phases that designers go through
in search for the best possible solution: analysis, synthesis, simulation, and evalu-
ation. The designer first clearly defines the problem space and then analyzes it to
formulate requirements. Next, designers must diverge and generate many possible
solutions, exploring the potential consequences behind each, ultimately converging
to select the most manageable ones. Finally, the chosen solution is implemented.
This sequence can be repeated making this design process iterative. Dorst [2007] ar-
gues that design as rational problem solving can be applied when the design problem is
clearly formulated and thus design goals are explicit, clear and stable. However, due
to the ill-defined and unstructured nature of most design problems we encounter in
real life, in most cases this design approach does not work [Schön 1983]. It is simply
not possible to have all the necessary information to solve a design problem [Cross

Co
-Desi
gn
ing
In
ter
ac
tiv
e S
pac
es.
.. 16 2006]. Designers would have to make an a priori judgment of the complexity of the
design challenge and its solution domain [Hummels & Frens 2008].
A second paradigm of design methodology, design as reflective practice [Schön
1983], also consists of four sequential phases: naming, framing, moving, and
evaluating. The first two phases, naming and framing, can be mapped to the analysis
phase of design as rational problem solving. Naming consists of identifying all the
relevant factors in the situation, which later helps frame the design problem. The
designer can then move towards a solution, consider the situation again, and create
new moves. Finally, the moves or solutions are evaluated. In this process, Schön
stresses the importance of linking the design process to a concrete design situation,
integrating knowledge, skills, and attitude.
As technology became part of people’s everyday lives, designers took on a more
holistic approach in trying to understand how people interact with technology, and
thus new design disciplines emerged (i.e. interaction, experience, and sustainable de-
sign). New paradigms of design methodology have also naturally come into existence
to reflect some of these changes in design. Kees Dorst [2007] has explored other
paradigms of design methodology: design as applied creativity, design as learning, and
design as evolution.
In design as applied creativity, designers focus their creative skills and analytical
reasoning towards a solution and not on the problem. This approach seems espe-
cially relevant for chaotic problems that do not lend themselves to analysis. In design
as learning, designers take a different approach by gradually gathering knowledge
on both the design problem and the possible routes towards solutions. Designers go
through rounds of proposing, experimenting, and thus learning their way towards a
solution. Design as evolution consists of a gradual process of tuning primitive (vague)
ideas towards evolved (knowledgeable) possible solutions over generations. This
evolution refers both to the problem definition and the ideas for solution, the final
aim being the generation of a matching problem-solution pair.
A final paradigm of design methodology, design as reflective transformation
[Hummels & Frens 2008], is a design process based on four principles: 1) flexibility
and individuality, 2) integrating knowledge, skills and attitudes, 3) supporting trans-
formation, and 4) creating moments of reflection. Design as reflective transforma-
tion is a holistic, open, and flexible design process that allows designers and design
students find their preferred way of designing future interactive intelligent products
and services. The designer can be involved in any of five activities (i.e. envisioning,
sensing, analyzing, ideating and validating), changing as many times as necessary,
and in no particular order. The path that designers choose to follow will be on one
hand influenced by the nature, context and complexity of the design problem, and
on the other by their individual designerly skills.
The design paradigms mentioned earlier describe different approaches taken

Int
ro
du
ct
ion
17by designers when confronted with new design challenges. Some design problems
naturally lend themselves to more rigid paradigms such as design as rational problem
solving while others benefit from flexible paradigms like design as reflective trans-
formation. The same observation holds for the designers themselves who feel more
comfortable with one paradigm over another based on their interests and skills.
However, regardless of the paradigm, all design problems share at the core a degree
of uncertainty, conflict, choice, and compromise that designers must deal with and
that are part of the “delight of being a designer.” [Cross 2006]
The different design paradigms have evolved together with emerging design
disciplines in an attempt to understand the domestication of technology or how new
technology is appropriated by its users. Starting from a specific design activity such
as the creation of MBs, in this thesis I begin to build a holistic view on how interac-
tive design spaces can provide a better support for designers in their individual de-
sign processes. Similarly to the creation of MBs, the design process I am supporting
is by nature explorative, open, and flexible and thus bares close ties with the design
as reflective transformation paradigm. This paradigm reflects the natural evolution of
the design field and better responds to the dynamic, multidisciplinary, and multicul-
tural work needed to create future interactive intelligent products and services.
Research approach1.5 In this thesis a research through design approach is followed, in which the design
process is used as a form of research to contribute to a design activity [Archer
1995]. In a research through design process, working prototypes are created from
a clear research question and thus can express a hypothesis [Stappers 2007]. The
prototypes are put to test in real-life contexts so users can experience them [Frens
2006]. The design solutions behind the prototypes can be based on research meth-
ods or theories. The prototypes ultimately become the instruments in experiments
[Keller 2005], playing the role of stimuli in formal experiments [Stappers 2007].
Knowledge is generated by designing the artifact, by the artifact itself, and by the
evaluations of use. The knowledge gained can later be generalized as design recom-
mendations, theories or frameworks.
Another aspect of research through design present in this thesis is the fact that
the act of designing is in itself a confrontation of various forms of knowledge, both
formalized and experiential, which brings about new knowledge. This aspect of
research through design emphasizes the exploratory nature of design research over
the traditional scientific culture of evaluating by testing, which must be conducted
following very specific directions.
Co
-Desi
gn
ing
In
ter
ac
tiv
e S
pac
es.
.. 18
funky-design-spaces
Probesstudy
Workshops
DutchContextual
inquiries
Finnish MBinterviews
Co-designin Finland
FunkyCo�eeTable
De�nitionof MBs
Co-designin NL
FunkyWall
Considera-tions for a
MB makingtool
Intuitiveinteraction
funky-design-spaces
hypothesis
FunkyWall
Creativity,inspiration,
MBs
Two-handedness
Studentproject
dialogue-labs
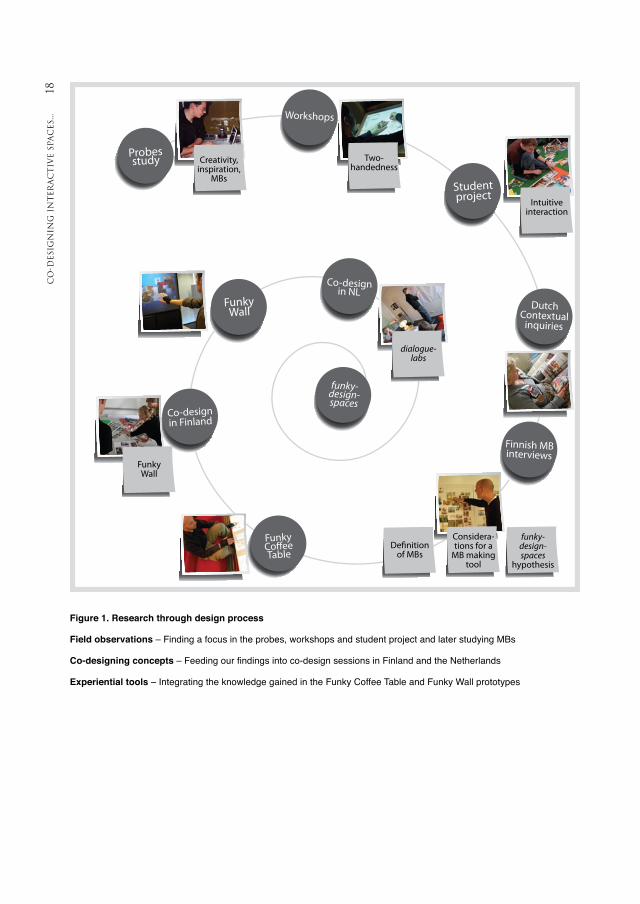
Figure 1. Research through design process
Field observations – Finding a focus in the probes, workshops and student project and later studying MBs
Co-designing concepts – Feeding our findings into co-design sessions in Finland and the Netherlands
Experiential tools – Integrating the knowledge gained in the Funky Coffee Table and Funky Wall prototypes

Int
ro
du
ct
ion
19In my research through design process (Figure 1) the knowledge gained in field
observations (chapters 2 and 3) is integrated with the co-designed concepts or funky-
design-spaces (chapter 4) into experiential tools (chapter 5). The Funky Coffee Table
and Funky Wall prototypes are created and later tested to express the funky-design-
spaces hypothesis and to try to provide answers to my research questions on how and
why designers create MBs and how AR tools can provide support for this activity.
My complete research through design process consists of 10 separate studies con-
ducted with 50 (different) practicing designers and 32 industrial design students:
A probes study with Dutch designers who identified MBs as a relevant topic. ×Workshops with Dutch designers who encouraged us to augment mood boarding. ×A student project where the concept of intuitive interaction begins to shape up. ×Two contextual inquiry studies on Dutch and Finnish designers’ use of MBs that ×helped identify requirements for an AR tool that supports mood boarding and
integrate them into the funky-design-spaces hypothesis.
Co-design sessions conducted in Finland and the Netherlands to elaborate on my ×hypothesis and test the idea of constructing a space rather than a single tool that
supports MB making with AR.
Two prototypes that were designed, implemented and evaluated (i.e. the Funky ×Coffee Table and the Funky Wall) to bring the funky-design-spaces hypothesis to
life.
An extra evaluation of the two experiential tools running alongside each other to ×test the funky-design-spaces hypothesis.
About this thesis1.6 To avoid as much as possible repeating background information at the beginning
of each chapter, this thesis is constructed as different chapters that build from one
another. The different publications from the author that were originally written for
different audiences and research communities (e.g. design research, tabletop inter-
action, general HCI) are thus modified for the benefit of communicating the larger
picture in the entirety of this book.
The thesis follows a chronological order to give a sense of the process together
with the specific activities undertaken. Throughout this thesis, other designers and
researchers have contributed in preparing, discussing, co-designing, implementing,
and inspiring this work. At the start of each chapter, their names are mentioned.
Some acronyms are used throughout the thesis:
MB (mood board) – MBs (mood boards) ×AR (augmented reality) ×UCD (user-centered design) ×HCI (human-computer interaction) ×

Co
-Desi
gn
ing
In
ter
ac
tiv
e S
pac
es.
.. 20 First-person singular (“I”, “me”, “my”) is used at the beginning and end of
each chapter. At the beginning of the chapter first person is used to introduce the
problem while at the end of the chapter it is used to reflect on the process. In these
two parts of each chapter, references to the author’s own experiences are included
as illustrations of an issue regarding the research process. First person is not used to
argue a solution or decision.
Outline of this thesis1.7 In this chapter 1, the starting point for this research is described. Based on the con-
text of the research and previous experience, an alternative approach is proposed
and discussed. Finally, the main research questions are presented.
In chapter 2, design practice is studied by means of three studies to provide
designers with a sensible AR support tool for their work. The chapter starts with
the probes study where design activities are examined from a general perspective.
From the probes study, a set of important ideas and possible research directions are
deduced. The findings are connected to supporting creativity and finding inspiration
in the early stages of the design process. Mood boarding is identified as a relevant
task for designers and potentially becomes the central activity to support with AR.
The chapter continues with the second study, workshops, where probes results are
discussed with designers who are also confronted with an AR tool. In the workshops,
designers see the potential of supporting mood boarding with AR and encourage
us to do so. Finally, a student project is presented where the actual making of MBs
is observed using different techniques such as traditional, digital and AR MBs. The
concept of intuitive interaction begins to shape up.
Chapter 3 explores mood boarding in depth. An understanding of the essence of
MBs is created by means of two studies. The results of both contextual inquiries with
Dutch industrial designers and of MB interviews with Finnish textile and fashion
designers are introduced. Based on these two studies, a definition of MBs, a detailed
description of the MB making process and a summary of the five main stages of the
MB making process are presented. The chapter ends by formulating the funky-design-
spaces research hypothesis.
In chapter 4, the data from the previous two chapters is fed into co-design
sessions with Dutch and Finnish designers. The general idea behind the funky-design-
spaces hypothesis is tested in the dialogue-labs where researchers and people (i.e.
designers) collaboratively come up with new concrete ideas that support MB making
with AR. The idea for the Funky Wall comes directly from the co-design sessions and
is explained in the next chapter. The funky-design-spaces hypothesis is initially proved
true by designers and is put to the test with experiential tools in the next chapter.
Chapter 5 looks at AR tools and technology to further explore the funky-design-
spaces hypothesis. Two tools, the Funky Coffee Table and Funky Wall are designed,

Int
ro
du
ct
ion
21implemented, and evaluated. The knowledge and experience from the previous three
chapters are integrated into these two working tools. The results of the evaluation
prove the funky-design-spaces hypothesis true.
Finally, chapter 6 rounds off this thesis by reflecting to what extent the activi-
ties described in this thesis contribute to our understanding of the research ques-
tions, identifying aspects that could also be valuable to other researchers working in
similar and different context than mine.

Co
-Desi
gn
ing
In
ter
ac
tiv
e S
pac
es.
.. 22
design practice

Desi
gn
Pr
ac
tic
e23Design Practice2
This chapter is based on the articles:
Andrés Lucero & Jean-Bernard Martens (2006) Supporting the creation of MBs: ×industrial design in mixed reality. In Proceedings of TableTop 2006, IEEE, 127-
128.
Andrés Lucero & Tuuli Mattelmäki (2007a) Professional Probes: A Pleasurable ×Little Extra for the Participant’s Work. In Proceedings of IASTED HCI 2007,
ACTA, 170-176.
Andrés Lucero, Tatiana Lashina, Elmo Diederiks & Tuuli Mattelmäki (2007b) How ×probes inform and influence the design process. In Proceedings of DPPI ‘07, ACM,
377-391.
Problem2.1 According to the original proposal of my PhD project ID-MIX: Industrial Design in
Mixed Reality, I was supposed to investigate the impact and practical relevance of
mixed reality (augmented reality or AR from now on) tools on actual work practice,
with industrial designers as a specific user group. I had to first identify relevant
tasks for designers and later design and evaluate alternative AR approaches in
several design cycles.
A huge task lay ahead of me. First study design practice, identify a relevant
task for designers, and really understand what are some of the difficulties and
possible opportunities of moving to AR, not assuming that the tool will augment
the activity per se because maybe it will de-augment some of the current features.
The value would be in getting the grips of providing support with AR in a sensible
way. To achieve this, I would have to spend a considerable amount of time talking
to designers and understanding their practice. Although I would most probably run
out of time at the end of the process that originally included several design cycles, I
was more than happy to compromise this aspect to make sure that the tools I would
create make sense to users.
Related work2.2 Several researchers have studied design practice in different disciplines (e.g. indus-
trial, fashion, graphic, etc.), countries, and focusing on specific stages of the design
process. Eckert and Stacey [2000] did an empirical study with knitwear designers to
facilitate communication within design teams with computer support. Over seven
years and in three different countries (i.e. Britain, Germany and Italy), they looked
into the use of sources of inspiration throughout the knitwear design process. As a
general finding, they identified the important role that previous designs and other
sources of ideas (i.e. shapes, patterns, motifs and color combinations) play in defin-
ing the context for new designs and in informing the creation of individual designs.

Co
-Desi
gn
ing
In
ter
ac
tiv
e S
pac
es.
.. 24 In the Netherlands, Bekker [1995] interviewed sixteen interface designers to
determine the type of support they need for gathering information about users and
applications in the design process. Regarding the main findings, designers requested
support tools to improve user involvement in design projects, communication and
prototyping activities. Some of the problems encountered by interface designers to
gather information from users and their tasks were: not knowing what methods to
use and the infrequent contact with users. In relation to design practice, Bekker’s
findings refer to different aspects behind the project teams such as how the teams
are configured, how team members collaborate, how information is gathered, prob-
lems encountered by the team, and the tools used along the project.
In an attempt to provide real-world supportive tools in the form-creation phase,
Kolli and Pasman did research on the designers’ work environment by conducting six
contextual inquiries with creative professionals (i.e. photographer, fashion designer,
sculptor, potter, jewelry designer and furniture designer). They summarized their
observations into general findings that are applicable to design practice in different
areas. The main areas of interest referred to the participants’ background and experi-
ence, projects and clients, methods and techniques, tools, work environment and an
ideal computerized environment. Kolli and Pasman [Kolli et al. 1993] elaborated fur-
ther on this study by conducting contextual inquiries with eight practicing industrial
designers, focusing on form creation and development in the product design process.
They clustered their observations into seven considerations for designing a com-
puter environment that supports conceptualizing. Such tools should: 1) support the
rapid and rough capturing of ideas; 2) afford a personalized environment; 3) use rich
information sources; 4) enable a high level of communicability; 5) support individu-
alistic styles; 6) afford a smooth shifting of activities; and 7) support motor skills. As
a general conclusion, they pointed out the importance of visual material and visual
ways of working in the conceptualization process, relying heavily on existing designs
as input for their idea generation. Designers collecting precedents in the form of
product samples, product catalogues, photographs or slides becomes a major activity
during the conceptual phase. Designers later process these samples into collages,
MBs or presentations [Pasman 2003].
In a follow-up of the 1993 study by Kolli et al., Keller et al. [2006] specifically
looked into the way product designers keep and use their informal collections of
visual material (i.e. advertisements, magazines, and pictures) in their design process
and to provide new media tools that support these interactions. They used cultural
probes [Gaver et al. 1999] and conducted five contextual inquiries with practicing
product designers. Most of their findings were in line with the 1993 study. The main
differences were the emergence of Internet and the divide between the digital and
physical worlds. Regarding the latter, they found out that the designers’ digital and
physical collections were hardly ever used in combination. Their results were also

Desi
gn
Pr
ac
tic
e25input for a set of six considerations for a tool to support designers in collecting
visual material, trying to focus on merging both collections in interaction and value.
The tool should: 1) support active collecting without a predefined structure, 2) merge
physical and digital collections, 3) rely on visual interaction, 4) enable serendipitous
encounters of material, 5) provide inspiration by breaking the working rhythm, and
6) support social aspects of visual material.
Probes study2.3
Problem2.3.1 Several studies of design practice have been conducted in different countries such
as Sweden [Gedenryd 1998], England [Eckert & Stacey 2000], Finland [Valtonen
2007] and Australia [Tang 2001], to name a few examples. In the Netherlands,
where this study took place, researchers have studied design practice in terms of the
creative work environment [Kolli et al. 1993] and on how designers find inspiration
[Keller 2005]. We wanted to study how Dutch designers work in order to look for
trends and identify opportunities for AR to support their work. As such, in this first
study, we needed to identify representative activities that industrial designers per-
form. Therefore, our first research question was do industrial designers see opportuni-
ties for AR to support their work, and if yes, how?
Approach2.3.2 To find answers to the previously mentioned research question, we had to enter
the design studios and study how designers work to identify activities that could
be supported by AR. We decided to use a non-intrusive method that would allow us
to obtain information from the participants while working in the real context (i.e.
their design studios). We used cultural probes [Gaver et al. 1999] to get an idea of
the details behind designers’ lives: what designers do in the design studio, their ac-
tivities, places and objects they use in the practice of industrial design (Figure 2). In
this part of the study, participants were also asked on their current use of technol-
ogy and on their familiarity with AR.
Participants2.3.3 Seventeen practicing industrial designers were initially recruited for this study.
They all agreed to participate in the study although ultimately only 10 worked on
the probes and sent them back. Three of the final participants also worked in design
research and design education. All participants had at least 2 years of experience in
design practice (9 years of experience on average). The participants varied in their
education (university, academy), age (between 24 and 50), and gender (6 male, 4
female). We obtained a wide variety of contexts, ranging from an office in a large

Co
-Desi
gn
ing
In
ter
ac
tiv
e S
pac
es.
.. 26 company, to freelance work performed at home. We also wanted to see how design-
ers work in contexts other than their offices. Therefore, we included practicing in-
dustrial designers who spent one day per week coaching industrial design students
at our university. In this way, we were able to see how designers organize their work
in two different workplaces.
Method2.3.4 The basis for this user study was the cultural probes method [Gaver et al. 1999].
Design and research practitioners have applied probes in their design processes to
find new ways of understanding user experience, allowing them to obtain a bet-
ter understanding of their users and to inspire their designs. Regarding its main
characteristics, probes: 1) are based on user participation by means of self-docu-
mentation, 2) look at the user’s personal context and perceptions, and 3) have an
exploratory character [Mattelmäki 2006]. Therefore, they are also very useful for
experience research in which possible areas for new applications of technology are
explored from a user perspective [Diederiks & Kyffin 2006].
Gaver, Dunne and Pacenti first introduced cultural probes [Gaver et al. 1999]
as a form of exploratory and design-oriented self-documentation method. Cultural
probes are collections of evocative tasks meant to elicit inspirational responses from
people – not comprehensive information about them, but fragmentary clues about
their lives and thoughts [Gaver et al. 2004]. A probe kit is given to volunteers repre-
senting the group that is being studied. The contents of the probe kit differ from one
design or research project to another. Probe kit materials are purposefully ambigu-
ous, trying to stimulate the mind of the participants and capture their experiences
while working on the probes. No hard deadlines are imposed on participants who
do these assignments in their own time and natural environment allowing them to
feel at ease and relaxed. Participants complete the materials and send them back
to researchers for interpretation. One of the advantages of working on probes over
extended periods of time (e.g. one week) is that it allows participants not only to re-
flect on the topic that is being researched but also on the answers they have provided
on the previous days [Lucero et al. 2004].
Several researchers have extended probes for different contexts and uses, such
as in technology probes [Hutchinson et al. 2003], mobile probes [Hulkko et al. 2004],
empathy probes [Mattelmäki & Battarbee 2002], photograph probes [Nieminen &
Mannonen 2005] and urban probes [Paulos & Jenkins 2005]. These variations on
probes have opened a vast space of new opportunities for design and research. These
opportunities include informing design, facilitating the process of design reflections,
and the framing of the problem solution space [Mattelmäki 2006]. However, Gaver
has identified that in the process of adapting probes, some researchers have also
appropriated the probes into a scientific process [Gaver et al. 2004]. Gaver is skepti-

Desi
gn
Pr
ac
tic
e27cal about this growing tendency to rationalize an approach that originally values
uncertainty, play, exploration, and subjective interpretation.
In an industrial context, the objective of using resources for probing is based on
the expectation of improving the solution creation and decision-making processes.
Thus, usually in design practice and in research, project leaders and managers expect
to see one ultimate and well-argued solution emerging as a result of probing. Appar-
ently, when presenting the results from probing together with the final design you
should be able to draw a straight line between them and verify the value of the re-
sources used. This expectation makes sense, since often the aim is to bring a product
proposition to the market as fast as possible. This is usually done for a defined target
market requiring only very specific user or market research.
However, if we want to embed our solutions in social and material contexts
(a design perspective) or if we want to generate more than one option for possible
applications (interaction, experience and application research) the aim is to explore
the broader context as well. In most cases a direct connection between probes results
and the final design is not evident as probes inform and influence the design process
in many different ways. Based on a study that applied probes in the context of the
bathroom for a lighting system, Lucero et al. [2007b] considered the links between
the probing results and the final design solutions and demonstrated their relation-
ships. We found that the use of probes allow designers to 1) enter an intimate space,
2) discover unexpected uses, 3) gather requirements, 4) look into participants’ lives,
5) shift focus, and 6) find inspiration for new concepts. The authors emphasize the
idea that design and research teams should not be expecting a single or ultimate re-
sult emerging from probes. Instead, probes usually provide a wide range of potential
ideas leading to other possible solutions. The final chosen solution will depend on
the skillfulness of the design team to translate the findings into a final concept.
Procedure2.3.5 Ten Dutch designers worked on the probes and took part in the study between No-
vember 2004 and June 2005. Participants worked on the probes in their design stu-
dios and homes for a period of one week. We wanted to observe industrial design
practice, not only the activities, places and objects used, but also we were interested
in more inspirational data. The probes study consisted of four parts: making the
probes, sending the probes, working with the probes, and collecting the probes.
Making the probes
We describe our probe kit using Mattelmäki’s properties of probe objects [Mat-
telmäki 2006]. First the kit contained a design-studio diary including 1) a timeline
to probe the daily thoughts and activities of our participants (Figure 3, bottom), 2)
closed questions covering different aspects of routines, collaboration, and use of

Co
-Desi
gn
ing
In
ter
ac
tiv
e S
pac
es.
.. 28
technology, 3) open questions to make people tell stories and express their opinions
(Figure 3, top-left), 4) a map to allow self-expression, and 5) a drawing exercise
(ideal design studio) to probe the dreams and aspirations of industrial designers.
In the map exercise, we first asked participants to cluster their activities, places,
and objects used for their work (Figure 3, top-right). Then we asked them to draw
a floor plan of their design studio and link their daily activities to the objects and
the places on the map. In the ideal design studio drawing exercise, we asked them to
forget about budget, organization or other restrictions and share with us what their
dream design studio would be like.
Second, the kit included a disposable camera to take a maximum of 36 pictures
to visually support some of the experiences they had while working on the probes
(Figure 2, bottom-right). We included a table in the design-studio diary where
participants kept track of their pictures. We made suggestions for shots as well as
intentionally left half of the pictures unassigned so participants could share different
aspects of their environment or activities with us. In total, participants made over
Figure 2. Aspects of the probes study
The probe kit (top-left) – Consisting of a design-studio diary with activities and a disposable camera
Probing design practice (top-right) – A designer’s workplace
Probing people’s lives (bottom-left) – The probes also allowed us to look into the designers’ lives
Probing experiences (bottom-right) – Collection of over 200 images made by 10 participants

Desi
gn
Pr
ac
tic
e29200 pictures with the disposable cameras (21 pictures per participant on average).
A considerable amount of work and resources was destined to create an inspir-
ing probe kit. The design-studio diary was designed with great care so that designers
would appreciate it was handcrafted and especially made for them. Upon receiving
the materials, designers had very positive comments and reactions. Participant SK
said, “This is so nice. It really looks and feels like a diary.” The booklet was designed to
visually stimulate writing. A handwriting-like font was used to communicate directly
to our participants’ heart and to trigger an intimate sharing of their experiences
while filling-in the diary. A blue color was used for the text to further elicit that it
was handwritten with a ballpoint pen. We were successful in conveying this aspect to
designers as two participants asked us, “Did you write this down manually?” The effort
put in designing the probes was rewarded by the participants’ dedication to work on
the probes. The content of each probe kit was packed in a brown envelope to further
elicit a down-to-earth and handcrafted feeling.
When planning the probes we also took into account the nature and context
of the work we were going to study. We especially looked into the placement of the
probes, in other words, where and how designers would most likely use them. To cre-
ate less mess on the sometimes-cluttered desks of designers, we concentrated most
probe materials into one booklet.
Sending the probes
To increase motivation, all participants were given the probe kit (Figure 2, top-left)
during a personal meeting. For five participants this meeting took place in their
design studio. The remaining five participants received the probe kit during the
kick-off meeting of Young Designers in Industry (YD+I) that took place in February
2005 in Amsterdam. YD+I is a foundation where industry and public institutions
act as problem owners of extremely complicated social and cultural problems, that
young creative designers must tackle head on. Kees Dorst, one of the organizers of
YD+I, was our contact and gave the probe kit to the participants.
All participants signed a consent form in which their anonymity was guaranteed
and allowing us to use their comments and suggestions for research purposes.
Working with the probes
Participants worked with the probes for seven consecutive days in their design
studios and they could freely choose the starting day of the week. The materials
included in the kit probed different aspects of the life (Figure 2, bottom-left) and
practice (Figure 2, top-right) of an industrial designer.

Co
-Desi
gn
ing
In
ter
ac
tiv
e S
pac
es.
.. 30
Figure 3. The design-studio diary
Closed and open questions (top-left) – Covering aspects of their activities and leaving room to express their
opinions
Clustering (top-right) – Participants grouped their main activities according to suggested categories. The bot-
tom two categories were intentionally left blank for them to complete the diagram
One-day timeline (bottom)– Designers shared their daily thoughts and activities by filling-in seven timelines.
The left part corresponds to the morning and the right to the afternoon. Tabs were created to help participants
find the current day of the week

Desi
gn
Pr
ac
tic
e31Collecting the probes
For the first five participants, we picked up the probe kits in their design studios
after one week. The other five YD+I participants sent their probes by mail in the
self-addressed and stamped envelopes we included in the kit.
Interpretation2.3.6 Once the probes kits were collected, the data was processed for interpretation. The
data from the diaries for all participants was transcribed and comments were num-
ber and color-coded for each participant. Tables with the participants’ entries were
created as a way to have a clear overview of the rich data that had been collected.
The pictures from the disposable cameras were developed and scanned as they
provided information on the written content of the probes. Two researchers (Selene
Mota and the author) went through the data and derived categories from the users’
data. General findings were formulated and presented back to the participants for
discussion during an interview to check the reliability of the interpretation.
Checking the interpretation2.3.7 Participants were invited for probing interviews [Mattelmäki 2006] to check the
interpretation made by the researchers. These personal interviews were held as
part of larger workshops that were organized to introduce the participants to AR
technologies in our research lab. Unfortunately, only four of our original probes
study participants were able to attend the workshops. We decided to present our
general findings anyway to the remaining six participants by means of visuals for
discussion, as they were also industrial designers and thus familiar with the topics
that were presented. The workshops are explained in greater detail in the next sec-
tion (2.4).
Findings2.3.8 In general, our findings are connected to the early stages of the design process. As
such, our main findings can be divided into 1) supporting flexibility in creation, 2)
finding inspiration, and 3) mood boarding.
Supporting flexibility in creation
As industrial designers reach the late stages of the design process, they require a
higher level of detail and control over their work, relying heavily on their comput-
ers. However, during the early stages of the design process, designers need tools
that allow more flexibility, especially during the creation phase. Most activities
mentioned in the diary in relation to this creation phase (i.e. designing, thinking,
creating MBs, contemplating, inspiration, sketching, brainstorm and discussing) do
not require a computer. Workshop participant ER said “the design process starts with
the generation of ideas which is done away from the computer.” JJR added, “people are

Co
-Desi
gn
ing
In
ter
ac
tiv
e S
pac
es.
.. 32
making a strong link between designers and computers; however, twenty years ago we did
not have computers to design. Computers should be mainly for visualization, presentation
and communication. The designer-creator does not work in front of the computer.”
Designers stressed the importance of working with their hands in the early
stages of the design process. In the creation phase, designers prefer the naturalness
of using pencils and paper. Designers keep a sketchbook at hand to make notes and
bring their ideas to life (Figure 4, top). Participant FV told us just how important
sketchbooks are to him: “I make a sketchbook with everything in it where I draw and
paste stuff. For important projects I keep a special (dedicated) sketchbook.” Although not
all designers keep a sketchbook, participant MM explicitly mentioned he missed the
feeling and the pleasure of using pen and paper to shape his ideas: “Pens and pencils
are the most important objects for me although I use them so rarely now to design (due to
time constraints), but it is the nicest thing to do.” Participant SK told us why she prefers
using her hands over computers for creation: “Whenever I am molding or looking for
new shapes, I know I can easily change colors and rotate the models on the computer but
you miss the feeling (of rotation) with the mouse.” She wanted to have the feeling that
she was molding with real paper.
Figure 4. Flexibility in creation
Sketchbooks (top) – The most important objects for two participants: their pencils and sketchbooks
Flexibleusesofofficespace (bottom) – Using the floor to conduct a brainstorm session and designing at an
elevated table in a standing position

Desi
gn
Pr
ac
tic
e33The relationship between designers and their use of technology is a special one.
They all accept technology, have incorporated it in their lives, and feel they can man-
age with it. Most designers use a computer both at home and at work, have a mobile
phone, and some own a personal digital assistant (PDA). In spite of this, designers
see technology as a means, something necessary for their work, but not as a goal.
Designers especially show some concerns regarding the role that computers play
in their creative process. Designers feel that computers may be taking away part of
their creativity especially in the early stages of the design process as can be told from
this comment from participant MM: “I don’t want to get too close into computers as
they might interfere with the creative design process.” As we see, although in most cases
designers see technology as something necessary, useful, and essential for their
work, designers will use technology only if it matches the way they like to work.
Technology should adapt to them, not the opposite. This comment written by AG in
her diary tells us they will accept technology only if they feel comfortable with it: “I
never thought that I would use computers when I first tried a PC with DOS. It was so un-
natural that I hated it. Now I love my computer. It helps me solve my greatest annoyance:
the untidiness of my drawings.”
Designers use their work environment in flexible ways (Figure 4, bottom).
They may have vertical separation panels to which they attach images or sketches.
Depending on the environment, designers may use a meeting table not only to hold
internal and external meetings, but also to serve on occasions as a place for creativ-
ity or to have lunch. For designers who perform freelance work at home their dinner
table may become the meeting table. Kitchens, coffee corners and a bar inside the
design studio were mentioned as important places to have a break, to socialize, for
relaxation, and have ad hoc meetings. This flexible use of space should also be encour-
aged when supporting the work of designers with new technologies.
Designers do not want to be tied to their computers. They requested flexibility
to design outside the office, to work outdoors in the sunshine, to take their laptops
to the forest. As participant SK nicely put it: “I search for ways to work that do not drag
me to my computer time and time again.” Allowing for this type of flexibility in relation
to the environment when designers are engaged in creating should be encouraged.
Two ideas emerged from the ideal design studio activity. In the first one (Figure
5, left), participant SK proposes an open space where technology (camera, writing
pad, projector, modeling programs) is integrated in the walls, floor and ceiling so
designers can create impulsively with different tools, having both freedom of move-
ment and space at the same time. Quick physical models can be made on a small
toolbox or table. In this idea there are no traditional desks or desktop computers
allowing designers to create on a larger scale making use of the full space. SK told us:
“Design through movement supports an energetic way of working, away from the world of
(desktop) computers.” In the second idea and in relation to using their work environ-

Co
-Desi
gn
ing
In
ter
ac
tiv
e S
pac
es.
.. 34
ment in flexible ways (Figure 5, right), participant SM proposes the messy desk. In
this example, the designer manages and has an overview of his projects by having
two separate desks: a clean desk to work on and a messy one to keep an overview of
his projects, something like a to-do list. Participant SM described it in this way: “A
desk to store ‘work in progress’ is as important to me as a (second) clean desk to work on.
The ‘work in progress’ desk serves as a dustbin and a physical overview of my to-do list. It
helps me to keep overview of eight to fifteen different projects simultaneously.” By keeping
messy stacks on his desk, he knows exactly what has to be done in each single proj-
ect. This proposal raises some questions: how would designers manage and keep such
an overview of their projects in an augmented desk? Would this be an opportunity to
easily carry their virtual mess from one place to another?
Finding inspiration
Finding inspiration is another important factor for designers and they have dif-
ferent ways to achieve this. In their diaries, participants were asked to group their
activities according to categories that were either predefined (i.e. creation, organiza-
tion, production) or two categories that were left blank on purpose. While some par-
ticipants included the act of finding inspiration as part of the creation category, for
others inspiration was such an important activity for their work that they labeled
one of the blank categories with it.
Most participants reported that finding inspiration was very much related to
forgetting about work for a while and being able to approach design problems from
a different perspective with a fresh mind. Participant JJR said, “Inspiration is related
to a state of mind which can be achieved in different ways.” Designers have their own
special ways of being inspired. For some, inspiration may come from browsing maga-
zines, reading books, surfing the Internet or visiting fairs (Figure 6, top). For others
it may be connected to meeting or observing interesting people. ER mentioned, “You
Figure5.Ideasonsupportingflexibilityincreationfromthediaries
An open room (left) – Using the full available space in the design studio to freely create
The messy desk (right) – A visual reminder of ongoing projects

Desi
gn
Pr
ac
tic
e35can talk to people who inspire you.” AVS added, “(You can find inspiration) listening to real
people discussing their problems on the train or tram.” Having short breaks to perform
physical activities both inside and outside the design studio is one of the strate-
gies used by designers to find inspiration. Inside the studio, designers mentioned
a pinball machine, a darts board and a painting corner as examples of physical
activities for inspiration. Outside the office, designers find inspiration by thinking
about a project while walking in the park, walking their dog, riding their bike, doing
shopping, or going swimming. Participant FV told us, “I go out cycling to break away
from my strict thinking pattern.” SK mentioned that, “you can go out for a walk, going for
action.” AO pointed out that she would find inspiration while “summarizing the day on
the way home by bike and/or train.” Participant JJR’s diary revealed he had two short
breaks playing football first indoor and then outside on a same given day (Figure 6,
bottom). The point is that all these activities were performed during working hours.
Designers either choose to think about a project from a different perspective while
performing these activities or rather prefer to clear their mind and come back to the
problem at the office.
Designers traditionally arrange their studios in ways that inspire them. They put
up boards on the wall to stick inspiring pictures and printouts from projects. They
also have bookcases where they keep their magazines and store books. Participant
JM asserted, “Sometimes things on the wall, or little sketches left behind by others can be
a source of inspiration” (Figure 6, middle-right). Designers also mentioned the impor-
tance of having a special place within the studio where they are able to relax, maybe
even meditate inside their workplace. For designers who work at home, their place to
think about a given idea could be their living room or, as participant EP mentioned,
“laying in bed with my notebook to think and write down a project” (Figure 6, middle-
left). In some design studios, designers have a dedicated inspiration corner where
they can disconnect from work.
As was previously mentioned, some twenty years ago in old practice designers
spent most of the time designing standing up in front of their drawing boards. This
configuration was much better suited for having ad hoc discussions, presenting and
sharing ideas to others, which encouraged physically moving around the studio.
Managers knew exactly when it was a good time to approach a designer based on the
designer’s location within the design studio or the position of their drawing board
(e.g. horizontal for work, vertical for presentation).
Another key aspect for designers to create an inspiring atmosphere inside the
design studio relates to observing the outside world. Designers want to be able to
have a clear view to observe and be in close contact with nature. Emphasizing the
importance of nature for designers, participant SM pointed out, “I use my laptop
virtually everywhere including the nearby forest.”

Co
-Desi
gn
ing
In
ter
ac
tiv
e S
pac
es.
.. 36
Figure 6. Finding inspiration
Traditional sources of inspiration (top) A corner with books, magazines and materials, and bookcases with
magazines and books. MF says, “I like my books very much for motivation and inspiration.”
Inspirational place (middle-left) – Laying in bed as a way to think differently about a design problem
Inspiring environment (middle-right) – Posters, sketches, and snippets left behind by colleagues can also inspire
Inspiration through physical activity (bottom) – Having a short break to play football indoors and outdoors
In relation to finding inspiration, two ideas were mentioned in the ideal design
studio activity. The podium (Figure 7, left) was described by participant JJR as “an
elevated platform close to a very well lit area with large windows where we (designers) can
sit in an informal way. It has a different energy field.” Physically walking to the podium
makes designers go away from their computers, take a step back and reflect on what

Desi
gn
Pr
ac
tic
e37
they are doing. In this studio the podium is used as a place where industrial design-
ers meet to brainstorm. Having a special place that designers have to walk to in order
to start brainstorming or design is a potential interesting idea to stimulate physical
activity. For the second idea, participant SL proposes reusing an ancient greenhouse
by a park where several designers have their own space or box (box within a box
concept) to work in and store things (Figure 7, right). The main ideas behind this
proposal are the proximity of natural scenery and sharing the greenhouse with
other designers, artists and professionals related to the world of design in a modular
system. Its creator said, “Currently I am literally trying to create with the city council a
greenhouse in a park as my own design studio to stress the relation with nature that I have
as a designer.”
Mood boarding
Most designers mentioned MBs as an important activity for their work. One
designer described herself as a MB designer and kept special magazines to use for
her MBs (Figure 8). Participant AVS summarized what MBs represent for designers:
“it is a representation of a feeling or direction you want to go. It is not hard words about
what you will do, it is emotional, a softer way of giving directions to your design, with
reference points, sometimes colors or shapes. You can later verify whether what you are
doing matches the mood you created in the beginning.” Regarding why designers use
MBs SM said, “whenever you want to share your ideas about a project, it makes it easier
to express your feelings and see what the client’s feelings are.” FV told us that by mak-
ing MBs “it makes clients feel that you are producing already.” Participant ER added,
“Clients love them because they can already visualize what you are doing.”
Figure7.Ideasonfindinginspirationfromthediaries
The podium (left) – Going to this elevated platform makes designers leave their computers. It is a special place
with a “special energy field” to start creating
Natural spaces (right) – Having a greenhouse as a design studio to be in close contact with nature, be able to
design in the forest and collaborate with colleagues from different disciplines

Co
-Desi
gn
ing
In
ter
ac
tiv
e S
pac
es.
.. 38 Designers make traditional (physical) MBs with images from magazines as well
as digital MBs in Photoshop®. They start creating them by looking for images on the
Internet, mainly on Getty Images or Google. Other designers said they used personal
pictures made on their digital cameras or added some abstract drawings for the back-
ground. Regarding the abstraction level of the elements that go in a MB, participant
FV said “images should be abstract because otherwise clients get sucked in by the images
and the idea could become too final.”
Conclusions2.3.9 From our probes study, we have identified a set of important ideas or possible direc-
tions for supporting the work of industrial designers with AR.
Supporting flexibility in creation
Introducing technology to support creativity in the early stages of the design pro-
cess should take into account several factors. First, working with their hands is very
important to designers, especially in the early stages of the design process. As such
they do not want to lose this basic, simple and natural tool as the main source of
input for these types of activities. Second, designers see technology as a means, not
as a goal. Work related to creation in the early stages of the design process is mostly
performed away from the computer. When creating, designers prefer more flexible
and intuitive ways of interaction, such as the use of pen and paper. Third, designers
need tools that provide flexibility while creating and this includes their workspaces.
Designers explicitly requested more freedom to decide how and where they work.
They do not want to be constantly tied to computers or physical spaces.
Finding inspiration
Finding inspiration is an important aspect for designers. Designers have different
ways of finding inspiration, which is very much related to forgetting about work
for a while and being able to approach design problems from a different perspective
with a fresh mind. Having short breaks to perform physical activities both inside
and outside the design studio is one of the strategies used by designers to find in-
spiration (e.g. playing darts or football at the office, taking a bicycle ride in town, or
walking the dog). Their design studios are also arranged in ways that inspire them
with special places to stick images on the wall, keep their collections of magazines,
or just to relax for a while. Having a view on the outside world to observe people
and life also creates a nice atmosphere in the design studio.
Mood boarding
The creation of MBs was an unexpected or surprising finding from this study.
Surprising because being a trained graphic designer I only became aware of the

Desi
gn
Pr
ac
tic
e39
existence of MBs when I arrived in the Netherlands. The fact that designers in our
study mentioned it as an important activity for their work only increased my curi-
osity. Our industrial design students at the TU/e were using MBs but there was no
formal course or expert to consult on the topic. Mood boarding was something that
students simply have to do. I was curious at this point how our participants were
taught mood boarding in their universities or academies.
We made an initial assessment of the previously mentioned three possible direc-
tions for AR to support the work of designers, including some of the specific ideas
(i.e. open room, podium, messy desk, natural spaces, having short fun breaks). All
these alternatives were carefully considered and analyzed first with respect to the
importance for the design process or that designers regard them as potentially inter-
esting because they help avoid current problems or create new opportunities. Other
aspects considered at this stage were connected to which areas, topics or activities
have not been explored closely up to now. For example the creation of MBs seemed
to be an important activity for designers that had not been sufficiently studied, thus
increasing the likelihood of leading to publications. We also considered the techni-
cal and theoretical expertise needed to bring some of these ideas to life. Finally, we
analyzed these ideas with respect to the areas of research that they covered (e.g.
tangible, tabletop or gestural interaction).
At this point in my research, mood boarding seemed like a good activity to
support with AR. Somehow MBs summarized most of the findings from the probes
study. MBs are mostly created in the early stages of the design process, specifically
in the creation phase, and respond to the need of designers to create away from the
computer. MBs provide a similar type of flexibility for designers at this stage of the
design process as pen and paper. MBs are also connected to the physicality men-
tioned by our participants for inspiration. For example, mood boarding away from
Figure 8. Mood boarding
Magazines to make MBs – Designers keeping a special box with magazines for making MBs with them, and
bookshelves filled with magazines

Co
-Desi
gn
ing
In
ter
ac
tiv
e S
pac
es.
.. 40 the computer bares some similarities with the painting corner mentioned by one
designer as a special place for inspiration. Using their bodies to physically walk to a
corner and start using their body in a more active fashion than while seated behind
the computer is something that both painting and mood boarding share.
Workshops2.4
Problem2.4.1 Our first research question was do industrial designers see opportunities for AR to
support their work, and if yes, how? We took the first step to answer this research
question by conducting a probes study in which we identified a set of representative
activities and ideas that could potentially support design practice. First, we needed
to check the reliability of our interpretation by discussing in more detail the general
findings of the probes study with our participants. Second, we wanted to involve
designers in helping us decide which of the previously identified activities and ideas
had a better potential for support in AR. However, just like any other professional
user, industrial designers were not familiar at the time with what AR exactly was.
Therefore, third, we needed to give them some examples of what AR is before we
could finish answering our first research question. The main research question for
the second study was which of the activities or ideas identified in the first user study
could potentially be supported with AR? and more specifically, should mood boarding be
supported by AR?
Approach2.4.2 To find answers to the previously described questions, we invited designers to par-
ticipate in interactive workshops in our research lab at the Eindhoven University of
Technology, the Netherlands. These workshops would allow us to further empathize
with our participants by first discussing our findings from the probes study with
them, by giving them a presentation on what AR actually is, and by sharing and
letting them experience some of the work done in our lab. These activities would
ultimately stimulate the participants’ imagination in a brainstorming session where
new, creative, and unexpected applications of AR for industrial design practice
would be discussed.
Participants2.4.3 Originally, we intended to have the same 10 participants from our probes study
participating in the workshops. For different reasons, only four of them were able
to attend the workshops. We invited six new participants who agreed to take part in
the workshops. They were all practicing industrial designers. One of them worked
in design research and design education. All participants had at least 2 years

Desi
gn
Pr
ac
tic
e41
experience in design practice (5 years of experience on average). The workshop
participants varied in their education (university, academy), size of the agency they
worked for (from one-man freelance designer to a design department of a large
department store), age (between 24 and 31), and gender (7 male, 3 female).
Procedure2.4.4 Ten workshop sessions were carried out between August 3 and September 22, 2005
at the Eindhoven University of Technology (TU/e). Each workshop session was
planned for two hours. The workshops consisted of four parts: 1) presentation on
AR (20 min.), 2) probing interviews (20 min.), 3) experiencing an AR system (60
min.), and 4) brainstorming session (20 min.).
Presentation on AR (20 min.)
To introduce the main topic of the workshop we showed our participants a 20-min-
ute PowerPoint presentation on AR. The presentation also gave us the opportunity
Figure 9. Workshop participants creating a MB using an AR system
The user experience (top-left) – Vertical screen for Internet browsing plus horizontal workspace for building the MB
Horizontal workspace (top-right) – Digital pen and cards with reflective material to interact with the system
Vertical screen (bottom-left) – Using mouse and keyboard input to browse images on the Internet
Interacting with the digital pen and card (bottom-right) – Digital pen and card with reflective material

Co
-Desi
gn
ing
In
ter
ac
tiv
e S
pac
es.
.. 42
to explain to our new participants the purpose of our research, say something about
the previous probes study, and why we were organizing these workshops. The topics
covered in the presentation included display technologies, interaction techniques,
commercial applications, and application domains. Participants were shown repre-
sentative examples of state-of-the-art along the mixed reality continuum [Milgram
& Kishino 1994]. The videos shown were The Invisible Train [Wagner et al. 2005],
Kick Ass Kung-Fu [Hämäläinen et al. 2005], Thumbs Up [Piekarski 2004], and the
I/O brush [Ryokai et al. 2005].
First, The Invisible Train [Wagner et al. 2005] (Figure 10, top-left) was present-
ed as an example of handheld display technology. Using a personal digital assistant
(PDA), four users simultaneously play a cooperative game where the main task is to
steer virtual trains over a real wooden miniature railroad track while keeping them
from colliding. This was a good example of a simple and intuitive interface for an
AR game. Second, Kick Ass Kung-Fu [Hämäläinen et al. 2005] (Figure 10, top-right)
was presented as an example of projection display technology. In this martial arts
Figure 10. Examples of state-of-the-art AR systems shown to our participants during the workshops
The invisible train (top-left) – Magic lens metaphor using a handheld display, camera and markers
Kick Ass Kung-Fu (top-right) – Full-body interaction using computer vision and projection displays
Thumbs Up (bottom-left) – Head-mounted display and glove-based interaction for outdoor systems
The I/O Brush (bottom-right) – AR tool that allows painting with real-world elements on a digital canvas

Desi
gn
Pr
ac
tic
e43game installation, players fight virtual enemies. The players are captured perform-
ing kicks and punches in the real world and are embedded by the system into the
gaming environment. The result is projected on two large displays. This was a good
example of full-body interaction for a gaming system. Third, Thumbs Up [Piekarski
2004] (Figure 10, bottom-left) was presented as an example of a glove-based user
interaction technique for mobile and outdoor systems as well as an example of using
head mounted displays. In this system created to support architectural design, users
can place virtual objects in the real world, interacting by means of pinch gloves. The
Thumbs Up video nicely illustrates the pinch glove interaction technique as well as
some of the possibilities for mobile AR systems. However, this video is also an ex-
ample of bad user interface design in terms of overloading the display with unneces-
sary data (e.g. frames per second, coordinates in degrees, minutes and seconds, etc.).
Finally, the I/O Brush [Ryokai et al. 2005] (Figure 10, bottom-right) was presented
as an example of AR applied to arts and design, and thus was the closest example to
the domain of industrial designers. The I/O Brush allows artists to create visual art
projects extracting elements from the real world. By using the brush artists are able
to capture color, texture, and moving patterns using a very simple interaction tech-
nique and interface. To capture or collect visual information, users press a button on
the brush that triggers a small camera. The captured elements can now be used on a
digital canvas to paint with them. The I/O Brush was also the closest to our beliefs in
terms of supporting the work of designers with AR by providing a simple interaction
and interface.
Probing interviews (20 min.)
After the presentation, we engaged with our participants in probing interviews
[Mattelmäki 2005], which lasted twenty minutes. In these interviews, we discussed
specific aspects of their probe materials and then checked the interpretation of
the main findings from the probes study, looking for further design opportunities.
Together with the participants, we went through their respective pictures and tran-
scripts. We were both trying to clarify any doubts left on what they had shared with
us, and trying to further discuss ideas we had identified as potentially interesting.
Later on, we discussed our general findings from the probes study, namely, 1) sup-
porting flexibility in creation, 2) finding inspiration, and 3) mood boarding.
Experiencing an AR system (60 min.)
In the following hour, we invited participants to have a first-hand experience with
an AR system: the Electronic Paper [Aliakseyeu et al. 2006] (Figure 9, top-left).
This prototype was originally targeted at the early stages of architectural design,
integrating traditional pen and paper with computer functionalities (such as for
creating, handling, storing and retrieving images and sketches), making it suffi-
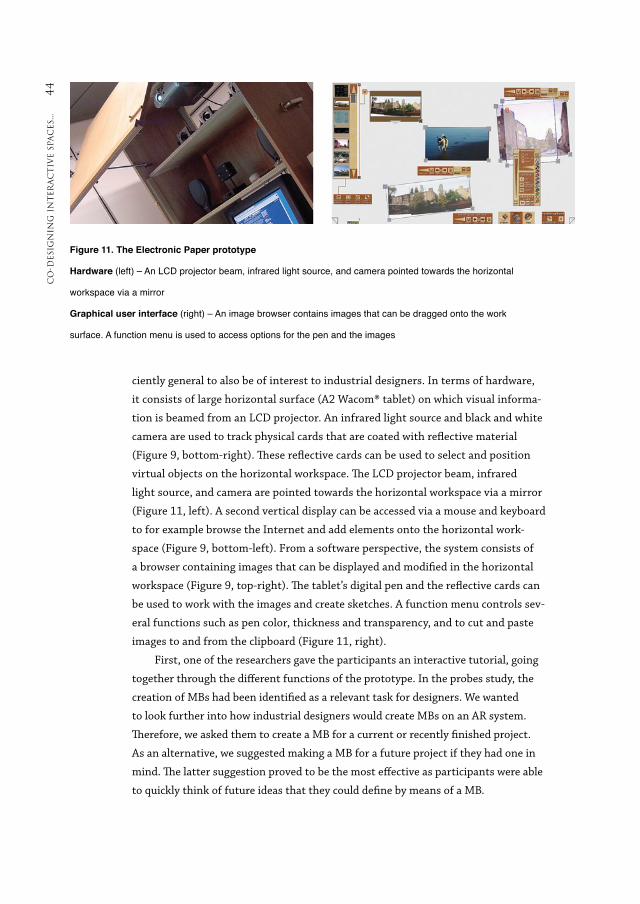
Co
-Desi
gn
ing
In
ter
ac
tiv
e S
pac
es.
.. 44
ciently general to also be of interest to industrial designers. In terms of hardware,
it consists of large horizontal surface (A2 Wacom® tablet) on which visual informa-
tion is beamed from an LCD projector. An infrared light source and black and white
camera are used to track physical cards that are coated with reflective material
(Figure 9, bottom-right). These reflective cards can be used to select and position
virtual objects on the horizontal workspace. The LCD projector beam, infrared
light source, and camera are pointed towards the horizontal workspace via a mirror
(Figure 11, left). A second vertical display can be accessed via a mouse and keyboard
to for example browse the Internet and add elements onto the horizontal work-
space (Figure 9, bottom-left). From a software perspective, the system consists of
a browser containing images that can be displayed and modified in the horizontal
workspace (Figure 9, top-right). The tablet’s digital pen and the reflective cards can
be used to work with the images and create sketches. A function menu controls sev-
eral functions such as pen color, thickness and transparency, and to cut and paste
images to and from the clipboard (Figure 11, right).
First, one of the researchers gave the participants an interactive tutorial, going
together through the different functions of the prototype. In the probes study, the
creation of MBs had been identified as a relevant task for designers. We wanted
to look further into how industrial designers would create MBs on an AR system.
Therefore, we asked them to create a MB for a current or recently finished project.
As an alternative, we suggested making a MB for a future project if they had one in
mind. The latter suggestion proved to be the most effective as participants were able
to quickly think of future ideas that they could define by means of a MB.
Figure 11. The Electronic Paper prototype
Hardware (left) – An LCD projector beam, infrared light source, and camera pointed towards the horizontal
workspace via a mirror
Graphical user interface (right) – An image browser contains images that can be dragged onto the work
surface. A function menu is used to access options for the pen and the images
Desi
gn
Pr
ac
tic
e45Brainstorming session (20 min.)
In the last twenty minutes of the workshop we had a short brainstorming session
with our participants, summarizing the different topics covered during the work-
shop (i.e. AR, cultural probes, the electronic paper prototype, and MBs).
We started off by asking them about their experiences while creating a MB using
the AR system. We wanted to have a conversation on possible uses for a similar tech-
nology for their work instead of seeking for improvements to the already existing
prototype. We ultimately wanted to steer the conversation in the direction of coming
up with other ways of using AR to support their work. In that sense, the videos and
prototypes shown during the workshop served as a warm-up activity and opened the
participants’ mind. We wanted participants to hopefully come up with novel applica-
tions of these technologies to support design practice.
Findings2.4.5
Probing interviews
The results from the probing interviews confirmed our previous findings related to
the early stages of the design process (i.e. supporting flexibility in creation, finding
inspiration, and mood boarding). Some comments mentioned by workshop partici-
pants during the probing interviews have already been included to support some of
our findings of the probes study (section 2.3.8).
Augmenting MBs
Regarding our main research question for this second study, designers confirmed to
us that, of all the activities identified in the probes study, the creation of MBs was
the best candidate to provide support for with AR. By experiencing the Electronic
Paper prototype designers were able to see the potential of augmenting MBs.
Designers reflected on some of the advantages of mixing aspects from tradition-
al and digital MBs by bringing the best of both worlds. Bringing MBs closer to the
digital world would allow making them in a faster and cheaper way. Designers could
easily change the final appearance of the MB, adding and removing materials with-
out having to compromise for a final layout as gluing would no longer be necessary.
As a result, MBs would no longer feel so final. As SK pointed out, “Making digital and
AR MBs would be faster than making them in paper because then I have to think carefully
about what I want to do because if I make a mistake, I cannot go back.” This comment
also brings us to another advantage of moving towards the digital world, which is
having the possibility to easily undo your actions.
An AR tool could also support working with images. For instance, a tool could
allow importing both images from physical magazines (scanning) and from the
Internet in a fast and simple way. Participant MK said, “with a quick scan, where you

Co
-Desi
gn
ing
In
ter
ac
tiv
e S
pac
es.
.. 46 can take something you like from a catalogue and add it to the system, like the I/O brush.”
Participant EB expressed his frustration with the way the current Electronic Paper
prototype supports importing images from the Internet which should be achieved in
a faster and more intuitive way: “I would like to drag an image with my finger from the
vertical screen into the horizontal system instead of doing copy on one screen, paste on an-
other screen, and using a mouse. ‘I want that image, here.’” Breaking the divide between
physical and digital collections and images is something that Cabinet [Keller 2005]
has already successfully achieved. Besides scanning, designers thought the possibili-
ty of easily scaling images up and down (also in proportion) as a potential advantage.
A tool could also allow designers to move and rotate pictures by providing direct
manipulation of images with their hands, instead of requiring the use of a keyboard
and mouse. The Electronic Paper prototype supports such a manipulation of images
by using physical cards on which virtual images are projected. Designers can freely
move the images by handling these cards, thus creating an interaction environment
where the action and perception space match. Where you act is where you see. MK
reflected: “I see the potential, I like very much the idea of interaction in the same place
that I am seeing. I would prefer making a MB on this system because I can work (manipu-
late images) directly on it.” AO pointed out “I like the idea of moving images with your
hands.” EB added “this system is better than making it on a computer with a mouse and
keyboard. It is an improvement.” Finally SM mentioned, “You have a one-to-one feeling
of what the result will be. It’s like an artist (painter), you can view the result.” Designers
also mentioned having some quick and expressive way of cropping images or cutting
them in a given shape to remove its background as an important feature for AR MBs.
Finally, designers also mentioned as an advantage adding audio and video
to better convey moods and feelings. Participant EB told us “Audio would be great
because audio will enhance the feeling you are trying to convey. I see it as adding loops, no
editing.”
Rough and sketchy
With a large amount of features, current computer programs offer the type of preci-
sion that is better suited for the later stages of the design process. In order to use
these programs, designers must be very precise in their actions. On the other hand,
the creation of MBs is not such a detailed activity and therefore a rough and sketchy
way of creating them should be provided. Interactions that require designers to be
very precise and aware of their actions would take away the kind of intuitiveness
needed to support the designer’s creative impulses.
Designers liked the fact that the Electronic Paper prototype provides a rough
and sketchy mode to make MBs. However, the optical tracking when manipulating
images would sometimes be too sensitive, forcing designers to be very precise and
aware of what they were doing. This type of interaction resulted in losing some of the

Desi
gn
Pr
ac
tic
e47
freedom and sketchiness required to make MBs. SK tried to put it in other words by
saying “when I have scissors, I want to be able to make a detailed cut which requires more
attention because I want it that way and not because the scissor is asking me to be always
careful.”
Don’t kill the illusion
Designers also asked us not to kill the illusion, meaning that it is very natural for
them to become involved in the experience of manipulating digital images. Howev-
er, whenever external physical interaction elements such as a keyboard or a mouse
are brought into the interaction environment (as is the case on the Electronic Paper
prototype), the illusion is broken (Figure 12). Participant EB said, “Sometimes I am
taken away from the system. The mouse and keyboard take me away from the world. I
would like to be in one tool (now it feels like two separate ones).” Participant AVS added,
“It is irritating to switch between the tablet, the keyboard and the mouse. That is why
I don’t use tablets: you either do everything with tablets or else, not.” SK told us, “To
use the button on the digital pen is not intuitive as it makes me stop and think. I have
to remember how to do it.” The interruption or distraction made by these external
elements diverts attention and thus works as a major inhibitor to the immersive
experience.
An undo function, which is typical of the digital world, could also potentially
break the illusion. In situations where direct manipulation of elements is supported,
having an undo function that results in moving an image that is being currently
manipulated by the designer could create an unexpected or unwanted effect. Undo is
already supported with physical interaction by the fact that you can physically take
the image back to the previous position.
Figure 12. Don’t kill the illusion
Keyboard and mouse – After experiencing the naturalness of handling images using the reflective cards, partici-
pants reported bringing a keyboard and mouse breaks the illusion of the experience

Co
-Desi
gn
ing
In
ter
ac
tiv
e S
pac
es.
.. 48 Working with two hands
Designers prefer working with their hands. There are three main aspects behind
this concept of working with two hands: both hands collaborating simultaneously,
both hands directly interacting with digital elements, and tactile feedback to ‘feel’
the digital elements.
Designers said the concept of being able to use both hands to interact with
the system was very interesting and should be encouraged. Participant SK said “I
like shifting and turning (images) with my non-dominant hand, where both hands help
each other. I liked that one hand was doing different things, like with a knife and fork.”
Participant EB added, “Using the card in the left hand while holding the pen with your
right hand is nice so you work with two hands simultaneously” (Figure 13, left). On the
current Electronic Paper prototype, working with two hands in collaboration is pos-
sible but designers tend to do one thing at a time, namely, sketching and arranging
images as separate sequential actions.
Second, designers elaborated on the two-handed interaction concept by request-
ing direct interaction with their hands. Designers said they prefer not having inter-
mediaries in the interaction so whenever working with their bare hands is possible it
should be supported. For example in the current system, designers thought the pen
was an unnecessary intermediary to allow them to move and rotate images. ER said,
“Why can’t I just click and draw with my fingers? It could work very nicely.” EB told us “I
want to be able to move pictures with my hands and not with a tool (card or pen). Maybe
gesture interaction could solve that.” Whenever working with their bare hands is not
possible small, simple, and easy-to-handle elements such as the current cards should
be encouraged.
Third, designers liked the feeling of grabbing, this is, the feeling of manipulating
digital pictures and having the tactile feeling of taking them (Figure 13, right). Par-
ticipant EB said, “I have more grip with what I am doing because I am doing things in the
real world. It is more realistic than on computers because I feel I have something under my
hands and not a virtual thing that is on a screen.” The reflective cards gave designers the
feeling of touching paper with their hands, as it was an actual card made of paper. FV
added, “I liked the feeling of grabbing, that you are making use of the full space (tablet),
that your body is connected to moving and rotating objects.” Providing this kind of tactile
feeling is an important factor for creating the sensation of grabbing for designers.
Keep it simple
The first intuitive reaction from designers when asked about how to improve the
current support given by the Electronic Paper prototype to the creation of MBs is
to start listing several functions and filters currently found on commercial graphic
software such as Photoshop® or Illustrator®. However, after giving it a second
thought, they all realized that the power of a tool that supports the creation of MBs

Desi
gn
Pr
ac
tic
e49
is based on being sketchy and rough. As MK put it, “the power is in the simplicity. The
simpler you make it, the better.” Therefore, the final message from designers when
designing an AR tool that supports the creation of MBs is: keep it simple.
Conclusions2.4.6
Augmenting MBs
During the workshops, we were able to further discuss our findings from the probes
study with our participants. Designers also had the chance to experience an AR
tool, which they used to create a MB. As a general remark, designers saw the poten-
tial of supporting the creation of MBs with AR and encouraged us to do so.
Rough and sketchy
As the creation of MBs is not such a detailed activity, designers prefer having a
rough and sketchy way of making them. Interactions that require designers to be
very precise and aware of their actions would take away the kind of intuitiveness
needed to support the designer’s creative impulses and thus should be avoided.
Don’t kill the illusion
Designers also asked us not to kill the illusion. When designing and AR tool, special
care should be taken in avoiding bringing into the environment physical (or digital)
elements that could break the illusion of the experience. For example, bringing in
the physical keyboard or mouse were both reported as illusion breakers. Simple and
realistic alternatives to address this issue might include the use of a digital key-
board instead of a physical one, deleting images by dragging them to a ‘delete zone’
on one side of the work surface instead of clicking an ‘x’ button, or using virtual
layers on top of the table instead of having tabs for different pages.
Figure 13. Working with two hands
Hands in collaboration (left) – Holding the digital pen and reflective cards in different hands to perform tasks
simultaneously
Feeling of grabbing (right) – Having a tactile feeling when manipulating digital images using reflective cards

Co
-Desi
gn
ing
In
ter
ac
tiv
e S
pac
es.
.. 50 Working with two hands
In the early stages of the design process for activities that involve creation, design-
ers prefer working with their hands. First, being able to work simultaneously and
in collaboration with both hands is something designers would like to be able to do.
As one designer put it, it is like the metaphor of a using a knife and fork: one holds
the food in place while the other cuts. Second, designers prefer not having interme-
diaries in the interaction so whenever working with their bare hands is possible it
should be supported. Third, designers liked the feeling of grabbing, this is, the feel-
ing of manipulating digital pictures and having the tactile feeling of taking them.
The reflective card created the feeling of taking paper in their hands because it was
an actual card made of paper. Providing this kind of tactile feeling is an important
factor for creating the sensation of grabbing for designers.
Keep it simple
Designers said to us that the power of a tool that supports the creation of MBs
is based on being sketchy and rough. Therefore, designers advised us to keep the
interaction simple. The power will be in its simplicity.
Student project2.5
Problem2.5.1 After identifying mood boarding as an important task for industrial designers that
could be supported with AR, there were several aspects that we wanted to explore
further. For example, we had not yet been able to observe how designers make MBs.
We also needed to really understand what are some of the difficulties and possible
opportunities of moving this task to AR. Designers make traditional MBs using
physical magazines and mounting boards and digital MBs on their computers with
images they download from the Internet. Therefore, we needed to identify what
are the main advantages that AR could bring to mood boarding with regards to effi-
ciency, effectiveness or joy of use in comparison with the traditional or digital ways
of making MBs. Although our participants were industrial design students and
not professional MB makers, we nevertheless thought they would provide us with
valuable input on how MBs could be made under these three different conditions
(i.e. traditional, digital and in AR). This third study would be our last step in trying
to define a focus for this research before doing more intensive contextual studies
with practicing designers who make MBs. The main research question for this third
study was what are the main difficulties and opportunities of moving mood boarding to
AR when compared to the traditional and digital ways of making them?
Approach2.5.2 During an eight-week project with industrial design students we observed the cre-

Desi
gn
Pr
ac
tic
e51ation of MBs in the context of a real project. The students’ task was to consider how
the creation of MBs could be better supported by AR systems. In order to achieve
this, they went through different phases. In the first four weeks, they got acquaint-
ed with the task they were supporting (i.e. mood boarding). First, they individually
explored how traditional MBs are made. Second, they created their own digital MBs
on their laptops. Third, they created a MB on an AR system using the Electronic
Paper prototype [Aliakseyeu et al. 2006]. In this way, we were hoping that students
would have a first-hand experience of the advantages and disadvantages of creat-
ing MBs with AR systems. In the final phase, students designed a new interaction
concept for creating MBs in AR from the knowledge and experience gained during
the first four weeks of the project. They worked in 6 groups, identifying uncovered
needs and translating them into a new interaction concept proposal. Each group
received guidance from a coach that was assigned to them. The coaches were either
practicing industrial designers or worked in design research and spent one day per
week in design education. Additionally, Jean-Bernard Martens had the role of being
the students’ client.
Participants2.5.3 Thirty-two first-year students from the Department of Industrial Design at the
Eindhoven University of Technology (TU/e) took part in the project. The project
was the second of two eight-week projects that students complete during their first
semester. As such, all students had previously completed at least one large project
as well as several shorter individual assignments that students take according to
their interests. The students had no previous experience with mood boarding or AR.
Education is mainly given in English with only a few assignments given in Dutch.
The students’ communication skills in English were good. As such, the language used
throughout the project was English.
Procedure2.5.4 The project was conducted over a period of eight weeks between November 10 and
December 23, 2005. The project consisted of five main parts: 1) kick-off meeting
and workshop, 2) making traditional, digital and AR MBs (weeks 1-4), 3) interim
presentation, 4) developing a concept (weeks 5-8), and 5) the final presentation.
Kick-off meeting and workshop
The project began with a kick-off meeting where students were introduced to the
main topics of the project by means of two one-hour lectures given by the author.
The main topic covered in the first lecture was the creation of MBs and included
an overview of how designers find inspiration, keep scrapbooks and folders with
images, and use these materials to create MBs [Dabner 2004]. The second lecture

Co
-Desi
gn
ing
In
ter
ac
tiv
e S
pac
es.
.. 52
consisted of an introduction to AR and was mainly based on the presentation given
to industrial designers during the workshops (see section 2.4.4). At the end of these
two lectures, students were given the project brief with an explanation of what was
expected from them during the eight-week project. During the kick-off meeting,
students were asked to begin gathering visual material (i.e. magazines and books)
and other elements that could be used in making their own MBs. Students were
asked to bring the collected materials to a workshop later that week.
The workshop itself consisted of making traditional MBs (Figure 14, top-left).
Students brought their materials together with scissors, glue and an A1 mounting
board. Students spent the entire day creating traditional MBs under the supervision
of an expert on MBs who helped them select the material and discuss the concepts
and messages they wanted to communicate with their MBs.
Figure 14. Stages of the student project “Making MBs in AR”
Traditional MBs (top-left) – Students created physical MBs using magazines and books
Digital MBs (top-right) – Students looking for images from the Internet on their laptops for their digital MBs
MBs in AR (bottom-left) – Students created their own MBs in AR using the Electronic Paper prototype
Interim presentation (bottom-right) – Groups presented the MBs made using the three different techniques

Desi
gn
Pr
ac
tic
e53Making traditional, digital and AR MBs (weeks 1-4)
The work and deliverables for each week were clearly divided. During the first week,
after the MB workshop, students individually explored how to make traditional
MBs using images from magazines and gluing them on a mounting board. In week
two, students created digital MBs by searching and downloading images from the
Internet and later assembling them using a photo-editing program (Figure 14, top-
right).
During week three, all thirty-two students spent an hour working on one of the
two running Electronic Paper prototypes to create a MB in AR (Figure 14, bottom-
left). First, students went through a 15-minute tutorial that covered the main
functionalities of the system needed to make a MB.
By the end of the third week, students had each made three MBs: one tradi-
tional, one digital and one in AR. We then asked students to fill out a questionnaire
ranking the different techniques to make MBs in order of preference.
In week four students worked individually on their new interaction concepts
and finally get together as a group to decide which concepts would be presented at
the interim presentation.
Interim presentation
At the end of the fourth week each group presented the main findings of their
research thus far (Figure 14, bottom-right). Students had been asked to thoroughly
document their individual MB making processes. One student per group guided the
audience through the different MBs each group member had individually created.
As the presenter explained what the main concepts behind the MBs were, com-
ments regarding problems or positive aspects of making MB in a specific way were
also included in the explanation. Finally, after all MBs had been presented, they in-
troduced their new ideas for what could potentially become the interaction concept
for creating MBs in AR. Students were given feedback on their ideas by all coaches.
Developing a concept (weeks 5-8)
During the final four weeks of the project, students worked in groups to develop
one of the concepts presented during the interim presentation. Their new designs
could focus on supporting mood boarding by either improving the current desktop
interaction as was used on the Electronic Paper prototype or by envisioning other
interaction techniques (e.g. full-body interaction, mobility). Whichever approach
they took, the final concept was to be presented as a 1:1 scale model. A three-min-
ute video showing the intended interaction was also part of the project deliverables.
We challenged students to think of new ways of creating MBs that could include
adding audio, video, or movement.

Co
-Desi
gn
ing
In
ter
ac
tiv
e S
pac
es.
.. 54
Final presentation
At the end of the project each of the six groups presented their final interaction
concepts for making MBs in AR. The proposals covered different aspects of making
MBs. Among the more traditional or expected ideas, four projects were focused on
navigation and interaction (Moodcube), portability and mobility (@mo), support-
ing image searches (Twigg’ it), and presentation in virtual reality (Mood-In). The
video prototypes created by two teams stood out from the rest for their valuable
contributions. First, the BlueEye system [Martens et al. 2006] (Figure 15, top) has
the ability to collect 2D and 3D objects, enrich MBs by adding movements (and
sounds), and control the system by means of hand gestures. The system bears
resemblance to the Cabinet system [Keller 2006a]. Second, the MUM (Multi-User
MB) system (Figure 15, bottom) allows people to collaboratively create MBs using
their mobile phones. First, people can collect interesting materials they see while
on the go, or request other people to make snapshots for them (e.g. if someone is
on the train). People can then meet, share their images and use their mobile phones
to manipulate the images in different ways.
Figure 15. Video prototypes of systems that support the creation of MBs in AR made by students
BlueEye (top) – Collecting and interacting with 2D and 3D objects using hand gestures
MUM (Bottom) – Collecting, sharing, and co-creating MBs using mobile phones

Desi
gn
Pr
ac
tic
e55Findings2.5.5
Traditional, digital, or AR
Table 1. Participant rankings for the overall preference of the three techniques (i.e. tradi-
tional, digital and AR ways of making MBs).
Regarding our research question, we first looked into the data from the question-
naires. Participants ranked each technique on a scale of 1 to 3 (where 1 is best and 3
is worst) based on overall preference, perceived speed, easiness, and fun. Due to the
small sample size, a series of Fisher’s exact tests was performed for the significance
of the difference in preference between techniques.
For the overall preference of the technique (Table 1), we observed that partici-
pants significantly preferred the digital way to both the traditional (p < 0.01, one-
tailed Fisher’s exact test) and the AR (p < 0.01, one-tailed Fisher’s exact test) ways of
making MBs. The digital way of making MBs was ranked first by 19 participants, the
traditional way by 8, and in AR by 5. Our results show that design students tended
to favor the digital way of making MBs over the traditional or AR ways. Why make a
mess with papers all over the place and glue things to a mounting board that after-
wards can no longer be changed? Participants were in general positive and open to
an AR tool that supports the creation of MBs. However, similarly to what workshops
participants had told us, this support should be provided in a different form than
what the Electronic Paper prototype currently gives.
Traditional Digital AR
1 8 19 5
2 15 6 11
3 9 7 16
0
5
10
15
20
25
30
Parti
cip
an
ts
Technique
Subjective Rank Preference Overall
1 2 3

Co
-Desi
gn
ing
In
ter
ac
tiv
e S
pac
es.
.. 56 Table 2. Participant rankings on the perceived speed of the three techniques (i.e. tradi-
tional, digital and AR ways of making MBs).
Regarding the speed (Table 2), we observed this time that participants signifi-
cantly preferred the AR way to both the digital (p < 0.01, one-tailed Fisher’s exact
test) and the traditional (p < 0.01, one-tailed Fisher’s exact test) ways of making
MBs. Participants also significantly preferred the digital way to the traditional way of
making MBs (p < 0.01, one-tailed Fisher’s exact test). Again design students thought
the traditional way of making MBs was the most time-consuming. Actually, 26
participants ranked it as the slowest of the techniques. Participants said it is harder
to find pictures due to the large number of magazines that they have to browse
through. Cutting images with scissors and gluing them on the mounting board were
also mentioned as reasons for slowing down the making of traditional MBs. On the
other hand, a large number of participants (24) ranked making MBs in AR as the
fastest technique. This shows that students did see a potential in making MBs faster
even than on their laptops. Some of the reasons given for this include the possibility
of working using both hands, the direct manipulation of images to rotate and move,
and the large work and display area.
Traditional Digital AR
1 0 8 24
2 6 20 6
3 26 4 2
0
5
10
15
20
25
30 P
arti
cip
an
ts
Technique
Subjective Rank Preference on Speed
1 2 3

Desi
gn
Pr
ac
tic
e57Table 3. Participant rankings on the perceived easiness of the three techniques (i.e. tradi-
tional, digital and AR ways of making MBs).
In relation to the easiness of making MBs (Table 3), we observed that par-
ticipants significantly preferred the traditional way to both the digital (p < 0.01,
one-tailed Fisher’s exact test) and AR (p < 0.05, one-tailed Fisher’s exact test) ways
of making MBs. Participants thought traditional MBs were the easiest to make as
more than half of them (18) ranked traditional MBs first. The basic set of skills and
actions needed for making MBs are actually mastered by most people already in their
infancy. Manipulating, cutting and gluing images are things that most people can
easily do without further explanation. Participants said that being able to touch and
move pictures around without any other external tools was a big advantage of tradi-
tional MBs. They also said traditional MBs become a social activity where it is easy
to discuss and share pictures with others (Figure 16, top-left). Finally, participants
said that the scale in which MBs are made gives a good overview of the materials
and MB contents (Figure 16, top-right). In contrast, we observed that participants
significantly rejected (by ranking the technique last) the digital way in comparison to
the traditional (p < 0.01, one-tailed Fisher’s exact test) and AR (p < 0.01, one-tailed
Fisher’s exact test) ways of making MBs. Twenty participants ranked digital MBs last
in terms of easiness. It takes a lot of practice to master the tools needed to make a
digital MB. Probably cutting out pictures using software is the best example of how a
simple task in everyday life can become difficult to achieve using a computer. Partici-
pants also argued that the lack of overview due to reduced screen size, and tangible
feedback were also reasons for not preferring digital MBs in terms of easiness.
Traditional Digital AR
1 18 4 10
2 7 8 17
3 7 20 5
0
5
10
15
20
25
30
Parti
cip
an
ts
Technique
Subjective Rank Preference on Easiness
1 2 3

Co
-Desi
gn
ing
In
ter
ac
tiv
e S
pac
es.
.. 58 Table 4. Participant rankings on the perceived fun of the three techniques (i.e. traditional,
digital and AR ways of making MBs).
Finally, regarding how much fun it is to make MBs using the different tech-
niques (Table 4), we observed that participants significantly preferred the AR way
to both the traditional (p < 0.01, one-tailed Fisher’s exact test) and digital (p < 0.01,
one-tailed Fisher’s exact test) ways of making MBs. Participants ranked a similar
amount of times traditional and digital MBs in first place (7 and 5 times respec-
tively), and considered MBs in AR to be the most fun by ranking it in first place
20 times. Students especially mentioned the more dynamic aspect of making MBs
instead of sitting on a chair watching a monitor as a big advantage in AR. They again
mentioned the social aspect of being able to make MBs in collaboration with other
people (Figure 16, bottom-left).
Intuitive interaction
Participants pointed out the advantages of having a direct interaction with their
hands to move and rotate images. They especially liked the fact that they could walk
up to the system and start interacting with the images with no further explanations
needed. There were no hidden functions, menus or complex actions that had to be
learned. As they were already familiar with the kind of skills needed to use the tool,
interacting with the system thus made sense to them. Design students described
the system as “quick to understand how to use it.” This simple and direct way of
interacting with a tool, without needing further explanation or getting used to it, is
what we should then aim for and what we will call intuitive interaction.
Traditional Digital AR
1 7 5 20
2 10 14 8
3 15 13 4
0
5
10
15
20
25
30 P
arti
cip
an
ts
Technique
Subjective Rank Preference on Fun
1 2 3
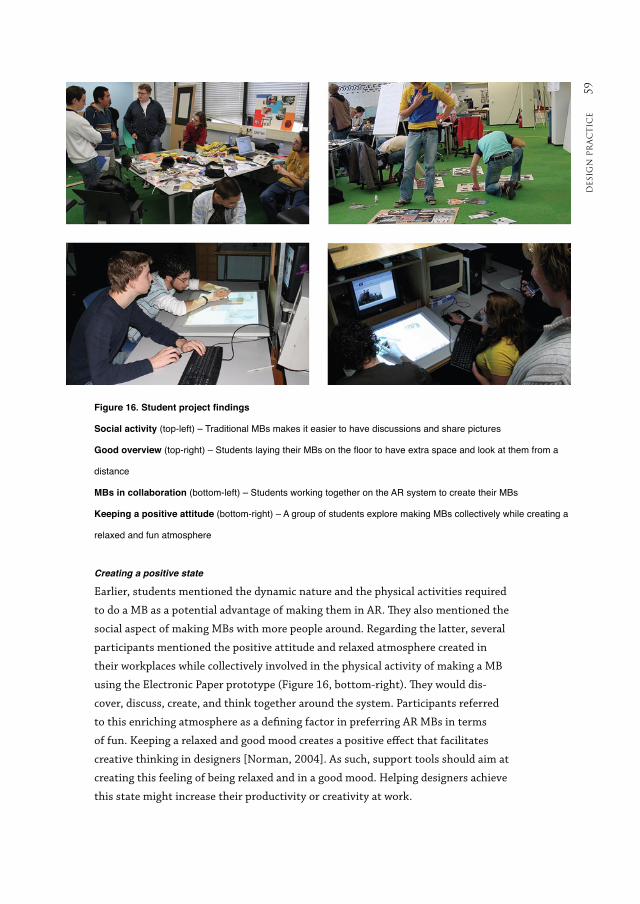
Desi
gn
Pr
ac
tic
e59
Creating a positive state
Earlier, students mentioned the dynamic nature and the physical activities required
to do a MB as a potential advantage of making them in AR. They also mentioned the
social aspect of making MBs with more people around. Regarding the latter, several
participants mentioned the positive attitude and relaxed atmosphere created in
their workplaces while collectively involved in the physical activity of making a MB
using the Electronic Paper prototype (Figure 16, bottom-right). They would dis-
cover, discuss, create, and think together around the system. Participants referred
to this enriching atmosphere as a defining factor in preferring AR MBs in terms
of fun. Keeping a relaxed and good mood creates a positive effect that facilitates
creative thinking in designers [Norman, 2004]. As such, support tools should aim at
creating this feeling of being relaxed and in a good mood. Helping designers achieve
this state might increase their productivity or creativity at work.
Figure16.Studentprojectfindings
Social activity (top-left) – Traditional MBs makes it easier to have discussions and share pictures
Good overview (top-right) – Students laying their MBs on the floor to have extra space and look at them from a
distance
MBs in collaboration (bottom-left) – Students working together on the AR system to create their MBs
Keeping a positive attitude (bottom-right) – A group of students explore making MBs collectively while creating a
relaxed and fun atmosphere

Co
-Desi
gn
ing
In
ter
ac
tiv
e S
pac
es.
.. 60 Adding more functionality
Design students requested more functionality (than what the Electronic Paper
prototype currently provides) for a tool that supports the creation of MBs. As
students interacted with the system, they showed the same intuitive reaction that
practicing designers had in the workshops, requesting several functions. Students
saw the system’s potential, which triggered a “more is better” reaction in them. They
requested to “add more functionality”, similar detailed and powerful functionality
found on commercial software such as Adobe® Photoshop® or Illustrator® (e.g.
layers, cropping, scissor-like cutting). After this initial request for more functional-
ity, workshop participants told us to “keep it simple” as the creation of MBs is based
on being sketchy and rough. In contrast, students did not reach this stage in their
reflection and insisted on having “a larger amount of editing possibilities.”
Conclusions2.5.6 In the student project, we were able to observe 32 design students making MBs the
traditional, digital and AR ways. It also allowed us to understand what are some of
the difficulties and possible opportunities of moving this task to AR.
Traditional, digital, or AR
Students identified positive and negative aspects of the different ways to make
MBs. Among the positive aspects of making MBs the traditional way, they men-
tioned the simplicity of physical (tangible) actions needed to create a MB (e.g. han-
dling paper, cutting with scissors), that it is a social activity where people discuss
and share pictures with each other, and that the large scale of MBs provides a good
overview of materials and contents. Among the negative aspects, they said it was a
time-consuming task as it is harder to find the right pictures with all the magazines
they have to browse through, that cutting out pictures from magazines creates
mess in the design studio, and that once materials have been glued to the board, it
becomes permanent.
Regarding digital MBs, some positive aspects included having many editing
possibilities (e.g. undo, change color, crop), there is a large choice of pictures, and no
mess is created in the design studio. About the negative aspects, students mentioned
it is hard to learn and master, lack of overview due to reduced screen size, and there
is no tangible feedback.
Finally, about MBs in AR, students mentioned being able to work with both
hands simultaneously to directly manipulate images (i.e. rotate and move), having a
large work/display area, and the possibility of having more than one person working
on the MB as positive aspects. On the other hand, students mentioned the limited
number of functions, the lack of layers, and the clumsy response of the interaction
elements (i.e. the reflective card and digital pen) as negative aspects.

Desi
gn
Pr
ac
tic
e61Intuitive interaction
Participants liked the fact that they could simply walk up to the tool and start
interacting directly with it using their current skills and knowledge on the task that
is being supported. There was no need for further explanations or getting used to
the tool. There were no hidden functions, menus or complex actions that had to be
learned. This simple and direct way of interacting with the tool is what we refer to
as intuitive interaction.
Creating a positive state
Participants mentioned a positive attitude and relaxed atmosphere that was created
in their workplaces while collectively involved in the physical activity of making a
MB in AR. Keeping a relaxed and good mood was possible partly due to the nature
of the task as well as to the dynamic, social, simple, and stimulating interaction and
context of creation.
Adding more functionality
Design students requested “a larger amount of editing possibilities.” Some of the func-
tions requested by them such as the inclusion of layers might prove useful for the
support tools we would like to provide. However, we must look at the bigger picture
and remember that in the second study practicing designers had told us to “keep
it simple.” We believe students are less familiar with the nature of mood boarding
and thus it is more difficult for them to go to an abstract level and think about the
implications and the needs for supporting this task.
Discussion2.6
Probes to study professional work2.6.1 From our probes study we learnt that applying this method in professional environ-
ments has special characteristics that must be addressed. For example, introducing
probes in the work place can have a negative effect due to interruptions to the work
of the participants. Answering questions on a diary can be a significant distraction
from the participant’s main task. Participants are often reluctant to take part in
these studies [Carter & Mankoff 2005].
Based on these concerns we proposed a set of considerations for designing pro-
fessional probes [Lucero & Mattelmäki 2007a], that is, probing materials to be used
to broaden the designer and researcher’s understanding of the topic that is being
studied. From our findings we propose five considerations for applying professional
probes that address the main challenges researchers and designers will face when
designing professional probes:

Co
-Desi
gn
ing
In
ter
ac
tiv
e S
pac
es.
.. 62 Professional probes should aim at low time-consuming activities that reduce the ×
demands on the participants. Photo and audio capturing should be considered as
alternatives to diaries.
Professional probes should encourage a fluent and playful process for participants ×while documenting their work. The materials should be easily approachable per-
haps even have a funny character to be perceived by participants as a pleasurable
extra for their work.
Professional probes should be tuned in to the special nature of the work that is be- ×ing studied. Discussing the probe contents before deployment with management or
potential participants will allow the probes to successfully enter the environment
they were sent to study.
Professional probes should be flexible enough to encourage the use of different ×strategies, allowing participants to work in ways that are meaningful to them.
Professional probes should aim at motivating participants by providing inspiring, ×unique, handmade probe materials that are made especially for the study that
is being undertaken. Materials should be tailored to create empathy both for the
participants and designers.
Practicing designers vs. design students2.6.2 In the first two studies (i.e. probes and workshops) our participants consisted of
practicing designers. In the third study on the other hand we invited first-year in-
dustrial design students to participate. Besides the evident difference in experience
with regards to design skills and practice, we also observed a change in education.
There is a big difference in the education received by design students today versus
twenty years ago. Today students are familiar with digital tools and thus depend
heavily on them. Their sketching and hand modeling skills are deteriorating and
have been partly (if not completely) replaced by powerful 3D modeling tools. For
example our participants, industrial design students from the Eindhoven Univer-
sity of Technology, all get laptops in their first year at university. It therefore comes
as no surprise that they would so overwhelmingly put in first place the digital way
of making MBs (19) over the traditional (8) or AR ways (5). What we observed in
the probes study was the exact opposite trend where experienced designers wished
to go back to the old practice where they could shape their ideas away from comput-
ers using pencils and paper to sketch.
Students also asked us to “add more functionality” to the AR tool. They were
unable to go beyond the wow effect or the phenomenon of student obsession over
new technology instead of artistic substance [Eber et al. 2002]. We believe that our
first-year students were less familiar with the nature of mood boarding and the old
practice thus it became more difficult for them to go to an abstract level and think
about what are the implications of supporting the creation of MBs. Although some

Desi
gn
Pr
ac
tic
e63of the functions requested by students might prove useful for the support tools we
would like to provide, especially the use of layers, we must look at the bigger picture
and understand what practicing designers have requested in terms of keeping the
tool simple.
Conclusions2.7 To provide practicing designers with a sensible AR support tool for their work, I had
to first study and understand design practice. How do designers currently work?
What are their needs? What tools do they use? I systematically conducted three
studies to find answers to these questions. First, in the probes study I identified a
set of important ideas or possible directions for supporting the work of industrial
designers with AR. Most of these findings were connected to supporting creativity
and finding inspiration in the early stages of the design process. Along the lines of
these findings, I also identified the creation of MBs as a relevant task for designers
that could potentially become the focus of my research.
Second, by collectively discussing the probes results with the participants in
workshops, I confirmed that the creation of MBs was the best potential activity to
support with AR. The purpose of the workshops was also to confront designers with
an AR tool. Participants also gave me key aspects to consider when supporting the
creation of MBs with AR. They mentioned the rough and sketchy nature of MB mak-
ing, and the power of being able to use both hands in activities that involve creation.
They also requested allowing designers to remain captivated by the experience of the
interaction, and to pay attention so that external elements do not break the illusion
of the experience. Finally, they also advised us to keep the interaction simple.
Third, in the student project, I was able to observe how MBs were made using
different techniques such as the traditional, digital and AR ways of making MBs. Stu-
dents also saw the potential in augmenting MBs. By directly comparing the different
techniques students gave their insights on providing an intuitive interaction that
allows designers to simply walk up to the tool and start performing tasks without
needing to read manuals or learn new skills to master it. They also liked the positive
and relaxed mood created by the dynamic, social, simple, and stimulating interaction
and context of creation.
In summary, at the end of these three studies I have enough insights and under-
standing on design practice, especially with regards to the early stages of the design
process. I also have identified a relevant task for designers, the creation of MBs, and
both practicing designers and design students have confirmed and encouraged me to
provide support for it with AR. The next step would be to really study in detail and
understand what the creation of MBs was all about, trying to find its essence.

Co
-Desi
gn
ing
In
ter
ac
tiv
e S
pac
es.
.. 64
mood boards

Mo
od
Bo
ar
ds
65Mood Boards3
Problem3.1 The three studies described in the previous chapter allowed me to obtain a better
understanding of design practice in general and to find a specific task that would be
the focus for my future research. After identifying the creation of MBs as a concrete
activity that could be supported by AR, I realized I knew very little about the task
that I was about to provide support for. I had to go in depth and try to understand
what the essence of MBs is. To achieve this, I would have to talk to several MB de-
signers or MB makers, discuss their MBs, and hopefully observe them while actually
making a MB.
I had already talked to several practicing designers and design students about
design and MBs but I had spent very little time in design studios observing designers
at work. Up to this point I had only been in design studios when delivering and col-
lecting the probe kits. The rest of the studies had been conducted in the safety of our
research labs (i.e. workshops) or classrooms (i.e. student project). So my next task
would be to go into the design studios, spend a great deal of time there and learn
about MB making in situ.
Related work3.2 MBs (Figure 17) are common practice in design processes. MBs play an important
role in design communication in different design disciplines such as in the knit-
wear and fashion industries [Eckert & Stacey 2000], in graphic [Dabner 2004] and
industrial design [Muller 2001], in interaction design [Øritsland & Buur 2003], and
in television and theater [Cristiano 2007].
MBs provide a mechanism for students and practicing designers to respond to
perceptions about the design brief [Garner & McDonagh-Philp 2001]. According to
McDonagh and Denton [2005], MBs have two main functions: one of inspiration for
a designer or design team, and another of communication, supporting both internal
and external dialogue with other stakeholders. MBs consist of a collection of mostly
abstract media (e.g. images, textures, forms, colors, and so on) [McDonagh & Storer
2005] to visually encapsulate qualities of mood, atmosphere and voice [Dabner
2004]. Some images are included purely for their visual properties, others for their
cultural properties [Eckert & Stacey 2000]. MBs allow designers and clients to ap-
proach a given design problem from different perspectives, thus serving as an aid to
lateral thinking [de Bono 1970].
The current literature provides several tips for making MBs. First, MBs should
not be expensive or time consuming to construct [Garner & McDonagh 2001]. Just
as for sketches, this does not mean that they have no value, but that cost or time
must not inhibit the ability to explore ideas, especially early in the design process

Co
-Desi
gn
ing
In
ter
ac
tiv
e S
pac
es.
.. 66
[Buxton 2007]. Depending on the type of project, MBs may be assembled in less
than an hour or it may take the designer a couple of weeks to slowly gather the
material together, while involved in other activities [Dabner 2004]. Second, as MBs
mostly consist of images collected from magazines, books and newspapers, abstract
imagery should be preferred to create feelings and moods [Garner & McDonagh
2001], hopefully from sources that are different from the intended design (e.g. waves
lapping on a sandy beach to define a color scheme for knitwear) [Eckert & Stacey
2000]. Working with abstraction can support ambiguity in design [Gaver et al. 2003].
Third, the items should be selected mostly on a visual basis while having some values
or concepts in mind [Bonnici & Proud 1998]. Finally, the images are juxtaposed and
glued on an A3, A2, or A1 sheet of card or foam board, making it easy for transporta-
tion [Dabner 2004].
Figure 17. Mood board example: ‘Senses’ MB put together by the author
This MB is an exploration for an AR tool that supports MB making using more senses than just sight. These
images were included for their visual or cultural properties. Several interpretations can be made from these
images beyond their literal meaning. A verbal explanation accompanies this MB. The value of MBs as an idea
development tool lies in the discussion and subsequent reinterpretations from the images and text

Mo
od
Bo
ar
ds
67Although MBs have been used by designers and taught in design schools for
a long time [McDonagh & Denton 2005], the existing literature on this activity is
rather limited. In particular, there are very few studies on how MBs are made and
used in design practice. There is one notable exception; Eckert and Stacey [2000]
analyzed the use of MBs (among other design techniques) to study the role sources
of inspiration play in the knitwear industry.
Approach3.3 In an attempt to find the essence of MBs we have continued our UCD process by
conducting contextual inquiries [Holtzblatt et al. 2004] with Dutch industrial
designers, and MB interviews with Finnish fashion and textile designers. Empathic
design [Koskinen et al. 2003] inspired these interviews in the sense that we built an
interpretation of the data to understand the user.
Studying these two groups of designers who use MBs for their work would allow
us to compare our findings on different levels. First, we would be able to know how
designers from different design disciplines (i.e. industrial, fashion, and textile) use
MBs for their work. Second, it would allow us to compare for differences in purpose
of use, looking first at Dutch designers who make MBs and leave the rest of the de-
sign process in the hands of other design professionals, and later comparing them to
Finnish designers who mostly use MBs as part of their own design process. Third, it
allowed us to look into how MBs are used in different countries. Finally, having two
contexts for our studies would allow us to compare our initial Dutch findings with
Finnish designers to confirm and hopefully expand our findings.
Dutch contextual inquiries3.4 From our previous studies of design practice, we found out that mood boarding is
an important task for designers, which is part of a longer chain of events and in-
teractions between different stakeholders (stylists, designers and clients). In order
to assess the long-term impact of our research in the work process of industrial
designers, we had to observe how they create MBs in their real environment. There-
fore, the main research question for this first study with Dutch designers was what
is the essence of making MBs?
Method3.4.1 For this study, the method used was contextual inquiries [Holtzblatt et al. 2004]. In
contextual inquiries participants take the role of experts as they guide the research-
er through different aspects of their work. This method allows for a more informal
discussion when compared to a traditional interview. There are no pre-defined sets
of questions that the researcher must ask. Instead, the researcher will take the role
of the apprentice, usually interfering to create a shared understanding of what is
going on and to steer the conversation along areas of concern.

Co
-Desi
gn
ing
In
ter
ac
tiv
e S
pac
es.
.. 68
Participants3.4.2 Four participants (Figure 18) were contacted based on their experience with making
and using MBs in their work. Three of the participants also worked in design re-
search and design education. All participants had at least 10 years of experience in
practice (14 years of experience on average). These participants varied in education
(university, academy), background (industrial designer, contextual designer, stylist/
photographer, designer/mechanical engineer), age (between 35 and 45), and gender
(3 female and 1 male). They were owners of their own small companies or were
doing freelance work at home. Three of them focused on image/branding while the
other participant focused on product design and marketing.
Procedure3.4.3 Four contextual inquiries were conducted between March 15 and July 7, 2006.
The sessions were planned for a total of two hours. In the first 15 minutes, the
interviewer (the author) explained the purpose of the session, including the focus
of the project, the previous user studies that were conducted, and how the cur-
Figure 18. Dutch participants in contextual inquiries
LM (top-left) – Stylist/Photographer
MP (top-right) – Industrial designer, graduated from TU Delft
FS (bottom-left) – Designer/Mechanical Engineer, graduated from the Design Academy in Eindhoven
CVDB (bottom-right) – Designer, graduated from the Design Academy in Eindhoven

Mo
od
Bo
ar
ds
69rent sessions fit within the larger picture of this research. These first 15 minutes
also allowed the interviewer to explain the confidentiality policy and how the data
gathered would be used.
The actual contextual interview started after the 15-minute introduction and
lasted between 60 and 90 minutes. Participants were observed in their workplace
while performing the task of making a MB. Participants walked the interviewer
through some of their current or previous projects for which they had used MBs.
Only one participant was actively involved in a MB making project at the time of the
session. Participants usually described between two and five of their projects.
Usually participants spent the first 30 minutes freely presenting their MBs,
explaining what the purpose of a given MB was, what the client wanted, the process
of making the MB. At the end of this part, the interviewer would go back to one of
the MBs and ask a general question about it in order to trigger the participant to go
in depth about certain topics.
All sessions were recorded on video. Pictures were also made during the session
to capture specific aspects of the work that the participants were describing. Some
participants also encouraged the interviewer to make pictures before jumping to a
new topic in the discussion.
Interpretation3.4.4 Interpretation sessions were conducted within 48 hours after the field interviews.
The interpretation team consisted of the author plus an independent researcher
(Selene Mota). Both interpretation team members made notes using Post-it® notes
while watching the corresponding video from the session. Each member created be-
tween 80 and 150 affinity notes per participant. The number of affinity notes varied
depending on the duration of the interview. Transcripts for all affinity notes were
made. Each note was first color-coded to identify the participant (using a differ-
ent Post-it® color), and then number-coded to identify the affinity note, and which
researcher made the note.
Analysis3.4.5 We assigned meaning to the data collected through interpretation. The analysis
team consisting of the same researchers involved in the interpretation sessions
walked through the notes in several interpretation rounds. The Post-it® notes from
the first three sessions were used to conduct the analysis in several rounds of inter-
pretation. The main purpose of these sessions was to build a common understand-
ing by making a work-modeling diagram and an affinity diagram.

Co
-Desi
gn
ing
In
ter
ac
tiv
e S
pac
es.
.. 70
The first part of the analysis consisted of creating a work-modeling diagram
(Figure 19, top-left). The goal was to identify the different steps in the process of
making MBs, including the people, the physical spaces, artifacts, and activities.
The final goal was to create a diagram with the different strategies used by design-
ers when making MBs. The researchers read the notes and created a common table
for each participant, individually linking the contents of the notes to each of the
previously mentioned areas of interest (i.e. people, spaces, artifacts and activities).
The table was jointly discussed, spotting the differences between team members in
the interpretation, and later resulting into more general findings. A unified version
of a work-modeling diagram representing the process of making MBs was created.
Once the analysis team felt the diagram was mature enough, the affinity notes were
scrambled to create the affinity diagram.
In the second part of the analysis we conducted seven rounds of discussions in a
period of ten days to build the affinity diagram (Figure 20). Each researcher read the
notes individually and slowly began grouping notes, creating clusters, which later led
to categories (Figure 19, top-right). A shared understanding on issues regarding the
Figure 19. Analysis of the Dutch contextual inquiries
Work-modeling diagram (top-left) – Building tables to create a work-modeling diagram
AffinityDiagram (top-right) – Reading notes to build the affinity diagram
Categories (bottom-left) – Creating an overview of categories emerging from the affinity diagram
Checking the interpretation (bottom-right) – We invited a participant to check the interpretation

Mo
od
Bo
ar
ds
71client, the relation between client and MB maker, the MBs themselves, and aspects
of images was built. These issues formed categories that were naturally revealed, and
were jointly revisited, discussed, and redefined. In the end these categories were pro-
cessed into more general findings (Figure 19, bottom-left). Between six and twenty
notes were left out per participant, and per researcher. These notes were often con-
nectors or notes that marked transitions in the discussion when participants started
describing another project. Other notes were going into details about the context of
the project. Once the affinity diagram was completed, we checked the work-modeling
diagram once again in relation to the categories that had emerged.
Checking internally3.4.6 The fourth session was kept aside to check the reliability of the model in relation
to the general categories defined thus far. First, an interpretation session similar
as for the first three contextual inquiries was conducted. Later interviewer and
researcher added their corresponding affinity notes to the affinity diagram. At this
point, existing categories could be removed as well as new ones created. In this
process, we were able to check the reliability of both the work-modeling diagram
and affinity diagram. Although the fourth participant stressed some aspects over
others, she did not greatly alter our perception of how MB designers do their work
or of the essence of MBs.
Checking with users3.4.7 We invited participant FS (Figure 19, bottom-right) for a final external check of our
interpretation of the data. The interviewer presented the work-modeling diagram
and affinity diagram to participant FS. This process allowed us to enrich and find
limits to our interpretation. The session lasted two hours. Although our four
participants had different views on certain aspects of the essence of MBs, partici-
pant FS confirmed most of our findings and helped us clarify some points we had
misinterpreted.
Findings3.4.8
Idea development
A MB is an idea development tool that helps both the client and the MB designer
explore the available design space or range of possibilities when the first ideas begin
to emerge. In this early stage of the design process, usually clients have some unde-
fined and rough ideas in mind for a future product, trend, or service, and thus will
find difficulty in describing them or expressing exactly what they mean. MB design-
ers and clients hold several meetings where the discussion evolves around topics
put on the table by the clients who are trying to share their thoughts and express

Co
-Desi
gn
ing
In
ter
ac
tiv
e S
pac
es.
.. 72
ideas through words. Participant MP reflected: “we cannot read their mind. Clients
transmit their ideas through words. The meaning behind those words is not important; it
is the idea they are trying to express which is important. The impressions on the keywords
for the designer may be totally different for the client. Therefore, we need to find some
level of understanding on what is actually meant.” Through these discussions, the MB
designer starts helping the client shape and better define what they have in mind.
Figure20.Categoriesfromtheaffinitydiagram
The discussions evolved around issues regarding the relationship between the client and the MB maker, the
MB makers themselves, and the MBs shown here as black Post-it® notes. The round notes show the five main
findings from this Dutch study
Communicationtool
Client/ Mood-BoardMaker
Commonunderstanding
Mood-BoardMaker
QualitySelectionSenses
Mindset
Whole
MoodBoard
Vision DirectionIdeadevelopment Research Context Involve Useful
Naturalness Inspiration TrendsPaperSizeAuthenticCollect Categorize Pile Trim
Feeling Paradox Story
Unique Useful Form Content Message Empathy
Elements TotalAtmosphere
Abstract Real Color Shapes Composition Whole
Enthusiasm
Ideadevelopment
Research anexpression
Involvingthe senses
NaturalisticCollection

Mo
od
Bo
ar
ds
73The MB designer will interpret the words mentioned by clients and use MBs to vi-
sualize the ideas that otherwise clients would have no clue as to what they look like,
helping MB designer and client get a better grip of the product, trend, or service
they have in mind. In line with this finding, Dabner [2004] indicates that MBs can
be a “springboard for discussion, particularly if a client has problems briefing the designer
about a difficult or unclear project that they need resolved.” Regarding the use of words,
Eckert and Stacey [2000] indicate that the lack of a universal standard vocabulary
for variations of design elements (e.g. human languages have only a small range of
accepted color names although a huge number of them are perceptually distinguish-
able) is prone to misinterpretation.
MBs help clients create and transmit a mindset or vision to different stakehold-
ers. The purpose of creating this new vision may be to change how the company is
perceived, or to develop a new product. The iterative process of interpreting, making,
and discussing helps the client in defining and transmitting this vision to as many
people as possible, so that clients, stakeholders, employees and others are all aligned
and share the same perspective. As participant FS told us, “it is to get everyone on
board the same boat, making everybody part of the change.” MB designers help their
clients present their vision or general ideas of what they want by asking them ques-
tions such as, “what do you want for the future of your company?,” “what is important for
you?,” “what brand personality do you want this new product to have?” In a study with
design practitioners’ views on their use of MBs, McDonagh and Storer [2005] found
that “MB construction can assist in getting all stakeholders on the same wavelength.”
Together, client and the MB designer spend a significant amount of time defin-
ing and discussing around topics with their potential target audience in mind. The
result of these discussions will be a set of keywords that outline the context of the
project, summarizing both the message they want to get across and the target group
they want to reach. As such, MB designers need to find out why the clients chose
those keywords for this given context before attempting to visualize them for the
clients. MB designers must also check how words are determined by a given context
or culture. MP mentioned “for example, ‘modern’ will mean something completely differ-
ent to a traditional company than to an avant-garde company. MB makers must interpret
terms differently according to the source (company, client, context).” CVDB added, “Words
are also culturally determined. For Christmas, a fireplace may bring emotional aspects in
western culture about coziness but may bring functional aspects about cooking in India.
These cultural differences in keywords and colors are crucial in MBs when you are trying to
communicate with other cultures.”
Having defined the vision and the set of keywords, MB designers now conduct
a thorough research fed by those topics in an attempt to go beyond what the clients
are able to verbalize, and to build their own understanding of what the clients told
them. In their research, MB designers will look into different elements around the

Co
-Desi
gn
ing
In
ter
ac
tiv
e S
pac
es.
.. 74 project that could influence the end-result, reading books and marketing reports,
conducting market and competitor analyses, having interviews, and listening to
relevant music, to have a strong impression of the issues that should be addressed.
MB designers stress the importance of conducting a thorough research from the
start as it makes their design period afterwards shorter, or as FS put it, “it helps speed
up the process.” The MB designer processes the information, builds a client profile,
and presents it back to the client. The MB designers confront their clients with some
of the findings, which help the clients think about their vision once more. Clients
might want to project a brand personality that does not suit what their company
stands for. Based on the research, MB designers can advise the client on the sound-
ness of their intentions.
The entire process of trying to understand what is in each other’s mind by first
defining the vision and keywords together, and later presenting and discussing the
results of the thorough research, allow both client and MB designer reach an agree-
ment and create a common understanding.
A completed MB sets a new direction for design. The MB will be a result of
the ongoing discussions, reflecting the mindset or vision that was discovered and
defined together with the client. So in the end the MB will not come as a surprise, it
will be the result of these discussions. MBs can serve as a reminder for designers to
focus on this new direction, and as inspiration for the future designs. MP mentioned
that, “by comparing the final product and the MB that set the direction for design you
should be able to see that they are related; that they are family but not twin brothers. The
MB should be a reference.” MBs are used to communicate this direction internally to
salesmen, marketing people, product developers, and other stakeholders so they all
share the mindset or vision for the future product. This finding is inline with Garner
and McDonagh [2001] who indicate that, “in a successful process, MBs seem to indi-
cate the direction of travel for design and development.”
Research an expression
MBs allow designers to research an expression. It is a way to find out how different
shapes, images, feelings, and concepts can coexist and what the new result brings.
MB designers start actively looking for different ingredients that represent the
keywords and give life to the vision defined with the client. Participant LM said,
“Designers must look for images to create a story around the keywords that were identi-
fied. The images should address the previous findings.” When these ingredients are
put next to each other they should convey a unique and recognizable feeling that
reaches out to the target audience and clearly conveys the vision that the client and
MB designer intended. As participant FS reflected, “the completed MB should give a
strong impression that goes directly into your heart as a whole.” Participant MP added:
“MBs are a new interpretation (new work of art) with a clear context.”

Mo
od
Bo
ar
ds
75MBs allow researching a paradox of apparently conflicting or contradicting
elements (e.g. keywords, topics, ideas). This tension is in the core of MBs as they
allow visually exploring what this paradox could result in through color, shapes, and
the story. Elements can form a paradox both in form (visual aspects) and content
(meaning). Form refers to color, shapes, and composition, while content refers to the
substance, ideas, story, or expressive effects of the elements that fit the paradox. MP
gave an example: “if the purpose of the MB is exploring shapes for packaging, MBs will
allow this exploration by giving a feeling of control over the juxtaposition of contradicting
shapes that fit the paradox.” Form and content may be conflicting and thus not serve
the final purpose of conveying a clear and recognizable feeling. As such, making MBs
is also about finding the right balance between form and content of the elements
that fit the paradox.
There is always a story behind MBs. For most cases, a MB is storytelling with
images. MB designers create a story that is supported by images and is based on
the keywords and vision defined with the client. MB designers look at the images
and see what those images tell them or how they help them build the story. “MBs
are meant to feed that story,” said FS. The story helps convey the message that the
client wants to put across and creates empathy with the target audience. Participant
LM tells us that creating empathy “is like putting yourself in someone else’s shoes.” MB
designers have to tell a story that addresses the culture, the environment and the
situations that real people face in their daily lives. When MB designers are selecting
images, they think aloud asking themselves questions such as “Would she use this?
How is her workplace?” (LM) to assess if a given picture matches the descriptions of
this person.
The elements that help build the story must be abstract, allowing MB designer,
client and the audience think on a general level and get a sense of the feeling that
should be conveyed. MB designers translate the abstract values and concepts that
have been previously identified into a visual deliverable. MB designers must avoid
applying the literal sense or meaning of objects, as it will not help the research they
are undertaking. MP told us, “If it is too literal, it is of no use.” For example, faces of
famous people or images directly connected to the topics or context discussed create
the effect of dragging the viewer’s attention, preventing them from getting the gen-
eral picture. Here lies one of the main difficulties for students making MBs: it is very
difficult for them to remain abstract (Figure 21). FS said: “students tend to be very
literal, concrete and explicit.” MP added, “For students, the picture itself is important, not
the total where colors, textures, shapes and compositions create a new feeling.” McDonagh
and Denton [2005] have also found that students often misunderstand MBs, “pro-
ducing them at a superficial level.” On the other hand, elements must also be real to
allow the discussion to evolve around concrete things (e.g. images from magazines).
They also try to incorporate textures and materials that clients can quickly relate to

Co
-Desi
gn
ing
In
ter
ac
tiv
e S
pac
es.
.. 76
(e.g. textures from their current environment, the company logo), transporting them
to the real world. Making MBs is an exercise of jumping between being abstract and
concrete again.
There are three key aspects MB designers look for in the elements they choose
to create an atmosphere on the MB: color, shapes and composition. First, when MB
designers are looking for images with the keywords in mind, they have an idea of the
kind of atmosphere that they would like to create, and will thus look for colors in the
image to better convey it. MP told us, “A MB may have the same images, but if the colors
of the images are changed, the end result will end up communicating a completely different
atmosphere.” Color can be used to create an identity for a MB. FS pointed out, “Using
the corporate colors of a company or the color orange if you want to say something about
Dutch culture will help the viewer receive the intended message.” Color is also an impor-
Figure 21. Mood board example: 'Silence' MB put together by a design student
Design students tend to be very literal in how they use images when creating their MBs. The topic of this MB
was 'sound', and the student here wanted to "represent silence to talk about sound." Although the idea is
potentially very interesting (i.e. talking about opposites), unfortunately the author picked these images for the
literal interpretations that could be made. Images of famous people (i.e. Pet Shop Boys, Jet Li) tend to drag the
viewer's attention. The general composition and colors do not help convey the feeling of 'silence'.

Mo
od
Bo
ar
ds
77tant factor for the future design direction. FS added: “when you look at a final design,
you will not see the exact same elements in the MB, but you will expect to find the colors
that MB is presenting.” Second, shapes can be used metaphorically to evoke a symbolic
meaning. MP gave an example: “People dancing with their arms and legs open in a star-
like shape may represent beautiful flowers. It is irrelevant whether these are people, or
if they are dancing; it is the colors, the shapes, and the posture that say something about
flowers.” Shapes can also be used in a more abstract way. For example, if the concept
to be represented is ‘dynamic’, MB designers might look for images with dynamic
shapes. If shapes found in an image evoke the right symbolic meaning but the colors
do not match with the rest of the images, then that image will be left out, and vice
versa. Third, composition is about creating a framework in which all the elements
are placed in such a way that it allows to clearly convey the message or story. It is
the MB designer’s job to first see if the elements match together, and later adopt-
ing a specific layout to send a message with how the different elements are placed
on the board. Regarding the importance of composition, MP said that “every brand,
every trend needs a different composition.” Finding the final composition is something
that takes time, therefore MBs have an incubation time. MB designers will create
a first tentative composition, then leave the MB for a while there, think about it in
their mind, and come back to it a week later to work on it again. By using fragments
of images to create a new composition, MB designers try to avoid having copyright
problems with the images they are using. As MP reflected, “I am creating something
new, something different.”
Making all elements in a MB fit together to express a feeling and create a new
whole is an art. The final MB should feel as a unit with its own identity. The different
elements should all coexist harmoniously, feeling like they belong together. The total
should evoke the feeling instead of its details. MP told us “every picture is present in
a MB because of the relation it has with its neighbors and the total. If one image changes,
everything changes. If one image is more dominant than another (i.e. because it shows a
typical kind of house), it will capture the viewer’s attention and they will be drawn into
expecting exactly what that image is conveying.” Although connections can be made
between the different elements in a MB, in the end the final general picture of the to-
tal MB should be very straightforward. FS mentioned, “it goes directly into your heart;
it is very coherent.” Creating such a strong and single impression requires a special
talent that MB designers have. MB designers give a special touch to design projects
by having a different way of looking at and finding the right images to give life to
this unique feeling.
Communication tool
Throughout the MB making process, MB designers meet their clients to discuss the
MBs establishing and keeping a special relationship with the client. This relation-

Co
-Desi
gn
ing
In
ter
ac
tiv
e S
pac
es.
.. 78 ship will ultimately define how they interact along the process. Having a good com-
munication and keeping the clients’ enthusiasm high are key issues for successful
MB design.
MB designers involve their clients by giving them a sense of ownership over the
MB itself. Metaphorically speaking, MB designers let the client run along with them
at some stages of the process, letting them go whenever MB designers need to work
on their own. Then they go back to the clients and involve them again in the process.
Meetings become the points where the client is actively involved, checking if the
interpretations made by the MB designer match theirs, and when they can have a say
about the overall process. As FS told us, “It gives the client the feeling that they can redi-
rect the MB maker if they think they are losing track.” MB designers want to inspire and
impress clients by communicating through images how they look at their product,
company, brand, or market. They should feel comfortable with the values and design
that are being aimed at. It also allows the client to say what they like, what is pretty
for them, what kind of designs they like. If the client likes a specific image, the MB
designer will try to find images along the chosen image. Clients must somehow re-
late to the MB. Adding the client’s logo or using materials that remind them of their
company achieve just that. At the end of the process, the original MB is given to the
client and creates surprising reactions from them such as “is that for me?” (LM)
Clients must also feel that what the MB designer is doing for them is useful.
This aspect relates to the end product itself as well as the process (i.e. the research,
keywords, etc.). MB designers must identify what the most important issues for
their clients are and address them in their MBs. FS said, “The MB must address what
the clients have in mind; if it is what they wanted, if it is what they were looking for. Things
that make sense to them, that maybe they have not thought of yet.”
Involving the senses
MB designers involve their senses to create MBs, with their body and mind taking
part in the process. It is a delicate balance between internal and external aspects
that allow them to find the necessary elements for the MB. It is a state of mind
where all their senses are involved.
MB designers prefer the naturalness of working with their hands to find the
elements needed for the MB. They like the touch and smell of paper, or listening to
music related to the feeling they are trying to research. Once they have found the
right images, they like cutting the images with scissors and dragging the images to
try different layouts. MB designers also prefer looking for real images on magazines.
They try to avoid building MBs or editing digital images using commercial software,
such as Photoshop®. They prefer using real paper and playing with the juxtaposition
of images. They may use colored papers to have a better control of the overall expres-
sion of the MB, but they will not favor changing the color palette electronically on

Mo
od
Bo
ar
ds
79Photoshop®. FS reflected: “The result of editing images in Photoshop inevitably results in
a new image, different from the original.”
The main reason MB designers keep their (updated) collections of magazines is
for inspiration. When they look for images they use their feelings, their intuition,
their skills in viewing, and their vision on things. FS said, “It’s a quick jump from the
head to the heart.” Keywords set the themes for image searching. Sometimes when
they are browsing the magazines they are surprised by images that introduce new
themes and topics that they had not thought of before. This is not random surprise
but a surprise that happens within the context of looking for images with keywords
in mind. CVDB mentioned, “With magazines, you are surprised. But looking at stock im-
ages (e.g. Image Bank, Getty Images) is less inspirational” as the result of the searches is
too literal. Another source of inspiration is music. Often when designers are working
on their MBs, music will be playing in the background to set the atmosphere they are
trying to reach.
Naturalistic collection
MB designers have an ongoing process of collecting images. It is a naturalistic
collection of images, meaning that whenever they see an interesting image that
triggers their imagination, they will collect it. Just like the naturalist Charles Dar-
win roaming the geography of South America who picked up interesting samples
of plants and insects as he saw them, hence the name naturalistic collection. Some
images can be collected because they inspire or trigger the imagination of the MB
designer. Others may simply comply with aspects of expression such as textures or
colors. MB designers turn to special bookstores and magazines whenever they feel
they need to feed new images to their collection. They will go to great lengths for
the last one or two missing images for a MB, even buying an entire book or a maga-
zine (e.g. View on Color or Provider) that can cost up to twenty times the price of a
normal magazine. Clients and designers approach MB designers because they know
they have an interesting collection of images that they work with and which they
will use. Another aspect about collecting is selecting elements that are not easily
outdated, and that can be useful for up to five or ten years.
MB designers categorize their collections of images. For some of them it is a
very structured process, keeping images in boxes under labels (e.g. human, modern,
kitchen, etc.). For others, the categories are looser, keeping the complete magazines
arranged in a bookshelf according to brand, types of magazines or themes, ready for
later retrieval. In any case, be it a loose or structured categorization, these categories
are very personal and make sense most of the time to the MB designer only. CVDB
said, “My system is my own system.” They will use keywords and labels that allow them
to retrieve magazines or images. But if another MB maker would be required to work
with someone else’s collection, they would probably feel lost.

Co
-Desi
gn
ing
In
ter
ac
tiv
e S
pac
es.
.. 80 MB designers create piles when they retrieve images from their collection with
the keywords in mind. They will usually start by looking on magazines, cutting out
pictures from them and ending up with a large amount of images. This process can
take up a considerable amount of time, “usually friends and clients wonder if designers
are actually working or reading the magazines.” Once they have enough images, they
will start throwing images in each category (usually 30 images per concept) and
start making connections with the different atmospheres. They like the easiness of
piling and arranging images within the pile. Growing piles create smaller piles and
sub-piles can be mixed together in a simple way. Retrieving an image that they have
seen before is as simple as going to the pile and getting the image. Once the piles are
ready, they also like having the overview of the whole table in one quick glance that
allows them to see what they have and they can start thinking what they want to do
(layout).
Finally, an important part of maintaining this collection of images is to trim it.
Their collection of images is a living thing that is constantly changing, and that is
continually fed with new material. However, space is limited and therefore once per
year MB designers go through their collection and dispose of some material. The two
main reasons for getting rid of images/magazines is that images cannot be outdated
and that MB designers need space and cannot keep everything in order to grow their
collections with new material. Participant LM added another reason for trimming
their collection: “Sometimes you can’t see the forest for the trees.” An overly large collec-
tion of images may prevent MB designers from focusing and being able to find the
right images.
MB designers look for quality images. There are five main aspects that define
quality in a picture: authenticity, photography, size, paper, and trend. First, MB
designers work with authentic or original pictures that help them discuss on real or
concrete elements with their clients. They are looking to discuss on real elements
and not on illustrations or (fake) images that were edited in the computer. MP
mentioned, “Otherwise, (clients) would look for graphic designers who are very good at
that.” Second, the images should also have a similar level of photography meaning
that usually the images are made by professional photographers who are aware of
what the images can evoke besides just showing the elements captured by the lens.
They have a special feeling for lighting, composition, contrast and the atmosphere
created. CVDB mentioned that “the level of photography is not so inspirational in non-
glossy magazines because the images are very down–to-earth, it is only for the purpose
of showing something. There is more fantasy to images from glossy magazines.” If for
some reason they need to make a copy of an image (e.g. two interesting images on
opposite sides of a page) they will make a very expensive good quality copy of it. LM
told us, “When placed on the MB, the client should not feel the difference between the copy
and the originals.” Third, the images should also be large in size, at least an A4 (US

Mo
od
Bo
ar
ds
81letter) format. The size of an image must be just right for a MB. Small images might
go unnoticed or cause distraction when placed next to larger images on a MB. On the
other hand, if an image is too big, it will tend to capture the attention of the viewer.
MB designers spend considerable time and money scaling images in copy shops. They
ask the operator to scale up or down in percentages which is not always easy. Fourth,
paper quality means that they will look for magazines with thick, glossy paper. The
quality of photography is usually directly related to the kind of paper it is printed on.
With thick paper, the image on the opposite side will not be visible when placed on
the MB. Finally, MB designers will look for images that show current trends in the
market. Some magazines specialize in tracking trends for design, clothing, archi-
tecture, and living. LM added, “This type of images is good to get the discussion going
with the client on the type of things they like and dislike. It serves as new inspiration for
design.”
SummaryofDutchfindings3.4.9 A MB is an idea development tool. MBs help both the clients and the MB designer
create and transmit a mindset or vision to different stakeholders. MB designers
help better define what their clients have in mind by holding a series of meetings in
which they define and discuss around topics with their potential target audience in
mind. The result of these discussions will be a set of keywords that outline the con-
text of the project. The MB designer will conduct a thorough research fed by those
topics, process the information and present it back to the client, which allows both
parties to reach an agreement and create a common understanding. A completed
MB sets a new direction for design.
A MB allows designers to research an expression. MBs allow researching the dif-
ferent ingredients that put together convey a unique and recognizable feeling. MBs
allow researching a paradox of apparently conflicting or contradicting elements both
in form (visual aspects) and content (meaning). There is always a story behind MBs,
a story that helps convey the message that the client wants to put across and creates
empathy with the target audience. The elements that help build the story must both
be abstract to get a sense of the feeling that should be conveyed, and real to allow
the discussion to evolve around concrete things. Color, shapes and composition are
key aspects MB designers look for in the elements they choose to create an atmo-
sphere on the MB. Making MBs is an art of making all elements fit nicely together to
express a feeling and create a new whole.
A MB is also a communication tool for the MB designer and the client. MB
designers meet their clients to discuss the MBs, establishing and keeping a special
relationship with the client. This relationship will ultimately define how they interact
along the process. The clients’ enthusiasm is kept high by involving them throughout
the process and finding useful things for them.

Co
-Desi
gn
ing
In
ter
ac
tiv
e S
pac
es.
.. 82
Figure 22. Finnish participants of MB interviews
EH (top-left) – Freelance textile designer
LL-K and NH (top-right) – Fashion designers. They work for Stockmann the largest Finnish department store
IH (second row-left) – Fashion designer. She owns a company for which she designs her own collections
JK and HH (second row-right) – Textile designers, they recently opened their own design agency

Mo
od
Bo
ar
ds
83MB designers involve their senses to create MBs, with their body and mind
taking part in the process. It is a state of mind where all their senses are involved.
They prefer the naturalness of working with their hands to find the elements needed
for the MB. They like the touch and smell of paper or listening to music related to
the feeling they are trying to research. They like cutting the images with scissors
and dragging the images on the table to see the result of different layouts. The main
reason MB designers keep their (updated) collections of magazines is for inspiration.
MB designers keep a naturalistic collection of images. Whenever they see an
interesting image that triggers their imagination, they will collect it. MB designers
categorize their collection of images in an often-personal structure. MB designers
create piles when they retrieve images with keywords in mind. They will usually
start by looking on magazines, cutting out pictures from them and ending up with
a large amount of images. Their collection of images is a living thing that is con-
stantly changing, and that is continually fed with new material. Therefore in order to
maintain their collection, MB designers must regularly trim it. MB designers look for
quality images; images that are authentic, photographically inspiring, large in size,
printed on thick glossy paper, and which show current trends.
Finnish MB interviews3.5 In the previous contextual inquiries with Dutch designers, we were able to study
why industrial designers use MBs for their work, identifying the essence of MBs.
However, we wanted to compare our findings when MBs are used in other design
disciplines, for different purposes, and in other countries. Therefore, our research
questions for this second study with Finnish designers were 1) are there any differ-
ences in how different areas within design make use of MBs?, 2) are there any differences
between designers who use MBs as part of their design process as opposed to designers
who only make MBs?, and 3) are there any differences in how MBs are used in different
countries?
Method3.5.1 For this study the method used was empathic design [Koskinen et al. 2003]. In em-
pathic design, a small number of cases from the main user group (expert users) are
first studied in depth to get a better understanding of people. A set of hypotheses
is created from the analysis of these cases. Cases from other user groups (future or
JJ-A (third row-left) – Textile designer. She has won several design awards in Finland
AA (third row-right) – Industrial designer. Managing director of a small design firm
TK (bottom-left) – Industrial designer. Colors and materials manager at Nokia
VU (bottom-right) – Industrial designer. Freelance designer and student

Co
-Desi
gn
ing
In
ter
ac
tiv
e S
pac
es.
.. 84 extreme users) are analyzed to test the emerging hypotheses. If the case does not
fit the hypothesis, the hypothesis is discarded or revised, adding a new dimension
to the analysis. Hypotheses are tested until the designer has an interpretation that
explains the data thoroughly. Inference allows taking research in design beyond
inspiration, producing understanding of the user by building an interpretation of
the data.
In this case, the main user group consisted of seven fashion and textile design-
ers while the future and extreme user groups consisted of one industrial design
Master student and two industrial designers respectively.
Participants3.5.2 Seven Finnish textile and fashion designers and three industrial designers (Figure
22) were contacted for this study. They were all experienced designers who use MBs
as part of their design processes. All except one had at least 10 years experience in
practice (13 years of experience on average). Although they all graduated from TAIK
(University of Art and Design Helsinki), they varied in their background (textile,
fashion, industrial designers), in age (between 35 and 45), and gender (6 female and
4 male). Three of them worked for large companies (i.e. Stockmann and Nokia), four
of them worked in small design firms that they owned, and the rest did freelance
work for large companies (e.g. Rukka, Luhta, Pentik).
Procedure3.5.3 Ten interviews were conducted between September 19 and December 19, 2006. The
procedure is similar to the one described in contextual inquiries in section 3.4.3.
The main differences were connected to the content of the interview and how the
interviews were captured. First, in this case all participants exclusively presented
and discussed some of their previous projects for which they had used MBs. Partici-
pants usually described between two and five projects. Second, due to confidential-
ity issues, not all sessions were recorded on video. For those interviews in which
video could not be used, notes were made instead. Otherwise pictures were made
during the sessions to capture specific aspects of the work that the participants
were describing. The only exception to this was the last participant whose picture
was made outside the company’s headquarters.
Interpretation3.5.4 After conducting all seven interviews, the interviewer (the author) made tran-
scripts (including photographs) and an initial categorization of the data within 48
hours after the interview. Creating this first round of interpretation right after the
interviews was crucial, especially in those cases where it was not possible to capture
the sessions on video. We had to process the data within that time frame to check

Mo
od
Bo
ar
ds
85
whether or not the notes captured the essence of what participants initially meant.
The transcripts varied between two and ten pages in length depending on the dura-
tion of the interview and whether we had permission to make pictures or not.
Checking with users3.5.5 Each participant was individually approached after the interview for member
validation. A summary consisting of the transcripts and the categories that were
created for each participant were respectively sent to them to check the interpreta-
tion. Participants added comments to the summaries of the interviews and sent
them back. Post-it® notes were used to make transcripts of the summaries. Between
41 and 51 notes were created per interview. The number of notes varied depending
on the duration of the interview (between 60 and 90 minutes). Notes were color-
coded (using a different Post-it® color) to identify the interview and number-coded
to identify the specific note.
Figure 23. MB interviews analysis
AffinityDiagram (top-left) – Reading notes to build the affinity diagram
Categories (top-right) – Creating new categories on the table
Notes left aside (bottom-left) – Discussing notes that were left aside
CheckingwithDutchfindings (bottom-right) – Checking the categories from the previous study

Co
-Desi
gn
ing
In
ter
ac
tiv
e S
pac
es.
.. 86 While we were waiting for our first seven participants to send us their com-
ments back, we conducted three extra MB interviews with industrial designers who
use MBs for their work.
Analysis3.5.6 We assigned meaning to the summaries of the interviews through interpretation
(Figure 23). The analysis team this time consisted of the interviewer (the author)
plus two researchers (Dzmitry Aliakseyeu and Selene Mota), one of which had been
previously involved in the analysis of the contextual inquiries. The Post-it® notes
were used in several in-depth rounds of interpretation with all seven interviews
from fashion and textile designers. The main goal of these interpretation rounds
was to confirm and hopefully expand our initial Dutch findings. For this reason,
we started by grouping notes around the same categories identified in the contex-
tual inquiry study (e.g. client, client-MB maker, MBs, and images). Some of these
categories were naturally confirmed, some were merged into existing categories,
new ones emerged, and some were discarded. In the end, these categories were
processed into more general findings. Between one and eight notes were left out per
interview. These notes often marked changes in the discussion when participants
started describing another project. Other notes were going into details about the
context of the project.
Checking internally3.5.7 We kept three interviews with industrial designers in a separate basket (cases from
other user groups) away from the initial interpretation described in the previous
section. By doing this, we were able to go back to the data and test our existing
interpretation from the fashion and textile designers through an examination of
new cases, each time posing the question does the interpretation still work? This
procedure allowed us to enrich our interpretation, helped us to find limits to the
interpretation, and make generalizations on why designers use MBs.
Findings3.5.8 There is a great amount of overlap between our Finnish and Dutch findings. We will
first share new insights from Finnish participants on the five main categories from
our Dutch findings. We will then expand our findings by presenting new aspects
introduced by our Finnish participants that either challenge or bring a new twist to
our current understanding of MBs.
Dutch findings: Idea development
Finnish MB designers agreed with the idea of MBs being an idea development tool,
one that allows the design team (including the client and other stakeholders) to

Mo
od
Bo
ar
ds
87thoroughly work out together the different design possibilities. Finnish MB design-
ers gave us new insights on how MBs are used when several people (not only one
MB designer and one client) are involved in the process.
Several MB designers within a design team can first use MBs internally and later
involve the client in the process. In such situations, members of the design team go
through the brief, verbally discussing its contents to extract the main ideas and con-
cepts. Later, each team member can individually collect the images that they think
reflect the identified concepts. By collectively discussing the images, they can remove
some of them and create one MB together. AA told us: “Of course there is no total
agreement on what the MB should be.” This way of using MBs allows the design team to
internally explore the design space before meeting the client.
In large department stores, design teams with several MB designers use MBs to
identify future trends for the new collections that will be produced for the depart-
ment store. In such cases, there are no external clients but they rather prepare
internal presentations to different stakeholders (e.g. managers, marketing, buyers)
within the company. The group of designers is divided into smaller teams and brand
managers are appointed for each brand. They hold general meetings to present and
discuss the images selected by each team. “We decorate the room with images. We want
to hear what everybody thinks. We close the door and we try to get in the mood of the
brand,” said LLK. When the MBs are ready, they have a special trend day in which
they have a presentation, play music, and serve coffee. They invite managers, as well
as people from the marketing and buying divisions. Buyers later use these MBs to
find the materials and products needed to create the trend. NH mentioned that, “we
need to work with pictures to explain to our buyers what we have in mind. They want to
buy exactly what we are showing.”
Finnish MB designers reflected on the importance of using MBs to reach an
agreement:
JK: “For the client it’s very good to work this way because when you have visual ×things it’s always easier to talk about ideas and everyone knows what we are talk-
ing about, who we are making this collection for.”
EH: “MBs help reach some level of understanding with the client that words only ×don’t allow. With words we think we can understand each other but the color of a
red tomato for me may be different from the color of a red tomato for someone else.”
Dutch findings: Research an expression
Finnish MB designers agreed with the notion of MBs allowing them to research an
expression. Participants reflected on how inserting several MBs as part of Power-
Point presentations might affect the perception of MBs as a whole. While with a set
of physical MBs it is easier to look at them and compare them in one go, with digital
presentations it becomes a linear story. HH said, “it’s a problem to make (digital

Co
-Desi
gn
ing
In
ter
ac
tiv
e S
pac
es.
.. 88
presentations) that go on and you can’t see the entity, but I think it helps if you take a
printout of the slides and let it stand on its own.” Inline with our findings, Dabner
[2005] indicates that MBs have the advantage that “they can be viewed as a whole
simultaneously, making comparisons and connections easier. Scrapbooks are less
effective because the turning of pages creates an isolated sequence of visual experi-
ences.”
Participants gave us examples of how MBs allow them to research a paradox of
apparently conflicting elements:
For her ‘snow fantasy’ collection, IH combined snow, with nature and technology. ×In the background, she used the Futuro house (1968), a UFO-shaped holiday home
from Finnish designer Matti Suuronen. The buildings were made of plastic. The MB
was a combination between soft and technical things.
Figure 24. Set of eleven MBs for a luxurious clothing line
The apparently conflicting concepts of 'mobility', 'women drivers', and 'Russia' were explored in this set of MBs.
Each MB explored specific aspects of the collection such as ‘the joining of art an science’ and ‘how technology
has been adjusted to be more feminine.’

Mo
od
Bo
ar
ds
89
AA created a set of twenty-three MBs to create ‘color worlds’ for a paint manu- ×facturer. For ‘new luxury’, he collected items that referred to an aesthetic idea of
luxury in relation to having time and space. For ‘mystical bohemian’ he explored an
artist-type style with mystical elements, very rich in colors.
For a luxurious clothing line, NH created a set of eleven MBs (Figures 24 & 25). ×The main concepts of the collection were ‘mobility’, ‘women drivers’, and ‘Russia’.
Each MB explored specific aspects of the collection such as ‘the joining of art an sci-
ence’ and ‘how technology has been adjusted to be more feminine.’
To propose a new color chart for tableware products, HH made a set of MBs. In one ×of them he explored the topic ‘organic-eco-luxury’. It was important to be ecological
but also to find a little sophistication into the colors, especially thinking of central
European markets.
Figure 25. Set of eleven MBs for a luxurious clothing line
Some MBs inlcuded objects (i.e. toy car wheels) to communicate aspects of mobility in the concept 'women driv-
ers'. The wheels also had a practical use as this MB could stand on its own and thus be displayed together with
the other MBs on the table.

Co
-Desi
gn
ing
In
ter
ac
tiv
e S
pac
es.
.. 90 Dutch findings: Communication tool
Finnish MB designers mostly agreed with what Dutch designers had told us about
MBs and how they are used to communicate and inform the design team, clients,
and other stakeholders. However they also added that sometimes in large com-
panies MBs are made available on their Intranet to inspire designers, marketing,
sales, and people in advertising. It is also common that clients and the design team
itself are distributed over the globe, working in different time zones. MBs are then
attached to PowerPoint presentations with some accompanying text embedded in
the presentation or sometimes and extra A4 text document is attached with an ex-
planation of the MB. HH said that, “it had to be a presentation that could stand on its
own as much as possible. (The clients) used this presentation to present it to their bosses
and other people in the factory.” In both cases, Intranet or PowerPoint presentation,
designers are not sure if the intended message is conveyed.
MBs are also used to communicate the final designs to technical people who will
make or build the designs. JJ-A mentioned that, “making a knitwear collection can be
quite complex. It’s very handy to have these MBs to show to the technical persons ‘look,
this is a structure I would like to have, something like this.’” She also reflects on how the
technical people do not necessarily understand the moods, feelings and abstract
ideas behind the boards, but they do understand the technical aspects of the materi-
als or knitwear shown. “It’s also very good for those guys. They are looking ‘what the hell
is this?’ But they understand this part of the structure very well.”
Dutch findings: Involving the senses
Finnish participants agreed that MB designers must use their intuition and involve
their senses to create MBs. Participants also shared a few experiences from industry
in which MB designers involve other senses than just sight. LLK encourages her
teams to think of smell, touch and other feelings. “We try to capture those feelings in
the images and the music that reflect the mood of the trend. The sounds could evoke the
smell of the sea, and the sound of waves.” TK told us that in Nokia, they already create
mood videos that include sound and animation. “You are trying to activate relevant
senses in the presentation with music, sounds, communicate color, with an effect you can
feel.” In this respect, McDonagh and Denton [2005] propose the idea of incorporat-
ing movement, sound and even scents “to offer a multi-dimensional sensorial experi-
ence, which more accurately reflect and respond to modern product design.”
Dutch findings: Naturalistic collection
Finally, Finnish MB designers also agreed with the fact that they have an ongoing
process of collecting materials for their MBs. Most of these materials consist of
images from magazines and occasionally MB designers use their self-made pictures.
AA reflected on the importance of having the right kind of magazines: “It is always

Mo
od
Bo
ar
ds
91important that the material that you have available re-directs (defines) what you get (the
end result). Sometimes you need other types of magazines and not only interior design
magazines.”
Finnish MB designers brought up an interesting discussion regarding copyright
issues when working with images made by other people. EH said: “With copyright you
have to be very careful what to use.” She feels it is safer to use images from magazines
and books because it is public and becomes common knowledge if it is printed. But
on the Internet, she feels it becomes a more personal image. “I think it’s not right.” VU
added: “You normally use parts of pictures. You can take an ad for a big fashion company
and just crop like a pocket, or the fabric, or the texture, that’s ok.”
Finnish findings: Defining the future
MBs help the design team in defining the future. MBs allow designers to shake the
system and create new ideas that cannot be currently found in the market. Design-
ers are defining the new designs and collections two years ahead of their market
release date. Therefore, MB designers try to avoid including both images that show
what is currently available in the market, and that come from the same domain
they are designing for (e.g. not showing pictures of current mobile phones if they
are trying to design the mobile phone of the future). Participant HH told us, “there
is no use in bringing products from the competitors (to the MB) because they are already
known and available in the shops. Here we are talking about the future, and what will
be happening some years ahead.” Participant JJ-A reflected on how she uses images
to define future designs: “It is very difficult to find these pictures because what you are
seeking is new and what the images show already exists, it is always old. However, it
helps tell another person what I mean, what I have in mind.” She later added: “Dis-
cussing about these pictures is not about discussing the specific content or shape of the
pictures because I want something different. I am looking for something else that I don’t
know yet.” McDonagh and Storer [2005] reflected on how style boards usually con-
tain images of existing products which can “lead to an inbreeding of styles, almost
visual plagiarism and may reduce lateral thinking in the inexperienced designer.”
Regarding the use of source images, Eckert and Stacey [2000] have found that im-
ages unconnected to the domain have the “vagueness and ambiguity important for
triggering reinterpretations.”
Finnish findings: Conflicting ideas
Finnish MB designers also mentioned how MBs allow visualizing and exploring
conflicting ideas that make the team and the client think. When MB designers and
clients are confronted with the MB, they are not just looking as passive spectators
but they are compelled to think. When HH was explaining the ‘organic-eco-luxury’
MB, he said: “(With these topics) we have to think in a little different way. ‘Organic-eco-

Co
-Desi
gn
ing
In
ter
ac
tiv
e S
pac
es.
.. 92 luxury’ makes you think. There are many different solutions to find from that. If you only
see the pictures, you make your own conclusions and ideas from what you see. But when
you combine it with the (story), you make the tension, you make it more interesting.”
Participant JK added: “You may use strong pictures with strong words which makes that
awkward combination that makes you think. It really makes you and the client think.”
Finnish findings: Levels of abstraction
MB designers work on different levels of abstraction with MBs. Depending on the
type and purpose of the project, they might decide to keep the discussions on a
more concrete or abstract level. Keeping the discussion on an abstract level allows
one’s thinking to flow and come up with new ideas. Going to a too concrete level
tends to narrow the number of directions for design, cutting out the possibilities
that are in the vicinity of what these visualizations define. MB designers are chal-
lenged to find the right abstraction level to support communication and discussion.
AA reflected on this point: “You stay abstract to be able to work emotions, moods, atmo-
spheres, and inspiration. If you go too concrete into the topics you are dealing with, then
the attention is caught by details that are really uninteresting.” JK said, “with this kind
of work there are different levels: very concrete level (down) or very abstract level (high).
It depends on the project on which level you work. If we start doing some new collection
in a very new way, then we can work on a very abstract level. If we say, ‘this is happening
next year’ then it is very clear where we are going, and we can be more concrete.”
MB designers carefully consider if using MBs will help their clients or not as
not all clients are familiar with working with pictures. This also is true for designers
themselves. This is why experienced designers tend to acknowledge this aspect and
turn to other MB designers, stylists, or photographers who have a feeling for work-
ing with pictures. VU said, “It depends on who you are working for (client).” AA added,
“I have the feeling that most people are not generally capable of discussing the MBs, if you
know what I mean. Without being rude, people who don’t have education that has visual
dimensions, they do not know the language of visuals and, to make it concrete, an engineer,
not all of them but some, instead of seeing the ‘technical’ visual approach, they would
see ‘a bicycle, a knife, and a coffee maker’. That’s not what we want to talk about.” JJ-A
mentioned, “It always depends on the collections and the customers. In the case of the
motorcycle garment collection I made, I am not going to send any MBs to the end custom-
ers. It’s no use to show any trend or fashion ideas because they have their own fashion. If
I go to the motorcycling people with this (fashion MBs) they would laugh at me.” TK told
us about the use of mood videos: “For some teams it is not so good to have a mood video
out there because they are too abstract for them. They prefer to talk about concrete things.
The very beautiful thing is that people learn and if you work together you can request more
abstraction.”

Mo
od
Bo
ar
ds
93Similarly to what Dutch designers told us, MB designers mostly avoid using
pictures of famous people as they would bring a new dimension and could create
a distraction from the topic. TK mentioned that, “if the face leads you to think about
something specific only, then that is limiting you, it is a stereotype. We can refer to dif-
ferent personalities but referring to a specific face could be too limiting. It should not be
forced to you nor dictated to you.” However, on very few occasions MB designers might
include a picture of a famous person (e.g. Madonna) if it would sharpen the ideas
behind the MB or if they wanted to make a statement. Bonnici and Proud [1998]
suggest reconsidering the selection of an image “if an image jumps out, or if the eye
moves around the selection.”
Finnish findings: Telling a story
MBs always tell a story. MBs create a frame for MB designers to tell real stories
about people and their lives; about their dreams, aspirations, and products they
like. Finnish MB designers use MBs to tell stories about groups of people they
are designing for, with their different mindsets and lifestyles. Each MB reflects a
different lifestyle: ‘artist businessman’, ‘romantic countryside’, or ‘independent
Scandinavian woman.’ JK said, “it helps us think whom are we designing for, what
are we doing, and why are we doing it.” JJ-A added, “when I present these images I am
telling a story about the type of woman who is using this design. Women who are happy,
easy going, who take time for themselves, who have to travel but like to stay at home.”
For another project, JJ-A used an old postcard she found while she was in Paris that
inspired the story behind her design. “It’s not about exactly what the picture is telling
me but the story I can build around the picture.”
In the case of MBs that are included as part of PowerPoint presentations, HH
said: “There is always a story that we tell, the story is strongly connected to the pictures.”
However because people from other departments may see these presentations they
will also include a few words. “We can’t really trust that our message goes through only
by telling it in the meeting. It has to be written somehow because the material stays there
and it has to be understandable. It needs to consist of pictures and words.”
Finnish findings: Several interpretations
Finnish MB designers stressed that one of the richest aspects about MBs is that
they are purposely ambiguous and thus there are several possible ways to interpret
them. There is no right or wrong interpretation to be made. MBs create the condi-
tions for different people to have a productive discussion together. MB designers
avoid spending too much time explaining or defending the MB, as this is not their
main purpose. MB designers guide their clients through, telling the story behind it
so they can understand it, but they are mostly interested in how the clients perceive
it. TK told us: “Having a constructive discussion and receiving feedback is extremely

Co
-Desi
gn
ing
In
ter
ac
tiv
e S
pac
es.
.. 94 important. When I present a MB everybody wants to give their interpretations.” AA also
reflects on this point: “Unlike written text or mathematics, we are in an area where
nobody can say, ‘this is exactly right.’ What is important is that we have an agreement on
the holistic view, that everybody has somewhat the same ideas in their head when they
are talking about the topic, but then everybody can have different opinions.” New inter-
pretations are made in this process of discussing the MB, also by the MB designer.
SummaryofFinnishfindings3.5.9 Regarding the previous Dutch findings, Finnish MB designers mostly agreed with
them. However, they introduced new aspects to the existing interpretation. First,
they gave us new insights on how MBs are used when several people (not only one
MB designer and one client) are involved in the process. For example, several MB
designers within a design team can first use MBs internally and later involve the
client in the process. In large department stores, design teams with several MB
designers use MBs to identify future trends that are later presented to different
stakeholders (e.g. managers, marketing, buyers) within the company. Second, par-
ticipants told us about how MBs are inserted as slides in a digital slides presenta-
tion (e.g. PowerPoint) and how having a separate and sequential structure affects
the perception of MBs as a whole. Third, participants expressed uncertainty that
the right message or story is conveyed when MBs either stand alone or are inserted
as part of a digital slides presentation, and are made available on the Intranet of
large companies without the MB designer being able to explain the MB. Fourth,
Participants also shared a few experiences from industry in which MB designers in-
volve other senses than just sight, creating mood videos that also include sound and
animation. Finally, Finnish MB designers also brought up an interesting discussion
regarding copyright issues when working with images made by other people. The
rest of the findings consist of new aspects introduced by Finnish participants.
MBs help the design team in defining the future. MBs allow designers to shake
the system and create new ideas that cannot be currently found in the market. De-
signers are defining the new designs and collections two years ahead of their market
release date. MB designers avoid including both images that show what is currently
available in the market, and that come from the same domain they are designing for.
MB designers work on different levels of abstraction with MBs. Depending
on the type and purpose of the project, they might decide to keep the discussions
on a more concrete or abstract level. MB designers are challenged to find the right
abstraction level to support communication and discussion. MB designers carefully
consider if using MBs will help their clients or not as not all clients are familiar with
working with pictures.
MBs allow visualizing and exploring conflicting ideas that make the team and
the client think. When MB designers and clients are confronted with the MB, they

Mo
od
Bo
ar
ds
95are not just looking as passive spectators but they are compelled to think.
MBs always tell a story. MBs create a frame for MB designers to tell real stories
about people and their lives; about their dreams, aspirations, and products they like.
MB designers use MBs to tell stories about groups of people they are designing for,
with their different mindsets and lifestyles.
MBs have several interpretations to them. There is no right or wrong interpreta-
tion to be me made. MBs create the conditions for different people to have a produc-
tive discussion together. MB designers avoid spending too much time explaining or
defending the MB, as this is not their main purpose. MB designers guide their clients
through, telling the story behind it so they can understand it, but they are mostly
interested in how the clients perceive it.
Discussion3.6 As a general remark, there was a significant amount of agreement and overlap
between the Dutch and Finnish findings. In the following sections we will present a
few differences that we spotted along the way.
Design disciplines3.6.1 Industrial designers used MBs in the traditional sense that we have described in
this chapter, namely with the MB designer and the client involved from the very
beginning in idea development of new products or services. Textile and fashion
designers used MBs to define and create trends for their future collections. As such,
MBs were initially used for their own inspiration, helping them identify what will
be the new fashion trends in the international markets. Only later on in the pro-
cess, MB designers involved their clients in the process.
Market size3.6.2 As we mentioned in the introduction to this chapter, we spotted a difference in
market size. The Dutch designers we interviewed differed in the scale of the projects
and the type of clients (from global campaigns for large international companies, to
small projects for the local town hall). This gave us a feeling that the Dutch market
was more internationally oriented than the Finnish market. Our Finnish partici-
pants also worked for small to large clients, but they only rarely mentioned projects
outside Finland.
The second main difference we found in relation to market size was connected
to the purpose of using MBs. In the larger Dutch market designers could be almost
exclusively devoted to making MBs. Clients would approach MB makers for their
ability to work with images. These MB designers left the rest of the design process to
other design professionals. In the smaller Finnish market, all designers I interviewed
were exclusively using MBs as part of their own design process, which gave us richer
feedback on the actual use of MBs.

Co
-Desi
gn
ing
In
ter
ac
tiv
e S
pac
es.
.. 96 Country3.6.3
The most notable difference we found when we compared our findings was related
to the Finnish participants’ sense of pride for their country and the Scandinavian
design tradition. When they explained their MBs to us, they would often say things
like:
EH: “I used blue and turquoise because Finnish people love (that color), it is the ×color of our flag.”
JK: “This is the basic Scandinavian style with colors and materials that many ×people here in Finland use, for example white, wood and blue, the color of Finland”
AA: “This MB refers to honest, Finnish, simple, and fresh food that should be at- ×tractive but easy to approach.”
They would also include in their MBs references to other famous Finnish de-
signers through motifs or designs created by them (e.g. an Alvar Aalto chair, or the
Futuro house by Matti Suuronen). Participant IH also referred to her country when
she spoke about how she deals with ethical issues of her designs: “I want to support
Finnish work. So we make the production here in Finland, using Finnish materials. I don’t
want them to be made in the far-east where I don’t know who is making the clothes and if
they are getting paid enough.”
Again, differences in market size might play a role in this perception that Dutch
designers do not refer to their country in their designs as often as Finnish designers
do. It might also have to do with the fact that the Dutch market is more interna-
tionally oriented than the Finnish market. However, it seems that design is closer
to people’s everyday lives in Finland (at least in Helsinki) than in the Netherlands.
Finnish design can be found everywhere in Helsinki: in its large Design district; in
Alvar Aalto’s buildings, chairs, and vases (Figure 26, two images at the top); also in
Kaj Franck’s revolutionary tableware for Iittala (Figure 26, bottom-left) that nobody
had the courage to redesign as it had become an icon of Finnish design; or in Eero
Aarnio’s Ball Chair (Figure 26, bottom-right) that you can find in Arabia’s public
library to actually sit in it and read a book. All these recurring aspects came up in
one way or another during the interviews. Originally from Slovenia, participant
VU shared his views on Finnish design: “There is a different attitude (here in Finland)
towards design. Everybody here is really respectful about design.”
The essence of MBs3.7 Based on the findings from the Dutch and Finnish studies, we were able to build an
understanding of what MBs are.
Definition3.7.1 We propose a definition of MBs (Figure 27) as a way to communicate our under-
standing on the activity that we have conducted our research on. This definition

Mo
od
Bo
ar
ds
97
consists of eleven statements. Each statement summarizes one or more findings
from our Dutch and Finnish studies. As such, next to each statement we have repre-
sented the corresponding finding it emerged from.
Process3.7.2 Based on both studies, we also created a work-modeling diagram (Figure 28) that
represents the different strategies used by MB designers in the course of the
process of making MBs. The diagram consists of two main parts. The left part of
the diagram represents the fraction of the process when MB designers are actively
involved in making a MB. It consists of five loops: definition, collection, creation,
building and presenting. On the right, we have represented the collection loop, or
the MB designer’s parallel ongoing activity of collecting images, regardless if they
are currently involved in a MB project or not.
The process begins when the client contacts the MB designer and together
they enter the definition loop where they hold a series of meetings in which they
define the context of the project and begin research by building a client profile. After
Figure 26. Finnish designs
Paimio Chair (top-left) – Designed in 1931 by architect and designer Alvar Aalto (1898-1976)
Vase (top-right) – Also designed by Alvar Aalto in 1936
Kartio glasses (bottom-left) – Designed in 1958 by Kaj Franck (1911-1989)
Ball Chair (bottom-right) – Designed in 1966 by Eero Aarnio (1932-)

Co
-Desi
gn
ing
In
ter
ac
tiv
e S
pac
es.
.. 98
rounds of discussion, the MB designers enter the creation loop where they find in-
spiration by looking for images that trigger their imagination. Once they have found
the right elements for the MB, they will build a story around them, carefully taking
into account several aspects of visual composition (e.g. atmosphere, feeling, para-
dox, whole). MB designers and their clients hold a series of meetings to check the
interpretation, and reach an agreement. In the building loop, MB designers tailor the
MBs to match the client’s needs. They give finishing touches to highlight certain im-
Figure27.DefinitionofMBs
It consists of eleven statements that summarize one or more aspects of the Dutch and Finnish findings
Research anexpression
Mood boards are an idea development tool
used by designers and their clients to communicate,
think, and share their di�erent views
that emerge from the design brief
while de�ning future products or trends.
Although di�erent types of media can be used,
they mostly consist of images
used in di�erent levels of abstraction
to tell a story about the company, product, or audience,
and setting a direction for design.
There is no right or unique interpretation of a mood board.
Dutch�ndings
Finnish�ndings
Ideadevelopment
Communicationtool
Severalinterpretations
De�ningthe future
Levels ofabstraction
Telling astory
Con�ictingideas
Involvingthe senses
NaturalisticCollection

Mo
od
Bo
ar
ds
99
portant aspects of the MB (e.g. format, identity, text, materials). MB designers also
define the final expressive details (e.g. blurring images by adding semi-transparent
color paper) that will better help communicate the expression they want to achieve
before mounting or gluing the final MB. In the final presenting loop, MB designers
get together with their clients to check if the intended message or vision is conveyed,
and to receive feedback. Finally, MB designers decide on aspects of distribution (e.g.
Figure 28. Work-modeling diagram
The different strategies used by MB designers are represented here. The five main loops are represented as
hexagons, while the milestones and activities are shown as notes in darker and lighter shades of grey respectively
Building
Tailor
Research
Inspiration
Collect
Categorize
Trim
Details
Store
Context
Elements
StoryVisual
Composition
De�nition
Creation
Collection
Distribution Backup
Contact
Meetings
Final MB
Loop ActivityMilestone
Presenting
Feedback
Message

Co
-Desi
gn
ing
In
ter
ac
tiv
e S
pac
es.
.. 10
0 one MB or several booklets), and how to backup their work, especially when they
give the original MB to their clients.
In the collection loop, MB designers are constantly looking for new materials for
their MBs. They first collect images that trigger MB designers internally due to their
visual properties. Then they must categorize and store their collection in an order
that is very personal and only makes sense to them. Finally, they must periodically
trim their collection to keep it updates and to allow new material to be stored.
The six stages3.7.3 From our previous studies, we have identified six stages in the MB making process
that offer opportunities for new and interesting AR designs:
Collecting ×Browsing ×Connecting ×Building ×Expanding ×Presenting ×
First, designers begin by roughly collecting images from magazines, the Internet,
and occasionally their own personal collection of images. This first stage relates to
the collection loop of the work-modeling diagram (Figure 27). The next two stages
are connected to the creation loop. Once designers feel they have enough material to
work with, they will move on to the second stage, browsing. Here designers can spend
a considerable amount of time pre-selecting images that will help them build a story
or say something about the target audience, product, or company they are designing
for. Third, through connecting, designers sort the pre-selected images in a simple and
flexible way by assigning them to categories (usually up to 30 images per concept).
Fourth, designers start building the MBs by thinking how they want to arrange the
images and create different layouts. Naturally, this stage is connected to the building
loop. The fifth stage, expanding, is not linked to a specific part of the work-modeling
diagram but is a more holistic view on the complete process. Expanding refers to
exploring future possibilities for supporting the creation of MBs by involving other
senses (not just sight), and using other types of media (e.g. music, animation, video).
In the final sixth stage, presenting, designers and clients meet face-to-face to share
and discuss the intended story behind the MB. Designers create a single large MB or
a series of smaller booklets for their clients to keep and share with other stakehold-
ers. This last stage refers back to the presenting loop.

Mo
od
Bo
ar
ds
101Considerations for a MB making tool3.8
Support idea development3.8.1 In our studies we have learned that mood boarding is an idea development activity
that goes beyond the making of the physical MB. There is a series of steps both
the MB maker and client go through before and after creating the MB itself. For
example, several meetings take place along the process of making MBs to discuss
and present the progress.
New tools should support mood boarding as an idea development activity, rather ×than mood boarding as the creation of the object. The tool should provide support
for the different steps of the MB making process, including the activities involved
before and after the actual act of building the MB.
Encourage two-way communication3.8.2 From our contextual inquiries we learnt that keeping a good communication
between the client and the MB maker helps establish a positive relationship. This
relationship will define how both parties interact throughout the process. MB
makers must also present and communicate the result of their work to their clients.
However, it is also important how clients perceive the MB, the feedback they pro-
vide, and the discussions triggered.
New tools should encourage two-way communication between the client and the ×MB maker needed for successful MB design.
Involving the senses3.8.3 MB makers involve their body and mind in the process of making MBs. It is a state
of mind in which all their senses are involved allowing them to use their intuition
on finding the right elements for a MB. They use touch to browse the pages of the
magazines, to feel the paper, to cut images, to create piles of images and to place
images when they are working on the layout of the MB. They use sight to select vi-
sual aspects that images convey (color, shapes, textures). They use hearing to work
with sounds or music related to the themes or user group they are working with.
They like the smell of paper when they are working with different types of paper.
New tools should encourage using other senses than just sight. Tactile and auditory ×feedback should be provided when supporting the process of making MBs.
Holistic interactive space3.8.4 The process of making MBs goes beyond the activities and the time spent at the
designer’s table. MB making is a dynamic and iterative process in which designers
are constantly moving from one place to another. They are also switching activities,
going from searching (e.g. images), to making (e.g. layout, gluing), then going back

Co
-Desi
gn
ing
In
ter
ac
tiv
e S
pac
es.
.. 10
2 again to find the missing image that fits, and also presenting.
New tools should create a holistic and integrated interactive design space. Instead ×of aiming at one interactive tool (e.g. table, wall, floor) that concentrates and pro-
vides support for all parts of the MB making process, there should be an emphasis
on the importance of the whole room and the interdependence of its individual
tools.
Merging with the real context3.8.5 Addressing the context of use is an essential part of supporting the work of design-
ers. The process of making MBs takes place in different contexts both in and outside
of the design studio. For example, in the beginning of the process, designers can
spend a considerable amount of time looking for images. Designers will usually pre-
fer going through their large collections of magazines and images while comfortably
seated on a couch, in a coffee corner, or at the coffee table in a living room (when
working at home), where they can freely start creating ad hoc piles of magazines and
pictures.
New tools should carefully address the specific context of the activity they are aim- ×ing to provide support for. Not only should they provide support in different physi-
cal places but they should also consider the nature of the activity. For instance,
some activities might require a more relaxed setting (e.g. image browsing) and
others a more formal one (e.g. meetings and presentations).
Flexible and intuitive interaction3.8.6 From our user studies we have learned that for activities involving creation design-
ers prefer working with their hands and with tools that allow flexibility and intuitive
interaction (e.g. the use of pen and paper). Designers prefer working with both
hands towards achieving a goal, using their hands collaboratively where one hand is
doing something different than the other, as when one is using a knife and fork.
New tools should provide flexible and intuitive interaction through hand move- ×ments and other modalities (e.g. speech), allowing designers to perform tasks as
naturally as they do now.
Conclusions3.9 After identifying the creation of MBs as a concrete activity, I went in depth trying
to understand what the essence of MBs is. I have done that through two means: by
conducting contextual inquiries with Dutch industrial designers, and MB inter-
views with Finnish textile and fashion designers. After these studies I have been
able to come up with a definition of MBs, and a detailed description of the process
of making MBs, which I have later summarized into the six main stages of the MB
making process. In the process of trying to understand current design practice with

Mo
od
Bo
ar
ds
103
respect to MBs, I was also trying to obtain some initial ideas about how AR could
possibly provide support (Figure 29). The observations I did in these two studies,
also allowed me to identify my research hypothesis of funky-design-spaces.
Funky-design-spaces research hypothesis
Based on the findings from the previous studies I have come up with the vision of
a new holistic design studio, a comfortable space for creativity that helps designers
keep a good attitude. This space would create a positive effect [Norman 2004] that
facilitates creative thinking in designers. Within this larger context, the process of
making MBs would be supported by different funky-design-spaces or tools that are
interconnected and help break the rhythm [Keller et al. 2006], stimulating design-
ers to move around their design studios. Therefore our main research question
became could these funky-design-spaces support the creation of MBs?
Figure 29. Mood board example: 'Essence' MB put together by the author
This MB was created as a way to communicate and summarize the main findings from the studies on MBs. Some
of the topics included in this MB are 'playfulness', 'movement', 'idea development', 'intuitive interaction' and 'levels
of abstraction'.

Co
-Desi
gn
ing
In
ter
ac
tiv
e S
pac
es.
.. 10
4
co-design
Co
-Desi
gn
105Co-Design4
This chapter is based on the article: Andrés Lucero & Kirsikka Vaajakallio (2008) ×Co-Designing Mood Boards: Creating Dialogue with People. In Proceedings of
IASTED HCI 2008, ACTA, 254 – 260.
Problem4.1 After observing and talking with practicing designers on how they make MBs in
their studios, it was time to consider some of the difficulties and opportunities of
supporting the creation of MBs with AR. As a practicing designer, I felt confident
of being able to take all the information I gathered during the user studies and find
inspiration to propose, implement and evaluate my own solutions. All the effort I
put into understanding something (apparently) as simple as MBs would now help
a single designer (me) propose new concepts. There was something very un-user
centered about this. There would be a large portion of the process without user
involvement up until the final evaluations of the tools.
In a personal communication with Yngve Sundblad at NordiChi 2006, he said
about my research process: “People think UCD or participatory design is giving all the
power to the users, and that is not the case. Of course the kind of professional knowledge
(i.e. design practice) that you have, and the knowledge that technical people and program-
mers have, should also be involved in (the design of solutions). But the important thing is
that users are experts on their own situation, and they can give you something. In this case
industrial designers can give you a lot. So I would encourage you to continue with UCD
design and involve users in designing.” As I firmly believed in the UCD approach I had
been following until now, I decided to fully involve users in the creative process of
finding solutions to support their work by conducting co-design sessions.
Related work4.2 Several authors have explored ways of actively involving real users and other stake-
holders in the design process by inviting them to shape future artifacts in different
lab settings. Some studies have also emphasized envisioning future opportunities
with potential users in real context (e.g. in an office) and on the move (e.g. going
to visit a client) while users perform their everyday activities in order to see both
what is and what could be [Iacucci & Kuutti 2002]. This related work section covers
co-design labs set up in real and artificial contexts.
Design labs in real context4.2.1 The Design Collaboratorium [Buur & Bødker 2000] emerged as a way to overcome
the limited notion of usability labs. They emphasize workshops as a vehicle for
collaboration in which the real use context is addressed, the emergence of use is
studied, and where different stakeholders work together in an integrated design

Co
-Desi
gn
ing
In
ter
ac
tiv
e S
pac
es.
.. 10
6 setting. However, because its main goal is to bring together the development team,
user involvement varies greatly across projects, and in some cases users are not
involved at all. Design:lab [Binder 2007] is a collaborative space of designerly explo-
ration that takes advantage of a controlled environment and uses experimentation
to go beyond observation in the real context towards prototyping possible changes.
Design:lab takes place in real context (e.g. factory), combining the existing work en-
vironment (e.g. production room) with more controlled areas (e.g. factory cantina).
In Design:lab authorship is shared meaning that lab partners have equal rights
authoring the design work. The lab provides a setting for exploring the design space
with the people involved, and thus its outcome is not the final design but rather the
ground to start the actual design.
Designlabsinartificialcontexts4.2.2 In the Design Lab [Brandt 2006] users and other stakeholders engage in a conver-
sational design practice based on a series of design events focusing on collabora-
tive inquiry and participatory design. During the sessions, data from field studies
(i.e. video ethnography and probing [Binder 2007]) is fed in the form of design
artifacts (i.e. ethnographic video-snippets in the form of cards) to bridge the gap
between the lives and experiences of the different stakeholders. The sessions are
driven by events, working with the design notions of “staging, evoking, and enacting.”
Johansson [2005] takes a similar approach in collaborative design sessions where
designers and future users build future scenarios using data from probing and video
snippets as sketching material. In the Co-Experience Environment [Ivey & Sanders
2006] users were invited to co-design a physical environment for co-experience. A
small group of users with shared expertise were recruited to allow the research to
evolve as an activity of equitable collaboration. Similarly to what we did, for the
Co-Experience Environment participants previously worked on a probe package
that later helped the designer to create two spaces. Users were invited to experi-
ence these spaces and give feedback on the overall experience. As such, in their case
users were not actively involved in the design of the first two spaces but provided
inspiration for the design of future co-experience environments.
Approach4.3
Design labs4.3.1 Practitioners from different fields of research and design have understood the
importance of involving diverse groups of users in the generation phase of novel
artifacts, and thus facilitating participation has become one of the cornerstones of
designing [Brandt et al. 2005]. Researchers have started to see everyday people not
only as the recipients of the artifacts of the design process, but as active partici-

Co
-Desi
gn
107pants in the design and production process itself, capable of adapting products
to better meet their own needs [Sanders 2006a]. As a result, new methods and
approaches aiming at bringing design (and research) teams together with relevant
stakeholders to work collaboratively throughout the design and development
process arise continuously [Buur & Bødker 2000, Johansson & Linde 2005, Brandt
2006, Ivey & Sanders 2006, Binder 2007]. While various articles discuss the ben-
efits of using these methods, there is a lack of studies that concentrate on what is
actually going on in the co-design situations.
Funky-design-spaces hypothesis4.3.2 The previous user studies with Dutch and Finnish MB makers have shown that
the process of making MBs takes place in different contexts both in and outside
of the design studio (section 2.3.8). For example, in the beginning of the process,
designers can spend a considerable amount of time looking for images. Designers
prefer going through their large collections of magazines in a comfortable place
where they can freely start creating ad hoc piles of magazines and pictures [Lucero
et al. 2007]. The process of making MBs also goes beyond the activities and the time
spent collecting and arranging images on a table. MB making is a dynamic and it-
erative process in which designers constantly switch between searching and making
(e.g. layout, gluing), then going back again to find the missing image that fits. MB
makers must also go out and meet their clients at different stages of the process to
discuss ideas and present their results.
Based on these findings, the funky-design-spaces hypothesis has been defined.
It is a vision for a new holistic design studio, a comfortable space that facilitates cre-
ative thinking in designers. Within this larger context, different funky-design-spaces
or tools that are interconnected and stimulate designers to move around their design
studios would support the process of making MBs. These funky-design-spaces should
encourage breaking the rhythm and doing activities away from the designers’ desks
[Keller et al. 2006].
Practicing designers have been invited to test the funky-design-spaces hypothesis
by co-designing these spaces with us. We (the author and Kirsikka Vaajakallio) or-
ganized dialogue-labs with two objectives in mind. First we wanted to present space
scenarios that are mapped to the different stages of the MB making process, obtain
feedback, and develop them further. As such our first research question is how can
these funky-design-spaces support the creation of MBs for designers? The second objec-
tive was to study how different materials can support the dialogue between people
when co-designing novel concepts. Therefore, our second research question is how do
different materials affect the dialogue and idea generation during co-design sessions?

Co
-Desi
gn
ing
In
ter
ac
tiv
e S
pac
es.
.. 10
8
Dialogue-labs to test our hypothesis4.3.3 In our dialogue-labs we brought participants into a controlled environment that
mimicked a design studio. This allowed us to test the hypothesis of different funky-
design-spaces, without confining ideas to preconceptions of what a design studio is
Figure 30. Finnish participants in the different stages
KB (top-left) – Designer at IDEO in collecting
KS (top-right) – Freelance industrial designer (right) in browsing
TW and JJ-L (middle-left) – Industrial designer (left), and design researcher (right) in connecting
FSW and TM (middle-right) – User interface researcher at Suunto (left), and design researcher (right) in building
AA (bottom-left) – Managing director of a small design firm in expanding
NS (bottom-right) – Freelance industrial designer in presenting

Co
-Desi
gn
109supposed to be like or leading them to think of their current design studio spaces.
We encouraged them to think of an ideal design studio that could be large enough to
home these different funky-design-spaces. Although we understand and stress the
importance of context when studying the work of designers [Vaajakallio & Mat-
telmäki 2007], we felt that we had enough contextual information from the previ-
ous studies described in chapter 3.
Finnish co-design sessions4.4
Method4.4.1 We set up co-design activities in workshops, which we call dialogue-labs [Lucero &
Vaajakallio 2008], in order to develop future ways of creating and communicating
MBs together with practicing designers. In dialogue-labs different types of locations,
tasks, and materials spark conversation and an exchange of ideas between research-
ers and participants (i.e. end users). By engaging in activities that rely on visual and
tangible materials the complete design team involving researchers and participants
is able to approach a given design problem from different entry points or perspec-
tives and thus come up with novel design concepts. As an example, sketching is
used by participants of the dialogue-labs to deal with the proposed design problem
through the language of designing [Schön 1983], combining verbal and non-verbal
expressions while sketching, by drawing and talking in parallel.
Participants4.4.2 Eight practicing designers took part in our co-design sessions in Finland (Figure
30). Each session involved four people: two designers plus two researchers (the
author and Kirsikka Vaajakallio) who acted in a double role of facilitator/designer.
We primarily contacted experienced MB makers who were familiar with the ongoing
research as they had previously been involved in MB interviews. All participants
had at least 5 years of experience in design practice (7 years of experience on aver-
age). The participants varied in their education (university/academy), age (between
28 and 36), and gender (6 female, 2 male).
The dialogue-labs (FI)4.4.3 The setting for the Finnish dialogue-labs was a large room (4m85 x 5m95 x 3m70)
at the University of Art and Design Helsinki (TAIK), which was arranged to look
and feel as much as possible like a real design studio including working tables,
magazines, drawing materials, chairs and sofa (Figure 31). We aligned activity and
process by setting the space according to the six stages of the MB making process
that we previously identified (Figure 32): 1) collecting, 2) browsing, 3) connecting, 4)
building, 5) expanding, and 6) presenting.

Co
-Desi
gn
ing
In
ter
ac
tiv
e S
pac
es.
.. 11
0
The aim was to obtain feedback from designers for this layout, but also to
provide a basic structure for the co-design sessions in order to encourage discussion
around the specific areas. The overall task was imagine new scenarios or future ways
of creating and communicating MBs. Each stage had a corresponding location within
the room, materials, and task that was formulated in an abstract-enough way so that
Figure 31. The Finnish dialogue-labs
A large room in TAIK was arranged to look and feel like a real design studio
Figure 32. Map of the Finnish dialogue-labs
The space was distributed according to the six stages of the MB making process. Different materials could be
found in the different stages
collecting expanding
browsing
buildingconnecting
presenting
closing discussion
1. collecting(vest, glass containers, magazines, camera)
2. browsing(laptop, video, couch,2 magazines, camera)
3. connecting(scenario cube, standing up,acting out, camera)
4. building(image cards, contact sheets,booklet, scissors, glue, paper)
5. expanding(DJ scenario, drawing, paper,pens)
6. presenting(laptop, projector, video,gloves, camera)
extra: closing discussion(carpet, pillows, Playmobil, camera)

Co
-Desi
gn
111
Figure 33. Materials used in the dialogue-labs
Cards (top-left) – Cards were available at each stage to explain the situation, the materials, and the task
Inspiring view (top-right) – A stage was set by an open window with a view on the sea for inspiration
Make Tools (middle-left) – Explorer vest, glass containers, and make tools to act-out or prototype their ideas
Connecting cube (middle-right) – Each side depicted situations where people make associations between things
Collage (bottom-left) – Images from magazines, contact sheets, and a booklet to build a MB
Sketching (bottom-right) – A real-life scenario, pens, and paper to draw new scenarios that add new senses
designers could feel inspired to think beyond how MBs are now made and used, and
to think of novel ways of making them. In each stage there were cards available to
indicate the situation, the materials, and the task (Figure 33, top-left).

Co
-Desi
gn
ing
In
ter
ac
tiv
e S
pac
es.
.. 11
2 Collecting
Designers now mainly use magazines to find contents for their MBs. However,
sometimes they also need to collect other materials to express a given mood or
atmosphere in their MBs, for example sound, video, smells, textures, or colors. We
encouraged the team to think about these new possibilities for novel content for
a MB. This stage was set by an open window with a view on the sea to help them
transport themselves beyond the physical space of the design lab (Figure 33, top-
right). We used the idea of going on a hunt to collect different sensations. Magazines
were lying on the table illustrating the current situation, while more ambiguous
material was used to evoke future possibilities. Abstract physical materials (Figure
33, middle-left) aiming to stimulate creating new devices or interactions included
an explorer-like vest with pockets, glass containers with a cork similar to those
used in chemistry class to keep the captured sensations, and a set of make tools (i.e.
Velcro modeling) that allow people to prototype and express their ideas [Sanders &
William 2001]. The task given was what types of new sensations could be collected for a
MB, and how could they be collected?
Browsing
Designers now browse through their magazines searching for images for MBs.
They may look for images at a table, in a coffee corner, or while seated on a couch.
Two magazines were lying on a coffee table to allow reenacting how designers now
browse magazines when searching for images. Additionally, we presented a video of
a digital tool that allows browsing images on a coffee table [Lucero et al. 2007]. The
video itself was shown in a coffee-corner context: the laptop on which the video was
shown was set on a coffee table and participants were seated on a couch. The video
is presented without sound to inspire by showing an example of browsing, but we
encouraged the teams to explore beyond the contents of the video. The task was
how could different types of contents or sensations for a MB be browsed?
Connecting
This stage refers to the process when designers select, group, pile, and make rela-
tions between different images to later include them in their MBs. In an attempt to
inspire designers to think of similar situations in which people connect things, we
created a scenario cube (Figure 33, middle-right). The cube measures 20 cm on each
side and represents the following situations: 1) A DJ browsing different sounds,
deciding which tracks make for a better mix, 2) a naturalist (e.g. Charles Darwin)
adding a new specimen to his collection, 3) a cook with a rack full of different spices
and flavors, 4) dancers and the set of movements that make a dance piece, 5) a tai-
lor touching different fabrics for his latest design, and 6) a librarian visually keeping
track of the available books.

Co
-Desi
gn
113The purpose of the scenario cube was to trigger discussions based on the
examples contained on its six sides. This stage was set on a wall that was covered
with white paper and Post-it® notes that varied in color and shape. The task was how
would you keep track and make connections with the different contents you have for a MB?
Building
Designers have different ways to handle a collection of images prior to start
building their MBs. For example, they may have images torn from magazines, or
thumbnails of images downloaded from the Internet. This stage was set by a table
in a corner of the room on which we placed different ways to handle a collection of
images: a set of A6 cards, an A3 contact sheet with smaller pictures, and an image
booklet that designers can browse by sliding images (Figure 33, bottom-left). Using
the images and materials found on the table, we asked them to create a collage of
different ways how designers could build a MB. We expected the different types of
collections and the task of creating the collage to inspire designers to think of new
solutions. The task was how could designers put together new and different types of
contents in a MB?
Expanding
Some designers experiment with their MBs by including other senses in them such
as using simple sounds or animation. We presented a real scenario proposed by the
Finnish participant HH during the MB interviews. The scenario shows the situa-
tion of a designer who runs his own small company and creates MBs as part of his
daily work. At night, he works as a DJ and uses his hands now to select the best
bits of music. He wonders how he could add some of his musical creations to his
MBs to help him better convey some of the feelings he has in mind. This scenario is
presented as an A2 print on a table. We provide pens and paper so participants can
draw on top of the proposed scenario, thinking of new solutions to add music or
sound to MBs as a starting point (Figure 33, bottom-right). However, other types
of contents or sensations could also be added to MBs (e.g. video, smell, animation,
textures, etc.) The task was what other novel elements or contents could be added to a
MB to better convey a feeling or an atmosphere, and how could they be added?
Presenting
Usually designers directly present their MBs to their clients. However, sometimes
MBs stand alone as part of a PowerPoint presentation in an Intranet and the de-
signer is unable to convey the story behind it. For this stage, we presented a video
that showed a designer (the author) presenting a MB. Once again, the video itself
was shown in a similar context as the one portrayed in the video: the video was
projected on a wall. Sound was also omitted to prevent the team from going directly

Co
-Desi
gn
ing
In
ter
ac
tiv
e S
pac
es.
.. 11
4 towards the proposed solution. We provided a pair of gloves to invite the team to
explore and act out different types of interaction using their hands and/or body.
We asked participants to watch the video (with no sound) and try to assign (new)
meaning to it. The task was how could the story of a MB be communicated differently?
Procedure4.4.4 Four co-design sessions were conducted in August 2007 at the University of Art and
Design Helsinki (TAIK). The sessions were planned for a total of two hours. The ses-
sions consisted of six parts:
Introduction – sensitizing – consent forms (15 min.) ×First co-design session in pairs (45 min.) ×Share and discuss outcomes (15 min.) ×Second co-design session together (20 min.) ×Closing discussion (15 min.) ×Debriefing – questionnaires (10 min.) ×
Introduction – sensitizing – consent forms (15 min.)
To create a comfortable and relaxed atmosphere, participants were greeted and
introduced to each other as they arrived as if they were coming to our home [Ivey &
Sanders 2006]. We began by reading together our definition of MBs (section 3.7.1)
that summarizes the main findings from our Dutch and Finnish studies, followed
by a short discussion to build a common understanding of the main theme of the
session. We later explained the two main purposes of the session, namely studying
how co-design sessions should be conducted, and obtaining ideas for future designs.
We suggested them to think of technologies they could expect to be common in five
years time to avoid both having wide sci-fi ideas, or ideas that are limited to current
possibilities. Finally, all participants (including the researchers) read together and
signed a consent form.
First co-design session in pairs (45 min.)
We formed two pairs consisting of one designer and one researcher/designer, also
taking into account diversity of expertise with MBs so that highly experienced MB
designers would be paired with the other researcher (Kirsikka Vaajakallio) whose
primary expertise was on co-design. Based on these six stages of the MB making
process, each pair was asked to think of new scenarios or novel ways of interacting
with a tool that supports the creation of MBs. Participants could focus their explo-
ration on functionality, space, or whatever came to mind. We suggested starting
from the most critical stage for MBs, or the one that requires more dedication or
time. Each pair spent on average 15 minutes in each of the three stages they visited.

Co
-Desi
gn
115
Share and discuss outcomes (15 min.)
Participants were called together as a group to share some of the ideas that emerged
from the first round of discussion in pairs.
Second co-design session together (20 min.)
The complete design team elaborated upon and evaluated some of the proposed
ideas.
Closing discussion (15 min.)
To round up the discussion, the complete group sat together around the coffee table
for a final activity on how an ideal design studio could support the entire process of
making MBs. A scale model of the current design studio situation using Playmo-
bil® (Figure 34) was laid on the coffee table to stimulate playfulness with physical
elements. Participants could choose to adapt the current configuration to suit their
dreams, or start a new design studio from scratch.
Debriefing – questionnaires (10 min.)
Finally, all participants (including the researchers) were asked to fill-in two separate
questionnaires. In the first one, we tried to assess the quality of the ideas that
emerged from the session by asking participants (including the researchers) to rate
each idea from every stage on a 7-point Likert scale (where -3 is very bad, 3 is very
good, and 0 is neutral). Before they could give a rating, we collectively agreed on
the idea that would be rated per stage by writing down the name of the idea on the
questionnaire. In most cases, each pair went through different stages as the other
pair. The second questionnaire consisted of assessing the helpfulness of the mate-
rial by asking participants (including the researchers) to rate the different materials
Figure 34. Playmobil® scale model of the design studio for the closing discussion
Discussion around the table (left) – Participants involved in sharing their ideas
Role-playing with the puppets and objects (right) – Participants using a puppet or piece of furniture to repre-
sent a situation

Co
-Desi
gn
ing
In
ter
ac
tiv
e S
pac
es.
.. 11
6
that were available for the team on a 7-point Likert scale (where -3 is not helpful,
3 is very helpful, and 0 is neutral). In this case, the team members had to rate only
the stages they had worked in, including the closing discussion area (Figure 32).
Interpretation4.4.5 Immediately after each co-design session we conducted short interpretation
rounds. The interpretation team consisted of the same two researchers. In this
interpretation we summarized the main ideas that emerged during the sessions by
means of sketches on A3 sheets of paper (Figure 35). Keywords were placed next
to the sketches to describe the main ideas behind each concept. These sketches al-
lowed us to have an initial overview on the quantity and quality of the ideas. Each
A3 sheet and the ideas it contained were coded to identify the co-design session,
and the number of the idea. Additionally, we discussed and wrote down some of the
main discoveries we had made in relation to the process of conducting the co-design
sessions.
Analysis4.4.6 The analysis consisted of two main parts: the process and the ideas. First, we were
interested in the process itself and how the way the dialogue-labs were prepared and
conducted had affected the outcome. Therefore, we looked into the questionnaires
by calculating the mean ratings and standard deviation for quality of the ideas and
helpfulness of the materials. Second, we summarized the ideas that had a better po-
tential as perceived by the participants by first looking at the highest mean ratings.
We then did rounds of discussions within the analysis team to define the final con-
cepts. We also did clustering whenever some ideas overlapped. The final concepts
were summarized into sketches.
Figure 35. Analysis of the ideas from the Finnish dialogue-labs
Summary of ideas (left) – Immediately after each session the main ideas were summarized in A3 format
Sketches of the ideas (right) – Example of the ideas that emerged during one of the sessions

Co
-Desi
gn
117Findings4.4.7
Funky-design-spaces hypothesis
Regarding our first research question, participants generally agreed with the no-
tion of funky-design-spaces. Participants emphasized the desire of having easily
convertible flexible spaces to support different types of activities. For example they
mentioned the need to go outdoors to find inspiration depending on the topic of
the project (e.g. market, forest, or street). In other cases such as for building, par-
ticipant TW said, “for this type of activity you should be standing up.”
With respect to the six stages of the MB making process and their correspond-
ing location in the room, in some cases participants were a bit confused, as they did
not see a clear difference between, for example, browsing and connecting. Ultimately
they proposed merging the two stages together. As the sessions went by, it also be-
came clear to both participants and researchers that expanding is not actually a sepa-
rate stage of the process but runs across all stages through the task think of new ways
to create and communicate MBs. The six stages were first identified and described in
chapter 3 (section 3.7.3). Expanding was then included as a separate stage based on
the author's ideas that later led to the funky-design-spaces hypothesis (section 4.3.2).
However, after confronting these six stages with designers in the dialogue-labs, we
decided to reject expanding as a separate stage. Therefore our new interpretation of
the MB making process includes the following stages: 1) collecting, 2) browsing, 3)
connecting, 4) building, and 5) presenting.
Breaking down the process of making MBs into six physically separate stages,
forced participants to move about the room during the session. Participants thought
these changes had been positive as they made the teams think of the whole process
from different perspectives, without breaking the overall creative flow behind the
session. Moreover, participants indicated that they needed these breaks to approach
a new task with a fresh mind and that they would become tired if they had stayed
in the same stage for 45 minutes. Thoughts that had previously come up in another
stage were developed further while emphasizing on a different stage of the process.
Quality of the ideas
We split our findings regarding our second research question on how do different
materials affect the dialogue and idea generation during co-design sessions in two: qual-
ity of the ideas and perceived helpfulness of the materials. We looked into the data
from the questionnaires, namely the participant mean ratings on the quality of the
ideas (Table 5). Participants first collectively agreed on what they thought was the
best idea for each stage and later gave individual ratings on a 7-point Likert scale
where -3 is very bad, 3 is very good, and 0 is neutral. A series of paired two-tailed
t-Tests was performed for the significance of the difference between the means of
the ideas.

Co
-Desi
gn
ing
In
ter
ac
tiv
e S
pac
es.
.. 11
8 Table 5. Finnish participant mean ratings and standard deviations on the quality of the
ideasforeachstage.Errorbarsrepresentthe95%confidenceintervalofeachmean.
As a general remark, we can say that participants were positive about the qual-
ity of the ideas that emerged during the sessions. All mean ratings were higher or
equal to 1.67, and we saw no significant difference between ideas that emerged from
different stages (p > 0.05). The ideas that originated during the closing discussion
received the highest rating (mean=2.25, SD=.75). The standard deviations were low
and fluctuated between 0.75 and 1.07.
We were expecting the ideas that emerged from the closing discussion to have
the highest mean rating mainly for two reasons. First, all participants collectively
worked on new ideas after having shared the ideas they had previously explored as
pairs. As such we expected these ideas to be better developed. Second, the ideas from
the closing discussion were fresher in the participants’ mind so it was easier for them
to remember their details.
Every session brought up something new: On average we obtained 14 different
ideas from each session. After the first two sessions, we did see some recurring top-
ics starting to emerge (e.g. inspiration spaces, flexible work and presentation areas).
However, until the very last session new topics were revealed.
Helpfulness of the materials
Regarding the second part of our second research question, we again looked into
participants’ mean ratings for the helpfulness of the materials (Table 6). Partici-
pants gave individual ratings to the materials that they used in every stage on a
7-point Likert scale where -3 is not helpful, 3 is very helpful, and 0 is neutral. A se-
-3
-2
-1
0
1
2
3
Collecting Browsing Connecting Building Expanding Presenting Discussion
Mean
Rati
ng
s
Stages
Quality of the Ideas (FI)
1.94 1.81 1.73 1.67 1.83 2.06 2.25
.90 .95 1.05 1.03 1.07 .90 .75
Mean
SD
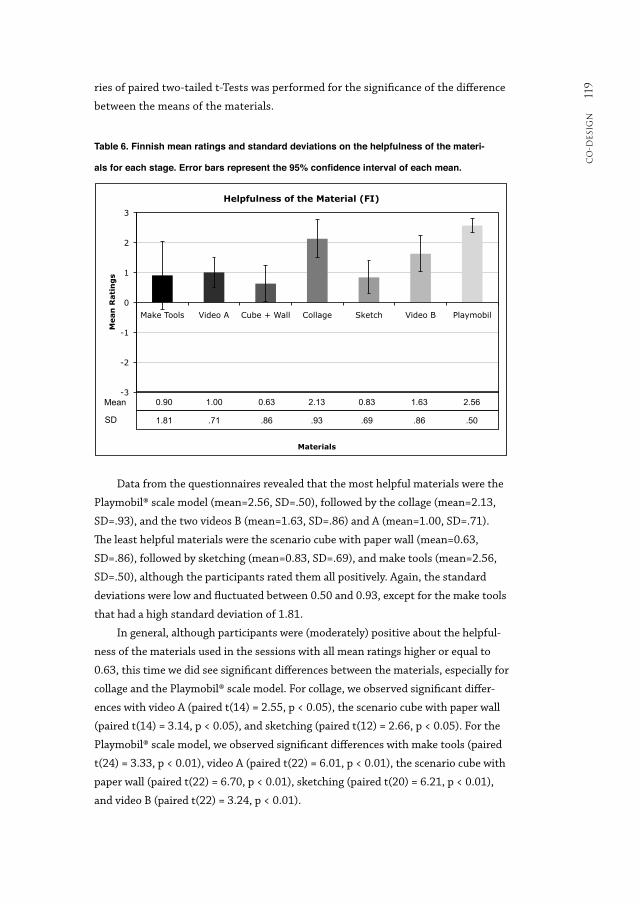
Co
-Desi
gn
119ries of paired two-tailed t-Tests was performed for the significance of the difference
between the means of the materials.
Table 6. Finnish mean ratings and standard deviations on the helpfulness of the materi-
alsforeachstage.Errorbarsrepresentthe95%confidenceintervalofeachmean.
Data from the questionnaires revealed that the most helpful materials were the
Playmobil® scale model (mean=2.56, SD=.50), followed by the collage (mean=2.13,
SD=.93), and the two videos B (mean=1.63, SD=.86) and A (mean=1.00, SD=.71).
The least helpful materials were the scenario cube with paper wall (mean=0.63,
SD=.86), followed by sketching (mean=0.83, SD=.69), and make tools (mean=2.56,
SD=.50), although the participants rated them all positively. Again, the standard
deviations were low and fluctuated between 0.50 and 0.93, except for the make tools
that had a high standard deviation of 1.81.
In general, although participants were (moderately) positive about the helpful-
ness of the materials used in the sessions with all mean ratings higher or equal to
0.63, this time we did see significant differences between the materials, especially for
collage and the Playmobil® scale model. For collage, we observed significant differ-
ences with video A (paired t(14) = 2.55, p < 0.05), the scenario cube with paper wall
(paired t(14) = 3.14, p < 0.05), and sketching (paired t(12) = 2.66, p < 0.05). For the
Playmobil® scale model, we observed significant differences with make tools (paired
t(24) = 3.33, p < 0.01), video A (paired t(22) = 6.01, p < 0.01), the scenario cube with
paper wall (paired t(22) = 6.70, p < 0.01), sketching (paired t(20) = 6.21, p < 0.01),
and video B (paired t(22) = 3.24, p < 0.01).
-3
-2
-1
0
1
2
3
Make Tools Video A Cube + Wall Collage Sketch Video B Playmobil
Mean
Rati
ng
s
Materials
Helpfulness of the Material (FI)
0.90 1.00 0.63 2.13 0.83 1.63 2.56
1.81 .71 .86 .93 .69 .86 .50
Mean
SD

Co
-Desi
gn
ing
In
ter
ac
tiv
e S
pac
es.
.. 12
0 Participants had strong divergent opinions about the use of make tools (SD =
1.81). For some participants the make tools were used as props, gaining new mean-
ings. For example, in one session the vest was used as a vest, but also as a scarf.
However, for other participants, the vest, glasses, and make tools were intimidating
and they did not know what to do with them. Originally, all materials were laid on
the table at the beginning of the session. As the sessions went by we discovered that
some participants felt overwhelmed by the amount of options that were given to
them simultaneously. For the Dutch dialogue-labs sessions that followed these Finn-
ish sessions, we decided to place all materials inside a box to prevent over stimulat-
ing participants by having them gradually discover and remove the elements from
the box.
The three most helpful materials were the Playmobil® scale model (mean=2.56,
SD=.50), the collage (mean=2.13, SD=.93), and video B (mean=1.63, SD=.86). First,
we were unsure if participants would feel inspired to think of new scenarios using
the Playmobil® scale model. We were happy to discover that people became actively
involved in role-playing with the characters and the furniture. People would usually
take a given puppet or piece of furniture to represent the situation they were trying
to depict. In the end, as more ideas were being discussed around the table, all partici-
pants became involved and shared their views.
Second, regarding the use of collages, we discovered the need to begin the co-de-
sign sessions with a warm-up task to break the ice [Sleeswijk et al. 2005], which also
allows participants to move from easier tasks to more challenging ones. Our notions
from this exercise are similar in the sense that we noticed that it took some time for
participants to become familiar with each other and with the situation. After going
for pairs and starting the actual co-design, it took some time for the teams to reach a
comfortable creative mood. In this respect, collages were chosen by participants who
initially were less willing to open up and start designing. They went for an activity
that was familiar to them and which made them feel more at ease.
Finally, from all the materials used to start the dialogue, videos seemed to work
quite well by providing a clear and simple starting point for discussion by mutually
observing what happens in the video. Participants would ask each other “what do you
think is happening?” thus helping build upon the spirit of collaboration. The idea with
the videos was not to give restrictions but instead trigger thinking. For example, in
one session the video shown in the presenting stage triggered them to think beyond
user interface aspects.
The least helpful material was the scenario cube with paper wall (mean=0.63,
SD=.86). We discovered the paper-covered wall had created the opposite effect of the
make tools. Instead of overwhelming participants by an excess of information, the
wall had created a large-scale white page effect. For the Dutch dialogue-labs sessions
after these Finnish sessions, we decided to add abstract paper shapes or Post-it®

Co
-Desi
gn
121
notes to give participants a few alternatives to begin their exploration and thus
reduce the white page effect.
Design ideas4.4.8 We looked into the participant mean ratings per stage to identify what Finnish
participants thought were the best ideas that emerged from the different locations.
The highest rated ideas per location were:
Collecting: tags (mean=2.5) ×Browsing: contextual browser (mean=2.5) ×Connecting: large cut and paste board (mean=2.3) ×Building: messy table (mean=1.75) ×Expanding: history of the MB (mean=2.75) ×Presenting: watching the stars (mean=2.5) ×Closing discussion: layered table (mean=2.5) ×
Figure 36. Tags placed on the designer’s body allow collecting samples of images, sounds or smells from
different perspectives

Co
-Desi
gn
ing
In
ter
ac
tiv
e S
pac
es.
.. 12
2
Tags
This tool (Figure 36) allows collecting senses (e.g. sound, images, smell) from differ-
ent areas or perspectives. MB designers place three (or more) special tags on their
body (e.g. chest, hip, ankle), which are activated by pressing one of them. Three
small samples are then collected from each of the three tags. Later on, MB design-
ers can check which of the three samples that were made simultaneously best fits
their needs. For example a sample of the sound of footsteps could be best collected
at floor level while the sound of wind could be a more general sound collected from
high above. All three sounds can be played simultaneously to check the result when
they are combined. The tags also contain small cameras and thus images and short
videos can be collected in a similar way. Samples are collected in a quick and natural
way, as it is very important to capture the moment before it is gone. There is no
detailed framing of a picture because instead MB designers have three different
shots to choose from.
Figure 37. This large cut and paste board is used by design teams to simultaneously browse their large
collections of materials, giving them an overview of all available images and sounds

Co
-Desi
gn
123Contextual browser
The contextual browser allows MB designers to take their collection of materials
wherever they want with them and start browsing it in the real context (e.g. to the
forest or the open market). MB designers can find inspiration both while on the
move in the environment they are currently in, and in the materials contained in
their collection. For example, MB designers can explore the feelings, sounds and
sensations they are getting as they are walking in a busy market place, and browse
their collection in context. MB designers may also capture new materials and add
them to their existing collections in this process. The system provides additional
contextual information when the images are selected or captured, for example on
the location (e.g. downtown Helsinki), time (e.g. fish market day), and situation
(e.g. when my feet got wet because I wore slippers).
Large cut and paste board
This tool (Figure 37) consists of a large wall that allows MB designers to have all
the collected material around them ready to work with it. MB designers can have a
quick overview of all the materials from a distance before selecting what they need.
Instead of having collections of images and sounds that are stored and hidden in
folders and files, the tool can easily store and display on demand the materials on
the wall, making them readily available for the MB designers to use. The tool allows
easily forming custom arrangements of materials in the wall space. Design groups
can make their own selections or proposals for the first impressions and rough
ideas for a design problem, and later compare and discuss them. The different alter-
natives on the wall provide feedback and influence the ideas of the other team. The
wall easily allows the duplication (or cut and paste) of images so that both teams
can use a similar central image for their selection.
Messy table
This is a large interactive table that helps organize and build MBs. This table gives
MB designers the opportunity to naturally handle images while receiving tactile
feedback. The messy table also gives an overall feeling of creating a hand-made MB
although it is made in a digital environment. A messy table allows MB designers to
easily make connections between images and quickly work with a given image in
isolation from others. Therefore images are not arranged in rows and columns but
create a mess on the table. Images shown upside down or flipped on the reverse side
can provide nice surprises. Materials look and feel real so MB designers can actually
see and touch the differences in the type of paper images have been printed on (e.g.
matte, glossy, or recycled). Images at the end of a messy stack of images can easily
be identified simply because it has a glossy finish to it.

Co
-Desi
gn
ing
In
ter
ac
tiv
e S
pac
es.
.. 12
4
History of the MB
This tool records and documents the actual creation of the MB, a very rich process
in which many interesting things are said and discussed. Including the process that
led to it complements the final MB. The tool captures and delivers the general mood
and atmosphere of the situation as well as interesting things that are thought, said,
reflected upon, and done. The tool also records the iterative distillation process of
selecting, adding, and removing images, or even combining two MBs together. By
means of a timeline that can be easily and quickly dragged back and forth, clients
and MB designers see the formation process of the MB; where it started and where
it ended up, showing all relevant information in between. The tool allows sharing
important information with other people (e.g. client or stakeholders) who were not
involved in the making of the MB.
Watching the stars
This tool (Figure 38) is an open invitation to experience MBs in a new way. The
setup is inspired by Japanese rooms. Clients and MB designers let go of their inhibi-
Figure 38. Watching the stars is an invitation for designers and their clients to experience MB presenta-
tions in a relaxed and different way

Co
-Desi
gn
125tions and lie down together on the floor (e.g. Tatami mats) in a completely different
sensorial experience. People adopt a more relaxed attitude to first (quietly) observe
the MB that is projected above them. Lying on the floor creates a more intimate
setting to observe the MB, almost like a personal cocoon. The tool projects the MB
on the ceiling for a few minutes to allow people to immerse themselves into the MB.
After witnessing the MB, people adopt a more active attitude to discuss and share
their experiences on what they have seen. Therefore, people now sit around a low
round table in the center of the room on which the MB is projected while it slowly
rotates to provide different views. After the discussion the MB can be put up on the
ceiling or down on the table once again, in iterative rounds of discussion.
Layered table
This tool consists of a set of adjustable surfaces (e.g. table, wall) that can be used
for different purposes. Materials can be easily shared between surfaces. Different
surfaces can for example be used to keep a collection of materials, to make a selec-
tion of materials, to put the discarded material (e.g. garbage surface), or for actually
building the MB. A horizontal surface can easily be transformed into a vertical
display to show and share its contents on the wall. Surfaces used for garbage can
inspire and be a starting point for other designers working on a different project.
These surfaces stimulate MB designers to be standing in an active attitude to be
able to easily and rapidly share materials between surfaces. MBs can be built on a
horizontal surface, be put up on a vertical surface to check the results, and back
down on the horizontal surface for adjusting.
Dutch co-design sessions4.5
Method4.5.1 For the Dutch co-design sessions we used the same method of dialogue-labs [Lucero
& Vaajakallio 2008] as for the previous Finnish study.
Participants4.5.2 We invited six practicing designers and design researchers to participate in our
Dutch co-design sessions (Figure 39). We used the same construct of working in
two pairs involving one designer and one researcher who acted as facilitator/de-
signer. Therefore, once again each session consisted of four participants in total. We
tried to contact the four participants who helped us in our contextual inquires. As
we only had four participants back then, we decided to invite designers who were
experienced MB makers and/or who were familiar with the ongoing research. All
participants had at least 7 years of experience in design practice (15 years of experi-
ence on average). The participants varied in their education (university/academy),
age (between 30 and 46), and gender (5 male, 1 female).

Co
-Desi
gn
ing
In
ter
ac
tiv
e S
pac
es.
.. 12
6
The dialogue-labs (NL)4.5.3 From our previous findings of the co-design sessions in Finland we discovered
that one of the stages (i.e. expanding) should not be considered as a separate stage.
Expanding runs across all stages as an invitation to think of novel ways to create and
Figure 39. Dutch participants in the different stages
PD (top-left) – Design researcher exploring the box contents in collecting
FP (top-right) – Freelance designer and design educator (left) watching a video in browsing
FS (middle- left) – Owner of a small design and branding consultancy (left) in connecting
IK (top-left) – Owner of a small design and research consultancy (left) in building
MDG (bottom-left) – Design researcher in expanding
MF (bottom-right) – Owner of a small design firm (left) in presenting

Co
-Desi
gn
127
communicate MBs. However, in order to be able to compare the Finnish and Dutch
co-design sessions, we decided not to alter the setup of the co-design sessions.
The setting for the Dutch dialogue-labs was the living room of the /d.search-labs
(5m05 x 6m50 x 2m45) in the Department of Industrial Design at the Eindhoven
University of Technology (TU/e). The room was arranged to look and feel as much
as possible like a real design studio (Figure 40) and included similar elements as
Figure 40. The Dutch dialogue-labs
The living room of the /d.search-labs was arranged to look and feel like a real design studio
Figure 41. Map of the Dutch dialogue-labs
The space was distributed according to the six stages of the MB making process. Different materials could be
found in the different stages
expanding
building
connecting
closing discussion
browsing
collecting
presenting
1. collecting(vest, glass containers, magazines, camera)
2. browsing(laptop, video, couch,2 magazines, camera)
3. connecting(scenario cube, standing up,acting out, camera)
4. building(image cards, contact sheets,booklet, scissors, glue, paper)
5. expanding(DJ scenario, drawing, paper,pens)
6. presenting(laptop, projector, video,gloves, camera)
extra: closing discussion(carpet, pillows, Playmobil, camera)
Co
-Desi
gn
ing
In
ter
ac
tiv
e S
pac
es.
.. 12
8 the ones described in the Finnish dialogue-labs (section 4.4.3). We used the same
previously mentioned six stages of the MB making process, with its corresponding
locations inside the room, as well as the same tasks for each stage (Figure 41). How-
ever, we introduced a few modifications in each stage, either due to differences in the
dimensions of the new space, or the available furniture and hardware (e.g. flat screen
TV instead of a projector). We now briefly describe some of the main differences
between the Finnish and Dutch dialogue-labs per stage.
Collecting
Just like in the Finnish dialogue-labs, this stage was set by an open window to help
participants open their mind and transport themselves beyond the room bound-
aries. Unfortunately, instead of having a nice view on the sea, the setting was
somewhat less inspirational as participants were looking down on a parking lot. We
turned the shades down so that participants would be mostly looking to the distant
horizon where they could see a nice forest, a river, and the city skyline. Participants
would still hear external sounds and a breeze of fresh air would enter the room thus
providing the type of input from the outside world that we were looking for.
In the Finnish sessions we discovered that some participants were overwhelmed
by the amount of options and materials available to them all at once. We wanted
to see if placing the materials inside a box would prevent intimidating participants
by having them gradually discover and remove the elements from the box instead
(Figure 39, top-left).
Browsing
The setting for this stage was almost identical as the one described in the Finnish
sessions. The setting only differed in the round shape and smaller size of the coffee
table where the laptop was set.
Connecting
Similarly as for collecting, we made a small modification to the materials. The paper-
covered wall had created a large-scale white page effect in the Finnish sessions. For
the Dutch sessions after we wanted to test if adding abstract paper shapes or Post-
it® notes would give participants a few alternatives to begin their exploration and
thus reduce the white page effect.
Building
In this setting we slightly modified the available materials. The author had created a
rich collection of large images (i.e. at least A4) from glossy magazines to make MBs
and kept them in a green box. This box and the images it contained were used in the
Dutch sessions for their inspirational value.

Co
-Desi
gn
129Expanding
The only change in this stage was the use of an oval-shaped table on which partici-
pants made their sketches.
Presenting
We provided the same pair of gloves and showed the same video as for the Finnish
sessions. However, instead of using a projector to display the video on the wall, we
used a 29-inch Philips Ambilight flat screen TV. One disadvantage of using a screen
is that Finnish participants often used the projector as an extra resource for creativ-
ity and design by casting shadows using parts of their body.
Procedure4.5.4 Three co-design sessions were conducted in November 2008 at the Eindhoven
University of Technology (TU/e). The sessions were planned for a total of two hours
and they consisted of the same six parts described in section 4.4.4 for the Finnish
sessions.
Interpretation4.5.5 Short interpretation rounds similar to the ones described in section 4.4.5 were con-
ducted immediately after each co-design session by the two researchers who acted
as facilitators/designers.
Analysis4.5.6 We did the same analysis described in section 4.4.6 for the Finnish sessions.
Findings4.5.7
Funky-design-spaces hypothesis
In relation to our first research question, our Dutch participants agreed with the
notion of funky-design-spaces. During the closing discussion of all three sessions,
participants proposed a series of ideas that were trying to introduce more flexibility
in their workspaces. First, the idea of crop rotation could be introduced in the design
studio to use specific qualities of the limited space available for different situations.
Second, by simply being able to quickly change the height of tables depending on
the stage of the design process. Participant PD said, “Once you have to stand up there
seems to be a lot more happening, at least with regards to moving about and constructing
things. Once you sit at a table people seem more fixed on specific elements on the table.”
Third, by allowing to share and display information from one area to another in
a very simple and fast way that does not break the creative process. FP reflected,
“Transferring files with USB sticks is one of the big problems of the digital world. Every
time you have to do all kinds of work in naming, collecting, putting things in folders, and

Co
-Desi
gn
ing
In
ter
ac
tiv
e S
pac
es.
.. 13
0 sharing it with someone over and over again.” Finally, and perhaps most importantly,
MB designers again put an emphasis on their need to have the mental freedom to
be able to go outdoors during working hours to find inspiration or simply to take
a break and come back to work with a fresh mind. FS mentioned that, “I would like
to add some escape room. Sometimes when you are involved in all these projects and
processes you need to have a refreshed mind to have a completely different view on what
you are doing.”
Quality of the ideas
We again split our second research question in two: quality of the ideas and helpful-
ness of the materials. We looked into the data from the questionnaires, namely the
participant mean ratings on the quality of the ideas (Table 7). Participants first
collectively agreed on what they thought was the best idea for each stage and later
gave individual ratings on a 7-point Likert scale where -3 is very bad, 3 is very good,
and 0 is neutral. A series of paired two-tailed t-Tests was performed for the signifi-
cance of the difference between the means of the ideas.
Table 7. Dutch participant mean ratings and standard deviations on the quality of the
ideasforeachstage.Errorbarsrepresentthe95%confidenceintervalofeachmean.
Participant mean ratings fluctuated between 0.92 and 2.17. The highest mean
ratings corresponded to the ideas that originated in presenting (mean=2.17, SD=.55).
The standard deviations were relatively low fluctuating between 0.55 and 1.66.
Once again we can say that overall participants were positive about the quality
of the ideas that emerged during the sessions with mean ratings that were higher
-3
-2
-1
0
1
2
3
Collecting Browsing Connecting Building Expanding Presenting Discussion
Mean
Rati
ng
s
Stages
Quality of the Ideas (NL)
1.67 1.50 0.92 1.50 1.58 2.17 2.00
.75 1.12 1.11 1.12 1.66 .55 .91
Mean
SD

Co
-Desi
gn
131or equal to 0.92. However, we did see two significant differences between ideas that
emerged from different stages, namely between connecting and presenting (paired
t(22) = 3.3, p < 0.01), and between connecting and the closing discussion (paired t(22)
= 2.5, p < 0.05). Although we were again expecting the ideas that emerged from the
closing discussion to have the highest mean rating, it turned out not to be so. Dutch
participants thought with a high level of agreement (SD=.55) that the better ideas
had emerged in presenting (mean=2.17).
Helpfulness of the materials
Regarding the second part of our second research question, we looked into partici-
pant mean ratings for the helpfulness of the materials (Table 8). Participants gave
individual ratings to the materials they had used in each stage on a 7-point Likert
scale where -3 is not helpful, 3 is very helpful, and 0 is neutral. A series of paired
two-tailed t-Tests was performed for the significance of the difference between the
means of the materials.
Table 8. Dutch participant mean ratings and standard deviations on the helpfulness of
thematerialsforeachstage.Errorbarsrepresentthe95%confidenceintervalofeach
mean.
The mean ratings revealed that the most helpful materials were the two videos
B (mean=2.00, SD=.58) and A (mean=1.50, SD=.50), followed by the Playmobil®
scale model (mean=1.75, SD=1.01), and sketching (mean=1.33, SD=1.49). The least
helpful materials were the collage (mean=0.50, SD=1.98), followed by the scenario
cube with paper wall (mean=1.00, SD=1.00), and make tools (mean=1.17, SD=1.07),
-3
-2
-1
0
1
2
3
Make Tools Video A Cube + Wall Collage Sketch Video B Playmobil
Mean
Rati
ng
s
Materials
Helpfulness of the Material (NL)
1.17 1.50 1.00 0.50 1.33 2.00 1.75
1.07 .50 1.00 1.98 1.49 .58 1.01
Mean
SD

Co
-Desi
gn
ing
In
ter
ac
tiv
e S
pac
es.
.. 13
2 although the participants rated them all positively. Here we found a great deal of dif-
ference in the agreement across participants that fluctuated between 1.00 and 1.98,
except for the two videos A and B that had low standard deviations of 0.50 and 0.58
respectively.
Participants were in general (moderately) positive about the helpfulness of
the materials used in the sessions with all mean ratings higher or equal to 0.50. We
observed no significant differences between the helpfulness of the materials (p >
0.05). However we saw that Dutch participants used materials somewhat differently
than their Finnish counterpart. For example, while collages had been rated highly
by Finnish participants (mean=2.13, SD=.93), Dutch participants gave it the lowest
mean rating (mean=0.50, SD=1.98). For some Dutch participants the use of collage
was similarly helpful as for the Finnish participants. However we observed that
while Finnish participants were actively involved in creating a collage, Dutch partici-
pants generally used the materials but never engaged in actually making a collage,
which could explain the difference in mean ratings.
With regards to the use of make tools, we decided to place the materials inside a
single box to avoid overwhelming participants. This decision had a positive effect on
participants as can be seen in the higher mean rating (mean=1.17, SD=1.07) when
compared to the Finnish findings (mean=0.90, SD=1.81). We also observed that
hiding things in the box sparked the curiosity of participants who gradually unveiled
some of the materials they found in the box (Figure 39, top-left).
Regarding the most helpful materials, participants thought video B was the
most helpful (mean=2.00, SD=.58). The main difference between videos A and B is
how abstract or concrete its contents are. The presenting video does not show a work-
ing tool or an interaction but instead shows a designer (i.e. me) standing in front of a
MB while making a presentation. In line with Brandt and Grunnet [2000], we found
that simple, more generic, and abstract representations seem to open up solution
space.
Regarding the scenario cube with paper wall, we placed a few abstract-shaped
Post-it® notes (e.g. circles, triangles, flowers) to reduce the white page effect we had
observed in the previous Finnish sessions. The higher mean ratings (mean=1.00,
SD=1.00) when compared to the Finnish study (mean=0.63, SD=0.86) show that this
decision positively affected participants.
Design ideas4.5.8 We looked into the participant mean ratings per stage to identify what Dutch par-
ticipants thought were the best ideas that emerged from the different locations. The
highest rated ideas per location were:

Co
-Desi
gn
133Collecting: collecting box (mean=2.0) ×
Browsing: collective tagging (mean=2.0) ×Connecting: exploration wall (mean=2.0) ×Building: mood sketching (mean=2.75) ×Expanding: living MB (mean=2.75) ×Presenting: presentation recorder (mean=1.75) ×Closing discussion: take a break (mean=2.5) ×
Collecting box
This tool consists of a box you can go out with to collect different materials for your
MBs. It contains special collecting pads that collect smell by rubbing them against
an object or surface. The collecting pads can then be cut into different shapes or
given the color of the smell to include them in a MB. The box can also create dif-
ferent textured surfaces (e.g. sanding paper, leather) to help MB designers explain
to their clients what something would feel like to the touch (e.g. how the interior
of a car would feel). Small marbles collect sounds by pressing them. Pressing them
again releases the sound. Clients on the other side of the world can feel the sounds,
smells, and textures using a similar collecting box. The toolbox is easy to transport
and helps preserve the samples collected for later use. Once several samples have
been collected, the toolbox also allows MB designers to create and combine new
materials for their MBs. The toolbox and its contents are inspiring to look at and
handle; something MB designers can proudly show their clients. Including new
senses into the MB can help reduce the number of pictures needed.
Collective tagging
This tool provides support for going through piles of images or magazines that you
or other designers have created. This system is inspired by the current use of Post-
it® notes to mark interesting pictures. MB designers can add tags to indicate that an
image is interesting for them. The number of tags added indicates how many proj-
ects a magazine has been used for. Tags help MB designers quickly remember what
made a given image interesting to them. Other designers also add their own tags.
Tags are shared with other people to check how different people perceive similar
interesting images. Some MB designers may want to avoid images that have a peak
in popularity and search in unexplored areas. Similarly, piles of magazines made for
different projects can be saved as a tag. MB designers can browse tags of piles made
in other design studios or pre-defined piles with specific interests.
Exploration wall
This tool consists of a large digital wall that allows design teams to first cluster dif-
ferent types of media. Abstract representations or shapes stand for images, sounds,

Co
-Desi
gn
ing
In
ter
ac
tiv
e S
pac
es.
.. 13
4
smells, or textures. The tool allows easily making connections between media by
dragging elements together, linking, and annotating them. Images can be repre-
sented as thumbnails that are enlarged when selected. Design teams can explore
sounds collectively and individually. Two persons can approach different parts of
the wall and simultaneously play a given sound in a low volume. Approaching the
wall and scratching its surface allows designers to smell aromas. The exploration wall
also allows ordering the available material collectively. The wall gives an overview
of materials that are later used to create a narrative that unfolds. This narrative
dictates how the different elements are connected. Besides being a wall with an
overview of materials and temporal or narrative clustering, it is also a mixing wall
to try out combinations and where different possibilities can be explored.
Mood sketching
This tool supports the designer’s creative impulses by allowing them to create sev-
eral MBs in a very quick and inexpensive way. MB designers use a PDA or iPhone-
sized device to quickly and intuitively sketch different moods, selecting, moving,
Figure 42. In mood sketching designers use portable devices to quickly and impulsively create several
MBs that they put up on the wall for feedback and discussion

Co
-Desi
gn
135rotating, and enlarging images on the screen. It only takes them one or two min-
utes to create the MB. The sketched MB is then shared and put up on a digital wall
so a new one can be made. As the original size of the sketched MB is very small, it
looks pixelated and very ugly on the large screen when enlarged. However, people
look at it as a sketch of a mood so it is acceptable. Colleagues can comment on the
mood sketches hanging on the wall. MB designers can then stop, look at the results
and analyze which strategy (e.g. starting with a background, this is status quo, a
top-down approach) or parts of mood sketches worked best. So MB designers can
start with a given strategy they have chosen and make new mood sketches in quick
succession. When designers are happy with a few mood sketches, then the materials
used in them pop up on a large horizontal table in full resolution for fine-tuning,
creating a final MB.
The tool (Figure 42) supports the practice of crit in design or art schools where
students put up their sketches, collages or designs on the wall and then they go
around as a class discussing each person’s work. Crit is short for criticism and is also
practiced among design colleagues to receive feedback. The sketches and MBs that
are put up become public, the ideas bounce off the wall, and become the weight for
the conversation and the dialogue.
Living MB
The living MB is a tool that makes MBs interactive living objects that provide
inspiration and surprise. The MB designer creates a core MB with a few basic ele-
ments, plus alternatives or associative images, movies or sounds for each of the
basic elements. The MB is displayed on a wall and changes over time reacting on the
context depending if there are more or less people around, if the weather changes
the amount of light in the room, or if it has remained unchanged for some time.
Elements can also change or move to challenge the MB designer. People can keep
on adding new materials or making associations to the basic elements. The tool can
also suggest new associations based on the basic elements. The living MB provides
inspiration for its creator and other designers by catching their attention and defin-
ing the atmosphere they work in.
Presentation recorder
This tool (Figure 43) helps the client and MB designer interactively communicate
and later remember ongoing discussions. The tool captures the presentation given
by the MB designer and shares it with the client to also involve them in the process.
It becomes some kind of contract with the agreement to follow a given path for
the remainder of the project. This pre-editing tool only captures movements and
sounds to see the discussion. Therefore, no video and no faces are captured or
displayed. The client can then take specific things in the presentation, point at them

Co
-Desi
gn
ing
In
ter
ac
tiv
e S
pac
es.
.. 13
6
and change them. The client will shuffle around the MBs and the tool captures snap-
shots of the different stages of the discussion. MB making then becomes a closer
cooperation between the MB designer and the client who become a team.
Take a break
Take a break (Figure 44) responds to the designers’ need to have a space where they
can momentarily disconnect from work, do something in there, and come back with
a fresh mind. This comfortable space creates a feeling of disconnection from the
world, similar to that of taking a shower or lying flat in bed. The idea is to provide a
free connection to the outside world, if not physically at least mentally. Designers
feel free to go to this isolated space for a creative moment of doing nothing while
having some privacy and not being disturbed by others. An inspiration for this
space could be Eero Aarnio’s Ball Chair (1966) (Figure 26, bottom-right), which is
described as a “room within a room with a cozy and calm atmosphere, protecting
outside noises and giving a private space for relaxing.”
Figure 43. The presentation recorder captures sounds and movements made during a MB presentation,
serving as a reminder of previous agreements

Co
-Desi
gn
137
Overallfindings(FI+NL)4.6
Funky-design-spaces hypothesis4.6.1 In relation to our first research question, both our Finnish and Dutch participants
generally agreed with the notion of funky-design-spaces that stimulate designers
to move away from their desk to support the process of making MBs. Both groups
expressed in their own way the need to have easily convertible flexible spaces that
support different activities both inside and out of their design studios. The rich
diversity of design ideas proposed by the teams also point in that direction. They
almost suggested a mentality change for their work culture where going outside
during work hours to find inspiration or to break away from work is seen as socially
acceptable (now it is not). What we confirmed is that MB making is an activity that
requires designers to break away from their desk.
Figure 44. Take a break corresponds to the designers’ need for a comfortable place where they feel free to
rest and unwind for a while before heading back to work now with a fresh mind

Co
-Desi
gn
ing
In
ter
ac
tiv
e S
pac
es.
.. 13
8 Quality of the ideas4.6.2 We jointly calculated the mean ratings and standard deviations for our Finnish
(n=16) and Dutch (n=12) participants to have a general impression of our findings
(Table 9). A series of paired two-tailed t-tests was performed for the significance of
the difference between the means of the ideas.
Table 9 Finnish and Dutch participant mean ratings and standard deviations on the qual-
ityoftheideasforeachstage.Errorbarsrepresentthe95%confidenceintervalofeach
mean.
Overall, participants were positive about the quality of the ideas that were cre-
ated in the dialogue-labs. Participant mean ratings fluctuated between 1.30 and 2.14.
We observed three significant differences between the ideas that originated from the
different stages, namely between connecting and presenting (paired t(49) = 2.9, p <
0.01), between connecting and the closing discussion (paired t(49) = 2.9, p < 0.01), and
between building and the closing discussion (paired t(50) = 2.1, p < 0.05).
The ideas that originated during the closing discussion received the highest mean
ratings (mean=2.14, SD=.83), followed closely by presenting (mean=2.11, SD=.77).
The standard deviations were low and fluctuated between 0.77 and 1.16, except for
expanding (SD=1.40). This data suggests that the dialogue-labs had a positive influ-
ence on the creation of ideas. Participants were positive about the outcome gener-
ated during the sessions, both in terms of quality and quantity of the ideas.
Helpfulness of the materials4.6.3 We also jointly calculated the mean ratings for our Finnish (n=16) and Dutch
(n=12) participants with regards to the helpfulness of the materials (Table 10). A
-3
-2
-1
0
1
2
3
Collecting Browsing Connecting Building Expanding Presenting Discussion
Mean
Rati
ng
s
Stages
Quality of the Ideas (FI + NL)
1.82 1.68 1.30 1.58 1.71 2.11 2.14
.85 1.04 1.16 1.08 1.40 .77 .83
Mean
SD

Co
-Desi
gn
139series of paired two-tailed t-tests was performed for the significance of the differ-
ence between the means of the ideas.
Table 10 Finnish and Dutch participant mean ratings and standard deviations on the
helpfulnessofthematerialsforeachstage.Errorbarsrepresentthe95%confidence
interval of each mean.
Generally speaking, participants were positive about the helpfulness of the
materials, although less so than for the quality of the ideas. We found significant
differences between the materials, especially for video B and the Playmobil® scale
model. For video B, we observed a significant difference with the scenario cube
with paper wall (paired t(26) = 2.96, p < 0.01). For the Playmobil® scale model, we
observed significant differences with make tools (paired t(42) = 3.22, p < 0.01), video
A (paired t(40) = 3.71, p < 0.01), the scenario cube with paper wall (paired t(40) =
4.79, p < 0.01), and sketching (paired t(38) = 3.27, p < 0.01). All mean ratings were
higher or equal than 1.00, except for the scenario cube with paper wall (mean=0.79,
SD=.94). The use of the Playmobil® scale model (mean=2.21, SD=.86), and videos B
(mean=1.79, SD=.77) and A (mean=1.21, SD=.67) received the highest mean ratings
and had the highest level of agreement, helping participants mostly to discuss, pres-
ent, and generate new ideas. Participants agreed on sketching (mean=1.08, SD=1.19)
and the scenario cube with paper wall (mean=0.79, SD=.94) composing a second less
useful group of materials. Finally, although the collage and make tools had higher
mean ratings than the previous group (mean=1.43 and mean=1.00 respectively), due
to the high level of disagreement (SD=1.68 and SD=1.58 respectively), we cannot
conclusively say something about their usefulness. The data shows that for some
-3
-2
-1
0
1
2
3
Make Tools Video A Cube + Wall Collage Sketch Video B Playmobil
Mean
Rati
ng
s
Materials
Helpfulness of the Material (FI + NL)
1.00 1.21 0.79 1.43 1.08 1.79 2.21
1.58 .67 .94 1.68 1.19 .77 .86
Mean
SD

Co
-Desi
gn
ing
In
ter
ac
tiv
e S
pac
es.
.. 14
0
participants they were really useful and for others not.
Finally, we also did a regression analysis to examine the relationship between
the perceived helpfulness of the materials and the perceived quality of the ideas. The
analysis shows the perceived helpfulness of the material had a significant impact on
the perceived quality of the ideas that emerged from each co-design session (β=.211,
p<.027, R²=.045). Although the quality of the material had a significant impact on
the quality of the emerging ideas, one can note that it only accounted for 4,5% of
the variance in the data. It becomes apparent that the perceived quality of ideas that
emerge from co-design sessions is influenced by a multitude of factors and these
could be aspects such as the perceived involvement in the creation of the idea or the
perceived cooperation between co-design participants.
Design ideas4.6.4 There is a large amount of overlap between the Finnish and Dutch findings. We have
Figure 45. The funky-design-spaces environment
The spaces are located in a natural surrounding where designers can disconnect from the world by, for ex-
ample, going into the deep woods. Large windows provide a direct view on the natural surroundings and allow
natural light to energize designers

Co
-Desi
gn
141
Figure 46. Inside the funky-design-spaces
The spaces create a relaxed and comfortable atmosphere where designers can engage in individual activities as
well as creative collaboration. Designers feel that they belong to a larger team but they can also have a moment
for themselves when needed. Adjustable multi-purpose surfaces can be used to easily display and share informa-
tion. These surfaces can be assigned for different uses
already discussed the general similarities we found in both studies with respect to
the funky-design-spaces hypothesis (section 4.6.1). Now, regarding the specific ideas
generated during the sessions, we also found characteristics in common. These
ideas have been summarized into three groups: flexible spaces (environment), intui-
tive making (activities), and recording encounters (process). By means of this summary,
we will try to put in perspective how the individual ideas found in both studies fit
the larger context of the funky-design-spaces (Figure 48).
Flexible spaces (environment)
Ideas like the contextual browser, watching the stars, the layered table, mood sketching,
living MB and take a break belong to a first group where MB designers request more
freedom and flexibility to do their current activities. Most of these ideas explicitly

Co
-Desi
gn
ing
In
ter
ac
tiv
e S
pac
es.
.. 14
2
called for having freedom to go outside the design studio environment (Figure 45).
Others like the layered table or mood sketching were asking for support to use the
design studio space in more flexible ways so as to be able to easily display and share
information on adjustable multi-purpose surfaces (Figure 46). Of course, these
ideas are also the most closely related to our funky-design-spaces hypothesis.
The funky-design-spaces are set in natural surroundings (Figure 45) where de-
signers can disconnect from the world and come back with a fresh mind. For exam-
ple, designers can go into the deep woods or walk along the canal during work hours
to re-energize. The dome-like shape of the environment is an open invitation to leave
behind current conceptions of what a design studio is and think of new inspiring
buildings that house the funky-design-spaces. Within this larger context, a boat on
the canal or a greenhouse in the forest (section 2.3.8) could become good examples
Figure 47. Interconnected funky-design-spaces
Sharing information between the different spaces is done in a simple way to support the natural creative flow.
Designers have a ball that they can bounce on a wall to collect the information and then can move to a table
and roll the ball on it to display the contained imagery

Co
-Desi
gn
143
Figure 48. Floorplan funky-design-spaces
The complete funky-design-spaces vision. Special places welcome employees and visitors to create a sense
of community and family. A large communal table is used for meals and meetings. Designers can take turns in
cooking at the kitchen and then break bread together to share stories and enhance the feeling of belonging to
a team. Several adjustable multi-purpose surfaces are available in the periphery of the studio
of design studios that house the funky-design-spaces. Large windows provide a direct
view on the natural surroundings and allow natural light to energize designers.
Once inside (Figure 46), the funky-design-spaces create a relaxed and comfort-
kitchen/coffeecorner
communal tablefor meals ormeetings
toilets
entrance
“escape”
chair
adjustable multi-purpose surfaces
informalrelax area
“watching the stars”
“interconnected”

Co
-Desi
gn
ing
In
ter
ac
tiv
e S
pac
es.
.. 14
4 able atmosphere where designers can engage in individual activities as well as
creative collaboration. Designers feel that they belong to a larger team but they can
also have a moment for themselves when needed. Adjustable multi-purpose surfaces
can be used to easily display and share information. These surfaces can be assigned
for different uses.
Intuitive making (activities)
The ideas contained in this group have in common that they all reflect the MB de-
signers’ need for carrying out current MB activities in ways that are more intuitive.
We refer mostly to the following ideas: tags, large cut and paste board, messy table,
collecting box, collective tagging, and exploration wall. All these ideas describe solu-
tions for making current activities simpler, faster, and more accessible, while also
providing an intuitive interaction. These ideas look at individual as well as collective
exploration and creation of MBs. We have previously defined intuitive interaction
as tools that allow designers to simply walk up to them and start performing tasks
using their current skills and knowledge on the task that is being supported. There
is no need to read manuals or learn new skills to master the functions provided by
the tools (section 2.5.5).
Storing and moving information between these different tools or spaces should
also be made in a simple way to avoid breaking the creative process (Figure 47).
Designers have a ball that they can bounce on a surface (e.g. wall) to collect informa-
tion that is being displayed there. Then, designers can move to any other surface (e.g.
table) and then roll the ball on the surface to display the contained information (e.g.
images, audio, text, etc.)
Recording encounters (process)
Two ideas, history of the MB and presentation recorder, form the final group where
MB designers would like to document and share the process of making MBs. Re-
cording the actual process of making and discussing MBs can serve as a reminder of
ongoing discussions. It can also become a (audiovisual) contract between the client
and the MB maker for the direction they have agreed to follow. An essential part
of these ideas is to support ways of involving the client more in the MB-making
process.
Discussion4.7
Designers versus everyday people4.7.1 In contrast to the co-design studies presented in the related work section, in our
case the potential users were skilled designers, which partially reduced the need
for facilitation and guidance during the dialogue. However, having designers as
Co
-Desi
gn
145co-design partners challenged our work as researchers/designers. At first designers
played along with us, listening attentively and roughly doing what was asked from
them. However as the session progressed, they gradually started to analyze the
sessions from different perspectives and reflect on some of our decisions: “why did
you formulate this task like this?,” “why did you make this separation?,” “I like this mate-
rial.” The setting, tasks and materials presented to the designers triggered different
thoughts.
We also experienced a situation in which our participants had not recently
used MBs for their work. In such cases we had to facilitate more, using our personal
experiences with MBs as well as the cumulative experience from previous sessions to
feed the discussion. In addition being researcher and designer simultaneously made
it possible for us to grasp issues not mentioned before, and moreover bring our own
ideas into the discussion for evaluation and further development. The challenge was
to stay at the same level with the design partner and not push the situation or stand
aside too much.
Motivating participants4.7.2 It is the researcher/designer’s role to use their own creativity to amplify the creativ-
ity of everyday people [Sanders 2006b]. As such, we used a layered approach to in-
spire and trigger people’s creativity. Our strategy consisted first of reading together
the instruction cards (description), and second, talking within the team (explana-
tion). At this stage, most teams had enough information to begin working on the
task. If they still needed to build a better understanding of the task, the third step
consisted of playing around using the objects available on the table (the material).
Having things to play with and touch helped many participants enter the fourth
step that was to engage and start performing the task itself (the action). After a few
minutes discussing ideas, the teams sometimes would forget the content of the task
or feel they were a bit off track. In these situations, the teams naturally went back
to the cards and thus restart the inspiration procedure.
Diversity of materials4.7.3 Since different things inspire people, it is important to have diverse and flexible ma-
terials that allow a wide range of uses and expressions. Therefore, ambiguous ma-
terials such as simple geometric shapes (e.g. make tools [Sanders & William 2001])
that are open for many interpretations can evoke unexpected ideas. Simple models
seem to open up solution space whereas more detailed models narrow it [Brandt &
Grunnet 2000]. On the other hand, our notion of props getting new meanings dur-
ing the sessions based on the need of the team and regardless of what established
meanings they had in everyday life (e.g. postcards interpreted as material samples)

Co
-Desi
gn
ing
In
ter
ac
tiv
e S
pac
es.
.. 14
6 shows that it is not always the open-ended form of the prop that enables many
interpretations.
Biases4.7.4 We have previously identified two sources of possible bias in the results of the dia-
logue-labs: recency effect (section 4.4.7), and positive effect towards the researcher.
Regarding the recency effect or the cognitive bias that results from people
recalling recent events better than remote ones, we were expecting the ideas that
emerged from the closing discussion to have a highest mean rating. As the Playmo-
bil® scale model was always used last, it was easier for participants to remember the
details of the ideas created on it rather than those that originated in the middle of
the session. In that respect, the results on the helpfulness of the Playmobil® scale
model should be considered separately from the other materials that were used
randomly.
Perhaps the largest source of possible bias in the dialogue-labs was the positive
effect towards the researcher. We carefully crafted the dialogue-labs materials; we cre-
ated a comfortable space and a relaxed atmosphere. We also facilitated and partici-
pated in the co-design sessions. The ratings given by the participants may have been
biased by the gezellig (cozy) research context we designed. The fact that participants
rated ideas (or materials) positively may not just be due to them thinking that
the ideas were actually good, but also because they may have wanted to please us.
Regarding this aspect, asking an independent researcher to act as the second facilita-
tor/designer instead of the author would have avoided the bias.
Conclusions4.8 In my quest to augment MBs with a UCD approach, instead of making my own
designs based on the rich use data I collected in the activities described in the previ-
ous chapters, I decided to feed the data and results from the studies to Dutch and
Finnish designers in dialogue-labs. We collaboratively came up with new concrete
ideas for tools that support MB making with new technologies.
Our funky-design-spaces hypothesis was proved true by both studies. Regarding
the quality and quantity of the ideas, the results show that participants were gener-
ally positive about the outcome of the sessions, thus the dialogue-labs had a positive
influence on the creation of ideas. Regarding the helpfulness of the materials, videos
and creating future scenarios with the help of a Playmobil® scale model assisted
participants mostly to discuss, present, and generate new ideas. We also discovered
it was important to have diverse materials and strategies to motivate participants to
get started and to keep them on a creative mood throughout the session. Moreover,
the experiences our participants had during the sessions show that dividing the
co-design activities in physically separate tasks helps participants approach the

Co
-Desi
gn
147topic from different angles and maintain a fresh mind. In summary, researchers and
designers aiming at amplifying the creativity of users should provide the conditions
to support dialogue between participants, and as such, we believe our findings may
inform other design processes.

Co
-Desi
gn
ing
In
ter
ac
tiv
e S
pac
es.
.. 14
8
augmented reality tools

Au
gm
en
ted
Rea
lit
y T
oo
ls14
9Augmented Reality Tools5 This chapter is based on the articles:
Andrés Lucero & Jean-Bernard Martens (2006) Supporting the creation of mood ×boards: industrial design in mixed reality. In Proceedings of TableTop 2006, IEEE,
127-128.
Andrés Lucero, Dzmitry Aliakseyeu & Jean-Bernard Martens (2007) Augment- ×ing mood boards: Flexible and Intuitive Interaction in the Context of the Design
Studio. In Proceedings of TableTop 2007, IEEE, 147 – 154.
Andrés Lucero, Dzmitry Aliakseyeu & Jean-Bernard Martens (2008) Funky Wall: ×presenting MBs using gesture, speech and visuals. In Proceedings of AVI ‘08, ACM,
425-428.
Problem5.1 The time spent with designers observing how they work and later in collective
creation was both necessary and useful. The two-and-a-half years spent studying
design practice and MB making became the foundation for letting users drive the
innovation process. Now it was time to integrate the knowledge and experience
gained in the previous user studies into working tools, and bring the funky-design-
spaces hypothesis to life. However, this heavy user involvement came at a cost. I was
running out of time.
The next step would have been to propose and implement a set of five intercon-
nected tools (one for each stage of the MB-making process) that would support the
creation of MBs. However, as I had decided to go for a single longer design cycle
instead of several shorter ones, I realized I would have to compromise and go for an
alternative plan consisting of developing two tools instead of the intended five. This
would have an effect on the designers' perception of the holistic design studio that
I was trying to introduce in the funky-design-spaces hypothesis, as the overall vision
would be incomplete. The best I could aim for at this point was to allow designers to
get a glimpse of the complete vision by allowing them to explore two tools working
alongside each other.
I developed two tools: the Funky Coffee Table and the Funky Wall. The first one
was developed before the co-design sessions and was actually shown as one of the
videos with no audio for the stage browsing in the co-design sessions (i.e. video A). I
cannot say that the idea behind the Funky Coffee Table originated in the co-design
sessions. Actually, participants very quickly deviated from the original idea when we
showed them the video with no sound in the co-design sessions. In that respect, the
video only served as inspiration for our participants.
The second tool, the Funky Wall, was developed in between the Finnish and
Dutch sessions. The tool was not shown during the co-design sessions. The video
used for the stage presenting in the co-design sessions (i.e. video B) showed a de-

Co
-Desi
gn
ing
In
ter
ac
tiv
e S
pac
es.
.. 15
0 signer (i.e. me) presenting one of his MBs. Having said this, two ideas that emerged
from the co-designs sessions were directly related and introduce the main arguments
for the Funky Wall: history of the MB (section 4.4.8) and presentation recorder (section
4.5.8). Both the Funky Coffee Table and Funky Wall are explained in detail in this
chapter.
Related work 5.2 In chapter 3, six stages of the MB making process were identified. However, later
in chapter 4 we realized that expanding was not a separate stage but ran across
all stages as an invitation to explore new ways of making MBs (section 4.4.7).
Therefore, in our new interpretation, the process of making MBs can be divided into
these five stages: 1) collecting, 2) browsing, 3) connecting, 4) building, and 5) present-
ing. Each of these stages offers opportunities for new AR designs. This related work
section looks at these five stages (section 3.4.8) and how existing systems provide
support for them.
Augmenting MBs5.2.1
Collecting
First, designers who use MBs for their work are constantly collecting images. If they
see something interesting, they collect it (Figure 49, top-left). Designers begin by
roughly collecting images from large-sized magazines printed on glossy paper that
they find in magazine shops and bookstores. They will also collect images from the
Internet, and occasionally they will use images from their personal collection or
especially make pictures for a MB.
Adding images from the Internet to a digital table can be solved through dif-
ferent available options (e.g. network drive, USB stick). The same holds for pictures
made with a digital camera that can be sent wirelessly to the system. The Cabinet
system [Keller et al. 2006a] (Figure 50, top-left) has addressed the issue of add-
ing images from physical magazines onto a digital table, thus breaking the divide
between physical and digital. It photographs objects placed on the workspace and
replaces them with a digital footprint in the same place.
Browsing
Second, once designers feel they have enough material to work with, they will move
on to the second stage, browsing. Here designers can spend a considerable amount
of time pre-selecting images that will help them build a story or say something
about the target audience, product, or company they are designing for. Design-
ers browse magazines, cutting out pictures from them and ending up with a large
number of images. Designers end up with a large pile of pre-selected images that

Au
gm
en
ted
Rea
lit
y T
oo
ls15
1
they carry with them if they want to share its contents with colleagues for discus-
sion (Figure 49, top-right).
We (the author and Dzmitry Aliakseyeu) explored how an AR tool can provide
support for browsing images by designing, implementing and evaluating our first
tool, the Funky Coffee Table.
Connecting
Third, through connecting, designers sort the pre-selected images in a simple and
flexible way by assigning them to categories (usually up to 30 images per concept)
(Figure 49, bottom-left) (section 3.4.8). MB designers will sometimes label the
piles with notes. They also like the easiness of piling and arranging images within
the pile. Growing piles create smaller piles and sub-piles can be mixed together in a
simple way.
The creation as well as the handling of piles on digital tables has already been
explored in recent systems such as Cabinet [Keller et al. 2006] where designers load
Figure 49. Stages of the MB making process represented through different activities
Inspiring images (top-left) – Images collected for inspiration
Piles of images (top-right) – Piles of pre-selected images that designers carry around with them
Labeling piles (bottom-left) – Piles of images are labeled using Post-it® notes
Giving a presentation (bottom-right) – A designer presenting a set of three MBs

Co
-Desi
gn
ing
In
ter
ac
tiv
e S
pac
es.
.. 15
2
images into the system and maintain workbooks of related images, with each work-
book acting as a digital pile. We have also explored interaction with digital piles on
digital tables [Aliakseyeu et al. 2006a, Aliakseyeu et al. 2007] identifying three basic
tasks that must be supported by a digital pile (navigation, reorganization, and repo-
sitioning), and have proposed three interaction techniques that meet these require-
ments. In the first technique, DragDeck (Figure 50, top-right), users interact with
a pile by touching the pile with the pen. Once the pile is open, the user can browse
through the pile by moving the pen in a given direction while maintaining contact
with the table surface. The second technique is HoverDeck (Figure 50, bottom-left)
in which users open the file in a similar way to the previous technique. Then users
can browse through the pile by hovering the pen on top of the pile in a given direc-
Figure 50. The Cabinet system and interaction with digital piles on digital tables
Cabinet (top-left) – Tool that helps designers collect and organize visual material for inspiration
Different views of piles: Drag Deck (top-right) – A closed pile (left) and an open pile ready for browsing
(right). Once opened (touch) a pile can be browsed by moving the pen maintaining contact with the surface
Different views of piles: Hover Deck (bottom-left) – Once the pile is open the user can browse its content by
hovering the pen on top of the pile. The hover direction determines the browsing direction
Different views of piles: Expand Pile (bottom- right) – The pile expands to reveal all hidden images. Left: pile
is closed with 45 images. Right: pile is expanded when the user touches the top image of the pile

Au
gm
en
ted
Rea
lit
y T
oo
ls15
3tion. In other words, the main difference with the previous techniques is that users
must slightly lift the pen from the table surface to browse. Finally in ExpandPile
(Figure 50, bottom-right) when users touch a pile, the entire pile expands to reveal
all its contents in a similar way as the Cabinet system. Elements are scaled to fit
within the workspace or the designated area for the pile.
Building
Fourth, designers start building the MBs by thinking how they want to cut and ar-
range the images, dragging them to create different layouts. Designers use differ-
ent techniques to control the overall expression of the MB. For example, they will
add subtle effects such as blurring by adding semi-transparent colored sheets of
paper to give a more uniform feel about the color of the MB. They may also include
the logo and name of the company to create a greater sense of identity with the
company.
Several systems provide support to arrange images on digital tables [Jacucci et
al. 2005, Aliakseyeu et al. 2006b, Keller et al. 2006]. Although none of these systems
were originally conceived to support the creation of collages or MBs, they all provide
ways to simultaneously display and arrange (e.g. move, scale, rotate) images on a
digital table.
Presenting
In the final fifth stage, presenting, designers and clients meet face-to-face to share
and discuss the intended story behind the MB (Figure 49, bottom-right). Usually
designers create a single large MB or a series of smaller booklets for their clients to
keep and share with other stakeholders. However, sometimes MBs stand alone em-
bedded in a PowerPoint presentation that is uploaded to an Intranet, and designers
can only hope that clients and other stakeholders perceive the intended message or
story.
By co-designing, implementing and evaluating our second tool, the Funky Wall,
we (the author and Dzmitry Aliakseyeu) explored how the presentation of MBs can
be supported in new ways.
Approach5.3 In the course of our user studies with Dutch and Finnish designers who create MBs
for their work, we discovered that understanding the context of creation is essential
when supporting the work of designers. In our vision, we see the process of making
MBs going beyond the activities and the time spent by designers collecting and ar-
ranging images on a table. MB making is a dynamic and iterative process.
The funky-design-spaces is a vision of interconnected spaces that encourage
designers to move around their design studios. Designers usually prefer brows-

Co
-Desi
gn
ing
In
ter
ac
tiv
e S
pac
es.
.. 15
4
ing for images away from their computer or desk, while comfortably seated on a
couch, in a coffee corner or at the coffee table in a living room (e.g. when working at
home). Similarly, designers present their MBs by placing them on a wall and giving
an explanation in a stand up position. With this in mind, for the Funky Coffee Table
and Funky Wall prototypes we have respectively decided to design the interaction
on a coffee table and in front of a large wall screen to encourage browsing images and
presenting MBs in a more natural setting within the design studio.
First tool: The Funky Coffee Table5.4
Introduction5.4.1 Browsing magazines in search for images is one of the first steps of the MB making
process. Designers prefer going through their large collections of magazines in a
comfortable place (Figure 51, left) where they can freely start creating ad hoc piles
of magazines and pictures, making a soft pre-selection of images.
Designers end up with a large number of images taking up all available usable
space in their design studios including tables, walls and floor (Figure 51, right).
Space is not only limited to spreading images in the studio but also for storing maga-
zines. Designers must throw away magazines in order to update their collections
with new material (section 3.4.8).
Desktop and digital systems provide solutions for displaying and storing large
amounts of images, however they do not provide the conditions to browse and select
images in a flexible way and in comfortable spaces for designers in their design
studios.
Figure 51. Situations observed in our studies in relation to the Funky Coffee Table
Browsing on a couch (left) – A designer in her studio browsing images while seated on a couch by a coffee table
Desk clutter (right) – Images taking up all available space in a designer’s studio including the wall behind her

Au
gm
en
ted
Rea
lit
y T
oo
ls15
5Related work5.4.2 A considerable amount of related work has influenced the design of this tool. Most
of this work is connected to image browsing, tabletop systems, and hand gesture/
movement based interaction.
A number of tabletop systems have been designed to support image browsing
and sharing. Besides the aforementioned Cabinet system [Keller et al. 2006], the Per-
sonal Digital Historian [Shen et al. 2002] is a tabletop, pen-based system that helps
people construct, organize, navigate and share digital collections in an interactive
multi-person conversational setting. Another example of a tabletop-based system for
picture sharing and browsing is SharePic [Apted et al. 2006], which was specifically
developed for the elderly population. The main distinctive property of the system is
that it is strongly influenced by the way physical photographs are handled and placed
on physical tables.
There is also a considerable amount of work that addresses gesture-based inter-
action on tables, in open spaces, or in 3D virtual environments. Tabletop systems
like Diamond Touch [Dietz & Leigh 2001], and Lumisight [Matsushita et al. 2004]
use hand gestures and movements to interact on the table. Other authors [Wexelblat
1995, Quek et al. 2002, Lenman et al. 2002] have studied the general application of
hand gestures and movements to support human-computer interaction.
The Funky Coffee table makes use of layers above the work surface which was
first explored for pen-based systems by Grossman et al. [2006] using a single layer,
and later by Subramanian et al. [2006] using multiple layers of interaction.
Designing the Funky Coffee Table5.4.3 Based on the requirements we gathered from MB designers, we have decided to
first provide support for the second stage of the MB making process, browsing, by
designing the Funky Coffee Table, an image browser that: 1) merges with the real
context allowing designers to work in the comfort of their existing design studio
environment, 2) captures the current flexibility and intuitiveness of interaction
with physical images, and 3) provides an alternative solution to a cluttered desk and
messy design studio by using the space above the table to interact.
Merging with the real context: coffee table
MB designers prefer browsing images while comfortably seated on a couch, in a
coffee corner or at the coffee table in a living room when working at home. Taking
this into account, we have decided to design the interaction using a coffee table
to encourage image search in a more relaxed environment within a design studio.
Designers can sit around the coffee table and sit back comfortably on a couch.
The table had to allow designers to view at least two images to make compari-
sons and connections between images. Designers had told us how looking at a set of

Co
-Desi
gn
ing
In
ter
ac
tiv
e S
pac
es.
.. 15
6
MBs makes it easier to compare the MBs in one go (section 3.5.8). Therefore, we de-
cided to increase to 3 the number of images simultaneously displayed on the table to
increase the chance and the possibilities of making new discoveries and connections
between images. We used a long rectangular IKEA coffee table (120x40x40 cm.) that
had the ratio needed (1:3) to comfortably display 3 images on it (Figure 52, left).
Designing interaction around a coffee table has its own implications and chal-
lenges from an ergonomic point of view. Looking at the Dreyfuss charts [Dreyfuss
1967], we realize there are aspects related to appropriate viewing angle, posture,
reach, and the time people would be sitting around the table that need to be taken
into account when designing interactions around such elements.
Flexibility of interaction: hand movements
From our studies we have learned that for activities involving creation designers
prefer working with their hands with tools that allow for flexibility and intuitive
interaction (e.g. pencil and paper). Their current way to browse, select (cut out), and
create soft-piles of images is a good example of flexible and intuitive interaction (sec-
tion 2.5.5). Inspired by this example, we decided to encourage interaction through
hand movements (section 2.4.5), allowing designers to work with both hands
towards achieving the goal of pre-selecting images (Figure 52, right). Designers use
their hands collaboratively; each hand with a different function, as when one is us-
ing a knife and fork.
Avoiding the mess: space above the table
When designers are looking for images in magazines, they start cutting out pictures
from them and end up with a large number of images. Designers will form soft-piles
Figure 52. Designing the Funky Coffee Table
The coffee table (left) – Long rectangular IKEA table that allows displaying three images simultaneously
Hand movements and space above the table (right) – Designers use their hands to store images in layers
above the table surface

Au
gm
en
ted
Rea
lit
y T
oo
ls15
7of images and thus create a great amount of mess around their design studios. Piles
of images and magazines will create cluttered desks and take up all available usable
space in their design studios including tables, walls and floor.
In our previous studies designers have told us about the importance of messy
desks as reminders for ongoing projects (section 2.3.8) and to have an overview
of the available materials in one glance (section 3.4.8). Removing the mess might
reduce the overview that designers now have of their work and materials. Therefore
the table should also provide a simple and quick way of looking at all available mate-
rials while also partially reducing the desk clutter.
With these two aspects in mind, namely reducing desk clutter and providing an
overview, we have decided to extend the available space for interacting and display-
ing information by using the space above the table [Subramanian et al. 2006]. The
active area above the work-surface has been divided into multiple layers to interact
with soft-piles of images, thus extending the design space (Figure 52, right). Images
are stored in layers above the table (n=2), which can be easily explored to obtain an
overview of the current state of the selection process.
Interaction techniques5.4.4 We now describe how the Funky Coffee Table provides support for navigating im-
ages and interacting with soft-piles.
Browsing by flipping pages
We propose two ways to browse images based on the observations made in the
previous studies as well as on the possibilities offered by AR. The first one is similar
to flipping pages of a magazine in the sense that users must mimic with their
dominant hand the movement anywhere above the table to switch to the next page
(Figure 53, top-left). Three large-sized images (approximately A4 depending on the
proportion and orientation of the individual image) are displayed simultaneously to
allow designers to be captured by the atmosphere and contents of the image, hence
the 1:3 ratio of the chosen table (Figure 54, top-left). The next or previous three
images will be displayed depending on the direction of the movement (Figure 54,
top-right). The change of pages is accompanied with a page-flipping sound.
A short and quick diagonal movement in the direction the user wants to browse
defines the flipping gesture. The movement starts at the table level and goes slightly
up on the z-axis, in a diagonal way. As an alternative, designers can also browse
from the couch, resting their hands on the couch itself and performing the diagonal
movement. The speed of the movement helps discern the flipping gesture from a free
hand movement, thus preventing accidental triggering of the gesture.

Co
-Desi
gn
ing
In
ter
ac
tiv
e S
pac
es.
.. 15
8
Browsing by flicking
Augmenting the process of making MBs implies extending the current practices by
providing support using the advantages of new technologies. As such we extend im-
age browsing by introducing techniques that pertain to the digital world.
We use a flicking movement to initiate continuous scrolling (Figure 54, second
row-left). The flicking movement is similar to the flipping movement only that it is
longer (Figure 53, top-right) and triggers a distinctive longer flipping-page sound.
This time the length of the gesture helps us discern flicking from free hand move-
ments. We map the direction of flicking to the scrolling direction, and the flicking
speed to the rate at which the pictures scroll. The approach is similar to the one used
for scrolling on the iPhone with the difference that we do not use inertia or friction,
so once scrolling starts it continues with constant speed until the stop movement
is performed. We decided to leave inertia or friction out to encourage designers to
find their preferred continuous-browsing speed instead of having them perform the
gesture several times to browse through a large collection of images. Users can stop
the scrolling by tapping on the table (Figure 54, second row-right).
Figure 53. Interaction techniques for the Funky Coffee Table
Flipping (top-left) – Browsing by mimicking a flipping-page movement anywhere above the table
Flicking (top-right) – Browsing by doing a flicking movement on the table
Soft piles (bottom-left) – Creating soft piles by orthogonally moving a selected image
Reviewing and arranging piles (bottom-right) – Reviewing piles (left) and placing an image on another layer (right)

Au
gm
en
ted
Rea
lit
y T
oo
ls15
9Soft piling
We propose the use of layers above the digital table in order to create more space to
store images and create soft-piles. Once designers find an image that captures their
attention, they can place the image in a soft-pile. Placing their dominant hand over
an image at the table-level, and then quickly moving the hand upwards orthogo-
nally with respect to the horizontal table surface achieve piling (Figure 53, bottom-
left). The image will be placed into one of two locations at 30-50 cm. (soft-pile ‘A’)
(Figure 54, third row-left) and 50-70 cm. (soft-pile ‘B’) (Figure 54, third row-right)
above the table surface, depending on the highest point reached by the hand move-
ment before it starts going down again to a resting position. The tool provides
feedback for the layer by displaying a large orange ‘A’ or blue ‘B’ on the lower-right
corner of the workspace.
The tool automatically scales and arranges the piled images to fit within the
workspace area. The tool optimizes the space used by the images so that whenever
images are removed from a large pile the images can be presented in the largest size
possible (Figure 54, both images at the bottom). However, the tool also creates a
clear visual differentiation between the collection and a layer. While three images are
always displayed on the collection, the minimum amount of spaces for thumbnails
presented on the layer is set to six. If there are less than six images on the layer, then
the remaining spaces are left blank (Figure 54, bottom-left). In this way, we prevent
the system from displaying three images at a collection level and three images at the
layer level, which would only be differentiated by the layer feedback ‘A’, or ‘B’.
Based on our observations of designers working with images at this stage of the
MB making process (section 3.4.8), we have deliberately limited the number of soft-
piles supported by the Funky Coffee Table (n=2) to meet the needs of designers.
Reviewing and arranging soft piles
Placing the non-dominant hand above the table surface and changing height ac-
cordingly allows navigating within layers of soft-piles. Placing the non-dominant
hand within the range between 30-50 cm. orthogonally from the horizontal table
surface results in displaying the contents of layer ‘A’ (Figure 54, bottom-left).
Similarly, placing the non-dominant higher up on the range between 50-70 cm. will
show the contents of layer ‘B’ (Figure 54, bottom-right).
Arranging the soft piles is achieved by using asymmetric two-handed interac-
tion. First users must choose an image using the non-dominant hand to reveal the
layer contents of either layer ‘A’ or ‘B’, and then place the dominant hand on top
of the image at the same orthogonal height as the non-dominant hand to activate
it. The tool provides feedback by dynamically enlarging the active image by 20%.
Second, while still keeping the non-dominant hand at the current layer location and
then placing the dominant hand at a desired new location (Figure 53, bottom-right)
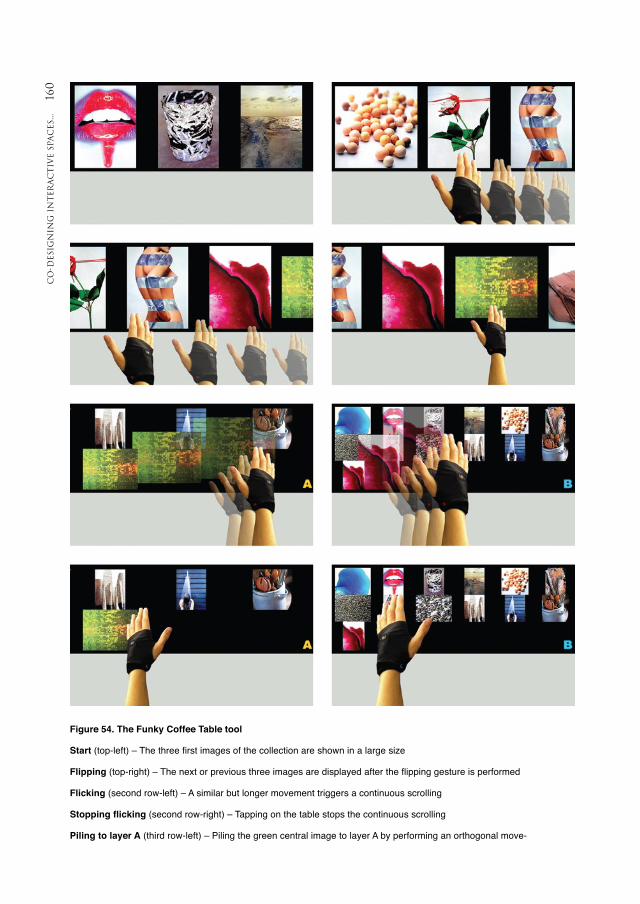
Co
-Desi
gn
ing
In
ter
ac
tiv
e S
pac
es.
.. 16
0
Figure 54. The Funky Coffee Table tool
Start (top-left) – The three first images of the collection are shown in a large size
Flipping (top-right) – The next or previous three images are displayed after the flipping gesture is performed
Flicking (second row-left) – A similar but longer movement triggers a continuous scrolling
Stoppingflicking (second row-right) – Tapping on the table stops the continuous scrolling
Piling to layer A (third row-left) – Piling the green central image to layer A by performing an orthogonal move-
Au
gm
en
ted
Rea
lit
y T
oo
ls16
1achieve removal of an image from a soft-pile or positioning an image to another soft-
pile. In this way, we are making the interaction simpler by having designers use both
hands collaboratively where one hand has a different function from the other.
Evaluation5.4.5 The usability and usefulness of the Funky Coffee Table prototype were tested in
an exploratory user study. One of the main questions that we wanted to answer
was: will practicing designers see the prototype as a relevant tool for creating MBs?
Moreover we wanted to test the interaction techniques (hand movements) in terms
of naturalness, ease of learning and use. The evaluation was conducted with 10
practicing designers with at least 5 years of experience (13 years of experience on
average). The participants varied in their education (university/academy), age (be-
tween 30 and 46), gender (7 male, 3 female), and dominant hand (8 right, 2 left).
The evaluations were conducted individually. All sessions were recorded on video.
Implementation
A tabletop tool was set up using a desktop PC, which controlled a top-down projec-
tor projecting an image of size 120x40 cm (1272x424 pixels) on a white IKEA table
(120x40x40cm) (Figure 55, bottom-right), as well as an ultrasonic tracking system
– InterSense IS-600 used to track hands. Participants sat on a couch next to the
table. The application was written in C# and OpenGL was used for visualization
purposes.
During the sessions participants wore custom-designed interactive gloves that
contained the sensors for the IS-600 tracking system (Figure 55, top-right). The
gloves were made in Lycra (Figure 55, bottom-left) to allow a comfortable fit for dif-
ferent sizes of hands and were hand sewn.
Designing and making the gloves proved to be much more challenging than
anticipated. It took us 4 weeks to come up with a final design. The created design had
to be both durable and easy to disassemble so the batteries can be replaced.
In the end, four pairs of gloves from different materials were designed and
tested with the sensors in them before the final design was ready (Figure 55, top-
left). As a finishing touch, a blue ‘L’ and a red ‘R’ were embroidered on the left and
right gloves respectively.
ment with respect to the horizontal table surface and stopping between 30-50 cm from the table
Piling to layer B (third row-right) – Piling the fuchsia image to layer B by stopping the orthogonal movement
between 50-70 cm. from the table
Reviewing layer A (bottom-left) – Reviewing layer contents using the non-dominant hand
Reviewing layer B (bottom-right) – Reviewing layer B by placing the non-dominant hand higher

Co
-Desi
gn
ing
In
ter
ac
tiv
e S
pac
es.
.. 16
2
Tasks
Users were asked to focus on both the relevance of the application for the creation
of MBs, and on the interaction techniques. Following a description of the interac-
tion (approximately 5 minutes), participants were allowed to freely explore the
functionality and get acquainted with the application (approximately 5 minutes).
Participants were later asked to perform simple tasks (i.e. change pages, start
and stop scrolling, create piles, re-arrange a pile), starting with 30 different images
at the table-level. Finally, a short post interview was conducted. The average time per
participant was 30 minutes.
Findings5.4.6
General principles
In the first part of our exploratory evaluations, designers started trying out the in-
teraction techniques and as a general observation we can say that they were all able
to use the tool with little or no prior training. They especially liked the naturalness
Figure 55. Design of the interactive gloves and experiment setup
Early designs (top-left) – Four pairs of gloves were designed and tested
Sensor and battery (top-right) – Location of the sensor and battery cradle inside the glove
Final design (bottom-left) – Final interactive gloves with ‘L’ and ‘R’ for left and right hand respectively
Experiment setup (bottom-right) – Experiment setup with the coffee table, gloves and couch

Au
gm
en
ted
Rea
lit
y T
oo
ls16
3and simplicity of the interaction and of the overall tool as can be observed from the
following reactions:
“I think the movements that you have to make in order to browse are very natural. ×It really looks like you are actually browsing a magazine.” [P1]
“It’s beautiful! It’s very nice; it’s a very nice interaction. (It is) what I intuitively do ×when I am just organizing stuff, I have piles around me, I put some things here and
some things there.” [P2]
“I like the flipping movement a lot, it is very quick and clear in combination with ×the sound.” [P5]
“(The proposed interaction) is a more natural way of browsing and you can work ×in different layers at the same time, so you don’t need to do an extra movement
that is not related to your actions in order to change the layer. That’s what happens
now with a 2D browsing system. So you can browse and change layers at the same
time. The multitasking I guess is interesting, not because you are going to do all the
things at the same time, but there could be some overlap between things. This small
overlap between things is nice.” [P6]
“On one hand I like the idea that you have some kind of repertoire on gestures. This ×is a wonderful poetical view. It’s very pure and it’s very playful for mastering the
whole process (of working) with a lot of images and when in your head you always
know where things are. So you can store things in layers which I think is interest-
ing.” [P3]
“It feels like browsing through stock images or digital images, but the bigger ones ×that I am used to with analogue material from magazines. So I like that the image
is being projected (large), colorfully, and bright, and that I can even browse through
them. That, I like. Then I like that you can control the speed.” [P8]
“There’s enough logic to it in browsing layers and moving images between layers. ×And that is something that amazes me because it’s kept simple, in two layers, but
you already use a 3 dimensional virtual idea, while still having a 2 dimensional
(surface) that I have to congratulate you on. It’s beautiful! That really changes the
way you think about interface, that you have in fact virtual possibilities in your
own mind.” [P10]
Hand gestures
Regarding the interaction techniques, we observed that flicking initially caused
most difficulty to our participants, followed by piling. It took two attempts to get
flicking going for five participants while one participant needed three tries to get
piling working. In the first case, the attempt to do a flicking movement would result
instead in flipping a page due to the fact that only the length of the movement dif-
ferentiates both movements. After these initial difficulties participants were able to
continue with the interaction.

Co
-Desi
gn
ing
In
ter
ac
tiv
e S
pac
es.
.. 16
4 There was one conceptual interaction problem for 6 participants who were try-
ing to rearrange a pile by moving an image from the middle layer to another layer. All
10 participants were able to access the middle layer with their non-dominant hand
but upon displaying the layer on the table, they tried to interact with the elements
using their dominant hand at a table-level instead of at a middle layer-level. They all
overcame the problem upon further exploration indicating, “It works fine once you
know what to do.”
Four participants expressed concern about fatigue:
“I am a bit concerned about how much time I have to hold my [left] hand in the air, ×however, the principle behind it is quite logical…” [P1]
“(Doing the flicking movement repetitively) can be quite tiring for me…” [P5] דTo be able to work at a layer level I have to hold my hand in that position. And ×already within a few minutes I could feel it in my arm. So that is not comfortable. I
think you can solve that if you just select the level (layer) with your left hand but so
that it stays there (on that layer).” [P8]
“Keeping your hand in midair, especially if it doesn’t work like you wanted it, then ×you have to keep you hand extended in midair for one and a half minutes. We’re not
built for that I’m afraid.” [P9]
Regarding the relevance of the proposed application, all participants saw a prac-
tical use of the image browser in their design studios. They liked the fact that they
could dynamically browse images (flicking) to make connections with images:
“This kind of browsing gives you more opportunities to select images.” [P1] דI like the fact that images just come by (flicking). I could imagine that there’s even ×more than just horizontal (scrolling). So horizontally, this is a group of images or a
magazine, and then you can also browse vertically and then you go through differ-
ent groups of magazines. That would be nice (to) give you the feeling of (making) a
pre-selection.” [P10]
Feedback
Regarding the feedback provided by the tool, participants mentioned two main
aspects: the naming of the selected layer (i.e. ‘A’ or ‘B’), and the feedback for the
selected image within a layer. With regards to the former, participants said:
“I think the naming of the layer should be done differently. Maybe with gestures ×indicating the number of the layer with your fingers. Then you don’t need to have
the feedback on the table with letters because in a way you are still using the prin-
ciples of GUIs (graphical user interfaces), and now with gesturing you have all the
possibilities so don’t go back to labeling things.” [P6]
“The letter for the layer ‘A’ or ‘B’ is very much in the outer corner of my awareness. בA’ and ‘B’ is also not very poetical. In a certain way this table is poetic with this
transformation or interpretation of gestures (hand movements) into actions. So I

Au
gm
en
ted
Rea
lit
y T
oo
ls16
5could also imagine displaying A and B by a filling-up column or a color or something
like that.” [P3]
“The fact that there are two different colors for the layer letter is good. It’s interest- ×ing that it’s in the corner, it doesn’t take up space and still you know that some-
thing is changing there in the corner of my eye. But I can imagine it could also be
(represented as) a colored dot. Nevertheless I would keep the ‘A’ and the ‘B’ because
it’s easier to talk about.” [P10]
The second aspect mentioned by participants was connected to the feedback
provided by the tool by enlarging a selected image when it becomes active within a
layer:
“I guess it’s enough to show the selected image by enlarging.” [P6] דThe feedback for the image that is selected during piling, you would also expect it ×at the table level when you begin piling. You can’t miss which image you’re trying to
pile but to be consistent you would expect the same enlargement.” [P9]
Interaction above the table
We asked participants about setting the interaction above the table by extending
the available space using layers. Participants agreed with the idea of using the active
work-area above the table:
“I think it’s a nice idea to use the space above the table because then you have ev- ×erything above the same area (table), so that you don’t have to pick up the images
from the floor next to the couch. That’s what actually happens now, that you end up
with photos everywhere.” [P6]
“I find it useful because it has a physical layering, but I don’t find it useful to work ×so that it forces you to keep your hand in the air.” [P8]
“I think it’s a good thing. I think it works really well.” [P7] דMy fist indication is that I really love it. Browsing is beautiful. But I could imagine ×that some people could handle more layers. So the number of layers could be adjust-
able depending on what you are doing.” [P10]
Future uses
Regarding future applications of this table, some participants speculated over pos-
sible uses of the table:
“It looks very promising. You could create an application in combination with the ×Microsoft table (Surface).” [P1]
“I think that for the household, you have a digital camera with photographs from ×your family, children and then you can select the pictures to print out.” [P3]
“I know that the Japanese order at the McDonalds like this. They project the meals ×on the table. This table makes me feel much more like the iPod or iTunes that you
browse through the collection of music, books, things like that.” [P9]

Co
-Desi
gn
ing
In
ter
ac
tiv
e S
pac
es.
.. 16
6 “This table compared to my computer screen and all the thumbnails on it that are ×enlarged to the screen size, is so much more beautiful. And then you also have the
three layers where I can imagine the client saying ‘can we go back to layer B?’ This
could be a very compact editorial table.” [P10]
Discussion5.4.7
Appropriateness of the (coffee) table
We believe that the choice of the IKEA table (and couch) has affected how design-
ers perceived the prototype in a positive way. Designers realized that this was not
a standard coffee table, but a modern and sleek one that could perfectly be found
in a design studio. As such, the chosen coffee table helped greatly in addressing the
importance of the context of creation.
Regarding how the interaction is affected by the seating position around the
coffee table, the tool currently allows browsing and piling images while designers are
sitting comfortably and resting their back. However, for re-arranging piles, design-
ers must lean forward to view the images that are in piles (due to their smaller size),
and to interact with them. We predict that designers will spend a considerably larger
amount of time browsing images than re-arranging them so our main concern at this
point is what would happen with the perception of the tool over prolonged use.
Interaction based on hand movements
In our prototype we have used one-point ultrasonic tracking (ISense). Alterna-
tive solutions such as vision-based tracking can potentially support a richer set of
movements and can also add hand gestures, however, as was pointed out above, the
main motivation for choosing hand movements to interact was to keep interaction
as light and simple as possible. In this respect the tracking capabilities of the ISense
were enough for recognizing a small set of movements implemented in the proto-
type. In relation to a design-studio context, video-based recognition will probably
be more appropriate due to smaller size and price.
Designers favored not having additional interaction devices (i.e. holding tan-
gible objects). The gloves were comfortable and unobtrusive and were perceived as a
means to track hands and not as an interaction device.
Virtual space above vs. around the table
Some participants suggested a few gestures that could be implemented in the
prototype to also support interaction around the table (i.e. at a table-height level,
adjacent to the table). We initially considered this option for our prototype espe-
cially because it fits the selection process: “I choose this image, so I bring it towards
me.” However we believe this type of interaction mimics what happens on a normal
Au
gm
en
ted
Rea
lit
y T
oo
ls16
7desk but does not support the ergonomics of seating on a couch. On a normal desk,
people sit (or stand) at a different height with respect to the table, and can rest
their elbows on the table. Their reaching possibilities are fundamentally differ-
ent than when seated on a couch. The vertical space above the table becomes then
easier to reach than the space around it.
Having said this, setting the interaction above the table did introduce concep-
tual difficulties for interaction as far as the mental model from the users and the
one we were trying to introduce. When re-arranging a pile, the action space is set in
midair (i.e. holding both hands above the table to access a layer and interact with an
image), while the perception space is located at table-level (i.e. image projected on
the table). Participants instinctively tried to grab the projected image at table-level
instead of layer-level.
One possible solution for this problem could be to use the concept of marking
menus [Kurtenbach & Buxton 1993], where different actions can be assigned to
the eight points of the compass or cardinal (i.e. North, East, South, and West) and
ordinal (i.e. Northeast, Southeast, Southwest, and Northwest) directions. In such a
case, left and right would be used to browse images forward and backwards as it is
now, and other directions can be assigned to put images in piles. For novice users,
pressing and waiting would display a discoverable menu as a reminder of the differ-
ent options available. An expert user would simply perform the gesture in the given
direction. These eight directions fall within the capacity of short-term memory and
therefore can be remembered and learned very quickly. The actions can be performed
almost automatically with eyes closed so that the attention is always on the work.
Interaction on vs. above the table
During the evaluation we observed that users had no problems with staying in one
layer or moving between layers, however they all had some difficulties arranging
piles. While the movement itself was well understood most users needed a few at-
tempts to perform it.
All hand movements including page flipping could be performed in midair (it
was not necessary to touch the table surface), however all participants used the table
surface to start a hand movement and generally had less errors performing this hand
movement than when performed in the air. This indicates that interaction in mid
air should be kept for simple actions while interaction on the surface can be more
complex (this also is inline with findings reported by Subramanian et al. [2006]).
We observed that setting the interaction in an unstable position where users are
unable to rest their hands not only causes fatigue but also generates imprecision in
the interaction (e.g. staying within a layer with the non-dominant hand).

Co
-Desi
gn
ing
In
ter
ac
tiv
e S
pac
es.
.. 16
8 Number of piles
We defined the number of piles (n=2) for two reasons. First, our studies showed
that when designers start searching images for MBs, they create a few soft-piles
(1-3) containing around 20 images each. Second, to keep the interaction above the
table comfortable, we set the distance between the first layer (table surface) and
the second layer at 30 cm, and the distance between the second and the third at 20
cm. Adding more layers would imply either placing layers on top in an area that is
difficult to reach while sitting on a couch, or reducing the distance between layers,
adding extra restrictions to the set of hand movements. We are also relying on the
acuity of motor memory for the number of layers above the table that people can
work with. We believe it would be difficult for people to keep track of more than
four layers.
Conclusions5.4.8 We introduced the first of two prototypes providing support for the MB making
process. The Funky Coffee Table is an interactive tabletop tool that supports image
browsing as one part of the process of making MBs. The tool addresses the impor-
tance of the context of creation (section 2.5.6) by setting the interaction around a
coffee table for designers in the context of their design studios. The tool also follows
the principles of intuitive interaction (section 2.5.5) by encouraging designers to
interact with the tool by means of hand movements (section 2.4.5) or asymmetric
two-handed interaction. Finally, the tool extends the available workspace to store
images by interacting and displaying information in the area above the table. Piles
of images can be created in two layers above the table.
Through a user study we explored the limitations of the tool in terms of plac-
ing the interaction above the table, the proposed hand movements, and the image
browser itself. As a general remark, the evaluations showed that designers were able
to use the tool with little or no prior training, and to see a practical use of the pro-
posed Funky Coffee Table in their design studios. Regarding the hand movements,
participants were positive on the naturalness and simplicity of interaction with the
tool. However, they did show some concerns about fatigue in terms of how much
time they would be able to use the tool, especially if they are required to keep their
hands in midair to re-arrange piles. Finally, setting the interaction above the table
introduced some discrepancies with regards to the users’ mental model, especially
when the action-perception spaces are not matching (i.e. re-arranging piles).
The ideas for the Funky Coffee Table were not generated in the dialogue-labs
(chapter 4), but instead were based on findings from the contextual inquiries and
MB interviews (chapter 3). Therefore, we wanted the second tool to reflect some of
the ideas that emerged during the co-design sessions.

Au
gm
en
ted
Rea
lit
y T
oo
ls16
9
Second tool: The Funky Wall5.5
Introduction5.5.1 After designers have gone through the complete process of collecting, browsing, and
connecting images, and then actually building the MB, designers also have to present
the result of their work. They must communicate the story (and the ideas) behind
the MB to their clients. Presentation and communication become important as-
pects to make sure that the right message is conveyed. Clients are guided by means
of an explanation given by the designer so they can understand the ideas behind
the MB (Figure 56, left). However, it is also important how clients perceive the MB.
Receiving feedback and having a constructive discussion is what MBs are all about:
they support idea development by making both the client and the design team
think and reflect on the different possibilities for a future product, service, or trend.
Usually designers will have meetings with their clients to present, discuss and
receive feedback on their MBs. However, in large companies MBs are created as in-
spiration for designers, and other departments within the company (e.g. marketing,
sales, advertising). These MBs set the atmosphere that will later define the direction
for design. These MBs are made available on the company’s Intranet for different
departments to look at and experience them.
It is also common that clients and the design team itself are distributed over
the globe, working in different time zones. MBs are then embedded in PowerPoint
presentations (Figure 56, right) and an extra A4 text document is attached with an
explanation of the MBs. In these cases, Intranet or PowerPoint presentation (section
3.5.8), the main question is, how can designers make sure that the right message is
conveyed? Why was a given image chosen? What is the path through the MB that
Figure 56. Situations observed in our studies in relation to the Funky Wall
Giving a presentation (left) – Designers guide clients through the presentation by means of an explanation
PowerPoint presentation (right) – A MB embedded in a PowerPoint presentation
Co
-Desi
gn
ing
In
ter
ac
tiv
e S
pac
es.
.. 17
0 the designer intended in order to tell the story? And equally important, how can
clients reply and give feedback on what they are thinking? More generally speaking,
how can we support presenting and receiving feedback for a MB?
Related work5.5.2
Gesture and speech-based systems
Clark and Brenan [1991] and McNeil [2005] have extensively studied the relation
between gestures and speech, and the role of gestures in human communication.
Clark and Brenan argue that gestures together with communicative statements help
establish common understanding, and that an appropriate gesture that is easily
interpretable is preferable over complex sentence constructions.
Gestures have also been widely explored as a natural way of interaction for a
range of systems such as tabletop systems, vertical displays, multi-device environ-
ments, and 3D virtual environments [Baudel & Beaudouin-Lafon 1993, Bekker
et al. 1995, von Hardenberg & Bérard 2001, Vogel & Balakrishnan 2004]. Several
projects have studied the application of hand gestures and movements to support
human-computer interaction. Bekker et al. [1995] looked at gestures that people use
when engaged in design activities and, classified them into 4 groups: kinetic, spatial,
pointing and others. They made two interesting observations that are relevant to
this work: they observed that gestures are carefully synchronized with speech and
that gestures occur in relation to the spatial organization of participants and work
artifacts [Bekker et al. 1995]. This is in line with the work of McNeil [2005] who
argues that gestures are an integral component of language. Hardenberg & Bérard
[2001] studied the usability of bare-hand human computer interaction. The study fo-
cused on using static hand postures for issuing a command, and fingers for pointing.
They also proposed a number of application areas, one of which is a wall projection
system. From the user’s perspective, the complete system consists of an interface
projected on the wall. The study demonstrated that the proposed prototypes could
indeed be controlled using hands-only interaction [von Hardenberg & Bérard 2001].
An example of a public display system that is controlled by gestures was
presented in [Vogel & Balakrishnan 2004]. The authors aimed at studying shared, in-
teractive public displays that support transition from implicit to explicit interaction.
They used hand gestures and touch for explicit interaction, while body orientation
and location played part in implicit interaction. They also proposed four interaction
phases that are based on the distance between the user and the display: ambient
display (furthest distance), implicit interaction, subtle interaction and personal
interaction (closest distance).
A few systems employed gesture-based interaction in addition to speech, for
either enriching the presentation process or to improve the communication with

Au
gm
en
ted
Rea
lit
y T
oo
ls17
1remote parties [Tang & Minneman 1991, Baudel & Beaudouin-Lafon 1993, Tang et
al. 2004]. The Charade system [Baudel & Beaudouin-Lafon 1993] allows present-
ers to use free-hand gestures to control a remote computer display, while also using
gestures for communicating with the audience. Tivoli [Pedersen et al. 1993], an
electronic whiteboard, is another example of a system where a free-form gesture
based interface was employed to enrich presentations and discussions during meet-
ings. VideoWhiteboard (VideoDraw) [Tang & Minneman 1991] enables remote
collaborators to work together much as if they were sharing a whiteboard. The key
aspect of the system is that collaborators not only see drawings but also the shadows
of the gestures made by the collaborator at the remote site. The authors argue that
the gestures’ shadows provide a stronger sense of co-presence. Another system that
employs gesture shadows is Mixed Presence Groupware [Tang et al. 2004]. Kirk et
al. [2006] studied different ways to represent gesture shadows (hands, hands and
sketch, sketch only). They concluded that unmediated video representations of
hands speed up performance without affecting accuracy.
Most of the previously presented research looks at real-time communication,
where collaborators interact in real time (they can be either physically co-located or
in different locations). It is, however, unclear to what extent their research findings
can be applied in a situation where communication does not happen in real time but
rather offline.
Capturing and browsing meeting content
There is a large area of research that looks at optimal meeting content capturing
and browsing [Geyer et al. 2005]. Many of these systems are based on the idea of
Activity-based Information Retrieval, which proposes to use user activity (such as
note-taking, annotating, writing on whiteboards) to index multimedia data and
make data retrieval easier [Lamming 1991]. The main difference with our tool is
that most of these systems only look at speech and handwriting notes and not at
hand gestures, as means to segment the meeting and to identify bookmarks [Chiu
et al. 1999, Geyer et al. 2005]. The Cornell Lecture Browser [Mukhopadhyay &
Smith 1999] uses video and speech analysis to capture a structured environment (a
university lecture) using only passive capture and segmentation (no explicit actions
are required from the presenter).
Only a few examples can be found where a speech plus gesture approach is
used to enrich the capturing and (re)viewing of presentations. Ju et al. [1997] use a
motion estimation technique to detect key frames and segment the video (recorded
presentation). The proposed method is robust with respect to slide motions, occlu-
sions and gestures. In addition it enriches the slides by indicating where the speaker
is pointing. Another example is the Active Multimodal Presentations [Elsayed 2006]
concept.

Co
-Desi
gn
ing
In
ter
ac
tiv
e S
pac
es.
.. 17
2 Most of these systems include both explicit and implicit information capture
and segmentation. The Funky Wall, however, attempts to create a structure using
only implicit information. Plus it uses gestures and segmentation (together with
speech and vision) as an additional information channel (that is presented to the
viewer through gesture traces).
Designing the Funky Wall5.5.3 After providing support for browsing with the Funky Coffee Table, and based on
the ideas that emerged during the co-design sessions (i.e. history of the MB and
presentation recorder), we decided to also design support for the final part of the MB
making process, presenting, by designing a Funky Wall that: 1) allows designers to
easily record their MB presentations while capturing the richness of their individual
presentation skills and style, 2) allows both designers and clients to play back and
explore different aspects of the presentation using an intuitive and flexible interac-
tion involving hand movements and body position (i.e. proximity), and 3) supports
two-way communication needed for successful MB design, by allowing clients to
reply and share their thoughts on the MB contents provided both sides own the
same tool.
Proximity-based interaction
The Funky Wall employs four different ranges of interaction depending on the de-
signer’s proximity to the MB: showing, contemplating, replaying, and exploring.
Different interaction modalities and functionalities are made available to the
users (i.e. designers or clients) based on the distance from the screen. Gesturing
close to the screen is used to record a presentation or comment on an existing pre-
sentation (less than 0.5 meters). When the presentation has been created, design-
ers or clients can then contemplate the MB from a distance (more than 2 meters,
no gestures), they can replay the entire presentation (gesturing between 1.5 and 2
meters), or they can also explore specific parts of the recorded presentation (gestur-
ing between 0.5 and 1.5 meters). Our four ranges of interaction resemble the ranges
proposed by Vogel & Balakrishnan [2004] and in Hello.Wall [Prante et al. 2003].
Intuitive and flexible: hand movements and speech
As previously mentioned for the Funky Coffee Table (section 5.4.3), we have de-
cided to follow the principles of intuitive interaction (section 2.5.5) by encouraging
designers to interact with the tool by means of hand movements (section 2.4.5). To
keep the interaction simple, designers can record their presentation by gesturing
and explaining the MB in front of the screen, using their hands to point or outline
specific areas of the MB as they would do in case of an actual presentation.
When a presentation is given, the tool automatically records and keeps essential

Au
gm
en
ted
Rea
lit
y T
oo
ls17
3aspects of the presentation at three main information layers and in combination
with the MB itself: gesture, sound (speech) and vision. These information layers are
analyzed in order to split the presentation into a number of meaningful segments.
Each segment is associated with a specific time, interval and specific area on the MB
(not every segment has this property since part of the presentation can cover gener-
al aspects of the MB without relating to any specific part). There are three important
attributes that are used for splitting: the location of hands, the acceleration of ges-
tures, and pauses in speech. Preliminary observations show that location and speed
of the gesture can be used as means to create meaningful indices, i.e., to associate
the speech layer with a particular area of interest. These attributes allow segmenting
the audio file and associating every segment with a specific area in the MB.
Two-way communication
A MB is an idea development tool. During the MB making process, designers and
clients have several rounds of discussions to reach agreement on the ideas being
presented in the MB. Therefore, for a successful MB design the tool should support
two-way communication between designer and client. The Funky Wall supports
this iterative process by allowing designers and clients to provide input by creat-
ing a presentation and share their thoughts by providing feedback. For this type of
communication to happen, two Funky Walls are needed, one for the designer and
another for the client.
Interaction techniques5.5.4
Showing
To begin recording their presentation, designers simply need to gesture and speak
in front of the MB at close range (less than 0.5 meters from the screen) (Figure 57,
top-left). As designers are using both hands to gesture in front of the screen, the
tool displays white traces of the gestures made, as if designers were putting down
a continuous flow of paint with their hands (Figure 58, top-left). To allow good
visibility of the MB the opacity of the white trace is set to 30%. Additionally, ten
seconds after the gesture has been overlaid on top of the MB it gracefully fades out
to 25% opacity. In this way, the latest traces left by the designer are made more
prominent than previous ones.
The tool captures and segments both the speech and the natural hand move-
ments made by the designer, hence creating associations between audio segments
and gestures. Wang Freestyle (Levine & Ehrlich 1995) is a system that allows users
to annotate a document (TIF file) using a stylus, and speak while they are annotat-
ing. The file is then emailed back to the intended recipient who can play back the
audio synchronized with the marks made.

Co
-Desi
gn
ing
In
ter
ac
tiv
e S
pac
es.
.. 17
4
Contemplating
Once a presentation has been completed, the spectators (i.e. designers or clients)
can review the recorded presentation (Figure 57, top-right). Users contemplate the
MB from a distance greater than 2 meters. This allows spectators to have a more
comfortable and clean overview of the MB. No gesturing is possible at this range
(Figure 58, top-right).
Replaying
Spectators can replay the entire presentation by approaching the screen at a dis-
tance between 1.5 and 2 meters from the screen (Figure 57, bottom-left). At this
range, users can have an overview of the associated recorded content created by the
Figure 57. Proximity-based interaction. Different parts of the tool are revealed depending on the designer’s
proximity to the screen.
Showing (top-left) – Showing by gesturing next to the screen (<0.5m)
Contemplating (top-right) – Contemplating the MB from a distance for a comfortable overview (no gestures >2m)
Replaying (bottom-left) – Rising the dominant and non-dominant hands display all gestures and the complete
audio explanation respectively (gesturing 1.5-2m)
Exploring (bottom-right) – Exploring specific parts of the presentation. The dominant hand displays the dynamic
visual gestures while the non-dominant hand triggers the associated audio (gesturing 0.5-1.5m)

Au
gm
en
ted
Rea
lit
y T
oo
ls17
5
designer while showing the MB, and which the tool recorded. Raising the dominant
hand results in displaying a static representation of all gestures made during the
presentation semitransparent on top of the MB (Figure 59, top-left). Raising the
non-dominant hand will trigger the complete speech or audio explanation. By put-
ting both hands together, the recorded speech will be played and the transparent
dynamic gestures will unfold as the presentation progresses (Figure 58, bottom-
left).
Having an overview of all gestures by displaying them as a static representation
allows spectators to quickly see areas of high interest where gestures concentrate.
This might be helpful for example if the spectator wonders whether or not the de-
signer has addressed specific parts during the presentation.
Figure 58. Proximity-based interaction. Designers interacting with the four main parts of the tool.
Showing (top-left) – White traces of the gestures made by the designer are displayed
Contemplating (top-right) – Having a comfortable and clean overview
Replaying (bottom-left) – Putting both hands together triggers both the recorded speech and the transparent
dynamic gestures
Exploring (bottom-right) – Viewing a static representation of the gestures made in a specific area by pointing with
the dominant hand.

Co
-Desi
gn
ing
In
ter
ac
tiv
e S
pac
es.
.. 17
6
Exploring
If spectators want to explore specific parts of the MB, they can take one step closer
towards the screen (between 0.5 and 1.5 meters) (Figure 57, bottom-right). By
pointing with the dominant hand to a given area in the MB, users can view a static
representation of the traces made in that area (Figure 58, bottom-right & Figure
59, top-right) while the rest of the traces remain hidden. These overlaid traces of
gestures serve as guides for retrieval. We provide visual contextual feedback so that
spectators are able to identify time-based connections between associated explana-
tions (i.e. gesture and speech) within the presentation. The tool highlights both the
explanations made by the designer just before and immediately after the currently
selected gesture. The currently selected gesture is displayed in white, while the
Figure 59. The Funky Wall tool
Replaying (top-left) – Visual feedback displaying all gestures made during the presentation semitransparent
on top of the MB
Exploring (top-right) – Static representation of the traces made on top of the image (textured wall)
Visual contextual feedback (bottom-left) – The tool highlights the currently selected gesture in white (wood),
the previously selected gesture in a lighter shade of white (textured wall), and the next gesture in black (beans)
Experiment setup (bottom-right) – A designer exploring specific parts of the presentation wearing the interac-
tion gloves

Au
gm
en
ted
Rea
lit
y T
oo
ls17
7previous gesture is shown in a lighter shade of white as if faded. The next gesture
is displayed in black, as something that still needs to be discovered (Figure 59,
bottom-left).
Putting both hands together display the dynamic gestures together with the
corresponding spoken explanation. The tool allows the entire MB to remain visible
while individual areas are highlighted, and gesture trails are triggered.
If after reviewing the presentation the designer is unsatisfied with the results,
they can go back and make the presentation once again by following the procedure
described for showing. The assumption here is that MB presentations usually last
somewhere between 5 and 8 minutes. Therefore, instead of providing a tool that al-
lows editing specific parts of the presentation, we propose that they make the entire
presentation over.
Supporting two-way communication
When designers are satisfied with the recorded presentation, they can share it with
their clients who are located at a remote location. By having a similar Funky Wall in
their offices, the clients can hear and see the associated explanation or story that
the designer originally wanted to convey. The clients can explore the entire presen-
tation or specific parts of it by following the procedures described in contemplating,
replaying, and exploring. But more importantly, to truly support two-way commu-
nication, clients must be able to give designers feedback based on their perception
and interpretation of the MB.
Clients can reply and add their own comments to the MB using the same inter-
action modality used by designers to record their presentations described in showing
(gesturing at less than 0.5 meters from the screen). In this way, designer and client
can have several iterations throughout the MB making process.
Evaluation5.5.5 We conducted exploratory user evaluations of our prototype in order to test the
usefulness and usability of the Funky Wall (Figure 54, bottom-right). First, we
wanted to see if practicing designers would see the prototype as a relevant tool to
present their MBs. Second, we wanted to test the interaction techniques in terms of
naturalness, ease of learning and use.
We recruited 12 practicing designers with at least 5 years of experience in
design practice (13 years of experience on average). The participants varied in their
education (university/academy), age (between 30 and 46), gender (9 male, 3 male),
and dominant hand (10 right, 2 left). The evaluations were conducted individually.
All sessions were recorded on video.

Co
-Desi
gn
ing
In
ter
ac
tiv
e S
pac
es.
.. 17
8 Tasks
In the first part of the study, we asked participants to present a MB to us using
our tool. We asked them to bring a MB they had created for a past project. If they
were unable to bring a MB with them to the session, as an alternative we showed
them one of our own MBs and we let them create their own story around it. Each
participant was told that during their presentation, they would be using a tool that
tracked their hand movements and record their speech, while the tool would display
traces of their hand movements. This part lasted for approximately 5 minutes.
In the second part of the study we asked them to play the role of the client
by letting them discover the story behind a MB that was provided to them. Each
participant explored a presentation we had prepared in advance using the tool. Fol-
lowing a brief description of the interaction we allowed them to freely explore the
functionality and get acquainted with the application. This part took approximately
10 minutes.
In the third part of the study, we asked them to walk us through their experi-
ences while creating their own presentation and then while exploring the given pre-
sentation. They shared their thoughts on their interpretation of the different stages
of the interaction and the feedback provided. In this final discussion, we wanted to
assess the relevance of our tool for presenting MBs to their clients. We also tried
to see if they were able to perform the hand gestures. This discussion lasted for 30
minutes, on average per participant.
Implementation
A tool was set up using a desktop PC connected to a back-projection screen with
resolution 1024x768 pixels and physical size 2.0 x 1.5 meters, as well as an ultra-
sonic tracking system – InterSense IS-600 used to track hands. During the sessions
participants wore custom-designed interaction gloves that contained the sensors.
The gloves were made in Lycra to allow a comfortable fit for different sizes of hands.
Participants stood in front of the screen. The application was written in C# and
used OpenGL for visualization purposes. Both the presentation and replay parts of
the prototype were fully functional. The analysis phase, where the presentation is
segmented, was done manually.
Findings5.5.6
General principles
Designers were positive about the general underlying principles behind the tool. In
general terms, they agreed with the way the tool provided support for presenting
MBs:

Au
gm
en
ted
Rea
lit
y T
oo
ls17
9“I think that with this system you can easily identify different parts of the presen- ×tation and play them back again. In a way, you have removed the presenter but you
have kept the gestures and the impact the gestures make, which is nice.” [P2]
“It’s beautiful! I like the idea a lot. It’s very stimulating. In case of long and complex ×presentations this allows you to have reminders of where certain parts of the pre-
sentation were, something like chapters. You really get the feeling like you see the
entire MB and you can focus on the subjects you like by zooming into some parts.
The feeling is good, you feel in control of the presentation.” [P3]
“I do like the gestures and maybe you could recognize people by (their gesturing) ×after some time. The way you tag automatically the spots with text that’s really
beautiful I think. So that’s very, very rich.” [P10]
Hand gestures
In the first part of the study where participants were asked to present a MB using
the tool, designers were able to interact with the tool with no prior training. They
especially liked the naturalness and simplicity of the interaction through hand
movements. However, in the second part of the study participants experienced
some difficulties when exploring a presentation by triggering sounds. They specifi-
cally expressed some concerns about the amount of gestures they would have to
perform and fatigue. They also found some of the gestures awkward or uncomfort-
able to make (e.g. putting both hands together in mid-air to trigger a sound):
“It can be a bit heavy in terms of all the gestures you have to make, but it is easy to ×step into (and move between the different proximity areas). But it’s nice that it is
physical. It’s refreshing!” [P3]
“Bringing both hands together to trigger sounds is very uncomfortable. Maybe (you ×could do) a quick movement in the air like you are pressing something, or just use
your finger.” [P4]
“The gestures you are making when presenting are natural, but the gestures you ×have to make to retrieve information are not. It would be better to make a quick
selecting movement.” [P6]
Proximity-based interaction
We also wanted to hear from designers on the idea of using proximity-based
interaction. Designers welcomed the introduction of this interaction style to reveal
different parts of the tool to support the presentation of MBs. They told us that the
coupling between stages or locations and the available activities was natural as can
be seen in these comments:
“I think it’s good because if you step back you immediately make it clear that I want ×to have the overview. If you go closer you want to have some detail or talk to some-
body. And you go back again and you listen and you want to see the whole picture.

Co
-Desi
gn
ing
In
ter
ac
tiv
e S
pac
es.
.. 18
0 So this is quite logic for me.” [P8]
“If I am sitting at the back then I am the audience, and it’s about general things ×anyway. If you want to go to detail you stand up and you point. I might imagine
that the big chief doesn’t want to stand up and gesture from his chair. But I agree
with the mapping of distance and different functionalities.” [P9]
“It totally makes sense that you say the place where you are standing at the back is ×an overview and (you increasingly) get more and more interactive with the system
until the point where you are actually touching (the screen) and sending back your
comments.” [P10]
Participants mentioned some difficulties in knowing the exact location they
were in (i.e. showing, contemplating, replaying, exploring) due to a lack of feedback.
This happened especially when designers would move between different parts of
the tool (i.e. closer or further away from the display) without performing any hand
gestures (i.e. keeping their hands in a resting position next to their body):
“It’s fun! You try to move back and forward, and see what happens in each stage. ×This type of aesthetics of interaction can trigger new ideas in designers to try new
things. I miss some kind of feedback to know where I am standing. There should be
dynamic transitions between locations.” [P3]
Visual feedback
Regarding the visual feedback provided by the tool by showing the traces of ges-
tures on top of the MB, the discussions were centered around three main topics:
amount of visual information, dynamic gestures, and feedback for previous and
next speech segment.
In relation to the amount of visual clutter, participants had different opinions.
Some participants commented on the amount of visual clutter that the gestures cre-
ated while others suggested filtering out or grouping some of the gestures:
“At a certain point it is getting increasingly cluttered.” [P4] דI think the way the visual feedback is presented is done in a subtle way; it does not ×ruin the impression of the MB.” [P5]
“The MB disappears behind the gesturing. So it might be good to somehow filter it ×or simplify it towards blobs because I think it’s a bit sad that the MB fades.” [P9]
Participants also commented on the helpfulness of being able to play back the
dynamic gestures on top of the MB as they heard the explanation. They especially re-
flected on the positive impact the dynamic gestures have on the overall presentation.
Participants said the dynamic gestures made it richer, more alive, and more human
than other types of standalone presentations (i.e. PowerPoint):
“It helps to better explain the picture. It enriches the experience and gives a touch ×of sensibility. It makes it easier (for you) to connect. Although you are not there

Au
gm
en
ted
Rea
lit
y T
oo
ls18
1present anymore as a designer, it seems that you are there. It is like a ghost of you.”
[P1]
“It really (makes it) much more alive. I can feel that the designer was there doing ×those gestures. I think that is nice, it makes it more human.” [P2]
“(Seeing the dynamic gestures) is funny; you really get the feeling that the designer ×said this and was pointing while he was doing it. (It feels) like going back in time.
I think that if you just highlight an image and you hear the story is really different
than if you see the process of showing that story. I like that a lot!” [P3]
The final aspect of visual feedback that designers reflected on was showing the
previous and next speech segment together with the currently selected one. Design-
ers saw this aspect as a bonus as it helped them get into the context of the presenta-
tion:
“I really liked being able to explore temporally, going back and forth. There is a real ×nice coupling. In traditional presentations you have no cues about what is happen-
ing, where am I and where am I going to go next. That is a really nice aspect of this
tool. This is much more intuitive than just having a timeline or something similar
because now you can actually see how things unfold temporally alongside the
thematic unfolding.” [P5]
“It’s good that you indicate the direction in black. That will be the next part of the ×story. It makes sense.” [P1]
Rehearsing presentations
Finally, participants reflected on how the Funky Wall could potentially become a
support tool to improve presentation skills. Displaying the gestures in visual form
made them more aware of how they use their hands during presentations, which
could influence the way they present:
“I become more aware of what I am doing. I have to practice to be clear, for example ×by making circles around images. It’s a new way of presenting. It’s exciting actually.
[P1]
“I also see it as a rehearsal tool so you can really put up a presentation, see how you ×did, what you forgot, and improve it.” [P2]
“It’s a good idea for the presenter. It forces you to think of the whole structure of the ×presentation. This system could help the presenter become a better presenter.” [P5]
Discussion5.5.7
Feasibility of the tool
In our prototype the analysis phase, where the presentation is segmented, was done
manually. The main reason for doing this was that the goal of the study was to first
assess the potential usefulness and usability of such tool. However, based on the

Co
-Desi
gn
ing
In
ter
ac
tiv
e S
pac
es.
.. 18
2 results reported in the literature and the analysis of gesture-speech synchroniza-
tion automation, our tool seems feasible [Stifelman 1997].
For segmentation our tool does not need to recognize speech, we only need
to detect phrase boundaries. One way of detecting phrase boundaries is by using
pauses (intervals of non-speech audio between speech segments) [Wang & Hirsch-
berg 1992]. Stifelman [1997] found that phrases could be robustly identified using a
threshold of 155 ms; pauses shorter than the threshold are most likely pauses within
a phrase while longer ones are pauses between phrases. The speed and location of
gestures can also be used to make the segmentation more robust. In our exploratory
study we have observed that speed can be used to separate between explanations
of specific parts (slow movements), connections between different parts (fast long
movements), and the general discussion of the MB (often fast short movements).
Applying a similar approach to presentations
A similar approach can be used in webcasting, such as ePresence (http://epresence.
tv/) or Microsoft webcasts (http://www.microsoft.com/events/). Webcasts are
archived and can be accessed many times. By adding a gesture layer we can enrich
the presentations, and improve the efficiency and understandability of the presen-
tation. We can also use gestures to create indices or bookmarks that would help to
browse through presentations. This is of course more applicable to highly visual
presentations that would naturally lead to many pointing and outlining gestures.
Using other media to record and replay
We believe that the use of gestures allows designers to more clearly express the feel-
ings and ideas for a MB and therefore can enrich the presentation and improve the
way that the client can later perceive the MB. The same is applicable to the replaying
and annotating of the presentation. However the latter part can also be done on
any desktop system using a standard pointing device such as a mouse. Part of the
richness will be lost, but nevertheless the message can be conveyed. In principle,
the presentation could also be done on a desktop but we fear that the added rich-
ness will be lost.
Visual vs. audio feedback
Feedback in the tool comes mainly in the form of visual representations. Some par-
ticipants found it difficult to know exactly in which location they were only based
on visual aspects. Providing transitions by means of sound between the different
parts of the presentation is something that should be supported to reduce some of
the visual clutter.

Au
gm
en
ted
Rea
lit
y T
oo
ls18
3Conclusions5.5.8 We introduced the second and final prototype that provides support for the process
of making MBs. The Funky Wall is an interactive wall-mounted display tool that
supports designers in conveying the story behind MBs in situations when face-to-
face communication is not possible. The tool allows designers to easily record MB
presentations while capturing the richness of their individual presentation skills
and style. The tool also allows both designers and clients to play back, explore and
comment on different aspects of the presentation, by following the principles of
intuitive interaction (section 2.5.5), interacting with the system using hand move-
ments (section 2.4.5) and body position (i.e. proximity).
We have evaluated the tool with professional designers in order to test its
usefulness and usability. The results of the study showed that designers saw a practi-
cal use of the tool in their design studios. Participants felt that the tool gave them
control over the presentation, so they could, with little effort, explore different
aspects of the MB. Moreover they felt that the combination of speech and traces of
hand movements gives a touch of sensibility and makes it easier to connect with the
message. Gestures could be used as a creative tool for expression and aesthetics. Re-
garding the hand movements, participants also liked the naturalness and simplicity
of the interaction. However, just like for the Funky Coffee Table, they also expressed
some concerns about fatigue in terms of how much time they would be able to work
with the tool with their hands in the air.
The exercise of designing, implementing and evaluating the Funky Wall tool has
taught us several lessons that are applicable to other situations where face-to-face
communication is not available, such as webcasting or e-learning. We believe the
three-layer approach we harnessed can potentially allow more flexible presentation
browsing while also reducing the required bandwidth.
Discussion5.6
Design considerations5.6.1 In chapter 3, we identified considerations for a MB making tool (section 3.8). We
will now check to what extent the tools we developed reflect those considerations.
Support idea development
We have identified five stages of the MB making process. Out of those stages, the
first four traditionally belong to the making of the MB (collecting, browsing, con-
necting and building), taking early discussion topics and developing them into more
mature ideas. The Funky Coffee Table fits within this part of the process. The fifth
stage of the process (presenting) explores what happens to the ideas contained in
the MB once the MB designer has completed it and they are shared to the outside

Co
-Desi
gn
ing
In
ter
ac
tiv
e S
pac
es.
.. 18
4 world. The Funky Wall supports this part of the process. However, to fully support
idea development, maybe we should have developed a third tool that supports the
early discussion rounds between client and MB designer, or the early inception of
ideas. The MB making process would then become a more simplified process with
three general stages: inception (beginning), creation (making), and presentation
(the after-life).
Encourage two-way communication
The Funky Wall achieves this by supporting asynchronous and remote presenta-
tions of MBs when face-to-face communication is not possible. We believe that
nothing beats the richness in communication of a co-located presentation. Our tool
tries to allow making a presentation asynchronously and remotely, while capturing
the richness of a co-located presentation by dynamically playing back the gesturing
and the speech made by the designer.
Involving the senses
Both the Funky Coffee Table and the Funky Wall provide users with multimodal
feedback. Throughout the interaction, the tools provide audiovisual feedback on the
current state of the tool. Additionally, the Funky Coffee Table provides a horizon-
tal surface for designers to touch and guide their browsing gestures (i.e. flipping
and flicking). The Funky Wall adds the extra dimensions of time and movement to
automatically index the presentation and dynamically display the gestures made by
the presenter.
Holistic interactive space
The two tools we developed expressed our funky-design-spaces hypothesis. We em-
phasized the importance of an integrated environment in supporting the creation
of MBs with AR. The Funky Coffee Table and the Funky Wall were conceived as
separate interactive tools that concentrate on specific parts of the MB making pro-
cess. Although we did not develop the connectivity and sharing part of the concept,
once all parts of the interactive design space would be functional it should be pos-
sible to easily share and transfer materials or contents from one place to another, as
expressed in some of the ideas generated during the co-design sessions.
Merging with the real context
The Funky Coffee Table does this by providing support in a relaxed setting on a
coffee table while designers are comfortably seated on a couch. The Funky Wall is
set up in a more formal yet natural setting for the task of giving a presentation by
standing up in front of a wall display as they show their work.

Au
gm
en
ted
Rea
lit
y T
oo
ls18
5Flexible and intuitive interaction
The Funky Coffee Table provides flexible and intuitive interaction for MB designers
by allowing them to work using hand movements (gestures). Inspired in the current
way MB designers browse, select, and create soft-piles of images, the tool encour-
ages MB designer to work with both hands collaboratively towards achieving a goal.
MB designers wear hand-made interaction gloves that participants thought were
comfortable and unobtrusive.
The Funky Wall provides flexible and intuitive interaction through hand move-
ments (gestures), and body position (proximity). MB designers are able to simply
walk up to the screen and start gesturing and explaining the MB to their clients. Due
to the simplicity of the tool, little or no prior training is needed for the MB design-
ers to be able to interact with the tool. MB designers wear the same gloves as for the
Funky Coffee Table.
Funky-design-spaces hypothesis5.6.2 Our funky-design-spaces hypothesis introduces the vision of a new holistic design
studio, a comfortable space in which AR tools provide support for the creation of
MBs. These tools should be interconnected and stimulate designers to break away
from their desks inside their design studios.
Up to this point, the Funky Coffee Table and Funky Wall prototypes had only
been evaluated with practicing designers in isolation. We had very little clues about
how participants perceived the idea of this holistic designs studio that our funky-
design-spaces hypothesis was trying to introduce. Therefore, we decided to conduct
an extra evaluation of both tools working alongside each other.
Evaluation
The main purpose of this evaluation was to see to what extent the tools we had cre-
ated expressed our funky-design-spaces hypothesis and to try to provide answers to
our research questions on how and why designers create MBs and how AR tools can
provide support for this activity. The evaluation was conducted with six practicing
designers with at least five years of experience. The participants varied in gender (1
female, 5 male), age (between 30 and 46), and dominant hand (5 right, 1 left). The
evaluations were conducted individually. All sessions were recorded on video.
Setup
The evaluation consisted of two parts. In the first part of the session participants
experienced both tools (Figure 60). One half began with the Funky Coffee Table and
the other half with the Funky Wall, later switching to try the other tool. Partici-
pants were asked to perform the same tasks previously described for each tool.
Participants spent on average 20 minutes per tool.

Co
-Desi
gn
ing
In
ter
ac
tiv
e S
pac
es.
.. 18
6
In the second part of the study, we asked participants to share their views on
our funky-design-spaces hypothesis, specifically on our idea of supporting the process
of making MBs with AR by having distributed interconnected tools instead of a
single centralized system on which designers perform most of their tasks and spend
most of their time. This discussion lasted for 10 minutes, on average per participant.
The average total time of the session per participant was 1 hour.
Findings
As a first general remark, participants agreed with the vision of a holistic design
studio housing interconnected tools that stimulate designers to break away from
their desks, and thus proved the funky-design-spaces hypothesis true. Designers also
reflected on how these spaces could and should encourage collaboration with more
people:
Figure 60. Evaluating the Funky Coffee Table and Funky Wall to test our funky-design-spaces hypothesis
Funky Coffee Table (top-left) – Piling an image into layer ‘A’ using the dominant hand
Funky Coffee Table (top-right) – Reviewing layer contents with the non-dominant hand
Funky Wall (bottom-left) – Exploring specific parts of the presentation using the dominant hand
Experiment setup (bottom-right) – Experiment setup with the coffee table and small couch. The larger couch
seen on the background faced the large screen used for the Funky Wall

Au
gm
en
ted
Rea
lit
y T
oo
ls18
7“It’s good that you support working in different situations not always sitting bor- ×ingly behind your screen.” [P2]
“It’s much better to have different activities in different places within the design ×studio. The problem of doing it in front of a computer is that you are on your own,
alone in front of the computer. Now, for example someone else could be sitting here
(points) and another one there (points), and all could be browsing simultaneously.
So three persons can be working together. Or then you could imagine that you could
use these things for focus groups and things like that. So it’s not just designers that
can use it. It would also be a way to make the world of the designer closer to the
user.” [P1]
“Personally, I don’t think I would use a single device for making MBs. So, yes, I ×agree with your vision of having distributed functionalities.” [P3]
“You could use the table to browse images and magazines in less solitude, and the ×same goes for the wall.” [P6]
Regarding our research question on how AR tools can provide support for the
creation of MBs, participants were positive about the proposed interaction styles
and functionality. Participants reflected both on the use of the orthogonal distance
from the interactive surface as a cue for interaction and the use of hands as the main
input mechanism. Regarding the use of distance for interaction, participants identi-
fied both positive (i.e. extra space) and negative aspects (i.e. lack of physicality) of
interacting in open space (i.e. midair). Regarding asymmetric two-handed interac-
tion, designers found similarities between tools and the use of one hand to select
and the other hand to perform an action:
“I agree because as I said, even though I want to have less chaos in my office ×because I need my space, at the same time I still want to see the pile and how big
it is. When I have enough to work with, it may be 20 or 25 images, then I want to
move towards the screen where I make it. So for me it still needs to have the physi-
cal world that I have but you translated it into another physical world into using
distance as a cue for interaction and I like that. Maybe I am missing the physicality
of it (in midair). In a way the table is already a touch screen so it comes very close
to what I want.” [P4]
“(Using gestures) feels good for me because it’s a bit the same with (the wall trig- ×gering sounds) and the table where you choose a layer with one hand and activate
with the other.” [P6]
“What is really new here is the use of distance for interaction which is very clear. If ×you know the system, you know where you are.” [P6]
The table and wall prototypes allowed them to go beyond the functionalities
provided by the tools and imagine how the tools would work together. Designers
reflected on how information would be transferred from one tool to another, as can
be seen in these comments:

Co
-Desi
gn
ing
In
ter
ac
tiv
e S
pac
es.
.. 18
8 “I see this table in a meeting room for example. And then having the images on a ×projector so you can make groups of images and then put it on the wall and the im-
ages appear there, and you have different groups and you can move it there on the
wall. So it’s like a selecting table.” [P1]
“If you have places within one room, it should be easily shareable and also somehow ×clear what the other is trying to communicate to you in any stage of the MB making
process.” [P3]
Conclusions5.7 For my research through design process, I designed two tools to test my hypothesis
of funky-design-spaces. The initial idea was to co-design together with designers AR
tools that would support the creation of MBs. Due to time restraints I developed
one tool before conducting the co-design sessions and a second tool in between the
Finnish and Dutch co-design sessions. Nevertheless, some ideas closely related to
the Funky Wall tool emerged in the Dutch sessions after the tool had been com-
pleted.
Both tools allowed me to test my funky-design-spaces hypothesis, which was
proved true as expressed by participants during the evaluations of the tools. Partici-
pants agreed with the notion of tools that stimulate designers to break away from
their desk.
The process of making MBs as described in section 5.6.1, consists of three
general stages: inception (beginning), creation (making), and presentation (the
after-life). The Funky Coffee Table provides support for one part of the creation stage
(i.e. browsing). The Funky Wall provides support for the final stage of the MB making
process, the presentation stage.
Both the Funky Coffee Table and the Funky Wall provide a flexible and intuitive
interaction through hand movements (gestures) tracked by means of interactive
gloves. The tools also merge with the real context of the activity and the location in
the design studio. Finally, I introduced ‘z’ or the orthogonal distance from the inter-
active surface as a cue for interaction.
In the case of the Funky Coffee Table, using the space above the table allowed
creating extra space for storing and handling images. However, it produced at the
same time a discrepancy for interaction between the action and perception space.
Some designers found it difficult to interact with images in situations where the
action space is set in mid-air and the perception space is located a table-level, such
as for rearranging piles of images. Designers tried to interact with the images where
they were perceived (table-level) instead of in mid-air. Although they were all able
to overcome the problem upon further exploration, these findings raise issues with
regards to my choice for supporting interaction above the table versus other alterna-
tives such as around the table. Regarding the use of hand movements, although

Au
gm
en
ted
Rea
lit
y T
oo
ls18
9participants were positive on its naturalness and simplicity as an input method, they
were also concerned about fatigue and how much time they would have to keep their
hands in mid-air.
Regarding the Funky Wall, I used distance from the vertical display to design
proximity-based interaction to reveal different parts of the tool that supports the
presentation of MBs. Here, designers welcomed the introduction of this interaction
style to support different functions of the tool. However, they also mentioned some
difficulties in knowing the exact location they were in only based on visual feedback.
Designers proposed the use of audio transitions that would allow providing better
feedback and at the same time reducing visual clutter. Regarding the use of hand
movements, they also expressed some concerns on the amount of gestures they have
to perform and they even found some of the gestures uncomfortable to make.

Co
-Desi
gn
ing
In
ter
ac
tiv
e S
pac
es.
.. 19
0
reflections

Refl
ec
tio
ns
191Reflections6
This final chapter consists of a set of reflections on the research presented in this
thesis. A first reflection on the extent to which the activities and user studies
described in the preceding chapters address the specific research questions is pre-
sented, followed by a second reflection on the complete process. Finally, a reflection
on limitations and future work is discussed.
On the research questions6.1
Question 1: What are MBs and why do designers use them6.1.1 This research question was directly derived from design practice through the studies
described in chapter 2. The use of MBs is a love it or hate it issue [McDonagh &
Storer 2005a] for designers and students, and this thesis is greatly influenced by
trying to understand why. In chapter 3, the essence of MBs is explored. The results
of the contextual inquiries with Dutch and Finnish designers consist of a definition
and a work-modeling diagram that describes the process of making MBs in detail.
These results are later shared and discussed with Finnish and Dutch participants
in co-design sessions in chapter 4. Finally, MBs are further explored in chapter 5
by checking the relevance of the support provided by the Funky Coffee Table and
Funky Wall tools for MB creation and communication.
In total, excluding the study with design students, 50 (different) practicing
designers participated in the studies. With an average experience in industry of ten
years (33 years of age in average), the participants made up for around 500 years of
experience with MBs.
Based on the results of these studies, the following definition is proposed by the
author (section 3.7.1):
MBs are an idea development tool used by designers and their clients to communi- ×cate, think, and share their different views that emerge from the design brief while
defining future products, services or trends. Although different types of media can
be used, they mostly consist of images used in different levels of abstraction to tell
a story about the company, product, or audience, and setting a direction for design.
There is no right or unique interpretation of a MB.
Each study enriches our understanding of what a MB is. In the first contextual
inquiry Dutch designers indicate that MB makers specialize in creating MBs and
can then pass the rest of the work to other design professionals. The second study
consisting of MB interviews with Finnish designers opens up our views on MBs
by seeing designers that use MBs as part of their own complete design process.
In the dialogue-labs our definition of MBs is shared with designers to expand our
understanding of MBs. Participants tend to agree with the definition and bring new
insights based on the proposed definition. Finally, our understanding of MBs is put

Co
-Desi
gn
ing
In
ter
ac
tiv
e S
pac
es.
.. 19
2 to the test from the perspective of the tools we have created.
So why do MBs stir up such mixed emotions in designers and students alike?
According to McDonagh and Denton [2005b] MBs remain largely an item of faith
in the design community. In this thesis I have tried to shed some light on the issue.
One of the skills required to successfully create MBs consists of having the ability
to work with images on different levels of abstraction. Experience and thus age play
a big role in developing this ability to build meaning and understanding of how to
work with images. Therefore, it becomes difficult for students who are taking their
first steps working with images to understand the real value of using MBs. To them,
MBs sometimes feel like a meaningless addition to a project’s list of deliverables
[Garner & McDonagh-Philp 2001]. Some participants suggested that students who
are in fourth or fifth year of design education can understand and work on an ab-
stract level which is necessary to work with images, and not before that. Moreover,
some students are unable to work with MBs even after they graduate. This brings us
to the issue of practicing designers who hate or do not believe in MBs.
In chapter 4, we discovered differences in creativity, and willingness to let go
and get started with the creative tasks. This would indicate that designers are not
equally creative or equally equipped with the tools and skills to perform their work.
Howard Gardner proposes the following definition of intelligence [Gardner 1999]:
“The ability to solve problems or to create products that are valued within one or
more cultural settings.” Gardner emphasizes how our mind is split into modules,
which can be seen in the rich variety of our abilities and creative domains. We all
have different skills, and different people show how skilled they can be in some areas
and not in others. At the Department of Industrial Design of the TU/e a compe-
tency-based educational model has been applied since 2001. Similar to Gardner’s
constructivist conception of intelligence, which takes into account that students
learn in different ways [Lucero et al. 2006], the competency-based model consists
of ten competency areas or abilities that students must develop. At the end of their
studies, students will have been responsible for their own individual learning and
thus their competency development or skills will vary from one student to another.
Their development can be usually visualized as a spider (or star) chart, but also as a
graphic equalizer of an audio component where each band corresponds to an abil-
ity. Just as designers and students have different skills in idea generation, concept
development, technology, empathy, marketing, sketching, visualizing teamwork,
reasoning, reflection, or logic, so too do they have different abilities to work with the
levels of abstraction needed to make MBs.
Question 2: How can AR tools provide support for professional users in 6.1.2 their workThis question is directly related to the results of the funky-design-spaces hypothesis.

Refl
ec
tio
ns
193The results of the evaluations of the Funky Coffee Table and Funky Wall seem to in-
dicate that designers do see an advantage in the support provided by the tools and
thus would be willing to change their current work practices. Although the tools
can be improved and the funky-design-spaces (i.e. the five stages) have not been
completely brought to life, the existing tools allow designers to get a glimpse of the
vision behind our hypothesis. Designers agreed with the notion of tools that stimu-
late them to break away from their desks. A couple of designers suggested that
some of these stages might even be grouped, such as for browsing and connecting.
Intuitive interaction is proposed as a perspective on providing AR support for
professional users in their work. The first idea behind intuitive interaction is allowing
people to simply walk up to a tool and begin interacting with it using their current
skills and knowledge on the task that is being supported. There is no need for long
explanations or time getting used to the tool, therefore people should be able to
interact with the tool with little or no prior training. The key question here is that,
because the tool fits the skills and the supported task, then as a result training is not
required. Thus training the use of the tool is not the key question. Second, intuitive
interaction means allowing designers to freely use their hands as the main input
mechanism for activities that involve creation. Designers wear custom-made interac-
tive Lycra® gloves that contain sensors so that the tool can track their hand move-
ments. The gloves are not perceived as a tangible interaction device but simply as a
way to track hand movements. Later, speech is added as an extra way of interacting
with the system. A third component of intuitive interaction is taking use contexts
into account or the ability of the tools to merge with the existing possibilities of a
design studio environment. Finally, a new cue for interaction is introduced as part
of this idea of intuitive interaction. Both tools use the orthogonal distance from the
interactive surface (or ‘z’) to generate extra interaction space, and to hide and reveal
different functions of the tools. In summary, the four main aspects behind intuitive
interaction are:
Builds on people’s current skills and knowledge on the supported task ×Uses hands as main input mechanism for tasks involving creation ×Tools must merge with the real context ×Use of the orthogonal distance from the interactive surface as cue for interaction ×
These four aspects were put to the test when designers evaluated the tools.
According to the results, participants were mostly positive about the general notion
and the ideas behind intuitive interaction. The tools were evaluated positively for
building on people’s current skills and merging with the real context. Although par-
ticipants agreed with the interaction principles behind the use of hand gestures and
orthogonal distance from the surface to interact, these two aspects can be improved.
Aspects such as mental models, fatigue, visual and auditory feedback, and transi-
tions between areas can be further explored.

Co
-Desi
gn
ing
In
ter
ac
tiv
e S
pac
es.
.. 19
4 On the research process6.2 The relevance of the work described in this thesis refers to an academic context
with its main purpose being knowledge generation. However, as stated in the
introduction (section 1.3), I was also interested in the overall research process with
regards to the use of different UCD methods to unveil the needs of users, not only
in an academic context, but also in an industrial one. In this section I plan to move
towards an industrial context to reflect on some of the lessons learned along the
way.
How realistic is a three-year design process like the one described in this thesis?
Would project leaders and managers be willing to use this amount of resources in an
industrial context? Can this process be carried out in a shorter time span? These are
all fair questions that I will try to reflect upon.
How realistic is it?6.2.1 For an industrial context where time is money, for sure the process described in
this thesis is unrealistic. Having to wait for three years before seeing the results of
the design process is something that is acceptable for a research project like this,
but not for industry. I have been constantly thinking about this point during my
long process. In discussions with fellow researchers I have been trying to quantify
exactly how much shorter this process could have been.
In a personal communication with Tuuli Mattelmäki who did her Doctoral the-
sis on design probes, I specifically asked her how short could a probes study become?
Her first reaction was, “people always ask me this question”, proving it was a relevant
one. After initially hesitating to respond she replied: “If you have a larger team, then
it could take three weeks: one for preparation, one for deployment, and one for analysis.”
Compared to the eight months my probes study took, three weeks was quite an
improvement. Having more than one person preparing, deploying and analyzing the
probes sure would speed up things, but would the results be any different?
The probes study allowed me to find a focus for research (i.e. supporting the
creation of MBs). As the project progressed, efficiency gradually increased with every
subsequent user study. As I had a clearer idea of what had to be done the resources
used in terms of time for each study were less and less and I was able to involve more
designers per study. For example, the four contextual inquiries with Dutch design-
ers took a total of four months, while the ten MB interviews with Finnish designers
took five months, both including the final analysis. With each participant I became
more experienced in preparing and conducting the interviews. I knew better what to
look for, what to ask, when to remain silent, and when it was time to leave as I had
collected sufficient information.
The co-design sessions were probably the best case of efficiency in terms of re-
sources. It took four weeks to prepare and conduct four dialogue-labs sessions in Fin-

Refl
ec
tio
ns
195land: one week to plan the sessions, two weeks to prepare the materials and contact
the participants, and one week to conduct the sessions. Since the materials used in
the Dutch sessions were basically the same and thus less preparation was required, it
took 3 days to conduct three dialogue-labs sessions in the Netherlands. A vital aspect
in this case was having Kirsikka Vaajakallio as a second researcher involved in pre-
paring and conducting the sessions both in Finland and in the Netherlands. Kirsikka
had previous experience conducting similar creative sessions to allow participants
express their ideas using physical materials [Vaajakallio & Mattelmäki 2007]. Our
joint experience helped us speed things up as the sessions progressed. In an indus-
trial context, dialogue-labs could be conducted in four weeks: planning the sessions,
preparing the materials, conducting the sessions, and doing the analysis would take
one week each. The time required to conduct the sessions might vary depending on
the number of sessions planned. Due to the amount of information generated dur-
ing each session, team members can only participate in one session per day.
Regarding the development of the tools, it took Dzmitry Aliakseyeu and me
three months to conceive, discuss, design, and implement each of the Funky Coffee
Table and Funky Wall prototypes. Again, having the invaluable experience and help
of Dima to create the prototypes proved a key point in having a shorter development
time. As the project progressed, the resources used in terms of time became closer
and closer to industry standards.
Shortening the process6.2.2 In an attempt to try to shorten the process described in this thesis we set up a proj-
ect that would basically consist of performing similar tasks but in a shorter time
frame. TU/e Industrial Design student Eveline Brink did a three-month project on
how to bring the funky-design-spaces research hypothesis to life from the perspec-
tive of industrial design students. Her main tasks were to conduct a probes study
(with probe interviews) and dialogue-labs that would be translated into proposals
to redesign the space of the VIP lab of our department (Figure 61). In those three
months she was able to 1) successfully conduct a probes study with ten students, 2)
analyze the data and create posters with simple diagrams and drawings for probes
interviews, and finally 3) conduct three dialogue-labs with a total of eight partici-
pants (excluding herself). Using the data collected during the sessions (i.e. video,
pictures, artifacts and questionnaires) she identified 64 ideas that were subse-
quently summarized into 12 directions for design, which were then translated into
4 scenarios. This example shows that it is indeed possible to dramatically shorten
the resources used in terms of time for a long process such as the one described in
this thesis.
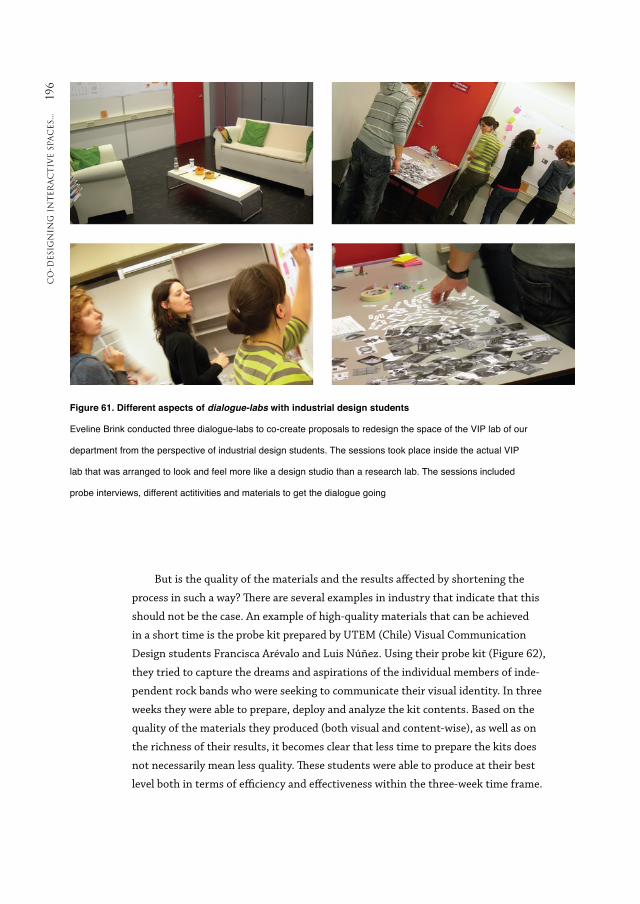
Co
-Desi
gn
ing
In
ter
ac
tiv
e S
pac
es.
.. 19
6
But is the quality of the materials and the results affected by shortening the
process in such a way? There are several examples in industry that indicate that this
should not be the case. An example of high-quality materials that can be achieved
in a short time is the probe kit prepared by UTEM (Chile) Visual Communication
Design students Francisca Arévalo and Luis Núñez. Using their probe kit (Figure 62),
they tried to capture the dreams and aspirations of the individual members of inde-
pendent rock bands who were seeking to communicate their visual identity. In three
weeks they were able to prepare, deploy and analyze the kit contents. Based on the
quality of the materials they produced (both visual and content-wise), as well as on
the richness of their results, it becomes clear that less time to prepare the kits does
not necessarily mean less quality. These students were able to produce at their best
level both in terms of efficiency and effectiveness within the three-week time frame.
Figure 61. Different aspects of dialogue-labs with industrial design students
Eveline Brink conducted three dialogue-labs to co-create proposals to redesign the space of the VIP lab of our
department from the perspective of industrial design students. The sessions took place inside the actual VIP
lab that was arranged to look and feel more like a design studio than a research lab. The sessions included
probe interviews, different actitivities and materials to get the dialogue going

Refl
ec
tio
ns
197
Figure 62. Sample pages from the “Masa: Hágalo usted mismo” probe kit (diary)
Francisca Arévalo and Luis Núñez created high- quality probe materials in spite of
the limited available time. The kit was meant to capture the dreams and aspirations of
(music) band members to create an identity for the band

Co
-Desi
gn
ing
In
ter
ac
tiv
e S
pac
es.
.. 19
8 On the limitations and future work6.3
Iterative design cycles6.3.1 The work described in this thesis consists of a single long design cycle up to the
point of the co-design sessions (chapter 4), followed by two short design iterations
that resulted in the two prototypes that were designed and evaluated (chapter
5). The process includes iterations within stages in the sense of constantly going
back to enrich our understanding of the problem before moving on. For instance,
in chapter 3 the results of our Dutch contextual inquiries were tested against the
findings of the Finnish MB interviews. In chapter 4, the ideas that emerged from
the Finnish dialogue-labs were compared to the results of the Dutch dialogue-labs.
Finally, in chapter 5 the knowledge gained by designing, implementing and evaluat-
ing the Funky Coffee Table was complemented with the acquired knowledge of
going through the same process for the Funky Wall. By testing both tools together
we were able to test our funky-design-spaces research hypothesis. Instead of this
being a linear process, the design solutions evolved through iteration, an inherent
feature of design. Keinonen et al. [2008] argue that the final solution to a (design)
problem can be triggered in any phase within the iterative loop. This goes back to
the discussion on design paradigms (section 1.4), and how the design process I am
supporting is by nature explorative, open, and flexible and thus better responds
to the dynamic, multidisciplinary, and multicultural work needed to create future
interactive intelligent products and services.
A new opportunity for further research consists of doing several shorter itera-
tions of the process. For example, a first iteration of the process might consist of
conducting a probes study with a general research or design problem in mind and
quickly developing a tool based on the knowledge gained up to that point. The first
iteration could already include some initial user involvement in co-designing dur-
ing the probing interviews or in future workshops [Kensing & Halskov 1992]. A
second iteration could consist of conducting contextual inquiries to further explore
and expand the knowledge on the problem, and again co-design with users in more
structured dialogue-labs that lead to the implementation and design of an improved
version of the previous tool or a new tool altogether. A third iteration might include
semi-structured interviews with again co-design activities and maybe even exploring
co-development. It would be interesting to compare how much the results obtained by
the end of the third iteration differ from the results presented in this thesis.
Co-design, co-creation and co-development6.3.2 Traditionally, practitioners have involved users at both ends of the design process:
in the beginning to understand the problem from a user perspective, and at the end
of the process in (usability) evaluations of the proposed designs. However in this

Refl
ec
tio
ns
199thesis I argue that users should drive the innovation process by involving them all
along the way.
The term co-design has been used to refer to the work described in this thesis.
Co-design is a general term used to indicate collective creativity as it is applied across
the whole span of a design process [Sanders & Stappers 2008]. According to Sanders
and Stappers co-creation specifically addresses collective creativity that takes place
at the beginning of co-designing or in the fuzzy front end of product, service, or in-
terface development. The process described in this thesis has in their view (and also
mine) mainly covered aspects of co-creation and to a lesser degree aspects related to
an area that remains largely unexplored: co-development.
Co-development consists of involving end-users in the final stages of the design
process, when decisions are being made. Hence, co-development addresses collective
analysis and decision-making at the later stages of product, service, or interface de-
velopment. Within this new paradigm of co-design (Figure 63), the role of practitio-
ners is to first involve potential end users in co-creation activities by carefully prepar-
ing materials that seek to amplify the creativity of everyday people [Sanders 2006b],
such as the activities described in chapter 4. Similarly, the role of practitioners would
then be to engage users in co-development activities that amplify the analytical-think-
ing and decision-making skills of everyday people. Co-development methods should
aim at allowing everyday people prototype, experience, and help the whole team
address the feasibility of the final designs that reach the development phase.
Just as co-creation activities do not require everyday people to become experts
in color theory, materials, or computer programs (e.g. Photoshop®, Illustrator®,
Flash®) to generate ideas, co-development activities should not oblige everyday
people to know about algorithms, databases or master programming languages (e.g.
ActionScript, C#, Java, Ajax) in order to assess the feasibility of the final ideas. Co-
development differs from end-user programming [EUSES 2008] in the sense that the
latter deals with everyday people who actually use programming languages as part of
their work. Co-development also differs from extreme programming [XProgramming
2008] as the latter seeks to involve the whole team together (programmers, testers,
analysts, coach, and manager) in programming activities including a business repre-
sentative or customer who represents everyday people but who not necessarily is a
real user.
Sanders and Stappers [2008] argue that one of the reasons it has taken so long
for co-creation to have an impact in industry is connected to resistance from existing
power structures to give the power to end-users. I have witnessed similar initial
reticence from designers towards the idea of co-design when presenting the dialogue-
labs at an HCI conference. Practitioners, especially programmers, might be reluctant
to engage users in co-development activities due to the decision-making power they
would have to give away. Both designers and programmers might have to partly give

Co
-Desi
gn
ing
In
ter
ac
tiv
e S
pac
es.
.. 20
0
Figure 63. Stages and methods in a co-design process
Nine stages of the co-design process are represented as circular Post-it® notes while the methods for each stage
are represented as regular notes. At the beginning of the process practitioners and users engage in co-creation
activities. Chances are they will become increasingly involved in co-development activities as they get closer to
the end of the process
ProblemDesign brief
ImplementProductor Service
probes,MBs
workshops,survey,probe
interviews
usabilitytest,
experiment
Analysis
Research
Specify
contextualinquiries,
observation,interviews
Evaluation
Prototype
Concepts
Ideas
dialogue-lab,brainstorm,
collages,sketches
make tools,Playmobil®
Lego®
a�nitydiagrams,
focus group,scenarios,
card sorting
paper &video prot.,mock-ups,
wizard-of-oz

Refl
ec
tio
ns
201up the control they have now. If the result of giving a voice to people is having prod-
ucts, services, and interactions that make more sense to users, then it is a sacrifice
worth making.
Another alternative for future research is then to explore the idea of co-develop-
ment. What is co-development? Can it be applied for any design or research problem?
The user would become another member of the development team, with a say in
the decisions that are being made. If the users are experts in practice to consult and
involve them to understand the context, narrow down the problem, think and proto-
type novel solutions then it only seems natural to involve them in the development
as well. Some methods such as Make Tools [Sanders & William 2001, Vaajakallio
& Mattelmäki 2007] allow practitioners to involve users in early co-development by
quickly building solutions in the real context.
Co-designing with designers6.3.3 Sanders [2006a] suggests involving everyday people as active participants in the de-
sign and production processes, adapting products to better meet their own needs.
When the task is to co-design tools that support the work of designers, can design-
ers still be considered as everyday people? Of course, if designers are invited to par-
ticipate based on their experience as practitioners. Then designers can be everyday
people. It is not my intention to suggest that designers should be the privileged
and exclusive participants in co-design activities. Actually, the assumption that all
designers are (equally) creative or that they are more creative than non-designers is
at least questionable. For example, the results presented in chapter 4 indicate that
some extra facilitation and guidance was needed for some participants that were
less willing to open up and engage in design activities.
A direction for future research might include involving other user groups (non-
designers) in co-design activities, letting these potential users guide the innovation
process. Usually elderly and children first come to mind when thinking of alternative
user groups. Among the latter, Wouter Sluis-Thiescheffer [Thang et al. 2008] is work-
ing on comparing the quality of the ideas that emerge during co-designs sessions
with children by using two methods: brainstorming and prototyping. Although he is
mostly interested in the quality of the resulting ideas, he has found out that brain-
storming generates more creative solutions while the results of prototyping are more
relevant and workable.
Funky-design-spaces hypothesis6.3.4 The vision for the funky-design-spaces hypothesis includes several interconnected
tools that stimulate designers to break away from their desks and move around

Co
-Desi
gn
ing
In
ter
ac
tiv
e S
pac
es.
.. 20
2 their design studios to support the creation of MBs. Our final understanding of the
MB-making process includes six stages:
Defining ×Collecting ×Browsing – Funky Coffee Table ×Connecting ×Building ×Presenting – Funky Wall ×
Two tools were designed and evaluated to test this hypothesis. The Funky Coffee
Table and Funky Wall provide support for browsing and presenting respectively.
The Funky Coffee Table introduced some conceptual difficulties for interaction
regarding the mental model from the users and the one I was trying to introduce
(section 5.4.7). For rearranging piles of images, there is a discrepancy between the
action space (set in mid-air) and the perception space (located at table-level). This
problem was introduced by using 'z' or the orthogonal distance from the interac-
tive surface as a cue for interaction. One way to circumvent this problem is to use 'y'
instead of 'z' as a cue for interaction. Each row of images corresponding to one maga-
zine or pile is browsed horizontally using 'x', and then designers can use 'y' to move
to other groups of images or magazines. Another way of avoiding this problem by
using a combination of 'x' and 'y' is to assign different actions the eight points of the
compass. East and West would correspond to browsing backward and forward while
the remaining six cardinal and ordinal directions could be used for piling images by
throwing images in one of these directions. The actions would be performed almost
automatically so that the attention is always focused on the work. Another improve-
ment for the Funky Coffee Table could be to retrieve the layer contents by using
gestures to indicate the number of the layer with your fingers on the table or the
direction where the layer is located by pointing with a finger. Finally, using 'y' instead
of 'z' as a cue for interaction would also remove the need for designers to keep their
hands in mid-air thus avoiding fatigue.
Regarding the Funky Wall, while using the distance from the vertical display (i.e.
proximity-based interaction) allowed designers to easily reveal different parts of the
tool, at some points it became difficult for them to know exactly in which location
they were based on visual feedback only. This happened especially in some cases
when designers would walk closer or further away from the tool without performing
any hand gestures. One way to tackle this issue is to add an extra sensor that would
only track the designer's position with respect to the screen independent from the
hand gesturing together with audio transitions that would indicate moving from
one location to another. Regarding the gestures as such, participants were again
concerned about fatigue and the awkwardness of some of the gestures (e.g. putting

Refl
ec
tio
ns
203both hands together in mid-air to trigger a sound). One solution here could be to
design a different set of gestures that would allow selecting and triggering by doing a
quick movement in mid-air pointing towards (or pressing) a specific sound or part of
the presentation.
An interesting line of future research is to co-design and evaluate tools that
support the remaining four stages of the MB-making process, namely defining, col-
lecting, connecting, and building. Doing so would allow bringing to life the complete
vision behind the funky-design-spaces hypothesis. We have partly explored provid-
ing support for connecting together with Dima Aliakseyeu, Sriram Subramanian,
and Carl Gutwin [Aliakseyeu et al. 2006a, Aliakseyeu et al. 2007] by conducting a
user study on how people interact with piles on digital tables. Despite this, support
for four stages is missing. It would be interesting to evaluate all six interconnected
tools alongside each other to see if people might feel that some of these tools can be
naturally grouped back together, so that instead of six tools, designers might only
require four. Participants made some comments during the evaluations of the tools
that might lead in this direction.
Evaluations6.3.5 The Funky Coffee Table and Funky Wall tools were evaluated in exploratory user
studies with 10 and 12 participants respectively. The sessions lasted on average 40
minutes per participant. We originally wanted to assess the long-term impact of
introducing AR tools in work processes by setting out the proposed designs in real
context and evaluate their use over a long period of time (i.e. a couple of months).
However, along the way we decided to follow the longer and richer route described
in chapters 3, 4 and 5 that allowed us to let users drive the innovation process.
A final line of future research consists of setting out the Funky Coffee Table and
Funky Wall prototypes together in different design studios for extended periods of
time. This sort of evaluation allows observing the appropriation of technology on be-
half of designers and the emergence of new uses. In this respect, Ianus Keller [Keller
2005] designed and evaluated Cabinet, a prototype that supports designers in their
interaction with collections of visual material. In his work, Ianus exposed Cabinet to
the “roughness of the real world.” Cabinet was tested in a real context for a period
of four weeks in three design agencies. Regarding the appropriation of Cabinet,
designers used them in different ways: 1) to organize sketches and translate them to
renderings (as an image management application), 2) to analyze graphic designs (as
a photo management application), and 3) to organize sketches according to reference
materials (as an organizational tool). In particular, the second user found it annoy-
ing that her colleagues would mess up her collection. The solution she came up with
was to create a pile of images that her colleagues could safely work with and label it

Co
-Desi
gn
ing
In
ter
ac
tiv
e S
pac
es.
.. 20
4 both with a physical Post-it® note with the text “start here” and a similar digital note
that said “that means here!” This sort of social interaction that emerges over longer
use with the proposed tools is worth further looking into.
“People who seek the certainty of externally structured, well-defined problems will ×never appreciate the delight of being a designer.” – Nigel Cross.

Refl
ec
tio
ns
205

Co
-Desi
gn
ing
In
ter
ac
tiv
e S
pac
es.
.. 20
6
references

Refe
ren
ces
207References
Aliakseyeu, Dzmitry, Sriram Subramanian,
Andrés Lucero & Carl Gutwin (2006a)
Interacting with piles of artifacts on
digital tables. In Proceedings of AVI ‘06,
ACM, 159-162.
Aliakseyeu, Dzmitry, Jean-Bernard Martens
& Matthias Rauterberg (2006b) A com-
puter support tool for the early stages
of architectural design. Interacting with
Computers 18(4), Elsevier, 528-555.
Aliakseyeu, Dzmitry, Andrés Lucero & Sriram
Subramanian (2007) Interacting with
piles of artifacts on digital tables. Digital
Creativity 18(3), 161-174.
Apted, Trent, Judy Kay & Aaron Quigley
(2006) Tabletop Sharing of Digital Pho-
tographs for the Elderly. In Proceedings
of CHI’06, ACM, 781-790.
Archer, Bruce (1995) The nature of Research.
Co-design, (2), 6-13.
Baudel, Thomas & Michel Beaudouin-Lafon
(1993) Charade: remote control of ob-
jects using free-hand gestures. Commun.
ACM 36(7), 28-35
Bekker, Mathilde M., Judith S. Olson & Gary
M. Olson (1995) Analysis of gestures in
face-to-face design teams provides guid-
ance for how to use groupware in design.
In Proceedings of DIS ‘95, ACM, 157-166.
Bekker, Mathilde (1995) An analysis of user
interface design practice: towards support
for team communication. Doctoral Disser-
tation, Delft University of Technology,
the Netherlands.
Binder, Thomas (2007) Why Design:Labs?
In Proceedings of Design Inquiries ‘07.
Available at www.nordes.org, accessed
September 4, 2007.
Bonnici, Peter & Linda Proud (1998) Design-
ing with Photographs. RotoVision, 62-63.
de Bono, Edward (1970) Lateral Thinking:
Creativity Step by Step. Harper & Row.
Brandt, Eva & Camilla Grunnet (2000) Evok-
ing the future: Drama and props in user
centered design. In Proceedings of PDC
‘00, 11-20.
Brandt, Eva, Martin Johansson & Jörn
Messeter (2005) The design Lab:
Re-thinking What to Design and How
to Design. In Design Spaces. Edited by
Binder and Hellström, Edita Publishing,
34-43.
Brandt, Eva (2006) Designing Exploratory
Design Games: A Framework for Par-
ticipation in Participatory Design? In
Proceedings of PDC ‘06, ACM, 57-66.
Buur, Jacob & Susanne Bødker (2000) From
usability lab to “design collaboratorium”:
reframing usability practice. In Proceed-
ings of DIS ‘00, ACM Press, 297-307.
Buxton, William (2007) Sketching user experi-
ence: getting design right and the right
design. Morgan Kaufmann.
Carter, Scott & Jennifer Mankoff (2005)
When participants do the capturing:
the role of media in diary studies. In
Proceedings of CHI ‘05, ACM, 899-908.
Chiu, Patrick, Ashutosh Kapuskar, Sarah Reit-
meier & Lynn Wilcox (1999) NoteLook:
Taking notes in meetings with digital
video and ink. In Proceedings of Multime-
dia ’99, ACM, 149-158.
Clark, Herbert H. & Susan E. Brennan (1991)
Grounding in Communication. In L.B.
Resnick, R.M. Levine, & S.D. Teasley
(Eds.). Perspectives on socially shared

Co
-Desi
gn
ing
In
ter
ac
tiv
e S
pac
es.
.. 20
8 cognition. APA, 127-149.
Cristiano, Giuseppe (2007) The Storyboard
Design Course. The ultimate guide for art-
ists, directors, producers and scriptwriters.
Thames Hudson.
Cross, Nigel (2006) Designerly Ways of Know-
ing. Springer-Verlag London.
Dabner, David (2004) Graphic Design School:
The Principles and Practices of Graphic
Design. Thames & Hudson, 52-55.
Diederiks, Elmo & Steven Kyffin (2006)
Experience and Application Research. In
Ambient Lifestyle: From Concept to Experi-
ence, edited by Aarts, E. and Diederiks
E., Amsterdam, BIS Publishers, 36-44.
Dietz, Paul & Darren Leigh (2001) Diamond-
Touch: a multi-user touch technology. In
Proceedings of UIST ‘01, ACM, 219-226.
Dorst, Kees (2007) Understanding Design: 175
Reflections on Being a Designer. Gingko
Press.
Dreyfuss, Henry (1967) Designing for People.
Allworth Press, New York.
Eber, Dena E., Bonnie Mitchell & Heather
Elliott (2002) Teaching gems for art and
design. In Proceedings of SIGGRAPH ‘02,
ACM, 18-18.
Eckert, Claudia & Martin Stacey (2000)
Sources of inspiraton: a language of
design. Design Studies 21(5): 523-538.
Elsayed, Adel (2006) Machine-Mediated Com-
munication: The Techology. In Proceed-
ings of ICALT’06, IEEE, 1194-1195.
EUSES (2008) End users shaping effective
software. Available at http://eusescon-
sortium.org/, accessed July 25, 2008.
Frens, Joep (2006) Designing for Rich Interac-
tion: Integrating Form, Interaction,
and Function. Doctoral Dissertation,
Eindhoven University of Technology,
the Netherlands.
Gardner, Howard (1999) Intelligence Re-
framed: Multiple Intelligences for the 21st
Century. Basic Books.
Garner, Steve & Deana McDonagh-Philp
(2001) Problem Interpretation and
Resolution via Visual Stimuli: The Use
of ‘Mood Boards’ in Design Education.
The Journal of Art and Design Education
20(1), 57-64.
Gaver, William, Anthony Dunne & Elena
Pacenti (1999) Cultural probes. Interac-
tions 6(1), ACM, 21-29.
Gaver, William, Jacob Beaver & Steve Benford
(2003) Ambiguity as a resource for
design. In Proceedings of CHI ‘03, ACM,
233-240.
Gaver, William, Andrew Boucher, Sarah
Pennington & Brendan Walker (2004)
Cultural probes and the value of uncer-
tainty. Interactions 11(5), ACM, 53-56.
Gedenryd, Henrik (1998) How Designers
Work: making sense of authentic cognitive
activities. Doctoral Dissertation, Lund
University, Sweden.
Geyer, Werner, Heather Richter & Gregory
D. Abowd (2005) Toward a Smarter
Meeting Record – Capture and Access
of Meetings Revisited. Multimedia Tools
and Applications 27(3), Springer Science,
393-410.
Grossman, Tovi, Ken Hinckley, Patrick
Baudisch, Maneesh Agrawala & Ravin
Balakrishnan (2006) Hover Widgets:
Using the Tracking State to Extend the
Capabilities of Pen-Operated Devices. In
Proceedings of CHI ’06, ACM, 861-870.
Halskov, Kim & Peter Dalsgaard (2007)
The emergence of ideas: the interplay
between sources of inspiration and
emerging design concepts. CoDesign
3(4), 185-211.
Hämäläinen, Perttu, Tommi Ilmonen,
Johanna Höysniemi, Mikko Lindholm
& Ari Nykänen (2005) Martial arts in
artificial reality. In Proceedings of CHI

Refe
ren
ces
209‘05, ACM, 781-790.
von Hardenberg, Christian & François Bérard
(2001) Bare-hand human-computer
interaction. In Proceedings of PUI ‘01, vol.
15, ACM, 1-8.
Holtzblatt, K., Burns, J., Wendell, Wood, S.
(2004) Rapid Contextual Design. Morgan
Kaufmann.
Hulkko, Sami, Tuuli Mattelmäki, Katja
Virtanen, & Turkka Keinonen (2004)
Mobile probes. In Proceedings of Nordi-
CHI ‘04, ACM, 43-51.
Hummels, Caroline & Joep Frens (2008)
Designing for the Unknown: A Design
Process for the Future Generation of
Highly Interactive Systems and Prod-
ucts. In Proceedings of EPDE ‘08, 1-6.
Hutchinson, Hilary, Wendy Mackay, Bo
Westerlund, Benjamin B. Bederson,
Allison Druin, Catherine Plaisant,
Michel Beaudouin-Lafon, Stéphane
Conversy, Helen Evans, Heiko Hansen,
Nicolas Roussel, Björn Eiderbäck, Sinna
Lindquist & Yngve Sundblad (2003)
Technology probes: inspiring design for
and with families. In Proceedings of CHI
‘03, ACM, 17-24.
Iacucci, Giulio & Kari Kuutti (2002) Everyday
Life as a Stage in Creating and Perform-
ing Scenarios for Wireless Devices.
Personal and Ubiquitous Computing 6(4),
299-306.
Ivey, Marlene & Elizabeth Sanders (2006)
Designing a Physical Environment for
Co-experience and Assessing Participant
Use. In WonderGround, DRS, 2006, 1-17.
Jacucci, Giulio, Antti Oulasvirta, Antti
Salovaara, Thomas Psik & Ina Wagner
(2005) Augmented Reality Painting and
Collage: Evaluating Tangible Interaction
in a Field Study. In Proceedings of Interact
2005, LNCS 3585, 43-56.
Johansson, Martin & Per Linde (2005) Play-
ful Collaborative Exploration: New Re-
search Practice in Participatory Design.
Journal of Research Practice 1(1), 2005.
Ju, Shanon X., Michael J. Black, Scott Min-
neman & Don Kimber (1997) Analysis
of Gesture and Action in Technical Talks
for Video Indexing. In Proceedings of
CVPR ‘97, IEEE, 595-601.
Keinonen, Turkka, Vesa Jääskö & Tuuli Mat-
telmäki (2008) Three-in-one user study
for focused collaboration. International
Journal of Design, 2(1), 1-10.
Keller, Ianus (2005) For Inspiration Only: De-
signer interaction with informal collections
of visual material. Doctoral Dissertation,
Delft University of Technology, the
Netherlands.
Keller, Ianus, Aldo Hoeben & Aadjan Van der
Helm (2006a) Cabinet: merging design-
ers’ digital and physical collections of
visual materials. Personal and Ubiquitous
Computing 10, 2-3 (Jan. 2006), 183-186.
Keller, Ianus, Gert Pasman & Pieter Jan Stap-
pers (2006b) Collections designers keep:
Collecting visual material for inspiration
and reference. CoDesign 2 (1), 17-33.
Kensing, Finn & Kim Halskov Madsen (1992)
Generating visions: future workshops
and metaphorical design. In Design At
Work: Cooperative Design of Computer
Systems, J. Greenbaum and M. Kyng,
Eds. Lawrence Erlbaum Associates,
Mahwah, NJ, 155-168.
Kirk, David & Danae Stanton Fraser (2006)
Comparing remote gesture technologies
for supporting collaborative physical
tasks. In Proceedings of CHI ‘06, ACM,
1191-1200.
Kolli, Raghu, Gert Pasman & Jim Hennessey
(1993) Some considerations for design-
ing a user environment for creative
ideation. In Proceedings of Interface ‘93,
72-77.

Co
-Desi
gn
ing
In
ter
ac
tiv
e S
pac
es.
.. 21
0 Koskinen, Ilpo, Katja Battarbee & Tuuli
Mattelmäki (2003) Empathic Design. IT
Press, Finland.
Kurtenbach, Gordon & William Buxton
(1993) The limits of expert performance
using hierarchic marking menus. In
Proceedings of INTERACT ‘93 and CHI
‘93, ACM, 482-487.
Lamming, Michael G. (1991) Towards a
Human Memory Prosthesis. Technical
Report #EPC-91-116 EPC-91-116. Rank
Xerox EuroPARC.
Lawson, Bryan (1980) How designers think.
London: The Architectural Press.
Lenman, Sören, Lars Bretzner & Björn
Thuresson (2002) Using marking menus
to develop command sets for computer
vision based hand gesture interfaces.
In Proceedings of NordiCHI ‘02, vol. 31,
ACM, 239-242.
Levine, Stephen R. & Susan F. Ehrlich (1995)
The Freestyle system: a design perspec-
tive. In Human-Computer interaction:
Toward the Year 2000, R. M. Baecker, J.
Grudin, W. A. Buxton, and S. Greenberg,
Eds. Morgan Kaufmann Publishers,
871-880.
Lucero, Andrés, Tatiana Lashina & Elmo M.
A. Diederiks (2004) From Imagination
to Experience: The Role of Feasibility
Studies in Gathering Requirements for
Ambient Intelligent Products. In Pro-
ceedings of EUSAI 2004, Springer, 92-99.
Lucero, Andrés & Jean-Bernard Martens
(2006) Supporting the creation of mood
boards: industrial design in mixed
reality. In Proceedings of TableTop 2006,
IEEE, 127-128.
Lucero, Andrés, Rodrigo Zuloaga, Selene
Mota & Felipe Muñoz (2006) Persuasive
Technologies in Education: Improv-
ing Motivation to Read and Write for
Children. In Proceedings of Persuasive ‘06,
Springer, 142-153.
Lucero, Andrés & Tuuli Mattelmäki (2007)
Professional Probes: A Pleasurable Little
Extra for the Participant’s Work. In
Proceedings of IASTED HCI 2007, ACTA,
170-176.
Lucero, Andrés, Tatiana Lashina, Elmo Die-
deriks & Tuuli Mattelmäki (2007a) How
probes inform and influence the design
process. In Proceedings of DPPI ‘07, ACM,
377-391.
Lucero, Andrés, Dzmitry Aliakseyeu & Jean-
Bernard Martens (2007b) Augmenting
Mood Boards: Flexible and Intuitive
Interaction in the Context of the Design
Studio. In Proceedings of TableTop 2007,
IEEE, 147-154.
Lucero, Andrés & Kirsikka Vaajakallio (2008)
Co-Designing Mood Boards: Creating
Dialogue with People. In Proceedings of
IASTED HCI 2008, ACTA, 254-260.
Lucero, Andrés, Dzmitry Aliakseyeu & Jean-
Bernard Martens (2008) Funky Wall:
presenting mood boards using gesture,
speech and visuals. In Proceedings of AVI
‘08, ACM, 425-428.
Martens, Jean-Bernard, Andrés Lucero,
Bart Naaijkens, Bastiaan Ekeler, Guus
Rammeloo, Marcel van Heist, Matthijs
Kwak & Max Sakovich (2006) Blue Eye
- Making Mood Boards in Augmented
Reality. In Adjunct Proceedings of HCI
2006 ENGAGE.
Matsushita, Mitsunori, Makoto Iida, Takeshi
Ohguro, Yoshinari Shirai, Yasuaki
Kakehi & Takeshi Naemura (2004)
Lumisight table: a face-to-face collabora-
tion support system that optimizes
direction of projected information to
each stakeholder. In Proceedings of CSCW
‘04, ACM, 274-283.
Mattelmäki, Tuuli & Katja Battarbee (2002)
Empathy Probes. In Proceedings of PDC

Refe
ren
ces
2112002, CPSR, 266-271.
Mattelmäki, Tuuli (2005) Applying Probes
– from inspirational notes to collabora-
tive insights. CoDesign 1(2), Taylor &
Francis, 83-102.
Mattelmäki, Tuuli (2006) Design probes. Doc-
toral Dissertation. University of Art and
Design Helsinki, Finland.
McCloud, Scott (1994) Understading Comics:
the Invisible Art. New York: Kitchen Sink.
McDonagh, Deana & Ian Storer (2005a)
Mood boards as a design catalyst and re-
source: researching an under-researched
area. Design Journal 7(3): 16-31.
McDonagh, Deana & Howard Denton (2005b)
Exploring the degree to which individual
students share a common perception
of specific mood boards: observations
relating to teaching, learning and
team-based design. Design Studies 26(1),
Elsevier, 35-53.
McNeil, David (2005) Gesture and thought.
Chicago: University of Chicago Press.
Milgram, Paul & Fumio Kishino (1994) Tax-
onomy of Mixed Reality Visual Displays.
IECE special issue on networked reality
E77-D(12), 1321-1329.
Mukhopadhyay, Sugata & Brian Smith (1999)
Passive capture and structuring of
lectures. In Proceedings of MULTIMEDIA
‘99, ACM, 477-487.
Muller, Wim (2001) Order and meaning in
design. Lemma Publisher, Utrecht.
Mynatt, Elizabeth D., Takeo Igarashi, W.
Keith Edwards & Anthony LaMarca
(1999) Flatland: New Dimensions in
Office Whiteboards. In Proceedings of
CHI’99, ACM, 346-353.
Nieminen, Mika P. & Petri Mannonen (2005)
Capturing the Mobile and Distributed
Work for Concept Development using
Photograph Probes. In Proceedings of
IASTED HCI 2005, ACTA, 191-196.
Norman, Donald (2004) Emotional Design.
Why we love (or hate) everyday things.
Basic Books.
Øritsland, Trond Are & Jacob Buur (2003)
Interaction Styles: An Aesthetic Sense
of Direction in Interface Design. Inter-
national Journal of Human-Computer
Interaction 15(1), 67-85.
Pasman, Gert (2003) Designing with prec-
edents. Doctoral Dissertation, Delft Uni-
versity of Technology, the Netherlands.
Patten, James, Hiroshi Ishii, Jim Hines &
Gian Pangaro (2001) Sensetable: a wire-
less object tracking platform for tangible
user interfaces. In Proceedings of CHI ‘01,
ACM, 253-260.
Paulos, Erik & Tom Jenkins (2005) Urban
probes: encountering our emerging
urban atmospheres. In Proceedings of
CHI ‘05, ACM, 341-350.
Pedersen, Elin Rønby, Kim McCall, Thomas P.
Moran & Frank G. Halasz (1993) Tivoli:
an electronic whiteboard for informal
workgroup meetings. In Proceedings of
CHI’93, ACM, 391-398.
Piekarski, Wayne and Bruce H. Thomas
(2003) Tinmith-Mobile Outdoor Aug-
mented Reality Modelling Demonstra-
tion. In Proceedings of ISMAR ‘03, IEEE/
ACM, 317.
Prante, Thorsten, Carsten Röcker, Norbert
Streitz, Richard Stenzel, Carsten Mag-
erkurth, Daniel van Alphen & Daniela
Plewe (2003) Hello.Wall - Beyond Ambi-
ent Displays. In Adjunct Proceedings of
UBICOMP 2003, 277-278.
Quek, Francis, David McNeill, Robert Bryll,
Susan Duncan, Xin-Feng Ma, Cemil
Kirbas, Karl E. McCullough & Rashid
Ansari (2002) Multimodal human dis-
course: gesture and speech. TOCHI 9(3),
ACM, 171-193.
Ryokai, Kimiko, Stefan Marti & Hiroshi Ishii

Co
-Desi
gn
ing
In
ter
ac
tiv
e S
pac
es.
.. 21
2 (2005) Designing the world as your
palette. In Proceedings of CHI ‘05, ACM,
1037-1049.
Sanders, Elizabeth & Colin William (2001)
Harnessing People’s Creativity: Ideation
and Expression through Visual Com-
munication. In Focus Groups: Supporting
Effective Product Development. Edited by
Langford and McDonagh-Philp, Taylor
and Francis.
Sanders, Elizabeth (2006a) Scaffolds for
Building Everyday Creativity. In Design
for Effective Communications: Creating
Contexts for Clarity and Meaning. Edited
by Jorge Frascara, Allworth Press.
Sanders, Elizabeth (2006b) Design Serving
People. In Cumulus Working Papers,
UIAH, 2006, 28-33.
Sanders, Elizabeth & Pieter Jan Stappers
(2008) Co-creation and the new land-
scapes of design. CoDesign 4(1), 5-18.
Schön, Donald A. (1983) The Reflective Practi-
tioner: How Professionals Think in Action.
Temple Smith, London.
Shen, Chia, Neal B. Lesh, Frederic Vernier,
Clifton Forlines & Jeana Frost (2002)
Sharing and Building Digital Group
Histories. In Proceedings of CSCW’02,
ACM, 324-333.
Sleeswijk Visser, Froukje, Pieter Jan Stappers,
Remko van der Lugt & Elizabeth Sand-
ers (2005) Contextmapping: experiences
from practice. CoDesign 1(2), Taylor and
Francis.
Spinuzzi, Clay (2005) The methodology of
participatory design. Technical Communi-
cation 52(2), 163-174.
Stappers, Pieter Jan (2007) Doing design
as a part of doing research. In: Design
Research Now. Edited by Michel, R.,
Birkhäuser, Basel, Switzerland, 81-91.
Stifelman, Lisa (1997) The Audio Notebook:
Paper and Pen Interaction with Structured
Speech. PhD dissertation, MIT Media
Laboratory.
Subramanian, Sriram, Dzmitry Aliakseyeu &
Andrés Lucero (2006) Multi-layer inter-
action for digital tables. In Proceedings of
UIST ‘06, ACM, 269-272.
Surface (2007): http://www.microsoft.com/
surface/ accessed May 31, 2007.
Tang, Anthony, Michael Boyle & Saul
Greenberg (2004) Display and presence
disparity in Mixed Presence Groupware.
In Proceedings of the Fifth Conference on
Australasian User interface - Volume 28,
ACM, 73-82.
Tang, Hsien-Hui (2001) Exploring the Roles of
Sketches and Knowledge in the Design Pro-
cess. Doctoral Dissertation, University of
Sydney, Australia.
Tang, John C. & Scott Minneman (1991)
VideoWhiteboard: video shadows to
support remote collaboration. In Pro-
ceedings of CHI ‘91, ACM, 315-322.
Thang, Bingh, Wouter Sluis-Thiescheffer,
Tilde Bekker, Berry Eggen, J.H., Huib De
Ridder, and Arnold Vermeeren (2008)
Comparing the Creativity of Children’s
Design Solutions based on Expert
Assessment. In Proceedings of IDC ‘08,
ACM, 266-273.
Vaajakallio, Kirsikka & Tuuli Mattelmäki
(2007) Collaborative design exploration:
envisioning future practices with make
tools. In Proceedings of DPPI ‘07, ACM,
223-238.
Valtonen, Anna (2007) Redefining Industrial
Design: Changes in the Design Practice in
Finland. University of Art and Design
Helsinki, Finland.
Vogel, Daniel & Ravin Balakrishnan (2004)
Interactive public ambient displays:
transitioning from implicit to explicit,
public to personal, interaction with mul-
tiple users. In Proceedings of UIST 2004,

Refe
ren
ces
213ACM, 137-146.
Wagner, Daniel, Thomas Pintaric, Florian
Ledermann & Dieter Schmalstieg (2005)
Towards Massively Multi-user Aug-
mented Reality on Handheld Devices. In
Proceedings of Pervasive 2005, Springer,
208-219.
Wang, Michelle Q. & Julia Hirschberg (1992)
Automatic Classification of Intonational
Phrase Boundaries. Computer, Speech,
and Language 6, 175–196.
Wellner, Pierre (1993) Interacting with paper
on the DigitalDesk. In Communications
36(7), ACM, 87-96.
Wexelblat, Alan (1995) An approach to natu-
ral gesture in virtual environments. In
TOCHI 2(3), ACM, 179-200.
XProgramming (2008) Available at: www.
xprogramming.com/xpmag/whatisxp.
htm, accessed July 29, 2008.
Co
-Desi
gn
ing
In
ter
ac
tiv
e S
pac
es.
.. 21
4
summary

Sum
ma
ry
215Summary
People have different ways of communicating with each other and building an
understanding in the context of professional work (e.g. face-to-face meetings,
phone calls, email, videoconference, etc.). Designers use mood boards as means to
communicate and reach agreements with their clients (or within a design team)
in the beginning of the design process. Mood boarding helps explore the available
design space or range of possibilities that emerge from the design brief. It does so
by visualizing rough and undefined ideas using mostly visual materials (i.e. images
from books or magazines). A mood board defines and communicates the direction
for a design project.
Human-computer interaction researchers have already identified the potential
behind interactive vertical and horizontal surfaces as a more natural and familiar
setting to design (collaborative) interactions. Traditionally, research in this area
has been mostly driven by technology. As a result, one fundamental facet has been
missing: the user. For sure, following a technology push approach is one good way
of doing research and fostering innovation. However, it is not the only one. In this
thesis a user-centered design approach is followed, leading to user-driven innova-
tion. Basically, it implies conducting a series of user studies (i.e. cultural probes,
workshops, contextual inquiries, interviews, video observations) to first explore
the work (i.e. design practice) of professional users, then identify a relevant task for
these professional users (i.e. industrial designers), and finally try to understand the
essence of this task before making any attempt of providing support for it with new
technologies. Finally, the results of these studies are fed into co-design sessions in
which end-users actively create sensible solutions and tools that support their work
and in their real context.
This thesis explores why and how designers use mood boards in the early stages
of the design process, and how augmented reality can support mood boarding by
following a user-centered design approach.
In this thesis a research through design approach is followed, in which the design
process is used as a form of research to contribute to a design activity. Working pro-
totypes are created from a clear research question and thus can express a hypothesis.
The prototypes are put to test in real-life contexts so users can experience them.
Knowledge is generated by designing the artifact, by the artifact itself, and by the
evaluations of use. The knowledge gained can later be generalized as design recom-
mendations, theories or frameworks. In this research through design process the
knowledge gained in field observations (chapters 2 and 3) is integrated with the co-
designed concepts or funky-design-spaces (chapter 4) into experiential tools (chapter
5). The Funky Coffee Table and Funky Wall prototypes are created and later tested to
express the funky-design-spaces hypothesis and to try to provide answers to the re-

Co
-Desi
gn
ing
In
ter
ac
tiv
e S
pac
es.
.. 21
6 search questions on how and why designers create mood boards and how augmented
reality tools can provide support for this activity.
In chapter 2, design practice is studied by means of three studies to provide
designers with a sensible augmented reality support tool for their work. The chapter
starts with the probes study where design activities are examined from a general
perspective. From the probes study a set of important ideas and possible research di-
rections are deduced. The findings are connected to supporting creativity and finding
inspiration in the early stages of the design process. Mood boarding is identified as
a relevant task for designers and potentially becomes the central activity to support
with augmented reality. The chapter continues with the second study, workshops,
where probes results are discussed with designers who are also confronted with an
augmented reality tool. In the workshops designers see the potential of supporting
mood boarding with augmented reality and encourage us to do so. Finally, a student
project is presented where the actual making of mood boards is observed using dif-
ferent techniques such as traditional, digital and augmented reality mood boards.
The concept of intuitive interaction begins to shape up.
Chapter 3 explores mood boarding in depth. An understanding of the essence
of mood boards is created by means of two studies. The results of both contextual
inquiries with Dutch industrial designers and of mood-board interviews with Finn-
ish textile and fashion designers are introduced. Based on these two studies, the
following definition of mood boards is proposed:
Mood boards are an idea development tool used by designers and their clients to ×communicate, think, and share their different views that emerge from the design
brief while defining future products, services or trends. Although different types of
media can be used, they mostly consist of images used in different levels of abstrac-
tion to tell a story about the company, product, or audience, and setting a direction
for design. There is no right or unique interpretation of a mood board.
Based on the results of the two studies with Dutch and Finnish designers, a
detailed description of the mood-board making process and a summary of the five
main stages of the mood-board making process are also presented. These studies also
led to six considerations for a mood-board making tool for designers:
Support idea development. Supporting the complete process of making mood ×boards, the before and after the actual act of building the mood board.
Encourage two-way communication. Encourage communication between the client ×and the mood-board maker needed for successful mood-board design.
Involving the senses. Mood-board creation on computers is currently heavily re- ×stricted to the visual nature of the activity. Other senses should be involved.
Holistic interactive space. Several interconnected tools that support the rich diver- ×sity of the activities along the mood-board making process.
Merging with the real context. Carefully addressing the specific context of the ×
Sum
ma
ry
217activity (e.g. relaxed versus formal activities).
Flexible and intuitive interaction. Allowing designers to perform tasks as naturally ×as they do now by interacting through hand movements as well as other modalities.
Chapter 3 ends by formulating the funky-design-spaces research hypothesis.
In chapter 4, the data from the previous two chapters is fed into co-design
sessions with Dutch and Finnish designers. The general idea behind the funky-design-
spaces hypothesis is tested in the dialogue-labs where researchers and people (i.e.
designers) collaboratively come up with new concrete ideas that support mood-board
making with augmented reality. The idea for the Funky Wall comes directly from the
co-design sessions and is explained in the next chapter. The funky-design-spaces hy-
pothesis is initially proved true by designers and is put to the test with experiential
tools in the next chapter.
Chapter 5 looks at augmented reality tools and technology to further explore
the funky-design-spaces hypothesis. Two tools, the Funky Coffee Table and Funky
Wall are designed, implemented, and evaluated. The knowledge and experience from
the previous three chapters are integrated into these two working tools. The results
of the evaluation prove the funky-design-spaces hypothesis true. The chapter ends
by proposing intuitive interaction as a perspective on providing augmented reality
support for professional users in their work. The four main aspects behind intuitive
interaction are:
Builds on people’s current skills and knowledge on the supported task ×Uses hands as main input mechanism for tasks involving creation ×Tools must merge with the real context ×Use of the orthogonal distance from the interactive surface as cue for interaction ×
Finally, chapter 6 rounds off this thesis by reflecting to what extent the activi-
ties described in this thesis contribute to our understanding of the research ques-
tions, identifying aspects that could also be valuable to other researchers working in
similar and different context than mine.

Co
-Desi
gn
ing
In
ter
ac
tiv
e S
pac
es.
.. 21
8
publications

Pu
bli
cat
ion
s21
9Publications
Publications (first author)
Lucero, Andrés, Dzmitry Aliakseyeu & Jean-Bernard Martens (2008) Funky Wall: ×Presenting Mood Boards Using Gesture, Speech and Visuals. In Proceedings of AVI
‘08, ACM, 425-428.
Lucero, Andrés & Kirsikka Vaajakallio (2008) Co-Designing Mood Boards: Creat- ×ing Dialogue with People. In Proceedings of IASTED HCI 2008, ACTA, 254-260.
Lucero, Andrés, Dzmitry Aliakseyeu & Jean-Bernard Martens (2007) Augment- ×ing Mood Boards: Flexible and Intuitive Interaction in the Context of the Design
Studio. In Proceedings of TableTop 2007, IEEE, 147-154.
Lucero, Andrés, Tatiana Lashina, Elmo Diederiks & Tuuli Mattelmäki (2007) How ×Probes Inform and Influence the Design Process. In Proceedings of DPPI ‘07, ACM,
377-391.
Lucero, Andrés & Tuuli Mattelmäki (2007) Professional Probes: A Pleasurable ×Little Extra for the Participant’s Work. In Proceedings of IASTED HCI 2007,
ACTA, 170-176.
Lucero, Andrés, Rodrigo Zuloaga, Selene Mota & Felipe Muñoz (2006) Persuasive ×Technologies in Education: Improving Motivation to Read and Write for Children.
In Proceedings of Persuasive ‘06, Springer, 142-153.
Lucero, Andrés & Jean-Bernard Martens (2006) Supporting the Creation of Mood ×Boards: Industrial Design in Mixed Reality. In Proceedings of TableTop 2006,
IEEE, 127-128.
Lucero, Andrés, Tatiana Lashina & Elmo Diederiks (2004) From Imagination to ×Experience: The Role of Feasibility Studies in Gathering Requirements for Ambient
Intelligent Products. In Proceedings of EUSAI 2004, Springer, 92-99.
Publications (co-author)
Aliakseyeu, Dzmitry, Pourang Irani, Andrés Lucero & Sriram Subramanian (2008) ×Multi-Flick: An Evaluation of Flick-Based Scrolling Techniques for Pen Interfaces.
In Proceedings of CHI ‘08, ACM, 1689-1698.
Aliakseyeu, Dzmitry, Andrés Lucero & Jean-Bernard Martens (2008) Users’ quest ×for an optimized representation of a multi-device space. In Proceedings of AVI ‘08,
ACM, 359-362.
Aliakseyeu, Dzmitry, Andrés Lucero & Sriram Subramanian (2007) Interacting ×with piles of artifacts on digital tables. Digital Creativity 18(3), Routledge, 161-
174.
Muñoz Bravo, Julio, Andrés Lucero & Dzmitry Aliakseyeu (2007) Probing the Need ×for Mobile Technologies for Designers. In Proceedings of IASTED HCI 2007, ACTA,
244-249.

Co
-Desi
gn
ing
In
ter
ac
tiv
e S
pac
es.
.. 22
0 Sriram Subramanian, Dzmitry Aliakseyeu & Andrés Lucero (2006) Multi-layer ×interaction for digital tables. In Proceedings of UIST ‘06, ACM, 269-272.
Aliakseyeu, Dzmitry, Sriram Subramanian, Andrés Lucero & Carl Gutwin (2006) ×Interacting with piles of artifacts on digital tables. In Proceedings of AVI ‘06, ACM,
159-162.
Martens, Jean-Bernard, Andrés Lucero, Bart Naaijkens, Bastiaan Ekeler, Guus ×Rammeloo, Marcel van Heist, Matthijs Kwak & Max Sakovich (2006) Blue Eye -
Making Mood Boards in Augmented Reality. In Adjunct Proceedings of HCI 2006
ENGAGE.

Pu
bli
cat
ion
s22
1

Co
-Desi
gn
ing
In
ter
ac
tiv
e S
pac
es.
.. 22
2
curriculum vitae

Cu
rr
icu
lum
Vit
ae
223Curriculum Vitae
Andrés Antonio Lucero Vera was born on September 14, 1974 in Santiago, Chile.
After graduating in 1999 in Visual Communication Design from Universidad Tec-
nológica Metropolitana (UTEM) in Santiago, Chile, he starts working in industry as
a graphic and web designer, both for companies and as a freelance designer. He also
starts a parallel career in education teaching at his alma mater.
In 2002, he joins the User-System Interaction (USI) program at the Eindhoven
University of Technology (TU/e) in the Netherlands where he starts working in
interaction design. As part of the USI program he works for one year as a Research
Assistant in Philips Research Eindhoven on a project involving the design and evalu-
ation of an interaction solution for an Ambient Lighting System for the Bathroom in
HomeLab.
In 2004, he starts his PhD at the Department of Industrial Design at the TU/e,
on supporting the work of Industrial Designers with Mixed Reality. His work results
in the construction of the Funky Coffee Table and Funky Wall prototypes. During his
PhD he teaches industrial design students.
In 2006, he spends 6 months as a Visiting Researcher at the University of Art
and Design Helsinki (TAIK) conducting studies with designers as part of his PhD.
In 2008, he starts working for Nokia Research. He lives in Tampere, Finland
together with his wife Soledad, their daughter Rayen (2005), and their son Antü
(2008).

Co
-Desi
gn
ing
In
ter
ac
tiv
e S
pac
es.
.. 22
4

andres lucero vera
Andrés Antonio Lucero Vera (1974) works as a researcher for Nokia in Finland. For the past ten years he has held various design-related research or teaching posts at Universities in Finland, the Netherlands and Chile. He has also worked in design industry as a graphic designer in Chile and as an interaction designer at Philips Research in the Netherlands. In his research, he has worked in several multi-cultural interdisciplinary projects that apply user-centered design as an approach to let users guide the innovation process. He has also developed tools and methods to actively involve end-users in co-designing interactions, products and services.
