co for eor on the norwegian shelf -...
TRANSCRIPT

“Environment and value creation”
CO2 for EOR on the Norwegian shelf
– A case study
Bellona report
August 2005
Viktor E. Jakobsen
Frederic Hauge, Marius Holm & Beate Kristiansen

August 2005 CO2 for EOR – environment and value creation
2
Note to the English version readers This report was originally written in Norwegian and intended for recipients on the Norwegian political and industrial scenes. The translated document contains translated idioms, implicit assumptions and points of view that may not be familiar for the readers without adequate insight into the Norwegian political, environmental and industrial debates. In addition, the report as it stands today is a draft document that has been published as a discussion document” to the Norwegian political and industrial stakeholders in the CO2 capture and storage issue. The purpose of this consultation process is to initiate debate and challenge Bellona’s proposals before finalising the report, thereby achieving a process that ensures that the proposed solutions represents a common ground and understanding among the stakeholders of the Norwegian CO2 capture and storage opportunities. This report has been translated thanks to the financial assistance of Shell International Ltd.
Subsequent events Since the original report was published on 30 August 2005, the following events have occurred: In the general elections held on 12 September 2005, the coalition made up of the Norwegian Labour Party, the Socialist Left Party of Norway and the Norwegian Centre Party achieved majority in the Norwegian Parliament. In the month preceding the election, the three parties negotiated a common platform for the government, the Soria-Moria Accord. Although the issues of CO2 and gas power were particularly debated, the three parties managed to find a solution, mainly thanks to work undertaken by Bellona, i.e. this report. The main statements in the common political platform concerning the issues discussed in this report are:
“Through economic measures and focus on new technology we will ensure that any new
concession for gas power plants must be based on CO2 capture. The Norwegian Continental Shelf
may become a deposit for large amounts of CO2, and CO2 may be used to produce more oil and
gas from the shelf. The government wishes that:
• Through a state enterprise and alongside private participants, the government take part in
financing infrastructure for natural gas transport, and through this achieve CO2 capture
and transportation; and
• A state enterprise be given the responsibility of creating and contributing financially to a
value chain for transport and injection of CO2.”
The new majority coalition government came to power on 13 October 2005. Good reading

August 2005 CO2 for EOR – environment and value creation
3
Bellona offices Bellona Oslo
E-mail: [email protected] Tel: +47 2323 4600 Fax: +47 2238 3862 Postal address: P.O. Box 2141 Grünerløkka 0505 Oslo, Norway Visiting address: Nordregate 2 Bellona Europe
E-mail: [email protected] Tel: +32-2-6483122 Fax: +32-2-6468122 Mobile: +32-473978760 Postal address: 10 B, Clos du Parnasse, 1050 Brussels, Belgium Visiting address: (see above)
Bellona Murmansk
E-mail: [email protected] Tel/Fax: +7-8152-440632 Postal address: 183038 Murmansk, P. O. Box 4310, Russia Bellona St. Petersburg
E-mail: [email protected] Tel/Fax: +7-812-3272943 Postal address: P.O. Box 58, 191 028 St. Petersburg, Russia Bellona USA
E-mail: [email protected] Tel: +1 302 263 9251 Postal address: P.O. Box 42090, Washington D.C. 20015, USA

August 2005 CO2 for EOR – environment and value creation
4
Foreword Bellona considers anthropogenic climate change as one of the great challenges facing the global community. Consequently, one of Bellona’s essential activities has for a long time been to work with measures and technologies that help reduce greenhouse gas emissions. Bellona’s perspective on CO2 capture and storage has therefore primarily focused on the reduction of greenhouse gas emissions. Many may be surprised that Bellona strongly argues in favour of Enhanced Oil Recovery (EOR) on the Norwegian Continental Shelf (NCS). However, Bellona’s recommendation to initiate EOR using CO2 is based on a sensible environmental assessment. This will result in storing large amounts of CO2 that otherwise would have been emitted into the atmosphere. Profitability is primarily ensured by the enhanced oil production and in turn secures financing of the CO2 capture facilities and infrastructure that will continue to capture and store CO2 for many years after the production of oil ceases. Bellona believes that Norway, a rich oil nation with huge revenues from the sale of fossil energy in the form of oil, gas and coal, has a moral obligation to be an international driving force in the development of technology that may reduce the effects of climate change. When combusted, Norwegian exports of fossil energy account for more than 2.3% of global greenhouse gas emissions. This is equivalent to more than 700 million tonnes of CO2 annually, which Norway enjoys the revenues and affluence of. This gives Norway a great moral responsibility. In Bellona’s opinion, capturing CO2 from power production and other industrial activities, injecting it into oil and gas reservoirs for enhanced oil and gas recovery, and using it in deep lying coal beds for methane extraction for electricity and hydrogen production, represents one of the most significant sources of clean energy, albeit not renewable energy. Bellona has been, and still is, contributing to setting the political and environmental agenda both in Norway and in the EU. Bellona is pleased that its proposals regarding CO2 capture and storage are met with increasing interest from the political and industrial stakeholders who also recognise the need for technological and conceptual solutions to reduce the effects of climate change. Bellona’s work entitled “Roadmap to the Hydrogen Society”, presented to members of the European Parliament (EP) and to the European Commission (EC) at an EP hearing1 held on 18 March 2003, demonstrated that de-carbonising fossil energy sources are absolutely necessary to reach the goals set by the EU. In a world where 90% of energy consumption is dependant on fossil fuel sources, and where nuclear power not is a desirable option, it will take time before all the needed future supply of renewable energy sources can be produced. Bellona works closely with industry and public authorities through several co-operation and partnership programmes. These are the Bellona industry collaboration programme (B7), the Bellona ‘CO2-alliance-programme, industry and government Round Table ‘Miljøsok’, the Norwegian Oil Industry Association’s environmental round-table2, Carbon Capture Stakeholder group, the Carbon Sequestration Leadership Forum (CSLF) and the Norwegian Gas Technology group. These activities have allowed Bellona to gain thorough insight into the various issues, challenges and opportunities of CCS. The dialogue and collaboration has also been a source of quality assurance of Bellona’s work. The EC’s appointment of Bellona’s leader, Mr. Frederic Hauge, to the Advisory Council for the Technology Platform for Zero Emission Fossil Fuel Power Plants is a breakthrough for our work in the EU. For many years, Bellona has arranged hearings, seminars and lectures directed towards all EU
1 http://www.bellona.no/no/energi/hydrogen/29080.html 2 A continuation of the Miljøsok round-table, starting in October 2001. http://www.olf.no/miljo/miljoforum/

August 2005 CO2 for EOR – environment and value creation
5
stakeholders. The appointment represents a demanding task. The challenge facing Bellona as a small organisation in this work is to continue creating conceptual proposals for solutions. Our holistic view coupled with our extensive network can prove to be an asset for proposing the appropriate technological, economic, political and legal solutions. Bellona’s work on these issues is dependent on financial resources. We are very grateful to our partners in the B7 programme and the CO2 alliance that has made it possible for us to work on these issues. It is inspiring to participate in creating solutions to our climate challenges. Our hope is that this report contributes to an improved understanding of the possibilities and inspires others to contribute to giving CO2 a decent burial.
Frederic Hauge
Bellona Founder

August 2005 CO2 for EOR – environment and value creation
6
Contents
FOREWORD ................................................................................................................ 4
CONTENTS.................................................................................................................. 6
EXECUTIVE SUMMARY, CONCLUSIONS AND RECOMMENDATIONS............... 10
CHAPTER 1: INTRODUCTION ................................................................................. 15
CHAPTER 2: CO2 HISTORY ..................................................................................... 17 Searching for solutions ............................................................................................................................................. 17
CHAPTER 3: THE STARTING POINT FOR A CO2 FOR EOR REPORT ................ 20 Prognosis for Norway’s greenhouse gas emissions................................................................................................. 20 Bellona does not accept the conclusions in the NPD’s report................................................................................. 27
CHAPTER 4: THE PETROLEUM RESOURCES ON THE NCS............................... 35 Resources, reserves and production on the Norwegian shelf .................................................................................. 35 Recovery rate and maturity on the NCS .................................................................................................................. 37
CHAPTER 5: CO2 FOR EOR – A TECHNICAL INTRODUCTION ........................... 42 Tertiary oil production.............................................................................................................................................. 42 CO2 and miscibility .................................................................................................................................................. 44 Contamination of CO2 in produced oil and gas ....................................................................................................... 45 Resource assessment by the use of CO2 on the NCS............................................................................................... 46 Oil reservoir and percentage enhanced recovery rate by the use of CO2 ................................................................ 47 CO2 operated oil production and the CO2/oil volume-relationship......................................................................... 49 An example of a volume calculation of injected CO2 and oil produced ................................................................. 54 Closing remarks regarding the use of CO2 on the NCS........................................................................................... 56
CHAPTER 6: THE POTENTIAL FOR ENHANCED RECOVERY OF OIL AND GAS ON THE NORWEGIAN SHELF ................................................................................. 58 CO2 for EOR............................................................................................................................................................. 58 CO2 for Enhanced Gas Recovery (EGR) ................................................................................................................. 63 Gas-CO2 substitution ................................................................................................................................................ 63
CHAPTER 7: FRAMEWORK FOR CO2 CAPTURE AND STORAGE...................... 65 Why does CO2 capture and storage not happen by itself?....................................................................................... 65 Economic measures .................................................................................................................................................. 67 Legal measures ......................................................................................................................................................... 70

August 2005 CO2 for EOR – environment and value creation
7
CHAPTER 8: ESTABLISHMENT OF A CO2 VALUE CHAIN IN NORWAY............ 72 Operational model for a CO2 value chain in Norway.............................................................................................. 72 The climate obligations as part of the basis for the establishment of a CO2 value chain in Norway..................... 73 Unit cost in connection with capture of CO2 from industrial activity and energy production ............................... 74 Establishment of a CO2 capture and distribution chain in Norway......................................................................... 76
CHAPTER 9: FINANCIAL ASSESSMENT OF A CO2 VALUE CHAIN IN NORWAY.................................................................................................................................... 84 Assumptions for the financial assessments.............................................................................................................. 88 The significance of establishing a CO2 value chain for Norwegian power production and the possibility of electrification on the NCS ........................................................................................................................................ 94 Norwegian climate goals and their achievement ..................................................................................................... 96
CHAPTER 10: RECOMMENDATIONS FOR FURTHER WORK.............................. 98
APPENDICES .......................................................................................................... 100 Appendix 1: Literature and references................................................................................................................... 100 Appendix 2: Abbreviations and definitions ........................................................................................................... 103 Appendix 3: Summary of Bellona’s conclusions and recommendations regarding the weaknesses with NPD’s CO2 for EOR report ................................................................................................................................................ 104 Appendix 4: Bellona’s Methagen vision – a large source for CO2 ....................................................................... 106 Appendix 5: The relationship between suggested measures and the EEA rules for environmental support ....... 108

August 2005 CO2 for EOR – environment and value creation
8
Graphs Graph 1: Annual CO2 emission in tonnes from some energy and industry companies subject to
the Greenhouse Gas Emission Trading Act. .................................................................... 20 Graph 2: Norwegian emissions assessment for greenhouse gases – 2004 - 2020.................... 21 Graph 3: Annual CO2 greenhouse gases emissions in Norway 1987 – 2020 (million tonnes
CO2 equivalents) .............................................................................................................. 21 Graph 4: Annual CO2 permit costs for Norway based on an international permit price of EUR
20 per tonne CO2 .............................................................................................................. 22 Chart 5: CCP assessment of gross capture costs for a gas power plant in Norway based on
various technical platforms .............................................................................................. 31 Chart 6: Total petroleum production on the NCS .................................................................... 35 Chart 7: Total annual use of natural gas for pressure maintenance on the NCS...................... 35 Chart 8: Total petroleum resources on the NCS ...................................................................... 36 Chart 9: Oil and condensate production on the NCS 1970 – 2024 .......................................... 36 Chart 10: Oil fields on the NCS – resource assessment for production, remaining reserves and
resources after shut-down................................................................................................. 37 Chart 11: Recovery rate for Norwegian oil production 2004................................................... 37 Chart 12: Gas injection by field 1971 - 2004 ........................................................................... 38 Chart 13: SDFI portfolio according to maturity 2001.............................................................. 38 Chart 14: SDFI portfolio according to maturity 2005.............................................................. 39 Chart 15: SDFI portfolio according to maturity 2010.............................................................. 39 Chart 16: Unit cost of production in NOK per barrel oil equivalent on the NCS 1998 – 2020
per field ............................................................................................................................ 40 Chart 17: Investments on the Norwegian shelf (NOK billion) ................................................ 40 Chart 18: Annual investments in Norwegian petroleum industry 1985 – 2009 in NOKbn ..... 41 Chart 19: The State’s cash flow from the petroleum activity .................................................. 41 Chart 20: Production profile for an oil field through phase 1 - 3............................................. 42 Chart 21: Oil production, water- and CO2-injection for a Texas based oil field brought
through phase 1 through 3 by Shell International ............................................................ 43 Chart 22: oil and condensate production on NCS 1970 – 2024 including 5% EOR by use of
CO2 ................................................................................................................................... 44 Chart 23: Gas discoveries on the NCS and the Viktoria field in the Norwegian ocean........... 46 Chart 24: Shell International E&P – experience with recovery rate for oil production in
secondary and tertiary phase in Texas.............................................................................. 47 Chart 25: Gross sales value of oil produced (from the 20 fields that are included in the NPD
CO2 study) on the NCS by the use of CO2 dependant on oil price (USD per barrel) and percentage recovery rate................................................................................................... 49
Chart 26: Production profile for the Weyburn field 1955 - 2025............................................. 50 Chart 27: Statoil Gullfaks CO2 study – field profile and CO2-oil relation............................... 50 Chart 28: Injection profile for CO2 on the Weyburn field (including purchased and recycled
CO2).................................................................................................................................. 51 Chart 29: Percentage enhanced recovery rate from an oil field based on various WAG-profiles
.......................................................................................................................................... 52 Chart 30: production profiles for CO2-injection and oil production in tertiary production ..... 53 Chart 31: Main operational parameters – oil production and injection profiles for CO2 and
water ................................................................................................................................. 54 Chart 32: main operational parameters – well stream.............................................................. 54 Chart 33: Sales value of oil produced per ton CO2 purchased ................................................. 55 Chart 34: Unit cost of production on the Norwegian shelf per barrel of oil equivalents ......... 55 Chart 35: Geological map of the North Sea and the Norwegian Ocean .................................. 56

August 2005 CO2 for EOR – environment and value creation
9
Chart 36: Illustration of production of CO2 from a coal power plant and the need on an oil field................................................................................................................................... 57
Chart 37: produced, planned produced, remaining resources and planned recovery rate for the oil fields on the Norwegian shelf according to NPD’s regions (Includes NPD excluded fields)................................................................................................................................ 59
Chart 38: Potential enhanced recovery due to EOR with a total recovery rate of 63%. .......... 60 Chart 39: Annual need for fresh CO2 over 25 years to achieve a total recovery rate of 63%.. 61 Chart 40: Gross potential value creation at varying recovery rate and oil price (only fields
included in the NPD report) ............................................................................................. 62 Chart 41: Gross potential value creation at varying recovery rate and oil price (all fields) .... 62 Chart 42: Carbon Capture Project (CCP) assessment of gross capture cost from a gas power
plant in Norway based on various technological platforms. The capture cost in USD/ton may be seen on the Y-axis and the year the technology may be expected to be mature is shown on the X-axis. ........................................................................................................ 74
Chart 43: Bellona study of unit cost for CO2 capture from a gas power plant–gross capture costs per ton CO2.............................................................................................................. 75
Chart 44: large stationary emissions of CO2 in Norway .......................................................... 76 Chart 45: Necessary CO2 infrastructure ................................................................................... 78 Chart 46: NOCO prices per ton CO2 and return on capital based on varying gas price. ......... 80 Chart 47: Changes in Norwegian CO2 emissions as a consequence of establishing NOCO AS
and CPETRO.................................................................................................................... 83 Chart 48: The CO2 value chain ................................................................................................ 84 Chart 49: Distribution of the value creation by establishing a CO2 value chain operating for 40
years. ................................................................................................................................ 85 Chart 50: State net revenues as a function of oil price by the establishment of a CO2 value
chain with EOR ................................................................................................................ 86 Chart 51: State net revenues by the establishment of a CO2 value chain per ton CO2 captured
.......................................................................................................................................... 87 Chart 52: State annual revenues from the establishment of a CO2 value chain with varying oil
price.................................................................................................................................. 87 Chart 53: Annual need for CO2 on oil fields on the Norwegian shelf ..................................... 88 Chart 54: Annual investments on the NCS 1985 - 2009 .......................................................... 89 Chart 55: gas price-oil price co-variation................................................................................. 91 Chart 56: NOCO CO2 connection fee and sales price CO2 ...................................................... 91 Chart 57: CPETRO sliding scale pricing of CO2 delivered ..................................................... 92 Chart 58: P&L for an oil field operated with CO2 for EOR based on the sliding scale pricing
model................................................................................................................................ 93 Chart 59: Industrial cost curve for power production in Europe.............................................. 96 Chart 60: Norwegian CO2 emission as a consequence of the establishment of a CO2 value
chain and electrification of the Norwegian shelf ............................................................. 97 Tables
Table 1: Expected recovery rate by the use of CO2 in 6 different oil regions in the USA..................................... 48 Table 2: Stationary emissions of CO2 in Norway connected to a CO2 value chain................................................ 77 Table 3: Investments for NOCO AS ........................................................................................................................ 89 Table 4: CPETRO investments ................................................................................................................................ 90 Table 5: Offshore investments ................................................................................................................................. 90 Table 6: Operating costs for an oil field in CO2 for EOR operation per barrel and per ton CO2 purchased.......... 92 Table 7: P&L for CPETRO and the government at different stages of CPETRO's operations ............................. 94 Table 8: Possible power production in Norway as a consequence the establishment of a CO2 value chain ......... 95

August 2005 CO2 for EOR – environment and value creation
10
Executive summary, conclusions and recommendations
Bellona recommends that the government establish a value chain for CO2. Two companies
should be established. One for capture and one for the distribution and sale of 17 million tonnes
of CO2 annually to be used for enhanced oil recovery (EOR) purposes. The price mechanism
places the risk on the party with the largest proportion of revenues in the value chain – i.e. the
government – and makes capture of CO2 for EOR purposes a very profitable operation. At
current oil prices, this mechanism, involving total investments of NOK 86 billion (EUR 10,7
billion), will yield a gross value creation through increased oil and gas production of NOK 1,000
billion (EUR 125 billion) over a 40-year period. In addition, this measure will contribute to
allowing Norway to achieve obligations under the Kyoto Protocol; increase value creation from
Norwegian natural gas; reduce operating costs and risks for the Norwegian process industry;
and enable large contracts to the offshore oil service and construction industries.
Norway’s climate challenge – Kyoto will cost the government between EUR 1,25 – 2 billion Unless Norway implements measures to capture CO2 and starts electrifying the Norwegian Continental Shelf (NCS), it will not reach its Kyoto target through national reductions of emissions. This will result in the Norway having to purchase emission permits abroad. Based on a CO2 emission permit price of EUR 20 per tonne, Norway risk paying between NOK 10 – 16bn (EUR 1,25 – 2) in the five year Kyoto period to emit 70 to 100 million tonnes more than its Kyoto obligations. Since the Norwegian government has assumed this cost, it should consider how it may be kept as low as possible. Norwegian petroleum production at a crossroads The combined production of oil and gas on the NCS is expected to reach its peak in 2008 with a production of 286 million standard cubic metres (Sm3) oil equivalents (o.e). In recent years, oil and condensate production has been steady at about 190 million Sm3, and based on proved, probable and possible reserves, production is expected to be reduced by half within the next ten years. Prospects for gas production are brighter, however, as an increasing amount of gas will be used as pressure support for mature fields, unless CO2 injections are established as an alternative.
CO2 for EOR may yield a value creation of EUR 125 billion
Production from an oil field may be divided into three phases. In the primary phase the existing reservoir pressure is used for oil production. Primary production normally yields a 30% recovery of OOIP. During the primary phase production, the reservoir pressure drops and subsequently water and/or gas is injected to maintain the reservoir pressure. This is called secondary phase and the recovery rate may reach 50% of OOIP. In third phase, when only maintaining reservoir pressure no longer generates a profitable oil production, injection of CO2 may contribute to release oil that otherwise would be left in the ground. If third phase production is implemented the recovery rate increases. International experience from third phase production is that the recovery rate may increase by between 8 to 16% of OOIP. If a conservative assessment of 5% enhanced recovery is used, CO2 injection may yield a gross value creation of more than NOK 1,000bn (EUR 125 billion) at current oil price. The establishment of a CO2 value chain in Norway
CO2 capture facilities should be established at all planned gas power plants, which should be capable of both capturing CO2 from the power plants and from adjacent industrial activities. At first, capture facilities are built in Grenland, at Kårstø, Mongstad, Tjeldbergodden and Skogn. These stationary

August 2005 CO2 for EOR – environment and value creation
11
sources of CO2 are thereby linked together through a network of pipelines for transportation of CO2 and directed towards the two main regions for CO2 intermediate storage: 1) the Norwegian Ocean CO2 region with the Draugen field as storage, and 2) the North Sea CO2 region with the Heimdal field as CO2 storage.
Recommended measures
Establishment of NOCO Ltd. (Norwegian CO2 Recycling Ltd.) and Carbon Petro (CPETRO)
NOCO Ltd.
Established as a limited liability company, NOCO Ltd. has as its primary business the requirement to build and operate CO2 capture facilities for energy and industry. Bellona recommends that the government takes the initiative to establish this company and that private investors are invited to co-invest. NOCO would have two streams of revenue:
• Revenues from the receipt of flue gas from energy production and industrial processes through a CO2 capture tariff.
• Revenues from the sale of dried and compressed CO2, delivered to CPETRO’s (see below) CO2 transport and intermediate storage system. Pricing of CO2 may be based on production costs including a profit margin.
The capture tariff that gas power plants and industry must pay, will be in the order of NOK 10-20 (EUR 1,25 – 2.5) per tonne, thus eliminating the risk attached to future developments in CO2 permit prices and future regimes for emission quotas. In addition to operating in Norway, NOCO will also be able to operate CO2 capture internationally and be able to take on entire CO2 capture and storage operations
CPETRO
Bellona recommends that the Norwegian government establish CPETRO as a publicly owned enterprise, owned either entirely or jointly, by the Ministry of Oil and Energy and/or the Ministry of the Environment. CPETRO could also be established as a daughter company to the existing Norwegian government investment fund for petroleum activities, PETORO. CPETRO should mainly be considered as a long-term investment in the Norwegian government’s equity oil and the tax revenues, stemming from the increased petroleum production equivalent with State Direct Financial Interest (SDFI). CPETRO brings CO2 to the NCS with the purpose of increasing oil and gas production, consequently increasing the value of the government’s future tax revenues and equity oil interests. CPETRO’s business idea is mainly based on the following:
• Buying CO2 for physical delivery and use on the NCS (from NOCO and others); • Transporting CO2 in pipelines to the intermediate CO2 storage facilities at Draugen and
Heimdal; and • Selling CO2 to oil and gas producing licenses on the NCS at regulated, market based prices.
When oil and gas production on the shelf has ceased, the role of NOCO and CPETRO will be to facilitate long term storage of CO2 for pure climate change mitigation purposes. The business idea will then be based on the savings the Norwegian government will achieve through the avoidance of purchasing CO2 permits and the revenue created from CO2 generated oil and gas production otherwise left in the ground. At this point, the infrastructure investments made in CPETRO will have been paid back many times over, given a normal price trajectory for oil and gas.

August 2005 CO2 for EOR – environment and value creation
12
Pricing of CO2 sales to the production licenses must follow the oil price
If the oil production license owner must pay for the entire investment to capture and transport CO2 to the production platform the risk becomes too high due to low profitability at low oil prices. For the government, which has revenues from both a 78% total offshore tax and its equity oil, the CO2 generated enhanced oil production will be profitable even at very low oil prices. By letting CPETRO use a sliding scale price for CO2 delivered based on the prevailing oil and gas prices, the government may reduce the financial risk for the oil production licenses since the price of CO2 becomes very low at low oil prices. Based on this model, CPETRO will have direct revenues from CO2 sales to the production licenses. At low oil prices, the CO2 delivered platform price will be low and revenues will not cover operating costs for CPETRO’s CO2 purchases. However, the government, as CPETRO’s owner, will receive additional revenues that more than cover any operating loss in CPETRO. First, the government will receive 78% of the production license operating profit from taxes, in addition to a substantial part of the net profit through its corporate ownership and equity oil. Secondly, through the annual capture and storage of 17 million tonnes of CO2 Norway will avoid having to purchase CO2 permits in the international market. Assuming a CO2 capture rate of 85%, Norway will reduce its CO2 emissions in the Kyoto period by 65 million tonnes. Norwegian CO2 permit costs would thereby be reduced by NOK 9,8bn in the period 2008 to 2012 alone. This reduction in the CO2 permit costs comes as a direct consequence of the establishment of CPETRO and should be included in the government’s economic assessments of the investments and operating costs incurred by CPETRO. Increased value creation from Norwegian natural gas It is a national policy to increase the domestic value creation from gas (ref. Government White Book St.meld. nr.47 (2003 – 2004) “Innovation activities for environmentally friendly gas power technologies”). From both from an economic and an environmental perspective, it is better to export power made with CO2 capture and storage installed than merely exporting gas to a market with limited possibilities for CO2 capture and storage. In addition to the gas power plants already foreseen, Bellona recommends that a 5 GW gas power plant (“Europe Power”) be built on the South/South West Coast of Norway, and that the planned projects at Tjeldbergodden and Mongstad be increased to 2 GW each. The end result would be a total of 93 TWh power production based on gas burned with CO2 capture. This would amount to annual domestic gas consumption equal to 11% of total gas exports. Under such a scenario, even if all offshore installations are provided with power from the mainland, Norway would be able to export 61 TWh in a normal year. This power would be price-competitive in the Northern European power market. Norwegian gas production would also have the potential to increase since the establishment of a value chain for CO2 may release natural gas that today is used in pressure maintenance for sale or power production instead. Creating a competitive advantage for Norwegian CO2 intensive industry
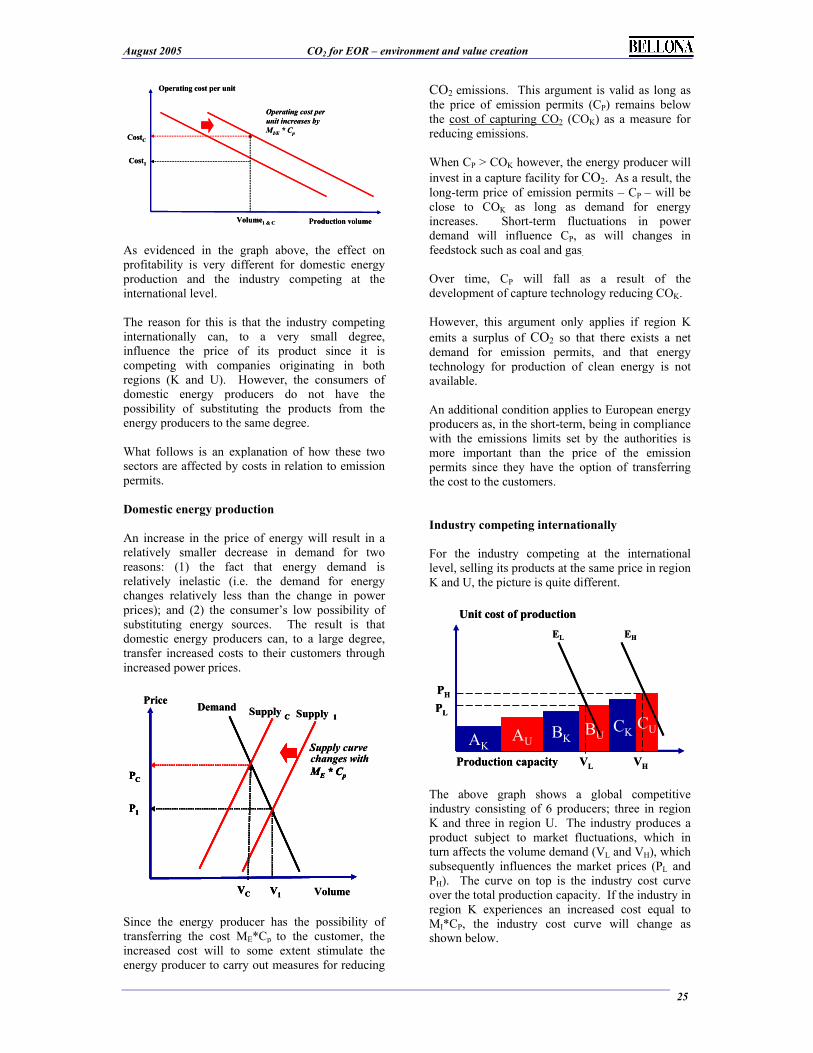
The introduction of the Emissions Trading Scheme (ETS) in the EU and Norway has introduced a cost on CO2 emissions for industry and energy production. The ETS’ impact on profitability for domestic energy production and the internationally competitive industry is quite different. The internationally competitive industry can only to a small extent influence product pricing since prices are determined in the international market by competition with companies located in non-Kyoto regions that do not have CO2 costs to consider. The situation is different for domestic energy producers as they have the opportunity to transfer the CO2 costs to their customers who have almost no opportunity to substitute other energy suppliers or sources. The result is that internationally competing industry has to carry increased operating cost through ETS costs and increased energy costs. The end result is reduced competitiveness with a subsequent shift of such industrial production to non-Kyoto regions. Establishing an infrastructure for CO2 capture and storage will create a competitive advantage for

August 2005 CO2 for EOR – environment and value creation
13
Norwegian industrial clusters due to the elimination of risks attached to future emission permit regulations and prices.
Ripple effects for Norwegian industry The establishment of a CO2 value chain will yield significant ripple effects throughout the Norwegian economy. In addition to maintaining a competitive CO2 intensive industry, investments in gas power plants, capture facilities and infrastructure will generate a large contract flow for, amongst others, the Norwegian oil service industry. It is fair to assume that Norwegian companies will participate in the contest for contracts. According to this scenario, CPETRO will invest NOK 20bn (EUR 2,5 billion) over a two-year period, and the first eight oil fields to use CO2 for EOR will invest NOK 50 – 60bn (EUR 6,25 – 7,5 billion) over a four-year period. NOCO investments are assessed at NOK 13bn (EUR 1,6 billion), in addition to the very large investment in gas power plants. Conclusions Through the establishment of a CO2 value chain for EOR, the Norwegian government will enjoy net revenues and not net costs while fulfilling its Kyoto treaty obligations (see graph to right). The graph below shows the government’s direct revenues from the CO2 value chain. The red line represents the government’s net direct revenues, which are equivalent to the sum of tax income, reduced CO2 permit costs and CPETRO’s operating result. Although CPETRO has a negative operating result, the graph indicates that the government will achieve positive direct net revenues with oil prices at USD 18 per barrel. This is conservative, as in this case the government’s revenues and value accretion from its various ownerships are not included in the cash flow. Based on a long term oil price of USD 30 per barrel, the CO2 value chain will yield the government an annual direct net revenue of NOK 3,5bn (EUR 440 million) for 40 years (real prices and undiscounted cash flow). Based on current oil prices of USD 65 per barrel, the CO2 value chain will yield a gross value creation of more than NOK 1,000bn (EUR 125 billion) over the 40-year period
State net direct revenues as a function of oil price owing to the
establishment of a CO2 for EOR value chain
State total net direct revenues per tonne CO2 captured
38
93
149
204
262
318
375
432
489
545
602
658
715
764
0
100
200
300
400
500
600
700
800
900
18 22 26 30 34 38 42 46 50 54 58 62 66 70
Oil price - USD/bbl
NOK per tonne CO2 captured
Main assumption
NOK 204 per tonne
CO 2 captured
Source: Bellona 2005

August 2005 CO2 for EOR – environment and value creation
14
In summary, it is important to note that the value creation potential may be significantly increased above this level if the availability of CO2 on the NCS is increased from the annual supply of 17 million tonnes as this scenario is based on additional Norwegian or foreign sources.
State annual net direct revenues due to the establishment of a CO2-value chain at different oil price levels
-6 000
-4 000
-2 000
0
2 000
4 000
6 000
8 000
10 000
12 000
14 000
18 22 26 30 34 38 42 46 50 54 58 62 66 70
Statens sparte CO2-kvote kostnader
Statens skatteinntekter fra EOR
CPETRO driftsresultat
Netto resultat for Staten ved CO2-verdikjede
NOKm State annual net direct revenues in 40 years due to the establishment of a CO2-value chain
as a function of oil price
Oil price - USD/bbl
Main assumption
NOK 3,5bn annually
State avoided CO2 permit costs
State tax revenues from EOR oil
CPETRO operating result
State direct net revenues from CO2 value chain
Assumptions: CO2 permit price: EUR 20 per tonne, CO2-volume: 17 million tonnes per year
Source: Bellona 2005

August 2005 CO2 for EOR – environment and value creation
15
Chapter 1: Introduction The Bellona Foundation is striving to achieve CO2 capture and storage both in Norway and internationally. Bellona considers CO2 capture and storage as the only viable option to close the
gap between energy production and demand in an environmentally sound way, thereby ensuring that climate changes and acidification of the oceans due to increased CO2 concentrations in the atmosphere will be stabilised. A prerequisite for CO2 capture and storage is the establishment of an infrastructure for CO2 capture from large emission sources with transport and permanent storage in geological formations. Because of its geographical location and industrial activity, Norway has a unique opportunity to build an infrastructure for CO2 capture and storage that does not entail an increased cost to society. Norway’s CO2 capture and storage infrastructure can be built around the supply of CO2 as a resource for enhanced petroleum production, and at the same time, yield increased value creation for the Norwegian petroleum industry. Today, natural gas and water are used for reservoir pressure maintenance and to increase oil production on the NCS. In many oil fields, CO2 may substitute for pressure maintenance requirements as well as have a much better “washing” effect than water due to its chemical properties in its contact with oil. Injecting CO2 into a reservoir generally increases the oil recovery rate, thus increasing the value of the petroleum activity. This is often referred to as enhanced oil recovery (EOR). CO2 may also be used as a means to enhanced gas recovery (EGR). In 2004, 128bn Sm3 of natural gas were produced on the NCS. Approximately 78bn Sm3 were sold for exports, 7bn Sm3 were used for power production offshore and 42bn Sm3 (33%) were used as pressure support for increased oil recovery. 20bn Sm3 (48%) of the gas used as pressure maintenance was used on just two oil fields, Åsgard (26%) and Oseberg (22%). By producing enough CO2 to substitute the gas used for pressure maintenance, the natural gas could be sold instead. The export value of the gas injected into the Oseberg reservoir was NOK 10bn last year. There remain significant uncertainties regarding the amount of injected gas that will be stranded, i.e. remain in the reservoir after production stops. The assessments vary between 20 and 40%. Enhanced oil and gas recovery and CO2 substitution for natural gas give CO2 a value as a
resource that necessitates the establishment of a CO2 value chain infrastructure for Norway.
This report demonstrates the prospects arising from the use of CO2 in the petroleum production on the NCS, and how Norway has a unique opportunity to link the climate change challenge to economic value creation. Hence the report’s title: “Environment and Value Creation”. The report is also an answer to the Norwegian Petroleum Directorate’s (NPD) report, “CO2 for enhanced oil recovery on the Norwegian Shelf – a case study”, produced upon request of the Ministry of Oil and Energy (MOE) and presented on 26 April 2005. According to Bellona, the NPD report only provided a fragmented view of the CO2 for EOR opportunities. Through its CO2 for EOR report, Bellona wishes to examine all the opportunities, thereby contributing to the decision-making process for establishing a CO2 value chain in Norway. This report seeks to uncover and discuss the technical and economic foundations for really answering The Ministry of Oil and Energy and the Norwegian Parliament’s desire to assess the possibilities of using CO2 for EOR. It is Bellona’s view that the NPD’s report did not manage to answer the task given, which was: “… to
issue recommendations for viable measures to motivate the use of CO2 for EOR on the NCS.” Bellona’s goal with this report is to contribute clear, real options and understanding so that the process of using CO2 for EOR gets back on the right track.

August 2005 CO2 for EOR – environment and value creation
16
Bellona is currently working on another report entitled “The Norwegian gas power plant and CO2 emission fallacy”, which is expected in the near future. Some of the source material used in the cost assessments is from this as yet unpublished report. These reports are part of Bellona’s work towards reducing greenhouse gas emission in the frame of its B7 programme for clean energy. This draft version of Bellona’s CO2 for EOR report has been sent to relevant stakeholders for comments and discussion before the final version is completed. Chapter 2 of the report, “CO2 history”, provides an overview of the debate concerning the establishment of gas power plants and CO2 capture and storage over the last ten years. The historical overview is not intended to be exhaustive, but is merely an illustration of the main developments in the Norwegian CO2 debate and how Bellona has worked on CO2 issues. Chapter 3, “The starting point for a CO2 for EOR report”, describes the motivation and starting point for this report. It discusses Norway’s climate challenges and the achievement of its Kyoto targets, as well as presents a thorough critique of the NPD’s CO2 for EOR report. Chapter 4, “The petroleum resources on the NCS”, provides an overview of Norwegian petroleum activity. The NCS is approaching a mature phase with all the challenges this entails. Bellona stands behind the Norwegian Oil Industry Association (OLF) description that “…the Norwegian petroleum
activity stands at a crossroads”. Bellona’s experience is that increased in-depth knowledge about the use of CO2 for is warranted for the Norwegian CO2 debate. This is the foundation for chapter 5, “CO2 for EOR – a technical
introduction”. In chapter 6, “The potential for enhanced recovery of oil and gas on the Norwegian Continental
Shelf”, the report puts forward the significant value potential that can be released through increased oil production and improved use of gas by establishing a CO2 value chain in Norway. The Norwegian CO2 debate has been stuck in superficial discussions regarding measures to enable CO2 capture and storage without comprehensively assessing and analysing these measures. Chapter 7, “Framework for CO2 capture and storage”, discusses the current structure and sheds light on the reasons why there is no CO2 capture and storage in Norway. Furthermore, the chapter describes new possible measures for developing a CO2 for EOR. Chapter 8, “Establishment of a CO2 value chain in Norway”, shows how Norway, with a sensible assessment of resources, economical, industrial and climatic assumptions, can establish a CO2 value chain. The CO2 capture and distribution chain described is in accordance with sound commercial and operational principles, both for the private sector and for the Norwegian government. The process of establishing a CO2 value chain in Norway illustrates typical Norwegian collaboration between the government and private stakeholders. Chapter 9, “Financial assessment of a CO2 value chain in Norway”, presents the financial assumptions, results and sensitivities linked to the establishment of a CO2 value chain. Chapter 9 also addresses how this can create opportunities for value creation beyond the petroleum sector and provide Norway with an opportunity to meet its climate obligations. Chapter 10, the last chapter, provides recommendations for further studies, both for achieving a CO2 value chain and developing the ensuing opportunities.

August 2005 CO2 for EOR – environment and value creation
17
Chapter 2: CO2 history The Bellona Foundation has been working on the issue of CO2 capture and storage from power production and industrial processes since 1992. Under the heading – Searching for Solutions – the work on this kind of methods for CO2 capture and storage has been the top priority in the organisation. Bellona’s conclusion is that these technologies and conceptual solutions may, beyond a doubt, contribute very importantly to direct emissions reductions, and that through technology applied in an economically sensible manner may build a bridge into the renewable energy society.
Searching for solutions 1995
Establishing an overview of the challenges facing the NCS required an understanding of the rationale for electrification of the NCS. This was presented by Bellona in March 1995. In May, the Norwegian electricity company Naturkraft issued a notification and a consequence analyses in connection with its planned gas power plant. In July 1995, Bellona replied to the consultation, demanding that use of CO2 capture and storage technology should be evaluated. This submission was eventually taken into consideration and resulted in the project being reviewed in several rounds. The same year, Bellona commissioned a preliminary study by Sintef on a concept for power generation with CO2 capture on abandoned offshore installations and on 6 June 1006 received the report3 “Offshore gas power with CO2 removal supplied from a plant located on an abandoned
platform”. 1996
Statoil started CO2 capture from natural gas at the Sleipner field with storage in the Utsira geological formation. Since then, approximately one million tonnes are stored annually. . On 23 February, Naturkraft sent its final application to the authorities, claiming, among other things, that the electricity was to be used in electrification of the Troll field. Bellona strongly criticised this application, claiming that Naturkraft had not conducted the required assessment of CO2 capture. The Norwegian Water Resources and Energy Directorate (NVE) returned the application and asked Naturkraft to conduct the CO2 assessment. On 30 October 1996, NVE granted Naturkraft licence to build gas power plants at Kårstø and Kollsnes. Bellona issued a formal complaint, which resulted in frantic political activity the following year. Miljøsok established a task force to assess the consequences of using 6bn Sm3 of natural gas on the mainland. The task force members, including Bellona, unanimously agreed that if such an amount of gas were to be used, it had to be in conjunction with CO2 capture and storage. 1997
The public debate concerning CO2 capture from gas power plants heated up. In May, Bellona launched the term “sausage cookers” for conventional gas power plants and stated that it was entirely possible to build these power plants to operate without emissions. This assertion created considerable arguments in the middle of the final stages of the Jagland government’s consideration of Bellona’s formal complaint regarding NVE’s license to Naturkraft. Through a combination of much public attention and thorough professional and legal work, Bellona succeeding in requiring the Jagland government (Labour Prime Minister in the 1990s) to consider its
3 http://www.bellona.no/no/harde_miljoefakta/full_oversikt_arbeidsnotater/udef10240/

August 2005 CO2 for EOR – environment and value creation
18
complaint during the Cabinet meeting of 4 June 19974. Bellona was finally successful in inserting CO2 into the Pollution Control Act with the result that the NVE did not have the authority to issue a licence for CO2 emissions and that emission permits had to be granted separately by the environment authorities. This also enabled the enforcement of technology requirements through the Pollution Control Act. Therefore, the case for gas power plants had to be considered again by the Pollution Control Authority because NVE did not have the authority to grant licenses for CO2 emissions. 1998
In the autumn, Egil Myklebust, CEO of Norwegian oil company Norsk Hydro, announced plans to build a 10 TWh gas power plant with CO2 capture and storage. The CO2 produced was intended for pressurisation use on the Grane field, as there was no pressure in the field to cause the oil to flow. This and several other ideas were, however, shelved because the low oil price made the project uneconomical using CO2. In addition, the low price of natural gas made natural gas the best alternative at the time. Bellona unsuccessfully urged the authorities to use paragraph 4.1 the Petroleum Act to require that Norsk Hydro use CO2 on the Grane field as a substitute for gas with sales value. 1999
At the annual conference of the Confederation of Norwegian Enterprise (NHO) in May 1999, Bellona launched its vision of building ten to 20 gas fired power plants on the Norwegian coast line. The intent was to use the electricity offshore and to secure power for production of renewable energy by producing polysilicon for the solar industry, while achieving increased economic return by using the newly available CO2 for EOR. 2000
When the Bondevik 1 government resigned on 9 March 2000 because of the gas power plant debate on 9 March 2000, it was due to the fact that the government was unable to gather political support for the formulation that “..The Pollution Control Act shall remain an important measure for regulating CO2
emissions”. Bellona worked closely with the current government on the legal basis. Prime Minister Bondevik took the consequences of his principles and the government resigned in a manner that demands respect. Bellona was highly critical, especially to the Labour Party’s inconsequential behaviour in this situation since, paradoxically enough, the Labour Party Jagland government’s decision to take Bellona’s complaint into consideration implemented CO2 in the Pollution Control Act. 2001
When the Bondevik 2 government came to power in 2001, gas fired power plants with CO2 emission control became one of the most difficult issues in the Sem negotiations (Agreement by the parties to the coalition government). The gas fired power plant licenses already given should still be valid. In addition, the gas power plants at the Snøhvit project had to be accepted, and the new coalition government agreed in the Sem accord to halve the electricity tax for gas power plants with CO2 capture. 2002
On 30May 2002, Norway ratified5 the Kyoto Protocol and therefore agreed to the following legally binding obligation: in the five-year period from 2008 to 2012, Norway may emit 253 million tonnes of CO2 equivalents. 2003
When, on 25 November 2003, NPD Director Gunnar Berge presented the potential for increased oil recovery through CO2 for EOR on the NCS in OLF’s environmental forum, it was a significant acceptance of Bellona’s arguments.
4 http://www.bellona.no/no/energi/fossil/gasskraft/10335.html 5 http://odin.dep.no/md/norsk/aktuelt/pressem/022021-070080/

August 2005 CO2 for EOR – environment and value creation
19
Bellona worked a long time to achieve storage of all CO2 emitted from the Snøhvit project, both the CO2 produced in the process and that from the gas fired power plants. In the final project concession granted on 13 September, it became clear that the approximately 900,000 tonnes of CO2 removed from the LNG process had to be stored, while the one million tonnes emitted from power production were to be allowed Therefore, on 25 November, Bellona sent a comprehensive letter6 to the MOE suggesting how Norway could initiate a dialogue on possible CO2 capture and storage measures with the European Union. Months passed before an unclear came from the Ministry. 2004 - 2005
Bellona worked actively to get the Norwegian Parliament to request the MOE initiate assessments for the economic aspects of using CO2 for EOR. On 21 October 2004, the MOE gave this mandate
7 to the NPD. In a number of hearings, Bellona has been critical of the principles of the Greenhouse Gas Emissions Trading Act (GHG Act). Bellona delivered a comprehensive hearing8 dated 16 August 2004. In the proposal issued by the government, the process industry’s needs and wishes were not taken into consideration, resulting in the process industry paying a heavy burden relative to the petroleum industry. In the December 2004 implemented final version of the GHG Act, the government withdrew the proposal and entered into a voluntary agreement with the Federation of Norwegian Process Industries. However, despite its and a number of objections, Bellona still believes that having a quota system is better than not having a system at all. Bellona is satisfied that, in the GHG Act, the Bondevik 2 government has maintained CO2 emissions regulation under the Pollution Control Act. Bellona views the establishment of Gassnova, effective 1 January 2005,9 as very positive. The European Union established its Emissions Trading Scheme (ETS) in January 200510. Through the European Economic Area (EEA) agreement, the EU ETS system will to a large extent also be implemented in Norway. However, it is noteworthy that the ETS is to be considered as a minimum directive and therefore allowing Norway to go further than the requirements of the ETS Directive in its domestic measures. The Kyoto Protocol came into force on 16 February 2005 with Russia’s ratification, making it legally binding. In a negative decision, the government gave the go-ahead to start negotiations to build natural gas pipelines to Skogn and Grenland. In April 2005, the MOE assigned Gassco to start financing negotiations with regional participants. Not surprising, there was no guidance given to simultaneously look at possible CO2 solutions and infrastructure. On 26 April, Thorild Widvey, the Minister of Oil and Energy, presented the NPD report on CO2 for EOR on the NCS (a report that is thoroughly discussed in this report). Naturkraft made its investment decision on the Kårstø power plant on 24 June 2005, but renounced the Kollsnes plant. On 30 June, BP announced its intention to use CO2 for EOR in the British continental shelf Miller field. And finally, on 8 August, Thorild Widvey claimed that CO2 capture would not be possible for at least ten years11. Bellona has been part of this fight for 10 years; we refuse to battle for another 10 years.
6 http://www.bellona.no/no/energi/fossil/nord/31849.html 7 http://www.bellona.no/data/f/0/39/49/9_9811_0/mulighetsstudie_CO2.pdf 8 http://www.bellona.no/no/energi/fossil/klima/34876.html 9 http://odin.dep.no/oed/norsk/aktuelt/pressesenter/pressem/026001-070271/dok-bn.html 10 http://europa.eu.int/comm/environment/climat/emission.htm 11 Haugaland energirike seminar on the 8th of August, Haugesunds Newspaper the 9th of August.

August 2005 CO2 for EOR – environment and value creation
20
Chapter 3: The starting point for a CO2 for EOR report This chapter provides the background for Bellona’s CO2 for EOR on the NCS report is explained. The likelihood for Norwegian CO2 emissions increasing is higher than ever, while the measures and strategies for reducing emissions to achieve Norway’s international Kyoto appear unclear and costly. Most significantly, Bellona is in strong disagreement with the main conclusion of the NPD’s CO2 for EOR report, which is the starting point for this report.
Prognosis for Norway’s greenhouse gas emissions Norway’s Kyoto obligations direct that emissions of greenhouse gases shall not surpass 50,6 million tonnes per year of CO2-equivalents on average during the period 2008 – 2012. This equals a total of 253 million tonnes for the entire period. Norway’s obligations may be met by emissions reduction through the use Kyoto Protocol flexible mechanisms, i.e. permit purchase, joint implementation (JI) or the clean development mechanism (CDM).
Based on the last assessment from the Statistics Norway (SN)/Ministry of Finance/PCA (Ministry of the Environment, 2005), the expectation is that Norwegian emissions will continue to increase in the years to come and that Norway will emit approximately 64,5 million tonnes per year12 of CO2
12 See SN’s page http://www.ssb.no/emner/01/04/10/klimagassn/ or Ministry of Finance page http://odin.dep.no/fin/norsk/dok/regpubl/stmeld/006001-040030/hov005-bn.html .
Graph 1: Annual CO2 emission in tonnes from some energy and industry companies subject to the
Greenhouse Gas Emission Trading Act.
0 500 000 1 000 000 1 500 000 2 000 000 2 500 000 3 000 000
Skagerak Energi NGCC CO2CCStatoil Tjeldbergodden NGCC
Industrikraft Midtnorge - Skogn NGCCGassco Kårstø
Statoil Mongstad ASANaturkraft - Kårstø NGCC
Norcem Brevik ASStatoil Mongstad NGCC
Statoil Methanol TjeldbergoddenNoretyl AS Rafnes
Norcem Kjøpsvik ASEsso Norge AS Slagen Raffineri
Hydro Polymers RafnesHydro Stureterminalen
Fundia Armeringsstål ASBorealis Bamble
Mokado Mo Kalk og DolomittverkVerdalskalk AS
Rautaruukki Profiler ASTroll Gassanlegg Kollsnes
Optiroc Leca ASHydro Aluminium Rolled products
Oleon Scandinavia ASOptiroc Leca Borge ASRockwool Moss AS
Rockwool Trondheim ASGlava Askim AS
Weinberger Bratsberg Teglverk ASPQ Norge Silicates
Dynea ASAGlava Stjørdal AS
Tonnes CO2 emissions
Notes: Red columns depict planned gas power plants without CO2 capture. The green column is the announced gas fired power
plant with CO2 capture to be built by Skagerak Energi in the range 400 to 1,000 MW. Blue columns are the PCA assessment of
CO2 emissions. The Kårstø gas treatment facility is, however, expected to emit approximately 1,65 million tonnes CO2 annually
in the Kyoto period.
Source: PCA, 2005 and Bellona

August 2005 CO2 for EOR – environment and value creation
21
equivalents on average during the Kyoto period, which is equivalent to 323 million tonnes or 70 million tonnes more than Norway’s allowances (graph 2). Unfortunately, this assessment does not take into account all the planned gas fired power plants. In addition, the NPD’s assessment of CO2 emissions from the NCS activity has slightly increased since SN’s prediction. If the planned gas fired power plants and the increased NCS emissions assessment are taken into consideration, Norwegian greenhouse gas emissions will increase to a total of between 320 to 360 million tonnes during the Kyoto period. This represents emissions of approximately 70 to 100 million tonnes more than Norway’s committed reductions (graph 3).
Unless Norway implements measures for CO2 capture and electrification of the NCS, it will not meet its Kyoto targets through domestic emissions reductions. As a result, the Norwegian government must buy emission permits abroad to achieve its Kyoto obligations. The cost of this policy remains unclear, but the closest cost estimate available is related to trading emission permits in the international market. In the EU, trading in CO2 permits has begun for the period 2005 to 2007. Permit prices have shown significant volatility this past year, from EUR 6 to 30 per tonne CO2 permit. During the first half of
Graph 2: Norwegian emissions assessment
for greenhouse gases – 2004 - 2020
Source: SN/PCA/Min.Fin., 2004
Graph 3: Annual CO2 greenhouse gases emissions in Norway 1987 – 2020 (million tonnes CO2 equivalents)
0
10
20
30
40
50
60
70
80
90
1987198819891990199119921993199419951996199719981999200020012002200320042005200620072008200920102011201220132014201520162017201820192020
Tillegg for gasskraftverk og NCS
SSB/Fin.dep prognose
Norges samlede utslipp av klimagasser
Kyotoforpliktelse
Million tonnes CO 2 Norwegian emissions of greenhouse gases in CO 2 equivalents
Kyoto periodAddition for gas power plants and NCS
Kyoto obligation
Norway's emissions of greenhouse gases
SN/PCA/Min.Fin. prognosis
Notes: We have assumed full operations of the gas power plants at Skogn, Tjeldbergodden, Kårstø, Mongstad and Grenland
during 2008/2009.
Source: SN/PCA/Min.Fin., 2004 and Bellona, 2005

August 2005 CO2 for EOR – environment and value creation
22
2005, it seems that the permit price stabilised to slightly above EUR 20. Choosing this as premise for the calculation of Norwegian permit costs during the Kyoto period, Norway may risk having to pay between NOK 10 to 16bn in the five-year period to be able to emit the expected 70 to 100 million incremental tonnes of CO2 (graph 4). In other words, Norway is facing a sunk cost, in the respect that it will have to pay money.
The unusual aspect of this situation is that Norway still has time to decide how these funds should be used. Although the cost of this policy in the post Kyoto era is unclear, it is reasonable to assume that CO2 emissions after 2012 will continue to have a cost (see text box 1). There exist politically approved plans for gas fired power plants, with additional gas fired power plants being planned, as well as negotiations to build a natural gas infrastructure to Grenland; without any CO2 emissions capture solutions. Statoil is planning a second train at Snøhvit and is examining the opportunity of a third train in various places on the coast. If these plans come to pass, they will contribute to a significant increase in greenhouse gas emissions beyond Norway’s obligation, which subsequently will have to be met by additional emission permit purchases at a considerable cost for the Norwegian government. Bellona considers that the assessment for Norway’s greenhouse gas emissions underestimates the challenges ahead and therefore prepared a new estimate for greenhouse gas emissions based on the current political decisions (see graph 3 above). The prognosis for greenhouse gas emissions presented in this report shows that, according to current plans, Norwegian emissions will be between 70 and 110 million tonnes CO2 equivalent, or between 27 and 42 % above Norway’s reduction obligations. This includes all the measures that exist today through the Norwegian Parliament’s decisions for emission reductions. Our prognosis should be further developed, based on scenarios that include the planned building of a natural gas infrastructure, the petroleum activity in the Barents Sea, etc. At the same time, several reports (Markedskraft and
Graph 4: Annual CO2 permit costs for Norway based on an international permit price of EUR 20 per tonne
CO2
0
500
1 000
1 500
2 000
2 500
3 000
3 500
4 000
4 500
5 000
2008 2009 2010 2011 2012 2013 2014 2015 2016
SSB-bane Revidert anslag
Norway's annual CO2 permit costs in the Kyoto-period, and further
at a permit price of EUR 20 per tonne CO2NOK million
SN emission prediction
Revised prediction
Source: Bellona, 2005

August 2005 CO2 for EOR – environment and value creation
23
others) indicate that the CO2 permit price will remain high in the foreseeable future (see text box 1, pp. 23-25). In Bellona’s view, many official assessments concerning climate change policy over the last ten years (Norwegian Parliament white papers and other public documents) assumed exceedingly low Norwegian emissions and underestimated the cost of purchasing CO2 permits. Detailed permit cost assessment has not been performed and it seems that there is the misconception that purchasing CO2 permits in the international market will be less expensive than reducing emissions in Norway. The present report repudiates this “truth”. It remains unclear how the government is expected to purchase emission permits and who is responsible for purchasing them. Today, the responsibility rests with the Ministry of the Environment, but there is discussion whether that should be handled by the Norwegian central bank. Determining which area of the government is responsible for emission reduction purchases is very politically sensitive and no actual decisions have been taken. This is probably due to the significant cost to the Norwegian government’s national budget. Another reason why it was believed for a long time that the private sector permit system for greenhouse gas credit would be sufficient to handle the situation. This, however, will not be the case. The permit system covers only a small part of the total Norwegian emissions and the emission-regulated companies are issued free emission permits for a large portion of total emission (currently 95%). The fact that some companies choose to purchase additional emission permits abroad since this seems cheaper than reducing their own emissions does not solve the government’s problems because total emissions are not reduced, and because, paradoxically enough, the government has to purchase emission permits abroad to cover the free emission permits it has issued, as well as the emissions in sectors not regulated by the emission permit system. Another essential element is that for the foreseeable future, the emission regulated do not have the opportunity to increase their permit purchases to any significant degree since this would incur a great increase in operating costs which would threaten the existence of these companies. The result of a reduced free permit issuance to the companies would spell industrial death in Norway. Because of this, the cost of implementing the Kyoto Protocol becomes the government’s responsibility since the government has not implemented measures that transfer the cost to the greenhouse gas emitters. This is how it has to be for the industries competing with companies located in countries without emissions obligations. But since the government has taken on the cost, it must consider how to keep this cost as low as possible. The real consideration is whether it is cheaper for the government to purchase emission permits abroad, or to contribute to investments and measures that result in emission reductions at home. In such an assessment it should be assumed that there will also be an international commitment and a cost attached to emissions in the years following the Kyoto period. Investments made in permanent emission reductions would therefore yield considerable savings post-Kyoto, while the strategy of purchasing emission permits will likely result in costs after 2012. For the period 2008 to 2012, current climate policy results in an expected emission permit purchase cost from other nations of between NOK 10 to 17 billion, with additional costs expected thereafter. The alternative to this policy is to build gas fired power plants with CO2 capture, clean the flue gas from onshore industry and conduct an electrification of the NCS. Through active ownership in the management of the petroleum resources and an active climate policy, Norway should be able to reduce CO2 emissions from an annual level of 72 million tonnes to 46 million tonnes by the end of 2012. This involves the establishment of part 1 of Norway’s CO2 value chain (reducing emissions by 15 million tonnes per year from 2009) and electrification of the NCS (reducing annual emissions by up to 14 million tonnes).

August 2005 CO2 for EOR – environment and value creation
24
Text box 1: Internalisation of externalities –
when CO2 emissions become a cost
The establishment of the Kyoto Protocol and the launch of a cost of emitting CO2 due to the possibility of international emission permit trade has induced, on an international scale, an economic relationship that is described as the internalisation of externalities. An externality, or external effect, can be understood as a negative consequence (cost) that occurs from the activity of one agent, for which the agent does not bear the cost of. An externality is present in conjunction with pollution, i.e. CO2 emissions, when the following conditions prevail: • An activity from agent A causes a loss of
welfare X for agent B; and • The loss of welfare X is not compensated. Trading in CO2 emission permits is an attempt to establish a price (cost) on the external effect (welfare loss) that the participant who emits more CO2 than allowed induces on the global climate. By having the market (supply and demand) decide the clearing price of CO2 emissions, the world hopes it will be capable of reducing global CO2 emissions in the most cost-efficient way possible. The responsibility for this financial arrangement formally lies between countries. Many countries have, however, chosen to delegate this responsibility to national companies that emit greenhouse gases, through national emission permit arrangements (e.g. GHG Act). The idea is that these companies, having restricted emission conditions, will find the best solution for reducing emissions and through a market mechanism will find the cheapest way of reducing emissions by the sale and purchase of emission permits. In theory, this looks like an amicable system for reducing CO2 emissions. However, significant challenges are created on a company level when there are two CO2 cost regions on a global level: • A region “K” with CO2 costs (internalisation of
externalities); and • A region “U” without CO2 costs. In Norway, delegating the responsibility for emissions from the state to the company level creates structural changes for the industry competing at the international level. It also changes
the value distribution between customers and producers in protected industries. What follows is an explanation of the functions and consequences of an emission permit system. Norway emits more CO2 than it is allowed to. The emissions are distributed between different sectors (see pie chart below).
International competitive industry
Other sectors
Domestic energy
production
Petroleum industry
Domestic transport
In Norway, two sectors are chosen for regulation through the emission permit scheme, while the other sectors pay a CO2 levy. Norway has distributed the responsibility of achieving its climate obligations between the state, the domestic energy production (sector E) and the industry competing at the international level (sector I). The three sectors have the responsibility for their own share of the Norwegian emissions above the climate obligations [(M), MS, ME and MI correspondingly] (see graph below).
Allowed
CO2
emissions
Emissions
above
obligations
CO2 emissionsSharing of responsibility for
handling excess emissions of CO2
State
International comp.industry
Domestic energyproduction
Allowed
CO2
emissions
Emissions
above
obligations
CO2 emissionsSharing of responsibility for
handling excess emissions of CO2
State
International comp.industry
Domestic energyproduction
Until the emission permit scheme is enforced, CO2 emissions are not a cost for the companies in sectors E and I. After the restriction covering parts of Norway’s excess emissions through the purchase of permits (CP), sectors E and I will see a direct increase in their operating costs equal to ME*CP and MI*CP.
August 2005 CO2 for EOR – environment and value creation
25
Operating cost per unit
Production volume
Cost1
CostC
Volume1 & C
Operating cost per
unit increases by
MI/E
* Cp
Operating cost per unit
Production volume
Cost1
CostC
Volume1 & C
Operating cost per
unit increases by
MI/E
* Cp
As evidenced in the graph above, the effect on profitability is very different for domestic energy production and the industry competing at the international level. The reason for this is that the industry competing internationally can, to a very small degree, influence the price of its product since it is competing with companies originating in both regions (K and U). However, the consumers of domestic energy producers do not have the possibility of substituting the products from the energy producers to the same degree. What follows is an explanation of how these two sectors are affected by costs in relation to emission permits. Domestic energy production
An increase in the price of energy will result in a relatively smaller decrease in demand for two reasons: (1) the fact that energy demand is relatively inelastic (i.e. the demand for energy changes relatively less than the change in power prices); and (2) the consumer’s low possibility of substituting energy sources. The result is that domestic energy producers can, to a large degree, transfer increased costs to their customers through increased power prices.
P1
PC
V1
changes with
ME * Cp
1C
VC
Price
Volume
P1
PC
V1
Supply curve
ME * Cp
Demand1
SupplyC
VC
Supply
P1
PC
V1
changes with
ME * Cp
1C
VC
Price
Volume
P1
PC
V1
Supply curve
ME * Cp
Demand1
SupplyC
VC
Supply
Since the energy producer has the possibility of transferring the cost ME*Cp to the customer, the increased cost will to some extent stimulate the energy producer to carry out measures for reducing
CO2 emissions. This argument is valid as long as the price of emission permits (CP) remains below the cost of capturing CO2 (COK) as a measure for reducing emissions. When CP > COK however, the energy producer will invest in a capture facility for CO2. As a result, the long-term price of emission permits – CP – will be close to COK as long as demand for energy increases. Short-term fluctuations in power demand will influence CP, as will changes in feedstock such as coal and gas. Over time, CP will fall as a result of the development of capture technology reducing COK. However, this argument only applies if region K emits a surplus of CO2 so that there exists a net demand for emission permits, and that energy technology for production of clean energy is not available. An additional condition applies to European energy producers as, in the short-term, being in compliance with the emissions limits set by the authorities is more important than the price of the emission permits since they have the option of transferring the cost to the customers. Industry competing internationally
For the industry competing at the international level, selling its products at the same price in region K and U, the picture is quite different.
Unit cost of production
Production capacity
PL
PH
VHVL
AK AU BK BU CKCU
EHEL
Unit cost of production
Production capacity
PL
PH
VHVL
AK AU BK BU CKCU
EHEL
The above graph shows a global competitive industry consisting of 6 producers; three in region K and three in region U. The industry produces a product subject to market fluctuations, which in turn affects the volume demand (VL and VH), which subsequently influences the market prices (PL and PH). The curve on top is the industry cost curve over the total production capacity. If the industry in region K experiences an increased cost equal to MI*CP, the industry cost curve will change as shown below.

August 2005 CO2 for EOR – environment and value creation
26
Unit cost of production
Production capacity
PL
PH
VHVL
AUBU
CU
EHEL
AK
MIA*CPBK
MIB*CP
CK
MIC*CP
PHC
VHCVLC
PLC
Unit cost of production
Production capacity
PL
PH
VHVL
AUBU
CU
EHEL
AK
MIA*CP
AK
MIA*CPBK
MIB*CP
CK
MIC*CP
CK
MIC*CP
PHC
VHCVLC
PLC
The consequence for the industry in region K is that it looses competitive power and in the worst case becomes unprofitable and shuts down. The companies in region K will to a smaller degree have the possibility to influence the prices and a larger part of demand volume will be covered by companies in region U. In addition, the product prices will increase slightly, although not enough to cover the increased cost related to emissions. The consequence for the owners of businesses in region K is that, in the long run, they will seek to establish production units in region U at the cost of production units in region K to protect their return on investments. The fact that industry is often also energy intensive is an essential to understanding the effect of placing the responsibility and cost for greenhouse gas emissions on the industry competing at the international level. This means that when the price of energy increases as a consequence of emission permit pricing (P1< PC), the operating cost of energy intensive industry competing at the international level will increase by: Energy use*(P1< PC) + MI*CP Summary and conclusion
As long as region K emits more CO2 than its obligations according to the Kyoto Protocol, there will be a deficit of CO2 emission permits.
This deficit may be reduced by JI and CDM measures at the global level. However, the price of these measures will probably be close to EU prices of CO2 emission permits within the foreseeable future. So far, a detailed analysis of what may be expected to happen in the global CO2 permit market has not been performed. Bellona therefore finds it reasonable, for lack of a better analysis, to assume that price of CO2 emission permits over the next ten years will be close to the gross CO2 capture cost within the EU, unless the demand for energy in the EU were to drop significantly, which is unlikely in Bellona’s view. To sum up, the following relationships will prevail in the international market: If the demand for CO2 permits exceeds the supply of permits, CDM and JI measures: E-CO2K > T-CO2K + JI + CDM ..the price for CO2 permits will have a supply/demand balance price equal to gross CO2 capture costs: CP ≈ COK …and the electricity prices will increase by: ∆P = PC – P1 = ME*CP = ME*COK ..and the cost of energy intensive industry competing at the international level will increase by: MI*CP + ∆P*Energy = MI*CP + (ME*COK)*Energy At the time of writing, the assessment of gross CO2 capture costs is in the range NOK 200-250 per tonne CO2. In this report, Bellona has chosen to assume a long-term emission permit price of EUR 20 (NOK 160) per tonne CO2 as the basis for the economic calculations.

August 2005 CO2 for EOR – environment and value creation
27
Bellona does not accept the conclusions in the NPD’s report The NPD’s report on CO2 for EOR is one of the most important documents the Norwegian public service has presented in 2005. However, Bellona does not accept the conclusions put forward in the NPD report. The following section explains Bellona’s conceptual differences and the reasoning behind our disagreements with the NPD report. The NPD report mandate and work process
On 21 October 2004, the Ministry of Oil and Energy (MOE) requested the NPD to conduct a “study of
the possibilities of conducting projects with injection of CO2 for enhanced oil recovery on the
Norwegian continental shelf”. The Ministry requested the study to include a “comprehensive
overview of:
• The technical potential for the use of CO2 for enhanced oil recovery in oil fields on the NCS;
• The suitable sources of CO2 in Norway and the countries surrounding the North Sea;
• The necessary infrastructure and investments in capture, transport and CO2 injection for
EOR;
• The challenges and barriers to conduct projects with CO2 injection including economical,
immature technology and competition with EOR using CO2,,.etc.; and
• The possible measures the government may use to stimulate the use of CO2 for EOR and their
costs”.
The MOE requested this study following a decision taken in the Norwegian Parliament’s Committee for Energy and Environment, in conjunction with the treatment of White Paper nr.38 which instructed the government to “propose suggestions for appropriate measures to stimulate the use of CO2 as
pressure support for enhanced oil recovery on the Norwegian shelf”.
Accordingly, it is the Norwegian Parliament who asked for and should be the ultimate recipient
of the NPD study. In Bellona’s opinion, the NPD mandate given by the MOE represents a diminution of the Parliament’s initial intention and direction to the government. The process that followed in conjunction with NPD’s work became a very closed process. General comments on the mandate response On 26 April 2005, the NPD presented their study at a seminar entitled “Capture and storage of CO2 –
where do we stand today?”, organised by the MOE and hosted by Minister of Oil of Energy Thorhild Widwey.13. NPD Director Gunnar Berge gave a presentation of the results of the study14 and officially delivered the report to Ms. Widwey. Bellona believes that the NPD report on CO2 for EOR failed to adequately and properly respond to the mandate originally given by the MOE and is in serious breach of the Norwegian Parliament’s directive. Indeed, it does not propose any “suggestions for appropriate measures to stimulate the use
of CO2 as pressure support for enhanced oil recovery on the Norwegian shelf”.
13 More information on the seminar (including lectures) may be found on http://www.odin.dep.no/oed/norsk/p30006318/olje_gass/026031-990049/dok-bn.html . 14 The study may be found on http://www.npd.no/Norsk/Emner/Ytre+miljo/co2rapport_pm_260405.htm.

August 2005 CO2 for EOR – environment and value creation
28
The NPD report represents a serious setback for the work on CO2 and must not be accepted as the guideline for future discussions on how Norway handles its national CO2 challenge and builds its future energy infrastructure. The report’s main conclusion is negative as to using CO2 for EOR on the NCS: ”CO2 injection is technically possible and there is a huge technical potential for enhanced oil
recovery, however, it is the NPD’s judgement that CO2 injection does not represent a commercial
alternative for enhanced oil recovery for the licence owners on the Norwegian shelf today.”
Bellona is of the opinion that this judgement is based on flawed technical, economic and commercial arguments and assessments. The report contains interesting information, but is too limited in its perspective to provide any real answers or relevant evaluations or to clarify the real opportunities. The issues dealt with in the report are not placed in an environmental or larger economic context. When these larger aspects are left out, the alternatives presented for CO2 injection projects do make CO2 for EOR unrealistic, and the report thus gives a flawed analysis to assist decisions that will need to be taken by politicians and other decision makers. Although the conclusion is more focused on potential problems than opportunities, the NPD’s assessment of the technical recovery potential does provide some reason for optimism. The report recognises the greater recovery potential of using CO2 than using other methods for increased oil recovery. Even with questionable cost assessments and financial assumptions (including the failure to consider CO2 for EOR in a broader context), the CO2 projects illustrated in the study yield break even economics at an oil price within the range of USD 30 per barrel. The report also completely lacks transparency and provides no in-depth insight into the various calculations made or methodologies used to draw conclusions. In this respect, Norway has a lot to learn from the EU, which puts forward a strong emphasis on transparency in projects, assessments and processes. In the report, the NPD only briefly discusses the technical and economic basis of the study. Even then, this discussion is not clear and is somewhat hidden from the reader. In addition, the study does not show any sensitivity assessments or analysis of variations from the base parameters chosen. This makes it impossible for any reader who does not have a separately acquired, thorough technical and economic knowledge of the issues, to make a sound judgement of the basic technical and economic judgements and results given. The report’s content is almost totally given at an aggregated level. Likewise, the report mainly refers to selective information only and lacks assessments of measures and possible actions. Accordingly, the report adds little new to increase the insight into CO2 capture and storage and the possibilities to conduct CO2 injection projects. The technical potential for EOR with the use of CO2 The MOE mandated the NPD to provide “a comprehensive overview of the technical potential for the
use of CO2 for enhanced oil recovery on the Norwegian shelf”. In its assessment, the NPD assumed that 20 oil fields on the NCS may be able to use CO2 for EOR. They chose to exclude a further 20 producing fields, which collectively represent 40% of the total remaining oil resources on the NCS. In other words, the basis for the NPD’s technical resource assessment for EOR is restricted to apply only to 60% of the remaining oil resources on the NCS. The technical potential for EOR is estimated on the basis of how much oil the reservoir may yield by using CO2 as a means of enhanced recovery above the level other, more conventional methods, may yield. This ratio is often calculated on the basis of OOIP in the reservoir. In its report, the NPD

August 2005 CO2 for EOR – environment and value creation
29
assumed a potential enhanced recovery rate of between three and seven percent of OOIP. Experience from the USA shows an average OOIP recovery rate of between eight and 16% by using CO2
15. In a recently published study from the US Department of Energy, an average recovery rate of 14% was used. The potential depends on field specific issues and it may be difficult to transfer the US experience directly to Norwegian fields. The Norwegian fields, however, have qualities that may yield both more and less than the US fields. It therefore seems that the NPD report places more emphasis on the issues that may yield a lower recovery rate than those implying that use of CO2 in Norwegian fields could yield higher production. In short, the NPD report emphasised the negative position while de-emphasising any positive implication, resulting in a biased report. In addition, the report does not, for example, mention the Statfjord field, which through the use of miscible gas injection, that can logically be compared to CO2 use, is expected to achieve a total recovery rate of 70% OOIP against the current average of 46% on the NCS. As a further example, many Norwegian oil fields will achieve good miscibility (the necessary mixing of oil and CO2 that gives the oil an improved viscosity to produce it from the reservoir), which indicates that the reservoirs are well suited for the use of CO2 for EOR. Yet some areas have such a permeable reservoir that there is a credible risk that the rock pores may be destroyed through CO2 use. Pilot testing of CO2 injection must be conducted to assess this. If there is a risk of the sea floor sinking, it may be solved by using floating installations or pressure maintenance, similar to that done with water flooding during the 1980s. The basic assumptions used are very conservative, which contributes to putting CO2 for EOR measures on the NCS in a weaker economical light than international experience indicates. How much oil can be extracted depends on the specific reservoir the accuracy of the knowledge about the reservoir. Production on the NCS in general, and on the proposed EOR fields in particular, is based on solid experience and good reservoir mapping through seismic studies and other tools available to the oil and gas companies. Small changes in recovery rates can yield huge changes in field economics. Neither recovery sensitivity nor the sensitivity for varying oil prices are discussed or included in the report. The lack of sensitivities makes it impossible for the reader of the NPD report to fully understand the economic potential of CO2 for EOR on the NCS. The large potential of CO2 for EOR on the NCS is therefore underestimated at best and totally mis-stated at worst. In addition to the expected recovery rate, the assessment of how much oil may be produced per unit of CO2 injected is a very interesting and important figure, especially for the payment assessment per tonne CO2. The NPD has based its assessment on 2,5 barrels of oil per tonne CO2 injected (equivalent to 335 kg crude oil per 1,000 kg CO2 injected)
16. The reason behind this choice is neither validated nor discussed. International experience clearly shows that this may be higher, i.e. more barrels per tonne CO2 injected may well be recovered. Chart 6.4 of the NPD report shows estimates of how much oil may be extracted depending on the amount of CO2 injected. The illustration indicates that the more CO2 is injected over the longest possible time frame, the more oil is produced. The upper range estimates are set at 30 years of injection and 25 million tonnes of CO2 annually without discussing why these parameters were set as the upper range or at all. When the NPD prepared its CO2 for EOR study, it limited the opportunities for assessing the resource and economic potential on the NCS to only involve CO2 for EOR. In certain cases, CO2 may be applied for pressure support for enhanced gas recovery (EGR). This is a very specialised issue and 15 Kinder Morgan, operating 2 oil fields refers to these experience numbers on their home page http://www.kindermorgan.com/business/co2/ 16 In Statoil’s CO2 study of the Gullfaks field this relationship is, as described in the NPD report, between 2,26 and 4,5 barrels of oil per tonne CO2 injected. The preliminary numbers issued for the BP CO2 for EOR project on the Miller field ranges from 2,1 to 1,5 barrels per tonne CO2 injected http://www.bp.com/genericarticle.do?categoryId=97&contentId=7006978

August 2005 CO2 for EOR – environment and value creation
30
only certain gas fields can benefit. However, the NPD ignored it completely. CO2 can also substitute for pressure maintenance, relieving the need to use Norway’s valuable natural gas resources that today are used for this purpose in oil fields. One of the most important uses for CO2 that can stored in the NCS is pressure maintenance, therefore freeing gas for power production with an increased value creation beyond the sale of gas only from the petroleum production on the. Suitable sources of CO2 The MOE mandated the NPD to provide “a comprehensive overview of suitable sources of CO2 in
Norway and the countries surrounding the North Sea”. The report eyes the possibility of establishing large stationary sources of CO2 to supply the NCS with adequate volumes of CO2. The assessment of CO2 sources largely focuses on existing sources and is short-sighted. In addition, the assessment of potential sources is marked by a limited horizon, without any will to see opportunities and comprehensive solutions. Examples of such conceptual and broad assessments are:
• To achieve economies of scale efficiencies and produce the large volumes of CO2 needed, there exist many interesting opportunities to build fossil based power production along the Norwegian coast line in larger facilities. It is both possible and desirable to install a larger power production capacity than is currently planned. Electrification of the NCS will also substantially contribute to making room for large CO2 sources.
• Producing CO2 by extracting CO2 from natural gas is not discussed. Utilisation of CO2 from existing and new gas fields should be part of a study of potential CO2 sources. For example, there are oil fields in the vicinity of the Sleipner field that have adequate miscibility with CO2. The possibility of using the CO2 produced at the Sleipner field today, currently only representing an operating cost, with no income, is not discussed. Neither is the opportunity for the Viktoria gas field – one of the largest gas findings on the NCS that contains large amounts of CO2. Removal of the excess CO2 from this natural gas stream will enhance the value of the gas sold as well as provide incremental CO2 for EOR use.
• There is great potential for CO2 production by reforming hydrogen production from natural gas. Hydrogen will be necessary over time as fuel in the transportation sector. It may also be produced for the hydrogenisation of petroleum products to achieve a lighter quality, or for sale blended into the natural gas exports to Europe – Methagen (see Appendix 5 for more information).
Necessary infrastructure and investments The MOE mandated the NPR to provide “..a comprehensive overview of the necessary infrastructure
and investments”.
CO2 Capture
A large section of the report discusses technologies for CO2 capture. It is remarkable that this issue is given such a dominant place in a report that should mainly discuss CO2 for EOR. When looking at CO2 capture, however, the report provides only an aggregated technical overview of capture technologies and references to numbers from previously cited cost estimate studies. The report does not identify the necessary facilities or investments. Over the last year, studies have been published indicating that the cost assessments used by the NPD are based on outdated information. Before Christmas 2004, Aker/Kværner/GassTek published a study indicating that the cost for a capture facility that could be readily build by 2007 would be below NOK 200 per tonne CO2.

August 2005 CO2 for EOR – environment and value creation
31
In the final report of phase 1 of the Carbon Capture Project (CCP)17, the CCP published the results of four years of research that conclude that gross capture costs are in the same range as Aker/Kværner/GassTek (see Chart 5 below). In addition, Bellona’s financial analysis shows that the cost may be reduced even further when internal pricing including profit elements for internal sales of energy are adjusted for. Further cost reductions stemming from technical optimisation, especially with regards to improved amine solvents and investments costs, are expected. The NPD report bases its conclusions on numbers from 2000 and 2002, which are twice as expensive as the CCP and Aker/Kværner assessments.
The NPD report emphasises the need for research on capture technologies. While Research and Development (R&D) is a good thing, full-scale technical design and operation must be conducted, according to the Norwegian scientific community18 and the suppliers of capture facilities, before deploying the activity. In the short-term, there will not be any paradigm changes within amine technology development yielding significant cost savings19. The are also reasons to believe that in the near-term, alternate capture technology will not become significantly cheaper than the current amine based capture technology. In addition, many of the future concepts increase the operating risk for a gas fired power plant and many of the future concepts do not have the possibility of cleaning industrial flue gases that may be added to the capture stream beyond the gas power plant. If the climate targets are to be met as the IPCC recommends, today’s technology must be used and improved. Significant reductions in greenhouse gas emissions are needed now as well as in 20 years. In this perspective, only the current technology platform is available. It is therefore essential to begin using today’s technology.
17 The published studies are; “Vol 1 - Capture and Separation of Carbon Dioxide from Combustion”, and “Vol 2 - Geologic Storage of Carbon Dioxide with Monitoring and Verification”. See also CCPs homepage (http://www.co2captureproject.com/Phase1Index.htm) and the Elsevier homepage (http://www.elsevier.com/wps/find/bookdescription.cws_home/704293/description#description ). 18 Put forward by the research director Nils Røkke at SINTEF in several presentation during 2004/2005. 19 Reference to statements from SINTEF in Dagens Næringsliv 04.04.05 ”Røkke and chief researcher Erik Lindeberg have little belief in technological quantum leaps – sudden shifts that will make CO2 capture significantly cheaper”.
Chart 5: CCP assessment of gross capture costs for a gas power plant in Norway based on various technical
platforms
Source: CCP, 2005

August 2005 CO2 for EOR – environment and value creation
32
The next step for developing current technology is to build plants and gain relevant operational experience that may be utilised for further optimisation and cost reductions. This is called “learning by doing”, or the development of the industrial learning curve that will lead to cost reductions.20 Improved technical design and practical experience – not research – are needed to achieve less costly capture plant design and operation. Both Aker/Kværner/GassTek and the CCP state that plants with very low capture costs may be designed and ready to order within one to two years from today (see Chart 5 above). The reason why relatively large cost reductions can be achieved by new technical design is because plants were originally developed for use other than large-scale capture from a gas fired power plant. Optimising gains will be created when strong incentives for designing at the lowest possible cost emerge. In addition, a significant portion of the “cost reductions” lie in improved cost calculations. For the most part, early studies consisted of technology assessments and comparisons, or “equation” based, which subsequently have included irrelevant and inflated cost items that are not needed in the final actual product. Bona fide project assessments and ordinary budgeting have been missing as techniques for project appraisals and cost estimation. Build up and assessment of case
The fact that different fields need different volumes of CO2 at differing times has long been known. There is an obvious need for analyses and studies that provide more specific information about the relevant intermediate storage facilities and CO2 for EOR reservoirs. These issues should have been more thoroughly discussed in the NPD study to put forward more information and knowledge. To look at CO2 for EOR without assessing the need for buffer storage makes the usefulness of the project studies very limited; this must be included to achieve a realistic basis for decisions. Two project examples were used in the NPD’s report. However, these should be viewed as singular and trivial illustrations, as the calculations do not show any attempt to optimise the eight fields identified as candidates in the “CO2 for Tampen area”. For example, leaving the Heimdal field out as an intermediate storage to bridge the time discrepancies between production and use of CO2 undermines the reality of the assessments. It is also too limited to review such projects for each particular production license. A broader view must be used, not limited to specific fields. In deed, it is crucial to establish a larger collaboration consortium with a longer time line than the Gullfaks field. When it comes to the choice of cases, Bellona believes that the Halten area should also be reviewed closely for CO2 use, as there are many interesting elements in this region. Apart from potential fields for CO2 for EOR, the region has the Viktoria gas field with a high CO2 content (10%), available capacity in the Halten gas pipe and the geological formation on Frohavet that is assessed as being suitable for long-term CO2 storage. Farther North, the authorities must make sure that the capacity of the CO2 pipeline from Snøhvit is adequate to include other CO2 emissions in the area. It is currently designed to transport approximately one million tonnes annually. The pipe should be built to also include the CO2 from the gas fired power plant on the Snøhvit facility, which will emit 0,9 million tonnes, and Hammerfest Power Company’s planned gas fired power plant, as well as other future sources.
20 Reference to Paul Feron, TNO Science & Industry, and SINTEF, Brussels 13-15.04.05, where they put forward that ”learning by doing” will lead to cost reductions.

August 2005 CO2 for EOR – environment and value creation
33
Costs
Based on the economical starting point of the NPD report, the report, not surprisingly, draws the conclusion that:
• It is too expensive to get CO2 to the NCS platforms; and • There are inadequate sources of CO2 available for transport to the NCS.
Bellona believes that the first conclusion is based on a misunderstanding or lack of any business model for bringing CO2 to the NCS, and on incorrect information regarding gross CO2 capture costs. These flawed judgements negate all other conclusions as to the availability of CO2 for EOR purposes, including the assessment of CO2 for EOR projects on the NCS. The report does not comprehensively appraise or discuss the costs, investments or projects needed to build the necessary CO2 infrastructure on the NCS. For example, neither injected CO2 volume sensitivity nor emission permit costs are included. The report assumes a static emission permit price of EUR 10 per tonne CO2 and a static volume of five million tonnes of CO2 injected. These are not “real world” examples and should be discussed and examined more closely since changes in these assumptions strongly affect the profitability of CO2 projects. One of the most important assumptions for the financial assessments made in the NPD report is implicit and never discussed: the pairing of gross capture cost of CO2 from a gas fired power plant and the cost and financial risk for the EOR use of CO2. The presumed connection between gross CO2 capture costs and the price for CO2 delivered to the platform is basically flawed. This is one of the main assumptions that gives a completely inaccurate perspective and subsequently an erroneous finding for the possibility of using CO2 for EOR on the NCS. Field life and salvage value in the calculations is also subject for discussion. Fluor claims that the guaranteed economic life for its amine capture plants is 30 years, and for pipelines it can be even longer. In the Gas White Paper, the NVE used 40 years. It seems that the NPD report assumes a shorter economic life. It is very important also to develop a business model where the cost for the infrastructure is distributed on more than the first user of the CO2 pipeline. In connection with climate policy, the relevant alternative to purchasing emission permits abroad is to create a CO2 infrastructure to facilitate capture and storage. A rate of return is not placed on the emission permit costs; the purchase of permits is viewed as a pure cost. It is therefore not financially correct to put a cost of capital on the alternative when compared to permit purchase. Based on this principle, the transportation cost becomes significantly lower than assumed in the NPD report.
Challenges and barriers The MOE mandated the NPD to provide the “challenges and barriers to conduct projects with CO2
injection including economic, immature technology and competition with EOR using CO2, etc”.
This point received principal importance in the report. Most of the report’s conclusions are described as barriers. In addition, Bellona feels that the challenges are over emphasised at the expense of the opportunities. In Bellona’s opinion, this gives an unbalanced impression that CO2 capture and storage is difficult and too expensive to undertake. The study of opportunities thus becomes a study of impossibilities. How the challenges can or should be overcome is hardly discussed at all. Large and small challenges/barriers are listed on an equal footing without thorough discussion and implies a degree of difficulty that does not actually exist when each particular barrier is judged on its own merit. Bellona regretted a discussion on:
• The need to obtain more an improved reservoir knowledge;

August 2005 CO2 for EOR – environment and value creation
34
• The need for clear cut business models to clarify each stakeholder’s role; • Risk and predictability for the various stakeholders in the CO2 value chain; • Incentives for cost reductions and efficient technical design; • Transparency in cost and profitability assessments; • Proper methods for cost and economic assessments; • Realistic project concepts for the use of CO2 for EOR; • How the government may carry its share of the building risk based on expected profitability
from EOR increased tax revenues; • Reduced decommissioning costs due to prolonged field life; and • Government co-ordination of the tasks necessary to realise CO2 for EOR on the NCS.
Possible measures and the cost of implementation It is very regrettable that NPD did not look at CO2 for EOR in a larger economic context. Indeed, the government may earn on:
• Improved utilisation of the country’s oil and gas resources; • Postponed removal/decommissioning costs; • An alternate use of the emission permit cost funds; • An active approach to making the inevitable steps towards the low-emission society; • To abide by international treaties; • To take a leading role in the technology race; and • What CO2 capture and storage may mean for onshore industry and as part of the necessary
long-term adjustment of business. Bellona finds it disturbing that the issue on “possible measures the government may use to stimulate
the use of CO2 for enhanced oil recovery and the cost of these measures” is not answered at all by the report. This was the main question the Norwegian Parliament instructed the government to answer! No explanation or justification has in any way been given. It is astonishing that, because of this omission, the MOE has not returned the study to the NPD. Because Bellona sees the Parliament has not received an answer to its initial question, Bellona has taken on this task and believes that the present report provides the answers requested. Bellona believes that the best way to answer the Parliament’s question on the opportunity to establish a Norwegian CO2 value chain is to identify (1) the measures and incentives needed to resolve the environmental and EOR question; and (2) the economic issues both for private companies and the Norwegian government. Chapters 8 and 9 of this report discuss the measures and tasks Bellona feels the NPD should have considered in its report.

August 2005 CO2 for EOR – environment and value creation
35
Chapter 4: The petroleum resources on the NCS
Resources, reserves and production on the Norwegian shelf According to the NPD’s 2005 resource report, which represents the last published NCS forecasts, the combined oil and gas NCS production is expected to peak in 2008 with an annual production of approximately 286m Sm3 oil equivalents (chart 6 at right). Gas production is expected to increase, while oil and condensate production is expected to decline significantly beginning in 2005. The average oil and condensate production between 1996 and 2004 was approximately 190m Sm3 annually. Based on current production, reserves in fields and discoveries, the oil production is expected to decline from 140m Sm3
in 2010 to 90m Sm3 by 2015. This represents a 50% reduction in the oil production over the next 10 years (see chart 9 below). Over the past 10 years approximately 35% of the gross gas production on the NCS has been used in pressure maintenance for oil recovery. Using gas in this manner is expected to continue through the next 10 years also. It is interesting to note that the expected use of gas for pressure maintenance will amount to between 320 to 330 billion Sm3 (chart 7 above) in lost or delayed revenue. To place this in perspective, the gas sales value at current prices is approximately NOK 400bn, or equivalent to the sale of electricity from a 2,100TWh conventional gas fired power plant with power sales revenue of about NOK 530 to 730bn, depending on the market (Nordic vs. Germany). Norway has produced approximately half (2,870 million Sm3) of the total NCS oil reserves, including as yet undiscovered reserves (5,837 million Sm3). Of the remaining oil reserves
Chart 6: Total petroleum production on the NCS
Source: NPD, The resource report 2005
Chart 7: Total annual use of natural gas for pressure maintenance on the
NCS
Source: NPD, The resource report 2005

August 2005 CO2 for EOR – environment and value creation
36
1,807 million Sm3 are expected to be produced from known reserves, while the estimate from unknown reserves is 1,160 million Sm3. Prospects are slightly brighter for gas production.
According to forecasts, total petroleum production over the next 10 years is expected to be approximately 380 million Sm3 lower than the previous 10 year period. This is equivalent to reduced sales revenue at current prices of NOK 930 billion.
Chart 8: Total petroleum resources on the NCS
Source: NPD, The resource report 2005
Chart 9: Oil and condensate production on the NCS 1970 – 2024
0,00
50,00
100,00
150,00
200,00
250,00
1970197219741976197819801982198419861988199019921994199619982000200220042006200820102012201420162018202020222024
Reserver Ressurser i felt Ressurser i funn Uoppdagede ressurser
Oil production on the NCS in million cubic metres of oil 1970 - 2024
Reserves IOR resources Discoveries Undiscovered resources
Source: Bellona, 2005, NPD

August 2005 CO2 for EOR – environment and value creation
37
However, with the present action plan in place, there will be significant oil and gas resources left in the fields after planned production shut-down (chart 10 below).
Recovery rate and maturity on the NCS NPD assess the NCS average expected recovery OOIP percentage to be approximately 46%. The national goal is to achieve a 50% OOIP recovery rate through primary and secondary recovery methods. The fields that have the highest recovery rates (red line in chart 11) are the same fields that today use the largest gas volume for pressure maintenance (chart 12 below). Ekofisk, Statfjord, Oseberg and Gullfaks alone have used 61% of this gas since 1975, equivalent to 253 billion Sm3 (the grand total is 413 billion Sm3).
Chart 10: Oil fields on the NCS – resource assessment for production, remaining reserves and resources
after shut-down
Source: NPD, The resource report 2005
Chart 11: Recovery rate for Norwegian oil production 2004
0
10
20
30
40
50
60
70
1992 1993 1994 1995 1996 1997 1998 1999 2000 2001 2002 2003 2004
Alle oljefelt Ekofisk, Statfjord, Oseberg og Gullfaks Øvrige oljefelt
% recovery rate of original oil in place on the NCS
46%
NCS goal of 50%
All fields Ekofisk, Statfjord, Oseberg & Gullfaks Other fields
Source: NPD, The resource report 2005

August 2005 CO2 for EOR – environment and value creation
38
The Statfjord field, until now Norway’s largest oil producer, is entering tail-end production and beginning its “blowdown” phase. The fact that the NCS is approaching a point in its productive life cycle where an increasing number of fields go from plateau to mature-, late- and tail end production has many important consequences. The main effects can be summarised as follows:
• Increased unit production cost; • Reduced State tax revenues; • Reduced cash flow from SDFI/Petoro • Reduced activity and manning level, both
on- and offshore. Charts 13, 14 and 15 show clearly how fast the NCS is approaching maturity. Between 2001 and 2010, only 10 years, a significant portion of the SDFI/Petoro fields are expected to move from plateau to mature/declining production.
Chart 12: Gas injection by field 1971 - 2004
Source: NPD, The resource report 2005
Chart 13: SDFI portfolio according to maturity 2001
Source: Skjærpe, Petoro, 2004
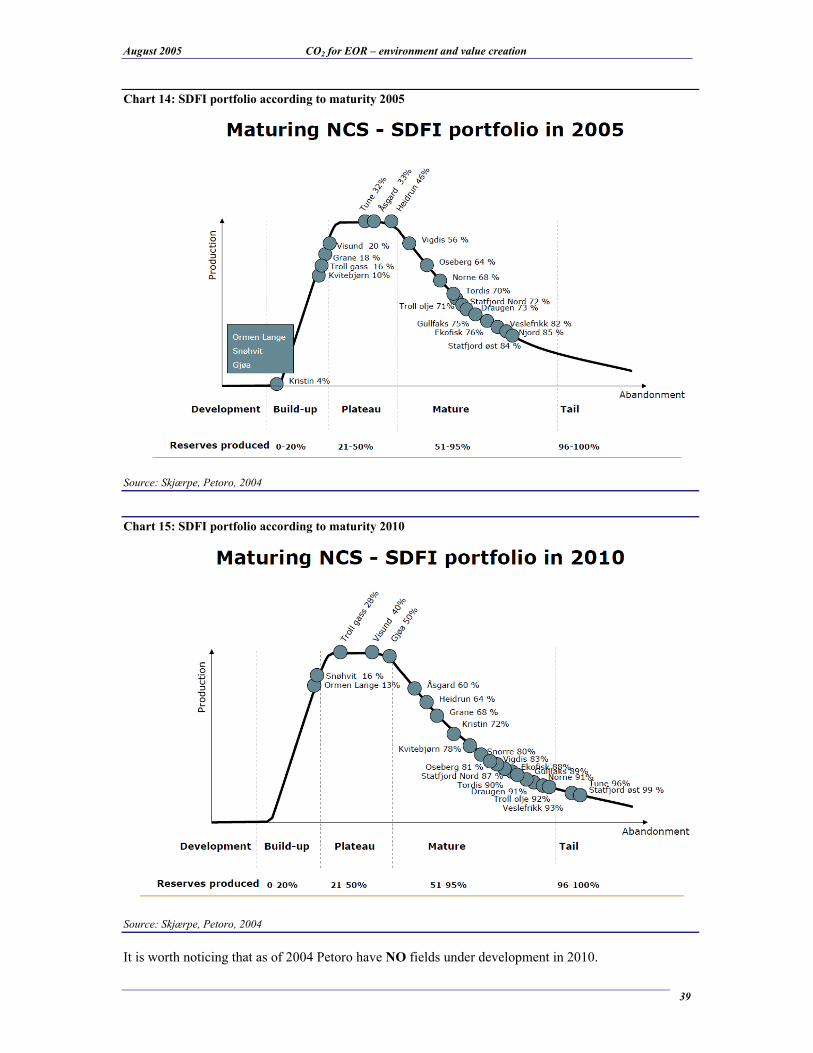
August 2005 CO2 for EOR – environment and value creation
39
It is worth noticing that as of 2004 Petoro have NO fields under development in 2010.
Chart 14: SDFI portfolio according to maturity 2005
Source: Skjærpe, Petoro, 2004
Chart 15: SDFI portfolio according to maturity 2010
Source: Skjærpe, Petoro, 2004

August 2005 CO2 for EOR – environment and value creation
40
In the petroleum industry, the time from discovery until the start of production can take as much as ten years for fields not close to existing installations. The development decline in the SDFI portfolio is a worrying sign for the future development of the NCS.
Field operating costs on the NCS today range between NOK 20–30 per barrel of oil equivalent produced. It is expected that the unit cost will increase significantly as production volumes decline (chart 16 above). This unit cost increase will increase NCS oil and gas price vulnerability. In addition, increased cost per barrel operating costs will reduce the State’s tax revenues.
Chart 16: Unit cost of production in NOK per barrel oil equivalent on the NCS 1998 – 2020 per field
Source: Kon-Kraft, 2004
Chart 17: Investments on the Norwegian shelf (NOK billion)
Source: Kon-Kraft, 2004

August 2005 CO2 for EOR – environment and value creation
41
In 2004 the Norwegian oil industry conducted a cost and investment level study: “Norwegian
petroleum industry at the cross roads”. Chart 17 above shows Kon-Kraft’s 2004 assessment on the NCS 2012 estimated investment level. The last NPD investment forecast NPD (in conjunction with the 2005 resource report) has increased the investment assessment slightly relative to the 2004 Kon-Kraft assessment (chart 18 at right). In the last two years the State’s cash flow from petroleum activity has skyrocketed, creating a large value increase in the Petroleum Fund. (Chart 19 below) A prolonged high cash flow from petroleum activity is, however, not only dependent on high oil and gas prices but also on a continuation of the high investment level necessary to stimulate exploitation of new oil and gas resources.
Measures that will help maintain NCS production and investment levels are important for Norway’s future economic development. New NCS discoveries will help only marginally since most of the shelf has been explored. Increasing the ultimate NCS field recovery rate is most important measure Norway can implement to meet this challenge. For Bellona, the conclusion is clear: the NCS must be brought into the third stage of production: Tertiary oil and gas production.
Chart 18: Annual investments in Norwegian petroleum industry
1985 – 2009 in NOKbn
0
10
20
30
40
50
60
70
80
90
1985
1986
1987
1988
1989
1990
1991
1992
1993
1994
1995
1996
1997
1998
1999
2000
2001
2002
2003
2004
2005
2006
2007
2008
2009
Totalt 1985 - 1995
Rør og landanlegg
Innretninger
Modifikasjoner
Brønner
Investments in Norwegian petroleum industry 1985 - 2009 (NOKbn)NOKbn
Total 1985 - 1995
Onshore and piplines
Installations
Modifications
Wells
Source: SN, NPD, 2005
Chart 19: The State’s cash flow from the petroleum activity
-20
20
60
100
140
180
220
260
300
1971 1975 1979 1983 1987 1991 1995 1999 2003
Bn NOK 2005 value
SDFI
Statoil Dividend
CO2 Tax
Royalty and Area fee
Taxes
State net cash flow
Source: MOE, NPD, 2005

August 2005 CO2 for EOR – environment and value creation
42
Chapter 5: CO2 for EOR – a technical introduction
Tertiary oil production Production from an oil field goes through stages based on reservoir development. A decision to start the use of CO2 for EOR on the NCS is a decision to bring the oil production on the NCS into what the international oil industry refers to as “tertiary” production. Production from an oil field can be divided into three phases (chart 20 below);
• Phase 1) Oil is produced by the initial reservoir pressure (i.e. production of easily accessible oil resources in the reservoir).
• Phase 2) Water (and/or gas) is injected into the reservoir to maintain production pressure because the original reservoir pressure has declined with produced oil volume from the reservoir.
• Phase 3) The reservoir can be “cleaned” and pressurized with CO2. CO2 affects the reservoir oil chemically by making it less viscous (easier to move out of the reservoir). The “Solubility” of the CO2 into the oil contributes to the release of oil that otherwise would be left in the reservoir. In many instances, alternating the use of CO2 and water achieves both “cleaning” and pressurising of the reservoir.
Based on international experience, the NCS reserve and production increase potential for EOR using CO2 is between 27021 and 1,400 million Sm3 of oil22. This represents between 18 and 70% of the
21 270 million Sm3 is based on a 2% recovery rate for the entire oil resource base on the NCS. 22 720 to 1,400 by the use of international experience numbers of a recovery rate from 8 to 16% of OOIP, more about this later. SINTEF has conducted several studies and modelling of CO2 for EOR potential on the NCS. In as study from 2000 it was assessed that the total potential for enhanced recovery by the use of CO2 on the NCS is in the amount of 1 to 2 billion Sm3 of oil.
Chart 20: Production profile for an oil field through phase 1 - 3
Oil production
Original oil in place
100%
50%
25%
75%
Point of economical production shut-down
Primary Primary Secondary Tertiary
30%
50% 65%
Secondary
Tertiary
Time
Recovery rate
Oil production
Original oil in place
100%
50%
25%
75%
Point of economical production shut-down
Primary Primary Secondary Tertiary
30%
50% 65%
Secondary
Tertiary
Time
Recovery rate
Source: Bellona, 2005

August 2005 CO2 for EOR – environment and value creation
43
estimate for remaining oil production. Most of these resources will only be available for production if CO2 is used to “clean out” the reservoirs.
With respect to the expected NCS development, such a potential EOR using CO2 implies that the main challenge to use CO2 for EOR on the NCS during the next 20 years is to the logistics and technology transfer needed to bring the fields into this third or tertiary phase. To achieve this there are two challenges that must be solved:
• Secure an adequate amount of CO2 to flood the reservoirs; • Ensure that the CO2 is available at a price acceptable for profitable application of tertiary
production technology and cost These challenges, while daunting, can be met if they are taken in context with Norway’s climate challenges. This can happen through the establishment of a Norwegian CO2 value chain. Chart 22 illustrates a potential NCS production profile where EOR using CO2 yields an incremental 5%, of total OOIP. This is equivalent to 450 million Sm3 of oil at a sales value of NOK 1,200 billion (at current prices).
Chart 21: Oil production, water- and CO2-injection for a Texas based oil field brought through phase 1
through 3 by Shell International
Source: Shell International E&P

August 2005 CO2 for EOR – environment and value creation
44
Before we discuss the economic issues of the NCS EOR potential, it is important to understand the technical issues related to the use of CO2 in EOR.
CO2 and miscibility The expression “miscibility” is the key to understanding CO2’s properties in relation to oil production. CO2 has chemical properties that make it better suited than methane or water to contact oil in the reservoir, after water flooding has economically mobilized as much oil as it can. Injecting CO2 into the reservoir has the added benefit of maintaining reservoir pressure. Due to these properties CO2 will cause the release of petroleum resources that would otherwise be inaccessible. CO2 has been used in EOR for more than 30 years, mainly in the USA, Texas Permian Basin. The US experience gives a good foundation for assessing the effect of using CO2 for EOR on the NCS. The first EOR project on the NCS that will use CO2 is BP’s Miller field. Statoil’s Statfjord field gives Norway its example on the NCS that can be comparable to the use of CO2 for EOR. CO2 contacts and combines with oil in the pores of the reservoir rock. This CO2 and oil becomes “miscible” in that it mixes thoroughly with the oil in the reservoir at the proper pressure and temperature, causing the oil in the reservoir rock pores to expand and move into the area of less pressure in the well bore and to be produced to the surface. The result is that the reservoir is “cleaned” more efficiently using CO2 injection and as a bonus, pressure is maintained in the reservoir. It is this chemical effect that produces more oil than with the use of gas and water. To determine whether or not the use of CO2 for EOR will be economic, there are two essential reservoir issues that must be assessed:
A. Expected OOIP percentage increase recovery as a result of the CO2 use due to the “cleaning” effect;
B. How many barrels of oil that can be produced per tonne of CO2 injected (the CO2/oil volume-relationship)
Chart 22: oil and condensate production on NCS 1970 – 2024 including 5% EOR by use of CO2
0,00
50,00
100,00
150,00
200,00
250,00
1970197219741976197819801982198419861988199019921994199619982000200220042006200820102012201420162018202020222024
Reserver Ressurser i felt Ressurser i funn Uoppdagede ressurser CO2 EOR 5%
Oil production on the NCS in million cubic metres oil 1970 - 2024 including CO2 EOR
Reserves IOR resources Discoveries Undiscovered resources
Source: Bellona, 2005, NPD

August 2005 CO2 for EOR – environment and value creation
45
The first issue, increased recovery percentage as a percentage of OOIP, gives the basis for assessing the total economic potential in a CO2 for EOR project in that it gives an estimate of total saleable oil that can be expected. Further, the CO2 volume-relationship will determine the total fresh (pure) CO2 volume needed, and to a significant degree determine the willingness of the license owner to decide to institute the CO2 flood: The cost per ton CO2 delivered to the platform is a very expensive proposition. In a CO2 for EOR project assessment, sensitivity analyses to determine the recovery rate and the volume-relationship yield will dictate the financial profitability of the project. The NPD report on CO2 for EOR failed to include the potential for any economic sensitivities of these two relationships. The NPD report identified what they assumed was the NCS relevant percentage enhanced recovery rate, but did not include any discussion about how the chosen volume-relationship was determined. At the same time only the most conservative assumptions were used. These factors contributed in the NPD report to the conclusion that CO2 for EOR measures on the NCS would be viewed in a weaker economic light than international experience might otherwise indicate. It is therefore impossible for the reader to form an impression of the real economic potential for using CO2 for EOR on the NCS.
Contamination of CO2 in produced oil and gas One of the challenges to using CO2 in oil and gas production is that CO2 has no “heating value”. Gas produced after CO2 EOR has been instituted will, once breakthrough occurs, also produce CO2 with the gas. The CO2 content will increase and as time passed become a significant percentage of the total recovered gas. Steps will need to be taken to separate the CO2 from the saleable gas and re-inject the CO2 into the field. High CO2 content in crude oil is not a technical problem. The CO2 separates naturally from the oil. The CO2 is then reinjected into the formation along with fresh CO2. Reducing high CO2 levels in gas is a significantly more demanding and costly process. This can be done through amine-absorption (like the Sleipner field), or membrane and other technologies (currently being done offshore Thailand and in the US). There is no technology problem with this separation. Rather weight and size needs for the selected CO2 removal technology will need to be evaluated and the best, cheapest process used to ensure most profit for each field. Gas and CO2 may also be separated at an onshore facility for gas processing, like at Kårstø. Economics and overall logistics for gas and CO2 use will be the determining factor. By establishing a CO2 infrastructure in Norway, natural gas with a high CO2 content (up to 15%) may be used directly in power production, and the CO2, which does not burn, would not have to be extracted other than at the end of the process and returned to the offshore field for EOR use. On the NCS we have several gas fields with high CO2 concentrations, such as the Sleipner field in the North Sea and the Viktoria field in the Norwegian ocean. Sleipner West and East have been in production since 1993. The Sleipner gas has a CO2 content of 9%, which is above the maximum limit of 2.5% for sale to European buyers. Because of the high CO2 content in its gas, the Sleipner field invested in an amine absorption facility. The pure CO2 removed is injected into a geological formation for permanent storage. Sleipner’s amine absorption facility has the annual CO2 removal capacity of one million tonnes of CO2. The Viktoria field in the Norwegian ocean (Chart 23 below), discovered in 2000, is one of the largest recent NCS gas finds. However, Viktoria’s CO2 content is around 10%. The high CO2 level will makes it more costly to produce and sell the gas into the commercial market. An alternative may be to sell the CO2 rich gas at Tjeldbergodden to a gas fired power plant with CO2 capture. Selling gas with high CO2 content to a power plant is an interesting alternative insomuch as burning such high CO2 content gas for power within Norway in essence removes the CO2 through the burning process and does not require incremental pipeline capacity to be built; especially in an area of the Norwegian Ocean where export possibilities for new gas resources are limited because transport capacity is at full capacity for several years to come. By dedicating Viktoria gas to domestic power production use there will be no need to install CO2 removal equipment.

August 2005 CO2 for EOR – environment and value creation
46
Resource assessment by the use of CO2 on the NCS Mentioned earlier and discussed more fully below, in assessing the use of CO2 for EOR there are three resource relationships that must be considered.
• The recovery potential for enhanced oil recovery [EOR] • The recovery potential for enhanced gas recovery [EGR] • CO2 – natural gas substitution [CO2-NG SUB]
Individual project economics is used to decide whether or not CO2 flooding will be profitable. Any economic analysis is always conditional on the technical reservoir characteristics. As previously mentioned, the two relationships needed to assess economics are:
• Percentage enhanced recovery rate anticipated (as to OOIP, resulting in ultimate EOR barrels recovered)
• The volume-relationship between CO2 and oil/gas (how much oil/gas produced per tonne CO2 used)
Chart 23: Gas discoveries on the NCS and the Viktoria field in the Norwegian ocean
0 100 200 300 400 500 600 700 800
Andre 99 felt
ODIN
6707/10-1
6507/5-1 SKARV 5)
NJORD
MIKKEL
VEST EKOFISK
ALBUSKJELL
TUNE
SNORRE
GULLFAKS
HEIMDAL
VISUND
HEIDRUN
KRISTIN
KVITEBJØRN
VALHALL
ELDFISK
VIKTORIA
GULLFAKS SØR
STATFJORD
FRIGG
OSEBERG
SLEIPNER VEST OG ØST
EKOFISK
SNØHVIT
ÅSGARD
ORMEN LANGE
TROLL
Billion cubic meteres natural gas
Gas resources on the Norwegian shelf per field (Bn. Sm3)
Troll - 1,664mrd Sm3
Viktoria - 118bn Sm3 - 10% CO 2 content
Viktoria
Source: Bellona, 2005, NPD

August 2005 CO2 for EOR – environment and value creation
47
Oil reservoir and percentage enhanced recovery rate by the use of CO2 NPD have in its report assumed a potential enhanced recovery rate in the NCS 23 between 3% and 7% of field OOIP. The percentage OOIP recovery experience in the USA is between 8 to 16% when using CO2
24 for EOR.
The NCS per the government has an expected ultimate reserves recovery rate of 46%, with the long term goal set currently at 50%. This reserves recovery rate is based on primary and secondary production methods only. However, Norway has oil fields with significantly higher recovery rates: Ekofisk, Statfjord, Oseberg and Gullfaks. In these giant fields enormous amounts of gas have been injected to maintain reservoir pressure in combination with water flooding. By injecting this gas in addition to maintaining pressure, some miscibility has been achieved between the gas and the oil, resulting in incremental oil recovery. On the Statfjord field and at Smørbukk South (Åsgard) the gas is used as a solvent for the oil, resulting in “miscible gas injection”25. On the Oseberg and Grane field oil where gas are not in the same phase, the gas is able to be used only pressure maintenance, pushing the oil towards the well production zone by lying as a “ceiling” over the oil. Included in the benefit of having the gas pressurise the formation, allowing oil production, the area where the gas and oil contact also has resulted in some “non-miscible” production. That is, the reservoir and oil properties do not allow for the complete mixing of the oil when it contacts the gas (miscibility), but some mixing does occur, resulting in incremental production that would otherwise not have occurred. In the USA there are significant ongoing efforts to increase the use of CO2 for EOR. The US Department of Energy Office of Fossil Fuels (US DOE) in April, 2005, finalized a large project that assessed the CO2 for EOR potential in several US oil regions (see Table 1 below)
26.
23 NPD have in their assessment assumed that 20 fields on the NCS may use CO2 for EOR. They have chosen to exclude 20 oil producing fields that represent 40% of total remaining oil resources on the NCS. 24 Kinder Morgan, operating 2 such fields refers to these experience numbers on their web pages http://www.kindermorgan.com/business/co2/ 25 The Statfjord field that is produced by miscible gas injection has an expected recovery rate of 70%. This may be seen as an indication of the potential for EOR from similar fields on the NCS. CO2 has far better miscibility potential than natural gas. 26 More information on this project may be found on http://www.fe.doe.gov/programs/oilgas/eor/
Chart 24: Shell International E&P – experience with recovery rate
for oil production in secondary and tertiary phase in Texas
Source: Shell International E&P, 2004

August 2005 CO2 for EOR – environment and value creation
48
In this assessment the US DOE assumed an average recovery rate percentage of 14% as the base. The main reason such a percentage was used is that thirty years of operations and EOR experience using CO2 has contributed to improved technology and understanding of how reservoirs behave when being flooded with CO2. At present, there are approximately 206,000 barrels of oil per day being produced from CO2 floods, mainly in the Permian Basin of West Texas in the USA. This is the oil equivalent of more than 12 million Sm3, or stated another way, about 7% of the current Norwegian oil and condensate production.
Kinder Morgan CO2 Company (Kinder Morgan), an owner and operator of US CO2 reserves has, through the operations of two oil fields being flooded by CO2 injection, established significant experience both technically and operationally. Kinder Morgan’s assessment is that the cost to use CO2 injection for EOR has gone down by forty percent (40%) during the past fifteen years, and Kinder Morgan is currently operating its two floods at a cost of approximately USD 2 – 3 per barrel (NOK 12 – 20), excluding CO2 purchase costs. Only been one detailed technical assessment on the NCS has been performed: The Statoil Gullfaks field study. The study concluded the technical potential for EOR using CO2 to be significant. However, since the cost to bring CO2 to Gullfaks was assumed to be very high, Statoil considered the project unrealistic and not as profitable as spending money to current increase production by infill drilling. This conclusion was based on an estimated CO2 cost of NOK 350 to 500 per tonne delivered to the platform. However Statoil’s willingness to pay for CO2 at oil prices between USD 20 to 22 was only NOK 70 per tonne. Neither Statoil nor NPD managed to add up the numbers. There are also several studies of CO2 for EOR on the NCS that have been performed by SINTEF
27 We will look more closely at the NCS CO2 for EOR potential in the next chapter, but an example of how important sensitivity analyses related to the percentage increase in enhanced recovery and oil production is, we have included Chart 25 to illustrate the full economical potential28.
27 More information on SINTEF’s CO2 for EOR studies may be received by contacting the researcher Erik Lindeberg ([email protected]). 28 Chart 25 is based on the 20 oil fields NPD used as the basis for its NCS EOR potential assessment. In chapter 6 we have, however, included the entire resource base for the NCS (all producing oil fields).
Table 1: Expected recovery rate by the use of CO2 in 6 different oil regions in the USA
Basin/AreaOriginal oil in
placeRemaining oil
in placeOriginal
recovery rate
CO2-EOR technically recoverable
CO2-EOR recovery rate
Total recovery rate
bn.barrels bn.barrels % bn.barrels % %
California 83,3 57,3 31,2 % 5,2 6,2 % 37,5 %
Gulf Coast 60,8 36,4 40,1 % 10,1 16,6 % 56,7 %
Oklahoma 60,3 45,1 25,2 % 9,0 14,9 % 40,1 %
Illinois 9,4 5,8 38,3 % 0,7 7,4 % 45,7 %
Alaska 67,3 45,0 33,1 % 12,4 18,4 % 51,6 %
Louisiana Offshore 28,1 15,7 44,1 % 5,9 21,0 % 65,1 %
Total 309,2 205,3 33,6 % 43,3 14,0 % 47,6 % Source: US.- Department of Energy, 2005
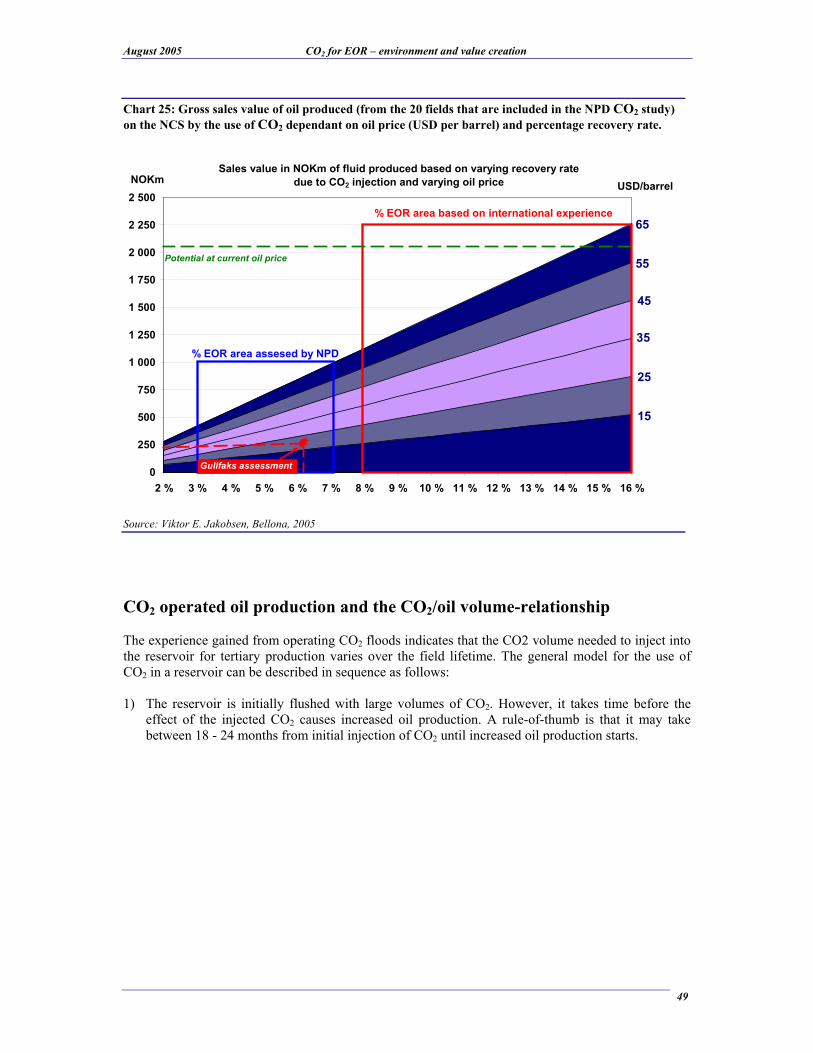
August 2005 CO2 for EOR – environment and value creation
49
CO2 operated oil production and the CO2/oil volume-relationship The experience gained from operating CO2 floods indicates that the CO2 volume needed to inject into the reservoir for tertiary production varies over the field lifetime. The general model for the use of CO2 in a reservoir can be described in sequence as follows: 1) The reservoir is initially flushed with large volumes of CO2. However, it takes time before the
effect of the injected CO2 causes increased oil production. A rule-of-thumb is that it may take between 18 - 24 months from initial injection of CO2 until increased oil production starts.
Chart 25: Gross sales value of oil produced (from the 20 fields that are included in the NPD CO2 study)
on the NCS by the use of CO2 dependant on oil price (USD per barrel) and percentage recovery rate.
65
55
45
35
25
15
0
250
500
750
1 000
1 250
1 500
1 750
2 000
2 250
2 500
2 % 3 % 4 % 5 % 6 % 7 % 8 % 9 % 10 % 11 % 12 % 13 % 14 % 15 % 16 %
NOKm
% EOR area assesed by NPD
% EOR area based on international experience
USD/barrel
Sales value in NOKm of fluid produced based on varying recovery rate due to CO2 injection and varying oil price
Potential at current oil price
Gullfaks assessment
Source: Viktor E. Jakobsen, Bellona, 2005

August 2005 CO2 for EOR – environment and value creation
50
2) The more CO2 initially injected into the reservoir, the more oil can be expected to be produced. It
is therefore very important to have as much CO2 injected as possible into the reservoir in the initial phase to ensure high oil production.
Statoil’s estimate for Gullfaks was that an annual injection of 2,2 million tonnes of CO2 would result in increased oil production of 10 million Sm3 of oil, while an annual injection of 5 million tonnes would result in 30 million Sm3 of increased oil production in the reservoir’s economic life. For the Gullfaks study it seems that approximately 5 million tonnes injected annually constituted an optimum with regards to the CO2-Oil volume-relationship. 5 million tonnes are, however, not the annual need Gullfaks would have for purchasing fresh CO2 in the entire period, since an increasing amount of the needed CO2 can be recycled CO2 from the well stream following the oil from the reservoir.
3) After a period of CO2 injection, and CO2 “breakthrough” occurs (when the CO2 starts coming
back to the surface with oil and gas production), the oil and gas will contain CO2 (i.e. the produced well stream will contain increasing amounts of CO2). The produced CO2 in the oil/gas is separated and thereafter reinjected in the field. The result is that the field’s need to purchase fresh CO2 may be gradually reduced as more and more of the CO2 injected is actually produced from the oil reservoir itself. This is a technical decision that would be based on production increases from the field. Historically, fresh CO2 (i.e. non recycled CO2) has the best effect on incremental
Chart 26: Production profile for the Weyburn field 1955 - 2025
Source: EnCana Corporation
Chart 27: Statoil Gullfaks CO2 study – field profile
and CO2-oil relation
Source: Statoil, 2004

August 2005 CO2 for EOR – environment and value creation
51
production as it is the most mole pure CO2 and does not contain any methane from gas separation).
The general method of CO2 injection in Permian Basin oil fields that producing in the US today is alternating the injection of CO2 with water, so called, “water alternating gas” or “WAG” production. Operational experience indicates that this contributes to the largest production of oil per tonne CO2 injected. (It must be noted here that the WAG EOR method is based completely on the reservoir type and field recovery method which is developed by the initial technical analysis performed prior to making the CO2 EOR field decision.) The water helps maintain the reservoir pressure, as well as reduces the total need for CO2. The water assists also by moving the CO2 that is combined in the oil under pressure in the reservoir to the production well. From an economical perspective, this makes sense, because reducing CO2 with water also reduces operational cost because water is far less expensive than “fresh” CO2. EOR using CO2 in oil fields requires capital investments in new wells, as well as modifying or replacing existing equipment to be able to handle a sour well stream. That is, CO2, in the presence of water, under pressure is considered an “acid gas” in that the combination of water and CO2 creates carbonic acid. This can increase corrosion on equipment and wells. This may require equipment modification containing stainless steel or chrome, coating equipment to resist corrosion, or instituting a chemical corrosion inhibition program. Over the past thirty years EOR experience in the US, significant technological improvements and experience have made corrosion no less a problem, but one that can be readily mitigated. A significant part of the implementation cost of CO2 for past EOR projects has been the cost attached to this type of modification, and adaptation of this will from an onshore to offshore NCS environment need to be made on platform topsides and wells.
Chart 28: Injection profile for CO2 on the Weyburn field (including purchased and recycled CO2)
Source: IEA GHG Weyburn CO2 Monitoring and Storage Project,2004
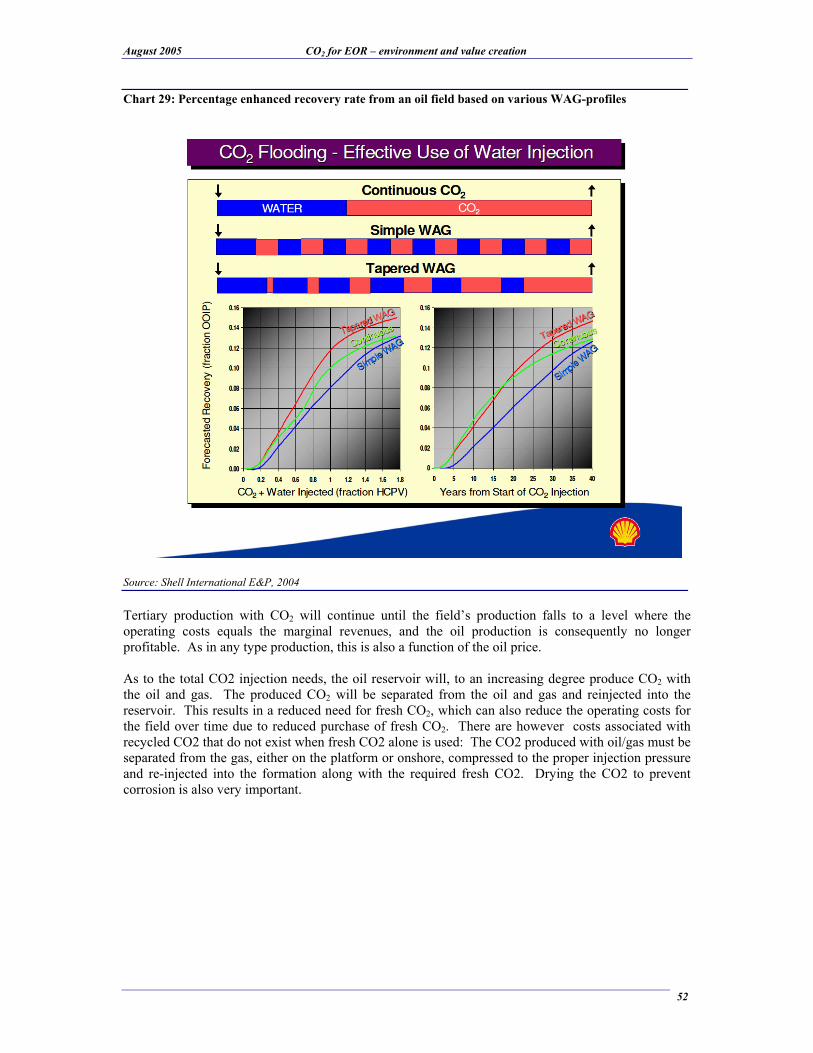
August 2005 CO2 for EOR – environment and value creation
52
Tertiary production with CO2 will continue until the field’s production falls to a level where the operating costs equals the marginal revenues, and the oil production is consequently no longer profitable. As in any type production, this is also a function of the oil price. As to the total CO2 injection needs, the oil reservoir will, to an increasing degree produce CO2 with the oil and gas. The produced CO2 will be separated from the oil and gas and reinjected into the reservoir. This results in a reduced need for fresh CO2, which can also reduce the operating costs for the field over time due to reduced purchase of fresh CO2. There are however costs associated with recycled CO2 that do not exist when fresh CO2 alone is used: The CO2 produced with oil/gas must be separated from the gas, either on the platform or onshore, compressed to the proper injection pressure and re-injected into the formation along with the required fresh CO2. Drying the CO2 to prevent corrosion is also very important.
Chart 29: Percentage enhanced recovery rate from an oil field based on various WAG-profiles
Source: Shell International E&P, 2004

August 2005 CO2 for EOR – environment and value creation
53
As has been stated more than once, in the assessment of the total amount of CO2 needed for tertiary production there are two relationships that have significance for the volume-relationship;
• Number of barrels of oil produced per tonne of CO2 injected • Total number of barrels produced before tertiary production reaches its economical limit, i.e.
when petroleum production drops below profitable levels. The expected use and net purchase of fresh CO2 may therefore be expressed according to the following equation29:
=Tonnes of CO2 injected = =Total barrels of oil produced
Barrels of oil produced per tonne CO2 Barrels of oil produced per tonne CO2
Total oil resource X Expected % enhanced recovery
Tonnes of CO2 purchased = Tonnes of CO2 injected X (1 - % CO2 recycling rate)
=Tonnes of CO2 injected = =Total barrels of oil produced
Barrels of oil produced per tonne CO2 Barrels of oil produced per tonne CO2
Total oil resource X Expected % enhanced recovery
Tonnes of CO2 purchased = Tonnes of CO2 injected X (1 - % CO2 recycling rate)
Experience from USA indicates that depending on the reservoir 1 ton of CO2 injected will yield between 1 and 8 barrels of oil (equivalent to 135 to 1,000 kg of crude oil). NPD has in its CO2 for EOR study assumed 2,5 barrels per tonne CO2 injected (equivalent to 335 kg of crude oil per 1,000 kg of CO2 injected)
30.
29 The equations represent a financial simplification of the assessment processes that needs to be performed to assess the enhanced recovery potential of an oil field when using CO2. In reality the CO2 for EOR study starts with a thorough reservoir study, where the reservoir flow is modelled, and accordingly the amount of injected CO2, water, and the production of associated gas and oil is decided.
Chart 30: production profiles for CO2-injection and oil production in tertiary production
Oil production (barrels)
Point of economical
production shut-down
Time
CO2 injection (tonnes)
Start CO2
injection
Start CO2 - EOR
oil production
Time from CO2 injection to oil
production
Time
Purchased
CO2
Recycled CO2
Oil production (barrels)
Point of economical
production shut-down
Time
CO2 injection (tonnes)
Start CO2
injection
Start CO2 - EOR
oil production
Time from CO2 injection to oil
production
Time
Purchased
CO2
Recycled CO2
Source: Bellona, 2005
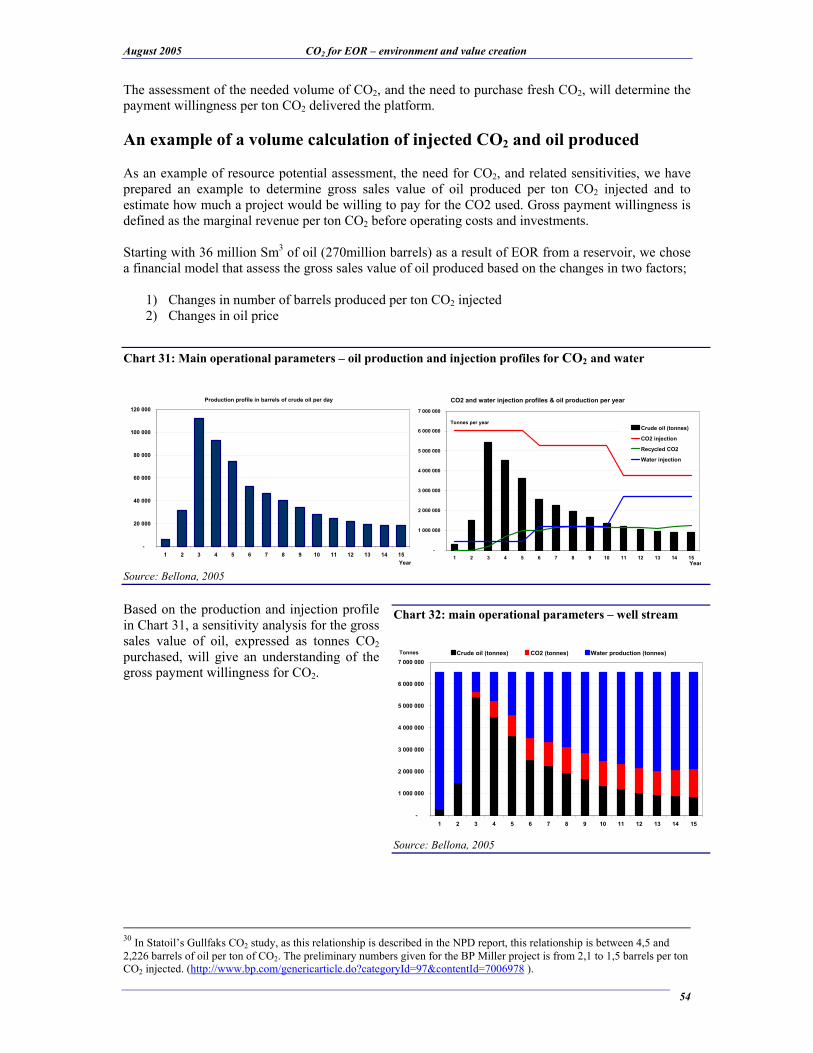
August 2005 CO2 for EOR – environment and value creation
54
The assessment of the needed volume of CO2, and the need to purchase fresh CO2, will determine the payment willingness per ton CO2 delivered the platform.
An example of a volume calculation of injected CO2 and oil produced As an example of resource potential assessment, the need for CO2, and related sensitivities, we have prepared an example to determine gross sales value of oil produced per ton CO2 injected and to estimate how much a project would be willing to pay for the CO2 used. Gross payment willingness is defined as the marginal revenue per ton CO2 before operating costs and investments. Starting with 36 million Sm3 of oil (270million barrels) as a result of EOR from a reservoir, we chose a financial model that assess the gross sales value of oil produced based on the changes in two factors;
1) Changes in number of barrels produced per ton CO2 injected 2) Changes in oil price
Based on the production and injection profile in Chart 31, a sensitivity analysis for the gross sales value of oil, expressed as tonnes CO2 purchased, will give an understanding of the gross payment willingness for CO2.
30 In Statoil’s Gullfaks CO2 study, as this relationship is described in the NPD report, this relationship is between 4,5 and 2,226 barrels of oil per ton of CO2. The preliminary numbers given for the BP Miller project is from 2,1 to 1,5 barrels per ton CO2 injected. (http://www.bp.com/genericarticle.do?categoryId=97&contentId=7006978 ).
Chart 31: Main operational parameters – oil production and injection profiles for CO2 and water
Production profile in barrels of crude oil per day
-
20 000
40 000
60 000
80 000
100 000
120 000
1 2 3 4 5 6 7 8 9 10 11 12 13 14 15
Year
-
1 000 000
2 000 000
3 000 000
4 000 000
5 000 000
6 000 000
7 000 000
1 2 3 4 5 6 7 8 9 10 11 12 13 14 15
Crude oil (tonnes)
CO2 injection
Recycled CO2
Water injection
Tonnes per year
Year
CO2 and water injection profiles & oil production per year
Source: Bellona, 2005
Chart 32: main operational parameters – well stream
-
1 000 000
2 000 000
3 000 000
4 000 000
5 000 000
6 000 000
7 000 000
1 2 3 4 5 6 7 8 9 10 11 12 13 14 15
Crude oil (tonnes) CO2 (tonnes) Water production (tonnes)Tonnes
Source: Bellona, 2005
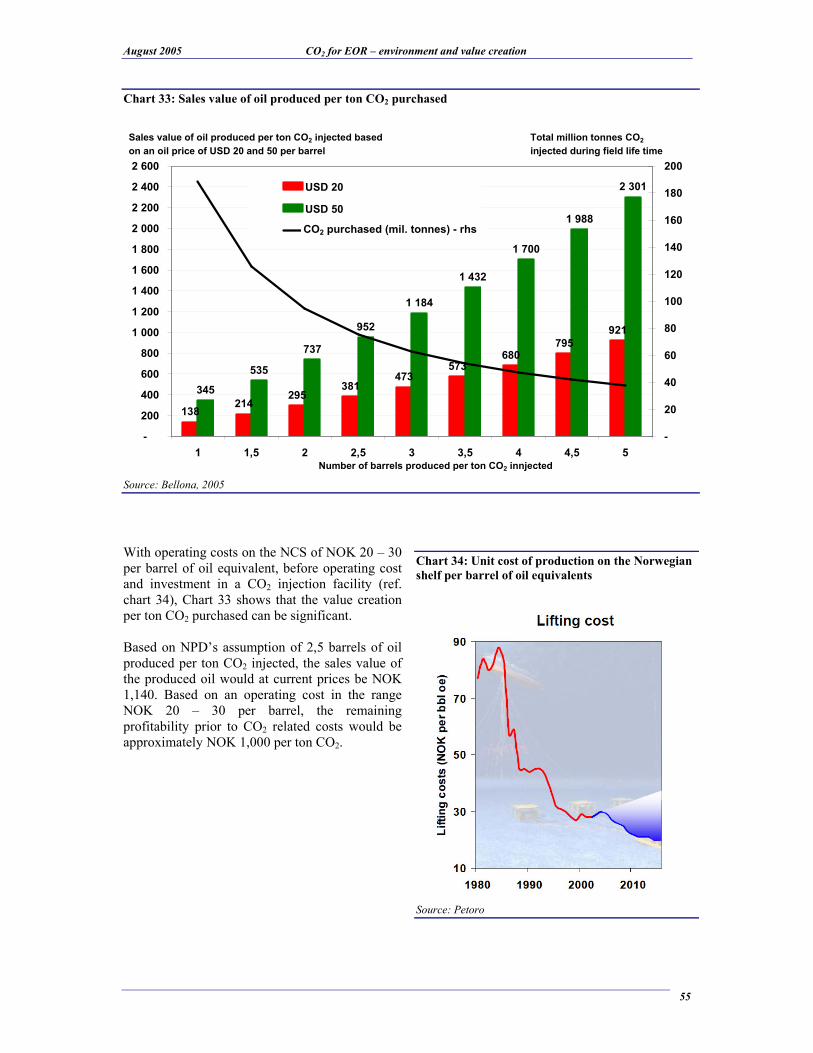
August 2005 CO2 for EOR – environment and value creation
55
With operating costs on the NCS of NOK 20 – 30 per barrel of oil equivalent, before operating cost and investment in a CO2 injection facility (ref. chart 34), Chart 33 shows that the value creation per ton CO2 purchased can be significant. Based on NPD’s assumption of 2,5 barrels of oil produced per ton CO2 injected, the sales value of the produced oil would at current prices be NOK 1,140. Based on an operating cost in the range NOK 20 – 30 per barrel, the remaining profitability prior to CO2 related costs would be approximately NOK 1,000 per ton CO2.
Chart 33: Sales value of oil produced per ton CO2 purchased
138214
295381
473573
680795
921
345
535
737
952
1 184
1 432
1 700
1 988
2 301
-
200
400
600
800
1 000
1 200
1 400
1 600
1 800
2 000
2 200
2 400
2 600
1 1,5 2 2,5 3 3,5 4 4,5 5
-
20
40
60
80
100
120
140
160
180
200
USD 20
USD 50
CO2 kjøpt (mil.tonnes) - rhs
Sales value of oil produced per ton CO2 injected based
on an oil price of USD 20 and 50 per barrel
Total million tonnes CO2
injected during field life time
Number of barrels produced per ton CO2 innjected
CO2 purchased (mil. tonnes) - rhs
Source: Bellona, 2005
Chart 34: Unit cost of production on the Norwegian
shelf per barrel of oil equivalents
Source: Petoro

August 2005 CO2 for EOR – environment and value creation
56
Closing remarks regarding the use of CO2 on the NCS There are two main relationships that have to be considered regarding the use of CO2 for EOR on the NCS:
1) The recovery rate on oil fields based on miscible gas injection is very high: Statfjord expects seventy percent (70%) ultimate total recovery. This shows the potential for CO2 use in other similarly structure reservoirs where CO2 miscibility may result in significantly increased oil recovery. Another example is the Miller field, where BP expects a total reserves recovery of approximately fifty-five percent (55%) following primary and secondary production, and has calculated a preliminary incremental seven percent (7%) OOIP as the result of CO2 injection (tertiary production). This would take the total expected reserves recovery rate to sixty-two percent (62%). The Miller field is close to the NCS, approximately 10 km east of the Glitne field, and shares the same geology.
Chart 35: Geological map of the North Sea and the Norwegian Ocean
Miller & Glitne
Source: NGU, NPD

August 2005 CO2 for EOR – environment and value creation
57
2) The timing of CO2 volumes needed for EOR by a field will be different from the volume
of CO2 produced from power plants and industrial sources. As chart 36 illustrates, the deliveries of CO2 from power production or industrial activity represents an even flow of CO2 over time. An oil or gas field will, however, have a varying need for CO2 volumes. The time frame for a field’s CO2 use will be shorter in conjunction with alternating water- and CO2 injection, and the need for larger CO2 volumes will be greater over shorter periods of time, especially early in the life of the CO2 flood. In addition there is only so much CO2 that can be stored in an oil/gas field since field production will end at some point. This creates a need for an intermediate storage facility for the operational CO2 supply chain on the NCS as well as a need for a permanent storage solution for “excess” CO2 (as an example the case of the Sleipner field that uses the Utsira formation as a permanent storage for CO2).
Chart 36: Illustration of production of CO2 from a coal power plant and the need on an oil field
Source: Erik Lindeberg, Sintef 2004

August 2005 CO2 for EOR – environment and value creation
58
Chapter 6: The potential for enhanced recovery of oil and gas on
the Norwegian shelf When the NPD conducted its CO2 for EOR study, limited the resource and economical potential on the NCS, first by applying CO2 for EOR only to oil reserves, And at the same time limiting the opportunity for CO2 EOR to only sixty percent (60%) of the NCS oil fields. Likewise, there were no sensitivities shown for any value potential that might accrue were the percentage recovery rate or the CO2/oil volume-relationship based on a varying oil price be different than the base assumption. This gave a very narrow read to the report and did not offer any potential upside (or downside) to give the intended reader a full view of what might be available as incremental revenue from NCS use of CO2 for EOR. In this chapter we conduct the resource and sensitivity assessment based on a varying oil price, and also include oil fields it would be natural to consider that were not included in the published NPD study. In addition to this, we examine how CO2 could be used as pressure maintenance for enhanced gas recovery (EGR), and also the needed gas substitution with CO2 as a means for pressure maintenance in oil fields, which will free gas with a burn value for power production. All these are very relevant issues to consider to better assess the impact EOR using CO2 can and will have on the NCS.
CO2 for EOR NPD divided the Norwegian shelf into four regions; South North Sea, Troll/Oseberg, Tampen and the Norwegian Ocean. We have chosen the same regional division of the oil fields. In addition our analysis includes the fields NPD excluded from its report.
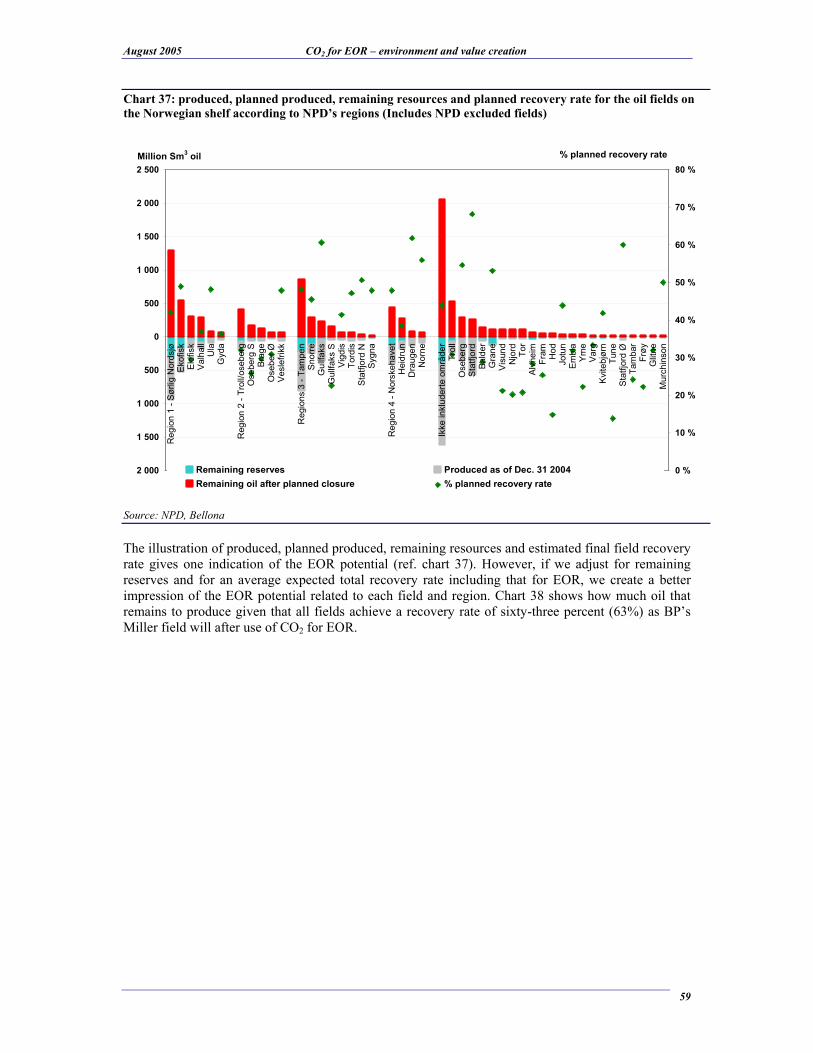
August 2005 CO2 for EOR – environment and value creation
59
The illustration of produced, planned produced, remaining resources and estimated final field recovery rate gives one indication of the EOR potential (ref. chart 37). However, if we adjust for remaining reserves and for an average expected total recovery rate including that for EOR, we create a better impression of the EOR potential related to each field and region. Chart 38 shows how much oil that remains to produce given that all fields achieve a recovery rate of sixty-three percent (63%) as BP’s Miller field will after use of CO2 for EOR.
Chart 37: produced, planned produced, remaining resources and planned recovery rate for the oil fields on
the Norwegian shelf according to NPD’s regions (Includes NPD excluded fields)
2 000
1 500
1 000
500
0
500
1 000
1 500
2 000
2 500Region 1 - Sørlig Nordsjø
Ekofisk
Eldfisk
Valhall
Ula
Gyda
Region 2 - Troll/oseberg
Oseberg S
Brage
Oseber Ø
Veslefrikk
Regions 3 - Tampen
Snorre
Gullfaks
Gullfaks S
Vigdis
Tordis
Statfjord N
Sygna
Region 4 - Norskehavet
Heidrun
Draugen
Norne
Ikke inkluderte områder
Troll
Oseberg
Statfjord
Balder
Grane
Visund
Njord
Tor
Alvheim
Fram
Hod
Jotun
Embla
Yme
Varg
Kvitebjørn
Tune
Statfjord Ø
Tambar
Frøy
Glitne
Murchinson
0 %
10 %
20 %
30 %
40 %
50 %
60 %
70 %
80 %
Gjenværende reserver Produsert per 31.12.2004
Gjenværende olje etter planlagt nedstengning % planlagt utvinningsgrad
% planned recovery rateMillion Sm3 oil
Remaining reserves
Remaining oil after planned closure
Produced as of Dec. 31 2004
% planned recovery rate
Source: NPD, Bellona

August 2005 CO2 for EOR – environment and value creation
60
Based on such an estimate, we show that it is the Troll fields that contain the largest volume potential, while Statfjord is already past 63% in its expected recovery rate. In reality and truth, the potential enhanced recovery will vary significantly from field to field. Statoil is the only company that has conducted a full, adequate reservoir analysis, with its Gullfaks field study. The Draugen field study has started, but has not concluded. The Gullfaks study shows that at an annual injection of 5 million tonnes over a 20 year period could yield 36 million Sm3EOR barrels, which would have Gullfaks surpass 63% ultimate reserves recovery of OOIP. With this estimated increase, Gullfaks’ ultimate OOIP recovery rate would be sixty-seven percent (67%). Based therefore on reasonable estimates for EOR recovery, we conclude that the State through the MOE and NPD should immediately require thorough reservoir studies for the EOR potential using CO2 on all fields on the NCS. There have been many scoping studies performed on most of the NCS fields and even Norske Hydro and Conoco/Phillips as well as the Grane operator have performed published EOR studies. Finally in this illustration we show the estimate for CO2 needed by fields and regions to recovery 63% of the OOIP (Chart 39 below). The volumes reflected assume a CO2/oil volume-relation of 3 barrels per ton CO2
31 injected, that the CO2 for EOR operations last for 25 years and that 30% of the injected CO2 is recycled. Under these assumptions the average need for fresh CO2 to the fields would be 175 million tonnes per year. This EOR recovery estimate is illustrative of the huge recovery potential, but assumes that all fields would enter tertiary production at the same time. This will not happen. It is interesting to see that a region like the Southern North Sea alone would have an annual need of 28 million tonnes of CO2.
31 Equivalent to producing 400 kg crude oil per 1,000 kg CO2 injected in the reservoir.
Chart 38: Potential enhanced recovery due to EOR with a total recovery rate of 63%.
Enhaced recovery at a recovery rate of 63%
0
50
100
150
200
250
300Region 1 - Sørlig Nordsjø
Ekofisk
Eldfisk
Valhall
Ula
Gyda
Region 2 - Troll/oseberg
Oseberg S
Brage
Oseber Ø
Veslefrikk
Regions 3 - Tampen
Snorre
Gullfaks
Gullfaks S
Vigdis
Tordis
Statfjord N
Sygna
Region 4 - Norskehavet
Heidrun
Draugen
Norne
Ikke inkluderte områder
Troll
Oseberg
Statfjord
Balder
Grane
Visund
Njord
Tor
Alvheim
Fram
Hod
Jotun
Embla
Yme
Varg
Kvitebjørn
Tune
Statfjord Ø
Tambar
Frøy
Glitne
Murchinson
Million Sm3 oil
Source: NPD, Bellona
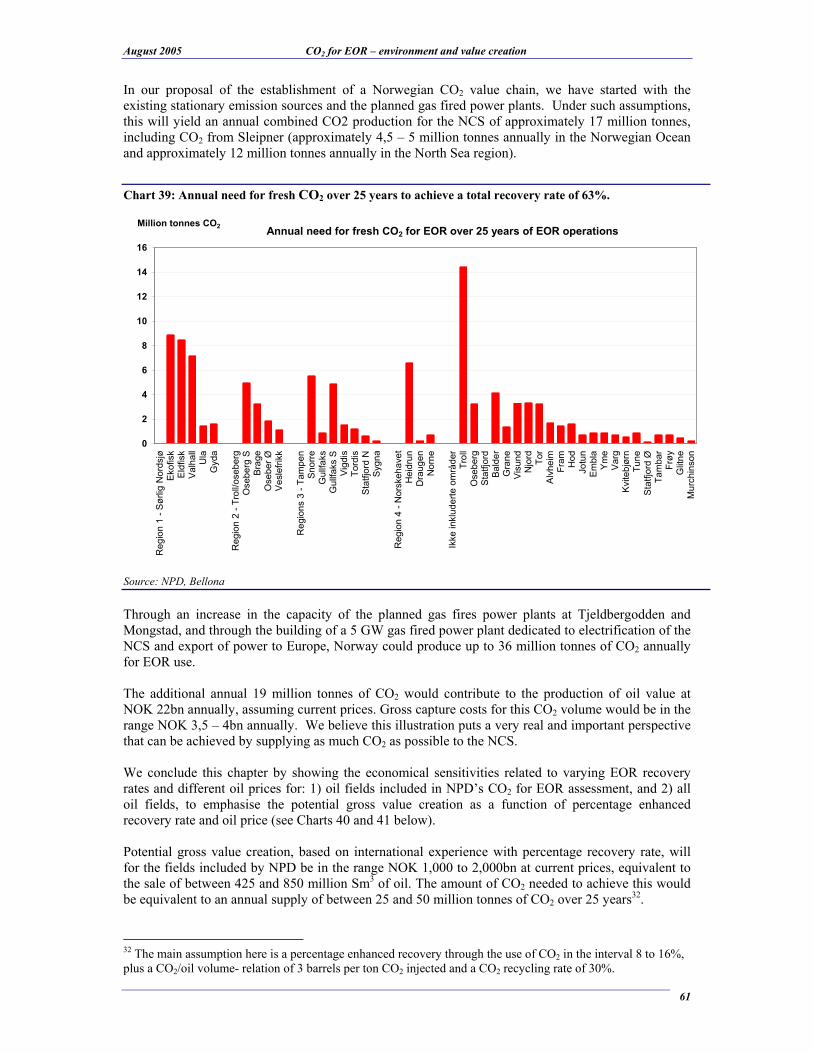
August 2005 CO2 for EOR – environment and value creation
61
In our proposal of the establishment of a Norwegian CO2 value chain, we have started with the existing stationary emission sources and the planned gas fired power plants. Under such assumptions, this will yield an annual combined CO2 production for the NCS of approximately 17 million tonnes, including CO2 from Sleipner (approximately 4,5 – 5 million tonnes annually in the Norwegian Ocean and approximately 12 million tonnes annually in the North Sea region).
Through an increase in the capacity of the planned gas fires power plants at Tjeldbergodden and Mongstad, and through the building of a 5 GW gas fired power plant dedicated to electrification of the NCS and export of power to Europe, Norway could produce up to 36 million tonnes of CO2 annually for EOR use. The additional annual 19 million tonnes of CO2 would contribute to the production of oil value at NOK 22bn annually, assuming current prices. Gross capture costs for this CO2 volume would be in the range NOK 3,5 – 4bn annually. We believe this illustration puts a very real and important perspective that can be achieved by supplying as much CO2 as possible to the NCS. We conclude this chapter by showing the economical sensitivities related to varying EOR recovery rates and different oil prices for: 1) oil fields included in NPD’s CO2 for EOR assessment, and 2) all oil fields, to emphasise the potential gross value creation as a function of percentage enhanced recovery rate and oil price (see Charts 40 and 41 below). Potential gross value creation, based on international experience with percentage recovery rate, will for the fields included by NPD be in the range NOK 1,000 to 2,000bn at current prices, equivalent to the sale of between 425 and 850 million Sm3 of oil. The amount of CO2 needed to achieve this would be equivalent to an annual supply of between 25 and 50 million tonnes of CO2 over 25 years
32.
32 The main assumption here is a percentage enhanced recovery through the use of CO2 in the interval 8 to 16%, plus a CO2/oil volume- relation of 3 barrels per ton CO2 injected and a CO2 recycling rate of 30%.
Chart 39: Annual need for fresh CO2 over 25 years to achieve a total recovery rate of 63%.
0
2
4
6
8
10
12
14
16
Region 1 - Sørlig Nordsjø
Ekofisk
Eldfisk
Valhall
Ula
Gyda
Region 2 - Troll/oseberg
Oseberg S
Brage
Oseber Ø
Veslefrikk
Regions 3 - Tampen
Snorre
Gullfaks
Gullfaks S
Vigdis
Tordis
Statfjord N
Sygna
Region 4 - Norskehavet
Heidrun
Draugen
Norne
Ikke inkluderte områder
Troll
Oseberg
Statfjord
Balder
Grane
Visund
Njord
Tor
Alvheim
Fram
Hod
Jotun
Embla
Yme
Varg
Kvitebjørn
Tune
Statfjord Ø
Tambar
Frøy
Glitne
Murchinson
Million tonnes CO2Annual need for fresh CO2 for EOR over 25 years of EOR operations
Source: NPD, Bellona

August 2005 CO2 for EOR – environment and value creation
62
Chart 40: Gross potential value creation at varying recovery rate and oil price (only fields included in the
NPD report)
65
55
45
35
25
15
0
250
500
750
1 000
1 250
1 500
1 750
2 000
2 250
2 500
2 % 3 % 4 % 5 % 6 % 7 % 8 % 9 % 10 % 11 % 12 % 13 % 14 % 15 % 16 %
NOKm
% EOR area assesed by NPD
% EOR area based on international experience
USD/barrel
Sales value in NOKm of fluid produced based on varying recovery rate due to CO2 injection and varying oil price
Potential at current oil price
Gullfaks assessment
Source: Bellona
Chart 41: Gross potential value creation at varying recovery rate and oil price (all fields)
65
55
45
35
25
15
0
500
1 000
1 500
2 000
2 500
3 000
3 500
4 000
4 500
2 % 3 % 4 % 5 % 6 % 7 % 8 % 9 % 10 % 11 % 12 % 13 % 14 % 15 % 16 %
NOKm USD/barrel
Sales value in NOKm of fluid produced at varying enhanced recovery rate due toCO2 injection at varying oil price (all fields)
Source: Bellona

August 2005 CO2 for EOR – environment and value creation
63
CO2 for Enhanced Gas Recovery (EGR) We have not calculated the potential for enhance gas production on the Norwegian shelf due to the use of CO2. The potential is, however, obvious. An interesting opportunity that should be examined in the future is the use CO2 in the large gas fields such as Ekofisk, Statfjord and Oseberg for incremental gas production by EGR. Using CO2 for EGR has not been performed on a commercial basis worldwide but in certain instances may be able to allow for recovery of natural gas that otherwise would be left in the reservoir. Research and testing using CO2 that would otherwise be stored could be useful in the Frigg field for example. Another issue in relation to EGR is that the gas production will probably last longer than oil production. Injected CO2 may be re-used for other reservoirs than into which it was originally injected. This could mean that CO2 may be used sequentially on the shelf. A possible example is that CO2 first stored at the Gullfaks field may be used at Oseberg through producing the CO2 from Gullfaks, and transporting the CO2 to Oseberg for EGR there. With coordination of the CO2 resources on the NCS, the long term need for “fresh” produced CO2 might be reduced, saving incremental capital and operating costs, potentially making future CO2 for EOR/EGR projects more profitable.
Gas-CO2 substitution As described in Chapter 4 (Chart 7), 42 billion Sm3 of gas was used for pressure maintenance on the NCS during 2004. Some of this gas was useful for miscible gas injection (approximately 34% of the volume in 2004), which is comparable to the EOR use of CO2. Gas has a heat-value, CO2 does not. If the gas used for pressure maintenance had been used for the production of power at a conventional gas power plant, this gas volume would generate the equivalent annual power production of 275 TWh33 of electricity. Based on average electricity prices in Europe (NOK 320 per MWh) this would have yielded a sales value of NOK 88 billion in Germany or The Netherlands. Sale of this gas to the continent would at current natural gas prices have a value of NOK 60 billion. The value increase by transforming gas to electricity, before transport losses, would be 50% delivered the coast of Europe. Producing CO2 from such gas fired power production would yield 90 million tonnes of CO2 annually – a CO2 volume that the NCS could use for tertiary oil production. It is uncertain how much of the gas used for pressure maintenance will remain in the reservoirs as stranded gas after production in a field is shut-down. NPD and the oil industry have estimated that between 20% and 40% of injected gas used for pressure maintenance would ultimately be stranded. The possibility for conducting a gas-CO2 substitution might imply a massive program to build gas fired power plants and CO2 capture facilities. Even if true, to do so would bring about significant economical value creation though measures like;
• Increased gas values through conversion of gas to electricity • Reduced loss saleable gas resources (reduced stranded gas) • Increased oil production due to increased access to CO2 for EOR
33 275 TWh would increase the total power production capacity in Europe with 8% (Europe includes Germany, France, Belgium, Netherlands, Switzerland, Austria and the Nordic). Total power production capacity is approximately 3,500 TWh annually.

August 2005 CO2 for EOR – environment and value creation
64
• Enough power for Norway to implement NCS electrification with real Norwegian CO2 emission reductions
• Contribution to a needed long term climate control measure: infrastructure for CO2 storage
If for no other reason, these potential values should justify studies to shift oil operations on Oseberg and Ekofisk from “non-miscible” gas injection to a CO2 for EOR operated production. This should be a priority area since substituting CO2 for gas would aid in solving s essential issues like:
• Use of gas in Norway to create incremental value for the Norwegian society • Significant CO2 production significant for EOR
This chapter has shown the significant potential value creation that can be created on the NCS from a CO2 value chain. The detailed value chain calculations and the business model will be discussed in detail in Chapters 8 and 9, as well as the needed organisational and financial structures that must be in place to operate the CO2 value chain. We will show that the main argument against establishing a CO2 value chain on the NCS: That the cost of bringing CO2 to the fields is too high, is flawed and there has not been a full and complete examination of the values contained in the creation of a CO2 value chain.

August 2005 CO2 for EOR – environment and value creation
65
Chapter 7: Framework for CO2 capture and storage The debate on CO2 capture has played a major role in Norwegian politics for over ten years and is a very large source of conflict in all relevant government alternatives. The issue has also resulted in the resignation of a government. Despite this – and despite the fact that there is agreement that CO2 emissions must be reduced significantly – no public study or discussion of which measures should be implemented to achieve CO2 capture and storage, including capture, storage, and EOR using CO2, have been undertaken. The Norwegian Parliament’s White Paper nr.38 (2003-2004) on petroleum activity led to believe that this discussion on appropriate measures would take place. The Parliament’s petition nr.249 (2003-2004), decision IV states that: “The Parliament asks the government to forward proposals for
sufficient measures to stimulate the use of CO2 for pressure maintenance for EOR on the NCS. On
addition, the Parliament asks the government to further consider incentive schemes for increased tail-
end production. The evaluation must be forwarded as soon as possible and no later than in
conjunction with the national budget for 2006”.
On 21 October 2004, the MOE sent a letter to the NPD, asking it to “conduct a study of the
possibilities for implementing projects using CO2 injection for EOR on the NCS”. One of the issues the MOE wanted the study to include was a way to “give a comprehensive overview” of:
• “Possible measures the authorities might use in order to stimulate the use of CO2 for EOR
and the cost of implementing them”.
The NPD chose not to include an assessment of such measures in their report. As mentioned above, the government is expected to forward its proposals no later than the timeframe for consideration of the 2006 national budget. Since the NPD chose not to perform the assignment given by the MOE, Bellona urges the government to give the proposals and assessments contained in this report formal consideration.
Why does CO2 capture and storage not happen by itself? Bellona’s calculations show that capture of CO2 from gas fired power plants and other industrial stationary sources, combined with the use of CO2 for EOR, will be very profitable for Norway. Nevertheless, the commercial marketplace has not executed any CO2 for EOR projects. There are several reasons for this. The following section will point out the key challenges, go through the current inadequate CO2 framework and propose measures Bellona feels are appropriate. This Chapter presents a broad range of measures. These options should not be construed as Bellona’s recommendations. Bellona’s main recommendation is presented in the next two Chapters, and the model and economic framework proposed here are fairly superficial. Nevertheless, it is useful for the reader to gain an overview of the relevant measures. Finally this Chapter discusses the legal framework for CO2 capture and EOR: the Pollution Control Act and the Petroleum Act.

August 2005 CO2 for EOR – environment and value creation
66
Gassnova does not have a mandate to institute CO2 capture and storage
For a long time, it was thought that the technology for CO2 capture was unavailable or immature to use for CO2 removal from large-scale gas fired power plants. Based on this understanding, the government received the Parliament’s approval to establish a fund of two billion NOK to be managed by Gassnova, the state’s centre for environmentally friendly gas fired power technology. The annual interest earned on the fund is to be used to support technology development and pilot projects in this area. The government emphasised the establishment of Gassnova was an important step towards the realisation of a gas fired power plant with CO2 capture. There is no doubt that the funds Gassnova controls are useful to Norwegian scientific research and for building competence on CO2 capture technology. Unfortunately, the establishment of Gassnova has placed the discussion of a CO2 capture and storage framework in the shadows. The politicians have chosen to delay further discussion due to the belief that immature technology is the major barrier to realising a full scale gas fired power plant with CO2 capture. In reality, the situation is just the opposite. Technology for gas fired power plants with CO2 removal is available, but the current financial framework makes it unprofitable to investors. There is consensus in the scientific community that the next important step to expand current technology would be to build a full-scale facility to gain the operational experience to further optimise and reduce costs. CO2 permits with no costs provide weak incentives and tactical behaviour Emissions of CO2 from sectors without a CO2 levy are subject to emission permit regulations. This means that companies are obliged to have emission permits equivalent to the amount of CO2 they emit. With current permit prices being approximately EUR 20 per tonne of CO2, permits represent a significant increase in a company’s cost base. Today, emissions from existing industry and those from a gas fired power plant that has yet to be built have been issued free emission permits equivalent to 95% of the emissions for the period 2005 to 2007. These permits may be sold if the emissions are eliminated through CO2 capture and storage. However, this represents weak incentives for significant investments in CO2 capture technology since the companies still have no guidance for emission permits for the period 2008 to 2012 (Kyoto period). Free emission permits are equivalent to a subsidy, as the government is the entity that must pay for emission reductions or CDM measures to comply with the Kyoto Protocol. A lacking value chain implies huge risk and large investments for individual participants Today, there is no CO2 value chain from source to end user. Suppliers of CO2, such as a gas fired power plant, depend on a secure and continuous sale of CO2 at market clearing prices to justify significant capital investments in CO2 capture and compression. Potential buyers, such as oil companies, need significant CO2 volumes, larger than a single Norwegian source is able to supply. The oil companies also need supply flexibility, which demands a physical buffer capacity in some form of intermediate CO2 storage. Oil field license investment decisions are usually made by a group of owners, each with differing equity percentages and management wishes. To achieve the best possible profitability, it will probably be necessary to share CO2 infrastructure related investment costs between several licenses. As long as one license is required to carry the entire infrastructure burden to use CO2 for EOR, there is no reason to believe the investment decisions will be made. If a CO2 infrastructure were in place to be used by several licenses, and had a longer life time than the individual license, it would be feasible to make such investments.

August 2005 CO2 for EOR – environment and value creation
67
Distribution of risk and reward Due to the 78% tax on petroleum activity, the largest part of the reward for producing oil rests with the government. The government and the licenses are therefore misaligned. The government, who owns all the oil on the NCS, wants the license holders to extract as much oil from each field as possible. When a field is decommissioned, the oil remaining in the formation represents a lost value for the government. This is why the government already uses different measures to secure the largest possible recovery. For a license holder, usually an international oil company, however, the main purpose is to earn as high a return on invested capital as possible. Investments in enhanced recovery from mature fields compete with investments in new areas and other countries. The project with the highest rate of return with the lowest perceived risk will receive funding.
Economic measures Although a CO2 for EOR project may be economically profitable for the government, it is not as economical, in the current oil and gas framework, for a single entity to take on such an investment alone. As mentioned above, the government receives the majority benefit from mature field EOR. Since the majority of the profitability lies with the State, it is natural that the State carry most of the risk. This can be achieved through a designed adjustment to the tax system.

August 2005 CO2 for EOR – environment and value creation
68
Regulated maximum return One measure that might be considered is, through tax exemptions, to allow oil companies a defined regulated return on investment in CO2 for EOR projects. The offshore taxation of 78% should be the basis, but the Ministry of Finance might grant licenses tax exemptions that secure the companies a given, fixed, return for such projects. This would be regulated through agreements between the Ministry and the individual license. In this manner, the government may assume risk, but also secures its reward. Taxation based on achieved oil price Another measure that might reduce the oil companies’ risk is to have taxation based on achieved oil price instead of average fixed price taxation as is the case today. This would enable the oil companies to hedge their production and reduce further risk by selling oil on forward contracts without being taxed based on a potentially higher average fixed price assessment than that actually achieved.
Volume exemption In 2004, the Konkraft tax project (Konkraft, 2003, Norwegian petroleum at the cross roads) suggested different changes to the tax regime to promote increased value creation on the NCS. One of the project proposals was to give a volume exemption, in crowns per volume unit, for all production from new fields and increased volumes from existing fields. The government did not support the proposal, most probably because the Ministry of Finance considered such an exemption arrangement would result in reduced tax revenues with no real incentive for end-life production. The Ministry of Finance thought, perhaps correctly, that production included in the volume exemption scheme would be implemented regardless of such a tax exemption. The same does not apply for EOR from mature fields through CO2 injection. Tertiary production is more costly and economic and technical barriers are higher than traditional methods for increased recovery (such as fill drilling). A volume exemption directly tied to oil produced by CO2 injection, for example at USD 2 per barrel, would reduce the risk to acceptable levels and increase the license potential profitability. This measure creates the need for limitations, but this would be manageable. Increased depreciation The licenses can also be given the opportunity to increase depreciation charges on investments directly tied to the use of CO2 for EOR. A shorter depreciation time gives a lower taxable income in the period from initial investment to full write down and consequently a lower up-front taxation. This measure is directly linked to CO2 for EOR. A limitation on which investments that might be included is manageable.
Direct linking of the offshore CO2 levy to funds for climate measures on the NCS The NCS is issued a CO2 levy of NOK 289 and NOK 333 per tonne CO2 on oil and gas, respectively. Most of the electrical power for offshore installations is produced on the platform by power plants with low efficiencies compared to gas fired power plants onshore. (The energy efficiency remains, however, high compared to the offshore activity in other countries). The NCS CO2 levy annually costs the licenses approximately NOK 3 to 4 billion. The Norwegian Oil Industry Association (OLF) has previously argued that the levy should be abolished and replaced with emission permits. Aside from the fact it would be cheaper for the licenses, the argument has been that the levy has no real function. The OLF argues that the CO2 levy has already resulted in all investments in emission reduction

August 2005 CO2 for EOR – environment and value creation
69
measures that had a lower marginal cost than the levy. The levy therefore no longer has an effect and is thereby reduced to merely another fiscal tax. Emission permit obligations would yield a better environmental effect, as long as the license payments for such permits result in emission reductions elsewhere, instead of ending in the government treasury. In Bellona’s assessment, this last argument is correct, but the assumption that there no longer exist possibilities for emission reduction measures with lower marginal cost than the levy level is wrong. Bellona feels that electrification of the NCS from land based power is a very realistic alternative. Due to high gas prices and low energy efficiency, local power production today is a costly alternative for oil companies. Previously, electrification of the NCS was regarded as less profitable since access to land based power was limited. Today, this may be solved by building large gas fired power plants with CO2 capture onshore. An additional bonus is that it will create large amounts of CO2 that could be used for EOR. Bellona suggests that the authorities assess introducing emission permits for the offshore activity according to the Greenhouse Gas Emissions Trading Act (GHG Act), while linking the current CO2 levy with a fund for investment in emission measures offshore. The fund should mainly be used for electrification of the NCS and CO2 infrastructure measures, depending on which other measures are implemented (reference to the company CPETRO as mentioned in Chapter 9). The fund could secure the realisation of profitable regional investments and could be established based on the model of the Sulphur fund.
State subsidy to gas power plants that builds CO2 capture facilities In its common political platform, the Sem-accord, the Bondevik government implementing a time limited support arrangement for production of “CO2 free gas power” equivalent to a reduction of the electricity tax at 2002 level. This has, however, not resulted in any new projects by the builders of gas fired power plants. Such a support arrangement may perhaps trigger single investments, but does not represent the long term framework or predictability that is necessary for CO2 capture and storage to be developed into a significant value chain.
Gas power plant with CO2 capture may be given the same conditions as plants without CO2
capture The Parliament may state that gas fired power plants with CO2 capture be given the same amount of free emission permits as traditional gas power plants, meaning that the government should give emission permits based on the total amount of CO2 produced from the gas fired power plant (equivalent to the sum of the CO2 emitted into the atmosphere and captured). This will remove the uncertainty related to any future emission permit regime and subsequently equalise the investment decision regarding CO2 capture. The participants will still face the uncertainty of the amount of free emission permits if any, but there will be security in the fact that emission permits will not reduce if investment in a CO2 capture facility is chosen. The State should contribute to the establishment of a CO2 for EOR value chain Since there is no functional value chain for CO2, from emission source to end-user or deposit, this is a hindrance for EOR investments. The government should establish this value chain, which can happen in a number of ways. This report evaluates a particularly robust business model believed to be both economically sound and in compliance with the current legal framework according to the GHG Act, the Pollution Control Act, the Petroleum Act, the EEA/EFTA agreement and international treaties. This measure, recommended by Bellona, is described in detail in Chapters 8 and 9.

August 2005 CO2 for EOR – environment and value creation
70
Legal measures
The Pollution Control Act Through its ratification of the Kyoto Protocol, Norway has obligated itself to partake in the international effort to reduce global CO2 emissions. Approval of the Protocol is acknowledgement that Norway believes that the emission of CO2 contributes to large climatic changes. The Kyoto Protocol came into force on 16 February 2005. As an international driving force, Norway must comply and be forward thinking in its active domestic policy to maintain its credibility in the international environmental policy setting. Because the Kyoto Protocol is the central mechanism in climate issues and because climate change is a cross border, global problem, the assessment of CO2 emissions from gas fired power should focus on Norway’s relationship to the Kyoto Protocol. According to the Parliament’s law proposal nr. 13 (2004-2005) – the GHG Act – Norway’s emission status during the Kyoto Protocol period (2008 to 2012) will be annual emissions of ten million tonnes more than its allowed level. Emissions from any new gas fired power plants coming into operation during this period of after, presumably, would create an additional obligation beyond this level. It should also be mentioned that Norway should expect further emission reduction obligations in future international climate negotiations. The GHG Act regulates parts of Norway’s CO2 emissions up to first obligation period for the Kyoto Protocol from 2008 to 2012. Its purpose is to reduce greenhouse gas emissions in a cost efficient manner. This law and its preparatory work are presumed to be a template for how the government foresees future regulation after 2008. CO2 emissions (and other greenhouse gases) are also regulated by the Pollution Control Act, which requires that emissions receive an emission license. This requirement has not been changed with the introduction of the GHG Act, which means that any business subject to the GHG Act must also have an emission permit according to the Pollution Control Act. The responsibility for having an emission license is also stipulated in the GHG Act. With regards to an opening for specifying technological demands when granting an emission license based on the Pollution Control Act, it is recognised in the preparatory that such a demand is applicable to new gas fired power plants. The reason for this is what Bellona initially claimed; that new gas fired power plants will represent significant sources of CO2 emissions, which would make it even harder for Norway to achieve its Kyoto obligations.
The Norwegian Parliament will not have stricter regulations in Norway
On several occasions, the majority in the Parliament has stated that Norwegian gas fired power plants shall not have more strict greenhouse gas emission requirements than is common in other EEA countries. The Parliament’s majority may of course change this point of view. However, if it is assumed that this condition should be fulfilled and that gas fired power plants in EU countries are not required to capture CO2, this regulation must be shaped in a manner that the demand for CO2 capture does not make the investment in a gas fired power plant less profitable in rate of return and risk than it would have been without this requirement.
Changes in emission licenses
Warranted in the Pollution Control Act, the emission control authority may “revoke or change the
conditions of an emission license, warranted in this law or by regulation according to the law, or
define new requirements, and if necessary revoke the license if (...) new technology makes it possible
to significantly reduce emissions”.

August 2005 CO2 for EOR – environment and value creation
71
Furthermore in § 18, fourth junction, it is stated that ”by decisions according to first and third
junction, it must be taken into consideration the cost incurred on a polluter by a change or permit
revoke, and the advantages and disadvantages a change or permit revoke will induce.”
Companies with an emission permit for CO2, such as a gas power plant or industrial facility, can not be required to implement CO2 capture, even though new technology is available, without considering the business consequences. If a change in the emission permit results in undue costs or competitive disadvantages it is not reasonable to make such changes. In light of the business model for a CO2 capture company (NOCO AS – Norwegian CO2 Recycling Ltd.) proposed in this report, Bellona believes it reasonable that the law may give the authorities the opportunity to demand capture of existing emissions on the locations where a CO2 capture facility is built, so long as this does not induce undue costs on the emitter. Since the cost of capture services may be tied to the emitter’s current emission permits, a demand for CO2 capture will not incur excessive costs for the emitter. If NOCO is established, it will be necessary for the government to use the opportunity to require capture in the emission permits to secure NOCO an adequate supply of “raw materials” (CO2) to enable the establishment of a CO2 value chain. If new gas fired power plants are not required to capture their CO2 emissions, each new plant will increase Norwegian greenhouse gas emissions by 2.5%. An increase of this magnitude is significant when seen in relation to Norway’s Kyoto obligations to reduce emissions down to a level of +1% relative to 1990 emission levels. Particular assessment of domestic issues related to the Kyoto Protocol is also of great importance since Article 17 of the Protocol states that a permit trading system should be “supplemental” to domestic measures. Based on the wording “supplemental” and the understanding of several of the treaty parties, it is understood that more than 50% of emissions should be reduced nationally, independent of emission permit trading. This notion is also supported by the purpose of the treaty. The Petroleum Act Bellona believes that the authorities may use the Petroleum Act to warrant and secure that an economically profitable EOR project from mature fields can be realised. In the first place, all licenses should be required to assess the potential for the use of CO2 for EOR. This requirement is warranted in the Petroleum Act: “production of petroleum shall be conducted in such a manner that as much of
the present resource in a reservoir or in several reservoirs seen as one is produced. Production shall
be conducted according to acceptable technical and healthy economical principles in such a manner
that waste of petroleum or reservoir energy is avoided. In order to achieve this licence holders are
obligated to continuously assess the production strategy and technical solutions and implement
necessary measures.”
Like the Pollution Control Act, the Petroleum Act is an important instrument for the establishment of a CO2 value chain. Since there is no market for CO2 for EOR, the company that assumes the risk of establishing a pipeline infrastructure and any intermediate CO2 storage facilities must have secured CO2 supplies. If, for a variety of reasons, a license decides not to start EOR using CO2, although this may be deemed profitable, the NPD should be able to use the Petroleum Act’s opening of requiring a higher recovery rate.

August 2005 CO2 for EOR – environment and value creation
72
Chapter 8: Establishment of a CO2 value chain in Norway In the preceding chapter we have made it clear that it is very import for Norway to establish a CO2 value chain. The basis for starting a Norwegian CO2 value chain is tied to two main arguments:
• Norway needs as much CO2 as possible for use on the NCS • Capturing CO2 from Norwegian emission will reduce Norwegian long term climate costs
In addition to enabling a CO2 value chain, doing so will contribute to the establishment of a long term, stable framework for CO2 intensive onshore industry, which will secure industry’s ability to survive in Norway. The NPD report’s economical assessments not surprisingly concluded that;
• It is currently too expensive to supply NCS platforms with CO2 • There is not enough CO2 available for economical transport to the NCS
The first conclusion is based on an incomplete assessment and understanding of how to enable CO2 to be brought to the NCS and incorrect information regarding CO2 gross capture costs. The second conclusion is based on too limited an understanding of the opportunities and effects of establishing a CO2 value chain. These erroneous judgements puts limitations on and prevents any other conclusion from being considered as to CO2 availability for EOR purposes, as well as the assessments of the economics of CO2 for EOR projects on the NCS. In this chapter we will present how a reasonable value chain for physical CO2 capture and delivery could be organised. Chapter 9 presents the financial aspects of this value chain.
Operational model for a CO2 value chain in Norway One of the most important assumptions of the economical assessments made in the NPD report is implied but not discussed: The direct connection or linkage between CO2 gross capture cost from a gas fired power plant and the CO2 for EOR cost and financial risk assessment. The direct link is faulty logic and the direct connection between gross CO2 capture cost and the price of CO2 delivered to the platform is mistaken. Another idea that was mentioned only is the possibility of establishing large stationary CO2 sources to supply the NCS with adequate amounts of CO2. The most realistic operational and economic business model to begin using CO2 for EOR on the NCS can be described as follows:
1. As part of the efforts to bring NCS into tertiary production, for making CO2 for gas substitution possible, and using both as a climate measure, a company must be established that has responsibility for the capture, purchase and transport of CO2 from the large stationary sources of CO2 emissions. The financial foundation for this company exists due to the potential for large EOR recoveries in the NCS. It is also possible to start with Norway’s emission permit obligations as an economical starting point.
2. Another CO2 Company establishes a transportation system (pipelines and perhaps ships) for
CO2 to two large CO2 intermediate storage sites. Existing oil fields with CO2 needs or abandoned gas fields may be used as intermediate storage solutions. The reason for intermediate storage is the fact that the CO2 production and field CO2 demand for EOR

August 2005 CO2 for EOR – environment and value creation
73
purposes will have different volume production profiles y and different field demand lifetimes.
3. Under these scenarios the supply of CO2 to oil and gas fields can then be made on a project-to-
project basis based on required supply from the CO2 intermediate storage sites on the NCS. CO2 sales to oil and gas licenses on the NCS will generate revenue for the CO2 Company and be based on commercial contract terms. The main driver is the direct revenue from the sale of CO2 for the CO2 company. The State also receives indirect revenues due to the following financial effects;
• Increased tax revenues from EOR oil and gas production • Reduced emission permit costs by the fulfilment of Norwegian Kyoto obligations • Delay in the NCS platform abandonment costs due to EOR production on oil and gas fields • Increased “after tax” value of the owner shares in Petoro, Statoil, Norsk Hydro and other NCS
based businesses in which the Norwegian State holds owner interest. • Increased tax revenues from increased NCS activity level in the Norwegian supply • The opportunity to reduce the operating costs on the Norwegian shelf by up to 15 – 20% as a
consequence of NCS electrification (a reduced CO2 levy from the shelf reduces the State’s revenues, however, this can be viewed in conjunction with reduced emission permit costs).
• Sustained income tax revenues from high paying jobs that REMAIN in Norway due to life extension from EOR activity (multiplying tax effect for income earned).
The proper business model for the NCS licensee is to relate the price for CO2 to the fluctuation in oil price. Consequently the economical calculations will be based on the actual cost of using CO2 in the platform, and the price for CO2 delivered to the platform will fluctuate based on a marginal price assessment of the payment willingness for CO2.
The climate obligations as part of the basis for the establishment of a CO2
value chain in Norway The climate reasoning for establishing a Norwegian CO2 value chain is as follows: According to the Kyoto Protocol, Norway is obligated to emit not more than 50,6 million tonnes of CO2 equivalent per year in the period 2008 through 2012. The international regulations for the period after 2012 are not yet clear, however, there is no reason to believe that the international community will lessen future emission regulation. Based on a recent prognosis for Norwegian emissions, and on the planned gas fired power plants planned to be operational in the period, Norway is expected to emit between 70 and 100 million tonnes of CO2 during the Kyoto period more than allowed. Through purchase of emission permits in the international market this will represent a financial outlay in the amount of approximately NOK 15 billion in the five year period. The alternative to purchase emission permits abroad would be to implement climate measures at home. Summing up, the basis for the establishment of a Norwegian CO2 value chain is tied to two main arguments;
• We need as much CO2 as possible for the use on the NCS. • By capturing CO2 from Norwegian emissions we will be able to reduce our climate cost
outlay. Both arguments are based on pure economical assessments, and the assessment of the cost of CO2 capture and storage as pure climate measures is a bonus on top of the economical benefits Norway as a nation will reap by the establishment of a CO2 value chain.
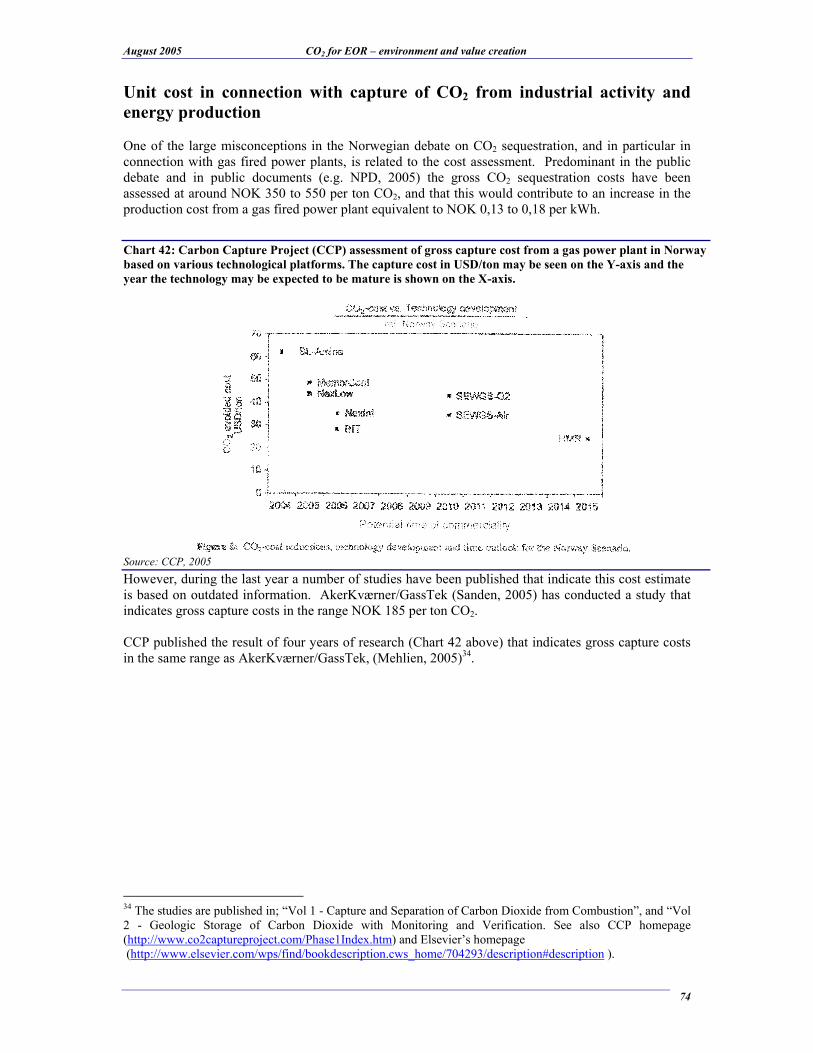
August 2005 CO2 for EOR – environment and value creation
74
Unit cost in connection with capture of CO2 from industrial activity and
energy production One of the large misconceptions in the Norwegian debate on CO2 sequestration, and in particular in connection with gas fired power plants, is related to the cost assessment. Predominant in the public debate and in public documents (e.g. NPD, 2005) the gross CO2 sequestration costs have been assessed at around NOK 350 to 550 per ton CO2, and that this would contribute to an increase in the production cost from a gas fired power plant equivalent to NOK 0,13 to 0,18 per kWh.
However, during the last year a number of studies have been published that indicate this cost estimate is based on outdated information. AkerKværner/GassTek (Sanden, 2005) has conducted a study that indicates gross capture costs in the range NOK 185 per ton CO2. CCP published the result of four years of research (Chart 42 above) that indicates gross capture costs in the same range as AkerKværner/GassTek, (Mehlien, 2005)34.
34 The studies are published in; “Vol 1 - Capture and Separation of Carbon Dioxide from Combustion”, and “Vol 2 - Geologic Storage of Carbon Dioxide with Monitoring and Verification. See also CCP homepage (http://www.co2captureproject.com/Phase1Index.htm) and Elsevier’s homepage (http://www.elsevier.com/wps/find/bookdescription.cws_home/704293/description#description ).
Chart 42: Carbon Capture Project (CCP) assessment of gross capture cost from a gas power plant in Norway
based on various technological platforms. The capture cost in USD/ton may be seen on the Y-axis and the
year the technology may be expected to be mature is shown on the X-axis.
Source: CCP, 2005

August 2005 CO2 for EOR – environment and value creation
75
Based on available public sources regarding costs related to investments and operations of an amine based capture facility for a gas fired power plant, Bellona has through its financial modelling, concluded that a Norwegian based gas fired power plant with CO2 capture will incur a gross capture cost of between NOK 160 to 247 per ton CO2. This is based on a gas price varying from NOK 0,6 to 2,0 per Sm3. However, there is still considerable uncertainty regarding the investment costs of such a Norwegian amine capture facility. This uncertainty is incorporated in the financial calculations and is responsible for uncertainty in costs in the upper range. The long term price prognosis for international emission permits is believed to be relatively steady and will not fall below the marginal gross capture cost of CO2 from coal and gas energy production. The sales price of coal and gas will, however, have an indirect effect through its influence on the energy costs related to CO2 capture (see also chapter 3). In our explanation of the financial model, we base the financial assessments on a long term emission permit price of EUR 20 per ton CO2 and a gross capture cost in Norway based on a gas price of NOK 1,0 per Sm3. This gives a gross capture cost equal to NOK 186 per ton CO2.
Chart 43: Bellona study of unit cost for CO2 capture from a gas power plant–gross capture costs per ton CO2
61
26
32
28
186
40
146
0
50
100
150
200
250
Energikostnader
Kjemikalier
Andre
driftskostander
Investeringskostnad
CO2 fangstkostand
før avkastning
Avkastningskrav
Brutto CO2
fangstkostnad
Gross capture costs per ton CO2 for a gas power plant in NorwayNOK/Ton CO2
Energy costs
Energy costs
Chemicals
Other
operatin
g costs
Depreciatio
n
Capture cost b
ef.
require
d ra
te of
return
Require
d ra
te of
return
Gross capture
costs
Remarks; The calculation above is based on a gas price of NOK 1,0 per standard cubic metres, and a required rate of return on
total assets before tax of 7% (equivalent to a required rate of return non equity before tax of 14% or an equity beta of more than
3, which may be seen as extremely high for power production).
Source: Bellona working paper 2005; ”The Norwegian gas power and CO2 emission fallacy”

August 2005 CO2 for EOR – environment and value creation
76
Establishment of a CO2 capture and distribution chain in Norway Norway has some large stationary CO2 emissions. These are concentrated in industrial areas and the oil and gas activities onshore. Annually the Statoil refinery at Mongstad emits approximately 1,7 million tonnes of CO2, the Kårstø gas processing facility approx. 1,6 million tonnes, Grenland industry about 2 million tonnes, and the Methanol plant at Tjeldbergodden about 0,4 million tonnes. Total emitted CO2 is 5.7 million tonnes from these plants, of which 4.8 million tonnes would be available for EOR assuming an 85% capture efficiency. In addition there are gas fired power plants planned for Tjeldbergodden, Skogn, Mongstad, Kårstø and Grenland, that combined, will produce approximately 10 million tonnes of CO2. The expansion of production at the Methanol plant at Tjeldbergodden will contribute with an additional 0,2 million tonnes. The activity in connection to the Snøhvit project in Hammerfest may contribute with up to 1 million tonnes per year. And finally the Sleipner field produces and stores about 1 million tonnes of CO2 annually. In total there are 17 sources of CO2 that could contribute between 14 and 17 million tonnes of CO2 annually to the NCS. To capture this amount of CO2 five plants must be built along the coast (Skogn, Tjeldbergodden, Mongstad, Kårstø and Grenland) that together should emit a minimum of 16 million tonnes CO2, and average 3,2 million tonnes per plant. Based on our preliminary investment assessment in amine based capture plants the facilities (including CO2 compression) would cost approximately NOK 17 billion
35. In addition to the existing and planned facilities, there is an opportunity to expand the capacity at Tjeldbergodden and Mongstad based on NCS electrification. Norway has significant gas volumes that are currently used for pressure maintenance. By building a very large gas fired power plant in Rogaland for example, it may be possible for Norway to export significant volumes of power to the European power market (reference the current establishment of NorNedLed that is expected to increase the capacity of power transfer between Norway and the Continent by 7 TWh). In our example we have chosen to call this power plant EuropePower.
35 The capture plants have an expected lifetime of 30 years (see also Jakobsen, 2005).
Chart 44: large stationary emissions of CO2 in Norway
Source: Norwegian Geological Survey (NGU)

August 2005 CO2 for EOR – environment and value creation
77
These stationary sources of CO2 capture are tied together in a pipeline network that transports CO2 to intermediate storage in the two main CO2 regions; 1) Norwegian Ocean with the Draugen field as CO2 deposit, and 2) North Sea with the Heimdal field as CO2 deposit. We believe the reservoir at the Heimdal platform is potentially good for storage and reuse. The production from the reservoir has stopped, and at the same time the platform is a hub for Norwegian gas distribution. Consequently this platform will be maintained for many years to come. Only minor incremental costs are required to start CO2 injection into and from this installation. Storage in abandoned reservoirs is very interesting and intuitively should be considered very safe because the structure held oil and gas for millennia. Approximately 20 fields are planned to be shut down during the next 10 years. The largest fields already closed are Frigg, Heimdal and Odin fields. They are all situated in the same area. At Frigg there are uncertainties related to possible future production of the remaining natural gas. This makes it necessary to assess how CO2 will affect any future gas production there. The production at Odin is shut down and the equipment has been removed.
Table 2: Stationary emission of CO2 in Norway connected to a CO2 value chain
Connected stationary CO2 emission sources Gross CO2 emissions
CO2 production with 85% capture
Tonnes Tonnes
CO2 sources for region Norwegian Ocean
Melkøya NGCC 625 000 531 250
Hammerfest Energi NGCC 290 698 247 093
Methanol factory 550 000 467 500
TBO NGCC 2 500 000 2 125 000
Skogn NGCC 2 325 581 1 976 744
Total 5 375 581 4 569 244
CO2 sources for region North Sea
Skagerak Energi NGCC 2 906 977 2 470 930
Borealis 59 000 50 150
Hydro Polymers, Rafnes 100 000 85 000
Noretyl, Rafnes 525 000 446 250
Norcem Kjøpsvik 420 432 357 367
Norcem Brevik 951 971 809 175
Kårstø gas processing facility 1 650 000 1 402 500
Kårstø NGCC 1 250 000 1 062 500
Kollsnes gas facility 56 000 47 600
Mongstad Refinery 1 660 000 1 411 000
Mongstad NGCC 813 953 691 860
Sleipner CO2 production 1 000 000 1 000 000
Total 11 393 333 8 834 333
CO2 production based on existing and planned projects 16 768 915 13 403 577
Wanted additional projects
Increase capacity of TBO NGCC to 2GW 3 313 953 2 816 860
Increase capacity of Mongstad NGCC to 2GW 3 313 953 2 816 860
Building EuropePower NGCC - 5GW 14 534 884 12 354 651
Total additional CO2 21 162 791 17 988 372
Total potential CO2 production to NCS 37 931 705 31 391 950
Potential CO2 production to Draugen CO2 deposit 8 689 535 7 386 105
Potential CO2 production to Heimdal CO2 deposit 29 242 170 24 005 845
Source: SFT, Bellona 2005

August 2005 CO2 for EOR – environment and value creation
78
The Draugen field is regarded as well suited for CO2 for EOR. This reservoir may also function as intermediate storage.
Chart 45: Necessary CO2 infrastructure
Grenland
Skogn
DraugenCO2
Deposit
Melkøya
HeimdalCO2
Deposit
EuropePower
NorNed Led
EuropePower Led
Norwegian CO2
infrastructure
= Gas power plant
= CO2 pipeline
= Power cable

August 2005 CO2 for EOR – environment and value creation
79
The capture facilities deliver CO2 into the CO2 pipeline network. CO2 is received at Draugen and Heimdal for deposit, thereafter the CO2 is recovered and sold to oil and gas fields on the NCS. The one million tonnes of CO2 from the Sleipner field can be sent directly to the Heimdal CO2 deposit instead of being stored in the Utsira formation. Bellona suggests by issuing this report a solution that creates a Norwegian CO2 value chain that will function in a logical manner and satisfy industrial, commercial, legal and environmental concerns. With Norway as a country being the main benefactor for net profitability from the CO2 value chain, the Norwegian State will be charged with taking the initiative by establishing two companies that Bellona has chosen to name;
• NOCO AS – Norwegian CO2 Recycling Ltd
• CPETRO SF - Carbon Petro State Enterprise
NOCO AS – Norwegian CO2 recycling Ltd NOCO AS is to be established as a limited liability company and has as its business model the responsibility to build and operate CO2 capture facilities for industrial activity and energy production facilities. In addition to this the Company will work actively to develop CO2 sequestration technology and secure Intellectual property rights for utilisation in international business ventures. NOCO can also operate CO2 sequestration internationally, even whole CO2 value chains. We suggest that the State takes the initiative to establish the Company and invites private investors to partake in this venture. We believe there will be many interested private investors, both national and international, that would participate in NOCO. Private investors in Norway should be both industrial and energy companies like Statoil, Norsk Hydro, Statkraft and AkerKværner. Foreign companies interested could be technology suppliers like Mitsubishi Heavy Industries and Fluor, as well as international energy companies like Shell and BP. A Norwegian technology supplier like Sargas AS should have a great interest in taking part through delivering technology rights. The business model is based on the following main drivers:
• Establish CO2 production/capture facilities close to CO2 intensive industry and energy production
• On the basis of existing regulations like the Greenhouse Gas Emission Trading Act and the Pollution Control Act, require that adjacent relevant industries connect to NOCO’s capture facilities and purchase capture services.
• The State will through CPETRO (below) purchase CO2 for EOR use on the NCS • NOCO has two sources of revenues:
o Flue gas revenue from industry/energy production through CO2 connection fee o Sale of dried and compressed CO2 delivered into CPETRO’s pipeline and storage
system.
CO2 connection fee
The CO2 connection fee is based on long term contracts between the suppliers of flue gas and NOCO. The fee is to be structured in such a manner that it represents both a long term stable solution for the producers of emission (i.e. industry and gas fired power plants), and the cost will be reasonable for the industry/energy activity.

August 2005 CO2 for EOR – environment and value creation
80
The long term price structure will vary only with changes in the gas price delivered to the plant where the capture facility is located, and is in our preliminary financial modelling set to a price that varies between NOK 12 and 20 per ton CO2 delivered from the capture plant. Changes to the CO2 connection fee varies only based on changes to the gas price between NOK 0,6 and 2 per Sm3. The pricing of the CO2 connection fee is therefore disconnected from any development in the international CO2 emission permit price, and tied only to the operating costs of the NOCO CO2 capture plant. There may be an option where NOCO charges varying CO2 connection fees from different suppliers of flue gas due to variations in the CO2 content in the flue gas. Changes in CO2 content in flue gas will change the cost of CO2 capture, a change that in a commercial market normally would be shared between the supplier and customer. The Norwegian emission permit regulations today grant a 95% free emission permit. The remaining 5% must be bought in a CO2 emission permit market where prices fluctuate. It is also expected that the free emission permit will be reduced36 or eliminated altogether over time and the price for such permits are expected to increase. Through the NOCO price structure CO2 intensive industrial activity and energy production will achieve a much higher predictability for the long term cost of capture than if they would be subject to the uncertainty of emission permit regulations and the price of such permits.
Sale of CO2 to CPETRO
CPETRO has the responsibility to transport as much CO2 as possible to the NCS for storage and onward EOR use. NOCO revenues are received from the sale of dried and compressed CO2 to CPETRO at a price per ton CO2 delivered into the CPETRO pipeline, based on long term contracts
36Gøteborg Energi was given only 40% free emission permit for their gas power plant currently under construction.
Chart 46: NOCO prices per ton CO2 and return on capital based on varying gas price.
12,7 13,3 14,0 14,6 15,2 15,9 16,5 17,2 17,8 18,5 19,1 19,8 20,4 21,1 21,7
0
50
100
150
200
250
300
0,6 0,7 0,8 0,9 1 1,1 1,2 1,3 1,4 1,5 1,6 1,7 1,8 1,9 2
5 %
6 %
7 %
8 %
9 %
10 %
11 %
12 %
CO2 fangstavgift
CO2 salgspris
NOCO IRR (rhs)
Gasspris - NOK per kubikk meter levert
Return on totalassets before tax
NOCO AS - Connection between gas price, CO2 connection fee
sales price CO2 and return on total assets before tax
NOK/ton CO2
CO2 connection fee
CO2 sales price
Gas price - NOK per Sm3
Source: Bellona 2005

August 2005 CO2 for EOR – environment and value creation
81
that take into account the cost of producing CO2. The price of CO2 delivered will be tied to the energy price (the gas price). In our preliminary modelling NOCO sells its CO2 to CPETRO delivered that varies between NOK 157 and 270 per ton, based on changes in the gas price of NOK 0,6 to 2 per Sm3. Chart 46 illustrates the pricing of CO2 connection fee and CO2 delivered to CPETRO as a function of gas price. In addition the chart shows the return on total asset before tax (internal rate of return of the project) for the average NOCO capture facility. The final element that should be mentioned in connection to the operations of NOCO is that the NOCO capture facilities may also capture NOX-connections, SOx or other environmentally damaging substances. Normally there are economies of scale in relation to capture operations, especially with regards to investments. Such measures may contribute to the total capture costs of a geographical area, through the establishment of NOCO, may achieve far more cost optimal solutions than through implementing such measures individually. CPETRO - Carbon Petro State enterprise Bellona suggests that the Norwegian State establish CPETRO (Carbon Petro) as a State enterprise, wholly owned by the Ministry of Oil and Energy, the Ministry of the Environment, or by both. It may also be appropriate to establish CPETRO as a daughter company of Petoro. CPETRO is mainly to be regarded as a long term investment by the Norwegian State and share in tax revenues from the EOR petroleum activity equal to SDFI. CO2 will be delivered to the NCS for EOR activities through pipelines built and owned by CPETRO. This will increase the production of oil and gas, and thereby increase the value of the State’s future tax revenues from the NCS and from the State’s offshore oil and gas assets. CPETRO’s business model:
• Purchase and physically move CO2 for use on the NCS (from NOCO and potentially others). • Own CO2 pipelines and transport to CO2 deposits, Draugen and Heimdal. • Re-sell and transport CO2 to oil and gas fields in the NCS at regulated prices. • In the long term (in 50 to 100 years when the petroleum activity no longer has use for CO2),
CPETRO functions as an environmental mitigation operation. The business is based in part on the cost savings the Norwegian State will achieve by avoiding CO2 emission permits purchases. It is believed that the investments made by the State into CPETRO will be paid back many times over, assuming a normal price trajectory for oil and gas.
CPETRO sells CO2 by two methods; Whip: The Norwegian State may, by having adequate amounts of CO2 available for use on the NCS, and with the mandate of the petroleum Act § 4-1, require the operators/licenses to use the available CO2 for EOR where it is feasible (profitable) to do so. The NPD may, mandated by the Petroleum Act, require that the licences assess the potential for EOR, EGR and CO2/Gas pressure maintenance substitution. This should yield adequate data to start projects.
Carrot: Due to the 78% offshore tax rate and the State’s significant ownership in assets through Petoro/SDFI, Statoil and Norsk Hydro, there exists today an asymmetrical risk in EOR project profitability on the NCS. The “license issue” contributes to accentuate this asymmetry in profitability assessments37. Due to the asset ownership and the tax revenues from increased oil and gas production, the State may let CPETRO use a sliding scale in the pricing of CO2 delivered to the fields based on the
37The ”license issue” is the “issue” that it seems very difficult for the various licenses on the NCS to achieve collaborate strategies on regional solutions due to differences in production strategies, maturity etc.

August 2005 CO2 for EOR – environment and value creation
82
then current oil and gas prices (not unlike the system of norm price taxation), thus reducing the financial risk dramatically for the licenses. The sliding scale pricing of CO2 on the shelf will function in such a manner that the license achieves more than enough financial “room” for most CO2 for EOR/EGR and CO2 gas substitution projects on the Norwegian shelf to be feasible
38. In the next chapter we will return to the dynamics of the sliding scale pricing of CO2 delivered. The revenue and cost model for CPETRO is more complex than for NOCO since CPETRO’s activities include both direct and indirect revenues and costs. This is the primary rationale behind CPETRO being organised as a State enterprise. CPETRO costs
Direct costs: CO2 purchases, transportation and the CO2 deposit operations. Indirect costs: The reduced CO2 levy for the State from the Norwegian shelf due to an increased incentive to implement electrification platforms once CO2 becomes a resource and the gas receives a higher value when brought ashore and used for gas fired power production. CPETRO revenues
Direct revenues are based on the sales of CO2. These will be subject to a regulated commercial based price fixing tied to the market price of oil and gas. In times with very low oil price, the sales revenues per ton CO2 sold will be below the direct costs per tonne, and CPETRO will have an increase in indirect costs. (The indirect revenues become important and will more than cover the operating loss). In the start-up phase CPETRO’s operations will be skewed by the revenue stream vs. the cost of purchasing CO2. (Timing difference between CO2 injection in fields and increased oil/gas production – tax revenue. Lag may be up to two years). Deliveries of CO2 to fields on the shelf will be based on long term contracts with defined price mechanisms tied to oil and gas prices. Such a business model is normal for Norwegian State enterprises. Norway has a number of examples of State enterprises and activities that are presented as costs in the National budget, but contribute to a positive value creation in the social economic accounts of the Country. The best example is the Norwegian health care system. Surveys shows that Norway has among the lowest unit costs of health care in the world due to the use of a public health care system This in contrast to the. USA which has a private health care system that is more costly to operate and where the US population health services may be both unevenly distributed and perhaps inferior. Indirect revenues are related the Norwegian State’s revenues and costs. Indirect revenues 1: increased tax revenues on the NCS, and as increased value creation for the
State’s assets on the NCS In addition to the revenues from sale of CO2, a value accretion from the EOR oil and gas produced from the use of CO2 will be transferred to the State in the form of increased tax revenues on the NCS, and as increased value creation for the State’s assets on the NCS. At current oil prices there will be significant value creation potential by injecting 17 million tonnes of CO2 annually into Norwegian oil fields. Based on a CO2-oil volume-relationship of 2,5 per tonne injected, this is equivalent to EOR oil with a sales value of NOK 18 billion, while CPETRO’s CO2 purchases would cost NOK 3,6 billion at a gas price of NOK 1,4 per Sm3. (More about this later...)
Indirect revenues 2: Reduced emission permit costs due to reduced national CO2 emission. Through the capture and storage of approximately 17 million tonnes of CO2 annually, Norway will reduce the
38 These entails that the licenses may stress the CO2 for EOR/EGR projects on profitability criteria and hurdle rates at USD 18 to 22 per barrel and required rates of return at 12 to 14% and still achieve profitability.

August 2005 CO2 for EOR – environment and value creation
83
need to purchase emission permits in the international market. If we assume an 85% capture rate, Norway will reduce the CO2 emissions in the Kyoto period by 65 million tonnes. This reduced emissions volume from approximately 108 million to 43 million tonnes of CO2 saves Norway emission permit costs of approximately NOK 9,8 billion in the period 2008 through 2012 (from NOK 16,5 billion to NOK 6,7 billion). This reduced emission permit cost will come as a direct consequence of CPETRO’s establishment and should therefore be taken into account when assessing CPETRO income statement. NOCO and CPETRO are investments taken by Norway to increase oil and gas production for the State. They are also set up to benefit the environment. The financial effects of both the direct and indirect costs as well as the direct and indirect revenues (benefits) should be taken into account when assessing the full financial benefit to the Norwegian State by establishing such a CO2 value chain. In actuality, EOR and the environment are one issue with two parts. By addressing both together, the Norwegian environment can be cleaner with a net profit associated with cleanup rather than a social cost for mere carbon capture and storage. Setting up the CO2 value chain accomplishes both tasks.
Chart 47: Changes in Norwegian CO2 emissions as a consequence of establishing NOCO AS and CPETRO
-20
-15
-10
-5
0
5
10
15
20
25
30
2008 2009 2010 2011 2012
-3 000
-2 000
-1 000
0
1 000
2 000
3 000
4 000
Oppr.merutslipp av CO2 Fangst i CO2 verdikjede Ny merutslipp av CO2
Gammel kvotekostand Ny kvotekostnad
NOKmMil.tonnes CO2 Norwegian CO2 emission and permit costs before and after CO2 value chain
Original excess CO2 emissions
Original emission permit cost New emission permit cost
CO2 capture from value chain New excess CO2 emissions
Remarks: By establishing NOCO AS and CPETRO, Norwegian CO2 emission will be reduced by up to 15 million tonnes of CO2
(based on 85% CO2 capture rate). This will reduce Norway’s cost for purchasing emission permits in the international permit
market. Based on an emission permit price of EUR 20 per ton CO2 the savings could be approximately NOK 10 billion in the
period 2008 through 2012.
Source: Bellona 2005

August 2005 CO2 for EOR – environment and value creation
84
Chapter 9: Financial assessment of a CO2 value chain in Norway In this chapter we pull the threads together and present a financial assessment of Bellona’s proposed Norwegian CO2 value chain. We also present some potential industrial and climate results. Before we get into the details, we first state the main conclusion. The figure below shows the overall chain and the costs and revenues related to establishing CO2 value. Chart 48: The CO2 value chain
1) Industry/Gas power
CO2 deposit
2) NOCO AS
3) CPETRO
Oil/Gas production
4) Oil license
CO2 reservoir Oil reservoir Market
Pipeline
CO2 – oil volume balance
15% CO2 emissions
5) Oil and
gas price
CO2 value chain
1) 1,000,000 t
CO2 in flue gas
2) 850,000 t
CO2 captured,
dried &
compressed
2) 150,000 t
CO2 to air
3) 850,000 t
compressed CO2
transported
3) 850,000 t
CO2 stored
4) 850,000 t
CO2 injected
5) 2,125m
barrels oil sold
Baseassumptions
Changes to volume balance
1) No changes
2) % CO2 capture
rate varies 70–95%
influence unit
capture cost
and emissions
+/- in % CO2
capture rate
3) No change3) No
change
4) No
change
5) No.of barrels
per ton CO2
injected varies
from 1 to 8 –
base level set
to 2.5 p.t.
Min: 850,000
bbl
Maks: 6,8m bbl
CO2 value chain revenues and costs in NOK per ton CO2 captured (stored)
1) Net cost
- 15,20 t/CO2
2) Air emission
= 0 cost due to
permit
Base assumptions
Variation in costs and revenues
2) Revenues = 204,3
(15,2 + 189,1)
Op.costs = (130)
Op.profit = 74,7
IRR = 7,6% bef.tax tot.assets
Investmentssuppliers
Op.costEmployees
suppliers
Lisence22% of profit
State78% of profit
Reduced CO2 permit
3) Revenues = 123
Op.costs = (278)
Op.profit/loss = (156)
Oil price = USD 30 bbl
Gas price = NOK 0,98 Sm3
NOK/USD = 6,5
NOK/EUR = 8
Required return on total assets
offshore equal 12% bef.tax
4) Revenues = 561 Op.costs = (304)
Tax (78%) = (200)
Net profit = 57
5) State net revenues and costs
CPETRO = (156)
Offshore tax(78%) = 200
Reduced CO2 permit = 160
Net CO2 revenues = 204
NB! Value creation
0,00
50,00
100,00
150,00
200,00
250,00
1970197219741976197819801982198419861988199019921994199619982000200220042006200820102012201420162018202020222024
Reserver Ressurser i felt Ressurser i funn Uoppdagede ressurser CO2 EOR 5%
Oljeproduksjon på NCS i millioner kubikkmeter olje 1970 - 2024
65
55
45
35
25
15
0
250
500
750
1 000
1 250
1 500
1 750
2 000
2 250
2 500
2 % 3 % 4 % 5 % 6 % 7 % 8 % 9 % 10 % 11 % 12 % 13 % 14 % 15 % 16 %
NOKmrd
% EOR område vurdert av OD
% EOR område basert på operativ erfaring internasjonaltUSD/fat
Salgsverdi i NOKmrd av veske produsert på grunnlag av forskjellig merutvinningsgradsom følge av CO2 injeksjon og med varierende oljepris
Potensialet med dagens oljepris
Gullfaks vurdering
61
26
32
28
186
40
146
0
50
100
150
200
250
Energikostnader
Kjemikalier
Andre
driftskostander
Investeringskostnad
CO2 fangstkostand
før avkastning
Avkastningskrav
Brutto CO2
fangstkostnad
Brutto fangstkostnader per tonn CO2 for et gasskraftverk i NorgeNOK/Tonn CO2
-20
-15
-10
-5
0
5
10
15
20
25
30
2008 2009 2010 2011 2012
-3 000
-2 000
-1 000
0
1 000
2 000
3 000
4 000
Oppr.merutslipp av CO2 Fangst i CO2 verdikjede Ny merutslipp av CO2
Gammel kvotekostand Ny kvotekostnad
NOK mrdMil.tonn CO2 Norske CO2 utslipp og kvotekostnader før og etter CO2 verdikjede etablering
-6 000
-4 000
-2 000
0
2 000
4 000
6 000
8 000
10 000
12 000
14 000
18 22 26 30 34 38 42 46 50 54 58 62 66 70
Statens sparte CO2 kvote kostnader
Statens skatteinntekter fra EOR
CPETRO driftsresultat
Netto resultat for Staten ved CO2 verdikjede
NOKmrd Statens årlige inntekter i 40 år som følge av etablering av CO2 verdikjede som funksjonav varierende oljepris
Oljepris - USD/bbl
Basis forutsetning
NOK 3,5mrd årlig
12,7 13,3 14,0 14,6 15,2 15,9 16,5 17,2 17,8 18,5 19,1 19,8 20,4 21,1 21,7
0
50
100
150
200
250
300
0,6 0,7 0,8 0,9 1 1,1 1,2 1,3 1,4 1,5 1,6 1,7 1,8 1,9 2
5 %
6 %
7 %
8 %
9 %
10 %
11 %
12 %
CO2 fangstavgift
CO2 salgspris
NOCO IRR (rhs)
Gasspris - NOK per kubikk meter levert
Avkastning påtotalkapitalen f.skatt
NOCO AS - Sammenheng mellom gasspris, CO2 renseavgift, salgspris CO2og avkastning på totalkapitalen før skatt
NOK/tonn CO2
0
10
20
30
40
50
60
70
1992 1993 1994 1995 1996 1997 1998 1999 2000 2001 2002 2003 2004
Alle oljefelt Ekofisk, Statfjord, Oseberg og Gullfaks Øvrige oljefelt
%-vis utvinningsgrad av totale oljeressurser på Norsk sokkel
46%
Målsetning NCS på 50%
271
9621
334221320
5449510109
377
0
100
200
300
400
500
600
Salgsverdi av EOR
olje
Sparte CO2 kvote
kostnader
Betalt CO2 renseavgift
fra industrien
Brutto verdiskapning
Investeringer Offshore
Investeringer CPETRO
Investeringer NOCO
AS
Til fordeling
NOCO
Lisenser (eks. statens)
Leverandører og
ansatte
Verdiskap
ning til
staten (ink.CPETRO)
NOKmrd Fordeling av CO2-kjede verdiskapning - skapt av økt oljeutvinning og sparte CO2 kvoter over 40 år
Operating costs CO2 capture
Variation in recovery
Changes to the oil price
Value creation and reduction
of risk

August 2005 CO2 for EOR – environment and value creation
85
By establishing NOCO AS and CPETRO, while investing approximately NOK 86 billion during a 40 year period, Norway will be able to capture 680 million tonnes of CO2 from industrial activity on the Norwegian mainland (17 million tonnes annually from CO2 intensive industry and gas power plants). The combined cost for the industry will be NOK 9,7 billion. This is equivalent to NOK 14,2 per ton39 CO2. Without this value chain the CO2 would continue to be emitted into the atmosphere. The investment made by the State in CPETRO amounts to NOK 20 billion over a two year period, mainly in the physical transportation and NCS storage infrastructure for CO2. NOCO AS invests approximately NOK 13 billion, however, we suggest most of this be financed privately. As main assumptions for our calculations, 8 fields use CO2 for EOR. This costs approximately NOK 6,9 billion per field over an initial four year period, funded by the investments of the license owners. By using the captured CO2 to increase the recovery rate on the NCS , and based on conservative assumptions, our model creates gross values of NOK 495 billion based on a long term oil price of USD 30 per barrel. (Based on the current oil price (USD 65 per barrel) the gross value creation would increase to approximately NOK 930 billion!). NOK 377 billion is the result of increased oil sales from enhanced oil recovery due to CO2, and NOK 109 billion is saved costs associated with avoided CO2 emission permits40. In total, with the industry’s contribution, the result is NOK 495 billion by capturing 680 million tonnes of CO2 from the atmosphere. This represents a gross value creation of NOK 727 per ton CO2.
39 Equivalent to the CO2 connection fee industry and gas power plants must pay to NOCO AS. 40 This assumes an oil price of USD 30 per barrel (currently at USD 65), and a long term international emission permit cost of EUR 20 (NOK 160).
Chart 49: Distribution of the value creation by establishing a CO2 value chain operating for 40 years.
271
9621
334221320
5449510109
377
0
100
200
300
400
500
600
Salgsverdi av EOR
olje
Sparte CO2 kvote
kostnader
Betalt CO2 renseavgift
fra industrien
Brutto verdiskapning
Investeringer Offshore
Investeringer CPETRO
Investeringer NOCO
AS
Til fordeling
NOCO
Lisenser (eks. statens)
Leverandører og
ansatte
Verdiskapning til
staten (ink.CPETRO)
NOKbnDistribution of the CO2 chain value creation made from enhanced oil recovery and reduced
CO2 emission permits over 40 years
Sales value of EOR oil
Reduced emission
perm
it costs
CO2 connection fee
from industry
Gross valeu creation
Offshore
investm
ents
CPETRO
investm
ents
NOCO investm
ents
Value for distribution
License owners
Employees and
suppliers
Value creation of the
State incl. CPETRO
Source: Bellona 2005

August 2005 CO2 for EOR – environment and value creation
86
The State will be the largest recipient of the value creation (approximately 56% directly as shown in chart 49, indirectly as much as 70 – 75%). This is the main argument whereby the State must take the initiative and lead in the implementation of the Norwegian CO2 value chain. In the case where the value creation assessment is based on current oil prices the State will receive 90% of this value creation, equivalent to approximately NOK 760 billion. The main corner stone in this value creation is that it is possible to produce more oil from Norway’s oil resource by using CO2. Our main challenge is to get as much CO2 to the NCS as possible. A second cornerstone is that with the plans for increasing our domestic gas fired power and the other industrial plans, Norway has NO CHANCE to achieve its Kyoto obligations through domestic emission reductions. Norway will have to pay for its increases and it will cost more money into the foreseeable future to emit increasing volumes of CO2. We have no other way reduce these costs than to capture CO2 from industrial activity and power production. Norway must reduce the CO2 emission on the NCS. Establishing the Norwegian CO2 value chain is the key.
From our financial analysis, establishing the Norwegian value chain would yield significant net revenues rather than net long term costs, even at oil prices as low as USD 15 per barrel. As Chart 50 shows, Norway will, on an annual basis, when the amount of CO2 used for EOR equals the amount captured, earn money on each ton of CO2 captured. The alternative is to purchase emission permits with a cost of NOK 160 to 190 per ton in the international market. In other words the State of Norway gains a positive economic result from CO2 for EOR at oil prices of USD 18 per barrel. Even though the operating result or CPETRO is negative at this oil value, and this is not balanced by increased tax revenues alone, the project is in positive territory if the international CO2 permit price is EUR 20. (Note this is a conservative result: The State’s revenues from licenses through SDFI are not included in the State’s revenues in this assessment). Our analysis shows that the argument frequently used in the Norwegian debate: “It is cheaper to buy
emission permits abroad than conducting own measures”, is false.
Chart 50: State net revenues as a function of oil price by the establishment of a CO2 value chain with EOR
State total net direct revenues per tonne CO2 captured
38
93
149
204
262
318
375
432
489
545
602
658
715
764
0
100
200
300
400
500
600
700
800
900
18 22 26 30 34 38 42 46 50 54 58 62 66 70
Oil price - USD/bbl
NOK per tonne CO2 captured
Main assumption
NOK 204 per tonne
CO 2 captured
Source: Bellona 2005

August 2005 CO2 for EOR – environment and value creation
87
Chart 51: State net revenues by the establishment of a CO2 value chain per ton CO2 captured
-122
-67
-11
44
102
158
215
272
329
385
442
498
555604
-300
-200
-100
0
100
200
300
400
500
600
700
800
18 22 26 30 34 38 42 46 50 54 58 62 66 70
Netto skatteinntekter Staten per tonn CO2 deponert
Netto kostnad CPETRO per tonn CO2 deponert
Sparte CO2 kvotekostnader per tonn CO2
CO2 tiltaksinntekt/kostnad per tonn CO2 fanget
NOK/ton CO2 captured
Oil price - USD/bbl
Corresponds to a CO 2 permit price of EUR 20
State net revenues by establishing a CO2 value chain per ton CO2 captured
State revenues/cost per ton CO2 captured
Saved CO2 permit costs per ton CO2
Net cost CPETRO per ton CO2 stored
Net State tax revenues per ton CO2 stored
Source: Bellona 2005
Chart 52: State annual revenues from the establishment of a CO2 value chain with varying oil price
-6 000
-4 000
-2 000
0
2 000
4 000
6 000
8 000
10 000
12 000
14 000
18 22 26 30 34 38 42 46 50 54 58 62 66 70
Statens sparte CO2-kvote kostnader
Statens skatteinntekter fra EOR
CPETRO driftsresultat
Netto resultat for Staten ved CO2-verdikjede
NOKm State annual net direct revenues in 40 years due to the establishment of a CO2-value chain
as a function of oil price
Oil price - USD/bbl
Main assumption
NOK 3,5bn annually
State avoided CO2 permit costs
State tax revenues from EOR oil
CPETRO operating result
State direct net revenues from CO2 value chain
Source: Bellona 2005

August 2005 CO2 for EOR – environment and value creation
88
Chart 52 shows the State’s annual net revenues as a function of oil price due to the establishment of a CO2 value chain in Norway. The revenue represents the normalised annual revenue the State receives every year for 40 years according to our financial model.
Assumptions for the financial assessments
Resource technical assessments We have chosen the following assumption for the CO2 for EOR project assessments:
• CO2-oil volume-relationship of 2,5 barrels per ton CO2 injected • 15% recycling rate for the injected CO2
Our study has generalised and has not been made specific assumptions regarding the percent-recovery rate from an individual field due to the fact that only 17 million tonnes of CO2 are available. We assume that 8 fields use the CO2 for EOR use. This is equal to each field using an average of 4,25 million tonnes of fresh CO2 each year over a 20 year period.
As the chart shows, the Ekofisk and Eldfisk fields alone could store 17 million tonnes of CO2 annually for 25 years based on the same conservative recovery rate as the Miller field. We know that Gullfaks could use a minimum of 5 million tonnes per year with a higher expected CO2-oil volume-relationship than 2,5 barrels per tonne CO2 injected. Assumptions for the investment assessments We have calculated total investments over a 40 year period to be NOK 86 billion. We assume that most of these investments are made in the beginning of the period. As the chart below shows only NOK 13 billion in investments will remain to be made on the shelf after 2009.
Chart 53: Annual need for CO2 on oil fields on the Norwegian shelf
0
2
4
6
8
10
12
14
16
Region 1 - Sørlig Nordsjø
Ekofisk
Eldfisk
Valhall
Ula
Gyda
Region 2 - Troll/oseberg
Oseberg S
Brage
Oseber Ø
Veslefrikk
Regions 3 - Tampen
Snorre
Gullfaks
Gullfaks S
Vigdis
Tordis
Statfjord N
Sygna
Region 4 - Norskehavet
Heidrun
Draugen
Norne
Ikke inkluderte områder
Troll
Oseberg
Statfjord
Balder
Grane
Visund
Njord
Tor
Alvheim
Fram
Hod
Jotun
Embla
Yme
Varg
Kvitebjørn
Tune
Statfjord Ø
Tambar
Frøy
Glitne
Murchinson
Million tonnes CO2Annual need for fresh CO2 for EOR over 25 years of EOR operations
Source: Bellona 2005

August 2005 CO2 for EOR – environment and value creation
89
The investments made by NOCO AS are not included in the chart showing investments in the petroleum industry. We assume that NOCO only invests in phase 1A since our financial modelling does not assume any expansion of Tjeldbergodden, Mongstad, or the building of EuropePower. Phase IB is for illustrative purposes only, showing the increased CO2 that would be available and that Norway could be self sufficient in CO2 for EOR.
Chart 54: Annual investments on the NCS 1985 - 2009
0
10
20
30
40
50
60
70
80
90
1985
1986
1987
1988
1989
1990
1991
1992
1993
1994
1995
1996
1997
1998
1999
2000
2001
2002
2003
2004
2005
2006
2007
2008
2009
Totalt 1985 - 1995
CO2 EOR
CPETRO
Rør og landanlegg
Innretninger
Modifikasjoner
Brønner
NOKbn Investments in Norwegian petroleum industry
Investments in establishing a CO 2 value chain Total 1985 - 1995
CO 2 for EOR
Pipelines
and onshore
Installations
Modifications
Wells
Source: Bellona 2005
Table 3: Investments for NOCO AS
Investments - NOCO Total CO2 capacity
NOKm tonnes
CO2 capture facilities
Phase 1ANOCO Skogn 1 892 2 500 000
NOCO Tjeldbergodden 2 346 3 100 000
NOCO Mongstad 1 892 2 500 000
NOCO Kårstø 2 270 3 000 000
NOCO Grenland 3 784 5 000 000
Working capital 500
Investments phase 1A 12 684 16 100 000
Phase 1BNOCO EuropePower 11 352 15 000 000
NOCO Tjeldbergodden expansion 1 2 270 3 000 000
NOCO Mongstad expansion 1 2 573 3 400 000
Working capital 700
Investments phase 1B 16 896 21 400 000
Total investments NOCO phase 1A & 1B 29 580 Source: Bellona 2005
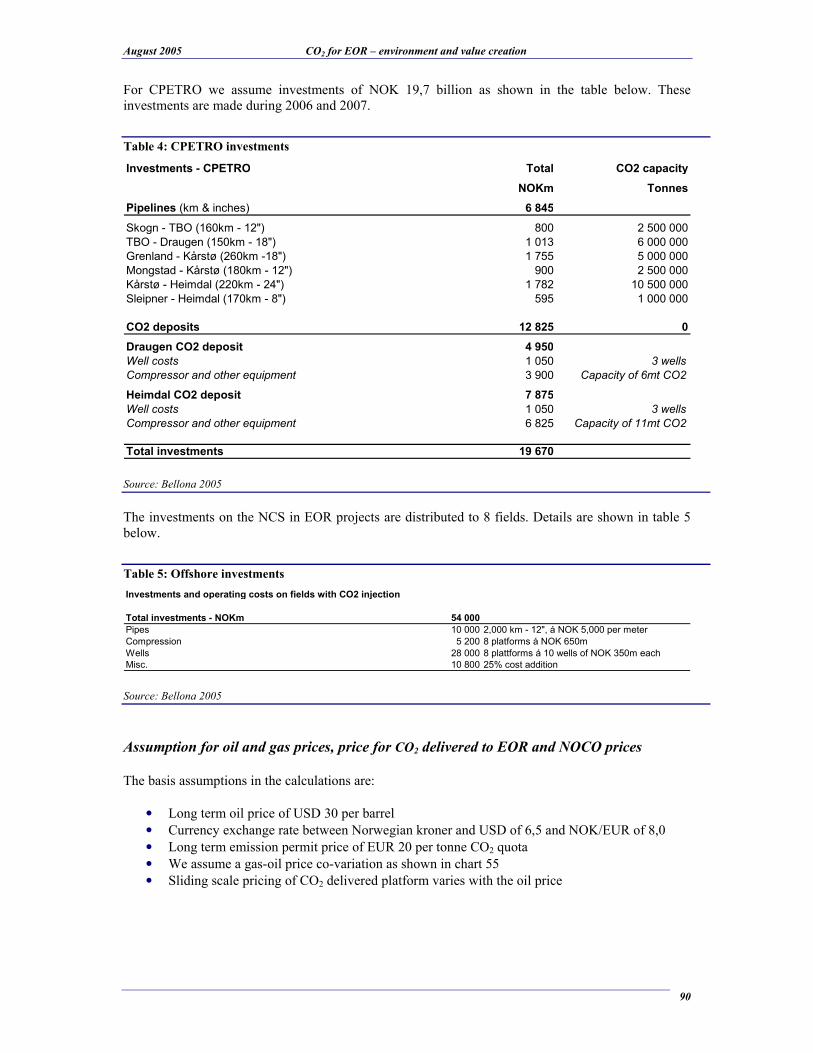
August 2005 CO2 for EOR – environment and value creation
90
For CPETRO we assume investments of NOK 19,7 billion as shown in the table below. These investments are made during 2006 and 2007.
The investments on the NCS in EOR projects are distributed to 8 fields. Details are shown in table 5 below.
Assumption for oil and gas prices, price for CO2 delivered to EOR and NOCO prices
The basis assumptions in the calculations are:
• Long term oil price of USD 30 per barrel • Currency exchange rate between Norwegian kroner and USD of 6,5 and NOK/EUR of 8,0 • Long term emission permit price of EUR 20 per tonne CO2 quota • We assume a gas-oil price co-variation as shown in chart 55 • Sliding scale pricing of CO2 delivered platform varies with the oil price
Table 4: CPETRO investments
Investments - CPETRO Total CO2 capacity
NOKm Tonnes
Pipelines (km & inches) 6 845
Skogn - TBO (160km - 12") 800 2 500 000
TBO - Draugen (150km - 18") 1 013 6 000 000
Grenland - Kårstø (260km -18") 1 755 5 000 000
Mongstad - Kårstø (180km - 12") 900 2 500 000
Kårstø - Heimdal (220km - 24") 1 782 10 500 000
Sleipner - Heimdal (170km - 8") 595 1 000 000
CO2 deposits 12 825 0
Draugen CO2 deposit 4 950Well costs 1 050 3 wells
Compressor and other equipment 3 900 Capacity of 6mt CO2
Heimdal CO2 deposit 7 875Well costs 1 050 3 wells
Compressor and other equipment 6 825 Capacity of 11mt CO2
Total investments 19 670 Source: Bellona 2005
Table 5: Offshore investments
Investments and operating costs on fields with CO2 injection
Total investments - NOKm 54 000Pipes 10 000 2,000 km - 12", á NOK 5,000 per meter
Compression 5 200 8 platforms á NOK 650m
Wells 28 000 8 plattforms á 10 wells of NOK 350m each
Misc. 10 800 25% cost addition Source: Bellona 2005

August 2005 CO2 for EOR – environment and value creation
91
NOCO adjust prices to achieve a required 7% rate of return before tax on the total assets. Changes to the NOCO prices follows changes in energy costs (gas prices).
Chart 55: gas price-oil price co-variation
Gas price and oil price correlation
0,981,08
1,19
1,3
1,41
1,51
1,62
1,74
1,85
1,96
2,07
0,86
0,61
0,73
0,00
0,25
0,50
0,75
1,00
1,25
1,50
1,75
2,00
2,25
18 22 26 30 34 38 42 46 50 54 58 62 66 70
Base for calculations
Gas price - NOK/sm3
Oil price - USD/bbl
Source: Bellona 2005
Chart 56: NOCO CO2 connection fee and sales price CO2
12,7 13,3 14,0 14,6 15,2 15,9 16,5 17,2 17,8 18,5 19,1 19,8 20,4 21,1 21,7
0
50
100
150
200
250
300
0,6 0,7 0,8 0,9 1 1,1 1,2 1,3 1,4 1,5 1,6 1,7 1,8 1,9 2
5 %
6 %
7 %
8 %
9 %
10 %
11 %
12 %
CO2 fangstavgift
CO2 salgspris
NOCO IRR (rhs)
Gasspris - NOK per kubikk meter levert
Return on totalassets before tax
NOCO AS - Connection between gas price, CO2 connection fee
sales price CO2 and return on total assets before tax
NOK/ton CO2
CO2 connection fee
CO2 sales price
Gas price - NOK per Sm3
Source: Bellona 2005

August 2005 CO2 for EOR – environment and value creation
92
CPETRO is paid for the delivered CO2 according to a sliding scale. This is done to reduce the asymmetrical risk as discussed in chapter 8. The sliding scale used here is progressive in the favour of the State when oil prices rise. The licenses achieve adequate return on capital.
The licensee’s profitability increases dramatically if the licensee is able recover more than 2,5 barrels per ton CO2 injected. Most importantly, even at oil prices at USD 18 the licensee will achieve a 12% return on capital before tax, even with our model using investment and operating cost assumptions that are 30% above the NCS current average level! Assumption regarding the operating costs for a field in CO2 for EOR operation
Chart 57: CPETRO sliding scale pricing of CO2 delivered
Sliding scale pricing of CO2 for EOR from CPETRO in NOK per tonne CO2
0
50
100
150
200
250
300
350
400
450
500
18 22 26 30 34 38 42 46 50 54 58 62 66 70
NOK/tonne CO2 delivered
Oil price - USD/bbl
Base for case study
Source: Bellona 2005
Table 6: operating costs for an oil field in CO2 for EOR operation per barrel and per ton CO2 purchased
Total operating cost per ton CO2 purchased 304 NOK/t CO2
CO2 operating costs per ton CO2 purchased injected 217 NOK/t CO2
Purchase of CO2 123 NOK/t CO2
CO2 operations 25 NOK/t CO2
Depreciation CO2 70 NOK/t CO2
Unit cost other operations (excl. CO2 costs) 86 NOK/t CO2
Total operating cost per barrel 106 NOK/bbl
CO2 operating cost per barrel 76 NOK/bbl
Purchase of CO2 per barrel 43 NOK/bbl
CO2 operating cost per barrel 9 NOK/bbl
Depreciation CO2 per barrel 24 NOK/bbl
Unit cost other operations (excl. CO2 costs) per barrel 30 NOK/bbl
Source: Bellona 2005

August 2005 CO2 for EOR – environment and value creation
93
Furthermore, we have assumed operating costs for an EOR project as shown in Table 6. Operating costs vary only in the CO2 purchase price by using sliding scale pricing. With total operating costs equal to NOK 106 per barrel, including CO2 purchases, the costs are 4 times higher than the average for the NCS.
According to Kinder Morgan, in its experience with operating CO2 floods, the additional costs, excluding CO2 purchase costs, is approximately NOK 12 to 20 per barrel
41. We have based the calculation on NOK 31 per barrel. The sliding scale pricing of the CO2 makes it possible for the license to operate profitably even at low oil prices. The direct operating result for CPETRO will be negative at oil prices below USD 50 per barrel, but the indirect revenues generated will more than compensate for this shortfall. This is the primary reason why CPETRO should be run as a State enterprise and be an item on the National budget.
41 Kinder Morgan, operating 2 fields inform about these experience numbers on their homepage http://www.kindermorgan.com/business/co2/
Chart 58: P&L for an oil field operated with CO2 for EOR based on the sliding scale pricing model
-300
-200
-100
0
100
200
300
400
500
18 22 26 30 34 38 42 46 50 54 58 62 66 70
Unit cost other operations (excl. CO2 costs) per barrel
Depreciation CO2 per barrel
CO2 operating cost per barrel
Purchase of CO2 per barrel
Salgsverdi olje per fat
Resultat etter skatt per tonn CO2 kjøpt for lisens
NOK/tonne CO2 purchased P&L for oil license per tonne CO2 purchased at various oil price
Oil price - USD/bbl
Unit cost other operation (excluding CO2 costs) per barrel
Depreciation CO2 investments of license
Operating costs CO2
Purchase price CO2
Sales value of oil per tonne CO2 purchased
License operating net profit per tonne CO2 purchased
Source: Bellona 2005

August 2005 CO2 for EOR – environment and value creation
94
The significance of establishing a CO2 value chain for Norwegian power
production and the possibility of electrification on the NCS The establishment of a Norwegian CO2 value chain increases the opportunity for domestic use of natural gas in Norway. Natural gas can be used for gas fired power production built on the mainland, and the incremental power production can be used to both electrify the NCS and uplift the value of Norway’s natural gas resource by transforming natural gas sales into Norwegian generated electricity for European export power exports. All of this is based on the establishment of a CO2 value chain. If Norway expands the NGCC plants at Tjeldbergodden, Mongstad and builds large NGCC plants for export to Europe and NCS electrification, this allows Norway to increase its power supply and helps Norway achieve its climate obligations.
Table 7: P&L for CPETRO and the State at different stages of CPETRO’s operations
P&L - CPETRO Year 1 Year 5 Year 10
CO2 purchased from NOCO 17 000 000 17 000 000 17 000 000
Direct revenuesCO2 sales revenues 0 2 083 2 450
CO2 sales price per ton delivered platform 123 123 123
Sale of CO2 (mtonnes 0 17 20
Gross CO2 costs -4 246 -4 246 -4 246Purchase of CO2 -3 187 -3 187 -3 187
Transport of CO2 -141 -141 -141
Intermediate storage of CO2 -918 -918 -918
Re-sale of CO2 0 -50 -59
Direct EBITDA -4 246 -2 164 -1 796
Depreciation of pipelines and equipment -492 -492 -492
Capitalisation of stored CO2 797 0 -120
Operating profit -3 941 -2 655 -2 288
Net cash flow per ton CO2 stored -250 -127 -106Operating result per ton CO2 stored -232 -156 -135
Indirect revenues 2 720 6 128 6 729
Revenues from CO2 for EOR/EGR 0 3 408 4 009Increased tax revenues (oil price of USD 30) 0 3 408 4 009
Increased after tax value of State assets
Reduced CO2 emission permit costs 2 720 2 720 2 720
State net-result from CPETRO -1 221 3 472 4 441
State net cash flow from CPETRO -1 526 3 964 4 933
State net cost/revenue before CO2 quota -3 941 752 1 721State net cost/revenue before CO2 quota per ton CO2 -232 44 101
State differential cost per ton CO2 captured -72 204 261State differential cash flow per ton CO2 captured -90 233 290
Source: Bellona 2005
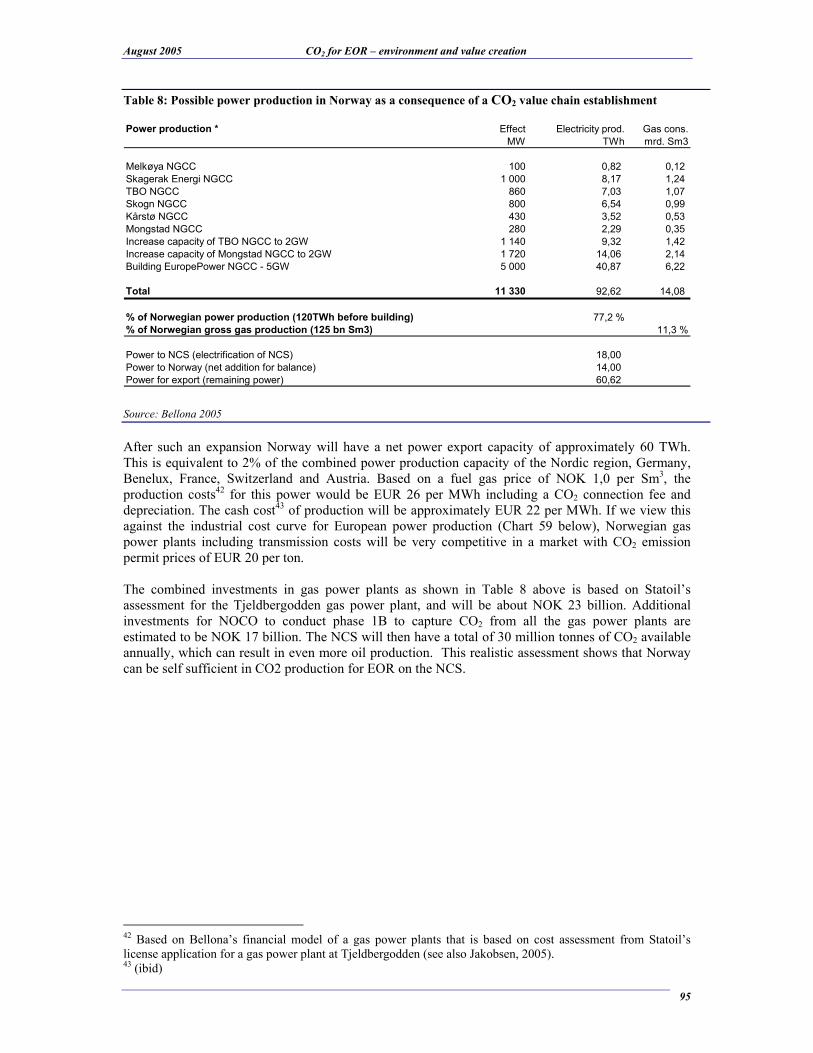
August 2005 CO2 for EOR – environment and value creation
95
After such an expansion Norway will have a net power export capacity of approximately 60 TWh. This is equivalent to 2% of the combined power production capacity of the Nordic region, Germany, Benelux, France, Switzerland and Austria. Based on a fuel gas price of NOK 1,0 per Sm3, the production costs42 for this power would be EUR 26 per MWh including a CO2 connection fee and depreciation. The cash cost43 of production will be approximately EUR 22 per MWh. If we view this against the industrial cost curve for European power production (Chart 59 below), Norwegian gas power plants including transmission costs will be very competitive in a market with CO2 emission permit prices of EUR 20 per ton. The combined investments in gas power plants as shown in Table 8 above is based on Statoil’s assessment for the Tjeldbergodden gas power plant, and will be about NOK 23 billion. Additional investments for NOCO to conduct phase 1B to capture CO2 from all the gas power plants are estimated to be NOK 17 billion. The NCS will then have a total of 30 million tonnes of CO2 available annually, which can result in even more oil production. This realistic assessment shows that Norway can be self sufficient in CO2 production for EOR on the NCS.
42 Based on Bellona’s financial model of a gas power plants that is based on cost assessment from Statoil’s license application for a gas power plant at Tjeldbergodden (see also Jakobsen, 2005). 43 (ibid)
Table 8: Possible power production in Norway as a consequence of a CO2 value chain establishment
Power production * Effect Electricity prod. Gas cons.
MW TWh mrd. Sm3
Melkøya NGCC 100 0,82 0,12
Skagerak Energi NGCC 1 000 8,17 1,24
TBO NGCC 860 7,03 1,07
Skogn NGCC 800 6,54 0,99
Kårstø NGCC 430 3,52 0,53
Mongstad NGCC 280 2,29 0,35
Increase capacity of TBO NGCC to 2GW 1 140 9,32 1,42
Increase capacity of Mongstad NGCC to 2GW 1 720 14,06 2,14
Building EuropePower NGCC - 5GW 5 000 40,87 6,22
Total 11 330 92,62 14,08
% of Norwegian power production (120TWh before building) 77,2 %
% of Norwegian gross gas production (125 bn Sm3) 11,3 %
Power to NCS (electrification of NCS) 18,00
Power to Norway (net addition for balance) 14,00
Power for export (remaining power) 60,62
Source: Bellona 2005

August 2005 CO2 for EOR – environment and value creation
96
Norwegian climate goals and their achievement As can be seen in Table 8 above, the offshore need for power can be supplied from land if all the proposed projects are built. A large part of the CO2 emissions offshore, approximately 12 to 14 million tonnes per year, stem from the direct drive compressors, power turbine production and combustion engines on the platforms. The production from these turbines also covers the need for heating that through electrification may be solved through the use of gas. However, this need is insignificant for the emission compared to today’s level. Norway can achieve its Kyoto obligations through domestic offshore emissions reductions through the use of onshore power plants CO2 capture. (See chart 60 below).
Chart 59: Industrial cost curve for power production in Europe
= Cost addition when CO2 quota
equals € 20 per tonnes
* Countries: France, Benelux, Germany, Switzerland, Austria and the Nordic countries
127 136 236 312 334 359 389 440 461
GTOilGas
steam
CC-
GT
Lig-
niteCoalNuclearWindHydro~3
~6
~15~19
~39
~21
~26
~34
~46
~37
~85
~100
63-88
46-71
33
41
Current full cost of new CCGT (McKinsey assessment)
Full cost CCGT 20 € /ton CO2-cost (McKinsey assessment)
GW capacity
~36
0
20
40
60
80
100
0 100 200 300 400
Demand fluctuating hour by hour
through this range
Power generation costs €/MWh
Total cash costs for power generation in western central Europe*
Full cost CCGT at NOK 1,0 sm3 gas price (VEJ ass.)22
28Full cost CCGT with 85% CO2 capture (VEJ ass.)
Remarks: Europe is in this case Germany, France, the Nordic region, Benelux, Switzerland and Austria
Source: McKinsey,2003 and Bellona 2005

August 2005 CO2 for EOR – environment and value creation
97
Chart 60: Norwegian CO2 emission as a consequence of the establishment of a CO2 value chain and
electrification of the Norwegian shelf
0
10
20
30
40
50
60
70
80
90
1987198819891990199119921993199419951996199719981999200020012002200320042005200620072008200920102011201220132014201520162017201820192020
Nåværende prognoseNorges samlede utslipp av klimagasserUtslipp med CO2 og elektrifiseringUtslipp med CO2-verdikjedeKyotoforpliktelse
Million tonnes CO2 Norwegian emission of greenhouse gases in CO2 equivalents
Kyoto period
Kyoto obligation
Emissions with a CO2 value chain
Emissions with a CO2 value chain and electrificationNorwegian CO2 emissions
Current CO2 emission prognosis
Source: Bellona 2005

August 2005 CO2 for EOR – environment and value creation
98
Chapter 10: Recommendations for further work Bellona wishes to further the work begun here with detailed modification, calculations, and studies of how best to ultimately construct the CO2 value chain. We welcome all comments, suggestions and constructive criticism during the course of this report’s review. A revised version will be issued that will reflect further study and include modifications as warranted. This is necessarily a collaborative effort between all Norwegian interested parties. In addition Bellona has the following recommendations for further work: - Even though Bellona does not see any direct conflict between the proposals in this report and
governmental rules for support under the EEA agreement, this issue should be examined further and in detail. The measures should be notified to ESA and Norwegian authorities must enter into a dialogue with ESA regarding the establishment of the companies proposed.
- Gassco is to negotiate the natural gas pipelines to Grenland and to Trøndelag. Bellona
recommends that the authorities immediately give Gassco the additional mandate to include CO2-return pipelines negotiations as well.
- Bellona recommends that detailed project appraisal for the proposed measures in this report start
immediately, and that proposal to the Odelsting regarding the Law of establishing CPETRO SF be prepared.
- In any further project appraisal of the value chain infrastructure, Bellona wish to contribute
detailed cost estimates from detailed equipment lists for all elements in the CO2 value chain. Bellona requests that these details be made available for our review.
- Bellona recommends that the business model used in this report be further expanded in scope and
in detail. - Intermediate CO2 storage facilities are a pivotal part of the CO2 infrastructure. Such deposits make
the system flexible and robust between competing party CO2 supply and demand needs. The Heimdal reservoir is presented as a suitable reservoir. There are undoubtedly others. The production has ended and the platform infrastructure will be in place for many years. During Bellona’s research for this report there has been little information available regarding the operations of such intermediate storage facilities. Such information should be made available for the further project appraisal of the infrastructure. Intermediate storage onshore should also be evaluated. The best and least expensive method for intermediate storage requirements can be found.
- A Norwegian CO2 aggregation and NCS field distribution plan formed that gives a sequential
timeline when different fields may need CO2. The plan should include CO2 for EOR, EGR and pressure maintenance (gas- CO2 substitution). As EGR is more theoretical (few, if any EGR projects exist), an estimate for the EGR potential is needed. At the same time the authorities should use the Petroleum Act § 4-1 to require the licences to map the possible use of CO2 for EOR, EGR and gas-CO2 substitution.
- The process of capturing CO2 will affect the emissions and capture potential for NOX, SO2 and
other VOCs. The opportunity to reduce these emissions in parallel with CO2 should be included in any CO2 capture project appraisal and the economic value added to NOCO and SPETRO’s income assessment.
- A CO2 infrastructure makes NCS electrification based on fossil fuel possible. NCS electrification
can significantly reduce Norway’s greenhouse gas emissions and building onshore power plants to

August 2005 CO2 for EOR – environment and value creation
99
generate this electricity can produce enough CO2 for Norway to be self sufficient in CO2 for EOR use. Electrification may either be done through power cables from land or produced offshore. The power produced offshore today is both more expensive and more polluting than onshore production. On this basis Bellona believes that it should be possible to establish value chains and measures for NCS electrification. Other relevant partial studies in connection to electrification is:
- Assessment of CUT vs. electrification with regards to emissions of NOX, sulphur dioxide and VOC in addition to CO2
- Use of floating power production on the NCS - Re-use of installations for power production from e.g. high temperature fuel cells or other
compact technologies - Cost assessment to replace direct drive compressors with electric generators. This is the
most costly piece left offshore as an inhibitor to electrification by onshore to offshore cables.
- For NOCO AS and CPETRO SF there are great business opportunities abroad. NOCO AS may be
able to license technology and/or build-own-operate capture assets in other countries. CPETRO SF may purchase CO2 from foreign sources and deliver to users in other areas like the UK shelf. This should be included in the phase 2 development of these companies. However, an immediate dialogue should be opened with Gøteborg Energi to handle the flue gas from their gas power plant under construction that has only received 40% emission permits, and coal power producers in Denmark that may be able to deliver CO2 to the Ekofisk area.
- It must be clarified who has the responsibility in Norway for emission permit purchases. - Study how to establish a Norwegian carbon fund and how it can be tied to the offshore CO2 levy. - Study mapping of the State’s indirect revenues in conjunction with a CO2 infrastructure. i.e. the
value of postponed decommissioning costs of offshore installations, employment effects etc. - A general assessment of the significance a CO2 infrastructure may have for the offshore supply
industry, especially regarding the international market potential for improving and selling this technology
- Solutions for power production and CO2 capture from smaller electricity generators in connection
with industrial activity should be evaluated. - When using CO2 for EOR, alternating CO2 and water injection is often used. An examination of
produced water instead of ordinary water should be reviewed. - CO2 sequestration in connection with power and hydrogen production from biomass is an
interesting source of CO2. Framework for these concepts is, however, unclear and should be examined.
- This report identifies the production of hydrogen and Methagen as potential large CO2 sources. It
is necessary to look more closely at the connection between CO2 and H2/Methagen infrastructure and identify value chains and business models and measures to validate these concepts.

August 2005 CO2 for EOR – environment and value creation
100
Appendices
Appendix 1: Literature and references Amantini, E., Manai, T. and Jeaud, P.; ”Technico-economic feasibility study of CO2 capture,
transport and geo-sequestration: A case study for France”. 7th GHGT conference, Vancouver, Canada, 2004.
Berger, Bjørn, Kaarstad, Olav and Haugen, Hans Aksel; “Creating a large-scale CO2 infrastructure
for enhanced oil recovery”. 7th GHGT conference, Vancouver, Canada, 2004. Holt, T., Lindeberg, E., Vassenden, F. and Wessel-Berg, D.; ” A large-scale infrastructure model for
CO2 disposal and for Economic and capacity potential in the North Sea”. 7th GHGT conference, Vancouver, Canada, 2004.
Hustad, Carl-W and Austell, J. Michael; ”Mechanisms and incentives to promote the use and storage
of CO2 in the North Sea”. European energy law report, pp. 355-380, 2004. Hustad, Carl-W et.al; “Large-scale CO2 sequestration on the Norwegian Continental Shelf; A
technical, economic, legal and institutional assessment”. Collaboration between Sintef Petroleum Research, Norwegian School of Management, Sandvika, CO2-Norway AS, University of Oslo, Faculty of Law and CICERO. March, 2004.
Jakobsen, Viktor; “The Norwegian gas power plant and CO2 emission fallacy”. Bellona working
paper, 2005 (work in progress). Kon-Kraft; “Norsk petroleumsvirksomhet ved et veiskille – kartlegging av kostnadsbildet på norsk
sokkel”. March, 2004. Kaarstad, Olav (Statoil); ”Creating a North Sea CO2 value chain”. Presentation. Kvamsdal, Hanne M., Mejdell, Thor et.al.; ”Tjeldbergodden power/methanol – CO2 reduction efforts.
SP2: CO2 capture and transport”. Sintef Energy research, February, 2005. Lekander, Per (McKinsey); “Impacts of ETS on power prices”. Presentation, CEPS workshop,
December, 2003. Markedskraft, June 2005, "Long term price forecast for electrical power in the Nordic countries 2006-
2025", Meer, L.G.H van der, Hartman, J., Geel, C. and Kreft, E.; ”Re-injecting CO2 into an offshore gas
reservoir at a depth of nearly 4,000 metres sub-sea”. 7th GHGT conference, Vancouver, Canada, 2004.
Melien, Torgeir, Norsk Hydro ASA; ”Economic and cost analysis for CO2 capture costs in the CO2
capture projects scenarios”. Pp. 47 – 87, In: Thomas, D.C.(ed) 2005: CCP, Carbon dioxide capture for storage in deep geologic formations – results from the CO2 capture project, Volume 1, Capture and Separation of Carbon Dioxide from Combustion Elsevier, 2005.
The Ministry of the Environment, 2005. St.meld.nr. 21 (2004-2005) Regjeringens miljøvernpolitikk og
rikets miljøtilstand

August 2005 CO2 for EOR – environment and value creation
101
Moldskred, Sissel; ”Gullfaks – Vurderinger av CO2-injeksjon for økt utvinning”. Statoil. Presentation, OG21, September, 2004.
OLF, 2004. Norge bør implementere EUs kvotehandelsdirektiv. Press release 20. September 2004. NPD; ”The petroleum resources on the Norwegian continental shelf – the resource report”. June
2005. NPD; ”A feasibility study of CO2 for EOR to the NCS”. April 2005. The Oil industry association; ”Elkraft fra land til norsk sokkel – tiltakskost og miljøeffekt”. January,
2003. The Ministry of Oil and Energy; ”Fakta – Norsk petroleumsverksemd 2005”. 2005. Odelsting Law proposal nr.13 (2004 – 2005); ”About the Greenhouse Gas Emission Trading”. The
Royal Ministry of the Environment, November 2004. Pearce, David W. and Turner, R. Kerry; “Economics of natural resources and the environment”.
Harvester Wheatsheaf, 1990. Sanden, K. 2005. Presentation from AkerKværner/GassTek on the "Gas and energy technology
conference 2005" in Langesund, Norway, 08.06.05. Schulte, Willem (Shell International E&P); “Experience from use of CO2 for enhanced oil recovery in
the USA”. Presentation, OG21 seminar, September, 2004. Skjærpe, Tor Rasmus and O’Connor, Helen; ”Bolstering the bottom line – how technology and
teamwork give results”. Petoro presentation, ONS, Stavanger, August, 2004. Skjærpe, Tor Rasmus; ”Petroleum technology at a crossroad – Technology and implementation”.
Petoro presentation, ONS, Stavanger, August, 2004. Storting white paper nr.9 (2002 – 2003); ”About domestic use of natural gas”. The Royal Ministry of
Oil and Energy, November, 2002. Storting white paper nr.38 (2003 – 2004); “About the Petroleum activity”. The Royal Ministry of Oil
and Energy, May, 2004. Storting white paper nr.47 (2003 – 2004); “About the innovation activity for environmentally friendly
gas power technologies.”. The Royal Ministry of Oil and Energy, August 2004. Storting white paper nr.8 (2004 – 2005); “Perspectives 2004 – challenges and opportunities for
Norwegian economy”. The Royal Ministry of Finance, November, 2004. Torp, Tore A., Brown, Ken R.; ” CO2 underground storage costs as experienced at Sleipner and
Weyburn”. 7th GHGT conference, Vancouver, Canada, 2004. Turta, Alex; ”Enhanced gas recovery and CO2 storage in dry gas pools”. Presentation at PTAC
workshop; CO2 from industrial sources to commercial EOR. Calgary, Canada, October, 2003. US. Department of Energy, Office of Fossil Energy, National Energy Technology Laboratory and
Strategy Center for Natural Gas and Oil; “CO2 EOR technology”. December, 2004.

August 2005 CO2 for EOR – environment and value creation
102
US. Department of Energy, Office of Fossil Energy, Advanced Resources International Inc.; “Basin
oriented strategies for CO2 enhanced oil recovery – Offshore Louisiana”. March, 2004. US. Department of Energy, Office of Fossil Energy, Advanced Resources International Inc.; “Basin
oriented strategies for CO2 enhanced oil recovery – California”. March, 2004. Vollsæter, Geir (Shell E&P Europe): ”CO2 for enhanced oil recovery – The value chain”.
Presentation, Langesund conference, June, 2005. Wilson, M and Monea, M. et.al. (Petroleum technology research centre); “IEA GHG Weyburn CO2f
monitoring & storage project summary report 2000 – 2004”. 7th GHGT conference, Vancouver, Canada, 2004.

August 2005 CO2 for EOR – environment and value creation
103
Appendix 2: Abbreviations and definitions Abbreviations o.e. Oil equivalents Sm3 Standard cubic metre NOK Norwegian krone bn Billion EUR Euro NPD Norwegian Petroleum Directorate MOE The Ministry of Oil and Energy NCS The Norwegian continental shelf OLF The Norwegian Oil Industry Association NVE The Norwegian Water Resources and Energy Directorate PCA The Norwegian Pollution Control Authority

August 2005 CO2 for EOR – environment and value creation
104
Appendix 3: Summary of Bellona’s conclusions and recommendations
regarding the weaknesses with NPD’s CO2 for EOR report
Conclusions
• Neither the Storting nor MOE’s own mandate may in any way be said to have been answered. It is particularly worrisome that the answer to the mandate’s requirement for proposals and measures to establish CO2 projects is completely absent.
• The report is too limited in its viewpoints and information offered to be able to draw any realistic conclusions.
• The content is not put into any environmental or socially economical context. Without these aspects the report becomes unsuited as a basis for decisions.
• The main conclusion is based on flawed technical and economical premises and judgements. • It is not transparent. Documentation, arguments and discussion are with chosen input with no
sensitivities - up or down. • Challenges are over emphasised and opportunities omitted. Large and small barriers are given
equal weight without thorough individual evaluations. This contributes to an exaggerated impression of the complex and costly evaluation of CO2 storage and EOR.
• NPD has chosen to use conservative values both with regards to what percentage oil recovery may be achieved using CO2 for EOR, as well as how many barrels of oil each ton of CO2 injected should produce, without discussion, validation or sensitivity analysis. 40% of the petroleum resources have been excluded from the NPD assessment.
• Neither the total economical sensitivity towards changes in the EOR potential nor the sensitivity towards changes in oil price has been discussed or even mentioned. In this manner the large potential that lies in using CO2 for EOR becomes foggy.
• The assessment of CO2 sources reflects limited thinking, without any will to look for possibilities or comprehensive solutions. Neither CO2 in natural gas, CO2 produced with hydrogen or Methagen production, nor coordination of fossil based power production from large stationary sources are included.
• The chosen cases or “project examples” must be regarded as singular and superficial illustrations, not adequate project appraisals.
• The report does not perform any reality check or cost assessments, investments or project evaluations for the needed infrastructure.
Bellona’s recommendations:
• CO2 for EOR should always be evaluated in an environmental and socio-economic context. Without these taken together, no realistic decisions can be taken.
• Such studies should have full transparency, and give detailed examples showing how each idea works.
• Perform sensitivity analysis illustrating what changes in recovery rate and oil price will mean financially.
• The authorities should require that the companies perform tertiary field models and gas- CO2 substitution for each license. The petroleum Act § 4-1 is available to be used for this purpose.
• The necessary work to map and assess relevant aquifers and buffer storage facilities must be performed44. Evaluating CO2 for EOR without taking into account both actual long term and intermediate storage makes the case studies of limited value.
44 From what Bellona understands, the only detailed geological mapping has been made in conjunction with the coast- and ocean areas outside Trøndelag through the CO2STORE project. Apart from this there are simply a rough overview of potential storage aquifers in the North Sea and the Norwegian Ocean made by NGU in 2001 through the GESTCO project. NGU’s old proposal to conduct a more thorough mapping related to the most relevant places for establishing gas power plants has not bee realised. http://www.ngu.no/modules/module_109/publisher_view_product.asp?iEntityId=865.

August 2005 CO2 for EOR – environment and value creation
105
• When evaluating CO2 sources, CO2 in natural gas, CO2 produced in conjunction with hydrogen or Methagen, and coordination of power production must be included.
• The State must evaluate how to carry a major portion of the risk as it is the beneficiary of any profit by increased tax revenues from mature field EOR.
• Realistic field case studies must be performed, business models built and measures taken that gives acceptable risk and predictability for the different participants in the CO2 value chain.
• Establish adequate and approved methods for cost and profitability analysis and secure realistic cost estimates. Do not base studies on comparative, estimated technology costs.
• The cost of transportation and storage should be calculated on the same basis as alternative purchase of emission permits.
• Incentivise cost reduction and efficient engineering. • The goal must be to create transparent cost and profitability assessments based on approved
methodology, realistic cases and business models. Measure must be taken to incentivise participants who cooperate and conduct this work.

August 2005 CO2 for EOR – environment and value creation
106
Appendix 4: Bellona’s Methagen vision – a large source for CO2
To produce enough CO2 for EOR, producing hydrogen from natural gas may provide an opportunity to establish a large stationary CO2 source. A potential sales channel for the hydrogen is to mix it with the natural gas that is exported to Europe – Methagen. Norwegian gas exports to the European market were approximately 74 billion Sm3 in 2004. Existing infrastructure may accommodate a mixture of up to 15 volume percentage hydrogen45. The positive effects of this are: - Produces close to 9 million tonnes of CO2 annually - Facilitates the establishment of an offshore CO2 infrastructure - Methagen may reduce NOX emissions from CNG vehicles by 25% to 50% - Methagen reduces methane emissions by up to 25% from combustion processes - Large scale production facilitates cost reductions for hydrogen to the transportation sector - In the long run, there will be a potential for sale of up to 15% hydrogen in Norwegian gas exports
according to EU’s goals for the use of alternative fuels. This assumes that natural gas is replaced by Methagen.
- Opportunity to increase gas prices because CO2 is removed, leaving a higher value commodity and lowering CO2 content that would otherwise be burned in European markets.
Below is a visualisation of a Methagen and CO2 infrastructure in the North Sea.
45 The project Naturalhy under EU’s 6th framework programme for research, where Bellona has a seat in the strategic advisory committee, looks at how existing natural gas infrastructure may take on Methagen.

August 2005 CO2 for EOR – environment and value creation
107
EU goals for alternative fuels (in energy content) for transportation
46
10% natural gas within 2020 5% hydrogen within 2020 COM (2001) 547 provisional version
EU-30 Methagen Scenario
Supply and use of hydrogen
0
5
10
15
20
25
30
35
40
Supply through NG (15% H2) Use of NG cars (15% H2) use of H2-BC cars
bn Sm3
Supply side: Hydrogen via Methagen
Assumptions Methagen hydrogen share 15% v/v
Burn value methane (CH4) 37,3 MJ/ Sm3 Burn value hydrogen (H2) 10,8 MJ/ Sm3 Norwegian gas exports 74,0 bn Sm3/year CO2 capture by SMR 0,8447 kg CO2/ Sm
3 H2 CO2 capture by SMR 85%
Calculations Burn value Methagen (15%vol) 33,3 MJ/ Sm3 Energy amount in gas exports 2,8E+12 MJ/year
Equivalent energy export Methagen 8,3E+10 Sm3/year Total hydrogen export 1,2E+10 Sm3/year Total CO2 capture 9 Mt/year
Potential demand hydrogen
Assumptions Demand at EU 5% H2 goal (conservative) 3,5E+1048 Sm3/year
Calculations Demand CNG (10% target) 2,0E+10 Sm3/year Demand CNG (10% target) 7,5E+11 MJ/year
Burn value Methagen (15% vol) 33,3 MJ/Sm3 Demand Methagen 2,3E+10 Sm3/year Demand for H2 (15% vol Methagen) 3,4E+09 Sm3/year
46 Ref. COM (2001) 547 provisional version. 47 NOU 2004: 11, s 141 48 NOU 2004: 11, s 22

August 2005 CO2 for EOR – environment and value creation
108
Appendix 5: The relationship between suggested measures and the EEA
rules for environmental support Norwegian authorities are not free to implement any energy or environmental policy measure they choose. The EEA treaty states clear limitations for measures that may entail any kind of governmental support. According to the Treaty’s article 61, all public support that influences, or potentially may influence competition is prohibited. The condition for a measure to be included by the general prohibition in the support regulations are that; 1) the support is given by a public authority, 2) affects or threatens to affect competition, 3) that the support favours single companies or products, and 4) that the support is affecting the trade between EEA countries. The prohibition comprises public support that fulfils all of the four conditions. Support for environmental measures
Support that is designed to help a company comply with new or existing environmental regulations in the EU is not allowed; however, according to the ESA guidelines for governmental support, the regulations in some instances allow for investment and operating cost support in environmental measures where the environmental measures brings the company beyond the standards set by the EU. It is also an opening for giving investment grants to companies to fulfil national standards that are stricter than the EU regulations, as well as investment support for measures within areas where there are no established EU standards. The EFTA Surveillance Authority (ESA) guidelines have several possibilities for investment grants to renewable energy sources and for combined electricity and heat production (CHP). Electricity production based on fossil sources with CO2 capture is, however, not explicitly mentioned, which probably is applicable to the fact that the concept is so novel that it was deemed irrelevant at the point in time when the regulations were shaped. Both EU and Norway have established an emission permit system for greenhouse gases that now seems to be the overall measure for regulating greenhouse gas emissions in the sectors involved. This comprises gas fired power plants and several industrial sectors. Companies included in the emission permit system are not mainly subject to EU standard regulations in the form of BAT-demands, limitations on emissions per produced unit or equivalent. Since there are no EU standards within this field, we believe that investment grants or support for CO2 capture facilities should be allowed according to the regulations for governmental grants, under the condition that the other conditions of the regulations are fulfilled. The relationship between the regulations for governmental support and the establishment of
state owned companies for CO2 sequestration
The EEA treaty does not put any limitations on State ownership in commerce and companies; however, the regulations for governmental support apply equally for state owned/part owned companies. We will comment shortly on how our proposed business model is modelled to avoid any conflict regarding governmental support. State support in tax related measures
The measures we have proposed related to the taxation of the petroleum activity are not selective. All licenses will be facing the same incentives, and any element of support in such tax-incentives will therefore not threaten nor affect competition.