co oxidation at nickel centres by n o or o to yield a novel … · co oxidation at nickel centres...
TRANSCRIPT

S1
Supporting Information
for
CO oxidation at nickel centres by N2O or O2 to yield a novel
hexanuclear carbonate
Bettina Horn, Christian Limberg,* Christian Herwig, Michael Feist and Stefan Mebs
Humboldt-Universität zu Berlin, Institut für Chemie, Brook-Taylor-Str. 2, 12489 Berlin,
Germany
* To whom correspondence should be addressed: [email protected]
Table of Contents
General Procedures S2
Experimental Section ‒ Spectroscopic Details S3
Density Functional Calculations S11
References S15
Electronic Supplementary Material (ESI) for Chemical CommunicationsThis journal is © The Royal Society of Chemistry 2012

S2
General Procedures. All manipulations were carried out in a glovebox, or else by means of
Schlenk-type techniques involving the use of a dry argon atmosphere. Solvents were purified
employing a MBraun Solvent Purification System SPS. The 1H and 13C NMR spectra were
recorded on a Bruker DPX 300 NMR spectrometer (1H 300.1 MHz, 13C 75.5 MHz) with dry
dmso-d6 as solvent at 20 °C. The 1H NMR spectra were calibrated against the residual proton,
the 13C NMR spectra against natural abundance 13C resonances of the deuterated solvents
(dmso-d6 δH 2.50 ppm and δC 39.43 ppm). Infrared (IR) spectra were recorded using solid
samples prepared as KBr pellets with a Shimadzu FTIR-8400S-spectrometer. Mass spectra
(ESI/APCI) were recorded on an Agilent Technologies 6210 Time-of-Flight LC-MS
instrument. Microanalyses were performed on a Leco CHNS-932 elemental analyser. The
thermal behaviour was studied by simultaneously coupled TA-MS measurements. A
NETZSCH thermoanalyzer STA 409 C Skimmer®, equipped with a BALZERS QMG 421,
was used to record the thermoanalytical curves (T, DTA, TG, DTG) together with the ionic
current (IC) curves in the multiple ion detection (MID) mode.S1,S2 Further experimental
details were as follows: DTATG sample carrier system; Pt/PtRh10 thermocouples; platinum
crucibles (0.8 mL beaker); sample mass 11-17 mg (measured versus empty reference
crucible); constant purge gas flow of 100 mL/min argon 5.0 (AIRLIQUIDE); constant heating
rate 10 K/min; raw data evaluation with manufacturer’s software PROTEUS® (v. 4.3) and
QUADSTAR® 422 (v. 6.02) without further data treatment, e.g. such as smoothing.
Electronic Supplementary Material (ESI) for Chemical CommunicationsThis journal is © The Royal Society of Chemistry 2012

S3
Experimental Section – Spectroscopic Details
Synthesis of K6[LtBuNiCO3]6, 1, by oxidation with N2O. A suspension of K2[L
tBuNiCO]2
(80 mg, 63.7 µmol), I ,S3 in 5 mL hexane was exposed to an atmosphere of N2O. The resulting
solution was stirred overnight and a brown suspension was formed. All volatiles were
removed in vacuo, and the residue was washed with 1 mL tetrahydrofuran. 1 was isolated as a
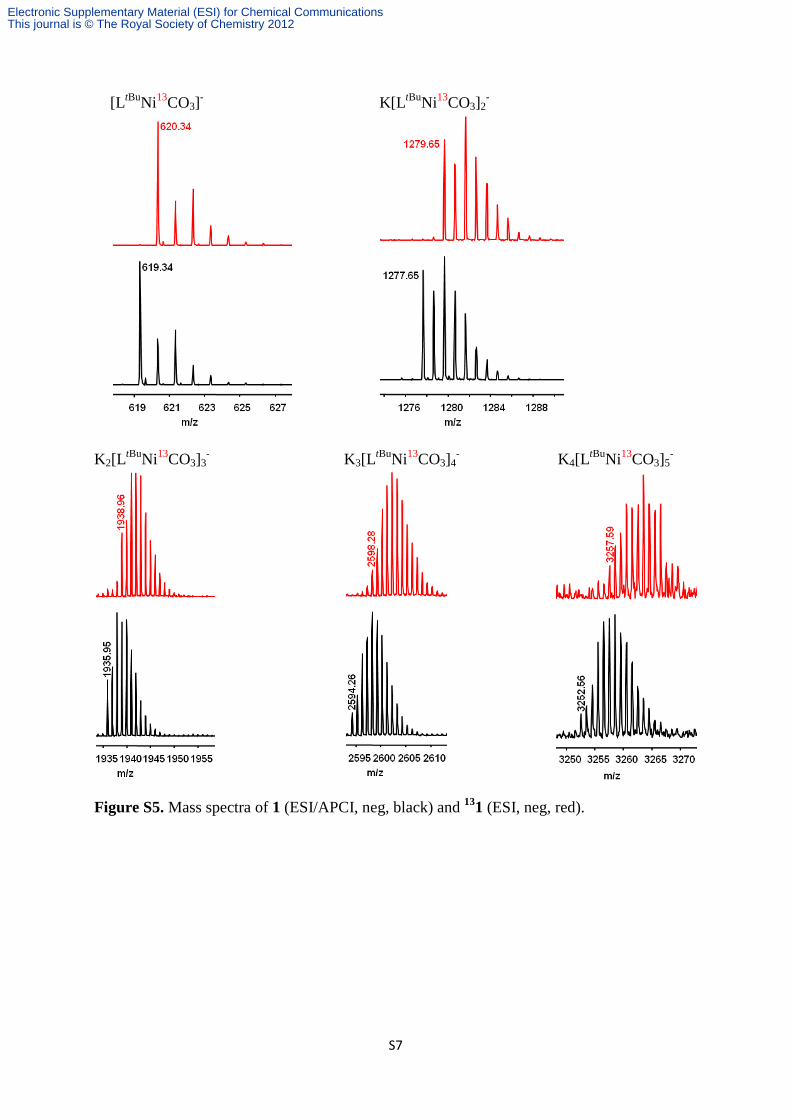
pure light yellow brown powder (45 mg, 11.4 µmol, 54 %). ESI/APCI-MS (250 V, neg, see
Figure S5): m/z (%): 619.3441 ([LtBuNiCO3]-, calc.: 619.3409), 1277.6507 (K[LtBuNiCO3]2
-,
calc.: 1277.6456), 1935.9533 (K2[LtBuNiCO3]3
-, calc.: 1935.9503), 2594.2591
(K3[LtBuNiCO3]4
-, calc.: 2594.2549), 3252.5626 (K4[LtBuNiCO3]5
-, calc.: 3252.5596); IR
(KBr): υ = 3170 (w), 3055 (w), 3017 (m), 2959 (vs), 2929 (s), 2908 (s), 2868 (s), 1922 (w),
1858 (w), 1796 (w), 1740 (w), 1623 (vs, CO32-), 1614 (vs, CO3
2-), 1533 (m), 1521 (s), 1465
(m), 1445 (m), 1436 (m), 1409 (vs), 1382 (m), 1368 (s), 1322 (vs), 1294 (m, CO32-), 1252
(w), 1220 (m), 1208 (w), 1193 (w), 1183 (w), 1164 (m), 1148 (w), 1099 (m), 1055 (m), 1032
(m), 1013 (w), 977 (w), 935 (w), 852 (w), 834 (w), 808 (m), 784 (m), 765 (m), 729 (w), 719
(w), 683 (w) cm-1; 1H NMR (300.1 MHz, dmso-d6): δ = 6.83 (m, 3JHH = 7.5 Hz, 2H, Ar-pH),
6.72 (m, 3JHH = 7.2 Hz, 4H, Ar-mH), 4.98 (s, 1H, CHCC(CH3)3), 3.90 (m, 3JHH = 6.8 Hz, 4H,
CH(CH3)2), 1.74 (d, 3JHH = 6.6 Hz, 12H, CH(CH3)2), 1.27 (d, 3JHH = 6.6 Hz, 12H, CH(CH3)2),
0.84 (s, 18H, C(CH3)3) ppm; 13C{1H} NMR (75.5 MHz, dmso-d6): δ = 164.6 (NCC(CH3)3),
164.0 (CO3), 145.2 (Ar-iC), 142.1 (Ar-oC), 123.4 (Ar-pC), 121.0 (Ar-mC), 96.4
(CHCC(CH3)3), 40.6 (C(CH3)3), 32.5 (C(CH3)3), 27.7 (CH(CH3)2), 24.8, 23.1 (CH(CH3)2)
ppm; Elemental analysis calc. (%) for C216H318K6N12Ni6O18 (3957.66 g·mol-1): C 65.55,
H 8.10, N 4.25; found: C 65.03, H 8.20, N 3.64.
Electronic Supplementary Material (ESI) for Chemical CommunicationsThis journal is © The Royal Society of Chemistry 2012

S4
Synthesis of 131 by oxidation with N2O. A suspension of K2[LtBuNi13CO]2
(60 mg,
47.7 µmol), 13I ,S4 in 5 mL hexane was exposed to an atmosphere of N2O. The resulting
solution was stirred over night and a brown suspension was formed. All volatiles were
removed in vacuo, and the residue was washed with 1 mL tetrahydrofuran. 131 was isolated as
a pure light yellow brown powder (37 mg, 9.3 µmol, 59 %). ESI-MS (250 V, neg): m/z (%):
620.3438 ([LtBuNi13CO3]-, calc.: 620.3409), 1279.6479 (K[LtBuNi13CO3]2
-, calc.: 1279.6456);
IR (KBr): υ = 3169 (w), 3056 (w), 3018 (w), 2960 (s), 2930 (m), 2908 (m), 2869 (m), 1923
(w), 1855 (w), 1796 (w), 1617 (w), 1570 (vs, 13CO32-), 1555 (vs, 13CO3
2-), 1518 (s), 1465
(m), 1445 (m), 1437 (m), 1408 (vs), 1382 (m), 1368 (s), 1321 (s), 1270 (m, 13CO32-), 1253
(m), 1220 (m), 1208 (w), 1193 (w), 1183 (w), 1164 (w), 1148 (w), 1099 (w), 1056 (w), 1031
(w), 977 (w), 935 (w), 808 (m), 784 (m), 765 (m), 718 (w), 683 (w) cm-1; 13C{1H} NMR
(75.5 MHz, dmso-d6): δ = 164.0 (13CO3) ppm.
Synthesis of K6[LtBuNiCO3]6, 1, by oxidation with O2. Solid K2[L
tBuNiCO]2 (28 mg,
22.3 µmol), I , was treated with neat O2 for 1 h. Immediately the sample turned light brown.
After 12 h at room temperature in contact with O2 hexane (0.5 mL) was added and the
resulting suspension was allowed to ripen for 3 days. The residue was separated from the
solution and dried in vacuum to give 8 mg of 1 (2.0 µmol, 27 %).
Employing 13I instead of I in this reaction leads to the formation of 131 as proved by ESI-MS
(see Figure S5) and 13C NMR spectroscopy. ESI-MS (250 V, neg): m/z (%): 620.3428
([L tBuNi13CO3]-, calc.: 620.3409), 1279.6495 (K[LtBuNi13CO3]2
-, calc.: 1279.6456); 1938.9627
(K2[LtBuNi13CO3]3
-, calc.: 1938.9503); 2598.2756 (K3[LtBuNi13CO3]4
-, calc.: 2598.2549);
3257.5901 (K4[LtBuNi13CO3]5
-, calc.: 3257.5596); 13C{1H} NMR (75.5 MHz, dmso-d6): δ =
164.0 (13CO3) ppm.
Electronic Supplementary Material (ESI) for Chemical CommunicationsThis journal is © The Royal Society of Chemistry 2012

S5
Figure S1. 1H NMR spectrum of K6[LtBuNiCO3]6, 1, dissolved in dmso-d6.
Figure S2. 13C NMR spectrum of K6[LtBuNiCO3]6, 1, dissolved in dmso-d6.
Electronic Supplementary Material (ESI) for Chemical CommunicationsThis journal is © The Royal Society of Chemistry 2012

S6
Figure S3. IR spectra of K6[LtBuNiCO3]6, 1 (black), and K6[L
tBuNi13CO3]6, 131 (red).
Figure S4. νCO region of the IR spectra recorded for K6[LtBuNiCO3]6, 1 (black), and
K6[LtBuNi13CO3]6,
131 (red).
Electronic Supplementary Material (ESI) for Chemical CommunicationsThis journal is © The Royal Society of Chemistry 2012
S7
[LtBuNi13CO3]- K[L tBuNi13CO3]2
-
K2[LtBuNi13CO3]3
-
K3[LtBuNi13CO3]4
-
K4[LtBuNi13CO3]5
-
Figure S5. Mass spectra of 1 (ESI/APCI, neg, black) and 131 (ESI, neg, red).
Electronic Supplementary Material (ESI) for Chemical CommunicationsThis journal is © The Royal Society of Chemistry 2012

S8
Thermal Analysis and PulseTA experiments.
The usual TA-MS curves illustrating the thermal behaviour of the ligand precursor are shown
in Figures S6 an S7. The mass numbers m/z = 18 (abbreviated in the following as m18), m44,
and m45 are self-explaining in the given context whereas m31 and m57 represent the possible
solvent residues methanol and hexane, respectively.
Figure S6 and S7. TA-MS curves of the ligand precursor HLtBu (17.090 mg) in Ar with the
IC curves for the mass numbers m/z = 18 (H2O+), 31 (CH3O
+), 44 (12CO2+), 45 (13CO2
+), and
57 (C4H9+).
Figure S8, however, summarizes the essential features of a PulseTA experiment that consists
of an internal calibration of the IC signalS5 representing the molecule expected to be released.
The known injected amount is then related to the reaction peak by a simple area comparison
of the integral peak areas. The observation that the decomposition of the ligand alone
produces the mass number m44 as well (possibly originating from the iPr group, see Figure
S7) must not hinder a CO2 quantification provided one succeeds in separating an additional
contribution to the m44 from the basic intensity level of the m44 trace.
The average value of 0.5 µV/s for the calibration peaks in Figure S8 leads to a CO2 mass of
0.95 mg for the reaction peak which equals to 7.5 equivalents of CO2 instead of the expected
6 CO2. This was not satisfying even though the general curve shape of the PTA experiment
was excellent. We tried, therefore, to succeed by an evaluation via the mass number m45
(13CO2+), performed with the labelled compound 131. As only the carbonate carbon was
marked in 131, we expected a better distinction of “ligand carbon” from the carbonate carbon,
both being responsible for the liberation of CO2 (cf. Figures S6 and S7).
-10
0
10
20
30
DTA /uV
0
20
40
60
80
100
TG /%
-40.0
-35.0
-30.0
-25.0
-20.0
-15.0
-10.0
-5.0
0
5.0
DTG /(%/min)
50 100 150 200 250 300 350 400Temperature /°C
1.0
2.0
3.0
4.0
5.0
6.0[2]
Ion Current *10-10 /ATG
DTG
DTA
m18
m57(x5)
m31(x50)134
344
139
360
-99.51↑ exo
-30
-20
-10
0
10
20
30
DTA /uV
0
20
40
60
80
100
TG /%
-30
-25
-20
-15
-10
-5
0
5
DTG /(%/min)
50 100 150 200 250 300 350 400Temperature /°C
0
1.0
2.0
3.0
4.0
5.0
6.0[4]
Ion Current *10-11 /ATG
DTG
DTA
m44
m57 m45(x10)
134
139
360
-99.51
↑ exo
Electronic Supplementary Material (ESI) for Chemical CommunicationsThis journal is © The Royal Society of Chemistry 2012

S9
The corresponding TA run is shown in Figure 9. Here, the injected 12CO2 was represented by
the mass number m45 (13CO2+). Accordingly, the IC curve for m45 exhibits an inverted area
ratio for calibration and reaction peaks compared with that shown in Figure S8, and the
injected volume of 1 mL 12CO2 corresponded to 0.0183 mg 13CO2 only (cf. the natural isotope
ratio 12C : 13C = 100 : 1). With the average value of 0.0081 µV/s one obtains 0.37 mg 13CO2
for the reaction peak which equals to 3 equivalents of 13CO2 instead of the expected 6
equivalents of 13CO2. Again, the quantification is not satisfying. It was found impossible to
distinguish between the different contributions to the mass numbers m44 and m45, despite
utilisation of the labelled 131. This distinction would have been possible exclusively by
establishing an additional intensity contribution to a given mass number, but the MS
sensitivity was obviously too low for it. Note further that the small exothermal effect at
~ 260 °C, preceding the main decomposition step, contributes as well to the total IC signal of
m44 and m45 which can be deduced from stronger amplified IC curves (not shown here).
Figure S8. PTA curves of 121 (11.39 mg) in Ar with the IC curve for m/z = 44 (12CO2+).
Before (170 °C) and after (400 °C) the reaction peak, respectively, 1 mL gaseous 12CO2
(1.83 mg CO2) was injected for calibration.
-40
-30
-20
-10
0
10
DTA /uV
0
20
40
60
80
100
TG /%
-50
-40
-30
-20
-10
0
10
DTG /(%/min)
50 100 150 200 250 300 350 400 450Temperature /°C
0
0.5
1.0
1.5
Ion Current *10-9 /ATG
DTG
DTA
m44 1 mL
331
341
242
260
-76.74
0.52E-07 0.48E-070.26E-07
↑ exo
Electronic Supplementary Material (ESI) for Chemical CommunicationsThis journal is © The Royal Society of Chemistry 2012

S10
Figure S9. PTA curves of 131 (10.62 mg) in Ar with the IC curve for m/z = 45 (13CO2). At
160 °C and 390 °C, respectively, 1 mL 12CO2 was injected for calibration (further
explanations in the text).
-45.0
-40.0
-35.0
-30.0
-25.0
-20.0
-15.0
-10.0
-5.0
DTA /uV
0
20
40
60
80
100
TG /%
-35.0
-30.0
-25.0
-20.0
-15.0
-10.0
-5.0
0
5.0
DTG /(%/min)
50 100 150 200 250 300 350 400 450Temperature /°C
0
0.5
1.0
1.5
Ion Current *10-10 /ATG
DTA
DTG
m45
250
256 -74.54344
0.009E-07 0.0072E-070.15E-07
↑ exo
Electronic Supplementary Material (ESI) for Chemical CommunicationsThis journal is © The Royal Society of Chemistry 2012

S11
Density Functional Calculations. Geometry optimisations were performed in redundant
internal coordinates using the Gaussian09 program package.S6 The B3LYP functionalS7 was
employed together with the Def2-SVP basis setS8 for C and H atoms and the Def2-TZVPD
basis setS9 for Ni, N, and O atoms, both taken from the EMSL Basis Set Exchange
DatabaseS10. Very tight convergence criteria were chosen for the SCF procedure and a pruned
(99,590) “ultrafine” integration grid was used for numerical integrations. The program
NBO5.9S11 was used for subsequent Natural Bond Orbital (NBO) analysis. Visualisation of
molecular structures was accomplished with the program GaussView5.
A cutout of the molecular structure of K2[LtBuNiCO]2, I as determined by X-ray diffraction
analysis was used as starting geometry for the mononuclear model [LtBuNi(CO)]-. The
optimised structure is shown in Figure S10 including NBO charges. Both the Ni and the C
(carbonyl) atom are positively charged. Due to the relatively small charge differences between
these two atoms no clear preference for a nucleophilic attack of N2O can be derived.
Figure S10. Optimised molecular structure for the singlet state of [LtBuNi(CO)]- including
NBO charges for selected atoms. Hydrogen atoms are omitted for clarity.
Attempts to optimise the geometry of a [LtBuNi(CO)O]- intermediate with different
conceivable starting structures always led to the same [LtBuNi(η2-CO2)]- complex (Figure
S11).
Electronic Supplementary Material (ESI) for Chemical CommunicationsThis journal is © The Royal Society of Chemistry 2012

S12
Figure S11. Three different starting structures of an [LtBuNi(CO)O]- intermediate leading to
the same end structure (bottom right) after optimisation. Hydrogen atoms are omitted for
clarity.
Cartesian coordinates (Å) for the theoretical structure of [L tBuNi(CO)] -, obtained from geometry optimization:
Singlet state, E = −3323.64290754 hartree
x y z
Ni 0.00000000 -1.02741500 0.00009300 N 1.48573800 0.29068300 0.02850000 N -1.48573900 0.29067900 -0.02855000 O -0.00000300 -3.91114400 0.00034200 C -1.97753900 -1.51678000 3.23777100 C 1.30070200 1.60458300 0.03493500 C 2.70876500 -0.41753200 -0.00119000 C -1.30070300 1.60457700 -0.03521600 C -2.70876500 -0.41753200 0.00126200 C -2.68247500 -0.31998600 2.57366600 C 0.00000000 2.17060700 -0.00019000 C 2.43784300 2.70638600 0.09111300 C 3.29011300 -0.90098700 1.20646000 C 3.31973700 -0.73701000 -1.24889200
Electronic Supplementary Material (ESI) for Chemical CommunicationsThis journal is © The Royal Society of Chemistry 2012

S13
C -2.43784300 2.70637000 -0.09158800 C -3.31974000 -0.73679000 1.24901900 C -3.29010900 -0.90120100 -1.20630400 C -3.67156200 0.34184600 3.54841300 C 3.89743800 2.21081900 0.12660600 C 2.24226300 3.55686300 1.37192100 C 2.32608300 3.62135800 -1.15430100 C 4.46758300 -1.65494800 1.14099500 C 2.63052700 -0.65968200 2.56324200 C 4.49380400 -1.49918900 -1.25693000 C 2.68246800 -0.32044200 -2.57361000 C -2.32609800 3.62154900 1.15367600 C -3.89743900 2.21079900 -0.12701400 C -2.24225000 3.55663600 -1.37253400 C -4.49380800 -1.49896700 1.25718900 C -4.46758000 -1.65515000 -1.14070900 C -2.63051900 -0.66013800 -2.56312600 C 5.08234600 -1.95311400 -0.07572600 C 3.54788300 0.07337700 3.55850400 C 2.11630100 -1.97737100 3.17076000 C 3.67155000 0.34121900 -3.54847800 C 1.97753200 -1.51735500 -3.23750100 C -5.08234600 -1.95310100 0.07606300 C -2.11628600 -1.97793400 -3.17040400 C -3.54787300 0.07273900 -3.55852300 C 0.00000000 -2.73662800 0.00024200 H -1.23446100 -1.95236300 2.55311500 H -2.70152000 -2.30576700 3.50419400 H -1.45833600 -1.20641800 4.16127300 H -1.90328200 0.41997000 2.34181600 H 0.00000000 3.25290800 -0.00028500 H -3.14346600 0.69847600 4.44924300 H -4.45077500 -0.36129700 3.88770800 H -4.18129600 1.20594800 3.09265300 H 4.17878000 1.64523100 -0.76842400 H 4.11235000 1.57661200 0.99342500 H 4.55799100 3.09307800 0.18606700 H 2.30917500 2.92609000 2.27246000 H 1.27015900 4.06755300 1.39818800 H 3.03073200 4.32679600 1.44022700 H 3.12206100 4.38621500 -1.13392700 H 1.36181100 4.14403400 -1.21441500 H 2.44571600 3.03744400 -2.08052000 H 4.91333800 -2.02612300 2.06901000 H 1.75269000 -0.02208200 2.38481900 H 4.95999900 -1.74936100 -2.21456900 H 1.90327400 0.41955300 -2.34188900 H -1.36182900 4.14424000 1.21371200 H -2.44573500 3.03778700 2.07999100 H -3.12208000 4.38639900 1.13317000 H -4.17878700 1.64535200 0.76810400 H -4.11234400 1.57645500 -0.99373400 H -4.55799000 3.09304900 -0.18661800
Electronic Supplementary Material (ESI) for Chemical CommunicationsThis journal is © The Royal Society of Chemistry 2012

S14
H -3.03071900 4.32655700 -1.44097600 H -2.30915200 2.92571400 -2.27296900 H -1.27014600 4.06732200 -1.39887500 H -4.96000500 -1.74897000 2.21487100 H -4.91333400 -2.02648800 -2.06865900 H -1.75268500 -0.02250300 -2.38481400 H 6.00195200 -2.54437700 -0.10422200 H 3.89690800 1.03965700 3.16152200 H 4.44155900 -0.52428800 3.80670000 H 3.01396400 0.27184000 4.50378600 H 1.56455800 -1.78798500 4.10762500 H 2.94843100 -2.66349600 3.40414500 H 1.43919400 -2.48758000 2.47051600 H 4.45076300 -0.36198400 -3.88764900 H 4.18128400 1.20540300 -3.09287300 H 3.14345100 0.69768700 -4.44937000 H 1.45832500 -1.20715800 -4.16105600 H 1.23445600 -1.95281900 -2.55276600 H 2.70151400 -2.30638700 -3.50378700 H -6.00195200 -2.54435800 0.10466200 H -2.94841300 -2.66410500 -3.40366800 H -1.43917900 -2.48801400 -2.47006500 H -1.56454000 -1.78871500 -4.10730100 H -3.01395100 0.27103100 -4.50383900 H -3.89690100 1.03909100 -3.16171800 H -4.44154800 -0.52497200 -3.80661400
Electronic Supplementary Material (ESI) for Chemical CommunicationsThis journal is © The Royal Society of Chemistry 2012

S15
References
S1 W.-D. Emmerich, E. Post, J. Therm. Anal., 1997, 49, 1007.
S2 E. Kaisersberger, E. Post, Thermochim. Acta, 1997, 295, 73.
S3 B. Horn, S. Pfirrmann, C. Limberg, C. Herwig, B. Braun, S. Mebs, R. Metzinger, Z.
Anorg. Allg. Chem., 2011, 637, 1169.
S4 B. Horn, C. Limberg, C. Herwig, S. Mebs, Angew. Chem., 2011, 123, 12829; Angew.
Chem. Int. Ed., 2011, 50, 12621.
S5 M. Maciejewski, C.A. Müller, R. Tschan, W.-D. Emmerich, A. Baiker,
Thermochim. Acta, 1997, 295, 167.
S6 M. J. Frisch, G. W. Trucks, H. B. Schlegel, G. E. Scuseria, M. A. Robb, J. R.
Cheeseman, G. Scalmani, V. Barone, B. Mennucci, G. A. Petersson, H. Nakatsuji, M.
Caricato, X. Li, H. P. Hratchian, A. F. Izmaylov, J. Bloino, G. Zheng, J. L.
Sonnenberg, M. Hada, M. Ehara, K. Toyota, R. Fukuda, J. Hasegawa, M. Ishida, T.
Nakajima, Y. Honda, O. Kitao, H. Nakai, T. Vreven, J. A. Montgomery, Jr., J. E.
Peralta, F. Ogliaro, M. Bearpark, J. J. Heyd, E. Brothers, K. N. Kudin, V. N.
Staroverov, R. Kobayashi, J. Normand, K. Raghavachari, A. Rendell, J. C. Burant, S.
S. Iyengar, J. Tomasi, M. Cossi, N. Rega, J. M. Millam, M. Klene, J. E. Knox, J. B.
Cross, V. Bakken, C. Adamo, J. Jaramillo, R. Gomperts, R. E. Stratmann, O. Yazyev,
A. J. Austin, R. Cammi, C. Pomelli, J. W. Ochterski, R. L. Martin, K. Morokuma, V.
G. Zakrzewski, G. A. Voth, P. Salvador, J. J. Dannenberg, S. Dapprich, A. D. Daniels,
Ö. Farkas, J. B. Foresman, J. V. Ortiz, J. Cioslowski, and D. J. Fox, Gaussian 09,
Revision A.02; Gaussian, Inc., Wallingford CT, 2009.
S7 a) A. D. Becke, Phys. Rev. A, 1988, 38, 3098; b) C. Lee, W. Yang, R. G. Parr, Phys.
Rev. B, 1988, 37, 785; c) A. D Becke, J. Chem. Phys., 1993, 98, 5648.
S8 F. Weigend, R. Ahlrichs, Phys. Chem. Chem. Phys., 2005, 7, 3297.
S9 D. Rappoport, F. Furche, J. Chem. Phys., 2010, 133, 134105.
S10 a) D. Feller, J. Comp. Chem., 1996, 17, 1571; b) K. L. Schuchardt, B. T. Didier, T.
Elsethagen, L. Sun, V. Gurumoorthi, J. Chase, J. Li, T. L. Windus, J. Chem. Inf.
Model., 2007, 47, 1045.
S11 E. D. Glendening, J. K. Badenhoop, A. E. Reed, J. E. Carpenter, J. A. Bohmann, C. M.
Morales, F. Weinhold, Theoretical Chemistry Institute, University of Wisconsin,
Madison, WI, 2001; http://www.chem.wisc.edu/~nbo5.
Electronic Supplementary Material (ESI) for Chemical CommunicationsThis journal is © The Royal Society of Chemistry 2012