co transport - ieaghg
TRANSCRIPT
CO2 Transport IEAGHG 10th International CCS Summer School
Regina, Saskatchewan, Canada July 21, 2016
Melanie D. Jensen, Senior Chemical Engineer
CO2 Capture and Infrastructure Engineering Team Lead
© 2016 University of North Dakota Energy & Environmental Research Center.

2
APPROACHES TO TRANSPORTING CO2
Ship
Photo from http://maritime-connector.com/ship/yara-embla-9279446/
Pipeline
Photo from http://k2radio.com/greencore-pipeline-dedicated-bringing-co2-to-montana-and-wyoming/
Photos from https://netl.doe.gov/publications/proceedings/04/RCSP/Illinois%20State%20Geological%20Survey.pdf
Road Rail

3
FLUIDS CARRIED BY PIPELINE
Pipeline construction, operation, and monitoring methods are well-known because many commodities are transported by pipeline. Some examples include: • Natural gas (methane). • Gasoline. • Crude oil. • CO2. • Beer (Bruges, Belgium).
Photo from https://si.wsj.net/public/resources/images/BN-NV499_0503be_J_20160503125715.jpg

4
CO2 PIPELINE DESIGN • Similar in design to gas and oil pipelines, although
the higher pressures seen by CO2 pipelines are often accommodated with thicker pipe.
• Carbon steel is typically used.
– CO2 must not contain any free water.
– Materials costs make up 15%−35% of the total onshore pipeline cost.
• Pressure. – Natural gas transported at roughly 20.7–82.7 bar
(300−1200 psig). Compressors are used at booster stations.
– CO2 transported at 82.7–206.8 bar (1200−3000 psig), which is as a supercritical fluid. Pumps are often used at booster stations.
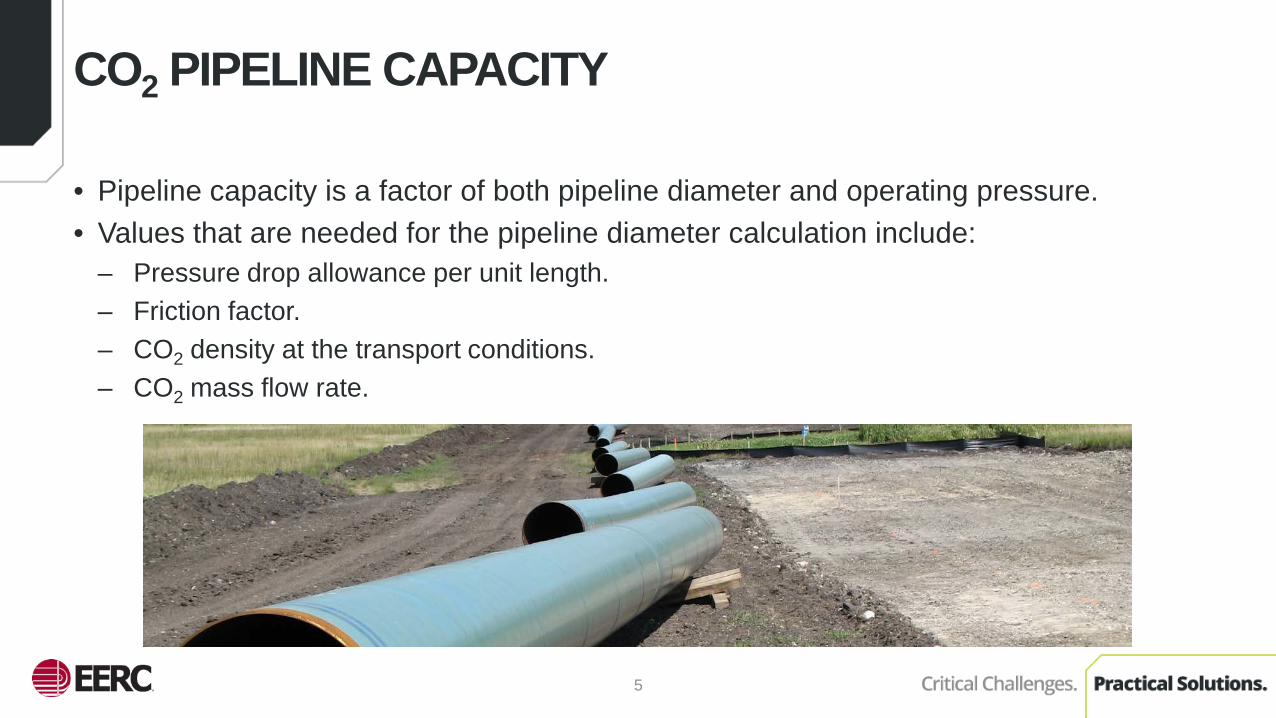
• Pipeline capacity is a factor of both pipeline diameter and operating pressure. • Values that are needed for the pipeline diameter calculation include:
– Pressure drop allowance per unit length. – Friction factor. – CO2 density at the transport conditions. – CO2 mass flow rate.
5
CO2 PIPELINE CAPACITY
6
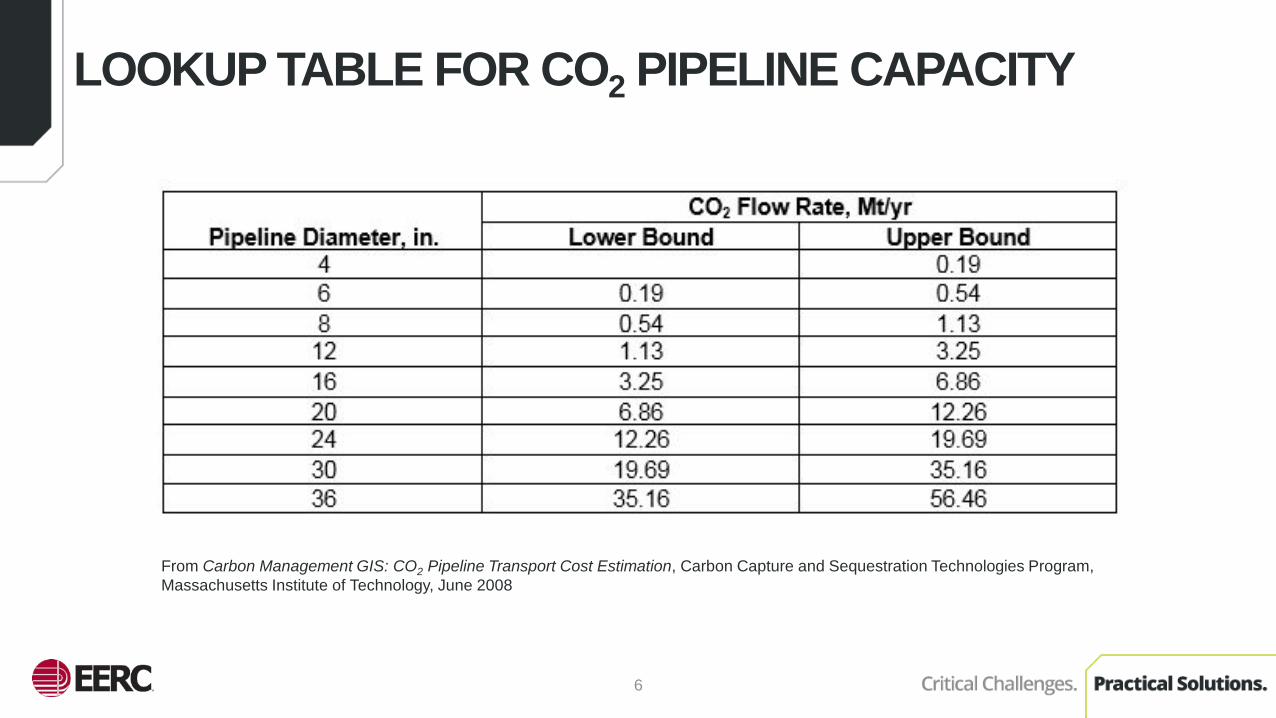
LOOKUP TABLE FOR CO2 PIPELINE CAPACITY
From Carbon Management GIS: CO2 Pipeline Transport Cost Estimation, Carbon Capture and Sequestration Technologies Program, Massachusetts Institute of Technology, June 2008
7
CO2 PIPELINE SPECIFICATIONS
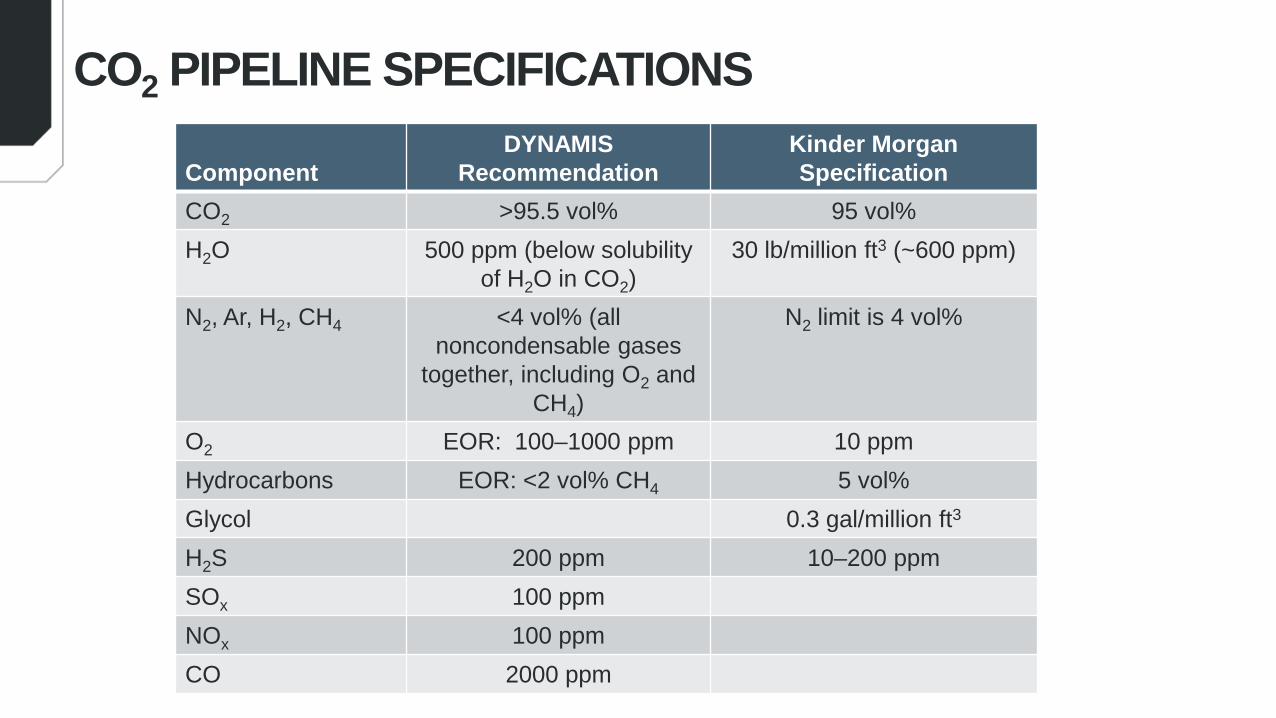
Component DYNAMIS
Recommendation Kinder Morgan Specification
CO2 >95.5 vol% 95 vol% H2O 500 ppm (below solubility
of H2O in CO2) 30 lb/million ft3 (~600 ppm)
N2, Ar, H2, CH4 <4 vol% (all noncondensable gases
together, including O2 and CH4)
N2 limit is 4 vol%
O2 EOR: 100–1000 ppm 10 ppm Hydrocarbons EOR: <2 vol% CH4 5 vol% Glycol 0.3 gal/million ft3
H2S 200 ppm 10–200 ppm SOx 100 ppm NOx 100 ppm CO 2000 ppm

Impurities • Change the physical and transport properties
of CO2. • Affect the CO2 hydraulics, which in turn affect
the number of compressors, compressor power requirements, temperature transients, etc.
• Change other aspects, such as fracture propagation, corrosion, nonmetallic component deterioration, and the formation of hydrates and clathrates.
• Change the capacity of the pipeline itself.
8
Flow Rate • Can affect the ability to maintain a consistent
temperature and pressure within the pipeline. This can be exacerbated by topography effects.
• Operation and shut-in conditions can both be affected.
• Multiphase flow is a possibility when the pressure changes. This makes transport more difficult. It is more likely to occur in pipelines that are oversized relative to the amount of CO2 being transported.
• Pressure oscillations may cause gas bubbles to form, altering the CO2 behavior and potentially damaging the pipeline.
EFFECTS ON TRANSPORT OF VARIABILITY IN THE CO2 STREAM
Safe operation of CO2 pipelines begins with a pipeline design that establishes source compositions and conditions that have an appropriate safety margin.
9
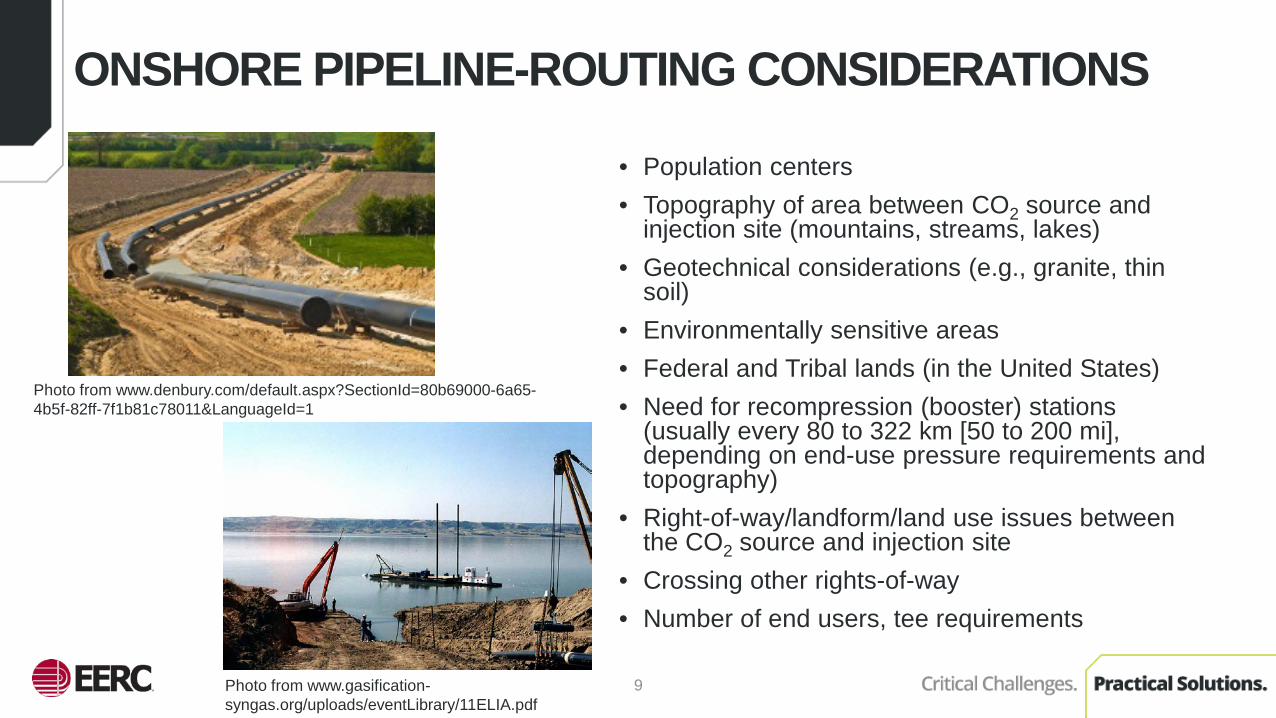
ONSHORE PIPELINE-ROUTING CONSIDERATIONS
• Population centers • Topography of area between CO2 source and
injection site (mountains, streams, lakes) • Geotechnical considerations (e.g., granite, thin
soil) • Environmentally sensitive areas • Federal and Tribal lands (in the United States) • Need for recompression (booster) stations
(usually every 80 to 322 km [50 to 200 mi], depending on end-use pressure requirements and topography)
• Right-of-way/landform/land use issues between the CO2 source and injection site
• Crossing other rights-of-way • Number of end users, tee requirements
Photo from www.gasification-syngas.org/uploads/eventLibrary/11ELIA.pdf
Photo from www.denbury.com/default.aspx?SectionId=80b69000-6a65-4b5f-82ff-7f1b81c78011&LanguageId=1
10
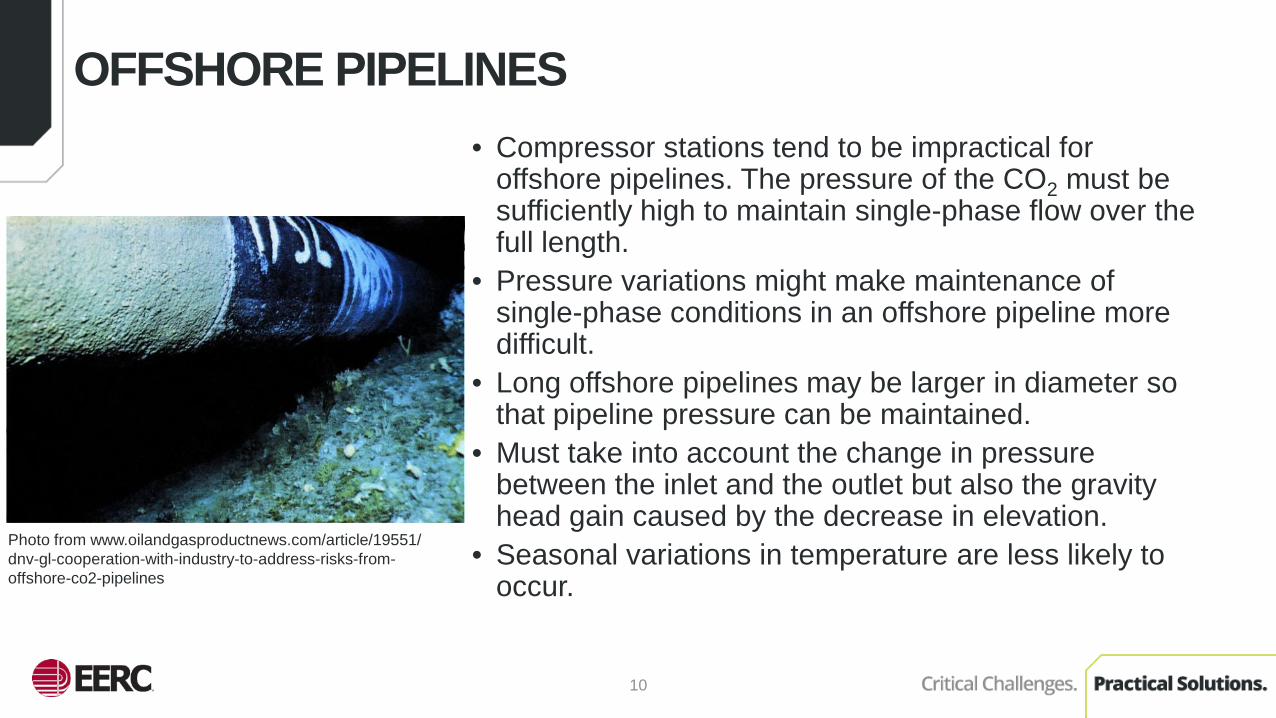
OFFSHORE PIPELINES • Compressor stations tend to be impractical for
offshore pipelines. The pressure of the CO2 must be sufficiently high to maintain single-phase flow over the full length.
• Pressure variations might make maintenance of single-phase conditions in an offshore pipeline more difficult.
• Long offshore pipelines may be larger in diameter so that pipeline pressure can be maintained.
• Must take into account the change in pressure between the inlet and the outlet but also the gravity head gain caused by the decrease in elevation.
• Seasonal variations in temperature are less likely to occur.
Photo from www.oilandgasproductnews.com/article/19551/ dnv-gl-cooperation-with-industry-to-address-risks-from-offshore-co2-pipelines

The OCAP CO2 pipeline carries about 400,000 tonnes/yr of CO2 through a 97-km (60 mi) pipeline to greenhouses to enhance plant growth. The CO2 is produced by a Shell refinery and an Abengoa bioethanol plant.
11
ROTTERDAM CO2 PIPELINE HUB
Map from www.globalccsinstitute.com/sites/www.globalccsinstitute.com/files/content/ media_release/123054/files/ROAD%20presentation%20Andy%20Read%20@ MEP%20meeting%20(Strasbourg%2028%20April%202015)%20fina....pdf

12
• There is more than 6600 km (4100 mi) of CO2 pipelines in the United States with a maximum capacity of more than 170 Mt/yr. Additional pipelines are planned in Canada and the United States but are not shown on this map.
• The CO2 pipelines in the United States are predominantly used to transport CO2 for use in enhanced oil recovery.
• In more than 30 years of operation, there have been no casualties or fatalities associated with these CO2 pipelines.
CO2 PIPELINES IN THE UNITED STATES
13
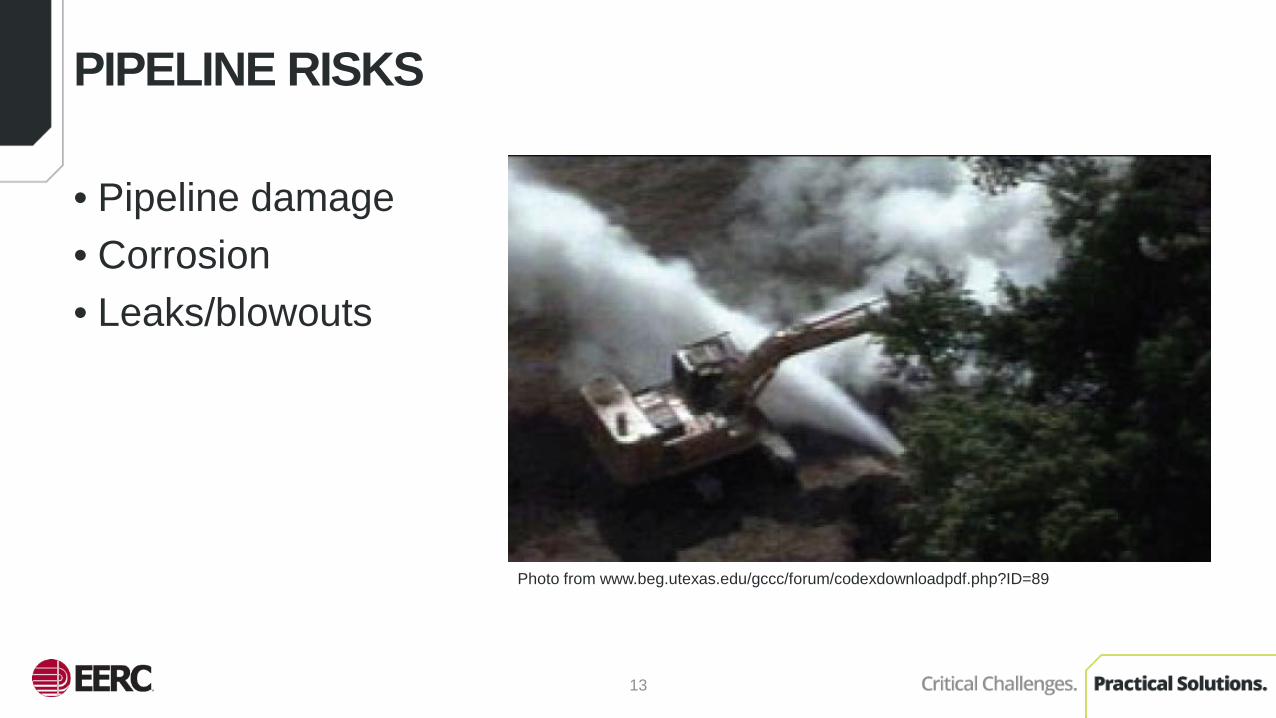
PIPELINE RISKS
• Pipeline damage • Corrosion • Leaks/blowouts
Photo from www.beg.utexas.edu/gccc/forum/codexdownloadpdf.php?ID=89
14
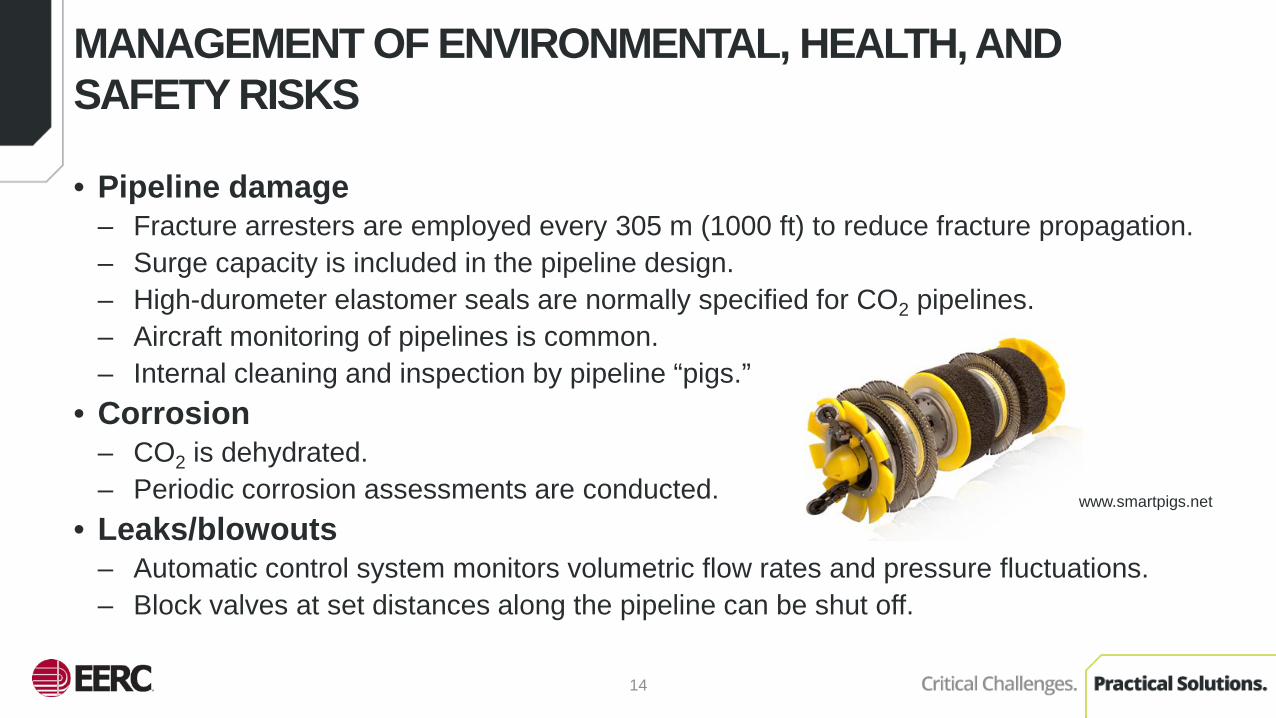
MANAGEMENT OF ENVIRONMENTAL, HEALTH, AND SAFETY RISKS
• Pipeline damage – Fracture arresters are employed every 305 m (1000 ft) to reduce fracture propagation. – Surge capacity is included in the pipeline design. – High-durometer elastomer seals are normally specified for CO2 pipelines. – Aircraft monitoring of pipelines is common. – Internal cleaning and inspection by pipeline “pigs.”
• Corrosion – CO2 is dehydrated. – Periodic corrosion assessments are conducted.
• Leaks/blowouts – Automatic control system monitors volumetric flow rates and pressure fluctuations. – Block valves at set distances along the pipeline can be shut off.
www.smartpigs.net

15
TRANSPORT OF CO2 BY SHIP
Pipelines Ships High capital cost, low operating cost Low capital cost, high operating cost Low flexibility Flexibility in both volume and route Onshore pipelines require compression
Require onshore intermediate storage and liquefaction facilities
More difficult to reuse other types of pipelines for CO2
Easier to reuse ships for other types of gases
Photo from http://maritime-connector.com/ship/yara-embla-9279446/

• Development of a Global CO2 Pipeline Infrastructure
Report: 2010/13 • CO2 Pipeline Infrastructure Report: 2013/18 • Operational Flexibility of CO2
Transport and Storage Report: 2016/04
16
IEAGHG R&D PROGRAMME PIPELINE REPORTS

17
CCS IS MISSING THE “T”
Pipeline Transport of CO2 is critical to CCS. • Without pipelines, there can
be no commercial-scale CCS. • Unlike capture, no new
technologies are required.
Photo from www.gasification-syngas.org/uploads/eventLibrary/11ELIA.pdf
18
CONTACT INFORMATION
Energy & Environmental Research Center University of North Dakota 15 North 23rd Street, Stop 9018 Grand Forks, ND 58202-9018 www.undeerc.org 701.777.5115 (phone) 701.777.5181 (fax) Melanie D. Jensen, Senior Chemical Engineer CO2 Capture and Infrastructure Engineering Team Lead [email protected]

THANK YOU!