co2 storage capacity estimation under geological
TRANSCRIPT

Vol.:(0123456789)1 3
Journal of Petroleum Exploration and Production https://doi.org/10.1007/s13202-021-01192-4
ORIGINAL PAPER-EXPLORATION GEOLOGY
CO2 storage capacity estimation under geological uncertainty using 3‑D geological modeling of unconventional reservoir rocks in Shahejie Formation, block Nv32, China
Ayman Mutahar AlRassas1 · Shaoran Ren1 · Renyuan Sun1 · Hung Vo Thanh2 · Zhenliang Guan3
Received: 24 March 2021 / Accepted: 16 May 2021 © The Author(s) 2021
AbstractUnderground CO2 storage is a promising technology for mitigating climate change. In this vein, the subsurface condition was inherited a lot of uncertainties that prevent the success of the CO2 storage project. Therefore, this study aims to build the 3D model under geological uncertainties for enhancing CO2 storage capacity in the Shahejie Formation (Es1), Nv32 block, China. The well logs, seismic data, and geological data were used for the construction of 3-D petrophysical models. The target study area model focused on four units (Es1 × 1, Es1 × 2, Es1 × 3, and Es1 × 4) in the Shahejie Formation. Well logs were utilized to predict petrophysical properties; the lithofacies indicated that the Shahejie Formation units are sandstone, shale, and limestone. Also, the petrophysical interpretation demonstrated that the Es1 reservoir exhibited high percentage porosity, permeability, and medium to high net-to-gross ratios. The static model showed that there are lateral heterogeneities in the reservoir properties and lithofacies; optimal reservoir rocks exist in Es1 × 4, Es1 × 3, and Es1 × 2 units. Moreover, the pore volume of the Es1 unit was estimated from petrophysical property models, ranging between 0.554369 and 10.03771 × 10⁶ sm3, with a total volumetric value of 20.0819 × 10⁶ sm3 for the four reservoir units. Then, the 100–400 realizations were gener-ated for the pore volume uncertainties assessment. In consequence, 200 realizations were determined as an optimal solution for capturing geological uncertainties. The estimation of CO2 storage capacity in the Es1 formation ranged from 15.6 to 207.9 × 10⁹ t. This result suggests the potential of CO2 geological storage in the Shahejie Formation, China.
Keywords 3-D geological model · Geological uncertainty · CO2 storage capacity · Unconventional oil reservoir · Tight oil reservoir · Nv32 block
Introduction
Carbon capture and storage is an alternative approach for minimizing CO2 emissions to the atmosphere (Vo Thanh et al. 2019; Ampomah et al. 2017b). In general, CO2 can be stored in different subsurface sites, such as deep saline
aquifers, coal bed seams, unconventional resources, and depleted petroleum reservoirs (Vo Thanh et al. 2020b, 2020a). Among these storage sites, saline aquifers have the largest CO2 storage capacity (Vo Thanh et al. 2019). How-ever, depleted petroleum reservoirs are the most suitable candidates because the CO2 injection process can improve oil recovery (Vo Thanh et al. 2019). Improving the oil recov-ery is therefore feasible by injecting CO2 into oil-bearing reservoirs. This method, known as CO2-enhanced oil recov-ery (CO2-EOR), combined with gas storage, can be used to alleviate the cost of sequestration (Zhong and Carr 2019; Vo Thanh et al. 2019).
Mitigating CO2 seepage hazards implies a reduction in perpendicular CO2 migration by selecting appropriate storage sites. Three-dimensional (3-D) reservoir geologi-cal modeling is currently an effective method for evaluat-ing the CO2 storage capacity. Several recent studies have examined the CO2 storage capacity using 3-D geological
* Ayman Mutahar AlRassas [email protected]
* Hung Vo Thanh [email protected]
1 School of Petroleum Engineering, China University of Petroleum (East China), Qingdao, China
2 School of Earth and Environmental Sciences, Seoul National University, Seoul, Korea
3 Faculty of Earth Resources, China University of Geosciences, Wuhan, China

Journal of Petroleum Exploration and Production
1 3
models (Ampomah et al. 2017a; Anderson 2017; Spencer 1987; Alcalde et al. 2018). These models are an appropriate approach that integrates all available geological, geophysi-cal, and engineering data (Hirsche et al. 1997; Bueno et al. 2011; Abdideh and Bargahi 2012; Dai et al. 2016). Accord-ing to recent studies, 3-D geostatistical modeling can sup-port the evaluation of potential CO2 storage areas in hydro-carbon reservoirs (Vo Thanh et al. 2019, 2020b; Rahim et al. 2015; Yin et al. 2017). Therefore, geological modeling is a promising tool for maximizing CO2 utilization in petroleum resources (Kamali et al. 2013; Zamora Valcarce et al. 2006; Metwalli et al. 2017).
The assessment and management of subsurface uncer-tainties have increasingly become more important in the petroleum industry sector. The aim is to enhance reserve portfolios, implement appropriate field developments, and strengthen technical operations, particularly with respect to well planning (Kamali et al. 2013). Stochastic approaches are used to screen and value hydrocarbon assets (Bueno et al. 2011; Kamali et al. 2013).
Using Monte Carlo simulations, subsurface models can reduce the geological uncertainty, thus improving the prob-ability of CO2 storage project success (Dai et al. 2016; Hir-sche et al. 1997). Additionally, the geological uncertainty assessment provides a better understanding of the P10, P50, and P90 values. These values can provide an enhanced per-spective on the static and dynamic CO2 storage capacity at the target site (Bueno et al. 2011).
As sampling and direct multiplication of Monte Carlo loops is straightforward and fast, thousands of Monte Carlo loops can be implemented for accurate output distributions. Although these methods are fast, determining the intrinsic dependencies among all of the input variables is difficult, often providing no quantification or visualization of the spa-tial location and variability in the uncertainty. A 3-D model
is an alternative approach for volumetric determinations, facilitating a practical treatment of the dependence between various input variables while enhancing knowledge on the spatial heterogeneity in the uncertainty (Kamali et al. 2013; Abdideh and Bargahi 2012; Kamali et al. 2013). The geo-logical structure of a reservoir, variation in its petrophysical properties, and the gas oil contact and oil water contact are considered the main sources of uncertainty (Kamali et al. 2013). The probabilistic distribution of the gross rock vol-ume (GRV) (MMm3) and stock-tank oil initially in place (STOIIP) can then be determined, as well as the use of reli-able volume computations and risk evaluations (Bueno et al. 2011; Satter and Iqbal 2016). Moreover, few studies have focused on the gap between CO2 storage and geological uncertainties, whereas the performance of the CO2 storage assessment affects the geological uncertainty. Therefore, we address comprehensive 3-D reservoir geological modeling as a multi-objective function of the four reservoir units in the Paleogene Shahejie Formation (Es1) and compute the CO2 storage capacity based on the geological uncertainty in the Nv32 block of the Shenvsi oilfield (Fig. 1). This study also aims to provide a systematic overview of the potential for the geological sequestration of CO2 while improving oil recovery and CO2 storage.
Study area
The Shahejie Formation (Es1) of the Nv32 block is situ-ated in the Shenvsi oilfield in the southern region of Cang-zhou City, Hebei Province. The Shenvsi oilfield structure is located within the Cangxian and Kongdian structures. Sev-eral oilfields exist as a result of the structural complexity and fault evolution within the Shenvsi oilfield. Furthermore, the sedimentary stratigraphy of the study area comprises
Fig. 1 Map of the Shahejie Formation in the Nv32 block
Journal of Petroleum Exploration and Production
1 3
Eocene to Pliocene rock successions, which include four major lithostratigraphic formations, i.e., the Shahejie, Dong-ying, Guantao, and Minghuazhen formations, from oldest to youngest. The structural area of the sand–oil top structure is 2.0 km2, the structural width is 100 m, the proven oil-bear-ing area is 1.4 km2, and the petroleum geological reserves are 225 × 104 t (Rassas et al. 2020; Ling and Qingkui 2017). Figure 1 shows the oilfield locations.
Databases and methodology
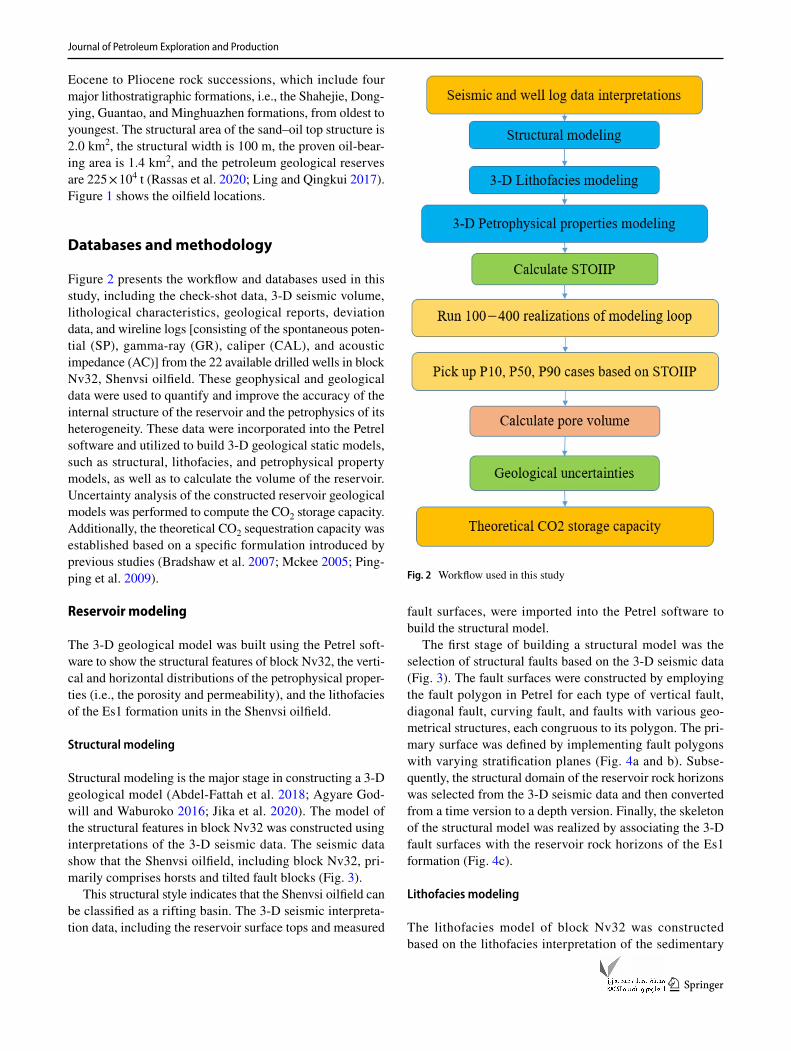
Figure 2 presents the workflow and databases used in this study, including the check-shot data, 3-D seismic volume, lithological characteristics, geological reports, deviation data, and wireline logs [consisting of the spontaneous poten-tial (SP), gamma-ray (GR), caliper (CAL), and acoustic impedance (AC)] from the 22 available drilled wells in block Nv32, Shenvsi oilfield. These geophysical and geological data were used to quantify and improve the accuracy of the internal structure of the reservoir and the petrophysics of its heterogeneity. These data were incorporated into the Petrel software and utilized to build 3-D geological static models, such as structural, lithofacies, and petrophysical property models, as well as to calculate the volume of the reservoir. Uncertainty analysis of the constructed reservoir geological models was performed to compute the CO2 storage capacity. Additionally, the theoretical CO2 sequestration capacity was established based on a specific formulation introduced by previous studies (Bradshaw et al. 2007; Mckee 2005; Ping-ping et al. 2009).
Reservoir modeling
The 3-D geological model was built using the Petrel soft-ware to show the structural features of block Nv32, the verti-cal and horizontal distributions of the petrophysical proper-ties (i.e., the porosity and permeability), and the lithofacies of the Es1 formation units in the Shenvsi oilfield.
Structural modeling
Structural modeling is the major stage in constructing a 3-D geological model (Abdel-Fattah et al. 2018; Agyare God-will and Waburoko 2016; Jika et al. 2020). The model of the structural features in block Nv32 was constructed using interpretations of the 3-D seismic data. The seismic data show that the Shenvsi oilfield, including block Nv32, pri-marily comprises horsts and tilted fault blocks (Fig. 3).
This structural style indicates that the Shenvsi oilfield can be classified as a rifting basin. The 3-D seismic interpreta-tion data, including the reservoir surface tops and measured
fault surfaces, were imported into the Petrel software to build the structural model.
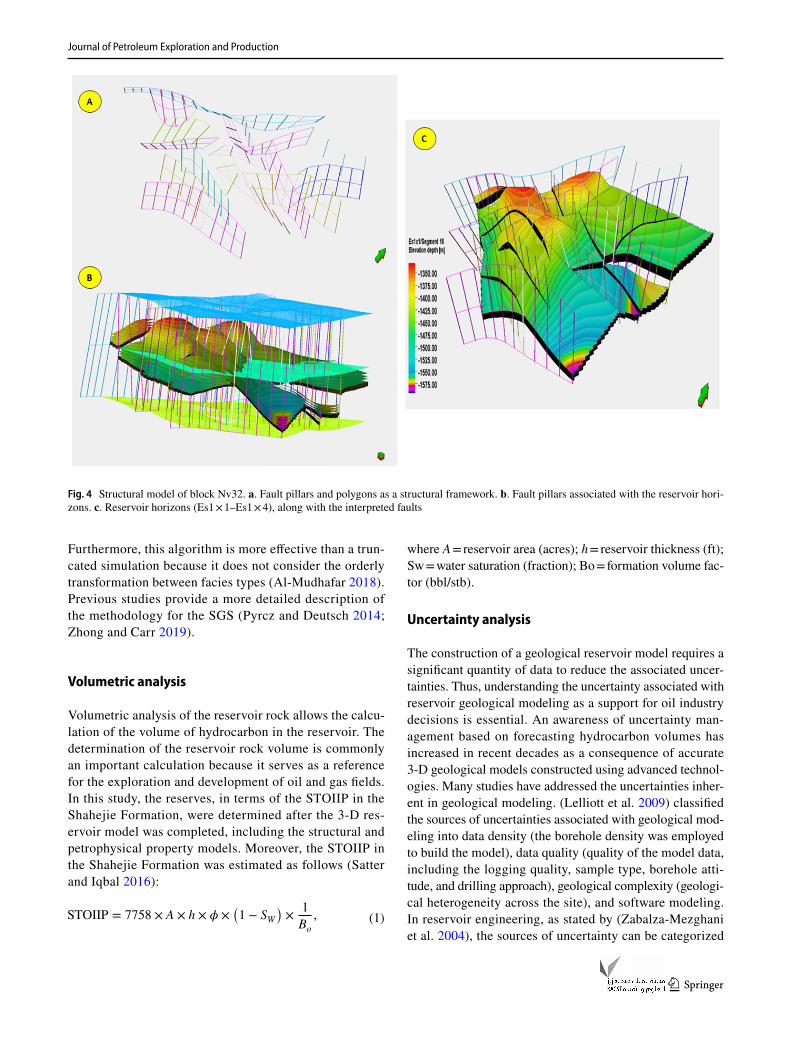
The first stage of building a structural model was the selection of structural faults based on the 3-D seismic data (Fig. 3). The fault surfaces were constructed by employing the fault polygon in Petrel for each type of vertical fault, diagonal fault, curving fault, and faults with various geo-metrical structures, each congruous to its polygon. The pri-mary surface was defined by implementing fault polygons with varying stratification planes (Fig. 4a and b). Subse-quently, the structural domain of the reservoir rock horizons was selected from the 3-D seismic data and then converted from a time version to a depth version. Finally, the skeleton of the structural model was realized by associating the 3-D fault surfaces with the reservoir rock horizons of the Es1 formation (Fig. 4c).
Lithofacies modeling
The lithofacies model of block Nv32 was constructed based on the lithofacies interpretation of the sedimentary
Fig. 2 Workflow used in this study

Journal of Petroleum Exploration and Production
1 3
environments obtained from the well logs. The well log-based lithofacies results showed that the Es1 units in block Nv32 mainly comprise three lithologies, i.e., shale, lime-stone, and sandstone. The well log-based lithofacies results from the 22 wells were imported to the Geomap 3.6 soft-ware. Additionally, data for the facies model were then extracted from Geomap 3.6 and imported to the Petrel soft-ware to construct the lithofacies model of block Nv32.
Facies modeling requires different facies approaches, such as object modeling, which is typically utilized for litho-facies modeling. However, in this model, the assigned values were employed to populate discrete lithofacies models based on grids of different bodies with various geometries, facies codes, and fractions. Facies modeling in a 3-D space was simulated using the simulation sequential indicator (SIS) method.
Petrophysical property modeling
Petrophysical property modeling is a critical stage in res-ervoir characterization because it significantly influences the heterogeneity and flows modeling. In this study, the petrophysical properties of the four formation units within the Es1 Formation of block Nv32 were estimated from the well-logging data using the Petrel software. Based on the well log, the petrophysical properties were up-scaled and laterally dispersed using the sequential Gaussian simula-tion (SGS) method. This method is the most prominent geostatistical technique for constructing stochastic random fields of continuous parameters, including permeability and porosity (Pyrcz and Deutsch 2014; Zhong and Carr 2019). The SGS method has been successfully imple-mented to generate several equiprobable realizations of the distributions of the petrophysical properties to obtain the uncertainty (Mckee 2005; Pingping et al. 2009).
Fig. 3 Seismic sections showing the reservoir tops of the Formation units associated with normal faults a. Es1 × 1, b. Es1 × 2, c. Es1 × 3, and d. Es1 × 4. Vertical lines represent the locations of the wells
Journal of Petroleum Exploration and Production
1 3
Furthermore, this algorithm is more effective than a trun-cated simulation because it does not consider the orderly transformation between facies types (Al-Mudhafar 2018). Previous studies provide a more detailed description of the methodology for the SGS (Pyrcz and Deutsch 2014; Zhong and Carr 2019).
Volumetric analysis
Volumetric analysis of the reservoir rock allows the calcu-lation of the volume of hydrocarbon in the reservoir. The determination of the reservoir rock volume is commonly an important calculation because it serves as a reference for the exploration and development of oil and gas fields. In this study, the reserves, in terms of the STOIIP in the Shahejie Formation, were determined after the 3-D res-ervoir model was completed, including the structural and petrophysical property models. Moreover, the STOIIP in the Shahejie Formation was estimated as follows (Satter and Iqbal 2016):
(1)STOIIP = 7758 × A × h × � ×(
1 − SW)
×1
Bo
,
where A = reservoir area (acres); h = reservoir thickness (ft); Sw = water saturation (fraction); Bo = formation volume fac-tor (bbl/stb).
Uncertainty analysis
The construction of a geological reservoir model requires a significant quantity of data to reduce the associated uncer-tainties. Thus, understanding the uncertainty associated with reservoir geological modeling as a support for oil industry decisions is essential. An awareness of uncertainty man-agement based on forecasting hydrocarbon volumes has increased in recent decades as a consequence of accurate 3-D geological models constructed using advanced technol-ogies. Many studies have addressed the uncertainties inher-ent in geological modeling. (Lelliott et al. 2009) classified the sources of uncertainties associated with geological mod-eling into data density (the borehole density was employed to build the model), data quality (quality of the model data, including the logging quality, sample type, borehole atti-tude, and drilling approach), geological complexity (geologi-cal heterogeneity across the site), and software modeling. In reservoir engineering, as stated by (Zabalza-Mezghani et al. 2004), the sources of uncertainty can be categorized
Fig. 4 Structural model of block Nv32. a. Fault pillars and polygons as a structural framework. b. Fault pillars associated with the reservoir hori-zons. c. Reservoir horizons (Es1 × 1–Es1 × 4), along with the interpreted faults

Journal of Petroleum Exploration and Production
1 3
throughout the geological modeling process. These uncer-tainties occur in static geological models, fluid flow mod-eling, up-scaling, the incorporation of production data, and economic assessments. Bueno et al. (2011) categorized the various uncertainty behaviors, including discrete and deter-ministic stochastic uncertainties. Therefore, the uncertainties associated with the input datasets utilized to construct 3-D geological models cannot be represented by a single deter-ministic realization, which produces significant uncertainty during reservoir estimation when combining sources.
Furthermore, 3-D models still comply with these rules, and the presence of significant uncertainty elements, which occur in model construction, remains irrefutable. The vol-umetric equation is usually used to define the number of errors; however, modern technology has enabled the use of 3-D models as a basis to facilitate evaluations of this uncer-tainty within a reservoir. The use of these 3-D models has several benefits over an assessment, depending on the direct implementation of volumetric equations. Among these bene-fits, 3-D models facilitate the realistic visualization of intrin-sic correlations; the resulting accuracy of the uncertainty estimation allows the establishment of a strong foundation for capital management. In this model, for the geological uncertainty, calculating the pore volume is essential. Thus, 100–400 cases were simulated for the uncertainty evalua-tion to define the pore volume by changing the variogram parameter in the Petrel software. The probability distribution of the pore volume was determined using the Monte Carlo sampling approach. Subsequently, the results for P10, P50, and P90 were adopted for the risk evaluation of the theoreti-cal CO2 storage capacity.
Theoretical ��2 Storage Capacity
This study mainly focused on the theoretical CO2 storage capacity in the structural and stratigraphic trapping, given as follows:
where MCO2 is the mass CO2 storage capacity (Mt), A is the trap area ( m2 ), h is the thickness (m), ϕ is the porosity (lrb%), Siir is the irreducible water saturation (lrb%), B is the formation volume factor ( m3∕m3 ), �CO2 is the density of CO2 ( kg∕m3 ), and E is the coefficient of the capacity integrated by the traps, CO2 sweep, and buoyancy efficiency (IEA 2020; Anon 1981).
(2)MCO2 = A × h × � ×(
1 − Swiir)
× B × �CO2 × E,
The CO2 storage mass can be characterized as an effective capacity by multiplying by the storage effective coefficient, C, which is the trapping efficiency. The storage mass can be determined based on the reservoir simulation. The trap area, thickness, and porosity were precisely estimated using the 3-D reservoir geological model. Therefore, rather than Eq. (2), we changed the grid pore summation volumes �
VPV =∑
i
Ai × hi × �i
�
to replace A × h × � , where Ai is
the grid area, hi is the grid thickness, and �i is the porosity of the grid; thus, the new equation was as follows (Vo Thanh et al. 2019):
where VPV is the total pore volume ( m3).
Results and discussion
3‑D reservoir geological models
In block Nv32 of the Shenvsi oilfield, the Es1 Formation was the main reservoir rock, which was divided into four zones, i.e., Es1 × 1, Es1 × 2, Es1 × 3, and Es1 × 4, from top to bottom, based on the well log and seismic data, providing effective compatibility (Figs. 5 and 6). The geological char-acteristics, such as the significant change in thickness of the four Es1 zones, were obtained based on the correlations of the wells used in this study (Fig. 5f). The four horizons were also mapped in 3-D model space. These reservoir units are laterally extensive throughout the model area and influenced by the interpreted normal faults (Fig. 5a–d).
The seismic data, horizon, and fault surfaces were inter-preted (Fig. 6a–c), followed by structural modeling (Fig. 6e). The structural model of block Nv32 displays a network of faults related to the syndepositional tectonic event. These sets of normal faults control the entire area of block Nv32, covering up to 70%; they are mainly NE–SW-trending and dip toward the NW–SE (Fig. 6d).
The petrophysical models of block Nv32 were developed based on the petrophysical parameters, i.e., porosity, perme-ability, and net-to-gross ratio (NTG). These were obtained through a well log analysis of the wells (Fig. 1).
Porosity refers to the quantity of oil that occupies the pore space of a reservoir. Thus, the oil volume capacity in the oil reservoir was estimated by measuring its porosity.
(3)MCO2 = VPV ×(
1 − Swiir)
× B × �CO2 × E,

Journal of Petroleum Exploration and Production
1 3
Fig. 5 Results of surface modeling in block Nv32. Elevation depths (m) of the a. Es1 × 1, b. Es1 × 2, c. Es1 × 3, and d. Es1 × 4 reservoir units. E. Depth modeling of all of the Es1 reservoir units. F. Cross section of the wells used in this study

Journal of Petroleum Exploration and Production
1 3
Permeability is another crucial parameter for determining the characteristics of reservoir rocks. Permeability is utilized to facilitate the transmission of reservoir fluid in the subsur-face rock to the well surface.
Fig. 6 Structural modeling results for block Nv32. The left panel presents the seismic sections a–c showing the reservoir tops of the Es1 Formation associated with normal faults. d. Surfaces of the fault
network in the NE–SW, NW–SE, and E directions. e. Structural mod-eling presenting the depths of the Es1 reservoir units in contact with the normal faults
Fig. 7 Results of the reservoir porosity modeling for block Nv32. The left panel presents the porosity maps of the a. Es1 × 1, b. Es1 × 2, c. Es1 × 3, and d. Es1 × 4 reservoir units. e. Porosity modeling of all of the ES1 reservoir units. F. Cross-sectional porosity model of the wells used in this study
▸

Journal of Petroleum Exploration and Production
1 3
Journal of Petroleum Exploration and Production
1 3

Journal of Petroleum Exploration and Production
1 3
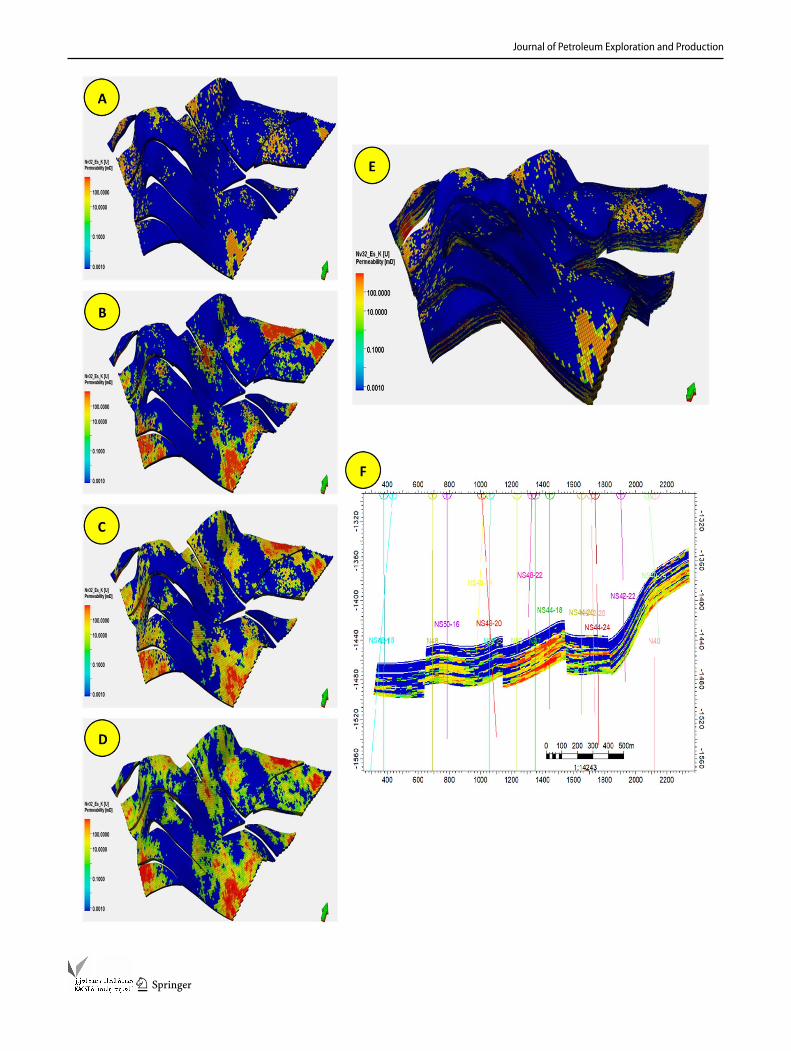
In this study, the petrophysical investigation identified four principal reservoir intervals, i.e., Es1 × 1, Es1 × 2, Es1 × 3, and Es1 × 4, from the top to the bottom. These res-ervoir units have average porosity and permeability values ranging from 2 to 36% and 0.017–974.8 mD, respectively. In contrast, the NTG ratios of these reservoir units have rela-tively low to high values ranging from 0.60 to 1.00. These petrophysical results were mapped and dispersed in a 3-D model space by up-scaling the assigned values and under-standing the reservoir quality within block Nv32.
Petrophysical models, including the porosity, perme-ability, and NTG ratio, were built for each reservoir unit throughout block Nv32 by employing the SGS technique. The 3-D models indicate that the petrophysical parameters of these four reservoir units extend laterally within the block Nv32 model, influenced by the interpreted normal faults. However, these models facilitated simulations of the spatial distribution of the petrophysical parameters and were used to determine the volume (STOIIP) of the reservoir units, indicating potential locations for future evolution within the oilfield. The 3-D spatial distribution indicates the presence of high porosity and permeability in the Es1 × 2, Es1 × 3, and Es1 × 4 reservoir units, as shown by the yellow–red color range (Figs. 7B–D and 8B–D).
In contrast, models for the Es1 × 1 reservoir unit exhib-ited lower porosity and permeability values (based on the blue–green color scheme in Figs. 7A and 8A). We note that the interpreted lithofacies of these units affect the principal petrophysical parameters of the reservoir units. In summary, the 3-D facies model revealed that the Es1 Formation is, in terms of the lithology, a more heterogene-ous reservoir rock, showing a generally larger probability distribution of shale (dominantly) and sandstone, with minor limestone, both vertically and laterally (Fig. 9).
The presence of low porosity and permeability values within the Es1 × 1 reservoir unit can likely be attributed to the presence of high shale lithofacies (Fig. 9A) because shales are commonly characterized by low petrophysical properties, i.e., porosity and permeability.
The NTG models of the Es1 × 1, Es1 × 2, Es1 × 3 and Es1 × 4 units were also mapped in a 3-D model space based on the validity of the 3-D porosity and perme-ability models. The NTG model agreed with the 3-D reservoir property models for the porosity and perme-ability, revealing that the Es1 × 2, Es1 × 3, and Es1 × 4 reservoir units generally have good NTG ratio values between 0.60 and 1.00, as indicated by the green to red colors in Fig. 10B–D. Moreover, the structural limbs of the Es1 × 1 unit in the model had significant NTG ratio values (Fig. 10A).
STOIIP Determination
The reservoir volume (STOIIP) was the last stage for assess-ing the oil capacity in the reservoir, which aimed to esti-mate the quantity of HCs in the reservoir (El Khadragy et al. 2017). Reservoir characteristics, including the porosity, per-meability, and NTG ratio, are commonly used as input data to determine the reservoir volume (Edwards and Santogrossi 1989).
The modeled petrophysical parameters of the Es1 reser-voir units, including the porosity, permeability, and NTG ratio (Figs. 7, 8, and 10), were utilized to determine the reserves in accordance with the STOIIP of block Nv32. The STOIIP of block Nv32 was estimated at approximately 20.0819 × 10⁶ sm3.
The 3-D spatial distribution indicated the presence of high potential reserves in the Es1 × 2, Es1 × 3, and Es1 × 4 reservoir units, with volumes (STOIIP) of 4.70694, 4.78284, and 10.03771 × 10⁶ sm3, respectively (Fig. 11). These res-ervoir units have porosities, permeabilities, and NTG ratios of 2–36%, 0.017–974.8 mD, and 0.60–1.00, respectively (Figs. 7b–d, 8b–d, and 10b–d). In contrast, the petrophysi-cal property models showed that the porosity, permeability, and NTG ratio of the Es1 × 1 reservoir unit in block Nv32 are 2–15%, 0.017–100 mD, and 0.10–0.25, respectively (Figs. 7a, 8a, and 10a). Moreover, we estimated a volume (STOIIP) of 0.554368 × 10⁶ sm3 (Fig. 11).
Geological uncertainties in the petrophysical models
Spatial uncertainties refer to reservoir properties that dif-fer spatially, including the petrophysical properties ratio
Fig. 8 Results of the reservoir permeability modeling for block Nv32. The left panel presents the permeability maps of the a. Es1 × 1, b. Es1 × 2, c. Es1 × 3, and d. Es1 × 4 reservoir units. e. Permeability modeling of all of the ES1 reservoir units. F. Cross-sectional perme-ability model of the wells used in this study
◂

Journal of Petroleum Exploration and Production
1 3
Fig. 9 Facies modeling results for block Nv32. The left panel presents the facies maps of the a. Es1 × 1, b. Es1 × 2, c. Es1 × 3, and d. Es1 × 4 res-ervoir units. e. Facies modeling of all of the ES1 reservoir units. f. Cross-sectional facies model of the wells used in this study
Journal of Petroleum Exploration and Production
1 3
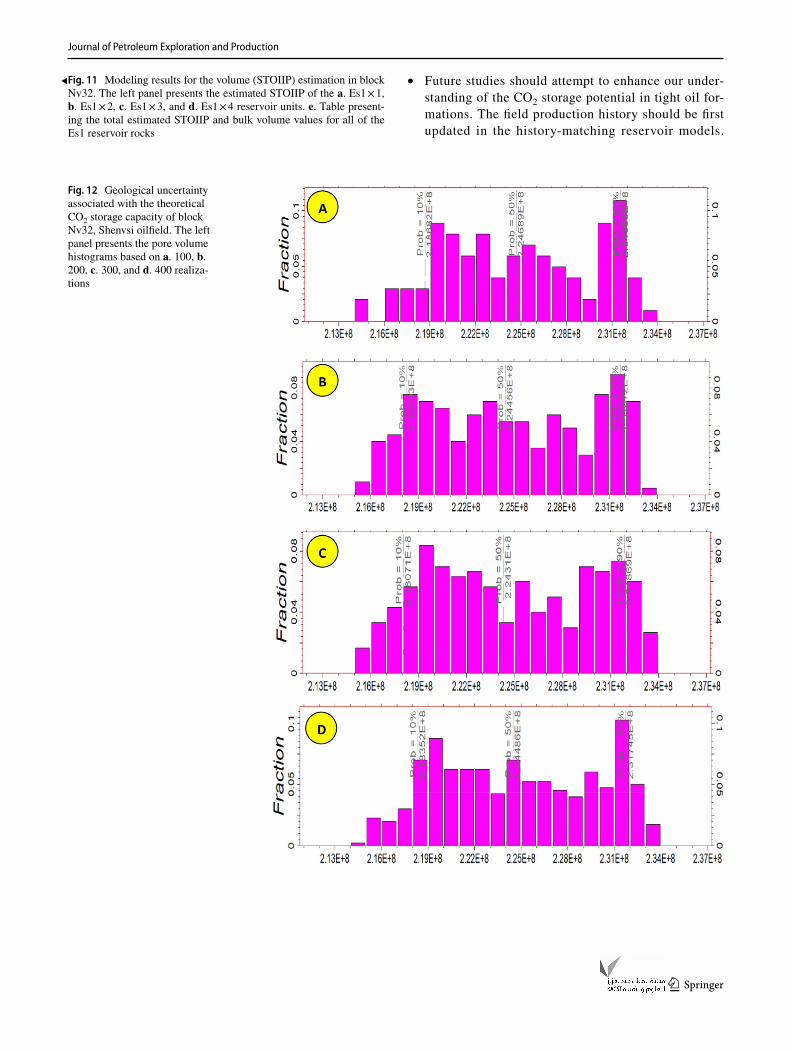
(Almeida et al. 2020). Sites for CO2 sequestration typically contain significant uncertainty within their geological char-acteristics, including the uncertainty in the petrophysical properties (Chen et al. 2020; Jin et al. 2020; Heath et al. 2012). Structural interpretation is typically achieved using many assumptions, which leads to more uncertainties in the distribution of the reservoir properties in the structural models. Additionally, the core and well log data represent the porosity and permeability, respectively. Therefore, geo-logical uncertainties also occur in the petrophysical models. Consequently, the models utilized for reservoir forecasting are vulnerable to various forms of uncertainty; moreover, interpreting and quantifying uncertainty is the most chal-lenging aspect of modeling (Demyanov et al. 2019). There-fore, we considered the geostatistical parameters for the geological uncertainties. These parameters included the major, minor, and vertical directions, with values between 600 and 800 (base value of 600), 400–700 (base value of 500), and 2–50 (base value of 10), respectively. Table 1 lists the geostatistical parameters for the geological uncertainty. These geostatistical parameters generated a large number of operations with respect to the geological uncertainties. How-ever, computing the pore volume is essential for determining the geological uncertainty. Therefore, 100‒400 operations were conducted for the geological uncertainty, which was used to estimate the pore volume by altering the variogram parameters in the Petrel software (Fig. 12). The Monte Carlo sampling approach was employed to compute the probability distribution of the pore volume.
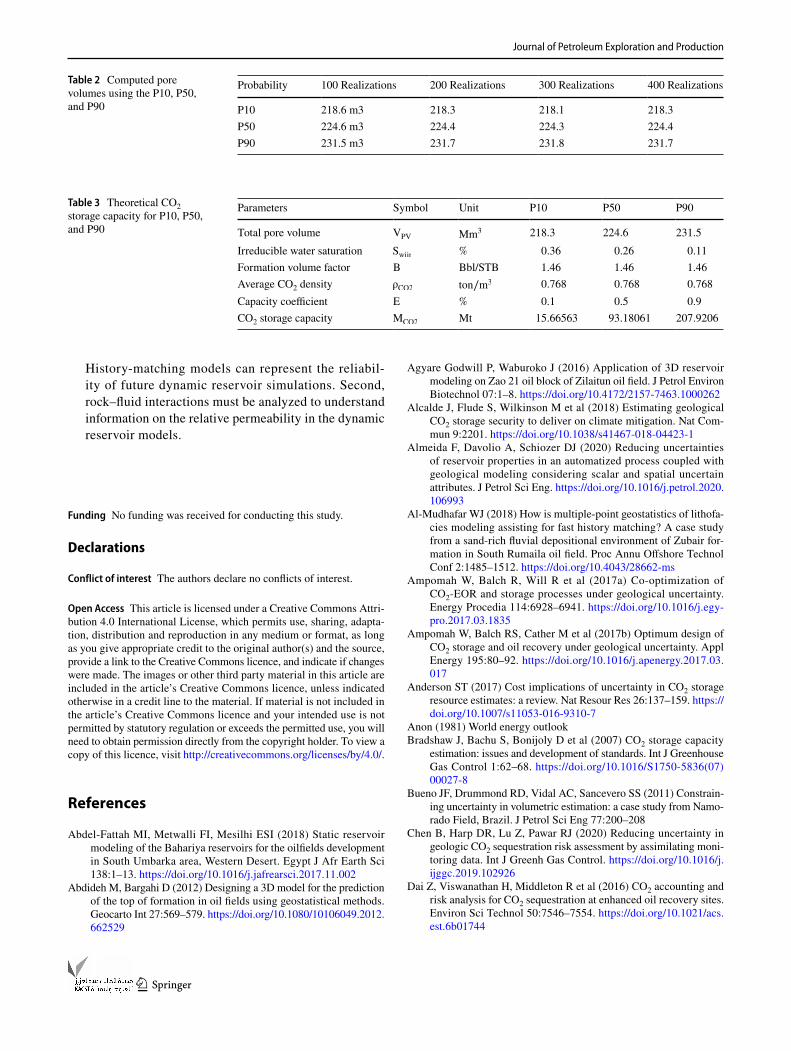
Figure 12 presents the geological uncertainty for the theoretical CO2 storage capacity in block Nv32, Shenvsi oilfield. This figure demonstrates the idea of the selected number of realizations, which will vary from case to case. The P10, P50, and P90 statistics were adopted for the risk evaluation of the theoretical CO2 storage capacity, which shows that an increase in the number of operations up to 400 does not change the results when compared with the use of 200 realizations. However, the results of the pore vol-ume uncertainties were similar to those of the uncertainty assessment based on 200 geological operations. Therefore, 200 was deemed the optimal number of realizations for the CO2 storage evaluation. Table 2 presents the computed pore
volumes using the P10, P50, and P90 statistics using geo-logical realizations.
Theoretical CO2 storage capacity
Estimating the CO2 storage capacity in a tight oil formation is convenient and straightforward, as compared with coal bed methane (CBM) and deep saline aquifers (DSA). Fur-thermore, petroleum reservoirs are better known and char-acterized than CBM and DSA media. Moreover, petroleum reservoirs are discrete instead of continuous, which allows for CO2 storage in petroleum reservoirs. The total capacity of all the reservoirs in an area determines the CO2 storage capacity in the petroleum reservoirs of a specific area and at a given scale, computed based on the reservoir proper-ties, including the oil initial in place (OIIP), temperature (T), pressure (P), permeability (k), and porosity (ϕ). The Carbon Sequestration Leadership Forum introduced a set of approaches to estimate the CO2 storage capacity for struc-tural and stratigraphic trapping, dissolution trapping, and residual gas saturation trapping. Based on these guidelines, the theoretical CO2 storage capacity was computed using Eq. (3). The least likely, P10, storage capacity was 15.6 million tons, whereas the most likely, P90, storage capacity was 207.9 million tons. Therefore, this tight oil reservoir has the potential for CO2 storage, as indicated by the large quantity of CO2. Although this unconventional oil reser-voir poses challenges for CO2 injection, the carbon capture utilization and storage guidelines suggest that a tight oil formation is a promising CO2 injection site. The advan-tage of tight oil reservoirs for CCUS includes improved oil recovery and a decrease in the rate of CO2 emissions. Additionally, the capability of these formations is unknown in the CCUS community. Thus, the theoretical CO2 storage capacity was evaluated to determine the potential of a tight oil reservoir. In summary, the advantage of CO2-EOR in tight oil reservoirs is the possibility of an additional stor-age site in the CCUS network. Owing to data availability limitations, which hinder our understanding of the CO2 flows in tight oil reservoirs, the result of this study provide a preliminary indicator for the CCUS in unconventional oil-bearing formations. Furthermore, we plan to develop

Journal of Petroleum Exploration and Production
1 3

Journal of Petroleum Exploration and Production
1 3
• The seismic and well log data indicate that the Es1 for-mation can be divided into four reservoir units. Shale is the dominant lithology, with intercalations of sandstone and limestone shale within the reservoir units, affected by interpreted normal faults.
• The well log data also indicate that the Es1 × 2, Es1 × 3, and Es1 × 4 reservoir units generally exhibit 2–36% porosity, 0.017‒974.8 mD permeability, and moderate to good NTG ratios, i.e., good reservoir quality.
• The reservoir geological models show that there are lat-eral heterogeneities in the petrophysical properties and lithofacies of the reservoir.
• The reservoir geological models were employed to cal-culate the reservoir volume of the units in the Shahe-jie Formation of block Nv32. The four reservoir units in the Es1 Formation have volumetric values between 0.554368 × 10⁶ and 10.03771 × 10⁶ sm3, with a total volu-metric value of 20.0819 × 10⁶ sm3.
• According to the results of the uncertainty analysis for the geological model, 100–400 realizations were used in the uncertainty evaluation to estimate the pore vol-ume. The results indicate that the appropriate number of realizations is 200. This number of geological reali-zations were reduced the uncertainties in the 3D model.
• The results for the theoretical CO2 storage capacity indicate that the least likely, P10, range capacity was 15.6 million tons, whereas the most likely, P90, storage capacity was 207.9 million. A large CO2 storage capac-ity demonstrates that tight oil formations may be a new sink for CCUS researchers.
• The results of the model indicate that the ES1 forma-tion in block Nv32 has a combined potential for CO2 storage and EOR.
Fig. 10 Results of the net-to-gross (NTG) ratio modeling for block Nv32. The left panel presents the NTG maps of the a. Es1 × 1, b. Es1 × 2, c. Es1 × 3, and d. Es1 × 4 reservoir units. e. NTG modeling of all of the ES1 reservoir units. f. Cross-sectional NTG model of the wells used in this study
◂
Table 1 Geostatistical parameters for the geological uncertainties
Parameters Min Base value Max
Major direction 600 600 800Minor direction 400 500 700Vertical 2 10 50
a dynamic reservoir model for CO2 injection in unconven-tional oil reservoirs. Further data collection will be con-ducted to evaluate the compositional CO2 interaction in the reservoir. Table 3 lists the theoretical CO2 storage capacity for P10, P50, and P90 in block Nv32.
Summary and conclusion
We performed a comprehensive study on integrated 3-D geo-logical reservoir models under geological uncertainty in the Es1 Formation in block Nv32, Shenvsi oilfield, with a multi-objective function to improve oil recovery and estimate the CO2 storage capacity. The main conclusions obtained from this study are summarized below.

Journal of Petroleum Exploration and Production
1 3
Journal of Petroleum Exploration and Production
1 3
Fig. 11 Modeling results for the volume (STOIIP) estimation in block Nv32. The left panel presents the estimated STOIIP of the a. Es1 × 1, b. Es1 × 2, c. Es1 × 3, and d. Es1 × 4 reservoir units. e. Table present-ing the total estimated STOIIP and bulk volume values for all of the Es1 reservoir rocks
◂ • Future studies should attempt to enhance our under-standing of the CO2 storage potential in tight oil for-mations. The field production history should be first updated in the history-matching reservoir models.
Fig. 12 Geological uncertainty associated with the theoretical CO2 storage capacity of block Nv32, Shenvsi oilfield. The left panel presents the pore volume histograms based on a. 100, b. 200, c. 300, and d. 400 realiza-tions
Journal of Petroleum Exploration and Production
1 3
History-matching models can represent the reliabil-ity of future dynamic reservoir simulations. Second, rock–fluid interactions must be analyzed to understand information on the relative permeability in the dynamic reservoir models.
Funding No funding was received for conducting this study.
Declarations
Conflict of interest The authors declare no conflicts of interest.
Open Access This article is licensed under a Creative Commons Attri-bution 4.0 International License, which permits use, sharing, adapta-tion, distribution and reproduction in any medium or format, as long as you give appropriate credit to the original author(s) and the source, provide a link to the Creative Commons licence, and indicate if changes were made. The images or other third party material in this article are included in the article’s Creative Commons licence, unless indicated otherwise in a credit line to the material. If material is not included in the article’s Creative Commons licence and your intended use is not permitted by statutory regulation or exceeds the permitted use, you will need to obtain permission directly from the copyright holder. To view a copy of this licence, visit http:// creat iveco mmons. org/ licen ses/ by/4. 0/.
References
Abdel-Fattah MI, Metwalli FI, Mesilhi ESI (2018) Static reservoir modeling of the Bahariya reservoirs for the oilfields development in South Umbarka area, Western Desert. Egypt J Afr Earth Sci 138:1–13. https:// doi. org/ 10. 1016/j. jafre arsci. 2017. 11. 002
Abdideh M, Bargahi D (2012) Designing a 3D model for the prediction of the top of formation in oil fields using geostatistical methods. Geocarto Int 27:569–579. https:// doi. org/ 10. 1080/ 10106 049. 2012. 662529
Agyare Godwill P, Waburoko J (2016) Application of 3D reservoir modeling on Zao 21 oil block of Zilaitun oil field. J Petrol Environ Biotechnol 07:1–8. https:// doi. org/ 10. 4172/ 2157- 7463. 10002 62
Alcalde J, Flude S, Wilkinson M et al (2018) Estimating geological CO2 storage security to deliver on climate mitigation. Nat Com-mun 9:2201. https:// doi. org/ 10. 1038/ s41467- 018- 04423-1
Almeida F, Davolio A, Schiozer DJ (2020) Reducing uncertainties of reservoir properties in an automatized process coupled with geological modeling considering scalar and spatial uncertain attributes. J Petrol Sci Eng. https:// doi. org/ 10. 1016/j. petrol. 2020. 106993
Al-Mudhafar WJ (2018) How is multiple-point geostatistics of lithofa-cies modeling assisting for fast history matching? A case study from a sand-rich fluvial depositional environment of Zubair for-mation in South Rumaila oil field. Proc Annu Offshore Technol Conf 2:1485–1512. https:// doi. org/ 10. 4043/ 28662- ms
Ampomah W, Balch R, Will R et al (2017a) Co-optimization of CO2-EOR and storage processes under geological uncertainty. Energy Procedia 114:6928–6941. https:// doi. org/ 10. 1016/j. egy-pro. 2017. 03. 1835
Ampomah W, Balch RS, Cather M et al (2017b) Optimum design of CO2 storage and oil recovery under geological uncertainty. Appl Energy 195:80–92. https:// doi. org/ 10. 1016/j. apene rgy. 2017. 03. 017
Anderson ST (2017) Cost implications of uncertainty in CO2 storage resource estimates: a review. Nat Resour Res 26:137–159. https:// doi. org/ 10. 1007/ s11053- 016- 9310-7
Anon (1981) World energy outlookBradshaw J, Bachu S, Bonijoly D et al (2007) CO2 storage capacity
estimation: issues and development of standards. Int J Greenhouse Gas Control 1:62–68. https:// doi. org/ 10. 1016/ S1750- 5836(07) 00027-8
Bueno JF, Drummond RD, Vidal AC, Sancevero SS (2011) Constrain-ing uncertainty in volumetric estimation: a case study from Namo-rado Field, Brazil. J Petrol Sci Eng 77:200–208
Chen B, Harp DR, Lu Z, Pawar RJ (2020) Reducing uncertainty in geologic CO2 sequestration risk assessment by assimilating moni-toring data. Int J Greenh Gas Control. https:// doi. org/ 10. 1016/j. ijggc. 2019. 102926
Dai Z, Viswanathan H, Middleton R et al (2016) CO2 accounting and risk analysis for CO2 sequestration at enhanced oil recovery sites. Environ Sci Technol 50:7546–7554. https:// doi. org/ 10. 1021/ acs. est. 6b017 44
Table 2 Computed pore volumes using the P10, P50, and P90
Probability 100 Realizations 200 Realizations 300 Realizations 400 Realizations
P10 218.6 m3 218.3 218.1 218.3P50 224.6 m3 224.4 224.3 224.4P90 231.5 m3 231.7 231.8 231.7
Table 3 Theoretical CO2 storage capacity for P10, P50, and P90
Parameters Symbol Unit P10 P50 P90
Total pore volume VPV Mm3 218.3 224.6 231.5
Irreducible water saturation Swiir % 0.36 0.26 0.11Formation volume factor B Bbl/STB 1.46 1.46 1.46Average CO2 density ρCO2 ton∕m3 0.768 0.768 0.768Capacity coefficient E % 0.1 0.5 0.9CO2 storage capacity MCO2 Mt 15.66563 93.18061 207.9206

Journal of Petroleum Exploration and Production
1 3
Demyanov V, Arnold D, Rojas T, Christie M (2019) Uncertainty quan-tification in reservoir prediction: Part 2—Handling uncertainty in the geological scenario. Math Geosci 51:241–264. https:// doi. org/ 10. 1007/ s11004- 018- 9755-9
Edwards JD, Santogrossi PA (1989) Divergent/passive margin basins. American Association of Petroleum Geologists, Tulsa
El Khadragy AA, Eysa EA, Hashim A, Abd El Kader A (2017) Reser-voir characteristics and 3D static modelling of the Late Miocene Abu Madi Formation, onshore Nile Delta. Egypt J Afr Earth Sci 132:99–108. https:// doi. org/ 10. 1016/j. jafre arsci. 2017. 04. 032
Heath JEE, Kobos PHH, Roach JDD et al (2012) Geologic hetero-geneity and economic uncertainty of subsurface carbon dioxide storage. SPE Econ Manag 4:32–41. https:// doi. org/ 10. 2118/ 158241- PA
Hirsche K, Porter-Hirsche J, Mewhort L, Davis R (1997) The use and abuse of geostatistics. LEAD Edge 16:253–262. https:// doi. org/ 10. 1190/1. 14376 12
IEA (2020) Global energy review 2020. Glob Energy Rev. https:// doi. org/ 10. 1787/ a60ab bf2- en
Jika HT, Onuoha MK, Okeugo CG, Eze MO (2020) Application of sequential indicator simulation, sequential Gaussian simulation and flow zone indicator in reservoir-E modelling; Hatch Field Niger Delta Basin. Nigeria Arab J Geosci. https:// doi. org/ 10. 1007/ s12517- 020- 05332-8
Jin X, Wang G, Tang P et al (2020) 3D geological modelling and uncertainty analysis for 3D targeting in Shanggong gold deposit (China). J Geochem Explor. https:// doi. org/ 10. 1016/j. gexplo. 2019. 106442
Kamali MR, Omidvar A, Kazemzadeh E (2013) 3D geostatistical mod-eling and uncertainty analysis in a carbonate reservoir, SW Iran. J Geol Res 2013:1–7. https:// doi. org/ 10. 1155/ 2013/ 687947
Lelliott MR, Cave MR, Wealthall GP (2009) A structured approach to the measurement of uncertainty in 3D geological models. Q J Eng Geol Hydrogeol 42:95–105. https:// doi. org/ 10. 1144/ 1470- 9236/ 07- 081
Ling J, Qingkui W (2017) Application of sequence stratigraphy in depression lake in slope zone, taking Shenvsi oilfield as an exam-ple. IOSR JAGG 05:38–40. https:// doi. org/ 10. 9790/ 0990- 05020 13840
Mckee BN (2005) Technical groupMetwalli FI, Shendi EAH, Fagelnour MS (2017) Reservoir petro-
physical modeling and risk analysis in reserve estimation; a case study from Qasr Field, north Western Desert, Egypt. IOSR JAGG 05:41–52. https:// doi. org/ 10. 9790/ 0990- 05020 14152
Pingping S, Xinwei L, Qiujie L (2009) Methodology for estimation of CO2 storage capacity in reservoirs. Petrol Explor Dev 36:216–220. https:// doi. org/ 10. 1016/ S1876- 3804(09) 60121-X
Pyrcz, Deutsch (2014) Book-geostatistical reservoir modeling Pyrcz and Deutsch
Rahim S, Li Z, Trivedi J (2015) Reservoir geological uncertainty reduction: an optimization-based method using multiple static measures. Math Geosci 47:373–396. https:// doi. org/ 10. 1007/ s11004- 014- 9575-5
Rassas AAL, Ren S, Sun R et al (2020) Application of 3D reservoir geological model on Es1 formation, block Nv32, Shenvsi oilfield, China. OJOGas 05:54–72. https:// doi. org/ 10. 4236/ ojogas. 2020. 52006
Satter A, Iqbal GM (2016) Determination of oil and gas in place: con-ventional and unconventional reservoirs
Spencer JC (1987) Environmental assessment strategies. Top Geri-atr Rehabil 3:35–42. https:// doi. org/ 10. 1097/ 00013 614- 19871 0000- 00007
Vo Thanh H, Sugai Y, Nguele R, Sasaki K (2019) Integrated workflow in 3D geological model construction for evaluation of CO2 storage capacity of a fractured basement reservoir in Cuu Long Basin, Vietnam. Int J Greenh Gas Control. https:// doi. org/ 10. 1016/j. ijggc. 2019. 102826
Vo Thanh H, Sugai Y, Nguele R, Sasaki K (2020) Robust optimization of CO2 sequestration through a water alternating gas process under geological uncertainties in Cuu Long Basin, Vietnam. J Nat Gas Sci Eng. https:// doi. org/ 10. 1016/j. jngse. 2020. 103208
Vo Thanh H, Sugai Y, Sasaki K (2020) Impact of a new geological modelling method on the enhancement of the CO2 storage assess-ment of E sequence of Nam Vang field, offshore Vietnam. Energy Sources Part Recover Util Environ Eff 42:1499–1512. https:// doi. org/ 10. 1080/ 15567 036. 2019. 16048 65
Yin X, Lu S, Wang P et al (2017) A three-dimensional high-resolution reservoir model of the Eocene Shahejie Formation in Bohai Bay Basin, integrating stratigraphic forward modeling and geostatis-tics. Mar Petrol Geol 82:362–370. https:// doi. org/ 10. 1016/j. marpe tgeo. 2017. 02. 007
Zabalza-Mezghani I, Manceau E, Feraille M, Jourdan A (2004) Uncer-tainty management: from geological scenarios to production scheme optimization. J Petrol Sci Eng 44:11–25. https:// doi. org/ 10. 1016/j. petrol. 2004. 02. 002
Zamora Valcarce G, Zapata T (2006) Three-dimensional structural modeling and its application for development of the El Portón field, Argentina, Ansa A, Selva G. Am Assoc Petrol Geol Bull 90:307–319. https:// doi. org/ 10. 1306/ 09300 504142
Zhong Z, Carr TR (2019) Geostatistical 3D geological model construc-tion to estimate the capacity of commercial scale injection and storage of CO2 in Jacksonburg-Stringtown oil field, West Virginia, USA. . Int J Greenhouse Gas Control West Virginia Int J Greenh Gas Control 80:61–75. https:// doi. org/ 10. 1016/j. ijggc. 2018. 10. 011
Publisher’s Note Springer Nature remains neutral with regard to jurisdictional claims in published maps and institutional affiliations.