coal briefing and queensland coal site tour...2013/05/29 · disclaimer coal briefing, 29 may 2013...
TRANSCRIPT

BHP Billiton Limited ABN 49 004 028 077 BHP Billiton Plc Registration number 3196209 Registered in Australia Registered in England and Wales Registered Office: 180 Lonsdale Street Melbourne Victoria 3000 Registered Office: Neathouse Place, London SW1V 1BH United Kingdom
The BHP Billiton Group is headquartered in Australia
BHP Billiton Limited BHP Billiton Plc 180 Lonsdale Street Neathouse Place Melbourne Victoria 3000 Australia London SW1V 1BH UK GPO BOX 86 Tel +44 20 7802 4000 Melbourne Victoria 3001 Australia Fax + 44 20 7802 4111 Tel +61 1300 55 47 57 Fax +61 3 9609 4372 bhpbilliton.com bhpbilliton.com
To: Australian Securities Exchange1 cc: New York Stock Exchange London Stock Exchange JSE Limited
COAL BRIEFING AND QUEENSLAND COAL SITE TOUR BHP Billiton advises that there will be a Coal briefing and Hay Point site tour on Wednesday, 29 May 2013. The Queensland Coal visit will conclude with a tour of the Peak Downs mine and Caval Ridge project on Thursday, 30 May 2013. A copy of the materials to be presented on Wednesday, 29 May 2013 is attached. The remaining materials will be released on Thursday, 30 May 2013. The presentation materials will be available on the BHP Billiton website at www.bhpbilliton.com.
Jane McAloon Group Company Secretary
1 This release was made outside the hours of operation of the ASX market announcements office.
28 May 2013
For
per
sona
l use
onl
y

BHP Billiton Coal overview
Dean Dalla Valle
President Coal
29 May 2013
BMA F
or p
erso
nal u
se o
nly

Disclaimer
Slide 2
Forward looking statements
This presentation contains forward looking statements, including statements regarding: trends in commodity prices and currency exchange rates; demand for commodities; plans,
strategies and objectives of management; closure or divestment of certain operations or facilities (including associated costs); anticipated production or construction commencement
dates; capital costs and scheduling; operating costs and shortages of materials and skilled employees; anticipated productive lives of projects, mines and facilities; provisions and
contingent liabilities; tax and regulatory developments.
Forward looking statements can be identified by the use of terminology such as „intend‟, „aim‟, „project‟, „anticipate‟, „estimate‟, „plan‟, „believe‟, „expect‟, „may‟, „should‟, „will‟, „continue‟ or
similar words. These statements discuss future expectations concerning the results of operations or financial condition, or provide other forward looking statements.
These forward looking statements are not guarantees or predictions of future performance, and involve known and unknown risks, uncertainties and other factors, many of which are
beyond our control, and which may cause actual results to differ materially from those expressed in the statements contained in this presentation. Readers are cautioned not to put undue
reliance on forward looking statements.
For example, our future revenues from our operations, projects or mines described in this presentation will be based, in part, upon the market price of the minerals, metals or petroleum
produced, which may vary significantly from current levels. These variations, if materially adverse, may affect the timing or the feasibility of the development of a particular project, the
expansion of certain facilities or mines, or the continuation of existing operations.
Other factors that may affect the actual construction or production commencement dates, costs or production output and anticipated lives of operations, mines or facilities include our
ability to profitably produce and transport the minerals, petroleum and/or metals extracted to applicable markets; the impact of foreign currency exchange rates on the market prices of the
minerals, petroleum or metals we produce; activities of government authorities in some of the countries where we are exploring or developing these projects, facilities or mines, including
increases in taxes, changes in environmental and other regulations and political uncertainty; labour unrest; and other factors identified in the risk factors discussed in BHP Billiton‟s filings
with the US Securities and Exchange Commission (the “SEC”) (including in Annual Reports on Form 20-F) which are available on the SEC‟s website at www.sec.gov.
Except as required by applicable regulations or by law, the Group does not undertake any obligation to publicly update or review any forward looking statements, whether as a result of
new information or future events.
Non-IFRS financial information
BHP Billiton results are reported under International Financial Reporting Standards (IFRS) including Underlying EBIT and Underlying EBITDA which are used to measure segment
performance. This presentation also includes certain non-IFRS measures including Attributable profit excluding exceptional items, Underlying EBITDA interest coverage, Underlying
effective tax rate, Underlying EBIT margin and Underlying return on capital. These measures are used internally by management to assess the performance of our business, make
decisions on the allocation of our resources and assess operational management. Non-IFRS measures have not been subject to audit or review.
UK GAAP financial information
Certain historical financial information for periods prior to FY2005 has been presented on the basis of UK GAAP, which is not comparable to IFRS or US GAAP. Readers are cautioned
not to place undue reliance on UK GAAP information.
No offer of securities
Nothing in this presentation should be construed as either an offer to sell or a solicitation of an offer to buy or sell BHP Billiton securities in any jurisdiction.
Reliance on third party information
The views expressed in this presentation contain information that has been derived from publicly available sources that have not been independently verified. No representation or
warranty is made as to the accuracy, completeness or reliability of the information. This presentation should not be relied upon as a recommendation or forecast by BHP Billiton.
Coal briefing, 29 May 2013
For
per
sona
l use
onl
y

Disclaimer
Slide 3 Coal briefing, 29 May 2013
Coal Resources
This presentation includes information on Coal Resources (inclusive of Coal Reserves). Coal Resources are compiled by: R Macpherson (MAIG) – Metallurgical Coal and
D Lawrence (SACNASP) – Energy Coal. This is based on Coal Resource information in the BHP Billiton 2007 and 2012 Annual Report for all assets. All reports can be found at
www.bhpbilliton.com.
All information is reported under the „Australasian Code for Reporting of Exploration Results, Mineral Resources and Ore Reserves, 2004‟ (the JORC Code) by the above mentioned
persons who are employed by BHP Billiton and have the required qualifications and experience to qualify as Competent Persons for Mineral or Coal Resources under the JORC
Code.
The compilers verify that this report is based on and fairly reflects the Coal Resources information in the supporting documentation and agree with the form and context of the
information presented.
Coal Resource classifications (100% basis) for each province, where relevant, are contained in Table 1.
Table 1
Asset Measured Resource
(million tonnes)
Indicated Resource
(million tonnes)
Inferred Resource
(million tonnes)
BHP Billiton interest
(%)
Metallurgical coal 2007 2012 2007 2012 2007 2012 2007 2012
CQCA and Gregory JV 1,549 2,812 3,174 4,524 3,239 3,772 50 50
BHP Mitsui 116 183 646 1,119 1,035 1,082 80 80
Illawarra Coal 200 283 202 453 774 589 100 100
IndoMet Coal 0 83 120 33 0 658 75 75
Energy coal
New Mexico 1,097 847 5 260 0 4 100 100
South Africa 2,098 1,836 1,742 1,030 1,999 1,030 921 100
Australia 983 1,229 1,873 2,808 1,319 1,729 100 100
Colombia 905 2,955 1,214 984 58 730 33.3 33.3
1. Weighted average equity interest.
For
per
sona
l use
onl
y

Program
Slide 4
Day 1: Wednesday, 29 May 2013
BHP Billiton Coal overview Dean Dalla Valle
Metallurgical coal market outlook Vicky Binns
Metallurgical coal financial performance Gideon Oberholzer
Metallurgical coal projects Phil Hynes
Hay Point overview Stephen Dumble
Hay Point site visit
Day 2: Thursday, 30 May 2013
BMA overview Stephen Dumble
Peak Downs site visit
Caval Ridge site visit
Coal briefing, 29 May 2013
For
per
sona
l use
onl
y

Key themes
Coal briefing, 29 May 2013 Slide 5
• A strong management team with deep operational experience
• Committed to ongoing improvement in HSEC performance
• Our productivity agenda will increase returns from our installed capacity
• We have taken decisive action to drive costs lower
• Capital expenditure will peak in FY13 with no new major projects planned
• Further simplification of the portfolio remains a priority
• Our plan will deliver substantial growth in free cash flow
For
per
sona
l use
onl
y

Operationally experienced leadership team
Coal briefing, 29 May 2013 Slide 6
VP Human
Resources
Matthew Brady
President Coal
Dean Dalla Valle
Asset President
BECSA
Manie Dreyer
Asset President
BMA
Stephen Dumble
VP HSEC
Hannes
van Rensburg
VP Projects
Phil Hynes
VP Finance
Gideon Oberholzer
VP Production
New Mexico, BMC,
Illawarra
Michael Rosengren
VP Strategy &
Development
David Ruddell
Asset President
NSWEC
Peter Sharpe
VP External
Affairs
Kym Winter Dewhirst
VP Marketing
Coal
Vicky Binns
For
per
sona
l use
onl
y
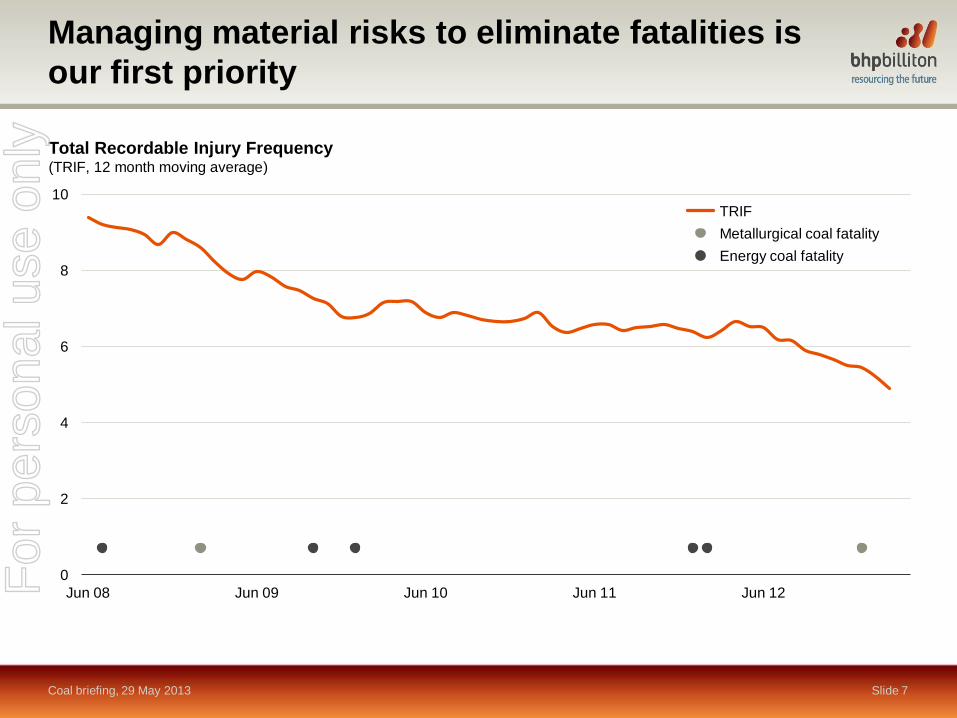
Managing material risks to eliminate fatalities is
our first priority
0
2
4
6
8
10
Jun 08 Jun 09 Jun 10 Jun 11 Jun 12
Total Recordable Injury Frequency (TRIF, 12 month moving average)
Slide 7 Coal briefing, 29 May 2013
TRIF
Energy coal fatality
Metallurgical coal fatality
For
per
sona
l use
onl
y

Committed to ongoing improvement in HSEC
Coal briefing, 29 May 2013 Slide 8
Community
• Deliver major health, education and housing programs in developing nations
• Continue our substantial contribution to local community groups
• Support our local buying program in the Bowen Basin
Health
• Improve controls to eliminate and reduce occupational exposures such as diesel
exhaust, respirable dust and silica
• Manage workplace fatigue
• Control and reduce malaria, HIV and TB in developing nations
Environment
• Increase water recycling and reduce high quality water consumption
• Maximise gas capture and abatement to reduce greenhouse gas emissions
• Work with local communities and governments to effectively manage dust and noise
Safety
• Focus on visible safety leadership
• Manage material and fatal risks – standardise critical controls
• Simplify health and safety management systems and procedures
For
per
sona
l use
onl
y

Our business is underpinned by our high quality
resource base
Coal briefing, 29 May 2013 Slide 9
Metallurgical coal assets
Energy coal assets
New Mexico Coal
100%
Cerrejón Coal
33.3%
Energy Coal
South Africa
(BECSA)
100%3
BHP Billiton
Mitsui Coal
(BMC)
80%
NSW Energy Coal
100%
BHP Billiton
Mitsubishi Alliance
(BMA)
50%
Illawarra Coal
100%
IndoMet Coal project
75%
Singapore
Marketing office
Share of BHP Billiton
EBIT2
Share of BHP Billiton
production2
Coal head office
Offices
0
5
10
15
FY07 FY12
Metallurgical coal Energy coal
Substantial high quality resource base1
(billion tonnes, equity share)
1. Coal Resources (100% terms) are tabulated in Disclaimer Table 1.
2. Contribution to BHP Billiton over the five year period from FY08 to FY12. Production calculated on a copper equivalent basis using FY12 average prices.
3. BHP Billiton‟s effective interest in BECSA will reduce to 90% following completion of a Black Economic Empowerment transaction and Employee Share Ownership Program implementation.
Coal
21%
Coal
14%
For
per
sona
l use
onl
y

Our plan will deliver substantial growth in free
cash flow
Coal briefing, 29 May 2013 Slide 10
• We will pull the productivity lever hard with
an extreme focus on operating performance
– maximise utilisation of installed capacity
– deliver significant operating cost savings
– complete existing capital expenditure
programs
– continue to simplify the portfolio
• We have the resources, assets, people and a
plan that will seek to increase margins and
returns in the absence of higher prices
• This plan will substantially increase free
cash flow and cement the integrated
Coal business as the „fourth pillar‟ of the
BHP Billiton portfolio
Mt Arthur Coal
For
per
sona
l use
onl
y

We will maximise utilisation of installed capacity
Coal briefing, 29 May 2013 Slide 11
• Our operational focus is to maximise
utilisation of installed capacity
– recover latent capacity
– complete projects in execution
– debottleneck installed capacity
• A substantial increase in metallurgical coal
volumes will underpin lower unit costs
– Queensland Coal is currently producing
at 100% of supply chain capacity
– by FY15 capacity will be more than
40% higher than FY12 production
• We will continue to optimise our energy coal
production mix with a focus on high margin
export volumes
1. Includes major projects in execution; FY15 capacity excludes Norwich Park and Gregory nominal capacity.
Metallurgical coal production capacity1 (million tonnes per annum, 100% basis)
55 46 44
51
66
7
7 8
8
9 16
0
25
50
75
100
FY10 FY11 FY12 FY13e Projects & latent capacity
FY15e
Queensland Coal Illawarra
For
per
sona
l use
onl
y

267
401
252 52
134
(37)
0
125
250
375
500
Opera
ting
Overh
eads
Volu
me
rela
ted
Sub-t
ota
l
Explo
ration
& b
usin
ess
develo
pm
ent
Tota
l (P
&L)
We have taken decisive action to drive
costs lower
Coal briefing, 29 May 2013 Slide 12
• Decisive action has already delivered tangible
results
– temporary closure of high cost metallurgical
coal mines
– US$0.8 billion annualised controllable cash
cost savings achieved for our Coal business
in H1 FY13
• Substantial opportunity to deliver further
cost savings
– maximise utilisation to drive unit costs lower
– optimise contractor usage and rates
– reduce supplier costs and general overheads
– reduce business development and
exploration expenditure
• The implementation of our productivity agenda
will drive margins and returns higher
Metallurgical coal unit cash costs2
(index, FY08 = 100)
1. Controllable cash costs exclude non-cash and one-off items. Variance relative to H1 FY12.
2. A$ per tonne FOB costs - cash production costs plus shiploading, demurrage, royalties and marketing and selling costs.
100
150
200
250
FY
08
FY
09
FY
10
FY
11
FY
12
Q1 F
Y13
Q2 F
Y13
Q3 F
Y13
Q4 F
Y13e
BMA BMC Illawarra
Coal business cash cost savings achieved in H1 FY131 (US$ million)
For
per
sona
l use
onl
y

0.0
1.0
2.0
3.0
4.0
5.0
FY
08
FY
09
¹
FY
10
FY
11
FY
12
FY
13
e
FY
14
e
FY
15
e
Forecast Major project
Minor and sustaining Exploration
Our productivity agenda extends to development
projects
Coal briefing, 29 May 2013 Slide 13
• Capital expenditure will peak in FY13
• Our major Coal projects in execution are
nearing completion with the majority expected
to deliver first production by end CY14
– Caval Ridge, 63% complete
– Hay Point Stage Three Expansion,
61% complete on the basis of the
revised scope
– Appin Area 9, 40% complete
– Newcastle Third Port Stage Three,
71% complete
– Cerrejón P40, 65% complete
• We will substantially reduce development
expenditure with no new major projects planned
• Our plan will result in a substantial increase in
free cash flow
Coal capital and exploration expenditure (US$ billion)
Note: All references regarding project completion are as at 30 April 2013.
1. Saraji East acquisition of US$980 million excluded from FY09 expenditure.
For
per
sona
l use
onl
y

Further simplification of the portfolio remains
a priority
Coal briefing, 29 May 2013 Slide 14
• Formation of the integrated Coal business
has led to a significant reduction in overheads
• Assets must earn their right to remain in
the portfolio
• We have taken decisive action across our
Coal operations
– temporary closure of high cost Norwich
Park and Gregory open cut mines
– New Mexico non-binding MOU to
transfer full ownership of the Navajo
Coal Company to the Navajo Nation
– we will selectively pursue asset
divestment opportunities with a firm
focus on value
• We will focus our efforts on the things that
matter most
Goonyella Riverside
For
per
sona
l use
onl
y

Key themes
Coal briefing, 29 May 2013 Slide 15
• A strong management team with deep operational experience
• Committed to ongoing improvement in HSEC performance
• Our productivity agenda will increase returns from our installed capacity
• We have taken decisive action to drive costs lower
• Capital expenditure will peak in FY13 with no new major projects planned
• Further simplification of the portfolio remains a priority
• Our plan will deliver substantial growth in free cash flow
For
per
sona
l use
onl
y

Metallurgical coal
market outlook
Vicky Binns
Vice President Marketing Coal
29 May 2013
For
per
sona
l use
onl
y

Key themes
• Strong steel production outlook continues to underpin metallurgical coal demand
• Scrap will become an increasingly important component of Chinese steel production
• China has become a significant importer of metallurgical coal
• Future demand growth is expected to transition towards other emerging economies
• The market appears comfortably supplied in the near-term
• BHP Billiton coals continue to be among the most highly valued, supporting strong
long-term margins
• We are progressing towards a more liquid, index-linked metallurgical coal market
Slide 17 Coal briefing, 29 May 2013
For
per
sona
l use
onl
y

BHP Billiton is a major seaborne supplier
Coal briefing, 29 May 2013 Slide 18
BHP Billiton metallurgical coal sales (%)
CY12 metallurgical coal supply, selected
seaborne suppliers1
(million tonnes)
0
20
40
60
80
100
FY09 FY10 FY11 FY12 FY13e
0
10
20
30
40
50
60
BH
P B
illito
n
Te
ck
Alp
ha
NR
Me
ch
el
Rio
Tin
to
An
glo
A
me
rica
n
Pe
ab
od
y
Wa
lter
En
erg
y
Xstr
ata
Source: Company filings.
1. Presented on a 100% basis except Anglo American which is presented on an equity basis. Peabody and Alpha tonnages represent metallurgical coal sales. Figures could include
some thermal coal. Some producers converted from short tonnes to metric tonnes.
Other Europe
Latin America India
Japan, Korea, Taiwan China For
per
sona
l use
onl
y
China has driven global steel production growth
Coal briefing, 29 May 2013 Slide 19
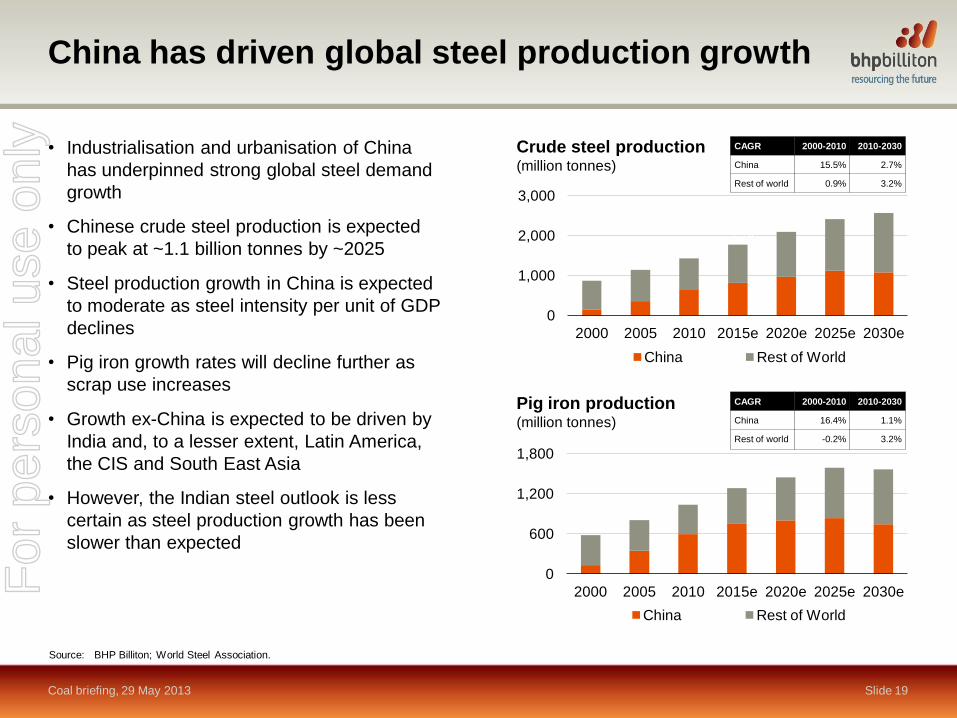
• Industrialisation and urbanisation of China
has underpinned strong global steel demand
growth
• Chinese crude steel production is expected
to peak at ~1.1 billion tonnes by ~2025
• Steel production growth in China is expected
to moderate as steel intensity per unit of GDP
declines
• Pig iron growth rates will decline further as
scrap use increases
• Growth ex-China is expected to be driven by
India and, to a lesser extent, Latin America,
the CIS and South East Asia
• However, the Indian steel outlook is less
certain as steel production growth has been
slower than expected
0
1,000
2,000
3,000
2000 2005 2010 2015e 2020e 2025e 2030e
China Rest of World
India
Source: BHP Billiton; World Steel Association.
Crude steel production (million tonnes)
0
600
1,200
1,800
2000 2005 2010 2015e 2020e 2025e 2030e
China Rest of World
Pig iron production (million tonnes)
CAGR 2000-2010 2010-2030
China 15.5% 2.7%
Rest of world 0.9% 3.2%
CAGR 2000-2010 2010-2030
China 16.4% 1.1%
Rest of world -0.2% 3.2%
For
per
sona
l use
onl
y

Scrap usage in China will increase substantially
Coal briefing, 29 May 2013 Slide 20
• Scrap availability in China is expected
to quadruple from 2010 to 2030
• Increased usage of scrap in basic
oxygen furnaces will see pig iron
growth rates decline
• Electric arc furnaces are expected to
contribute a significant share of total
Chinese steel production by 2030
0
250
500
750
1,000
1,250
0
10
20
30
40
50
2000 2005 2010 2015e 2020e 2025e 2030e
Scrap availability (RHS)
Steel production (RHS)
Scrap ratio to steel output (LHS)
China scrap availability to total steel output (%) (million tonnes)
Slide 20
Source: BHP Billiton; World Steel Association.
For
per
sona
l use
onl
y
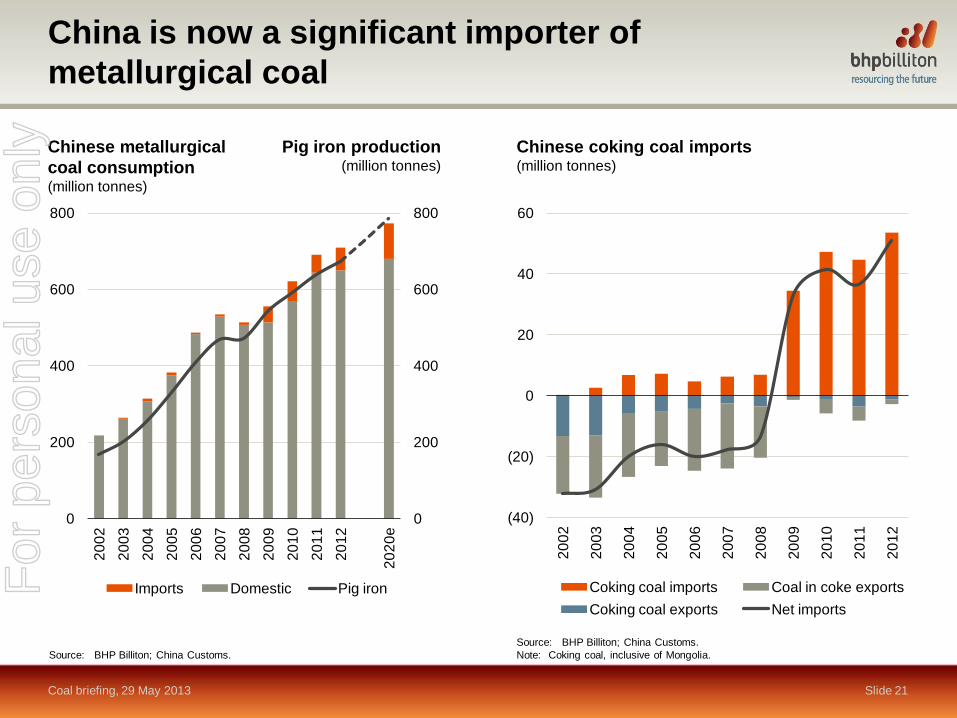
China is now a significant importer of
metallurgical coal
0
200
400
600
800
0
200
400
600
800
20
02
20
03
20
04
20
05
20
06
20
07
20
08
20
09
20
10
20
11
20
12
20
20
e
Imports Domestic Pig iron
Chinese metallurgical
coal consumption (million tonnes)
Pig iron production (million tonnes)
(40)
(20)
0
20
40
60
20
02
20
03
20
04
20
05
20
06
20
07
20
08
20
09
20
10
20
11
20
12
Coking coal imports Coal in coke exports
Coking coal exports Net imports
Chinese coking coal imports (million tonnes)
Slide 21 Coal briefing, 29 May 2013
Source: BHP Billiton; China Customs.
Source: BHP Billiton; China Customs.
Note: Coking coal, inclusive of Mongolia.
For
per
sona
l use
onl
y

Long-term seaborne metallurgical coal demand
will transition towards other emerging markets
Coal briefing, 29 May 2013 Slide 22
• China is expected to remain a significant
importer, however much of China‟s future
demand growth will be met by domestic coals
• Global metallurgical coal demand growth
rates will moderate as demand transitions
towards other emerging markets
• India is expected to be the most significant
source of new seaborne demand
• Rest of world (RoW) demand growth will be
driven by Turkey and South East Asia
• Limited growth is expected in developed
markets such as Europe and Japan
0
400
800
1,200
1,600
20
00
20
03
20
06
20
09
20
12
20
15
e
20
18
e
20
21
e
20
24
e
20
27
e
20
30
e
Global metallurgical coal demand (million tonnes)
CAGR 2000-2010 2010-2030
Global 6.2% 1.5%
RoW developed
Brazil
RoW developing
China
India
Source: BHP Billiton; GTIS; IEA.
Actual Forecast For
per
sona
l use
onl
y
0
100
200
300
400
0
20
40
60
80
CY08 CY09 CY10 CY11 Q1 CY12
Q2 CY12
Q3 CY12
Q4 CY12
Q1 CY13
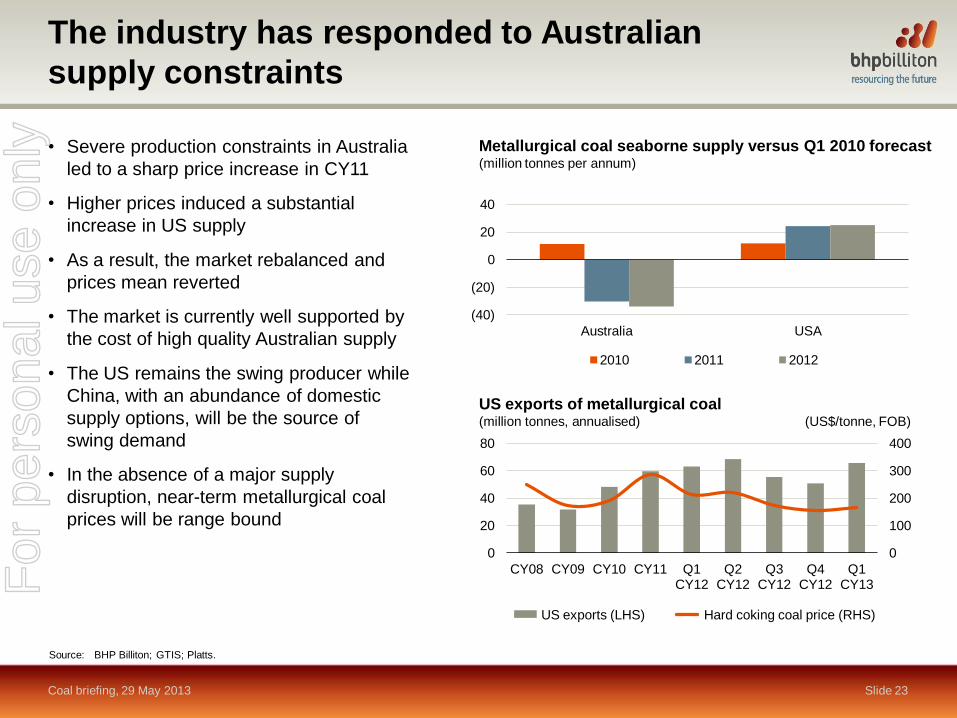
The industry has responded to Australian
supply constraints
Coal briefing, 29 May 2013 Slide 23
• Severe production constraints in Australia
led to a sharp price increase in CY11
• Higher prices induced a substantial
increase in US supply
• As a result, the market rebalanced and
prices mean reverted
• The market is currently well supported by
the cost of high quality Australian supply
• The US remains the swing producer while
China, with an abundance of domestic
supply options, will be the source of
swing demand
• In the absence of a major supply
disruption, near-term metallurgical coal
prices will be range bound
(40)
(20)
0
20
40
Australia USA
2010 2011 2012
Metallurgical coal seaborne supply versus Q1 2010 forecast (million tonnes per annum)
Source: BHP Billiton; GTIS; Platts.
US exports of metallurgical coal (million tonnes, annualised) (US$/tonne, FOB)
US exports (LHS) Hard coking coal price (RHS)
For
per
sona
l use
onl
y

Future supply growth is predominantly
Australian
Coal briefing, 29 May 2013 Slide 24
• The recovery of latent capacity and delivery
of projects in execution in Australia should
lead to a comfortably supplied market in the
near-term
• Emerging supply basins in Mozambique and
Mongolia have had limited impact to date
• Unlocking these new basins has proven
challenging given their risk and capital
intensity
• The growth profile for US supply is limited
• Slower demand growth and range-bound
pricing in the near-term could lead to
project delays
• Australian quality hard coking coals
are expected to remain among the most
highly valued
0
100
200
300
400
500
600
2010 2015e 2020e 2025e 2030e
Australia Canada Indonesia
Mozambique Russia United States
Mongolia Others
Metallurgical coal seaborne supply (million tonnes per annum)
Source: BHP Billiton; WoodMackenzie; GTIS.
Note: Mongolian land based (not seaborne) exports included.
2010-2015 2015-2020 2020-2025 2025-2030
CAGR 7.9% 4.1% 1.4% 0.1%
For
per
sona
l use
onl
y
0
10
20
30
40
50
60
70
80
15 17 19 21 23 25 27 29 31 33 35 37 39
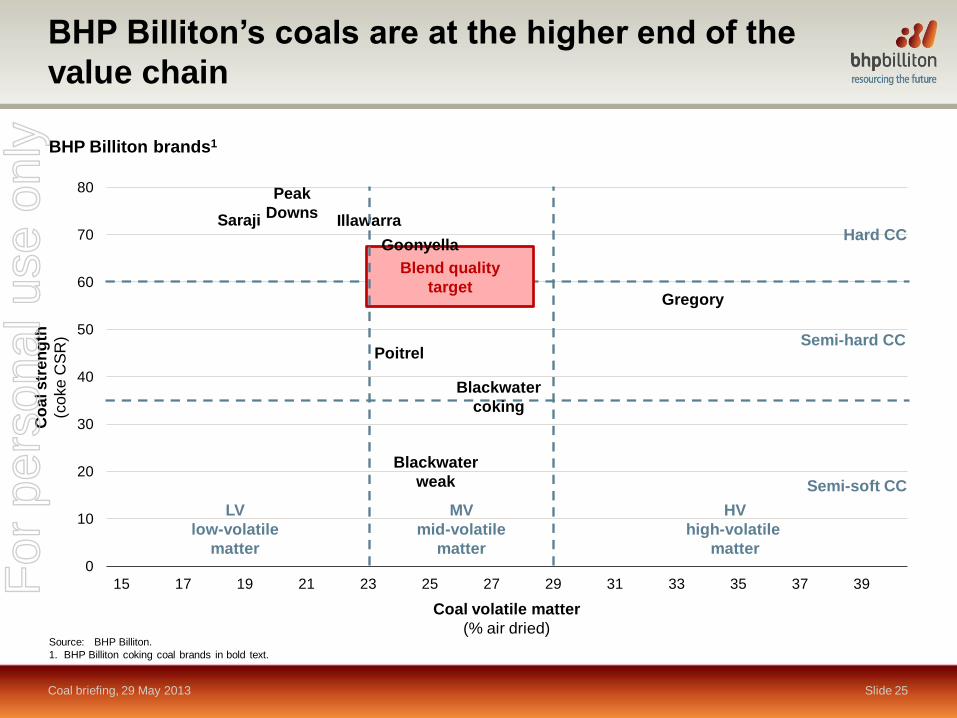
BHP Billiton’s coals are at the higher end of the
value chain
Coal briefing, 29 May 2013 Slide 25
BHP Billiton brands1
Source: BHP Billiton.
1. BHP Billiton coking coal brands in bold text.
Poitrel
Saraji
Peak
Downs
Gregory
Blackwater
coking
Blackwater
weak
LV
low-volatile
matter
HV
high-volatile
matter
Semi-hard CC
Hard CC
Semi-soft CC
Illawarra
Blend quality
target
Goonyella
MV
mid-volatile
matter
Coal volatile matter
(% air dried)
Co
al s
tre
ng
th
(co
ke
CS
R)
For
per
sona
l use
onl
y

0
10
20
30
40
50
60
70
80
15 17 19 21 23 25 27 29 31 33 35 37 39
BHP Billiton’s coals are at the higher end of the
value chain
Coal briefing, 29 May 2013 Slide 26
BHP Billiton brands1 and coal basins
Source: BHP Billiton.
1. BHP Billiton coking coal brands in bold text.
US LV
AUS and CAN Prime HCCs
AUS Hunter Valley
SSCC
Prime US HV AUS SHCCS
Poitrel
Saraji
Peak
Downs
Gregory
Blackwater
coking
Blackwater
weak
LV
low-volatile
matter
HV
high-volatile
matter
Semi-hard CC
Hard CC
Semi-soft CC
Illawarra
Blend quality
target
Goonyella
MV
mid-volatile
matter
Coal volatile matter
(% air dried)
Co
al s
tre
ng
th
(co
ke
CS
R)
For
per
sona
l use
onl
y

Coking coal price indices (US$/tonne)
Source: Platts; Argus.
50
100
150
200
250
Ap
r 1
2
Ma
y 1
2
Ju
n 1
2
Ju
l 12
Au
g 1
2
Se
p 1
2
Oct 1
2
No
v 1
2
De
c 1
2
Ja
n 1
3
Fe
b 1
3
Ma
r 1
3
Ap
r 1
3
Platts LV HCC FOB
Argus FOB HCC
Platts 64 CSR Mid-vol FOB
Platts LV PCI FOB
Platts SSCC FOB
Price indices are becoming more liquid and
increasingly accepted in the industry
Coal briefing, 29 May 2013 Slide 27
• Various price indices are available to the
market, with CSR, volatiles and ash among
the key value drivers
• There are an increasing number of index
providers accepted by the industry
• Increased spot sales have led to greater
liquidity
• Price discovery has improved and is now
more reflective of the market
• Pricing ranges have narrowed, however
better quality LV HCC maintains a premium
even in weak markets
• More customers are employing index-linked
pricing in contracts
For
per
sona
l use
onl
y

Key themes
• Strong steel production outlook continues to underpin metallurgical coal demand
• Scrap will become an increasingly important component of Chinese steel production
• China has become a significant importer of metallurgical coal
• Future demand growth is expected to transition towards other emerging economies
• The market appears comfortably supplied in the near-term
• BHP Billiton coals continue to be among the most highly valued, supporting strong
long-term margins
• We are progressing towards a more liquid, index-linked metallurgical coal market
Slide 28 Coal briefing, 29 May 2013
For
per
sona
l use
onl
y

Metallurgical coal
financial performance
Gideon Oberholzer
Vice President Finance Coal
29 May 2013
Peak Downs F
or p
erso
nal u
se o
nly

Our plan will substantially increase free
cash flow
Coal briefing, 29 May 2013 Slide 30
• Strong financial performance over the last
five financial years reflects the underlying
quality of our metallurgical coal assets
– US$11.9 billion of Underlying EBIT1,
representing 10% of total
BHP Billiton Underlying EBIT
– US$13.8 billion of cash generated from
operations, representing 10% of total
BHP Billiton cash generated from
operations
– 14% of total BHP Billiton copper
equivalent production2
– average EBIT margin of 34%
• Recent performance has been affected by
significant market and operating challenges
• The opportunity lies before us to significantly
increase margins and free cash flow
1. Excluding exceptional items and third party products.
2. Copper equivalent production calculated using FY12 average prices.
EBIT contribution by asset (Average EBIT FY08 to FY121)
BMA 65%
Illawarra 19%
BMC 16%
Metallurgical coal financial performance1
(EBIT, US$ billion) (EBIT margin, %)
(20)
0
20
40
60
(2)
0
2
4
6
FY08 FY09 FY10 FY11 FY12 H1 FY13
EBIT EBIT margin
For
per
sona
l use
onl
y

100
150
200
250
300
350
Apr 10 Nov 10 May 11 Dec 11 Jun 12 Jan 13
Argus FOB HP (USD)
Argus FOB HP (AUD equivalent)
A challenging operating environment
Coal briefing, 29 May 2013 Slide 31
• A number of factors have constrained
profitability
– severe operational challenges
– substantial drop in coal prices
– significant increase in Queensland royalties
and the introduction of a carbon tax
– cost inflation driven by a heated market for
labour, consumables, contractors and
accommodation
– persistent strength of the Australian dollar
• We have a simple roadmap to recovery and
have already delivered tangible results
Source: Argus.
HCC prices have experienced a sharp decline (US$/tonne, FOB)
For
per
sona
l use
onl
y

Queensland Coal is now operating at supply
chain capacity
Coal briefing, 29 May 2013 Slide 32
• Queensland Coal volumes were severely
constrained by extraordinary rainfall events
and industrial activity
• Operating challenges have recently been
overcome
– flood mitigation infrastructure and water
release programs have reduced risk
– a three year BMA Enterprise Bargaining
Agreement was signed in October 2012
BMA capacity utilisation has recovered (%)
40
60
80
100
120
Se
p 0
9
De
c 0
9
Ma
r 1
0
Ju
n 1
0
Se
p 1
0
De
c 1
0
Ma
r 1
1
Ju
n 1
1
Se
p 1
1
De
c 1
1
Ma
r 1
2
Ju
n 1
2
Se
p 1
2
De
c 1
2
Ma
r 1
3
Ju
n 1
3e
For
per
sona
l use
onl
y

0
50
100
150
Jul 12 FY13e
A sustainable reduction in costs is our
primary goal
Coal briefing, 29 May 2013 Slide 33
• We are targeting five key components of our
cost base to reduce operating expenditure
– a reduction in contractor usage and rates
– a significant reduction in overheads
– the alignment of mine input costs with the
external market
– a reduction in exploration and study costs
– the closure of high cost operations
Substantial reduction in BMA functional headcount (full time equivalent, index, July 2012 = 100)
Targeted FY13 cost savings are broad based
Contract reduction
Maintenance
Equipment
Personnel
Consultants
Other
For
per
sona
l use
onl
y

60
70
80
90
100
110
FY
12
Ju
l 12
Au
g 1
2
Se
p 1
2
Oct 1
2
No
v 1
2
De
c 1
2
Ja
n 1
3
Fe
b 1
3
Ma
r 1
3
Ap
r 1
3
Ma
y 1
3e
Ju
n 1
3e
Strong progress has already been achieved
Coal briefing, 29 May 2013 Slide 34
• We have successfully renegotiated terms
with some contractors while other contracts
have been terminated
• We have optimised the use of hire equipment
and rationalised the mining fleet
• We have renegotiated terms with suppliers of
bulk consumables, spares and maintenance
services
• We have delivered significant savings and
will continue to pull the productivity lever hard
BMA monthly absolute mine site cash costs (AUD, index, FY12 = 100)
BMA unit cash costs have turned the corner1
(index, FY08 = 100)
1. A$ per tonne FOB costs - cash production costs plus shiploading, demurrage, royalties and marketing and selling costs.
50
150
250
FY
08
FY
09
FY
10
FY
11
FY
12
H1
FY
13
H2
FY
13
e For
per
sona
l use
onl
y
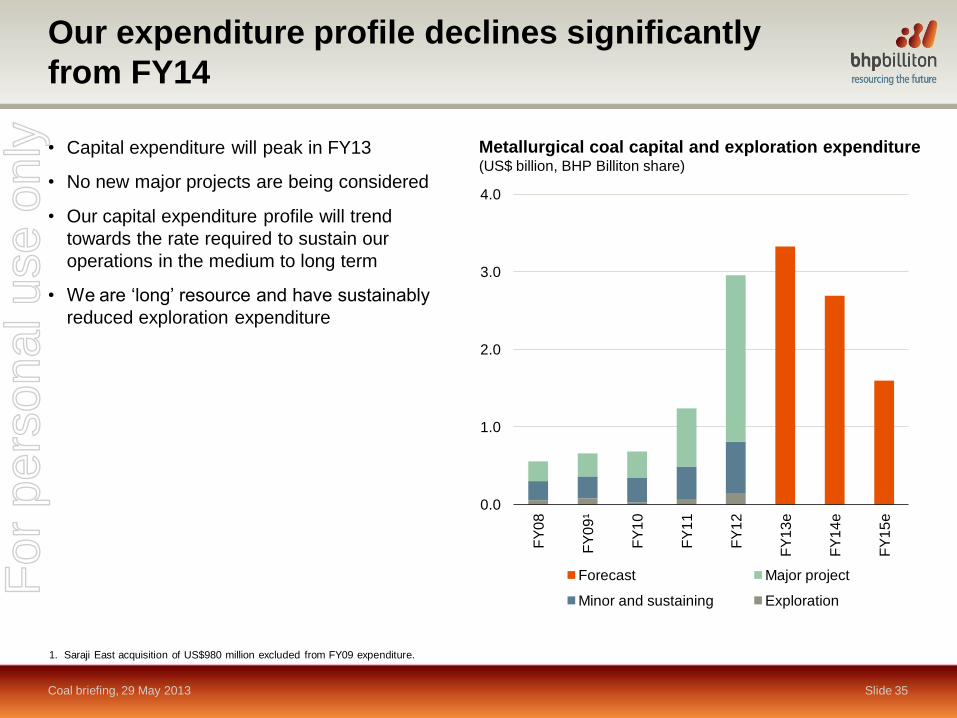
Our expenditure profile declines significantly
from FY14
Coal briefing, 29 May 2013 Slide 35
• Capital expenditure will peak in FY13
• No new major projects are being considered
• Our capital expenditure profile will trend
towards the rate required to sustain our
operations in the medium to long term
• We are „long‟ resource and have sustainably
reduced exploration expenditure
Metallurgical coal capital and exploration expenditure (US$ billion, BHP Billiton share)
1. Saraji East acquisition of US$980 million excluded from FY09 expenditure.
0.0
1.0
2.0
3.0
4.0
FY
08
FY
09
¹
FY
10
FY
11
FY
12
FY
13
e
FY
14
e
FY
15
e
Forecast Major project
Minor and sustaining Exploration
For
per
sona
l use
onl
y

Our plan will substantially increase free
cash flow
Coal briefing, 29 May 2013 Slide 36
• We have the coal resources, people and a
plan to maximise returns from our asset base
– increase the productivity and efficiency
of the supply chain
– deliver a sustainable reduction in costs
– re-establish our competitive advantage
– substantially increase free cash flow
For
per
sona
l use
onl
y

Metallurgical coal
projects
Phil Hynes
Vice President Project Development Coal
29 May 2013
Caval Ridge CPP F
or p
erso
nal u
se o
nly
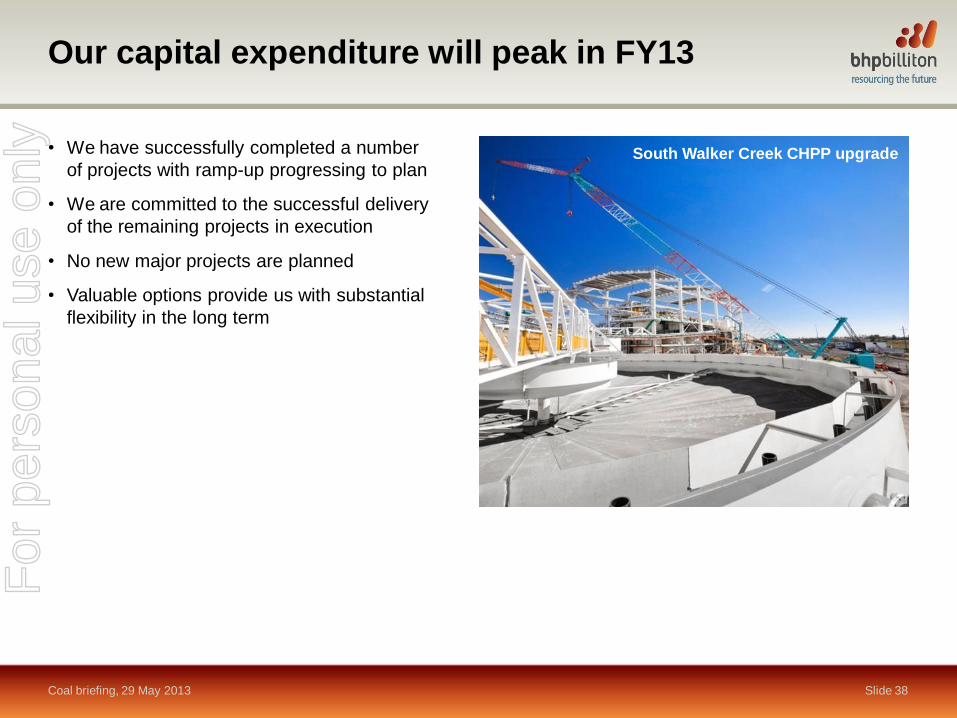
Our capital expenditure will peak in FY13
Coal briefing, 29 May 2013 Slide 38
• We have successfully completed a number
of projects with ramp-up progressing to plan
• We are committed to the successful delivery
of the remaining projects in execution
• No new major projects are planned
• Valuable options provide us with substantial
flexibility in the long term
South Walker Creek CHPP upgrade
For
per
sona
l use
onl
y

Daunia and Broadmeadow projects successfully
delivered
Coal briefing, 29 May 2013 Slide 39
Daunia
• 4.5 mtpa (100% basis) greenfield mine development
• First production achieved in March 2013, ahead of
schedule and under budget
• Forecast to ramp-up to nameplate capacity by Q4 CY13
• Budget of US$800 million (BHP Billiton share) with
forecast final cost of US$710 million
Broadmeadow Life Extension
• Extends mine life and increases capacity by 0.4 mtpa
(100% basis)
• First production achieved in March 2013, ahead of
schedule
• Forecast to ramp-up to nameplate capacity by Q4 CY13
• Budget of US$450 million (BHP Billiton share) with
forecast final cost of US$473 million
• Longwall top coal caving provides upside potential
Daunia CHPP
Broadmeadow stack out conveyor
For
per
sona
l use
onl
y

Caval Ridge will be a tier 1 hard coking coal
asset
Coal briefing, 29 May 2013 Slide 40
• Project progressing to plan
– budget of US$1.87 billion (BHP Billiton share)
– project is 63% complete1, with initial production
expected in CY14
• Resource life of the initial project is expected to be
greater than 60 years2
• Caval Ridge refers to the northern extension of the
Peak Downs mine
• Peak Downs North coking coal is a high quality premium
hard coking coal
• Mining fleet supports initial 5.5 mtpa (100% basis)
open cut mine
– owner operated dragline / truck and shovel operation
• Preparation plant is being constructed with capacity of
10 mtpa (100% basis)
– a low cost expansion will be timed to meet
market demand
1. As at 30 April 2013.
2. The Resource Life is estimated from the Caval Ridge resource base (767 mt) divided by the approved production rate of 5.5 mtpa, factored up by coal preparation plant recovery
(56%) and mining recovery (96%). The Caval Ridge Resource is incorporated into the Peak Downs Mineral Resource reported as of 30 June 2012 composed of: Measured
Resource 685 mt; Indicated Resource 874 mt , Inferred Resource 572 mt on a 100% basis (BHP Billiton interest is 50%) and should be read together with and subject to, the
notes set out in the FY12 Annual Report, which can be found at www.bhpbilliton.com.
Tailings filter building
Coal Prep Plan Building Screen Floor
For
per
sona
l use
onl
y

Hay Point expansion underpins our uniquely
integrated supply chain
Coal briefing, 29 May 2013 Slide 41
• Hay Point Stage Three Expansion increases
port capacity from 44 mtpa to 55 mtpa and
reduces storm vulnerability
• Project is 61% complete1
• The project scope has been revised and now
excludes demolition of the existing trestle
• Schedule is currently under review with no
impact to sales volumes anticipated
– marine works represent the major
challenge given significant weather
interruptions and productivity issues
• In this context, the budget of US$1.25 billion
(BHP Billiton share) is being reviewed
• This project further underpins our competitive
advantage in the Bowen Basin
HPX3 marine construction
1. As at 30 April 2013.
For
per
sona
l use
onl
y
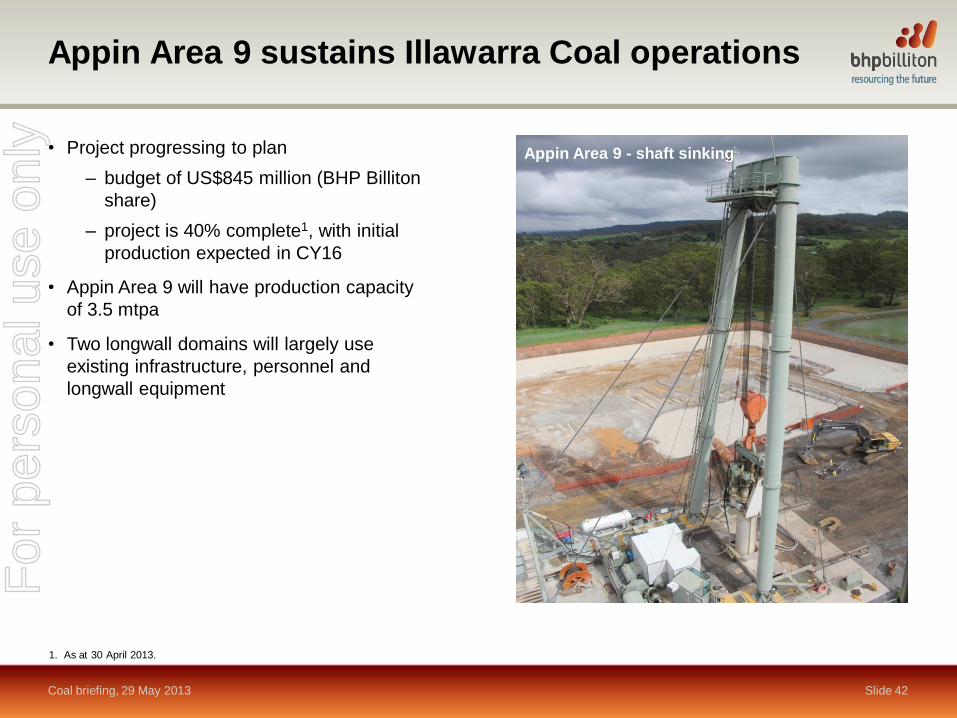
Appin Area 9 sustains Illawarra Coal operations
Coal briefing, 29 May 2013 Slide 42
• Project progressing to plan
– budget of US$845 million (BHP Billiton
share)
– project is 40% complete1, with initial
production expected in CY16
• Appin Area 9 will have production capacity
of 3.5 mtpa
• Two longwall domains will largely use
existing infrastructure, personnel and
longwall equipment
Appin Area 9 - shaft sinking
1. As at 30 April 2013.
For
per
sona
l use
onl
y

Hay Point – maximising
supply chain efficiency
Stephen Dumble
Asset President BMA
29 May 2013
Hay Point F
or p
erso
nal u
se o
nly

Hay Point Coal Terminal
Slide 44 Coal briefing, 29 May 2013
3rd berth
Product stockyards
New transfer towers
New trestle Existing trestle
Existing berths
For
per
sona
l use
onl
y

Hay Point Coal Terminal provides a significant
competitive advantage
Coal briefing, 29 May 2013 Slide 45
• Hay Point is 100% BMA owned
• Dedicated port with full blending capability
underpins our competitive advantage
• Existing port capacity of 44 mtpa with
expansion to 55 mtpa underway
• Services eight of our Queensland Coal mines
• Capacity details
– in-loading and out-loading capacity of
6,000 tph
– 5 stackers / reclaimers
– stockyard capacity 1.25 million tonnes
• The port loads around 450 vessels per annum,
shipping to 70 customers in more than 20
countries
Hay Point shiploading
Hay Point stockyards
For
per
sona
l use
onl
y

Bowen
Collinsville
Moranbah
Mackay
Dysart
Emerald Blackwater
Rockhampton
South Walker Creek
Poitrel
Peak Downs
Saraji
Goonyella Riverside
Broadmeadow
Blackwater
Caval Ridge
Daunia
DBCT Hay Point
Gladstone
0 100km
Gregory Crinum
Norwich Park
Abbot Point
Hay Point 44 mtpa
(55 mtpa HPX3)
Gladstone 81 mtpa
DBCT 85 mtpa
Abbot Point 50 mtpa
Goonyella Rail System
129 mtpa
Newlands Rail
System 50 mtpa
Blackwater Rail System 74 mtpa
Under construction
BMA operations
Rail Port Mine
BMC operations
Leveraging our infrastructure network to deliver
value for our shareholders
Coal briefing, 29 May 2013 Slide 46
• Capacity at four Queensland ports with
matched rail flexibility allows us to optimise
the supply chain
• BMA rail operations are being established
with initial capacity of 15 mtpa commencing
in CY14
• BMA is the only integrated metallurgical coal
producer from mine to port in Australia
BMA locomotive Note: All rail and port capacities are shown at 100%.
For
per
sona
l use
onl
y

For
per
sona
l use
onl
y