coal primer
DESCRIPTION
Start of a Primer on the US Coal IndustryTRANSCRIPT

A Global CommodityGlobal Supply, Global Demand

Coal: The Essential Resource• This primer was complied as part of research conducted for an equity research report on
Hallador Energy, and Illinois Basin Coal Company.
• Coal is one of the worlds essential resources, despite its current status as a reviled resource, one that has long been the target of aggressive government regulation in the United States, and more recently a target of governments the world over, it remains an essential source of energy.
• Approximately 41% of the worlds electricity is generated by coal-fired power plants, more then any other fuel source, and 68% of the worlds steel is produced using coal.
Key Take Away: Coal Remains one of the Worlds Essential Resources
2013 Regional Consumption by Fuel as a % of Total Consumption*Oil NatGas Coal Nuclear Hydro Renewables
N. America 36.75% 30.09% 17.53% 7.67% 5.61% 2.35%S. & C. America 46.26% 22.53% 4.33% 0.69% 23.47% 2.72%Europe 30.03% 32.76% 17.39% 8.99% 6.88% 3.95%Middle East 49.00% 49.08% 1.05% 0.12% 0.73% 0.03%Africa 41.88% 27.20% 23.43% 0.77% 6.30% 0.42%Asia 27.47% 11.17% 52.35% 1.51% 5.99% 1.52%Total 32.87% 23.73% 30.06% 4.42% 6.72% 2.19%*Million Tonnes Oil Equivalent

Global Energy Consumption• The Worlds Top Five Energy Consumers in 2013 were: China, US, Russia, India
and Japan.
• Over the last ten years the energy consumption has been driven by the developing world, and in particular by China and India.
Top Five Energy Consumers*2009 2010 2011 2012 2013 CAGR Spark Chart
China 2,104 2,340 2,545 2,731 2,852 6.27%US 2,206 2,285 2,265 2,208 2,266 0.54%Russian 648 674 696 699 699 1.53%India 484 510 535 573 595 4.23%Japan 478 507 481 478 474 -0.15%Total of Top Ten 5,919 6,316 6,522 6,690 6,886 3.07%Rest of World 5,407 5,640 5,710 5,794 5,844 1.57%Total World 11,326 11,956 12,232 12,483 12,730 2.37%*Million Tonnes Oil Equivalent
0
1000
2000
3000
4000
5000
6000
7000
8000
1965
1968
1971
1974
1977
1980
1983
1986
1989
1992
1995
1998
2001
2004
2007
2010
2013
Mill
ion
tonn
es o
il eq
uiva
lent
OECD vs. Non-OECD Energy Consumption
OECD Non-OECD
0
500
1000
1500
2000
2500
3000
1965
1968
1971
1974
1977
1980
1983
1986
1989
1992
1995
1998
2001
2004
2007
2010
2013
Mill
ion
tonn
es o
il eq
uiva
lent
Energy Consumption: China, vs. US
China US

Global Coal Consumption
• Global coal is consumed primarily for electricity generation and steel making. (% split)• The world consumption of coal has grown at a rate
of ____ since 1990 and at a rate of ____ since 2000. In the US the rate of growth since 2000 has been ___. • As a percentage of total world energy consumption
coal has ____________________
Pic Chart of Coal UsageGlobal Consumption of Coal and % of Global Energy Consumption Chart

Illinois BasinThe New Heart of US Coal Production

The Illinois Basin
• The Illinois Basin has experienced a 25% increase in volume mined since 2009, while the traditional heart of American Coal, the Appalachian Region, has declined by 14%.
• Illinois Basin market share has risen from 8% of total US production in 2000, to 12.5% in 2012. Growth in market share has been driven by the spread of scrubbing technology at coal fired power plants, enabling them to make use of the higher sulfur content, and relatively higher BTU ILB coal.
• ILB coal was first exported from the US in 2007, since then the volume of export has grown by 10%, in 2012 industry data suggests that 29% of US thermal coal exports were from the ILB. This trend is likely to continue as a result of new export terminal construction.
• The Illinois Basic is estimate to have over 50 billion tons of recoverable coal reserves, making it the second largest basin in the country behind only Powered River Basin with its estimated 115 billion tons.
Key Take Away: The Illinois Basin is one of thepremier US Coal Basins with significant growth potential

The Illinois Basin: Reserves
• As of 2013 ILB consisted of approximately 80 mines, approximately 75% of which were focused on underground mining, and 25% of which engaged in surface mining.
• The most prolific coal seam in the ILB is the Herrin Coal Thickness, which is 4 to 9 feet thick and ideal for cost effective long wall and continues mining.
Power River Basin43%
Appalahia19%
Western Bituminous
5%
Other13%
West Kentucky3%
Indiana 2%
Illinois15%
Illinois Basin20%
Total US Reserve Base • The ILB has 50.6 billion tons of estimated recoverable reserves at the end of 2011: 37.9 billion in Illinois, 4.0 in Indiana and 8.6 in West Kentucky.
• The ILB represents 20% of the country’s recoverable reserves, second only to the powder river basin. Assuming 140 million tons of production the ILB would have a reserve a level of 360 years.

The Illinois Basin: Pricing
• Approximately 75% of ILB mines are focused on underground extraction, and 25% of are engaged in surface mining.
• The most prolific coal seam in the ILB is the Herrin Coal Thickness, which is 4 to 9 feet thick and ideal for cost effective underground long wall and continues mining.
• In addition to more efficient mining techniques ILB labor structure helps keep costs down, with only 6% of coal miners in the region belonging to a union, compared to 275 in the Appalachian basin.
• Although the heat content is similar CAPP remains significantly more expensive then ILB.
15
25
35
45
55
65
75
85
2001 2002 2003 2004 2005 2006 2007 2008 2009 2010 2011 2012
CAPP vs. ILB Coal Prices
CAPP ILB
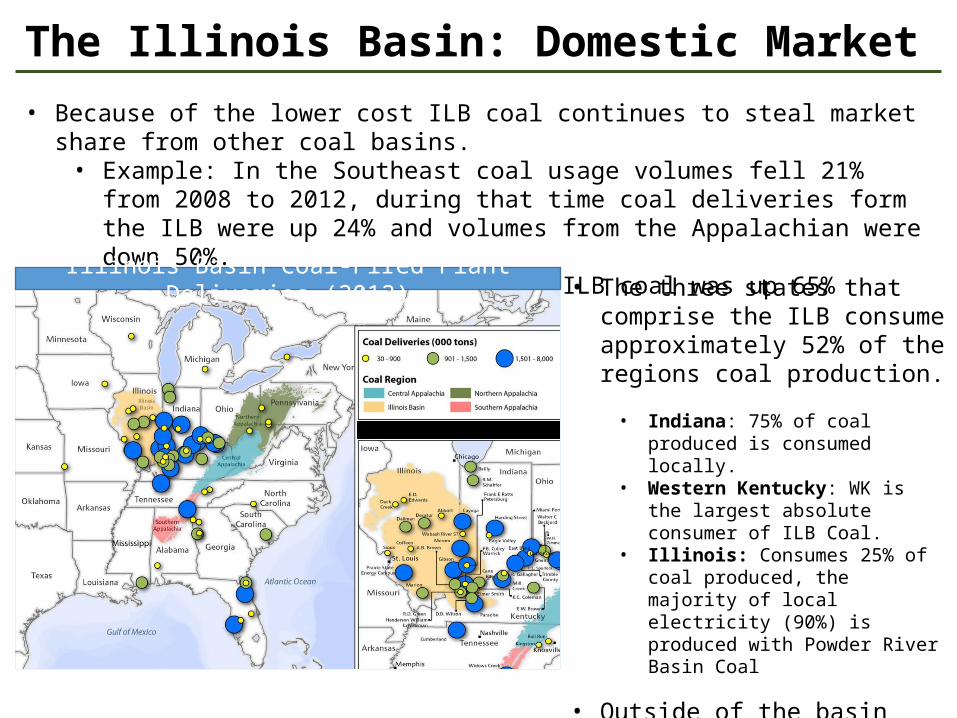
The Illinois Basin: Domestic Market• Because of the lower cost ILB coal continues to steal market share from other coal basins.
• Example: In the Southeast coal usage volumes fell 21% from 2008 to 2012, during that time coal deliveries form the ILB were up 24% and volumes from the Appalachian were down 50%.
• Example: Florida consumption of ILB coal was up 65% between 2009 and 2012.
Illinois Basin Coal-Fired Plant Deliveries (2012) • The three states that comprise the ILB consume approximately 52% of the regions coal production.
• Indiana: 75% of coal produced is consumed locally.
• Western Kentucky: WK is the largest absolute consumer of ILB Coal.
• Illinois: Consumes 25% of coal produced, the majority of local electricity (90%) is produced with Powder River Basin Coal
• Outside of the basin Florida, Ohio, Tennessee and Alabama are the largest consumers of ILB coal.

The Illinois Basin: International Market
• As of 2013 ILB consisted of approximately 80 mines, approximately 75% of which were focused on underground mining, and 25% of which engaged in surface mining.
• The most prolific coal seam in the ILB is the Herrin Coal Thickness, which is 4 to 9 feet thick and ideal for cost effective long wall and continues mining.

The Illinois Basin: Major Producers
• As of 2013 ILB consisted of approximately 80 mines, approximately 75% of which were focused on underground mining, and 25% of which engaged in surface mining.
• The most prolific coal seam in the ILB is the Herrin Coal Thickness, which is 4 to 9 feet thick and ideal for cost effective long wall and continues mining.

The Illinois Basin: Major Producer Margins
• As of 2013 ILB consisted of approximately 80 mines, approximately 75% of which were focused on underground mining, and 25% of which engaged in surface mining.
• The most prolific coal seam in the ILB is the Herrin Coal Thickness, which is 4 to 9 feet thick and ideal for cost effective long wall and continues mining.