coalition for african rice development: progress since … · coalition for african rice...
TRANSCRIPT

www.riceforafrica.org/meetings/sc/sc7 CARD SC7 Meeting Document No. 2-1
1
Coalition for African Rice Development: Progress since the 4th General Meeting (GM4)
8 November 2012, Yaounde, CAMEROON
CARD Secretariat
Contents
1. NRDS implementation
2. Mechanization
3. Marketing
4. South-south Cooperation (CARD Sec data base, VC, IFAD Grant)
5. CAADP
6. Networking with the private sector

www.riceforafrica.org/meetings/sc/sc7 CARD SC7 Meeting Document No. 2-1
2
1. NRDS IMPLEMENTATION
NRDS Implementation – Process
NRDS Process
NRDS Formulation & Launching
Gap Analysis & Prioritization
Concept Notes
Lobbying for Funding
Project Cycle Management
Updates
X Donor
Mapping Needs
Mapping = Gaps
Priorities
↓
Mechanization Promotion
Thematic issues e.g. Market Access
↓
Alignment to CAADP
NRDS Taskforce
Gov’t Budget
CAADP I/P
DPs
Private Sector
Concept Notes

www.riceforafrica.org/meetings/sc/sc7 CARD SC7 Meeting Document No. 2-1
3
Capacity Development in strategic planning G2 Country Formulatio
n Prioritisation
Concept Notes
Benin
Burkina Faso
Côte D’Ivoire
CAR
DR Congo
Ethiopia
The Gambia
Liberia
Rwanda
Togo
Zambia
G1 Country Formulation
Prioritisation
Concept Notes
Cameroon
Ghana
Guinea
Kenya
Madagascar
Mali
Mozambique
Nigeria
Senegal
Sierra Leone
Tanzania
Uganda
- WW2 - WW1 - WW2 - WW1
Local
Local
FAO
Prioritisation 20/23 countries [3/4]
Policy /
Institutional
Infrastructure Human resource
capacity
Provision /
support
Information /
knowledge
Seed
Fertilizer
Irrigation /
water management
On-farm
technology
dissemination
(R&E)
Mechanization
Quality
improvement
Access to market
Access to credit
Overall policy tools
www.riceforafrica.org/meetings/sc/sc7 CARD SC7 Meeting Document No. 2-1
4
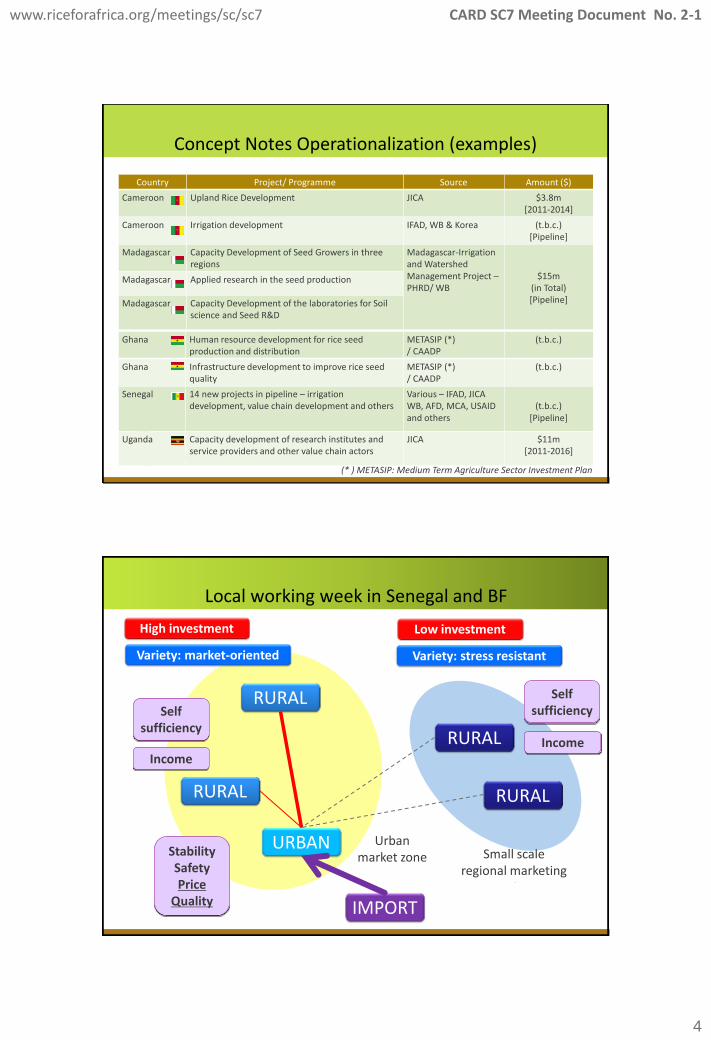
Concept Notes Operationalization (examples)
Country Project/ Programme Source Amount ($)
Cameroon Upland Rice Development JICA $3.8m [2011-2014]
Cameroon Irrigation development IFAD, WB & Korea (t.b.c.) [Pipeline]
Madagascar Capacity Development of Seed Growers in three regions
Madagascar-Irrigation and Watershed Management Project – PHRD/ WB
$15m (in Total) [Pipeline]
Madagascar Applied research in the seed production
Madagascar Capacity Development of the laboratories for Soil science and Seed R&D
Ghana Human resource development for rice seed production and distribution
METASIP (*) / CAADP
(t.b.c.)
Ghana Infrastructure development to improve rice seed quality
METASIP (*) / CAADP
(t.b.c.)
Senegal 14 new projects in pipeline – irrigation development, value chain development and others
Various – IFAD, JICA WB, AFD, MCA, USAID and others
(t.b.c.)
[Pipeline]
Uganda Capacity development of research institutes and service providers and other value chain actors
JICA $11m [2011-2016]
(* ) METASIP: Medium Term Agriculture Sector Investment Plan
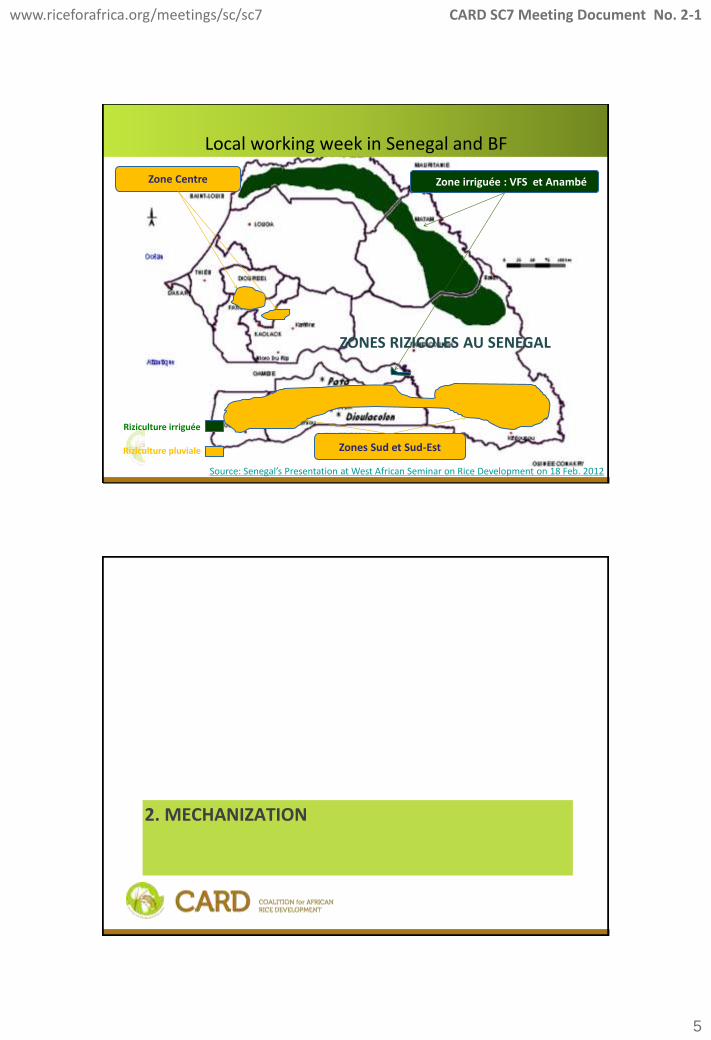
Urban market zone Small scale
regional marketing
Local working week in Senegal and BF
URBAN
RURAL
RURAL
RURAL
RURAL
Stability Safety Price
Quality
Self sufficiency
Income
High investment Low investment
Variety: market-oriented Variety: stress resistant
Self sufficiency
Income
IMPORT
www.riceforafrica.org/meetings/sc/sc7 CARD SC7 Meeting Document No. 2-1
5
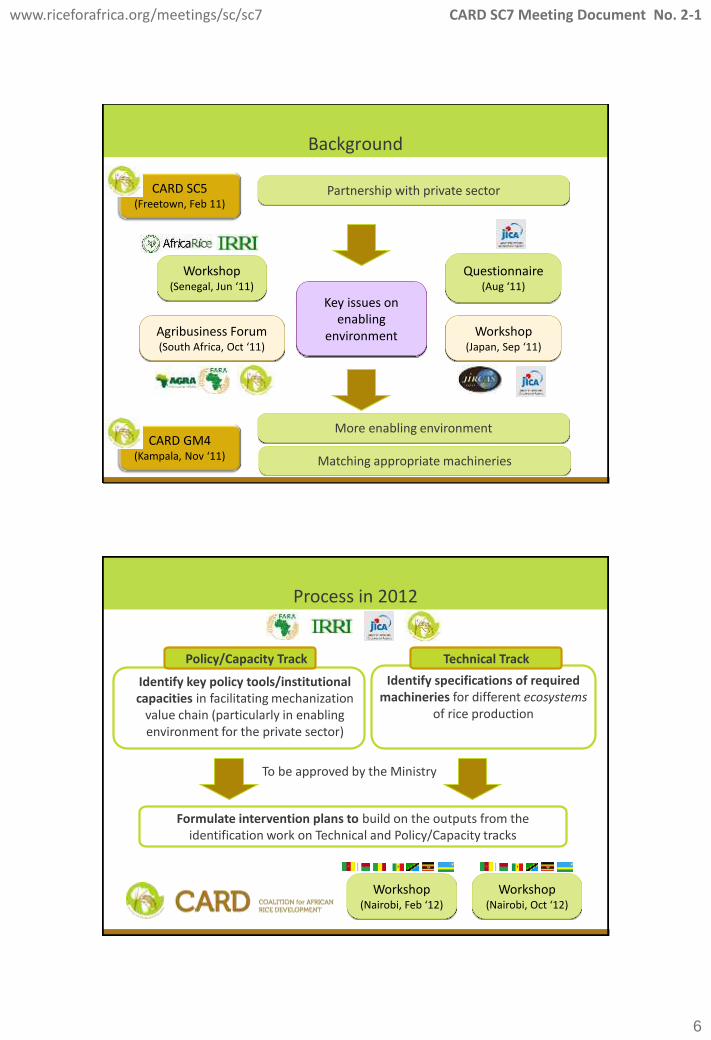
• Pls put map of Senegal here
Zones Sud et Sud-Est
Zone irriguée : VFS et Anambé Zone Centre
Riziculture irriguée
Riziculture pluviale
ZONES RIZICOLES AU SENEGAL
Local working week in Senegal and BF
Source: Senegal’s Presentation at West African Seminar on Rice Development on 18 Feb. 2012
2. MECHANIZATION
www.riceforafrica.org/meetings/sc/sc7 CARD SC7 Meeting Document No. 2-1
6
Background
Partnership with private sector CARD SC5 (Freetown, Feb 11)
Workshop (Senegal, Jun ‘11)
Questionnaire (Aug ‘11)
Workshop (Japan, Sep ‘11)
Agribusiness Forum (South Africa, Oct ‘11)
Key issues on enabling
environment
More enabling environment CARD GM4
(Kampala, Nov ‘11) Matching appropriate machineries
Process in 2012
Identify specifications of required machineries for different ecosystems
of rice production
Technical Track
Identify key policy tools/institutional capacities in facilitating mechanization
value chain (particularly in enabling environment for the private sector)
Policy/Capacity Track
Formulate intervention plans to build on the outputs from the identification work on Technical and Policy/Capacity tracks
To be approved by the Ministry
Workshop (Nairobi, Feb ‘12)
Workshop (Nairobi, Oct ‘12)
www.riceforafrica.org/meetings/sc/sc7 CARD SC7 Meeting Document No. 2-1
7
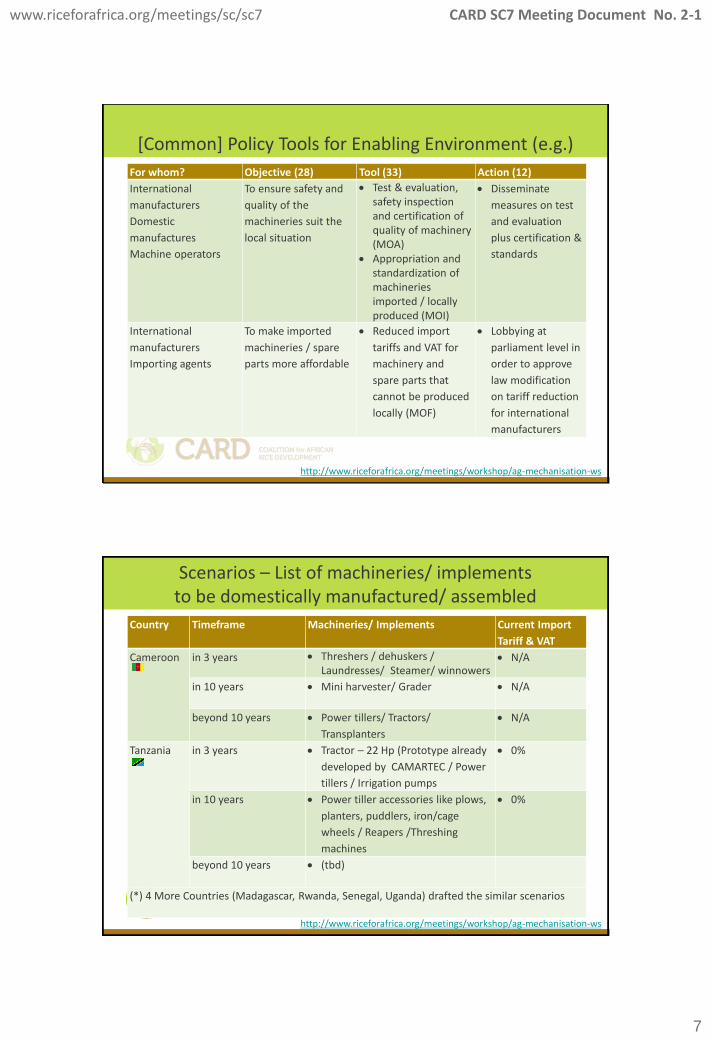
[Common] Policy Tools for Enabling Environment (e.g.)
http://www.riceforafrica.org/meetings/workshop/ag-mechanisation-ws
For whom? Objective (28) Tool (33) Action (12)
International
manufacturers
Domestic
manufactures
Machine operators
To ensure safety and
quality of the
machineries suit the
local situation
Test & evaluation, safety inspection and certification of quality of machinery (MOA)
Appropriation and standardization of machineries imported / locally produced (MOI)
Disseminate
measures on test
and evaluation
plus certification &
standards
International
manufacturers
Importing agents
To make imported
machineries / spare
parts more affordable
Reduced import
tariffs and VAT for
machinery and
spare parts that
cannot be produced
locally (MOF)
Lobbying at
parliament level in
order to approve
law modification
on tariff reduction
for international
manufacturers
Scenarios – List of machineries/ implements to be domestically manufactured/ assembled
Country Timeframe Machineries/ Implements Current Import
Tariff & VAT
Cameroon in 3 years Threshers / dehuskers / Laundresses/ Steamer/ winnowers
N/A
in 10 years Mini harvester/ Grader N/A
beyond 10 years Power tillers/ Tractors/
Transplanters
N/A
Tanzania
in 3 years Tractor – 22 Hp (Prototype already
developed by CAMARTEC / Power
tillers / Irrigation pumps
0%
in 10 years Power tiller accessories like plows,
planters, puddlers, iron/cage
wheels / Reapers /Threshing
machines
0%
beyond 10 years (tbd)
(*) 4 More Countries (Madagascar, Rwanda, Senegal, Uganda) drafted the similar scenarios
http://www.riceforafrica.org/meetings/workshop/ag-mechanisation-ws
www.riceforafrica.org/meetings/sc/sc7 CARD SC7 Meeting Document No. 2-1
8
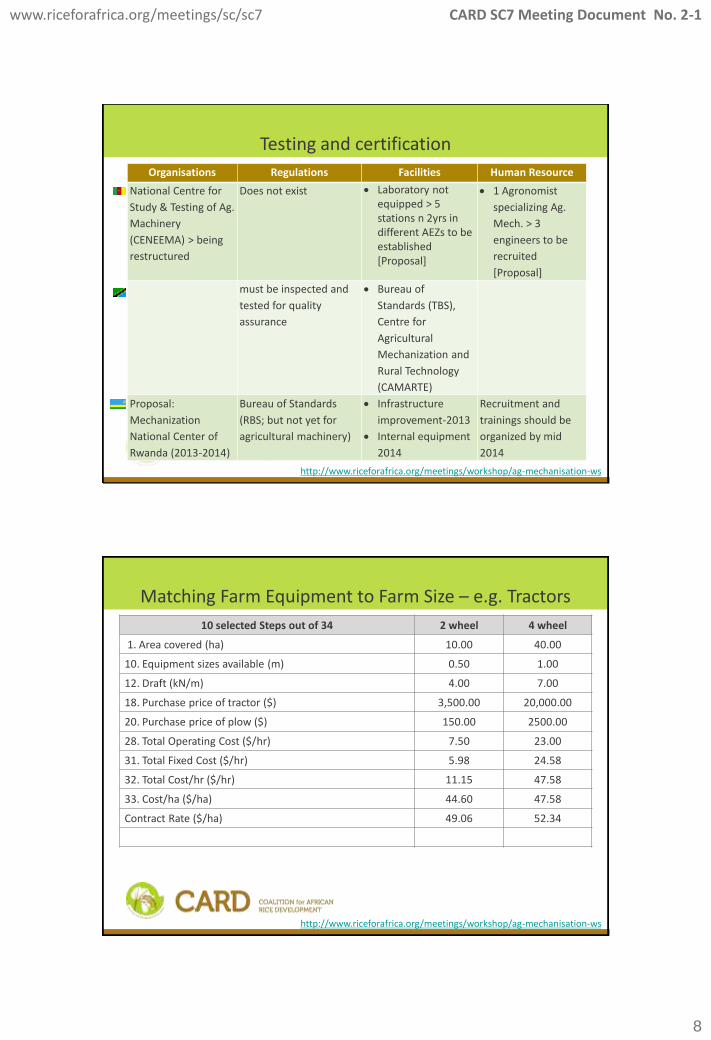
Testing and certification
Organisations Regulations Facilities Human Resource
National Centre for
Study & Testing of Ag.
Machinery
(CENEEMA) > being
restructured
Does not exist Laboratory not equipped > 5 stations n 2yrs in different AEZs to be established [Proposal]
1 Agronomist
specializing Ag.
Mech. > 3
engineers to be
recruited
[Proposal]
must be inspected and
tested for quality
assurance
Bureau of
Standards (TBS),
Centre for
Agricultural
Mechanization and
Rural Technology
(CAMARTE)
Proposal:
Mechanization
National Center of
Rwanda (2013-2014)
Bureau of Standards
(RBS; but not yet for
agricultural machinery)
Infrastructure
improvement-2013
Internal equipment
2014
Recruitment and
trainings should be
organized by mid
2014
http://www.riceforafrica.org/meetings/workshop/ag-mechanisation-ws
10 selected Steps out of 34 2 wheel 4 wheel
1. Area covered (ha) 10.00 40.00
10. Equipment sizes available (m) 0.50 1.00
12. Draft (kN/m) 4.00 7.00
18. Purchase price of tractor ($) 3,500.00 20,000.00
20. Purchase price of plow ($) 150.00 2500.00
28. Total Operating Cost ($/hr) 7.50 23.00
31. Total Fixed Cost ($/hr) 5.98 24.58
32. Total Cost/hr ($/hr) 11.15 47.58
33. Cost/ha ($/ha) 44.60 47.58
Contract Rate ($/ha) 49.06 52.34
Matching Farm Equipment to Farm Size – e.g. Tractors
http://www.riceforafrica.org/meetings/workshop/ag-mechanisation-ws
www.riceforafrica.org/meetings/sc/sc7 CARD SC7 Meeting Document No. 2-1
9
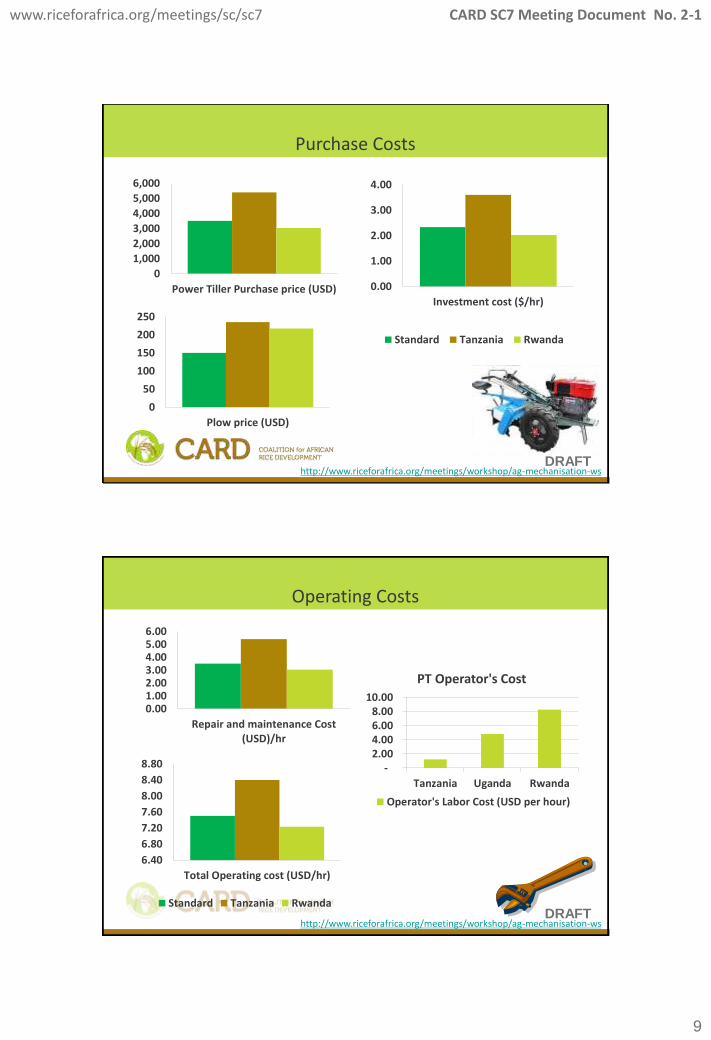
0
1,000
2,000
3,000
4,000
5,000
6,000
Power Tiller Purchase price (USD)
0
50
100
150
200
250
Plow price (USD)
0.00
1.00
2.00
3.00
4.00
Investment cost ($/hr)
Standard Tanzania Rwanda
Purchase Costs
http://www.riceforafrica.org/meetings/workshop/ag-mechanisation-ws DRAFT
0.001.002.003.004.005.006.00
Repair and maintenance Cost(USD)/hr
6.40
6.80
7.20
7.60
8.00
8.40
8.80
Total Operating cost (USD/hr)
Standard Tanzania Rwanda
- 2.00 4.00 6.00 8.00
10.00
Tanzania Uganda Rwanda
PT Operator's Cost
Operator's Labor Cost (USD per hour)
Operating Costs
http://www.riceforafrica.org/meetings/workshop/ag-mechanisation-ws DRAFT

www.riceforafrica.org/meetings/sc/sc7 CARD SC7 Meeting Document No. 2-1
10
0.00
2.00
4.00
6.00
8.00
10.00
Total Fixed cost (USD/hr)
0.00
4.00
8.00
12.00
16.00
Total Cost/hr (USD)
Standard Tanzania Rwanda
Fixed and Total Costs
http://www.riceforafrica.org/meetings/workshop/ag-mechanisation-ws DRAFT
-
20.00
40.00
60.00
80.00
100.00
Standard Mech Manual Mech Manual
Co
st (
USD
/Ha)
Cost of Land Preparation (USD/Ha)
Tanzania Rwanda
Comparison between Manual- and Mechanized Costs of Land Preparation at 10% return to service provider
http://www.riceforafrica.org/meetings/workshop/ag-mechanisation-ws DRAFT
www.riceforafrica.org/meetings/sc/sc7 CARD SC7 Meeting Document No. 2-1
11
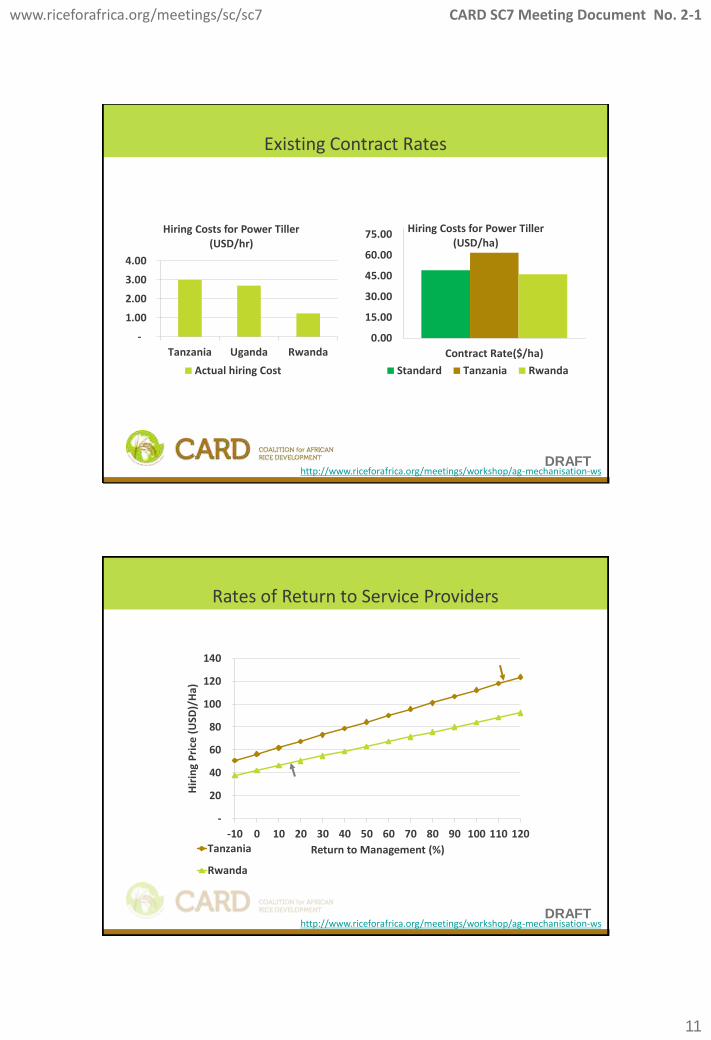
-
1.00
2.00
3.00
4.00
Tanzania Uganda Rwanda
Hiring Costs for Power Tiller (USD/hr)
Actual hiring Cost
0.00
15.00
30.00
45.00
60.00
75.00
Contract Rate($/ha)
Hiring Costs for Power Tiller (USD/ha)
Standard Tanzania Rwanda
Existing Contract Rates
DRAFT http://www.riceforafrica.org/meetings/workshop/ag-mechanisation-ws
-
20
40
60
80
100
120
140
-10 0 10 20 30 40 50 60 70 80 90 100 110 120
Hir
ing
Pri
ce (
USD
)/H
a)
Return to Management (%) Tanzania
Rwanda
Rates of Return to Service Providers
DRAFT http://www.riceforafrica.org/meetings/workshop/ag-mechanisation-ws
www.riceforafrica.org/meetings/sc/sc7 CARD SC7 Meeting Document No. 2-1
12
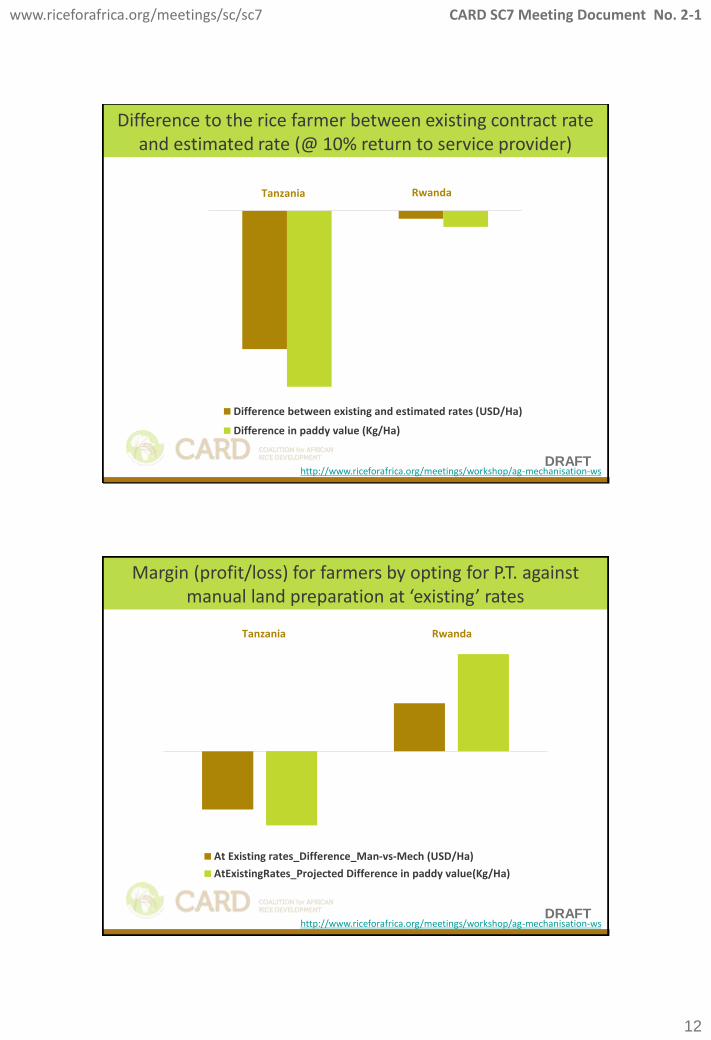
Difference between existing and estimated rates (USD/Ha)
Difference in paddy value (Kg/Ha)
Tanzania Rwanda
Difference to the rice farmer between existing contract rate and estimated rate (@ 10% return to service provider)
http://www.riceforafrica.org/meetings/workshop/ag-mechanisation-ws DRAFT
At Existing rates_Difference_Man-vs-Mech (USD/Ha)
AtExistingRates_Projected Difference in paddy value(Kg/Ha)
Tanzania Rwanda
Margin (profit/loss) for farmers by opting for P.T. against manual land preparation at ‘existing’ rates
http://www.riceforafrica.org/meetings/workshop/ag-mechanisation-ws DRAFT

www.riceforafrica.org/meetings/sc/sc7 CARD SC7 Meeting Document No. 2-1
13
Observations Issues Policy Options
Contract rate is low in Rwanda
The power tillers are subsidized (sustainability) Contract is sponsored by public sector Lack of private players in service provision
The operating cost for power tiller in Tanzania is also higher at 8.4 USD/hr
High repair and maintenance cost (5.4 USD/hr) against an estimated 3.5 USD/hr (Tanz)
High operator cost (Rwa) High fuel cost (Rwa)
Investment cost for power tillers is higher (USD 5400)\
Higher sales margin Higher interest rates on loans towards
machineries Matching of Equipments (machineries and
implements)
Contract rate (USD/hr) is high for Tanzania
High inflation Higher interest rates on loans/investments Taxation (service tax, income tax, etc.) Poor matching of equipments No/Weak competition amongst private
entrepreneurs
Observations > Issues > Technical and Policy Options
http://www.riceforafrica.org/meetings/workshop/ag-mechanisation-ws DRAFT
3. MARKETING

www.riceforafrica.org/meetings/sc/sc7 CARD SC7 Meeting Document No. 2-1
14
Updates
• Communicated with CMAOC as per the recommendation of the GM4 but did not make much progress.
• Meanwhile, the Gates Foundation conducted rice value chain analysis in their portfolio countries
• Detailed study: Burkina Faso, Ghana, Nigeria, Tanzania
• Preliminary study: Ethiopia, Mali and Uganda
• The Secretariat provided comments at the key points of the process, good relationship established
Source: OLAM, Interviews
National rice consumption in Ghana1)2)3) ['000 MT (%), 2011]
770
(100%)
100%
Local
Perfumed
<5% broken
28
(4%) 28
Vietnam Perfumed
<5% broken
34
(4%) 34
Thailand Perfumed
<5% broken
120
US #2 Non-
perfume 4% broken
82
(11%)
82
US#4 Non-
perfume 8% broken
9
(1%) 9
Medium
Segment >5%, 15%, 25% broken
407
(53%)
223
185
FA1S 100% broken
89
(12%)
28 61
120
(16%)
Premium Good Poor • Urban market consumers
prefer imported rice due to
perception of higher quality
- It is cleaner (no stones)
- Perfumed and low %
broken
- Appearance (e.g., even
color)
• Local rice must meet these
characteristics in order to
compete with imports
• Perfumed rice in particular
is increasingly popular and
now accounts for 81% of
overall rice imports
• 48% of imported rice
consumption is <5%
broken
• 31% of imported rice
consumption is perfumed
and <5% broken
Increasing quality
1) Based on OLAM sales estimates; 2) Local production of milled rice was 278 MT in 2011 (assumes 40% paddy loss from processing); 3) Assumes 80% of local milled rice is in the Medium segment range, 10% Premium and 10% Poor
National rice
consumption
Medium
Local Import
+2%
National rice
consumption
CAGR 06-11[%]
-4%
-17%
+3%
+40%
THE GHANAIAN RICE MARKET IS INCREASINGLY DRIVEN BY PREMIUM RICE WHICH IS GROWING AT 40% P.A., WHILE THE
MEDIUM SEGMENT IS SHRINKING AT -4% P.A.
Source: BMGF’s Presentation at West African Seminar on Rice Development on 18 Feb. 2012

www.riceforafrica.org/meetings/sc/sc7 CARD SC7 Meeting Document No. 2-1
15
• Perceived quality is a major factor in consumer
purchasing decisions and is the main reason why
consumers prefer imported rice
• The reputation of local rice is associated with
poor quality and it is priced at the level of 100%
broken rice
• Urban markets (such as Accra and Kumasi)
consume 75% of total rice in Ghana (both local
and import rice) yet they only consume ~20% of
local rice
• Local rice is rarely found in supermarket
chains, whose shelves are dominated by imported
rice varieties
• There is a need to improve local rice quality in
Ghana to compete with imports and to launch a
marketing campaign to advocate for consumption
the higher quality local rice1)
• Some importers, including Finatrade, buy local
aromatic rice and repackage it for the local market
Consumers are willing to pay a price premium of 113% for imported Thai rice over premium local rice
Source: OLAM, Finatrade, Interviews
1) 2008 “Ghana Rice” marketing campaign led to increases in the reported purchase of Ghanaian rice
Market price of high quality milled rice in Ghana, 2012 [GH₵/50 kg bag]
Low High Average
FA1S
(Perfumed
100% broken
Vietnam
(Perfumed,
<5% broken)
Thailand
(Perfumed,
<5% broken)
Local rice
(Perfumed,
<5% broken)
Ø 75
160
138
Ø 147
106
92 Ø 96
88
77 Ø 80
+113%
Source: BMGF’s Presentation at West African Seminar on Rice Development on 18 Feb. 2012
IF THE CHALLENGES CAN BE OVERCOME AND QUALITY CAN BE MET, GHANAINA FARMERS COULD PRODUCE AT A COST THAT IS COMPETITIVE
WITH IMPORTED THAI RICE
Source: BMGF Rive Value Chain Analysis
377
679
553
13
266
Trans-
port5)
60
Duty
(20%)
and
fees
324
Landed
cost
(FOB)4)
900
377
(42%)
523
Total
cost
per MT
milled
rice
Post
harvest
56
Harvest
75
Bird
scaring
38
Weed-
ing
50
Crop
protect-
ion
48
Fert-
ilizer
108
Seed
60
Land
prep
57
Bags
40
1,173
(76%)
1,550
Margin
(10%)
24%
377
(24%)
Total
10
Cart-
ing
Total
cost
per
Ha1)
79
Process-
ing2)
47
Trans-
port3)
Total
cost of
milled
rice
Irrig-
ation
1) Production cost for 1 harvest and assumes yield of 3 MT per Ha for irrigated fields; 2) Assumes paddy loss of 40% from milling; 3) Transportation of 1.8
MT milled rice from Northern to main markets; 4) FOB: Freight on Board, average price per MT: USD 900; 5) Transportation of 1 MT milled rice from Port
(Accra) to main markets
Cost comparison of imported and local milled rice, 2012 [USD]
Total cost for 3
MT paddy
Total cost for 1.8
MT milled rice
Cost of 1 MT milled local rice on smallholder irrigated farm
Total cost for
per MT milled
rice
Cost of 1 MT imported premium Thai rice
• Costs exclude farmer’s own labour and margins along the value
chain
• Even allowing for margins, the industry should be able to
compete with imported rice on cost if they can match its quality
• The picture is similar for rain fed smallholder farmers
We expect production cost to fall as efficiency improves and higher yields are achieved
Source: BMGF’s Presentation at West African Seminar on Rice Development on 18 Feb. 2012

www.riceforafrica.org/meetings/sc/sc7 CARD SC7 Meeting Document No. 2-1
16
1) Irrigation Company of Upper Region; 2) Will be operational 2012 end; 3) Includes government ownership, currently being taken over by Anvash; 4) WIENCO interested in the Eastern region
• GADCO
• Prairie
Volta3)
• Brazil
Agro-
Investment
• Finatrade
• OLAM
• Stallion
• Avnash Rice
Mill2)
• Large
nucleus
farmers (up
to 300 Ha
land)
• ICOUR1) • ICOUR1)
• Single mothers
(parboiled rice)
• Avnash
Rice Mill2)
• Nasia rice
mill3)
• Lolandi3)
• Amsig
Resources
• GADCO2)
• Prairie
Volta3)
• Brazil Agro-
Investment
Commercial players
• Aggregators
• Novel
Producer Market Processor
• Industry is very fragmented with no major commercial players - aggregators travel to Upper
East to source rice for key markets (Kumasi)
• ICOUR offers a large pool of irrigated land (713 Ha)
• Avnash plans to build a third mill in Bolgatanga to export to Burkina Faso
• Developed production, processing and market industry with leading integrated commercial players
along the chain
• Emerging interest of commercial players interested4) in expanding into the region for rice
production, such as VEGPRO, Africa Atlantic, Stallion (joint venture with Asia Golden Rice)
VOLTA
NORTHERN
• More developed rice processing industry, but production and market is very fragmented with
no major commercial players
• Avnash's mill is largest processor in Ghana (to be operational by 2012 end)
• Increasing number of smaller processors are setting up mills in Northern, e.g., Amsig
• Strong interest from Premium Food to enter; other interested players include GADCO
• Avnash plans to build a second mill in Northern
UPPER EAST
THE GHANAIAN RICE INDUSTRY IS DEVELOPING WELL, WITH A NUMBER OF COMMERCIAL PLAYERS ATTRACTED BY THE MARKET OPPORTUNITY AND GROWING CONDITIONS
Source: BMGF Rive Value Chain Analysis Source: BMGF’s Presentation at West African Seminar on Rice Development on 18 Feb. 2012
Impact of Copa Connect on irrigated smallholder income1)2) 2016 [USD, p.a.]
Copa Connect aims to increase irrigated smallholder income by 369% to USD 4,174 per year
Source: GADCO, Interviews
1) Does not taken into account opportunity cost of producing a different crop:; 2) Irrigation allows 2 crop cycles per year; 3) GADCO's price for milled rice: CONFIDENTIAL
185%
-369%
2,532 - 4,174
Target income (2016)
890
821
Increased
production cost
1,883
941
Price improvement3)
3,565
891
Yield improvement
1,602
801
Current income
Harvest 1 Harvest 2
Source: BMGF’s Presentation at West African Seminar on Rice Development on 18 Feb. 2012

www.riceforafrica.org/meetings/sc/sc7 CARD SC7 Meeting Document No. 2-1
17
Impact of Copa Connect on rainfed smallholder income1)2) [USD, p.a.]
Copa Connect aims to increase rainfed smallholder income by +291% to USD 1,126 per year
1) Does not taken into account opportunity cost of producing a different crop; 2) Rainfed farmers only have 1 crop cycle per year; 3) GADCO's price for milled rice: CONFIDENTIAL
Source: GADCO, Interviews
653
606
1,027
288419
606
419
Yield improvement Current income
288
707 - 1,126
Target income (2016)
+291%
1,213
Increased
production cost
Price improvement3)
Harvest 1
Source: BMGF’s Presentation at West African Seminar on Rice Development on 18 Feb. 2012
Nigerian consumers prefer parboiled rice, and imported rice makes up 60% of the market due to higher quality
Source: USAID GLOBAL FOOD SECURITY RESPONSE NIGERIA RICE STUDY, 2009
0.7
(13%)
Local
White
2.0
(40%)
Imported
Parboiled
1.0
(20%)
Imported
White
1.3
(27%)
Local
Parboiled
100% = 5m MT
Nigeria rice consumption by type [m MT] Rice consumption preferences in Nigeria
• There are two discrete market segments for household rice consumers:
• high-quality rice consumers: less price sensitive and prefer cleaner, less broken
rice
• lower-quality rice consumers: more price-sensitive and prefer the taste of local rice
• The most rapidly growing market segment is at the higher-end, which is
being met by imported rice at the moment
• For both domestic and imported rice, there is a strong consumer preference for
parboiled rice
• Parboiling allows the rice to cook faster, prevents the grains from sticking together
and offers higher nutritional content relative to rice that is not parboiled
Source: BMGF’s Presentation at West African Seminar on Rice Development on 18 Feb. 2012
www.riceforafrica.org/meetings/sc/sc7 CARD SC7 Meeting Document No. 2-1
18
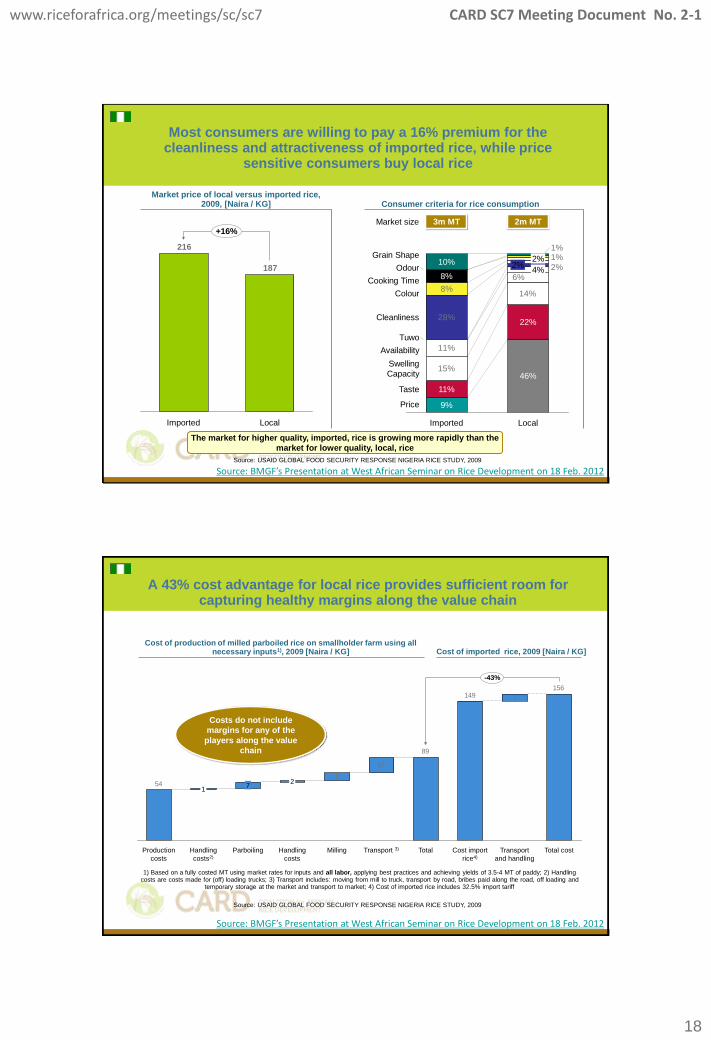
Most consumers are willing to pay a 16% premium for the cleanliness and attractiveness of imported rice, while price
sensitive consumers buy local rice
Market price of local versus imported rice, 2009, [Naira / KG]
187
216
Local Imported
+16%
Source: USAID GLOBAL FOOD SECURITY RESPONSE NIGERIA RICE STUDY, 2009
15%
14%
11%
8%
6%
28%
2%
1%1%
Cooking Time
Odour
Price
Taste
Swelling
Capacity
Availability
Tuwo
Cleanliness
Colour
Grain Shape
Local
46%
22%
4% 2%
2%
Imported
9%
11%
8%
10%
Consumer criteria for rice consumption
3m MT 2m MT Market size
The market for higher quality, imported, rice is growing more rapidly than the
market for lower quality, local, rice
Source: BMGF’s Presentation at West African Seminar on Rice Development on 18 Feb. 2012
A 43% cost advantage for local rice provides sufficient room for capturing healthy margins along the value chain
8
17
7
156149
89
54
Milling Handling
costs
2
Parboiling
7
Handling
costs2)
1
Production
costs
-43%
Total cost Transport
and handling
Cost import
rice4)
Total Transport 3)
Cost of production of milled parboiled rice on smallholder farm using all necessary inputs1), 2009 [Naira / KG]
Cost of imported rice, 2009 [Naira / KG]
1) Based on a fully costed MT using market rates for inputs and all labor, applying best practices and achieving yields of 3.5-4 MT of paddy; 2) Handling costs are costs made for (off) loading trucks; 3) Transport includes: moving from mill to truck, transport by road, bribes paid along the road, off loading and
temporary storage at the market and transport to market; 4) Cost of imported rice includes 32.5% import tariff
Costs do not include
margins for any of the
players along the value
chain
Source: USAID GLOBAL FOOD SECURITY RESPONSE NIGERIA RICE STUDY, 2009
Source: BMGF’s Presentation at West African Seminar on Rice Development on 18 Feb. 2012
www.riceforafrica.org/meetings/sc/sc7 CARD SC7 Meeting Document No. 2-1
19
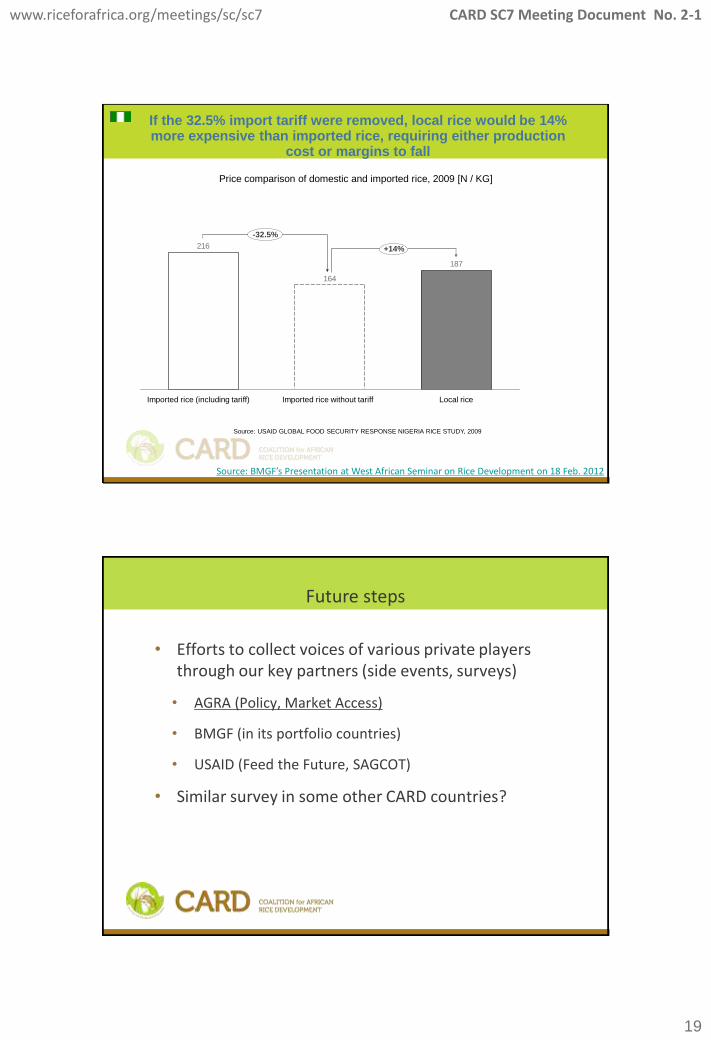
187
164
216
If the 32.5% import tariff were removed, local rice would be 14% more expensive than imported rice, requiring either production
cost or margins to fall
Price comparison of domestic and imported rice, 2009 [N / KG]
Imported rice without tariff Imported rice (including tariff) Local rice
-32.5%
+14%
Source: USAID GLOBAL FOOD SECURITY RESPONSE NIGERIA RICE STUDY, 2009
Source: BMGF’s Presentation at West African Seminar on Rice Development on 18 Feb. 2012
Future steps
• Efforts to collect voices of various private players through our key partners (side events, surveys)
• AGRA (Policy, Market Access)
• BMGF (in its portfolio countries)
• USAID (Feed the Future, SAGCOT)
• Similar survey in some other CARD countries?

www.riceforafrica.org/meetings/sc/sc7 CARD SC7 Meeting Document No. 2-1
20
4. SOUTH-SOUTH COOPERATION
South-south cooperation
Video Seminar
Seed
Quality
WUA
Stock- taking
Study tour
Facilities
Human resources
www.riceforafrica.org/meetings/sc/sc7 CARD SC7 Meeting Document No. 2-1
21
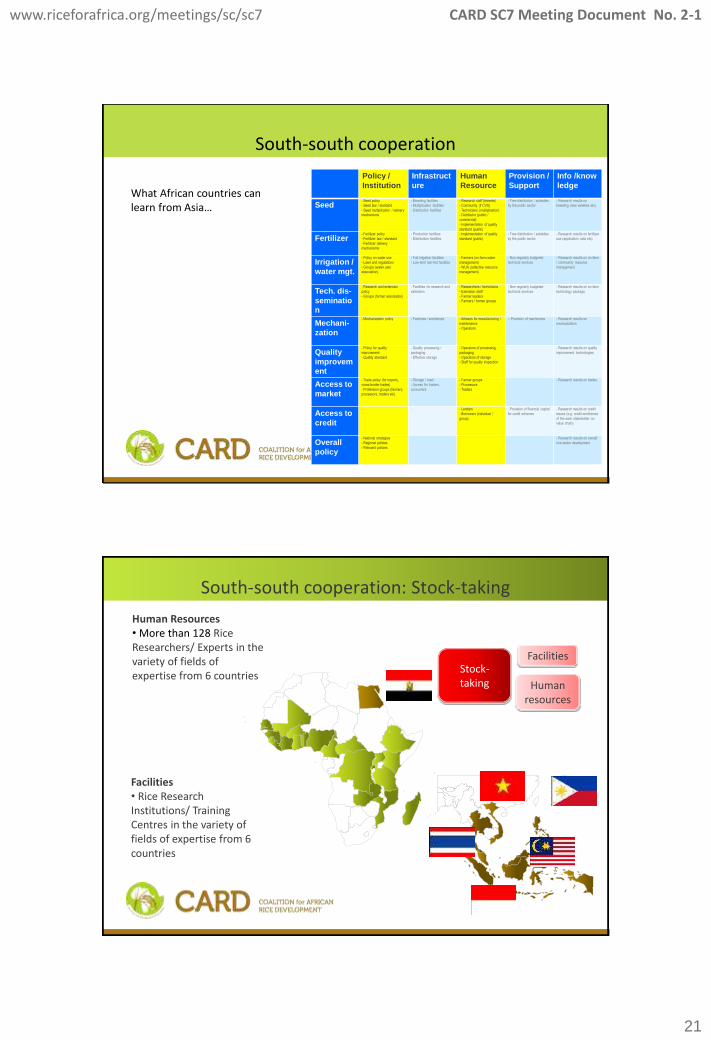
South-south cooperation
Policy /
Institution
Infrastruct
ure
Human
Resource
Provision /
Support
Info /know
ledge
Seed - Seed policy
- Seed law / standard
- Seed multiplication / delivery mechanisms
- Breeding facilities
- Multiplication facilities
- Distribution facilities
- Research staff (breeder)
- Community (if CVS)
- Technicians (multiplication) - Distributor (public /
commercial)
- Implementation of quality
standard (public)
- Free distribution / subsidies
by the public sector
- Research results on
breeding (new varieties etc)
Fertilizer - Fertilizer policy
- Fertilizer law / standard
- Fertilizer delivery mechanisms
- Production facilities
- Distribution facilities
- Implementation of quality
standard (public)
- Free distribution / subsidies
by the public sector
- Research results on fertilizer
use (application ratio etc)
Irrigation /
water mgt.
- Policy on water use
- Laws and regulations
- Groups (water user association)
- Full irrigation facilities
- Low-land rain-fed facilities
- Farmers (on-farm water
management)
- WUA (collective resource management)
- Non-regularly budgeted
technical services
- Research results on on-farm
/ community resource
management
Tech. dis-
seminatio
n
- Research and extension
policy
- Groups (farmer association)
- Facilities for research and
extension
- Researchers / technicians
- Extension staff
- Farmer leaders - Farmers / farmer groups
- Non-regularly budgeted
technical services
- Research results on on-farm
technology package
Mechani-
zation
- Mechanization policy - Factories / workshops - Artisans for manufacturing /
maintenance
- Operators
- -Provision of machneries - Research results on
mechanization
Quality
improvem
ent
- Policy for quality
improvement
- Quality standard
- Quality processing /
packaging
- Effective storage
- Operators of processing,
packaging
- Operators of storage - Staff for quality inspection
- Research results on quality
improvement technologies
Access to
market
- Trade policy (for imports,
cross-border trades)
- Profession groups (farmers, processors, traders etc)
- Storage / road
- Access for traders,
consumers
- Farmer groups
- Processors
- Traders
- Research results on trades
Access to
credit
- - - Lenders
- Borrowers (individual /
group)
- Provision of financial capital
for credit schemes
- Research results on credit
issues (e.g. credit-worthiness
of the each stakeholder on value chain)
Overall
policy
- National strategies
- Regional policies
- Relevant policies
- Research results on overall
rice sector development
What African countries can learn from Asia…
South-south cooperation: Stock-taking
Stock- taking
Facilities
Human resources
Human Resources • More than 128 Rice Researchers/ Experts in the variety of fields of expertise from 6 countries
Facilities • Rice Research Institutions/ Training Centres in the variety of fields of expertise from 6 countries

www.riceforafrica.org/meetings/sc/sc7 CARD SC7 Meeting Document No. 2-1
22
SSC Video Conference Seminar
Video Seminar
Seed
Quality
WUA
Topics •Seed multiplication / distribution (19 Sep) •On-farm / off-farm techniques for grain quality improvement (for small-scale farmers) (19 Oct) •Water User Association (16 Nov)
Target participants •Government organisations (staff involved in seed distribution, irrigation) •Private-sector companies (seed seller, rice miller) •Farmers’ groups
Format •Lectures through video conference
South-south cooperation – Platform & Study tour
Study tour
SSC Platform

www.riceforafrica.org/meetings/sc/sc7 CARD SC7 Meeting Document No. 2-1
23
5. CAADP
At Regional Level
NEPAD-AU as one of three key founders of the Coalition - Jointly with AGRA and JICA at TICAD IV (Japan, May ‘08)
Key African development partners as the Steering Committee members - NEPAD-AU, AGRA, AfricaRice, FARA (Pillar IV)
Gained recognition for the contribution in the implementation - A side event at 8th CAADP Partnership Platform (Kenya, May ‘12): Communique Annex 2
At Country Level
Integration of the result of NRDS implementation to CAADP - Matching priority interventions into CAADP/ Providing project concept notes to CAADP Country Team (Ghana, etc), same focal point (e.g. Guinea, Madagascar)
Integration of NRDS into CAADP Investment Plan - NRDS as ‘Rice Chapter’ (e.g. Ghana – METASIP, Sierra Leone – SCP)
CAADP-CARD F/Ps Dialogue –a 3 yrs Training and Dialogue in Japan proposed by JICA
Alignment to CAADP [1/3]
www.riceforafrica.org/meetings/sc/sc7 CARD SC7 Meeting Document No. 2-1
24
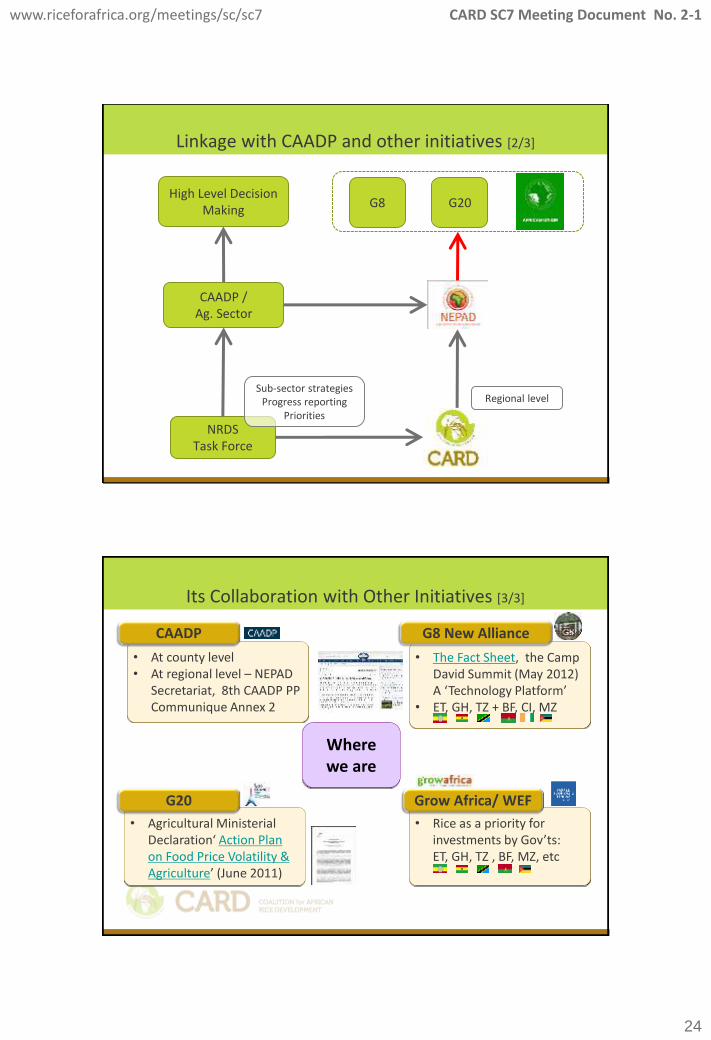
Linkage with CAADP and other initiatives [2/3]
NRDS Task Force
CAADP / Ag. Sector
High Level Decision Making
Sub-sector strategies Progress reporting
Priorities
Regional level
G8 G20
Its Collaboration with Other Initiatives [3/3]
Where we are
• At county level • At regional level – NEPAD
Secretariat, 8th CAADP PP Communique Annex 2
CAADP
• Agricultural Ministerial Declaration‘ Action Plan on Food Price Volatility & Agriculture’ (June 2011)
G20
• The Fact Sheet, the Camp David Summit (May 2012) A ‘Technology Platform’
• ET, GH, TZ + BF, CI, MZ
G8 New Alliance
• Rice as a priority for investments by Gov’ts: ET, GH, TZ , BF, MZ, etc
Grow Africa/ WEF
www.riceforafrica.org/meetings/sc/sc7 CARD SC7 Meeting Document No. 2-1
25
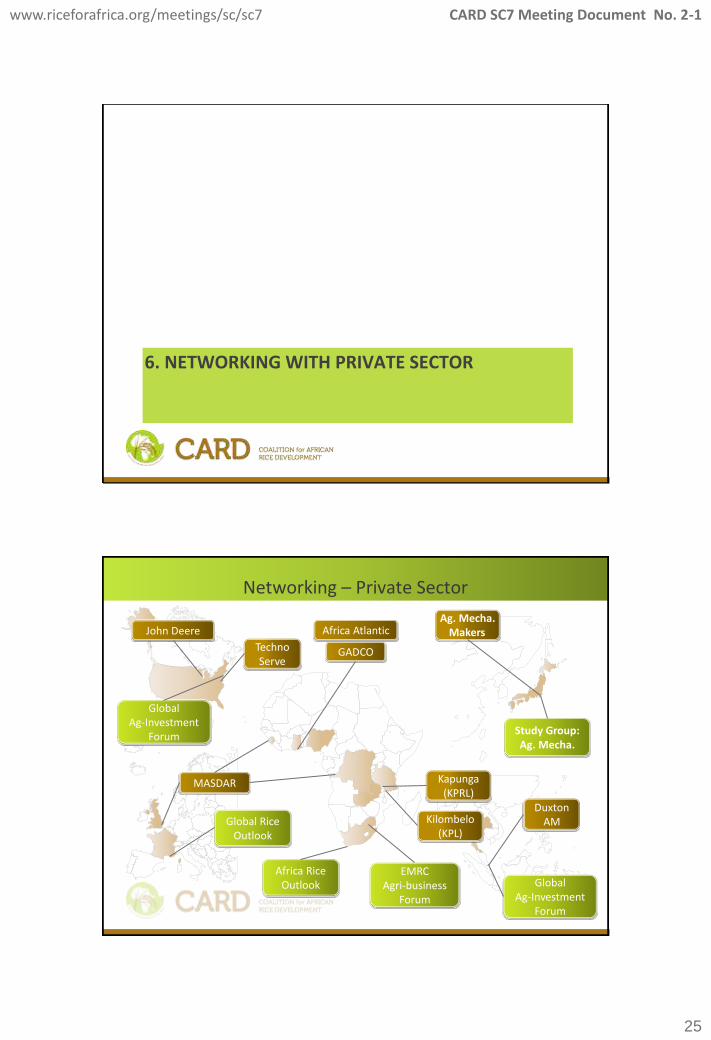
6. NETWORKING WITH PRIVATE SECTOR
Networking – Private Sector
Global Ag-Investment
Forum
Global Ag-Investment
Forum
Global Rice Outlook
Africa Rice Outlook
EMRC Agri-business
Forum
Study Group: Ag. Mecha.
MASDAR
John Deere
GADCO
Africa Atlantic
Kapunga (KPRL)
Kilombelo (KPL)
Techno Serve
Duxton AM
Ag. Mecha. Makers

www.riceforafrica.org/meetings/sc/sc7 CARD SC7 Meeting Document No. 2-1
26
Networking – Private Sector
MASDAR
John Deere
GADCO
Africa Atlantic
Kapunga (KPRL)
Kilombelo (KPL)
Techno Serve
Duxton AM
Ag. Mecha. Makers
VOICES Potential
Opportunities Business mode
Problems Roles of Gov’t
etc…
Local Private Sector
Small Scale
Farmer
Some more…
Growing large commercial investments – examples: About 1.5M ha in 13 SSA countries with 29 land deals, investors mainly from
outside continent, 48% of 45 global rice land deals, 3% of 924 global land deals [Land Matrix DB]
Ghana – 5,000ha in 5 years in Sogakope, invested by Global Agri-Development Company (GADCO), sold to local market under its own Copa brand, with $10M by Seattle-based hedge fund Summit Capital and with $1.5M by NY-based Acumen Fund
Ghana – Grow Africa: The Ghana Commercial Agriculture Project (GCAP), a joint project of the Government of Ghana, World Bank and USAID
Other crops other areas (ha)
Other crops Africa (ha)
Rice Africa (ha)
Rice other areas (ha)
www.riceforafrica.org/meetings/sc/sc7 CARD SC7 Meeting Document No. 2-1
27
(continued) Nigeria – PPP under Agricultural Transformation Agenda (ATA) such as; Badeggi Mill in Niger State privatized and managed by Deanshager Projects
Ltd, expanding from 30,000 MT/year to 100,000MT/year, contracting out with 3,000 farmers;
$12m Ofada/ Veetee Mill in Ogun State expanding from 30,000MT/year to potential 200,000 MT/annum;
Omor Mills (15,000MT/year) in Anambra owned by FG managed by Olam
DRC – EUR400m investment by Heineken to Bralima breweries producing primus beer, contracting out rice farmers, purchasing 30,000MT, 16% of national production, with the support by EUCORD, financed by Dutch Government , as well as with the assistance by USAID and the World Bank
Some more…
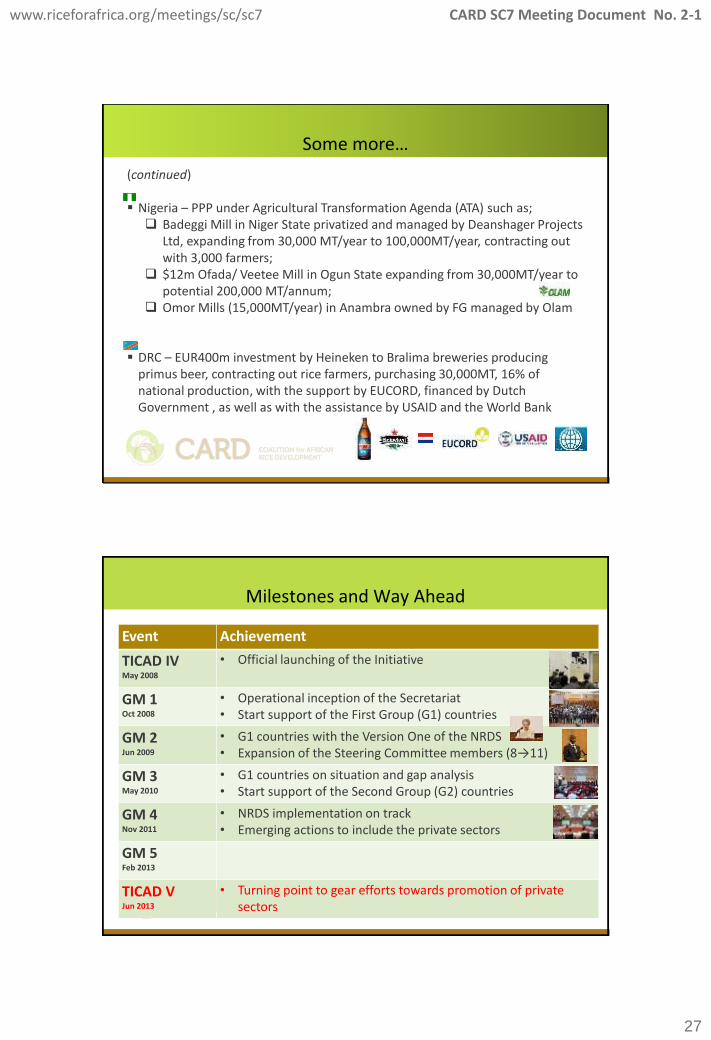
Milestones and Way Ahead
Event Achievement
TICAD IV May 2008
• Official launching of the Initiative
GM 1 Oct 2008
• Operational inception of the Secretariat • Start support of the First Group (G1) countries
GM 2 Jun 2009
• G1 countries with the Version One of the NRDS • Expansion of the Steering Committee members (8→11)
GM 3 May 2010
• G1 countries on situation and gap analysis • Start support of the Second Group (G2) countries
GM 4 Nov 2011
• NRDS implementation on track • Emerging actions to include the private sectors
GM 5 Feb 2013
TICAD V Jun 2013
• Turning point to gear efforts towards promotion of private sectors
www.riceforafrica.org/meetings/sc/sc7 CARD SC7 Meeting Document No. 2-1
28
THANK YOU
Webpage
• A tool to share information and particularly assist project planners to generate effective rice-related interventions that create synergies with other key stakeholders
www.riceforafrica.org