coast range subbasin fish management plan · coast range subbasin fish management plan prepared by...
TRANSCRIPT


COAST RANGE SUBBASIN FISH MANAGEMENT PLAN Prepared by Mary Jo Wevers Doug Nemeth John Haxton Steve Mamoyac Oregon Department of Fish and Wildlife March 1992

TABLE OF CONTENTS Page
INTRODUCTION ................................................................................................................. 1
GENERAL CONSTRAINTS................................................................................................. 3
HABITAT.............................................................................................................................. 6 Background and Status ............................................................................................ 6
Basin Description........................................................................................... 6 Land Use ..................................................................................................... 12 Habitat Management ................................................................................... 19
Policies.................................................................................................................... 20 Objectives ............................................................................................................... 20
WINTER STEELHEAD...................................................................................................... 24 Background and Status .......................................................................................... 24
Origin ........................................................................................................... 24 Life History and Population Characteristics................................................. 24 Hatchery Production .................................................................................... 27 Angling and Harvest .................................................................................... 28
Management Considerations.................................................................................. 29 Policies.................................................................................................................... 30 Objectives ............................................................................................................... 30
COHO SALMON................................................................................................................ 32 Background and Status .......................................................................................... 32
Origin ........................................................................................................... 32 Life History and Population Characteristics................................................. 32 Hatchery Production .................................................................................... 33 Angling and Harvest .................................................................................... 35
Management Considerations.................................................................................. 35 Policies.................................................................................................................... 35 Objectives ............................................................................................................... 36
FALL CHINOOK SALMON................................................................................................ 37 Background and Status .......................................................................................... 37
Origin ........................................................................................................... 37 Life History and Population Characteristics................................................. 37 Hatchery Production .................................................................................... 37
Policies.................................................................................................................... 37
TROUT AND WHITEFISH................................................................................................. 38 Background and Status .......................................................................................... 38
RAINBOW TROUT...................................................................................... 38 CUTTHROAT TROUT................................................................................. 40 Management Considerations ...................................................................... 48 WHITEFISH................................................................................................. 49
TABLE OF CONTENTS-continued Page
WARMWATER GAME FISH ............................................................................................. 54 Background and Status .......................................................................................... 54
Origin ........................................................................................................... 54 Life History and Population Characteristics................................................. 54 Hatchery Production .................................................................................... 57 Angling and Harvest .................................................................................... 58
Management Considerations.................................................................................. 58 Policies......................................................................................................... 59 Objectives .................................................................................................... 59
OREGON CHUB................................................................................................................ 62 Background and Status .......................................................................................... 62
Origin ........................................................................................................... 62 Life History and Population Characteristics................................................. 62 Hatchery Production .................................................................................... 62
Management Considerations.................................................................................. 62 Objectives ............................................................................................................... 63
SAND ROLLERS ............................................................................................................... 66 Background and Status .......................................................................................... 66
Origin ........................................................................................................... 66 Life History and Population Characteristics................................................. 66 Hatchery Production .................................................................................... 67 Angling and Harvest .................................................................................... 67
Management Considerations.................................................................................. 67 Objectives ............................................................................................................... 68
CRAYFISH......................................................................................................................... 70 Background and Status .......................................................................................... 70
Origin ........................................................................................................... 70 Life History and Population Characteristics................................................. 70 Hatchery Production .................................................................................... 70 Harvest......................................................................................................... 70
Management Considerations.................................................................................. 71 Objectives ............................................................................................................... 71
ANGLING ACCESS........................................................................................................... 73 Background and Status .......................................................................................... 73 Policies.................................................................................................................... 73 Objectives ............................................................................................................... 74
PLAN ADOPTION AND REVIEW ..................................................................................... 76
PRIORITY OF ACTIONS................................................................................................... 77
REFERENCES .................................................................................................................. 79
APPENDICES.................................................................................................................... 82
1
INTRODUCTION A high priority of the Willamette Basin Fish Management Plan (ODFW 1988) was the preparation of plans for subbasins within the Willamette Basin. The Coast Range Subbasin Plan was developed to provide specific direction for management of the fish resources of the Coast Range subbasin. The scope of the plan includes the Yamhill, Rickreall, Luckiamute, and Marys rivers and their tributaries. Separate mini-plans will be written for reservoirs and lakes in the subbasin. ODFW is committed to the planning process as an integral part of all current and future management by the agency. The Coast Range Plan is one element of the Department's planning efforts. Species plan for coho, steelhead, trout and warmwater game fish have been adopted, and a management plan for chinook salmon is being prepared. These statewide plans guide the development of more localized plans for individual river basins and subbasins. These plans serve several needed functions. They present a logical, systematic approach to conserving our aquatic resources. They establish management priorities and direct attention to the most critical problems affecting our fisheries so that the Department's funds and personnel can be used accordingly. They inform the public and other agencies about the Department's management programs and provide them with the opportunity to help formulate those programs. The Coast Range Subbasin Plan was developed by the Oregon Department of Fish and Wildlife with the assistance of a public advisory committee and a technical advisory committee. The public advisory committee represented user groups and interested members of the community at large. The function of this committee was to help identify objectives and actions and to serve as a sounding board for public interests. The public advisory committee members were: Member Affiliation Gordon Asbury Northwest Steelheaders, Yamhill R. Wayne Aylward Yamhill Sportsman's Association Richard Bunse Santiam Flycasters/Oregon Trout Bob Carter Yamhill Sportsman's Association Bill Dixon Unaffiliated Randy Gunn Unaffiliated Denver Hospodarsky Mid-Willamette Fly Fishers Walt Miller Polk County Sportsmen Vern Olsen Yamhill Sportsman's Association Bill Stack Unaffiliated Frank Stallings Northwest Steelheaders, Chehalem Harry Stuart Yamhill Sportsman's Association Bob Tish Northwest Steelheaders, Yamhill R. Bob Torley Izaak Walton League, Corvallis Steve Wilson Northwest Steelheaders, Corvallis

2
The technical advisory committee was composed of representatives of federal and state fishery and land management agencies. This committee contributed information used in the plan and reviewed drafts of the plan. Members of this committee were: Member Affiliation Bob House Bureau of Land Management Mike Simek Department of Forestry Conrad Tull Department of Forestry Brent Merrill Confederated Tribes of the Grande Ronde The habitat, steelhead, and salmon sections of the plan were originally prepared as part of the Integrated System Plan for Salmon and Steelhead Production in the Columbia River Basin (ODFW 1990, Columbia Basin Fish and Wildlife Authority 1990). Those sections have since been modified to fit ODFW's format for subbasin plans and to comply with the ODFW's Natural Production and Wild Fish Management policies (OAR 635-07-521 through 635-07-529). The plan is divided into sections that deal with habitat, the major fish species or groups of species, and angling access. Each of these sections contains: 1. Background and Status--historical and current information on the topic of that section that
helps explain the context of the policies, objectives, and actions that follow. 2. Policies--constraints or principles developed specifically for management activities in the
subbasin related to that species or topic. 3. Objectives--what is intended to be accomplished. 4. Actions--solutions or methods for accomplishing the objectives.
3
GENERAL CONSTRAINTS Besides the statewide species plans and the Willamette Plan, the Coast Range Plan must also conform to other established constraints such as federal acts (e.g., Wild and Scenic Rivers, Wilderness, Endangered Species), state statutes, administrative rules, memoranda of understanding and other policies. Legal Considerations The Department of Environmental Quality (DEQ) has developed state water quality standards that are in compliance with federal water quality standards. State water quality standards are specifically directed at fish bearing waters. DEQ administrative rules (Chapter 340, Division 41) address water quality standards basin by basin. Senate Bill 140 (ORS 537.332 through 537.360) directed the Water Resources Commission to convert minimum stream flows into in-stream water rights following review. In 1989 the Oregon Fish and Wildlife Commission adopted administrative rules (OAR 635-400-000 through 635-400-040) regarding in-stream water rights. Minimum streamflows were adopted for 20 locations in the Coast Range subbasin. Although legislation does not guarantee the availability of these flows, it does give minimum flows priority over water rights obtained subsequently. House Bill 2990 of 1985 (codified in part as ORS 543.015 and ORS 543.017) provides strict standards to protect anadromous fish, resident game fish and recreation from adverse effects of hydroelectric development. Its general impact has been to halt hydro development on anadromous fish streams. The Oregon Revised Statutes (ORS) require fish ladders and fish screens at dams and water diversions to provide upstream and downstream fish passage. The Oregon Forest Practices Act (Forest Practices Act) (ORS 527.610 to 527.730) was adopted in 1972. Commercial timber operations on state and private land are regulated by the act, which is administered by the Oregon Department of Forestry. Forest management activities on U.S. Forest Service and Bureau of Land Management lands are designed to comply with Forest Practices Act rules and state water quality standards. The Forest Practices Act does not apply within the urban growth boundary of towns and cities. The Oregon Removal-Fill Law requires a permit for the removal or filling of 50 cubic yards or more of material in natural waterways. The Division of State Lands oversees the program, reviews applications and issues permits, and enforces the law. The Oregon Riparian Tax Incentive Program of 1981 provides a tax exemption to land owners for riparian lands included in a management plan developed by the land owner and ODFW personnel. The Oregon Land Conservation and Development Commission has developed statewide planning goals. Goals that affect fishery resources include Goal 5, which addresses fish and wildlife areas and

4
habitats, and Goal 6, which addresses water quality. Oregon Senate Bill 523 of 1985 initiated a coordinated effort among state resource agencies for planning and management of the state's water resources. ODFW goals and policies for commercial and sport fishing regulations, fish management, and salmon hatchery operation, including the Natural Production and Wild Fish Management policies, are adopted as Oregon Administrative Rules (OAR). County land use plans contain goals and policies for riparian protection, erosion prevention, and fish and wildlife habitat protection. Procedures Developed by ODFW A Department Guide for Introductions and Transfers of Finfish into Oregon Waters (1982) and Fish Disease Control Guidelines (1979) provide direction for management of fish. Agreements with Other Agencies Each of the land and water management agencies in the Coast Range subbasin has regulatory authority over some aspect of land or water use, or has overall responsibility for specific land or water areas. Each agency has its own policies, procedures, and management directives associated with its area of responsibility. No single agency has total jurisdiction over an entire river basin. For this reason, coordinated involvement and cooperation among fishery, land, and water managers is necessary to achieve comprehensive management of a watershed to the benefit of the entire system and its resources. Memoranda of understanding among ODFW and the Bureau of Land Management (BLM), the U.S. Forest Service (USFS), and the U.S. Army Corps of Engineers (USACE) describe cooperative activities for protecting and improving fish habitat on federal lands. The BLM has entered into a memorandum of understanding with ODFW that says in part that the BLM agrees "to protect water quality and riparian areas by using appropriate bureau operational guidelines: e.g., buffer strips, proper road and culvert construction, bank stabilization methods, and other practices to minimize erosion from land management activities" (Memorandum of Understanding, Oregon Department of Fish and Wildlife - U.S. Bureau of Land Management 1981). Contractual agreements exist with the National Marine Fisheries Service and the U.S. Fish and Wildlife Service concerning Columbia River and ocean salmon fisheries, marine fish investigations, and hatchery production. ODFW comments on USFS and BLM project proposals as well as the general land management plans. The plan review process provides a forum for the state to address habitat improvement or protection for fishery resources. The BLM has initiated its planning process for western Oregon. Projected date of completion is late 1990. BLM fish habitat improvement projects require close coordination with the Department of Fish and Wildlife's Salmon and Trout Enhancement Program (STEP).

5
ODFW and the state Water Resources Department (WRD) have a memorandum of understanding to coordinate review and action on water rights applications that conflict with protection of fish and wildlife habitats (Memorandum of Understanding, Oregon Department of Fish and Wildlife - Oregon Water Resources Department 1990). WRD is currently updating its management programs for the Willamette Basin. Programs affect future water rights, set priorities for water use, and prescribe actions to solve water problems. ODFW, along with other state natural resource agencies, has identified issues that ODFW will cover and contribute to the Water Resources Department's planning process. Final adoption of new programs is expected in 1991. The Governor's Watershed Enhancement Board provides an opportunity for private individuals as well as organizations to become involved in watershed rehabilitation projects. An Oregon Fish and Wildlife Commission member is a member of this board. General Policies The following general policies apply to all subbasin plans in the Willamette basin, including the Coast Range subbasin. Policy 1. To the extent authorized by law, the Department shall seek compensation for losses
of production due to development and other man-made causes. Policy 2. Hatchery production shall be evaluated to determine if benefits exceed costs. Policy 3. The number of hatchery fish stocked in the Willamette basin, regardless of species
and size, shall not be increased and stream systems not currently receiving hatchery fish shall not be stocked, with the following exceptions:
(a) Experimental programs where the number of fish released is relatively small and a
planned and funded evaluation program exists; (b) Rehabilitation programs for native species; (c) As provided for in subbasin plans adopted by the Commission in public hearing;
and (d) Special situations approved by the Commission in public hearing. Policy 4. Stocking levels and areas shall be addressed in subbasin plans.

6
HABITAT
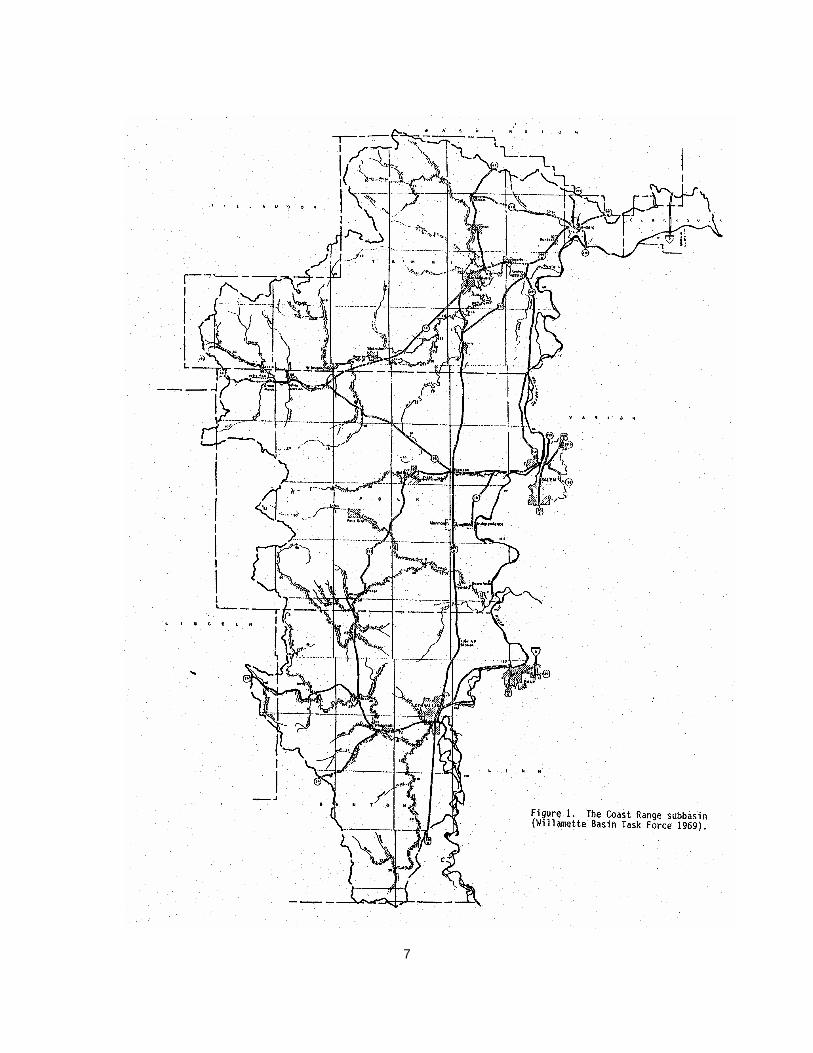
Background and Status Basin Description The Coast Range subbasin drains approximately 1,800 square miles (Table 1) of the midwestern side of the Willamette basin (Water Resources Board 1967). The major streams of the subbasin, moving north to south, are the Yamhill River, Rickreall Creek, Luckiamute River and Marys River (Figure 1). These streams originate in the steep and deeply dissected slopes of the upper elevations of the Coast Range (average elevation 2,000 feet) and flow eastward, emptying into the Willamette River. The subbasin also includes lesser Willamette tributaries from Dixon Creek in Corvallis north to Newland Creek near Wilsonville.
Table 1. Major rivers in the Coast Range subbasin, location of river mouth on the Willamette River, watershed area, and EPA reach number (D, unpublished data). Location Watershed (Willamette area EPA reach Watershed river mile) (sq. miles) number Yamhill 55 919 1709.0008.001.00.00 Rickreall 88 178 1709.0007.010.00.00 Luckiamute 108 368 1709.0003.001.00.00 Marys 132 329 1709.0003.014.00.00
Coast Range subbasin streams have little gradient for much of their length (Table 2). The upper Rickreall, Little Luckiamute, and North Yamhill have the greatest gradient and the Yamhill and lower South Yamhill have the least. Steeper reaches are characterized by gravel or bedrock bottoms, boulders, and fast water with riffles. Most of the salmonid production in the Coast Range subbasin occurs in these steeper gradient reaches. Flatter gradient reaches are characterized by mud or silt bottoms, few boulders, and numerous, long, slow-moving pools with few riffle areas. Salmonid production is relatively low in this type of habitat due to poor egg and fry survival and low insect production (Reiser and Bjornn 1979).
7

8
Table 2. Percent gradienta by reach for streams of the Coast Range subbasin. River Mile Stream From To Percent Gradient Yamhill R. 0 11 0.03 No. Yamhill R. 0 20 0.11 " " " 20 32 3.47 So. Yamhill R. 0 30 0.03 " " " 30 60 0.22 Rickreall Cr. 0 24 0.43 " " 25 32 5.74 Luckiamute R. 0 40 0.08 " " 40 58 2.12 L. Luckiamute R. 0 13 0.29 " " " 13 25 3.67 Marys R. 0 20 0.15 " " 20 40 0.26 a Estimated from USGS maps.
The subbasin has a modified marine climate, which is largely due to the buffering effects of the Coast and Cascade mountain ranges. Average maximum temperatures on the valley floor near Corvallis during the summer are in the upper 70s Fahrenheit and average minimum temperatures during the winter are in the mid-30s (Office of the State Climatologist, unpublished data). Temperatures are typically lower as one moves westward into the Coast Range. Most of the precipitation falls in the winter and early spring. Only 5 percent of the annual precipitation falls during the months of June through August, 75 percent during November through March (Polk County Department of Development 1978). Annual precipitation on the valley floor averages about 45 inches, while portions of the Coast Range receive more than 100 inches (Water Resources Department, 1961). Precipitation is the primary factor controlling streamflow in the Coast Range subbasin. Some streams can experience almost a one-hundred-fold increase in flow between annual low and high flows (USGS, unpublished data). Low flows are probably the factor most limiting fish production in the Coast Range subbasin. Water quality problems are associated with non-point source runoff and treated sewage discharged during low flow periods when insufficient water is available for adequate dilution of pollutants (Department of Environmental Quality 1987). Water quality during high flow periods decreases due to increased sediment loads. To a large extent, the Coast Range subbasin is underlain with sedimentary rock (Burroughs et al. 1973). Sedimentary rock does not demonstrate the porosity and permeability of volcanic rock, or its resultant water storage characteristics (Water Resources Department 1967). Consequently, Coast Range subbasin streams experience lower flows and higher water temperatures during the summer months than

9
many streams in the Cascade Range that are underlain predominantly with volcanic rock. Additionally, as a result of the climate and low elevation, streamflows are not supplemented with snowmelt as occurs with many streams originating in the Cascade Range. Consequently, streamflows closely follow seasonal rainfall patterns. Flow rates increase rapidly between the months of October and November with the onset of the rainy season, and remain high through March, after which they decline rapidly, reaching their lowest point in August (Figure 2, Table 3). Low flows are the factor most limiting salmonid production in the Coast Range subbasin. The decreased volume, depth, and velocity of the water during low-flow periods increases the rate of solar heating, especially in areas with poor riparian vegetation and cover. The resulting high temperatures favor the production of warmwater game fish and nongame species while posing stressful or lethal conditions for salmonids. As flows diminish, so do the areas available for juvenile rearing. As these areas become smaller, fish are forced to rear in less suitable habitats decreasing their chances for survival. Aquatic insect production, which is dependent on riffle area and water velocity, decreases during low flow periods, affecting food availability.

10

11
Table 3. Mean monthly discharge for streams of the Coast Range subbasin (USGS, unpublished data). _____________________________________________________________________________________________________________________________________________________ River Years sampled Stream mile range number J F M A M J J A S O N D _____________________________________________________________________________________________________________________________________________________ North Yamhill R. 21 '49-'73 25 636 556 441 227 111 48 20 12 13 48 259 545 South Yamhill R. 17 '40-'88 49 4,475 4,011 2,909 1,647 726 308 107 50 84 364 2,106 4,229 Rickreall Cr. 19 '58-'78 21 392 289 241 128 64 23 7 4 8 27 198 361 Luckiamute R. 13 '06-'88 56 2,280 2,061 1,448 851 423 199 79 43 56 189 1,104 2,129 Little Luckiamute R. 13 '66-'71 6 422 290 248 149 74 44 21 15 19 54 164 330 Marys R. 9 '41-'85 45 1,215 1,075 798 466 222 95 36 18 20 72 483 1,072 _____________________________________________________________________________________________________________________________________________________

12
To an extent, erosion and sedimentation are natural occurrences, particularly during high flow periods. Heavy stream sediment loads in the Coast Range subbasin affect salmonid production in several ways. High turbidities associated with excessive sediment suspension can stop or delay adult migration. Fine sediments cement spawning gravel together making redd construction difficult. During the months of November through March, high flows can cause bedload movement, which can affect production by destroying fish redds. Conversely, high flows benefit fish production by flushing fine sediments from the gravel. Egg and fry survival is decreased when silt prevents adequate water circulation. Holding and rearing areas decrease when pools become silted in. Production of aquatic insects, the major food of salmonids, is decreased. Prolonged exposure to suspended sediments can be directly injurious to fish by damaging gill surfaces (Bottom et al. 1985). Higher elevation areas in the Coast Range subbasin are forested with Douglas fir, grand fir, western red cedar, western hemlock, and red alder. As subbasin streams descend into the foothills, small meadows occur intermittently with forested areas, comprised of the above mentioned species in addition to bigleaf maple, Oregon white oak and vine maple. The valley floor (average elevation 200 feet) is flat with occasional small hills and is dominated by grasslands. Riparian vegetation in higher elevation timber producing areas consists primarily of red alder, other hardwoods, and shrubs of the Coast Range subbasin. Typically, riparian areas in agricultural areas are in poorer condition than those in forested areas. This is generally a result of efforts to maximize the amount of land available for crop production. Riparian vegetation in agricultural lands often consists mainly of grasses and shrubs. A healthy riparian zone is essential for optimum fish production. Riparian vegetation stabilizes streambanks, maintains water quality, is a source of terrestrial insects, and provides in-stream structure. Land Use Most of the land in the subbasin is privately owned (Table 4), and is often managed primarily for economic return. Control over land use practices that influence fish production is usually more limited on private land than on public land.
Table 4. Land ownership (acres) by watershed (WRD, unpublished data). Watershed BLM USFS USFWS State Private Yamhill R. 8,833 6,562 247 1,868 476,870 Rickreall Cr. 3,115 1,036 2,280 19 53,765 Luckiamute R. 8,646 384 13,566 176,169 Marys R. 6,417 8,794 3,314 9,738 163,080 Total 27,011 16,776 5,841 25,191 869,884 Percent 2.8 1.8 0.6 2.7 92.1
13
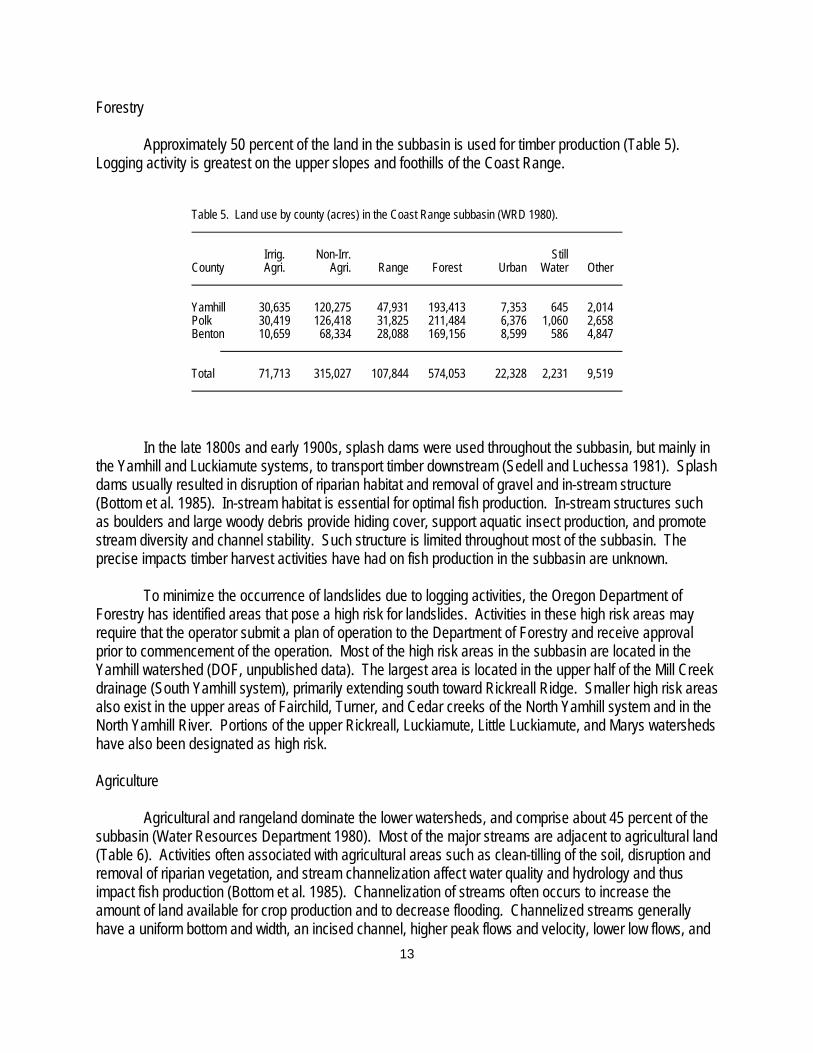
Forestry Approximately 50 percent of the land in the subbasin is used for timber production (Table 5). Logging activity is greatest on the upper slopes and foothills of the Coast Range.
Table 5. Land use by county (acres) in the Coast Range subbasin (WRD 1980). Irrig. Non-Irr. Still County Agri. Agri. Range Forest Urban Water Other Yamhill 30,635 120,275 47,931 193,413 7,353 645 2,014 Polk 30,419 126,418 31,825 211,484 6,376 1,060 2,658 Benton 10,659 68,334 28,088 169,156 8,599 586 4,847 Total 71,713 315,027 107,844 574,053 22,328 2,231 9,519
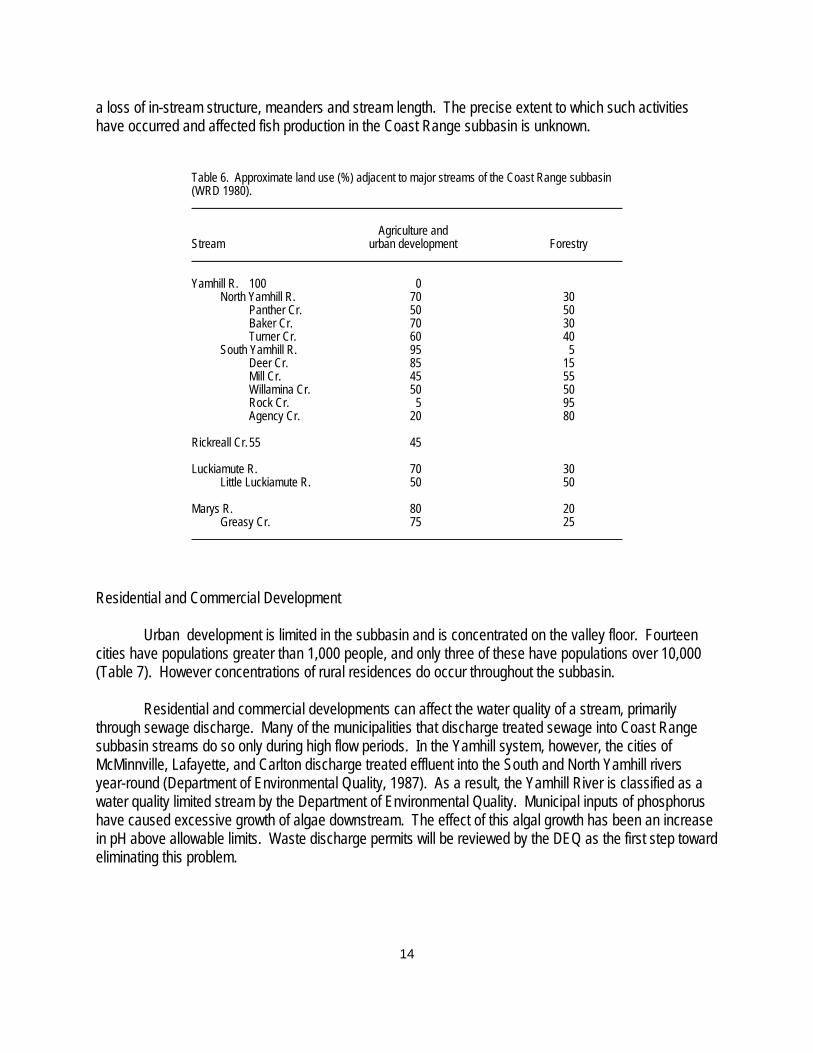
In the late 1800s and early 1900s, splash dams were used throughout the subbasin, but mainly in the Yamhill and Luckiamute systems, to transport timber downstream (Sedell and Luchessa 1981). Splash dams usually resulted in disruption of riparian habitat and removal of gravel and in-stream structure (Bottom et al. 1985). In-stream habitat is essential for optimal fish production. In-stream structures such as boulders and large woody debris provide hiding cover, support aquatic insect production, and promote stream diversity and channel stability. Such structure is limited throughout most of the subbasin. The precise impacts timber harvest activities have had on fish production in the subbasin are unknown. To minimize the occurrence of landslides due to logging activities, the Oregon Department of Forestry has identified areas that pose a high risk for landslides. Activities in these high risk areas may require that the operator submit a plan of operation to the Department of Forestry and receive approval prior to commencement of the operation. Most of the high risk areas in the subbasin are located in the Yamhill watershed (DOF, unpublished data). The largest area is located in the upper half of the Mill Creek drainage (South Yamhill system), primarily extending south toward Rickreall Ridge. Smaller high risk areas also exist in the upper areas of Fairchild, Turner, and Cedar creeks of the North Yamhill system and in the North Yamhill River. Portions of the upper Rickreall, Luckiamute, Little Luckiamute, and Marys watersheds have also been designated as high risk. Agriculture Agricultural and rangeland dominate the lower watersheds, and comprise about 45 percent of the subbasin (Water Resources Department 1980). Most of the major streams are adjacent to agricultural land (Table 6). Activities often associated with agricultural areas such as clean-tilling of the soil, disruption and removal of riparian vegetation, and stream channelization affect water quality and hydrology and thus impact fish production (Bottom et al. 1985). Channelization of streams often occurs to increase the amount of land available for crop production and to decrease flooding. Channelized streams generally have a uniform bottom and width, an incised channel, higher peak flows and velocity, lower low flows, and
14
a loss of in-stream structure, meanders and stream length. The precise extent to which such activities have occurred and affected fish production in the Coast Range subbasin is unknown.
Table 6. Approximate land use (%) adjacent to major streams of the Coast Range subbasin (WRD 1980). Agriculture and Stream urban development Forestry Yamhill R. 100 0 North Yamhill R. 70 30 Panther Cr. 50 50 Baker Cr. 70 30 Turner Cr. 60 40 South Yamhill R. 95 5 Deer Cr. 85 15 Mill Cr. 45 55 Willamina Cr. 50 50 Rock Cr. 5 95 Agency Cr. 20 80 Rickreall Cr. 55 45 Luckiamute R. 70 30 Little Luckiamute R. 50 50 Marys R. 80 20 Greasy Cr. 75 25
Residential and Commercial Development Urban development is limited in the subbasin and is concentrated on the valley floor. Fourteen cities have populations greater than 1,000 people, and only three of these have populations over 10,000 (Table 7). However concentrations of rural residences do occur throughout the subbasin. Residential and commercial developments can affect the water quality of a stream, primarily through sewage discharge. Many of the municipalities that discharge treated sewage into Coast Range subbasin streams do so only during high flow periods. In the Yamhill system, however, the cities of McMinnville, Lafayette, and Carlton discharge treated effluent into the South and North Yamhill rivers year-round (Department of Environmental Quality, 1987). As a result, the Yamhill River is classified as a water quality limited stream by the Department of Environmental Quality. Municipal inputs of phosphorus have caused excessive growth of algae downstream. The effect of this algal growth has been an increase in pH above allowable limits. Waste discharge permits will be reviewed by the DEQ as the first step toward eliminating this problem.

15
Table 7. Incorporated towns and cities in the Coast Range subbasin. _________________________________________________________________________ Town County Populationa Locationb _________________________________________________________________________ Adair Village Benton 554 Amity Yamhill 1,175 RM 8 Salt Cr. Carlton Yamhill 1,289 RM 10 No. Yamhill R. Corvallis Benton 44,757 RM 0 Marys R. Dallas Polk 9,422 RM 14 Rickreall Cr. Dayton Yamhill 1,526 RM 5 Yamhill R. Dundee Yamhill 1,663 Falls City Polk 818 RM 13 L. Luckiamute R. Independence Polk 4,425 Lafayette Yamhill 1,292 RM 8 Yamhill R. McMinnville Yamhill 17,894 RM 6 So. Yamhill R. Monmouth Polk 6,288 Newberg Yamhill 13,086 Philomath Benton 2,983 RM 10 Marys R. Sheridan Yamhill 3,979 RM 37 So. Yamhill R. Willamina Yamhill 1,717 RM 43 So. Yamhill R. Yamhill Yamhill 867 RM 15 No. Yamhill R. _________________________________________________________________________ a April 1, 1990 census, Center for Population Research and Census, School of Urban and
Public Affairs, Portland State University, Oregon. bRM = river mile
Dams and Hydropower Projects No major natural or artificial water storage capability exists in the Coast Range subbasin. In the North Yamhill system, dams are located on Panther Creek (RM 9.6), Baker Creek (RM 10), and Haskins Creek (RM 3.7). The dam on Panther Creek is a diversion used to supply water to the city of Carlton. A private hydropower facility supplying power to a single residence is located on Kane Creek, a tributary of Panther Creek containing no anadromous fish. Mercer Reservoir, located at RM 25 of Rickreall Creek, is a barrier to anadromous fish. No dams exist in the Luckiamute system. A flashboard dam near RM 21 on the Marys River, originally developed for small hydropower generation, has never operated as such and is not a barrier. Also in the Marys watershed, dams occur at the mouth of the North Fork of Rock Creek and at RM 0.5 of the South Fork. The dam on the South Fork is laddered, and serves as a diversion structure. Both of these dams are used to supply water for the city of Corvallis. Oregon law requires any person who constructs, operates, or maintains any dam or artificial obstruction on a waterway to provide and adequate fish ladder for upstream and downstream fish passage (ORS 509.605; 498.268). The Habitat Conservation Division will be developing standards, criteria, and procedures for evaluating and resolving fish laddering needs at in-stream obstructions. Fish laddering needs in the Coast Range subbasin will then be identified and resolved as part of a coordinated Department effort.

16
Stream reaches in the Coast Range subbasin protected from further hydroelectric development by the Northwest Power Planning Council are identified in Table 8.
Table 8. Stream reaches in the Coast Range subbasin protected from anadromous fish under the Northwest Power Planning Council's hydroelectric planning authority. __________________________________________________________________________ Stream Reach (RM) __________________________________________________________________________ Yamhill R. 0 - 11 North Yamhill R. 0 - 32 Panther Cr. 0 - 12 Baker Cr. 0 - 11 Turner Cr. 0 - 2.5 South Yamhill R. 0 - 61 Mill Cr. 0 - 18.5 Willamina Cr. 0 - 20 East Fk. Willamina Cr. 0 - 5 Rowell Cr. 0 - 8 Rock Cr. 0 - 10 Rogue R. 0 - 6.5 Agency Cr. 0 - 12.5 Yoncalla Cr. 0 - 4 West Fk. Agency Cr. 0 - 3.5 Pierce Cr. 0 - 3 Rickreall Cr. 0 - 28 Luckiamute R. 0 - 58 Soap Cr. 0 - 15 Little Luckiamute R. 0 - 25 Teal Cr. 0 - 6 Waymire Cr. 0 - 3.5 Pedee Cr. 0 - 12 Ritner Cr. 0 - 2 Maxfield Cr. 0 - 7 Marys R. 0 - 40 (Muddy Cr.) Beaver Cr. 0 - 10 Oak Cr. 0 - 8 Woods Cr. 0 - 6.5 (Greasy Cr.) Rock Cr. 0 - 4 Blakesley Cr. 0 - 5 Tumtum Cr. 0 - 7.5 Mulkey Cr. 0 - 5 Shotpouch Cr. 0 - 5 West Fk. Marys R. 0 - 6 Oleman Cr. 0 - 3 ___________________________________________________________________________

17
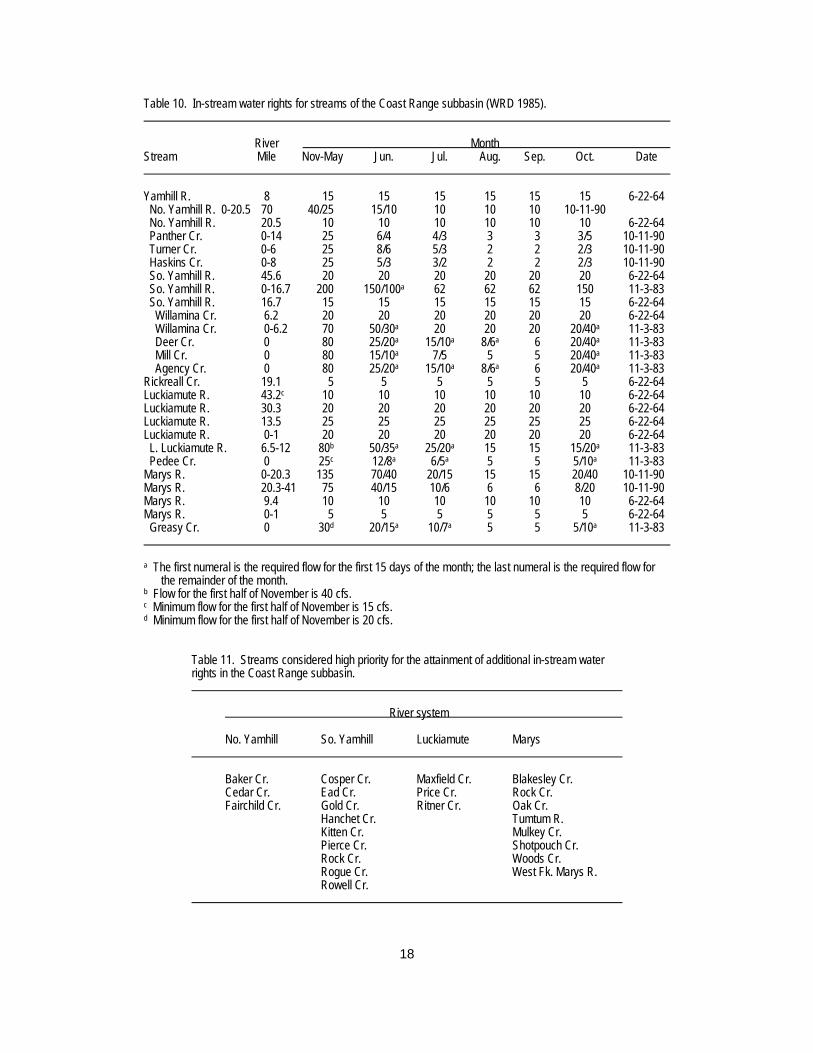
Diversions and Withdrawals Naturally low flows in the subbasin are often aggravated by water withdrawal for crop irrigation and to a lesser extent for municipal uses (Table 9). In an effort to minimize the effects of water withdrawal on aquatic life, in-stream water rights have been set at 26 sites in 16 streams in the Coast Range subbasin (Table 10). Streams listed in Table 11 are a high priority for additional in-stream water rights.
Table 9. Water rightsa for watersheds in the Coast Range subbasin (WRD, unpublished data). Total Percent of Total by Use Type Diverted Agric. Munic. Ind. Dom. Watershed cfs ac-ftb cfs ac-ft cfs ac-ft cfs cfs Yamhill 527 1,349 96 66 2 33 <1 <1 Rickreall 45 1,410 96 44 3 56 0 1 Luckiamute 193 332 95 100 4 0 <1 <1 Marys 155 87 0 12 0 <1 <1 a A water right is the amount of water legally allotted to users, not necessarily the amount
actually used. b An acre-foot is the volume of water required to cover one acre to a depth of 12 inches.
18
Table 10. In-stream water rights for streams of the Coast Range subbasin (WRD 1985). River Month Stream Mile Nov-May Jun. Jul. Aug. Sep. Oct. Date Yamhill R. 8 15 15 15 15 15 15 6-22-64 No. Yamhill R. 0-20.5 70 40/25 15/10 10 10 10 10-11-90 No. Yamhill R. 20.5 10 10 10 10 10 10 6-22-64 Panther Cr. 0-14 25 6/4 4/3 3 3 3/5 10-11-90 Turner Cr. 0-6 25 8/6 5/3 2 2 2/3 10-11-90 Haskins Cr. 0-8 25 5/3 3/2 2 2 2/3 10-11-90 So. Yamhill R. 45.6 20 20 20 20 20 20 6-22-64 So. Yamhill R. 0-16.7 200 150/100a 62 62 62 150 11-3-83 So. Yamhill R. 16.7 15 15 15 15 15 15 6-22-64 Willamina Cr. 6.2 20 20 20 20 20 20 6-22-64 Willamina Cr. 0-6.2 70 50/30a 20 20 20 20/40a 11-3-83 Deer Cr. 0 80 25/20a 15/10a 8/6a 6 20/40a 11-3-83 Mill Cr. 0 80 15/10a 7/5 5 5 20/40a 11-3-83 Agency Cr. 0 80 25/20a 15/10a 8/6a 6 20/40a 11-3-83 Rickreall Cr. 19.1 5 5 5 5 5 5 6-22-64 Luckiamute R. 43.2c 10 10 10 10 10 10 6-22-64 Luckiamute R. 30.3 20 20 20 20 20 20 6-22-64 Luckiamute R. 13.5 25 25 25 25 25 25 6-22-64 Luckiamute R. 0-1 20 20 20 20 20 20 6-22-64 L. Luckiamute R. 6.5-12 80b 50/35a 25/20a 15 15 15/20a 11-3-83 Pedee Cr. 0 25c 12/8a 6/5a 5 5 5/10a 11-3-83 Marys R. 0-20.3 135 70/40 20/15 15 15 20/40 10-11-90 Marys R. 20.3-41 75 40/15 10/6 6 6 8/20 10-11-90 Marys R. 9.4 10 10 10 10 10 10 6-22-64 Marys R. 0-1 5 5 5 5 5 5 6-22-64 Greasy Cr. 0 30d 20/15a 10/7a 5 5 5/10a 11-3-83 a The first numeral is the required flow for the first 15 days of the month; the last numeral is the required flow for
the remainder of the month. b Flow for the first half of November is 40 cfs. c Minimum flow for the first half of November is 15 cfs. d Minimum flow for the first half of November is 20 cfs.
Table 11. Streams considered high priority for the attainment of additional in-stream water rights in the Coast Range subbasin. River system No. Yamhill So. Yamhill Luckiamute Marys Baker Cr. Cosper Cr. Maxfield Cr. Blakesley Cr. Cedar Cr. Ead Cr. Price Cr. Rock Cr. Fairchild Cr. Gold Cr. Ritner Cr. Oak Cr. Hanchet Cr. Tumtum R. Kitten Cr. Mulkey Cr. Pierce Cr. Shotpouch Cr. Rock Cr. Woods Cr. Rogue Cr. West Fk. Marys R. Rowell Cr.

19
While in-stream water rights undoubtedly aid in maintaining streamflows for fish production, they are not guaranteed. The law does not require that the flows be maintained below the last site prescribed unless specified otherwise, and are subordinate to those with an earlier priority date. Consequently, these flows are not always achieved and out-of-stream water rights can actually exceed the amount of water in the stream (Table 12). In-stream water right flows do not represent optimum flows and, in some cases, may be less than the minimum flow required for salmonid production. Supplementation of flows in the Coast Range subbasin is not possible because no major water storage facilities exist. The largest storage facility is Mercer Reservoir, located on Rickreall Creek. Mercer Reservoir has 60 surface acres and is the water supply for the city of Dallas.
Table 12. Average low flow, minimum perennial streamflow, and total water rights for the North Yamhill, South Yamhill, Rickreall, Little Luckiamute, and Marys rivers (WRD, unpublished data; WRD 1985; USGS, unpublished data). Avg. Flow Min. Flow Total Water Rightsa Stream RM August August cfs ac-ft No. Yamhill R. 21 12 10 57 355 So. Yamhill R. 17 50 15b/62c 153 125 Rickreall Cr. 19 4 5b 22 790 Little Luckiamute R. 13 15 15d 44 0 Marys R. 9 18 5b 48 0 a These are the water rights for the entire stream, not just the rights above or below the river
mile specified. b Flow is to be maintained above the river mile specified. c Flow is to be maintained down to the mouth. d Flow is to be maintained between RM 13-8.
Oregon law requires a diverter to provide and maintain an adequate fish screen at a diversion to prevent fish from leaving the stream (ORS 509.615, 498.248). ODFW's Habitat Conservation Division has completed a summary report identifying fish screening needs at water diversions throughout the state. Screening needs in the Coast Range subbasin will be addressed according to their state-wide priority as part of an overall Department fish screening program that is currently being developed. Habitat Management The only habitat improvement projects in the subbasin are those undertaken by ODFW Salmon and Trout Enhancement Project (STEP) volunteers. From 1985 through 1988, 16 projects involving in-stream structures, seven projects involving passage improvement, and three projects involving riparian revegetation were completed (Table 13).

20
Table 13. Habitat improvement projects undertaken by STEP volunteers in the Coast Range subbasin during 1985-1988 (ODFW, unpublished data). In-stream Passage Riparian Stream structures improvements revegetation No. Yamhill R. 1986(2), 1987 -- -- So. Yamhill R. -- -- -- Mill Cr. 1985, 1986 -- -- Willamina Cr. -- 1986 -- Coast Cr. 1987, 1988 -- -- W.F. Agency Cr. 1986 -- -- Rickreall Cr. 1988 1988 -- Luckiamute Cr. 1988 -- -- Marys R. -- -- -- Rock Cr. 1986, 1988 1987 1985, 1986(2) S.F. Rock Cr. 1986, 1987 -- --
Policies Policy 1. The Department shall actively pursue and promote habitat protection and
improvement necessary to achieve the objectives for management of the subbasins' fish resources.
Policy 2. The Department shall coordinate with and advise agencies that manage the land
and water resources of Willamette subbasins. Policy 3. Habitat protection shall be emphasized over habitat rehabilitation and enhancement. Policy 4. Potential losses of fish production from habitat alteration shall be prevented or
reduced to the extent possible.
Objectives Objective 1. Provide necessary in-stream flows for fish production. Assumptions and Rationale 1. Flow in many streams is insufficient at times for optimum fish production. 2. Establishment of in-stream water rights will help maintain or increase fish production.

21
3. In-stream water rights can be established through existing legislation. 4. Improvements in streamflow will require the support and coordination of the regulatory
agencies and water users. Actions 1.1 Determine necessary flows for fish production. 1.2 Apply for in-stream water rights, particularly for those streams listed in Table 10. 1.3 Reapply for in-stream water rights where current in-stream (usually from converted
minimum perennial streamflows) water rights are inadequate to protect fish and wildlife uses.
1.4 Investigate discharge patterns of Haskins and Mercer reservoirs. Objective 2. Protect existing stream habitat from degradation associated with timber harvest,
road construction, and related activities on forested watersheds. Assumptions and Rational 1. Land use practices associated with timber harvesting can reduce fish production in
forested watersheds. Actions 2.1 Ensure compliance with state and federal forest management regulations and
consideration of ODFW recommendations. 2.2 Request that state and federal land management agencies conduct periodic monitoring
programs on the success and effectiveness of stream riparian and water quality protection measures.
Objective 3. Protect existing stream habitat in lowland areas from degradation associated with
agricultural, residential and commercial development, and other human activities. Assumptions and Rationale 1. Channel erosion, sedimentation, loss of riparian vegetation, and pollution reduce fish
production.

22
Actions 3.1 Cooperate with other agencies to increase protection of stream habitat. Objective 4. Improve the water quality of the subbasin. Assumptions and Rationale 1. High quality water is essential for fish production. 2. Fish production in some streams in the subbasin has declined because of poor water
quality. Actions 4.1 Coordinate with state and county agencies to improve monitoring and enforcement of
water quality standards. a. Urge the Department of Environmental Quality to increase water quality
monitoring especially in drainages suffering from poor water quality (such as the Yamhill and South Yamhill) and important production areas and determine point and non-point pollution sources.
b. Because of the water quality limited classification of the Yamhill River, urge the
Water Resources Department to deny applications for further water appropriations during summer from the Yamhill River and tributaries.
4.2 Promote riparian zone protection as a means of improving water quality for the future. a. Coordinate with county and state agencies and actively pursue regulations for the
establishment and maintenance of quality riparian zones in agricultural and urban lands.
b. Investigate opportunities for purchase or lease of riparian areas. Objective 5. Provide adequate upstream and downstream passage for fish at water diversions,
dams, and other artificial obstructions. Assumptions and Rationale 1. Adequate fish passage is necessary to prevent injury, delay or loss of fish as a result of
any water development project.
23
Actions 5.1 Evaluate suspected passage problems on Muddy Creek and in West Salem streams.
Recommend improvements. 5.2 Survey all culverts within the basin for passage problems. 5.3 Make specific recommendations to the responsible agencies or landowners to correct
problems at culverts. 5.4 Work with the ODFW Fish Passage Coordinator to establish an implementation schedule
for subbasin screening projects listed in the ODFW report on fish screening needs (as presented to the 66th Legislature; January 1991).
Objective 6. Develop subbasin specific knowledge that integrates fish distribution and
abundance information, habitat characteristics and potential for improvement, and sensitive watershed areas into the Department's Habitat Database system.
Assumptions and Rationale 1. Better understanding of factors that affect fish distribution and abundance will lead to more
effective habitat protection. 2. Computerized information will readily allow access by anyone in ODFW for habitat
protection issues. Actions 6.1 Inventory stream and watershed characteristics that affect fish production. 6.2 Promote increased interagency sharing of inventory information. 6.3 In coordination with BLM, private landowners, and volunteers, survey streams to
determine specific habitat problems and opportunities for habitat protection projects. 6.4 Ensure that all survey information is entered into the Habitat Database system.

24
WINTER STEELHEAD
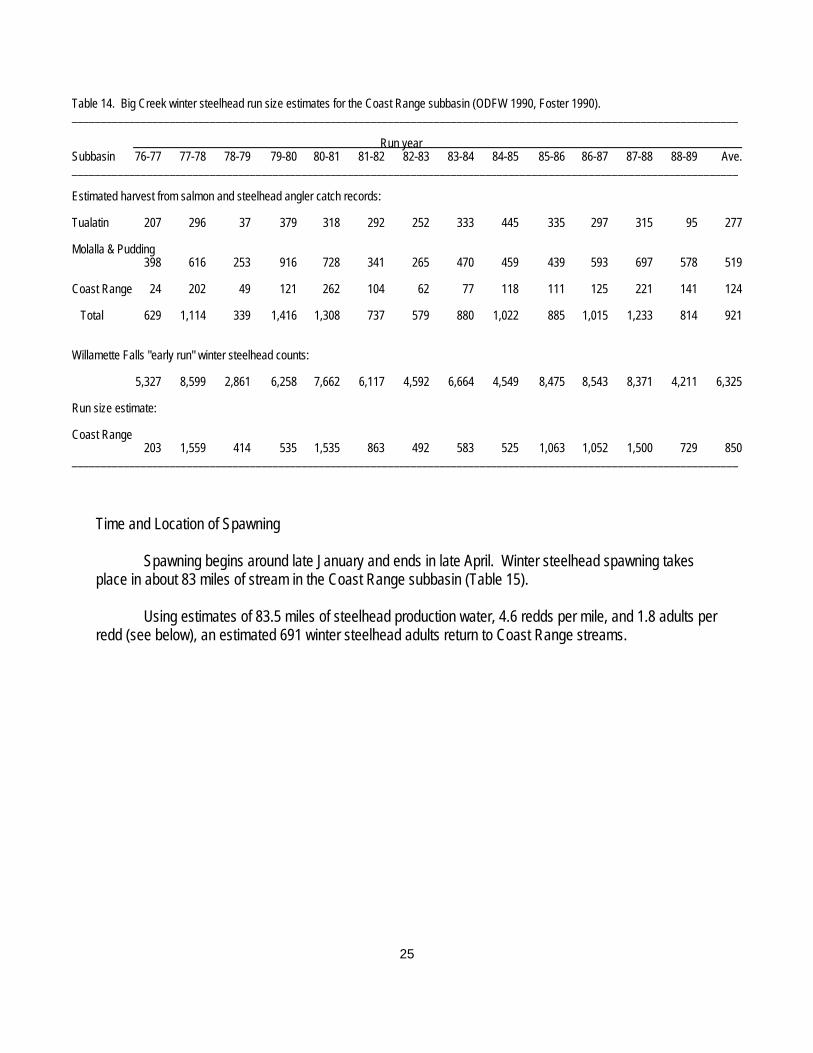
Background and Status Origin The Coast Range subbasin probably never supported large numbers of winter steelhead. Occasional reports of steelhead in the subbasin were made prior to ODFW stocking programs (Dimmick and Merryfield 1944, Willis et al. 1960). These fish may have been strays from other subbasin river systems. Hatchery releases of winter steelhead were made into the subbasin during 1964-82. Only STEP releases of fry have been made in recent years. Stream inventories (Ely 1979, Hunt 1980) and spawning surveys, indicate that natural production is occurring in the subbasin. Life History and Population Characteristics Distribution Steelhead occur in the upper reaches of the subbasin. The Yamhill system supports the greatest number of steelhead and the Marys system the least. Run Size The Coast Range subbasin does not have fish counting stations. To estimate numbers of Big Creek winter steelhead returning to the Coast Range (Table 14), the number of steelhead passing Willamette Falls between November 1 and February 15 (Big Creek stock) was divided among the three subbasins they return to above Willamette Falls -- the Tualatin, Molalla and Pudding, and Coast Range subbasins -- as follows: Run size = (Punch-card catch for subbasin / punch-card catch for all three subbasins) X Willamette Falls "early" winter steelhead count. The assumptions of this estimator are: 1) Exploitation rates are similar in all three subbasins. 2) The early-run stock returns only to these subbasins. 3) Catch of early-run stock above the falls in the mainstem Willamette River is zero. 4) All Big Creek stock (early-run) steelhead pass Willamette Falls between November 1 and
February 15. No other steelhead stocks pass the falls during this period. The average annual run returning to the Coast Range subbasin during 1976-77 through 1988-89 was estimated to be 850 fish.
25
Table 14. Big Creek winter steelhead run size estimates for the Coast Range subbasin (ODFW 1990, Foster 1990). ____________________________________________________________________________________________________________________ Run year Subbasin 76-77 77-78 78-79 79-80 80-81 81-82 82-83 83-84 84-85 85-86 86-87 87-88 88-89 Ave. ____________________________________________________________________________________________________________________ Estimated harvest from salmon and steelhead angler catch records: Tualatin 207 296 37 379 318 292 252 333 445 335 297 315 95 277 Molalla & Pudding 398 616 253 916 728 341 265 470 459 439 593 697 578 519 Coast Range 24 202 49 121 262 104 62 77 118 111 125 221 141 124 Total 629 1,114 339 1,416 1,308 737 579 880 1,022 885 1,015 1,233 814 921 Willamette Falls "early run" winter steelhead counts: 5,327 8,599 2,861 6,258 7,662 6,117 4,592 6,664 4,549 8,475 8,543 8,371 4,211 6,325 Run size estimate: Coast Range 203 1,559 414 535 1,535 863 492 583 525 1,063 1,052 1,500 729 850 ____________________________________________________________________________________________________________________
Time and Location of Spawning Spawning begins around late January and ends in late April. Winter steelhead spawning takes place in about 83 miles of stream in the Coast Range subbasin (Table 15). Using estimates of 83.5 miles of steelhead production water, 4.6 redds per mile, and 1.8 adults per redd (see below), an estimated 691 winter steelhead adults return to Coast Range streams.

26
Table 15. Suspected spawning areas of winter steelhead in the Coast Range subbasin. Stream River mile Stream River mile No. Yamhill R.* 21.0-29.0 Rickreall Cr.* 15.0-24.0 Panther Cr. 6.5-10.0 Baker Cr.* 7.0-10.0 Luckiamute R.* 40.0-48.0 Turner Cr. 0.0-3.0 L. Luckiamute R.* 11.0-13.0 Cedar Cr. 0.0-1.0 Teal Cr. 0.0-5.0 Haskins Cr.* 0.0-3.7 Pedee Cr. 0.0-4.2 Fairchild Cr.* 0.0-4.0 Petch Cr. 0.0-1.0 Marys R. -- Greasy Cr. 0.0-8.8 So. Yamhill R.* 52.0-60.0 Rock Cr. 0.0-3.7 Mill Cr.* 5.0-9.0 So. Fk. 0.0-2.0 Gooseneck Cr. 2.0-4.0 Willamina Cr.* 6.0-17.8 Coast Cr.* 0.0-6.0 Gilbert Cr. 0.0-0.2 Canada Cr.* 0.0-3.0 Burton Cr. 0.0-2.0 E.FK. Willamina Cr. 0.0-1.0 Gold Cr. 1.0-3.0 Cosper Cr. 0.0-0.5 Rowell Cr. 1.0-3.0 Rock Cr.* 0.0-4.0 Joe Day Cr. 0.0-3.0 Agency Cr.* 1.0-11.6 Yoncalla Cr. 0.0-0.1 W. Fk. Agency Cr. 0.0-0.8 Trib. A* 0.0-0.6 * Streams where steelhead production has been documented.
Spawning surveys indicate the average number of redds per mile in primary production areas ranges from 0.0 to 10.6 and averages of about 4.6 have stabilized at approximately 5 redds per mile (Table 16).

27
Table 16. Redds per mile for winter steelhead in the Coast Range subbasin (unpublished data, J. Haxton, ODFW). Redds per mile Stream Miles 1985 1986 1987 1988 1989 1990 1991 Ave. Yamhill R. -- -- -- -- -- -- -- -- -- So. Yamhill R. -- -- -- -- -- -- -- -- -- Mill Cr. 0.7 4.3 0.0 1.4 4.3 1.4 1.4 0.0 1.8 Willamina Cr. 0.8 7.5 6.2 7.5 12.5 12.5 3.8 10.0 8.6 Agency Cr. 0.7 7.1 5.7 7.1 18.6 2.9 4.3 5.7 7.0 No. Yamhill R. 0.5 8.0 6.0 12.0 14.0 4.0 0.0 0.0 6.3 Haskins Cr. 0.3 6.7 13.3 26.7 6.7 3.3 6.7 0.0 9.1 Fairchild Cr. 0.4 7.5 2.5 5.0 2.5 0.0 2.5 0.0 2.9 Luckiamute R. 1.0 11.0 3.0 20.0 29.0 -- 2.0 9.0 10.6
Hatchery Production Description of Hatcheries No hatcheries are located in the Coast Range subbasin. Early releases were primarily from Big Creek and Klaskanine hatcheries. Releases since the late 1970s have been from Gnat Creek Hatchery (east of Astoria) or Roaring River Hatchery (see the Santiam and Calapooia Subbasin Plan). Hatchery Releases Beginning in the late 1960s and early 1970s, managers released winter steelhead into the Coast Range subbasin to establish steelhead populations to provide a fishery. Releases were primarily early-run Big Creek stock. Some coastal stocks were also released. Coastal steelhead stocks have been found to be susceptible to the protozoan parasite Ceratomyxa shasta, which occurs throughout the Willamette basin. Consequently, it is believed that the coastal stocks experienced poor survival and naturally produced steelhead present today are primarily descended from Big Creek stock. From 1965 through 1973, 10,278 adults were released into the subbasin: 62% into the Yamhill watershed, 4% into the Rickreall, 23% into the Luckiamute, and 12% into the Marys (Table 17 and Appendix Table A-1). The Yamhill watershed was the only system to receive smolts and pre-smolts. From 1974 through 1982, an average of 50,422 smolts were released annually into the Yamhill system. Since 1983, only STEP fry have been released into the subbasin (Table 17 and Appendix A-1). The hatchery smolt stocking program was discontinued after 1982 when the amount of natural production was deemed sufficient to support the fishery. Adult production from fry releases is uncertain. Hatchery releases have been eliminated in the subbasin, except for releases of hatch-box fry.

28
Table 17. Total annual releases of winter steelhead into the Coast Range subbasin, 1964-1990 (Oregon Fish Commission, unpublished data; ODFW, unpublished data). Year Fry Fingerling Smolt Adult 1964 109,065 -- -- -- 1965 -- -- 43,950 230 1966 -- -- 54,917 -- 1967 -- -- 31,157 2,330 1968 -- -- 26,795 1,814 1969 -- -- -- 1,665 1970 -- -- -- 402 1971 -- -- -- 1,977 1972 -- -- -- 1,788 1973 -- -- -- 400 1974 -- -- 44,953 -- 1975 -- -- 48,890 -- 1976 -- -- 49,992 -- 1977 -- -- 42,635 -- 1978 -- -- 48,968 -- 1979 -- -- 66,044 -- 1980 -- -- 63,224 -- 1981 -- -- 63,081 -- 1982 24,800 44,787 20,012 -- 1983 269,100 -- -- -- 1984 19,500 -- -- -- 1985 201,700 -- -- -- 1986 396,300 -- -- -- 1987 99,600 -- -- -- 1988 210,700 -- -- -- 1989 132,500 -- -- -- 1990 132,500 -- -- --
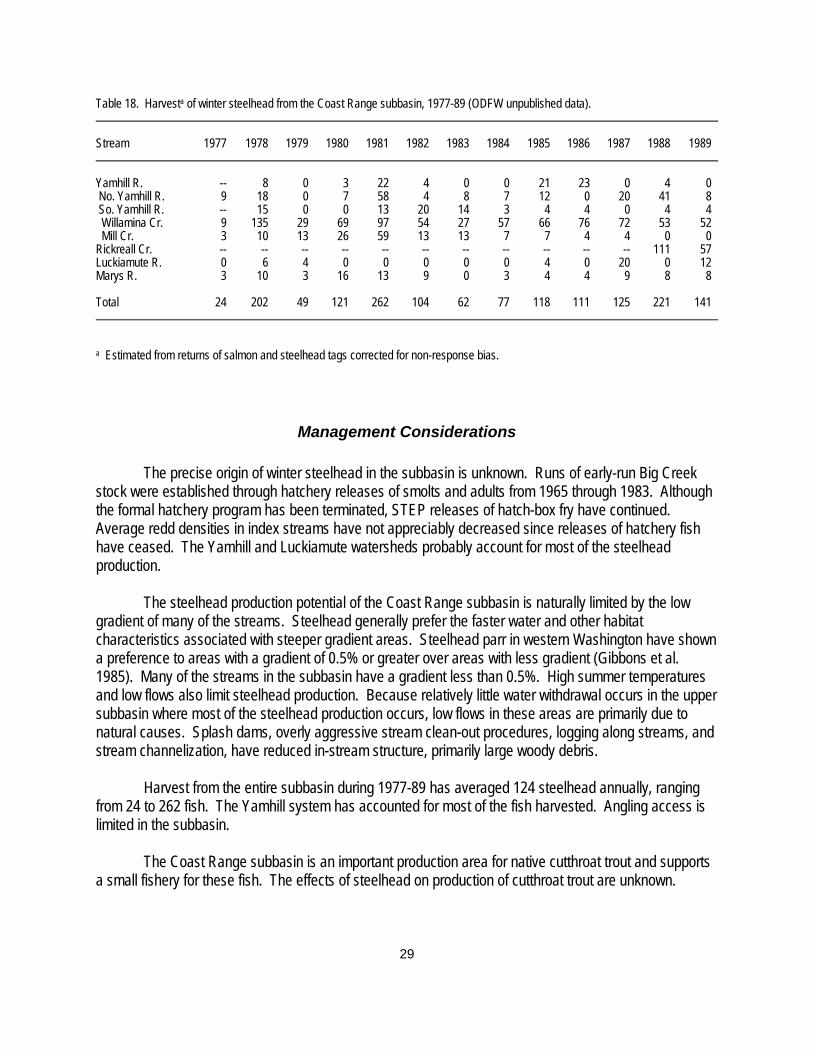
Angling and Harvest Harvest in the subbasin from 1977-89 ranged from 24 to 262 steelhead (ODFW 1989) (Table 18). In the past, the majority of the subbasin harvest occurred in the Yamhill watershed, primarily in Willamina Creek, a tributary of the South Yamhill. Recently, Rickreall Creek provides the majority of the harvest. Harvest of winter steelhead in the subbasin complies with general ODFW sport fishing regulations for winter steelhead and is estimated from salmon and steelhead tag returns.
29
Table 18. Harvesta of winter steelhead from the Coast Range subbasin, 1977-89 (ODFW unpublished data). Stream 1977 1978 1979 1980 1981 1982 1983 1984 1985 1986 1987 1988 1989 Yamhill R. -- 8 0 3 22 4 0 0 21 23 0 4 0 No. Yamhill R. 9 18 0 7 58 4 8 7 12 0 20 41 8 So. Yamhill R. -- 15 0 0 13 20 14 3 4 4 0 4 4 Willamina Cr. 9 135 29 69 97 54 27 57 66 76 72 53 52 Mill Cr. 3 10 13 26 59 13 13 7 7 4 4 0 0 Rickreall Cr. -- -- -- -- -- -- -- -- -- -- -- 111 57 Luckiamute R. 0 6 4 0 0 0 0 0 4 0 20 0 12 Marys R. 3 10 3 16 13 9 0 3 4 4 9 8 8 Total 24 202 49 121 262 104 62 77 118 111 125 221 141 a Estimated from returns of salmon and steelhead tags corrected for non-response bias.
Management Considerations The precise origin of winter steelhead in the subbasin is unknown. Runs of early-run Big Creek stock were established through hatchery releases of smolts and adults from 1965 through 1983. Although the formal hatchery program has been terminated, STEP releases of hatch-box fry have continued. Average redd densities in index streams have not appreciably decreased since releases of hatchery fish have ceased. The Yamhill and Luckiamute watersheds probably account for most of the steelhead production. The steelhead production potential of the Coast Range subbasin is naturally limited by the low gradient of many of the streams. Steelhead generally prefer the faster water and other habitat characteristics associated with steeper gradient areas. Steelhead parr in western Washington have shown a preference to areas with a gradient of 0.5% or greater over areas with less gradient (Gibbons et al. 1985). Many of the streams in the subbasin have a gradient less than 0.5%. High summer temperatures and low flows also limit steelhead production. Because relatively little water withdrawal occurs in the upper subbasin where most of the steelhead production occurs, low flows in these areas are primarily due to natural causes. Splash dams, overly aggressive stream clean-out procedures, logging along streams, and stream channelization, have reduced in-stream structure, primarily large woody debris. Harvest from the entire subbasin during 1977-89 has averaged 124 steelhead annually, ranging from 24 to 262 fish. The Yamhill system has accounted for most of the fish harvested. Angling access is limited in the subbasin. The Coast Range subbasin is an important production area for native cutthroat trout and supports a small fishery for these fish. The effects of steelhead on production of cutthroat trout are unknown.

30
Policies Policy 1. The naturally produced run of winter steelhead shall not be enhanced with releases
of hatchery fish pending an analysis of the status of wild steelhead populations in the subbasin.
Objectives Objective 1. Maintain an average annual spawning escapement of 675 adult winter steelhead in
the Coast Range subbasin. Assumptions and Rationale 1. Surveys of Coast Range index streams indicate average redd densities are 4.6 redds per
mile. Approximately 83.5 miles of stream may be used by winter steelhead for spawning. using a 1:08 female to male sex ratio, about 691 adult fish would be needed to seed the available habitat.
2. It is estimated that an average annual run of about 850 adults return to the subbasin. An
average of about 175 fish are harvested, leaving 675 adults for spawning escapement. 3. The contemporary run is believed to consist almost exclusively of fish descended from Big
Creek stock. It is unknown what, if any, portion of the run is comprised of indigenous stock.
4. The escapement objective will be modified should the acquisition of new information
warrant. 5. Passage will be maintained only to areas currently occupied by steelhead. 6. Winter steelhead provide angling diversity in the subbasin. Actions 1.1 Continue to monitor adult winter steelhead escapement, population distribution and
abundance, as measured by redds per mile, through annual spawning surveys in the Yamhill and Luckiamute Rivers.
1.2 Establish annual spawning surveys in the Mary's River, Rickreall Creek, and elsewhere in
the Coast Range subbasin where spawning is known or suspected to occur. 1.3 Using the information provided by Actions 1.1 and 1.2 develop estimates of the population
sizes in the Yamhill, Luckiamute, and Mary's Rivers and Rickreall Creek.

31
1.4 Conduct juvenile surveys in index streams to determine the age-specific patterns of
rearing and migration of juvenile steelhead. 1.5 Conduct an investigation to confirm or refute the provisional listing of wild fish populations
in the Yamhill River, Luckiamute River and Rickreall Creek. Recommend specific additions and/or deletions to the provisional list when it is next modified.
1.6 If it is determined that the run of steelhead in the Coast Range subbasin is comprised of
individual populations of wild fish, establish run size objectives for each population. Objective 2. Provide a potential average annual sport harvest of about 175 winter steelhead in
the Coast Range subbasin. Assumptions and Rationale 1. Spawning escapement has priority over harvest. 2. The average annual harvest of winter steelhead during 1977-89 in the Yamhill system was
about 100 fish. 3. The average annual harvest of winter steelhead during 1988-89 in Rickreall Creek was
about 75 fish. 4. Enhancement of the run to provide additional fish to harvest is not desirable because of
concern for native species. Actions 2.1 Continue to monitor harvest through expanded catch estimates based on salmon and
steelhead tag returns. 2.2 Monitor the sport fishery by conducting non-statistical creel surveys on key streams in the
subbasin. 2.3 If escapement is insufficient to meet established run size objectives over a 3-4 year
period, then consider implementing additional harvest restrictions in the Coast Range subbasin.

32
COHO SALMON
Background and Status Origin Coho salmon are not native to the Willamette basin above Willamette Falls. They were first introduced above the falls in the 1920s. Releases occurred throughout the Willamette basin from the 1950s through early 1970s, and in selected portions of the basin in the 1980s. Releases were primarily early-run Toutle stock, although coastal stocks and the late-run Cowlitz stock were occasionally used. Various concerns and uncertainties, such as the effect of coho on native cutthroat trout, winter steelhead and their contribution to Oregon fisheries, resulted in a de-emphasis on coho production above Willamette Falls. Life History and Population Characteristics Distribution Juvenile coho were found in the Luckiamute River prior to 1955, before any releases were made into the system (Willis et al. 1960). Unconfirmed reports of coho in Rickreall Creek were also made prior to stocking of the system (Willis et al. 1960). The origin of these fish is unknown. It is likely that they were strays from other subbasins. The exact distribution of coho in the Coast Range subbasin is not known, but is presumed to extend only to those areas that have been stocked since 1983. Spawning Location Spawning areas have been estimated based on current release locations (Table 19). The Yamhill and Luckiamute drainages are believed to contain about 70 percent of the total stream miles used for coho spawning. Coho spawning surveys conducted in the 1960s and 1970s (none have been conducted since 1976), included over half of the streams listed in Table 19. In all of these streams, except Woods Creek, coho redds were found at least once.

33
Table 19. Suspected spawning areas of coho in the Coast Range subbasin. Stream River mile Stream River mile No. Yamhill R. 14.5-30.5 Luckiamute R. 18.0-50.0 Panther Cr. 4.0-9.5 Maxfield Cr. 0.0-3.0 Baker Cr. 3.0-10.0 Peedee Cr. 0.0-4.0 Turner Cr. 0.0-3.0 S.Fk. Peedee Cr. 0.0-2.0 So. Yamhill R. 42.0-60.5 N.Fk. Peedee Cr. 0.0-2.0 Deer Cr. 7.0-15.5 Ritner Cr. 0.0-5.0 Mill Cr. 0.0-10.0 Soap Cr. 7.0-15.5 Gooseneck Cr. 0.0-5.0 Teal Cr. 0.0-5.0 Gold Cr. 0.0-3.0 Little Luckiamute R. 7.5-13.0 Cosper Cr. 0.0-0.5 Rowell Cr. 0.0-3.0 Marys R. 13.5-33.0 Rock Cr. 0.0-4.0 Greasy Cr. 0.0-9.0 Ead Cr. 0.0-2.0 Oak Cr. 0.0-9.0 Kitten Cr. 0.0-1.5 Rock Cr. 0.0-3.5 Pierce Cr. 0.0-2.0 Shotpouch Cr. 0.0-5.0 Woods Cr. 0.0-4.0 Rickreall Cr. 5.0-24.0 Applegate Cr. 0.0-1.0 Canyon Cr. 0.0-1.0 Ellendale Cr. 0.0-0.5
Hatchery Production Description of Hatcheries There are no hatcheries located in the Coast Range subbasin. Coho released into the subbasin were supplied by Bonneville, Oxbow, Eagle Creek, Cascade, and Sandy hatcheries. Eggs used in STEP hatch boxes were supplied by Sandy Hatchery. In 1983, STEP volunteers raised Cowlitz stock coho. These eggs were supplied by Cowlitz Hatchery in Washington state. Hatchery Releases In the spring of 1987, coho pre-smolts were stocked into subbasin streams at a density of about 1.26 pre-smolts per square yard. About four to five months later juvenile coho population estimates were made in the Luckiamute and Marys watersheds. About 0.04 juvenile coho per square yard were found. This substantial decrease in density may indicate that the areas stocked did not have habitat suitable to support coho. In the 1980s, coho were released into only a fraction of the streams that were stocked in the 1960s and 1970s (Williams 1983b) to minimize effects on cutthroat and steelhead. Since 1983, releases into the subbasin have been of fry and pre-smolts only (Table 20 and Appendix Table B-1). Fry releases have averaged about 855,400 fry annually. Pre-smolt releases have averaged about 1.2 million fish, but have not occurred every year. Except for STEP releases in 1983, all releases in the 1980s have been early-run stock. The majority of releases have been in the Yamhill watershed (Table 21).

34
Table 20. Coho releases in the Coast Range subbasin, 1954-87 (Williams 1983b). Year Fry Fingerling Yearling Adult 1952 -- -- 10,000 -- 1953 -- 100,000 -- -- 1954 -- 50,000 45,486 -- 1955 -- 239,556 79,877 -- 1956 -- 119,862 -- -- 1957 -- 198,000 -- -- 1958 -- 248,476 -- -- 1959 -- 199,440 91,784 -- 1960 -- -- 63,158 -- 1961 806,632 -- 44,979 -- 1962 1,154,793 -- 61,814 -- 1963 -- -- 79,853 -- 1964 3,703,246 164,183 73,620 550 1965 2,369,725 -- -- 446 1966 1,925,186 267,510 -- 680 1967 763,393 -- -- 3,247 1968 859,058 -- 424,952 2,237 1969 2,339,006 -- 498,324 2,139 1970 222,957 -- 431,280 150 1971 397,240 -- 455,028 300 1972 327,117 196,100 525,351 532 1973 -- -- -- 605 1974 158,517 92,300 296,842 204 1975 -- -- -- -- 1976 161,250 -- -- -- 1977 -- -- -- -- 1978 -- -- -- -- 1979 -- -- -- -- 1980 -- -- -- -- 1981 -- -- -- -- 1982 -- -- -- -- 1983 1,827,200 -- -- -- 1984 325,000a 648,400 -- -- 1985 899,600a 1,871,700 -- -- 1986 441,500a -- -- -- 1987 458,200a 501,200 -- -- a STEP releases.
Coho were stocked in the subbasin in the 1960s and 1970s as part of an effort to establish a self-sustaining run of coho to the upper Willamette basin. This program was terminated when returns did not reach expectations (Williams 1983a). In the 1980s, coho were stocked in an attempt to alleviate depressed ocean and Columbia River fisheries. Concern about competition with other fish species, and uncertainty regarding the programs' success, resulted in the program being discontinued after four years.

35
Table 21. Percent of total coho stocked in the Coast Range subbasin by watershed, 1952-87. Percent Watershed Fry Fingerling Yearling Adult Yamhill 52 43 59 33 Luckiamute 23 39 22 37 Rickreall 7 2 0 15 Marys 20 16 19 15
Angling and Harvest There is no recorded harvest of coho from the Coast Range subbasin. Coho from the Coast Range subbasin contribute almost entirely to ocean and Columbia River fisheries (ODFW 1988). Harvest of coho in the subbasin must comply with sport fishing regulations. Harvest is monitored solely through the return of salmon and steelhead angling tags.
Management Considerations Coho are not native to the subbasin. Past efforts to establish coho through stocking have met with little success. Coho may compete with native species, such as cutthroat trout and winter steelhead. Interactions of native species with coho in the Coast Range subbasin are unknown. Returning coho do not contribute significantly to Coast Range subbasin sport fisheries due to their dark color and poor quality flesh.
Policies Policy 1. Hatchery releases of coho salmon shall be permitted only for the purpose of
rehabilitating self-sustaining populations.
36
Objectives Objective 1. Maintain the natural production of coho salmon in the Coast Range subbasin
provided the existing run is determined to be self-sustaining. Assumptions and Rationale 1. Coho are not native to the Coast Range subbasin. 2. Coho do not contribute significantly to fisheries in the Coast Range subbasin. 3. Maintenance of self-sustaining populations is desirable to provide greater genetic diversity
in the Willamette basin. 4. Information on the distribution and abundance of adult and juvenile coho is necessary to
determine the status of self-sustaining population in the subbasin. 5. Coho may compete with native species for spawning and rearing habitats in the Coast
Range subbasin. 6. The management objective for coho will be deleted if it is determined that self-sustaining
populations are not present in the Coast Range subbasin. Actions 1.1 Implement habitat protection actions outlined under objections for habitat protection. 1.2 Continue to monitor the harvest of coho in the subbasin through punch card returns. 1.3 Monitor the distribution and abundance of adult coho by conducting annual spawning
surveys in selected streams where spawning is known or suspected to occur. 1.4 Monitor the distribution and abundance of juvenile coho by sampling selected streams
where natural production is suspected to occur. 1.5 Conduct scale analysis of adult coho returning to the subbasin to determine their origin.

37
FALL CHINOOK SALMON
Background and Status Origin Fall chinook are not native to the subbasin. Late-run Cowlitz stock fall chinook were released into the Luckiamute and Little Luckiamute rivers in 1974 and 1976. They do not occur in the subbasin today. Life History and Population Characteristics In 1976 (the first return year from the 1974 release), 24 redds were counted in the Luckiamute, but none were found in the Little Luckiamute (Hansen 1977). No redds or carcasses were found in subsequent years (Hansen and Williams 1979). No juveniles were found by seining in 1977 and 1978 (Hansen 1978). Low flows and high temperatures characteristic of Coast Range subbasin streams during late August and September are not suitable for natural production of fall chinook. Hatchery Production Cowlitz stock fall chinook were introduced as part of the effort to establish a self-sustaining run above Willamette Falls (Hansen 1977). Fall chinook were released into the Luckiamute and Little Luckiamute rivers in May of 1974 and 1976, at 128 fish per pound (Table 22) (Hansen 1977). This stock failed to establish itself in the subbasin.
Table 22. Releases of Cowlitz stock fall chinook into the Coast Range subbasin (Hansen 1977). Brood Release Number year year releaseda Release site 1973 1974 78,000 Luckiamute R. 1973 1974 131,250 Little Luckiamute R. 1975 1976 2,040,328 Luckiamute R. 1975 1976 262,340 Little Luckiamute R. a All releases have been fingerlings.
Policies Policy 1. There shall be no further releases of fall chinook salmon in the Coast Range
subbasin.

38
TROUT AND WHITEFISH
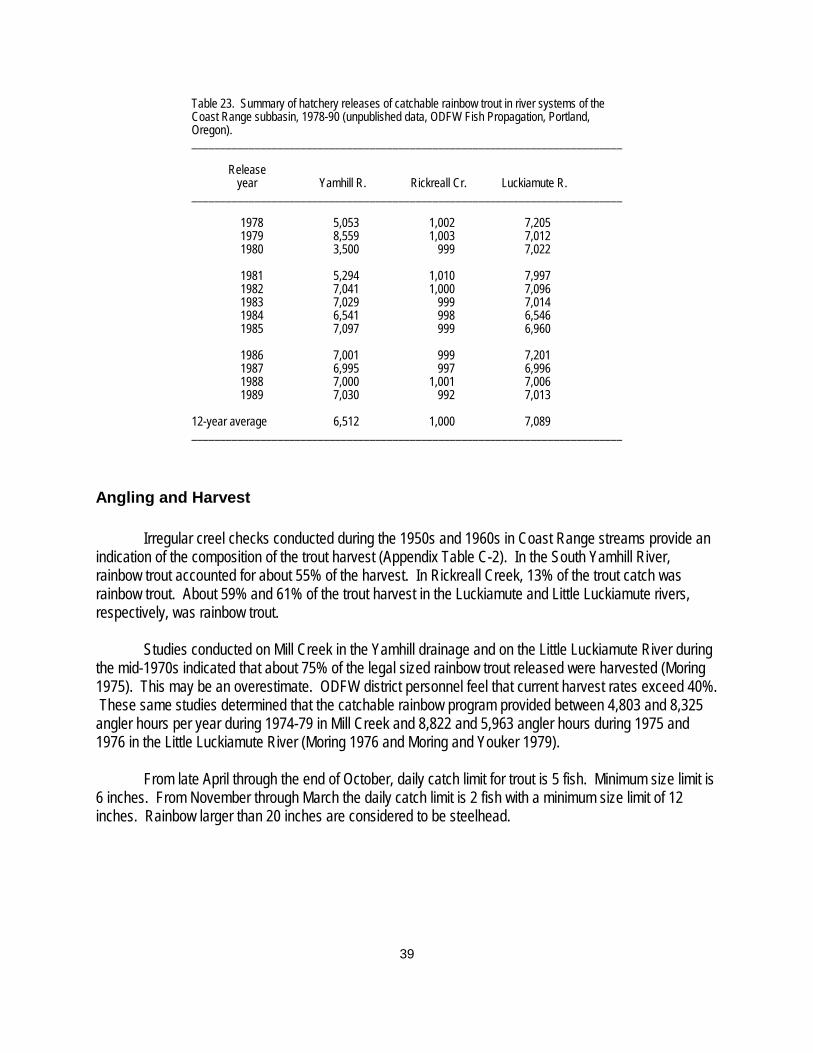
Background and Status RAINBOW TROUT Origin Rainbow trout are not native to the Coast Range subbasin. Releases of hatchery rainbow are made to provide a fishery. There is no evidence of natural production of rainbow trout from hatchery releases in the subbasin. Hatchery Production Description of Hatcheries Hatchery rainbow trout released in the Coast Range subbasin are currently raised at Roaring River fish hatchery. Description of the hatchery and rearing practices are found in the Santiam and Calapooia subbasin plan. Hatchery Releases Releases of rainbow, cutthroat, and brook trout in Coast Range streams have been made as early as the 1920s and 1930s. Currently, only catchable rainbow are released to provide a sport fishery. A total of 28 miles of stream are stocked with catchable rainbow in the Coast Range subbasin. Stocking levels during 1978-89 have averaged 6,512 catchable rainbow in the Yamhill drainage, 1,000 in Rickreall Creek, and 7,089 in the Luckiamute drainage (Table 23 and Appendix Table C-1). Current release goals are 7,000 catchable rainbow trout in the Yamhill drainage, 1,000 in Rickreall Creek, and 7,000 in the Luckiamute drainage. Rainbow trout are released from late April through early June.
39
Table 23. Summary of hatchery releases of catchable rainbow trout in river systems of the Coast Range subbasin, 1978-90 (unpublished data, ODFW Fish Propagation, Portland, Oregon). ___________________________________________________________________________ Release year Yamhill R. Rickreall Cr. Luckiamute R. ___________________________________________________________________________ 1978 5,053 1,002 7,205 1979 8,559 1,003 7,012 1980 3,500 999 7,022 1981 5,294 1,010 7,997 1982 7,041 1,000 7,096 1983 7,029 999 7,014 1984 6,541 998 6,546 1985 7,097 999 6,960 1986 7,001 999 7,201 1987 6,995 997 6,996 1988 7,000 1,001 7,006 1989 7,030 992 7,013 12-year average 6,512 1,000 7,089 ___________________________________________________________________________
Angling and Harvest Irregular creel checks conducted during the 1950s and 1960s in Coast Range streams provide an indication of the composition of the trout harvest (Appendix Table C-2). In the South Yamhill River, rainbow trout accounted for about 55% of the harvest. In Rickreall Creek, 13% of the trout catch was rainbow trout. About 59% and 61% of the trout harvest in the Luckiamute and Little Luckiamute rivers, respectively, was rainbow trout. Studies conducted on Mill Creek in the Yamhill drainage and on the Little Luckiamute River during the mid-1970s indicated that about 75% of the legal sized rainbow trout released were harvested (Moring 1975). This may be an overestimate. ODFW district personnel feel that current harvest rates exceed 40%. These same studies determined that the catchable rainbow program provided between 4,803 and 8,325 angler hours per year during 1974-79 in Mill Creek and 8,822 and 5,963 angler hours during 1975 and 1976 in the Little Luckiamute River (Moring 1976 and Moring and Youker 1979). From late April through the end of October, daily catch limit for trout is 5 fish. Minimum size limit is 6 inches. From November through March the daily catch limit is 2 fish with a minimum size limit of 12 inches. Rainbow larger than 20 inches are considered to be steelhead.

40
CUTTHROAT TROUT Origin Cutthroat trout are native to the Coast Range subbasin. Willamette cutthroat trout are considered to be the coastal subspecies Oncorhynchus clarki clarki (Moring 1978). However, anadromous stocks do not occur above Willamette Falls. Cutthroat trout are the only native trout in the Coast Range subbasin. Although rainbow and brook trout have been released in the subbasin, only cutthroat trout persist through natural production. Willamette basin cutthroat trout are currently listed as a stock of concern due to insufficient information regarding their status. Cutthroat trout should be given a high priority with respect to future population and habitat inventory and monitoring activities in the Willamette basin. Life History and Population Characteristics Distribution Cutthroat trout are widely distributed in the subbasin and occur at least seasonally in most perennial streams. Some intermittent streams may also be used by cutthroat during certain times of the year. Approximately 1,400 miles of stream in the Coast Range subbasin contain cutthroat trout. Isolated populations of cutthroat trout occur above barriers in Haskins and Baker creeks in the North Fork Yamhill system, in Mill, Rock, Yoncalla, and West Fork Salt creeks in the South Fork Yamhill system, in the Brush College system, in Rickreall Creek above Mercer Reservoir, in the Little Luckiamute, Teal, Burgett, and Rock Pit creeks in the Luckiamute system, and in the North Fork Rock Creek in the Marys River system. Abundance Inventories conducted in 1979 and 1980 on various streams throughout the subbasin suggest that cutthroat density is roughly of the same magnitude throughout the subbasin (Table 24). An exception is above the falls on the Little Luckiamute River, where cutthroat density is much greater than in other streams. Cutthroat populations which are isolated typically exhibit greater densities than those which coexist with anadromous salmonids.
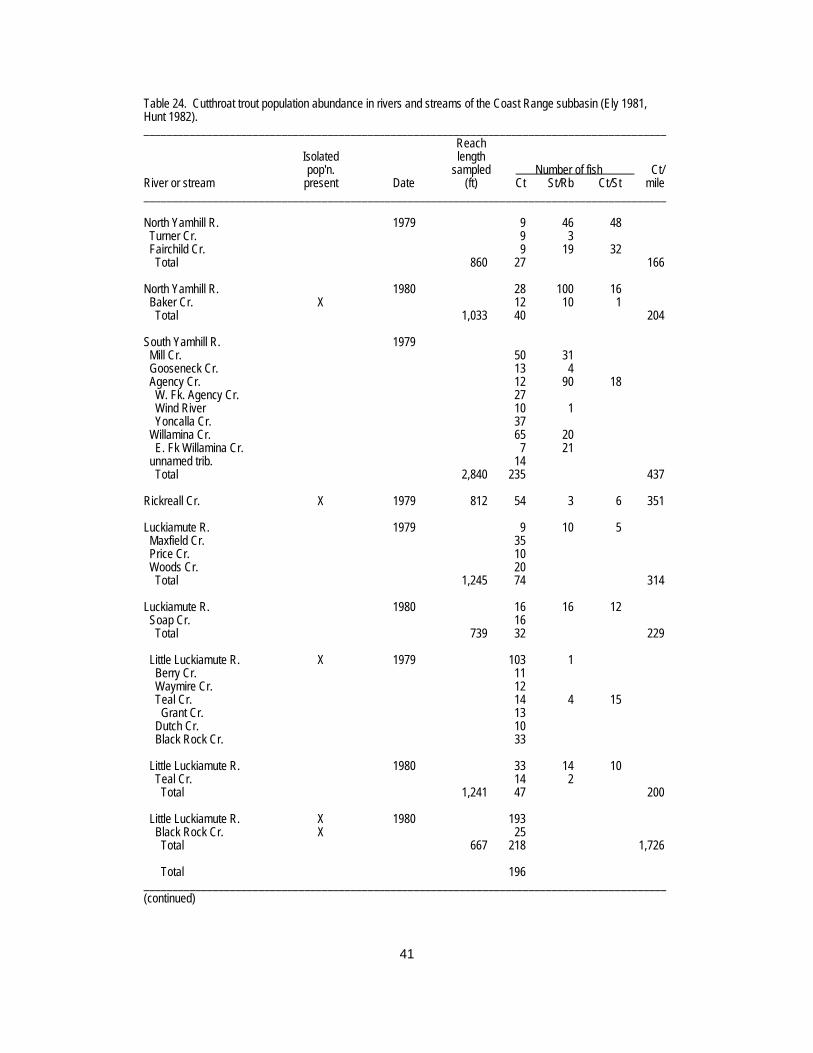
41
Table 24. Cutthroat trout population abundance in rivers and streams of the Coast Range subbasin (Ely 1981, Hunt 1982). ___________________________________________________________________________________________ Reach Isolated length pop'n. sampled Number of fish Ct/ River or stream present Date (ft) Ct St/Rb Ct/St mile ___________________________________________________________________________________________ North Yamhill R. 1979 9 46 48 Turner Cr. 9 3 Fairchild Cr. 9 19 32 Total 860 27 166 North Yamhill R. 1980 28 100 16 Baker Cr. X 12 10 1 Total 1,033 40 204 South Yamhill R. 1979 Mill Cr. 50 31 Gooseneck Cr. 13 4 Agency Cr. 12 90 18 W. Fk. Agency Cr. 27 Wind River 10 1 Yoncalla Cr. 37 Willamina Cr. 65 20 E. Fk Willamina Cr. 7 21 unnamed trib. 14 Total 2,840 235 437 Rickreall Cr. X 1979 812 54 3 6 351 Luckiamute R. 1979 9 10 5 Maxfield Cr. 35 Price Cr. 10 Woods Cr. 20 Total 1,245 74 314 Luckiamute R. 1980 16 16 12 Soap Cr. 16 Total 739 32 229 Little Luckiamute R. X 1979 103 1 Berry Cr. 11 Waymire Cr. 12 Teal Cr. 14 4 15 Grant Cr. 13 Dutch Cr. 10 Black Rock Cr. 33 Little Luckiamute R. 1980 33 14 10 Teal Cr. 14 2 Total 1,241 47 200 Little Luckiamute R. X 1980 193 Black Rock Cr. X 25 Total 667 218 1,726 Total 196 ___________________________________________________________________________________________ (continued)

42
Table 24 continued. ___________________________________________________________________________________________ Reach Isolated length pop'n. sampled Number of fish Ct/ River or stream present Date (ft) Ct St/Rb Ct/St mile ___________________________________________________________________________________________ Marys River W. Fk. Marys R. 1979 18 Oleman Cr. 5 E. Fk. Marys R. 2 Greasy Cr. 30 1 Rock Cr. 36 19 13 Griffith Cr. 2 So. Fk. Rock Cr. 16 2 Connection Cr. 6 Woods Cr. 29 Blakesley Cr. 19 Read Cr. 8 Tum Tum R. 6 Mulkey Cr. 12 Lasky Cr. 3 Bark Cr. 6 Shotpouch Cr. 31 Horton Cr. 4 Devitt Cr. 8 Total 4,050 241 314 Marys R. 1980 9 Greasy Cr. 12 1 1 Rock Cr. 18 2 7 Moss Cr. 12 Total 901 51 299 ___________________________________________________________________________________________
Age Structure Age structure is wider in larger rivers and restricted in smaller tributaries. In most small streams, the youngest year classes (ages 0, 1, and 2) are most significant in the age structure, while in large streams 2 and 3-year-old trout are most prevalent. This supports the belief that portions of tributary populations move into larger streams for most of their growth. Age structure of cutthroat trout from different Coast Range tributaries is similar (Figure 3). Age 1 fish make up half of the total population, while age 2 fish account for about one-third of the population. Size The mean fork length of cutthroat trout in Coast Range tributaries ranges from 4.4 inches in the Little Luckiamute River to 6.7 inches in the North Yamhill River (Table 25) (Ely 1979). Age specific length of cutthroat collected in Coast Range streams was about 2.5-6.5 inches for age 1 fish, 4-10 inches for age 2 fish, 5.5-12 inches for age 3 fish, 9-12 inches for age 4 fish, and about 16 inches for an age 5 fish (Table 26) (Moring and Youker 1979).

43
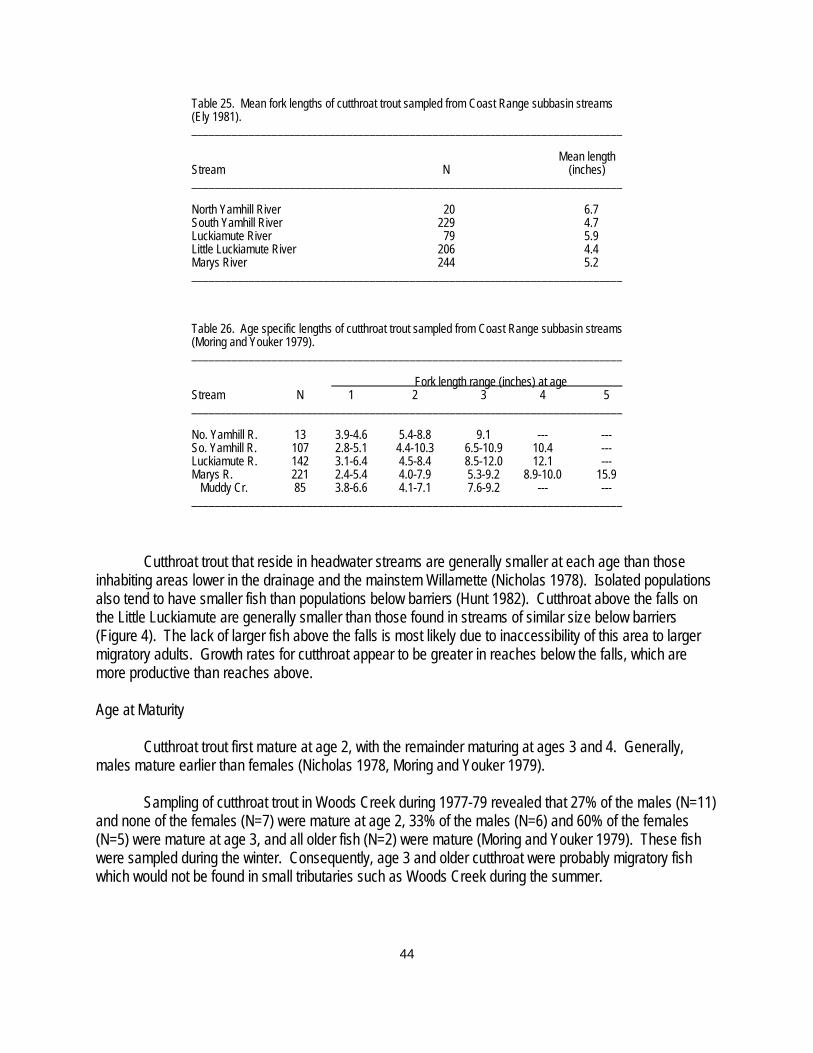
44
Table 25. Mean fork lengths of cutthroat trout sampled from Coast Range subbasin streams (Ely 1981). ___________________________________________________________________________ Mean length Stream N (inches) ___________________________________________________________________________ North Yamhill River 20 6.7 South Yamhill River 229 4.7 Luckiamute River 79 5.9 Little Luckiamute River 206 4.4 Marys River 244 5.2 ___________________________________________________________________________ Table 26. Age specific lengths of cutthroat trout sampled from Coast Range subbasin streams (Moring and Youker 1979). ___________________________________________________________________________ Fork length range (inches) at age Stream N 1 2 3 4 5 ___________________________________________________________________________ No. Yamhill R. 13 3.9-4.6 5.4-8.8 9.1 --- --- So. Yamhill R. 107 2.8-5.1 4.4-10.3 6.5-10.9 10.4 --- Luckiamute R. 142 3.1-6.4 4.5-8.4 8.5-12.0 12.1 --- Marys R. 221 2.4-5.4 4.0-7.9 5.3-9.2 8.9-10.0 15.9 Muddy Cr. 85 3.8-6.6 4.1-7.1 7.6-9.2 --- --- ___________________________________________________________________________
Cutthroat trout that reside in headwater streams are generally smaller at each age than those inhabiting areas lower in the drainage and the mainstem Willamette (Nicholas 1978). Isolated populations also tend to have smaller fish than populations below barriers (Hunt 1982). Cutthroat above the falls on the Little Luckiamute are generally smaller than those found in streams of similar size below barriers (Figure 4). The lack of larger fish above the falls is most likely due to inaccessibility of this area to larger migratory adults. Growth rates for cutthroat appear to be greater in reaches below the falls, which are more productive than reaches above. Age at Maturity Cutthroat trout first mature at age 2, with the remainder maturing at ages 3 and 4. Generally, males mature earlier than females (Nicholas 1978, Moring and Youker 1979). Sampling of cutthroat trout in Woods Creek during 1977-79 revealed that 27% of the males (N=11) and none of the females (N=7) were mature at age 2, 33% of the males (N=6) and 60% of the females (N=5) were mature at age 3, and all older fish (N=2) were mature (Moring and Youker 1979). These fish were sampled during the winter. Consequently, age 3 and older cutthroat were probably migratory fish which would not be found in small tributaries such as Woods Creek during the summer.

45

46
Fecundity Fecundities of two cutthroat trout sampled from Mountain View Creek, a tributary to Frazier Creek, Benton County, were 80 and 157 eggs (Moring and Youker 1979). Time of Spawning It is believed that most cutthroat trout spawning in Luckiamute River tributaries move upstream in November and drop back to the Willamette River by late March (Nicholas 1978). Cutthroat trout in Mountain View, Berry, and Soap creeks have been found spawning from January through May (Nicholas 1978). A large run of cutthroat trout were observed jumping at a dam on the lower Marys River on November 7, 1955 (Nicholas 1978). Thirty-two upstream migrant trout were trapped from November 8-10, 1955. On November 10, 1955 65 trout were observed attempting to leap over the dam in a 10-minute period. Movement and Migration Cutthroat trout exhibit varying degrees of migratory behavior. Some of the migratory behavior is related to spawning. Potamodromous cutthroat are those which migrate into small headwater streams in the fall and winter, spawn, and then migrate to larger rivers in the early spring (Moring et al. undated). Not all upstream migrants are maturing fish on a spawning run (unpublished data, J.J. Wetherbee, ODFW, Salem, Oregon). Other migratory movements are more local in nature, occurring in response to seasonal changes in temperature and flow, or to improve forage location. Some cutthroat populations do not migrate, but reside in the same area permanently (Dimick and Merryfield 1945). Wetherbee (Nicholas 1978, Moring and Hooton 1978) tagged cutthroat trout in Marys River, Mountain View Creek, Berry Creek, and a tributary to Soap Creek during 1955. Upstream migrants in Mountain View, Berry, and Soap creeks were generally smaller than migrants in the lower portion of Marys River. He surmised that most of the Marys River migrants had been rearing in the Willamette River while many of the migrants in small tributaries had reared in a larger tributary to the Willamette. One female cutthroat tagged in Mountain View Creek was later caught by an angler in the Santiam River. These limited observations suggest that upstream migrant cutthroat trout may have reared in that same tributary, in the mainstem Willamette, or in a major tributary on the east side of the Willamette. Although fish tagged by Wetherbee were known to migrate from December to the first of April, 84% of the fish were trapped in a one month period from January 16 to February 16 (unpublished data, J.J.Wetherbee, ODFW, Salem, Oregon). About 87% of the tagged cutthroat ranged in size from 7 to 12 inches. The remaining 33% were over 10 inches, and were thought to be from the Willamette River.

47
Hatchery Production No hatchery releases of cutthroat are made in the Coast Range subbasin. Angling and Harvest Past and Current Harvest Creel studies conducted during the 1950s and 1960s in Coast Range streams indicated cutthroat were caught in the South Yamhill River, Rickreall Creek, and the Luckiamute and Little Luckiamute rivers (Appendix Table C-2). In the South Yamhill River, cutthroat trout accounted for about 45% of the trout harvest. In Rickreall Creek, 87% of the trout catch was cutthroat. About 41% and 32% of the trout harvest in the Luckiamute and Little Luckiamute rivers, respectively, was cutthroat. The extent of angler utilization of cutthroat trout in Coast Range subbasins is unknown. Estimates of angler catch and effort of trout species have been made in angler surveys during 1974-77, but these combine heavy pressure and catches for catchable rainbow with cutthroat trout. Stocked rainbow trout are the primary target of angling pressure. Cutthroat trout are often only a secondary species in terms of effort. Catch rates for cutthroat trout in reaches of Mill Creek and the Little Luckiamute River stocked with catchable rainbow trout ranged from 0.07-0.15 fish per angler and 0.05-0.10 fish per hour (Table 27).
Table 27. Catch rates for cutthroat trout in Coast Range subbasin streams stocked with catchable rainbow trout (from Moring and Youker 1979). ___________________________________________________________________________ Cutthroat catch Per Per Stream Year angler hour ___________________________________________________________________________ Mill Creek (Yamhill R.) 1974 0.11 0.09 1975 0.15 0.08 1976 0.07 0.06 1977 0.07 0.05 Little Luckiamute River 1975 0.14 0.10 1976 0.08 0.08 ___________________________________________________________________________
Current harvest levels of cutthroat in Coast Range streams is unknown. Limited observations by district and state police personnel indicate that harvest levels are probably low for wild trout. However small, local populations may be severely impacted by relatively light fishing pressure.

48
Current Angling Regulations From late April through the end of October, daily catch limit for trout is 5 fish. Minimum size limit is 6 inches. From November through March, trout caught on streams open to salmon and steelhead must be released. Management Considerations Low stream flows and high summer temperatures constrain cutthroat trout production in some Coast Range streams. Small valley floor streams have inadequate protection from agricultural practices which impact spawning and rearing habitat. There is inadequate protection from forest practices along small streams that may be important spawning and early rearing areas for migratory and resident cutthroat. Spawning gravel may be limiting in some streams. Removal of natural barriers provides other fish species access to cutthroat spawning and rearing habitat. Competition with introduced salmonids, primarily steelhead and coho, constrains production of cutthroat trout (Nicholas 1978). Potamodromous cutthroat may be vulnerable to overharvest. More information is needed on the specific life history characteristics of these fish.

49
WHITEFISH Origin Whitefish are a member of the trout and salmon family Salmonidae and are native to larger streams in the Willamette Basin. There is no hatchery production of whitefish. Life History and Population Characteristics In the Coast Range subbasin, whitefish have been observed in Woods Creek in the Marys River drainage and in a tributary to the Little Luckiamute River (unpublished data, J. Haxton, ODFW, McMinnville, Oregon). Mountain whitefish mature at 3 to 4 years of age and spawn in the fall and early winter (Daily 1971). Length at maturity in most waters is less than 12 inches (ODFW 1987). Mountain whitefish have habitat preferences and a diet similar to trout. Angling and Harvest There is no information concerning harvest of whitefish in the Coast Range subbasin. Although whitefish can be caught on natural bait and flies, they are seldom sought by anglers. Whitefish may be taken from any water open to salmon, steelhead or trout angling. There is no bag limit. Policies Policy 1. In the Coast Range subbasin, cutthroat shall be given first and highest
consideration when evaluating and setting priorities for management activities. Policy 2. Releases of hatchery rainbow trout in streams the Coast Range subbasin shall be
confined to the following areas: RM 5-9 of Agency Creek RM 9-19 of Mill Creek RM 13-14 of Rickreall Creek RM 13-17 of the Little Luckiamute River RM 37-46 of the Luckiamute River

50
Objectives Objective 1. Maintain the genetic diversity and adaptiveness of wild trout populations. Assumptions and Rationale 1. Willamette basin cutthroat trout have been identified as a stock of concern. This objective
addresses some of the problems with this stock. 2. Increased angling pressure due to the catchable rainbow program may negatively affect
wild cutthroat populations. 3. Monitoring the distribution and abundance of populations of wild trout will provide an
indication of their health and adaptiveness. 4. Cutthroat trout are reproductively isolated from hatchery rainbow that are released in the
subbasin. Actions 1.1 Identify key stream systems in the Coast Range subbasin used by potamodromous trout. 1.2 Establish population trends in wild trout distribution and abundance in selected index
streams with special attention paid to potamodromous stocks. 1.3 Assess the migratory patterns of cutthroat trout in tributary systems in the Coast Range
subbasin by conducting tagging studies. 1.4 Verify and document the distribution and upper limits of cutthroat trout in streams. Objective 2. Protect, restore, and enhance wild trout and whitefish habitat. Assumptions and Rationale 1. Protection and enhancement of wild trout populations can be achieved principally through
habitat protection and improvement. Actions 2.1 Recommend to the Department of Forestry that they change their policy to provide full
riparian protection to all streams containing resident trout populations. 2.2 Identify sites for habitat improvement. 2.3 Develop habitat improvement plans. 2.4 Work with volunteers, sporting clubs, landowners and agencies to implement habitat
improvement projects, such as in valley floor streams and on the Marys River below Harris.
2.5 Implement habitat protection actions outlined under objectives for Habitat Protection.

51
Objective 3. Provide about 1,500 angler days on Agency Creek, 4,500 angler days on Mill Creek, 400 angler days on Rickreall Creek, 6,300 angler days on the Little Luckiamute River, and 1,500 angler days on the Luckiamute River by stocking legal-sized hatchery rainbow trout in the following streams and reaches:
RM 5-9 of Agency Creek RM 9-19 of Mill Creek RM 13-14 of Rickreall Creek RM 13-17 of the Little Luckiamute River RM 37-46 of the Luckiamute River Assumptions and Rationale 1. Over time, releases of catchable rainbow trout may be shifted to standing water bodies in
the subbasin. 2. The consumptive demand for trout is greater than natural production can provide in
accessible streams favored by anglers and close to population centers. 3. Additional angling opportunities can be provided through the release of hatchery rainbow. 4. An average of 4,450 angler days were recorded for Mill Creek during the 1974-77 and
1979 seasons (Moring and Youker 1979). 5. A total of 6,369 angler days were recorded for the Little Luckiamute River during a seven
week period in 1975 (Moring 1975). 6. The current level of hatchery releases provide harvest rates and returns to the angler
which satisfy angler demand. 7. Public access is available in these areas. 8. The fishery can be monitored with weekend car counts. 9. Harvest rate of catchable rainbow are thought to be at least 40% of the number released. Actions 3.1 Continue to release a maximum of 2,000 catchable rainbow in RM 5-9 of Agency Creek
and a maximum of 5,000 catchable rainbow in Mill Creek at RM 9-19 in the Yamhill River system.
3.2 Continue to release a maximum of 1,000 catchable rainbow in Rickreall Creek at RM 13-
14. 3.3 Continue to release a maximum of 5,000 catchable rainbow in the Little Luckiamute River
at RM 13-17.

52
3.4 Continue to release a maximum of 2,000 catchable rainbow in the Luckiamute River at RM 37-46.
3.5 Re-evaluate current angling pressure and harvest rates through creel studies on key
streams such as Mill Creek in the Yamhill system. Modify stocking practices as necessary to better meet angler demand.
3.6 If harvest rates fall below 40% then modify stocking practices such as release timing,
frequency, and sites to improve harvest rate. Objective 4. Provide angling opportunities for trout under the basic yield management
alternative for trout in unstocked reaches of the Coast Range subbasin. Assumptions and Rationale 1. The Trout Plan (ODFW 1987) sets management options for trout, one of which is Basic
Yield. These waters are managed to use their natural productivity to grow trout to a harvestable size.
2. The fisheries on these waters are of a general, consumptive nature. 3. Better life history information on cutthroat trout is needed to assess if current angling
regulations are adequate for protecting potamodromous and mon-migratory resident cutthroat.
4. Special regulations may be needed to protect wild populations. Actions 4.1 As part of the tagging study, monitor harvest rates of wild trout by requesting voluntary
return of tags by anglers. Key streams to monitor include Agency and Mill creeks in the Yamhill system and the Luckiamute River.
4.2 Develop criteria for further protection of cutthroat trout populations if needed. Objective 5. Maximize the harvest of hatchery rainbow trout. Assumptions and Rationale 1. Moring (1975) estimated harvest rates on Mill Creek and the Little Luckiamute were as
high as 75%. ODFW district personnel believe current harvest rates exceed 40%. 2. Angler catch rate of hatchery rainbow may be increased without increasing release
numbers. 3. Increased harvest would minimize the potential for competitive interaction between
hatchery rainbow and native cutthroat.

53
Actions 5.1 If harvest rate falls below 40%, determine how harvest rates can be increased by
modifying stocking schedules, release sites, and release numbers. Objective 6. Minimize the potentially negative effects of hatchery rainbow on the production and
genetic integrity of native trout, whitefish, and winter steelhead. Assumptions and Rationale 1. Hatchery fish are released in streams and rivers used by native trout and winter steelhead.
Hatchery trout may compete with native fish for food and habitat. 2. The increased angling effort brought about by releases of hatchery trout may increase the
harvest of native trout and steelhead. 3. Cape Cod stock is thought to contribute minimally to rainbow trout natural production in
the Coast Range subbasin. Actions 7.1 Consider marking hatchery trout to enable anglers to distinguish wild from hatchery trout. 7.2 Post signs at popular angling sites informing anglers about differences between native and
hatchery trout. 7.3 Continue to document hold over of hatchery rainbow during creel studies and use this
information to estimate the contribution of hatchery rainbow to natural production. 7.4 Continue to release Cape Cod stock unless it is determined that this practice is negatively
impacting cutthroat populations.

54
WARMWATER GAME FISH
Background and Status Origin Warmwater game fish are not native to the Coast Range subbasin. There is no documentation of the initial introductions of warmwater game fish in the subbasin. Movement of warmwater species introduced into the Willamette River and its larger tributaries has probably resulted in establishment of populations in the Coast Range subbasin. Largemouth bass and panfish have existed in standing and running waters in the Willamette basin since the 1800s. Life History and Population Characteristics Largemouth and smallmouth bass, black and white crappie, bluegill, pumpkinseed, warmouth, yellow perch, and brown bullhead are found in the lower reaches of the Yamhill, Luckiamute, and Marys rivers and in a slough near the mouth of Rickreall Creek. Bullfrogs are also found in the subbasin. Age I largemouth bass collected from the Yamhill River in 1979 had an average length of 2.9 inches (n=3), age II bass were 7.5 inches (n=1), and age III bass 11.6 inches (n=1) (unpublished data, ODFW). Size frequency of warmwater game fish electrosampled from the Yamhill and Luckiamute rivers is summarized in Tables 28-34.
Table 28. Size frequency of warmwater game fish electrosampled from the Yamhill River, 11 September 1973 (unpublished data, J. Haxton, ODFW, McMinnville, Oregon). ___________________________________________________________________________ No. of fish by one-inch size groups (F.L.) Speciesa 4 5 6 7 8 9 10 ___________________________________________________________________________ WC 1 5 2 Wm 1 2 1 1 BrB 1 1 YB 3 1 1 ___________________________________________________________________________ a WC = white crappie, Wm = warmouth, BrB = brown bullhead, YB = yellow bullhead.
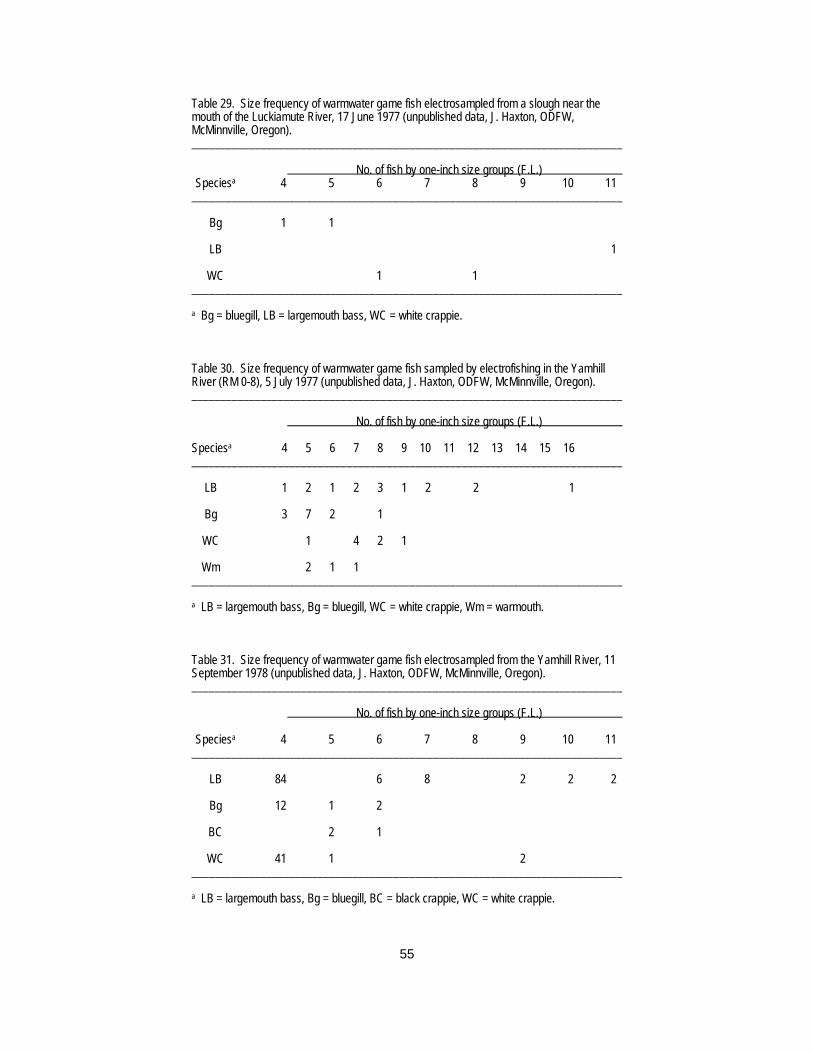
55
Table 29. Size frequency of warmwater game fish electrosampled from a slough near the mouth of the Luckiamute River, 17 June 1977 (unpublished data, J. Haxton, ODFW, McMinnville, Oregon). ___________________________________________________________________________ No. of fish by one-inch size groups (F.L.) Speciesa 4 5 6 7 8 9 10 11 ___________________________________________________________________________ Bg 1 1 LB 1 WC 1 1 ___________________________________________________________________________ a Bg = bluegill, LB = largemouth bass, WC = white crappie. Table 30. Size frequency of warmwater game fish sampled by electrofishing in the Yamhill River (RM 0-8), 5 July 1977 (unpublished data, J. Haxton, ODFW, McMinnville, Oregon). ___________________________________________________________________________ No. of fish by one-inch size groups (F.L.) Speciesa 4 5 6 7 8 9 10 11 12 13 14 15 16 ___________________________________________________________________________ LB 1 2 1 2 3 1 2 2 1 Bg 3 7 2 1 WC 1 4 2 1 Wm 2 1 1 ___________________________________________________________________________ a LB = largemouth bass, Bg = bluegill, WC = white crappie, Wm = warmouth. Table 31. Size frequency of warmwater game fish electrosampled from the Yamhill River, 11 September 1978 (unpublished data, J. Haxton, ODFW, McMinnville, Oregon). ___________________________________________________________________________ No. of fish by one-inch size groups (F.L.) Speciesa 4 5 6 7 8 9 10 11 ___________________________________________________________________________ LB 84 6 8 2 2 2 Bg 12 1 2 BC 2 1 WC 41 1 2 ___________________________________________________________________________ a LB = largemouth bass, Bg = bluegill, BC = black crappie, WC = white crappie.

56
Table 32. Size frequency of warmwater game fish electrosampled from the Yamhill River (RM 0-7), 14 August 1979 (unpublished data, J. Haxton, ODFW, McMinnville, Oregon). ___________________________________________________________________________ No. of fish by one-inch size groups (F.L.) Speciesa 4 5 6 7 8 9 10 11 ___________________________________________________________________________ BC 3 3 1 1 WC 3 1 3 7 4 2 1 1 Bg 1 1 Wm 2 1 2 YB 1 2 YP 1 ___________________________________________________________________________ a BC = black crappie, WC = white crappie, Bg = bluegill, Wm = warmouth, YB = yellow
bullhead, YP = yellow perch. Table 33. Size frequency of warmwater game fish electrosampled from a slough near the mouth of Rickreall Creek, 19 July 1988 (unpublished data, K. Daily, ODFW, Salem, Oregon). ___________________________________________________________________________ No. of fish by one-inch size groups (F.L.) Speciesa 2 3 4 5 6 7 8 9 10 ___________________________________________________________________________ LB 3 1 3 1 WC 2 1 Bg 1 BC 1 5 Pk 5 1 1 BrB 1 Wm 1 ___________________________________________________________________________ a LB = largemouth bass, WC = white crappie, Bg = bluegill, BC = black crappie, Pk =
pumpkinseed, BrB = brown bullhead, Wm = warmouth.

57
Table 34. Size frequency of warmwater game fish electrosampled in the Luckiamute Slough, 19 July 1988 (unpublished data, K. Daily, ODFW, Salem, Oregon). ___________________________________________________________________________________________
No. of fish by one-inch size groups (F.L.) Speciesa 1 2 3 4 5 6 7 8 9 10 11 12 13 14 15 16 ___________________________________________________________________________________________ LB 1 3 2 1 1 1 1 Bg 2 1 2 3 2 1 BC 1 5 Pk 1 BrB 1 Wm 1 ___________________________________________________________________________________________
a LB = largemouth bass, Bg = bluegill, BC = black crappie, Pk = pumpkinseed, BrB = brown bullhead, Wm = warmouth.
Hatchery Production Hatchery produced fish are used primarily to establish populations of warmwater game fish in the wild (ODFW 1987). Hatchery fish are obtained or reared for specific release programs. Largemouth bass, smallmouth bass, and channel catfish are either purchased or raised. Other species are captured and transplanted. There are no hatcheries or rearing facilities for warmwater game fish in the Coast Range subbasin. Hatchery fish are reared at St. Paul rearing ponds (see the Mainstem Willamette Plan). Warmwater game fish have been released in the Yamhill system (Table 35). Species released include largemouth bass, crappie, bullhead catfish, and channel catfish.

58
Table 35. Releases of warmwater game fish in running waters of the Coast Range subbasin (unpublished records, K. Daily, ODFW, Salem, Oregon). ___________________________________________________________________________ No. Site Date Speciesa released Size ___________________________________________________________________________ Yamhill River 1934 unknown 30,000 Yamhill River 1936 LB 13,000 crappie 22,000 bullhead 35,000 So. Yamhill R. 5-3-63 CC 4,880 3-20" Yamhill River 1977 CC 354 3-4" So. Yamhill R. 4-15-77 CC 256 8.4" Yamhill River 10-13-78 CC 1,100 3-4" ___________________________________________________________________________ a LB = largemouth bass, CC = channel catfish.
Angling and Harvest There is little angling pressure on warmwater species in running waters of the subbasin, and little is known of the overall species composition and catch. There has been moderate angling pressure on warmwater game fish in the lower Yamhill system which is navigable. There is bank access at RM 7 and boat access at RM 5. The South Yamhill has boat access at RM 5. Species caught most frequently are largemouth and smallmouth bass. Brown bullhead, crappie, bluegill, and yellow perch have also been harvested from the lower Yamhill (Willamette Basin Task Force 1969). The lower Rickreall has the potential to support a spring fishery for largemouth bass, bluegill, and crappie. The slough in the lower Luckiamute (RM 0-6) provides warmwater game fish to support a fishery. The bag limit for bass is 5 per day with no more than 3 over 15 inches. There is no bag limit for bluegill, catfish, crappie, other sunfish and yellow perch.
Management Considerations Sub-optimal water temperatures, lack of habitat, and competition with non-game fish constrain production of warmwater fish in the Coast Range subbasin.

59
There is no information concerning interactions between warmwater fish and native species in the Coast Range subbasin. Warmwater fish may impact native species through predation and competition. Warmwater fish are considered to be an underutilized resource in the Coast Range subbasin. Policies Policy 1. Any management proposals for warmwater game fish shall be reviewed and
evaluated for potential effects on indigenous fish species, especially cutthroat trout and Oregon chub.
Objectives Objective 1. Maintain populations of warmwater game fishes in running waters. Assumptions and Rationale 1. Little is known about warmwater game fish species presence, distribution, abundance, and
population characteristics in flowing waters of the Coast Range subbasin. 2. Monitoring the distribution and abundance of warmwater game fish populations in the
subbasins will provide an indication of population status. 3. Protection of existing warmwater populations can be achieved principally through habitat
protection and improvement. Actions 1.1 Inventory RM 0-7 of the Yamhill River, RM 0-5 of the South Yamhill, lower Rickreall Creek,
RM 0-6 of the Luckiamute, and the lower Marys River during the spring and summer for warmwater game fish population distribution and abundance.
1.2 On priority reaches, such as in the lower Yamhill system, where long-term data sets are
necessary to understand population dynamics, carry out routine sampling programs to determine the species composition, distribution, and population structure of warmwater game fish.
1.3 Implement habitat protection actions outlined under objectives for Habitat Protection.

60
Objective 2. Provide a diversity of warmwater angling opportunities through basic yield management.
Assumptions and Rationale 1. Basic yield management requires little intervention in natural processes affecting
production. 2. Running waters will be managed under general statewide regulations for warmwater game
fish. 3. Anglers will find variety in species and sizes. 4. Catch rates will be highly variable. Actions 2.1 While conducting monitoring activities and creel programs designed for other fish species,
collect data on the distribution, abundance, fishing pressure, and harvest of warmwater game fish.
2.2 Evaluate angling pressure, harvest rates, and angler satisfaction through tagging or creel
studies on key reaches and streams. Objective 3. Implement an evaluation of introducing channel catfish into the lower Yamhill River
and carry out the introduction if the evaluation is positive. Assumptions and Rationale 1. The potential exists for providing additional angling opportunity (and diversity) through an
active stocking program for channel catfish. 2. Angling opportunities for warmwater game fish species are limited at present. 3. Suitable habitat for channel catfish is available. 4. Channel catfish seldom, if ever, reproduce in the Willamette system. 5. Channel catfish would be restricted to the lower Yamhill River because of high upstream
water velocity and low temperature.
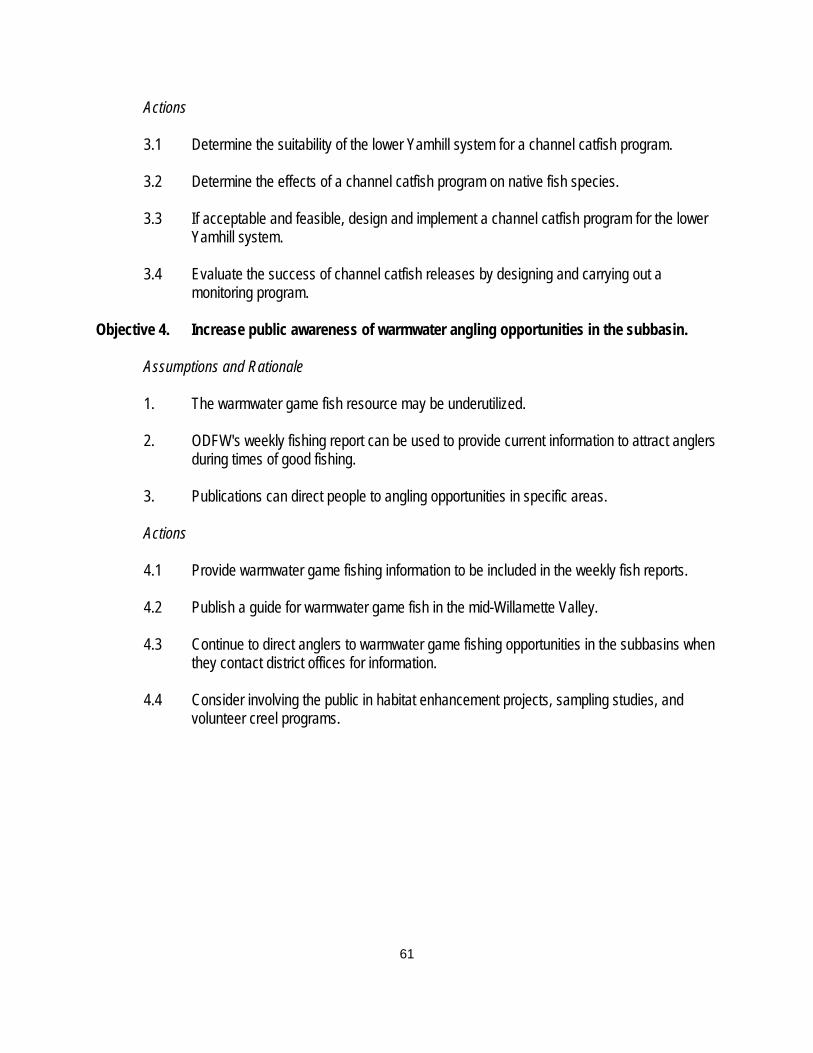
61
Actions 3.1 Determine the suitability of the lower Yamhill system for a channel catfish program. 3.2 Determine the effects of a channel catfish program on native fish species. 3.3 If acceptable and feasible, design and implement a channel catfish program for the lower
Yamhill system. 3.4 Evaluate the success of channel catfish releases by designing and carrying out a
monitoring program. Objective 4. Increase public awareness of warmwater angling opportunities in the subbasin. Assumptions and Rationale 1. The warmwater game fish resource may be underutilized. 2. ODFW's weekly fishing report can be used to provide current information to attract anglers
during times of good fishing. 3. Publications can direct people to angling opportunities in specific areas. Actions 4.1 Provide warmwater game fishing information to be included in the weekly fish reports. 4.2 Publish a guide for warmwater game fish in the mid-Willamette Valley. 4.3 Continue to direct anglers to warmwater game fishing opportunities in the subbasins when
they contact district offices for information. 4.4 Consider involving the public in habitat enhancement projects, sampling studies, and
volunteer creel programs.

62
OREGON CHUB
Background and Status Origin The Oregon chub is a small minnow historically recorded only from the Willamette and Umpqua basins in Oregon. The Willamette population is now considered to be genetically discrete from the Umpqua population, which will most likely be classified as separate species (Markle et al. 1990). Life History and Population Characteristics Oregon chub have been found in quiet waters such as sloughs and overflow ponds at low elevations in the Willamette valley (Dimick and Merryfield 1945). They prefer shallow, warm water with depositional substrates having abundant aquatic vegetation (Markle et al. 1990). Historical records show Oregon chub was found in the Little Luckiamute River (RM 8) and in a beaver pond in the Gray Creek tributary of Muddy Creek in the Marys River drainage (Markle et al. 1990). Currently, the distribution of Oregon chub in the Coast Range is thought to be restricted to a small pond upstream of the Beaver Pond in the Gray Creek system at Finley Wildlife Refuge (person communication on 22 October 1990 from D. Markle, OSU Department of Fisheries and Wildlife, Corvallis, Oregon). The Oregon chub spawns in the spring and early summer (Markle et al. 1990). Spawning occurs in aquatic vegetation. Fecundity of females taken from Shady Dell Pond in the upper Willamette basin ranged from 147 to 671 (Markle et al. 1990). Oregon chub feed primarily on zooplankton and midge larvae (Markle et al. 1990). Hatchery Production There is no hatchery production of Oregon chub. Fish captured for introductions into new sites may be held for a short period of time in isolated ponds at the St. Paul rearing facilities (see the mainstem Willamette plan). It is more likely that they would be transferred directly to re-introduction sites.
Management Considerations Although the Oregon chub is not presently on the federal list of threatened or endangered species, it is on the Federal Register as a category 2 species. More information is needed regarding its status. Markle and Pearsons (1990) have submitted a petition to list the Oregon chub as an endangered species. The Oregon chub is currently listed by the state as a sensitive species due to a decline in its distribution and abundance in the Willamette Valley. Sensitive species have been granted protection. The Oregon chub should be given a high priority with respect to future management activities in the Willamette basin.

63
The apparent decline of the Oregon chub in the Willamette valley correlates with the construction of dams and flood control projects. Historically large rivers had braided channels with numerous secondary side channels and wetlands. During winter and spring flooding events, Oregon chub could have been widely dispersed in the flood plain to pond and slough habitats where spawning and juvenile rearing would take place. With recent flood control projects, channelization of rivers and streams, and loss of backwaters, sloughs, and ponds, the dispersal opportunities and available habitat for Oregon chub is now greatly reduced. Oregon chub may also be vulnerable to predation by introduced fish species such as bass. Introduced warmwater game fish are often the dominant inhabitants of quiet waters along lower reaches of Coast Range rivers. They are probably a major detriment to recolonization, if not the cause of the decline of the Oregon chub in the subbasin.
Objectives Objective 1. Protect and enhance existing populations of Oregon chub in the Coast Range
subbasin. Assumptions and Rationale 1. Oregon chub have been identified by the state as a protected species. This objective
addresses some of the problems with this species. 2. A small population of Oregon chub currently exists in a beaver pond in the Gray Creek
drainage. 3. Additional populations may exist in the subbasin. 4. Protection of critical habitat is necessary to avoid further declines in abundance and
distribution. 5. Oregon chub populations may be vulnerable to predation and competition from introduced
fish species such as bass. 6. Many of the following actions cannot be accomplished under current levels of funding. If
funding continues to be limiting, ODFW will pursue actions according to priority as funds become available.

64
Actions 1.1 Survey likely habitat in the Coast Range subbasin to identify undocumented Oregon chub
populations. 1.2 Discourage introductions of fish species that may negatively impact the recovery of
Oregon chub populations in the Willamette basin. 1.3 Identify and implement habitat protection and improvement measures for Oregon chub at
the beaver pond on Finley Wildlife Refuge. 1.4 Periodically assess chub population status at the beaver pond on Finley Wildlife Refuge. 1.5 Implement habitat protection measures at additional sites where Oregon chub may be
found. Objective 2. Establish new populations of Oregon chub in isolated waters in the Coast Range
subbasin where possible. Assumptions and Rationale 1. Oregon chub have been identified by the state as a protected species. This objective
addresses some of the problems with this species. 2. A preliminary list of introduction sites prepared by an interagency task force has identified
four sites as potentially suitable for introductions of Oregon chub in the subbasin (ODFW et al. 1990). Further investigation and review may identify additional sites.
3. Introductions will be confined to the historic distribution of the Oregon chub. 4. Introductions will be restricted to small ponds isolated from floodwaters having
depositional substrate, gradually sloping banks, varied aquatic vegetation, little or no water velocity, a depth of less than 6 feet, summer water temperatures exceeding 64o F, and no predators, competitors, or a high probability of other fish being introduced that would be detrimental to the Oregon chub.
5. Introductions of Oregon chub will be approved through the ODFW stocking policy review
process. 6. If the Oregon chub is added to the federal list of threatened or endangered species, then
ODFW will be required to apply for a permit from the U.S. Fish and Wildlife Service and comply with the Section 7 consultation process before reintroducing new populations.

65
7. Many of the following actions cannot be accomplished under current levels of funding. If funding continues to be limiting, ODFW will pursue actions according to priority as funds become available.
Actions 2.1 Evaluate the following potential sites for introductions: Ponds at Baskett Slough Cronemiller Lake Ponds at Finley Wildlife Refuge Luckiamute Pond 2.2 Identify and evaluate other potential sites in isolated waters in the subbasin for
introductions. 2.3 Stock Oregon chub in selected, appropriate sites according to Guidelines for Re-
introducing Oregon chub into their Historic Range (ODFW et al. 1990). 2.4 Conduct systematic monitoring of introduced populations and determine the success of
the re-introductions. 2.5 Develop criteria to define a successful introduction of Oregon chub. 2.6 Determine the causes of unsuccessful introductions. 2.7 Restock sites if warranted. Objective 3. Promote greater public understanding and appreciation of the status of Oregon
chub. Assumptions and Rationale 1. The status and importance of the Oregon chub is recognized by only a small portion of the
general public. Actions 3.1 Publicize efforts taken and their rationale for protecting and enhancing populations of
Oregon chub. 3.2 Educate anglers and angling groups about the status of the Oregon chub and the risks of
introducing exotic species into potential Oregon chub habitat.

66
SAND ROLLERS
Background and Status Origin The sand roller, Percopsis transmontana, a member of the trout-perch family, is native to the Columbia River and its tributaries, including the Willamette. It is currently listed as a stock of concern statewide. Populations are suspected of being at low levels, but its exact status is unknown. The sand roller should be given a high priority with respect to future population and habitat inventory and monitoring activities in the Coast Range subbasin. Life History and Population Characteristics Sand rollers are generally found in low gradient reaches of rivers and streams. During daylight hours they hide among large submergent objects such as root wads and under banks. At night they move out in small schools to feeding areas over sandy substrates (personal communication on 23 October 1990 from P. Reimers, ODFW, Charleston, Oregon). Because of their secretive nature during the day, sand rollers often go uncollected during routine stream sampling. Current records for the subbasin may underestimate their distribution. Sand rollers have been collected from all major stream systems in the Coast Range subbasin (Table 36). Sand rollers collected from the Columbia River ranged in age from 1 to 6 years (Gray and Dauble 1979). Sand rollers usually attain sexual maturity at age II. All fish are mature by age III. Gravid females were collected from sites in the Columbia River from June through mid-July (Gray and Dauble 1979). Females collected from January through July contained 1,106 to 3,369 eggs. Carlander (1969) reports that a single female contained 4,748 eggs. Spawning occurs in the Columbia River in midsummer when water temperatures range from 57-61o F (Gray and Dauble 1979). Emergent fry were collected in mid-August in the Columbia River. Larger fry were collected in mid-September. Aquatic insects are the main food of sand rollers. Zooplankton may contribute a greater portion of the diet of immature fish (Gray and Dauble 1979).

67
Table 36. Records of sand rollers collected from rivers and streams in the Coast Range subbasin (unpublished data, J. Haxton, ODFW, McMinnville, Oregon and D. Markle, Oregon State University, Dept. of Fisheries and Wildlife, Corvallis, Oregon). ___________________________________________________________________________________________ Density Stream Location Date (#/100 ft) Comments ___________________________________________________________________________________________ Yamhill R. No. Yamhill R. RM 19.7 7-27-79 Numbers not indicated So. Yamhill R. Cosper Cr. RM 0.4 9-20-83 1 sand roller Rowell Cr. RM 1.6 9-21-83 1.6 Rickreall Cr. RM 8.5 9-17-54 OSU data Luckiamute R. Soap Cr. RM 5.3 8-11-82 2.4 U.S.E.P.A. data 9-23-82 0.6 " Pedee Cr. RM 0.6 9-1-87 Numbers not indicated Ritner Cr. RM 0.7 8-31-87 Numbers not indicated Marys R. RM 12.0 10-1-76 OSU data RM 24.0 10-25-63 " 5-17-67 " 6-4-67 " 10-2-76 " RM 25.0 4-15-64 " 12-3-67 " RM 31.0 6-22-78 " RM 33.0 7-5-63 " RM 39.0 1983 U.S.E.P.A. data Greasy Cr. RM 0.5 7-5-79 Numbers not indicated 9-28-83 0.5 RM 1.3 9-14-87 Numbers not indicated Tumtum R. RM 6.9 7-18-79 Numbers not indicated ___________________________________________________________________________________________
Hatchery Production There is no hatchery production of sand rollers in Oregon. Angling and Harvest Sand rollers are a non-game fish. There are no harvest regulations for sand rollers. There are no records of harvest of sand rollers in the Coast Range subbasin.
Management Considerations Sand rollers may be susceptible to habitat degradation and water diversions found in lower reaches of rivers and streams in the subbasin. Channelization of rivers and streams and removal of riparian vegetation reduces the structural complexity required by sand rollers.

68
Objectives Objective 1. Determine the distribution, relative abundance, and habitat use of sand rollers in the
Coast Range subbasin. Assumptions and Rationale 1. Sand rollers have been identified as a stock of concern statewide. This objective
addresses some of the problems with this stock. 2. The subbasin supports sand roller populations. 3. Determining the distribution and relative abundance of populations of sand rollers will
provide an indication of their health. 4. Information on the distribution and habitat use of sand rollers in the subbasin is necessary
in order to implement habitat protection actions. 5. Many of the following actions cannot be accomplished under current levels of funding. If
funding continues to be limiting, ODFW will pursue actions according to priority as funds become available.
Actions 1.1 While conducting routine inventory for other fish species, collect more detailed data for
sand rollers when present. 1.2 Use inventory data to determine the relative abundance of sand rollers in rivers and
streams of the Coast Range subbasin. 1.3 Use inventory data to determine the habitat requirements of sand rollers in the Coast
Range subbasin. Objective 2. Protect, restore, and enhance sand rollers habitat. Assumptions and Rationale 1. Sand rollers have been identified as a stock of concern statewide. This objective
addresses some of the problems with this stock. 2. Protection and enhancement of sand roller populations can be achieved principally
through habitat protection and improvement.
69
Actions 2.1 Advocate riparian protection for river and stream reaches containing sand rollers. 2.2 Develop habitat improvement plans where needed. 2.3 Work with volunteers, landowners, and agencies to implement habitat improvement
projects in stream reaches used by sand rollers. 2.4 Implement habitat protection actions outlined under objectives for Habitat Protection.

70
CRAYFISH
Background and Status Origin Three species of crayfish are native to Oregon (Hobbs 1976). These species, their subspecies and intergrades are spread statewide, with overlapping distributions. An introduced species found in the Rogue River is not known to occur in the Willamette or its tributary subbasins, including the Coast Range. Life History and Population Characteristics Crayfish breed in the summer, with the first egg-bearing females appearing as early as September. Eggs are carried over the winter and hatch late April to late June. The young are attached to the female by a thread-like material for a short time. Size achieved by zero-age crayfish during the first summer is quite variable due to the long period over which eggs hatch. Age determination by the length-frequency method is extremely difficult. Females mature at about 18-30 months. Fecundity increases with size and perhaps age. There is evidence to suggest that some or perhaps all females do not breed each year. Hatchery Production There is no hatchery production of crayfish in the Coast Range subbasin. No commercial crayfish culture operations have yet been successful in the state. Harvest Crayfish have been fished commercially in Oregon since before 1893, when records were first kept. Markets for bait and for restaurant food dictate the size of landings. Most of the Willamette basin harvest occurs in Multnomah, Clackamas, and Yamhill counties (unpublished data, ODFW, Portland, Oregon). Harvest of crayfish from the Yamhill River contribute to landings recorded for Yamhill County. Commercial harvest also occurs in the Luckiamute River. There are no estimates of commercial landings specifically for rivers and streams in the Coast Range subbasin. The commercial crayfish season is open from April 1 through October 31. Crayfish may be taken only by crayfish pots or ring nets. Only crayfish 3-5/8 inches or longer in length may be taken. Undersized crayfish must be returned unharmed to the water. Any crayfish caught with eggs attached must be returned unharmed to the water. Gear must be labeled with an identification number issued by ODFW.

71
Recreational use of the resource is widespread for bait and direct consumption. No license is required to take crayfish. The daily bag limit is 100 per person. The season is open the entire year at all hours. Estimates of sport harvest levels in the Coast Range subbasin are unavailable.
Management Considerations Crayfish are the most important freshwater invertebrate to Oregon's fisheries. They provide for both commercial and recreation fisheries in the Coast Range subbasin. They are also important fish forage. Water pollution, particularly pesticides and some industrial wastes, and flow depletions are the most serious threats to crayfish populations.
Objectives Objective 1. Assess the population status and commercial harvest of crayfish in the Coast
Range subbasin. Assumptions and Rationale 1. Presently, commercial catch information is reported only by date and county. 2. Information should be collected for the most heavily fished waters. 3. Data can be collected at reasonable cost from commercial operators. Actions 1.1 While conducting routine surveys, determine size and relative abundance of crayfish. 1.2 Require commercial harvesters to use a logbook to record effort and catch for all crayfish
harvest. Objective 2. Determine the size and importance of the recreational crayfish harvest in the Coast
Range subbasin. Assumptions and Rationale 1. Currently there is no measure of the impact of the recreational harvest or the fishery
potential of crayfish. 2. There are no estimates of current harvest or effort.

72
3. Recreational harvest is widespread and appears to be increasing. Actions 2.1 While conducting routine surveys, determine the size and relative abundance of crayfish. 2.2 Conduct creel studies in key areas to evaluate harvest and effort.

73
ANGLING ACCESS
Background and Status The Oregon State Land Board has recommended that the mainstem Yamhill River from its mouth to RM 8.3 at Lafayette be declared navigable based on historical use of the river for log drives and vessel navigation (Oregon State Land Board 1983). The Land Board has recognized that the Yamhill River from RM 8.5 to 11.2, the North Fork Yamhill from its mouth to RM 27, Willamina Creek from its mouth to RM 8.8, the South Fork Yamhill from its mouth to RM 6, the Luckiamute River from its mouth to RM 18, and the Marys River from its mouth to RM 22 show evidence of navigability based on historical use. The state legislature may exercise its full right to declare these river reaches navigable, although in the past only river reaches that had navigable use and were also meandered have been recommended. The Yamhill River currently has boat access at the Dayton Boat Ramp (RM 5). Boat access sites are needed at RM 14 and 20 on the North Yamhill for the winter steelhead fishery. Bank access is needed on the North Yamhill from Pike (RM 21) to the Flying M Ranch (RM 27) for steelhead and trout angling. The South Yamhill River currently has boat access at the Kiwanis Marine Park in McMinnville (RM 6) and at Monroe Landing (RM 20). An additional site is needed between RM 6 and 20 for winter steelhead and warmwater game fish angling. Boat access is also needed at RM 45 and 51 for winter steelhead angling. Further investigation is needed to determine if the potential for additional boat angling for winter steelhead on Rickreall Creek could be enhanced by developing or improving access from RM 5 to Ellendale (RM 17). Future development of boat access sites on the Luckiamute River between RM 28 and 44 may be needed as public pressure for winter steelhead and cutthroat trout angling increases. Bank angling access for trout on the Marys River could be improved on the reach between Harris (RM 27) and Blodgett (RM 32).
Policies Policy 1. The Department shall seek to provide access for boat and bank angling that will
satisfy public need for a variety of angling opportunities and a dispersion of angling effort throughout the subbasin.
Policy 2. Acquisition and development of angler access sites shall be consistent with
guidelines and objectives for management of fish species and habitat.
74
Objectives Objective 1. Provide and maintain 1 permanent boat access site on the Yamhill River, 2
permanent sites on the North Yamhill River, 5 permanent sites on the South Yamhill River, 2 permanent sites on Rickreall Creek, and 2 permanent sites on the Luckiamute River.
Assumptions and Rationale 1. It is necessary to work with other agencies, public groups and private landowners to
provide and maintain access sites. 2. Boat anglers primarily use the rivers for day-trips. Consequently, access sites need to be
relatively close together. 3. Some boat access sites are poorly maintained or are in need of improved or expanded
facilities. 4. Additional sites are needed on the North Yamhill, South Yamhill, Rickreall, and
Luckiamute rivers. 5. Many of the following actions cannot be accomplished under current levels of funding. If
funding continues to be limiting, ODFW will pursue actions according to priority as funds become available.
Actions 1.1 Acquire and develop boat access sites on the North Yamhill River at RM 14 and at RM 20. 1.2 Acquire and develop a boat access site on the South Yamhill River between RM 6 and 20. 1.3 Acquire and develop boat access sites on the South Yamhill River at RM 45 and at RM
51. 1.4 Acquire and develop boat access sites on Rickreall Creek between RM 5 and RM 17. 1.5 Develop a boat access site on Rickreall Creek at the town of Rickreall. 1.6 Acquire and develop boat access sites on the Luckiamute River between RM 28 and 44.

75
Objective 2. Increase bank angling access in the Coast Range subbasin where possible. Assumptions and Rationale 1. It is necessary to work with other agencies, public groups and private landowners to
provide and maintain access sites. 2. Additional bank angling access would increase angling opportunities. 3. Much of the shoreline along Coast Range rivers and streams is privately owned. 4. Private landowners often attempt to prevent public access on their property. Actions 2.1 Acquire sites for bank angling access on the North Yamhill between RM 21 and RM 27. 2.2 Acquire sites for bank angling access on Marys River between RM 27 and RM 32. 2.3 Identify additional potential sites for bank angling access on rivers and streams in the
Coast Range subbasin. 2.4 Acquire additional sites for bank angling where desirable. 2.5 Develop incentives to encourage private landowners to allow public access and to
encourage anglers to respect property rights.

76
PLAN ADOPTION AND REVIEW The Coast Range Plan should not be viewed as the final statement on the management of the fish and fisheries in the subbasin. Planning is a continuing process. As conditions of the resources and desires of the public change and as new information is obtained, the plan must be responsive and evolve as well. The Coast Range Plan will be rewritten as needed and presented to a public advisory committee. The final draft will be presented to the Fish and Wildlife Commission for adoption. Every 2 years public meetings will be held to review progress made in implementing the plan. These meetings are intended to provide an opportunity for the public to comment on management direction and progress. This review will precede the preparation of ODFW's biennial budget, which is submitted to the legislature for funding. This plan is intended to provide both long-term and short-term direction for management of the fisheries in the subbasin. As conditions for the resources and desires of the public change and as new information is obtained, the plan must be responsive and evolve as well. Upon adoption by the Oregon Fish and Wildlife Commission, the policies and objectives will become Oregon Administrative Rules. Revision of these rules requires action by the Commission. The entire plan, including policies and objectives, will be formally reviewed and revised every 5 years. Emergency changes in administrative rules can be made by the Commission in accordance with the Administrative Procedures Act when needed. Progress made implementing the actions in the plan will be reported by the Department every 2 years. At that time, implementation priorities will also be reexamined and adjustments made where necessary.

77
PRIORITY OF ACTIONS The Coast Range Subbasin Fish Management plan proposes many actions, more than can be completed within existing budgets. Some actions are currently on-going actions of ODFW and only need to be continued or modified. Other actions are new and need funding before they can be implemented. In order to achieve the objectives of this plan within ODFW's budgetary and staff limitations, priorities for funds and effort must be identified. High priority actions were identified for habitat protection, species or species groups, and access (Table 37). These priorities reflect what ODFW and the citizens advisory committee believe are the most important actions that should be addressed in the Coast Range Subbasin Fish Management Plan. The first 3 actions identified in Table 37 are habitat protection actions which affect more than a single stock or species of fish. The current funding status for each action is indicated. A "yes" in the currently funded column denotes that funding for that action is presently budgeted under existing programs, however current funding may not be adequate. If additional funds are needed, it is noted in the next column. Table 37. High priority actions in the Coast Range subbasin Fish Management Plan and funding status. ______________________________________________________________________________ Currently Actions funded Remarks on funding status ______________________________________________________________________________ Reduce the impacts of timber harvest activities on fish production
Yes Included in base budget
Reduce the impacts of agricultural, residential, and commercial development on fish production
Yes Included in base budget
Maintain or improve upstream and downstream passage for fish
No Additional funding needed for inventory of problem culverts
Monitor natural production of winter steelhead in the subbasin
No Additional funding needed to expand current surveys
Protect and enhance the productivity of wild trout
No Partially funded by base budget; additional funding needed for surveys and research investigations
______________________________________________________________________________ (continued)
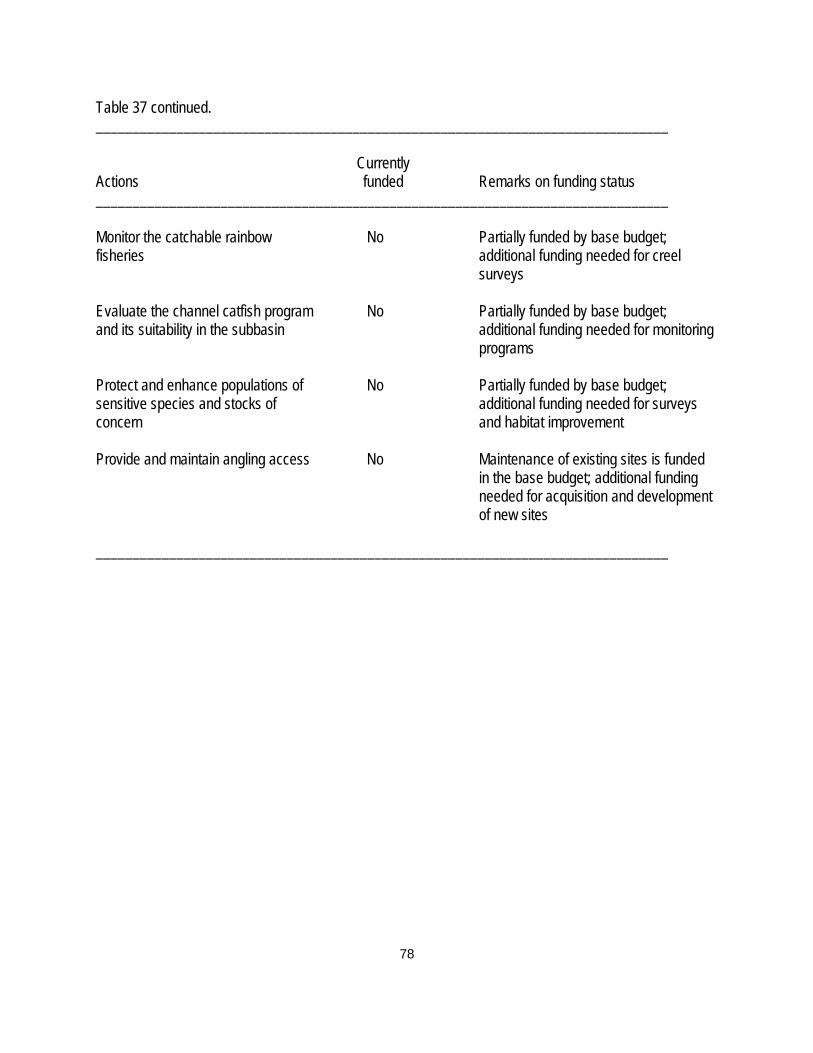
78
Table 37 continued. ______________________________________________________________________________ Currently Actions funded Remarks on funding status ______________________________________________________________________________ Monitor the catchable rainbow fisheries
No Partially funded by base budget; additional funding needed for creel surveys
Evaluate the channel catfish program and its suitability in the subbasin
No Partially funded by base budget; additional funding needed for monitoring programs
Protect and enhance populations of sensitive species and stocks of concern
No Partially funded by base budget; additional funding needed for surveys and habitat improvement
Provide and maintain angling access No Maintenance of existing sites is funded in the base budget; additional funding needed for acquisition and development of new sites
______________________________________________________________________________

79
REFERENCES Baldwin, E.W. 1976. Geology of Oregon. Kendall/Hunt Publishing Company, Dubuque, Iowa. Bottom, D.C., P.J. Howell and J.D. Rodgers. 1985. The effects of stream alterations on salmon and trout
habitat in Oregon. Oregon Department of Fish and Wildlife, Portland, Oregon. Burroughs, E.R., G.R. Chalfant, M.A. Townsend. 1973. Guide to reduce road failures in western Oregon.
Bureau of Land Management, Portland, Oregon. Carlander, K.D. 1969. Handbook of Freshwater Fishery Biology, Volume I. Iowa State University Press,
Ames, Iowa. Columbia Basin Fish and Wildlife Authority. 1990. Integrated System Plan for Salmon and Steelhead
Production in the Columbia River Basin, public review draft. Columbia Fish and Wildlife Authority, Portland, Oregon.
Dimick, R.E. and F. Merryfield. 1945. The fishes of the Willamette River system in relation to pollution.
Oregon State College Engineering Expt. Sta., Corvallis, Oregon. No. 19, pp. 7-55. Ely, C. 1981. Wild trout inventory, 1979. Information Report Series, Fisheries No. 81-6. Oregon
Department of Fish and Wildlife, Portland, Oregon. Gibbons, R.G., P.K.J. Hahn, T.H. Johnson. 1985. Methodology for determining MSY steelhead spawning
escapement requirements. Washington State Game Department, Fisheries Management Division, Report 85-11.
Gray, R.H. and D.D. Dauble. 1979. Biology of the sand roller in the central Columbia River. Trans. Amer.
Fish. Soc. 108: 646-649. Hansen, H.L. 1977. Stock assessment and enhancement of fall salmon species in the Willamette River
system. Federal Aid Progress Reports, Fisheries. Oregon Department of Fish and Wildlife. Hansen, H.L. 1978. Stock assessment and enhancement of fall salmon species in the Willamette River
system. Federal Aid Progress Reports, Fisheries. Oregon Department of Fish and Wildlife. Hansen, H.L. and R.H. Williams. 1979. Stock assessment and enhancement of fall salmon species in the
Willamette River system. Federal Aid Progress Reports, Fisheries. Oregon Department of Fish and Wildlife.
Hobbs, Jr., H. H. 1976. Crayfishes (Astacidae) of North and Middle America. U.S.E.P.A. Water Pollution
Control Research Series 18050 ELDO5/72.
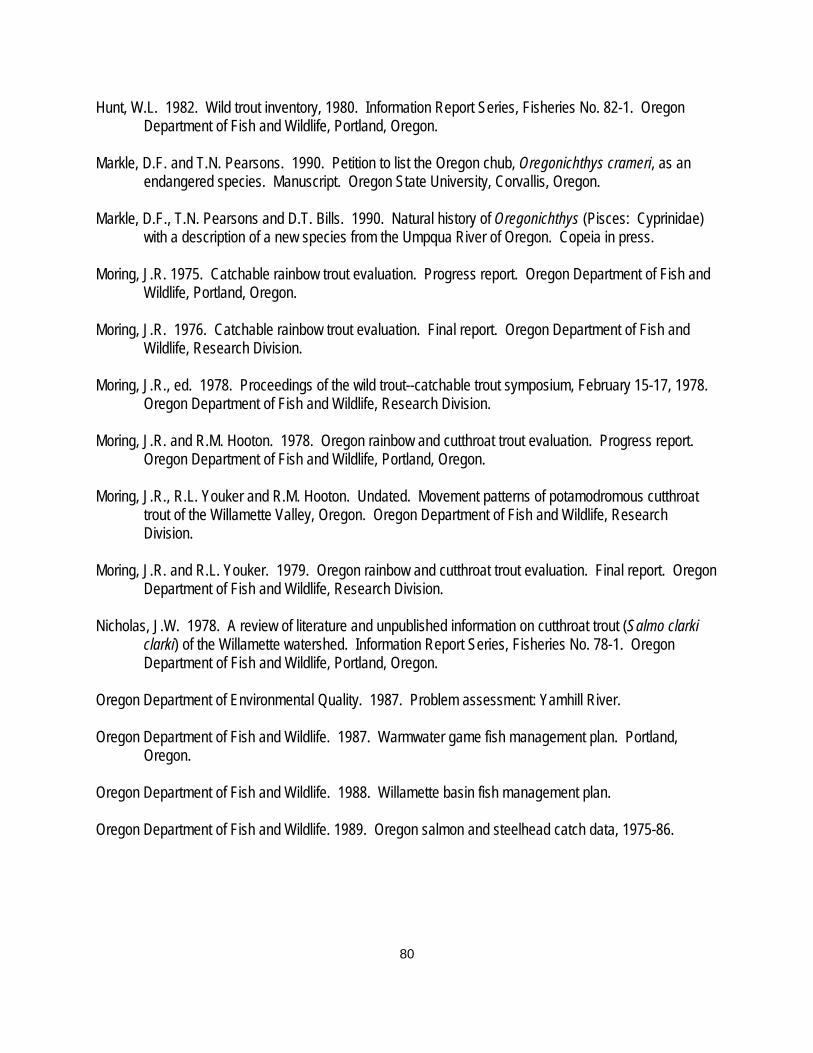
80
Hunt, W.L. 1982. Wild trout inventory, 1980. Information Report Series, Fisheries No. 82-1. Oregon Department of Fish and Wildlife, Portland, Oregon.
Markle, D.F. and T.N. Pearsons. 1990. Petition to list the Oregon chub, Oregonichthys crameri, as an
endangered species. Manuscript. Oregon State University, Corvallis, Oregon. Markle, D.F., T.N. Pearsons and D.T. Bills. 1990. Natural history of Oregonichthys (Pisces: Cyprinidae)
with a description of a new species from the Umpqua River of Oregon. Copeia in press. Moring, J.R. 1975. Catchable rainbow trout evaluation. Progress report. Oregon Department of Fish and
Wildlife, Portland, Oregon. Moring, J.R. 1976. Catchable rainbow trout evaluation. Final report. Oregon Department of Fish and
Wildlife, Research Division. Moring, J.R., ed. 1978. Proceedings of the wild trout--catchable trout symposium, February 15-17, 1978.
Oregon Department of Fish and Wildlife, Research Division. Moring, J.R. and R.M. Hooton. 1978. Oregon rainbow and cutthroat trout evaluation. Progress report.
Oregon Department of Fish and Wildlife, Portland, Oregon. Moring, J.R., R.L. Youker and R.M. Hooton. Undated. Movement patterns of potamodromous cutthroat
trout of the Willamette Valley, Oregon. Oregon Department of Fish and Wildlife, Research Division.
Moring, J.R. and R.L. Youker. 1979. Oregon rainbow and cutthroat trout evaluation. Final report. Oregon
Department of Fish and Wildlife, Research Division. Nicholas, J.W. 1978. A review of literature and unpublished information on cutthroat trout (Salmo clarki
clarki) of the Willamette watershed. Information Report Series, Fisheries No. 78-1. Oregon Department of Fish and Wildlife, Portland, Oregon.
Oregon Department of Environmental Quality. 1987. Problem assessment: Yamhill River. Oregon Department of Fish and Wildlife. 1987. Warmwater game fish management plan. Portland,
Oregon. Oregon Department of Fish and Wildlife. 1988. Willamette basin fish management plan. Oregon Department of Fish and Wildlife. 1989. Oregon salmon and steelhead catch data, 1975-86.

81
Oregon Department of Fish and Wildlife. 1990. Willamette River Subbasin Salmon and Steelhead Plan, Molalla and Pudding Rivers. Columbia Basin Fish and Wildlife Authority, Portland, Oregon.
Oregon Department of Fish and Wildlife, Oregon State University Fisheries and Wildlife Department, and
Willamette National Forest. 1990. Conservation agreement for the Oregon chub in the Willamette Valley, Oregon. Draft report.
Oregon Department of Water Resources. 1961. Middle Willamette drainage basin map: average annual
precipitation. Oregon Department of Water Resources. 1967. Willamette River basin. Salem, Oregon. Oregon Department of Water Resources. 1980. Middle Willamette drainage basin map: land use. Oregon Department of Water Resources. 1985. Update: Middle Willamette River basin plan. Oregon State Land Board. 1983. Report and recommendation on the navigable waters of Oregon.
Division of State Lands, Salem, Oregon. Polk County Department of County Development. 1978. Background report: natural resources. Reiser, D.W. and T.C. Bjornn. 1979. Influence of forest and rangeland management on anadromous fish
habitat in the western United States and Canada. W.R. Meehan. ed. USDA Forest Service General Technical Report PNW-96.
Sedell, J.R., and K.J. Luchessa. 1981. Using the historical record as an aid to salmonid habitat
enhancement. USFS, Forestry Sciences Laboratory, Corvallis, Oregon, USA. Willamette Basin Task Force. 1969. The Willamette basin, comprehensive study of water and related land
resources. Appendix D. Fish and Wildlife. Pacific Northwest River Basins Commission. Williams, R. 1983a. Coho salmon in the upper Willamette River, Oregon. A history of establishing a run of
non-indigenous salmon and prospects for renewed efforts to increase the run. (Draft). Oregon Department of Fish and Wildlife.
Williams, R. 1983b. Releases of coho salmon into the upper Willamette River, Oregon. Oregon
Department of Fish and Wildlife. Internal Report 833. Willis, R.A., M.D. Collins, R.E. Sams. 1960. Environmental survey report pertaining to salmon and
steelhead in certain rivers of eastern Oregon and the Willamette River and its tributaries. Part II. Survey reports of the Willamette River and its tributaries. Fish Commission of Oregon, Research Division, Clackamas, Oregon.

82
APPENDICES

83
APPENDIX A Winter Steelhead
Table A-1. Releases of winter steelhead into the Coast Range subbasin, 1964-87 (ODFW, unpublished data). Brood Release Number year year Stock (hatchery)a releasedb Release location 1964 1964 Unknown 109,065 (f) So. Yamhill R. 1964 1965 Big Creek (BC) 17,658 (y) So. Yamhill R. 1964 1964 Alsea 230 (a) Mill Cr. 1964 1965 Big Creek (BC) 18,900 (y) Willamina Cr. 1964 1965 Unknown (S) 7,392 (y) Agency Cr. 1965 1966 Big Creek (BC) 13,583 (y) No. Yamhill R. 1965 1966 Big Creek (BC) 10,440 (y) So. Yamhill R. 1965 1966 Big Creek (BC) 12,784 (y) Mill Cr. 1965 1966 Big Creek (BC) 9,935 (y) Willamina Cr. 1965 1966 Big Creek (BC) 8,175 (y) Agency Cr. 1966 1967 Big Creek (BC) 10,875 (y) No. Yamhill R. 1966 1966 Big Creek (BC) 232 (a) No. Yamhill R. 1966 1967 Big Creek (BC) 10,141 (y) Mill Cr. 1966 1967 Big Creek (BC) 10,141 (y) Agency Cr. 1967 1967 Big Creek (K) 402 (a) No. Yamhill R. 1967 1968 Big Creek (BC) 10,577 (y) No. Yamhill R. 1967 1967 Big Creek (K) 202 (a) So. Yamhill R. 1967 1967 Big Creek (BC) 300 (a) Mill Cr. 1967 1968 Big Creek (K) 5,578 (y) Mill Cr. 1967 1967 Big Creek (BC) 300 (a) Willamina Cr. 1967 1968 Big Creek (K) 5,320 (y) Willamina Cr. 1967 1967 Big Creek (K) 236 (a) Willamina Cr. 1967 1967 Big Creek (K) 212 (a) Cosper Cr. 1967 1968 Big Creek (K) 5,320 (y) Agency Cr. 1967 1967 Big Creek (K) 446 (a) Agency Cr. 1967 1967 Big Creek (K) 232 (a) Luckiamute R. 1968 1968 Big Creek (K) 200 (a) No. Yamhill R. 1968 1968 Big Creek (K) 175 (a) Mill Cr. 1968 1968 Big Creek (K) 168 (a) Willamina Cr. 1968 1968 Big Creek (BC) 180 (a) Willamina Cr. 1968 1968 Big Creek (BC) 160 (a) Agency Cr. 1968 1968 Big Creek (K) 200 (a) Luckiamute R. 1968 1968 Big Creek (K) 200 (a) L. Luckiamute R. 1968 1968 Alsea (A) 130 (a) L. Luckiamute R. 1968 1968 Big Creek (K) 200 (a) Greasy Cr. 1968 1968 Big Creek (K) 201 (a) Shotpouch Cr. 1969 1969 Big Creek (BC) 200 (a) Mill Cr. 1969 1969 Big Creek (BC) 238 (a) Willamina Cr. 1969 1969 Big Creek (K) 206 (a) Agency Cr. 1969 1969 Big Creek (BC) 208 (a) Rickreall Cr. 1969 1969 Big Creek (K) 204 (a) Luckiamute R. 1969 1969 Big Creek (K) 209 (a) L. Luckiamute R. 1969 1969 Big Creek (BC) 200 (a) Pedee Cr. 1969 1969 Big Creek (BC) 200 (a) Shotpouch Cr. (continued)
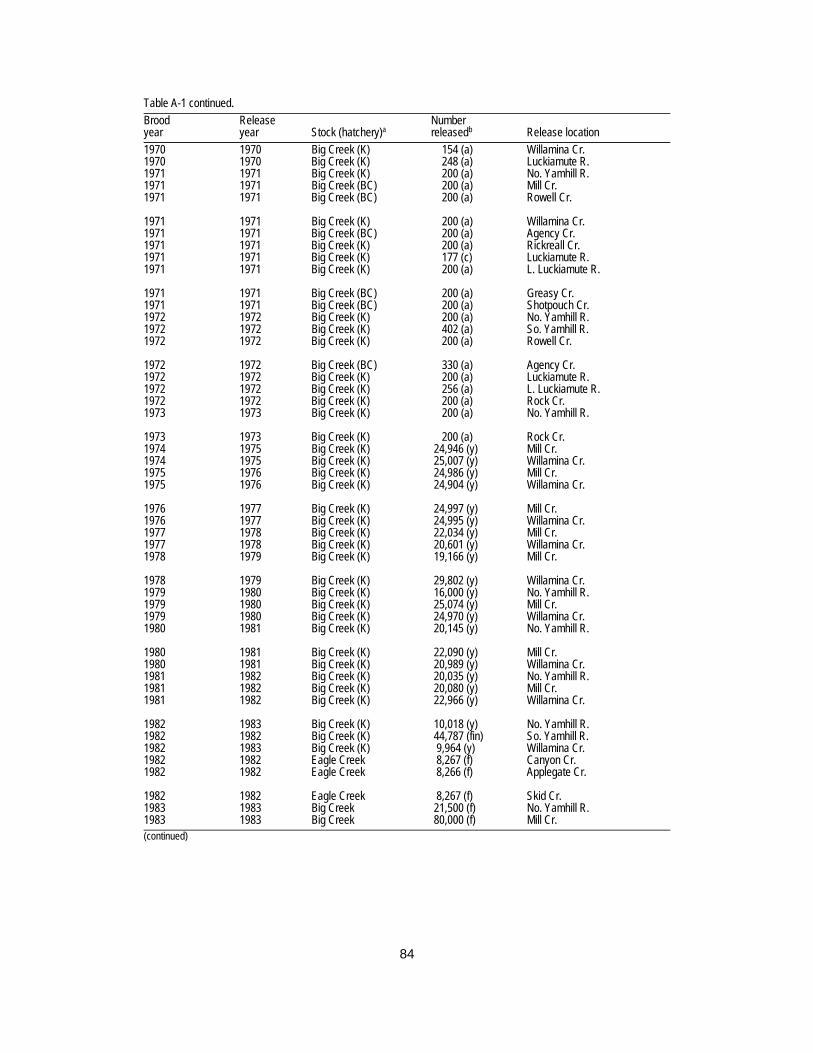
84
Table A-1 continued. Brood Release Number year year Stock (hatchery)a releasedb Release location 1970 1970 Big Creek (K) 154 (a) Willamina Cr. 1970 1970 Big Creek (K) 248 (a) Luckiamute R. 1971 1971 Big Creek (K) 200 (a) No. Yamhill R. 1971 1971 Big Creek (BC) 200 (a) Mill Cr. 1971 1971 Big Creek (BC) 200 (a) Rowell Cr. 1971 1971 Big Creek (K) 200 (a) Willamina Cr. 1971 1971 Big Creek (BC) 200 (a) Agency Cr. 1971 1971 Big Creek (K) 200 (a) Rickreall Cr. 1971 1971 Big Creek (K) 177 (c) Luckiamute R. 1971 1971 Big Creek (K) 200 (a) L. Luckiamute R. 1971 1971 Big Creek (BC) 200 (a) Greasy Cr. 1971 1971 Big Creek (BC) 200 (a) Shotpouch Cr. 1972 1972 Big Creek (K) 200 (a) No. Yamhill R. 1972 1972 Big Creek (K) 402 (a) So. Yamhill R. 1972 1972 Big Creek (K) 200 (a) Rowell Cr. 1972 1972 Big Creek (BC) 330 (a) Agency Cr. 1972 1972 Big Creek (K) 200 (a) Luckiamute R. 1972 1972 Big Creek (K) 256 (a) L. Luckiamute R. 1972 1972 Big Creek (K) 200 (a) Rock Cr. 1973 1973 Big Creek (K) 200 (a) No. Yamhill R. 1973 1973 Big Creek (K) 200 (a) Rock Cr. 1974 1975 Big Creek (K) 24,946 (y) Mill Cr. 1974 1975 Big Creek (K) 25,007 (y) Willamina Cr. 1975 1976 Big Creek (K) 24,986 (y) Mill Cr. 1975 1976 Big Creek (K) 24,904 (y) Willamina Cr. 1976 1977 Big Creek (K) 24,997 (y) Mill Cr. 1976 1977 Big Creek (K) 24,995 (y) Willamina Cr. 1977 1978 Big Creek (K) 22,034 (y) Mill Cr. 1977 1978 Big Creek (K) 20,601 (y) Willamina Cr. 1978 1979 Big Creek (K) 19,166 (y) Mill Cr. 1978 1979 Big Creek (K) 29,802 (y) Willamina Cr. 1979 1980 Big Creek (K) 16,000 (y) No. Yamhill R. 1979 1980 Big Creek (K) 25,074 (y) Mill Cr. 1979 1980 Big Creek (K) 24,970 (y) Willamina Cr. 1980 1981 Big Creek (K) 20,145 (y) No. Yamhill R. 1980 1981 Big Creek (K) 22,090 (y) Mill Cr. 1980 1981 Big Creek (K) 20,989 (y) Willamina Cr. 1981 1982 Big Creek (K) 20,035 (y) No. Yamhill R. 1981 1982 Big Creek (K) 20,080 (y) Mill Cr. 1981 1982 Big Creek (K) 22,966 (y) Willamina Cr. 1982 1983 Big Creek (K) 10,018 (y) No. Yamhill R. 1982 1982 Big Creek (K) 44,787 (fin) So. Yamhill R. 1982 1983 Big Creek (K) 9,964 (y) Willamina Cr. 1982 1982 Eagle Creek 8,267 (f) Canyon Cr. 1982 1982 Eagle Creek 8,266 (f) Applegate Cr. 1982 1982 Eagle Creek 8,267 (f) Skid Cr. 1983 1983 Big Creek 21,500 (f) No. Yamhill R. 1983 1983 Big Creek 80,000 (f) Mill Cr. (continued)
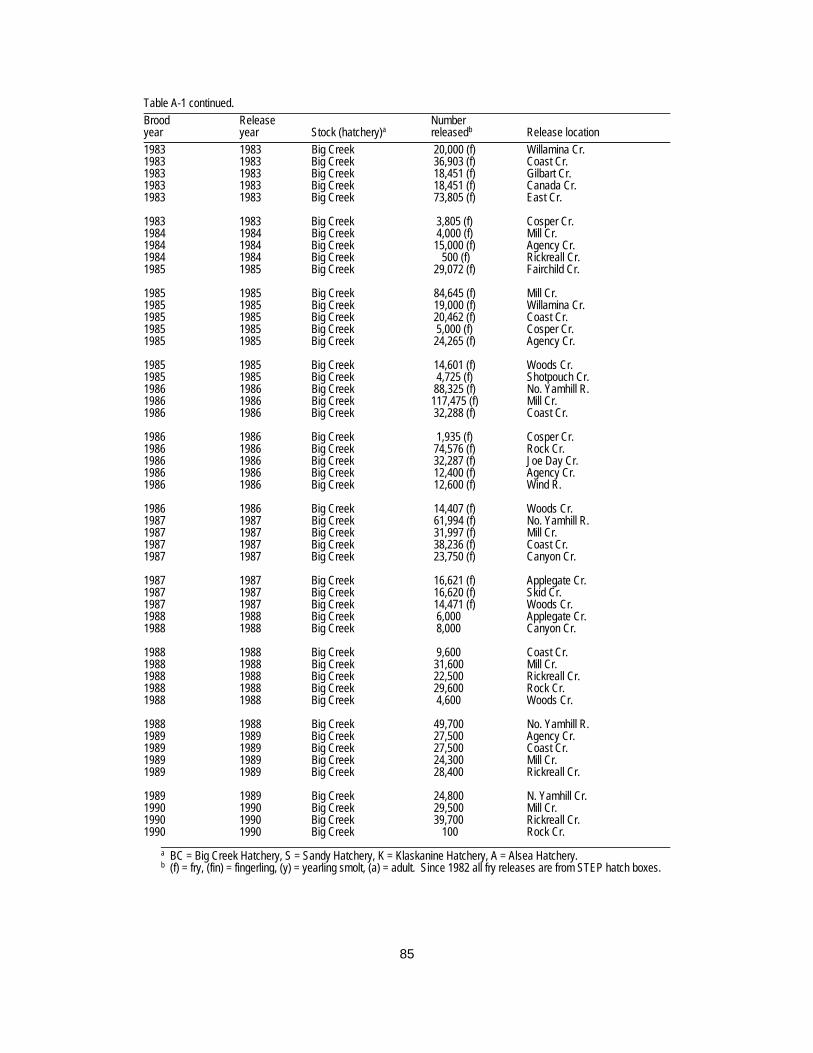
85
Table A-1 continued. Brood Release Number year year Stock (hatchery)a releasedb Release location 1983 1983 Big Creek 20,000 (f) Willamina Cr. 1983 1983 Big Creek 36,903 (f) Coast Cr. 1983 1983 Big Creek 18,451 (f) Gilbart Cr. 1983 1983 Big Creek 18,451 (f) Canada Cr. 1983 1983 Big Creek 73,805 (f) East Cr. 1983 1983 Big Creek 3,805 (f) Cosper Cr. 1984 1984 Big Creek 4,000 (f) Mill Cr. 1984 1984 Big Creek 15,000 (f) Agency Cr. 1984 1984 Big Creek 500 (f) Rickreall Cr. 1985 1985 Big Creek 29,072 (f) Fairchild Cr. 1985 1985 Big Creek 84,645 (f) Mill Cr. 1985 1985 Big Creek 19,000 (f) Willamina Cr. 1985 1985 Big Creek 20,462 (f) Coast Cr. 1985 1985 Big Creek 5,000 (f) Cosper Cr. 1985 1985 Big Creek 24,265 (f) Agency Cr. 1985 1985 Big Creek 14,601 (f) Woods Cr. 1985 1985 Big Creek 4,725 (f) Shotpouch Cr. 1986 1986 Big Creek 88,325 (f) No. Yamhill R. 1986 1986 Big Creek 117,475 (f) Mill Cr. 1986 1986 Big Creek 32,288 (f) Coast Cr. 1986 1986 Big Creek 1,935 (f) Cosper Cr. 1986 1986 Big Creek 74,576 (f) Rock Cr. 1986 1986 Big Creek 32,287 (f) Joe Day Cr. 1986 1986 Big Creek 12,400 (f) Agency Cr. 1986 1986 Big Creek 12,600 (f) Wind R. 1986 1986 Big Creek 14,407 (f) Woods Cr. 1987 1987 Big Creek 61,994 (f) No. Yamhill R. 1987 1987 Big Creek 31,997 (f) Mill Cr. 1987 1987 Big Creek 38,236 (f) Coast Cr. 1987 1987 Big Creek 23,750 (f) Canyon Cr. 1987 1987 Big Creek 16,621 (f) Applegate Cr. 1987 1987 Big Creek 16,620 (f) Skid Cr. 1987 1987 Big Creek 14,471 (f) Woods Cr. 1988 1988 Big Creek 6,000 Applegate Cr. 1988 1988 Big Creek 8,000 Canyon Cr. 1988 1988 Big Creek 9,600 Coast Cr. 1988 1988 Big Creek 31,600 Mill Cr. 1988 1988 Big Creek 22,500 Rickreall Cr. 1988 1988 Big Creek 29,600 Rock Cr. 1988 1988 Big Creek 4,600 Woods Cr. 1988 1988 Big Creek 49,700 No. Yamhill R. 1989 1989 Big Creek 27,500 Agency Cr. 1989 1989 Big Creek 27,500 Coast Cr. 1989 1989 Big Creek 24,300 Mill Cr. 1989 1989 Big Creek 28,400 Rickreall Cr. 1989 1989 Big Creek 24,800 N. Yamhill Cr. 1990 1990 Big Creek 29,500 Mill Cr. 1990 1990 Big Creek 39,700 Rickreall Cr. 1990 1990 Big Creek 100 Rock Cr.
a BC = Big Creek Hatchery, S = Sandy Hatchery, K = Klaskanine Hatchery, A = Alsea Hatchery. b (f) = fry, (fin) = fingerling, (y) = yearling smolt, (a) = adult. Since 1982 all fry releases are from STEP hatch boxes.

86
APPENDIX B Coho Salmon
Table B-1. Coho releases into the Coast Range subbasin, 1954-1988 (Williams 1983b, ODFW unpublished data). Brood Release Number year year Hatchery Stock releaseda Release location 1952 1954 Bonneville Toutle 10,000 (y) So. Yamhill R. 1953 1954 Sandy Toutle 100,000 (fin) So. Yamhill R. 1954 1955 Sandy Toutle 50,000 (fin) So. Yamhill R. 1954 1955 Sandy Toutle 45,486 (y) So. Yamhill R. 1955 1957 Sandy Toutle 79,877 (y) So. Yamhill R. 1956 1957 Sandy Toutle 239,556 (fin) So. Yamhill R. 1956 1957 Sandy Toutle 119,862 (fin) Luckiamute R. 1957 1958 Sandy Toutle 128,000 (fin) So. Yamhill R. 1957 1958 Sandy Toutle 70,000 (fin) Luckiamute R. 1958 1959 Sandy Toutle 88,476 (fin) So. Yamhill R. 1958 1959 Sandy Toutle 80,000 (fin) Luckiamute R. 1958 1959 Sandy Toutle 80,000 (fin) Marys R. tribs. 1959 1961 Bonneville Toutle 97,784 (y) So. Yamhill R. 1959 1960 Sandy Toutle 90,646 (fin) Luckiamute R. 1959 1960 Sandy Toutle 108,794 (fin) Marys R. tribs. 1960 1962 Sandy Toutle 63,158 (y) So. Yamhill R. tribs. 1961 1962 Bonneville Toutle 300,000 (f) No. Yamhill R. tribs. 1961 1962 Bonneville Toutle 402,052 (f) So. Yamhill R. tribs. 1961 1962 Bonneville Toutle 104,580 (f) Luckiamute R. 1961 1963 Sandy Toutle 44,979 (y) So. Yamhill R. tribs. 1962 1963 Sandy Toutle 291,886 (f) No. Yamhill R. tribs. 1962 1963 Bonn. & Klask. Toutle 462,907 (f) So. Yamhill R. tribs. 1962 1963 Bonneville Toutle 400,000 (f) Luckiamute R. 1962 1963 Klaskanine Toutle 350,000 (f) Marys R. 1962 1964 Sandy Toutle 61,814 (y) So. Yamhill R. tribs. 1963 1965 Sandy Toutle 10,060 (y) No. Yamhill R. tribs. 1963 1965 Sandy Toutle 69,793 (y) So. Yamhill R. tribs. 1964 1964 Cascade Toutle 300 (a) No. Yamhill R. 1964 1964 Cascade Toutle 600 (a) So. Yamhill R. tribs. 1964 1964 Cascade Toutle 250 (a) Marys R. trib. 1964 1965 Cascade Toutle 100,031 (fin) No. Yamhill R. tribs. 1964 1965 Klaskanine Toutle 1,827,209 (f) So. Yamhill R. tribs. 1964 1965 Oxbow Toutle 64,152 (fin) So. Yamhill R. tribs. 1964 1965 Klaskanine Toutle 304,872 (f) Rickreall Cr. 1964 1965 Klaskanine Toutle 392,587 (f) Luckiamute R. (continued)

87
Table B-1 continued. Brood Release Number year year Hatchery Stock releaseda Release location 1964 1965 Big Cr. & Klask. Toutle 1,178,578 (f) Marys R. tribs. 1964 1966 Sandy Toutle 29,321 (y) No. Yamhill R. 1964 1966 Sandy Toutle 14,329 (y) So. Yamhill R. Trib. 1964 1966 Sandy Toutle 29,970 (y) Marys R. tribs. 1965 1965 Sandy Toutle 700 (a) No. Yamhill R. 1965 1965 Alsea NAb 117 (a) No. Yamhill R. 1965 1965 Sandy Toutle 220 (a) So. Yamhill R. 1965 1965 Alsea NAb 200 (a) Luckiamute R. Trib. 1965 1965 Siletz NAb 246 (a) Marys R. 1965 1966 Sandy Toutle 308,628 (f) No. Yamhill R. Tribs. 1965 1966 Bonn. & Big Cr. Toutle 799,153 (f) So. Yamhill R. 1965 1966 Klaskanine Toutle 250,596 (f) Rickreall Cr. 1965 1966 Bonn. & Casc. Toutle 402,600 (f) Luckiamute R. tribs. 1965 1966 Bonn. & Big Cr. Toutle 608,748 (f) Marys R. tribs. 1966 1966 Bonneville Toutle 150 (a) So. Yamhill R. trib. 1966 1966 Bonneville Toutle 300 (a) Rickreall Cr. & trib. 1966 1966 Siletz NAb 190 (a) Luckiamute R. 1966 1966 Siletz NAb 190 (a) Marys R. 1966 1967 Trask Trask 193,502 (f) No. Yamhill R. 1966 1967 Sandy Toutle 140,196 (fin) No. Yamhill R. 1966 1967 Trask Trask 104,250 (f) So. Yamhill R. & trib. 1966 1967 Nehalem NAb 208,679 (f) Luckiamute R. tribs. 1966 1967 Nehalem & Siletz NAb 709,276 (f) Marys R. tribs. 1966 1967 Sandy Toutle 127,314 (fin) Marys R. 1967 1967 Klaskanine Toutle 159 (a) Yamhill R. 1967 1967 Siletz NAb 300 (a) No. Yamhill R. trib. 1967 1967 Klaskanine Toutle 406 (a) No. Yamhill R. & trib. 1967 1967 Klaskanine Toutle 806 (a) So. Yamhill R. tribs. 1967 1967 Siletz NAb 100 (a) So. Yamhill R. trib. 1967 1967 Bonn. & Casc. Toutle 659 (a) Luckiamute R. & trib. 1967 1967 Bonn. & Casc. Toutle 776 (a) Marys R. 1967 1967 Siletz NAb 200 (a) Marys R. trib. 1967 1968 Klaskanine Toutle 306,000 (f) So. Yamhill R. tribs. 1967 1968 Siletz NAb 152,667 (f) Rickreall Cr. & trib. 1967 1968 Siletz NAb 224,729 (f) Luckiamute R. tribs. 1967 1968 Siletz NAb 79,997 (f) Marys R. trib. 1968 1968 Bonneville Toutle 226 (a) No. Yamhill R. 1968 1968 Bonneville Toutle 140 (a) So. Yamhill R. trib. 1968 1968 Big Cr. Toutle 150 (a) Rickreall Cr. 1968 1968 Big Cr. Toutle 1,716 (a) Luckiamute R. & trib. 1968 1969 Cascade Toutle 501,997 (f) Luckiamute R. & tribs. 1968 1969 Sandy Toutle 357,061 (f) Marys R. & tribs. 1968 1970 Klaskanine Toutle 86,115 (y) No. Yamhill R. & trib. 1968 1970 Cascade Toutle 185,845 (y) Luckiamute R. trib. 1968 1970 Alsea NAb 152,992 (y) Marys R. tribs. 1969 1969 Big Cr. Toutle 429 (a) North Yamhill R. 1969 1969 Big Cr. Toutle 300 (a) So. Yamhill R. tribs. (continued)

88
Table B-1 continued. Brood Release Number year year Hatchery Stock releaseda Release location 1969 1969 Alsea NAb 200 (a) So. Yamhill R. tribs. 1969 1969 Big Cr. Toutle 610 (a) Rickreall Cr. 1969 1969 Big Cr. & Sandy Toutle 600 (a) Luckiamute R. 1969 1970 Big Cr. & Sandy Toutle 1,226,997 (f) So. Yamhill R. tribs. 1969 1970 Alsea NAb 296,547 (f) Luckiamute R. 1969 1970 Cascade Toutle 280,000 (f) Luckiamute R. tribs. 1969 1970 Alsea NAb 213,382 (f) Marys R. tribs. 1969 1970 Cascade Toutle 224,000 (f) Marys R. tribs. 1969 1970 Sandy Toutle 98,080 (f) No. Yamhill R. trib. 1969 1971 Sandy Toutle 181,739 (y) Luckiamute R. & tribs. 1969 1971 Alsea NAb 70,931 (y) Luckiamute R. 1969 1971 Alsea NAb 160,374 (y) Marys R. tribs. 1969 1971 Cascade Toutle 85,280 (y) No. Yamhill R. & trib. 1970 1970 Sandy Toutle 150 (a) Rickreall Cr. 1970 1971 McKenzie Toutle 222,957 (f) Luckiamute R. trib. 1970 1972 Cascade Toutle 86,258 (y) No. Yamhill R. tribs. 1970 1972 Cascade Toutle 123,700 (y) Luckiamute R. 1970 1972 Alsea NAb 41,589 (y) Luckiamute R. 1970 1972 Alsea NAb 179,733 (y) Marys R. tribs. 1971 1971 Big Cr. Toutle 150 (a) Rickreall Cr. 1971 1971 Bonneville Toutle 150 (a) Luckiamute R. trib. 1971 1972 Big Cr. Toutle 397,240 (f) So. Yamhill R. trib. 1971 1973 Bonneville Toutle 435,226 (y) So. Yamhill R. trib. 1971 1973 Bonneville Toutle 19,802 (y) Marys R. trib. 1972 1972 Bonneville Toutle 208 (a) So. Yamhill R. trib. 1972 1972 Sandy Toutle 164 (a) Rickreall Cr. 1972 1972 Bonneville Toutle 160 (a) Luckiamute R. 1972 1973 Elk R. Toutle 196,100 (fin) So. Yamhill R. tribs. 1972 1974 Bonn. & Sandy Toutle 484,769 (y) So. Yamhill R. tribs. 1972 1973 Sandy Toutle 327,117 (f) Luckiamute R. & trib. 1972 1974 Sandy Toutle 20,291 (y) Luckiamute R. 1972 1974 Sandy Toutle 20,291 (y) Marys R. trib. 1973 1973 Bonneville Toutle 239 (a) So. Yamhill R. trib. 1973 1973 Bonneville Toutle 152 (a) Rickreall Cr. 1973 1973 Eagle Cr. Toutle 214 (a) Luckiamute R. trib. 1974 1974 Eagle Cr. Toutle 204 (a) Luckiamute R. 1974 1975 Elk R. Toutle 29,300 (fin) Mercer Reservoir 1974 1975 Sandy Toutle 158,517 (f) Luckiamute R. trib. 1974 1976 Cascade Toutle 55,010 (y) N. Yamhill R. & tribs. 1974 1976 Cascade Cowlitz 124,869 (y) S. Yamhill R. & tribs. 1974 1976 Cascade Cowlitz 73,009 (y) Luckiamute R. & trib. 1974 1976 Cascade Cowlitz 43,954 (y) Marys R. tribs. 1976 1977 Cascade Cowlitz 161,250 (f) Rickreall Cr. 1982 1983 STEP Toutle 19,750 (f) Ellendale Cr. 1982 1983 STEP Toutle 29,750 (f) Rickreall Cr. 1982 1983 STEP Toutle 10,000 (f) Applegate Cr. 1982 1983 STEP Toutle 18,000 (f) Rickreall Cr. (continued)

89
Table B-1 continued. Brood Release Number year year Hatchery Stock releaseda Release location 1982 1983 STEP Toutle 10,000 (f) Canyon Cr. 1982 1983 STEP Toutle 10,000 (f) Skid Cr. 1982 1983 Sandy Toutle 251,104 (f) Yamhill R. 1982 1983 Sandy Toutle 188,328 (f) Deer Cr. 1982 1983 Gnat Cr. Toutle 112,800 (f) Mill Cr. 1982 1983 Gnat Cr. Toutle 56,400 (f) Gooseneck Cr. 1982 1983 Sandy Toutle 31,388 (f) Rock Cr. 1982 1983 Sandy Toutle 56,388 (f) Rogue R. 1982 1983 Gnat Cr. Toutle 56,400 (f) No. Yamhill R. 1982 1983 Gnat Cr. Toutle 84,600 (f) Baker Cr. 1982 1983 Gnat Cr. Toutle 84,600 (f) Turner Cr. 1982 1983 Sandy Toutle 133,151 (f) Luckiamute R. 1982 1983 Sandy Toutle 20,000 (f) Teal Cr. 1982 1983 Sandy Toutle 59,100 (f) Pedee Cr. 1982 1983 Sandy Toutle 23,640 (f) Pedee Cr., SF 1982 1983 Sandy Toutle 59,100 (f) Maxfield Cr. 1982 1983 Sandy Toutle 23,640 (f) Price Cr. 1982 1983 Sandy Toutle 59,100 (f) Ritner Cr. 1982 1983 Cascade Toutle 73,600 (f) Woods Cr. 1982 1983 Cascade Toutle 62,100 (f) Shotpouch Cr. 1982 1983 Cascade Toutle 110,400 (f) Greasy Cr. 1982 1983 Cascade Toutle 98,900 (f) Rock Cr. 1982 1983 STEP Toutle 20,000 (f) Casper Cr. 1982 1983 STEP Toutle 25,000 (f) Ead Cr. 1982 1983 STEP Toutle 8,000 (f) Hauchet Cr. 1982 1983 STEP Toutle 25,000 (f) Jackass Cr. 1982 1983 STEP Toutle 8,000 (f) Kitten Cr. 1982 1983 STEP Toutle 25,000 (f) Pierce Cr. 1982 1983 STEP Toutle 45,000 (f) Rowell Cr. 1982 1983 STEP Toutle 50,000 (f) Gold Cr. 1982 1983 STEP Toutle 19,000 (f) Panther Cr. 1982 1983 STEP Toutle 20,500 (f) Luckiamute system 1983 1984 Oxbow Toutle 111,150 (f) Luckiamute R. 1983 1984 Oxbow Toutle 59,280 (fin) L. Luckiamute R. 1983 1984 Oxbow Toutle 55,575 (fin) Pedee Cr. 1983 1984 Oxbow Toutle 55,575 (fin) Maxfield Cr. 1983 1984 Oxbow Toutle 44,460 (fin) Ritner Cr. 1983 1984 Oxbow Toutle 73,880 (fin) Woods Cr. 1983 1984 Oxbow Toutle 90,872 (fin) Shot Pouch Cr. 1983 1984 Oxbow Toutle 157,364 (fin) Greasy Cr. 1983 1984 STEP Cowlitz 10,000 (f) Canyon Cr. 1983 1984 STEP Cowlitz 10,000 (f) Applegate Cr. 1983 1984 STEP Cowlitz 10,000 (f) Skid Cr. 1983 1984 STEP Cowlitz 45,000 (f) Rickreall Cr. 1983 1984 STEP Cowlitz 10,000 (f) Ellendale Cr. 1983 1984 STEP Cowlitz 5,000 (f) Rickreall Cr. Trib. 1983 1984 STEP Cowlitz 25,000 (f) Kitten Cr. (continued)

90
Table B-1 continued. Brood Release Number year year Hatchery Stock releaseda Release location 1983 1984 STEP Cowlitz 25,000 (f) Pierce Cr. 1983 1984 STEP Cowlitz 25,000 (f) Ead Cr. 1983 1984 STEP Cowlitz 25,000 (f) Rogue R. 1983 1984 STEP Cowlitz 25,000 (f) Jackass Cr. 1983 1984 STEP Cowlitz 25,000 (f) Rowell Cr. 1983 1984 STEP Cowlitz 25,000 (f) Gold Cr. 1983 1984 STEP Cowlitz 25,000 (f) Hauchet Cr. 1983 1984 STEP Cowlitz 20,000 (f) Casper Cr. 1983 1984 STEP Cowlitz 15,000 (f) Teal Cr. 1984 1985 Bonneville Cowlitz 180,386 (fin) Deer Cr. 1984 1985 Oxbow Cowlitz 418,865 (fin) Mill Cr. 1984 1985 Oxbow Cowlitz 351,185 (fin) No. Yamhill R. 1984 1985 Bonneville Cowlitz 200,550 (fin) No. Yamhill R. 1984 1985 Oxbow Cowlitz 140,180 (fin) Panther Cr. 1984 1985 Oxbow Cowlitz 84,760 (fin) Baker Cr. 1984 1985 Oxbow Toutle 425,495 (fin) Luckiamute R. 1984 1985 Oxbow Toutle 254,670 (fin) L. Luckiamute R. 1984 1985 Bonneville Toutle 149,030 (fin) L. Luckiamute R. 1984 1985 Bonneville Toutle 139,965 (fin) Pedee Cr. 1984 1985 Bonneville Toutle 125,760 (fin) Ritner Cr. 1984 1985 STEP Toutle 3,282 (f) Soap Cr. 1984 1985 STEP Toutle 510,000 (f) Marys R. system 1984 1985 STEP Toutle 12,918 (f) Turner Cr. 1984 1985 STEP Toutle 49,698 (f) Panther Cr. 1984 1985 STEP Toutle 31,208 (f) Kitten Cr. 1984 1985 STEP Toutle 25,208 (f) Ead Cr. 1984 1985 STEP Toutle 24,450 (f) Pierce Cr. 1984 1985 STEP Toutle 49,688 (f) Rowell Cr. 1984 1985 STEP Toutle 19,247 (f) Jackass Cr. 1984 1985 STEP Toutle 19,247 (f) Rogue R. 1984 1985 STEP Toutle 9,000 (f) Hauchet Cr. 1984 1985 STEP Toutle 38,534 (f) Casper Cr. 1984 1985 STEP Toutle 24,692 (f) Gold Cr. 1984 1985 STEP Toutle 49,357 (f) Rickreall Cr. 1984 1985 STEP Toutle 9,556 (f) Canyon Cr. 1984 1985 STEP Toutle 9,556 (f) Applegate Cr. 1984 1985 STEP Toutle 9,556 (f) Skid Cr. 1984 1985 STEP Toutle 19,200 (f) Ellendale Cr. 1984 1985 STEP Toutle 3,954 (f) Oak Cr. 1984 1985 STEP Toutle 83,802 (f) So. Yamhill R. 1984 1985 STEP Toutle 19,871 (f) Teal Cr. 1985 1986 STEP Toutle 74,124 (f) Panther Cr. 1985 1986 STEP Toutle 16,093 (f) Eads Cr. 1985 1986 STEP Toutle 16,093 (f) Hauchet Cr. 1985 1986 STEP Toutle 16,093 (f) Kitten Cr. 1985 1986 STEP Toutle 16,093 (f) Pierce Cr. 1985 1986 STEP Toutle 32,186 (f) Jackass Cr. (continued)

91
Table B-1 continued. Brood Release Number year year Hatchery Stock releaseda Release location 1985 1986 STEP Toutle 32,186 (f) Rogue R. 1985 1986 STEP Toutle 64,373 (f) Rowell Cr. 1985 1986 STEP Toutle 28,869 (f) Casper Cr. 1985 1986 STEP Toutle 43,197 (f) Gold Cr. 1985 1986 STEP Toutle 9,833 (f) Applegate Cr. 1985 1986 STEP Toutle 9,833 (f) Canyon Cr. 1985 1986 STEP Toutle 9,834 (f) Skid Cr. 1985 1986 STEP Toutle 29,000 (f) Rickreall Cr. 1985 1986 STEP Toutle 29,000 (f) Ellendale Cr. 1985 1986 STEP Toutle 14,618 (f) Soap Cr. 1985 1986 STEP Toutle 75 (f) Woods Cr. 1986 1987 STEP Toutle 15,000 (f) Soap Cr. 1986 1987 STEP Toutle 74,142 (f) Panther Cr. 1986 1987 STEP Toutle 45,902 (f) Rowell Cr. 1986 1987 STEP Toutle 13,619 (f) Rogue Cr. 1986 1987 STEP Toutle 12,500 (f) Pierce Cr. 1986 1987 STEP Toutle 40,388 (f) Kitten Cr. 1986 1987 STEP Toutle 40,317 (f) Eads Cr. 1986 1987 STEP Toutle 40,222 (f) Jackass Cr. 1986 1987 STEP Toutle 19,055 (f) Casper Cr. 1986 1987 STEP Toutle 62,122 (f) Gold Cr. 1986 1987 STEP Toutle 84,600 (f) Rickreall Cr. 1986 1987 STEP Toutle 1,133 (f) Oak Cr. 1986 1987 Bonneville Toutle 164,010 (fin) L. Luckiamute R. 1986 1987 Bonneville Toutle 44,064 (fin) Pedee Cr. 1986 1987 Bonneville Toutle 53,136 (fin) Ritner Cr. 1986 1987 Bonneville Toutle 40,500 (fin) Woods Cr. 1986 1987 Bonneville Toutle 54,000 (fin) Shot Pouch Cr. 1986 1987 Bonneville Toutle 104,432 (fin) Greasy Cr. 1986 1987 Bonneville Toutle 41,088 (fin) Rock Cr. 1987 1988 STEP Toutle 39,589 (f) Panther Cr. 1987 1988 STEP Toutle 1,000 (f) Mill Cr. 1987 1988 STEP Toutle 6,611 (f) Soap Cr. 1987 1988 STEP Toutle 19,160 (f) Corral Cr.
a (f) = fry, (fin) = fingerling, (y) = smolt (yearling), (a) = adult.
b Information not available.

92
APPENDIX C Trout Table C-1. Hatchery releases of catchable rainbow trout in the Coast Range subbasin, 1978-90 (unpublished data, ODFW, Portland, Oregon). Brood Release No. & lbs.() year year Hatchery Stock released Release site 1976 1978 Roaring River Roaring River 2,253 No. Yamhill R. (772) 2,800 Agency Cr. (980) Leaburg Roaring River 1,002 Rickreall Cr. (313) 4,002 Little Luckiamute R. (1,395) 2,003 Luckiamute R. (698) 1977 1979 Roaring River Oak Springs 511 No. Yamhill R. (138) Roaring River 500 No. Yamhill R. (156) Oak Springs 1,003 Agency Cr. (271) Roaring River 1,000 Agency Cr. (313) Oak Springs 2,171 Mill Cr. (649) Roaring River 3,374 Mill Cr. (1,058) Oak Springs 1,003 Rickreall Cr. (271) Oak Springs 2,002 Little Luckiamute R. (541) Roaring River 3,007 Little Luckiamute R. (958) 1,003 Luckiamute R. (271) Roaring River 1,000 Luckiamute R. (313) 1978 1980 Roaring River Cape Cod 1,999 Agency Cr. (805) 1,501 Mill Cr. (556) 999 Rickreall Cr. (370) Leaburg Roaring River 5,021 Little Luckiamute R. (1,671) 2,001 Luckiamute R. (657) (continued)

93
Table C-1 continued. Brood Release No. & lbs.() year year Hatchery Stock released Release site 1979 1981 Roaring River Roaring River 1,000 Agency Cr. (370) Cape Cod 999 Agency Cr. (400) Roaring River 798 Mill Cr. (380) Cape Cod 2,497 Mill Cr. (1,099) Roaring River 1,010 Rickreall Cr. (374) Cape Cod 999 Little Luckiamute R. (499) Leaburg Roaring River 4,994 Little Luckiamute R. (1,343) 2,004 Luckiamute R. (668) 1980 1982 Roaring River Cape Cod 2,008 Agency Cr. (663) 5,033 Mill Cr. (1,681) 1,000 Rickreall Cr. (303) 5,088 Little Luckiamute R. (1,701) 2,008 Luckiamute R. (663) 1981 1983 Roaring River Cape Cod 2,013 Agency Cr. (650) 5,016 Mill Cr. (1,572) 999 Rickreall Cr. (333) 4,008 Little Luckiamute R. (1,284) 3,006 Luckiamute R. (933) 1982 1984 Roaring River Cape Cod 2,000 Agency Cr. (656) 4,541 Mill Cr. (1,452) 998 Rickreall Cr. (322) 4,545 Little Luckiamute R. (1,384) 2,001 Luckiamute R. (633) (continued)
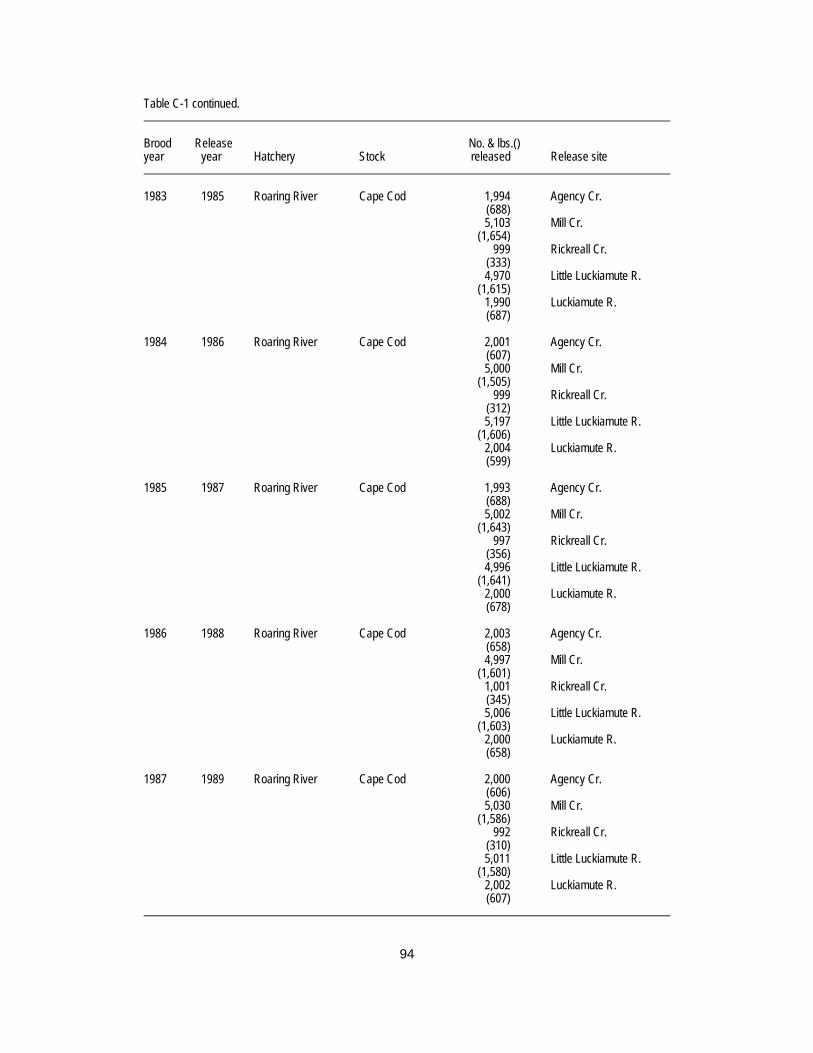
94
Table C-1 continued. Brood Release No. & lbs.() year year Hatchery Stock released Release site 1983 1985 Roaring River Cape Cod 1,994 Agency Cr. (688) 5,103 Mill Cr. (1,654) 999 Rickreall Cr. (333) 4,970 Little Luckiamute R. (1,615) 1,990 Luckiamute R. (687) 1984 1986 Roaring River Cape Cod 2,001 Agency Cr. (607) 5,000 Mill Cr. (1,505) 999 Rickreall Cr. (312) 5,197 Little Luckiamute R. (1,606) 2,004 Luckiamute R. (599) 1985 1987 Roaring River Cape Cod 1,993 Agency Cr. (688) 5,002 Mill Cr. (1,643) 997 Rickreall Cr. (356) 4,996 Little Luckiamute R. (1,641) 2,000 Luckiamute R. (678) 1986 1988 Roaring River Cape Cod 2,003 Agency Cr. (658) 4,997 Mill Cr. (1,601) 1,001 Rickreall Cr. (345) 5,006 Little Luckiamute R. (1,603) 2,000 Luckiamute R. (658) 1987 1989 Roaring River Cape Cod 2,000 Agency Cr. (606) 5,030 Mill Cr. (1,586) 992 Rickreall Cr. (310) 5,011 Little Luckiamute R. (1,580) 2,002 Luckiamute R. (607)
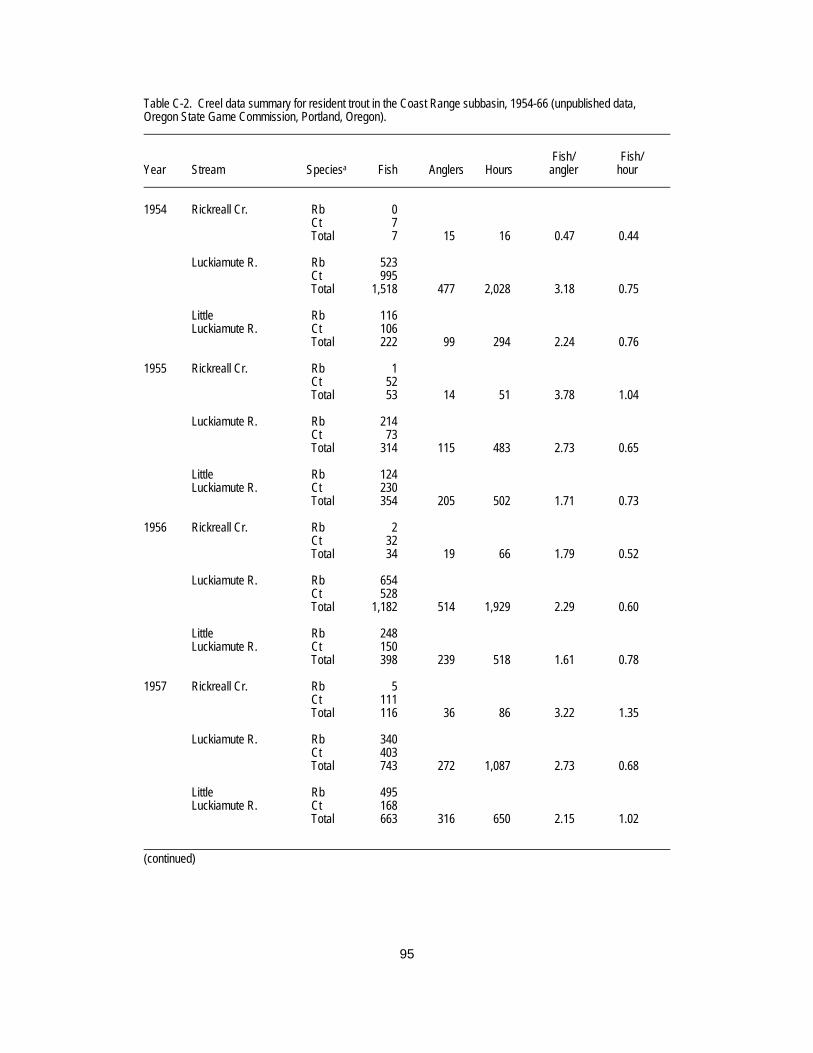
95
Table C-2. Creel data summary for resident trout in the Coast Range subbasin, 1954-66 (unpublished data, Oregon State Game Commission, Portland, Oregon). Fish/ Fish/ Year Stream Speciesa Fish Anglers Hours angler hour 1954 Rickreall Cr. Rb 0 Ct 7 Total 7 15 16 0.47 0.44 Luckiamute R. Rb 523 Ct 995 Total 1,518 477 2,028 3.18 0.75 Little Rb 116 Luckiamute R. Ct 106 Total 222 99 294 2.24 0.76 1955 Rickreall Cr. Rb 1 Ct 52 Total 53 14 51 3.78 1.04 Luckiamute R. Rb 214 Ct 73 Total 314 115 483 2.73 0.65 Little Rb 124 Luckiamute R. Ct 230 Total 354 205 502 1.71 0.73 1956 Rickreall Cr. Rb 2 Ct 32 Total 34 19 66 1.79 0.52 Luckiamute R. Rb 654 Ct 528 Total 1,182 514 1,929 2.29 0.60 Little Rb 248 Luckiamute R. Ct 150 Total 398 239 518 1.61 0.78 1957 Rickreall Cr. Rb 5 Ct 111 Total 116 36 86 3.22 1.35 Luckiamute R. Rb 340 Ct 403 Total 743 272 1,087 2.73 0.68 Little Rb 495 Luckiamute R. Ct 168 Total 663 316 650 2.15 1.02 (continued)

96
Table C-2 continued. Fish/ Fish/ Year Stream Speciesa Fish Anglers Hours angler hour 1958 Rickreall Cr. Rb 29 Ct 79 Total 108 59 113 1.82 0.96 Luckiamute R. Rb 168 Ct 128 Total 296 141 376 2.10 0.79 Little Rb 189 Luckiamute R. Ct 62 Total 251 212 203 2.08 1.24 1959 Rickreall Cr. Rb 2 Ct 70 Total 72 41 112 1.75 0.64 Luckiamute R. Rb 235 Ct 148 Total 383 138 486 2.78 0.79 Little Rb 295 Luckiamute R. Ct 104 Total 399 155 281 2.57 1.43 1960 So. Yamhill R. Rb 1 Ct 0 Total 1 1 2 1.00 0.50 Rickreall Cr. Rb 6 Ct 141 Total 147 81 218 1.82 0.68 Luckiamute R. Rb 65 Ct 103 Total 168 74 247 2.27 0.68 Little Rb 315 Luckiamute R. Ct 152 Total 467 242 601 1.93 0.78 1961 So. Yamhill R. Rb 21 Ct 12 Total 33 19 27 1.74 1.22 Rickreall Cr. Rb 95 Ct 89 Total 184 85 164 2.16 1.12 Luckiamute R. Rb 182 Ct 87 Total 269 98 336 2.74 0.80 Little Rb 312 Luckiamute R. Ct 46 Total 358 106 185 3.38 1.94 (continued)
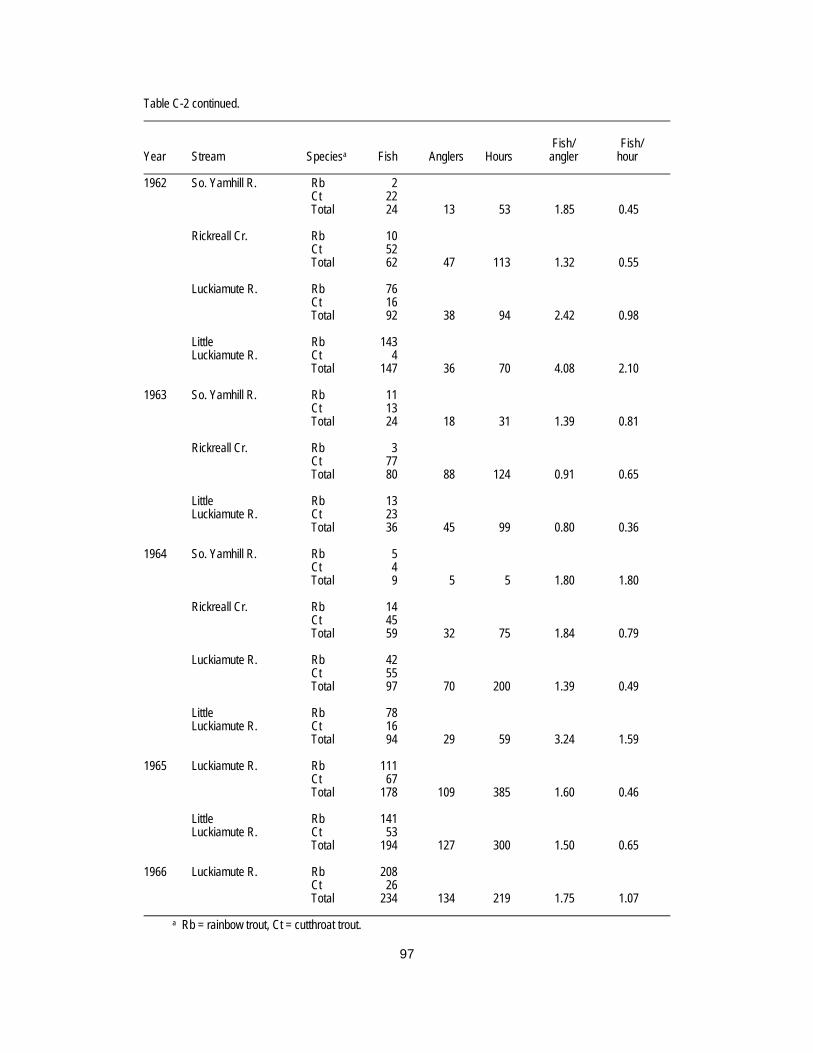
97
Table C-2 continued. Fish/ Fish/ Year Stream Speciesa Fish Anglers Hours angler hour 1962 So. Yamhill R. Rb 2 Ct 22 Total 24 13 53 1.85 0.45 Rickreall Cr. Rb 10 Ct 52 Total 62 47 113 1.32 0.55 Luckiamute R. Rb 76 Ct 16 Total 92 38 94 2.42 0.98 Little Rb 143 Luckiamute R. Ct 4 Total 147 36 70 4.08 2.10 1963 So. Yamhill R. Rb 11 Ct 13 Total 24 18 31 1.39 0.81 Rickreall Cr. Rb 3 Ct 77 Total 80 88 124 0.91 0.65 Little Rb 13 Luckiamute R. Ct 23 Total 36 45 99 0.80 0.36 1964 So. Yamhill R. Rb 5 Ct 4 Total 9 5 5 1.80 1.80 Rickreall Cr. Rb 14 Ct 45 Total 59 32 75 1.84 0.79 Luckiamute R. Rb 42 Ct 55 Total 97 70 200 1.39 0.49 Little Rb 78 Luckiamute R. Ct 16 Total 94 29 59 3.24 1.59 1965 Luckiamute R. Rb 111 Ct 67 Total 178 109 385 1.60 0.46 Little Rb 141 Luckiamute R. Ct 53 Total 194 127 300 1.50 0.65 1966 Luckiamute R. Rb 208 Ct 26 Total 234 134 219 1.75 1.07 a Rb = rainbow trout, Ct = cutthroat trout.