coastal ocean optics and dynamics watercolors · pdf file24 oceanography june 2004 watercolors...
TRANSCRIPT
Oceanography June 200424
Watercolors in the Coastal Zone
B Y O S C A R S C H O F I E L D , R O B E R T A . A R N O N E ,
W . P A U L B I S S E T T , T O M M Y D . D I C K E Y , C U R T I S S O . D A V I S ,
Z O E F I N K E L , M A T T H E W O L I V E R , A N D M A R K A . M O L I N E
What Can We See?
Hydrological optics has a rich history, play-
ing a signifi cant role in physical, chemical,
and biological oceanography. The success
over the last 30 years has provided oceanog-
raphers with a non-invasive means to study
regional and global scale physical, chemical,
and biological processes (Figure 1). The abil-
ity to map the color of the world’s oceans
has been used to estimate global ocean pro-
ductivity (Longhurst et al., 1995; Platt and
Sathyendranath, 1988; Sathyendranath et al.,
1989; Behrenfeld and Falkowski, 1997), aid
in understanding radiant heating processes
(Ohlman et al., 2000), assist in delineating
oceanic biotic provinces (Longhurst, 1998),
and document regional shelf break frontal
processes (Ryan et al., 1999a, 1999b). The
scientifi c utility of mapping ocean color led
to wide community support that has result-
ed in three generations of satellites launched
by the United States, complemented by an
international constellation of ocean color
satellites from Europe, Japan, China, and
India.
The utility of remote sensing results from
algorithms that use satellite-measured re-
fl ectance to estimate the concentration of
biogeochemically signifi cant constituents.
These algorithms were developed for opti-
cally “simple” waters where the optical prop-
erties of the ocean are largely defi ned by
phytoplankton and water molecules (Fig-
ure 2; see article by Mobley et al., this issue).
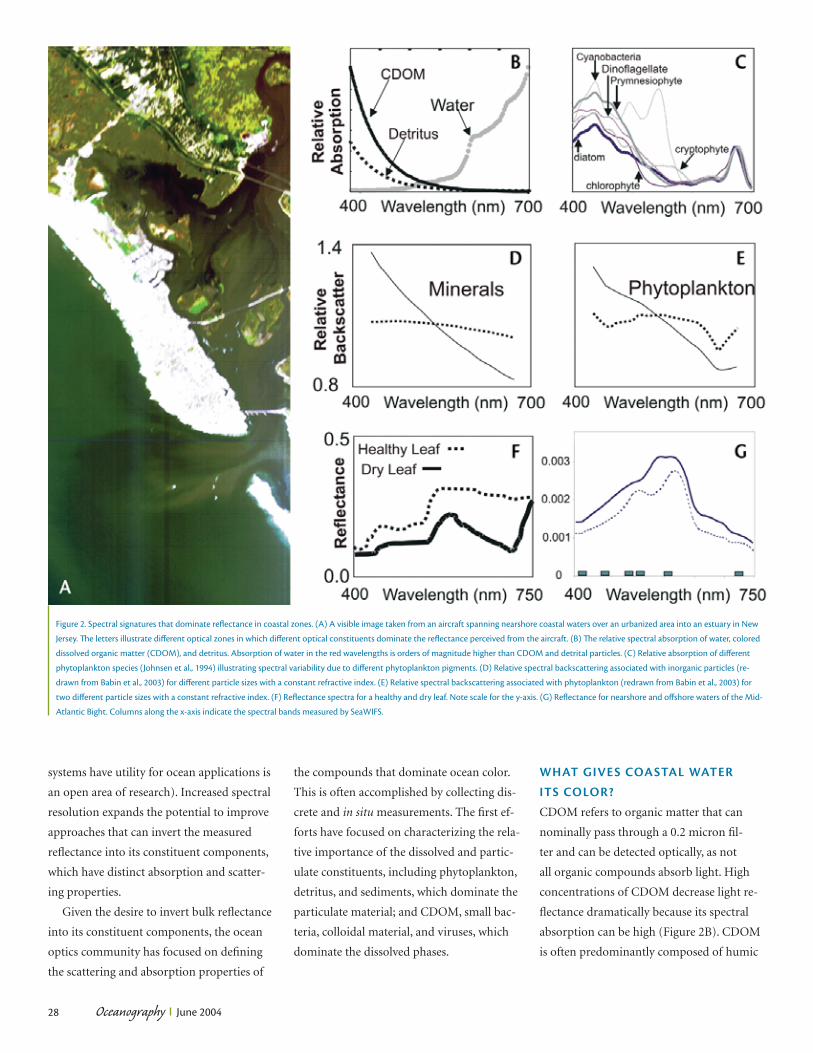
The spectral properties of water (Figure 2B)
and phytoplankton are distinct. Increasing
the concentration of phytoplankton (Figure
2C) in a volume of water selectively absorbs
blue wavelengths of light, effectively “green-
ing” the water refl ectance in a predictable
fashion. This “greening” allows empirical
relationships to be derived that estimate
chlorophyll a concentrations from the re-
fl ectance ratio of blue-to-green wavelengths
of light. Many times, however, the optical
signature of the ocean refl ects the presence
of materials other than phytoplankton and
water molecules. The resulting complexity
can directly infl uence the interpretation of
what you “see” using satellite refl ectance sig-
nals. A good example is the usually optically
simple, high nutrient-low chlorophyll zones
(HNLC). It has been proposed that deposi-
tion of atmospheric dust is a signifi cant fac-
tor regulating overall productivity in HNLC
zones (Martin, 1990; Prospero and Nees,
1986). Yet, if present in signifi cant concen-
trations, the optical signature of the dust
can compromise the empirical satellite algo-
rithms (Moulin et al., 2001). The presence of
signifi cant submicron dust particles, which
C O A S TA L O C E A N O P T I C S A N D D Y N A M I C S
Oceanography June 200424
THE ROLE OF OPTICS IN OCEANOGR APHY
Th is article has been published in Oceanography, Volume 17, Number 2, a quarterly journal of Th e Oceanography Society. Copyright 2003 by Th e Oceanography Society. All rights reserved. Reproduction of any portion of this arti-
cle by photocopy machine, reposting, or other means without prior authorization of Th e Oceanography Society is strictly prohibited. Send all correspondence to: [email protected] or 5912 LeMay Road, Rockville, MD 20851-2326, USA.

Oceanography June 2004 25Oceanography June 2004 25

Oceanography June 200426
Figure 1. Th e time and space scale variability in ocean color. (A) An annual global chlorophyll a map measured using SeaWIFS (from http://seawifs.gsfc.nasa.gov/SEAWIFS.html). (B) Backscattering
measured in summer 2001 in the Mid-Atlantic Bight using SeaWIFS. (C) An enlarged section in panel B focusing on the backscattering signal derived from the SeaWIFS observations; the satellite’s
1-kilometer pixel is clearly visible and illustrates the features in the coastal ocean that are poorly resolved. It should be noted that some of newer ocean-color satellites have spatial resolutions down
to 250 km. Ocean-color satellites with 30-meter resolution are proposed. ( D) An enlargement from panel C showing backscatter measured by aircraft. Note the features clearly visible in the aircraft
imagery that are missed with the standard 1-km pixels in the satellite imagery. (E) Th e visible image viewed by aircraft, with resolution on the order of tens of meters, showing the dramatic color
change associated with crossing an upwelling front in the Mid-Atlantic Bight. Th e visible “greening” of the water is associated with enhanced blue light absorption. Th is color shift underlies empirical
algorithms for ocean color remote sensing. (F) Time series of CDOM absorption, estimated from inverting bulk absorption measured with an ac-9 mounted on the Long term Ecosystem Observatory
(LEO) electro-optic fi ber optic cabled seafl oor node (Oliver et al., 2004). Rapid changes in CDOM concentration are associated with the passage of storms and a large plume of Hudson River water.
can remain in the water column for months
(Claustre et al., 2002), infl uences the rela-
tive refl ectance of the blue and green wave-
lengths of light and can result in an over-
estimate of chlorophyll a by a factor of two
to three using standard ocean color satellite
algorithms (Claustre et al., 2002). Therefore,
when interpreting ocean-color imagery, one
must ask whether the iron-rich dust leads to
a true increase in phytoplankton or whether
the perceived color change refl ects the dust
itself. The interpretation of ocean-color im-
agery is even more diffi cult in optically com-
plex waters where many different optically
signifi cant constituents infl uence remote-
sensing refl ectance.

Oceanography June 2004 27
amount of backscattered light is dependent
on the type and size of the material pres-
ent in the ocean. In contrast, absorption is
a sink for photons. Absorption is very high
in aquatic systems due to H2O molecules
that are extremely effective at absorbing red
light and phytoplankton that are effective at
absorbing blue light. The net result is that
refl ectance signal over the ocean is low (Fig-
ures 2F and 2G offer an opportunity to com-
pare the scales of refl ectance for terrestrial
leaves versus that of coastal waters).
This presents the remote-sensing engi-
neer the diffi cult task of designing sensi-
tive sensors that will not become saturated
if the signal is high, such as is the case on a
windy day when white caps and the presence
of air bubbles can lead to enhanced light
scatter. The available satellites have varying
degrees of spectral resolution ranging from
fi ve spectral bands to hyperspectral sys-
tems (often designed for terrestrial remote
sensing,<http://eo1.gsfc.nasa.gov/miscPages/
home.html>, the degree with which these
THE OPTICAL COMPLEXITY OF
COASTAL WATER S
Coastal waters are very often optically com-
plex. In nearshore continental shelf waters,
organic detritus and colored dissolved
organic matter (CDOM) are often present
in quantities suffi cient to obscure the plant
biomass signal because they infl uence the
blue-to-green refl ectance ratio (Figure 2B).
Additionally, the presence of highly scat-
tering inorganic particles and photons re-
fl ected off the seafl oor (see Limnology and
Oceanography, 48: 323-585, Figure 2D) can
complicate the quantitative interpretation of
the satellite imagery. Coastal waters are also
characterized by numerous distinct frontal
boundaries. Large changes in the in situ con-
centration of optically active constituents are
often observed across these frontal boundar-
ies (Figure 1). The spatial variability of these
frontal features is often on scales of kilome-
ters to meters (Figure 1D) and is diffi cult to
resolve with a standard 1-km satellite pixel.
How this spatial variability within a pixel
infl uences the observed satellite signal is an
open question (see Bissett et al., this issue).
Efforts to decipher this complex coastal
optical soup often use in situ measurements
to characterize observed refl ectance spectra.
This has become much easier in recent years
due to advances in instrumentation that
measure the in situ inherent optical proper-
ties [absorption (a), backscattered (bb), and
attenuation (c), note c – a = scattering (b)]
(Figure 3). One such effort, the Hyperspec-
tral Coupled Ocean Dynamics Experiment
(HyCODE), has integrated these instru-
ments into an ocean observatory (Glenn and
Schofi eld, 2003; Schofi eld et al., 2003), en-
abling bio-optical adaptive sampling of the
Mid-Atlantic Bight (Schofi eld et al., 2003).
Given the desire to develop coastal remote-
sensing applications, HyCODE focused on
a wide range of optical issues that are high-
lighted in this issue of Oceanography. As an
introduction to those efforts, this manu-
script reviews some of the major optically
active constituents that underlie the spectral
variability of remote-sensing refl ectance in
coastal waters.
Understanding the spectral variability in
ocean-color refl ectance is key to using re-
mote-sensing approaches, so our fi rst need
is to understand what underlies refl ectance.
Remote-sensing refl ectance is the above-
water ocean color and is defi ned as the ratio
of the upward fl ux of light to downward
fl ux of light incident on the ocean surface.
Atmospheric effects aside (which represent
~95 percent of the actual satellite signal),
refl ectance is a function of both the spectral
backward scattered light [bb(λ)] and spectral
absorption [a(λ)] within the water column.
The relationship between spectral refl ec-
tance [R(λ)] and the inherent optical prop-
erties can reasonably be described as
R(λ) = G bb(λ)
(1) a(λ) + bb(λ)
where G is a relatively constant param-
eter dependent on the angular distribution
of the light fi eld and the volume scatter-
ing coeffi cient (Gordon, 1975; Morel and
Prieur, 1977). Given that the magnitude of
the inherent optical properties represents
the linear combination of all optically ac-
tive constituents, the color of the refl ected
light integrates the spectral absorption and
backscattering properties for all the materi-
als present. For example, in coastal waters
the total absorption might be described by
the absorption of phytoplankton, detritus,
sediment, water, and CDOM. The net effect
is that the fi rst-order factor determining the
spectral shape and total amount of refl ec-
tance is the concentration of absorbing and
scattering constituents present; however,
it should be emphasized that the absorp-
tion and scattering effi ciencies of different
constituents vary dramatically due to their
specifi c molecular properties. For ocean-
color remote sensing, backscatter is a source
of photons from the ocean to the satellite.
Backscattered light is a small proportion
of the total scattered light, and the relative
Oscar Schofi eld ([email protected]) is
Associate Professor, Coastal Ocean Observation
Laboratory, Institute of Marine and Coastal
Sciences, Rutgers University, New Brunswick,
NJ. Robert A. Arnone is Head, Ocean Sciences
Branch, Naval Research Laboratory, Stennis
Space Center, MS. W. Paul Bissett is Research
Scientist, Florida Environmental Research
Laboratory, Tampa, FL. Tommy D. Dickey is
Professor, Ocean Physics Laboratory, University
of California at Santa Barbara, Santa Barbara,
CA. Curtiss O. Davis is at Naval Research Labo-
ratory, Washington, DC. Zoe Finkel is Graduate
Student, Coastal Ocean Observation Laboratory,
Institute of Marine and Coastal Sciences, Rutgers
University, New Brunswick, NJ. Matthew Oliver
is Graduate Student, Coastal Ocean Observa-
tion Laboratory, Institute of Marine and Coastal
Sciences, Rutgers University, New Brunswick, NJ.
Mark A. Moline is Associate Professor, Biologi-
cal Sciences Department, California Polytechnic
State University, San Luis Obispo, CA.
Oceanography June 200428
systems have utility for ocean applications is
an open area of research). Increased spectral
resolution expands the potential to improve
approaches that can invert the measured
refl ectance into its constituent components,
which have distinct absorption and scatter-
ing properties.
Given the desire to invert bulk refl ectance
into its constituent components, the ocean
optics community has focused on defi ning
the scattering and absorption properties of
the compounds that dominate ocean color.
This is often accomplished by collecting dis-
crete and in situ measurements. The fi rst ef-
forts have focused on characterizing the rela-
tive importance of the dissolved and partic-
ulate constituents, including phytoplankton,
detritus, and sediments, which dominate the
particulate material; and CDOM, small bac-
teria, colloidal material, and viruses, which
dominate the dissolved phases.
WHAT GIVES COASTAL WATER
ITS COLOR?
CDOM refers to organic matter that can
nominally pass through a 0.2 micron fi l-
ter and can be detected optically, as not
all organic compounds absorb light. High
concentrations of CDOM decrease light re-
fl ectance dramatically because its spectral
absorption can be high (Figure 2B). CDOM
is often predominantly composed of humic
Figure 2. Spectral signatures that dominate refl ectance in coastal zones. (A) A visible image taken from an aircraft spanning nearshore coastal waters over an urbanized area into an estuary in New
Jersey. Th e letters illustrate diff erent optical zones in which diff erent optical constituents dominate the refl ectance perceived from the aircraft. (B) Th e relative spectral absorption of water, colored
dissolved organic matter (CDOM), and detritus. Absorption of water in the red wavelengths is orders of magnitude higher than CDOM and detrital particles. (C) Relative absorption of diff erent
phytoplankton species (Johnsen et al., 1994) illustrating spectral variability due to diff erent phytoplankton pigments. (D) Relative spectral backscattering associated with inorganic particles (re-
drawn from Babin et al., 2003) for diff erent particle sizes with a constant refractive index. (E) Relative spectral backscattering associated with phytoplankton (redrawn from Babin et al., 2003) for
two diff erent particle sizes with a constant refractive index. (F) Refl ectance spectra for a healthy and dry leaf. Note scale for the y-axis. (G) Refl ectance for nearshore and off shore waters of the Mid-
Atlantic Bight. Columns along the x-axis indicate the spectral bands measured by SeaWIFS.

Oceanography June 2004 29
and fulvic acids, but can also include small
colloidal material. Generally, CDOM’s larg-
est impact is on absorption, but some colloi-
dal material can contribute to the backscat-
tering of light. CDOM sources include cel-
lular exudation/lysis/defecation (Kalle, 1966;
Bricaud et al., 1981; Guixa-Boixeru et al.,
1999), resuspension from sediments (Chen,
1999; Komada et al., 2002) and humic/fulvic
acids from rivers and terrestrial watersheds
(Blough et al., 1993; Vodacek et al., 1997).
Satellite algorithms for CDOM absorption
are being developed and offer in the near fu-
ture the possibility of mapping CDOM con-
centration. These algorithms are based on
empirical models that relate CDOM absorp-
tion to the ratio of green to red wavelengths
of refl ectance.
Absorption properties can also be used
to describe CDOM composition. Spectral
absorption of CDOM decreases exponen-
tially with increasing wavelength (Figure
2B). A low CDOM slope is generally inter-
preted as freshly produced material, which
is then degraded through either photo-oxi-
dation (Mopper et al., 1991; Kouassi and
Zika, 1992; Nelson et al., 1998) or microbial
activity (Whitehead, 1996). Spectral slope
increases as the material is chemically modi-
fi ed (Rashid, 1985), and over monthly time
scales, CDOM becomes increasingly refrac-
tory (Nelson et al., 1998). Mechanistic inter-
pretation of the age and source of CDOM
from the spectral slope is diffi cult due to
the complexity of the degradation process,
which is described by at least two rate con-
stants that span days to weeks (Twardowski
and Donaghay, 2002). Despite these uncer-
tainties, CDOM slope has been effectively
associated with specifi c water masses in
the Baltic Sea (Højerslev et al., 1996), Gulf
of Mexico (Carder et al., 1989), Caribbean
(Blough et al., 1993), Mid-Atlantic Bight
(Vodacek et al., 1997), and Sargasso Sea
(Nelson et al., 1998). Developing methods to
characterize CDOM composition from space
does not exist, but as the spectral resolu-
tion of satellite systems increases, the ocean
optics community will undoubtedly explore
the potential for new algorithms.
Depending on the fi lter, some organic
particles are often included in the CDOM
fraction. The most notable particles are vi-
ruses and bacteria. Viruses are very small
(~100 nm) and are not believed to contrib-
ute signifi cantly to the overall absorption
and scattering of light. Bacteria are also
abundant in the water column and con-
tribute signifi cantly to the overall scattering
properties (Morel and Ahn, 1990) in clear
ocean waters, where the contributions of
other larger particles such as phytoplankton
and sediment are small. These bacteria also
play a disproportionately large role in re-
mote-sensing refl ectance due to the relative
increase in backscattered to total scattered
light associated with small particles.
Particles are an important component in-
fl uencing the refl ectance of the ocean. Phy-
toplankton represent a dominant absorbing
constituent in most of the world’s oceans
(see below). However, in nearshore waters,
the presence of resuspended sediments can
be signifi cant. Inorganic sediment sources
can be resuspended from storms, deposited
from airborne dust, produced biologically
(Balch et al., 1991), and be transported into
coastal waters from rivers. Inorganic par-
ticles have high scattering effi ciency and
thus signifi cantly increase the light emanat-
ing from the ocean interior when present in
signifi cant concentrations (Figure 2D, note
the bright refl ectance of urbanized areas in
Figure 2A).
Phytoplankton represent a major absorb-
ing constituent in the world’s oceans due
to the presence of photosynthetic and non-
photosynthetic pigments. The absorption
variability associated with the diversity of
phytoplankton pigmentation impacts the
blue and green light refl ectance (Figure 2C).
In coastal waters, all major spectral classes
of phytoplankton (chlorophyll c-contain-
ing, phycobilin-containing, and chlorophyll
b-containing) are often present. Because
phytoplankton must harvest light for pho-
tosynthesis and light is rapidly attenuated
with depth in the ocean, phytoplankton
have evolved an extensive array of acces-
sory carotenoids. This attenuation is easily
observed in the fi eld where fi ltered material
from ocean water is most often brown due
to high concentrations of accessory carot-
enoids. This brown color contrasts with the
bright green we observe in terrestrial plants
where the chlorophylls dominate absorp-
tion characteristics. The diversity in pigment
absorption signatures is tantalizing because
it might permit discrimination of different
phytoplankton groups based on their optical
properties. While promising, one diffi culty is
the low spectral resolution available from in
situ and remote sensing. When hyperspectral
information is available, pattern recognition
and derivative analyses have proven most ef-
fective at discriminating phytoplankton taxa
using discrete data (see Chang et al., this
issue; also Schofi eld et al., 1999; Kirkpatrick
et al., 2000; Millie et al., 2002); however, this
capability has yet to be robustly achieved
using presently available remote-sensing
techniques. This remains an active area of
research.
Phytoplankton contribute signifi cantly
to the total scattering of the light. Total scat-
tering is, to fi rst order, regulated by biomass;
however, the effi ciency with which indi-
vidual phytoplankton cells contribute to
scattering can vary with phytoplankton size
and refractive index. Some of the changes
in refractive indices are due to phenotypic
features, such as internal air pockets (Sub-
ramaniam et al., 1999) or minerogenic ar-
mor (Iglesias-Rodriguez et al., 2002), or the
physiological state of the cell (Stramski, and
Reynolds, 1993; Reynolds et al., 1997). For
remote-sensing applications, phytoplankton
have a high scattering signal, but generally
only a small proportion is backscattered,
therefore phytoplankton absorption domi-
nates their contribution to refl ectance.
Oceanography June 200430
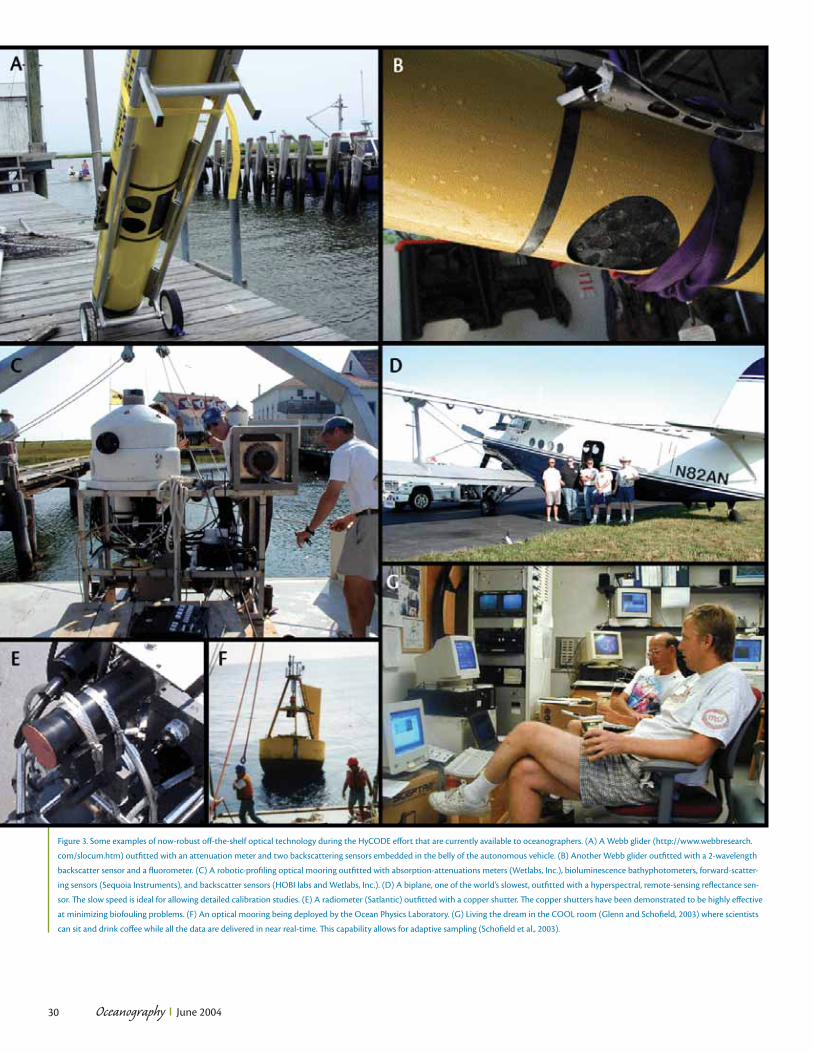
Figure 3. Some examples of now-robust off -the-shelf optical technology during the HyCODE eff ort that are currently available to oceanographers. (A) A Webb glider (http://www.webbresearch.
com/slocum.htm) outfi tted with an attenuation meter and two backscattering sensors embedded in the belly of the autonomous vehicle. (B) Another Webb glider outfi tted with a 2-wavelength
backscatter sensor and a fl uorometer. (C) A robotic-profi ling optical mooring outfi tted with absorption-attenuations meters (Wetlabs, Inc.), bioluminescence bathyphotometers, forward-scatter-
ing sensors (Sequoia Instruments), and backscatter sensors (HOBI labs and Wetlabs, Inc.). (D) A biplane, one of the world’s slowest, outfi tted with a hyperspectral, remote-sensing refl ectance sen-
sor. Th e slow speed is ideal for allowing detailed calibration studies. (E) A radiometer (Satlantic) outfi tted with a copper shutter. Th e copper shutters have been demonstrated to be highly eff ective
at minimizing biofouling problems. (F) An optical mooring being deployed by the Ocean Physics Laboratory. (G) Living the dream in the COOL room (Glenn and Schofi eld, 2003) where scientists
can sit and drink coff ee while all the data are delivered in near real-time. Th is capability allows for adaptive sampling (Schofi eld et al., 2003).
Oceanography June 2004 31
Detrital particles represent nonliving
organic matter including fecal pellets, cell
fragments, large colloids, and marine snow.
An exponentially decreasing slope describes
detrital spectral absorption, but the slope is
typically less steep than for CDOM (Figure
2B). The relative backscatter of detritus can
be high compared to that of phytoplankton
(Stramski and Kiefer, 1991), but of all the
optical constituents, detrital particles remain
relatively understudied. This lack of infor-
mation is problematic in coastal-water stud-
ies where detrital absorption can represent
up to 30 percent of the blue light absorption
signal (Schofi eld et al., In press).
WHERE DO WE GO FROM HERE?
Coastal waters are complex, but recent
advances in optical instrumentation al-
low the oceanographer to decipher this
complex soup, as highlighted in the other
manuscripts in this issue. Optical data allow
ocean-observing networks to serve the needs
of chemists and biologists by providing data
over ecologically relevant scales. It is our
hope that the wider community will adopt
these measurements and approaches so that
one day they become as standard as a Con-
ductivity-Temperature-Depth (CTD) sensor
in the oceanographer’s tool box.
ACKNOWLEDGEMENTS
We wish to acknowledge the support of the
Offi ce of Naval Research (ONR)-sponsored
HyCODE program and the numerous in-
vestigators that made this a fun and exciting
program. We are extremely thankful to John
Cullen and Heidi Sosik, both of whom pro-
vided constructive and extensive reviews that
greatly improved this manuscript.
REFERENCESBabin, M., A. Morel, V. Fournier-Sicre, F. Fell, and D. Strams-
ki, 2003: Light scattering properties of marine particles in coastal and open ocean waters as related to the particle mass concentration. Limnol. Oceanogr., 48, 843-859.
Balch, W.M., P.M. Holligan, S.G. Ackelson, and K.J. Voss, 1991: Biological and optical properties of mesoscale coccolithophore blooms in the Gulf of Maine. Limnol. Oceanogr., 36, 629-643.
Behrenfeld, M.J., and P.G. Falkowski, 1997: Photosynthetic rates derived from satellite-based chlorophyll concentra-tion. Limnol. Oceanogr., 42, 1-20.
Blough, N.V., O.C. Zafririou, and J. Bonilla, 1993: Optical absorption spectra of waters from the Orinoco River outfl ow–terrestrial input of colored organic matter to the Caribbean. J. Geophys. Res., 98, 2271-2278.
Bricaud, A., A. Morel, and L. Prieur, 1981: Absorption by dis-solved organic matter of the sea (yellow substance) in the UV and visible domains. Limnol. Oceanogr., 26, 45-53.
Carder, K.L., R.G. Steward, G.R. Harvey, and P.B. Ortner, 1989: Marine humic and fulvic acids: their effects on remote sensing of chlorophyll a. Limnol. Oceanogr., 34, 68-81.
Chen, R.F., 1999: In situ fl uorescence of dissolved organic matter in seawater. Mar. Chem., 37, 191-221.
Clauste, H., A. Morel, S.B. Hooker, M. Babin, D. Antoine, K. Oubelkheir, A. Bricaud, K. Leblanc, B. Queguiner, and S. Maritorena, 2002: Is desert dust making oligotrophic waters greener? Geophy. Res. Let., 29 (107), 1-4.
Glenn, S.M., and O. Schofi eld, 2003: Observing the oceans from the COOLroom: Our history, experience, and opin-ions. Oceanogr., 16( 4), 37-52.
Gordon, H.R., O.B. Brown, R.H. Evans, J.W. Brown, R.C. Smith, K.S. Baker, and D.K. Clark,1988: A semianalytic radiance model of ocean color. J. Geophys. Res., 93 (10), 909-24.
Guixa-Boixeru, N., D. Vaque, J.M. Gasol, and C. Pedros-Alio, 1999: Distribution pf viruses and the potential effect on bacterioplankton in an oligotrophic marine system. Aquat. Microb. Ecol., 19, 205-213.
Højerslev, N.K., N. Holt, and T. Aarup, 1996: Optical mea-surements in the North Sea-Baltic Sea transition zone. I. on the origin of the deep water in Kattegat. Cont. Shelf. Res., 16, 1329-1342.
Iglesias-Rodriguez, M.D., C.W. Brown, S.C. Doney, J.A. Kleypas, D. Kolber, Z. Kolber, P.K. Hayes, and P.G. Falkowski, 2002: Representing key phytoplankton functional groups in ocean carbon cycle models: Coc-colithophorids. Global Biogeochem. Cycles, 16(1100), 47(1)-47(20).
Johnsen, G., O. Samset, L. Granskog, E. Sakshaug, 1994: In vivo absorption characteristics in 10 classes of bloom-forming phytoplankton: taxonomic characteristics and responses to photoadaptation by means to discriminant and HPLC analysis. Mar. Ecol. Prog. Ser., 105, 149-157.
Kalle, K., 1966: The problem of the gelbstoff in the sea. Mar. Biol. Rev., 4, 91-04.
Kirkpatrick, G., D.F. Millie, M.A. Moline, and O. Schofi eld, 2000: Absorption-based discrimination of phytoplank-ton species in naturally mixed populations. Limnol. Oceanogr., 42, 467-471.
Komada, T., O. Schofi eld, and C. Reimers, 2002: Fluorescence characteristics of organic matter released from coastal sediments during resuspension. Mar. Chem., 79, 81-97.
Kouassi, A.M., and R.G. Zika, 1992: Light-induced destruc-tion of the absorbance property of dissolved organic matter in seawater. Toxicol. Environ. Chem., 35, 195-211.
Longhurst, A., 1998: Ecological Geography of the Sea. Aca-demic Press, CA, 398 pp.
Longhurst, A., S. Sathyendranath, T. Platt, and C. Caverhill, 1995: An estimate of global primary production in the ocean from satellite radiometer data. J. Plank. Res., 17, 1,245-1,271.
Martin, J.H. 1990: Glacial-interglacial CO2 change: The iron hypothesis. Paleooceanogr., 5, 1-13.
Millie, D.F., O. Schofi eld, G.J. Kirkpatrick, G. Johnsen, and T.J. Evens, 2002: Using absorbance and fl uorescence spectra to discriminate microalgae. European J. Phycol., 37, 313-322.
Mopper, K., X.L. Zhou, R.J. Kieber, R.J. Sikorski, and R.D. Jones, 1991: Photochemical degradation of dissolved or-ganic carbon and its impact on the oceanic carbon cycle. Nature, 353, 60-62.
Morel, A., and Y-H. Ahn, 1990: Optical effi ciency factors of free-living marine bacteria: infl uence of bacterioplank-ton upon the optical properties and particulate organic carbon in oceanic waters. J. Mar. Res., 48, 145-162.
Morel, A., and L. Prieur, 1997: Analysis of variations in ocean color. Limnol. Oceanogr., 22, 709-22.
Moulin, C., H.R. Gordon, R.M. Chomoko, V.F. Banzon, and R.H. Evans, 2001: Atmospheric correction of ocean color imagery through thick layers of Saharan dust. Geophys. Res. Let., 28, 5-8.
Nelson, N.B., D.A. Siegel, and A.F. Michaels, 1998: Seasonal dynamics of colored dissolved organic material in the Sargasso Sea. Deep-Sea Res., 45, 931-957.
Ohlmann, J.C., D.A. Siegel, and C.D. Mobley, 2000: Ocean radiant heating: Part 1. optical infl uences. J. Phys. Ocean-ogr., 30, 1,833-1,848.
Oliver, M.W., O. Schofi eld, T. Bergmann, S.M. Glenn, M.A. Moline, and C. Orrico, In Press: In-situ optically derived phytoplankton absorption properties in coastal waters and its utility for estimating primary productivity rates. J. Geophys. Res.
Platt, T., and S. Sathyendranath, 1988: Oceanic primary production: Estimation by remote sensing at local and regional scales. Science, 241, 1613-1620.
Prospero, J.M., and R.T. Nees, 1986: Impact of the North African drought and El-Nino on the mineral dust in the Barbados trade winds. Nature, 320: 735-738.
Rashid, M.A., 1985: Geochemistry of Marine Humic Com-pounds. Springer-Verlag, New York.
Reynolds, R.A., D. Stramski, and D.A. Kiefer, 1997: The ef-fect of nitrogen-limitation on the absorption and scat-tering properties of the marine diatom Thalassiosira pseudonana. Limnol. Oceanogr., 42, 881-892.
Ryan, J.P., J.A. Yoder, P.C. Cornillon, and J.A. Barth, 1999a: Chlorophyll enhancement and mixing associated with meanders of the shelfbreak front in the Mid-Atlantic Bight. J. Geophys. Res., 104, 23,479-23,493.
Ryan, J.P., J.A. Yoder, and P.C. Cornillon, 1999b: Enhanced chlorophyll at the shelfbreak of the Mid-Atlantic Bight and Georges Bank during the spring transition. Limnol. Oceanogr., 44, 1-11.
Sathyendranath, S., and T. Platt, 1989: Computation of aquatic primary production: Extended formalism to in-clude effect of angular and spectral distribution of light. Limnol. Oceanogr. 34, 188-198.
Schofi eld, O., J. Gryzmski, P. Bissett, G. Kirkpatrick, D.F. Millie, M.A. Moline, and C. Roesler, 1999: Optical moni-toring and forecasting systems for harmful algal blooms: possibility or pipedream? J. Phycol., 35, 125-145.
Schofi eld, O., W.P. Bissett, T.K. Frazer, D. Iglesias-Rodriguez, M.A. Moline, and S. Glenn, 2003: Development of re-gional coastal ocean observatories and the potential ben-efi ts to marine sanctuaries. Mar. Tech. Soc., 37, 54-67.
Schofi eld, O., T. Bergmann, W.P. Bissett, A. Irwin, G. Kirk-patrick, M.A. Moline, C. Orrico, and M. Oliver, In Press: Inverting inherent optical signatures in the nearshore coastal waters at the Long Term Ecosystem Observatory. J. Geophys. Res.
Stramski, D.F. and D.A. Kiefer, 1991: Light scattering by microorganisms in the open ocean. Prog. Oceanogr., 28, 343-383.
Stramski, D., and R.A. Reynolds, 1993: Diel variations in the optical properties of a marine diatom. Limnol. Oceanogr., 38, 1,347-1,364.
Subramaniam, A., E.J. Carpenter, and P.G. Falkowski, 1999: Optical properties of the marine diazotrophic cyano-bacteria Trichodesmium spp.: II- a refl ectance model for remote sensing. Limnol. Oceanogr., 44, 608-617.
Twardowski, M.S., and P.L. Donaghay, 2002: Photobleaching of aquatic dissolved materials: absorption removal, spec-tral alteration, and their interrelationship. J. Geophys. Res, 107(C8), 6.1-6.12.
Vodacek, A., N.V. Blough, M.D. DeGrandpre, E.T. Peltzer, and R.K. Nelson, 1997: Seasonal variation of CDOM and DOC in the Middle Atlantic Bight: Terrestrial inputs and photooxidation. Limnol. Oceanogr., 42, 674-686.
Whitehead, R.F., S. de Mora, S. Demers, M. Gosselin, P. Monfort, and B. Mostajir, 1996: Interactions of ultra-violet-B radiation, mixing, and biological activity on photobleaching of natural chromophoric dissolved organic matter: a mesocosm study, Limnol. Oceanogr., 45, 278-291.