coastline dynamics and raising landform: a geo-informatics
TRANSCRIPT
Coastline Dynamics and Raising Landform: A Geo-informatics Based Study on the Bay of Bengal, BangladeshEbadullah Khan and Nur Hussain
Received: July 2017 / Accepted: March 2018 © 2018 Faculty of Geography UGM and The Indonesian Geographers Association
Abstract The southern part of Bangladesh is bounded by the Bay of Bengal. Three major river systems which are: Brahmaputra-Jamuna, Ganges-Padma and Surma-Kusiara have developed the Ganges-Brahmaputra-Meghna (GBM) floodplain, this covers 80% area of Bangladesh. These rivers carry huge sediments from upper Himalayan region during monsoon period. On the contrary, as the costal part of Bangladesh is open to the sea, so high wave actions, strong wind flow, tidal actions are prevailing here. Consequently, coastline of this part is unstable and dynamic. Coastline change dy-namics is significant for disaster management, coastal planning and environmental management. Rennell’s map (1776), Landsat MSS (1976) and Landsat OLI (2016) images have been used to explore the coastline using tools of Remote Sensing and Geographic Information System (GIS) of Geo-informatics. During 240 years since 1776 to 2016 about 3892 km2 land instead of landform have been raised in coastal area of Bangladesh.
Abstrak Bagian selatan Bangladesh dibatasi oleh Teluk Benggala. Tiga sistem sungai utama seperti; Brahmaputra-Jamuna, Gangga-Padma dan Surma-Kusiara telah membentuk dataran banjir Gangga-Gerbang Brahmaputra-Meghna (GBM), daerah ini mencakup 80% wilayah Bangladesh. Sungai-sungai tersebut membawa sedimen besar dari wilayah Himalaya bagian atas pada saat musim hujan. Sebaliknya, karena bagian pesisir Bangladesh terbuka terhadap laut, maka gelombang tinggi, aliran angin kencang, tindakan pasang surut berlaku di sini. Akibatnya, garis pantai bagian ini tidak stabil dan din-amis. Perubahan dinamika garis pantai penting untuk manajemen bencana, perencanaan pesisir dan pengelolaan lingkun-gan. Untuk penggambaran identifikasi garis pantai, peta Rennell (1776), Landsat MSS (1976) dan Landsat OLI (2016) telah diinterpretasikan dengan menggunakan alat Teknologi Penginderaan Jarak Jauh dan Sistem Informasi Geografis (SIG) Geo-informatika. Selama 240 tahun dari tahun 1776 sampai 2016 sekitar 3892 km2 dataran, telah terbentuk di daerah pesisir Bangladesh..
Keywords: Remote Sensing; Global Mean Sea Level; Geospatial change; Coastal dynamics.
Kata kunci: Penginderaan jauh; Tingkat Laut Rata-rata Global; Perubahan geospasial; Dinamika pesisir.
1. IntroductionCoastal landform of Bangladesh is dynamic and
changes rapidly. The southern part of Bangladesh is bounded by the Bay of Bengal. For coastal zone monitoring, coastline extraction in various times is a fundamental work. Coastline is defined as the line of contact between land and the water body. Coastline is one of the most important linear features on the earth’s surface, which has a dynamic nature [Winarso, et al., 2001]. So the Coastline of Bangladesh is changing and shifting gradually southward [Brammer, 2014]. As a result, the new landform has been emerged frequently due to shifting of coastline. In IPCC Assessment Report 4 (2007), the coastal chapter assessed the impact of climate change and a global sea level rise up to 0.59 m in 2090s. The GMSL [Global Mean Sea Level] rise is projected to be 0.28-0.98 meter by 2100 although with regional variations and local factors the local sea level Ebadullah KhanDepartment of Geography and Environment, Jahangirnagar Univer-sity, Savar, Dhaka-1342, Bangladesh
Nur HussainSpace technology Application, Beijing University of Aeronautics and Astronautics - Beihang University, Beijing, ChinaCorresponding email: [email protected]
rise can be higher than the projected for the GMSL. Assessments of coastal impacts, vulnerability and adaptation need to consider relative sea level rise, which includes climate-induced GMSL rise and regional variations as well as local non-climate related sea level changes [IPCC, 2001; IPCC, 2007 and IPCC, 2014]. These reports refer to the gradually sea level rise that is proclaimed to be a serious threat for the lower part of the earth; specially, the coastal zone of Bangladesh. The remote sensing technology is used to detect the spatial change on the landfrom during the temporal variation. The change of shape, size, pattern, distribution, trend of change has been explored by using of the remote sensing technology. Remote sensing technology is very fruitful to explore the coastline change and land pattern change of a coastal zone. A study by Jadavpur University observed that total land area of 6402.09 km2 of Indian Sundarbans in the year 2001 has been found to be reduced to 6358.048 km2 in 2009 registering a land net loss of 44.042 km2. This includes erosion of 64.162 km2 and the accretion of 20.120 km2 [Hazra et al., 2002]. The Sundarban area of Bangladesh is located at the upper part of Swatch of no ground. So the transported sediments cannot deposited in this coastal zone but in the other side (Meghna estuary), where a
ISSN 2354-9114 (online), ISSN 0024-9521 (print)Indonesian Journal of Geography Vol. 50, No. 1, June 2018 (41 - 48)DOI: http://dx.doi.org/10.22146/ijg.26655, website: https://jurnal.ugm.ac.id/ijg© 2018 Faculty of Geography UGM and The Indonesian Geographers Association

COASTLINE DYNAMICS AND RAISING LANDFORM Ebadullah Khan and Nur Hussain
42
large amount of sediments is being deposited every year [Brammer, 1996; Hussain et al., 2017]. As a results, a large amount of newly landform has been raised in this site. In this aspect, the main aim of this research is to explore the coastline change and raised landforms at the coastal zones of Bangladesh during 240 years from 1776 to 2016.
2. The MethodsAt first, the location of coastline is found from the
Rennell’s Map on 1776 (James Rennell’s survey of Bengal and Bihar, considered one of the greatest technical achievements of cartography of the 18th Century). The Rennell’s coastline [Rennell;s Map 1776], Landsat MSS of 1976 and Landsat OLI of 2016 images have been used to indicate the 240 years of coastal change detections and emerged landforms of Bangladesh by using of geospatial and geo-informatics tools and techniques. Spatial adjustment approach of geo-referencing system use to compare between this old map and satellite image [Mugnier, 2009; Lavreau, 2016]. This research has been taken some geo-spatial approaches to obtain the main purpose. Data processing approaches has been described in section 2.2 and 2.3 with accuracy of data
The southernmost part of Bangladesh is bordered by about 710 km coastline of Bay of Bengal which covers 19 districts out of 64 districts of the country [Shibly and Takewaka, 2013]. The geographic location of study area 21°51’ N to 20°45’ N latitude and 89°56’ E to 92°20’ E Longitude. The morphology of the study area is dominated by upstream fluvial process of Ganges and Brahmaputra river [Brammer, 1996; Brammer, 2014, Sarker et al., 2013; Akter et al., 2015] (Map 1). The study area has been divided into three sections (Map 2). such as; a) west section is Sundarban zone, b)
Middle section is Meghna estuary zone, c) east section; Chittagong-Cox’s Bazar zone.
The relevant data is collected from Primary and Secondary sources. The Rennell’s Map of Bengal and Behar-1776 have been used to detect the coastline of 1776. Rennell originated this old map and continually updated this maps for accuracy and added new geospatial information, using indigenous maps and drawings. He mentioned the coastline on this map. The mean see level concept has come at 1915 to 1921 In the UK, the Ordnance Datum, in Europe vertical elevation references (European Vertical Reference System) are made to the Amsterdam Peil elevation, which dates back to the 1690s. Rennell drown this map by using cartographic methods included gleaning information from earlier maps, measuring distances along roads, establishing the coordinates of control points, and then creating a “graticule” or grid to create his maps . So there have no way to detect the mean sea level but aspect of accuracy, Rennell’s maps were of such accuracy and quality that they were used well into the 19th century and this map. This map has more detail information than European maps and used in 1782 as study of ocean current in England [University of Michigan, 2017]. However this map only the historical evidence to detect the coastline of 18th century. Landsat MSS-1976 and Landsat OLI-2016 have been used to detect the changes. The Landsat satellite have taken image at 11.am in Bangladesh time (GMT+ 6.00). This time were low tide period in this study area. As a result, all satellite imageries have been taken at the low tide time and all image have low tide characteristics. According to Bangladesh Methodological Department (BMD) the water level was about 1.5 meter above the mean sea level this time (observation of BMD statistical record).
Map 1. Geomorphic character of Bangladesh Map 2. Study area
Indonesian Journal of Geography, Vol. 50 No. 1, June 2018 : 41 - 48
43
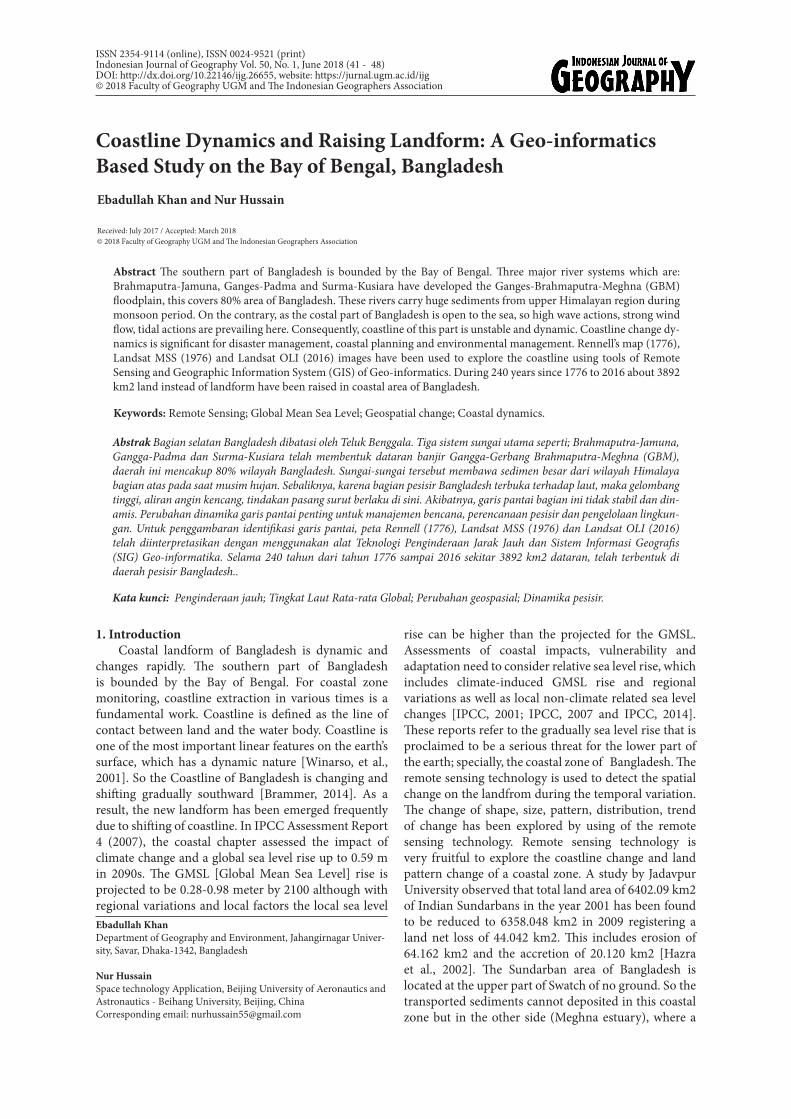
Data Processing ApproachesThere are several technical approaches have been
applied to explore the dynamic changes of the coastline. These approaches flow gradually step-by-step using some techniques and processes. The methodological complexity has been found to compare between this old map and satellite image [Cajthaml, 2011]. However, this map is the only historical evidence available to detect the coastline so this research have been approved the geometric correction of this map to compare with the satellite images. Firstly, the geometric correction have been done to compare the old map with the satellite images. Rennell considered Kolkata (Calcutta) as his control point then assumed the geospatial location by calculating distance of several control point from north and south Pole [University of Michigan, 2017]. Several control points have been observed to prepare geometric correction by using geo-referencing tools. The coastline data from Rennell’s Map of 1776 have been collected and data converted into vector data set by using GIS technology (Arc GIS10.2). Next, coastline data have been collected from satellite imageries of Landsat series at the same time (January) for each of the time interval.
For analyzing the data, same band combination has been used. The mid and near infrared spectral bands of satellite images have strong reflectance by soil and vegetation and absorbance by water, which make possible to separate the land from water and can be used to detect the shoreline position [Kuleli, 2010]. Landsat Multi-spectral Scanner (MSS) imageries have been used for defining the 1976 coastline, which the near infrared band (NIR, Band-4) is effective for coastline detection. Similarly, the Landsat Operational Land Image (OLI) imageries of 2016 has been used to define the 2016’s coastline and for these imageries, the near infrared (NIR, band-5) is effective for coastline detection. Bangladesh Transverse Mercator (BTM) has been used as coordinate system reference for spatial analysis.
3. Result and Discussion Coastline is also known as shoreline [Sing, 2008].
The coastline or Shoreline is the line of demarcation between land and water. It fluctuates from moment to moment influenced by waves and tides [Bloom, 1979]. So the coastline is a line that forms the boundary between the land and the water body of ocean. It is complex to differentiate between coastline and riverbank for the concerned area due to the presence of many adjacent rivers. As the coastline of Bangladesh is mostly curved, so the whole coastline is divided into three sections; such as “section a” which is associated with Sundarban, “section b” which is associated with Meghna estuary and “section c” which is associated with Chittagong-Cox’s Bazar coast. Each section has
Table 1. Satellite image source references.Year Reference ( Path/Row) Landsat
Band1976 138/45, 137/45, 135/45,
138/44, 137/44, 135/44Landsat MSS
2016 138/45, 137/45, 135/45, 138/44, 137/44, 135/44
Landsat OLI
Figure1. Data processing approaches
COASTLINE DYNAMICS AND RAISING LANDFORM Ebadullah Khan and Nur Hussain
44
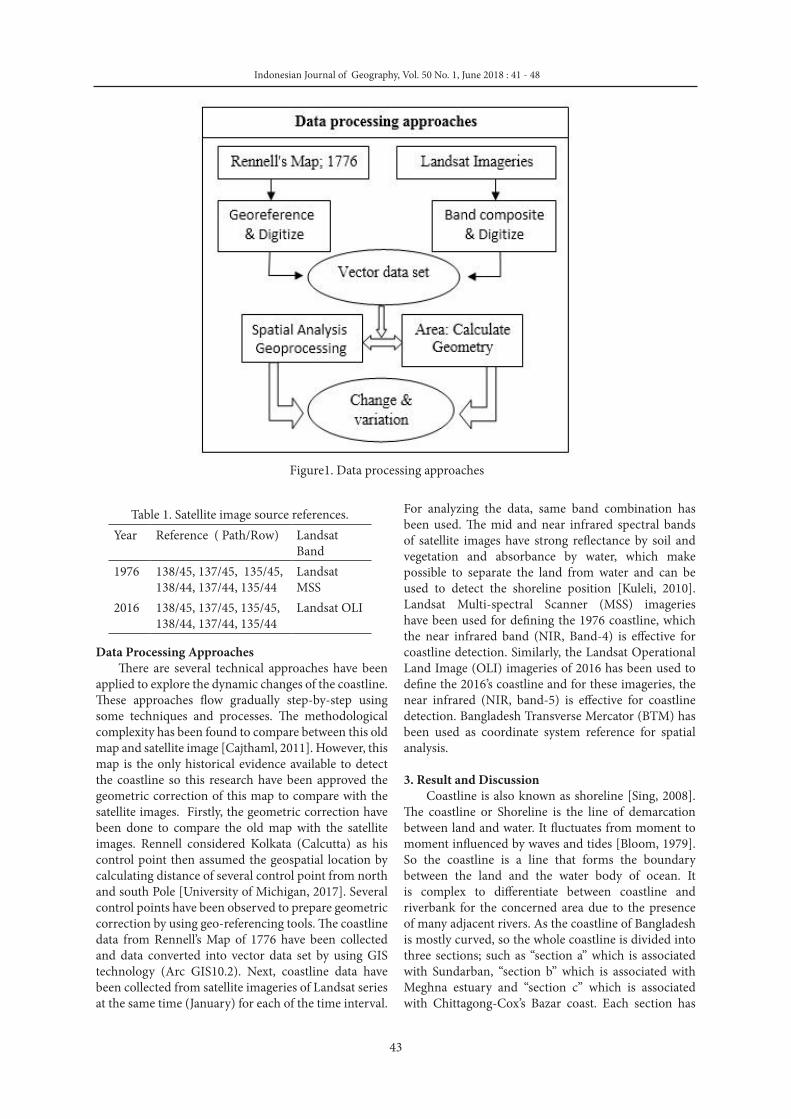
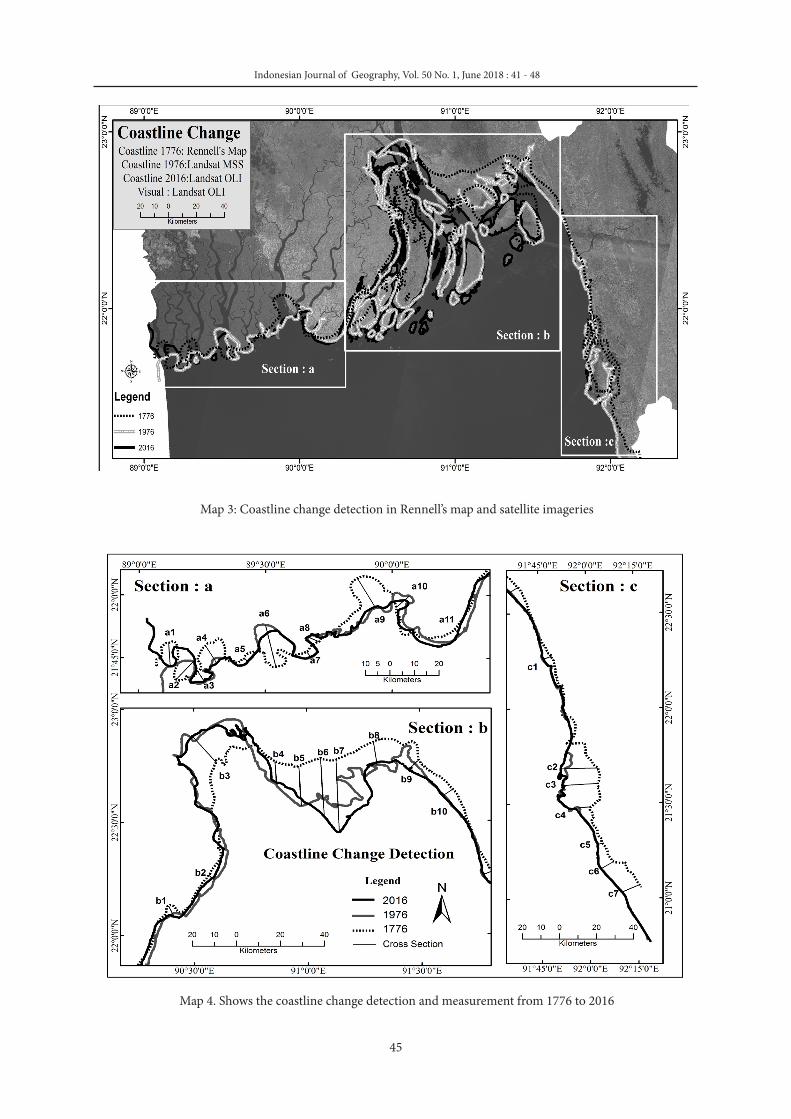
been dissected into several cross sections. In ‘‘section: a’’ the coastline is shifted into different directions at different period. In the concerned period, these cross sections irregularly shifted to seaward and landward. In cross section ‘a1’north to south, in ‘a2’ south-west to north-east, in ‘a3’north to south, in ‘a4’ north to south, in ‘a5’ north to south, in ‘a6’ south to north, in ‘a7’ north to south, in ‘a8’ north to south, in ‘a9’ north-west to south-east, in ‘a10’ west to east, in ‘a11’ north-west to south-east (Figure 08).
In ‘section: a’ the average coastline change of linear distance from north to south and from north-west to south-east direction is 6.54 km in the period of 1776 to 1976, 0.08 km in the period of 1976 to 2016 and 6.62 kms as a whole from 1776 to 2016 (Table 2). On the other hand, in the south to north directions, average coastline change of linear distance is 7.85 km in the period of 1776 to 1976 and 6.82 km in the period of 1776 to 2016 (Map 3).
In ‘‘section: b’’ the coastline is shifted into different directions at different period. In the concerned period, these cross sections irregularly shifted from landward to seaward. In cross section ‘b1’ north-west to south-east, in ‘b2’ north-west to south-east, in ‘b3’ south-east
to north-west, in ‘b4’ north to south, in ‘b5’ north to south, in ‘b6’ north to south, in ‘b7’ north to south, in ‘b8’ north to south, in ‘b9’ north-east to south-west, in ‘b10’ north-east to south-west (Figure 08). In ‘section: b’ the average change north to south and north-west to south-east direction is 10.81 km at 1776 to 1976 and 12.55 km. at 1776 to 2016 (Table 2). On the inverse south to north directions average change is 3.28 km in 1776 to 1976 and 2.75 km. in 1776 to 2016 (Table 3).
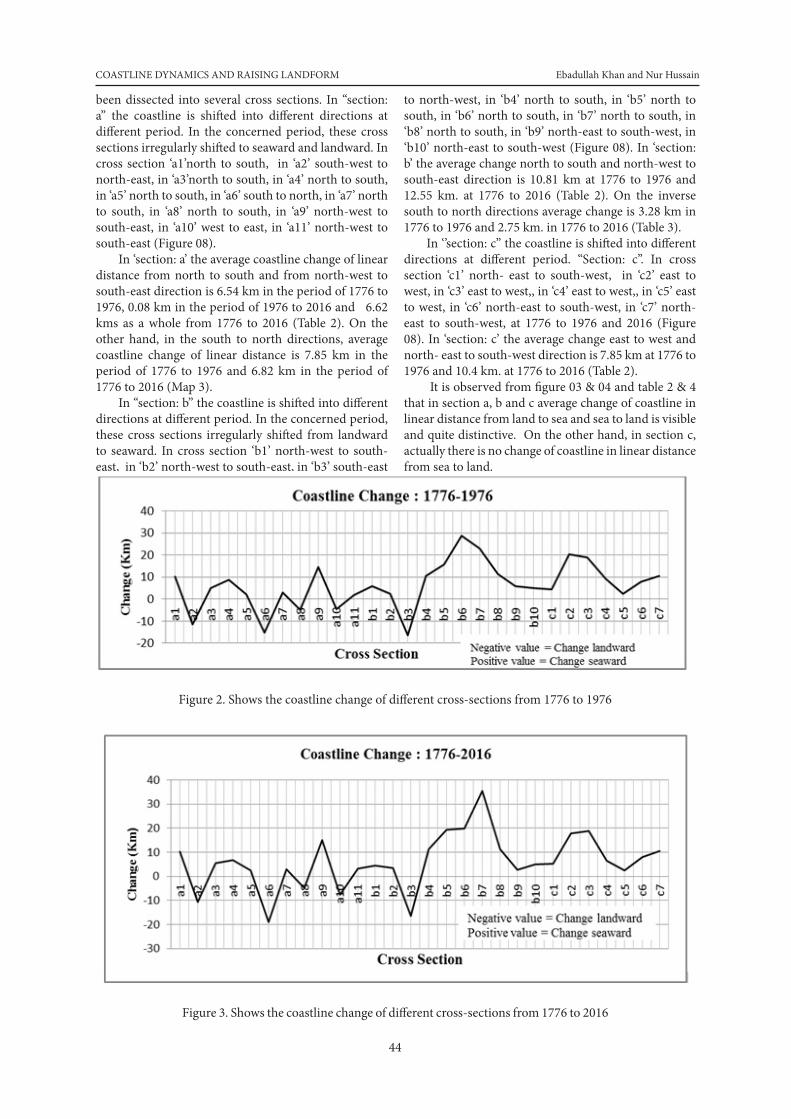
In ‘’section: c’’ the coastline is shifted into different directions at different period. “Section: c”. In cross section ‘c1’ north- east to south-west, in ‘c2’ east to west, in ‘c3’ east to west,, in ‘c4’ east to west,, in ‘c5’ east to west, in ‘c6’ north-east to south-west, in ‘c7’ north-east to south-west, at 1776 to 1976 and 2016 (Figure 08). In ‘section: c’ the average change east to west and north- east to south-west direction is 7.85 km at 1776 to 1976 and 10.4 km. at 1776 to 2016 (Table 2).
It is observed from figure 03 & 04 and table 2 & 4 that in section a, b and c average change of coastline in linear distance from land to sea and sea to land is visible and quite distinctive. On the other hand, in section c, actually there is no change of coastline in linear distance from sea to land.
Figure 2. Shows the coastline change of different cross-sections from 1776 to 1976
Figure 3. Shows the coastline change of different cross-sections from 1776 to 2016
Indonesian Journal of Geography, Vol. 50 No. 1, June 2018 : 41 - 48
45
Map 3: Coastline change detection in Rennell’s map and satellite imageries
Map 4. Shows the coastline change detection and measurement from 1776 to 2016
COASTLINE DYNAMICS AND RAISING LANDFORM Ebadullah Khan and Nur Hussain
46
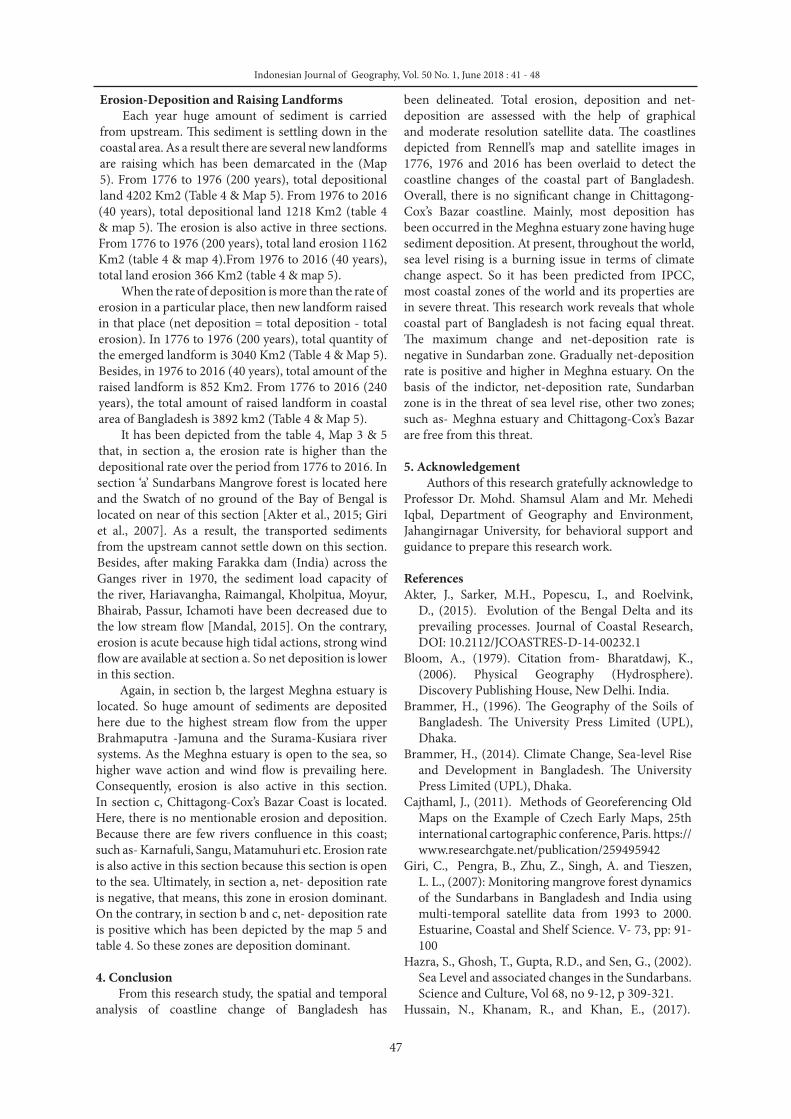
Table 2. Average coastline change (cross sections) of linear distance from land to seaPeriod Section a (in km) Section b (in km) Section c (in km)
1776-1976 6.54 10.81 7.851976-2016 0.08 1.74 2.191776-2016 6.62 12.55 10.04
Table 3. Average coastline change (cross sections) of linear distance from Sea to landPeriod Section a (in km) Section b (in km) Section c (in km)
1776-1976 7.85 3.28 0.001976-2016 2.65 0.00 0.001776-2016 10.50 2.75 0.00
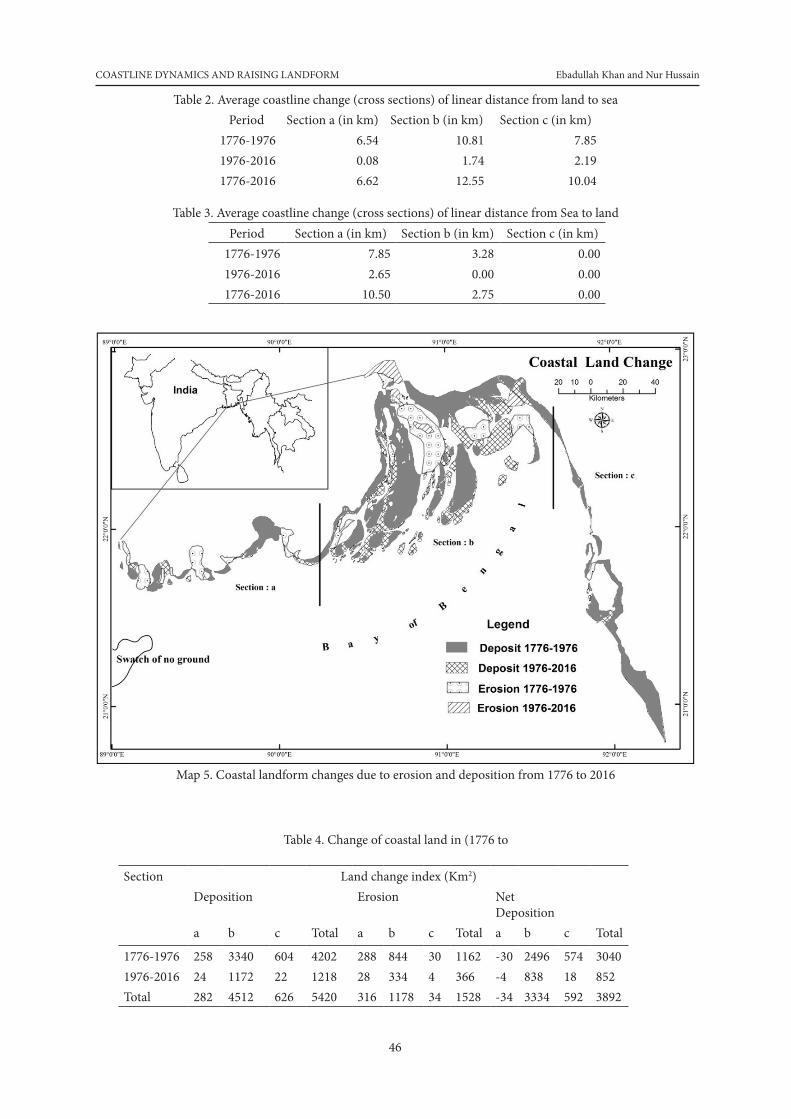
Map 5. Coastal landform changes due to erosion and deposition from 1776 to 2016
Table 4. Change of coastal land in (1776 to
Section Land change index (Km2)Deposition Erosion Net
Depositiona b c Total a b c Total a b c Total
1776-1976 258 3340 604 4202 288 844 30 1162 -30 2496 574 30401976-2016 24 1172 22 1218 28 334 4 366 -4 838 18 852Total 282 4512 626 5420 316 1178 34 1528 -34 3334 592 3892
Indonesian Journal of Geography, Vol. 50 No. 1, June 2018 : 41 - 48
47
Erosion-Deposition and Raising LandformsEach year huge amount of sediment is carried
from upstream. This sediment is settling down in the coastal area. As a result there are several new landforms are raising which has been demarcated in the (Map 5). From 1776 to 1976 (200 years), total depositional land 4202 Km2 (Table 4 & Map 5). From 1976 to 2016 (40 years), total depositional land 1218 Km2 (table 4 & map 5). The erosion is also active in three sections. From 1776 to 1976 (200 years), total land erosion 1162 Km2 (table 4 & map 4).From 1976 to 2016 (40 years), total land erosion 366 Km2 (table 4 & map 5).
When the rate of deposition is more than the rate of erosion in a particular place, then new landform raised in that place (net deposition = total deposition - total erosion). In 1776 to 1976 (200 years), total quantity of the emerged landform is 3040 Km2 (Table 4 & Map 5). Besides, in 1976 to 2016 (40 years), total amount of the raised landform is 852 Km2. From 1776 to 2016 (240 years), the total amount of raised landform in coastal area of Bangladesh is 3892 km2 (Table 4 & Map 5).
It has been depicted from the table 4, Map 3 & 5 that, in section a, the erosion rate is higher than the depositional rate over the period from 1776 to 2016. In section ‘a’ Sundarbans Mangrove forest is located here and the Swatch of no ground of the Bay of Bengal is located on near of this section [Akter et al., 2015; Giri et al., 2007]. As a result, the transported sediments from the upstream cannot settle down on this section. Besides, after making Farakka dam (India) across the Ganges river in 1970, the sediment load capacity of the river, Hariavangha, Raimangal, Kholpitua, Moyur, Bhairab, Passur, Ichamoti have been decreased due to the low stream flow [Mandal, 2015]. On the contrary, erosion is acute because high tidal actions, strong wind flow are available at section a. So net deposition is lower in this section.
Again, in section b, the largest Meghna estuary is located. So huge amount of sediments are deposited here due to the highest stream flow from the upper Brahmaputra -Jamuna and the Surama-Kusiara river systems. As the Meghna estuary is open to the sea, so higher wave action and wind flow is prevailing here. Consequently, erosion is also active in this section. In section c, Chittagong-Cox’s Bazar Coast is located. Here, there is no mentionable erosion and deposition. Because there are few rivers confluence in this coast; such as- Karnafuli, Sangu, Matamuhuri etc. Erosion rate is also active in this section because this section is open to the sea. Ultimately, in section a, net- deposition rate is negative, that means, this zone in erosion dominant. On the contrary, in section b and c, net- deposition rate is positive which has been depicted by the map 5 and table 4. So these zones are deposition dominant.
4. Conclusion From this research study, the spatial and temporal
analysis of coastline change of Bangladesh has
been delineated. Total erosion, deposition and net-deposition are assessed with the help of graphical and moderate resolution satellite data. The coastlines depicted from Rennell’s map and satellite images in 1776, 1976 and 2016 has been overlaid to detect the coastline changes of the coastal part of Bangladesh. Overall, there is no significant change in Chittagong-Cox’s Bazar coastline. Mainly, most deposition has been occurred in the Meghna estuary zone having huge sediment deposition. At present, throughout the world, sea level rising is a burning issue in terms of climate change aspect. So it has been predicted from IPCC, most coastal zones of the world and its properties are in severe threat. This research work reveals that whole coastal part of Bangladesh is not facing equal threat. The maximum change and net-deposition rate is negative in Sundarban zone. Gradually net-deposition rate is positive and higher in Meghna estuary. On the basis of the indictor, net-deposition rate, Sundarban zone is in the threat of sea level rise, other two zones; such as- Meghna estuary and Chittagong-Cox’s Bazar are free from this threat.
5. AcknowledgementAuthors of this research gratefully acknowledge to
Professor Dr. Mohd. Shamsul Alam and Mr. Mehedi Iqbal, Department of Geography and Environment, Jahangirnagar University, for behavioral support and guidance to prepare this research work.
References Akter, J., Sarker, M.H., Popescu, I., and Roelvink,
D., (2015). Evolution of the Bengal Delta and its prevailing processes. Journal of Coastal Research, DOI: 10.2112/JCOASTRES-D-14-00232.1
Bloom, A., (1979). Citation from- Bharatdawj, K., (2006). Physical Geography (Hydrosphere). Discovery Publishing House, New Delhi. India.
Brammer, H., (1996). The Geography of the Soils of Bangladesh. The University Press Limited (UPL), Dhaka.
Brammer, H., (2014). Climate Change, Sea-level Rise and Development in Bangladesh. The University Press Limited (UPL), Dhaka.
Cajthaml, J., (2011). Methods of Georeferencing Old Maps on the Example of Czech Early Maps, 25th international cartographic conference, Paris. https://www.researchgate.net/publication/259495942
Giri, C., Pengra, B., Zhu, Z., Singh, A. and Tieszen, L. L., (2007): Monitoring mangrove forest dynamics of the Sundarbans in Bangladesh and India using multi-temporal satellite data from 1993 to 2000. Estuarine, Coastal and Shelf Science. V- 73, pp: 91-100
Hazra, S., Ghosh, T., Gupta, R.D., and Sen, G., (2002). Sea Level and associated changes in the Sundarbans. Science and Culture, Vol 68, no 9-12, p 309-321.
Hussain, N., Khanam, R., and Khan, E., (2017).
COASTLINE DYNAMICS AND RAISING LANDFORM Ebadullah Khan and Nur Hussain
48
Two and Half Century’s Changes of World Largest Mangrove Forest: A Geo-informatics Based Study on Sundarbans Mangrove Forest, Bangladesh-India, Modern Environmental Science and Engineering, June 2017, Volume 3, No. 6, pp. 419-423. Doi: 10.15341/mese(2333-2581)/06.03.2017/007.
IPCC., (2001). Climate Change 2001, Scientific Basis; Summary for the Policy Makers, Intergovernmental Panel on Climate Change (IPCC), WMO-UNEP, Geneva, Switzerland, November 2007, pp. 52.
IPCC., (2007). Climate Change 2007: Synthesis Report, Intergovernmental Panel on Climate Change (IPCC), WMO-UNEP, Geneva, Switzerland, pp. 20.
IPCC, 2014. Intergovernmental Panel on Climate Change, Fifth Assessment Report. Final Draft, Working Group-II, Chapter 5. Available on: http://www.ipcc.ch/report/ar5/index.
Kuleli, T., (2010). Quantitative analysis of shoreline changes at the Mediterranean Coast in Turkey, Environ Monit Assess, Vol 167, pp. 387-397.
Lavreau, J., (2016). Geodetic Datum Transformation Parameters towards WGS84 Applicable to the 1/50k Topographical Map (1981) of Burundi. International journal of geosciences, 7, 631-636.
http://dx.doi.org/10.4236/ijg.2016.75048Mandal, I., (2015). Impact of Farakka Barrage at Farakka
and its Surroundings Area. Journal of Engineering Computers and Applied Sciences, Volume 4, No. 6, pp 156-164.
Mugnier, C.J., (2009). Republic of Burundi Grids and Datums. Photogrammertric engineering and remote sensing, 75, Pp.1257-1258
Rennell, J., (1976). An Actual Survey of the Province of Bengal and Bihar. East India Company.
Sarker, M. H., Akter, J., Rahman, M. M., (2013). Century-scale dynamics of the Bengal delta and future development, in: Proceedings on International Conference on Water and Flood Management, Dhaka, Bangladesh, pp. 91-104
Shibly, M. A., Takeaway, S., (2013). Morphological Changes and Vegetation Index Variation along the Western Coastal Zone Of Bangladesh. Proceedings of the 7th International Conference on Asian and Pacific Coasts (APAC 2013) Bali, Indonesia, September 24-26, 2013.
Sing, S., (2008). Oceanography, Prayag Pustak Bhaban, Alahbad.
University of Michigan, (2017). Explore and discover inspiring collections of art, literature, culture, and history! Available on: https://www.lib.umich.edu/online-exhibits/exhibits/show/india-maps/rennell
USGS, 2016. Landsat MSS Image. US geological Survey. Available on: https://earthexplorer.usgs.gov/
USGS, 2016. Landsat OLI Image. US geological Survey. Available on: https://earthexplorer.usgs.gov/
Winarso, G., Budhiman, S., (2001). The potential application of remote sensing data for coastal study, Proc. 22nd. Asian Conference on Remote Sensing, Singapore. Available on: http://www.crisp.nus.edu.sg/~acrs2001.