coca-cola bottlers japan holdings inc. q2 year-to-date ... · beverage business revenue 452,245...
TRANSCRIPT
Tamio Yoshimatsu, PresidentVikas Tiku, Vice President & Chief Financial Officer (Posted to CCBJH website on August 10, 2018)
Coca-Cola Bottlers Japan Holdings Inc.Q2 Year-to-date 2018 Earnings Presentation
August 13, 2018

Forward-looking statements
2
The plans, performance forecasts, and strategies appearing in this material are based on the assumptions and judgment of the management of Coca-Cola Bottlers Japan Holdings Inc. (CCBJH or Company) in view of data obtained as of the date this material was released. These forecasts may differ materially from actual performance due to risks and uncertain factors such as those listed below.
Risks and uncertain factors are not limited to the items listed below. They are also included in our annual securities report, or “Yuka ShokenHoukokusho”.
• Agreements with The Coca-Cola Company and Coca-Cola (Japan) Company Limited.
• The quality and safety of products
• Market competition
• Natural environment, such as climate, disaster, water resources, etc.
• Legal environment
• Leakage or loss of information
• Change of economic conditions, such as personal consumption, currency exchange rates, prices of raw materials, fair value of assets, etc.
• Business integration, streamlining and optimization of business processes, etc.
• Uncertain factors other than those above
The information in this presentation is provided for informational purposes and should not be construed as a solicitation of an investment in our securities.
CCBJH undertakes no duty to update any statement in light of new information or future events. You should rely on your own independent examination of us before investing in any securities issued by our company.
Coca-Cola Bottlers Japan Holdings Inc. (CCBJH)Second quarter year-to-date 2018 earnings presentation
3
Impact of the extraordinary rains and flooding in July
Q2 YTD 2018 business summary
Q2 YTD 2018 financial results
Q&A

Impact of the extraordinary rain and flooding in July 2018
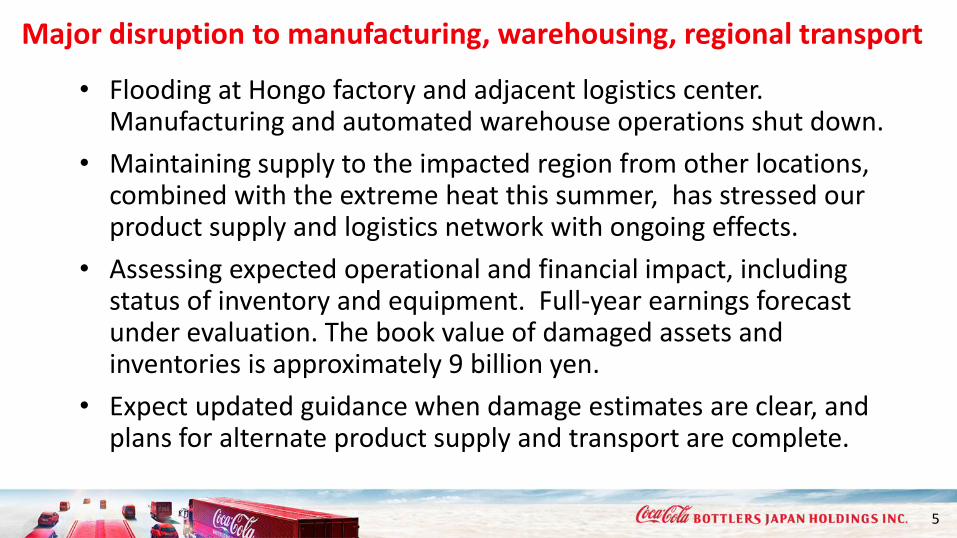
Major disruption to manufacturing, warehousing, regional transport
• Flooding at Hongo factory and adjacent logistics center. Manufacturing and automated warehouse operations shut down.
• Maintaining supply to the impacted region from other locations, combined with the extreme heat this summer, has stressed our product supply and logistics network with ongoing effects.
• Assessing expected operational and financial impact, including status of inventory and equipment. Full-year earnings forecast under evaluation. The book value of damaged assets and inventories is approximately 9 billion yen.
• Expect updated guidance when damage estimates are clear, and plans for alternate product supply and transport are complete.
5

Timeline of eventsJuly 6, 2018
Unprecedented heavy rainfall warning issued by Japan Metrological Agency
July 7, 2018
Hongo facilities flooded, including factory, automated warehouse, logistics center and employee housing. Heavy rain, flooding and landslides reported region-wide. Safety of all employees confirmed.
July 9, 2018
CCBJH announced that facilities were shutdown due to damage of machinery and equipment, inventory on site and other assets.
July 20, 2018
CCBJH issued a status update, including constraints in product supply due to the factory shutdown, inventory damage and transport disruption
July 24, 2018
Government issues a disaster declaration
August 1, 2018
CCBJH issues a notice on website of temporary product supply shortages in some areas
6
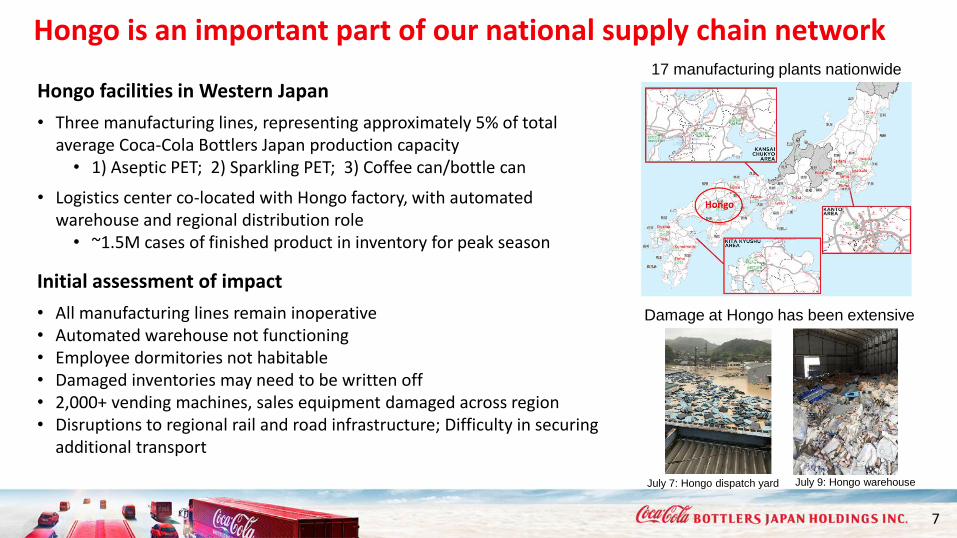
Hongo is an important part of our national supply chain network
7
Hongo facilities in Western Japan
• Three manufacturing lines, representing approximately 5% of total average Coca-Cola Bottlers Japan production capacity• 1) Aseptic PET; 2) Sparkling PET; 3) Coffee can/bottle can
• Logistics center co-located with Hongo factory, with automated warehouse and regional distribution role• ~1.5M cases of finished product in inventory for peak season
July 7: Hongo dispatch yard July 9: Hongo warehouse
17 manufacturing plants nationwide
Initial assessment of impact
• All manufacturing lines remain inoperative• Automated warehouse not functioning• Employee dormitories not habitable• Damaged inventories may need to be written off• 2,000+ vending machines, sales equipment damaged across region• Disruptions to regional rail and road infrastructure; Difficulty in securing
additional transport
Damage at Hongo has been extensive
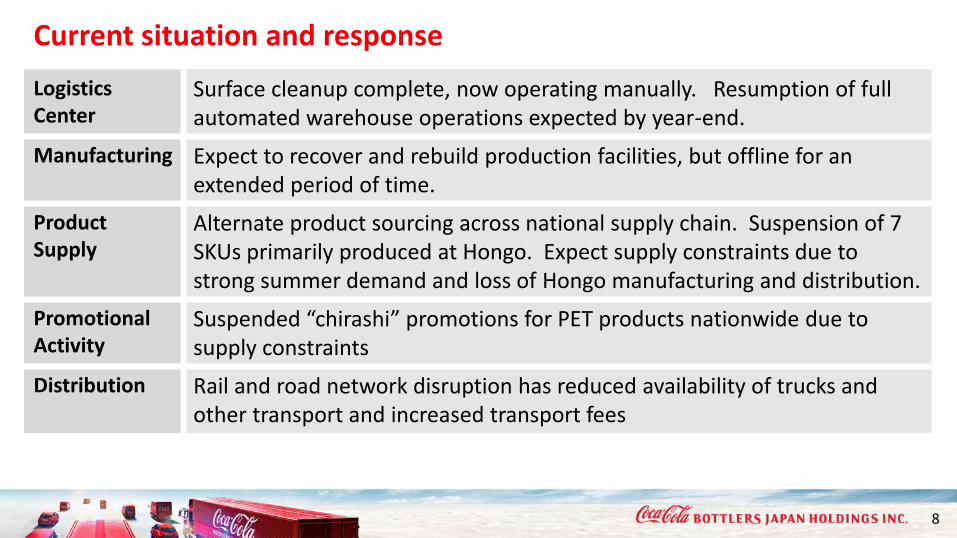
Current situation and response
8
Logistics Center
Surface cleanup complete, now operating manually. Resumption of full automated warehouse operations expected by year-end.
Manufacturing Expect to recover and rebuild production facilities, but offline for an extended period of time.
Product Supply
Alternate product sourcing across national supply chain. Suspension of 7 SKUs primarily produced at Hongo. Expect supply constraints due to strong summer demand and loss of Hongo manufacturing and distribution.
Promotional Activity
Suspended “chirashi” promotions for PET products nationwide due to supply constraints
Distribution Rail and road network disruption has reduced availability of trucks and other transport and increased transport fees

Key takeaways
• Flooding damage has been significant, but we will rebuild• All parts of our operations are coming together in all ways to support
recovery and rebuild product supply capability– our immediate priority
• Reevaluating our full-year forecast, expect updated guidance when full impact is clear
• Fundamental strategy and direction remains unchanged. We are committed growth opportunities ahead of us• Adapting to rapid shift in consumer preference with product launches and
capacity investments
• Designing agile and resilient supply chain network, incorporating the experience from the hot summer and natural disasters
9

Q2 YTD 2018 business summary
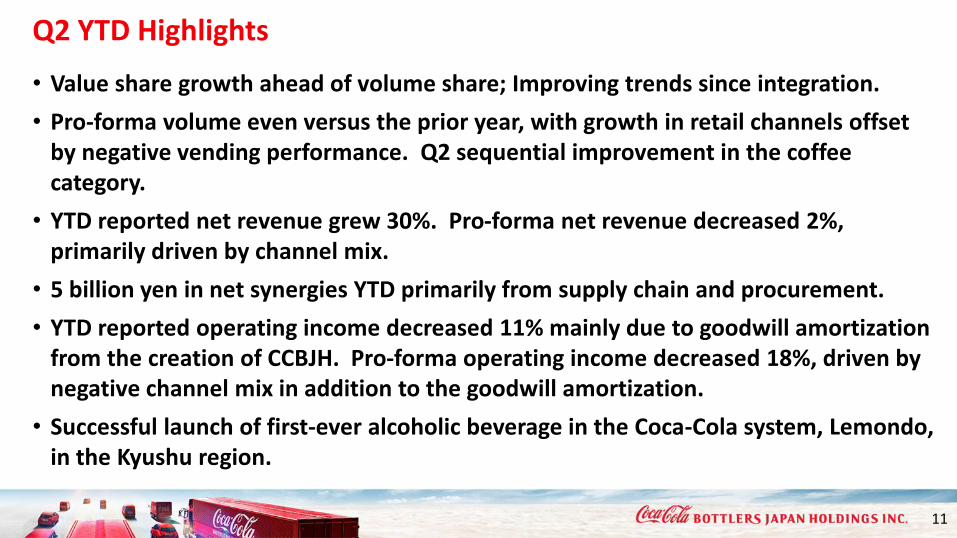
Q2 YTD Highlights
11
• Value share growth ahead of volume share; Improving trends since integration.
• Pro-forma volume even versus the prior year, with growth in retail channels offset by negative vending performance. Q2 sequential improvement in the coffee category.
• YTD reported net revenue grew 30%. Pro-forma net revenue decreased 2%, primarily driven by channel mix.
• 5 billion yen in net synergies YTD primarily from supply chain and procurement.
• YTD reported operating income decreased 11% mainly due to goodwill amortization from the creation of CCBJH. Pro-forma operating income decreased 18%, driven by negative channel mix in addition to the goodwill amortization.
• Successful launch of first-ever alcoholic beverage in the Coca-Cola system, Lemondo, in the Kyushu region.

2018: Pivoting from integration focus to growth mindsetSolid integration progress, synergies in-line with plan in a year of extremes
12
National scale, local presence
Synergies
Innovation
Continued disciplined synergy capture toward 2020
Prioritizing big bets
Fuel to re-invest for sustainable growth
“Beverages for Life” product portfolio
Enhanced engagement with customers and consumers,
driven by insights
Leveraging digital technology across the value chain
Executing segmented channel and category strategies
tailored for each region
Community-focused and customer-centric commercial
activities, leveraging the scale of CCBJH
YTD status
5B yen of YTD net synergies
Investing for growth
Strategies and initiatives in place for shareholder value creation
Innovative new launches responding to customers & consumers demand
Growth of aseptic PET product demand
Entering new categories
6 regional sales organizations in place. CCBJH-wide supply chain network optimization ongoing.
Corporate philosophy THE ROUTE
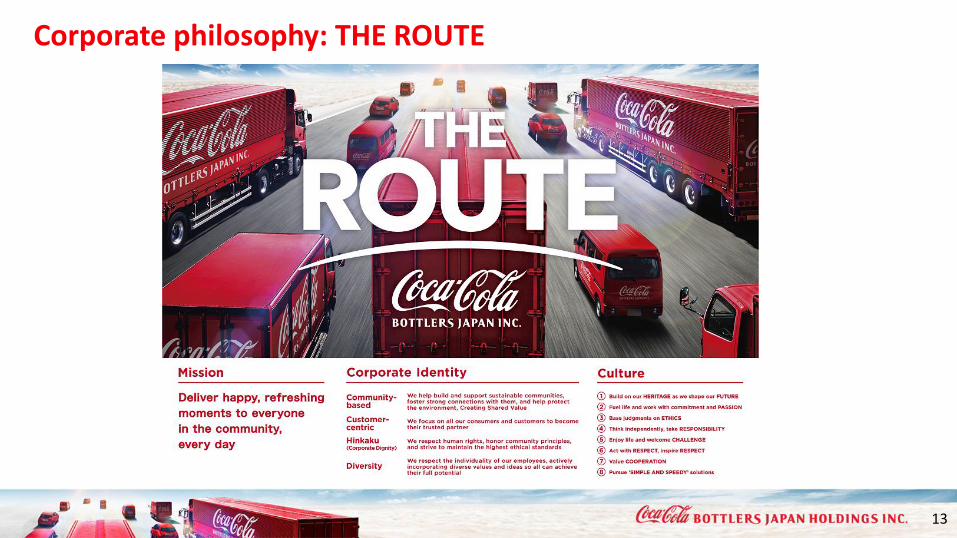
Corporate philosophy: THE ROUTE
13
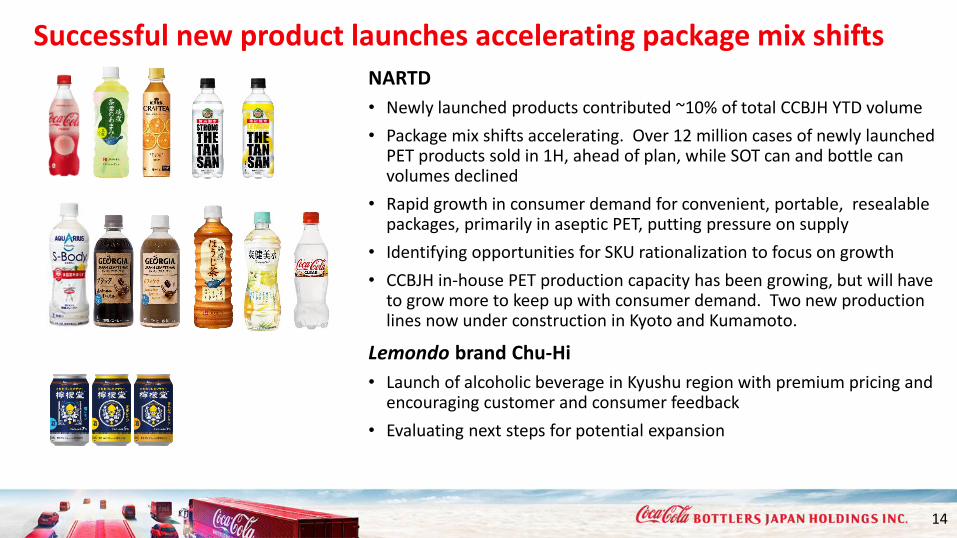
Successful new product launches accelerating package mix shifts
14
NARTD
• Newly launched products contributed ~10% of total CCBJH YTD volume
• Package mix shifts accelerating. Over 12 million cases of newly launched PET products sold in 1H, ahead of plan, while SOT can and bottle can volumes declined
• Rapid growth in consumer demand for convenient, portable, resealablepackages, primarily in aseptic PET, putting pressure on supply
• Identifying opportunities for SKU rationalization to focus on growth
• CCBJH in-house PET production capacity has been growing, but will have to grow more to keep up with consumer demand. Two new production lines now under construction in Kyoto and Kumamoto.
Lemondo brand Chu-Hi
• Launch of alcoholic beverage in Kyushu region with premium pricing and encouraging customer and consumer feedback
• Evaluating next steps for potential expansion
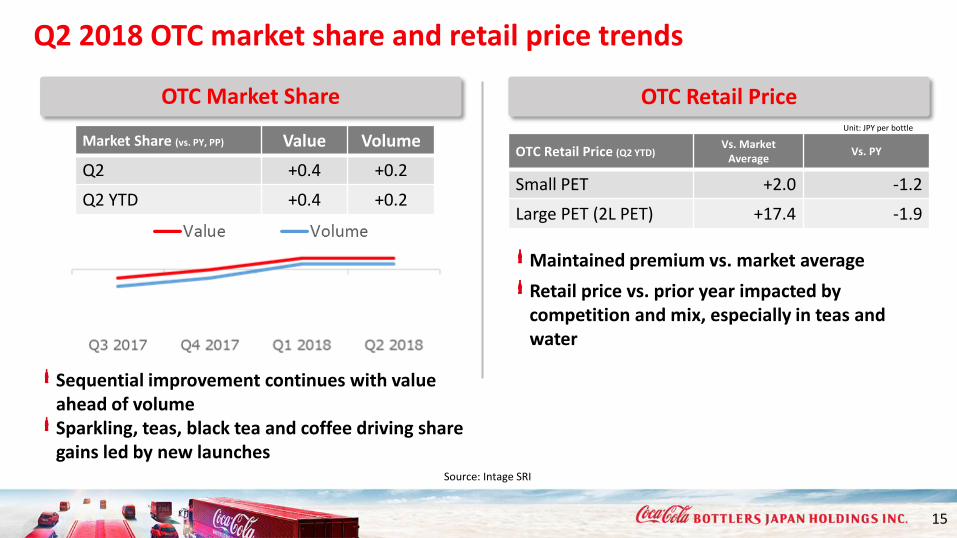
Q2 2018 OTC market share and retail price trends
15
Source: Intage SRI
OTC Market Share OTC Retail Price
Market Share (vs. PY, PP) Value Volume
Q2 +0.4 +0.2
Q2 YTD +0.4 +0.2
OTC Retail Price (Q2 YTD)Vs. Market
AverageVs. PY
Small PET +2.0 -1.2
Large PET (2L PET) +17.4 -1.9
Unit: JPY per bottle
Maintained premium vs. market average
Retail price vs. prior year impacted by competition and mix, especially in teas and water
Sequential improvement continues with value ahead of volumeSparkling, teas, black tea and coffee driving share gains led by new launches

Channel volume performance (pro-forma)Growth in OTC channels continues, supported by new launches
16
vs. PY VolumeRevenue per Case
(Yen)
Supermarket (SM)
+5% -12
Drug &Discounter (D&D)
+7% +3
ConvenienceStore (CVS)
+1% -12
Vending (VM) -6% -4
Retail & Food (R&F)
-2% +1
Supermarket, Drug & Discounter• Sequentially improving NSR/case trends vs. Q1• Volume growth in major categories led by new launches in
sparkling, tea and coffee• D&D grew in all categories with revenue per case growth
Convenience Store• Growth led by sparkling, coffee, non-sugar teas supported by
new launches• Revenue per case declines driven by product mix of coffee and
water
Vending• Growth of sparkling and non-sugar tea categories offset by
weakness in water and can/bottle can coffee. Successful Georgia Japan Craftsman coffee not yet widely available in VM.
• Small test market established in Tokyo for VM transformation initiatives. Initial results encouraging.
• 1.7M~ users of new CokeON Walk step count function offered through smartphone app CokeON since April
Retail & Food• Revenue per case growth in food service was offset by
negative revenue per case in retail
Q2 YTD 2018 volume: Even
Note: Differences in the pro-forma number provided in past presentations may be expected as a result of review and standardization of integration estimates.
SM23%
D&D13%
CVS15%
VM25%
R&F23%
Others1%
Sales volume doesn’t include alcohol

Category volume performance (pro-forma)Continued growth in sparkling and tea; Coffee improvement in Q2 supported by new launch
17
vs. PY Volume
Sparkling +5%
Non-sugar tea +4%
Sports -3%
Water -7%
Coffee -4%
Juice -2%
• Coca-Cola Peach, Coca-Cola Clear and THE TANSAN Strong & Lemon drove volume growth in sparkling.
• Launch of Ayataka Chaba no Amami drove non-sugar tea growth across major channels
• Sports category grew in drug & discounter and was flat in vending
• Premium iLohas plain water performed well. Total watervolume lower mainly due to cycling of flavored iLohasproducts
• Coffee share grew and volume improved in Q2 to -1%, supported by newly launched Georgia Japan Craftsman, primarily in retail channels. Growth in CVS, SM and D&D channels. Shift from traditional can to PET packaging is accelerating
Note: Differences in the pro-forma number provided in past presentations may be expected as a result of review and standardization of integration estimates.
Sparkling27%
Non-sugar tea
20%Sports
8%
Water9%
Coffee20%
Juice7%
Others9%
Q2 YTD 2018 volume: Even
Sales volume doesn’t include alcohol
Q2 YTD 2018 Financial results
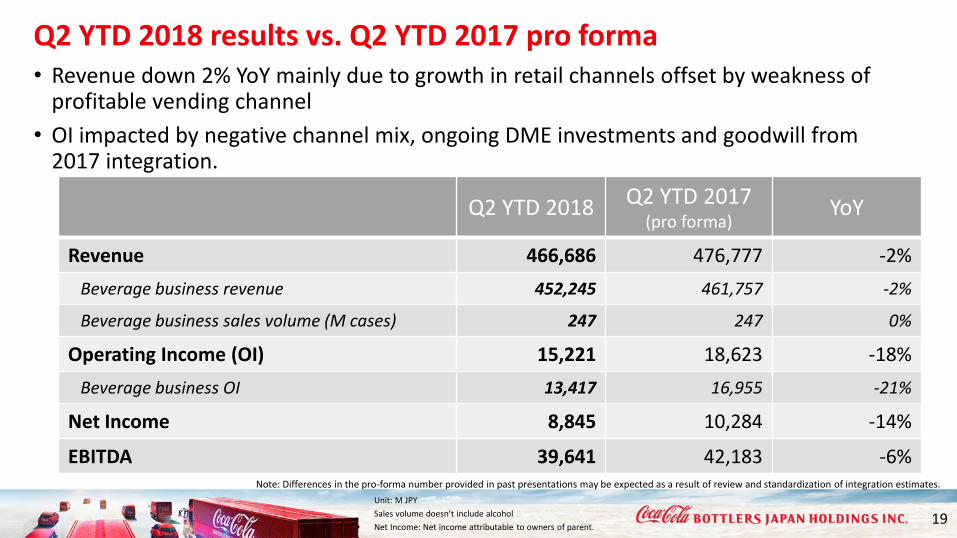
Q2 YTD 2018 results vs. Q2 YTD 2017 pro forma
19
Q2 YTD 2018 Q2 YTD 2017 (pro forma)
YoY
Revenue 466,686 476,777 -2%
Beverage business revenue 452,245 461,757 -2%
Beverage business sales volume (M cases) 247 247 0%
Operating Income (OI) 15,221 18,623 -18%
Beverage business OI 13,417 16,955 -21%
Net Income 8,845 10,284 -14%
EBITDA 39,641 42,183 -6%
Unit: M JPY
Sales volume doesn’t include alcohol
Net Income: Net income attributable to owners of parent.
• Revenue down 2% YoY mainly due to growth in retail channels offset by weakness of profitable vending channel
• OI impacted by negative channel mix, ongoing DME investments and goodwill from 2017 integration.
Note: Differences in the pro-forma number provided in past presentations may be expected as a result of review and standardization of integration estimates.
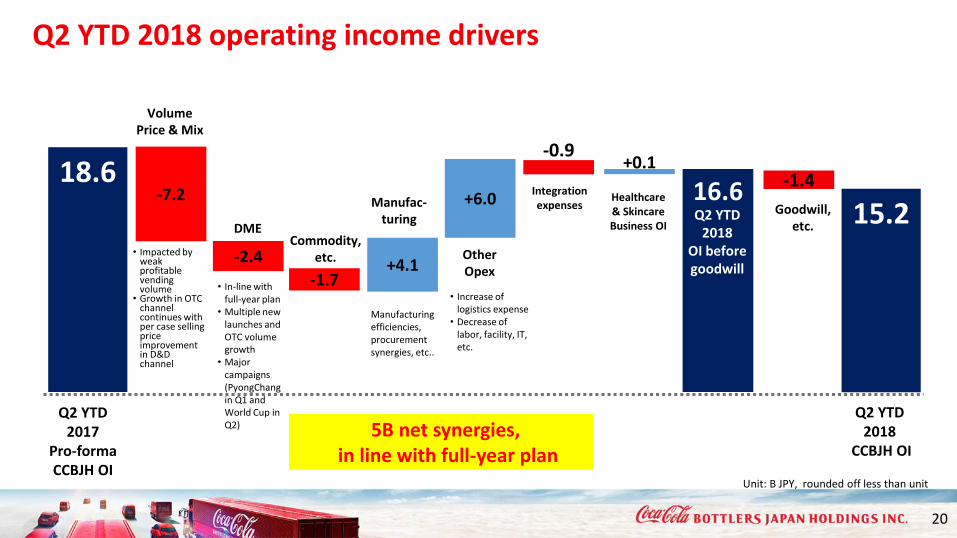
Q2 YTD 2018 operating income drivers
20
18.6
15.2-2.4
-1.4
+4.1
+0.1
-1.7
+6.0
-0.9
-7.2 16.6
Unit: B JPY, rounded off less than unit
Q2 YTD 2017
Pro-formaCCBJH OI
Q2 YTD2018
CCBJH OI
Healthcare & Skincare Business OI
Goodwill, etc.
• Impacted by weak profitable vending volume
• Growth in OTC channel continues with per case selling price improvement in D&D channel
• In-line with full-year plan
• Multiple new launches and OTC volume growth
• Major campaigns (PyongChang in Q1 and World Cup in Q2)
Manufac-turing
DME
Volume Price & Mix
Other Opex
5B net synergies,in line with full-year plan
Q2 YTD 2018
OI before goodwill
Commodity, etc.
Integration expenses
Manufacturing efficiencies, procurement synergies, etc..
• Increase of logistics expense
• Decrease of labor, facility, IT, etc.
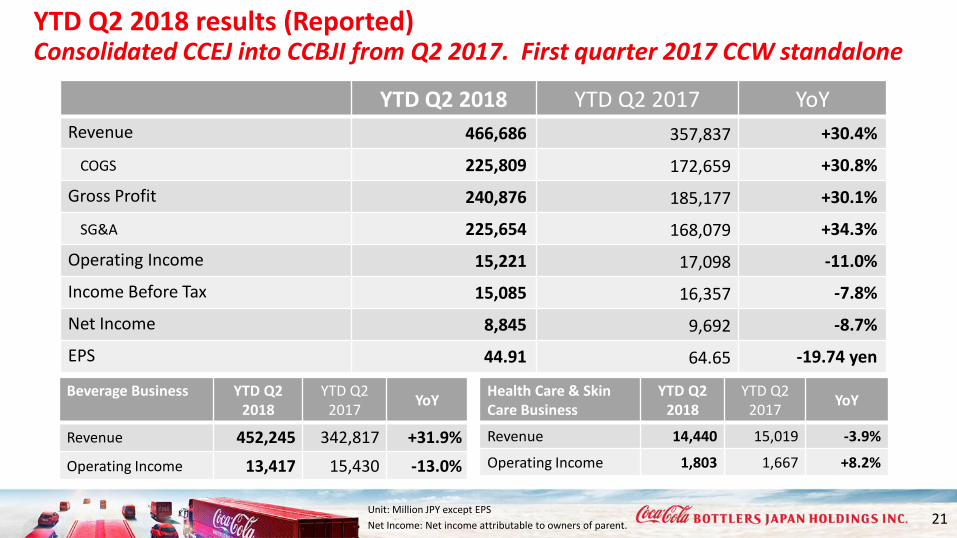
YTD Q2 2018 results (Reported)Consolidated CCEJ into CCBJI from Q2 2017. First quarter 2017 CCW standalone
21
YTD Q2 2018 YTD Q2 2017 YoY
Revenue 466,686 357,837 +30.4%
COGS 225,809 172,659 +30.8%
Gross Profit 240,876 185,177 +30.1%
SG&A 225,654 168,079 +34.3%
Operating Income 15,221 17,098 -11.0%
Income Before Tax 15,085 16,357 -7.8%
Net Income 8,845 9,692 -8.7%
EPS 44.91 64.65 -19.74 yen
Unit: Million JPY except EPS
Net Income: Net income attributable to owners of parent.
Beverage Business YTD Q2 2018
YTD Q22017
YoY
Revenue 452,245 342,817 +31.9%
Operating Income 13,417 15,430 -13.0%
Health Care & Skin Care Business
YTD Q2 2018
YTD Q22017
YoY
Revenue 14,440 15,019 -3.9%
Operating Income 1,803 1,667 +8.2%

Year-to-go and full-year outlook
• YTD revenues are behind plan, and year-to-go and full-year results will be impacted by the flood damage in western Japan and we are evaluating the impact.
• Full-year synergy plan of at least 8B yen remains unchanged.
• Expect updated guidance when flood damage estimates are clear and the impact of initiatives for alternate product supply and transport, including extra pressure due to the record hot summer, are known.
• Interim dividend payment JPY25/share as planned, year-end dividend forecast remains unchanged. (JPY25/share)
22

CAPEX and depreciationInvestment for Shinsei logistics network optimization and more PET production capacity
23
Q2 2018Actual
FY 2018 Plan
Capex 17.3 65.9
Depreciation 20.8 43.5
Unit: Billion JPY
Pro-forma depreciation doesn’t include amortization of goodwill, etc.
• Timing of investments means we are behind plan for full-year Capex spending
• Evaluating full-year and 2019 capex plan to rebuild Hongo and to meet growth in demand for PET products
Shinsei project
• Construction of two new PET manufacturing lines in Kyoto and Kumamoto started
• BoD approved investment in 2 additional aseptic production lines to meet strong market demand
• Started operation of new InzaiLogistics Center by consolidating 4 existing sites in Chiba
• Hakushu plant automated warehouse construction started
Manufacturing capabilities
Image of Hakushu automated warehouse

Year-to-go product launch & marketing calendarFocusing on summer demand for sparkling, “Big Bet” launch of FOSHU green tea
24
Coca-Cola Slim BottlesRegional designs
Ayataka TokusenchaGreen tea
Coca-Cola Summer Campaign Summer color bottles
Fanta100 things I could have done bottles
Our fourth FOSHU offering,launching September 24

25
YTD revenue growth behind plan; Synergy progress, value focus, shareholder returns on track
Revenue growth
Value share
Operating income and OI margin
Dividend growth
Volume growth, RGM initiatives, revenue-
rich innovation
Improve wholesale price/mix with
packaging, innovation, focus on value
Growth mindset, synergy capture,
reinvest in business
Revenue +2%Volume +2%
VALUE ahead of
volume
49.7 billion yen OI
OI margin 4.9%
Full-year 50 JPY/share,
up 6 JPY
Strong cash flow from operations driving
shareholder returns
Net synergiesSteady net synergy
capture to meet 2020 target of 25 billion yen
8 billion yen
Channel/package mix trends, YTG Hongo impact
Q2 YTD
Value +0.4
Volume +0.2
Need to evaluate progress of
summer and expected Hongo
impact
Interim 25 JPY/share,no change to
dividend outlook
Q2 YTD 5 billion yen

Wrap up
Making solid progress on integration and delivering synergies in-line with plan.
Reevaluating our full-year forecast, including challenges and opportunities. Flooding has been a temporary setback, but we will recover and rebuild.
Fundamental strategy and direction remains unchanged.
26

Q & A

Appendix

Q2 (April to June) volume performance
29
By Channel By Category
vs PY VolumeRevenue per Case
(Yen)
Supermarket (SM) +4% -2
Drug &Discounter (D&D)
+4% +15
Convenience Store (CVS)
-1% -30
Vending (VM) -6% -4
Retail & Food (R&F)
-2% +2
Sparkling27%
Non-sugar tea21%Sports
10%
Water9%
Coffee19%
Juice6%
Others8%
vs PY Volume
Sparkling +5%
Non-sugar tea +3%
Sports -6%
Water -10%
Coffee -1%
Juice -3%
Q2 2018 volume: -1%
SM25%
D&D
14%CVS15%
VM23%
R&F
22%
Others1%
Note: Differences in the pro-forma number provided in past presentations may be expected as a result of review and standardization of integration estimates.
Sales volume doesn’t include alcohol
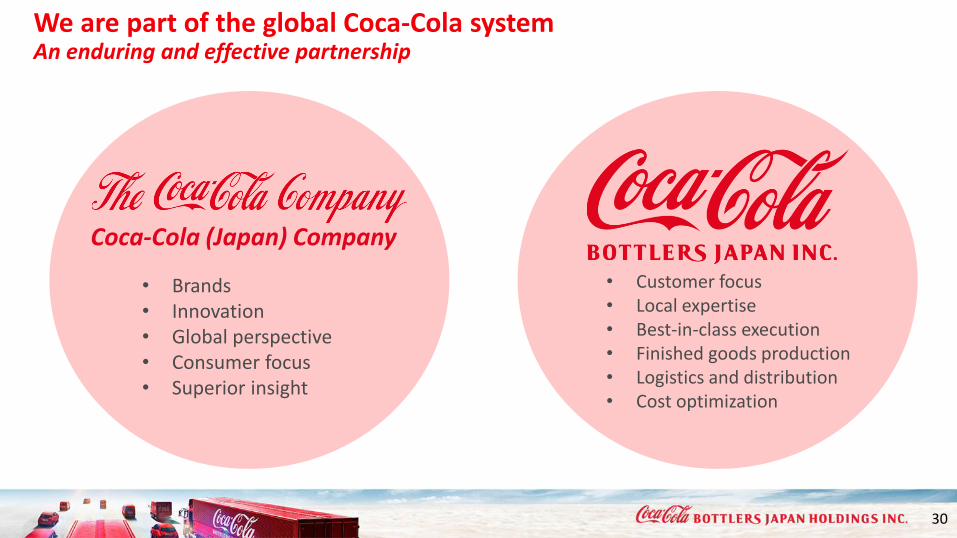
We are part of the global Coca-Cola systemAn enduring and effective partnership
30
• Brands• Innovation• Global perspective• Consumer focus• Superior insight
• Customer focus• Local expertise• Best-in-class execution• Finished goods production• Logistics and distribution• Cost optimization
Coca-Cola (Japan) Company
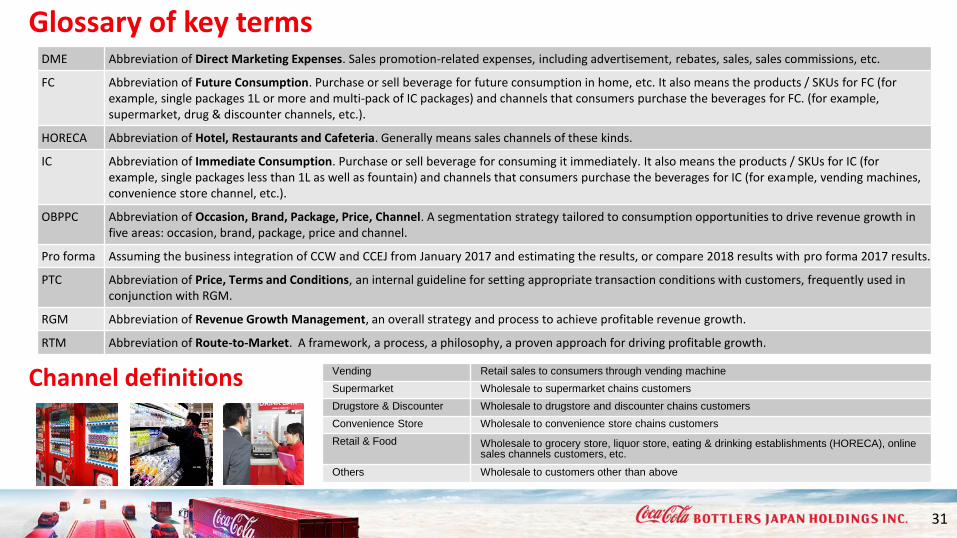
Glossary of key terms
31
Vending Retail sales to consumers through vending machine
Supermarket Wholesale to supermarket chains customers
Drugstore & Discounter Wholesale to drugstore and discounter chains customers
Convenience Store Wholesale to convenience store chains customers
Retail & Food Wholesale to grocery store, liquor store, eating & drinking establishments (HORECA), online sales channels customers, etc.
Others Wholesale to customers other than above
Channel definitions
DME Abbreviation of Direct Marketing Expenses. Sales promotion-related expenses, including advertisement, rebates, sales, sales commissions, etc.
FC Abbreviation of Future Consumption. Purchase or sell beverage for future consumption in home, etc. It also means the products / SKUs for FC (for example, single packages 1L or more and multi-pack of IC packages) and channels that consumers purchase the beverages for FC. (for example, supermarket, drug & discounter channels, etc.).
HORECA Abbreviation of Hotel, Restaurants and Cafeteria. Generally means sales channels of these kinds.
IC Abbreviation of Immediate Consumption. Purchase or sell beverage for consuming it immediately. It also means the products / SKUs for IC (for example, single packages less than 1L as well as fountain) and channels that consumers purchase the beverages for IC (for example, vending machines, convenience store channel, etc.).
OBPPC Abbreviation of Occasion, Brand, Package, Price, Channel. A segmentation strategy tailored to consumption opportunities to drive revenue growth in five areas: occasion, brand, package, price and channel.
Pro forma Assuming the business integration of CCW and CCEJ from January 2017 and estimating the results, or compare 2018 results with pro forma 2017 results.
PTC Abbreviation of Price, Terms and Conditions, an internal guideline for setting appropriate transaction conditions with customers, frequently used in conjunction with RGM.
RGM Abbreviation of Revenue Growth Management, an overall strategy and process to achieve profitable revenue growth.
RTM Abbreviation of Route-to-Market. A framework, a process, a philosophy, a proven approach for driving profitable growth.
Investor RelationsCoca-Cola Bottlers Japan Holdings [email protected] +81-3-5575-3797https://en.ccbj-holdings.com/ir/
facebook: https://www.facebook.com/ccbji/
THANK YOU