cockpit displays for enhancing terminal-area situational awareness · pdf filecockpit displays...
TRANSCRIPT

February 2007
NASA/CR-2007-214545
Cockpit Displays for Enhancing Terminal-Area Situational Awareness and Runway Safety Paul V. Hyer and Sharon Otero Lockheed Martin Corporation, Langley Program Office, Hampton, Virginia
https://ntrs.nasa.gov/search.jsp?R=20070010762 2018-04-18T02:01:47+00:00Z
The NASA STI Program Office . . . in Profile
Since its founding, NASA has been dedicated to the
advancement of aeronautics and space science. The
NASA Scientific and Technical Information (STI)
Program Office plays a key part in helping NASA
maintain this important role.
The NASA STI Program Office is operated by
Langley Research Center, the lead center for NASA’s
scientific and technical information. The NASA STI
Program Office provides access to the NASA STI
Database, the largest collection of aeronautical and
space science STI in the world. The Program Office is
also NASA’s institutional mechanism for
disseminating the results of its research and
development activities. These results are published by
NASA in the NASA STI Report Series, which
includes the following report types:
• TECHNICAL PUBLICATION. Reports of
completed research or a major significant phase
of research that present the results of NASA
programs and include extensive data or
theoretical analysis. Includes compilations of
significant scientific and technical data and
information deemed to be of continuing
reference value. NASA counterpart of peer-
reviewed formal professional papers, but having
less stringent limitations on manuscript length
and extent of graphic presentations.
• TECHNICAL MEMORANDUM. Scientific
and technical findings that are preliminary or of
specialized interest, e.g., quick release reports,
working papers, and bibliographies that contain
minimal annotation. Does not contain extensive
analysis.
• CONTRACTOR REPORT. Scientific and
technical findings by NASA-sponsored
contractors and grantees.
• CONFERENCE PUBLICATION. Collected
papers from scientific and technical
conferences, symposia, seminars, or other
meetings sponsored or co-sponsored by NASA.
• SPECIAL PUBLICATION. Scientific,
technical, or historical information from NASA
programs, projects, and missions, often
concerned with subjects having substantial
public interest.
• TECHNICAL TRANSLATION. English-
language translations of foreign scientific and
technical material pertinent to NASA’s mission.
Specialized services that complement the STI
Program Office’s diverse offerings include creating
custom thesauri, building customized databases,
organizing and publishing research results ... even
providing videos.
For more information about the NASA STI Program
Office, see the following:
• Access the NASA STI Program Home Page at
http://www.sti.nasa.gov
• E-mail your question via the Internet to
• Fax your question to the NASA STI Help Desk
at (301) 621-0134
• Phone the NASA STI Help Desk at
(301) 621-0390
• Write to:
NASA STI Help Desk
NASA Center for AeroSpace Information
7115 Standard Drive
Hanover, MD 21076-1320

National Aeronautics and Space Administration Langley Research Center Prepared for Langley Research Center Hampton, Virginia 23681-2199 under Contract NAS1-00135B
February 2007
NASA/CR-2007-214545
Cockpit Displays for Enhancing Terminal-Area Situational Awareness and Runway Safety Paul V. Hyer and Sharon Otero Lockheed Martin Corporation, Langley Program Office, Hampton, Virginia

Available from: NASA Center for AeroSpace Information (CASI) National Technical Information Service (NTIS) 7115 Standard Drive 5285 Port Royal Road Hanover, MD 21076-1320 Springfield, VA 22161-2171 (301) 621-0390 (703) 605-6000
Trade names and trademarks are used in this report for identification only. Their usage does not constitute an official endorsement, either expressed or implied, by the National Aeronautics and Space Administration.

CONTENTS
1.0 INTRODUCTION................................................................................................................... 2
2.0 HUD AND PFD CHRONOLOGY ........................................................................................ 2
3.0 PROJECT INTEGRATION.................................................................................................. 3 3.1 SOFTWARE INTEGRATION WITH SVDC ................................................................................... 3 3.2 HARDWARE INTEGRATION WITH SVDC.................................................................................. 4 3.3 DATA INPUT TO HUD AND PFD.............................................................................................. 5
4.0 RIPS HUD AND PFD DESCRIPTION ................................................................................ 5 4.1 RUNWAY INCURSION ALERTING ............................................................................................. 5 4.2 OPERATION MODES ................................................................................................................ 7
4.2.1 CRUISE AND APPROACH MODES.......................................................................................... 7 4.2.2 ROLLOUT MODE................................................................................................................. 9 4.2.3 TAXI MODE ...................................................................................................................... 10 4.2.4 TAKEOFF MODE............................................................................................................... 12 4.2.5 REJECTED TAKEOFF MODE............................................................................................... 12 4.2.6 GO AROUND MODE .......................................................................................................... 12 4.2.7 LOGICAL CONTROL OF OPERATIONAL MODES .................................................................... 12
4.3 OTHER FEATURES ................................................................................................................. 18
5.0 CONCLUSIONS ................................................................................................................... 20
ACKNOWLEDGMENTS .......................................................................................................... 20
REFERENCES............................................................................................................................ 21
TABLE OF ACRONYMS.......................................................................................................... 22

2
1.0 INTRODUCTION
The Runway Incursion Prevention System (RIPS) was developed under the Aviation Safety program at the Langley Research Center (LaRC) as part of the Synthetic Vision Systems (SVS) research activities aimed at providing a “virtual visual meteorological conditions (VMC)” capability to flight crews in all weather conditions. Specific SVS research goals included eliminating visibility-induced accidents such as controlled flight into terrain (CFIT) and runway incursions. RIPS aims to increase aviation safety by improving situational awareness, and by providing warnings to the pilots when a runway incursion has occurred, so that a potential collision can be avoided.
As part of an SVS flight test, the RIPS displays were integrated with the Synthetic Vision Display Concepts (SVDC) head-up display (HUD) and primary flight display (PFD) and with elements of a Rockwell Collins head-up display. This integration had important consequences for the manner of programming, the limitations placed on RIPS displays, and even the choice of computer.
This report describes the functionality of the RIPS HUD and PFD which provided alerts of runway conflict situations, and navigation and deceleration guidance.
2.0 HUD AND PFD CHRONOLOGY
A HUD is a transparent projection screen placed between the pilot and the windscreen, enabling the pilot to observe the world outside while at the same time receiving symbolic information projected onto this screen. The HUD screen is monochromatic (green). The full HUD system includes the screen (called a combiner glass), a projector mounted over the pilot’s head, a computer for generating the symbolic information and an interface with the aircraft’s systems.
The RIPS HUD is directly descended from the Integrated Display System (IDS) HUD. This HUD was demonstrated at the Atlanta Hartsfield International Airport (ATL) [1, 2, 3, 4]. It provided guidance for all phases of flight: approach, landing, roll-out to turnoff (ROTO), taxi, departure, and cruise. Runway and taxiway edges and centerlines were displayed as well as taxi routes, hold bars and a path prediction vector, with the ability at any time to declutter the HUD by means of a button on the pilot’s control wheel. Testing at Atlanta concentrated on deceleration guidance, with the aim of reducing runway occupancy time. Test pilots emphasized the importance of making the displays conformal and the need to limit the amount of information displayed on the HUD at any given time. They asserted that the utility of the system extended beyond low visibility operations, and recommended that some display elements be pilot-selectable.
The HUD was demonstrated again at the Dallas-Fort Worth International Airport (DFW) [5]. Several improvements over the previously demonstrated version were evaluated. These enhancements included an improved display for deceleration guidance, including the ability to reset the guidance when an exit was missed, and a method for runway exit selection by means of a keypad. In addition, hold short after landing technology (HSALT) [5] was developed to provide guidance to a stopping point on the runway. The pilot could select a hold short location and be guided to this hold bar after landing, using the conformal perspective display on the

3
HUD. The HUD also displayed runway incursion alerts. The robustness of the software was improved considerably as a result of this study. Test pilots concurred that the HSALT guidance was useful in completing land and hold short operations, and that the deceleration guidance was exceedingly helpful.
In the post-deployment period after the DFW test, several major innovations were made to the RIPS HUD. First, descriptive information regarding the physical location of a runway incursion was displayed. Second, supplementary turn guidance was generated for sharp turns on the airport surface, where the actual runway edges might not be visible through the HUD. Third, the HUD was programmed to operate as a Component Object Model (COM) on a personal computer (PC) to enable integration with the SVDC (see section 3.1). Other modifications were made in response to changes in the specifications.
In preparation for a flight demonstration at the Reno/Tahoe International Airport (RNO) and the Wallops Flight Facility (WAL) in July and August of 2004 [6], major changes were made in computer architecture. Since this deployment was intended to combine the efforts of two programs, a method had to be found to integrate the displays, while allowing independent development. Section 3.0 describes how this integration was achieved.
In addition to augmentation of the HUD, a new display capability of RIPS, the Primary Flight Display (PFD), was developed. The PFD was shown on a head-down, flat panel, full-color display. This unit will be described further in the section on hardware integration. The RIPS PFD display was largely a duplication of the RIPS HUD, but in color. The PFD was intended to provide a comprehensive image of the environment surrounding the aircraft regardless of ambient visibility constraints.
3.0 PROJECT INTEGRATION
The flight experiment and demonstration conducted in the summer of 2004 was a joint test between the RIPS sub-element and the SVDC sub-element. While each project had its own set of goals, they were required to share hardware and integrate software. The SVDC project was concerned with enhancing flight operations by providing the pilot with information which would augment the view seen through the windscreen and to substitute for this view in cases of limited visibility. The RIPS project focused on demonstrating runway incursion detection and alerting capabilities as well as taxi and deceleration guidance. The issues raised and solutions found for software and hardware integration of the RIPS displays will be considered in sections 3.1 and 3.2, respectively.
3.1 Software integration with SVDC
The RIPS HUD was originally designed to operate in a UNIX environment as a stand-alone program, with graphics output to a monitor during the development phase, and to the actual HUD hardware during simulation and flight testing. The SVDC software was designed to operate in the Windows environment on PC computers, employing Component Object Model (COM) methodology extensively. COM is a modular method of software development whereby individual programs are created and compiled as dynamic link libraries (DLLs) which can be run

4
and discarded at will. NASA determined that the SVDC software structure was to be utilized; therefore, the RIPS software was modified accordingly.
The RIPS software was recast as a server program that was called by the SVDC executive program which performed all the startup tasks and instituted a timing loop for real-time data input and drawing. The RIPS HUD and PFD were ported to a PC and converted to COM DLLs. The DLLs could be controlled without having to relocate or merge any software.
3.2 Hardware integration with SVDC
The HUD display consisted of both stroke and raster symbology. The stroke symbology was generated by a Rockwell Collins Flight Dynamics HGS-4000 dedicated computer, and consisted of standard navigation and guidance symbology. The raster symbology was a combination of the SVDC and RIPS displays. The raster signal was sent to the HUD projector as an RS-343, 30Hz interlaced signal, producing a pixel display area of 1280 X 959, with 1024 lines of usable display. The field-of-view encompassed by the PFD could be selected by the pilot. This feature is explained in section 4.3.
Since the RIPS symbology was being overlaid on the SVDC and the stroke symbology, it was necessary for the displays to have transparent backgrounds to avoid covering over previously drawn features. It was also necessary for the displays to overlay correctly. This was accomplished on the HUD by using the same field-of-view and horizontal and vertical offsets. These parameters were obtained by empirical alignment. In the simulator, an alignment pattern was projected onto the HUD. Aircraft alignment was performed onboard. The aircraft was leveled and then aligned with an external target, which was precisely positioned with respect to the aircraft.
The airborne navigation features of the RIPS HUD were suppressed to avoid interference with the SVDC displays, or duplication of elements of the stroke display. In some cases, a display element had to be relocated to avoid interference with SVDC or stroke displays. Hence, not all the HUD capabilities described in earlier reports [1, 3, 5] were used in this study.
Since the small display format (size A or B) which was available for retrofitting in the cockpit was not adequate for this study, the PFD and navigation display were shown side-by-side on special liquid crystal display units. Each unit had a viewable area of 17 cm. X 17 cm. (6.7 in. X 6.7 in.), and could be viewed even in full sunlight. The video signal input to each of these units was 1024 pixels wide by 768 pixels high, and was centered on the display. The two display units were mounted together in a single frame. Since this frame partially covered normal cockpit displays, it was designed to be quickly detached and removed.
Like the RIPS HUD, the RIPS PFD was overlaid on the synthetic vision displays. Whereas overlay on the HUD was achieved by a common alignment procedure, the SVDC values for field-of-view and pitch bias were passed directly to the RIPS PFD through its software interface with the client program.
Correct alignment also required the accurate positioning of the eye point with respect to the airport surface. This value was obtained from the aircraft geometry data file (see section 3.3).
5
3.3 Data input to HUD and PFD
Proper operation of the HUD and PFD required inputs of aircraft state data, control parameters, optical alignment parameters, aircraft geometric data, and data concerning the operative airport. The static information, such as optical alignment, aircraft geometry and airport database information, was input from data files. Dynamic information, such as aircraft state data, control parameters, and data concerning other traffic, were obtained by reading shared memory areas, which were populated by RIPS communication software. This method of interfacing has been described in earlier reports [1, 3, 5].
Geometric data for the aircraft was required for determining when the aircraft was clear of the runway, and for drawing taxiway turn guidance when operating in the taxi mode (section 4.2.3). In addition, proper drawing of the conformal views required knowledge of the displacement of the navigation reference point with respect to the landing gear, and of the displacement of the pilot’s eye point with respect to the navigation reference point. These values were obtained from aircraft drawings.
The chief source of airport information was surveys developed specifically for this project. The airport at Reno was surveyed by Jeppesen, Inc., and the Wallops Flight Facility and the Langley Air Force Base were surveyed by the Langley Research Center’s own Geographical Information System (GIS) team. Other data were obtained from AirNav charts and the National Oceanic and Atmospheric Administration (NOAA). GPS tracking of runway and taxiway centerlines was used to confirm the accuracy of the airport survey.
4.0 RIPS HUD AND PFD DESCRIPTION
This section discusses the specific features of the HUD and PFD used in this study. The display elements and features were essentially the same for the PFD as for the HUD, but colorized. However, the PFD had the ability of presenting all the display information utilizing various fields-of-view (FOV).
The pilot selectable options for FOV were unity, 30 degrees, 60 degrees and 90 degrees. A 30 degree FOV meant that the PFD encompassed what the pilot would perceive in a 30 degree arc within his field-of-view. The other selected angles showed a wider expanse. The unity field-of-view was conformal with the world as seen through the pilot’s windscreen. The effect of changing field-of-view is much the same as the effect of switching lenses on a camera, where a narrow field–of-view translates to greater magnification. A 90 degree FOV is appropriate for strategic planning, but may be too minified for tactical flying cues. The other FOV selections provide a significant increase in tactical terrain situational awareness.
4.1 Runway Incursion Alerting
Runway incursion alerts were shown on both the RIPS HUD and PFD. The alerts consisted of an alphanumeric message plus a symbol indicating the location of the intruding object. The alphanumeric message was blinking text depicting either ‘Runway Traffic’ or ‘Runway Conflict’, depending on the type of alert generated, according to the seriousness of the threat [7].

6
‘Runway Traffic’ alerts were cautionary in nature and informed the flight crew of a potential collision that did not yet require evasive action. ‘Runway Conflict’ alerts warned the pilot that an incursion was detected and evasive action was required to avoid a potential collision. A target designator box highlighted the location of the intruding traffic. This symbol was shown as a square open box if the intruding traffic was within the display field-of-view, and as a solid half circle at the edge of the display in the direction of the traffic, if the traffic was outside the display field-of-view. Figure 1 shows the alerting display when the traffic was within the field-of-view,
Figure 1. Runway conflict alert when traffic is inside field-of-view
and Figure 2 shows the edge warning symbol. This feature was especially important for notifying the pilot when an intruder was landing or taking off on a crossing runway [8]. On the PFD, the alerting symbology was shown in yellow for the ‘Runway Traffic’ alerts and red for the ‘Runway Conflict’ alerts.

7
Figure 2. Runway conflict alert when traffic is outside of field-of-view
(Note symbol on left edge of display)
4.2 Operation Modes
The RIPS HUD and PFD were designed to operate both in the air and on the surface. In order to generate displays through all phases of flight, it was necessary to define a set of modes of aircraft situation, so that the appropriate display would be generated at the proper time. A taxi mode governed displays on taxiways, while all other situations were grouped together under the rubric of ‘ROTO mode’. In this software implementation context, ‘ROTO mode’ is meant to include not only roll-out to turn-off, but also every aspect of aircraft operation with the exception of taxi operations. The ‘ROTO mode’ included:
• error (contradictory inputs concerning aircraft state); • ground modes: deceleration after landing, takeoff and rejected take off; • airborne modes: approach , goAround and cruise (general inter-airport operation).
4.2.1 Cruise and approach modes
Cruise mode was enabled at nose wheel lift off. Transition to approach mode occurred when the aircraft was lined up with the runway and was below an approach height limit (2000 ft. AGL). During inter-airport cruise and approach phases, RIPS navigation features such as pitch ladder

8
and alphanumeric display of altitude and speed were not used to avoid conflict and duplication with SVDC and Rockwell Collins Flight Dynamics flight symbologies.
In order to integrate with SVDC, and to enable operations at airports without Instrument Landing System (ILS) capabilities, the approach runway was identified from state data, rather than from ILS frequency. Once the aircraft track angle matched that of a runway (within tolerances) and the aircraft was within certain limits of the extended centerline and below 1200 feet AGL, the aircraft was determined to be on approach to a valid runway (until the aircraft landed, went around, or departed this approach path).
Immediately following the virtual runway capture, a box with alphanumeric information was displayed on the HUD for 10 seconds (Figure 3), containing the pertinent exit information for this runway, including the first feasible exit, the recommended exit speed and the distance to the start of the turnoff. The recommended exit speed was calculated from the exit angle and radius of curvature to keep the centrifugal force during turnoff within comfortable limits [2]. The PFD also rendered this information box in green. Figure 3 also shows the terrain depiction and runway outline drawn by the SVDC. In approach mode, runway edge markings were used only to indicate the exit, and not the runway proper, until the aircraft reached decision height. Thereafter, edge markings (called ‘cones’ or ‘plops’) were displayed, along with runway
Figure 3. Alphanumeric runway information display on HUD, overlaid on SVDC display
9
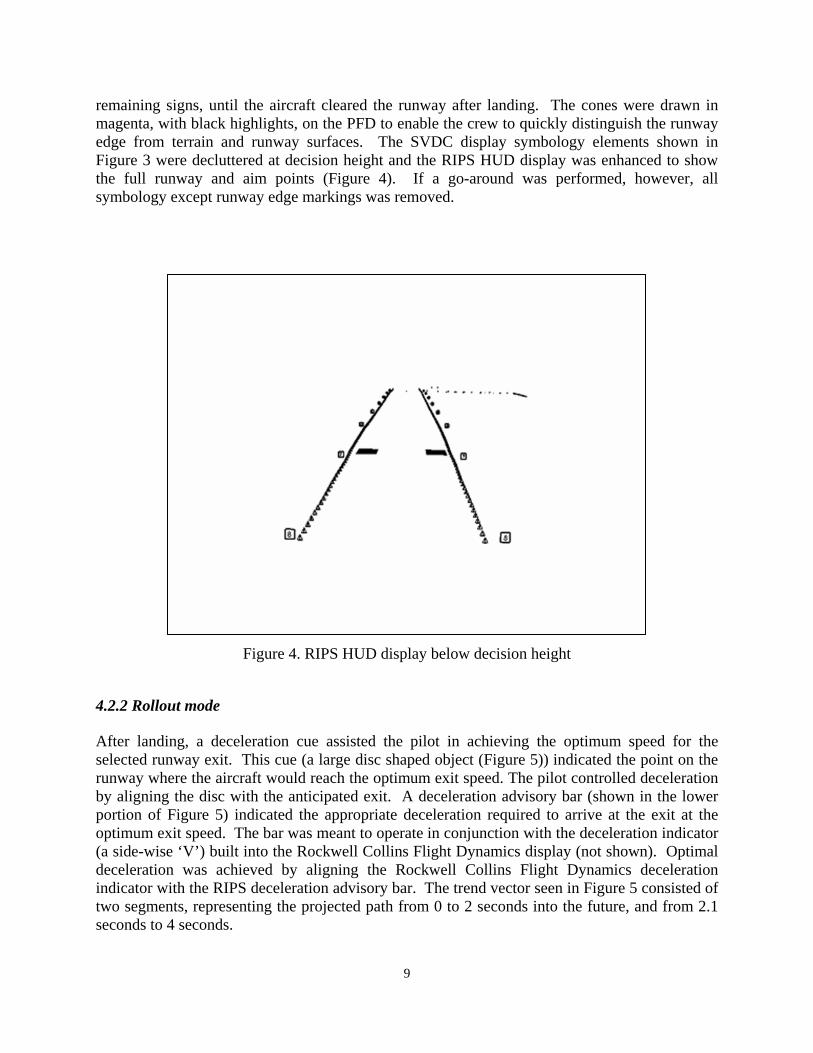
remaining signs, until the aircraft cleared the runway after landing. The cones were drawn in magenta, with black highlights, on the PFD to enable the crew to quickly distinguish the runway edge from terrain and runway surfaces. The SVDC display symbology elements shown in Figure 3 were decluttered at decision height and the RIPS HUD display was enhanced to show the full runway and aim points (Figure 4). If a go-around was performed, however, all symbology except runway edge markings was removed.
Figure 4. RIPS HUD display below decision height
4.2.2 Rollout mode
After landing, a deceleration cue assisted the pilot in achieving the optimum speed for the selected runway exit. This cue (a large disc shaped object (Figure 5)) indicated the point on the runway where the aircraft would reach the optimum exit speed. The pilot controlled deceleration by aligning the disc with the anticipated exit. A deceleration advisory bar (shown in the lower portion of Figure 5) indicated the appropriate deceleration required to arrive at the exit at the optimum exit speed. The bar was meant to operate in conjunction with the deceleration indicator (a side-wise ‘V’) built into the Rockwell Collins Flight Dynamics display (not shown). Optimal deceleration was achieved by aligning the Rockwell Collins Flight Dynamics deceleration indicator with the RIPS deceleration advisory bar. The trend vector seen in Figure 5 consisted of two segments, representing the projected path from 0 to 2 seconds into the future, and from 2.1 seconds to 4 seconds.

10
Figure 5. RIPS HUD deceleration guidance after touch down
4.2.3 Taxi mode
Taxi mode was enabled when the aircraft exited the runway after deceleration or the software was started while on a taxiway. It was possible to display taxi routes, either from the ramp to the departure runway or vice-versa. The taxi route was shown on the HUD and PFD by markings or cones along the edge of the path. An ATC message specified a taxi route for the aircraft to follow [1, 4]. (In this study, the ATC messages were simulated rather than actual). On receipt of such an ATC message, a path specification was retrieved from a stored file and used to generate a guidance path on the HUD and PFD. Since these markings pass out of the display field-of-view on sharp turns, non-conformal turn guidance was added to the standard taxi route guidance (Figure 6). This guidance, called a taxi director, is similar to a flight director but in 2-dimensional space. The taxi director showed the taxi route center line and the undercarriage of the aircraft, enabling the pilot to stay near the center of the taxiway, even during sharp turns. For optimal guidance, a symbol was drawn one third of the distance from the nose gear to the main gear, indicating the best tracking point to keep the aircraft on course, minimizing over-steering and under-steering. The identity of the current taxiway was indicated, whether or not a route was being drawn. The taxi director was drawn in white on black on the PFD. The usefulness of the taxi director can be seen in Figure 7, where the taxiway edge markers in the perspective view are not visible during a turn. The trend vector for the taxi director was a single segment projecting 5 seconds into the future. Figure 7 also shows the hold bar before the runway. This hold bar could be automatically cleared upon receipt of a datalinked ATC command.

11
Figure 6. Taxi director display on HUD
Figure 7. Taxi director display during turn

12
4.2.4 Takeoff mode
Takeoff mode was engaged when an aircraft moved from a taxiway onto a runway, or initiated a touch-and-go. In both takeoff and rejected takeoff modes, only the runway edges, ground speed, and trend vector were displayed. Runway 34L at the Reno airport has a displaced threshold marked by a solid bar ten feet wide. Located at a point on the runway other than the designated beginning of the runway, it indicates the beginning of the runway available for landing. Since the portion of runway behind a displaced threshold is available for use during takeoff, software modifications were required in the HUD and PFD to properly draw the runway edges for this section of runway.
4.2.5 Rejected takeoff mode
In certain situations, after an aircraft has begun to accelerate for takeoff, the pilot might need to abort the takeoff. Runway incursion alerts are one of many triggers that might bring about this decision. When a large value of throttle forward is followed by a reduction in throttle, the HUD and PFD change by removing all information except the runway edge markings, to leave the pilot’s view of the runway unobstructed.
4.2.6 Go around mode
In go-around mode, no RIPS information was displayed on the HUD. Previous versions showed the runway edges until the go around condition was cleared and transition to cruise mode occurred. Previous versions also displayed basic navigation guidance, but in the present study, the Rockwell Collins Flight Dynamics HUD performed that function.
4.2.7 Logical control of operational modes
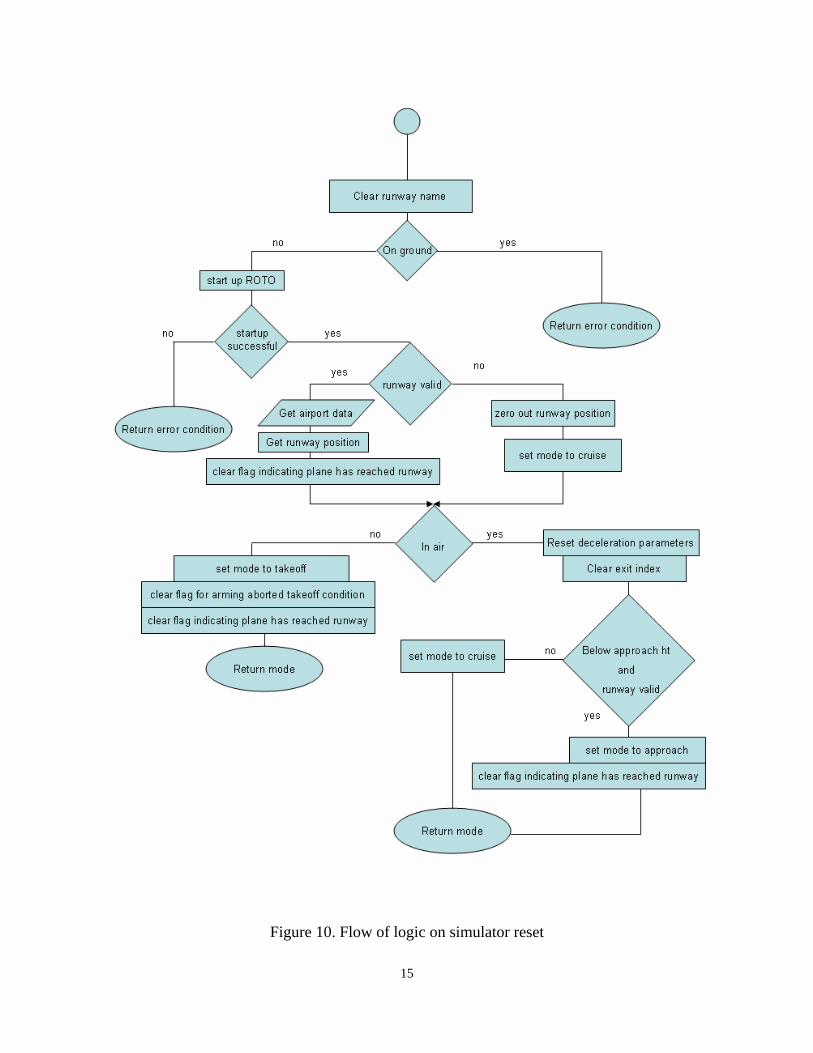
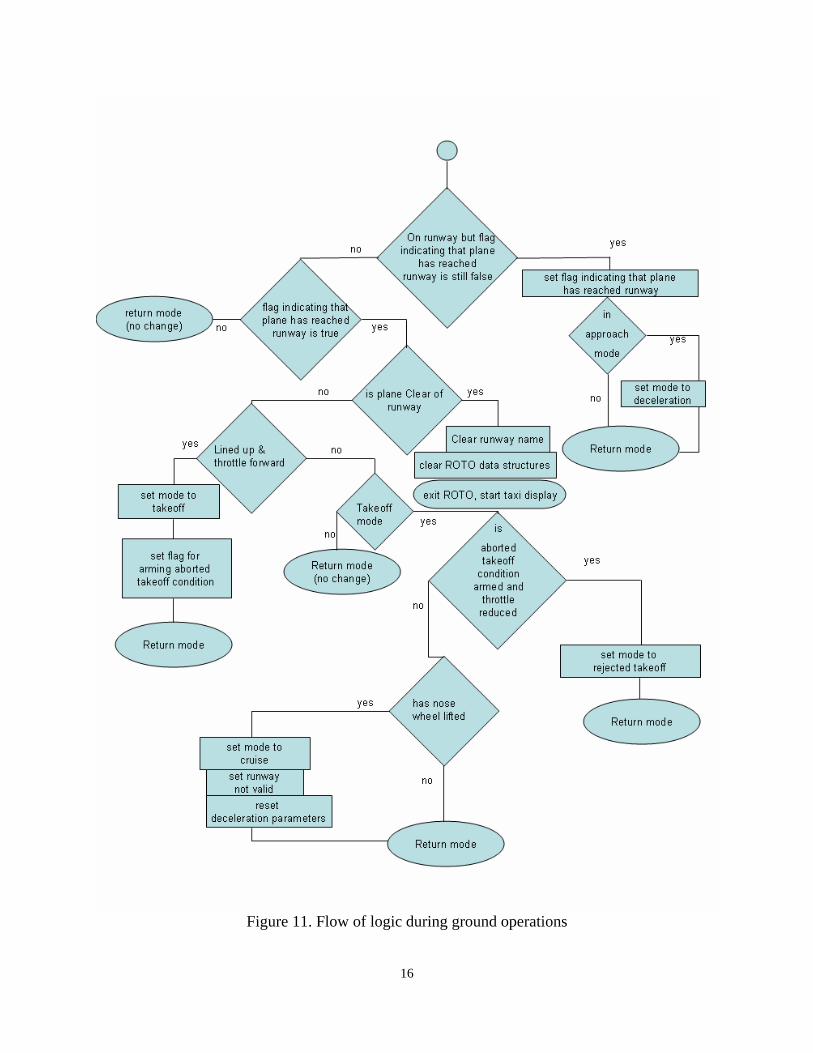
The operational modes were partitioned such that the taxi mode functioned separately from all other modes, which are referred to as ROTO mode. Logic governing all ROTO transitions was contained in a single, complicated function. In addition to all the natural transitions described in the preceding sections, use of the simulator imposed the requirement that the code function properly after arbitrary jumps in location and state, as for example from taxiing after turnoff back to final approach upon reset. The flow diagram for transition logic is shown in figures 8-12. Figure 8 gives the overall scheme, and refers to the other diagrams. Figure 9 shows the events following the insertion of a runway name. This character string is blank at startup, and gets populated when the aircraft lines up on approach (virtual runway capture), or taxis onto the departure runway. Figure 10 shows how simulator resets are handled. Figure 11 shows the transition logic that occurs on the ground. This includes deceleration after touching down, turnoff, takeoff, rejected takeoff, and touch-and-go. Figure 12 shows the transitions that can take place in the air, such as runway capture, go around, and departure from flight path. The function was designed to ‘drop through’ when no transition was occurring.

13
Figure 8. Overall scheme of transition logic.

14
Figure 9. Flow of logic on change of runway name
15
Figure 10. Flow of logic on simulator reset
16
Figure 11. Flow of logic during ground operations

17
Figure 12. Flow of logic during airborne operations

18
4.3 Other Features
Experimental Proxy of Runway - One of the goals of the SVS project was to develop and evaluate a system for preventing accidents due to controlled flight into terrain (CFIT) events. In order to evaluate this system in a safe manner, it was decided to conduct tests over a flat, level terrain (at Wallops) but to present the test pilot with the visual appearance of rugged terrain (in this case, the area around Reno) on all displays, to test the efficacy of the guidance cues and warnings. This was accomplished by making a runway at Wallops serve as a proxy for a runway at Reno. When proxy was enabled, the HUD and PFD displays used the proxy latitude and longitude, and incremented the altitude, heading and track angle by the delta values. When a pilot was approaching a runway at Wallops but proxy was enabled, the evaluation pilot saw a set of displays depicting a runway at Reno, surrounded by mountains. For safety reasons, however, the runway length was limited to the actual Wallops runway length, so that the proxy display did not mislead the pilot into running off the end of the runway.
Display of Runway Closure Status - A capability was developed to indicate a closed runway on the HUD and PFD upon receipt of a NOTAM message. The symbology consisted of a flashing ‘Closed Runway’ message plus an orthographic ‘X’ filling the field-of-view of the display. After 5 seconds the ‘X’ was removed and the alphanumeric message stopped flashing, but persisted until cancellation of the NOTAM. The ‘X’ symbol and the closed runway message were colored red on the PFD (Figure 13). The comparable view on the HUD is shown in Figure 14.
Figure 13. Runway closed symbol on PFD

19
Figure 14. Runway closed symbology on HUD
Voice Recognition and Command - The integrated project included a voice recognition system that enabled the pilot to perform a number of tasks, including control of the HUD and PFD information displayed. The relevant HUD related commands were “HUD cones on” and “HUD cones declutter” for adding or removing runway edge markings or taxi route path edges. The entire raster display consisting of both RIPS and SVDC symbologies could be selected or deselected for display by “HUD raster on” and “HUD raster declutter”. In addition, the entire display, both stroke navigational information and raster symbologies, could be selected or removed by the commands “HUD all on” and “HUD all declutter”. In addition, the field-of-view shown on the PFD could be changed by using a voice command. The appropriate commands were:
“PFD field-of-view 30”;
“PFD field-of-view 60”;
“PFD field-of-view 90”;
“PFD field-of-view unity”.
Providing the capability for the pilot to configure which HUD or PFD display elements are shown as well as providing the ability to remove clutter is essential.

20
5.0 CONCLUSIONS
HUD and PFD displays have been developed to enhance situational awareness and improve runway safety. These displays were designed to seamlessly transition through all phases of flight providing guidance and information to the pilot. This report describes the background of the LaRC HUD and PFD work, the steps required to integrate the displays with those of other LaRC programs, the display characteristics of the several operational modes and the transitional logic governing the transition between displays.
The COM methodology, operated in a Windows environment, enabled independent RIPS software development while integrating the displays from multiple sources at the point of application. This was significant for several reasons. First, information from several sources could be provided graphically on both the HUD and the PFD in a timely manner as an integrated display to improve situational awareness. Secondly, the COM methodology demonstrated that small, inexpensive, commonly available PCs can be utilized in lieu of more expensive computers. Microsoft Windows is the operating system most commonly found on PCs. However, since it lacks true real-time capabilities and the operating system is difficult to customize, both the HUD and the PFD have also been ported to run on PCs running Linux.
Pilot response to the taxi director, the ROTO/HSALT deceleration guidance, the closed runway alerting and the RIPS alerting was extremely favorable. In fact, a notable observation concerning the GvSITE flight evaluations of runway incursion scenarios was that the subject pilots rarely saw the incursion during daytime or twilight conditions indicating a definite need for an incursion alerting capability aboard the aircraft. The symbologies for indicating a runway incursion and the incurring traffic’s location proved to be very effective.
The need for indicating closed runways has been demonstrated by numerous accidents and incidents with the most notable one being the Singapore Airlines Boeing 747-400 accident at Chiang Kai-shek airport in 2000. The need for indicating taxi clearances is also demonstrated by this incident. The pilots attempted to take off on an unassigned runway parallel to the assigned one that was closed due to construction. Providing visual indication of the cleared route on the HUD and PFD provides situational awareness and the alerting capability aurally and/or graphically notifies both the pilot and ATC when deviation from the cleared path occurs. These capabilities would have also significantly impacted the outcome of the 2006 Lexington, KY Comair accident had they been available for use by the crew. .
ACKNOWLEDGMENTS
This work was conducted under contract NAS1-00135B, task order SAM13RDF. Special thanks are extended to A. A. Ananda of Raytheon Corp. and C. E. Cole of Genex Corp. for their assistance and advice in the difficult integration process and to Dr. R. M. Norman of Boeing, Corp. for calculating the location of the optimal tracking point for taxi turn guidance.

21
REFERENCES
1. Beskenis, Sharon O., Green, David F., Hyer, Paul V., Johnson, Edward J., Jr.: Integrated Display System for Low Visibility Landing and Surface Operations. NASA/CR-1998-208446, July, 1998.
2. Young, Steven D. and Jones, Denise R.: Flight Demonstration of Integrated Airport Surface Movement Technologies. NASA TM-1998-206283, January, 1998.
3. Johnson, Edward J., Jr., Hyer, Paul V.: Roll-Out and Turn-Off Display Software for Integrated Display System. NASA/CR-1999-209731, November, 1999.
4. Young, Steven D. and Jones, Denise R.: Flight Testing of an Airport Surface Guidance, Navigation and Control System. Navigation 2000 Conference, Long Beach California, 21 Jan. 1998.
5. Hyer, Paul V.: Demonstration of Land and Hold Technology at the Dallas-Fort Worth International Airport. NASA/CR-2002-211642, April, 2002.
6. Jones, Denise R.: Runway Incursion Prevention System Testing at the Wallops Flight Facility. SPIE Defense and Security Symposium 2005, Orlando, FL. 28 Mar. – 1 Apr. 2005
7. Green, David F., Jr.: Runway Safety Monitor - Algorithm for Runway Incursion Detection and Alerting. NASA/CR-2002-211416, January, 2002.
8. Green, David F., Jr.: Runway Safety Monitor Algorithm for Single and Crossing Runway Incursion Detection and Alerting. NASA/CR-2006-214275, February, 2006.

22
TABLE OF ACRONYMS
ATL Atlanta airport
CFIT Controlled flight into terrain
COM Component Object Model
DFW Dallas-Fort Worth airport
DLL Dynamic Link Library
FOV Field-of-view
GIS Geographic information systems
HSALT Hold short after landing technology
HUD Head-up Display
IDS Integrated Display System
ILS Instrument landing system
PC Personal Computer
PFD Primary Flight Display
RIPS Runway Incursion Prevention System
RNO Reno/Tahoe International Airport
ROTO Roll-out to turnoff
RSIL Research Systems Interface Laboratory
SVDC Synthetic Vision Display Concept
SVS Synthetic Vision System
VMC Visual Meteorological Conditions
WAL Wallops Flight Facility

REPORT DOCUMENTATION PAGE Form ApprovedOMB No. 0704-0188
2. REPORT TYPE Contractor Report
4. TITLE AND SUBTITLE
Cockpit Displays for Enhancing Terminal-Area Situational Awareness andRunway Safety
5a. CONTRACT NUMBER
NAS1-00135B
6. AUTHOR(S)
Hyer, Paul V.; and Otero, Sharon
7. PERFORMING ORGANIZATION NAME(S) AND ADDRESS(ES)
NASA Langley Research CenterHampton, VA 23681-2199
9. SPONSORING/MONITORING AGENCY NAME(S) AND ADDRESS(ES)
National Aeronautics and Space AdministrationWashington, DC 20546-0001
8. PERFORMING ORGANIZATION REPORT NUMBER
10. SPONSOR/MONITOR'S ACRONYM(S)
NASA
13. SUPPLEMENTARY NOTESLangley Technical Monitor: Denise R. JonesAn electronic version can be found at http://ntrs.nasa.gov
12. DISTRIBUTION/AVAILABILITY STATEMENTUnclassified - UnlimitedSubject Category 03Availability: NASA CASI (301) 621-0390
19a. NAME OF RESPONSIBLE PERSON
STI Help Desk (email: [email protected])
14. ABSTRACT
HUD and PFD displays have been developed to enhance situational awareness and improve runway safety. These displayswere designed to seamlessly transition through all phases of flight providing guidance and information to the pilot. This reportdescribes the background of the Langley Research Center (LaRC) HUD and PFD work, the steps required to integrate thedisplays with those of other LaRC programs, the display characteristics of the several operational modes and the transitionallogic governing the transition between displays.
15. SUBJECT TERMSRunway incursion; Flight test; Head-up display; Primary flight display; Closed runway; Incursion prevention system;Aviation safety; Synthetic vision; Conflict alerting
18. NUMBER OF PAGES
2719b. TELEPHONE NUMBER (Include area code)
(301) 621-0390
a. REPORT
U
c. THIS PAGE
U
b. ABSTRACT
U
17. LIMITATION OF ABSTRACT
UU
Prescribed by ANSI Std. Z39.18Standard Form 298 (Rev. 8-98)
3. DATES COVERED (From - To)
5b. GRANT NUMBER
5c. PROGRAM ELEMENT NUMBER
5d. PROJECT NUMBER
5e. TASK NUMBER
5f. WORK UNIT NUMBER
609866.02.07.07.02
11. SPONSOR/MONITOR'S REPORT NUMBER(S)
NASA/CR-2007-214545
16. SECURITY CLASSIFICATION OF:
The public reporting burden for this collection of information is estimated to average 1 hour per response, including the time for reviewing instructions, searching existing data sources, gathering and maintaining the data needed, and completing and reviewing the collection of information. Send comments regarding this burden estimate or any other aspect of this collection of information, including suggestions for reducing this burden, to Department of Defense, Washington Headquarters Services, Directorate for Information Operations and Reports (0704-0188), 1215 Jefferson Davis Highway, Suite 1204, Arlington, VA 22202-4302. Respondents should be aware that notwithstanding any other provision of law, no person shall be subject to any penalty for failing to comply with a collection of information if it does not display a currently valid OMB control number.PLEASE DO NOT RETURN YOUR FORM TO THE ABOVE ADDRESS.
1. REPORT DATE (DD-MM-YYYY)
02 - 200701-