cocoa processing company limited, tema
TRANSCRIPT
31ST MARCH 2017
LIMITED, TEMA
COCOA PROCESSING COMPANY
DRAFT FINANCIAL STATEMENTS
FOR THE HALF YEAR ENDED
EXIT PAGE
CONTENTS PAGE
BOARD OF DIRECTORS, OFFICERS AND REGISTERED OFFICE 2
HIGHLIGHTS 3
STATEMENT OF FINANCIAL POSITION 4
STATEMENT OF COMPREHENSIVE INCOME 5
STATEMENT OF CASH FLOWS 6
STATEMENT OF CHANGES IN EQUITY 7
NOTES TO THE FINANCIAL STATEMENT 8 -18
SHAREHOLDING INFORMATION 19
COCOA PROCESSING COMPANY LIMITED
2
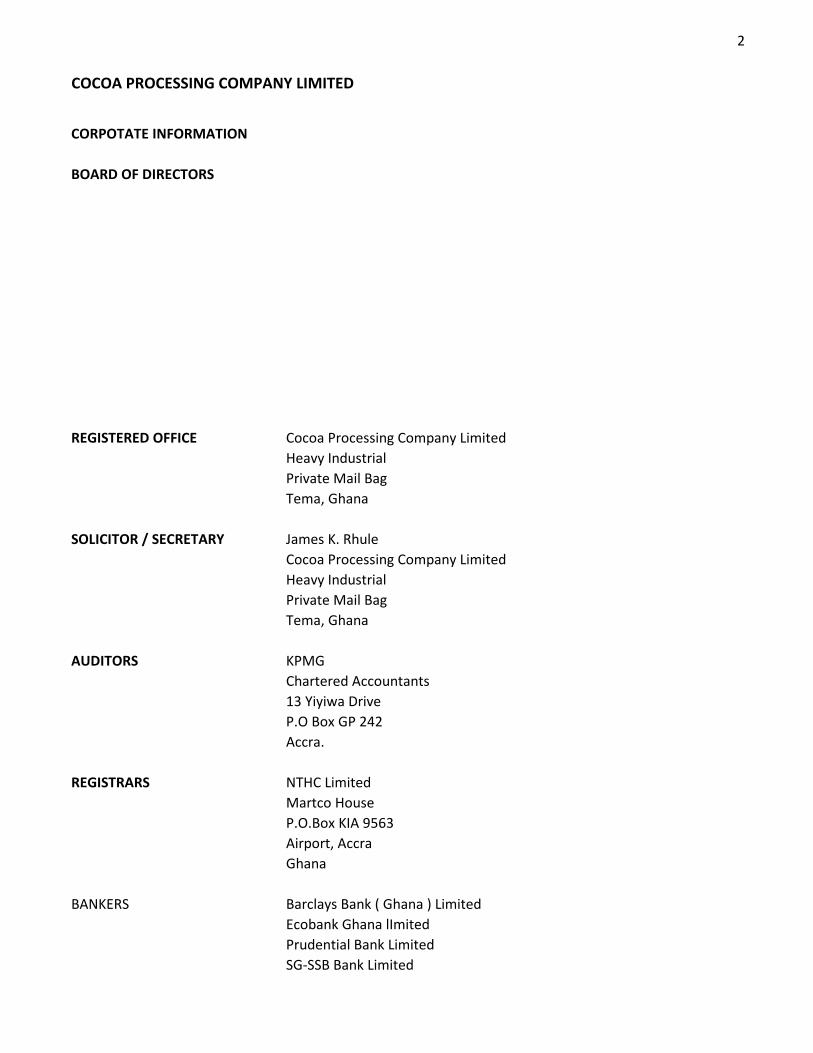
COCOA PROCESSING COMPANY LIMITED
CORPOTATE INFORMATION
BOARD OF DIRECTORS
REGISTERED OFFICE Cocoa Processing Company Limited
Heavy Industrial
Private Mail Bag
Tema, Ghana
SOLICITOR / SECRETARY James K. Rhule
Cocoa Processing Company Limited
Heavy Industrial
Private Mail Bag
Tema, Ghana
AUDITORS KPMG
Chartered Accountants
13 Yiyiwa Drive
P.O Box GP 242
Accra.
REGISTRARS NTHC Limited
Martco House
P.O.Box KIA 9563
Airport, Accra
Ghana
BANKERS Barclays Bank ( Ghana ) Limited
Ecobank Ghana lImited
Prudential Bank Limited
SG-SSB Bank Limited
3
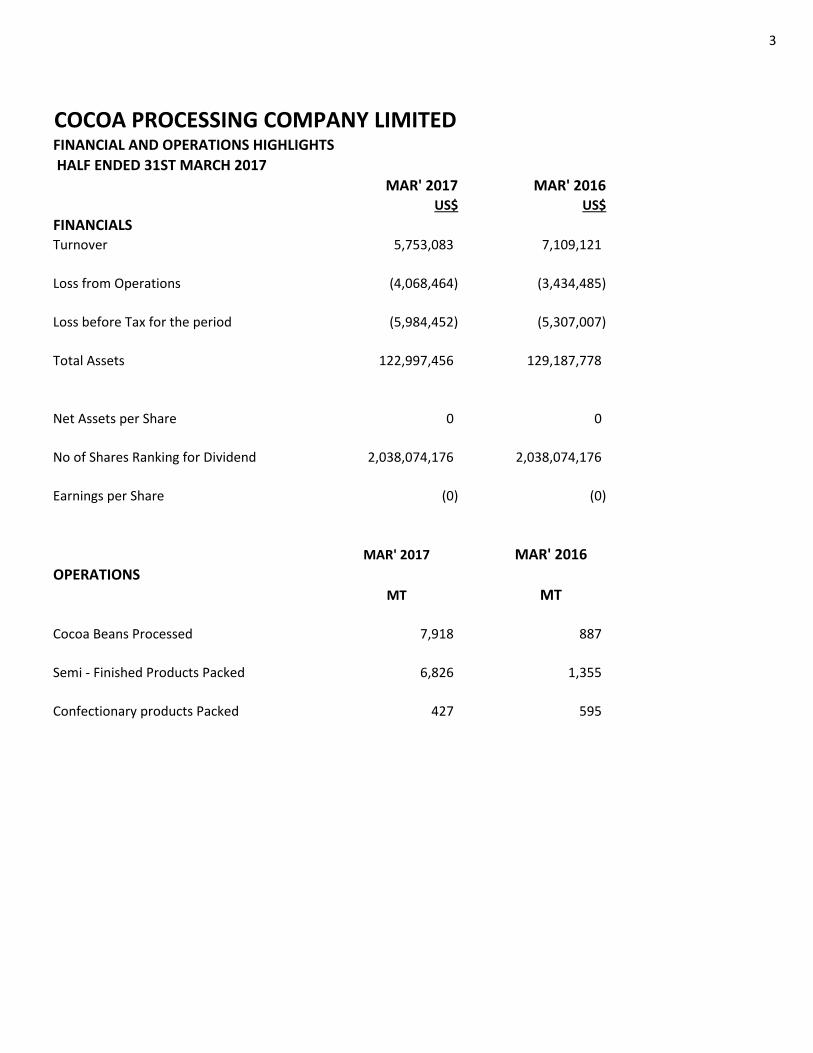
COCOA PROCESSING COMPANY LIMITEDFINANCIAL AND OPERATIONS HIGHLIGHTS
HALF ENDED 31ST MARCH 2017
MAR' 2017 MAR' 2016US$ US$
FINANCIALSTurnover 5,753,083 7,109,121
Loss from Operations (4,068,464) (3,434,485)
Loss before Tax for the period (5,984,452) (5,307,007)
Total Assets 122,997,456 129,187,778
Net Assets per Share 0 0
No of Shares Ranking for Dividend 2,038,074,176 2,038,074,176
Earnings per Share (0) (0)
MAR' 2017 MAR' 2016
OPERATIONS
MT MT
Cocoa Beans Processed 7,918 887
Semi - Finished Products Packed 6,826 1,355
Confectionary products Packed 427 595
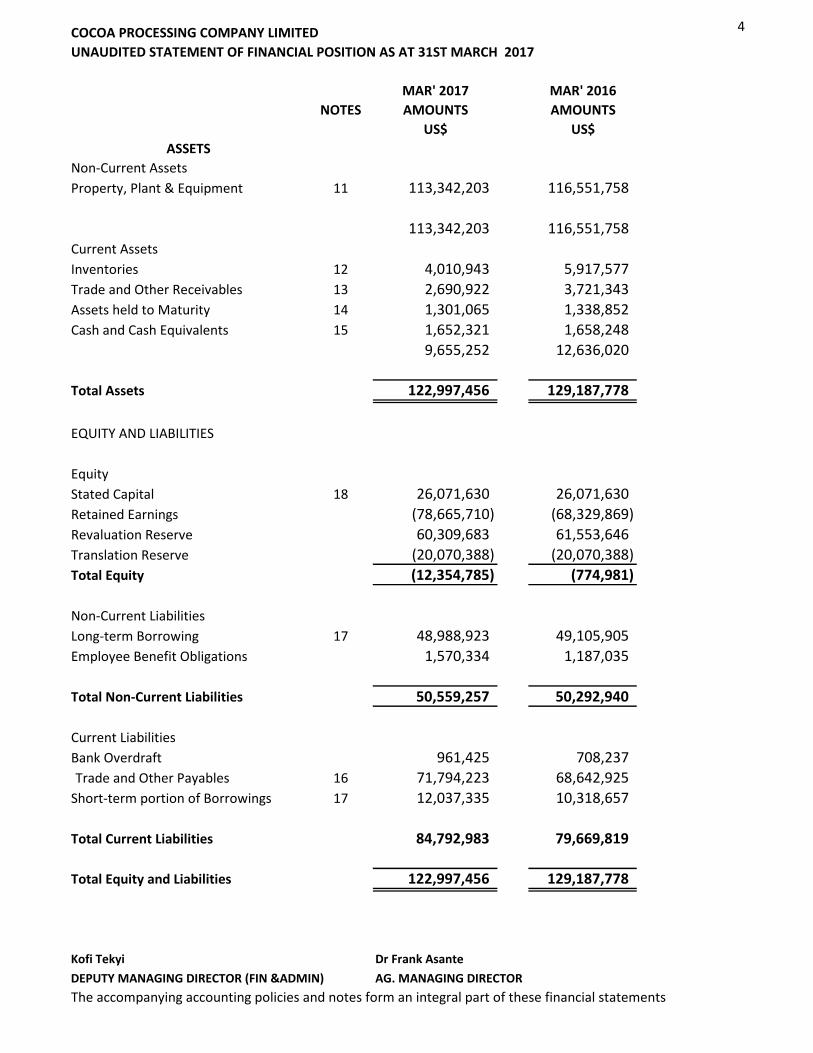
4COCOA PROCESSING COMPANY LIMITED
UNAUDITED STATEMENT OF FINANCIAL POSITION AS AT 31ST MARCH 2017
MAR' 2017 MAR' 2016
NOTES AMOUNTS AMOUNTS
US$ US$
ASSETS
Non-Current Assets
Property, Plant & Equipment 11 113,342,203 116,551,758
113,342,203 116,551,758
Current Assets
Inventories 12 4,010,943 5,917,577
Trade and Other Receivables 13 2,690,922 3,721,343
Assets held to Maturity 14 1,301,065 1,338,852
Cash and Cash Equivalents 15 1,652,321 1,658,248
9,655,252 12,636,020
Total Assets 122,997,456 129,187,778
EQUITY AND LIABILITIES
Equity
Stated Capital 18 26,071,630 26,071,630
Retained Earnings (78,665,710) (68,329,869)
Revaluation Reserve 60,309,683 61,553,646
Translation Reserve (20,070,388) (20,070,388)
Total Equity (12,354,785) (774,981)
Non-Current Liabilities
Long-term Borrowing 17 48,988,923 49,105,905
Employee Benefit Obligations 1,570,334 1,187,035
Total Non-Current Liabilities 50,559,257 50,292,940
Current Liabilities
Bank Overdraft 961,425 708,237
Trade and Other Payables 16 71,794,223 68,642,925
Short-term portion of Borrowings 17 12,037,335 10,318,657
Total Current Liabilities 84,792,983 79,669,819
Total Equity and Liabilities 122,997,456 129,187,778
Kofi Tekyi Dr Frank Asante
DEPUTY MANAGING DIRECTOR (FIN &ADMIN) AG. MANAGING DIRECTOR
The accompanying accounting policies and notes form an integral part of these financial statements
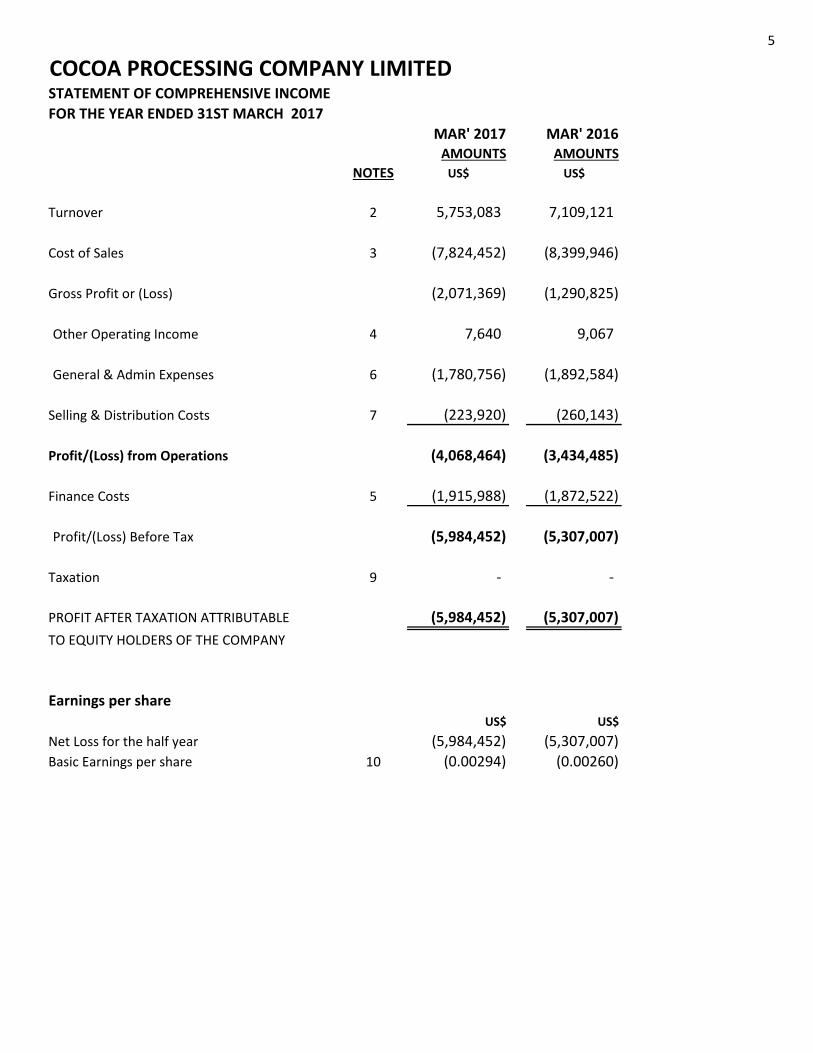
5
COCOA PROCESSING COMPANY LIMITEDSTATEMENT OF COMPREHENSIVE INCOME
FOR THE YEAR ENDED 31ST MARCH 2017
MAR' 2017 MAR' 2016AMOUNTS AMOUNTS
NOTES US$ US$
Turnover 2 5,753,083 7,109,121
Cost of Sales 3 (7,824,452) (8,399,946)
Gross Profit or (Loss) (2,071,369) (1,290,825)
Other Operating Income 4 7,640 9,067
General & Admin Expenses 6 (1,780,756) (1,892,584)
Selling & Distribution Costs 7 (223,920) (260,143)
Profit/(Loss) from Operations (4,068,464) (3,434,485)
Finance Costs 5 (1,915,988) (1,872,522)
Profit/(Loss) Before Tax (5,984,452) (5,307,007)
Taxation 9 - -
PROFIT AFTER TAXATION ATTRIBUTABLE (5,984,452) (5,307,007)
TO EQUITY HOLDERS OF THE COMPANY
Earnings per share
US$ US$
Net Loss for the half year (5,984,452) (5,307,007)
Basic Earnings per share 10 (0.00294) (0.00260)
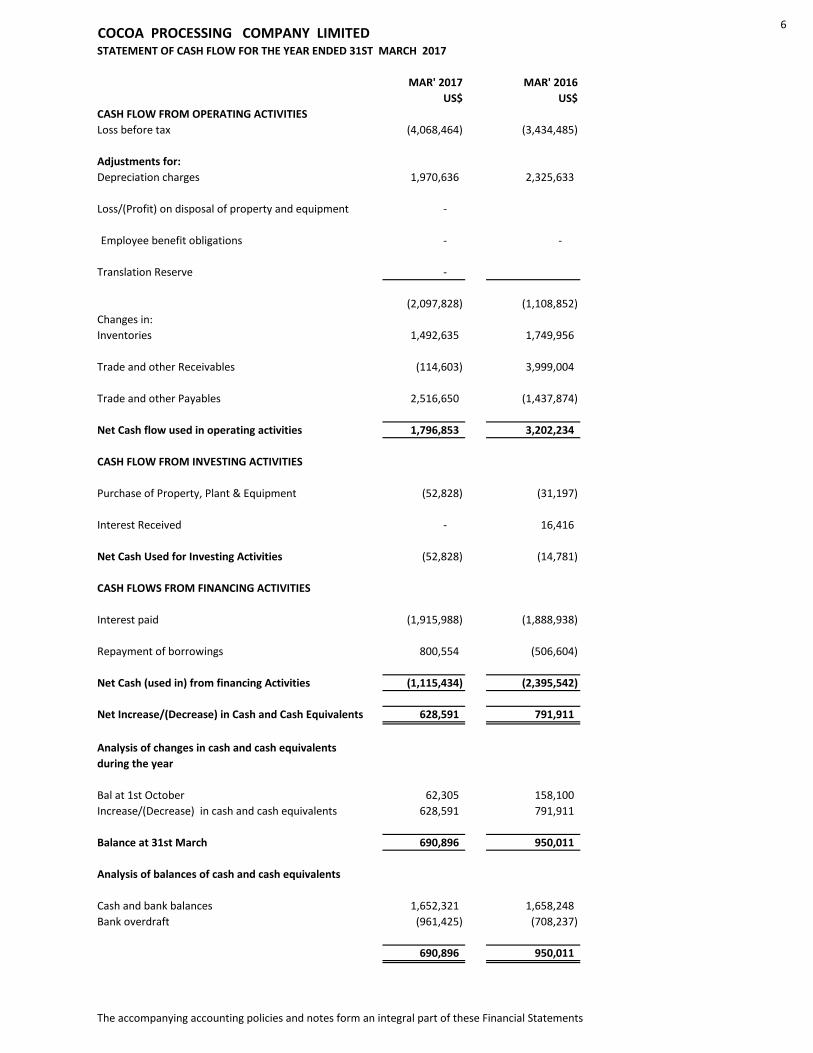
6COCOA PROCESSING COMPANY LIMITED STATEMENT OF CASH FLOW FOR THE YEAR ENDED 31ST MARCH 2017
MAR' 2017 MAR' 2016
US$ US$
CASH FLOW FROM OPERATING ACTIVITIES
Loss before tax (4,068,464) (3,434,485)
Adjustments for:
Depreciation charges 1,970,636 2,325,633
Loss/(Profit) on disposal of property and equipment -
Employee benefit obligations - -
Translation Reserve -
(2,097,828) (1,108,852)
Changes in:
Inventories 1,492,635 1,749,956
Trade and other Receivables (114,603) 3,999,004
Trade and other Payables 2,516,650 (1,437,874)
Net Cash flow used in operating activities 1,796,853 3,202,234
CASH FLOW FROM INVESTING ACTIVITIES
Purchase of Property, Plant & Equipment (52,828) (31,197)
Interest Received - 16,416
Net Cash Used for Investing Activities (52,828) (14,781)
CASH FLOWS FROM FINANCING ACTIVITIES
Interest paid (1,915,988) (1,888,938)
Repayment of borrowings 800,554 (506,604)
Net Cash (used in) from financing Activities (1,115,434) (2,395,542)
Net Increase/(Decrease) in Cash and Cash Equivalents 628,591 791,911
Analysis of changes in cash and cash equivalents
during the year
Bal at 1st October 62,305 158,100
Increase/(Decrease) in cash and cash equivalents 628,591 791,911
Balance at 31st March 690,896 950,011
Analysis of balances of cash and cash equivalents
Cash and bank balances 1,652,321 1,658,248
Bank overdraft (961,425) (708,237)
690,896 950,011
The accompanying accounting policies and notes form an integral part of these Financial Statements
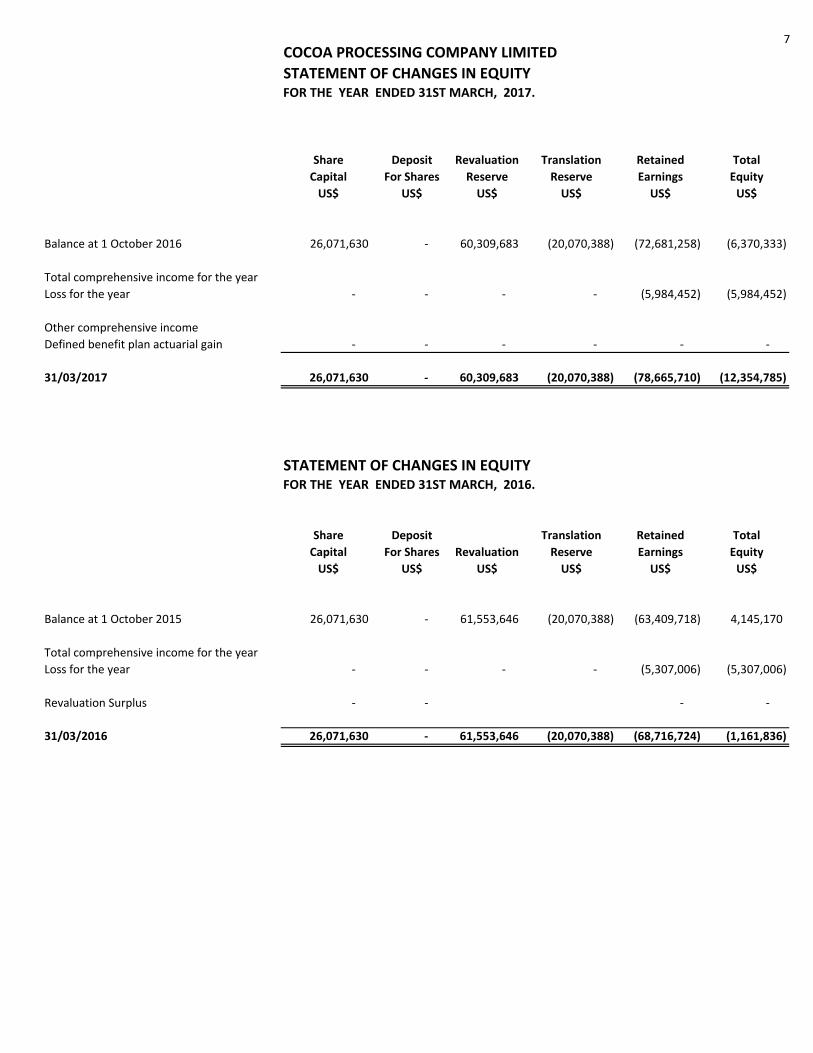
7COCOA PROCESSING COMPANY LIMITED
STATEMENT OF CHANGES IN EQUITYFOR THE YEAR ENDED 31ST MARCH, 2017.
Share Deposit Revaluation Translation Retained Total
Capital For Shares Reserve Reserve Earnings Equity
US$ US$ US$ US$ US$ US$
Balance at 1 October 2016 26,071,630 - 60,309,683 (20,070,388) (72,681,258) (6,370,333)
Total comprehensive income for the year
Loss for the year - - - - (5,984,452) (5,984,452)
Other comprehensive income
Defined benefit plan actuarial gain - - - - - -
31/03/2017 26,071,630 - 60,309,683 (20,070,388) (78,665,710) (12,354,785)
STATEMENT OF CHANGES IN EQUITYFOR THE YEAR ENDED 31ST MARCH, 2016.
Share Deposit Translation Retained Total
Capital For Shares Revaluation Reserve Earnings Equity
US$ US$ US$ US$ US$ US$
Balance at 1 October 2015 26,071,630 - 61,553,646 (20,070,388) (63,409,718) 4,145,170
Total comprehensive income for the year
Loss for the year - - - - (5,307,006) (5,307,006)
Revaluation Surplus - - - -
31/03/2016 26,071,630 - 61,553,646 (20,070,388) (68,716,724) (1,161,836)
8
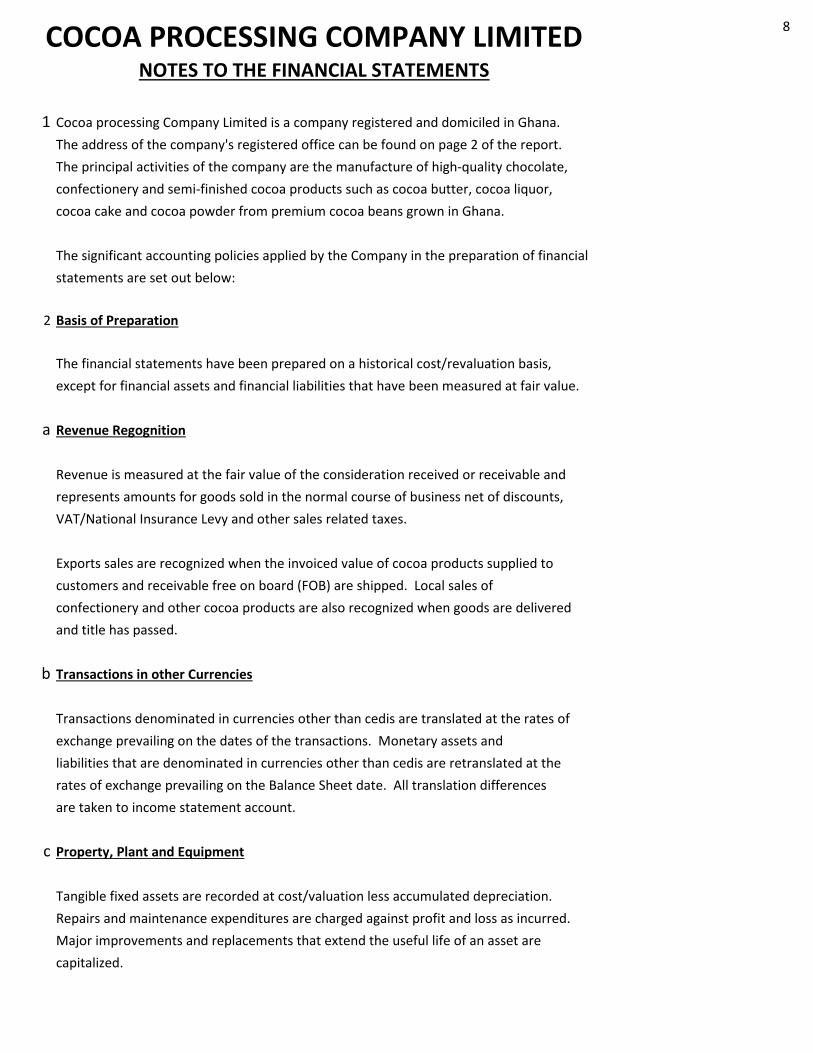
1 Cocoa processing Company Limited is a company registered and domiciled in Ghana.
The address of the company's registered office can be found on page 2 of the report.
The principal activities of the company are the manufacture of high-quality chocolate,
confectionery and semi-finished cocoa products such as cocoa butter, cocoa liquor,
cocoa cake and cocoa powder from premium cocoa beans grown in Ghana.
The significant accounting policies applied by the Company in the preparation of financial
statements are set out below:
2 Basis of Preparation
The financial statements have been prepared on a historical cost/revaluation basis,
except for financial assets and financial liabilities that have been measured at fair value.
a Revenue Regognition
Revenue is measured at the fair value of the consideration received or receivable and
represents amounts for goods sold in the normal course of business net of discounts,
VAT/National Insurance Levy and other sales related taxes.
Exports sales are recognized when the invoiced value of cocoa products supplied to
customers and receivable free on board (FOB) are shipped. Local sales of
confectionery and other cocoa products are also recognized when goods are delivered
and title has passed.
b Transactions in other Currencies
Transactions denominated in currencies other than cedis are translated at the rates of
exchange prevailing on the dates of the transactions. Monetary assets and
liabilities that are denominated in currencies other than cedis are retranslated at the
rates of exchange prevailing on the Balance Sheet date. All translation differences
are taken to income statement account.
c Property, Plant and Equipment
Tangible fixed assets are recorded at cost/valuation less accumulated depreciation.
Repairs and maintenance expenditures are charged against profit and loss as incurred.
Major improvements and replacements that extend the useful life of an asset are
capitalized.
COCOA PROCESSING COMPANY LIMITEDNOTES TO THE FINANCIAL STATEMENTS
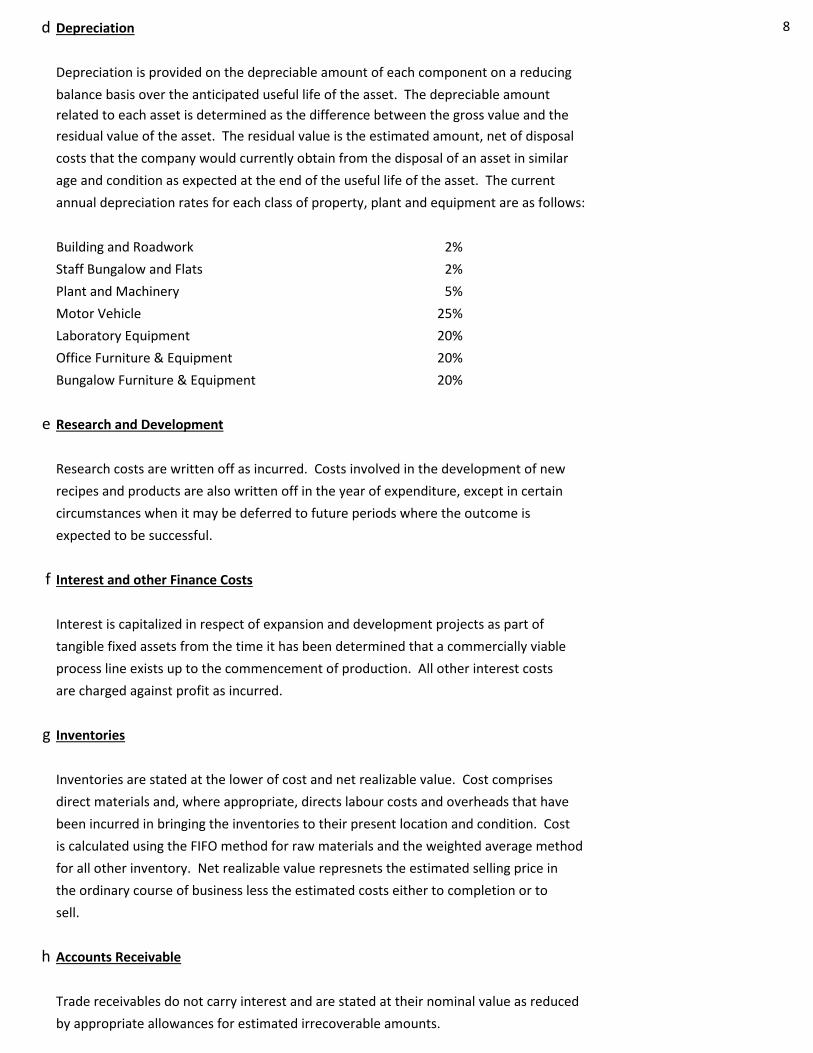
8d Depreciation
Depreciation is provided on the depreciable amount of each component on a reducing
balance basis over the anticipated useful life of the asset. The depreciable amount
related to each asset is determined as the difference between the gross value and the
residual value of the asset. The residual value is the estimated amount, net of disposal
costs that the company would currently obtain from the disposal of an asset in similar
age and condition as expected at the end of the useful life of the asset. The current
annual depreciation rates for each class of property, plant and equipment are as follows:
Building and Roadwork 2%
Staff Bungalow and Flats 2%
Plant and Machinery 5%
Motor Vehicle 25%
Laboratory Equipment 20%
Office Furniture & Equipment 20%
Bungalow Furniture & Equipment 20%
e Research and Development
Research costs are written off as incurred. Costs involved in the development of new
recipes and products are also written off in the year of expenditure, except in certain
circumstances when it may be deferred to future periods where the outcome is
expected to be successful.
f Interest and other Finance Costs
Interest is capitalized in respect of expansion and development projects as part of
tangible fixed assets from the time it has been determined that a commercially viable
process line exists up to the commencement of production. All other interest costs
are charged against profit as incurred.
g Inventories
Inventories are stated at the lower of cost and net realizable value. Cost comprises
direct materials and, where appropriate, directs labour costs and overheads that have
been incurred in bringing the inventories to their present location and condition. Cost
is calculated using the FIFO method for raw materials and the weighted average method
for all other inventory. Net realizable value represnets the estimated selling price in
the ordinary course of business less the estimated costs either to completion or to
sell.
h Accounts Receivable
Trade receivables do not carry interest and are stated at their nominal value as reduced
by appropriate allowances for estimated irrecoverable amounts.
10
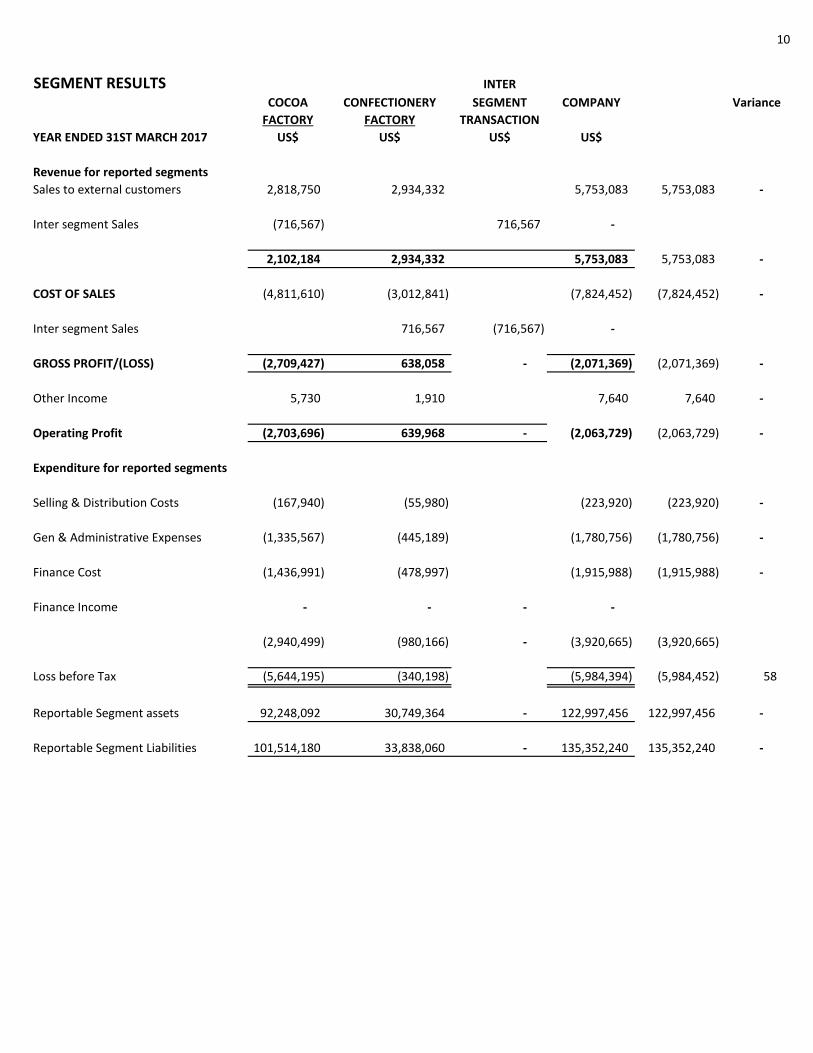
SEGMENT RESULTS INTER
COCOA CONFECTIONERY SEGMENT COMPANY Variance
FACTORY FACTORY TRANSACTION
YEAR ENDED 31ST MARCH 2017 US$ US$ US$ US$
Revenue for reported segments
Sales to external customers 2,818,750 2,934,332 5,753,083 5,753,083 -
Inter segment Sales (716,567) 716,567 -
2,102,184 2,934,332 5,753,083 5,753,083 -
COST OF SALES (4,811,610) (3,012,841) (7,824,452) (7,824,452) -
Inter segment Sales 716,567 (716,567) -
GROSS PROFIT/(LOSS) (2,709,427) 638,058 - (2,071,369) (2,071,369) -
Other Income 5,730 1,910 7,640 7,640 -
Operating Profit (2,703,696) 639,968 - (2,063,729) (2,063,729) -
Expenditure for reported segments
Selling & Distribution Costs (167,940) (55,980) (223,920) (223,920) -
Gen & Administrative Expenses (1,335,567) (445,189) (1,780,756) (1,780,756) -
Finance Cost (1,436,991) (478,997) (1,915,988) (1,915,988) -
Finance Income - - - -
(2,940,499) (980,166) - (3,920,665) (3,920,665)
Loss before Tax (5,644,195) (340,198) (5,984,394) (5,984,452) 58
Reportable Segment assets 92,248,092 30,749,364 - 122,997,456 122,997,456 -
Reportable Segment Liabilities 101,514,180 33,838,060 - 135,352,240 135,352,240 -
11
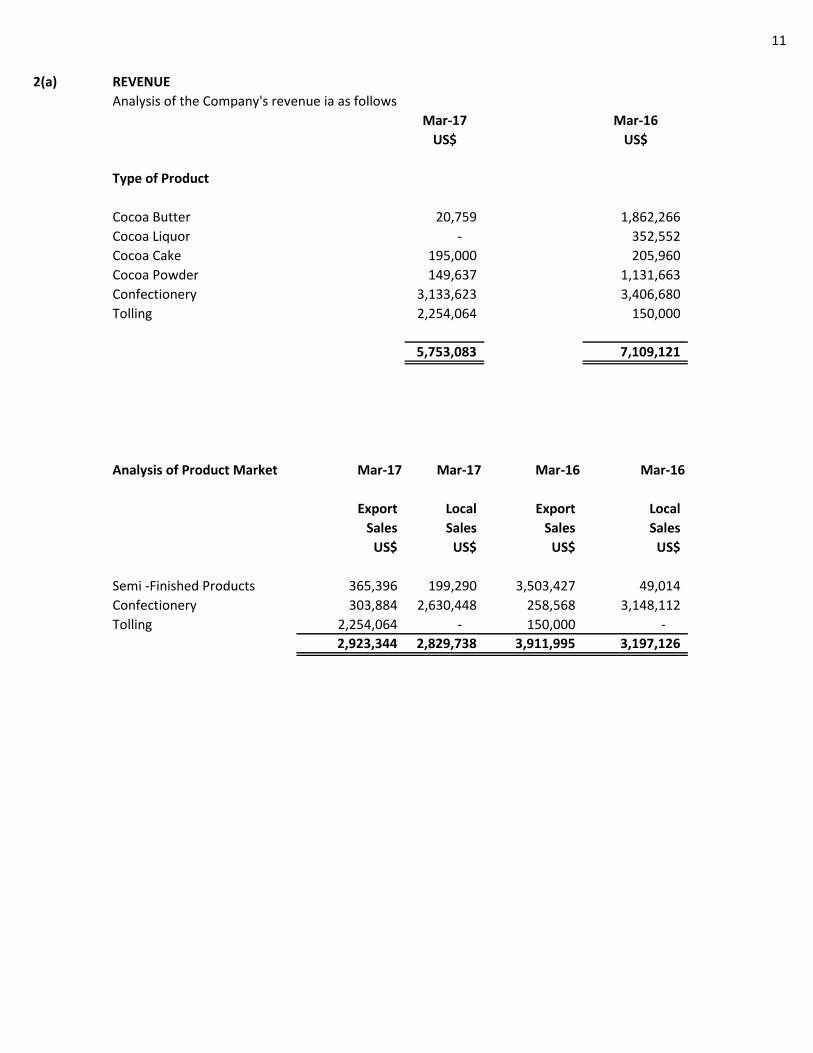
2(a) REVENUE
Analysis of the Company's revenue ia as follows
Mar-17 Mar-16
US$ US$
Type of Product
Cocoa Butter 20,759 1,862,266
Cocoa Liquor - 352,552
Cocoa Cake 195,000 205,960
Cocoa Powder 149,637 1,131,663
Confectionery 3,133,623 3,406,680
Tolling 2,254,064 150,000
5,753,083 7,109,121
Analysis of Product Market Mar-17 Mar-17 Mar-16 Mar-16
Export Local Export Local
Sales Sales Sales Sales
US$ US$ US$ US$
Semi -Finished Products 365,396 199,290 3,503,427 49,014
Confectionery 303,884 2,630,448 258,568 3,148,112
Tolling 2,254,064 - 150,000 -
2,923,344 2,829,738 3,911,995 3,197,126
12
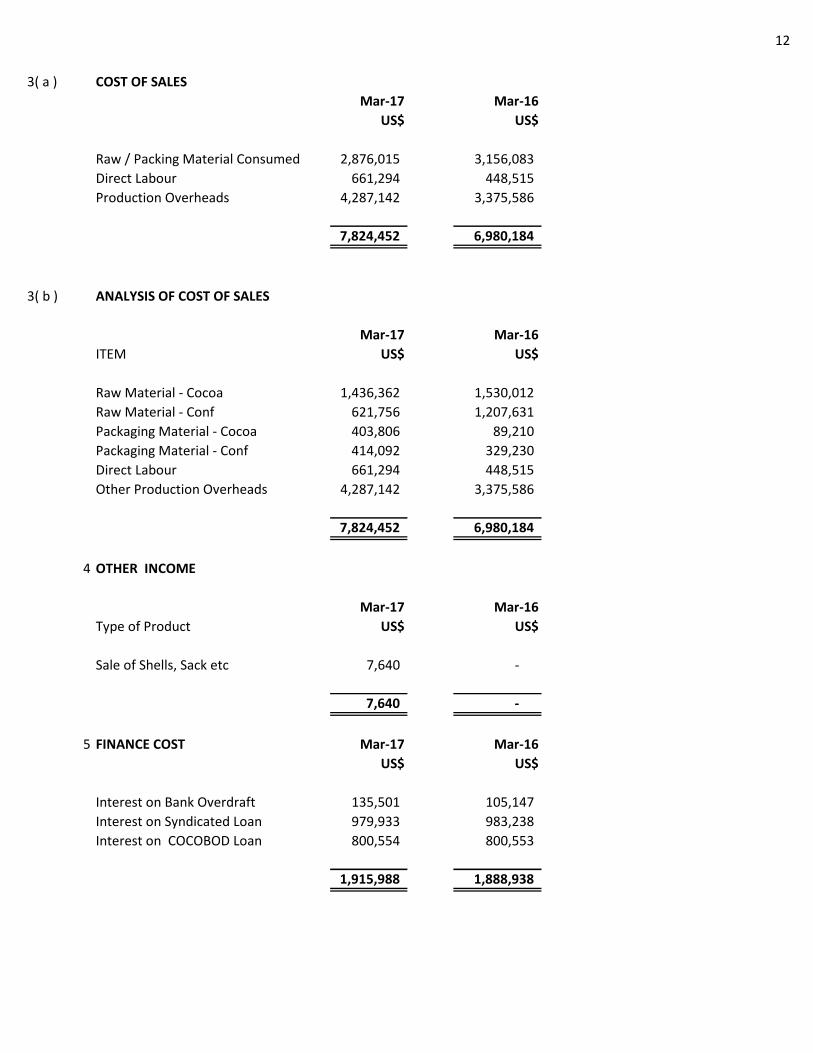
3( a ) COST OF SALES
Mar-17 Mar-16
US$ US$
Raw / Packing Material Consumed 2,876,015 3,156,083
Direct Labour 661,294 448,515
Production Overheads 4,287,142 3,375,586
7,824,452 6,980,184
3( b ) ANALYSIS OF COST OF SALES
Mar-17 Mar-16
ITEM US$ US$
Raw Material - Cocoa 1,436,362 1,530,012
Raw Material - Conf 621,756 1,207,631
Packaging Material - Cocoa 403,806 89,210
Packaging Material - Conf 414,092 329,230
Direct Labour 661,294 448,515
Other Production Overheads 4,287,142 3,375,586
7,824,452 6,980,184
4 OTHER INCOME
Mar-17 Mar-16
Type of Product US$ US$
Sale of Shells, Sack etc 7,640 -
7,640 -
5 FINANCE COST Mar-17 Mar-16
US$ US$
Interest on Bank Overdraft 135,501 105,147
Interest on Syndicated Loan 979,933 983,238
Interest on COCOBOD Loan 800,554 800,553
1,915,988 1,888,938
13
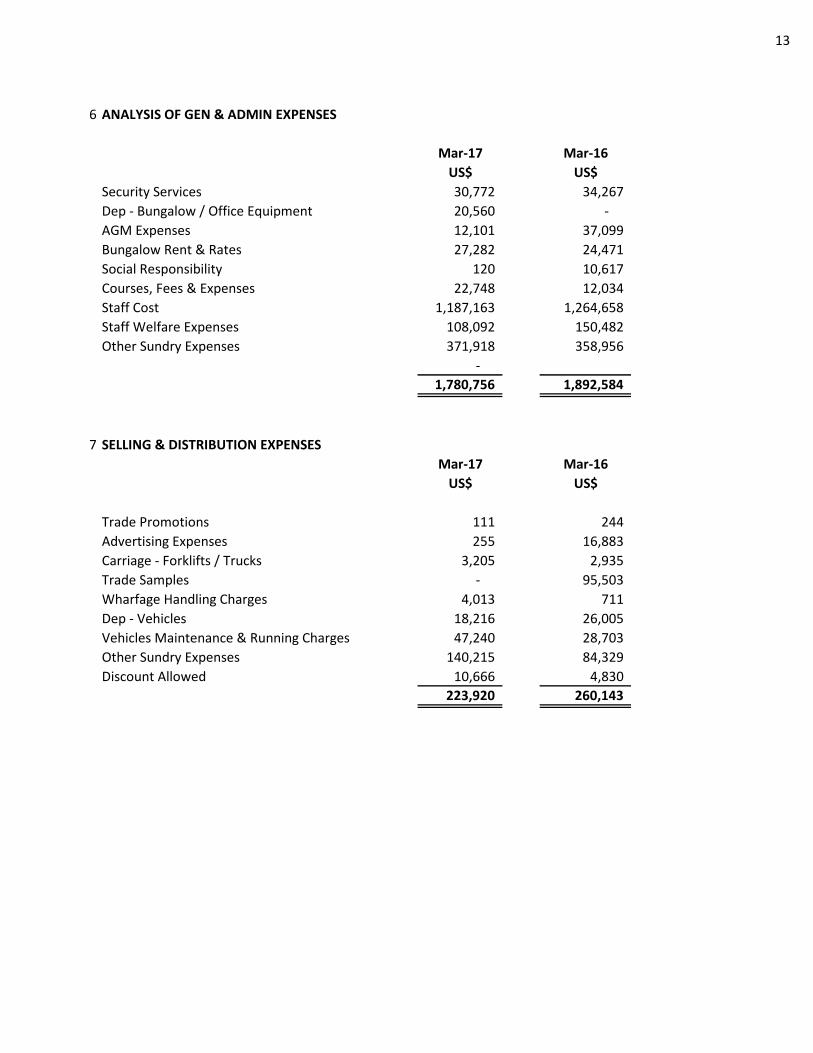
6 ANALYSIS OF GEN & ADMIN EXPENSES
Mar-17 Mar-16
US$ US$
Security Services 30,772 34,267
Dep - Bungalow / Office Equipment 20,560 -
AGM Expenses 12,101 37,099
Bungalow Rent & Rates 27,282 24,471
Social Responsibility 120 10,617
Courses, Fees & Expenses 22,748 12,034
Staff Cost 1,187,163 1,264,658
Staff Welfare Expenses 108,092 150,482
Other Sundry Expenses 371,918 358,956
-
1,780,756 1,892,584
7 SELLING & DISTRIBUTION EXPENSES
Mar-17 Mar-16
US$ US$
Trade Promotions 111 244
Advertising Expenses 255 16,883
Carriage - Forklifts / Trucks 3,205 2,935
Trade Samples - 95,503
Wharfage Handling Charges 4,013 711
Dep - Vehicles 18,216 26,005
Vehicles Maintenance & Running Charges 47,240 28,703
Other Sundry Expenses 140,215 84,329
Discount Allowed 10,666 4,830
223,920 260,143
14
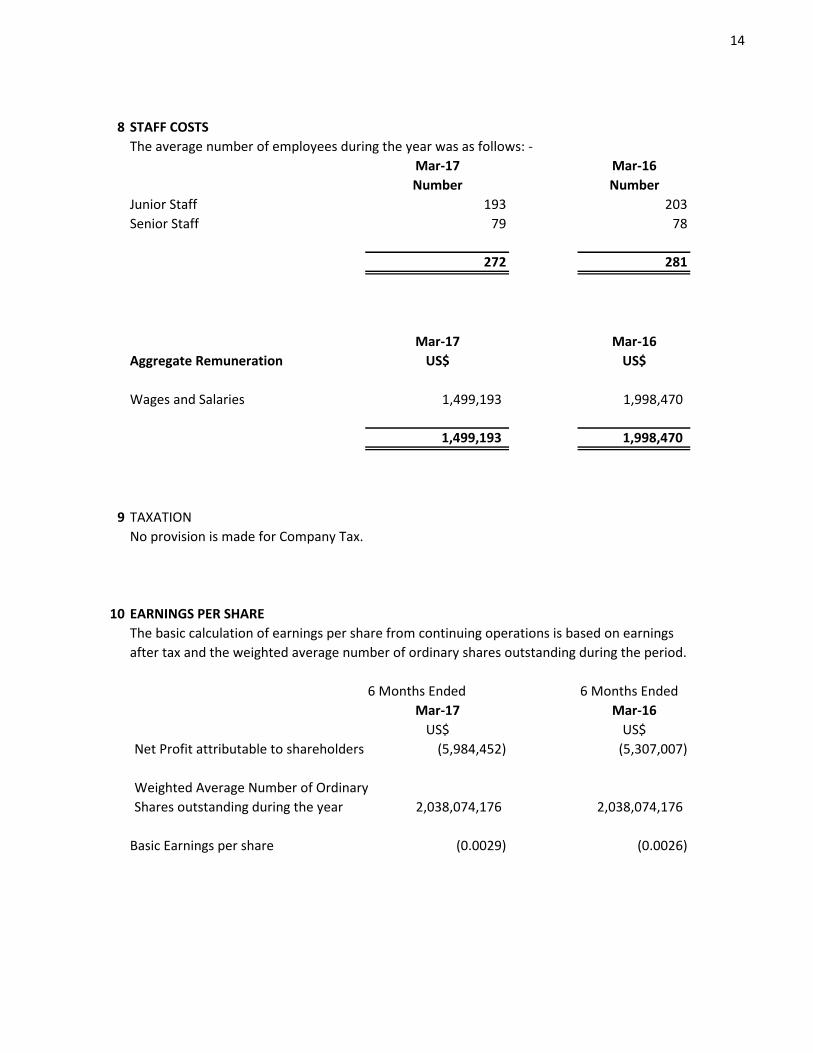
8 STAFF COSTS
The average number of employees during the year was as follows: -
Mar-17 Mar-16
Number Number
Junior Staff 193 203
Senior Staff 79 78
272 281
Mar-17 Mar-16
Aggregate Remuneration US$ US$
Wages and Salaries 1,499,193 1,998,470
1,499,193 1,998,470
9 TAXATION
No provision is made for Company Tax.
10 EARNINGS PER SHARE
The basic calculation of earnings per share from continuing operations is based on earnings
after tax and the weighted average number of ordinary shares outstanding during the period.
6 Months Ended 6 Months Ended
Mar-17 Mar-16
US$ US$
Net Profit attributable to shareholders (5,984,452) (5,307,007)
Weighted Average Number of Ordinary
Shares outstanding during the year 2,038,074,176 2,038,074,176
Basic Earnings per share (0.0029) (0.0026)
15
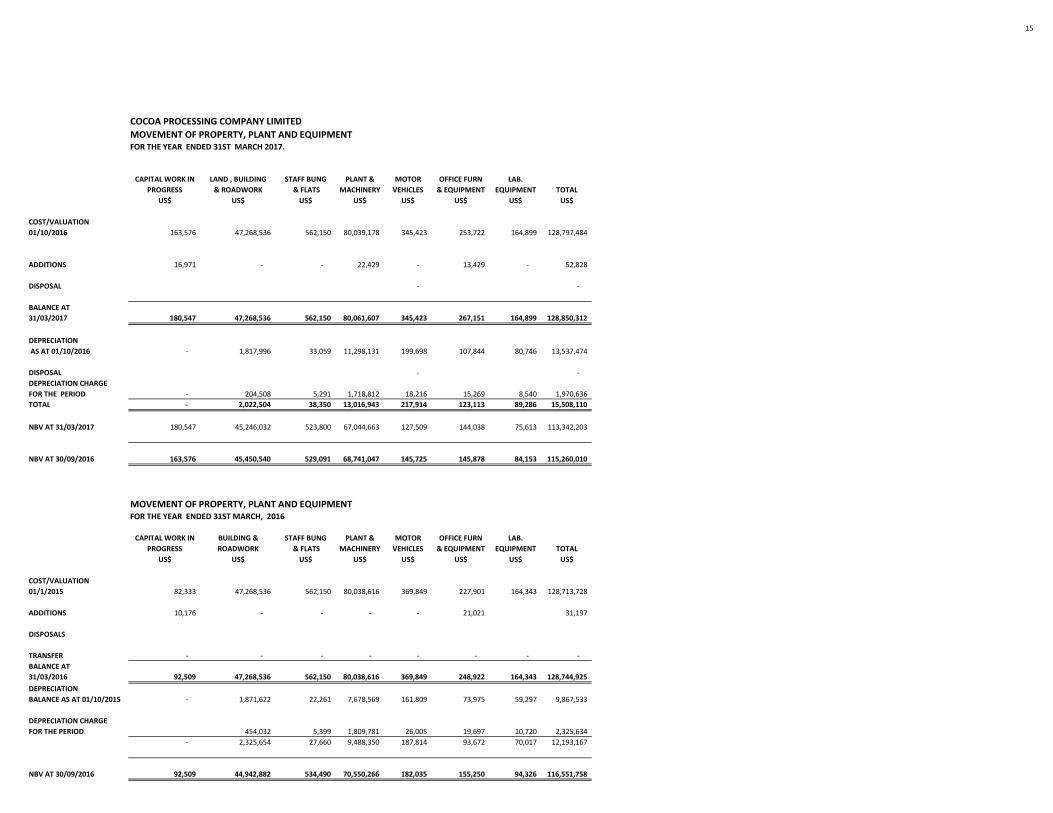
COCOA PROCESSING COMPANY LIMITED
MOVEMENT OF PROPERTY, PLANT AND EQUIPMENTFOR THE YEAR ENDED 31ST MARCH 2017.
CAPITAL WORK IN LAND , BUILDING STAFF BUNG PLANT & MOTOR OFFICE FURN LAB.
PROGRESS & ROADWORK & FLATS MACHINERY VEHICLES & EQUIPMENT EQUIPMENT TOTAL
US$ US$ US$ US$ US$ US$ US$ US$
COST/VALUATION
01/10/2016 163,576 47,268,536 562,150 80,039,178 345,423 253,722 164,899 128,797,484
ADDITIONS 16,971 - - 22,429 - 13,429 - 52,828
DISPOSAL - -
BALANCE AT
31/03/2017 180,547 47,268,536 562,150 80,061,607 345,423 267,151 164,899 128,850,312
DEPRECIATION
AS AT 01/10/2016 - 1,817,996 33,059 11,298,131 199,698 107,844 80,746 13,537,474
DISPOSAL - -
DEPRECIATION CHARGE
FOR THE PERIOD - 204,508 5,291 1,718,812 18,216 15,269 8,540 1,970,636
TOTAL - 2,022,504 38,350 13,016,943 217,914 123,113 89,286 15,508,110
NBV AT 31/03/2017 180,547 45,246,032 523,800 67,044,663 127,509 144,038 75,613 113,342,203
NBV AT 30/09/2016 163,576 45,450,540 529,091 68,741,047 145,725 145,878 84,153 115,260,010
MOVEMENT OF PROPERTY, PLANT AND EQUIPMENTFOR THE YEAR ENDED 31ST MARCH, 2016
CAPITAL WORK IN BUILDING & STAFF BUNG PLANT & MOTOR OFFICE FURN LAB.
PROGRESS ROADWORK & FLATS MACHINERY VEHICLES & EQUIPMENT EQUIPMENT TOTAL
US$ US$ US$ US$ US$ US$ US$ US$
COST/VALUATION
01/1/2015 82,333 47,268,536 562,150 80,038,616 369,849 227,901 164,343 128,713,728
ADDITIONS 10,176 - - - - 21,021 31,197
DISPOSALS
TRANSFER - - - - - - - -
BALANCE AT
31/03/2016 92,509 47,268,536 562,150 80,038,616 369,849 248,922 164,343 128,744,925
DEPRECIATION
BALANCE AS AT 01/10/2015 - 1,871,622 22,261 7,678,569 161,809 73,975 59,297 9,867,533
DEPRECIATION CHARGE
FOR THE PERIOD 454,032 5,399 1,809,781 26,005 19,697 10,720 2,325,634
- 2,325,654 27,660 9,488,350 187,814 93,672 70,017 12,193,167
NBV AT 30/09/2016 92,509 44,942,882 534,490 70,550,266 182,035 155,250 94,326 116,551,758
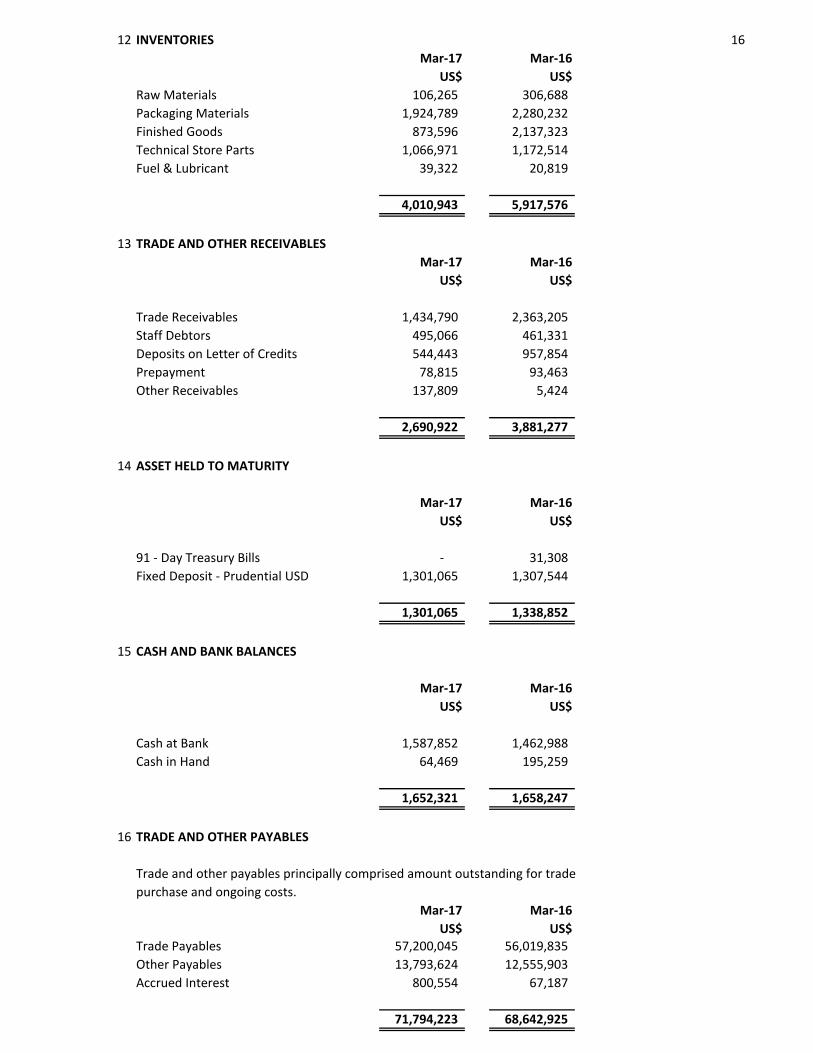
1612 INVENTORIES
Mar-17 Mar-16
US$ US$
Raw Materials 106,265 306,688
Packaging Materials 1,924,789 2,280,232
Finished Goods 873,596 2,137,323
Technical Store Parts 1,066,971 1,172,514
Fuel & Lubricant 39,322 20,819
4,010,943 5,917,576
13 TRADE AND OTHER RECEIVABLES
Mar-17 Mar-16
US$ US$
Trade Receivables 1,434,790 2,363,205
Staff Debtors 495,066 461,331
Deposits on Letter of Credits 544,443 957,854
Prepayment 78,815 93,463
Other Receivables 137,809 5,424
2,690,922 3,881,277
14 ASSET HELD TO MATURITY
Mar-17 Mar-16
US$ US$
91 - Day Treasury Bills - 31,308
Fixed Deposit - Prudential USD 1,301,065 1,307,544
1,301,065 1,338,852
15 CASH AND BANK BALANCES
Mar-17 Mar-16
US$ US$
Cash at Bank 1,587,852 1,462,988
Cash in Hand 64,469 195,259
1,652,321 1,658,247
16 TRADE AND OTHER PAYABLES
Trade and other payables principally comprised amount outstanding for trade
purchase and ongoing costs.
Mar-17 Mar-16
US$ US$
Trade Payables 57,200,045 56,019,835
Other Payables 13,793,624 12,555,903
Accrued Interest 800,554 67,187
71,794,223 68,642,925
17
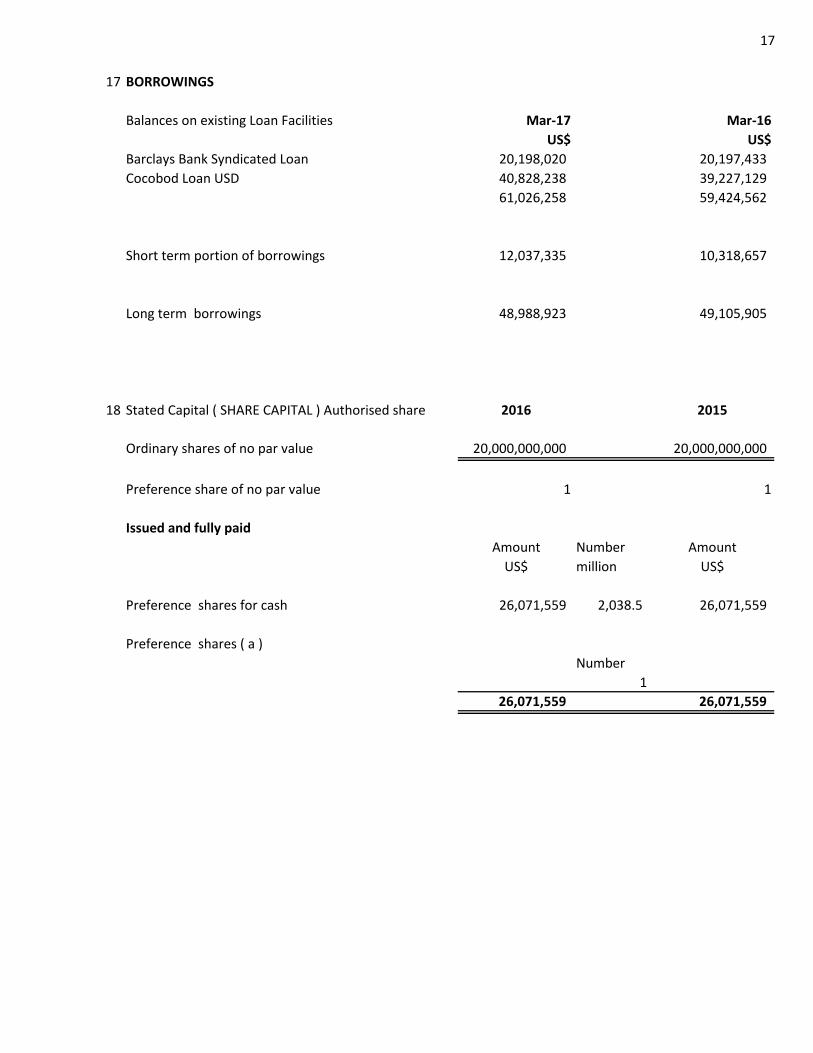
17 BORROWINGS
Balances on existing Loan Facilities Mar-17 Mar-16
US$ US$
Barclays Bank Syndicated Loan 20,198,020 20,197,433
Cocobod Loan USD 40,828,238 39,227,129
61,026,258 59,424,562
Short term portion of borrowings 12,037,335 10,318,657
Long term borrowings 48,988,923 49,105,905
18 Stated Capital ( SHARE CAPITAL ) Authorised share 2016 2015
Ordinary shares of no par value 20,000,000,000 20,000,000,000
Preference share of no par value 1 1
Issued and fully paid
Amount Number Amount
US$ million US$
Preference shares for cash 26,071,559 2,038.5 26,071,559
Preference shares ( a )
Number
1
26,071,559 26,071,559

18
19 CONTIGENT LIABILITIES
The company is from time to time, party to legal proceedings and claims, which arise in
the ordinary course of business. The directors do not anticipate that the outcome of these
proceedings and claims, either individually or in aggregate, will have a material adverse
effect upon the company's financial position.
Mar-17 Mar-16
20 CASH & CASH EQUIVALENTS US$ US$
Cash at Bank 1,587,852 1,462,988
Cash in hand 64,469 195,259
Fixed Deposits - -
Cash and Cash Equivalents1,652,321 1,658,247
Bank Overdraft (961,425) (708,237)
Cash and Cash Equivalents in the690,896 950,010
statement of cash flow

19
COCOA PROCESSING COMPANY LIMITEDTWENTY LARGEST SHAREHOLDERS
Shareholder's Name No of Shares % Holding
1 Ghana Cocoa Board 1,176,599,176 57.73
2 Government of Ghana c/o Ministry of Finance 532,554,100 26.13
3 Social Security & National Insurance Trust 206,754,000 10.14
4 Badu Collins K 3,181,000 0.16
5 SIC Life Company Limited 2,240,000 0.11
6 Donewell Life Company Limited 1,920,000 0.09
7 Ghana Reinsurance Company Limited 1,600,000 0.08
8 Agricultural Development Bank 1,600,000 0.08
9 Osei Isaac 1,583,900 0.08
10 Baah Matthew Mensah 960,000 0.05
11 Badu Collins Kwabena 876,900 0.04
12 Otchere - Boateng Lordina Justina 800,000 0.04
13 Ghana Libyan Arab Holding Company 800,000 0.04
14 Beaudoin Patrick 800,000 0.04
15 E.H. Boohene Foundation 800,000 0.04
16 Tetteh Richard Armarh 552,000 0.03
17 Adjei Seth Adjete 550,000 0.03
18 Teachers' Fund 500,000 0.02
19 Hyde Joel Emmanuel 500,000 0.02
20 Insurance Compensation Fund 480,000 0.02
1,935,651,076 94.97
Others 102,423,100 5.03
2,038,074,176 100.00
DIRECTORS' SHAREHOLDING AT 31ST MARCH 2015
No of Shares
Rose Emma Mamaa Entsua - Mensah 100,000
Aloko Francis Mahdi 70,408
SHAREHOLDING DISTRIBUTION AT 31ST MARCH 2015
No of Shareholders No of Shares % Holding
1 - 1000 28,100 12,876,891 0.55
1,001 - 5,000 18,439 41,159,318 1.76
5,001 - 10,000 1,608 12,401,194 0.54
Over 10,001 909 1,971,636,773 97.15
49,056 2,038,074,176 100.00