cod (gadus morhua) in subdivisions 24–32, eastern baltic
TRANSCRIPT

ICES Advice on fishing opportunities, catch, and effort Baltic Sea ecoregion Published 28 May 2021
ICES Advice 2021 – cod.27.24-32 – https://doi.org/10.17895/ices.advice.7745 ICES advice, as adopted by its Advisory Committee (ACOM), is developed upon request by ICES clients (European Union, Iceland, NASCO, NEAFC, Norway, and United Kingdom). 1
Cod (Gadus morhua) in subdivisions 24–32, eastern Baltic stock (eastern Baltic Sea) ICES advice on fishing opportunities ICES advises that when the precautionary approach is applied, there should be zero catch in 2022. This advice applies to all catches from the stock in subdivisions (SDs) 24–32. Stock development over time ICES assesses that spawning-stock size is below Blim and Bpa. No reference points for fishing pressure have been defined for this stock.
Figure 1 Cod in subdivisions 24–32, eastern Baltic stock. Summary of the stock assessment. The assumed recruitment (R) values for 2020 and 2021 are shaded in a lighter colour.
Catch scenarios Table 1 Cod in subdivisions 24–32, eastern Baltic stock. Assumptions made for the interim year and in the forecast.
Variable Value Notes Fages 4–6 (2021) 0.04 F based on catch constraint
SSB (2021) 60 366 From assessment; tonnes
Rage 0 (2020–2023) 1 813 170 Average of 2015–2019; thousands
Mages 4–6 (2021–2023) 0.74 Natural mortality estimated by the assessment in 2020
Total catch (2021) 3595 EU TAC 595 tonnes + Russian quota 3000; tonnes
ICES Advice on fishing opportunities, catch, and effort Published 28 May 2021 cod.27.24-32
ICES Advice 2021 2
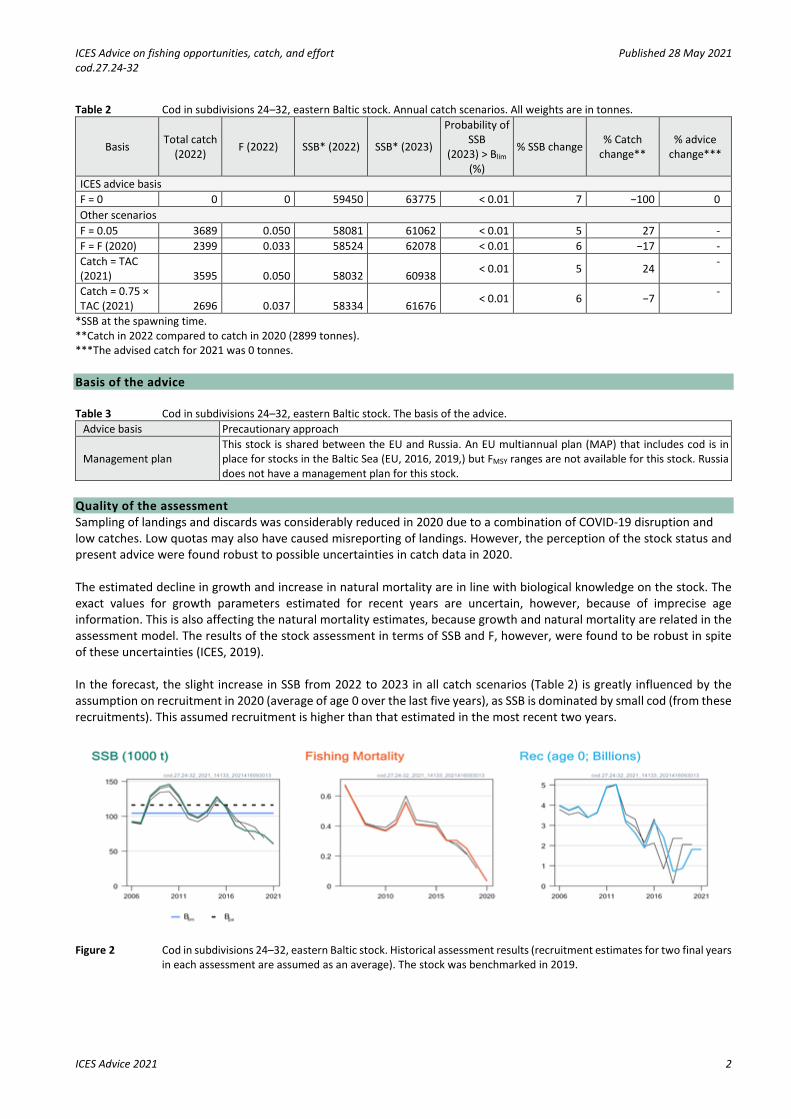
Table 2 Cod in subdivisions 24–32, eastern Baltic stock. Annual catch scenarios. All weights are in tonnes.
Basis Total catch (2022) F (2022) SSB* (2022) SSB* (2023)
Probability of SSB
(2023) > Blim (%)
% SSB change % Catch change**
% advice change***
ICES advice basis F = 0 0 0 59450 63775 < 0.01 7 −100 0 Other scenarios F = 0.05 3689 0.050 58081 61062 < 0.01 5 27 - F = F (2020) 2399 0.033 58524 62078 < 0.01 6 −17 - Catch = TAC (2021) 3595 0.050 58032 60938 < 0.01 5 24 -
Catch = 0.75 × TAC (2021) 2696 0.037 58334 61676 < 0.01 6 −7 -
*SSB at the spawning time. **Catch in 2022 compared to catch in 2020 (2899 tonnes). ***The advised catch for 2021 was 0 tonnes. Basis of the advice Table 3 Cod in subdivisions 24–32, eastern Baltic stock. The basis of the advice.
Advice basis Precautionary approach
Management plan This stock is shared between the EU and Russia. An EU multiannual plan (MAP) that includes cod is in place for stocks in the Baltic Sea (EU, 2016, 2019,) but FMSY ranges are not available for this stock. Russia does not have a management plan for this stock.
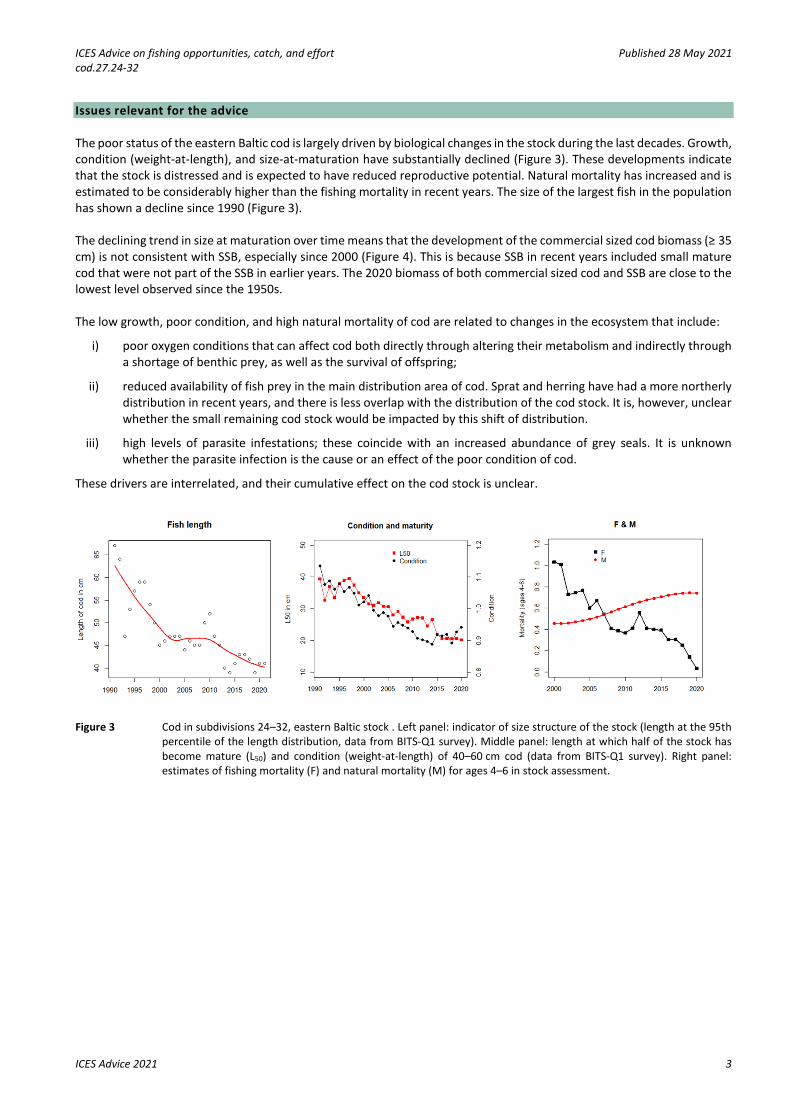
Quality of the assessment Sampling of landings and discards was considerably reduced in 2020 due to a combination of COVID-19 disruption and low catches. Low quotas may also have caused misreporting of landings. However, the perception of the stock status and present advice were found robust to possible uncertainties in catch data in 2020. The estimated decline in growth and increase in natural mortality are in line with biological knowledge on the stock. The exact values for growth parameters estimated for recent years are uncertain, however, because of imprecise age information. This is also affecting the natural mortality estimates, because growth and natural mortality are related in the assessment model. The results of the stock assessment in terms of SSB and F, however, were found to be robust in spite of these uncertainties (ICES, 2019). In the forecast, the slight increase in SSB from 2022 to 2023 in all catch scenarios (Table 2) is greatly influenced by the assumption on recruitment in 2020 (average of age 0 over the last five years), as SSB is dominated by small cod (from these recruitments). This assumed recruitment is higher than that estimated in the most recent two years.
Figure 2 Cod in subdivisions 24–32, eastern Baltic stock. Historical assessment results (recruitment estimates for two final years
in each assessment are assumed as an average). The stock was benchmarked in 2019.
ICES Advice on fishing opportunities, catch, and effort Published 28 May 2021 cod.27.24-32
ICES Advice 2021 3
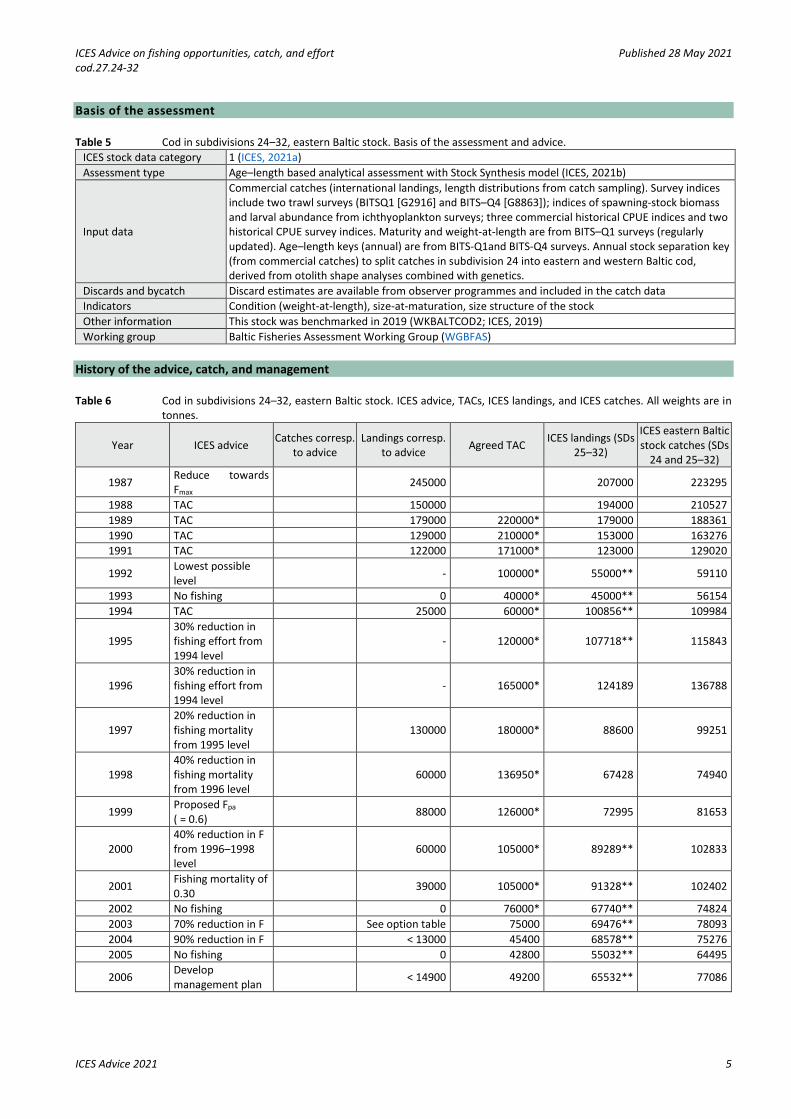
Issues relevant for the advice The poor status of the eastern Baltic cod is largely driven by biological changes in the stock during the last decades. Growth, condition (weight-at-length), and size-at-maturation have substantially declined (Figure 3). These developments indicate that the stock is distressed and is expected to have reduced reproductive potential. Natural mortality has increased and is estimated to be considerably higher than the fishing mortality in recent years. The size of the largest fish in the population has shown a decline since 1990 (Figure 3). The declining trend in size at maturation over time means that the development of the commercial sized cod biomass (≥ 35 cm) is not consistent with SSB, especially since 2000 (Figure 4). This is because SSB in recent years included small mature cod that were not part of the SSB in earlier years. The 2020 biomass of both commercial sized cod and SSB are close to the lowest level observed since the 1950s. The low growth, poor condition, and high natural mortality of cod are related to changes in the ecosystem that include:
i) poor oxygen conditions that can affect cod both directly through altering their metabolism and indirectly through a shortage of benthic prey, as well as the survival of offspring;
ii) reduced availability of fish prey in the main distribution area of cod. Sprat and herring have had a more northerly distribution in recent years, and there is less overlap with the distribution of the cod stock. It is, however, unclear whether the small remaining cod stock would be impacted by this shift of distribution.
iii) high levels of parasite infestations; these coincide with an increased abundance of grey seals. It is unknown whether the parasite infection is the cause or an effect of the poor condition of cod.
These drivers are interrelated, and their cumulative effect on the cod stock is unclear.
Figure 3 Cod in subdivisions 24–32, eastern Baltic stock . Left panel: indicator of size structure of the stock (length at the 95th
percentile of the length distribution, data from BITS-Q1 survey). Middle panel: length at which half of the stock has become mature (L50) and condition (weight-at-length) of 40–60 cm cod (data from BITS-Q1 survey). Right panel: estimates of fishing mortality (F) and natural mortality (M) for ages 4–6 in stock assessment.

ICES Advice on fishing opportunities, catch, and effort Published 28 May 2021 cod.27.24-32
ICES Advice 2021 4
Figure 4 Cod in subdivisions 24–32, eastern Baltic stock. Spawning stock biomass at the spawning time and biomass of commercial sized cod (≥35 cm in length) in the beginning of the year.
The concept of FMSY assuming long-term equilibrium is not presently considered appropriate for this stock due to a large decline in productivity in later years. At the current low productivity the stock is estimated to remain below Blim in the medium term, even with no fishing. Furthermore, fishing at any level will target the remaining few commercial-sized (≥35 cm) cod; this will deteriorate the stock structure further and reduce its reproductive potential. The eastern Baltic cod (EB) stock is mainly distributed and caught in the eastern Baltic cod management area (SDs 25–32), but it is also distributed and caught mixed with western Baltic (WB) cod in SD 24; this is part of the western Baltic management area (SDs 22–24). The assessment and this advice is for the eastern Baltic cod stock in the entire area of its distribution (SDs 24 and 25–32). Reference points Table 4 Cod in subdivisions 24–32, eastern Baltic stock. Reference points, values, and their technical basis.
Framework Reference point Value Technical basis Source
MSY approach MSY Btrigger Undefined ICES (2019) FMSY Undefined ICES (2019)
Precautionary approach
Blim 104 402 t SSB in 2012 which produced the last strong year-class, in the recent period of low productivity ICES (2021b)
Bpa 116 061 t Blim × exp(1.645 × σ), where σ = 0.07 ICES (2021b) Flim Undefined Fpa Undefined
Management plan
SSBmgt Undefined Fmgt Undefined
ICES Advice on fishing opportunities, catch, and effort Published 28 May 2021 cod.27.24-32
ICES Advice 2021 5
Basis of the assessment Table 5 Cod in subdivisions 24–32, eastern Baltic stock. Basis of the assessment and advice.
ICES stock data category 1 (ICES, 2021a) Assessment type Age–length based analytical assessment with Stock Synthesis model (ICES, 2021b)
Input data
Commercial catches (international landings, length distributions from catch sampling). Survey indices include two trawl surveys (BITSQ1 [G2916] and BITS–Q4 [G8863]); indices of spawning-stock biomass and larval abundance from ichthyoplankton surveys; three commercial historical CPUE indices and two historical CPUE survey indices. Maturity and weight-at-length are from BITS–Q1 surveys (regularly updated). Age–length keys (annual) are from BITS-Q1and BITS-Q4 surveys. Annual stock separation key (from commercial catches) to split catches in subdivision 24 into eastern and western Baltic cod, derived from otolith shape analyses combined with genetics.
Discards and bycatch Discard estimates are available from observer programmes and included in the catch data Indicators Condition (weight-at-length), size-at-maturation, size structure of the stock Other information This stock was benchmarked in 2019 (WKBALTCOD2; ICES, 2019) Working group Baltic Fisheries Assessment Working Group (WGBFAS)
History of the advice, catch, and management Table 6 Cod in subdivisions 24–32, eastern Baltic stock. ICES advice, TACs, ICES landings, and ICES catches. All weights are in
tonnes.
Year ICES advice Catches corresp. to advice
Landings corresp. to advice Agreed TAC ICES landings (SDs
25–32)
ICES eastern Baltic stock catches (SDs
24 and 25–32)
1987 Reduce towards Fmax
245000 207000 223295
1988 TAC 150000 194000 210527 1989 TAC 179000 220000* 179000 188361 1990 TAC 129000 210000* 153000 163276 1991 TAC 122000 171000* 123000 129020
1992 Lowest possible level - 100000* 55000** 59110
1993 No fishing 0 40000* 45000** 56154 1994 TAC 25000 60000* 100856** 109984
1995 30% reduction in fishing effort from 1994 level
- 120000* 107718** 115843
1996 30% reduction in fishing effort from 1994 level
- 165000* 124189 136788
1997 20% reduction in fishing mortality from 1995 level
130000 180000* 88600 99251
1998 40% reduction in fishing mortality from 1996 level
60000 136950* 67428 74940
1999 Proposed Fpa ( = 0.6) 88000 126000* 72995 81653
2000 40% reduction in F from 1996–1998 level
60000 105000* 89289** 102833
2001 Fishing mortality of 0.30 39000 105000* 91328** 102402
2002 No fishing 0 76000* 67740** 74824 2003 70% reduction in F See option table 75000 69476** 78093 2004 90% reduction in F < 13000 45400 68578** 75276 2005 No fishing 0 42800 55032** 64495
2006 Develop management plan < 14900 49200 65532** 77086

ICES Advice on fishing opportunities, catch, and effort Published 28 May 2021 cod.27.24-32
ICES Advice 2021 6
Year ICES advice Catches corresp. to advice
Landings corresp. to advice Agreed TAC ICES landings (SDs
25–32)
ICES eastern Baltic stock catches (SDs
24 and 25–32) 2007 No fishing 0 44300 50843** 64656 2008 No fishing 0 42300*** 42235** 55578
2009 Limit (total) landings to 48 600 tonnes
≤ 48600 49380*** 48439** 60513
2010 Follow management plan 56800 56100*** 50277 60400
2011 See scenarios - 64500*** 50368 62245
2012 Follow management plan 74200 74200*** 51225 67024
2013 Follow management plan 65900 68700*** 31355 42977
2014 Follow management plan 70301 73400*** 28909 45289
2015 20% reduction in catches 29085 55800*** 38079 50008
2016 Precautionary approach^ ≤ 29220 46900*** 29313 37438
2017 Precautionary approach^ ≤ 26994 36957*** 25496 30965
2018 Precautionary approach^ ≤ 26071 34288*** 15907 21605
2019 Precautionary approach^ ≤ 16685 29912*** 8383 11938
2020 Precautionary approach^ 0 7500*** 2319 2899
2021 Precautionary approach^ 0 3595***
2022 Precautionary approach^ 0
* For the total Baltic Sea until and including 2003. ** Reported landings in 1992–1995 and 2000–2009 are likely to be minimum estimates due to incomplete reporting. *** TAC is for SDs 25–32 and is calculated as EU + Russian autonomous quotas. ^ ICES provides stock-based advice (for the eastern Baltic cod stock). History of the catch and landings Table 7 Cod in subdivisions 24–32, eastern Baltic stock. Catch distribution by fleet in 2020 as estimated by ICES.
Catch (2020) Landings Discards
2899 tonnes Active gears 91% Passive gears 9%
152 tonnes 2747 tonnes
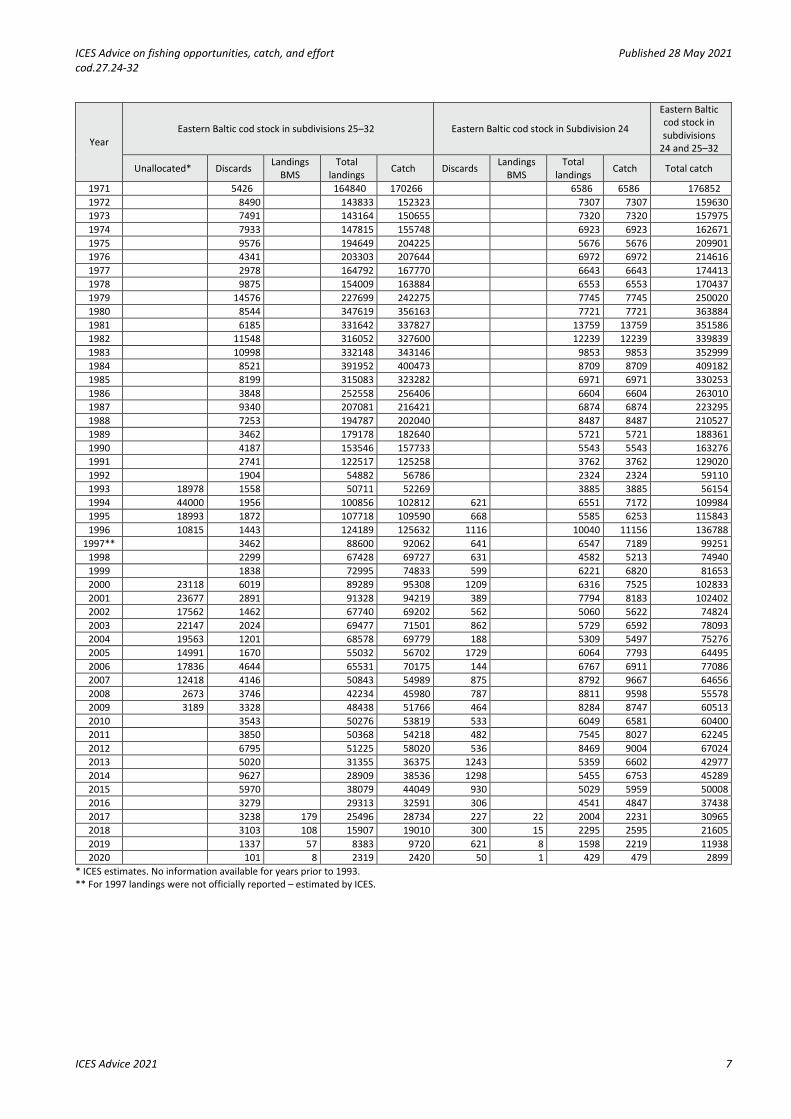
Table 8 Cod in subdivisions 24–32, eastern Baltic stock. History of ICES estimates of landings, discards, and catch by area.
Weights are in tonnes. The landings obligation has been in place since 2015, though landings below minimum conservation reference size (also known as ‘below minimum size’ [BMS]) have only been possible to separate since 2017.
Year Eastern Baltic cod stock in subdivisions 25–32 Eastern Baltic cod stock in Subdivision 24
Eastern Baltic cod stock in subdivisions
24 and 25–32
Unallocated* Discards Landings BMS
Total landings Catch Discards Landings
BMS Total
landings Catch Total catch
1966 8735 177318 186053 6624 6624 192677 1967 11733 195446 207179 6899 6899 214078 1968 9700 216353 226053 8614 8614 234667 1969 10654 212160 222814 5980 5980 228794 1970 7625 198451 206076 5720 5720 211796
ICES Advice on fishing opportunities, catch, and effort Published 28 May 2021 cod.27.24-32
ICES Advice 2021 7
Year Eastern Baltic cod stock in subdivisions 25–32 Eastern Baltic cod stock in Subdivision 24
Eastern Baltic cod stock in subdivisions
24 and 25–32
Unallocated* Discards Landings BMS
Total landings Catch Discards Landings
BMS Total
landings Catch Total catch
1971 5426 164840 170266 6586 6586 176852 1972 8490 143833 152323 7307 7307 159630 1973 7491 143164 150655 7320 7320 157975 1974 7933 147815 155748 6923 6923 162671 1975 9576 194649 204225 5676 5676 209901 1976 4341 203303 207644 6972 6972 214616 1977 2978 164792 167770 6643 6643 174413 1978 9875 154009 163884 6553 6553 170437 1979 14576 227699 242275 7745 7745 250020 1980 8544 347619 356163 7721 7721 363884 1981 6185 331642 337827 13759 13759 351586 1982 11548 316052 327600 12239 12239 339839 1983 10998 332148 343146 9853 9853 352999 1984 8521 391952 400473 8709 8709 409182 1985 8199 315083 323282 6971 6971 330253 1986 3848 252558 256406 6604 6604 263010 1987 9340 207081 216421 6874 6874 223295 1988 7253 194787 202040 8487 8487 210527 1989 3462 179178 182640 5721 5721 188361 1990 4187 153546 157733 5543 5543 163276 1991 2741 122517 125258 3762 3762 129020 1992 1904 54882 56786 2324 2324 59110 1993 18978 1558 50711 52269 3885 3885 56154 1994 44000 1956 100856 102812 621 6551 7172 109984 1995 18993 1872 107718 109590 668 5585 6253 115843 1996 10815 1443 124189 125632 1116 10040 11156 136788
1997** 3462 88600 92062 641 6547 7189 99251 1998 2299 67428 69727 631 4582 5213 74940 1999 1838 72995 74833 599 6221 6820 81653 2000 23118 6019 89289 95308 1209 6316 7525 102833 2001 23677 2891 91328 94219 389 7794 8183 102402 2002 17562 1462 67740 69202 562 5060 5622 74824 2003 22147 2024 69477 71501 862 5729 6592 78093 2004 19563 1201 68578 69779 188 5309 5497 75276 2005 14991 1670 55032 56702 1729 6064 7793 64495 2006 17836 4644 65531 70175 144 6767 6911 77086 2007 12418 4146 50843 54989 875 8792 9667 64656 2008 2673 3746 42234 45980 787 8811 9598 55578 2009 3189 3328 48438 51766 464 8284 8747 60513 2010 3543 50276 53819 533 6049 6581 60400 2011 3850 50368 54218 482 7545 8027 62245 2012 6795 51225 58020 536 8469 9004 67024 2013 5020 31355 36375 1243 5359 6602 42977 2014 9627 28909 38536 1298 5455 6753 45289 2015 5970 38079 44049 930 5029 5959 50008 2016 3279 29313 32591 306 4541 4847 37438 2017 3238 179 25496 28734 227 22 2004 2231 30965 2018 3103 108 15907 19010 300 15 2295 2595 21605 2019 1337 57 8383 9720 621 8 1598 2219 11938 2020 101 8 2319 2420 50 1 429 479 2899
* ICES estimates. No information available for years prior to 1993. ** For 1997 landings were not officially reported – estimated by ICES.

ICES Advice on fishing opportunities, catch, and effort Published 28 May 2021 cod.27.24-32
ICES Advice 2021 8
Table 9 Cod in subdivisions 24–32, eastern Baltic stock. History of ICES estimates of landings of cod caught in the eastern Baltic management area (SDs 25–32) by country. Weights are in tonnes.
Year Denmark Estonia Finland Germany, Dem. Rep. Germany, Fed. Rep. Latvia Lithuania Poland Russia Sweden USSR Faroe Islands* Norway Unallocated** Total
1966 37070 26 10589 12831 56007 22525 38270 177318 1967 39105 27 21027 12941 56003 23363 42980 195446 1968 44109 70 24478 16833 63245 24008 43610 216353 1969 44061 58 25979 17432 60749 22301 41580 212160 1970 42392 70 18099 19444 68440 17756 32250 198451 1971 46831 53 10977 16248 54151 15670 20910 164840 1972 34072 76 4055 3203 57093 15194 30140 143833 1973 35455 95 6034 14973 49790 16734 20083 143164 1974 32028 160 2517 11831 48650 14498 38131 147815 1975 39043 298 8700 11968 69318 16033 49289 194649 1976 47412 287 3970 13733 70466 18388 49047 203303 1977 44400 310 7519 19120 47702 16061 29680 164792 1978 30266 1437 2260 4270 64113 14463 37200 154009 1979 34350 2938 1403 9777 79754 20593 75034 3850 227699 1980 49704 5962 1826 11750 123486 29291 124350 1250 347619 1981 68521 5681 1277 7021 120901 37730 87746 2765 331642 1982 71151 8126 753 13800 92541 38475 86906 4300 316052 1983 84406 8927 1424 15894 76474 46710 92248 6065 332148 1984 90089 9358 1793 30483 93429 59685 100761 6354 391952 1985 83527 7224 1215 26275 63260 49565 78127 5890 315083 1986 81521 5633 181 19520 43236 45723 52148 4596 252558 1987 68881 3007 218 14560 32667 42978 39203 5567 207081 1988 60436 2904 2 14078 33351 48964 28137 6915 194787 1989 57240 2254 3 12844 36855 50740 14722 4520 179178 1990 47394 1731 4691 32028 50683 13461 3558 153546 1991 39792 1810 1711 6564 2627 1865 25748 3299 36490 2611 122517 1992 18025 1368 485 2793 1250 1266 13314 1793 13995 593 54882 1993 8000 70 225 1042 1333 605 8909 892 10099 558 18978 50711 1994 9901 952 594 3056 2831 1887 14335 1257 21264 779 44000 100856 1995 16895 1049 1729 5496 6638 4513 25000 1612 24723 777 293 18993 107718 1996 17549 1338 3089 7340 8709 5524 34855 3306 30669 706 289 10815 124189 1997 9776 1414 1536 5215 6187 4601 31396 2803 25072 600 88600 1998 7818 1188 1026 1270 7765 4176 25155 4599 14431 67428 1999 12170 1052 1456 2215 6889 4371 25920 5202 13720 72995 2000 9715 604 1648 1508 6196 5165 21194 4231 15910 23118 89289 2001 9580 765 1526 2159 6252 3137 21346 5032 17854 23677 91328 2002 7831 37 1526 1445 4796 3137 15106 3793 12507 17562 67740 2003 7655 591 1092 1354 3493 2767 15374 3707 11297 22147 69476 2004 7394 1192 859 2659 4835 2041 14582 3410 12043 19563 68578 2005 7270 833 278 2339 3513 2988 11669 3411 7740 14991 55032 2006 9766 616 427 2025 3980 3200 14290 3719 9672 17836 65532 2007 7280 877 615 1529 3996 2486 8599 3383 9660 12418 50843

ICES Advice on fishing opportunities, catch, and effort Published 28 May 2021 cod.27.24-32
ICES Advice 2021 9
Year Denmark Estonia Finland Germany, Dem. Rep. Germany, Fed. Rep. Latvia Lithuania Poland Russia Sweden USSR Faroe Islands* Norway Unallocated** Total
2008 7374 841 670 2341 3990 2835 8721 3888 8901 2673 42235 2009 8295 623 3665 4588 2789 10625 4482 10182 3189 48439 2010 10739 796 826 3908 5001 3140 11433 4264 10169 50277 2011 10842 1180 958 3054 4916 3017 11348 5022 10031 50368 2012 12102 686 1405 2432 4269 2261 14007 3954 10109 51225 2013 6052 249 399 541 2441 1744 11760 2870 5299 31355 2014 6035 166 350 676 1999 1088 11026 3444 4125 28908 2015 9526 183 388 1477 2873 1845 12896 3845 4438 37471 2016 6756 2 57 918 2656 1637 9583 3392 3995 28996
2017*** 6140 1 191 347 2079 1726 6484 4124 4405 25496 2018*** 2684 1 53 241 1253 694 5695 3376 1912 15907 2019*** 1058 2 85 299 260 112 3184 2701 683 8383 2020*** 21 2 24 13 79 12 377 1778 12 2319
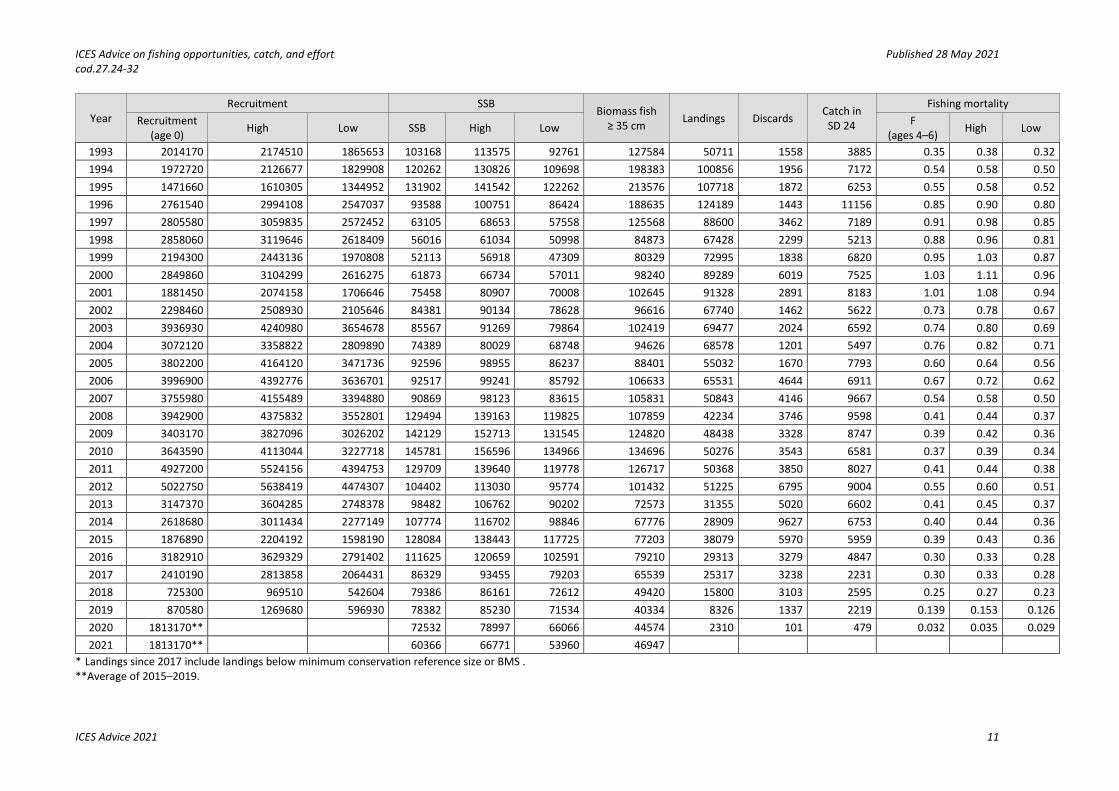
* Landings for 1997 were not officially reported – estimated by ICES. ** Working group estimates. No information was available for years prior to 1993. *** Includes landings below minimum conservation reference size (BMS) Summary of the assessment Table 10 Cod in subdivisions 24–32, eastern Baltic stock. Assessment summary. Weights are in tonnes, recruitment in thousands. High and Low refer to 90% confidence intervals.
Year Recruitment SSB Biomass fish
≥ 35 cm Landings Discards Catch in SD 24
Fishing mortality Recruitment
(age 0) High Low SSB High Low F (ages 4–6) High Low
1946 2142740 2405970 1908309 61984 68701 55267 89854 40985 0.40 0.44 0.36 1947 3114960 3432851 2826507 81627 89279 73976 122687 71831 0.52 0.56 0.47 1948 3686940 4037390 3366909 104998 113879 96117 174400 107104 0.59 0.63 0.54 1949 3776440 4130779 3452496 113596 123706 103486 193700 112735 0.57 0.61 0.52 1950 2951930 3266353 2667773 119470 129883 109057 201916 124509 0.59 0.64 0.55 1951 2361070 2647608 2105543 131329 141885 120773 221540 137815 0.60 0.64 0.56 1952 2714750 3028060 2433858 134695 145526 123864 242887 161103 0.67 0.72 0.62 1953 3945770 4316949 3606505 140502 152224 128780 233581 118132 0.49 0.53 0.46 1954 3830840 4185415 3506303 134802 146990 122614 230840 123947 0.53 0.57 0.49 1955 2335780 2607492 2092381 136155 148050 124260 219652 114415 0.49 0.53 0.45 1956 1940320 2181055 1726156 140869 151338 130400 241879 151985 0.61 0.65 0.57 1957 2964810 3249152 2705352 132390 141375 123405 254134 181366 0.75 0.79 0.71 1958 2452410 2712315 2217410 117482 125866 109098 218536 136301 0.65 0.69 0.61 1959 2721340 2992929 2474396 99213 106572 91854 185600 126033 0.70 0.74 0.66

ICES Advice on fishing opportunities, catch, and effort Published 28 May 2021 cod.27.24-32
ICES Advice 2021 10
Year Recruitment SSB Biomass fish
≥ 35 cm Landings Discards Catch in SD 24
Fishing mortality Recruitment
(age 0) High Low SSB High Low F (ages 4–6) High Low
1960 2479850 2757166 2230426 83701 90433 76969 171215 145408 0.92 0.99 0.85 1961 2554460 2874251 2270249 82822 89509 76134 151134 112034 0.74 0.80 0.69 1962 2751350 3133368 2415907 85098 92059 78138 155987 115553 0.75 0.80 0.69 1963 4381690 4858606 3951588 82853 90776 74929 157784 123047 0.80 0.87 0.74 1964 5721170 6232786 5251549 89934 100236 79631 152784 97788 0.62 0.68 0.55 1965 4969040 5469211 4514611 104105 117689 90521 170002 109809 0.60 0.67 0.53 1966 4766340 5238290 4336911 114800 126963 102637 212399 177318 8735 6624 0.91 0.96 0.85 1967 4323740 4759707 3927705 134710 146711 122709 247658 195446 11733 6899 0.87 0.95 0.79 1968 3370100 3753752 3025659 141043 151698 130388 274060 216353 9700 8614 0.89 0.96 0.82 1969 3512050 3914197 3151220 137477 146974 127980 270742 212160 10654 5980 0.89 0.95 0.83 1970 4369200 4848584 3937213 128661 138203 119119 256660 198451 7625 5720 0.88 0.94 0.82 1971 5805080 6381505 5280722 119461 129773 109149 229755 164840 5426 6586 0.80 0.86 0.74 1972 7180620 7833200 6582406 120000 131400 108600 216015 143833 8490 7307 0.73 0.79 0.67 1973 4495680 5039509 4010537 141158 154199 128117 232529 143164 7491 7320 0.64 0.69 0.58 1974 3787900 4306746 3331561 192945 208365 177525 290488 147815 7933 6923 0.50 0.54 0.46 1975 5453080 6118091 4860353 242072 260086 224058 389101 194649 9576 5676 0.51 0.55 0.48 1976 11818100 12831440 10884786 242068 263089 221047 424448 203303 4341 6972 0.50 0.54 0.46 1977 9605150 10563589 8733671 248476 272528 224424 401322 164792 2978 6643 0.41 0.45 0.38 1978 5691000 6452223 5019585 306579 333003 280155 421788 154009 9875 6553 0.34 0.37 0.32 1979 9499160 10407559 8670048 402719 430727 374711 581134 227699 14576 7745 0.38 0.40 0.36 1980 9607160 10462952 8821365 452632 482746 422518 734269 347619 8544 7721 0.48 0.51 0.45 1981 6330050 6990261 5732194 417425 448272 386578 710284 331642 6185 13759 0.49 0.52 0.45 1982 3928820 4390146 3515971 442611 471639 413583 693817 316052 11548 12239 0.46 0.49 0.44 1983 3367980 3725052 3045136 440964 465090 416838 734323 332148 10998 9853 0.47 0.49 0.44 1984 3526670 3821191 3254850 375841 394332 357350 713172 391952 8521 8709 0.61 0.63 0.58 1985 5296790 5595350 5014160 282223 296170 268276 554863 315083 8199 6971 0.65 0.67 0.62 1986 3212140 3437519 3001538 195202 207124 183280 404657 252558 3848 6604 0.72 0.76 0.68 1987 2005520 2169269 1854132 150258 157065 143451 302722 207081 9340 6874 0.78 0.80 0.77 1988 2027740 2178082 1887776 142675 148608 136742 276951 194787 7253 8487 0.80 0.84 0.77 1989 1490820 1620413 1371591 119519 124722 114316 255393 179178 3462 5721 0.81 0.84 0.78 1990 2983480 3196290 2784839 89969 94852 85086 201664 153546 4187 5543 0.93 0.97 0.89 1991 3544030 3774439 3327686 57626 61235 54018 144941 122517 2741 3762 1.05 1.08 1.01 1992 2393320 2576812 2222895 61172 67556 54788 96671 54882 1904 2324 0.56 0.61 0.51
ICES Advice on fishing opportunities, catch, and effort Published 28 May 2021 cod.27.24-32
ICES Advice 2021 11
Year Recruitment SSB Biomass fish
≥ 35 cm Landings Discards Catch in SD 24
Fishing mortality Recruitment
(age 0) High Low SSB High Low F (ages 4–6) High Low
1993 2014170 2174510 1865653 103168 113575 92761 127584 50711 1558 3885 0.35 0.38 0.32 1994 1972720 2126677 1829908 120262 130826 109698 198383 100856 1956 7172 0.54 0.58 0.50 1995 1471660 1610305 1344952 131902 141542 122262 213576 107718 1872 6253 0.55 0.58 0.52 1996 2761540 2994108 2547037 93588 100751 86424 188635 124189 1443 11156 0.85 0.90 0.80 1997 2805580 3059835 2572452 63105 68653 57558 125568 88600 3462 7189 0.91 0.98 0.85 1998 2858060 3119646 2618409 56016 61034 50998 84873 67428 2299 5213 0.88 0.96 0.81 1999 2194300 2443136 1970808 52113 56918 47309 80329 72995 1838 6820 0.95 1.03 0.87 2000 2849860 3104299 2616275 61873 66734 57011 98240 89289 6019 7525 1.03 1.11 0.96 2001 1881450 2074158 1706646 75458 80907 70008 102645 91328 2891 8183 1.01 1.08 0.94 2002 2298460 2508930 2105646 84381 90134 78628 96616 67740 1462 5622 0.73 0.78 0.67 2003 3936930 4240980 3654678 85567 91269 79864 102419 69477 2024 6592 0.74 0.80 0.69 2004 3072120 3358822 2809890 74389 80029 68748 94626 68578 1201 5497 0.76 0.82 0.71 2005 3802200 4164120 3471736 92596 98955 86237 88401 55032 1670 7793 0.60 0.64 0.56 2006 3996900 4392776 3636701 92517 99241 85792 106633 65531 4644 6911 0.67 0.72 0.62 2007 3755980 4155489 3394880 90869 98123 83615 105831 50843 4146 9667 0.54 0.58 0.50 2008 3942900 4375832 3552801 129494 139163 119825 107859 42234 3746 9598 0.41 0.44 0.37 2009 3403170 3827096 3026202 142129 152713 131545 124820 48438 3328 8747 0.39 0.42 0.36 2010 3643590 4113044 3227718 145781 156596 134966 134696 50276 3543 6581 0.37 0.39 0.34 2011 4927200 5524156 4394753 129709 139640 119778 126717 50368 3850 8027 0.41 0.44 0.38 2012 5022750 5638419 4474307 104402 113030 95774 101432 51225 6795 9004 0.55 0.60 0.51 2013 3147370 3604285 2748378 98482 106762 90202 72573 31355 5020 6602 0.41 0.45 0.37 2014 2618680 3011434 2277149 107774 116702 98846 67776 28909 9627 6753 0.40 0.44 0.36 2015 1876890 2204192 1598190 128084 138443 117725 77203 38079 5970 5959 0.39 0.43 0.36 2016 3182910 3629329 2791402 111625 120659 102591 79210 29313 3279 4847 0.30 0.33 0.28 2017 2410190 2813858 2064431 86329 93455 79203 65539 25317 3238 2231 0.30 0.33 0.28 2018 725300 969510 542604 79386 86161 72612 49420 15800 3103 2595 0.25 0.27 0.23 2019 870580 1269680 596930 78382 85230 71534 40334 8326 1337 2219 0.139 0.153 0.126 2020 1813170** 72532 78997 66066 44574 2310 101 479 0.032 0.035 0.029 2021 1813170** 60366 66771 53960 46947
* Landings since 2017 include landings below minimum conservation reference size or BMS . **Average of 2015–2019.

ICES Advice on fishing opportunities, catch, and effort Published 28 May 2021 cod.27.24-32
ICES Advice 2021 12
Sources and references EU. 2016. Regulation (EU) 2016/1139 of the European Parliament and of the Council of 6 July 2016 establishing a multiannual plan for the stocks of cod, herring and sprat in the Baltic Sea and the fisheries exploiting those stocks, amending Council Regulation (EC) No 2187/2005 and repealing Council Regulation (EC) No 1098/2007. Official Journal of the European Union, L 191, 15.7.2016. http://data.europa.eu/eli/reg/2016/1139/oj.
ICES. 2019. Benchmark Workshop on Baltic Cod Stocks (WKBALTCOD2). ICES Scientific Reports. 1:9. 310 pp. http://doi.org/10.17895/ices.pub.4984.
ICES. 2021a. Advice on fishing opportunities. In Report of the ICES Advisory Committee, 2021. ICES Advice 2021, section 1.1.1. https://doi.org/10.17895/ices.advice.7720.
ICES. 2021b. Baltic Fisheries Assessment Working Group (WGBFAS). ICES Scientific Reports. 3:53. 717 pp. http://doi.org/10.17895/ices.pub.8187.
Download the stock assessment data and figures. Recommended citation: ICES. 2021. Cod (Gadus morhua) in subdivisions 24–32, eastern Baltic stock (eastern Baltic Sea). In Report of the ICES Advisory Committee, 2021. ICES Advice 2021, cod.27.24-32. https://doi.org/10.17895/ices.advice.7745