code composer studio v3.0 getting started guide (rev. e)
TRANSCRIPT
Code Composer Studio v3.0 Getting Started Guide
Literature Number SPRU509ESeptember 2004
Printed on Recycled Paper

IMPORTANT NOTICE
Texas Instruments Incorporated and its subsidiaries (TI) reserve the right to make corrections, modifications,enhancements, improvements, and other changes to its products and services at any time and to discontinueany product or service without notice. Customers should obtain the latest relevant information before placingorders and should verify that such information is current and complete. All products are sold subject to TI’s termsand conditions of sale supplied at the time of order acknowledgment.
TI warrants performance of its hardware products to the specifications applicable at the time of sale inaccordance with TI’s standard warranty. Testing and other quality control techniques are used to the extent TIdeems necessary to support this warranty. Except where mandated by government requirements, testing of allparameters of each product is not necessarily performed.
TI assumes no liability for applications assistance or customer product design. Customers are responsible fortheir products and applications using TI components. To minimize the risks associated with customer productsand applications, customers should provide adequate design and operating safeguards.
TI does not warrant or represent that any license, either express or implied, is granted under any TI patent right,copyright, mask work right, or other TI intellectual property right relating to any combination, machine, or processin which TI products or services are used. Information published by TI regarding third-party products or servicesdoes not constitute a license from TI to use such products or services or a warranty or endorsement thereof.Use of such information may require a license from a third party under the patents or other intellectual propertyof the third party, or a license from TI under the patents or other intellectual property of TI.
Reproduction of information in TI data books or data sheets is permissible only if reproduction is withoutalteration and is accompanied by all associated warranties, conditions, limitations, and notices. Reproductionof this information with alteration is an unfair and deceptive business practice. TI is not responsible or liable forsuch altered documentation.
Resale of TI products or services with statements different from or beyond the parameters stated by TI for thatproduct or service voids all express and any implied warranties for the associated TI product or service andis an unfair and deceptive business practice. TI is not responsible or liable for any such statements.
Following are URLs where you can obtain information on other Texas Instruments products and applicationsolutions:
Products Applications
Amplifiers amplifier.ti.com Audio www.ti.com/audio
Data Converters dataconverter.ti.com Automotive www.ti.com/automotive
DSP dsp.ti.com Broadband www.ti.com/broadband
Interface interface.ti.com Digital Control www.ti.com/digitalcontrol
Logic logic.ti.com Military www.ti.com/military
Power Mgmt power.ti.com Optical Networking www.ti.com/opticalnetwork
Microcontrollers microcontroller.ti.com Security www.ti.com/security
Telephony www.ti.com/telephony
Video & Imaging www.ti.com/video
Wireless www.ti.com/wireless
Mailing Address: Texas Instruments
Post Office Box 655303 Dallas, Texas 75265
Copyright 2004, Texas Instruments Incorporated

vRead This First
Preface
������������
About This Manual
To get started with Code Composer Studio IDE, you must go through the firsttwo chapters of this book. The remaining chapters contain information that canbe useful to you, depending on your needs and the tools you are using. To de-termine whether you can utilize the features in these chapters, please reviewthe online help provided with Code Composer Studio.
How to Use This Manual
This document contains the following chapters:
Chapter Title Description
1 Introduction Introduces TI’s eXpressDSP technol-ogy initiative, and includes CodeComposer Studio’s simple and verybasic development flow.
2 Getting Started Quickly withCode Composer Studio IDE v3
Provides an abridged overview ofsome of the basic features and func-tionalities in Code Composer Studio.
3 Target and Host Setup Provides information on how to de-fine and set up your target configura-tion, and how to customize several ofthe general IDE options.
4 Code Creation Provides options available to createcode and build a basic Code Com-poser Studio project.
5 Debug Reviews the debug tools and showsyou how to use them.
6 Analyze/Tune Discusses the various tools to helpdevelopers analyze and tune theirapplications.
7 Additional Tools, Tips Gives information on how to findadditional help for documentation,updates, and with customizing yourCode Composer Studio installaton.

Notational Conventions
vi
Notational Conventions
This document uses the following conventions.
� Program listings, program examples, and interactive displays are shownin a special typeface similar to a typewriter’s. Examples use a boldversion of the special typeface for emphasis; interactive displays use abold version of the special typeface to distinguish commands that youenter from items that the system displays (such as prompts, commandoutput, error messages, etc.).
Here is a sample program listing:
0011 0005 0001 .field 1, 20012 0005 0003 .field 3, 40013 0005 0006 .field 6, 30014 0006 .even
Here is an example of a system prompt and a command that you mightenter:
C: csr −a /user/ti/simuboard/utilities
Related Documentation From Texas Instruments
For additional information on your target processor and related support tools,see the online manuals provided with the CCStudio IDE.
To access the online manuals:
Help→CCStudio Documentation→Manuals
Related Documentation
You can use the following books to supplement this user’s guide:
American National Standard for Information Systems-ProgrammingLanguage C X3.159-1989 , American National Standards Institute (ANSIstandard for C)
The C Programming Language (second edition) , by Brian W. Kernighanand Dennis M. Ritchie, published by Prentice-Hall, Englewood Cliffs, NewJersey, 1988
Programming in C , Kochan, Steve G., Hayden Book Company

Trademarks
viiRead This First
Trademarks
Code Composer Studio, DSP/BIOS, Probe Point(s), RTDX, TMS320C6000,and TMS320C5000 are trademarks of Texas Instruments Incorporated.
Pentium is a registered trademark of Intel Corporation.
Windows and Windows NT are registered trademarks of MicrosoftCorporation.
All trademarks are the property of their respective owners.
To Help Us Improve Our Documentation . . .
If you would like to make suggestions or report errors in documentation, pleaseemail us. Be sure to include the following information that is on the title page:the full title of the book, the publication date, and the literature number.
Email: [email protected]

viii

Contents
ix
������
1 Introduction 1-1. . . . . . . . . . . . . . . . . . . . . . . . . . . . . . . . . . . . . . . . . . . . . . . . . . . . . . . . . . . . . . . . . . . . . 1.1 Welcome to the World of eXpressDSP 1-2. . . . . . . . . . . . . . . . . . . . . . . . . . . . . . . . . . . . . . . . . 1.2 Development Flow 1-4. . . . . . . . . . . . . . . . . . . . . . . . . . . . . . . . . . . . . . . . . . . . . . . . . . . . . . . . . .
2 Getting Started Quickly 2-1. . . . . . . . . . . . . . . . . . . . . . . . . . . . . . . . . . . . . . . . . . . . . . . . . . . . . . . . . . 2.1 Launching Code Composer Studio 2-2. . . . . . . . . . . . . . . . . . . . . . . . . . . . . . . . . . . . . . . . . . . .
2.1.1 Important Icons Used in Code Composer Studio v3 2-2. . . . . . . . . . . . . . . . . . . . . . 2.2 Creating a New Project 2-2. . . . . . . . . . . . . . . . . . . . . . . . . . . . . . . . . . . . . . . . . . . . . . . . . . . . . . 2.3 Building Your Program 2-4. . . . . . . . . . . . . . . . . . . . . . . . . . . . . . . . . . . . . . . . . . . . . . . . . . . . . . 2.4 Loading Your Program 2-4. . . . . . . . . . . . . . . . . . . . . . . . . . . . . . . . . . . . . . . . . . . . . . . . . . . . . . 2.5 Basic Debugging 2-4. . . . . . . . . . . . . . . . . . . . . . . . . . . . . . . . . . . . . . . . . . . . . . . . . . . . . . . . . . .
2.5.1 Go to Main 2-4. . . . . . . . . . . . . . . . . . . . . . . . . . . . . . . . . . . . . . . . . . . . . . . . . . . . . . . . . 2.5.2 Using Breakpoints 2-4. . . . . . . . . . . . . . . . . . . . . . . . . . . . . . . . . . . . . . . . . . . . . . . . . . . 2.5.3 Source Stepping 2-5. . . . . . . . . . . . . . . . . . . . . . . . . . . . . . . . . . . . . . . . . . . . . . . . . . . . 2.5.4 Viewing Variables 2-5. . . . . . . . . . . . . . . . . . . . . . . . . . . . . . . . . . . . . . . . . . . . . . . . . . . 2.5.5 Output Window 2-5. . . . . . . . . . . . . . . . . . . . . . . . . . . . . . . . . . . . . . . . . . . . . . . . . . . . . . 2.5.6 Symbol Browser 2-6. . . . . . . . . . . . . . . . . . . . . . . . . . . . . . . . . . . . . . . . . . . . . . . . . . . . .
2.6 Introduction to Help 2-6. . . . . . . . . . . . . . . . . . . . . . . . . . . . . . . . . . . . . . . . . . . . . . . . . . . . . . . . .
3 Target and Host Setup 3-1. . . . . . . . . . . . . . . . . . . . . . . . . . . . . . . . . . . . . . . . . . . . . . . . . . . . . . . . . . . 3.1 Define and Set Up Target 3-2. . . . . . . . . . . . . . . . . . . . . . . . . . . . . . . . . . . . . . . . . . . . . . . . . . . .
3.1.1 Code Composer Studio Setup Utility 3-2. . . . . . . . . . . . . . . . . . . . . . . . . . . . . . . . . . . 3.1.2 Parallel Debug Manager Plus (PDM+) 3-8. . . . . . . . . . . . . . . . . . . . . . . . . . . . . . . . . . 3.1.3 Connect/Disconnect 3-9. . . . . . . . . . . . . . . . . . . . . . . . . . . . . . . . . . . . . . . . . . . . . . . . .
3.2 Host Setup 3-9. . . . . . . . . . . . . . . . . . . . . . . . . . . . . . . . . . . . . . . . . . . . . . . . . . . . . . . . . . . . . . . . . 3.2.1 IDE Customization 3-9. . . . . . . . . . . . . . . . . . . . . . . . . . . . . . . . . . . . . . . . . . . . . . . . . . .
4 Code Creation 4-1. . . . . . . . . . . . . . . . . . . . . . . . . . . . . . . . . . . . . . . . . . . . . . . . . . . . . . . . . . . . . . . . . . . 4.1 Create and Configure Project 4-2. . . . . . . . . . . . . . . . . . . . . . . . . . . . . . . . . . . . . . . . . . . . . . . .
4.1.1 Creating a Project 4-2. . . . . . . . . . . . . . . . . . . . . . . . . . . . . . . . . . . . . . . . . . . . . . . . . . . 4.1.2 Project Configurations 4-5. . . . . . . . . . . . . . . . . . . . . . . . . . . . . . . . . . . . . . . . . . . . . . . . 4.1.3 Project Dependencies 4-6. . . . . . . . . . . . . . . . . . . . . . . . . . . . . . . . . . . . . . . . . . . . . . . . 4.1.4 Makefiles 4-9. . . . . . . . . . . . . . . . . . . . . . . . . . . . . . . . . . . . . . . . . . . . . . . . . . . . . . . . . . . 4.1.5 Source Control Integration 4-10. . . . . . . . . . . . . . . . . . . . . . . . . . . . . . . . . . . . . . . . . . .
4.2 Configuring DSP/BIOS 4-12. . . . . . . . . . . . . . . . . . . . . . . . . . . . . . . . . . . . . . . . . . . . . . . . . . . . . 4.3 Editor 4-17. . . . . . . . . . . . . . . . . . . . . . . . . . . . . . . . . . . . . . . . . . . . . . . . . . . . . . . . . . . . . . . . . . . .
Contents
x
4.3.1 Using the Code Composer Studio Editor 4-17. . . . . . . . . . . . . . . . . . . . . . . . . . . . . . . 4.3.2 Using an External Editor 4-18. . . . . . . . . . . . . . . . . . . . . . . . . . . . . . . . . . . . . . . . . . . . .
4.4 Code Generation Tools 4-19. . . . . . . . . . . . . . . . . . . . . . . . . . . . . . . . . . . . . . . . . . . . . . . . . . . . . 4.4.1 Code Development Flow 4-19. . . . . . . . . . . . . . . . . . . . . . . . . . . . . . . . . . . . . . . . . . . . 4.4.2 Project Build Options 4-20. . . . . . . . . . . . . . . . . . . . . . . . . . . . . . . . . . . . . . . . . . . . . . . . 4.4.3 Compiler Overview 4-21. . . . . . . . . . . . . . . . . . . . . . . . . . . . . . . . . . . . . . . . . . . . . . . . . 4.4.4 Assembly Language Development Tools 4-22. . . . . . . . . . . . . . . . . . . . . . . . . . . . . . 4.4.5 Assembler Overview 4-23. . . . . . . . . . . . . . . . . . . . . . . . . . . . . . . . . . . . . . . . . . . . . . . . 4.4.6 Linker Overview 4-23. . . . . . . . . . . . . . . . . . . . . . . . . . . . . . . . . . . . . . . . . . . . . . . . . . . . 4.4.7 C/C++ Development Tools 4-24. . . . . . . . . . . . . . . . . . . . . . . . . . . . . . . . . . . . . . . . . . .
4.5 Building Your Code Composer Studio Project 4-26. . . . . . . . . . . . . . . . . . . . . . . . . . . . . . . . . . 4.5.1 From Code Composer Studio 4-26. . . . . . . . . . . . . . . . . . . . . . . . . . . . . . . . . . . . . . . . 4.5.2 External Make 4-27. . . . . . . . . . . . . . . . . . . . . . . . . . . . . . . . . . . . . . . . . . . . . . . . . . . . . 4.5.3 Command Line 4-27. . . . . . . . . . . . . . . . . . . . . . . . . . . . . . . . . . . . . . . . . . . . . . . . . . . . .
4.6 Available Foundation Software 4-29. . . . . . . . . . . . . . . . . . . . . . . . . . . . . . . . . . . . . . . . . . . . . . 4.6.1 DSP/BIOS 4-29. . . . . . . . . . . . . . . . . . . . . . . . . . . . . . . . . . . . . . . . . . . . . . . . . . . . . . . . . 4.6.2 CSL 4-29. . . . . . . . . . . . . . . . . . . . . . . . . . . . . . . . . . . . . . . . . . . . . . . . . . . . . . . . . . . . . . 4.6.3 BSL 4-30. . . . . . . . . . . . . . . . . . . . . . . . . . . . . . . . . . . . . . . . . . . . . . . . . . . . . . . . . . . . . . 4.6.4 DSPLIB 4-30. . . . . . . . . . . . . . . . . . . . . . . . . . . . . . . . . . . . . . . . . . . . . . . . . . . . . . . . . . . 4.6.5 IMGLIB 4-31. . . . . . . . . . . . . . . . . . . . . . . . . . . . . . . . . . . . . . . . . . . . . . . . . . . . . . . . . . . 4.6.6 XDAIS Components 4-33. . . . . . . . . . . . . . . . . . . . . . . . . . . . . . . . . . . . . . . . . . . . . . . . 4.6.7 Reference Frameworks 4-35. . . . . . . . . . . . . . . . . . . . . . . . . . . . . . . . . . . . . . . . . . . . .
4.7 Automation (for Project Management) 4-38. . . . . . . . . . . . . . . . . . . . . . . . . . . . . . . . . . . . . . . . 4.7.1 Using General Extension Language (GEL) 4-38. . . . . . . . . . . . . . . . . . . . . . . . . . . . . 4.7.2 Scripting Utility 4-39. . . . . . . . . . . . . . . . . . . . . . . . . . . . . . . . . . . . . . . . . . . . . . . . . . . . .
5 Debug 5-1. . . . . . . . . . . . . . . . . . . . . . . . . . . . . . . . . . . . . . . . . . . . . . . . . . . . . . . . . . . . . . . . . . . . . . . . . . 5.1 Setting Up Your Environment for Debug 5-2. . . . . . . . . . . . . . . . . . . . . . . . . . . . . . . . . . . . . . .
5.1.1 Setting Custom Debug Options 5-2. . . . . . . . . . . . . . . . . . . . . . . . . . . . . . . . . . . . . . . . 5.1.2 Simulation 5-8. . . . . . . . . . . . . . . . . . . . . . . . . . . . . . . . . . . . . . . . . . . . . . . . . . . . . . . . . . 5.1.3 Program Load 5-14. . . . . . . . . . . . . . . . . . . . . . . . . . . . . . . . . . . . . . . . . . . . . . . . . . . . . .
5.2 Basic Debugging 5-16. . . . . . . . . . . . . . . . . . . . . . . . . . . . . . . . . . . . . . . . . . . . . . . . . . . . . . . . . . 5.2.1 Running/Stepping 5-17. . . . . . . . . . . . . . . . . . . . . . . . . . . . . . . . . . . . . . . . . . . . . . . . . . 5.2.2 Breakpoints 5-18. . . . . . . . . . . . . . . . . . . . . . . . . . . . . . . . . . . . . . . . . . . . . . . . . . . . . . . . 5.2.3 Probe Points 5-21. . . . . . . . . . . . . . . . . . . . . . . . . . . . . . . . . . . . . . . . . . . . . . . . . . . . . . . 5.2.4 Watch Window 5-24. . . . . . . . . . . . . . . . . . . . . . . . . . . . . . . . . . . . . . . . . . . . . . . . . . . . . 5.2.5 Memory Window 5-27. . . . . . . . . . . . . . . . . . . . . . . . . . . . . . . . . . . . . . . . . . . . . . . . . . . 5.2.6 Register Window 5-29. . . . . . . . . . . . . . . . . . . . . . . . . . . . . . . . . . . . . . . . . . . . . . . . . . . 5.2.7 Disassembly/Mixed Mode 5-30. . . . . . . . . . . . . . . . . . . . . . . . . . . . . . . . . . . . . . . . . . . 5.2.8 Call Stack 5-31. . . . . . . . . . . . . . . . . . . . . . . . . . . . . . . . . . . . . . . . . . . . . . . . . . . . . . . . . 5.2.9 Symbol Browser 5-31. . . . . . . . . . . . . . . . . . . . . . . . . . . . . . . . . . . . . . . . . . . . . . . . . . . . 5.2.10 Command Window 5-32. . . . . . . . . . . . . . . . . . . . . . . . . . . . . . . . . . . . . . . . . . . . . . . . .
5.3 Advanced Debugging Features 5-34. . . . . . . . . . . . . . . . . . . . . . . . . . . . . . . . . . . . . . . . . . . . . . 5.3.1 Thread Level Debugging 5-34. . . . . . . . . . . . . . . . . . . . . . . . . . . . . . . . . . . . . . . . . . . .

Contents
xiContents
5.3.2 Advanced Event Triggering (AET) 5-36. . . . . . . . . . . . . . . . . . . . . . . . . . . . . . . . . . . . 5.4 Real-Time Debugging 5-40. . . . . . . . . . . . . . . . . . . . . . . . . . . . . . . . . . . . . . . . . . . . . . . . . . . . . .
5.4.1 Real−Time Mode 5-40. . . . . . . . . . . . . . . . . . . . . . . . . . . . . . . . . . . . . . . . . . . . . . . . . . . 5.4.2 Real-Time Data Exchange (RTDX) 5-42. . . . . . . . . . . . . . . . . . . . . . . . . . . . . . . . . . . .
5.5 Automation (for Debug) 5-49. . . . . . . . . . . . . . . . . . . . . . . . . . . . . . . . . . . . . . . . . . . . . . . . . . . . . 5.5.1 Using the General Extension Language (GEL) 5-49. . . . . . . . . . . . . . . . . . . . . . . . . 5.5.2 Scripting Utility for Debug 5-49. . . . . . . . . . . . . . . . . . . . . . . . . . . . . . . . . . . . . . . . . . . .
5.6 Target Reset 5-50. . . . . . . . . . . . . . . . . . . . . . . . . . . . . . . . . . . . . . . . . . . . . . . . . . . . . . . . . . . . . . 5.6.1 Reset Target 5-50. . . . . . . . . . . . . . . . . . . . . . . . . . . . . . . . . . . . . . . . . . . . . . . . . . . . . . . 5.6.2 Emulator Reset 5-50. . . . . . . . . . . . . . . . . . . . . . . . . . . . . . . . . . . . . . . . . . . . . . . . . . . .
6 Analyze/Tune 6-1. . . . . . . . . . . . . . . . . . . . . . . . . . . . . . . . . . . . . . . . . . . . . . . . . . . . . . . . . . . . . . . . . . . . 6.1 Appliction Code Analysis 6-2. . . . . . . . . . . . . . . . . . . . . . . . . . . . . . . . . . . . . . . . . . . . . . . . . . . .
6.1.1 Data Visualization 6-2. . . . . . . . . . . . . . . . . . . . . . . . . . . . . . . . . . . . . . . . . . . . . . . . . . . 6.1.2 Simulator Analysis 6-3. . . . . . . . . . . . . . . . . . . . . . . . . . . . . . . . . . . . . . . . . . . . . . . . . . . 6.1.3 Emulator Analysis 6-4. . . . . . . . . . . . . . . . . . . . . . . . . . . . . . . . . . . . . . . . . . . . . . . . . . . 6.1.4 BIOS Real-Time Analysis (RTA) Tools 6-5. . . . . . . . . . . . . . . . . . . . . . . . . . . . . . . . . . 6.1.5 Code Coverage and Multi-Event Profiler Tool 6-9. . . . . . . . . . . . . . . . . . . . . . . . . . . .
6.2 Application Code Tuning 6-10. . . . . . . . . . . . . . . . . . . . . . . . . . . . . . . . . . . . . . . . . . . . . . . . . . . . 6.2.1 Optimization Dashboard 6-10. . . . . . . . . . . . . . . . . . . . . . . . . . . . . . . . . . . . . . . . . . . . . 6.2.2 Compiler Consultant 6-14. . . . . . . . . . . . . . . . . . . . . . . . . . . . . . . . . . . . . . . . . . . . . . . . 6.2.3 CodeSizeTune (CST) 6-15. . . . . . . . . . . . . . . . . . . . . . . . . . . . . . . . . . . . . . . . . . . . . . . 6.2.4 Cache Tune 6-16. . . . . . . . . . . . . . . . . . . . . . . . . . . . . . . . . . . . . . . . . . . . . . . . . . . . . . .
7 Additional Tools, Help, and Tips 7-1. . . . . . . . . . . . . . . . . . . . . . . . . . . . . . . . . . . . . . . . . . . . . . . . . . 7.1 Component Manager 7-2. . . . . . . . . . . . . . . . . . . . . . . . . . . . . . . . . . . . . . . . . . . . . . . . . . . . . . . .
7.1.1 Opening Component Manager 7-3. . . . . . . . . . . . . . . . . . . . . . . . . . . . . . . . . . . . . . . . 7.1.2 Multiple Versions of the Code Composer Studio IDE 7-3. . . . . . . . . . . . . . . . . . . . .
7.2 Update Advisor 7-4. . . . . . . . . . . . . . . . . . . . . . . . . . . . . . . . . . . . . . . . . . . . . . . . . . . . . . . . . . . . . 7.2.1 Registering Update Advisor 7-4. . . . . . . . . . . . . . . . . . . . . . . . . . . . . . . . . . . . . . . . . . . 7.2.2 Checking for Tool Updates 7-4. . . . . . . . . . . . . . . . . . . . . . . . . . . . . . . . . . . . . . . . . . . . 7.2.3 Automatically Checking for Tool Updates 7-5. . . . . . . . . . . . . . . . . . . . . . . . . . . . . . . 7.2.4 Uninstalling the Updates 7-5. . . . . . . . . . . . . . . . . . . . . . . . . . . . . . . . . . . . . . . . . . . . . .
7.3 Additional Help 7-6. . . . . . . . . . . . . . . . . . . . . . . . . . . . . . . . . . . . . . . . . . . . . . . . . . . . . . . . . . . . . 7.3.1 Code Composer Studio Online Help 7-6. . . . . . . . . . . . . . . . . . . . . . . . . . . . . . . . . . .
Figures
xii
�����
1−1 eXpressDSP] Software and Development Tools 1-3. . . . . . . . . . . . . . . . . . . . . . . . . . . . . . . . . . . 1−2 Simplified Code Composer Studio Development Flow 1-4. . . . . . . . . . . . . . . . . . . . . . . . . . . . . . 4−1 Code Composer Studio IDE Basic Window 4-3. . . . . . . . . . . . . . . . . . . . . . . . . . . . . . . . . . . . . . . 4−2 Changing Active Project Configuration 4-5. . . . . . . . . . . . . . . . . . . . . . . . . . . . . . . . . . . . . . . . . . . 4−3 Source Control Pop-Up Menu 4-11. . . . . . . . . . . . . . . . . . . . . . . . . . . . . . . . . . . . . . . . . . . . . . . . . . 4−4 DSP/BIOS Configuration Window 4-12. . . . . . . . . . . . . . . . . . . . . . . . . . . . . . . . . . . . . . . . . . . . . . 4−5 View Source Code 4-17. . . . . . . . . . . . . . . . . . . . . . . . . . . . . . . . . . . . . . . . . . . . . . . . . . . . . . . . . . . 4−6 External Editor Icon 4-18. . . . . . . . . . . . . . . . . . . . . . . . . . . . . . . . . . . . . . . . . . . . . . . . . . . . . . . . . . 4−7 Code Development Flow 4-19. . . . . . . . . . . . . . . . . . . . . . . . . . . . . . . . . . . . . . . . . . . . . . . . . . . . . . 4−8 Build Options Dialog Box 4-20. . . . . . . . . . . . . . . . . . . . . . . . . . . . . . . . . . . . . . . . . . . . . . . . . . . . . . 4−9 TMS320 DSP Algorithm Standard Elements 4-33. . . . . . . . . . . . . . . . . . . . . . . . . . . . . . . . . . . . . 4−10 Elements of a Reference Framework 4-36. . . . . . . . . . . . . . . . . . . . . . . . . . . . . . . . . . . . . . . . . . . 4−11 GEL script to open volume project 4-384−12 Custom GEL menu to open a project 4-395−1 Symbol Browser Window 5-32. . . . . . . . . . . . . . . . . . . . . . . . . . . . . . . . . . . . . . . . . . . . . . . . . . . . . . 5−2 Command Window 5-33. . . . . . . . . . . . . . . . . . . . . . . . . . . . . . . . . . . . . . . . . . . . . . . . . . . . . . . . . . . 5−3 RTDX Data Flow 5-44. . . . . . . . . . . . . . . . . . . . . . . . . . . . . . . . . . . . . . . . . . . . . . . . . . . . . . . . . . . . . 5−4 RTDX Diagnostics Window 5-45. . . . . . . . . . . . . . . . . . . . . . . . . . . . . . . . . . . . . . . . . . . . . . . . . . . . 5−5 RTDX Config Window 5-45. . . . . . . . . . . . . . . . . . . . . . . . . . . . . . . . . . . . . . . . . . . . . . . . . . . . . . . . 5−6 RTDX Channel Viewer Window 5-46. . . . . . . . . . . . . . . . . . . . . . . . . . . . . . . . . . . . . . . . . . . . . . . . 6−1 Emulator Analysis Window 6-5. . . . . . . . . . . . . . . . . . . . . . . . . . . . . . . . . . . . . . . . . . . . . . . . . . . . . 6−2 Real-Time Capture and Analysis 6-6. . . . . . . . . . . . . . . . . . . . . . . . . . . . . . . . . . . . . . . . . . . . . . . . 6−3 DSP/BIOS Toolbar 6-7. . . . . . . . . . . . . . . . . . . . . . . . . . . . . . . . . . . . . . . . . . . . . . . . . . . . . . . . . . . . 7−1 Component Manager 7-2. . . . . . . . . . . . . . . . . . . . . . . . . . . . . . . . . . . . . . . . . . . . . . . . . . . . . . . . . .

1-1
������������
This chapter introduces TI’s eXpressDSP technology initiative. It also includesCode Composer Studio’s simple and very basic development flow.
Topic Page
1.1 Welcome to the World of eXpressDSP 1-2. . . . . . . . . . . . . . . . . . . . . . . . . .
1.2 Development Flow 1-4. . . . . . . . . . . . . . . . . . . . . . . . . . . . . . . . . . . . . . . . . . . .
Chapter 1
Welcome to the World of eXpressDSP
1-2
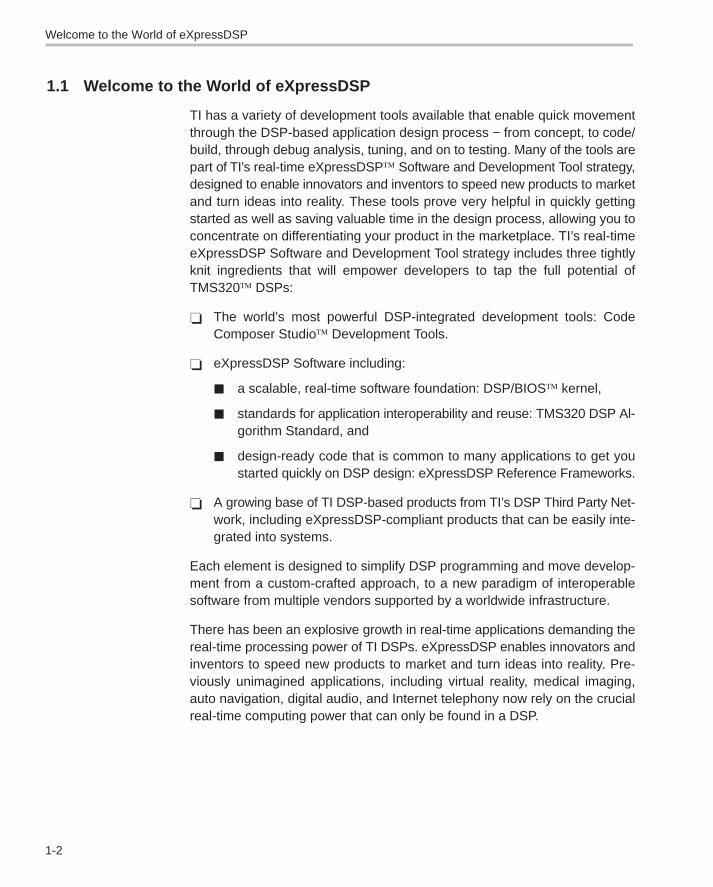
1.1 Welcome to the World of eXpressDSP
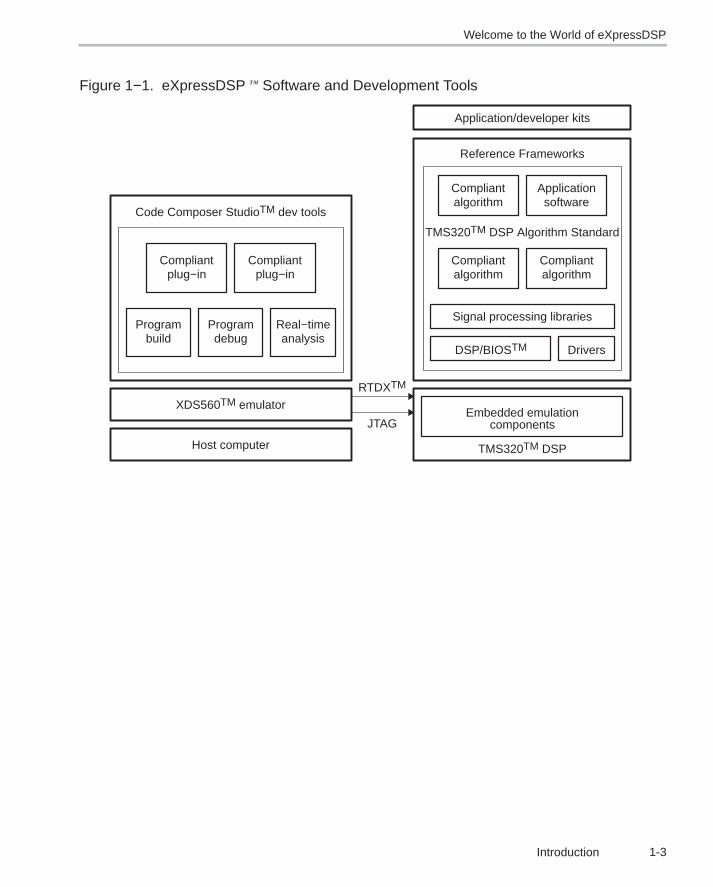
TI has a variety of development tools available that enable quick movementthrough the DSP-based application design process − from concept, to code/build, through debug analysis, tuning, and on to testing. Many of the tools arepart of TI’s real-time eXpressDSP Software and Development Tool strategy,designed to enable innovators and inventors to speed new products to marketand turn ideas into reality. These tools prove very helpful in quickly gettingstarted as well as saving valuable time in the design process, allowing you toconcentrate on differentiating your product in the marketplace. TI’s real-timeeXpressDSP Software and Development Tool strategy includes three tightlyknit ingredients that will empower developers to tap the full potential ofTMS320 DSPs:
� The world’s most powerful DSP-integrated development tools: CodeComposer Studio Development Tools.
� eXpressDSP Software including:
� a scalable, real-time software foundation: DSP/BIOS kernel,
� standards for application interoperability and reuse: TMS320 DSP Al-gorithm Standard, and
� design-ready code that is common to many applications to get youstarted quickly on DSP design: eXpressDSP Reference Frameworks.
� A growing base of TI DSP-based products from TI’s DSP Third Party Net-work, including eXpressDSP-compliant products that can be easily inte-grated into systems.
Each element is designed to simplify DSP programming and move develop-ment from a custom-crafted approach, to a new paradigm of interoperablesoftware from multiple vendors supported by a worldwide infrastructure.
There has been an explosive growth in real-time applications demanding thereal-time processing power of TI DSPs. eXpressDSP enables innovators andinventors to speed new products to market and turn ideas into reality. Pre-viously unimagined applications, including virtual reality, medical imaging,auto navigation, digital audio, and Internet telephony now rely on the crucialreal-time computing power that can only be found in a DSP.
Welcome to the World of eXpressDSP
1-3Introduction
Figure 1−1. eXpressDSP� Software and Development Tools
Compliantplug−in
Compliantplug−in
Programbuild debug
Programanalysis
Real−time
Code Composer StudioTM dev tools
XDS560TM emulator
Host computer
RTDXTM
JTAG
Compliantalgorithm software
Application
TMS320TM DSP Algorithm Standard
algorithmCompliant Compliant
algorithm
Signal processing libraries
DriversDSP/BIOSTM
Application/developer kits
TMS320TM DSP
Embedded emulationcomponents
Reference Frameworks

Development Flow
1-4
1.2 Development Flow
The development flow of most DSP−based applications consists of four basicphases: application design, code creation, debug, and analyze/tune. CodeComposer Studio is the key element of TI’s eXpressDSP software and devel-opment tools which integrate many of the tools needed to assist the developerin the development flow. This user’s guide will provide basic procedures andtechniques in program development flow.
Figure 1−2. Simplified Code Composer Studio Development Flow
Designconceptualplanning
Code & buildcreate project,
write source code,configuration file
Syntax checking,
logging, etc.probe points,
Debug
Analyze and Tune
2-1
������� ������� �������
This chapter provides an overview of some of the basic features and function-alities in Code Composer Studio v3, to guide you in creating and building sim-ple projects. Experienced users should skip this chapter and proceed to thefollowing chapters for more in-depth explanations of Code Composer Studio’svarious features.
Topic Page
2.1 Launching Code Composer Studio 2-2. . . . . . . . . . . . . . . . . . . . . . . . . . . . .
2.2 Creating a New Project 2-2. . . . . . . . . . . . . . . . . . . . . . . . . . . . . . . . . . . . . . . .
2.3 Building Your Program 2-4. . . . . . . . . . . . . . . . . . . . . . . . . . . . . . . . . . . . . . . .
2.4 Loading Your Program 2-4. . . . . . . . . . . . . . . . . . . . . . . . . . . . . . . . . . . . . . . .
2.5 Basic Debugging 2-4. . . . . . . . . . . . . . . . . . . . . . . . . . . . . . . . . . . . . . . . . . . . . .
2.6 Introduction to Help 2-6. . . . . . . . . . . . . . . . . . . . . . . . . . . . . . . . . . . . . . . . . . .
Chapter 2

Launching Code Composer Studio
2-2
2.1 Launching Code Composer Studio
To launch Code Composer Studio IDE for the first time, click the icon (shownbelow) on your desktop. A simulator is automatically configured by default. Toconfigure Code Composer Studio for a specific target, please refer to Chapter3 for more information.
2.1.1 Important Icons Used in Code Composer Studio v3
This list of icons is important in helping you to traverse through the Code Com-poser Studio IDE. These icons will be referred to throughout this manual.
Used to launch Code Composer Studio
Rebuilds the project
Builds the project incrementally
Halts execution
Toggle breakpoint toolbar button
Run toolbar button
Step into button
Step out of button
Step over button
2.2 Creating a New Project
You can create a working project by following these steps:
Step 1: If you installed Code Composer Studio in C:\CCStudio, create a fold-er called practice in the C:\CCStudio\myprojects folder.
Step 2: Copy the contents of C:\CCStudio\tutorial\target\consultant folder tothis new folder. (Note: target refers to the current configuration ofCode Composer Studio. By default, the target is sim64xx LE. For

Creating a New Project
2-3Getting Started Quickly
more about Code Composer Studio configurations, please refer toChapter 3)
Step 3: From the Project menu, choose New.
Step 4: In the Project Name field, type practice .
Step 5: In the Location field, type or browse to the folder you created in step1.
Step 6: By default, Project Type is set as Executable (.out) and Target is setas the current configuration of Code Composer Studio.
Step 7: Click Finish. Code Composer Studio creates a project file calledpractice.pjt This file stores your project settings and references thevarious files used by your project.
Step 8: Add files to the project by choosing Add Files to Project from the Proj-ect menu. You can also right-click the project in the Project View win-dow on the left and then select Add Files to Project. Add main.c, Do-Loop.c, and lnk.cmd (this is a linker command file that maps sectionsto memory) from the folder you created. Browse to the C:\CCStu-dio\c6000\cgtools\lib\ directory and add the rts.lib file for the targetyou are configured for.
Step 9: You do not need to manually add include files to your project, be-cause the program finds them automatically when it scans for depen-dencies as part of the build process. After you build your project, theinclude files appear in the Project View.

Building Your Program
2-4
2.3 Building Your Program
Now that you have created a functional program, you can build it. Since thisis the first time the project is being built, it is recommended that you use theBuild All function. An output window appears to show the build in process.When the build is finished, the output window will display “Build complete 0 er-rors, 0 warnings.”
Rebuild All is mainly used to rebuild the project when project options havebeen modified.
These build methods can also be accessed in the Project menu. For furtherinformation, please go to Chapter 4.
2.4 Loading Your Program
After the program has been built successfully, load the program by going toFile→Load Program. By default, Code Composer Studio will create a subdi-rectory called Debug within your project directory, and store the .out file in it.Select practice.out and click Open to load the program.
Note: Remember to reload the program by choosing File→Reload Pro-gram if you rebuild the project after making changes.
2.5 Basic Debugging
You can see Code Composer Studio’s versatile debugger in action by complet-ing the following exercises. For more in-depth information, please refer toChapter 5.
2.5.1 Go to Main
To begin execution of the Main function, select Debug→Go main. The execu-tion halts at Main.
2.5.2 Using Breakpoints
To set a breakpoint, place the cursor on the desired line and press F9. In addi-tion, you can also set the breakpoint by selecting the toggle breakpoint toolbarbutton. To remove the breakpoint, simply press F9 or the button again. When
Basic Debugging
2-5Getting Started Quickly
a breakpoint has been set, a red icon will appear at the selection margin to theleft of the code.
In main.c, set the breakpoint at the line “DoLoop(Input1, Input2, Weights, Out-put, LOOPCOUNT);”. Since execution was halted at the main function, nowyou can press F5, select Debug→Run or select the Run toolbar button to runthe program. As you can see, once execution reaches the breakpoint, it halts.
2.5.3 Source Stepping
Source stepping is only possible when program execution has been halted.Since you halted at breakpoint, you can now execute the program line by lineusing source stepping.
Step Into the DoLoop function by selecting the Step Into button. Step througha few times to observe the executions.
The Step Over and Step Out Of functions are also available and those buttonsare right below the Step Into button.
Assembly stepping is also available. Whereas source stepping steps throughthe lines of code, assembly stepping steps through the assembly instructions.For more information on assembly stepping, please go to section 5.2.1.
2.5.4 Viewing Variables
In the debugging process, it is often necessary to view the value of the vari-ables to ensure that the function executes properly. Variables can be viewedin the watch window when the CPU has been halted. The watch window canbe accessed by View→Watch Window. In the watch locals tab, all the relevantvariables in the current execution will be shown.
As you continue to Step Into the while loop, you will see that the values of thevariables change through each execution. In addition, you can view the valuesof specific variables by hovering the mouse pointer over the variable or by plac-ing the variables in the Watch1 tab. For more information on variables andwatch windows, please go to section 5.2.4.
2.5.5 Output Window
The Output window is located at the bottom of the screen by default. It can alsobe accessed by View→Output Window. By default, the printf function pro-duces the same Output window. Information such as the contents of Stdoutand the build log is displayed in the Output Window.
Introduction to Help
2-6
2.5.6 Symbol Browser
The symbol browser is a powerful tool that allows you to access all the compo-nents in your project with a single click. Select it through View→Symbol Brows-er. The symbol browser has multiple tabs: in this section we will discuss theFiles, Functions, and Globals tabs.
When you expand the tree in the Files tab, you will see the source files in yourproject. A file is automatically accessed when you double-click on it; the sameholds true for the Functions tab. The Globals tab will allow you to access theglobal symbols in your project.
For more information on the Symbol browser, please go to section 5.2.9.
These few steps have allowed you to successfully create, build, load and de-bug your first Code Composer Studio program.
2.6 Introduction to Help
Code Composer Studio provides a multitude of help tools accessed throughthe Help menu. Select Help →Contents to search by contents. Tutorials guideyou through the Code Composer Studio development process.
Select Help →Web Resources to obtain the most current help topics and otherguidance. User manuals are pdf files that provide information on specific fea-tures or processes.
Access Code Composer Studio’s newest features through Help→Update Ad-visor.
3-1
������ ��� ���
�����
This chapter provides information on how to define and set up your target con-figuration for both single processor and multiprocessor configurations, andhow to customize several of the general IDE options.
Topic Page
3.1 Define and Set Up Target 3-2. . . . . . . . . . . . . . . . . . . . . . . . . . . . . . . . . . . . . .
3.2 Host Setup 3-9. . . . . . . . . . . . . . . . . . . . . . . . . . . . . . . . . . . . . . . . . . . . . . . . . . .
Chapter 3
Define and Set Up Target
3-2
3.1 Define and Set Up Target
3.1.1 Code Composer Studio Setup Utility
This section discusses how to use the Setup utility to define and set up yourtarget configuration, for both single processor and multiprocessor configura-tions.
3.1.1.1 Importing an Existing Configuration
The Setup utility allows you to configure the software to work with differenthardware or simulator targets. You must select your own configuration in Set-up before starting Code Composer Studio.
You can create a configuration using the provided standard configuration files,or create a customized configuration using your own configuration files (seethe online help and/or the tutorial). For the purposes of this example, the stan-dard configuration files are used.
To create a system configuration using a standard configuration file:
Step 1: Double-click on the Setup Code Composer Studio desktop icon.Both the System Configuration dialog box and the Import Configura-tion dialog boxes appear, but we are concerned with the Import Con-figuration box for this step.
Step 2: Click the Clear button in the Import Configuration dialog box to re-move any previously defined configuration.
Step 3: Click Yes to confirm the Clear command.
Step 4: From the list of Available Configurations, select the standard config-uration that matches your system.
Define and Set Up Target
3-3Target and Host Setup
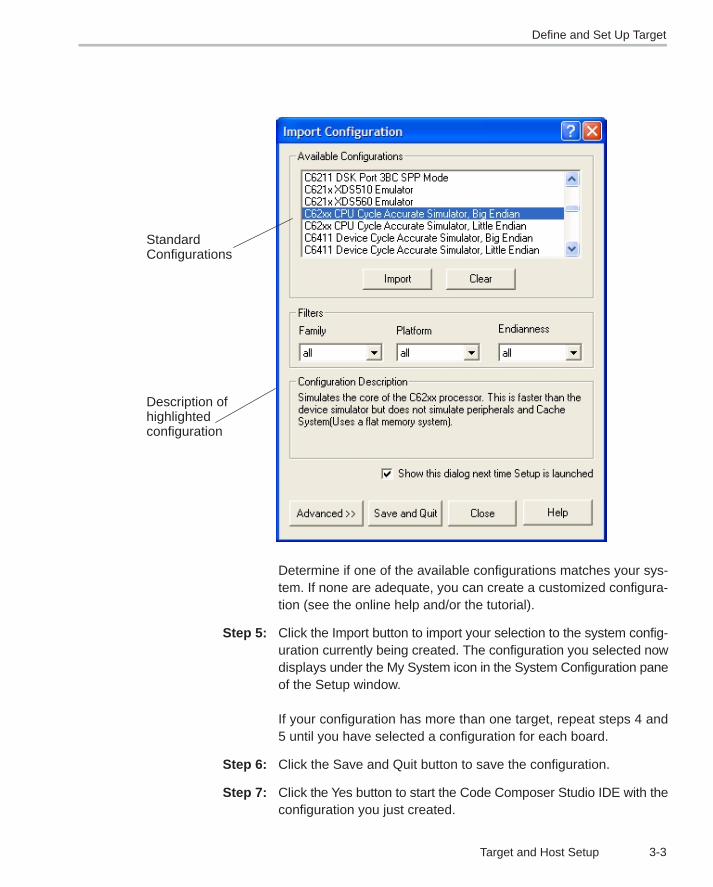
StandardConfigurations
Description ofhighlightedconfiguration
Determine if one of the available configurations matches your sys-tem. If none are adequate, you can create a customized configura-tion (see the online help and/or the tutorial).
Step 5: Click the Import button to import your selection to the system config-uration currently being created. The configuration you selected nowdisplays under the My System icon in the System Configuration paneof the Setup window.
If your configuration has more than one target, repeat steps 4 and5 until you have selected a configuration for each board.
Step 6: Click the Save and Quit button to save the configuration.
Step 7: Click the Yes button to start the Code Composer Studio IDE with theconfiguration you just created.
Define and Set Up Target
3-4
You can now start a project. See Chapter 4 of this book, or the online help andtutorial for information on starting a project.
3.1.1.2 Creating a New System Configuration
To set up a new system configuration you will be working from the Code Com-poser Studio Setup dialog box, instead of the Import Configuration dialog box.
Start with a blank working configuration by selecting Clear from the File menu.(You may also start with a standard or imported configuration that is close toyour desired system. In that case, begin at step three below after loading thestarting configuration.)
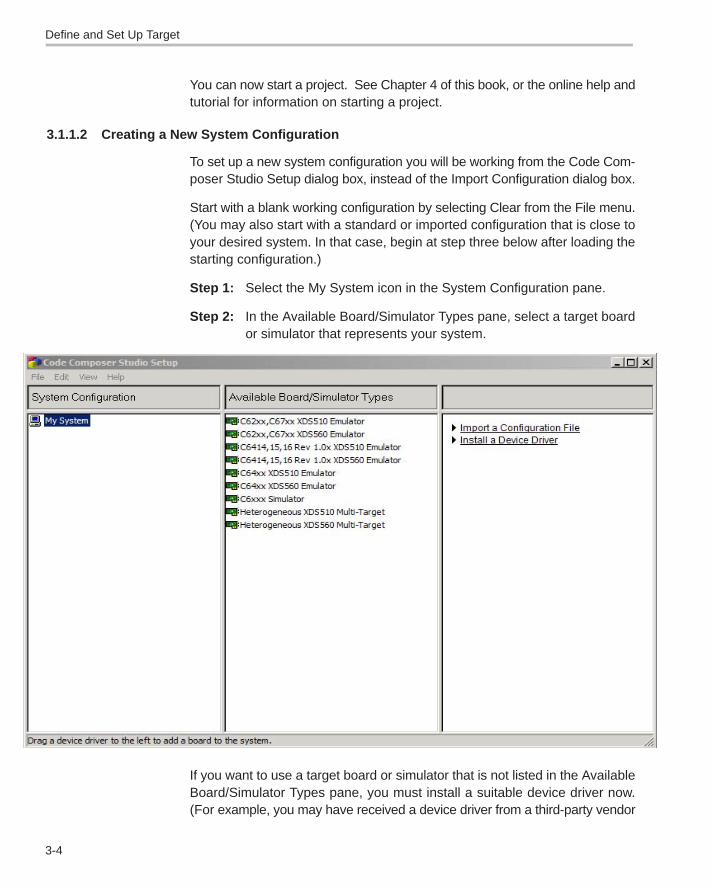
Step 1: Select the My System icon in the System Configuration pane.
Step 2: In the Available Board/Simulator Types pane, select a target boardor simulator that represents your system.
If you want to use a target board or simulator that is not listed in the AvailableBoard/Simulator Types pane, you must install a suitable device driver now.(For example, you may have received a device driver from a third-party vendor
Define and Set Up Target
3-5Target and Host Setup
or you may want to use a driver from a previous version of Code ComposerStudio.) Proceed to Installing/Uninstalling Device Drivers (select Help→Con-tents→Code Composer Studio Setup→How To…→Installing/Uninstalling De-vice Drivers) and then return to this section to complete your system configura-tion.
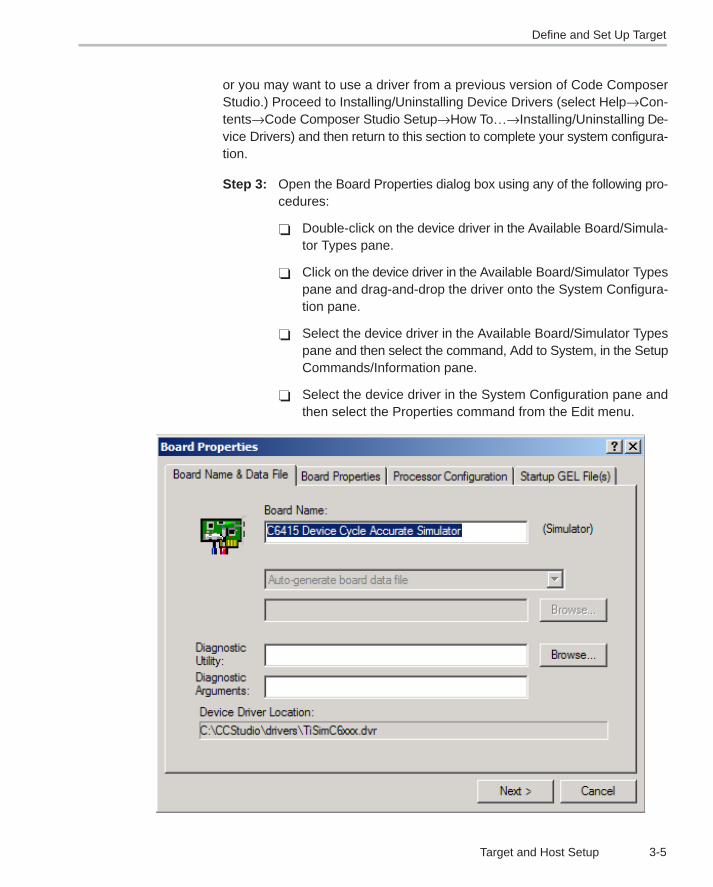
Step 3: Open the Board Properties dialog box using any of the following pro-cedures:
� Double-click on the device driver in the Available Board/Simula-tor Types pane.
� Click on the device driver in the Available Board/Simulator Typespane and drag-and-drop the driver onto the System Configura-tion pane.
� Select the device driver in the Available Board/Simulator Typespane and then select the command, Add to System, in the SetupCommands/Information pane.
� Select the device driver in the System Configuration pane andthen select the Properties command from the Edit menu.
Define and Set Up Target
3-6
Step 4: Edit the information in the Board Properties dialog. Board Propertiesis a tabbed dialog.
The tabs that appear and the fields that can be edited will differ de-pending on the board that you have selected.
After filling in the information in each tab, you can click the Next but-ton to go to the next tab, or simply click on the next tab itself. Whenyou are done, click the Finish button.
For more information on configuring the Board Properties dialog, see the on-line help (Help→Contents→Code Composer Studio Setup→Custom Setup).
3.1.1.3 Creating Multiprocessor Configurations
The most common configurations include a single simulator or a single targetboard with a single CPU. However, you can create more complicated configu-rations in the following ways:
� Connect multiple emulators to your computer, each with its own targetboard.
� Connect more than one target board to a single emulator, using specialhardware to link the scan paths on the boards.
� Create multiple CPUs on a single board, and the CPUs can be all of thesame kind or they can be of different types (e.g., DSPs and microcontrol-lers).
Although a Code Composer Studio configuration is represented as a series ofboards, in fact, each board is either a single CPU simulator or a single emulatorscan chain that can be attached to one or more boards with multiple proces-sors. The device driver associated with the board must be able to comprehendall the CPUs on the scan chain. More information may be found in the onlinehelp (Help→Contents→Code Composer Studio Setup→How To…→Config-uring CCS for Heterogeneous Debugging).
3.1.1.4 Startup GEL Files
The general extension language (GEL) is an interpretive language, similar toC. GEL functions can be used to configure the Code Composer Studio devel-opment environment. They can also be used to initialize the target CPU. A richset of built-in GEL functions is available, or you can create your own user-defined GEL functions.

Define and Set Up Target
3-7Target and Host Setup
The Startup GEL file(s) tab allows you to associate a GEL file (.gel) with eachprocessor in your system configuration.
When Code Composer Studio is started, each startup GEL file is scanned andall GEL functions contained in the file are loaded. If the GEL file contains aStartUp() function, the code within that function is also executed. For example,the GEL mapping functions can be used to create a memory map that de-scribes the processor’s memory to the debugger.
StartUp(){ /*Everything in this function will be executedon startup*/ GEL_MapOn(); GEL_MapAdd(0, 0, 0xF000, 1,1); GEL_MapAdd(0, 1, 0xF000, 1, 1);}
For more information, see the Code Composer Studio online help. SelectHelp→Contents→Creating Code and Building Your Project→AutomatingTasks with General Extension Language).
3.1.1.5 Device Drivers
Special software modules called device drivers, are used to communicate withthe target. Each driver file defines a specific target configuration: a targetboard and emulator, or simulator. Device drivers may either be supplied byTexas Instruments or by third-party vendors.
Each target board or simulator type listed in the Available Board/SimulatorTypes pane is physically represented by a device driver file. Code Composer

Define and Set Up Target
3-8
Studio does not support creating device drivers, but TI or third parties may shipdevice drivers separately from those which are pre-installed.
3.1.2 Parallel Debug Manager Plus (PDM+)
In multiprocessor configurations, invoking Code Composer Studio starts aspecial control known as the Parallel Debug Manager Plus (PDM+).
The PDM+ allows you to open a separate Code Composer Studio session foreach target device. Activity on the specified devices can be controlled in paral-lel using the PDM control.
The 3.0 version of Parallel Debug Manager (PDM+) has several changes fromearlier versions:
� Users can connect or disconnect from targets “on the fly” by right-clickingthe processor on the right pane of PDM+
� The interface allows an expanded view of processors, with several drop-down filters to reveal a list by group, by CPU or by board.
� Red highlighting on the processor icon (on the left pane) indicates that theprocessor is not connected to the system or that it has updated status in-formation.
� Your can now put processors into loosely-coupled groups, (i.e., where theprocessors are not all on the same physical scan chain). Choosing GroupView from the second dropdown menu and System on PDM’s left paneshows which groups are synchronous and which are not.
Global breakpoints work only when processors in a group belong to the samephysical scan chain.
For further details on the PDM+, see the Code Composer Studio online helpunder Help→Contents→Debug→Advanced Debugging Features→ParallelDebug Manager(PDM).
Host Setup
3-9Target and Host Setup
3.1.3 Connect/Disconnect
Code Composer Studio IDE now makes it easier to connect and disconnectwith the target dynamically, by using a new functionality called Connect/Dis-connect. Connect/Disconnect allows you to disconnect from your hardwaretarget and even to restore the previous debug state when connecting again.
By default, Code Composer Studio will not attempt to connect to the targetwhen the control window is opened. Connection to the target can be estab-lished by going to Debug→Connect. The default behavior can be changed inthe Debug Properties tab under Options→Customize.
The Status Bar will briefly flash a help icon to indicate changes in the target’sstatus. When the target is disconnected, the status bar will indicate this fact,as well as the last known execution state of the target (i.e., halted, running, freerunning or error condition). When connected, the Status Bar will also indicateif the target is stepping (into, over or out), and the type of breakpoint thatcaused the halt (software or hardware).
After a connection to the target (except for the first connection), a menu optionentitled Restore Debug State, will be available under the Debug Menu. Select-ing this option will enable every breakpoint that was disabled at disconnect. You can also reset them normally by pressing F9 or selecting Toggle Break-points from the right-click menu. Breakpoints from cTools jobs and emu analy-sis will not be enabled.
If the PDM+ is open, you can connect to a target by right-clicking on the cellcorresponding to the target device underneath the column marked, Name.
For further details on Connect/Disconnect, see the Code Composer Studio on-line help under Debugging→Connect/Disconnect.
3.2 Host Setup
3.2.1 IDE Customization
Once Code Composer Studio has been properly configured and the IDElaunched, you can customize several of the general IDE options to adhere toyour personal needs.
3.2.1.1 Setting Custom General IDE Options
Color
The color of various screen elements can be changed to suit your taste. All col-or changes are saved in the workspace.

Host Setup
3-10
To change the color of screen elements:
Step 1: Select Option→Customize, or right-click in a document window orDisassembly window and select Properties→Colors.
Step 2: In the Customize dialog box, select the Color tab.
The color dialog offers the following options:
Screen Element . Click the drop-down list and select the screen element tochange.
Color. The color field displays the current color of the selected screen element.
Palette. Select a different color from the palette. The color field is updated withthe selected color.
Step 1: Click Apply to accept your selection.
Step 2: Click OK to exit the dialog box. Click Cancel to exit the dialog boxwithout accepting your changes.

Host Setup
3-11Target and Host Setup
Keyboard
The default keyboard shortcuts can be changed and new keyboard shortcutscan be created for any editing or debugging commands that can be invokedfrom a document window.
To assign keyboard shortcuts:
Step 1: Select Option→Customize, or right−click in a document window andselect Properties→Keyboard.
Step 2: In the Customize dialog box, select the Keyboard tab.
The Customize → Keyboard dialog offers the following options:
Filename. By default, the file that contains the standard keyboard shortcutsis displayed. To load a previously saved keyboard configuration file (*.key), en-ter the path and filename, or use the browse button (…) to navigate to the file.
Commands. Select the command you want to assign to a keyboard shortcut.
Assigned Keys. Displays the keyboard shortcuts that are assigned to the se-lected command.
Add. Click the Add button to assign a new key sequence for invoking the se-lected command. In the Assign Shortcut dialog box, enter the new key se-quence, and then click OK.

Host Setup
3-12
Remove. To remove a particular key sequence for a command, select the keysequence in the Assigned Keys list and click the Remove button.
Default Keys. Immediately revert back to the default keyboard shortcuts byclicking the Default Keys button.
Save As. Click the Save As button to save your custom keyboard configurationin a file. In the Save As dialog box, navigate to the location where you want tosave your configuration. Enter a name for your keyword configuration file(*.key). Click Save.
Step 3: Click OK to exit the dialog box.
Control Window Display
To set display options:
Step 1: Select Option→Customize.
Step 2: In the Customize dialog box, select the Control Window Display tab.
The Control Window Display dialog offers the following options.
Host Setup
3-13Target and Host Setup
Title bar displays
The following options control the information that is displayed in the title barof the Control window:
Current Workspace. Displays the name of the current workspace. If selected,you can choose to display just the filename or display the full path.
Board name. Displays the name of the target board. This option is selectedby default.
Processor name. Displays the name of the target processor. This option isselected by default.
Processor type. Displays the type of target processor. This option is selectedby default.
Current loaded program. Displays the name of the current loaded program.If selected, you can choose to display just the output filename or display thefull path.
Current Project. Displays the name of the active project. If selected, you canchoose to display just the project filename or display the full path.
Device Driver Name. Displays the name of the device driver. If selected, youcan choose to display just the device driver filename or display the full path.
Product Name. Displays the name of the Code Composer Studio product. Bydefault, this option is selected.
Source file names
The following option controls the information that is displayed in the title barof document windows and the Build Options dialog box:
Display full path. Displays the full path and filename. By default, only the file-name is displayed.
Project close
Close all windows on Project Close. When a project is closed, close all doc-ument windows associated with the project. If a file has been modified, you willbe prompted to save your changes. By default, associated windows are notclosed.
Close projects
Close projects on exit Control W indow. This option is only significant whenusing a multiprocessor setup. Starting Code Composer Studio with a multipro-

Host Setup
3-14
cessor setup opens the Parallel Debug Manager (PDM). From the PDM, youcan launch a control window for each defined processor.
With this option disabled, projects remain open even when the control windowis closed. For example, if you open a control window from the PDM, load a proj-ect, exit the control window, and then reopen the control window, you will seethat the project is still open.
With this option enabled, projects that are opened within a control window areclosed when you exit the control window.
Without a multiprocessor setup, closing the control window exits Code Com-poser Studio, which always closes all projects.
Step 1: Click OK to accept your selections and close the Customize dialogbox.
File Access
The number of files and the format of the file names listed in the recent fileslist within the Code Composer Studio interface can be changed to suit yourtaste.
To Change the File Access Options:
Step 1: Select Option→Customize.
Step 2: In the Customize dialog box, select the File Access tab. Use thescroll arrows at the top of the dialog box to locate the tab.
The File Access dialog offers the following options:
Source files. Enter the maximum number of recent source files (File→RecentSource Files) to display. The value must be an integer in the range 1 to 10. Thedefault value is 4.
Programs. Enter the maximum number of recent program files (File→RecentProgram Files) to display. The value must be an integer in the range 1 to 10.The default value is 4.
Symbols. Enter the maximum number of recent symbol files (File→RecentSymbol Files) to display. The value must be an integer in the range 1 to 10.Default value is 4.
GEL files . Enter the maximum number of recent GEL files (File→Recent GELFiles) to display. The value must be an integer in the range 1−10. Default valueis 4.
Host Setup
3-15Target and Host Setup
Projects . Enter the maximum number of recent project files (Project→Recentproject files) to display. The value must be an integer in the range 1 to 10. Thedefault value is 4.
Workspaces . Enter the maximum number of recent workspaces (File →Re-cent Workspaces) to display. The value must be an integer in the range 1 to10. The default value is 4.
Reset file directories when opening a project . If you choose this option,when you try to open a file, Code Composer Studio will start you inside the di-rectory of your active project. If you don’t choose this option, Code ComposerStudio will start you inside the last directory you used, regardless of which proj-ect you are in now.
Show time stamp for program files in recent file list . Enabling this optionwill display the time stamp along with the file name of each program file in therecent file list.
Step 3: Click OK to exit the Customize dialog box.
Font
The typeface, style, size, and color of the default font can be changed to suityour preference.
To restore the original font and font characteristics, select Courier font, Regu-lar style, size 12.
To change fonts and font characteristics:
Host Setup
3-16
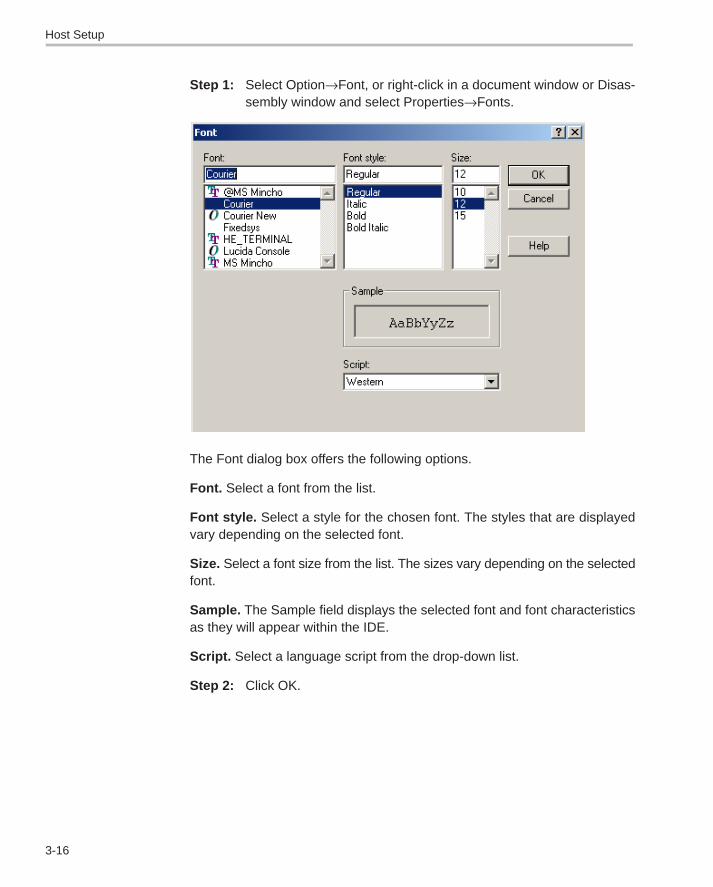
Step 1: Select Option→Font, or right-click in a document window or Disas-sembly window and select Properties→Fonts.
The Font dialog box offers the following options.
Font. Select a font from the list.
Font style. Select a style for the chosen font. The styles that are displayedvary depending on the selected font.
Size. Select a font size from the list. The sizes vary depending on the selectedfont.
Sample. The Sample field displays the selected font and font characteristicsas they will appear within the IDE.
Script. Select a language script from the drop-down list.
Step 2: Click OK.

4-1
���� �������
This chapter gives a brief look at the options available to create code and builda basic Code Composer Studio project.
Topic Page
4.1 Create and Configure Project 4-2. . . . . . . . . . . . . . . . . . . . . . . . . . . . . . . . . .
4.2 Configuring DSP/BIOS 4-12. . . . . . . . . . . . . . . . . . . . . . . . . . . . . . . . . . . . . . .
4.3 Editor 4-17. . . . . . . . . . . . . . . . . . . . . . . . . . . . . . . . . . . . . . . . . . . . . . . . . . . . . . .
4.4 Code Generation Tools 4-19. . . . . . . . . . . . . . . . . . . . . . . . . . . . . . . . . . . . . . .
4.5 Building Your Code Composer Studio Project 4-26. . . . . . . . . . . . . . . . . .
4.6 Available Foundation Software 4-29. . . . . . . . . . . . . . . . . . . . . . . . . . . . . . . .
4.7 Automation (For Project Management) 4-38. . . . . . . . . . . . . . . . . . . . . . . . .
Chapter 4

Create and Configure Project
4-2
4.1 Create and Configure Project
A project stores all the information needed to build an individual program orlibrary.
� Filenames of source code and object libraries
� Code generation tool options
� Include file dependencies
4.1.1 Creating a Project
The following procedure allows you to create single or multiple new projects(multiple projects can be open simultaneously). Each project’s filename mustbe unique.
The information for a project is stored in a single project file (*.pjt).
Step 1: From the Project menu, choose New.The Project Creation wizard window displays.
Step 2: In the Project Name field, type the name you want for your project.
Step 3: In the Location field, specify the directory where you want to store theproject file, Object files generated by the compiler and assembler arealso stored here.You can type the full path in the Location field or click the Browsebutton and use the Choose Directory dialog box. It is a good idea touse a different directory for each new project.
Step 4: In the Project Type field, select a Project Type from the drop-downlist. Choose either Executable (.out) or Library (lib). Executable indicatesthat the project generates an executable file. Library indicates thatyou are building an object library.

Create and Configure Project
4-3Code Creation
Step 5: In the Target field, select the target family that identifies your CPU.This information is necessary when tools are installed for multipletargets.
Step 6: Click Finish.A project file called projectname.pjt is created. This file stores all filesand project settings used by your project.
The new project and first project configuration (in alphabetical order) becomethe active project, and inherit TI-supplied default compiler and linker optionsfor debug and release configurations.
Figure 4−1. Code Composer Studio IDE Basic Window
DSP/BIOSToolbar
Build Toolbar
Activeproject
Project ViewWindow
After creating a new project file, add the filenames of your source code, objectlibraries, and linker command file to the project list.
4.1.1.1 Adding Files to a Project
You can add several different files or file types to your project. The types areshown in the graphic below. To add files to your project:
Step 1: Select Project→Add Files to Project, or right-click on the project’sfilename in the Project View window and select Add Files.

Create and Configure Project
4-4
The Add Files to Project dialog box displays.
Drop-down list offile types
Step 2: In the Add Files to Project dialog box, specify a file to add. If the filedoes not exist in the current directory, browse to the correct location.Use the Files of Type drop-down list to set the type of files that appearin the File name field.
Note:
Do not try to manually add header/include files (*.h) to the project. These filesare automatically added when the source files are scanned for dependen-cies as part of the build process.
Step 3: Click Open to add the specified file to your project.
The Project View (see Figure 4−1 ) is automatically updated when a file isadded to the current project.
The project manager organizes files into folders for source files, include files,libraries, and DSP/BIOS configuration files. Source files that are generated byDSP/BIOS are placed in the Generated Files folder. Code Composer StudioIDE finds files by searching for project files in the following path order whenbuilding the program:
� The folder that contains the source file.

Create and Configure Project
4-5Code Creation
� The folders listed in the Include search path for the compiler or assembleroptions (from left to right).
� The folders listed in the definitions of the optional DSP_C_DIR (compiler)and DSP_A_DIR (assembler) environment variables (from left to right).
Removing a File
If you need to remove a file from the project, right-click on the file in the ProjectView and choose Remove from Project in the pop-up menu.
4.1.2 Project Configurations
A project configuration defines a set of project level build options. Optionsspecified at this level apply to every file in the project.
Project configurations enable you to define build options for the differentphases of program development. For example, you can define a Debugconfiguration to use while debugging your program and a Releaseconfiguration for building the finished product.
Each project is created with two default configurations: Debug and Release.Additional configurations can be defined. Whenever a project is created or anexisting project is initially opened, the first configuration (in alphabetical order)is set to active and is preserved the Code Composer Studio workspace.
When you build your program, the output files generated by the software toolsare placed in a configuration-specific subdirectory. For example, if you havecreated a project in the directory MyProject, the output files for the Debugconfiguration are placed in MyProject\Debug. Similarly, the output files for theRelease configuration are placed in MyProject\Release.
Changing the Active Project Configuration
Click on the Select Active Configuration field in the Project toolbar and selecta configuration from the drop-down list.
Figure 4−2. Changing Active Project Configuration
Select ActiveProject
Select ActiveConfiguration
Create and Configure Project
4-6
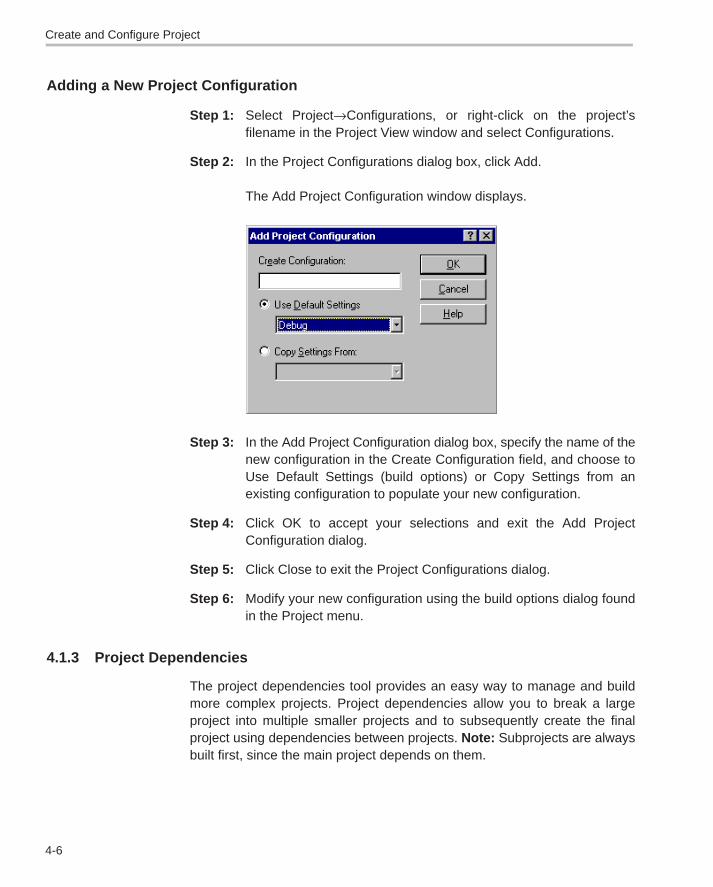
Adding a New Project Configuration
Step 1: Select Project→Configurations, or right-click on the project’sfilename in the Project View window and select Configurations.
Step 2: In the Project Configurations dialog box, click Add.
The Add Project Configuration window displays.
Step 3: In the Add Project Configuration dialog box, specify the name of thenew configuration in the Create Configuration field, and choose toUse Default Settings (build options) or Copy Settings from anexisting configuration to populate your new configuration.
Step 4: Click OK to accept your selections and exit the Add ProjectConfiguration dialog.
Step 5: Click Close to exit the Project Configurations dialog.
Step 6: Modify your new configuration using the build options dialog foundin the Project menu.
4.1.3 Project Dependencies
The project dependencies tool provides an easy way to manage and buildmore complex projects. Project dependencies allow you to break a largeproject into multiple smaller projects and to subsequently create the finalproject using dependencies between projects. Note: Subprojects are alwaysbuilt first, since the main project depends on them.
Create and Configure Project
4-7Code Creation
Adding/Creating a sub−project
The three ways to create a subproject, or, to be more specific, to create a project dependency relationship are discussed in the following topics.
First Method: Drag−and−drop from the project view windows.
You can drop the sub-project to the target project icon or to the Dependent Projects icon under the target project. You can drag and drop from within thesame project view window, or you can you drag and drop between project viewwindows of two Code Composer Studios running simultaneously.
Second Method: Drag−and−drop from Windows File Explorer.
Step 1: Choose the .pjt file from the project you want to be a subproject.
Step 2: Open Windows Explorer so that both Explorer and Code ComposerStudio are visible at the same time.
Step 3: In Windows Explorer, select the .pjt file of the project you want to bea subproject.
Step 4: Drag this .pjt file to the Project Window of Code Composer Studio.A plus sign should appear on the .pjt file that you were dragging.
Step 5: Drop it into the Project Dependency folder of the main project.
Third Method: Use the Context Menu
In the project view, right-click on the Dependent Projects icon under a loadedproject, select Add Dependent Projects. In the pop-up dialog, browse andselect another project .pjt file. The selected .pjt file will be a sub-project of theloaded project. If the selected .pjt file is not yet loaded, it will be automaticallyloaded.
Project Dependencies Settings
Sub-projects each have their own configuration settings. In addition, the mainproject has configuration settings for each sub-project. All of these settingscan be accessed from the Project Dependencies dialogue. The dialogue canbe accessed by the project menu as well as the context menu of the project.You simply click on Project Dependencies… to access the dialogue.
Modifying Project Configurations
In the Project Dependencies dialogue, it is possible to modify thesubprojectsettings. As mentioned previously, the dialogue can be accessed by

Create and Configure Project
4-8
Project→Project Dependencies.
As shown by Figure 4−3, you can choose to exclude certain subprojects fromyour configuration. In the example shown, the myConfig configuration forvolume. pjt excludes sinewave.pjt from the build. In addition, you can alsoselect a particular subproject configuration for this configuration. In myConfig,echo.pjt is built using a user-created configuration echoConfig rather than thedefault, myConfig subproject configuration.
Sub−project configurations
Each sub-project has its own set of build configurations. For each main projectconfiguration, you can choose to build each sub-project using a particularconfiguration. To modify the sub-project setting, use the dropdown boxbesides the project (under the settings column). Take the example shown in

Create and Configure Project
4-9Code Creation
Figure 4−4, you can change the subproject echo.pjt configuration toglobsConfig in the Debug configuration of volume.pjt.
4.1.4 Makefiles
The Code Composer Studio IDE supports the use of external makefiles(*.mak) and an associated external make utility for project management andbuild process customization.
To enable the Code Composer Studio IDE to build a program using a makefile,a Code Composer Studio project must be created that wraps the makefile.After a Composer Composer Studio project is associated with the makefile,the project and its contents can be displayed in the Project View window andthe Project→Build and Project→Rebuild All commands can be used to buildthe program.
Step 1: Double-click on the name of the makefile in the Project View windowto open the file for editing.
Step 2: Modify your makefile build commands and options.
Special dialogs enable you to modify the makefile build commandsand makefile options. The normal Code Composer Studio BuildOptions dialogs are not available when working with makefiles.
Multiple configurations can be created, each with its own build commands andoptions.

Create and Configure Project
4-10
Limitations and Restrictions
Source files can be added to or removed from the project in the Project View.However, changes made in the Project View do not change the contents of themakefile. These source files do not affect the build process nor are theyreflected in the contents of the makefile. Similarly, editing the makefile doesnot change the contents in the Project View. File-specific options for sourcefiles that are added in the Project View are disabled. The Project→CompileFile command is also disabled. However, when the project is saved, thecurrent state of the Project View is preserved.
Note:
Before using Code Composer Studio IDE commands to build your programusing a makefile, it is necessary to set the necessary environment variables.To set environment variables, run the batch file
DosRun.bat
The batch file is located in the directory c:\CCStudio. If you installed CodeComposer Studio IDE in a directory other than c:\ti, the batch file will be lo-cated in the directory you specified during installation.
4.1.5 Source Control Integration
The project manager enables you to connect your projects to a variety ofsource control providers. The Code Composer Studio IDE automaticallydetects compatible providers that are installed on your computer.
Step 1: From the Project menu, choose Source Control.
Step 2: From the Source Control submenu, choose Select Provider...

Create and Configure Project
4-11Code Creation
Step 3: Select the Source Control Provider that you want to use and pressOK.
NOTE: If no source control providers are listed, please ensure thatyou have correctly installed the client software for the provider onyour machine.
Step 4: Open one of your projects and select Add to Source Control fromProject→Source Control.
Step 5: Add your source files to Source Control.
You can check files in and out of source control by selecting a file in the ProjectView window and right clicking on the file.
Figure 4−3. Source Control Pop-Up Menu

Configuring DSP/BIOS
4-12
4.2 Configuring DSP/BIOS
The DSP/BIOS Configuration Tool enables developers to select and deselectkernel modules, and control a wide range of configurable parametersaccessed by the DSP/BIOS kernel at run-time as shown in the figure below.A file of data tables generated by the tool ultimately becomes an input to theprogram linker.
Programbuild
Programdebug
BIOS IIkernel
toolsPlug−in
Code Composer Studio
Real−time analysis
Host computer
RTDX
Target program
DSP/BIOS
TMS320 DSP
FrameworksalgorithmskernelsdriversComponents
Application
Figure 4−4. DSP/BIOS Configuration Window
Configuring DSP/BIOS
4-13Code Creation
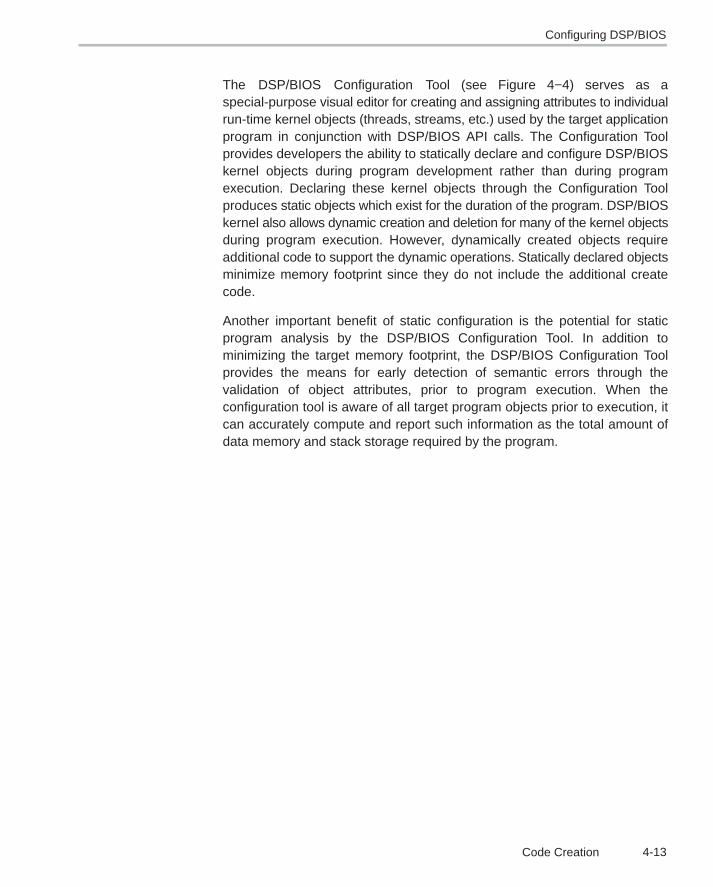
The DSP/BIOS Configuration Tool (see Figure 4−4) serves as aspecial-purpose visual editor for creating and assigning attributes to individualrun-time kernel objects (threads, streams, etc.) used by the target applicationprogram in conjunction with DSP/BIOS API calls. The Configuration Toolprovides developers the ability to statically declare and configure DSP/BIOSkernel objects during program development rather than during programexecution. Declaring these kernel objects through the Configuration Toolproduces static objects which exist for the duration of the program. DSP/BIOSkernel also allows dynamic creation and deletion for many of the kernel objectsduring program execution. However, dynamically created objects requireadditional code to support the dynamic operations. Statically declared objectsminimize memory footprint since they do not include the additional createcode.
Another important benefit of static configuration is the potential for staticprogram analysis by the DSP/BIOS Configuration Tool. In addition tominimizing the target memory footprint, the DSP/BIOS Configuration Toolprovides the means for early detection of semantic errors through thevalidation of object attributes, prior to program execution. When theconfiguration tool is aware of all target program objects prior to execution, itcan accurately compute and report such information as the total amount ofdata memory and stack storage required by the program.

Configuring DSP/BIOS
4-14
Creating DSP/BIOS Configuration Files
To create DSP/BIOS configuration files:
Step 1: Within Code Composer Studio, choose File→New→DSP/BIOSConfiguration.
The New Configuration window displays.
Available DSP/BIOSconfigurations for yourplatform
Description of theselected configu-rationView list as large icons
View list as small iconsView detailed list
Step 2: Select a Configuration template.
If your board is not listed, you can create and add a custom templateto this list.
Configuring DSP/BIOS
4-15Code Creation
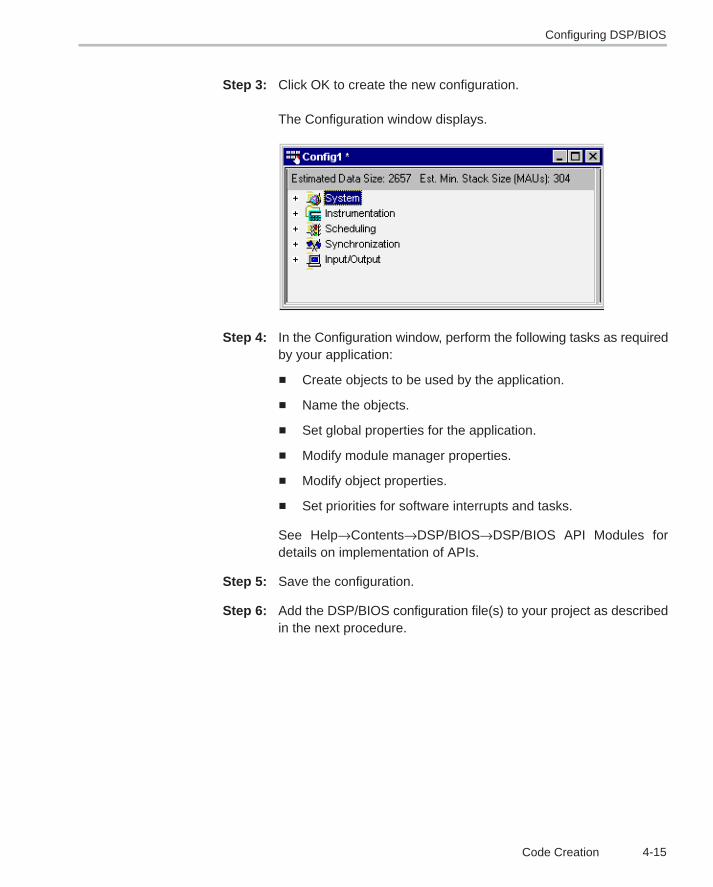
Step 3: Click OK to create the new configuration.
The Configuration window displays.
Step 4: In the Configuration window, perform the following tasks as requiredby your application:
� Create objects to be used by the application.
� Name the objects.
� Set global properties for the application.
� Modify module manager properties.
� Modify object properties.
� Set priorities for software interrupts and tasks.
See Help→Contents→DSP/BIOS→DSP/BIOS API Modules fordetails on implementation of APIs.
Step 5: Save the configuration.
Step 6: Add the DSP/BIOS configuration file(s) to your project as describedin the next procedure.

Configuring DSP/BIOS
4-16
Adding DSP/BIOS Configuration Files to Your Project
After you save a DSP/BIOS configuration file, follow these steps to add filesto your Code Composer Studio project.
Step 1: If it is not already open, use Project→Open to open the project withCode Composer Studio.
Step 2: Choose Project→Add Files to Project. In the Files of type box, selectConfiguration File (*.cdb). Select the .cdb file you saved and clickOpen.
Adding the .cdb file to a project automatically adds the following fileto the Project View folders:
� program.cdb in the DSP/BIOS Config folder
� programcfg.s62 in the Generated Files folder
� programcfg_c.c in the Generated Files folder
Step 3: Choose Project→Add Files to Project again. In the Files of type box,select Linker Command File (*.cmd). Select the *cfg.cmd file theConfiguration Tool generated when you saved the configuration fileand click Open.
Step 4: If your project already contained a linker command file, you maywant to modify the file or remove it from your project. It may duplicateor conflict with some of the linker commands in the file generated byDSP/BIOS.
Step 5: If your project includes the vectors.asm source file, right-click on thefile and choose Remove from project in the shortcut menu. Hardwareinterrupt vectors are automatically defined in the configuration file.
Step 6: If your project includes the rtsxxxx.lib file (where xxxx is your deviceor device’s generation), right−click on the file and choose Removefrom project in the shortcut menu. This file is automatically includedby the linker command file created from your configuration.
These steps can be used whenever you want to convert an existing programto one that can call DSP/BIOS API functions.
Editor
4-17Code Creation
4.3 Editor
4.3.1 Using the Code Composer Studio Editor
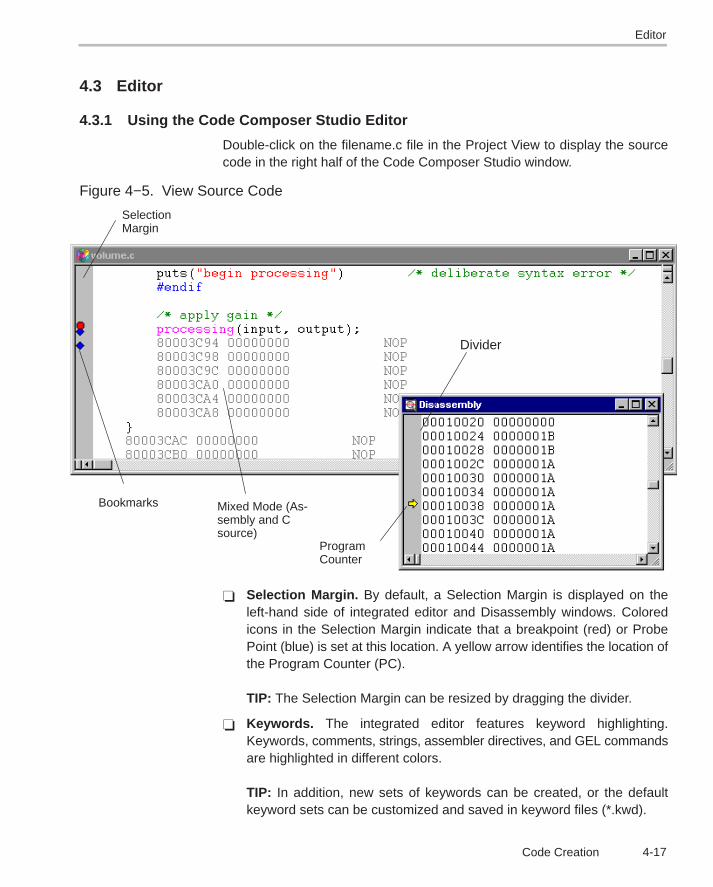
Double-click on the filename.c file in the Project View to display the sourcecode in the right half of the Code Composer Studio window.
Figure 4−5. View Source Code
SelectionMargin
Bookmarks Mixed Mode (As-sembly and Csource)
ProgramCounter
Divider
� Selection Margin. By default, a Selection Margin is displayed on theleft-hand side of integrated editor and Disassembly windows. Coloredicons in the Selection Margin indicate that a breakpoint (red) or ProbePoint (blue) is set at this location. A yellow arrow identifies the location ofthe Program Counter (PC).
TIP: The Selection Margin can be resized by dragging the divider.
� Keywords. The integrated editor features keyword highlighting.Keywords, comments, strings, assembler directives, and GEL commandsare highlighted in different colors.
TIP: In addition, new sets of keywords can be created, or the defaultkeyword sets can be customized and saved in keyword files (*.kwd).
Editor
4-18
� Keyboard Shortcuts. The default keyboard shortcuts can be changedand new keyboard shortcuts can be created for any editing or debuggingcommands that can be invoked from a document window. Keyboardshortcuts can be modified through the customize dialog box in the Optionsmenu.
� Bookmarks. Use bookmarks to find and maintain key locations withinyour source files. A bookmark can be set on any line of any source file.
Editor Properties
Customize the editor properties to suit your personal preferences. Forexample, you can choose to open files as read-only, or always save yoursource code before starting a build, or change the way keywords appear in theeditor. You can customize the editor by going to Options→Customize→Editorproperties.
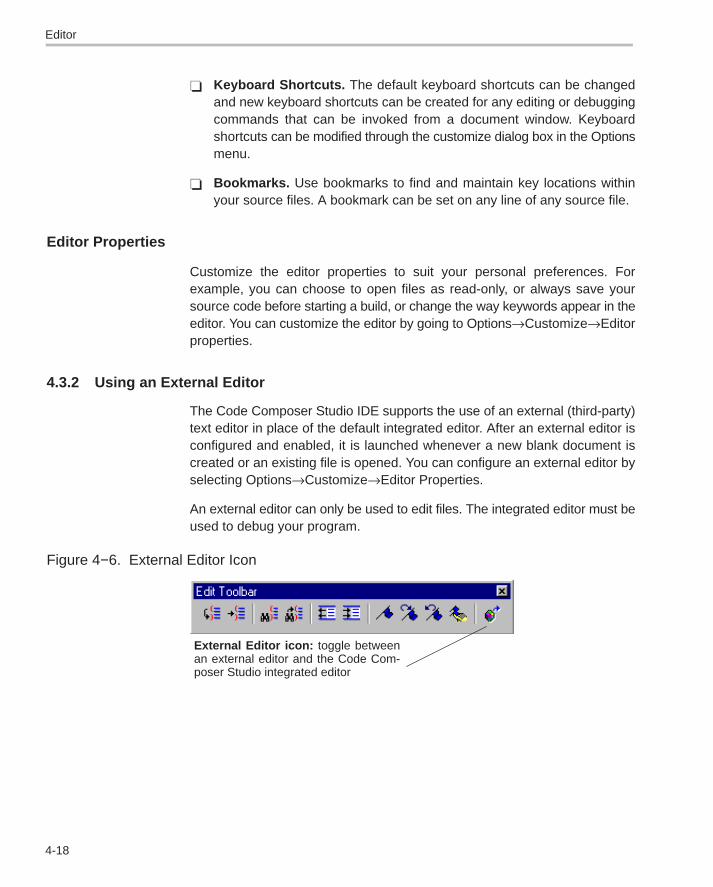
4.3.2 Using an External Editor
The Code Composer Studio IDE supports the use of an external (third-party)text editor in place of the default integrated editor. After an external editor isconfigured and enabled, it is launched whenever a new blank document iscreated or an existing file is opened. You can configure an external editor byselecting Options→Customize→Editor Properties.
An external editor can only be used to edit files. The integrated editor must beused to debug your program.
Figure 4−6. External Editor Icon
External Editor icon: toggle betweenan external editor and the Code Com-poser Studio integrated editor
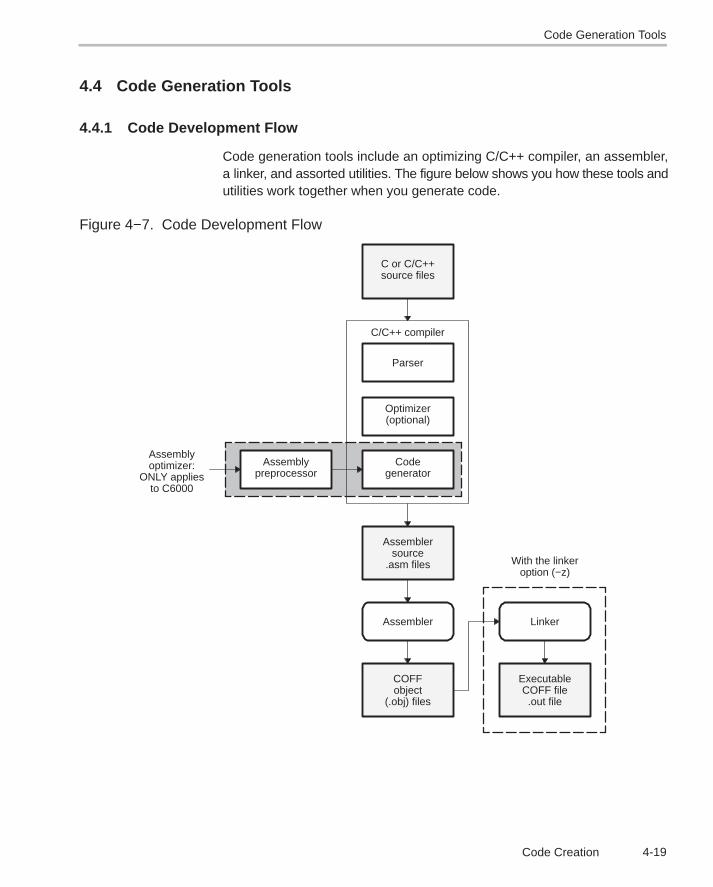
Code Generation Tools
4-19Code Creation
4.4 Code Generation Tools
4.4.1 Code Development Flow
Code generation tools include an optimizing C/C++ compiler, an assembler,a linker, and assorted utilities. The figure below shows you how these tools andutilities work together when you generate code.
Figure 4−7. Code Development Flow
Assemblersource
.asm files
(optional)Optimizer
Parser
C/C++ compiler
Assembler
COFF
(.obj) filesobject
preprocessorAssembly
Assemblyoptimizer:
ONLY appliesto C6000
C or C/C++source files
Linker
.out fileCOFF file
Executable
With the linkeroption (−z)
Codegenerator
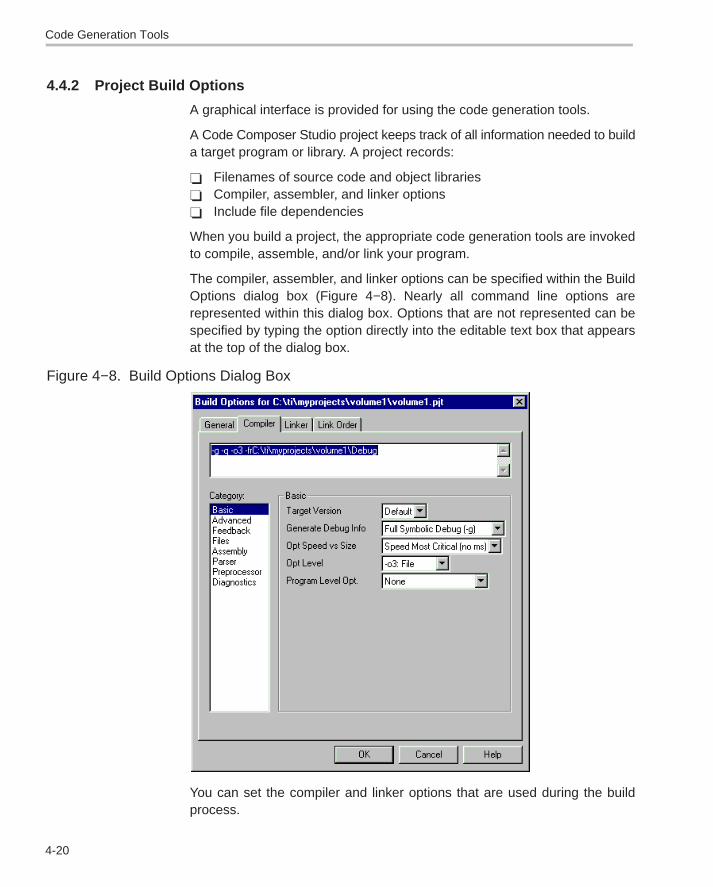
Code Generation Tools
4-20
4.4.2 Project Build Options
A graphical interface is provided for using the code generation tools.
A Code Composer Studio project keeps track of all information needed to builda target program or library. A project records:
� Filenames of source code and object libraries� Compiler, assembler, and linker options� Include file dependencies
When you build a project, the appropriate code generation tools are invokedto compile, assemble, and/or link your program.
The compiler, assembler, and linker options can be specified within the BuildOptions dialog box (Figure 4−8). Nearly all command line options arerepresented within this dialog box. Options that are not represented can bespecified by typing the option directly into the editable text box that appearsat the top of the dialog box.
Figure 4−8. Build Options Dialog Box
You can set the compiler and linker options that are used during the buildprocess.

Code Generation Tools
4-21Code Creation
Your build options can be set at two different levels, depending on howfrequently or in what configuration they are needed. First, you can define a setof project-level options that apply to all files in your project. Then, you canoptimize your program by defining file-specific options for individual sourcecode files.
TIP: For options that are commonly used together, you can set project-levelconfigurations, rather than setting the same individual options repeatedly. Youcan also look for this information in the online help and tutorial.
Setting Project Level Options
Step 1: Select Project→Build Options.
Step 2: In the Build Options Dialog Box, select the appropriate tab.
Step 3: Select the options to be used when building your program.
Step 4: Click OK to accept your selections.
Setting File-Specific Options
Step 1: Right-click on the name of the source file in the Project View windowand select File Specific Options from the context menu.
Step 2: Select the options to be used when compiling this file.
Step 3: Click OK to accept your selections.
4.4.3 Compiler Overview
The C and C++ compilers (for C5000 and C6000) are full-featuredoptimizing compilers that translate standard ANSI C programs into assemblylanguage source. The following subsections describe the key features of thecompilers.
Interfacing with Code Composer Studio
The following features pertain to interfacing with the compiler:
� Compiler shell program
The compiler tools include a shell program that you use to compile,assembly optimize, assemble, and link programs in a single step. Formore information, see the About the Shell Program section in theOptimizing Compiler User’s Guide appropriate for your device.

Code Generation Tools
4-22
� Flexible assembly language interface
The compiler has straightforward calling conventions, so you can writeassembly and C functions that call each other. For more information, seeChapter 8, Run-Time Environment, in the Optimizing Compiler User’sGuide appropriate for your device.
4.4.4 Assembly Language Development Tools
The following is a list of the assembly language development tools:
� Assembler. The assembler translates assembly language source filesinto machine language object files. The machine language is based oncommon object file format (COFF).
� Archiver. The archiver allows you to collect a group of files into a singlearchive file called a library. Additionally, the archiver allows you to modifya library by deleting, replacing, extracting, or adding members. One of themost useful applications of the archiver is building a library of objectmodules.
� Linker. The linker combines object files into a single executable objectmodule. As it creates the executable module, it performs relocation andresolves external references. The linker accepts relocatable COFF objectfiles and object libraries as input.
� Absolute Lister. The absolute lister accepts linked object files as inputand creates .abs files as output. You can assemble these .abs files toproduce a listing that contains absolute, rather than relative, addresses.Without the absolute lister, producing such a listing would be tedious andwould require many manual operations.
� Cross-reference Lister. The cross-reference lister uses object files toproduce a cross-reference listing showing symbols, their definitions, andtheir references in the linked source files.
� Hex-conversion Utility. The hex-conversion utility converts a COFFobject file into TI-Tagged, ASCII-hex, Intel, Motorola-S, or Tektronix objectformat. You can download the converted file to an EPROM programmer.
� With the TMS320C54x device, the mnemonic-to-algebraic translatorutility converts assembly language source files. The utility accepts anassembly language source file containing mnemonic instructions. Itconverts the mnemonic instructions to algebraic instructions, producingan assembly language source file containing algebraic instructions.

Code Generation Tools
4-23Code Creation
4.4.5 Assembler Overview
The assembler translates assembly language source files into machinelanguage object files. These files are in common object file format (COFF).
The two-pass assembler does the following:
� Processes the source statements in a text file to produce a relocatableobject file
� Produces a source listing (if requested) and provides you with control overthis listing
� Allows you to segment your code into sections and maintains a sectionprogram counter (SPC) for each section of object code
� Defines and references global symbols and appends a cross-referencelisting to the source listing (if requested)
� Assembles conditional blocks
� Supports macros, allowing you to define macros inline or in a library
4.4.6 Linker Overview
The linker allows you to configure system memory by allocating outputsections efficiently into the memory map. As the linker combines object files,it performs the following tasks:
� Allocates sections into the target system’s configured memory
� Relocates symbols and sections to assign them to final addresses
� Resolves undefined external references between input files
The linker command language controls memory configuration, output sectiondefinition, and address binding. The language supports expressionassignment and evaluation. You configure system memory by defining andcreating a memory module that you design. Two powerful directives,MEMORY and SECTIONS, allow you to:
� Allocate sections into specific areas of memory
� Combine object file sections
� Define or redefine global symbols at link time
Code Generation Tools
4-24
4.4.6.1 Text-Based Linker
The text linker combines object files into a single executable COFF objectmodule. Linker directives in a linker command file allow you to combine objectfile sections, bind sections or symbols to addresses or within memory ranges,and define or redefine global symbols. For more information on the TI linker,see the Code Generation Tools online help.
4.4.7 C/C++ Development Tools
The following is a list of the C/C++ development tools:
� C/C++ Compiler. The C/C++ compiler accepts C/C++ source code andproduces assembly language source code. A shell program , anoptimizer , and an interlist utility are parts of the compiler.
� The shell program enables you to compile, assemble, and link sourcemodules in one step. If any input file has a .sa extension, the shellprogram invokes the assembly optimizer.
� The optimizer modifies code to improve the efficiency of C programs.
� The interlist utility interweaves C/C++ source statements withassembly language output.
� Assembly Optimizer (C6000 � only). The assembly optimizer allows youto write linear assembly code without being concerned with the pipelinestructure or with assigning registers. It accepts assembly code that has notbeen register-allocated and is unscheduled. The assembly optimizerassigns registers and uses loop optimization to turn linear assembly intohighly parallel assembly that takes advantage of software pipelining.
� Library-build Utility. You can use the library-build utility to build your owncustomized run-time-support library. Standard run-time-support libraryfunctions are provided as source code in rts.src and rstcpp.src. The objectcode for the run-time-support functions is compiled for little-endian modeversus big-endian mode and C code versus C++ code into standardlibraries.
The run-time-support libraries contain the ANSI standardrun-time-support functions, compiler-utility functions, floating-pointarithmetic functions, and C I/O functions that are supported by thecompiler.
Code Generation Tools
4-25Code Creation
� C++ Name Demangling Utility. The C++ compiler implements functionoverloading, operator overloading, and type-safe linking by encoding afunction’s signature in its link-level name. The process of encoding thesignature into the linkname is often referred to as name mangling. Whenyou inspect mangled names, such as in assembly files or linker output, itcan be difficult to associate a mangled name with its corresponding namein the C++ source code. The C++ name demangler is a debugging aid thattranslates each mangled name it detects to its original name found in theC++ source code.

Building Your Code Composer Studio Project
4-26
4.5 Building Your Code Composer Studio Project
4.5.1 From Code Composer Studio
To build and run a program, follow these steps:
TIP: You can use the supplied “timake.exe” utility to build a project from theDOS shell.
Step 1: Choose Project→Rebuild All or click the Rebuild All toolbar button.All the files in your project are recompiled, reassembled, andrelinked. Messages about this process are shown in a frame at thebottom of the window.
Step 2: By default, the .out file is built into a debug directory located underyour current project folder. To change this location, select a differentone from the toolbar.
Step 3: Choose File→Load Program. Select the program you just rebuilt, and click Open. The program is loaded onto the target DSP and opens aDis-Assembly window that shows the disassembled instructions thatmake up the program. (Notice that a tabbed area at the bottom of thewindow is automatically opened. It shows the output that theprogram sends to stdout.)
Step 4: Choose View→Mixed Source/ASM. This allows you to simultaneously view your c source and theresulting assembly code .
Step 5: Click on an assembly instruction in the mixed-mode window. (Clickon the actual instruction, not the address of the instruction or thefields passed to the instruction.)
Press the F1 key. The Code Composer Studio IDE searches for helpon that instruction. This is a good way to get help on an unfamiliarassembly instruction.
Step 6: Choose Debug→Go Main to begin execution from the main function.The execution halts at Main.
Step 7: Choose Debug→Run or click the Run toolbar button to run theprogram.
Step 8: Choose Debug→Halt to quit running the program.

Building Your Code Composer Studio Project
4-27Code Creation
4.5.2 External Make
Code Composer Studio supports the use of external makefiles (*.mak) and anassociated external make utility for project management and build processcustomization.
To build a program using a makefile, a project must be created that wraps themakefile. After a project is associated with the makefile, the project and itscontents can be displayed in the Project View window and the Project→Buildand Project→Rebuild All commands can be used to build the program.
Step 1: Double-click on the name of the makefile in the Project View windowto open the file for editing.
Step 2: Modify your makefile build commands and options.
Special dialogs enable you to modify the makefile build commandsand makefile options. The normal Build Options dialogs are notavailable when working with makefiles.
Multiple configurations can be created, each with its own build commands andoptions.
Limitations and Restrictions
Source files can be added to or removed from the project in the Project View.However, changes made in the Project View do not change the contents of themakefile. These source files do not affect the build process nor are theyreflected in the contents of the makefile. Similarly, editing the makefile doesnot change the contents in the Project View. File-specific options for sourcefiles that are added in the Project View are disabled. The Project→CompileFile command is also disabled. However, when the project is saved, thecurrent state of the Project View is preserved.
4.5.3 Command Line
Using the timake utility from the command line
The timake.exe utility located in the <install dir>\cc\bin directory provides away to build projects (*.pjt) outside of the Code Composer Studio environmentfrom a command prompt. This utility can be used to accomplish batch builds.
To invoke the timake Utility:
Step 1: Open a DOS Command prompt
Building Your Code Composer Studio Project
4-28
Step 2: Set up the necessary environment variables by running the batch fileDos-Run.bat. This batch file must be run before using timake. If youinstalled the Code Composer Studio product in c:\CCStudio, thebatch file is located at:
C:\CCStudio\DosRun.bat
Step 3: Run the timake utility.
Please refer to the online help topic Using the timake Utility for moreinformation.
Makefiles
In addition to the option of using external makefiles within the Code ComposerStudio IDE, you can also export standard Code Composer Studio project file(*.pjt) to a standard makefile that can be built from the command line using anystandard make utility. Code Composer Studio comes with a standard makeutility (gmake) that can be run after running the DosRun.bat file.
To Export a Code Composer Studio Project to a Standard Makefile
Step 1: Make the desired project active by selecting the project name fromtheSelect Active Project dropdown list on the Project toolbar.
Step 2: Select Project Export to Makefile.
Step 3: In the Exporting <filename>.pjt dialog box, specify the configurationsto export, the default configuration, the host operating system foryour make utility, and the file name for the standard makefile.
Step 4: Click OK to accept yor selections and generate a standard makefule.
Pleae refer to the online help topic, Exporting a Project to a Makefile.
Available Foundation Software
4-29Code Creation
4.6 Available Foundation Software
4.6.1 DSP/BIOS
DSP/BIOS is a scalable real-time kernel, designed specifically for theTMS320C5000 , TMS320C2000, and TMS320C6000 DSP platforms.DSP/BIOS enables you to develop and deploy sophisticated applicationsmore quickly than with traditional DSP software methodologies and eliminatesthe need to develop and maintain custom operating systems or control loops.Because multithreading enables real-time applications to be cleanlypartitioned, an application using DSP/BIOS is easier to maintain and newfunctions can be added without disrupting real-time respnse. DSP/BIOSprovides standardized APIs across C2000, C5000, and C6000 DSP platformsto support rapid application migration.
4.6.2 CSL
The Chip Support Library(CSL) provides C-program functions to configureand control on-chip peripherals. It is intended to simplify the process of runningalgorithms in a real system. The goal is peripheral ease of use, shorteneddevelopment time, portability, hardware abstraction, and a small level ofstandardization and compatibility among devices.
4.6.2.1 Benefits of CSL
The CSL benefits you in the following ways:
� Standard Protocol to Program Peripherals
CSL provides a higher-level programming interface for each on-chipperipheral. This includes data types and macros to define peripheralregister configuration, and functions to implement the various operationsof each peripheral.
� Basic Resource Management
Basic resource management is provided through the use of open andclose functions for many of the peripherals. This is especially helpful forperipherals that support multiple channels.
� Symbol Peripheral Descriptions
As a side benefit to the creation of CSL, a complete symbolic description ofall peripheral registers and register fields has been created. It is suggestedthat you use the higher-level protocols described in the first two bullets, asthese are less device specific, making it easier to migrate your code tonewer versions of DSPs.

Available Foundation Software
4-30
4.6.3 BSL
The TMS320C6000 DSK Board Support Library (BSL) is a set of C-languageapplication programming interfaces (APIs) used to configure and control allon-board devices, which is intended to make it easier for developers to getalgorithms up and running in a real system. The BSL consists of discretemodules that are built and archived into a library file. Each module representsan individual API and is referred to simply as an API module. The modulegranularity is constructed such that each device is covered by a single APImodule except the I/O Port module, which is divided into two APU modules:LED and DIP.
4.6.3.1 Benefits of BSL
Some of the advantages offered by the BSL include: device ease of use, a levelof compatibility between devices, shortened development time, portability,some standardization, and hardare abstraction. In general, BSL makes iteasier for you to get yoru algorithms up and running in the shortest length oftime.
4.6.4 DSPLIB
The DSP Library (DSPLIB) includes many C-callable, assembly-optimized,general-purpose signal-processing and image/video processing routines.These routines are typically used in computationally intensive real-timeapplications where optimal execution speed is critical. By using these routines,you can achieve execution speeds considerably faster than equivalent codewritten in standard ANSI C language. In addition, by providing ready-to-useDSP and image/video processing functions, DSPLIB and IMGLIB cansignificantly shorten your application development time.
For more information on DSPLIB see:
� TMS320C54x DSP Library Programmer’s Reference (SPRU518)� TMS320C55x DSP Library Programmer’s Reference (SPRU422)� TMS320C62x DSP Library Programmer’s Reference (SPRU402)� TMS320C64x DSP Library Programmer’s Reference (SPRU565)

Available Foundation Software
4-31Code Creation
4.6.4.1 Benefits of DSPLIB
DSPLIB includes commonly used routines. Source code is provided thatallows you to modify functions to match your specific needs.
Features include:
� Optimized assembly code routines� C and linear assembly source code� C-callable routines fully compatible with the TI Optimizing C compiler� Benchmarks (cycles and code size)� Tested against reference C model
4.6.4.2 DSPLIB Functions Overview
DSPLIB provides a collection of C-callable high performance routines that canserve as key enablers for a wide range of signal and image/video processingapplications. These functions are representative of the high performancecapabilities of the C5000 and C6000 DSPs.
The routines contained in the DSPLIB are organized into the followingfunctional categories:
� Adaptive filtering� Correlation� FFT� Filtering and convolution� Math� Matrix functions� Miscellaneous
4.6.5 IMGLIB
The Image/Video Processing Library (IMGLIB) includes many C-callable,assembly-optimized, general-purpose signal-processing and image/videoprocessing routines. These routines are typically used in computationallyintensive real-time applications where optimal execution speed is critical. Byusing these routines, you can achieve execution speeds considerably fasterthan equivalent code written in standard ANSI C language. In addition, byproviding ready-to-use DSP and image/video processing functions, DSPLIBand IMGLIB can significantly shorten your application development time.
Available Foundation Software
4-32
For more information on IMGLIB see:
� TMS32C55x Imaging/Video Processing Library Programmer’s ReferenceGuide (SPRU037)
� TMS320C62x Image/Video Processing Library Programmer’s Reference(SPRU400)
� TMS320C64x Image/Video Processing Library Programmer’s Reference(SPRU023).
4.6.5.1 Benefits of IMGLIB
IMGLIB includes commonly used routines. Source code is provided thatallows you to modify functions to match your specific needs.
Features include:
� Optimized assembly code routines� C and linear assembly source code� C-callable routines fully compatible with the TI Optimizing C compiler� Benchmarks (cycles and code size)� Tested against reference C model
4.6.5.2 IMGLIB Functions Overview
IMGLIB provides a collection of C-callable high performance routines that canserve as key enablers for a wide range of signal and image/video processingapplications. These functions are representative of the high performancecapabilities of the C6000 DSPs.
The set of software routines included in the IMGLIB (available for the C6000platform only) are organized into three different functional categories asfollows:
� Image/video compression and decompression� Image Analysis� Picture filtering/format conversions
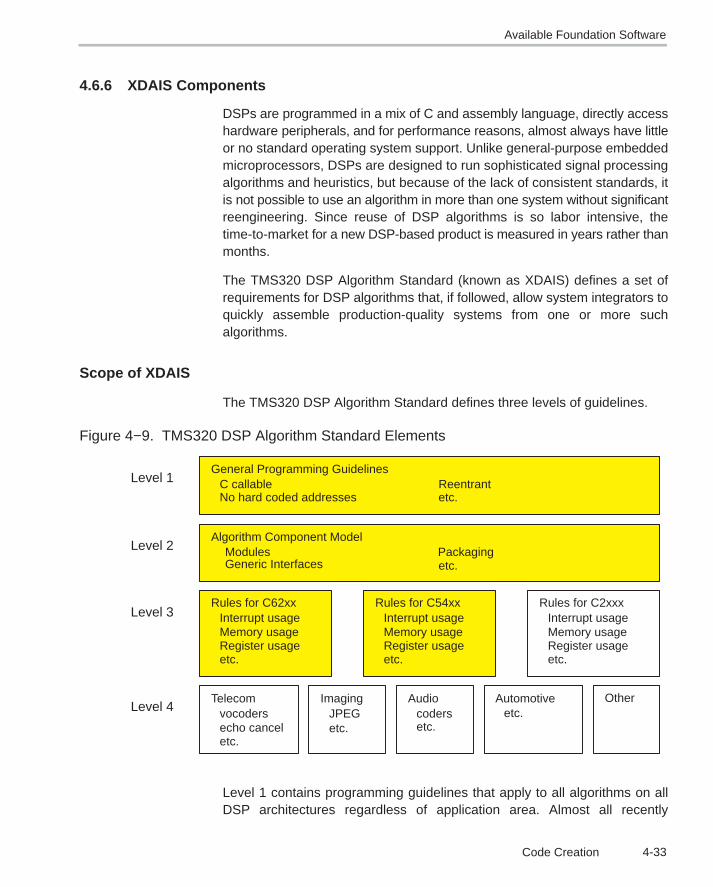
Available Foundation Software
4-33Code Creation
4.6.6 XDAIS Components
DSPs are programmed in a mix of C and assembly language, directly accesshardware peripherals, and for performance reasons, almost always have littleor no standard operating system support. Unlike general-purpose embeddedmicroprocessors, DSPs are designed to run sophisticated signal processingalgorithms and heuristics, but because of the lack of consistent standards, itis not possible to use an algorithm in more than one system without significantreengineering. Since reuse of DSP algorithms is so labor intensive, thetime-to-market for a new DSP-based product is measured in years rather thanmonths.
The TMS320 DSP Algorithm Standard (known as XDAIS) defines a set ofrequirements for DSP algorithms that, if followed, allow system integrators toquickly assemble production-quality systems from one or more suchalgorithms.
Scope of XDAIS
The TMS320 DSP Algorithm Standard defines three levels of guidelines.
Figure 4−9. TMS320 DSP Algorithm Standard Elements
Rules for C62xx
Level 1
Level 2
Interrupt usageLevel 3
Level 4
Memory usageRegister usageetc.
Telecomvocodersecho canceletc.
Rules for C54xxInterrupt usageMemory usageRegister usageetc.
Rules for C2xxxInterrupt usageMemory usageRegister usageetc.
ImagingJPEGetc.
Audiocodersetc.
Automotiveetc.
Other
Algorithm Component ModelModules PackagingGeneric Interfaces etc.
General Programming GuidelinesC callable ReentrantNo hard coded addresses etc.
Level 1 contains programming guidelines that apply to all algorithms on allDSP architectures regardless of application area. Almost all recently

Available Foundation Software
4-34
developed software modules follow these common sense guidelines already,so this level just formalizes them.
Level 2 contains rules and guidelines that enable all algorithms to operateharmoniously within a single system. Conventions are established for analgorithm’s use of data memory and names for external identifiers, as well assimple rules for how algorithms are packaged.
Level 3 contains the guidelines for specific families of DSPs. Today, there areno agreed-upon guidelines for algorithms with regard to the use of processorresources. These guidelines will provide guidance on the dos and don’ts forthe various architectures. There is always the possibility that deviations fromthese guidelines will occur, but then the algorithm vendor can explicitly drawattention to the deviation in the relevant documentation or module headers.
The shaded boxes in Figure 4−9 represent the areas that are covered in thisversion of the specification.
Level 4 contains the various vertical markets. Due to the inherently differentnature of each of these businesses, it seems appropriate for the stakeholdersin each of these markets to define the interfaces for groups of algorithms basedon the vertical market. If each unique algorithm were specified with aninterface, the standard would never be able to keep up and thus not beeffective. It is important to note that at this level, any algorithm that conformsto the rules defined in the top three levels is consideredeXpressDSP-compliant.
Rules and Guidelines
The TMS320 DSP Algorithm Standard specifies both rules and guidelines.Rules must be followed in order for software to be eXpressDSP-compliant.Guidelines, on the other hand, are strongly suggested recommendations thatshould be obeyed, but are not required, in order for software to beeXpressDSP-compliant.
Requirements of the Standard
The required elements of XDAIS:
� Algorithms from multiple vendors can be integrated into a single system.
� Algorithms are framework-agnostic. That is, the same algorithm can beefficiently used in virtually any application or framework.
� Algorithms can be deployed in purely static as well as dynamic run-timeenvironments.

Available Foundation Software
4-35Code Creation
� Algorithms can be distributed in binary form.
� Integration of algorithms does not require recompilation of the clientapplication; reconfiguration and relinking may be required however.
Goals of the Standard
The goals of XDAIS are:
� Easy to adhere to the standard� Possible to verify conformance to standard� Enable system integrators to easily migrate between TI DSPs� Enable host tools to simplify a system integrator’s tasks, including
configuration, performance modeling, standard conformance, anddebugging.
� Incur little or no “overhead” for static systems
4.6.7 Reference Frameworks
Reference Frameworks for eXpressDSP software are provided asstarterware for applications that use DSP/BIOS and the TMS320 DSPAlgorithm Standard. Developers first select the Reference Framework thatbest approximates their system and its future needs, and then adapt theframework and populate it with eXpressDSP-compliant algorithms. Ascommon elements such as device drivers, memory management, andchannel encapsulation are already pre-configured in the frameworks,developers can focus on their sys
Reference Frameworks contain design-ready, reusable, C language sourcecode for TMS320C5000 and TMS320C6000 digital signal processors(DSPs). Developers can build on top of the framework, confident that theunderlying pieces are robust and appropriate for the characteristics of thetarget application.
Reference Frameworks software and documentation are available fordownload from the TI website. It is not included in the Code Composer Studioinstallation.
Figure 4−10 shows the elements that make up a Reference Framework on thetarget DSP.

Available Foundation Software
4-36
abstractionChannel
Algorithmmanager
Framework components
eXpressDSPalg. 1
eXpressDSPalg. 2
Application level code
DSP/BIOS Chip support library
Device driver adapter
Device driver controller
TMS320 DSP hardware
Memorymanagementand overlays
Figure 4−10. Elements of a Reference Framework
Here are the elements, starting from the bottom up:
• Device controller and device adapter. The device drivers used in referenceframeworks are based on a standard driver model, which provides deviceadapters and specifies a standard device controller interface. If you haveunique external hardware, the device controller is likely to need customization,but the device adapter probably needs little or no modification.
• Chip Support Library (CSL). The device controller uses chip support librarymodules to support peripheral hardware.
• DSP/BIOS. This extensible software kernel is a good example of how eachreference framework leverages different amounts of the eXpressDSP
Available Foundation Software
4-37Code Creation
infrastructure, depending on its needs. The low-end RF1 framework usesrelatively few DSP/BIOS modules. In addition to providing an obvious footprintsavings, reducing the number of modules helps clarify design choices for adesigner who may not fully appreciate the ramifications of module selections.
• Framework Components. These elements provide overall system resourcemanagement, such as channel abstraction. Every reference framework needssome kind of channel management; but, design optimizations can be madebased on knowledge of the number of channels likely to be in use. For simplesystems with 1 to 3 channels, channel scheduling is handled with thelow-overhead DSP/BIOS HWI and IDL modules. For larger numbers ofchannels, it is wiser to use the SWI module, although it comes with some extrafootprint. For large systems with channels that change dynamically, the TSKmodule is most appropriate. In each reference framework, design decisionssuch as these let designers get systems running both more quickly and in theway most suited to the system.
Similar to channel managers are the algorithm managers, which manage somenumber of eXpressDSP-compliant algorithms. Other framework componentsare modules that handle memory overlay schemes—a critical technique in mostmemory constrained systems. Simply starting with the appropriate frameworksimplifies many choices that need to be made when developing from scratch.
• eXpressDSP-compliant Algorithms. Each algorithm follows the rules andguidelines of the TMS320 DSP Algorithm Standard Rules and Guidelines(SPRU352). To be compliant with the standard, algorithms must not directlyaccess any hardware peripherals and must implement standard resourcemanagement interfaces known as IALG (for memory management) andoptionally, IDMA (for DMA resource management). In the examples that TIprovides, the algorithms are generally simple ones like finite impulse response(FIR) filters and volume controllers. It is relatively easy to substitute moresignificant eXpressDSP-compliant algorithms for the TI-provided ones. It is thissubstitution that starts the process of making a generic reference frameworkapplication-specific.
• Application-level code. The last step is to modify the application-level code.This code applies unique and value-added application-specific knowledge,allowing for real product differentiation. Clearly the application code required fora single-channel MP3 player is quite different than that required for a digitalhearing aid.

Automation (for Project Management)
4-38
4.7 Automation (for Project Management)
4.7.1 Using General Extension Language (GEL)
The General Extension Language (GEL) is an interpretive language, similarto C, that lets you create functions to extend Code Composer Studio IDE’susefulness. You create your GEL functions by using the GEL grammar, andthen by loading them into Code Comoser Studio IDE. There is subset of GELfunctions that may be used to automate building of projects with CCStudioenvironment. Custom GEL menus may be created to automatically open andbuild a project.
Figure 4−11.GEL script to open volume project.
/* * Copyright 1998 by Texas Instruments Incorporated. * All rights reserved. Property of Texas InstrumentsIncorporated. * Restricted rights to use, duplicate or disclose thiscode are * granted through contract. *//* * ======== PrjOpen.gel ======== * Simple gel file to demonstrate project managmentcapabilities of GEL */
menuitem ”MyProjects”
hotmenu OpenVolume(){ // Open Volume tutorial example GEL_ProjectLoad(”C:\\ti\\tutorial\\sim55xx\\volume1\\volume.pjt”); // Set currently active configuration to debug GEL_ProjectSetActiveConfig(”c:\\ti\\tutorial\\sim55xx\\volume1\\volume.pjt”, ”Debug”); // Build the project. GEL_ProjectBuild(); }
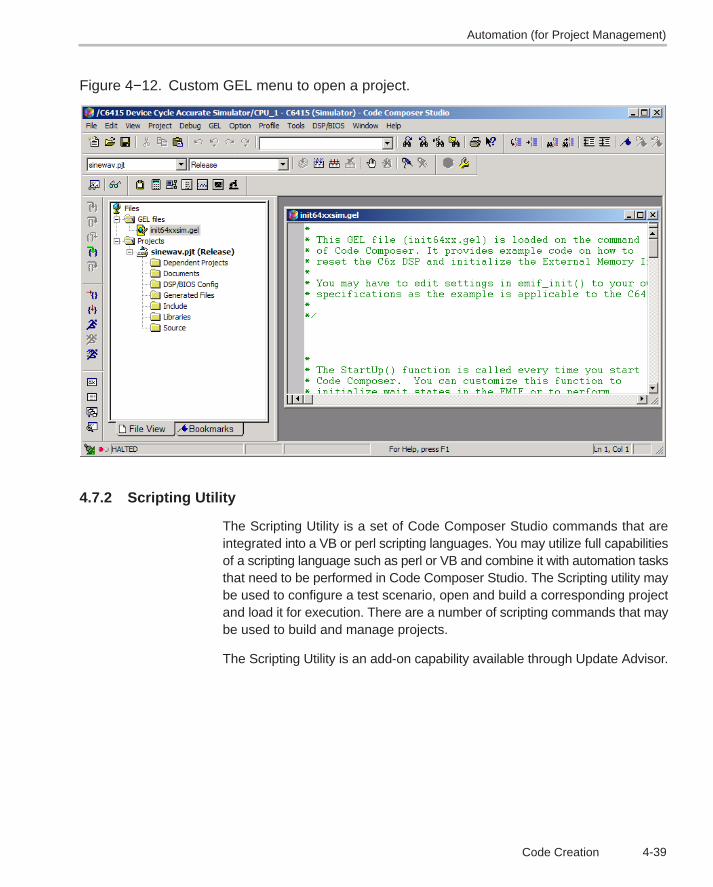
Automation (for Project Management)
4-39Code Creation
Figure 4−12. Custom GEL menu to open a project.
4.7.2 Scripting Utility
The Scripting Utility is a set of Code Composer Studio commands that areintegrated into a VB or perl scripting languages. You may utilize full capabilitiesof a scripting language such as perl or VB and combine it with automation tasksthat need to be performed in Code Composer Studio. The Scripting utility maybe used to configure a test scenario, open and build a corresponding projectand load it for execution. There are a number of scripting commands that maybe used to build and manage projects.
The Scripting Utility is an add-on capability available through Update Advisor.
5-1
�����
This chapter applies to all platforms using Code Composer Studio IDE.However, not all devices have access to all of the tools discussed in thischapter. For a complete listing of the tools available to you, see the online helpand online documentation provided with the Code Composer Studio IDE.
The Code Composer Studio IDE comes with a number of tools that help youdebug your programs. This chapter discusses these tools and shows you howto use them.
Topic Page
5.1 Setting Up Your Environment for Debug 5-2. . . . . . . . . . . . . . . . . . . . . . . .
5.2 Basic Debugging 5-16. . . . . . . . . . . . . . . . . . . . . . . . . . . . . . . . . . . . . . . . . . . . .
5.3 Advanced Debugging Features 5-34. . . . . . . . . . . . . . . . . . . . . . . . . . . . . . . .
5.4 Real-Time Debugging 5-40. . . . . . . . . . . . . . . . . . . . . . . . . . . . . . . . . . . . . . . .
5.5 Automation (for Debug) 5-49. . . . . . . . . . . . . . . . . . . . . . . . . . . . . . . . . . . . . .
5.6 Target Reset 5-50. . . . . . . . . . . . . . . . . . . . . . . . . . . . . . . . . . . . . . . . . . . . . . . . .
Chapter 5
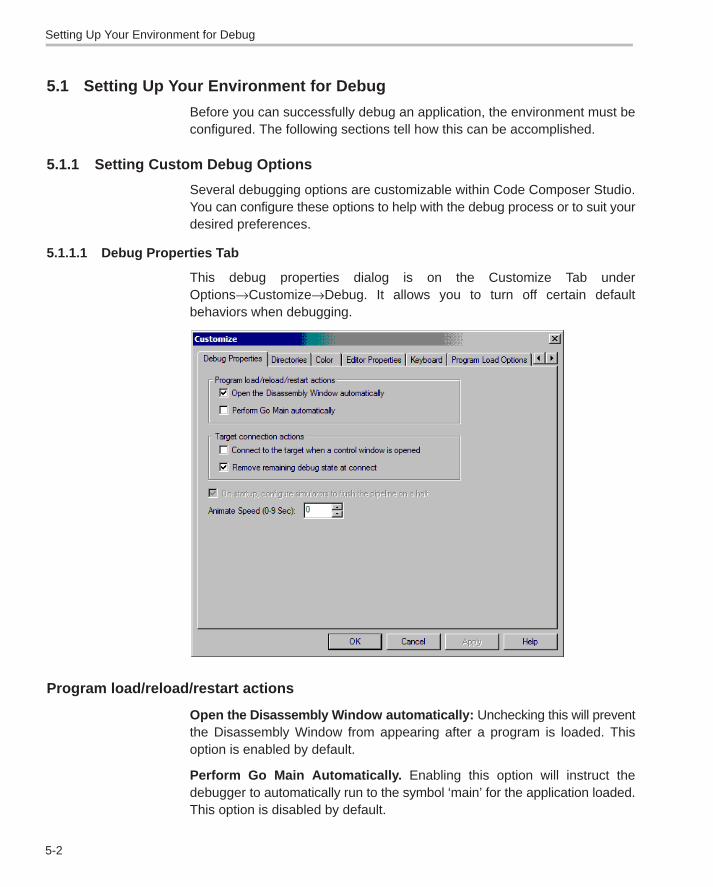
Setting Up Your Environment for Debug
5-2
5.1 Setting Up Your Environment for Debug
Before you can successfully debug an application, the environment must beconfigured. The following sections tell how this can be accomplished.
5.1.1 Setting Custom Debug Options
Several debugging options are customizable within Code Composer Studio.You can configure these options to help with the debug process or to suit yourdesired preferences.
5.1.1.1 Debug Properties Tab
This debug properties dialog is on the Customize Tab underOptions→Customize→Debug. It allows you to turn off certain defaultbehaviors when debugging.
Program load/reload/restart actions
Open the Disassembly W indow automatically: Unchecking this will preventthe Disassembly Window from appearing after a program is loaded. Thisoption is enabled by default.
Perform Go Main Automatically. Enabling this option will instruct thedebugger to automatically run to the symbol ‘main’ for the application loaded.This option is disabled by default.
Setting Up Your Environment for Debug
5-3Debug
Target Connection actions
Connect to the Target When a Contr ol Window is Opened: Control Windowsimply refers to the entire IDE interface for Code Composer Studio. You canhave multiple instances of this open when running PDM+. You can turn this offwhen you are experiencing target connection problems or don’t need theactual target to be connected (i.e., when writing source code, etc.). This optionis disabled by default.
Remove Remaining Debug State at Connect. When Code ComposerStudio disconnects from the target, it typically tries to remove breakpoints bydefault. If for some reason there are errors when trying to remove breakpoints,Code Composer Studio will try again to remove breakpoints whenreconnecting to the target. However, this second attempt to removebreakpoints can potentially put some targets into a bad state. For this reason,users are urged to disable this second attempt to remove breakpoints whenreconnecting. To disable this second attempt, uncheck this option.
Animation Speed. Animation Speed is the minimum time (in seconds)between breakpoints. Program execution does not resume until the minimumtime has expired since the previous breakpoint. See section 5.2.1 for moredetails.
5.1.1.2 Directories
To open up the source file where the application is halted, the debugger needsits location. The debugger includes source path information for:
� All the files in a project that is open in the project view
� Files in the current directory
� Paths specified by the user to Code Composer Studio
The paths specified to Code Composer Studio by the user are empty bydefault. Thus, if the application being debugged has used source files that arenot in the two former options, then the path to these files need to be specified.If not, the debugger will not be able to automatically open the file whenexecution halts at a location that references that source file (but will prompt theuser to manually find it). A common example of source files not being part ofthe open project is when including libraries in a build.
The Directories dialog box enables you to specify additional search paths thatthe debugger uses to find the source files included in a project.
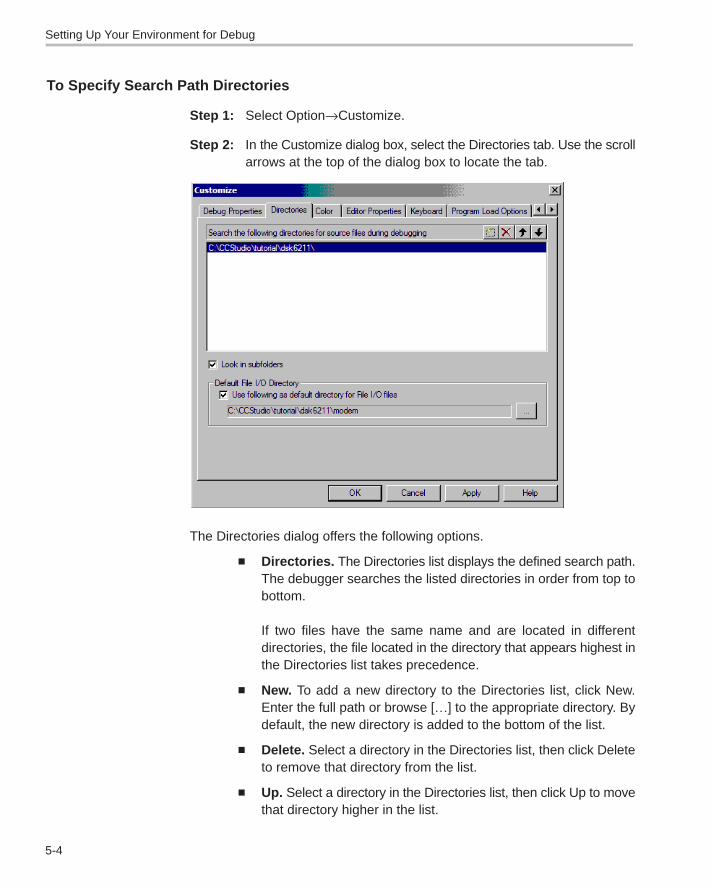
Setting Up Your Environment for Debug
5-4
To Specify Search Path Directories
Step 1: Select Option→Customize.
Step 2: In the Customize dialog box, select the Directories tab. Use the scrollarrows at the top of the dialog box to locate the tab.
The Directories dialog offers the following options.
� Directories. The Directories list displays the defined search path.The debugger searches the listed directories in order from top tobottom.
If two files have the same name and are located in differentdirectories, the file located in the directory that appears highest inthe Directories list takes precedence.
� New. To add a new directory to the Directories list, click New.Enter the full path or browse […] to the appropriate directory. Bydefault, the new directory is added to the bottom of the list.
� Delete. Select a directory in the Directories list, then click Deleteto remove that directory from the list.
� Up. Select a directory in the Directories list, then click Up to movethat directory higher in the list.
Setting Up Your Environment for Debug
5-5Debug
� Down. Select a directory in the Directories list, then click Down tomove that directory lower in the list.
� Look in subfolders. You can instruct the debugger to search inthe subfolders of the listed paths by enabling the Look insubfolders option.
� Default File I/O directory. In addition to setting source filedirectories, you can now set a default directory for File I/O files.Simply enable the Default File I/O directory option and then usethe browse button to find the path you wish to select as the defaultdirectory.
Step 3: Click OK to exit the Customize dialog box.
5.1.1.3 Program Load Options
The Program Load dialog box enables you to select actions that will occurautomatically when you load a program or load symbols.
To Set Program Load Options
Step 1: Select Option→Customize.
Step 2: In the Customize dialog box, select the Program Load Options tab.
The Program Load Options dialog offers the following options.
� Perform verification after Program Load. By default, thischeckbox is selected. This means that Code Composer Studiowill verify (by reading back selected memory) that the programwas loaded correctly. If you remove the check from this option, thisverification will not be performed.
� Load Program After Build. When this option is selected, theexecutable is loaded immediately upon building the project. Thisensures that the target contains the most up-to-date symbolicinformation generated after a build.
� Open Dependent Projects When Loading Projects. By default,if your program has subprojects upon which a main project isdependent, all the subprojects are opened along with the mainproject. If this option is disabled, then the subprojects will not beopened.
� Do Not Scan Dependencies When Loading Projects. Todetermine which files must be compiled during an incrementalbuild, the project must maintain a list of include file dependencies

Setting Up Your Environment for Debug
5-6
for each source file. A dependency tree is created whenever youbuild a project. To create the dependency tree, all the source filesin the project list are recursively scanned for #include, .include,and .copy directives, and each included file name is added to theproject list. By default, when a project is opened, all files in theproject are scanned for dependencies. If this option is disabled, itwill not automatically scan for dependencies upon opening aproject. This may result in quicker times for opening a project.
� Do Not Set CIO Breakpoint At Load. By default, if your programhas been linked using a TI runtime library (rts*.lib), a C I/Obreakpoint (C$$IO$$) is set when the program is loaded. Thisoption enables you to choose not to set the C I/O breakpoint.
The C I/O breakpoint is necessary for the normal operation of CI/O library functions such as printf and scanf. The C I/O breakpointis not needed if your program does not execute CIO functions.
When C I/O code is loaded in RAM, Code Composer Studio sets asoftware breakpoint. However, when C I/O code is loaded inROM, Code Composer Studio uses a hardware breakpoint. Sincemost processors support only a small number of hardwarebreakpoints, using even one can have a significant impact whendebugging.
Note: You can also avoid using the hardware breakpoint when CI/O code is loaded in ROM by embedding a breakpoint in yourcode and renaming the label C$$IO$$ to C$$IOE$$ to indicatethat this is an embedded breakpoint.
� Do Not Set End of Program Breakpoint At Load. By default, ifyour program has been linked using a TI runtime library (rts*.lib),an End of Program breakpoint (C$$EXIT) is set when the programis loaded. This option allows you to choose not to set the End ofProgram breakpoint.
The End of Program breakpoint is used to halt the processor whenyour program exits following completion. The End of Programbreakpoint is not needed if your program executes an infinite loop.
When End of Program code is loaded in RAM, Code ComposerStudio sets a software breakpoint. However, when End ofProgram code is loaded in ROM, Code Composer Studio uses ahardware breakpoint. Since most processors support only a small
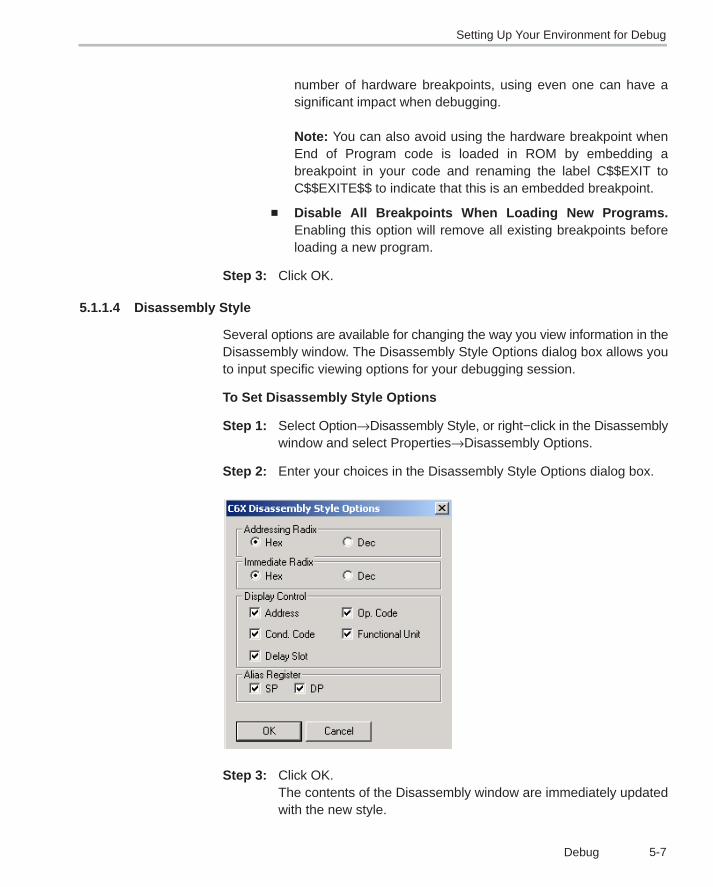
Setting Up Your Environment for Debug
5-7Debug
number of hardware breakpoints, using even one can have asignificant impact when debugging.
Note: You can also avoid using the hardware breakpoint whenEnd of Program code is loaded in ROM by embedding abreakpoint in your code and renaming the label C$$EXIT toC$$EXITE$$ to indicate that this is an embedded breakpoint.
� Disable All Breakpoints When Loading New Programs.Enabling this option will remove all existing breakpoints beforeloading a new program.
Step 3: Click OK.
5.1.1.4 Disassembly Style
Several options are available for changing the way you view information in theDisassembly window. The Disassembly Style Options dialog box allows youto input specific viewing options for your debugging session.
To Set Disassembly Style Options
Step 1: Select Option→Disassembly Style, or right−click in the Disassemblywindow and select Properties→Disassembly Options.
Step 2: Enter your choices in the Disassembly Style Options dialog box.
Step 3: Click OK.The contents of the Disassembly window are immediately updatedwith the new style.
Setting Up Your Environment for Debug
5-8
5.1.1.5 Default File I/O Directory
In addition to setting source file directories, you can now set a default directoryfor File I/O files. Simply enable the Default File I/O Directory option and thenuse the browse button to find the path you wish to select as the defaultdirectory.
5.1.2 Simulation
Debugging on simulation may require additional steps in order to configure thesimulator to behave closer to the actual HW target.
5.1.2.1 Memory Mapping
The memory map tells the debugger which areas of memory it can and cannotaccess. Memory maps vary depending on the application.
When a memory map is defined and memory mapping is enabled, thedebugger checks every memory access against the memory map. Thedebugger will not attempt to access an area of memory that is protected by thememory map
When the debugger compares memory accesses against the memory map,it performs this checking in software, not hardware. The debugger cannotprevent your program from attempting to access nonexistent memory.
Memory Mapping with Simulation
The simulator utilizes pre-defined memory map ranges to allow the mostgeneric representation of valid memory settings for DSP targets beingsimulated. The memory map settings can be altered to some degree; however,this is not a recommended practice as simulator performance may be affectedif extensive changes to valid memory ranges are employed.
Using the Debugger
The memory map can be defined interactively while using the debugger. Thiscan be inconvenient because, in most cases, you will set up up one memorymap before you begin debugging, and will then use this memory map for allother debugging sessions.

Setting Up Your Environment for Debug
5-9Debug
To Add a New Memory Map Range
Step 1: Select Option→Memory Map.
Note that the memory map can be chnaged externally
and these settings can be overridden.
Step 2: If your actual or simulated target memory configuration supportsmultiple pages, the Memory Map dialog box contains a separate tabfor each type of memory page (e.g., Program, Data, and I/O). Selectthe appropriate tab for the type of memory that you want to modify.Tabs do not appear for processors that have only one memory page.
The Memory Map dialog offers the following options.
� Enable Memory Mapping. Make sure that the Enable MemoryMapping checkbox is checked. Otherwise, all addressablememory (RAM) on your target is assumed to be valid by thedebugger.
� Starting Address. Enter the start address of the new memoryrange in the Starting Address input field.
� Length. Enter the length of the new memory range in the Lengthinput field.
� Attributes . Select the read/write characteristics of the newmemory range in the Attributes field.

Setting Up Your Environment for Debug
5-10
� Access Size (bits). Specify the access size for your targetprocessor. You can select an access size from the drop−down list,or you can type a value in the Access Size field.
It is not necessary to specify a size for processors that supportonly one access size.
� Volatile Memory. Normally, a write access consists of Read,Modify, and Write operations. When the Volatile Memory option isset on a segment of memory, any write access to that memory iscompleted by using only a Write operation.
� Memory Map List. Displays the list of memory−mapped ranges.
� Add. Click the Add button to add the new memory range to theMemory Map List.
� Delete. In the Memory Map List, select the memory map rangethat you want to delete and click the Delete button.
You can also delete an existing memory map range by changingthe Attributes field to “None − No Memory/Protected”. This meansyou can neither read nor write to this memory location.
� Reset. Resets the default values in the Memory Map List.
Step 3: Click Done to accept your selections.
The debugger allows you to enter a new memory range that overlaps existingones. The new range is assumed to be valid, and the overlapped range’sattributes are changed accordingly.
After you have defined a memory map, you may wish to modify its read/writeattributes. You can do this by defining a new memory map (with the sameStarting Address and Length) and clicking the Add button. The debuggeroverwrites the existing attributes with the new ones.

Setting Up Your Environment for Debug
5-11Debug
Using GEL
The memory map can also be defined using the general extension language(GEL) built-in functions. GEL provides a complete set of memory-mappingfunctions. The easiest method of implementing a memory map is to put thememory−mapping functions in a GEL text file and execute the GEL file at startup.
When you first invoke Code Composer Studio, the memory map is turned off.You can access any memory location; the memory map does not interfere. Ifyou invoke Code Composer Studio with an optional GEL filename specified asa parameter, the Gel file is automatically loaded. If the file contains the GELfunction StartUp(), the GEL functions in the file are executed. You can specifyGEL mapping functions in this file to automatically define the memory mappingrequirements for your environment.
Use the following GEL functions to define your memory map:
GEL_MapAdd() Memory map add
GEL_MapDelete() Memory map delete
GEL_MapOn() Enable memory map
GEL_MapOff() Disable memory map
GEL_MapReset() Reset memory map
The GEL_MapAdd() function defines a valid memory range and identifies theread/write characteristics of the memory range. The following is a sample ofa GEL file that can be used to define two blocks of length 0xF000 that are bothreadable and writeable:
StartUp()
{
GEL_MapOn();
GEL_MapReset();
GEL_MapAdd(0, 0, 0xF000, 1, 1);
GEL_MapAdd(0, 1, 0xF000, 1, 1);
}
When you have set up your memory map, you can use the Option→MemoryMap command to view it.
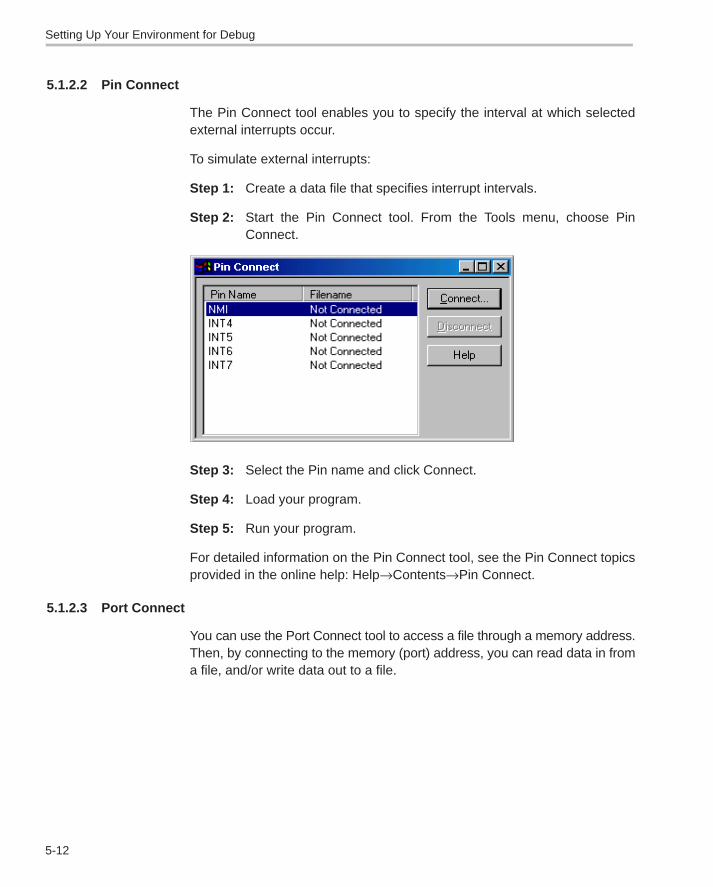
Setting Up Your Environment for Debug
5-12
5.1.2.2 Pin Connect
The Pin Connect tool enables you to specify the interval at which selectedexternal interrupts occur.
To simulate external interrupts:
Step 1: Create a data file that specifies interrupt intervals.
Step 2: Start the Pin Connect tool. From the Tools menu, choose PinConnect.
Step 3: Select the Pin name and click Connect.
Step 4: Load your program.
Step 5: Run your program.
For detailed information on the Pin Connect tool, see the Pin Connect topicsprovided in the online help: Help→Contents→Pin Connect.
5.1.2.3 Port Connect
You can use the Port Connect tool to access a file through a memory address.Then, by connecting to the memory (port) address, you can read data in froma file, and/or write data out to a file.

Setting Up Your Environment for Debug
5-13Debug
To connect a memory (port) address to a data file, follow these steps:
Step 1: From the Tools menu, select Port Connect.
This action displays the Port Connect window and starts the PortConnect tool.
Step 2: Click the Connect button.
This action opens the Connect dialog box.
Step 3: In the Port Address field, enter the memory address.
This parameter can be an absolute address, any C expression, thename of a C function, or an assembly language label. If you want tospecify a hex address, be sure to prefix the address number with 0x;otherwise, it is treated as a decimal address.
Step 4: In the Length field, enter the length of the memory range.
The length can be any C expression.
Setting Up Your Environment for Debug
5-14
Step 5: In the Page field (C5000 only), choose type of memory (program ordata) that the address occupies:
To identify this page. . . use this value.
Program memory Prog
Data memory Data
I/O space I/O
Step 6: In the Type field, select the Write or Read radio button, dependingon whether you want to read data from a file or write data to a file.
Step 7: Click OK.
This action displays the Open Port File window.
Step 8: Select the data file to which you want to connect and click Open.
Step 9: Select the No Rewind feature to prohibit the file from being rewindedwhen the end-of-file (EOF) is reached. For read accesses made afterEOF, the value 0xFFFFFFFF is read and the file pointer is keptunchanged.
The file is accessed during an assembly language read or write of theassociated memory address. Any memory address can be connected to a file.A maximum of one input and one output file can be connected to a singlememory address; multiple addresses can be connected to a single file.
For detailed information on the Port Connect tool, see the Port Connect topicsprovided in the online help: Help→Contents→Port Connect.
5.1.3 Program Load
The COFF file (*.out) produced by building your program must be loaded ontothe actual or simulated target board prior to execution.
Program code and data are downloaded onto the target at the addressesspecified in the COFF file.
Symbols are loaded into a symbol table maintained by the debugger on thehost. The symbols are loaded at the code and data addresses specified in theCOFF file.
A COFF file can be loaded by selecting File→Load Program...from the mainmenu and then using the Load Program dialog box to select the desired COFFfile.
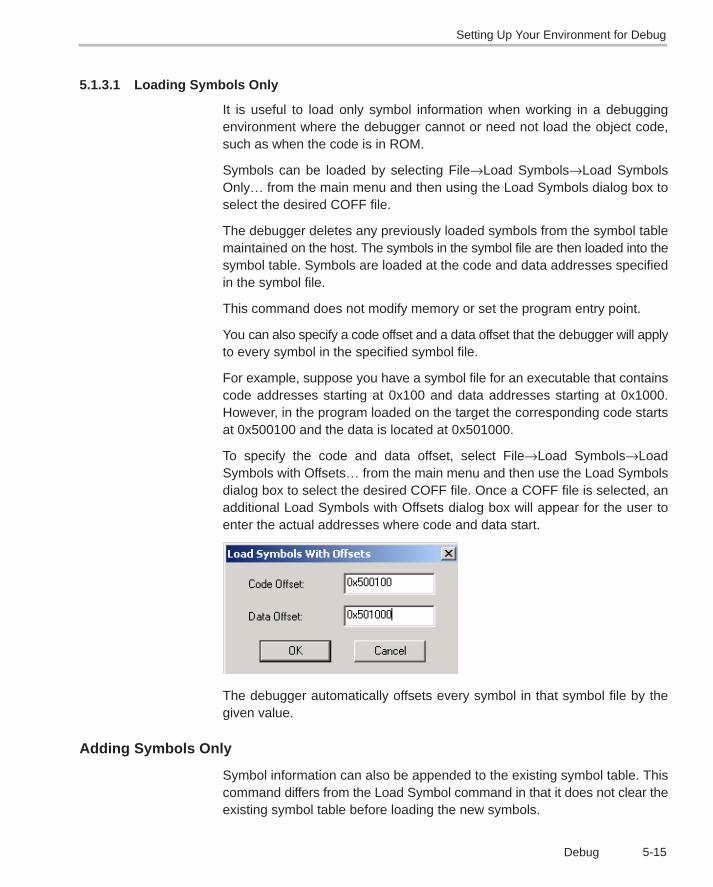
Setting Up Your Environment for Debug
5-15Debug
5.1.3.1 Loading Symbols Only
It is useful to load only symbol information when working in a debuggingenvironment where the debugger cannot or need not load the object code,such as when the code is in ROM.
Symbols can be loaded by selecting File→Load Symbols→Load SymbolsOnly… from the main menu and then using the Load Symbols dialog box toselect the desired COFF file.
The debugger deletes any previously loaded symbols from the symbol tablemaintained on the host. The symbols in the symbol file are then loaded into thesymbol table. Symbols are loaded at the code and data addresses specifiedin the symbol file.
This command does not modify memory or set the program entry point.
You can also specify a code offset and a data offset that the debugger will applyto every symbol in the specified symbol file.
For example, suppose you have a symbol file for an executable that containscode addresses starting at 0x100 and data addresses starting at 0x1000.However, in the program loaded on the target the corresponding code startsat 0x500100 and the data is located at 0x501000.
To specify the code and data offset, select File→Load Symbols→LoadSymbols with Offsets… from the main menu and then use the Load Symbolsdialog box to select the desired COFF file. Once a COFF file is selected, anadditional Load Symbols with Offsets dialog box will appear for the user toenter the actual addresses where code and data start.
The debugger automatically offsets every symbol in that symbol file by thegiven value.
Adding Symbols Only
Symbol information can also be appended to the existing symbol table. Thiscommand differs from the Load Symbol command in that it does not clear theexisting symbol table before loading the new symbols.

Basic Debugging
5-16
The steps for adding symbol information, with (File→Load Symbols→LoadSymbols with Offsets…) or without offsets (File→Load Symbols→LoadSymbols Only…), is similar to the steps outlined above for loading symbols.
5.2 Basic Debugging
Several components are available and many times necessary for basicdebugging in the Code Composer Studio IDE. The chart below provides a listof the icons used for debugging; they will be used throughout this chapter.
Step into (source mode)
Step over (source mode)
Step into (assembly mode)
Step out (assembly mode)
Step out (source and assembly mode)
Sync run
Sync halt
Animate
Toggle breakpoint
Toggle probe point
Expression

Basic Debugging
5-17Debug
5.2.1 Running/Stepping
Both source and assembly stepping are available only when the execution hasbeen halted. By accessing a mixed Source/ASM mode through View→MixedSource/ASM, you can view both source and assembly code simultaneously.
There are three types of stepping.
1) Step-Into executes one single statement and then execution is halted.
2) Step-Over executes the function and then halts after the function returns.
3) Step-Out executes the current subroutine and then returns to the callingfunction. Execution is then halted after returning to the calling function.
5.2.1.1 Source Stepping
Source stepping steps through the lines of code displayed on your sourceeditor.
5.2.1.2 Assembly Stepping
Assembly stepping steps through the lines of instructions that can bedisplayed on your dis-assembly window.
Run
The following commands allow you to run the program.
� Main − You can begin your debugging at main by Debug→GoMain. This action will take your execution to your main function.
� Run − After execution has been halted, you can continue to run bypressing the run button.
� Run to Cursor − If you want the program to run to a specificlocation, you can simply place the cursor at the said location andthen pressing this button .
� Set PC to Cursor − You can also set the program counter to acertain location by placing the cursor at the location and thenpressing the button .
� Animate − This action runs the program until a breakpoint isencountered. At the breakpoint, execution stops and all windowsnot connected to any probe points are updated. Programexecution then resumes until the next breakpoint. You cananimate execution by pressing the button.
Basic Debugging
5-18
Note: Animate speed can be modified under the options menu,Customize... section.
� Halt − Lastly, you can halt execution at any time by pressing thehalt button .
5.2.1.3 Multiprocessor Broadcast Commands (PDM+ only)
When using the Parallel Debug Manager (PDM), all run/step commands arebroadcast to all target processors in the current group. If the device driversupports synchronous operation, each of the following commands issynchronized to start at the same time on each processor.
� You can use Step into to single step all processors that are not alreadyrunning.
� You can use Step Over to execute a step over on all processors that arenot already running.
� If all the processors are inside a subroutine, you can use Step Out toexecute the step-out command on all the processors that are not alreadyrunning.
� Sync Run sends a global run command to all processors that are notalready running.
� Sync Halt halts all processors simultaneously.
� Animate starts animating all the processors that are not already running.
5.2.2 Breakpoints
Breakpoints are essential components of any debugging session.
Breakpoints stop the execution of the program. While the program is stopped,you can examine the state of the program, examine or modify variables,examine the call stack, etc. Breakpoints can be set on a line of source codein an Editor window or a disassembled instruction in the Disassembly window.After a breakpoint is set, it can be enabled or disabled.
For breakpoints set on source lines it is necessary that there be an associatedline of dissassembly code. When compiler optimization is turned on, manysource lines cannot have breakpoints set. To see allowable lines, use mixedmode in the editor window.
Basic Debugging
5-19Debug
Note:
Code Composer Studio IDE tries to relocate a breakpoint to a valid line inyour source window and places a breakpoint icon in the selection margin be-side the line on which it locates the breakpoint. If an allowable line cannot bedetermined, it reports an error in the message window.
Note:
Code Composer Studio briefly halts the target whenever it reaches a probepoint. Therefore, the target application may not meet real-time deadlines ifyou are using probe points. At this stage of development, you are testing thealgorithm. Later, you can analyze real-time behavior using RTDX andDSP/BIOS.
Software Breakpoints
Breakpoints can be set in any Disassembly window or document windowcontaining C/C++ source code. There is no limit to the number of softwarebreakpoints that can be set, provided they are set at writable memory locations(RAM). Software breakpoints operate by modifying the target program to adda breakpoint instruction at the desired location.
The fastest way to set a breakpoint is to simply double-click on the desired lineof code.
Step 1: In a document window or Disassembly window, move the cursorover the line where you want to place a breakpoint.
Step 2: Double-click in the Selection Margin immediately preceding the linewhen you are in a document window.
In a Disassembly window, double-click on the desired line.
A breakpoint icon in the Selection Margin indicates that a breakpoint has beenset at the desired location.
The Toggle Breakpoint command and the Toggle Breakpoint button alsoenable you to quickly set and clear breakpoints.
Step 1: In a document window or Disassembly window, put the cursor in theline where you want to set the breakpoint.
Step 2: Right-click and select Toggle Breakpoint, or click its icon on theProject toolbar.

Basic Debugging
5-20
Hardware Breakpoints
Hardware breakpoints differ from software breakpoints in that they do notmodify the target program; they use hardware resources available on the chip.Hardware breakpoints are useful for setting breakpoints in ROM memory orbreaking on memory accesses instead of instruction acquisitions. Abreakpoint can be set for a particular memory read, memory write, or memoryread or write. Memory access breakpoints are not shown in the source ormemory windows.
Hardware breakpoints can also have a count, which determines the numberof times a location is encountered before a breakpoint is generated. If the countis 1, a breakpoint is generated every time. Hardware breakpoints cannot beimplemented on a simulated target.
To set a hardware breakpoint:
Step 1: Select Debug→Breakpoints. The Break/Probe Points dialog boxappears with the Breakpoints tab selected.
Step 2: In the Breakpoint type field, choose “H/W Break at location” forinstruction acquisition breakpoints or choose “Break on <bus><Read|Write|R/W>” at location for a memory access breakpoint.
Step 3: Enter the program or memory location where you want to set thebreakpoint. Use one of the following methods:
� For an absolute address, you can enter any valid C expression,the name of a C function, or a symbol name.
� Enter a breakpoint location based on your C source file. This isconvenient when you do not know where the C instruction islocated in the executable. The format for entering in a locationbased on the C source file is as follows: fileName linelineNumber.
Step 4: Enter the number of times the location is hit before a breakpoint isgenerated, in the Count field. Set the count to 1 if you wish to breakevery time.
Step 5: Click the Add button to create a new breakpoint. This causes a newbreakpoint to be created and enabled.
Step 6: Click OK.

Basic Debugging
5-21Debug
5.2.3 Probe Points
In this section, you add a probe point, which reads data from a file on your PC.Probe Points are a useful tool for algorithm development. You can use probepoints to:
� Transfer input data from a file on the host PC to a buffer on the target foruse by the algorithm.
� Transfer output data from a buffer on the target to a file on the host PC foranalysis.
� Update a window, such as a graph, with data.
More Information About Probe Points
Probe points are similar to breakpoints in that they both halt the target toperform their action. However, probe points differ from breakpoints in thefollowing ways:
� Probe Points halt the target momentarily, perform a single action, andresume target execution.
� Breakpoints halt the CPU until execution is manually resumed and causeall open windows to be updated.
� Probe points permit automatic file input or output to be performed;breakpoints do not.
This section shows how to use a probe point to transfer the contents of a PCfile to the target for use as test data. It also uses a breakpoint to update all theopen windows when the Probe Point is reached.
Step 1: Choose File→Load Program. Select filename.out, and click Open.
Step 2: Double-click on the filename.c file in the Project View.
Step 3: Put your cursor in a line of the main function to which you want to adda probe point.
Step 4: Click the Toggle Probe Point toolbar button.
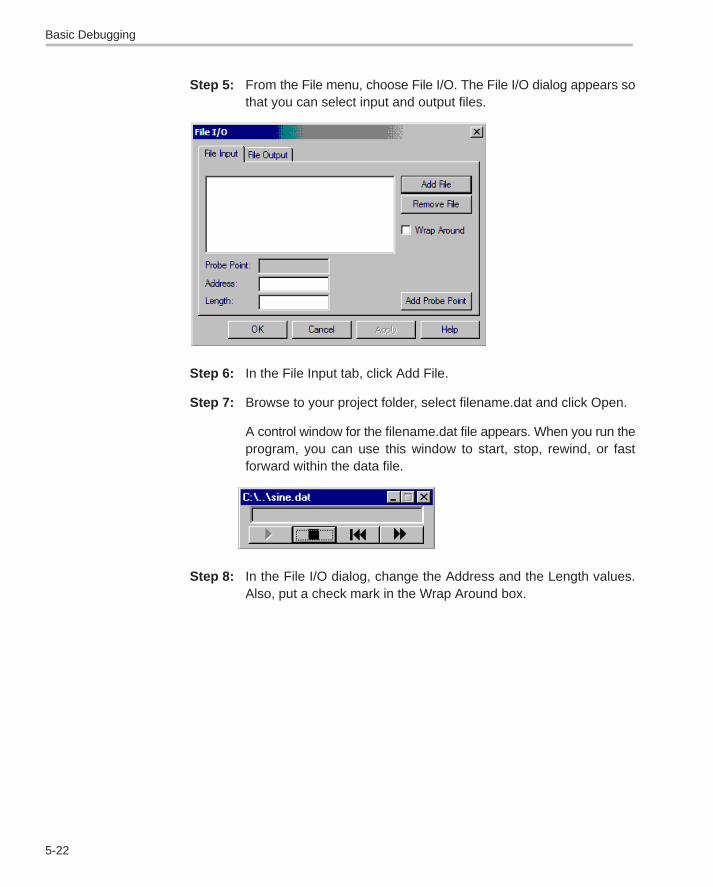
Basic Debugging
5-22
Step 5: From the File menu, choose File I/O. The File I/O dialog appears sothat you can select input and output files.
Step 6: In the File Input tab, click Add File.
Step 7: Browse to your project folder, select filename.dat and click Open.
A control window for the filename.dat file appears. When you run theprogram, you can use this window to start, stop, rewind, or fastforward within the data file.
Step 8: In the File I/O dialog, change the Address and the Length values.Also, put a check mark in the Wrap Around box.

Basic Debugging
5-23Debug
� The Address field specifies where the data from the file is to beplaced.
� The Length field specifies how many samples from the data fileare read each time the Probe Point is reached.
� The Wrap Around option enables the data to start being readfrom the beginning of the file when it reaches the end of the file.This allows the data file to be treated as a continuous stream ofdata.
Step 9: Click Add Probe Point. The Probe Points tab of the Break/ProbePoints dialog appears.
Step 10: In the Probe Point list, highlight a line.
Step 11: In the Connect To field, click the down arrow and select a file fromthe list.

Basic Debugging
5-24
Step 12: Click Replace. The Probe Point list changes to show that this ProbePoint is connected to the sine.dat file.
Step 13: Click OK. The File I/O dialog shows that the file is now connected toa Probe Point.
Step 14: Click OK to close the File I/O dialog.
5.2.4 Watch Window
When debugging a program, it is often helpful to understand how the value ofa variable changes during program execution. The Watch window allows youto monitor the values of local and global variables and C/C++ expressions.
To open the Watch window:
Step 1: Select View→Watch Window, or click the Watch Window button onthe Watch toolbar.
Open Quick WatchOpen the Watch window
The Watch window, contains two tabs labeled: Watch Locals and Watch.
� In the Watch Locals tab, the debugger automatically displays the Name,Value, and Type of the variables that are local to the currently executingfunction.
� In the Watch tab, the debugger displays the Name, Value, and Type of thelocal and global variables and expressions that you specify.
� For detailed information on the Watch Window, see the Watch Windowtopics provided in the online help: Help→Contents→Watch Window.
� When you are developing and testing programs, you often need to checkthe value of a variable during program execution. You use breakpoints andthe Watch Window to view such values.
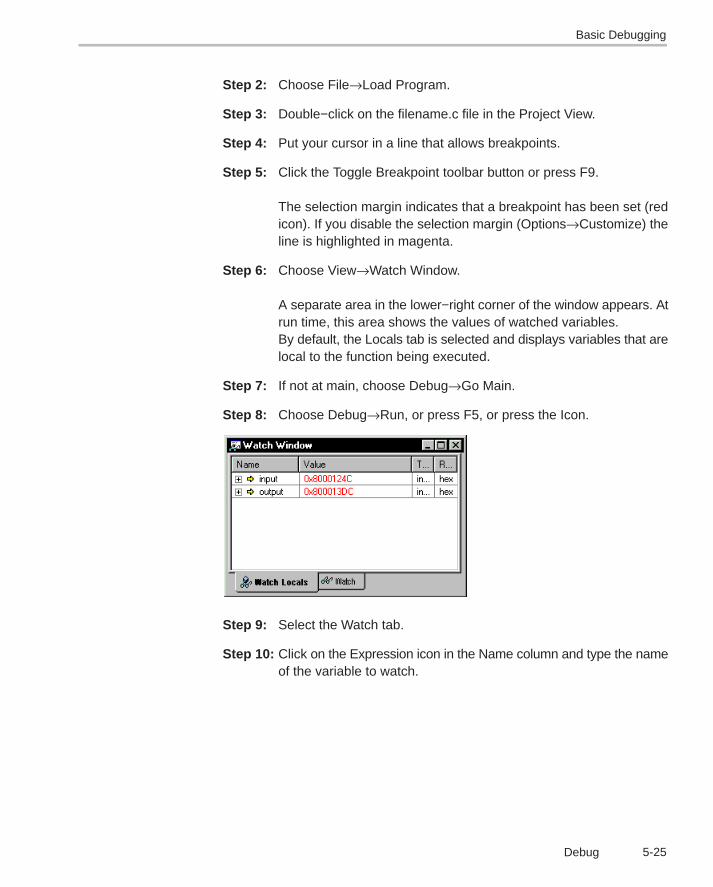
Basic Debugging
5-25Debug
Step 2: Choose File→Load Program.
Step 3: Double−click on the filename.c file in the Project View.
Step 4: Put your cursor in a line that allows breakpoints.
Step 5: Click the Toggle Breakpoint toolbar button or press F9.
The selection margin indicates that a breakpoint has been set (redicon). If you disable the selection margin (Options→Customize) theline is highlighted in magenta.
Step 6: Choose View→Watch Window.
A separate area in the lower−right corner of the window appears. Atrun time, this area shows the values of watched variables. By default, the Locals tab is selected and displays variables that arelocal to the function being executed.
Step 7: If not at main, choose Debug→Go Main.
Step 8: Choose Debug→Run, or press F5, or press the Icon.
Step 9: Select the Watch tab.
Step 10: Click on the Expression icon in the Name column and type the nameof the variable to watch.
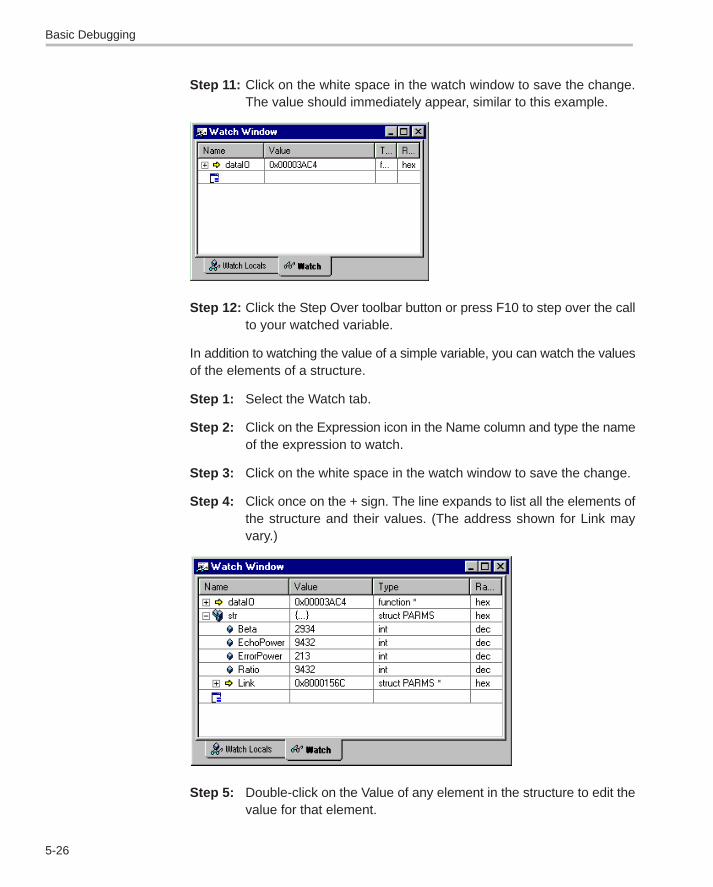
Basic Debugging
5-26
Step 11: Click on the white space in the watch window to save the change.The value should immediately appear, similar to this example.
Step 12: Click the Step Over toolbar button or press F10 to step over the callto your watched variable.
In addition to watching the value of a simple variable, you can watch the valuesof the elements of a structure.
Step 1: Select the Watch tab.
Step 2: Click on the Expression icon in the Name column and type the nameof the expression to watch.
Step 3: Click on the white space in the watch window to save the change.
Step 4: Click once on the + sign. The line expands to list all the elements ofthe structure and their values. (The address shown for Link mayvary.)
Step 5: Double-click on the Value of any element in the structure to edit thevalue for that element.

Basic Debugging
5-27Debug
Step 6: Change the value of a variable.
Notice that the value changes in the Watch Window. The value alsochanges color to red, indicating that you have changed it manually.
5.2.5 Memory Window
The Memory window allows you to view the contents of memory starting at aspecified address. Options enable you to format the Memory window display.You can also edit the contents of a selected memory location.
The Memory Window Options dialog box allows you to specify variouscharacteristics of the Memory window.
The Memory Window Options dialog offers the following options:
� Title. Enter a meaningful name for the Memory window. When theMemory window is displayed, the name appears in the title bar. Thisfeature is especially useful when multiple Memory windows aredisplayed.
Basic Debugging
5-28
� Address. Enter the starting address of the memory location youwant to view.
� Q Value. You can display integers using a Q value. This value isused to represent integer values as more precise binary values. Adecimal point is inserted in the binary value; its offset from theleast significant bit (LSB) is determined by the Q value as follows:
New_integer_value = integer / (2^(Q value))
A Q value of xx indicates a signed 2s complement integer whosedecimal point is displaced xx places from the least significant bit(LSB).
� Format. From the drop−down list, select the format of thememory display. More information on the different formats can befound in the on−line help.
� Enable Reference Buffer. Save a snapshot of a specified areaof memory that can be used for later comparison.
� Start Address. Enter the starting address of the memorylocations you want to save in the Reference Buffer. This field onlybecomes active when Enable Reference Buffer is selected.
� End Address. Enter the ending address of the memory locationsyou want to save in the Reference Buffer. This field only becomesactive when Enable Reference Buffer is selected.
� Update Reference Buffer Automatically. Select this checkboxto automatically overwrite the contents of the Reference Bufferwith the current contents of memory at the specified range ofaddresses. When this option is selected, the Reference Buffer isupdated whenever the Memory window is refreshed (for example,Refresh Window is selected, a breakpoint is hit, or execution onthe target is halted). If this checkbox is not selected, the contentsof the Reference Buffer are not changed. This option onlybecomes active when Enable Reference Buffer is selected.
� Bypass Cache Differences. This option forces the memory toalways read memory contents from physical memory. Normally, ifa memory’s contents were in cache, the returnedmemory valuewould display the value from cache, not from physicalmemory. Ifthis option is turned on, Code Composer Studio will ignore orbypass the cached memory contents.
� Highlight Cache Differences. This option highlights the value ofmemory locations when the cached value and physical value
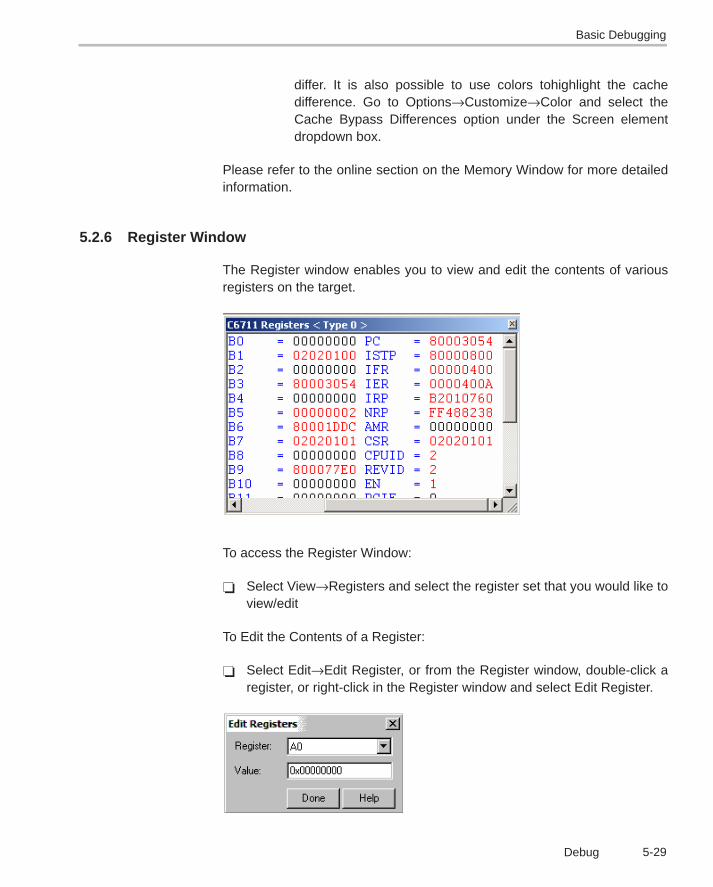
Basic Debugging
5-29Debug
differ. It is also possible to use colors tohighlight the cachedifference. Go to Options→Customize→Color and select theCache Bypass Differences option under the Screen elementdropdown box.
Please refer to the online section on the Memory Window for more detailedinformation.
5.2.6 Register Window
The Register window enables you to view and edit the contents of variousregisters on the target.
To access the Register Window:
� Select View→Registers and select the register set that you would like toview/edit
To Edit the Contents of a Register:
� Select Edit→Edit Register, or from the Register window, double-click aregister, or right-click in the Register window and select Edit Register.

Basic Debugging
5-30
5.2.7 Disassembly/Mixed Mode
Disassembly
When you load a program onto your actual or simulated target, the debuggerautomatically opens a Disassembly window.
The Disassembly window displays disassembled instructions and symbolicinformation needed for debugging. Disassembly reverses the assemblyprocess and allows the contents of memory to be displayed as assemblylanguage code. Symbolic information consists of symbols and strings ofalphanumeric characters that represent addresses or values on the target.
As you step through your program using the stepping commands, the PCadvances to the appropriate instruction. For the sections of your program codethat are written in C, you can choose to view mixed C source and assemblycode.
Mixed Mode
In addition to viewing disassembled instructions in the Disassembly window,the debugger enables you to view your C source code interleaved withdisassembled code, allowing you to toggle between source mode and mixedmode.
To change your selection, toggle View→Mixed Source/ASM; or right-click inthe source window and select Mixed Mode or Source Mode, depending onyour current selection.

Basic Debugging
5-31Debug
5.2.8 Call Stack
Use the Call Stack window to examine the function calls that led to the currentlocation in the program that you are debugging.
To Display the Call Stack:
Step 1: Select View→Call Stack, or click the View Stack button on the Debugtoolbar.
Step 2: Double-click on a function listed in the Call Stack window. Thesource code containing that function is displayed in a documentwindow. The cursor is set to the current line within the desiredfunction.
Once you select a function in the Call Stack window, you can observelocal variables that are within the scope of that function.
The call stack only works with C programs. Calling functions are determinedby walking through the linked list of frame pointers on the runtime stack. Yourprogram must have a stack section and a main function; otherwise, the callstack displays the message: C source is not available. Also note that the CallStack Window displays only the first 100 lines of output. Any amount of linesover 100 will be omitted from the display.
5.2.9 Symbol Browser
The Symbol Browser window (Figure 5−1) displays five tabbed windows:
� All associated files;� functions;� global variables;� types; and� labels of a loaded COFF output file (*.out).
Each tabbed window contains nodes representing various symbols. A plussign (+) preceding a node indicates that the node can be further expanded. To
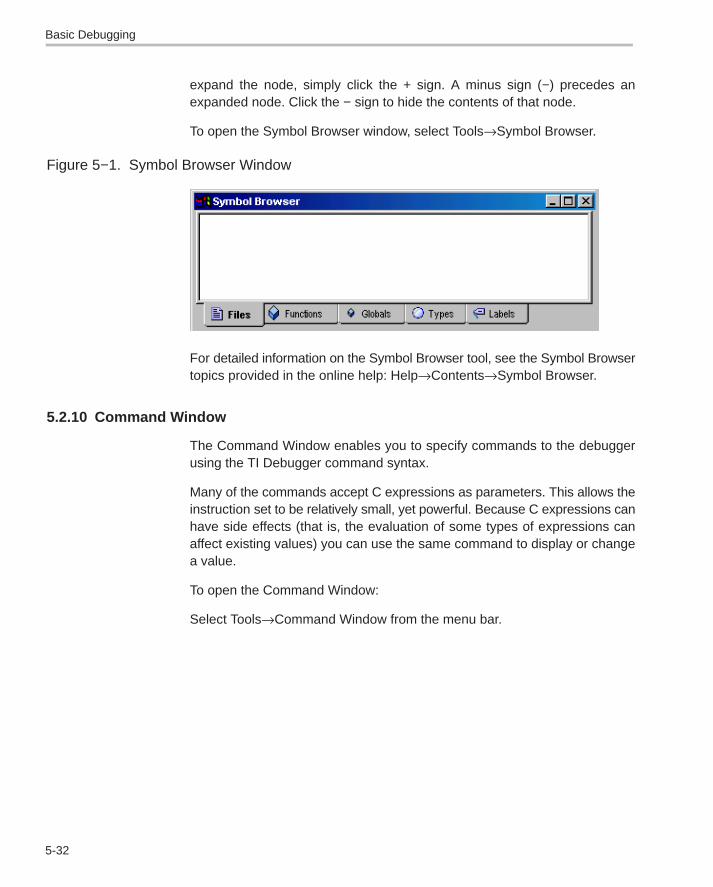
Basic Debugging
5-32
expand the node, simply click the + sign. A minus sign (−) precedes anexpanded node. Click the − sign to hide the contents of that node.
To open the Symbol Browser window, select Tools→Symbol Browser.
Figure 5−1. Symbol Browser Window
For detailed information on the Symbol Browser tool, see the Symbol Browsertopics provided in the online help: Help→Contents→Symbol Browser.
5.2.10 Command Window
The Command Window enables you to specify commands to the debuggerusing the TI Debugger command syntax.
Many of the commands accept C expressions as parameters. This allows theinstruction set to be relatively small, yet powerful. Because C expressions canhave side effects (that is, the evaluation of some types of expressions canaffect existing values) you can use the same command to display or changea value.
To open the Command Window:
Select Tools→Command Window from the menu bar.
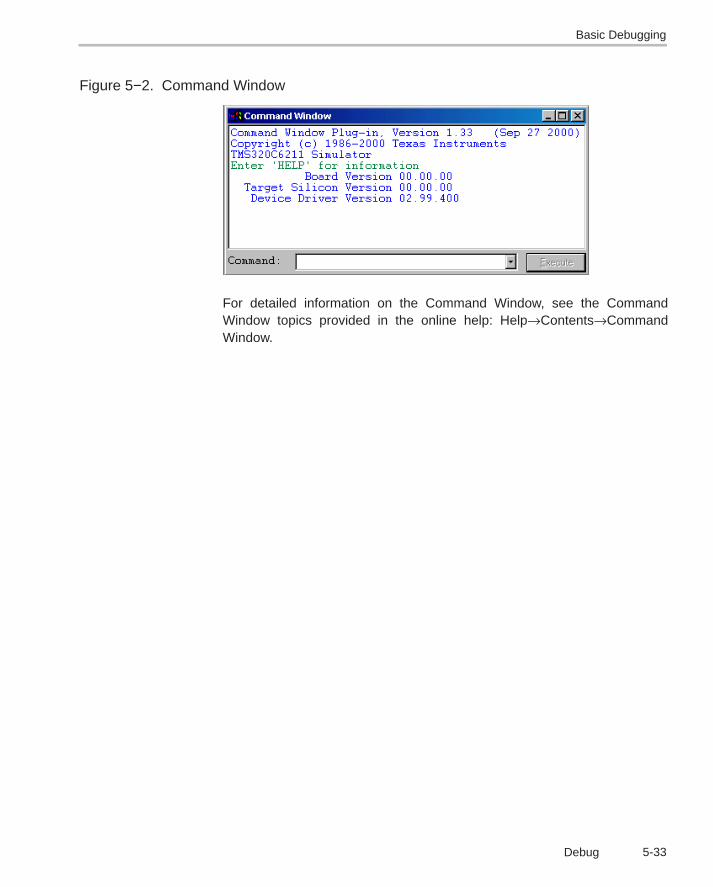
Basic Debugging
5-33Debug
Figure 5−2. Command Window
For detailed information on the Command Window, see the CommandWindow topics provided in the online help: Help→Contents→CommandWindow.
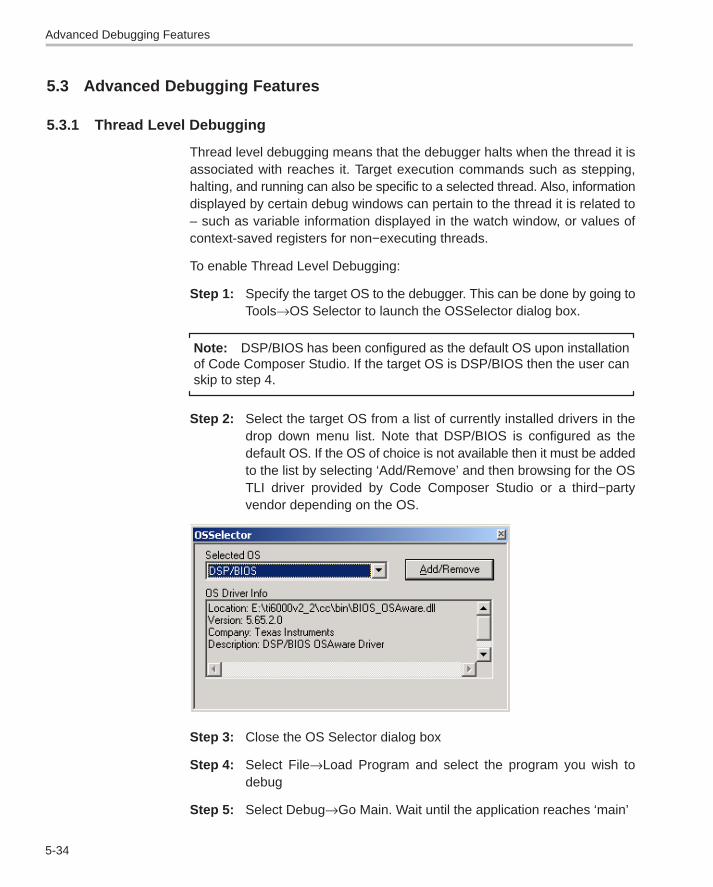
Advanced Debugging Features
5-34
5.3 Advanced Debugging Features
5.3.1 Thread Level Debugging
Thread level debugging means that the debugger halts when the thread it isassociated with reaches it. Target execution commands such as stepping,halting, and running can also be specific to a selected thread. Also, informationdisplayed by certain debug windows can pertain to the thread it is related to– such as variable information displayed in the watch window, or values ofcontext-saved registers for non−executing threads.
To enable Thread Level Debugging:
Step 1: Specify the target OS to the debugger. This can be done by going toTools→OS Selector to launch the OSSelector dialog box.
Note: DSP/BIOS has been configured as the default OS upon installationof Code Composer Studio. If the target OS is DSP/BIOS then the user canskip to step 4.
Step 2: Select the target OS from a list of currently installed drivers in thedrop down menu list. Note that DSP/BIOS is configured as thedefault OS. If the OS of choice is not available then it must be addedto the list by selecting ‘Add/Remove’ and then browsing for the OSTLI driver provided by Code Composer Studio or a third−partyvendor depending on the OS.
Step 3: Close the OS Selector dialog box
Step 4: Select File→Load Program and select the program you wish todebug
Step 5: Select Debug→Go Main. Wait until the application reaches ‘main’

Advanced Debugging Features
5-35Debug
Step 6: Select Debug→Enable Thread Level Debugging…
Thread Level Debugging has now been enabled for the debug session. Thedeveloper can now access the options under View→Threads.
The Threads menu will contain an alphabetical list of all tasks and SWI’s in thesystem. The list can include both statically and dynamically created threadsand the list can change depending on the creation and destruction of threadsin the system. The list is automatically updated whenever the target is halted.The Refresh Threads option will also refresh the list of threads. Selecting alisted thread for the first time will launch a Thread Control Window (TCW). Thesubsequent selections of the threads in the list will select the Thread ControlWindow of the thread. This is an easy way to switch between multiple ThreadControl Windows. There is also an option in the menu called Current Thread,which will allow for easy access to the current running thread.
The Thread Control Window is the main interface for debugging a particularthread. It has the same look and feel as the Main Control Window; however,
Advanced Debugging Features
5-36
it contains context information for the thread associated with a thread controlwindow. Debug commands and information are only in context of that thread.
More information on Task Control Windows and Task Level Debugging ingeneral can be found in the online help.
5.3.2 Advanced Event Triggering (AET)
Advanced Event Triggering (AET) is supported by a group of tools that makeshardware analysis easier than before. AET uses Event Analysis and EventSequencer to simplify hardware analysis.
Event Analysis uses a simple interface to help you configure commonhardware debug tasks called jobs. You can easily set breakpoints, actionpoints, and counters by using a right-click menu and performing a simpledrag-and-drop. You can access Event Analysis from the tools menu, or byright-clicking in a source file.
Event Sequencer allows you to look for conditions that you specify in yourtarget program and initiates specific actions when these conditions aredetected. While the CPU is halted, you define the conditions and actions, thenrun your target program. The sequence program then looks for the conditionyou specified and performs the action you requested.
Event Analysis
The following jobs can be performed using Event Analysis:
� Setting Breakpoints� Hardware Breakpoint� Hardware Breakpoint With Count� Chained Breakpoint� Global Hardware Breakpoint
� Setting Action/Watch Points� Data Actionpoint� Program Actionpoint� Watchpoint� Watchpoint With Data
� Setting Counters� Data Access Counter� Profile Counter� Watchdog Timer� Generic Counter
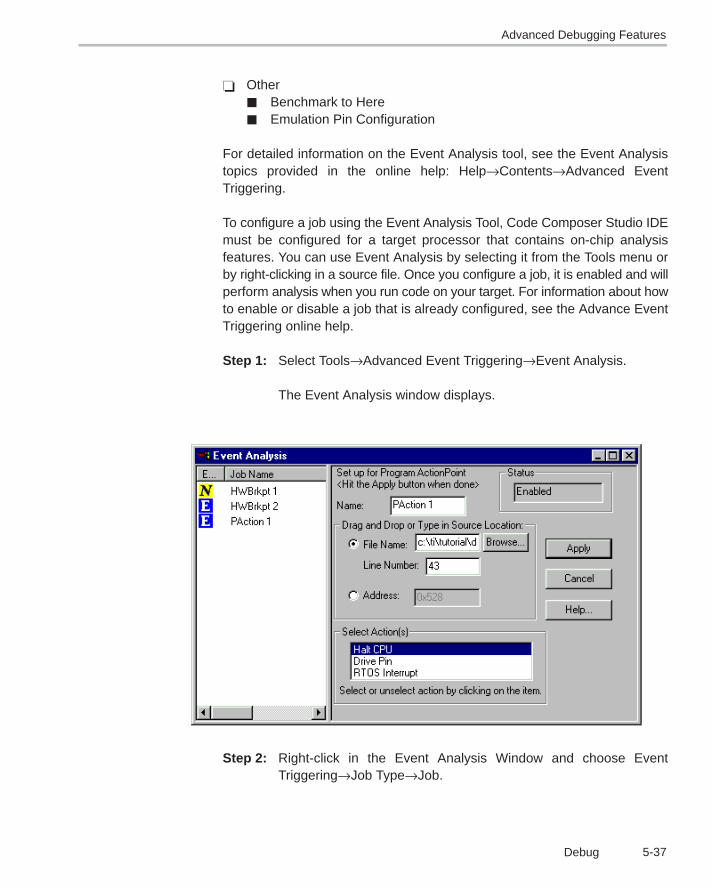
Advanced Debugging Features
5-37Debug
� Other� Benchmark to Here� Emulation Pin Configuration
For detailed information on the Event Analysis tool, see the Event Analysistopics provided in the online help: Help→Contents→Advanced EventTriggering.
To configure a job using the Event Analysis Tool, Code Composer Studio IDEmust be configured for a target processor that contains on-chip analysisfeatures. You can use Event Analysis by selecting it from the Tools menu orby right-clicking in a source file. Once you configure a job, it is enabled and willperform analysis when you run code on your target. For information about howto enable or disable a job that is already configured, see the Advance EventTriggering online help.
Step 1: Select Tools→Advanced Event Triggering→Event Analysis.
The Event Analysis window displays.
Step 2: Right-click in the Event Analysis Window and choose EventTriggering→Job Type→Job.

Advanced Debugging Features
5-38
The job menu is dynamically built and dependent on the targetconfiguration. If a job is not supported on your target, the job isgrayed out.
Step 3: Type your information in the Job dialog box.
Step 4: Click Apply to program the job and save your changes.
Event Sequencer
The Event Sequencer allows you to look for conditions that you specify in yourtarget program and initiates specific actions when these conditions aredetected. While the CPU is halted, you define the actions, then run your targetprogram. The sequencer program then looks for the condition that youspecified and performs the action you requested.
To use the Event Sequencer, Code Composer Studio IDE must be configuredfor a target processor that contains on-chip analysis features. You can use theEvent Sequencer by selecting it from the Tools menu. Once you create anEvent Sequencer program, it is enabled and performs analysis when you runcode on your target. For information on creating an Event Sequencer program,see the Advanced Event Triggering online help.
To enable the Event Sequencer:
Step 1: Select Tools→Advanced Event Triggering→Event Sequencer.
The Event Sequencer window displays.
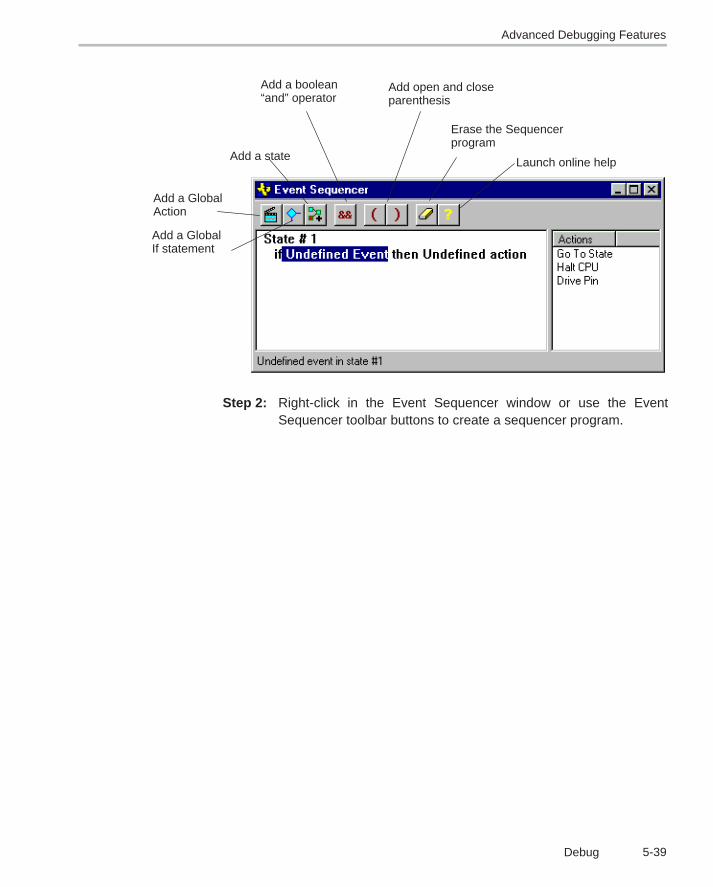
Advanced Debugging Features
5-39Debug
Add a GlobalAction
Add a GlobalIf statement
Add a state
Add a boolean“and” operator
Add open and closeparenthesis
Erase the Sequencerprogram
Launch online help
Step 2: Right-click in the Event Sequencer window or use the EventSequencer toolbar buttons to create a sequencer program.

Real-Time Debugging
5-40
5.4 Real-Time Debugging
Traditional debugging approaches (Stop Mode) require that programmerscompletely halt their system, which stops all threads and prevents interruptsfrom being handled. Stop Mode can exclusively be used for debug as long asthe system/application does not have any real-time constraints. Howeverthere will be times when the developer will want a better gauge of theirapplication’s real-world system behavior. Code Composer Studio offersseveral options to help with this effort.
5.4.1 Real−Time Mode
Real-Time Mode debug support provides a better gauge of real−world systembehavior by enabling programmers to halt and examine the application whileallowing user specified time critical interrupts to be handled. You can suspendprogram execution in multiple locations, which allows you to break within onetime−critical interrupt while still servicing others.
Enabling Real-Time Mode Debug:
Step 1: Select Debug→Real-Time Mode. The status bar at the bottom of theCode Composer Studio window now indicates POLITE REALTIME.
Step 2: Configure the real−time refresh options by selectingView→Real-Time Refresh Options…
Configure the options if desired. The first option will specify how often theWatch Window is updated. Checking the Global Continuous Refreshcheckbox will continuously refresh all windows that display target data,including memory/graph/watch windows. To continuously update only acertain window, uncheck this box and select Continuous Refresh from thewindow’s context menu.
Step 3: Click OK to close the dialog box.

Real-Time Debugging
5-41Debug
Step 4: Select View→Registers→CPU Registers to open the CPU RegisterDisplay.
The DIER is used to designate a single, a specific subset, or allinterrupts that are user selected via the IER as Real-Time(time-critical) interrupts. DIER mirrors the architecturally specifiedInterrupt Enable Register (IER)
Step 5: Right-click on a register and select Edit Register… and enter the newregister value that will specify which interrupts to designateinterrupts as real−time interrupts:
Step 6: Click Done to close the Edit Registers dialog box.
Step 7: Code Composer Studio has been configured for Real-Time Modedebug.
Rude Real−Time Mode
High priority interrupts, or other sections of code can be extremely time-critical,and the number of cycles taken to execute them must be kept at a minimumor to an exact number. This means debug actions (both execution control andregister/memory accesses) may need to be prohibited in some code areas ortargeted at a specific machine state. In real-time mode, by default theprocessor runs in ‘polite’ mode by absence of privileges, i.e., debug actionswill respect the appropriate delaying of the action and not intrude in the debugsensitive windows.
However, debug commands (both execution control and register/memoryaccess) can fail if they are not able to find a window that is not marked debugaction-sensitive. In order to have the debugger gain control, you must changereal−time debug from ‘polite’ to ‘rude’ mode. In rude real-time mode, thepossession of privileges allows a debug action to override any protection that
Real-Time Debugging
5-42
may prevent debug access and be executed successfully without delay. Also,the user can not debug critical code regions until they are switched into rudereal−time mode.
To enable Rude Real-Time mode, perform one of the following:
� Select Perform a Rude Retry from the display window when a debugcommand failed.
� Select Enable Rude Real-Time Mode from Debug menu when Real-Timeis turned on.
When Rude Real-Time is enabled, the status bar at the bottom of the mainprogram window displays RUDE REALTIME. To disable Rude Real-Time,deselect the Enable Rude Real-Time Mode item in the Debug menu. Thestatus bar now reads POLITE REALTIME.
If Rude Real-Time is enabled and you halt the CPU, there is a good chancethat the CPU will halt even when debug accesses are blocked, which might bewithin a time-critical ISR. This prevents the CPU from completing that ISR inthe appropriate amount of time, as the CPU cannot do anything until yourespond to the breakpoint. To prevent this problem, you must switch back toPolite real-time mode by deselecting Enable Rude Real-Time Mode.
Please refer to the online help section Debugging→Real Time Debugging formore detailed information on Real-Time Mode.
5.4.2 Real-Time Data Exchange (RTDX)
DSP/BIOS Real-Time Analysis (RTA) facilities utilize the Real-Time DataExchange (RTDX) link to obtain and monitor target data in real-time. You canutilize the RTDX link to create your own customized interfaces to the DSPtarget by using the RTDX API Library.
Real-time data exchange (RTDX) allows system developers to transfer databetween a host computer and target devices without interfering with the targetapplication. This bi-directional communication path provides for datacollection by the host as well as host interaction with the running targetapplication. The data collected from the target may be analyzed and visualizedon the host. Application parameters may be adjusted using host tools, withoutstopping the application. RTDX also enables host systems to provide datastimulation to the target application and algorithms.
RTDX consists of both target and host components. A small RTDX softwarelibrary runs on the target application. The target application makes functioncalls to this library’s API in order to pass data to or from it. This library makes
Real-Time Debugging
5-43Debug
use of a scan-based emulator to move data to or from the host platform via aJTAG interface. Data transfer to the host occurs in real-time while the targetapplication is running.
On the host platform, an RTDX Host Library operates in conjunction with CodeComposer Studio IDE. Data visualization and analysis tools communicate withRTDX through COM APIs to obtain the target data and/or to send data to theDSP application.
The host library supports two modes of receiving data from a targetapplication: continuous and non-continuous. In Continuous mode, the data issimply buffered by the RTDX Host Library and is not written to a log file.Continuous mode should be used when the developer wants to continuouslyobtain and display the data from a target application, and does not need tostore the data in a log file. In Non Continuous mode, data is written to a log fileon the host. This mode should be used when developers want to capture afinite amount of data and record it in a log file.
For details on using RTDX, see the Help→Contents→RTDX orHelp→Tutorial→RTDX Tutorial.
RTDX Data Flow
RTDX forms a two-way data pipe between a target application and a hostclient. This data pipe consists of a combination of hardware and softwarecomponents as shown below.
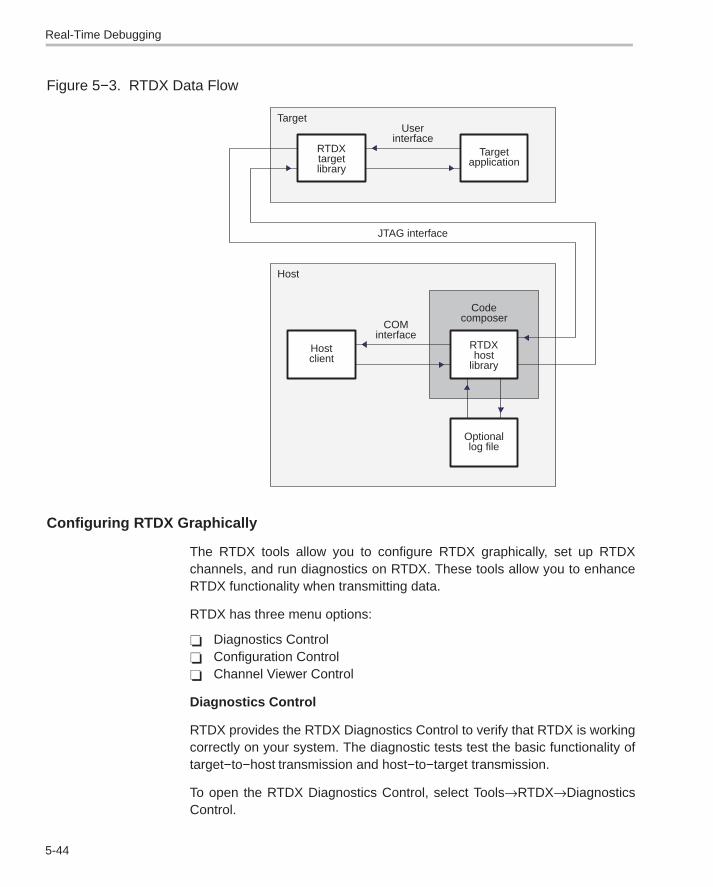
Real-Time Debugging
5-44
Figure 5−3. RTDX Data Flow
Userinterface
RTDX
libraryhost
Codecomposer
Hostclient
interfaceCOM
Target
Host
JTAG interface
RTDXtargetlibrary
Targetapplication
log fileOptional
Configuring RTDX Graphically
The RTDX tools allow you to configure RTDX graphically, set up RTDXchannels, and run diagnostics on RTDX. These tools allow you to enhanceRTDX functionality when transmitting data.
RTDX has three menu options:
� Diagnostics Control� Configuration Control� Channel Viewer Control
Diagnostics Control
RTDX provides the RTDX Diagnostics Control to verify that RTDX is workingcorrectly on your system. The diagnostic tests test the basic functionality oftarget−to−host transmission and host−to−target transmission.
To open the RTDX Diagnostics Control, select Tools→RTDX→DiagnosticsControl.
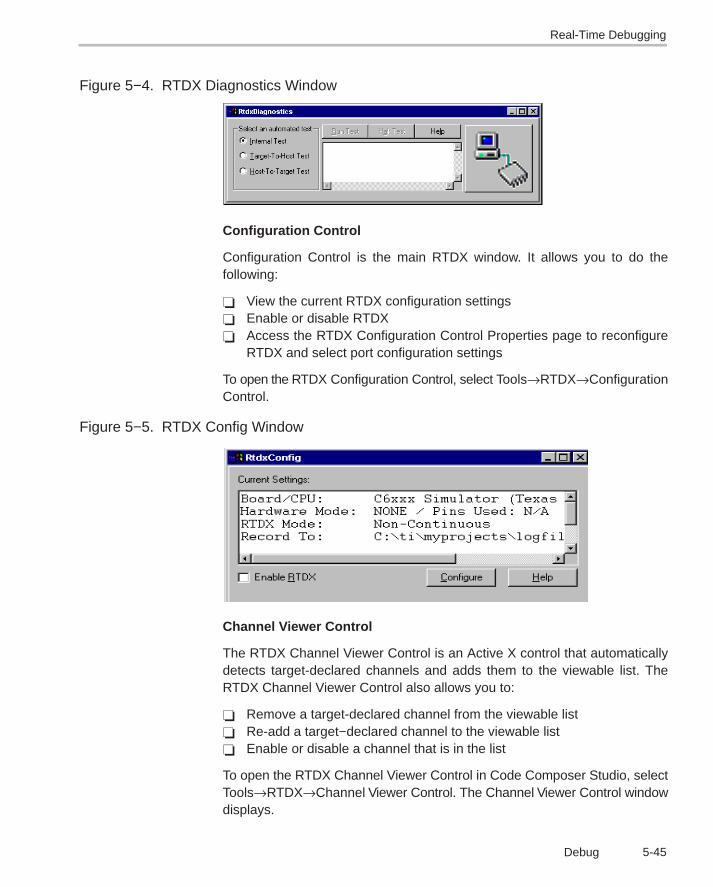
Real-Time Debugging
5-45Debug
Figure 5−4. RTDX Diagnostics Window
Configuration Control
Configuration Control is the main RTDX window. It allows you to do thefollowing:
� View the current RTDX configuration settings� Enable or disable RTDX� Access the RTDX Configuration Control Properties page to reconfigure
RTDX and select port configuration settings
To open the RTDX Configuration Control, select Tools→RTDX→ConfigurationControl.
Figure 5−5. RTDX Config Window
Channel Viewer Control
The RTDX Channel Viewer Control is an Active X control that automaticallydetects target-declared channels and adds them to the viewable list. TheRTDX Channel Viewer Control also allows you to:
� Remove a target-declared channel from the viewable list� Re-add a target−declared channel to the viewable list� Enable or disable a channel that is in the list
To open the RTDX Channel Viewer Control in Code Composer Studio, selectTools→RTDX→Channel Viewer Control. The Channel Viewer Control windowdisplays.
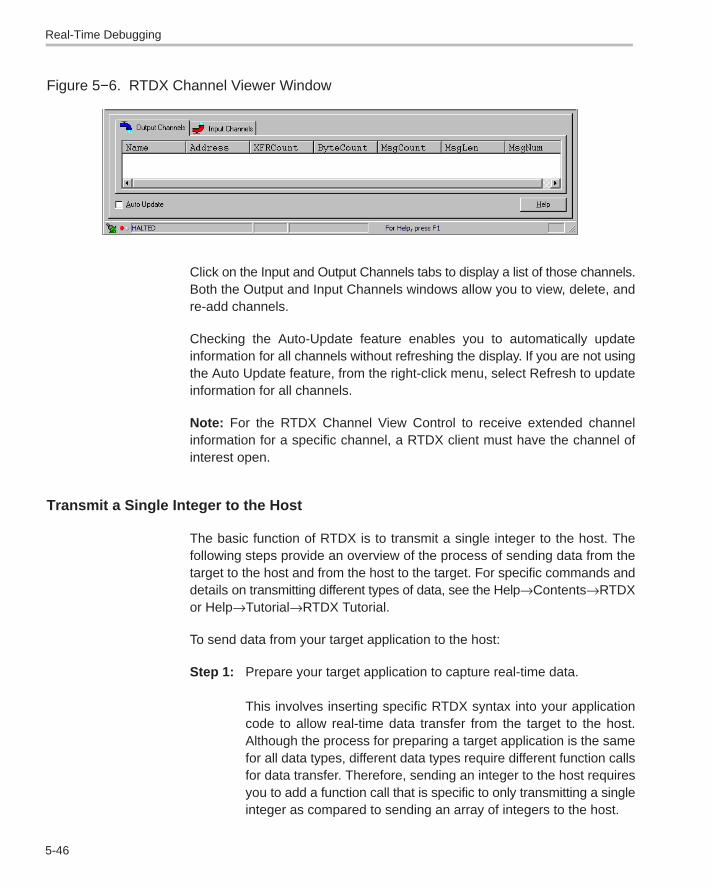
Real-Time Debugging
5-46
Figure 5−6. RTDX Channel Viewer Window
Click on the Input and Output Channels tabs to display a list of those channels.Both the Output and Input Channels windows allow you to view, delete, andre-add channels.
Checking the Auto-Update feature enables you to automatically updateinformation for all channels without refreshing the display. If you are not usingthe Auto Update feature, from the right-click menu, select Refresh to updateinformation for all channels.
Note: For the RTDX Channel View Control to receive extended channelinformation for a specific channel, a RTDX client must have the channel ofinterest open.
Transmit a Single Integer to the Host
The basic function of RTDX is to transmit a single integer to the host. Thefollowing steps provide an overview of the process of sending data from thetarget to the host and from the host to the target. For specific commands anddetails on transmitting different types of data, see the Help→Contents→RTDXor Help→Tutorial→RTDX Tutorial.
To send data from your target application to the host:
Step 1: Prepare your target application to capture real-time data.
This involves inserting specific RTDX syntax into your applicationcode to allow real-time data transfer from the target to the host.Although the process for preparing a target application is the samefor all data types, different data types require different function callsfor data transfer. Therefore, sending an integer to the host requiresyou to add a function call that is specific to only transmitting a singleinteger as compared to sending an array of integers to the host.
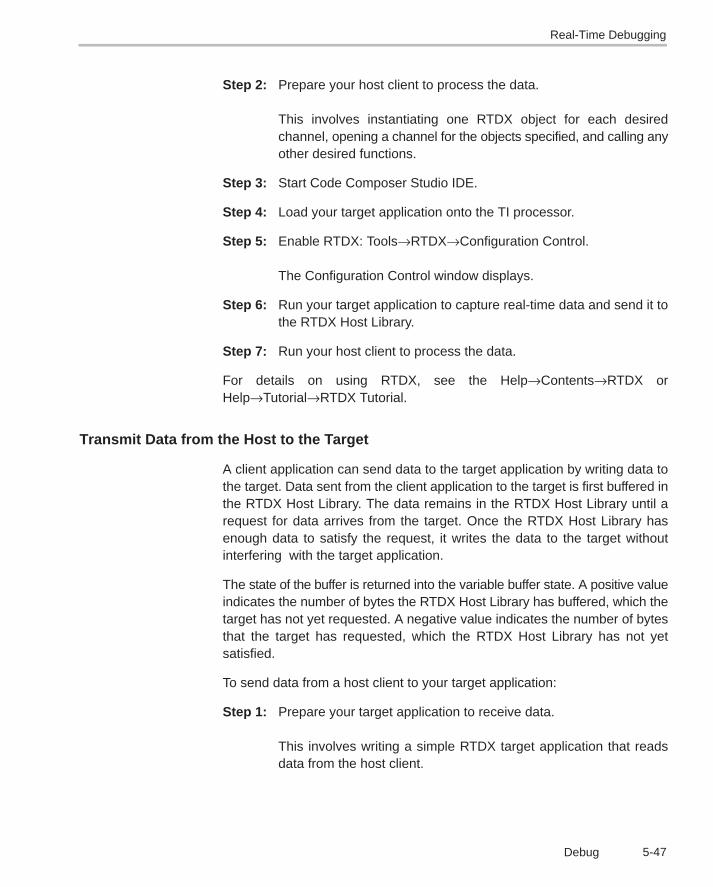
Real-Time Debugging
5-47Debug
Step 2: Prepare your host client to process the data.
This involves instantiating one RTDX object for each desiredchannel, opening a channel for the objects specified, and calling anyother desired functions.
Step 3: Start Code Composer Studio IDE.
Step 4: Load your target application onto the TI processor.
Step 5: Enable RTDX: Tools→RTDX→Configuration Control.
The Configuration Control window displays.
Step 6: Run your target application to capture real-time data and send it tothe RTDX Host Library.
Step 7: Run your host client to process the data.
For details on using RTDX, see the Help→Contents→RTDX orHelp→Tutorial→RTDX Tutorial.
Transmit Data from the Host to the Target
A client application can send data to the target application by writing data tothe target. Data sent from the client application to the target is first buffered inthe RTDX Host Library. The data remains in the RTDX Host Library until arequest for data arrives from the target. Once the RTDX Host Library hasenough data to satisfy the request, it writes the data to the target withoutinterfering with the target application.
The state of the buffer is returned into the variable buffer state. A positive valueindicates the number of bytes the RTDX Host Library has buffered, which thetarget has not yet requested. A negative value indicates the number of bytesthat the target has requested, which the RTDX Host Library has not yetsatisfied.
To send data from a host client to your target application:
Step 1: Prepare your target application to receive data.
This involves writing a simple RTDX target application that readsdata from the host client.
Real-Time Debugging
5-48
Step 2: Prepare your host client to send data.
This involves instantiating one RTDX object for each desiredchannel, opening a channel for the objects specified, and calling anyother desired functions.
Step 3: Start Code Composer Studio IDE.
Step 4: Load your target application onto the TI processor.
Step 5: Enable RTDX: Tools→RTDX→Configuration Control.
The Configuration Control window displays.
Step 6: Run your target application.
Step 7: Run your host client.
For details on using RTDX, see the Help→Contents→RTDX orHelp→Tutorial→RTDX Tutorial.
Automation (for Debug)
5-49Debug
5.5 Automation (for Debug)
5.5.1 Using the General Extension Language (GEL)
As mentioned earlier, GEL scripts can be used to create custom GEL menusand automate steps in Code Composer Studio. In section 4.7.1, we sawexamples of using built-in GEL functions to automate steps related to projectmanagement. There are also many built-in GEL functions that can be used toautomate steps during the debug process. Activities such as: set breakpoints,add variables to the Watch Window, begin execution, halt execution, and setup File I.O are just some of the actions that can be run from a GEL script.
5.5.2 Scripting Utility for Debug
The scripting utility as mentioned in section 4.7.2 also has comands that cangreatly aid in automating many debug steps. You can also refer to the onlinehelp that comes with the Scripting Utility.
Target Reset
5-50
5.6 Target Reset
There will be times when it is necessary to perform a reset of the target or theemulator. Commands to perform these resets are integrated in the CodeComposer Studio IDE. The availability to perform these reset commands aredependent on whether the IDE is connected to the target or not. Please referto section 3.1.3 (Connect/Disconnect) for more information on connecting ordisconnecting the target.
5.6.1 Reset Targ et
Target reset initializes the contents of all registers to their power-up state, andhalts execution of the program. If the target board does not respond to thiscommand and you are using a kernel-based device driver, the CPU kernel maybe corrupt. In this case, you must reload the kernel.
The simulator initializes the contents of all registers to their power−up state,according to target simulation specifications.
To reset the target processor, select Debug→Reset CPU.
Note: Connection must be established with the target for the Debug→ResetCPU option to be available.
5.6.2 Emulator Reset
Some processors require putting the processor into its functional run statebefore a hard reset will work. In this case, the only way to force the processorback into this functional run state is to reset the emulator. An emulator resetwill pull the TRST pin active, forcing the device to the functional run mode.
The Reset Emulator option becomes enabled whenever Code ComposerStudio is disconnected from the target. To reset the emulator, choose DebugMenu→Reset Emulator. Upon running Reset Emulator, the hardware is left ina free running state and you can now manually reset the target hardware bypressing the reset button or by selecting Debug→Reset CPU. Note that thisis not true on ARM.

6-1
�����!�"����
Providing value to customers is often the main objective for a DSP developer.A valuable customer experience can stem from an efficient application. Tocreate such an application, a developer may focus on performance, power,code size, or cost. Managing tradeoffs between these factors is a vital part ofa DSP developer’s role.
Application Code Analysis is the process of gathering and interpreting dataabout the factors that influence an application’s efficiency. Application CodeTuning is the modification of code to improve its efficiency. DSP developerscan analyze and tune their application as often as necessary to meet theefficiency goals defined by their customers, application, and hardware.
Code Composer Studio provides various tools to help developers analyze andtune their applications.
Topic Page
6.1 Application Code Analysis 6-2. . . . . . . . . . . . . . . . . . . . . . . . . . . . . . . . . . . . .
6.2 Application Code Tuning 6-10. . . . . . . . . . . . . . . . . . . . . . . . . . . . . . . . . . . . .
Chapter 6

Appliction Code Analysis
6-2
6.1 Appliction Code Analysis
An analysis of application code can reveal many opportunities to improveefficiency, especially when knowing where to look. The tools offered by CodeComposer Studio have been designed to gather important data and usefullypresent it to aid the DSP developer in the tuning process.
6.1.1 Data Visualization
Data visualization is useful when developing applications for communications,wireless, image processing, as well as general applications.
There are a variety of ways in Code Composer Studio to graph data processedby your program. The following classes of graphs are available:time/frequency, constellation diagram, eye diagram, and image.
All the graphs can be accessed by going to View→Graph and selecting thedesired graph and specifying the graph properties in the graph properties boxthat appears. In this example below, a Single Time (Time/Frequency) graphis being configured:
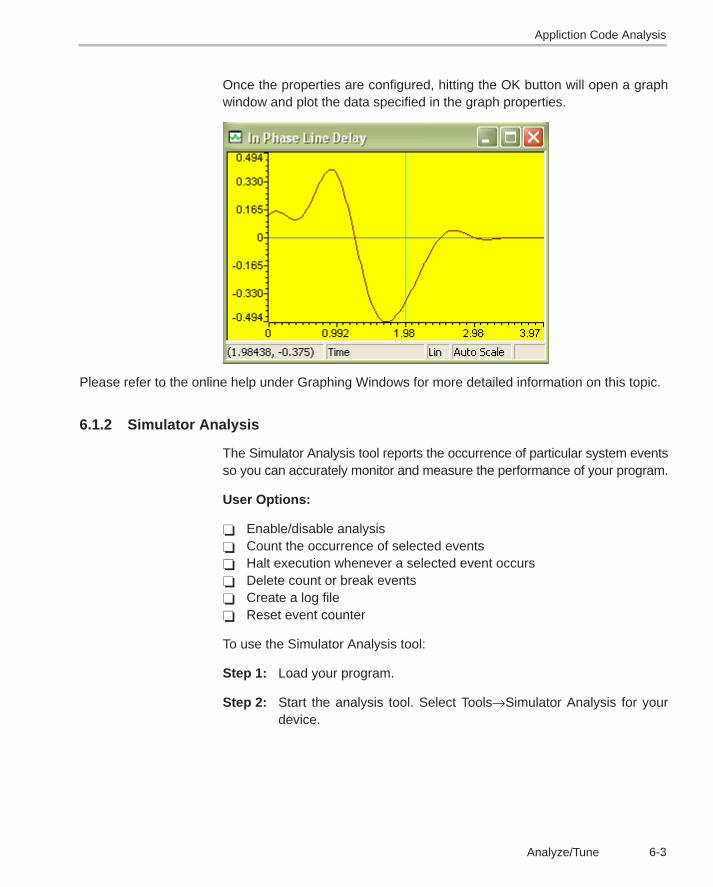
Appliction Code Analysis
6-3Analyze/Tune
Once the properties are configured, hitting the OK button will open a graphwindow and plot the data specified in the graph properties.
Please refer to the online help under Graphing Windows for more detailed information on this topic.
6.1.2 Simulator Analysis
The Simulator Analysis tool reports the occurrence of particular system eventsso you can accurately monitor and measure the performance of your program.
User Options:
� Enable/disable analysis� Count the occurrence of selected events� Halt execution whenever a selected event occurs� Delete count or break events� Create a log file� Reset event counter
To use the Simulator Analysis tool:
Step 1: Load your program.
Step 2: Start the analysis tool. Select Tools→Simulator Analysis for yourdevice.

Appliction Code Analysis
6-4
Step 3: Right-click in the Simulator Analysis window and then select Enableanalysis.
Step 4: Specify your analysis parameters (count events or break events).
Step 5: Run or step through your program.
Step 6: Analyze the output of the analysis tool.
For detailed information on the Simulator Analysis tool, see the SimulatorAnalysis topics provided in the online help: Help→Contents→SimulatorAnalysis.
6.1.3 Emulator Analysis
The Emulator Analysis tool allows you to set up, monitor, and count events andhardware breakpoints.
To start the Emulator Analysis tool:
Step 1: Load your program.
Step 2: Select Tools→Emulator Analysis for your device from the menu bar.
The Emulator Analysis window (Figure 6−1) contains the followinginformation:
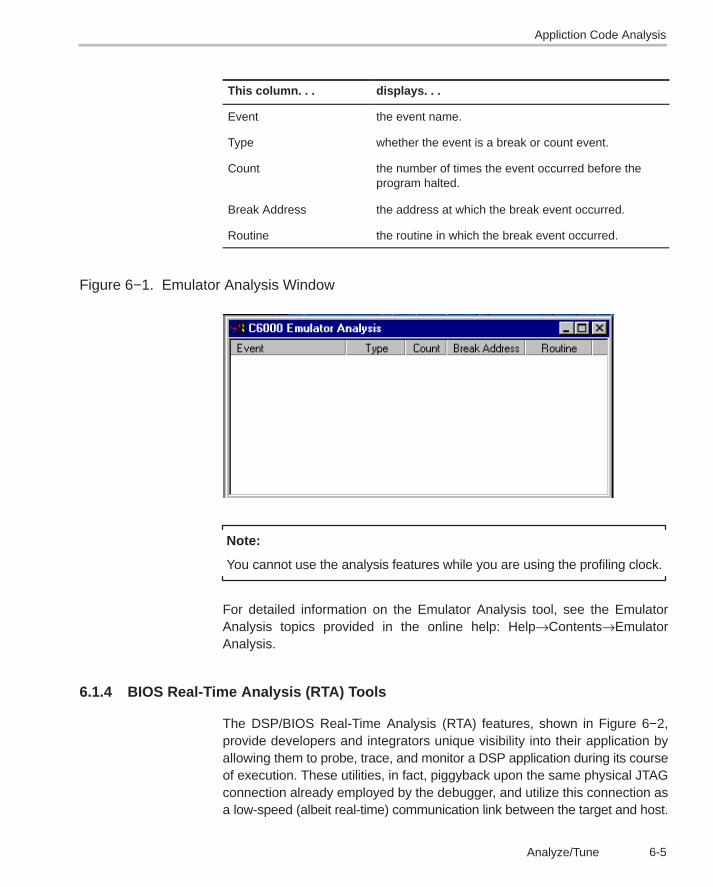
Appliction Code Analysis
6-5Analyze/Tune
This column. . . displays. . .
Event the event name.
Type whether the event is a break or count event.
Count the number of times the event occurred before theprogram halted.
Break Address the address at which the break event occurred.
Routine the routine in which the break event occurred.
Figure 6−1. Emulator Analysis Window
Note:
You cannot use the analysis features while you are using the profiling clock.
For detailed information on the Emulator Analysis tool, see the EmulatorAnalysis topics provided in the online help: Help→Contents→EmulatorAnalysis.
6.1.4 BIOS Real-Time Analysis (RTA) Tools
The DSP/BIOS Real-Time Analysis (RTA) features, shown in Figure 6−2,provide developers and integrators unique visibility into their application byallowing them to probe, trace, and monitor a DSP application during its courseof execution. These utilities, in fact, piggyback upon the same physical JTAGconnection already employed by the debugger, and utilize this connection asa low-speed (albeit real-time) communication link between the target and host.

Appliction Code Analysis
6-6
Figure 6−2. Real-Time Capture and Analysis
DSP/BIOS kernel interface
Host commandserver
Hostdata
channels
Statisticsaccumulators
Softwareeventlogs
Target DSP platform
Real−timedatalink
Host computer
Development
Execution traceTiming analysisRegression testingParametric variation
Deployment
System consoleActivity monitoringLive signal captureDiagnostic modules
DSP/BIOS RTA requires the presence of the DSP/BIOS kernel within thetarget system. In addition to providing run-time services to the application,DSP/BIOS kernel provides support for real-time communication with the hostthrough the physical link. By simply structuring an application around theDSP/BIOS APIs and statically created objects that furnish basic multitaskingand I/O support, developers automatically instrument the target for capturingand uploading the real-time information that drives the visual analysis toolsinside CCStudio IDE. Supplementary APIs and objects allow explicitinformation capture under target program control as well. From theperspective of its hosted utilities, DSP/BIOS affords several broad capabilitiesfor real-time program analysis.
The DSP/BIOS Real-Time Analysis tools can be accessed through theDSP/BIOS toolbar.

Appliction Code Analysis
6-7Analyze/Tune
Figure 6−3. DSP/BIOS Toolbar
Message Log
Statistics View
Host Channel Control
RTA Control Panel
Execution Graph
CPU Load Graph
Kernel/Object View
� Message Log: Displays time-ordered sequences of events written tokernel log objects by independent real-time threads. This is useful fortracing the overall flow of control in the program. There are two ways inwhich the target program logs events:
1) Explicitly, through DSP/BIOS API calls. For example, this can be donethrough “LOG_printf(&trace, “hello world!”);”, where “trace” is the name ofthe log object.
2) Implicitly, by the underlying kernel when threads become ready,dispatched, and terminated. An example of this would be log events in the“Execution Graph Details.”
You can output the log to a file by right-clicking in the Message Log window andselecting Property Page.
� Statistics View: Displays summary statistics amassed in kernelaccumulator objects, reflecting dynamic program elements ranging fromsimple counters and time-varying data values, to elapsed processingintervals of independent threads. The target program accumulatesstatistics explicitly through DSP/BIOS API calls or implicitly by the kernel,when scheduling threads for execution or performing I/O operations. Youcan change settings such as units for the statistics by right-clicking in theStatistics View window and selecting Property Page.
Appliction Code Analysis
6-8
� Host Channel Control: Displays host channels defined by your program.You can use this window to bind files to these channels, start the datatransfer over a channel, and monitor the amount of data transferred.Binding kernel I/O objects to host files provides the target program withstandard data streams for deterministic testing of algorithms. Otherreal−time target data streams managed with kernel I/O objects can betapped and captured on-the-fly to host files for subsequent analysis.
� RTA Control Panel: Controls the real-time trace and statisticsaccumulation in target programs. In effect, this allows developers tocontrol the degree of visibility into the real-time program execution. Bydefault, all types of tracing are enabled. You must check the “Global hostenable” check box in order for any of the tracing types to be enabled. Yourprogram can also change the settings in this window. The RTA ControlPanel checks for any programmatic changes at the rate set for the RTAControl Panel in the Property Page. In the Property Page, you can alsochange refresh rates for any RTA tool, such as the Execution Graph.
� Execution Graph: Displays the execution of threads in real−time.Through the execution graph you can see the timing and the order in whichthreads are executed. Thick blue lines indicate the thread that is currentlyrunning, that is, the thread using the CPU. More information aboutdifferent lines in the graph can be accessed by right-clicking in theExecution Graph window and selecting Legend. If you display theExecution Graph Details in a Message Log window, you can double-clickon a box (a segment of a line) in the Execution Graph to see details aboutthat event in text form. You can also hide threads in the graph byright-clicking in the Execution Graph window and selecting Property Page.
� CPU Load Graph: Displays a graph of the target CPU processing load.The most recent CPU load is shown in the lower−left corner and thehighest CPU load reached so far is shown in the lower−right corner. TheCPU load is defined as the amount of time not spent performing thelow-priority task that runs when no other thread needs to run. Thus, theCPU load includes any time required to transfer data from the target to thehost and to perform additional background tasks. The CPU load isaveraged over the polling rate period. The longer the polling period, themore likely it is that short spikes in the CPU load is not shown in the graph.To set the polling rate, open the RTA Control Panel window and right-clickin the window. Select Property Page, and in the Host Refresh Rates tab,set the polling rate with the Statistics View / CPU Load Graph slider andclick OK.

Appliction Code Analysis
6-9Analyze/Tune
� Kernel/Object View: Displays the configuration, state, and status of theDSP/BIOS objects currently running on the target. This tool shows boththe dynamic and statically configured objects that exist on the target. Youcan right-click in the window and select Save Server Data to save thecurrent data.
Note:
When used in tandem with the Code Composer Studio IDE standard debug-ger during software development, the DSP/BIOS real-time analysis toolsprovide critical visibility into target program behavior at exactly those inter-vals where the debugger offers little or no insight − during program execu-tion. Even after the debugger halts the program and assumes control of thetarget, information already captured through DSP/BIOS can provide invalu-able insights into the sequence of events that led up to the current point ofexecution.
Later in the software development cycle, regular debuggers becomeineffective for attacking more subtle problems arising from time-dependentinteraction of program components. The DSP/BIOS real-time analysis toolssubsume an expanded role as the software counterpart of the hardware logicanalyzer.
This dimension of DSP/BIOS becomes even more pronounced after softwaredevelopment concludes. The embedded DSP/BIOS kernel and its companionhost analysis tools combine to form the necessary foundation for a newgeneration of manufacturing test and field diagnostic tools. These tools will becapable of interacting with application programs in operative productionsystems through the existing JTAG infrastructure.
The overhead cost of using DSP/BIOS is minimal, therefore instrumentationcan be left in to enable field diagnostics, so that developers can capture andanalyze the actual data that caused the failures.
6.1.5 Code Coverage and Multi-Event Profiler Tool
The Code Coverage and Multi-event Profiler tool provides two distinctcapabilities:
� Code coverage provides visualization of source line coverage to facilitatedevelopers in constructing tests to ensure adequate coverage of theircode.
� Multi-event profiling provides function profile data collected over multipleevents of interest – all in a single simulation run of the application. Events

Application Code Tuning
6-10
include CPU cycles, instructions executed, pipeline stalls, cache hits,misses and so on. This tool helps identify hotspots, and possible factorsaffecting performance.
See the Code Coverage and Multi-event Profiler User’s Guide (SPRU624) forfurther details.
6.2 Application Code Tuning
The tuning process begins where the analysis stage ends. When applicationcode analysis is complete, the DSP developer should have identifiedinefficient code. The tuning process consists of determining whether inefficientcode can be improved, setting efficiency objectives, and attempting to meetthose goals by modifying code. Code Composer Studio links several toolstogether into an organized method of tuning as well as providing a single pointfor analyzing tuning progress. The Tuning tool suite is a cohesive set of tuningtools, logically formed to attack the key areas in which DSP developers needhigh efficiency.
6.2.1 Optimization Dashboard
The Dashboard is a central focal point for the tuning process. It displays build−and run-time profile data suggestions for which tuning tool to use, and it canlaunch each of the tools. The Dashboard is the main interface during the tuningphase of the development cycle.
6.2.1.1 Advice Window
The Advice window is an area of the Dashboard that displays tuninginformation. It guides the user through the tuning process, explaining anddetailing the appropriate steps to take, and displaying helpful information forusing tools, links to other tools and documentation, and important messages.
The Advice window should be consulted when first using a tool, or to determinethe appropriate action to take at any point in the tuning procedure.
Code Composer Studio initially starts in Debug layout. To open the Advicewindow, switch to Tuning layout by clicking the tuning fork icon on the toolbar.Alternatively, the user can choose Advice from the Profile→Tuning menu item.The Advice window will open at the left of the Code Composer Studio screenand display the following Welcome information:

Application Code Tuning
6-11Analyze/Tune
At the top of the Advice Window there is a toolbar that provides buttons forInternet−style navigation of advice pages as well as buttons for opening themain advice pages. Click on the arrows in the toolbar to navigate back andforth through the history of advice pages for that tab. Below the pane thatcontains the advice pages, there are one or more tabs. These tabs let severaladvice pages remain open, allowing DSP developers carry out more than onetask at once. Click on the tabs at the bottom of the Advice Window to switchbetween open pages. To close the active tab, right-click on the Advice Windowand choose Close Active Tab from the pop−up menu.
The Welcome advice page contains links to descriptions of each of the majortuning tools. At the bottom of the Welcome advice page, there is a blue boxcontaining suggestions for the next step in the tuning process. These blueAction boxes are found throughout the Advice Window pages.
When navigating through the Advice Window pages, red warning messagesmay appear. These messages often serve as helpful reminders while tuningbut may contain valuable solutions if problems are encountered along the way.
When you have launched a tool, such as CodeSizeTune, an advice tab for thattool appears at the bottom of the Advice window. The page contains
Application Code Tuning
6-12
information about the tool, including its function, when it should be used, andhow to apply the tool effectively for optimum tuning efficiency.
If the user follows the information presented on each page, the Advice Windowcan be a useful handbook when getting started with Application Code Tuning.
6.2.1.2 Profile Setup
As the Advice Window indicates, Code Composer Studio must know whatcode elements the DSP developer is interested in tuning before tuning begins.This can be accomplished using Profile Setup. The Profile Setup windowshould be used at the beginning of the Tuning process to specify the data tobe collected and the requisite sections of code.
The Profile Setup window can be opened using the Advice Window. In the blueAction box at the bottom of the Welcome page, click the link to open the SetupAdvice page. The first Action box will contain a link to open the Profile Setupwindow. Profile Setup can also be launched from the main menu topicProfile→Setup.
To configure the collected data, use the Activities tab of the Profile Setupwindow. Check off each desired activity corresponding to the element of theapplication that is being tuned. For a more detailed explanation of each activity,click on the activity and view its description in the window below.
The Ranges tab is used to tune specific sections of code. Functions, loops, andarbitrary segments of code can be added to the Ranges tab for collection oftuning information. Code Composer Studio must be notified when to stop datacollection by using the Control tab to add exit points to the code. When an exitpoint is reached, Code Composer Studio will stop collecting tuninginformation. The Control can also be used to add Halt and Resume Collectionpoints to the code in order to isolate different sections of code. The Custom tabcan be used to collect custom data, such as cache hits or CPU idle cycles.
6.2.1.3 Goals Window
Tuning an application is about setting and reaching efficiency goals, so CodeComposer Studio provides a method of recording numerical goals andtracking progress towards reaching them.
The Goals Window displays a summary of application data, including valuesfor the size of the code and number of cycles, that can be updated each timethe code is run. It also compares this data to the data for the last run, as wellas the goals that the DSP developer has defined.

Application Code Tuning
6-13Analyze/Tune
1) To open the Goals Window, first open the Advice Window.
2) On the Advice Window toolbar, click on the View General Tuning Adviceicon at the top of the window to open the General tab.
3) In the blue Action box, click on the Launch the Goals Window icon. TheGoals Window will open on the left side of the screen.
If an application has been loaded and profiling has been set up, the GoalsWindow can be populated with data simply by running the application. Torecord objectives for tuning, click in the Goals column, type in the goal andpress Enter. If a goal has been reached, the data will be displayed in green andin parentheses. Otherwise, the data will appear in red. When the applicationis restarted and run, the Current values in the Goals Window will move to thePrevious column and the difference will be displayed in the Delta column. TheGoals Window also allows a DSP developer to save or view the contents in alog at any time, by using the logging icons at the left side of the window.
6.2.1.4 Profile Viewer
The Profile Viewer displays collected data during the Application Code Tuningprocess. It consists of a spreadsheet-like grid with each row corresponding tothe elements of code selected in the Ranges tab of the Profile Setup window.The columns in the grid store the collected data for each profiled section ofcode, as selected in the Activities and Custom tabs of the Profile Setupwindow.
The Profile Viewer provides a single location for the display of all collectedinformation during the tuning process. Ranges can be sorted by different datavalues. Data sets displayed in the Profile Viewer can be saved, restored, andcompared with other data sets.
The Profile Viewer can be used to pinpoint sections of code that require themost tuning. For instance, to determine which function results in the mostcache stalls, the cache stall data in the Profile Viewer can be sorted fromlargest to smallest. Sections of the function can then be profiled to determineexactly what code is generating cache stalls.
To open the Profile Viewer, navigate to the Setup tab in the Advice Window.At the bottom of the Setup Advice page, click on the Profile Data Viewer link
Application Code Tuning
6-14
to display the Profile Viewer in the lower portion of the screen. Alternatively,Profile Viewer can be launched from the main menu topic Profile→Viewer. Iftuning has been set up using the Profile Setup window, running the applicationwill display data in the Profile Viewer. The view can be customized by draggingand dropping rows and columns. The data can be saved and restored usingthe Profile Viewer buttons, and it can be sorted by double-clicking on the titleof a column. In addition, several Profile Viewers can be openedsimultaneously.
6.2.2 Compiler Consultant
The Compiler Consultant Tool analyzes your application and makesrecommendations for changes to optimize the compiler cycle time. The tooldisplays two types of information: Compile Time Loop Information and RunTime Loop Information. Compile Time Loop Information is created by thecompiler. Run Time Loop Information is data gathered by profiling yourapplication. Each time you compile or build your code, Consultant will analyzethe code and create suggestions for different optimization techniques toimprove code efficiency. You then have the option of implementing the adviceand building the project again.
When you analyze Compiler Consultant information, sort information by:
Estimated Cycles Per Iteration if you want to view Compile Time LoopInformation.
cycle.CPU:Excl.Total if you are analyzing Run Time Loop Information.
This sorting will bring the rows to the top of the Profile Viewer that consumethe most CPU cycles and which should gain the most performance benefit bytuning.
You can then work on tuning one loop at a time. Double−clicking on the AdviceTypes entry for any loop row will bring up the full advice for that loop in theConsultant tab of the Advice window.
After you have applied the advice to fix individual loops, it is useful to hide thatrow in the Profile Viewer window. Hiding rows reduces the amount ofinformation present in the Profile Viewer window. Rows can always beunhidden.
To find out more about using the Compiler Consultant, see Consultant in theonline help under Application Code Tuning.
Application Code Tuning
6-15Analyze/Tune
6.2.3 CodeSizeTune (CST)
CodeSizeTune (CST) is a tool that enables you to easily optimize the trade-offbetween code size and cycle count for your application. Using a variety ofprofiling configurations, CodeSizeTune will profile your application, collectdata on individual functions, and determine the best combinations of compileroptions. CST will then produce a graph of these function-specific option sets,allowing you to graphically choose the configuration that best fits your needs.
Previous users of Code Composer Studio will recognize CST as areplacement for the Profile-Based Compiler (PBC).
1) How do I begin? CST starts with your debugged application. Check outCodeSizeTune in the online help under Application Code Tuning to makesure your application meets the criteria for CST profiling.
2) CST will use several profile collection options sets to build and profile yourapplication. Using the profile information it gains on how each functionperformed under several different profile collection options, CST piecestogether collection options that contain compiler options at the functionlevel. To find out more about how to build and profile, see Build & Profileunder CodeSizeTune in the online help.
3) The best profile collection options sets are then plotted on atwo−dimensional graph of code size vs. performance, which allows you tographically select the optimum combination of size and speed to meetyour system needs. For more on selecting a desired collection options set,see the topic Select Desired Speed and Code Size under CodeSizeTunein the online help.
4) Finally, you will save your selected collection options set to the CodeComposer Studio project. See Save Settings and Close underCodeSizeTune in the online help.
The Advice window guide you though the steps of the process. When youlaunch CodeSizeTune, the CodeSizeTune tab of the advice window will bedisplayed automatically. See CodeSizeTune Advice Window in the online helpfor more information.

Application Code Tuning
6-16
6.2.4 Cache Tune
The Cache Tune tool provides a graphical visualization of cache accessesover a set amount of time. This tool is highly effective at highlightingnon-optimal cache usage (due to factors such as conflicting code placement,inefficient data access patterns, etc.). All the memory accesses arecolor−coded by type. Various filters, panning, and zoom features facilitatequick drill−down to view specific areas. This visual/temporal view of cacheaccesses enables quick identification of problem areas, such as areas relatedto conflict, capacity, or compulsory misses. Using this tool, developers cansignificantly optimize cache efficiency, thereby reducing the cycles consumedin the memory subsystem. All of these features help the user to greatly improvethe cache efficiency of the overall application.
The Tuning→CacheTune menu item launches the Cache Tune tool showingthe latest cache traces. There are three kinds of cache trace files:
� Program Cache trace
� Data Cache trace
� Cross Cache trace
The data cache trace tab is displayed by default. If no cache traces have beencollected, then the graph is empty.
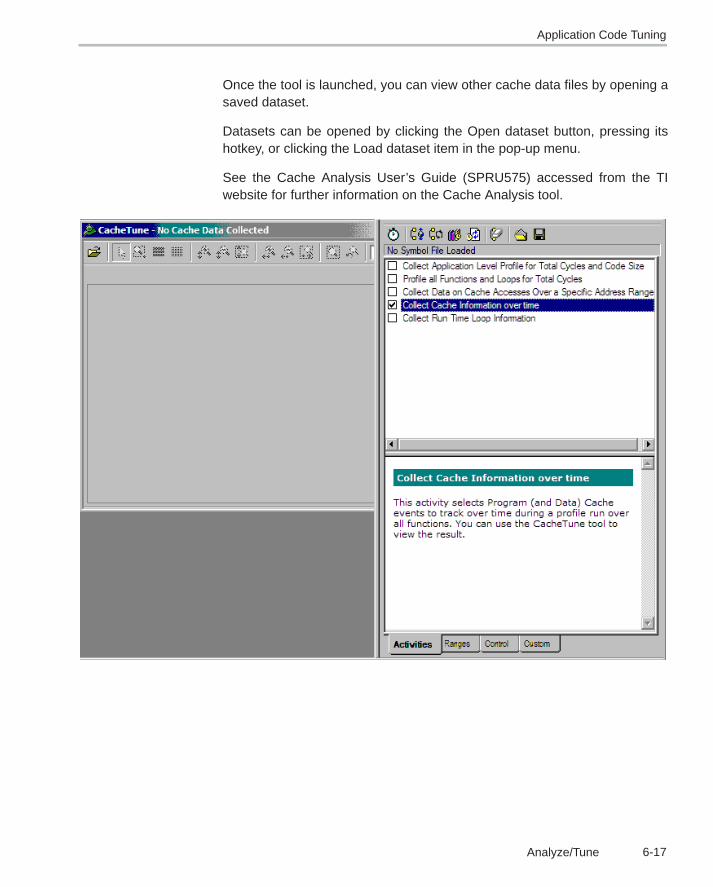
Application Code Tuning
6-17Analyze/Tune
Once the tool is launched, you can view other cache data files by opening asaved dataset.
Datasets can be opened by clicking the Open dataset button, pressing itshotkey, or clicking the Load dataset item in the pop-up menu.
See the Cache Analysis User’s Guide (SPRU575) accessed from the TIwebsite for further information on the Cache Analysis tool.

7-1
���������� ����# ����# ���
���
This chapter gives information on how to find additional help for documenta-tion, updates, and with customizing your Code Composer Studio installaton.
Topic Page
7.1 Component Manager 7-2. . . . . . . . . . . . . . . . . . . . . . . . . . . . . . . . . . . . . . . . . .
7.2 Update Advisor 7-4. . . . . . . . . . . . . . . . . . . . . . . . . . . . . . . . . . . . . . . . . . . . . . .
7.3 Additional Help 7-6. . . . . . . . . . . . . . . . . . . . . . . . . . . . . . . . . . . . . . . . . . . . . . .
Chapter 7
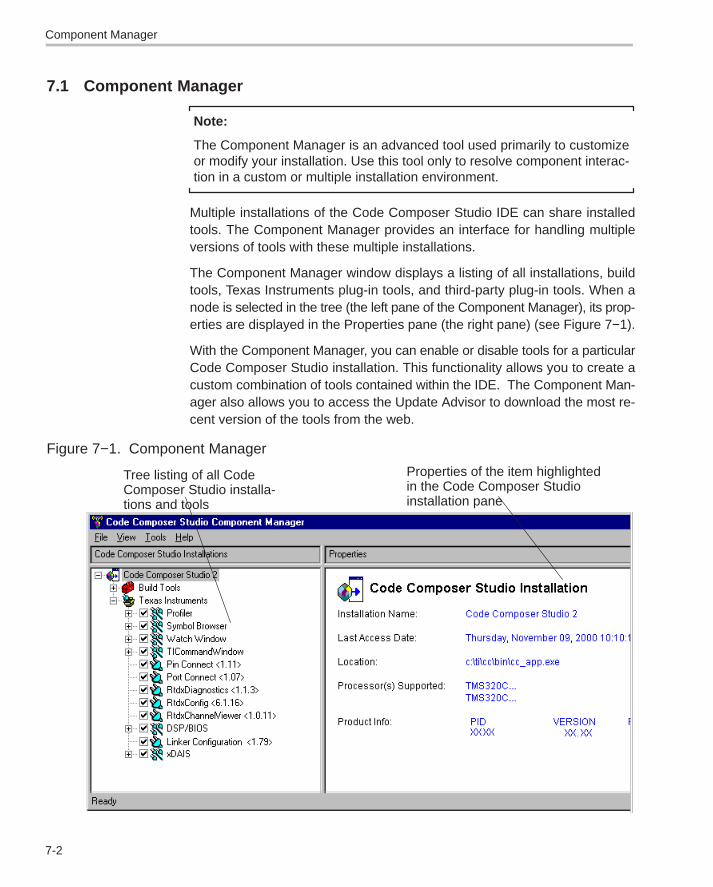
Component Manager
7-2
7.1 Component Manager
Note:
The Component Manager is an advanced tool used primarily to customizeor modify your installation. Use this tool only to resolve component interac-tion in a custom or multiple installation environment.
Multiple installations of the Code Composer Studio IDE can share installedtools. The Component Manager provides an interface for handling multipleversions of tools with these multiple installations.
The Component Manager window displays a listing of all installations, buildtools, Texas Instruments plug-in tools, and third-party plug-in tools. When anode is selected in the tree (the left pane of the Component Manager), its prop-erties are displayed in the Properties pane (the right pane) (see Figure 7−1).
With the Component Manager, you can enable or disable tools for a particularCode Composer Studio installation. This functionality allows you to create acustom combination of tools contained within the IDE. The Component Man-ager also allows you to access the Update Advisor to download the most re-cent version of the tools from the web.
Figure 7−1. Component Manager
Tree listing of all CodeComposer Studio installa-tions and tools
Properties of the item highlightedin the Code Composer Studioinstallation pane
Component Manager
7-3Additional Tools, Help, and Tips
7.1.1 Opening Component Manager
To open the Component Manager:
Step 1: From the Help menu in the Code Composer Studio IDE, selectAbout.
The About Code Composer Studio dialog box appears.
Step 2: In the About dialog box, click the Component Manager button.
The Component Manager window displays.
7.1.2 Multiple Versions of the Code Composer Studio IDE
The following is a list of requirements for maintaining multiple versions of theCode Composer Studio IDE and related tools:
� To keep more than one version of the Code Composer Studio IDE or a re-lated tool, you must install each version in a different directory.
� If you install an additional version of the Code Composer Studio IDE, oran additional version of a tool, in the same directory as its previous installa-tion, the original installation will be overwritten.
� You cannot enable multiple versions of the same tool within one installa-tion.

Update Advisor
7-4
7.2 Update Advisor
The Update Advisor allows you to download updated versions of the CodeComposer Studio IDE and related tools. The Update Advisor accesses theAvailable Updates web site. This site displays a list of patches, drivers, andtools available for downloading.
To use the Update Advisor, you must have Internet access and a browserinstalled on your machine. See the Code Composer Studio IDE Quick Start forcomplete system requirements.
Note:
You must be registered with TI&ME before you can access the Available Up-dates web site.
7.2.1 Registering Update Advisor
If you did not register your product during installation, you can access the on-line registration form from the Code Composer Studio help menu: Help→CCSon the Web→Register.
Important! The first time you use Update Advisor, your browser may displaythe TI&ME web page. To register, follow the directions displayed on the page.
You must register online and have a valid subscription plan in place to receivedownloads through Update Advisor. You receive a 90 day free subscriptionservice with the Code Composer Studio product. At the end of this period, youmust purchase an annual subscription service. Annual subscriptions are onlyavailable for the full product.
7.2.2 Checking for Tool Updates
In the Code Composer Studio IDE, select Help→Check for Updates→UpdateAdvisor.
If you are already registered with TI&ME, and have accepted the cookie neces-sary for automatic log-in, your browser will go directly to the Available Updatesweb site.
To query the Available Updates web site, the Update Advisor passes certaininformation from your machine:
� Code Composer Studio product registration number� Code Composer Studio installation version� a text description of the installed product� the list of installed plug-ins

Update Advisor
7-5Additional Tools, Help, and Tips
The Available Updates web site will then list any updates appropriate for yourCode Composer Studio installation.
You have the opportunity to just download the updates, or to download andinstall them immediately.
You can also configure the Update Advisor to automatically check for updates.
7.2.3 Automatically Checking for Tool Updates
You may check for tool updates at any time, or you can configure the UpdateAdvisor to automatically check for updates.
Step 1: Select Help→Update Advisor→Setting. The Web Settings dialogbox appears:
Step 2: In the Check for Update field, specify how often the Update Advisorshould check the Available Updates web site.
Step 3: To enable the automatic update feature, click the checkbox to the leftof the “Enable timed check for update upon startup” field.
When this field is enabled, the Update Advisor automatically checksfor web updates according to the schedule specified in step 2.
Step 4: Click OK to save your changes and close the dialog box.
7.2.4 Uninstalling the Updates
Any installed update can be uninstalled to restore the previous version of theCode Composer Studio IDE.
Note that only the previous version of a tool can be restored. If you install oneupdate for a tool, and then install a second update for the same tool, the firstupdate can be restored. The original version of the tool cannot be restored,even if you uninstall both the second update and the first update.
Additional Help
7-6
7.3 Additional Help
A multitude of help tools are available to answer your questions. You can ac-cess Help→Contents to guide you through certain topics step by step; traverseonline help sites that provide the most current help topics; or, peruse usermanuals which are pdf files that provide information on specific features or pro-cesses.
Also, you can access the Update Advisor to get the newest features throughHelp→Update Advisor.
7.3.1 Code Composer Studio Online Help
The Online Help provides links to the tutorials, multimedia demos, user manu-als, application reports, and a website (www.dspvillage.com) where you canobtain information regarding the software. Simply click on Help and follow thelinks provided.
Index
Index-1
����$
Aabsolute lister 4-22
add, new project configuration 4-6
add files to a project 4-3
add new project configuration 4-6
advanced event triggering 5-36event analysis 5-36event sequencer 5-36, 5-38
archiver, described 4-22
assemblerdescribed 4-22overview 4-23
assembly language tools 4-22absolute lister 4-22archiver 4-22assembler 4-22cross−reference lister 4-22hex−conversion utility 4-22linker 4-22menemonic−to−algebraic translator utility 4-22
assembly optimizer, described 4-24
automatic tool updates, Update Advisor 7-5
automatic web update, Update Advisor 7-5
Bbookmarks, code window 4-18
breakpointshardware 5-20introduction 5-18software 5-19vs. probe points 5-21
build options, dialog box 4-20
Build Options dialog box 4-20
CC/C++ compiler, described 4-24CCS versions, Component Manager 7-2change, active project configuration 4-5change active project configuration 4-5Channel Viewer Control, RTDX 5-45check for tool updates, Update Advisor 7-4, 7-5Chip Support Library 4-29code, review using the editor 4-17code development tools
assembly optimizer 4-24C++ name demangling utility 4-25library−build utility 4-24run−time−support libraries 4-24
code generation tools 4-19code window
bookmarks 4-18keyboard shortcuts 4-18keywords 4-17selection margin 4-17
Command Window 5-32compiler, overview 4-21 to 4-24Component Manager 7-2Configuration, create a 3-2configuration
add DSP/BIOS files to project 4-16add new project 4-6change active 4-5project selection 4-5
Configuration Control, RTDX 5-45configuration files, DSP/BIOS 4-14configuration tool, DSP/BIOS 4-12configure, RTDX graphically 5-44create a project 4-2
Project Creation wizard 4-2Create a System Configuration 3-2
Index
Index-2
cross-reference utility 4-22
CSL, Introduction to 4-29
CSL (chip support library), benefits of 4-29
CSL Benefits 4-29
Ddata flow, RTDX 5-43
debug toolsadvanced event triggering 5-36Command Window 5-32emulator analysis 6-4overview 5-2Pin Connect 5-12Port Connect 5-12probe points 5-21simulator analysis 6-3symbol browser 5-31Watch window 5-24
Development Flow, code composer studio 1-4
Diagnostics Control, RTDX 5-44
DSP/BIOSadd configuration files to project 4-16configuration tool 4-12create configuration files 4-14Real−time Analysis Tools 6-5using 4-12
DSP/BIOS toolbar 6-7
Eeditor, review source code 4-17
emulator analysis 6-4
EPROM programmer 4-22
event analysis 5-36
event sequencer 5-36, 5-38
event triggering 5-36event analysis 5-36event sequencer 5-36, 5-38
external editor, source code 4-18
external makefile 4-27
Ffiles
add DSP/BIOS configuraiton to project 4-16adding to a project 4-3create DSP/BIOS configuration 4-14
GGEL, general extension language 4-38
Hhardware breakpoints 5-20hex conversion utility, described 4-22
IImport Configuration dialog box 3-2, 3-3import makefile 4-27interlist utility, described 4-24
Kkeyboard shortcuts, code window 4-18keywords, code window 4-17
Llibrary-build utility, described 4-24linker
described 4-22overview 4-23
Mmakefile
external 4-27import 4-27
mnemonic−to−algebraic translator utility 4-22multiple CCS versions, Component Manager 7-2multiple tool versions, Component Manager 7-2

Index
Index-3
Nnew project
create a 4-2Project Creation wizard 4-2
Ooptimizer, described 4-24overview
assembler 4-23linker 4-23
PPin Connect 5-12Port Connect 5-12probe points 5-21
vs. breakpoints 5-21project
add DSP/BIOS configuration files 4-16adding files 4-3create a 4-2Project Creation wizard 4-2
project configurationadd new 4-6change active 4-5selecting 4-5
Project Creation wizard 4-2
RReal−time analysis tools, DSP/BIOS 6-5real−time component, DSP/BIOS 4-12real−time components, RTDX 5-42real−time data exchange, RTDX 5-42RTDX
Channel Viewer Control 5-45Configuration Control 5-45configure graphically 5-44data flow 5-43Diagnostics Control 5-44real−time data exchange 5-42transmit data from host 5-47transmit integer to host 5-46using 5-42
runtime-support, library, described 4-24
Sselect
configuration 4-5project configuration 4-5
select a project configuration 4-5selection margin, code window 4-17shell program, described 4-24simulator analysis 6-3
user options 6-3software breakpoints 5-19source code
external editor 4-18review 4-17
Source Control 4-10pop−up menu 4-11
symbol browser 5-31System Configuration, Create a 3-2
Ttool updates, Update Advisor 7-4, 7-5tool versions, Component Manager 7-2toolbar, DSP/BIOS 6-7tools
assembly language 4-22code generation 4-19compiler 4-21
translator utility, mnemonic−to−algebraic 4-22transmit data from host, RTDX 5-47transmit integer to host, RTDX 5-46
UUpdate Advisor 7-4
check for tool updates 7-4, 7-5use Source Control 4-10
pop−up menu 4-11using
DSP/BIOS 4-12RTDX 5-42
WWatch window 5-24web updates, Update Advisor 7-4, 7-5