codeanalyst user's manual - amd
TRANSCRIPT

CodeAnalyst User's Manual
CodeAnalyst User's Manual
Publication: 26833
Revision 1.2
Publication date : April 2012Copyright © 2003-2012 Advanced Micro Devices, Inc. All rights reserved.
Disclaimers
The contents of this documentation are provided in connection with Advanced Micro Devices, Inc. ("AMD") products.AMD makes no representations or warranties with respect to the accuracy or completeness of the contents of thispublication. The information contained herein may be of a preliminary or advance nature and is subject to changewithout notice. No license, whether express, implied, arising by estoppel or otherwise, to any intellectual propertyrights is granted by this publication. Except as set forth in AMD's Standard Terms and Conditions of Sale, AMDassumes no liability whatsoever and disclaims any express or implied warranty, relating to its products including,but not limited to, the implied warranty of merchantability, fitness for a particular purpose, or infringement of anyintellectual property right.
AMD's products are not designed, intended, authorized or warranted for use as components in systems intended forsurgical implant into the body, or in other applications intended to support or sustain life, or in any other applicationin which the failure of AMD's product could create a situation where personal injury, death, or severe property orenvironmental damage may occur. AMD reserves the right to discontinue or make changes to its products at any timewithout notice.
Trademarks
AMD, the AMD Arrow logo, AMD Athlon, AMD Opteron, and combinations thereof, and 3DNow! are trademarksof Advanced Micro Devices, Inc.
HyperTransport is a licensed trademark of the HyperTransport Technology Consortium.
Linux is a registered trademark of Linus Torvalds.
Microsoft, Windows, and Windows Vista are registered trademarks of Microsoft Corporation.
MMX is a trademark of Intel Corporation.
Other product names used in this publication are for identification purposes only and may be trademarks of theirrespective companies.
iii
Table of Contents1. Introduction ................................................................................................................... 1
1.1. Overview ............................................................................................................ 11.1.1. Preparing an Application for Profiling ........................................................... 11.1.2. Compiling with the GNU GCC Compiler ....................................................... 1
2. Features ........................................................................................................................ 22.1. Overview of AMD CodeAnalyst ............................................................................. 2
2.1.1. Program Performance Tuning ....................................................................... 22.1.2. Types of Analysis ...................................................................................... 22.1.3. Flexible, System-Wide Data Collection .......................................................... 32.1.4. Summarized Results with Drill-down ............................................................. 32.1.5. Graphical User Interface .............................................................................. 32.1.6. Projects and Sessions .................................................................................. 32.1.7. Basic Steps for Analysis ............................................................................. 4
2.2. Exploring the Workspace and GUI .......................................................................... 42.2.1. Projects Panel ............................................................................................ 42.2.2. Status Bar ................................................................................................. 42.2.3. Toolbars ................................................................................................... 52.2.4. Floating and Docking Toolbar Groups ........................................................... 52.2.5. Menus, Tools, and Icons ............................................................................. 62.2.6. File Menu and File Icons ............................................................................ 62.2.7. Profile Menu and Toolbar Icon Group ........................................................... 72.2.8. Tools Menu and Icons ................................................................................ 82.2.9. Windows Menu ......................................................................................... 92.2.10. Help Menu ............................................................................................ 112.2.11. Data and Source Display .......................................................................... 122.2.12. Code Density Chart ................................................................................. 162.2.13. Session Settings ...................................................................................... 172.2.14. Edit Event Configuration ......................................................................... 172.2.15. View Management Dialog Box ................................................................. 182.2.16. Configuration Management Dialog Box ...................................................... 192.2.17. CodeAnalyst Options Dialog Box .............................................................. 202.2.18. Profiling Java Applications ....................................................................... 21
2.3. CodeAnalyst Options ........................................................................................... 212.3.1. General Tab ............................................................................................ 222.3.2. Directories Tab ........................................................................................ 25
2.4. Event Counter Multiplexing .................................................................................. 262.4.1. Example of Event Counter Multiplexing ....................................................... 26
2.5. Importing Profile Data into CodeAnalyst ................................................................. 272.5.1. Import Local Profiling ............................................................................... 292.5.2. Import Remote Profiling ............................................................................ 322.5.3. Import CodeAnalyst Session Directory ......................................................... 332.5.4. Import Opreport's XML Output Files ........................................................... 34
2.6. Exporting Profile Data from CodeAnalyst ............................................................... 342.7. Session Settings .................................................................................................. 37
2.7.1. Setting Templates ..................................................................................... 372.7.2. General Tab ............................................................................................ 372.7.3. Advance Tab ........................................................................................... 392.7.4. Note Tab ................................................................................................ 412.7.5. OProfiled Log .......................................................................................... 412.7.6. Changing the CPU Affinity ........................................................................ 422.7.7. Process Filter ........................................................................................... 46

CodeAnalyst User's Manual
iv
2.8. CodeAnalyst and OProfile .................................................................................... 472.8.1. Profiling with OProfile Command-Line Utilities ............................................. 482.8.2. Importing and Viewing Profile Data ............................................................ 522.8.3. OProfile Daemon/Driver Monitoring Tool ..................................................... 52
3. Types of Analysis ......................................................................................................... 543.1. Types of Analysis ............................................................................................... 543.2. Time-Based Profiling Analysis .............................................................................. 54
3.2.1. How Time-Based Profiling Works ............................................................... 563.2.2. Sampling Period and Measurement Period .................................................... 563.2.3. Predefined Profile Configurations ................................................................ 57
3.3. Event-Based Profiling Analysis ............................................................................. 573.3.1. How Event-Based Profiling Works .............................................................. 593.3.2. Sampling Period and Measurement Period .................................................... 593.3.3. Event Multiplexing ................................................................................... 593.3.4. Predefined Profile Configurations ................................................................ 60
3.4. Instruction-Based Sampling Analysis ...................................................................... 603.4.1. IBS Fetch Sampling .................................................................................. 613.4.2. IBS Op Sampling ..................................................................................... 623.4.3. IBS-Derived Events .................................................................................. 643.4.4. Predefined Profile Configurations ................................................................ 64
3.5. Basic Block Analysis .......................................................................................... 643.6. In-Line Analysis ................................................................................................. 66
3.6.1. Aggregate samples into in-line instance ........................................................ 663.6.2. Aggregate samples into original in-line function ............................................. 673.6.3. Source inlined annotation ........................................................................... 68
3.7. Call-Stack Sampling Analysis ............................................................................... 693.7.1. Enabling CSS Profile ................................................................................ 703.7.2. Viewing CSS Profile ................................................................................. 70
4. Configure Profile .......................................................................................................... 724.1. Profile Data Collection ........................................................................................ 72
4.1.1. Modifying a Profile Configuration ............................................................... 734.2. Edit Timer Configuration ..................................................................................... 734.3. Edit Event-based and Instruction-based Sampling Configuration .................................. 74
4.3.1. Profile Name ........................................................................................... 754.3.2. Select and Modify Events in Profile Configuration ......................................... 764.3.3. Available Performance Events .................................................................... 77
4.4. Predefined Profile Configurations .......................................................................... 794.5. Manage Profile Configurations .............................................................................. 80
5. Collecting Profile .......................................................................................................... 845.1. Collecting Profiles and Performance Data ............................................................... 845.2. Collecting a Time-Based Profile ............................................................................ 84
5.2.1. Collecting a Time-Based Profile .................................................................. 845.2.2. Changing the Current View of the Data ........................................................ 875.2.3. Aggregate by Processes ............................................................................. 87
5.3. Collecting an Event-Based Profile .......................................................................... 885.3.1. Collecting an Event-Based Profile ............................................................... 885.3.2. Changing the Current View of the Data ........................................................ 915.3.3. Aggregate by Processes ............................................................................. 92
5.4. Collecting an Instruction-Based Sampling Profile ...................................................... 935.4.1. Collecting an IBS Profile ........................................................................... 935.4.2. Changing the Current View of the Data ........................................................ 965.4.3. Changing How IBS Data is Collected .......................................................... 98
6. Data Collection Configuration ........................................................................................ 1006.1. Data Collection Configuration ............................................................................. 100

CodeAnalyst User's Manual
v
6.2. Profile Configuration File Format ........................................................................ 1006.2.1. XML file format ..................................................................................... 1006.2.2. Examples of XML Files ........................................................................... 102
7. View Configuration ..................................................................................................... 1047.1. Viewing Results ................................................................................................ 1047.2. View Configurations .......................................................................................... 1047.3. View Management ............................................................................................ 105
7.3.1. View Management Dialog ........................................................................ 1067.4. Predefined Views .............................................................................................. 1077.5. View Configuration File Format .......................................................................... 109
7.5.1. XML File Format ................................................................................... 1097.5.2. Example XML File ................................................................................. 111
8. Tutorial ...................................................................................................................... 1138.1. AMD CodeAnalyst Tutorial ................................................................................ 113
8.1.1. Related Topics ....................................................................................... 1138.2. Tutorial - Prepare Application ............................................................................. 1138.3. Tutorial - Creating a CodeAnalyst Project .............................................................. 1138.4. Tutorial - Analysis with Time-Based Sampling Profile ............................................. 117
8.4.1. Changing the View of Performance Data ..................................................... 1198.5. Tutorial - Analysis with Event-Based Sampling Profile ............................................ 122
8.5.1. Assessing Performance ............................................................................ 1238.5.2. Changing Contents of a View ................................................................... 1258.5.3. Choosing Events for Data Collection .......................................................... 127
8.6. Tutorial - Analysis with Instruction-Based Sampling Profile ...................................... 1318.6.1. Collecting IBS Data ................................................................................ 1318.6.2. Reviewing IBS Results ............................................................................ 1338.6.3. Drilling Down Into IBS Data .................................................................... 137
8.7. Tutorial - Profiling a Java Application .................................................................. 1398.7.1. Reviewing Results .................................................................................. 1418.7.2. Launching a Java Program from the Command Line ...................................... 145
9. Performance Monitoring Events ..................................................................................... 1479.1. Performance Monitoring Events (PME) ................................................................. 1479.2. Unit masks for PMEs ........................................................................................ 1479.3. Instruction-Based Sampling Derived Events ........................................................... 148
9.3.1. IBS Fetch Derived Events ........................................................................ 1489.3.2. IBS Op Derived Events ........................................................................... 1509.3.3. IBS Op Branches Derived Events .............................................................. 1519.3.4. IBS Op Load-Store Derived Events ............................................................ 1519.3.5. IBS Op Northbridge Derived Events .......................................................... 154
10. Support .................................................................................................................... 15710.1. Enhancement Requests ..................................................................................... 15710.2. Problem Report ............................................................................................... 157
A. GNU General Public License ........................................................................................ 158A.1. Preamble ......................................................................................................... 158A.2. TERMS AND CONDITIONS FOR COPYING, DISTRIBUTION ANDMODIFICATION .................................................................................................... 159
A.2.1. Section 0 .............................................................................................. 159A.2.2. Section 1 .............................................................................................. 159A.2.3. Section 2 .............................................................................................. 159A.2.4. Section 3 .............................................................................................. 160A.2.5. Section 4 .............................................................................................. 160A.2.6. Section 5 .............................................................................................. 160A.2.7. Section 6 .............................................................................................. 161A.2.8. Section 7 .............................................................................................. 161
CodeAnalyst User's Manual
vi
A.2.9. Section 8 .............................................................................................. 161A.2.10. Section 9 ............................................................................................ 161A.2.11. Section 10 ........................................................................................... 162A.2.12. NO WARRANTY Section 11 ................................................................. 162A.2.13. Section 12 ........................................................................................... 162
A.3. How to Apply These Terms to Your New Programs ................................................ 162B. Features List .............................................................................................................. 164
B.1. New Features in CodeAnalyst 3.0 ........................................................................ 164B.2. New Features in CodeAnalyst 2.9 ........................................................................ 164B.3. New Features in CodeAnalyst 2.8 ........................................................................ 164B.4. New Features in CodeAnalyst 2.7 ........................................................................ 164B.5. New Features in CodeAnalyst 2.6 ........................................................................ 165
Bibliography ................................................................................................................... 166Index ............................................................................................................................ 167

vii
List of Figures2.1. Project Panel ............................................................................................................... 42.2. Status bar .................................................................................................................... 42.3. Toolbars - inactive and active ......................................................................................... 52.4. Floating and docking toolbars ......................................................................................... 52.5. Profile menu and toolbar ............................................................................................... 72.6. Tools menu and toolbar ................................................................................................. 82.7. Active and Inactive Icons .............................................................................................. 82.8. Windows Menu ............................................................................................................ 92.9. Cascading session panes .............................................................................................. 102.10. Tiling session panes .................................................................................................. 112.11. Help menu ............................................................................................................... 112.12. System Data tab: Aggregated by Module ....................................................................... 122.13. System Data tab: Aggregated by Process ....................................................................... 132.14. Single Module Data tab ............................................................................................. 142.15. Source and Disassmbly Mode in Src/Dasm mode ............................................................ 152.16. Source and Disassembly Tab in Disassembly-only Mode .................................................. 152.17. Code Density Chart ................................................................................................... 162.18. A drop-down list provides choices for selecting code density. ............................................ 162.19. Session Settings ........................................................................................................ 172.20. Edit event configuration ............................................................................................. 182.21. Global View Management .......................................................................................... 192.22. Configuration management ......................................................................................... 202.23. CodeAnalyst Options ................................................................................................. 212.24. CodeAnalyst Options ................................................................................................. 222.25. Aggregate samples into instance of in-line function ......................................................... 232.26. Aggregate samples into original in-line function ............................................................. 242.27. Aggregate samples into basic blocks ............................................................................. 252.28. Assess Performance Configuration (with 1 msec MUX Interval) ........................................ 272.29. Import Wizard .......................................................................................................... 302.30. Select "Export System Data" ....................................................................................... 352.31. Specify output CSV file ............................................................................................. 362.32. Import CSV into a spreadsheet .................................................................................... 362.33. Session Settings Dialog .............................................................................................. 372.34. Session Settings Dialog: General Tab ........................................................................... 382.35. Session Settings Dialog: Advance Tab .......................................................................... 402.36. Session Settings Dialog: Note Tab ............................................................................... 412.37. Session Settings Dialog: OProfiled Log Tab (Property Mode Only) .................................... 422.38. Process Filter Dialog ................................................................................................. 472.39. Command line switches to opcontrol ............................................................................ 482.40. Listing events: opcontrol -l ......................................................................................... 502.41. OProfile Daemon/Driver Monitoring Tool ..................................................................... 523.1. Time spent in each software module (TBP) ..................................................................... 553.2. Time spent in each function within an application (TBP) .................................................... 553.3. Time spent at source-level hot-spot (TBP) ....................................................................... 563.4. Retired instructions, DC accesses and misses per software module (EBP) .............................. 583.5. Retired instructions, DC accesses and misses for source-level hot-spot (EBP) ......................... 583.6. IBS op samples for each software module ....................................................................... 613.7. Attribution of IBS op samples to source-level hot-spot ....................................................... 613.8. CodeAnalyst Options ................................................................................................... 653.9. Module data view of basic block aggregation ................................................................... 653.10. Basic block information in Disassembly View ................................................................ 66

CodeAnalyst User's Manual
viii
3.11. Basic block pop-up menu ........................................................................................... 663.12. Aggregate into in-line instance .................................................................................... 673.13. Aggregate into in-line function .................................................................................... 683.14. Annotated inlined instances ......................................................................................... 693.15. Enabling CSS Profiling in Advanced tab of the Session Settings dialog ............................... 703.16. Invoke kcachgrind from Session Explorer ...................................................................... 713.17. Launch Kcachgrind with CSS data ............................................................................... 714.1. Edit timer configuration ............................................................................................... 744.2. Edit EBS/IBS configuration .......................................................................................... 754.3. Edit EBS/IBS configuration: Selected Events Tab ............................................................. 764.4. Edit EBS/IBS configuration: Description Tab .................................................................. 774.5. Edit EBS/IBS configuration: Perf Counter Tab ................................................................. 774.6. Edit EBS/IBS configuration: IBS Fetch / Op Tab .............................................................. 784.7. Edit EBS/IBS configuration: Import Tab ......................................................................... 784.8. Edit EBS/IBS configuration: Info Tab ............................................................................ 794.9. Configuration Management ........................................................................................... 814.10. Edit timer configuration ............................................................................................. 824.11. Edit events configuration ............................................................................................ 825.1. New Project Properties ................................................................................................ 845.2. Session Settings .......................................................................................................... 855.3. Task Bar Display ........................................................................................................ 865.4. System Data results ..................................................................................................... 865.5. View Management ...................................................................................................... 875.6. Aggregate by Processes ............................................................................................... 885.7. New Project Properties ................................................................................................ 895.8. Session Settings .......................................................................................................... 895.9. Launch Application ..................................................................................................... 905.10. Performance Data Results ........................................................................................... 915.11. View Management .................................................................................................... 925.12. Aggregate by Processes .............................................................................................. 935.13. New Project Properties ............................................................................................... 945.14. Session Settings ........................................................................................................ 955.15. Output from IBS Profile Session .................................................................................. 965.16. IBS Profile with "All Data" view when selecting large number of IBS-derived events ............. 975.17. IBS All Ops ............................................................................................................. 975.18. View Management .................................................................................................... 985.19. Edit EBS/IBS configuration ........................................................................................ 997.1. List of Views ........................................................................................................... 1047.2. Global View Management Dialog ................................................................................ 106

1
Chapter 1. Introduction1.1. Overview
AMD CodeAnalyst is a suite of tools to assist performance analysis and tuning. Chapter 2, Featuresprovides a summary of CodeAnalyst features and concepts. It is essential reading for all CodeAnalyst users.
Chapter 8, Tutorial provides step-by-step directions for using CodeAnalyst. In order to get an overallimpression of the CodeAnalyst workflow, please read following sections of these tutorials:
• Section 8.2, “Tutorial - Prepare Application”
• Section 8.3, “Tutorial - Creating a CodeAnalyst Project”
• Section 8.4, “Tutorial - Analysis with Time-Based Sampling Profile”
• Section 8.5, “Tutorial - Analysis with Event-Based Sampling Profile”
• Section 8.6, “Tutorial - Analysis with Instruction-Based Sampling Profile”
The following sections describe different areas of the CodeAnalyst configurations and workflow in detail.
• Section 2.3, “CodeAnalyst Options”
• Section 2.5, “Importing Profile Data into CodeAnalyst”
• Section 2.6, “Exporting Profile Data from CodeAnalyst”
• Section 2.7, “Session Settings”
• Chapter 3, Types of Analysis
• Chapter 4, Configure Profile
• Chapter 5, Collecting Profile
• Chapter 7, View Configuration
1.1.1. Preparing an Application for ProfilingAMD CodeAnalyst uses debug information produced by a compiler. Debug information is not requiredfor CodeAnalyst profiling, but it is required for source-level annotation. Performance data can be collectedfor an application program that was compiled without debug information, but the results displayed byCodeAnalyst are less descriptive. For example, CodeAnalyst will not be able to display function names orsource code. (Assembly code is displayed instead.) When compiling an application in release mode, thedeveloper can still produce the debug information so that AMD CodeAnalyst can perform its analysis.
1.1.2. Compiling with the GNU GCC CompilerWhen using GNU GCC to compile the application in general, specify the option -g to produce debugginginformation. Please refer to section "Options for Debugging Your Program or GCC" of the gcc Linux®manual page (man gcc) for more detail.

2
Chapter 2. Features2.1. Overview of AMD CodeAnalyst2.1.1. Program Performance Tuning
The program performance tuning cycle is an iterative process:
1. Measure program performance.
2. Analyze the results and identify program hot-spots.
3. Identify the cause for any performance issues in the hot-spots.
4. Change the program to remove performance issues.
AMD CodeAnalyst assists all four steps by collecting performance data, by analyzing and summarizing theperformance data, and by presenting it graphically in many useful forms (tables, charts, etc.). CodeAnalystdirectly associates performance information with software components such as processes, modules,functions and source lines. CodeAnalyst helps to identify the cause for a performance issue and wherechanges need to be made in the program.
The performance tuning cycle resembles the classic "scientific method" where a hypothesis (aboutperformance) is made and then the hypothesis is tested through measurement. Measurement and analysisprovide an objective basis for tuning decisions.
Performance analysis and tuning with CodeAnalyst consists of six steps:
1. Prepare the application for analysis by compiling with debug information turned on (an optional step).
2. Select the kind of data to be gathered by choosing one of several predefined profile configurations.
3. Configure run options such as the application program to be launched, the duration of data collection,etc.
4. Start and perform data collection.
5. Review and interpret the summarized results produced by CodeAnalyst.
6. Make changes to the program's algorithm and source code, recompile/link, and analyze again.
2.1.2. Types of AnalysisAMD CodeAnalyst is a suite of tools that help improve the performance of an application program orsystem. CodeAnalyst provides several different ways of collecting and analyzing performance data.
• Time-based profiling (TBP) shows where the application program or system is spending most of itstime. This kind of analysis identifies hot-spots that are good candidates for tuning and optimization.After making changes to the code, time-based profiling can evaluate, measure, and assess improvementsto performance. It can also verify that the modifications improved execution speed and calculate by howmuch. Please see Section 3.2, “Time-Based Profiling Analysis” for more detail.
• Event-based profiling (EBP) uses the performance monitoring hardware in AMD processors toinvestigate hot-spots. This kind of analysis identifies potential performance issues such as poor dataaccess patterns that cause cache misses. An event-based profile can identify the reason for a performanceissue as well as the code regions that may be performance culprits. Event-based profiling can test

Features
3
hypotheses about a performance issue to identify and resolve it. When multiple events are sampled, anevent profile shows the proportion of one event to another. See Section 9.1, “Performance MonitoringEvents (PME)” for descriptions of the events supported by AMD processors. Please see Section 3.3,“Event-Based Profiling Analysis” for more detail.
• Instruction-based sampling (IBS) also uses the performance monitoring hardware. This kind ofanalysis identifies the likely cause of certain performance issues and associates those issues preciselyto specific source lines and instructions. Please see Section 3.4, “Instruction-Based Sampling Analysis”for more detail.
• Basic Block Analysis statically analyzes the assembly instructions to identify basic blocks andaggregates data accordingly. Please see Section 3.5, “Basic Block Analysis” for more detail.
• In-line Analysis allows users to aggregate samples into either in-line functions or in-line instance.Please see Section 3.6, “In-Line Analysis” for more detail.
• Call-Stack Sampling (CSS) Analysis allows users to identify hot call-paths in the application. Pleasesee Section 3.7, “Call-Stack Sampling Analysis” for more detail.
Analysis usually begins with time-based profiling in order to find time-critical and time-consumingsoftware components. Event-based profiling or instruction-based sampling is usually employed next inorder to determine why a section of code is running more slowly than it should.
2.1.3. Flexible, System-Wide Data CollectionCodeAnalyst's data collection is system-wide, so performance data is collected about all softwarecomponents that are executing on the system, not just the application program itself. CodeAnalyst collectsdata on application programs, dynamically loaded libraries, device drivers, and the operating systemkernel. CodeAnalyst can be configured to monitor the system as a whole by not specifying an applicationprogram to be launched when data collection is started. Time-based profiling, event-based profiling, andinstruction-based sampling collect data from multiple processors in a multiprocessor system. CodeAnalystcan also be used to analyze Java just-in-time (JIT) code.
2.1.4. Summarized Results with Drill-downCodeAnalyst summarizes and displays performance information in a hierarchical fashion. TheCodeAnalyst graphical user interface organizes and displays information at each of these levels andprovides drill-down. Thus, CodeAnalyst provides an overview of available performance data (by processor by module) followed by drill-down to functions within a module, to source lines within a function, oreven the instructions that are associated with a line of source code.
2.1.5. Graphical User InterfaceThe CodeAnalyst graphical user interface (GUI) provides an interactive workspace for the collectionand analysis of program and system performance data. Users can also run profiling via a command-lineinterface and subsequently import the profile results into the CodeAnalyst GUI for viewing.
2.1.6. Projects and SessionsThe CodeAnalyst GUI uses a project- and session-oriented user interface. A project retains importantsettings to control a performance experiment such as the application program to launch and analyze,settings that control data collection, etc. A project also organizes performance data into sessions. ACodeAnalyst session is created when performance data is collected through the GUI or when profile datais imported into the project. (The Oprofile command line utility is an alternative method for collectingdata.) Session data is persistent and can be recalled at a later time. Sessions can be renamed and deleted.
Features
4
2.1.7. Basic Steps for AnalysisThe CodeAnalyst graphical user interface provides features to set up a performance experiment, run theexperiment while collecting data, and display the results. The basic steps are:
1. Open an existing project or create a new project.
2. Set up basic run parameters like the program to launch, the working directory, etc.
3. Select a predefined profile (data collection) configuration.
4. Collect a time-based profile, event-based profile, or IBS-based profile as selected by the profileconfiguration.
5. View and explore the results.
6. Save the project and session data to review it later or to share it.
2.2. Exploring the Workspace and GUIThe Exploring the Workspace and GUI section serves as a visual guide to options and related screens. Alloptions that have a separate information section contain links to that section.
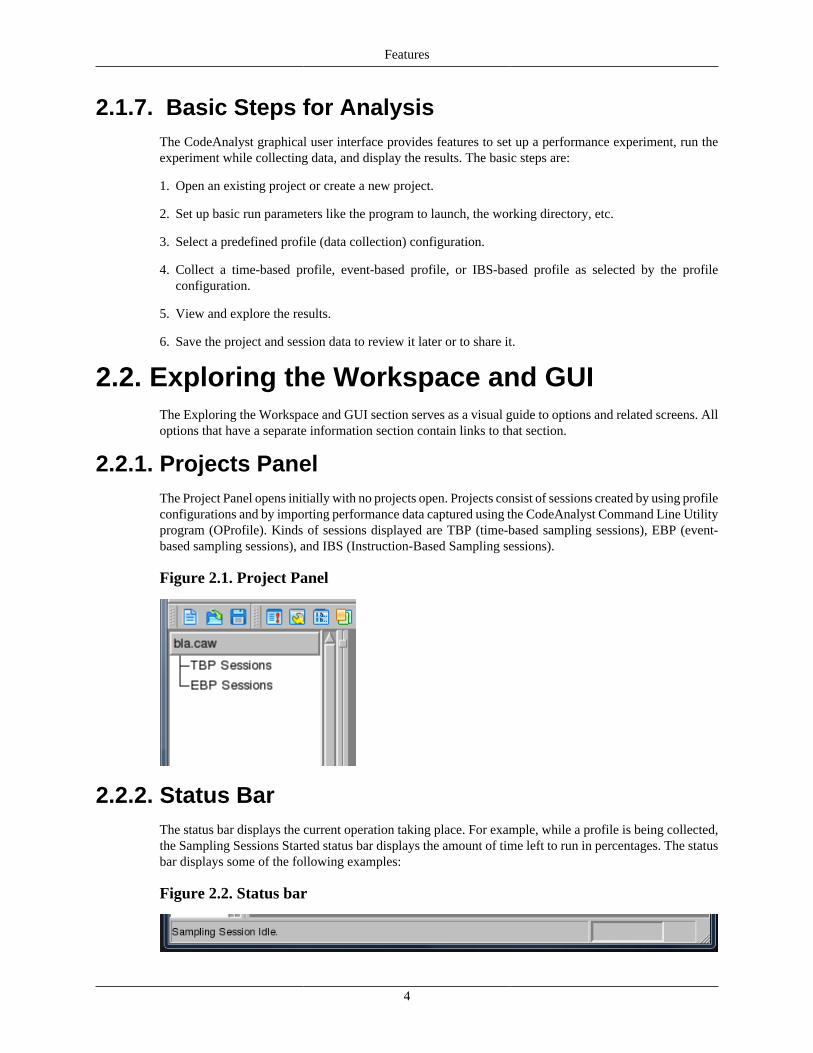
2.2.1. Projects PanelThe Project Panel opens initially with no projects open. Projects consist of sessions created by using profileconfigurations and by importing performance data captured using the CodeAnalyst Command Line Utilityprogram (OProfile). Kinds of sessions displayed are TBP (time-based sampling sessions), EBP (event-based sampling sessions), and IBS (Instruction-Based Sampling sessions).
Figure 2.1. Project Panel
2.2.2. Status BarThe status bar displays the current operation taking place. For example, while a profile is being collected,the Sampling Sessions Started status bar displays the amount of time left to run in percentages. The statusbar displays some of the following examples:
Figure 2.2. Status bar

Features
5
2.2.3. ToolbarsThe CodeAnalyst tools consist of menu items and corresponding icons or drop-down lists. Most menuitems and icons are not active until after a session is opened (or a profile session is running), as shownin the following illustrations.
Figure 2.3. Toolbars - inactive and active
2.2.4. Floating and Docking Toolbar GroupsToolbar groups have the ability to be floated or docked in the workspace. Drag and drop a toolbar group
using the grip located to the left of the group. Drag into the work area until the border darkens, andrelease. The toolbar displays its group name in a header. Double-click on the toolbar name to automaticallyreturn it to the toolbar area. To replace it in its original position, drag and realign the group until the shapechanges (elongates) and then release the mouse. Following are examples of toolbars being docked andfloated.
Figure 2.4. Floating and docking toolbars

Features
6
Any single icon or groups of icons that include the grip bar can be moved around the work area. Thisincludes tools found only on specific tab windows.
2.2.5. Menus, Tools, and IconsCodeAnalyst provides a menu bar and three toolbars. The toolbars can float in any area of the workspace.
The following sections give descriptions and definitions of menus, tools, and icons available for creatingprojects, profile actions, and creating configurations.
2.2.6. File Menu and File Icons
The commands available in the File menu are shown in the following table. These icons also appear astoolbar group icons that can float or be docked.
Menu Command and Icon (Fast Key) Description
(Ctrl+N) Opens a new project. This opensthe Project Options dialog box.
(Ctrl+O) Opens an existing project. Thisopens a dialog box for navigatingto CodeAnalyst workspace files.Recently opened projects arelisted at the bottom of the Filemenu.
(Ctrl+O) Saves an open project.
Export System Data... Exports the project data to acomma separated value (CSV)formatted file. This action opens

Features
7
Menu Command and Icon (Fast Key) Description
the Save As dialog box of file typeCSV.
Import... Imports performance data filesgenerated by Oprofile command-line tools.
Close (Ctrl+W) Closes an open project.
Quit (Ctrl+Q) Closes the application.
2.2.7. Profile Menu and Toolbar Icon GroupThe Profile menu and icons are used to start, pause, and stop data collection. Options are also part ofthe toolbar in the Profile toolbar group, which includes the profile configuration to be used for collectingperformance data.
Figure 2.5. Profile menu and toolbar
The commands available for controlling data collection and for selecting the profile configuration areshown in the following table.
Icon Description
Start
Activates the sampling process in the same way aschoosing Start from the Sampling toolbar. This iconis in the active state when a project is open and thesampling process has not yet started.
Pause
Suspends the sampling process in the same wayas choosing Pause from the Sampling toolbar. Thisicon is red in the active state when a project is openand the sampling process is in progress.
Stop
Terminates the sampling process in the same way aschoosing Stop from the Sampling toolbar. This iconis red in the active state when a project is open andthe sampling process has started or has been paused.
[profile configurations] (Second list) Provides a list of pre-defined profileconfigurations for data collection. The profileconfiguration determines the performance data tobe collected (time-based, event-based, etc.). The listchanges according to which mode is selected. SeeChapter 4, Configure Profile for more details.

Features
8
2.2.8. Tools Menu and IconsThe Tools menu contains icons for modifying project options for the current project and application-levelCodeAnalyst options. These icons also appear as toolbar group icons that float or can be docked. As thelast illustration shows, the Session Settings icon is not active unless a session is opened.
Figure 2.6. Tools menu and toolbar
Figure 2.7. Active and Inactive Icons
The following table summarizes the Tools menu items and associated toolbar icons. Hovering the mouseover the icon displays the name as indicated in parentheses. Links under "Menu Command" go to thecorresponding section for more information. The rollover text is included to assist with similar namingconventions used.
Menu Command / Icons Description
Session Settings Use this icon to change the sessions settings (e.g.,time-based and event-based). Please see Section 2.7,“Session Settings” for more detail.
CodeAnalyst Options... Opens the CodeAnalyst Options dialog box. Allof the application level configuration options canbe changed. Please see Section 2.3, “CodeAnalystOptions” for more detail.
Configuration Management Profile configurations determine how performancedata is collected. Profiles configurations can bedefined by the user or predefined configurations canbe selected. For more information, see Chapter 4,Configure Profile.
View Management A "view" consists of a set of event data andcomputed performance measurements displayedtogether in a table or a graph. Use ViewManagement to open the View Configuration dialog
Features
9
Menu Command / Icons Description
box and to change the contents displayed in theview. Exchange content from the Available Datalist and the Column shown list. Items in theColumn Shown list appear in the View Managementwindow. Some views have prerequisites that mustbe met before they can be selected from theavailable data list. For more information, see ViewConfigurations.
The Manage button opens the view managementdialog for the currently selected view. Please seeSection 7.3, “View Management” for more detail.
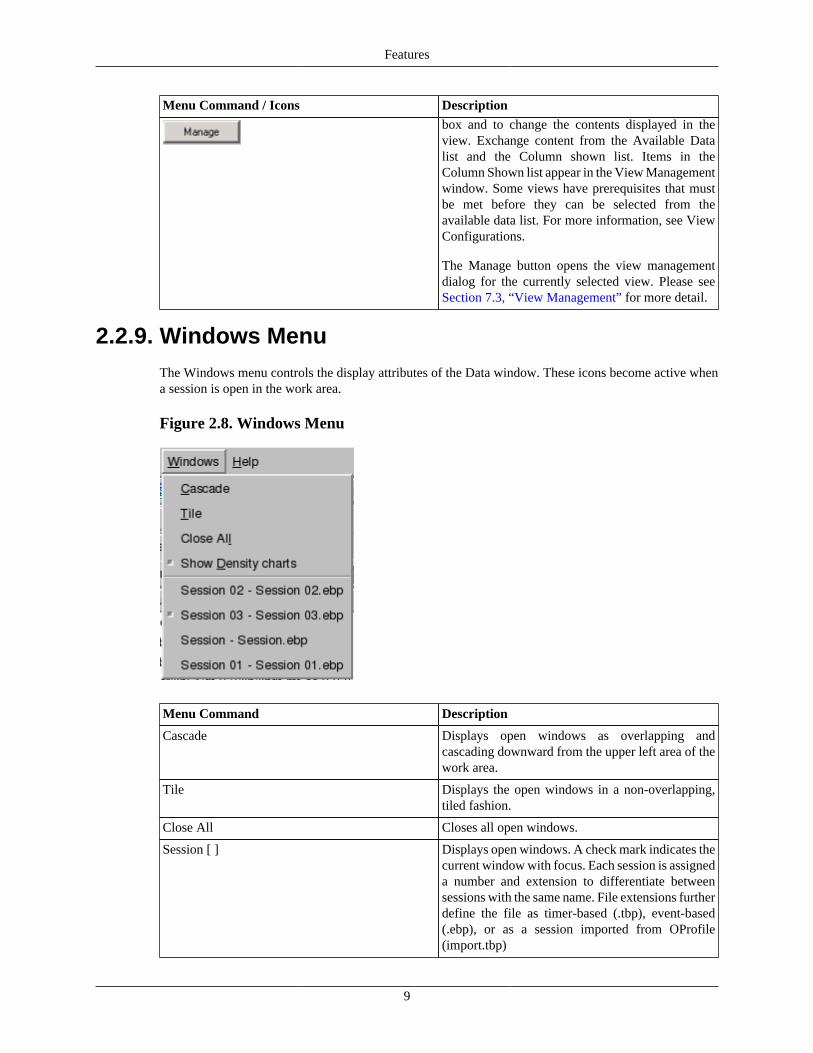
2.2.9. Windows MenuThe Windows menu controls the display attributes of the Data window. These icons become active whena session is open in the work area.
Figure 2.8. Windows Menu
Menu Command Description
Cascade Displays open windows as overlapping andcascading downward from the upper left area of thework area.
Tile Displays the open windows in a non-overlapping,tiled fashion.
Close All Closes all open windows.
Session [ ] Displays open windows. A check mark indicates thecurrent window with focus. Each session is assigneda number and extension to differentiate betweensessions with the same name. File extensions furtherdefine the file as timer-based (.tbp), event-based(.ebp), or as a session imported from OProfile(import.tbp)

Features
10
2.2.9.1. Cascading Session Panes
When two or more sessions are open, session panes can be cascaded. Following are examples of cascadingpanes.
Figure 2.9. Cascading session panes
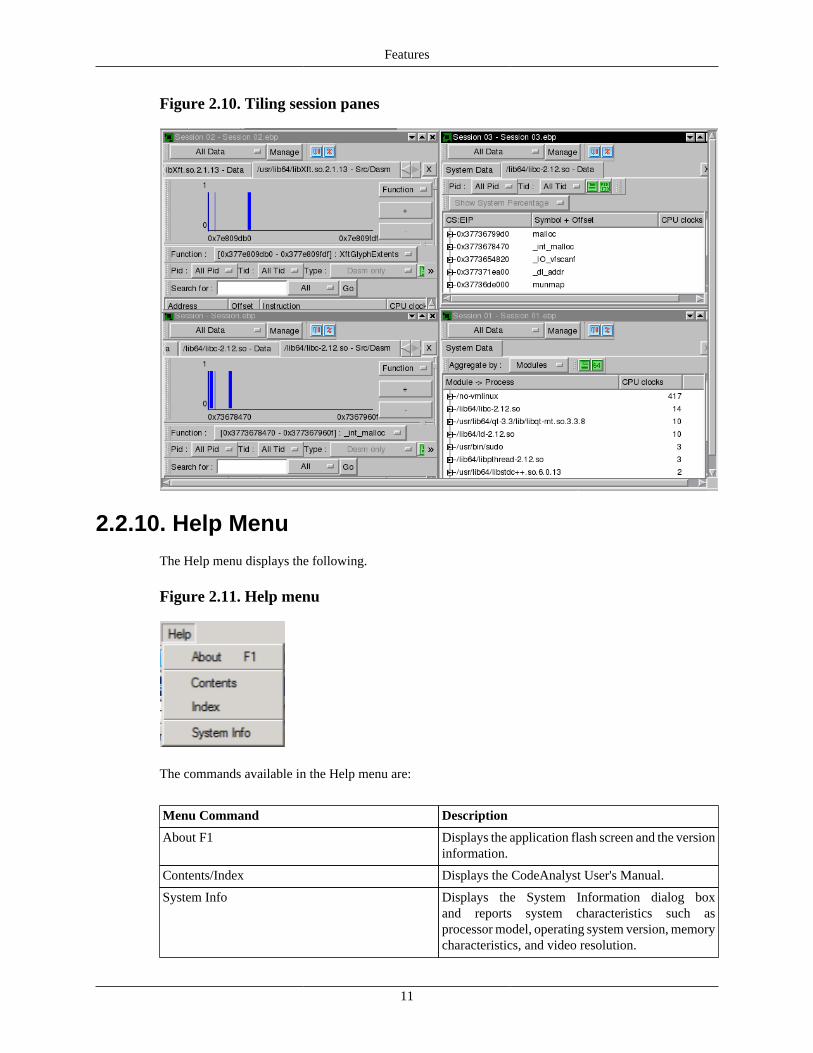
2.2.9.2. Tiling Session Panes
When two or more sessions are open, session panes can be tiled for viewing more than one pane at a time.Following are examples of tiled panes.
Features
11
Figure 2.10. Tiling session panes
2.2.10. Help MenuThe Help menu displays the following.
Figure 2.11. Help menu
The commands available in the Help menu are:
Menu Command Description
About F1 Displays the application flash screen and the versioninformation.
Contents/Index Displays the CodeAnalyst User's Manual.
System Info Displays the System Information dialog boxand reports system characteristics such asprocessor model, operating system version, memorycharacteristics, and video resolution.

Features
12
2.2.11. Data and Source DisplayThe profile results are shown in the form of data tables and annotated source code. In a time-based orevent-based profile session, the initial tabbed panel shows tabular system-wide profile data which can beaggregated by module or process. From this table, users can navigate further into the module and functionof interest. Source code display is organized to allow for drilling down into the selected function at thesource and disassembly level.
Additional interface elements are available. A drop-down list of preset views allows quick selection ofa new view. A view is a set of event data and computed performance measurements that display in eachcolumn of the table. The All Data view is the default view, which shows all available data in columns. Eachcolumn represents a distinct type of data or a computed performance measurement. Use the Section 7.3,“View Management” dialog box to change view configurations. Also, profile data can be shown in rawsamples or percentage. For multi-core systems, samples are shown for each core. Each column can besorted in ascending or descending order by clicking the column header. The 64-bit column distinguishesif samples are 32-bit modules or 64-bit modules.
2.2.11.1. System Data Tab
The System Data tab can be viewed in two modes. When aggregated by module, the tab lists the modulesand sample counts in descending sample count order. If the module is common in several processes, theprocesses are listed in the second level along with the PID. When aggregated by process, the tab lists theexecutables and sample counts in descending sample count order. If there are several processes that runthe same executable, the PIDs are listed in the second level. For each PID, the executable and dependencymodules are listed in the third level. In both modes, double-clicking on a module drills down to the TBPor EBP samples within the selected module which is displayed in the Single Module Data Tab.
Figure 2.12. System Data tab: Aggregated by Module
Features
13
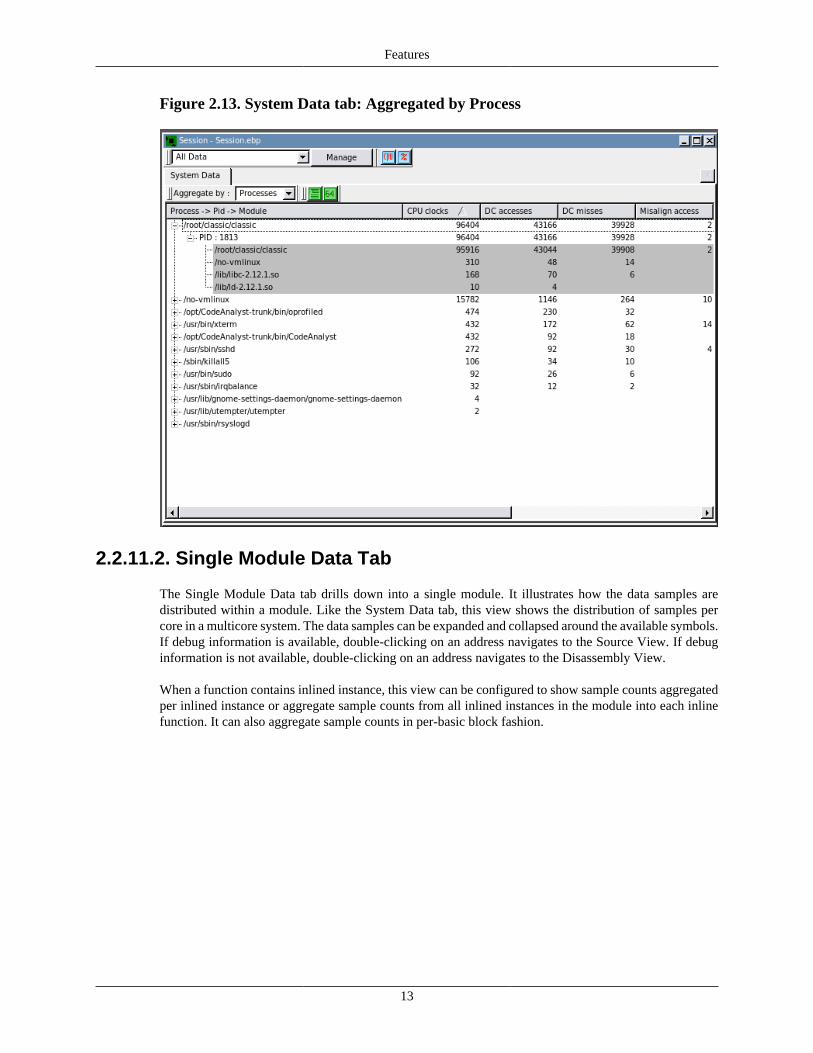
Figure 2.13. System Data tab: Aggregated by Process
2.2.11.2. Single Module Data Tab
The Single Module Data tab drills down into a single module. It illustrates how the data samples aredistributed within a module. Like the System Data tab, this view shows the distribution of samples percore in a multicore system. The data samples can be expanded and collapsed around the available symbols.If debug information is available, double-clicking on an address navigates to the Source View. If debuginformation is not available, double-clicking on an address navigates to the Disassembly View.
When a function contains inlined instance, this view can be configured to show sample counts aggregatedper inlined instance or aggregate sample counts from all inlined instances in the module into each inlinefunction. It can also aggregate sample counts in per-basic block fashion.

Features
14
Figure 2.14. Single Module Data tab
2.2.11.3. Source/Disassembly Tab
The Source/Dasm tab displays the source lines annotated with assembly instructions and/or inline instanceand sample count. The source line can be expanded or collapsed to show or hide the assembly instructionsthat are associated with the source line. When debug information is not available, only disassembly andsample counts will be displayed. Right-clicking on the source or disassembly line will reveal additionaloptions for the view such as to select copy the selection to a buffer (the clipboard). The information maythen be pasted into another document.

Features
15
Figure 2.15. Source and Disassmbly Mode in Src/Dasm mode
Figure 2.16. Source and Disassembly Tab in Disassembly-only Mode

Features
16
When viewing the Source/Disassembly tab in disassembly-only mode, it also displays basic blockinformation by interleaving different background colors of white and gray. Users can navigate throughcode execution paths from one basic block to the previous or the next basic block. Right-clicking at thebeginning of a basic block, opens a menu that lists the source addresses that are usually the destinationaddress of a control transfer instruction in some basic blocks. Right-click at the end of a basic block toopen a list with the destination address of the control transfer instruction.
When selecting multiple instructions on the Assembly tab, AMD CodeAnalyst displays a summary of theselection in the status bar of the Assembly window.
2.2.12. Code Density ChartSelecting "Show Density charts" under Windows toolbar menu displays a code density chart on the Source/Disassembly (Src/Dasm) tab. The chart on the Src/Dasm tab shows the number of samples relative to thelocation within the function or a user-specified area. The initial zoom level is at the function level and canalso be shown at partial view.
Figure 2.17. Code Density Chart
Figure 2.18. A drop-down list provides choices for selecting code density.
Features
17
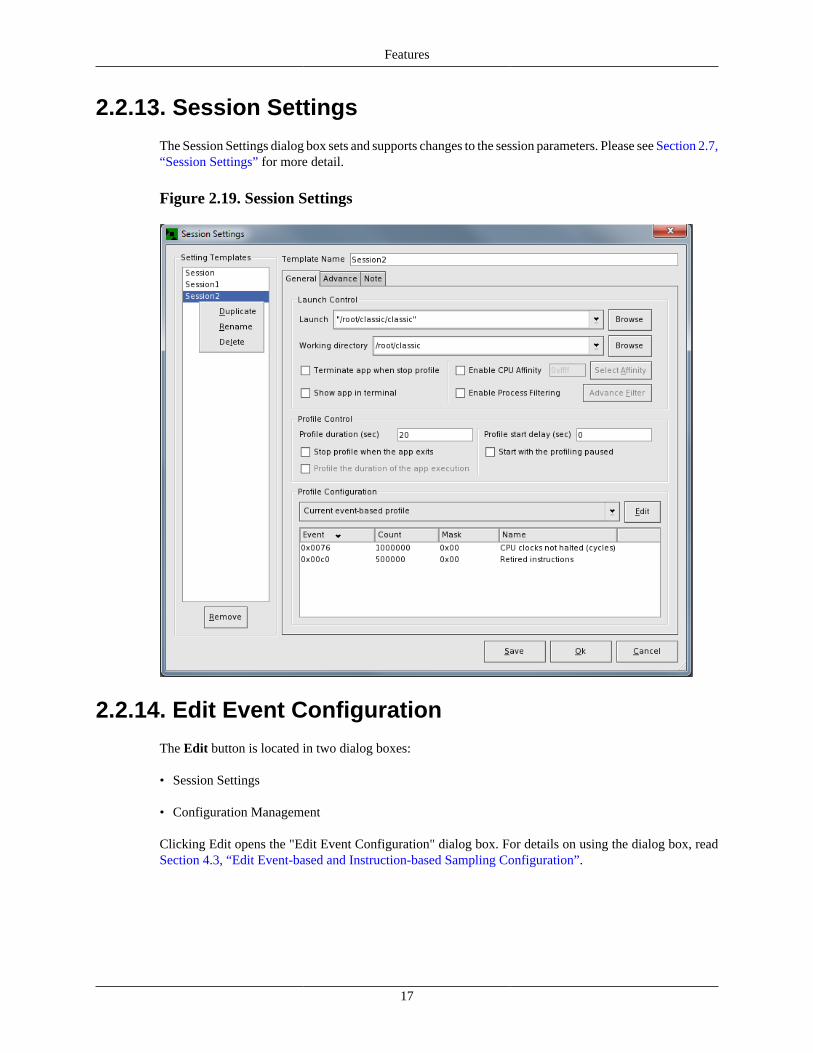
2.2.13. Session Settings
The Session Settings dialog box sets and supports changes to the session parameters. Please see Section 2.7,“Session Settings” for more detail.
Figure 2.19. Session Settings
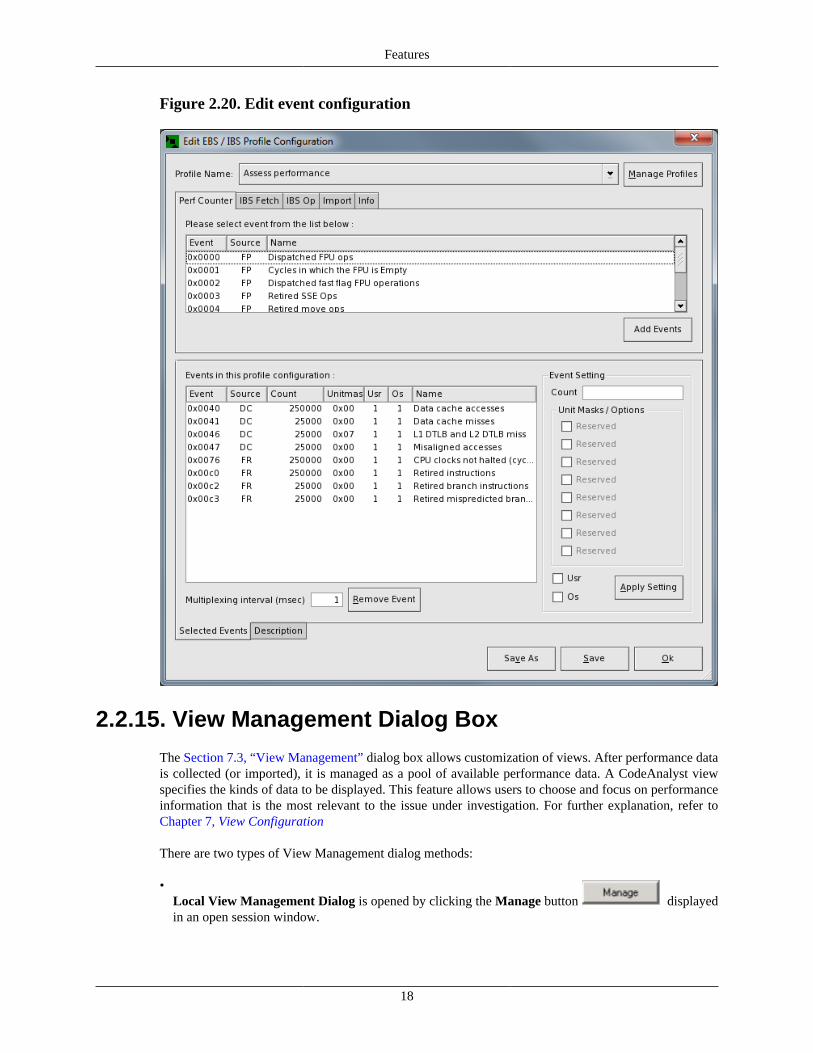
2.2.14. Edit Event Configuration
The Edit button is located in two dialog boxes:
• Session Settings
• Configuration Management
Clicking Edit opens the "Edit Event Configuration" dialog box. For details on using the dialog box, readSection 4.3, “Edit Event-based and Instruction-based Sampling Configuration”.
Features
18
Figure 2.20. Edit event configuration
2.2.15. View Management Dialog Box
The Section 7.3, “View Management” dialog box allows customization of views. After performance datais collected (or imported), it is managed as a pool of available performance data. A CodeAnalyst viewspecifies the kinds of data to be displayed. This feature allows users to choose and focus on performanceinformation that is the most relevant to the issue under investigation. For further explanation, refer toChapter 7, View Configuration
There are two types of View Management dialog methods:
•Local View Management Dialog is opened by clicking the Manage button displayedin an open session window.

Features
19
•
Global View Management Dialog is opened by selecting the Views icon from the toolbar orfrom the Tools menu.
For details using this dialog box, go to Section 7.3, “View Management”.
Figure 2.21. Global View Management
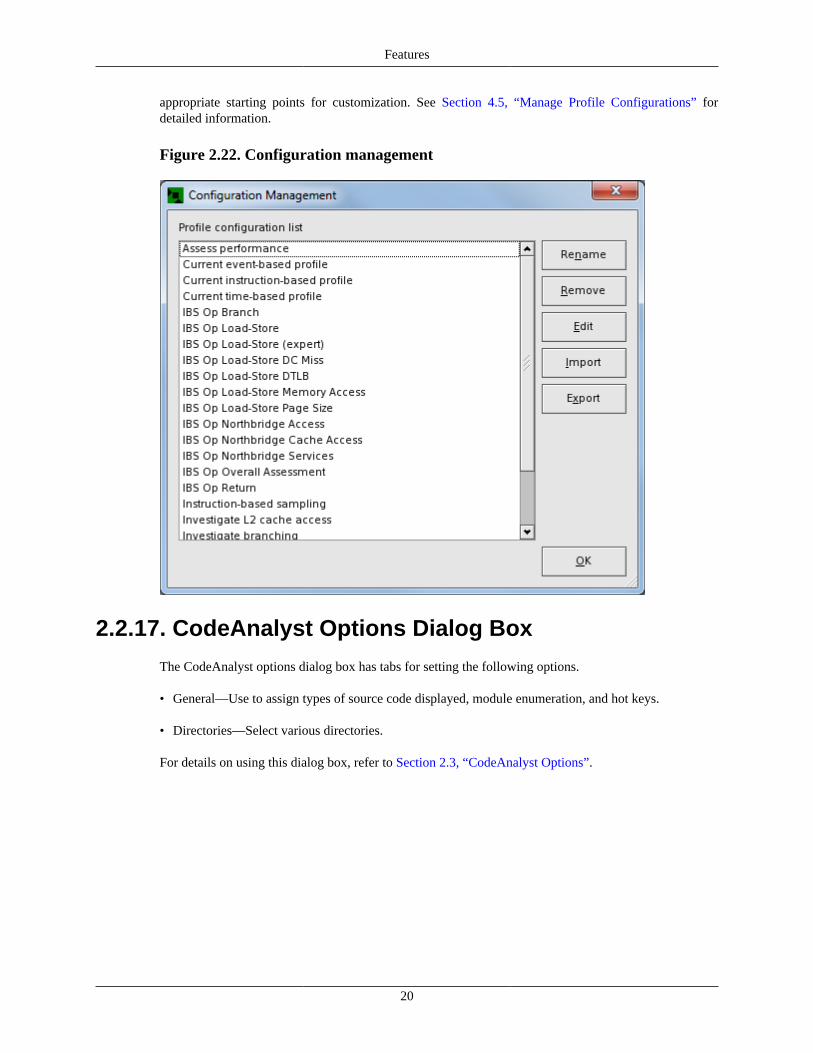
2.2.16. Configuration Management Dialog BoxPerformance data collection is controlled by profile configurations. A profile configuration specifies basicrun control parameters, types of data to collect, and how data is to be collected. Certain configurationscan be "managed" by the user to create new profile configurations. Specifications for basic run control,types of data collected, and how data is to be collected are determined through the configuration's profile.Predefined profile configurations and user-defined profile configurations are found in the ConfigurationManagement dialog box or in the toolbar list of profile configurations.
Configuration management allows for customizing existing profiles and for creating new ones.Configurations for both profiles and views are stored in files when CodeAnalyst is not running. Savingin this manner allows for easy sharing of files. Each user-created configuration is permanently stored asa file until it is removed by using the Remove button. See Section 4.5, “Manage Profile Configurations”for additional details.
Use the Configuration icon to open the dialog box.
2.2.16.1. Current-Type Profiles
The profile configuration list contains three "Current" configurations (Current time-based profile,Current event-based profile, Current instruction-based profile). These configurations are considered as
Features
20
appropriate starting points for customization. See Section 4.5, “Manage Profile Configurations” fordetailed information.
Figure 2.22. Configuration management
2.2.17. CodeAnalyst Options Dialog Box
The CodeAnalyst options dialog box has tabs for setting the following options.
• General—Use to assign types of source code displayed, module enumeration, and hot keys.
• Directories—Select various directories.
For details on using this dialog box, refer to Section 2.3, “CodeAnalyst Options”.

Features
21
Figure 2.23. CodeAnalyst Options
2.2.18. Profiling Java ApplicationsCodeAnalyst supports profiling of Java applications. The target Java application must be invoked withthe Java --agentpath option to specify the use of CodeAnalyst Java Profiling Agent. To launch a Javaapplication from within AMD CodeAnalyst:
1. In the launch field of the Session Settings Dialog, launch the Java command line with --agentpath:/opt/CodeAnalyst/lib/libCAJVMTIA32.so or --agentpath:/opt/CodeAnalyst/lib/libCAJVMTIA64.so
2. In the working directory field, type the path of Java application to be launched.
For example,
"/usr/bin/java" -agentpath:/opt/CodeAnalyst/lib/libCAJVMTIA32.so example1
where example1.class is in your working directory.
2.3. CodeAnalyst OptionsCodeAnalyst options control how AMD CodeAnalyst displays profile data and its toolbar and how it findssource and debug information. These options are persistent and are effective across projects and sessions.They affect the CodeAnalyst application as a whole.
CodeAnalyst options are changed using the CodeAnalyst Options dialog box. The dialog box containsfollowing tabs:

Features
22
• Section 2.3.1, “ General Tab”
• Section 2.3.2, “Directories Tab”
Open the CodeAnalyst Options dialog box by clicking the CodeAnalyst Options icon in the toolbar.Or you may open the CodeAnalyst Options dialog box by selecting Tools > CodeAnalyst Options fromthe pull-down menu.
2.3.1. General TabThe General tab controls the display of source code and disassembler instructions.
CodeAnalyst follows the usual Windows conventions for accepting or canceling changes to options.Clicking the Apply button activates the new options. Clicking the OK button activates the new optionsand closes the dialog box. Clicking the Cancel button closes the dialog box without applying changes.
Figure 2.24. CodeAnalyst Options
2.3.1.1. Source Code Display
If the Show disassembly only by default check box is selected, double-clicking a sample address in amodule opens the Source/Disassembly tab in Disassmbly only mode by default. Selecting the Alert whenno source is available check box displays an alert message when CodeAnalyst cannot find the sourcefor a module.
Features
23
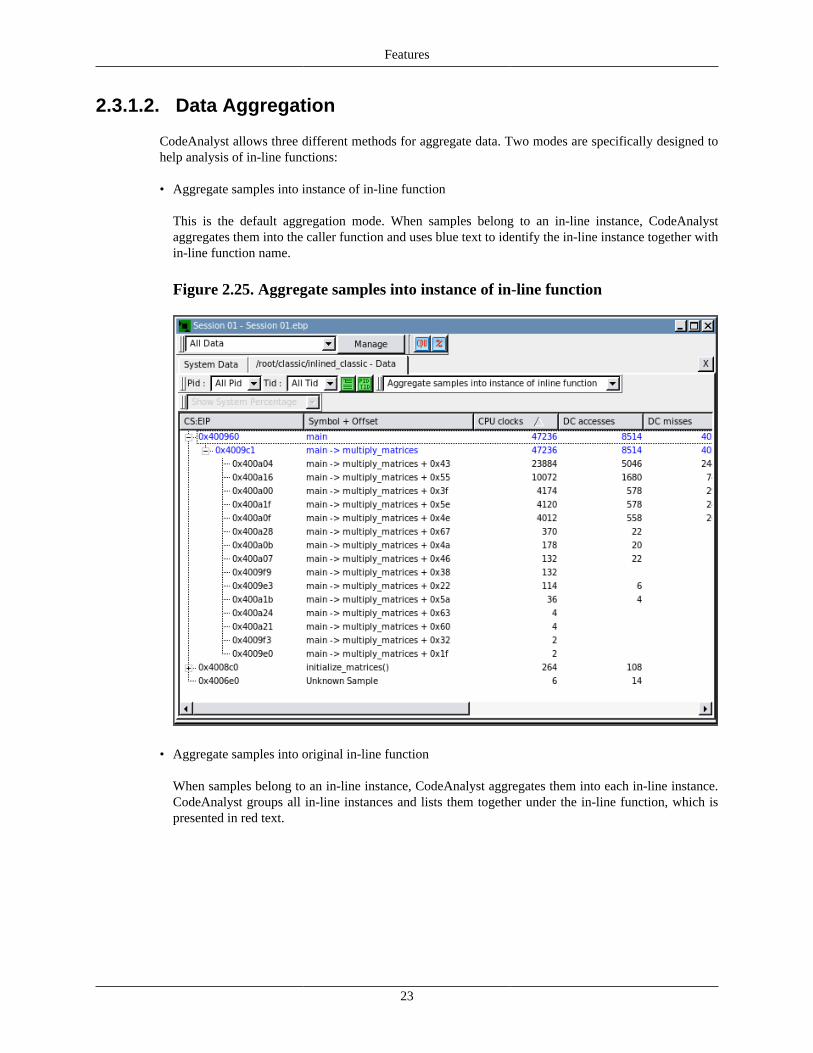
2.3.1.2. Data Aggregation
CodeAnalyst allows three different methods for aggregate data. Two modes are specifically designed tohelp analysis of in-line functions:
• Aggregate samples into instance of in-line function
This is the default aggregation mode. When samples belong to an in-line instance, CodeAnalystaggregates them into the caller function and uses blue text to identify the in-line instance together within-line function name.
Figure 2.25. Aggregate samples into instance of in-line function
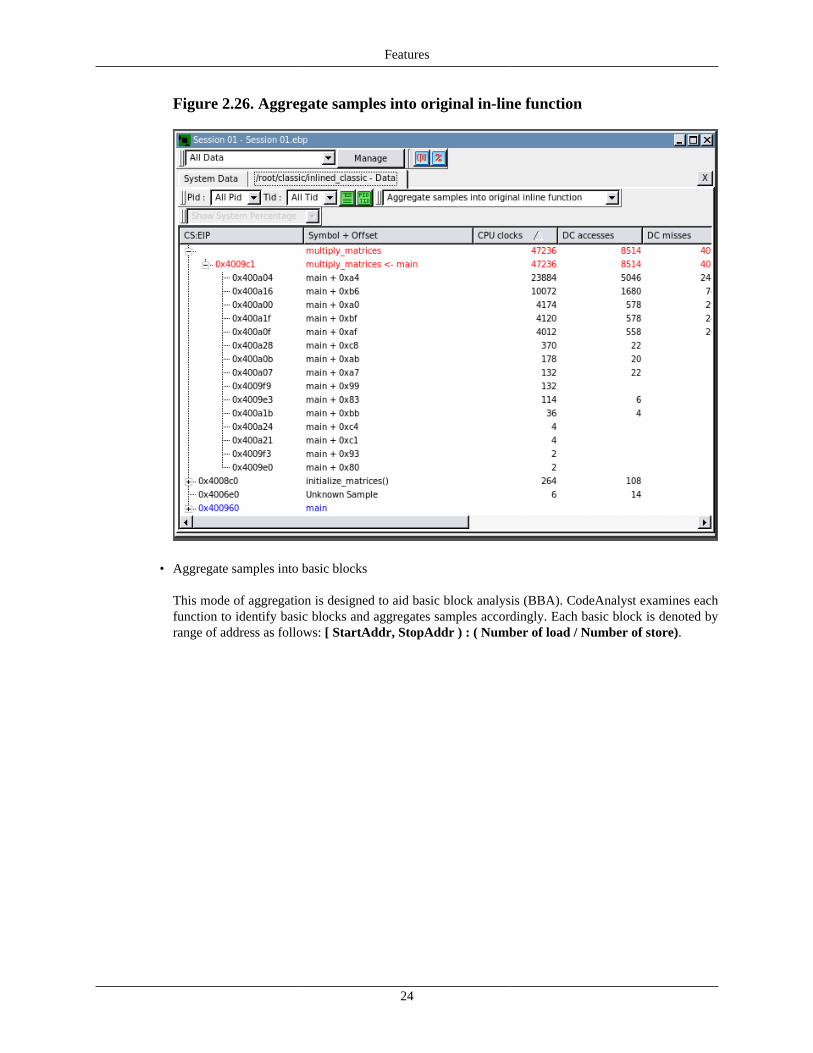
• Aggregate samples into original in-line function
When samples belong to an in-line instance, CodeAnalyst aggregates them into each in-line instance.CodeAnalyst groups all in-line instances and lists them together under the in-line function, which ispresented in red text.
Features
24
Figure 2.26. Aggregate samples into original in-line function
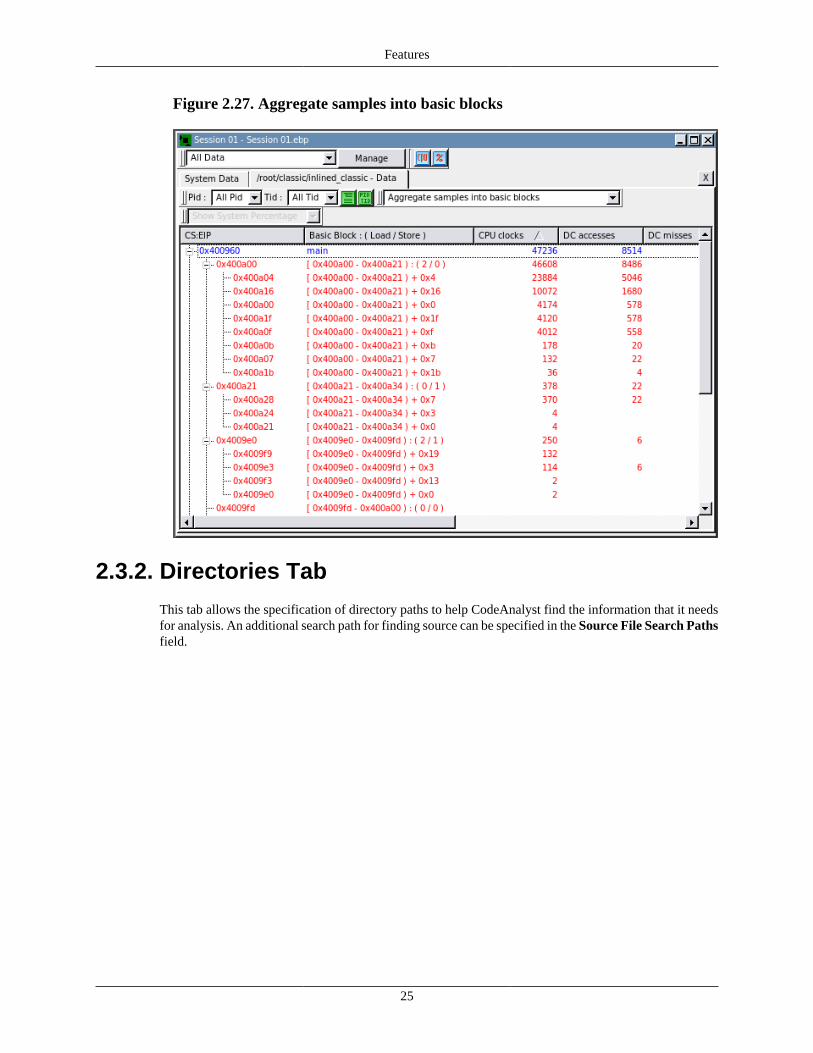
• Aggregate samples into basic blocks
This mode of aggregation is designed to aid basic block analysis (BBA). CodeAnalyst examines eachfunction to identify basic blocks and aggregates samples accordingly. Each basic block is denoted byrange of address as follows: [ StartAddr, StopAddr ) : ( Number of load / Number of store).
Features
25
Figure 2.27. Aggregate samples into basic blocks
2.3.2. Directories Tab
This tab allows the specification of directory paths to help CodeAnalyst find the information that it needsfor analysis. An additional search path for finding source can be specified in the Source File Search Pathsfield.

Features
26
2.4. Event Counter MultiplexingThe number of performance counters in AMD processors is often limited to a small number (i.e. 4 countersin most processor families). The number of performance events allowed in a profiling session is limited bythis hardware constraint. For instance, only four events could be measured per run. A minimum of two runswas needed to collect all data for five or more events. Event counter multiplexing removes this burden.
Event multiplexing is accomplished by re-programming the performance counters with the next set ofevents when a timer interrupt is generated by the driver. The interval between each timer can be specified inthe "Edit EBS/IBS Profile Configuration" dialog box. (See Section 4.3, “Edit Event-based and Instruction-based Sampling Configuration” for more information).
2.4.1. Example of Event Counter Multiplexing
In the Edit Event Configuration dialog (see Section 4.3, “Edit Event-based and Instruction-based SamplingConfiguration”), select the predefined profile configuration "Assess performance".
Features
27
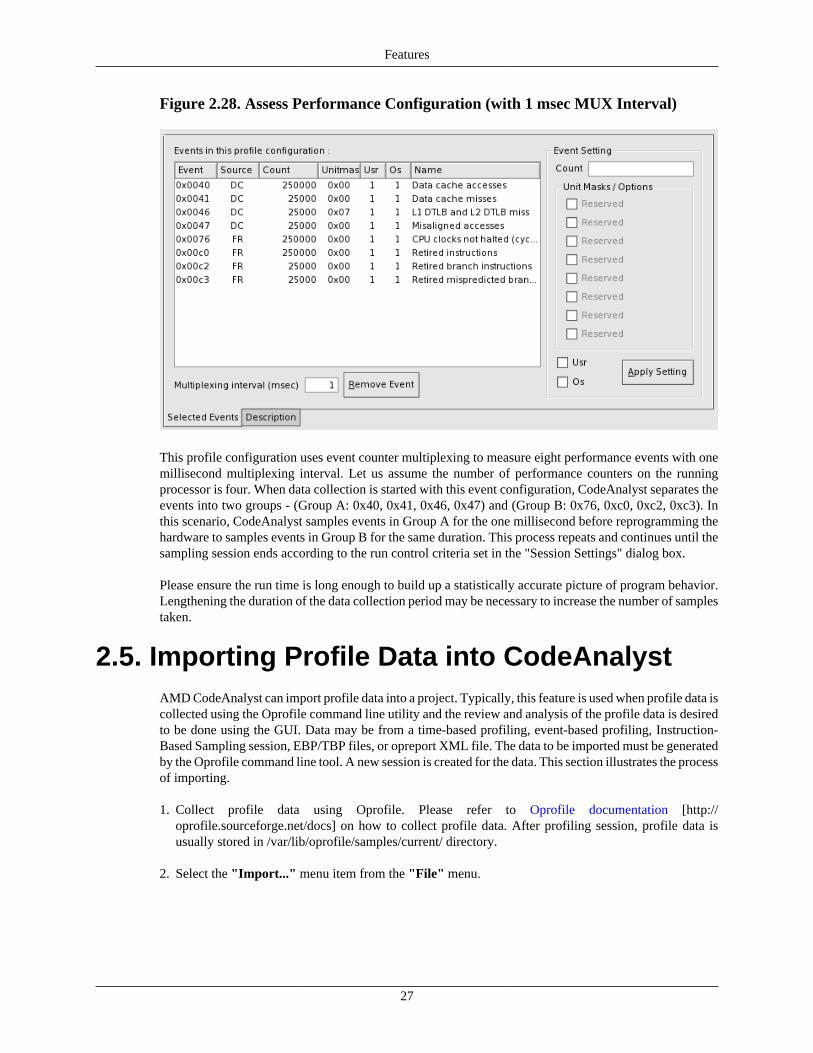
Figure 2.28. Assess Performance Configuration (with 1 msec MUX Interval)
This profile configuration uses event counter multiplexing to measure eight performance events with onemillisecond multiplexing interval. Let us assume the number of performance counters on the runningprocessor is four. When data collection is started with this event configuration, CodeAnalyst separates theevents into two groups - (Group A: 0x40, 0x41, 0x46, 0x47) and (Group B: 0x76, 0xc0, 0xc2, 0xc3). Inthis scenario, CodeAnalyst samples events in Group A for the one millisecond before reprogramming thehardware to samples events in Group B for the same duration. This process repeats and continues until thesampling session ends according to the run control criteria set in the "Session Settings" dialog box.
Please ensure the run time is long enough to build up a statistically accurate picture of program behavior.Lengthening the duration of the data collection period may be necessary to increase the number of samplestaken.
2.5. Importing Profile Data into CodeAnalystAMD CodeAnalyst can import profile data into a project. Typically, this feature is used when profile data iscollected using the Oprofile command line utility and the review and analysis of the profile data is desiredto be done using the GUI. Data may be from a time-based profiling, event-based profiling, Instruction-Based Sampling session, EBP/TBP files, or opreport XML file. The data to be imported must be generatedby the Oprofile command line tool. A new session is created for the data. This section illustrates the processof importing.
1. Collect profile data using Oprofile. Please refer to Oprofile documentation [http://oprofile.sourceforge.net/docs] on how to collect profile data. After profiling session, profile data isusually stored in /var/lib/oprofile/samples/current/ directory.
2. Select the "Import..." menu item from the "File" menu.

Features
28
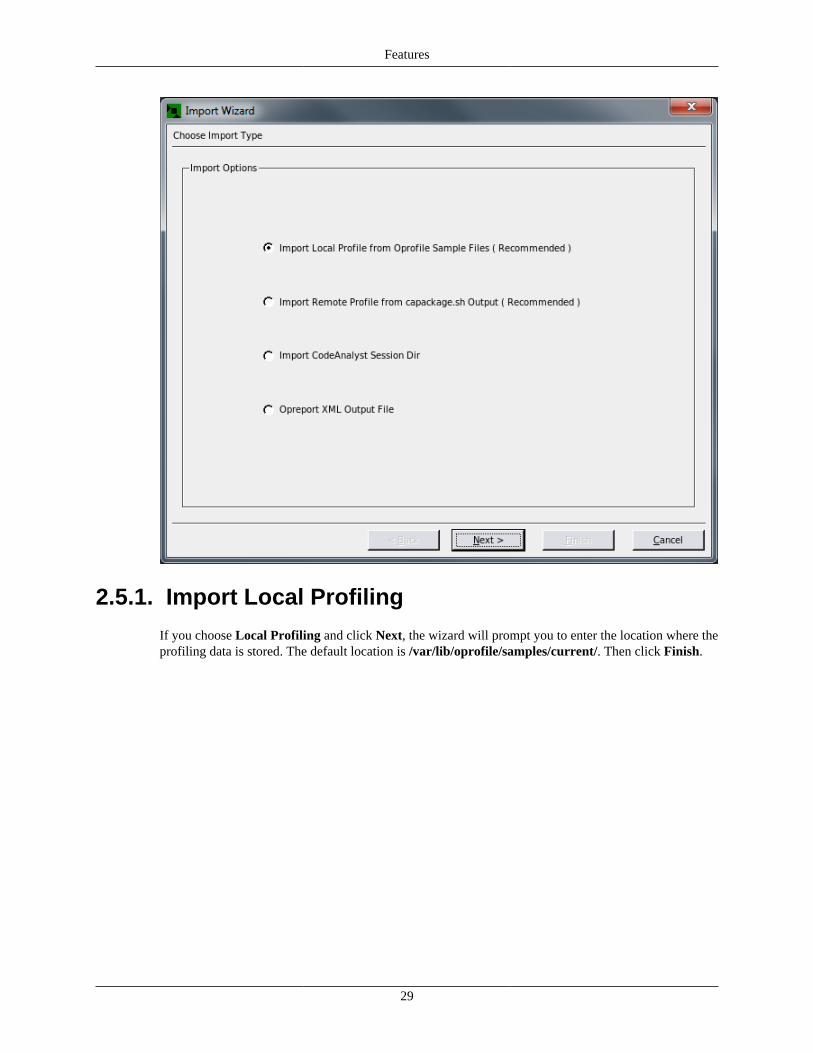
3. An Import Wizard dialog box appears. CodeAnalyst can import four types of profile data:
• Remote Profiling: In this mode, the profile data from a remote system can be packaged into acompressed tarball which is generated by a script called capackage.sh. Then, CodeAnalyst canimport the packaged file for analysis. (Advanced User only)
• Local Profile: In this mode, the profile data is generated on the local machine.
• TBP/EBP File: TBP/EBP files store profile data for each CodeAnalyst session. This can be importedinto different CodeAnalyst projects.
• Opreport's XML File: Opreport is an OProfile's commandline utility for viewing profile data intabulate style. It can also export data into an XML file.
Features
29
2.5.1. Import Local Profiling
If you choose Local Profiling and click Next, the wizard will prompt you to enter the location where theprofiling data is stored. The default location is /var/lib/oprofile/samples/current/. Then click Finish.
Features
30
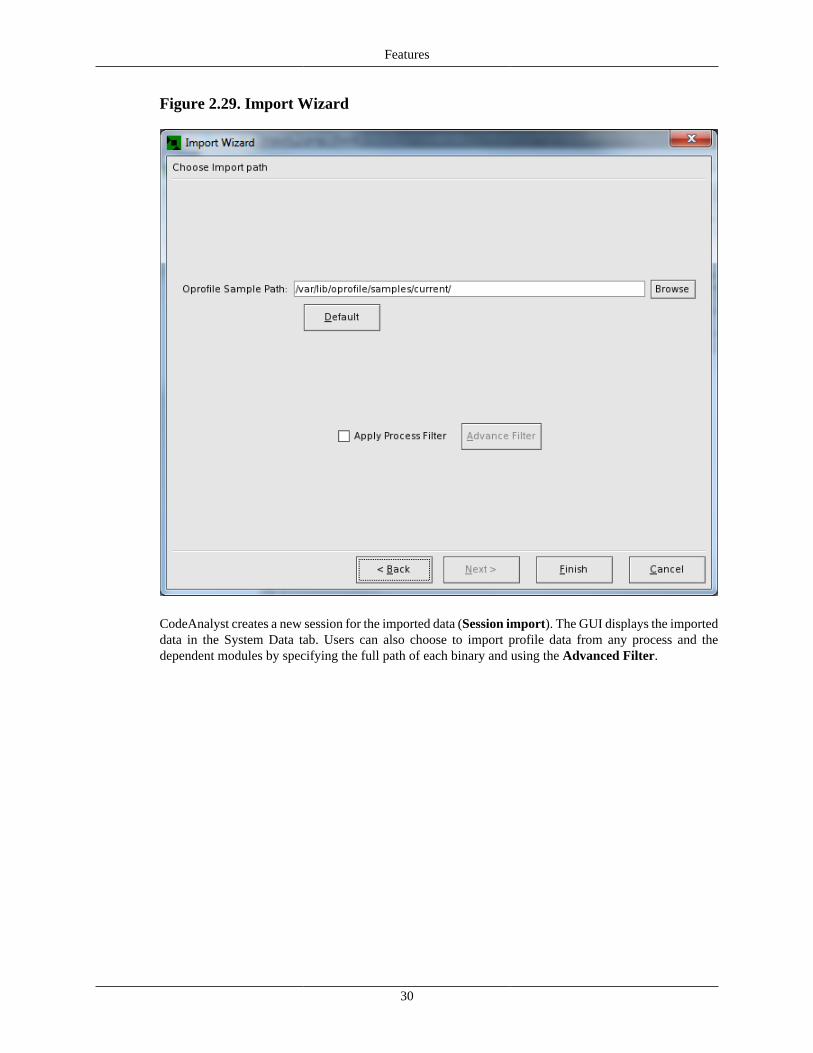
Figure 2.29. Import Wizard
CodeAnalyst creates a new session for the imported data (Session import). The GUI displays the importeddata in the System Data tab. Users can also choose to import profile data from any process and thedependent modules by specifying the full path of each binary and using the Advanced Filter.
Features
31
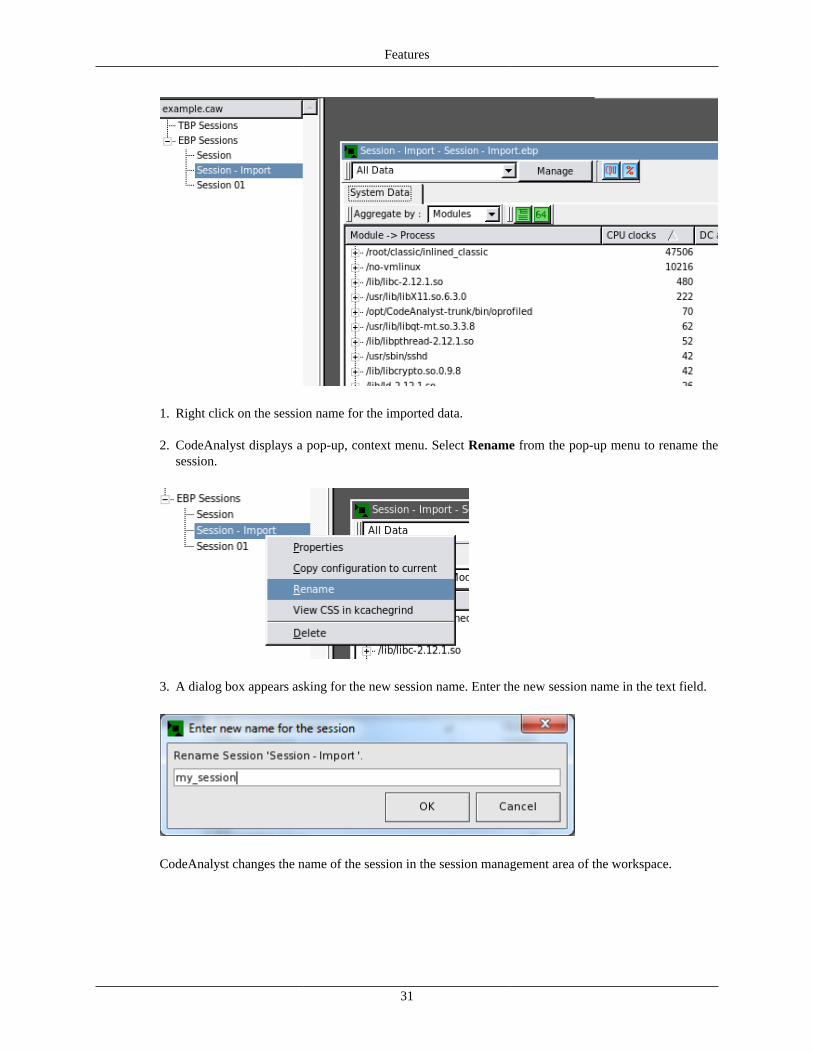
1. Right click on the session name for the imported data.
2. CodeAnalyst displays a pop-up, context menu. Select Rename from the pop-up menu to rename thesession.
3. A dialog box appears asking for the new session name. Enter the new session name in the text field.
CodeAnalyst changes the name of the session in the session management area of the workspace.

Features
32
2.5.2. Import Remote Profiling
When the graphical-user-interface is not available on the system, users can generate profile data using the"opcontrol" command-line tool (Please see Section 2.8, “CodeAnalyst and OProfile”). Once finished,the profiling information can be transferred to another system and viewed by the CodeAnalyst GUI.CodeAnalyst provides a tool called capackage.sh. It gathers information necessary for analyzing a sessionof profiling, and compresses it into an easily managed tarball (capacked.tar.gz). This tarball can then betransferred onto another system and imported into the CodeAnalyst GUI.
If you choose Remote Profiling and click Next,
The wizard prompts the user to enter the location of the tarball capacked.tar.gz output from capackage.sh.

Features
33
Once completed, click Finish and CodeAnalyst will untar capacked.tar.gz into the /tmp/CAxxxxxx/capacked/ directory, which contains the following sub-directories:
• binary—Stores the executable and modules used in profiling.
• current—Stores Oprofile samples.
• Java—Stores information related to Java profiling.
Then the importing process continues as described in Section 2.5.1, “ Import Local Profiling”.
2.5.3. Import CodeAnalyst Session Directory
CodeAnalyst stores profile data from each profile session in a directory. This directory generally containsTBP or EBP files and other intermediate data files. Importing the session directory allows users to easilymove profiling sessions between different CodeAnalyst projects. However, session properties are notavailable in this case.

Features
34
2.5.4. Import Opreport's XML Output FilesThis mode of import allows users to import the OProfile XML output file generated by the opreport utilityusing option "-X -w -d -l -o".
2.6. Exporting Profile Data from CodeAnalystAMD CodeAnalyst can export profile data from a table (such as the System Data tab or Processes tab)or source view. The data is exported as a file containing comma separated values (CSV.) This sectionillustrates the process of exporting data to a .CSV file.
1. With an open project and session, click the System Data tab and select the Export System Data...item from the File menu.
2. With an open project and session, select the Export System Data... item from the File menu.
Features
35
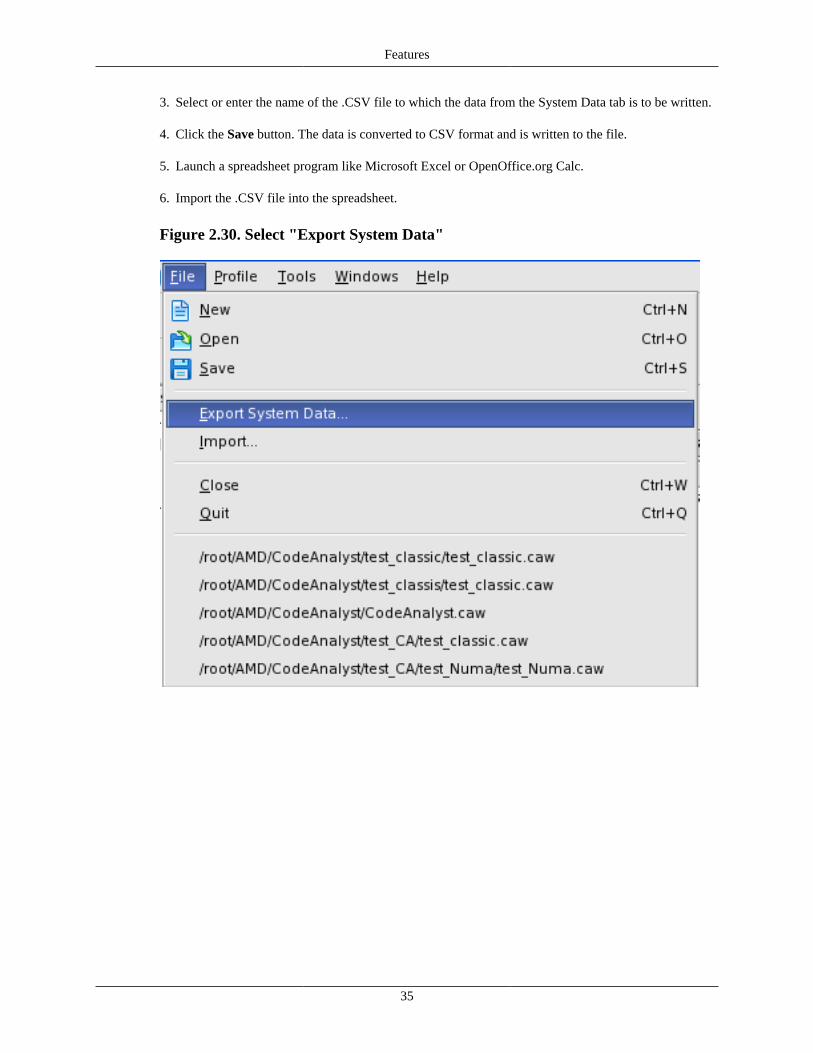
3. Select or enter the name of the .CSV file to which the data from the System Data tab is to be written.
4. Click the Save button. The data is converted to CSV format and is written to the file.
5. Launch a spreadsheet program like Microsoft Excel or OpenOffice.org Calc.
6. Import the .CSV file into the spreadsheet.
Figure 2.30. Select "Export System Data"

Features
36
Figure 2.31. Specify output CSV file
Figure 2.32. Import CSV into a spreadsheet

Features
37
2.7. Session SettingsThe "Session Settings" specify information that is needed to control performance data collection. SessionSettings are persistent and apply to future data collection sessions that are initiated within a project untilthe Session Settings are again changed.
Figure 2.33. Session Settings Dialog
2.7.1. Setting TemplatesOnce users finish configuring a data collection session, settings can be stored as a "setting template". Thecurrently selected template will be used to configure future data collection sessions. Stored templates arelisted in the "Setting Templates" field. When template selection changes, the dialog will re-populate eachfield with the settings previously stored. The template provides convenience when performing multipledata collection with different settings.
Right click on the selected template to show options to "Rename", create "Duplicate", or "Delete" eachtemplate. Renaming the current template can also be done simply by modifying the "Template Name" fieldand click "Save" or "Ok" button. Click the "Remove" button to remove the currently selected template.
NOTE that the modified template must be saved by clicking the "Save" or "Ok" button before selectinganother template.
2.7.2. General Tab
Features
38
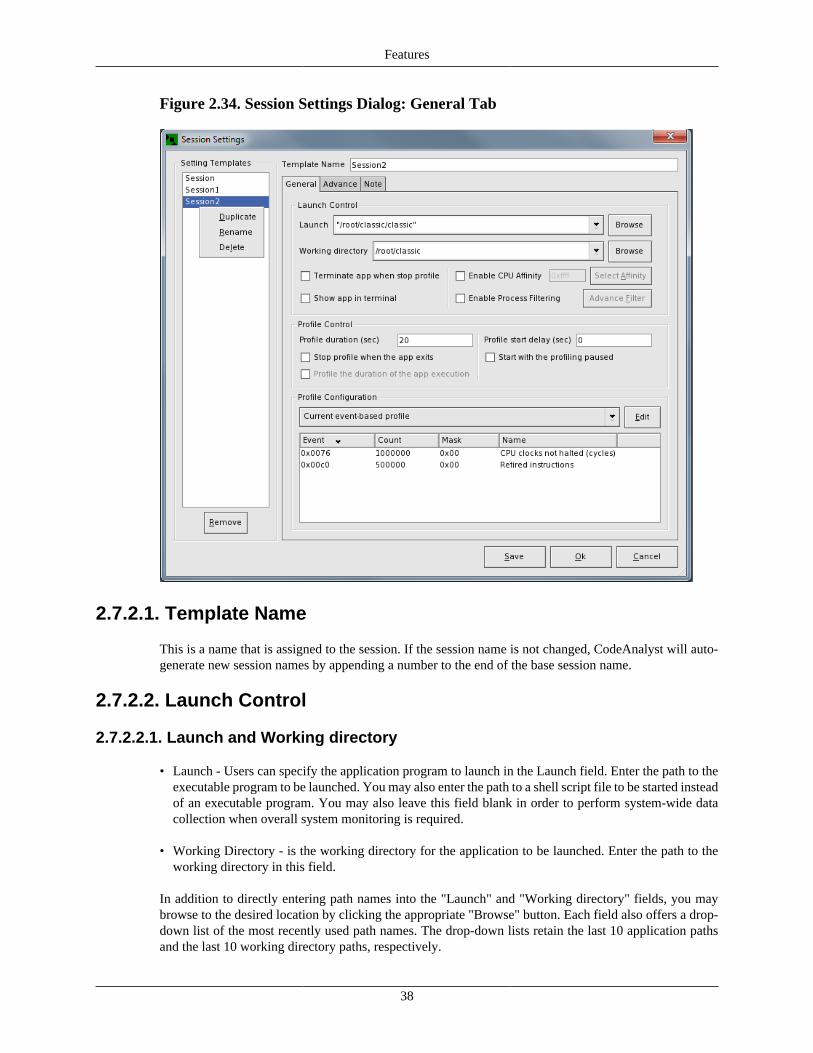
Figure 2.34. Session Settings Dialog: General Tab
2.7.2.1. Template Name
This is a name that is assigned to the session. If the session name is not changed, CodeAnalyst will auto-generate new session names by appending a number to the end of the base session name.
2.7.2.2. Launch Control
2.7.2.2.1. Launch and Working directory
• Launch - Users can specify the application program to launch in the Launch field. Enter the path to theexecutable program to be launched. You may also enter the path to a shell script file to be started insteadof an executable program. You may also leave this field blank in order to perform system-wide datacollection when overall system monitoring is required.
• Working Directory - is the working directory for the application to be launched. Enter the path to theworking directory in this field.
In addition to directly entering path names into the "Launch" and "Working directory" fields, you maybrowse to the desired location by clicking the appropriate "Browse" button. Each field also offers a drop-down list of the most recently used path names. The drop-down lists retain the last 10 application pathsand the last 10 working directory paths, respectively.

Features
39
2.7.2.2.2. Options
• Terminate the app after the profile - terminates the application at the completion of the profilesampling duration.
• Show app in terminal - Run the target application in a terminal. This option allows users to accessstdin/stdout/stderr from the command-line.
• Enable CPU Affinity - specifies the list of CPUs allowed to run the target application. (SeeSection 2.7.6, “Changing the CPU Affinity”)
• Enable Process Filter - filters out processes during data processing unless specified in "AdvanceFilter". (See Section 2.7.7, “Process Filter”)
2.7.2.3. Profile Control
• Stop data collection when the app exits - terminates the sampling process if the application terminates.This option is convenient when profiling small applications or if the shutdown sequence is desired inthe profile. Selecting this option enables the (s) Profile Duration option that sets up the profile run-time in seconds. (Profiling large applications over a long time period with this option could create verylarge profile data files.)
• Profile the duration of the app execution - allows profiling to continue as long as the specifiedapplication is running. When this option is selected, the (s) Profile duration option is disabled and nospecific profiling time limit is needed.
• Profile duration (sec) - sets the profile sampling duration in seconds.
• Start with profiling paused - This option is included for times when using the profiler API toprogrammatically control the Pause and Resume functionality.
• Start delay (sec) - sets the time in seconds of delaying the profile sampling after the target applicationis launched.
2.7.2.4. Profile Configuration
This is the kind of analysis to be performed. Choose a predefined profile configuration from the drop-down list. After selecting a profile configuration, performance events along with the count and unitmasksettings will be shown in the list. Please see Chapter 4, Configure Profile and Section 4.5, “Manage ProfileConfigurations” for more detail.
Click the "Edit" button to edit the selected profile configuration. However, predefined profileconfigurations cannot be changed unless saved as a new name.
2.7.3. Advance Tab

Features
40
Figure 2.35. Session Settings Dialog: Advance Tab
2.7.3.1. Enable vmlinux
This setting allows users to specify the kernel image used for kernel and kernel modules profiling. Uncheckthis setting to profile without the kernel image. The option equals "no-vmlinux" option in Oprofile. Checkthis setting to specify the vmlinux file. If vmlinux is compressed, uncompress it first. Please note that thisis not "vmlinuz" file.
2.7.3.2. OProfiled Buffer Configuration
• Event Buffer Watershed Size - Set kernel buffer watershed to num samples (2.6 only). When it'll remainonly buffer-size - buffer-watershed free entry in the kernel buffer data will be flushed to daemon, mostuseful values are in the range [0.25 - 0.5] * buffer-size.
• Event Buffer Size - Number of samples in kernel buffer. When using a 2.6 kernel buffer watershedneeds to be tweaked when changing this value.
• CPU Buffer Size - Number of samples in kernel per-cpu buffer (2.6 only). If you profile at high rate itcan help to increase this, if the log file shows excessive count of sample lost cpu buffer overflow.
2.7.3.3. Enable Call Stack Sampling (CSS)
• Call Stack Depth - specify the maximum depth of call stack unwinding

Features
41
• Call Stack Unwinding Interval - specify the frequency of stack unwinding (i.e. perform stack unwindingevery 1000 samples.)
• TGID for CSS - Users can specify the TGID to use for CSS instead of using TGID of the launchedtarget application. Note that if you select "Use TGID of the launched target application", the "Launch"field must be specified.
2.7.4. Note Tab
Figure 2.36. Session Settings Dialog: Note Tab
This tab contains a field where users can specify profile session note.
2.7.5. OProfiled Log

Features
42
Figure 2.37. Session Settings Dialog: OProfiled Log Tab (Property Mode Only)
This tab contains the information from /var/lib/oprofile/samples/oprofiled.log. This isavailable only in property mode of the Session Setting dialog.
2.7.6. Changing the CPU Affinity
CPU affinity limits the execution of a program or process to selected cores in a multicore system. CPUaffinity is set through a CPU affinity mask in which each bit of the mask specifies whether the programor process may execute upon a particular core. The number of available cores is system dependent. CPUaffinity can be used to perform scalability analysis by limiting the number of cores available to a multi-threaded program.
CPU affinity is defined in the CodeAnalyst Session Settings dialog box. The CPU affinity mask can bespecified directly as a hexadecimal value in the CPU affinity mask field as shown in the screen shotbelow. The CPU affinity mask determines the CPU affinity for the application program that is launchedby CodeAnalyst.

Features
43
It may be more convenient to set CPU affinity using the "Select Affinity" button located to the right ofthe CPU affinity mask field.
To change the CPU affinity:
1. Open the Session Settings dialog box.
2. Click the "Select Affinity" button.
3. The CPU Affinity Configuration dialog box appears.
4. Check a box to enable execution on a core.
5. Click the Select All button to check all boxes, enabling execution on all cores.
6. Click the Clear All button to remove checks from all boxes.
7. Click the OK button to activate the CPU affinity settings.

Features
44
The CPU affinity configuration below limits execution of the application program under test to a singleCPU (Core 1.)

Features
45
The Session Settings dialog box below reflects the change to the CPU affinity mask (0x2.)
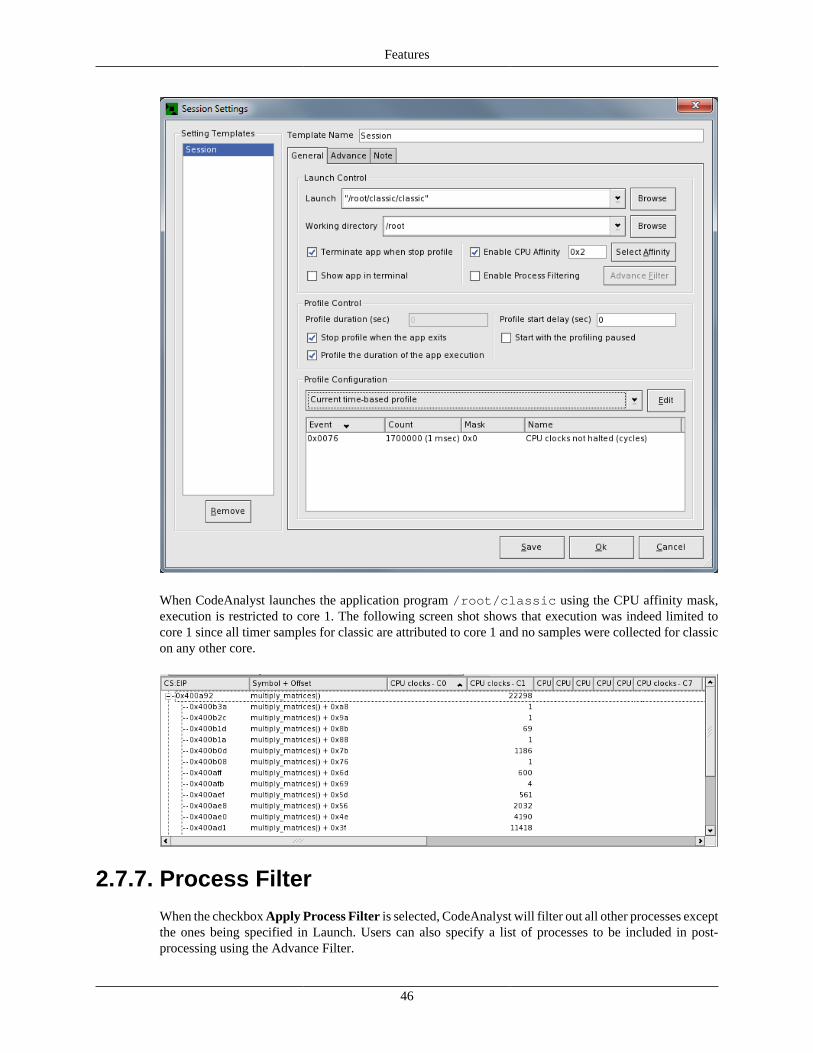
Features
46
When CodeAnalyst launches the application program /root/classic using the CPU affinity mask,execution is restricted to core 1. The following screen shot shows that execution was indeed limited tocore 1 since all timer samples for classic are attributed to core 1 and no samples were collected for classicon any other core.
2.7.7. Process FilterWhen the checkbox Apply Process Filter is selected, CodeAnalyst will filter out all other processes exceptthe ones being specified in Launch. Users can also specify a list of processes to be included in post-processing using the Advance Filter.

Features
47
Figure 2.38. Process Filter Dialog
Note that a profile is collected for all processes system-wide. However, only the profile specified inthe Advance Filter is being processed. This can also help reduce the post-processing wait time in somecases. The following figure shows a profiling session with process filter enabled. Here, only /root/classic and /lib64/libc-2.4.so are shown since application "classic" depends on the standard"libc" library.
2.8. CodeAnalyst and OProfileCodeAnalyst leverages a third-party profiling tool called OProfile [http://oprofile.sourceforge.net/news/]. CodeAnalyst provides graphical user interface which communicates with Oprofile kernel moduleand Oprofile daemon in order to collect profile data. OProfile also provides command-line utilities forCodeAnalyst. CodeAnalyst is designed to work with original OProfile which is often available on severalLinux distributions. CodeAnalyst also provides a modified OProfile kernel module, daemon, and utilitieswhich include additional features and support for latest AMD processors.
Opcontrol is a command-line tool from OProfile used to control a profiling session. It allows users toconfigure, start, and stop data collection. Users can invoke opcontrol from within a script, which is usefulwhen the task requires multiple profile runs. To see the list of command line options, simply run opcontrol

Features
48
--help at command prompt. To identify the CodeAnalyst provided version of "opcontrol" tool, simply runopcontrol --version.
The profiling results from opcontrol can be imported into the CodeAnalyst Graphical User Interface(GUI) for analysis. A CodeAnalyst project must be created to import and view performance data thatwas collected using the command line utility. Please see Section 2.5, “Importing Profile Data intoCodeAnalyst” for more information.
2.8.1. Profiling with OProfile Command-Line UtilitiesThe command line switches to opcontrol set up and control performance data collection. Analysis oftenconcentrates on the performance of a particular program. The ability to control profiling from a commandfile offers considerable flexibility when writing test scripts. Specific test cases can be encapsulated intoindividual script files. The following is an example of how to use opcontrol in a script:
Figure 2.39. Command line switches to opcontrol
2.8.1.1. Time-Based Profiling
Time-based profiling works by collecting samples at specified time intervals. Over a period of time, thesamples collected can show which blocks of code use the most processor time. See Section 3.2, “Time-Based Profiling Analysis” for further information.
The timer interval determines how often a TBP sample is taken . On Linux, Time-based profiling uses eventCPU_CLK_UNHALTED (performance counter event 0x76) which represents the amount of running

Features
49
time of a processor i.e. CPU is not in a halted state. This event allows system idle time to be automaticallyfactored out from IPC (or CPI) measurements, providing the OS halts the CPU when going idle. Thetime representation (in seconds or millisecond) can be calculated from the processor clock speed. Forinstance, on a processor running at clock speed 800MHz, to specify 1 millisecond time interval of time-based profiling using the opcontrol tool, we input
opcontrol --event=CPU_CLK_UNHALTED:800000::1:1
2.8.1.2. Event-Based Profiling
Event-based profiling works by using performance counters in the processor to count the number of timesa specific processor event occurs. When the specified counter threshold of an event is reached, Oprofilecollects a sample from the processor. Up to four events can be profiled in a given session, and each eventcan be assigned a different counter threshold. EBP requires an APIC-enabled system. See Section 3.3,“Event-Based Profiling Analysis” for further information.
To successfully use EBP, the user needs to consult the performance monitor event tables. See the sectionon Section 9.1, “Performance Monitoring Events (PME)” or the "BIOS and Kernel Developer's Guide(BKDG)" for the AMD processor in your test platform. For a general description of how to use theseperformance monitoring features, refer to the AMD64 Architecture Programmer's Manual, Volume 2,order# 24593, "Debug and Performance Resources" section.
The Event Select, Unit Mask and Event Count (sampling period) must be specified for each event to bemeasured. The Oprofile utility accepts event specifications that are formatted in the following manner:
[OPROFILE_EVENT_NAME]:[Count]:[Unit mask]:[Kernel]:[User]
• [OPROFILE_EVENT_NAME] specifies the name of event to be profiled.
• [Unit Mask] is a two digit, hexadecimal value which specifies the Unit Mask value for the event.
• [Count] is a decimal number that specifies the Event Count (sampling period.)
• [Kernel] 0 or 1 to specify kernel-space profiling.
• [User] 0 or 1 to specify user-space profiling.
A complete list of events can be viewed using command opcontrol -l.

Features
50
Figure 2.40. Listing events: opcontrol -l
Consider, for example, the DCache Refill From L2 or System event which can be used to measureonly refills from system memory through the use of a Unit Mask that qualifies the event. The Eventname is "DATA_CACHE_REFILLS_FROM_L2_OR_NORTHBRIDGE" and a Unit Mask value of 0x01measures only refills from system memory. Using an Event Count of 25,000, the full opcontrol eventspecification is:
opcontrol \
-e DATA_CACHE_REFILLS_FROM_L2_OR_NORTHBRIDGE:25000:0x1:1:1
The Retired Instructions event (Event Select 0x0C0) does not require a Unit Mask. Using an Event Countof 250,000, the full opcontrol event specification is:
opcontrol --event=RETIRED_INSTRUCTIONS:250000::1:1

Features
51
The Event Count field of the event specification determines how many times the event is to be countedbefore an EBP sample is collected. This field is important because some events happen so frequently thatthe processing of the samples becomes very slow or collecting the samples can cause the system to stopresponding. This latter scenario may occur if the specified Event Count is too small for an event. Forexample, event 0x4000 (DCache Access) happens quite frequently, so specifying a count of 10000 willgenerate a significant number of samples during a normal 5-second profiling session. It is advisable tospecify a large count number when profiling an event for the first time, and allow for later adjustments ofthe count to get more statistically useful data.
The following example command measures the Data Cache Accesses event (Event Select 0x040) usingan Event Count of 100,000:
opcontrol \
--event=DATA_CACHE_ACCESSES:100000::1:1
The user is allowed to specify up to four events on the command line. For example, to specify eventsDATA_CACHE_ACCESSES and RETIRED_INSTRUCTIONS in the same session with reasonablecounts, enter the following command:
opcontrol \
--event=DATA_CACHE_ACCESSES:100000::1:1 \
--event=RETIRED_INSTRUCTIONS:25000::1:1
After profiling has begun, oprofile prints out the confirmation messages and returns to command prompt.To stop the profiling session, simply run opcontrol with the corresponding option flags as listed inopcontrol --help.
2.8.1.3. Instruction-Based Sampling
Instruction-Based Sampling collects performance data on instruction fetch (IBS fetch sampling) andmacro-op execution (IBS op sampling.) IBS fetch sampling provides information about instruction cache(IC), instruction translation lookaside buffer (ITLB) behavior, and other aspects of the process of fetchinginstructions. IBS op sampling provides information about the execution of macro-ops that are issued fromAMD64 instructions. IBS op data is wide-ranging and covers branch and memory access operations. SeeSection 3.4, “Instruction-Based Sampling Analysis” for more information.
IBS fetch sampling and IBS op sampling are controlled by specifying
opcontrol --event=<IBS-Fetch-event-name>:<Fetch-count>:<Fetch-option-mask>:1:1
or
opcontrol --event=<IBS-Op-event-name>:<Op-count>:<Op-option-mask>:1:1
The count takes a single decimal value which is the fetch/op interval (sampling period) for IBS fetch/op sampling. The IBS fetch sampling counts completed fetches to determine the next fetch operation tomonitor and sample. The IBS op sampling counts processor cycles to determine the next macro-op tomonitor and sample. IBS fetch and op sampling may be enabled independently, or at the same time. Forinstance,
opcontrol \
--event=IBS_FETCH_ALL:250000:0:1:1 \
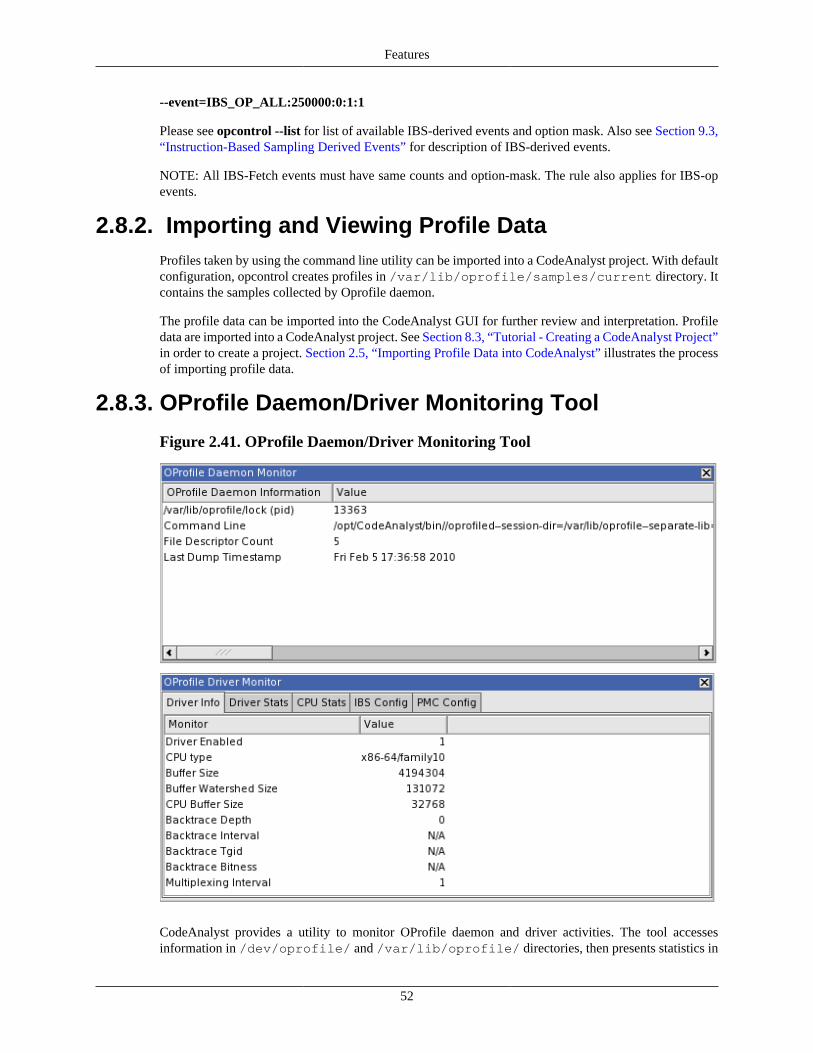
Features
52
--event=IBS_OP_ALL:250000:0:1:1
Please see opcontrol --list for list of available IBS-derived events and option mask. Also see Section 9.3,“Instruction-Based Sampling Derived Events” for description of IBS-derived events.
NOTE: All IBS-Fetch events must have same counts and option-mask. The rule also applies for IBS-opevents.
2.8.2. Importing and Viewing Profile DataProfiles taken by using the command line utility can be imported into a CodeAnalyst project. With defaultconfiguration, opcontrol creates profiles in /var/lib/oprofile/samples/current directory. Itcontains the samples collected by Oprofile daemon.
The profile data can be imported into the CodeAnalyst GUI for further review and interpretation. Profiledata are imported into a CodeAnalyst project. See Section 8.3, “Tutorial - Creating a CodeAnalyst Project”in order to create a project. Section 2.5, “Importing Profile Data into CodeAnalyst” illustrates the processof importing profile data.
2.8.3. OProfile Daemon/Driver Monitoring Tool
Figure 2.41. OProfile Daemon/Driver Monitoring Tool
CodeAnalyst provides a utility to monitor OProfile daemon and driver activities. The tool accessesinformation in /dev/oprofile/ and /var/lib/oprofile/ directories, then presents statistics in

Features
53
realtime. This tool helps provide insight into data collection subsystem. The tool is a dock window whichcan be moved around the main window or pulled out as a stand-alone dialog.

54
Chapter 3. Types of Analysis
3.1. Types of AnalysisAMD CodeAnalyst provides several types of analysis. Each kind of analysis provides information aboutcertain aspects of program behavior and performance. The following sections provide details about thekinds of analysis provided by AMD CodeAnalyst:
• Section 3.2, “Time-Based Profiling Analysis”
• Section 3.3, “Event-Based Profiling Analysis”
• Section 3.4, “Instruction-Based Sampling Analysis”
• Section 3.5, “Basic Block Analysis”
• Section 3.6, “In-Line Analysis”
• Section 3.7, “Call-Stack Sampling Analysis”
Time-based, Event-based, and Instruction-based sampling(IBS) analysis require different types of profiledata collecting at run-time. The section on time-based profiling has tips that apply to the other forms ofanalysis that use statistical sampling (EBP and IBS). Call-stack sampling analysis can be combined withall other types of analysis mentioned above.
The basic-block and in-line analysis are static analysis which inspects binary modules and allows users tobetter analyze the compiler generated assembly code by identifying basic-block and inline instance.
3.2. Time-Based Profiling AnalysisTime-based profiling (TBP) identifies the hot-spots in a program that are consuming the most time. Hot-spots are good candidates for further investigation and optimization.
Time-based profiling is system-wide, so a hot-spot can be identified anywhere in the system, not just anapplication under test. Any software component (an executable image, dynamically loaded library, devicedriver, or even the operating system kernel) that executes during the measurement period may be sampled.System-wide data collection conveniently handles applications consisting of parallel processes withoutany special configuration.

Types of Analysis
55
Figure 3.1. Time spent in each software module (TBP)
CodeAnalyst reports performance results in one or more tabs in the workspace. Results are broken out andsummarized by module, process, function, source line, or instruction.
Figure 3.2. Time spent in each function within an application (TBP)
CodeAnalyst supports drill-down to source lines and instructions. Source-level presentation ofperformance results requires symbolic (debug) information. See Section 1.1.1, “Preparing an Applicationfor Profiling”.
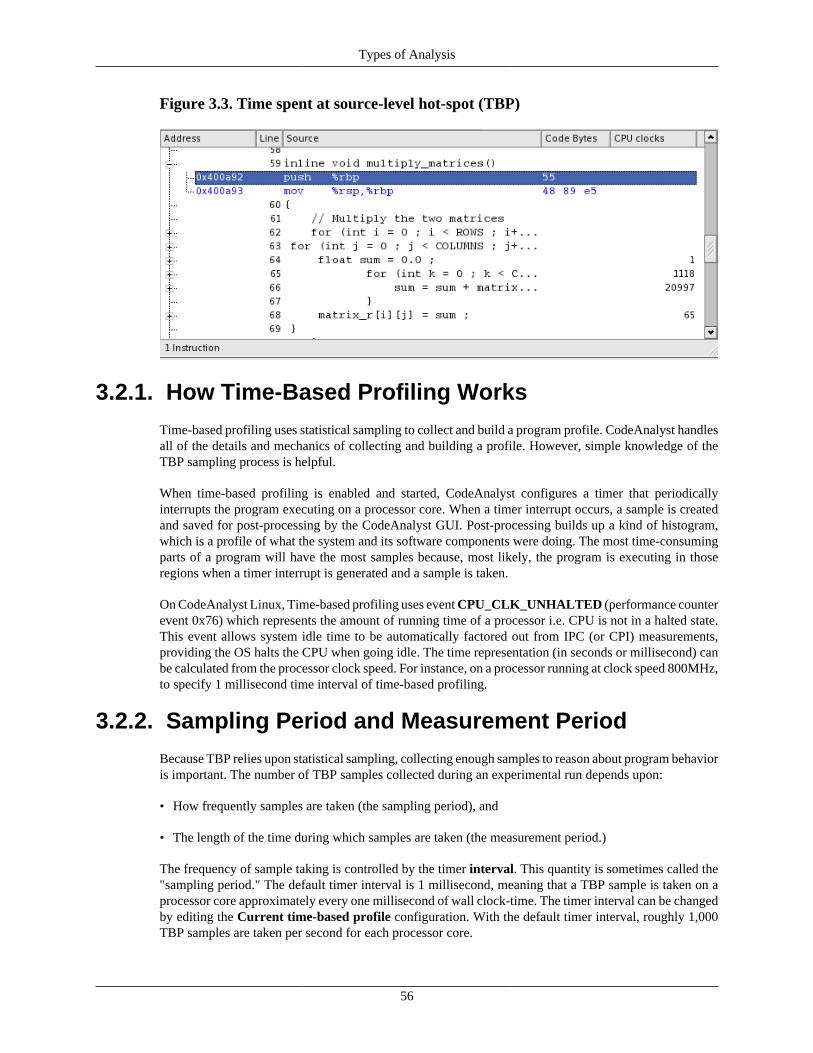
Types of Analysis
56
Figure 3.3. Time spent at source-level hot-spot (TBP)
3.2.1. How Time-Based Profiling Works
Time-based profiling uses statistical sampling to collect and build a program profile. CodeAnalyst handlesall of the details and mechanics of collecting and building a profile. However, simple knowledge of theTBP sampling process is helpful.
When time-based profiling is enabled and started, CodeAnalyst configures a timer that periodicallyinterrupts the program executing on a processor core. When a timer interrupt occurs, a sample is createdand saved for post-processing by the CodeAnalyst GUI. Post-processing builds up a kind of histogram,which is a profile of what the system and its software components were doing. The most time-consumingparts of a program will have the most samples because, most likely, the program is executing in thoseregions when a timer interrupt is generated and a sample is taken.
On CodeAnalyst Linux, Time-based profiling uses event CPU_CLK_UNHALTED (performance counterevent 0x76) which represents the amount of running time of a processor i.e. CPU is not in a halted state.This event allows system idle time to be automatically factored out from IPC (or CPI) measurements,providing the OS halts the CPU when going idle. The time representation (in seconds or millisecond) canbe calculated from the processor clock speed. For instance, on a processor running at clock speed 800MHz,to specify 1 millisecond time interval of time-based profiling.
3.2.2. Sampling Period and Measurement Period
Because TBP relies upon statistical sampling, collecting enough samples to reason about program behavioris important. The number of TBP samples collected during an experimental run depends upon:
• How frequently samples are taken (the sampling period), and
• The length of the time during which samples are taken (the measurement period.)
The frequency of sample taking is controlled by the timer interval. This quantity is sometimes called the"sampling period." The default timer interval is 1 millisecond, meaning that a TBP sample is taken on aprocessor core approximately every one millisecond of wall clock-time. The timer interval can be changedby editing the Current time-based profile configuration. With the default timer interval, roughly 1,000TBP samples are taken per second for each processor core.
Types of Analysis
57
With a shortened interval time, samples are taken more often and more samples are taken within a given,fixed-length measurement period. However, the amount of effort expended to take samples (known asoverhead) will increase, placing the test system under a higher load. The process of taking samples andthe overhead have an intrusive effect that perturbs the test workload and may bias statistical results.
As to the second factor—the length of time during which samples are taken—samples accumulate for aslong as data is collected. The measurement period depends upon the overall execution time of the workloadand the way in which CodeAnalyst data collection is configured. Using either the Session Settings orcommand line utility options, CodeAnalyst can be configured to collect samples for all or part of the timethat the test workload executes. If program run-time is short (less than 15 seconds), it may be necessary toincrease program run-time by using a larger data set or more loop iterations to obtain a statistically usefulresult. Extending the duration of the measurement period by changing the Session Settings or options tothe CodeAnalyst command line utility may need to be done.
Deciding how many samples are enough requires judgment and a working knowledge about thecharacteristics of the workload under test. Scientific applications often have tight inner loops that areexecuted several times. In these situations, samples accumulate rapidly within the inner loops and evena fairly short run-time yields a statistically useful number of samples. Other workloads, like transactionprocessing, have few intense inner loops and the profiles are relatively "flat." For flat workloads, a longermeasurement period is required to build up samples in code regions of interest.
3.2.3. Predefined Profile Configurations
CodeAnalyst provides predefined profile configurations to make configuration of time-based profilingand other kinds of analysis convenient. The predefine configuration for time-based profiling is called"Time-based profile." CodeAnalyst also provides a configuration named "Current time-based profile"where the timer interval (sampling period) can be changed.
3.3. Event-Based Profiling AnalysisEvent-based profiling (EBP) helps identify the root cause for CPU- and memory-related performanceissues. EBP uses the performance monitoring hardware in AMD processors to count the number ofoccurrences of hardware events. The kind and frequency of these events may indicate the presence of apipeline bottleneck, poor memory access pattern, poorly predicted conditional branches, or some otherperformance issue. Once hot-spots are found through time-based profiling, EBP is used to follow-up andinvestigate the hot-spots in order to identify and exploit opportunities for optimization.

Types of Analysis
58
Figure 3.4. Retired instructions, DC accesses and misses per software module (EBP)
Figure 3.5. Retired instructions, DC accesses and misses for source-level hot-spot(EBP)
AMD processors are equipped with performance monitoring counters (PMC). Each counter may countexactly one hardware event at a time. A hardware event is a condition (or change in hardware condition)like CPU clocks, retired x86 instructions, data cache accesses, or data cache misses. The number ofcounters and the hardware events that can be measured are processor-dependent. The CodeAnalystonline help provides a quick guide to the events that are available for each AMD processor family. See“Performance Monitoring Events (PME)” for descriptions of the events supported by AMD processors.However, you should consult the BIOS and Kernel Developer's Guide for the AMD processor in yourtest platform for the latest information. The number of events and, in some cases, the event behavior mayvary by revision within a processor family as well.
Types of Analysis
59
3.3.1. How Event-Based Profiling WorksLike time-based profiling, event-based profiling relies upon statistical sampling to build a program profile.CodeAnalyst handles the details of PMC configuration and sampling. However, the following shortdescription of how CodeAnalyst performs event-based profiling may help to understand how to useCodeAnalyst more effectively. Each counter must be configured with:
• An event to be measured (specified by event select and unit mask values,
• An event count (sampling period),
• Choice of OS-space sampling, user-space sampling, or both, and
• Choice of edge- or level-detect.
Some AMD processor families support additional configuration parameters and CodeAnalyst offers theseparameters when they are supported on the test platform. Once a PMC has been configured and samplingis started, the counter counts the event to be measured until the event count (sampling period) is reached.At that time, an interrupt generates and an EBP sample taken. The EBP sample contains a timestamp,the kind of event that triggered the interrupt, the identifier of the process that was interrupted, and theinstruction pointer where the program will restart after the return from the sampling interrupt. CodeAnalystuses this data along with information from the executable images, debug information, and source codeto accumulate and display a profile for each executing software component (process, module, function,source line, or instruction.)
3.3.2. Sampling Period and Measurement PeriodSince EBP is a statistical method, it also depends upon a statistically significant quantity of samples inorder to support reasoning about program behavior. As discussed in Section 3.2, “Time-Based ProfilingAnalysis”, the number of samples collected depends upon the sampling period (the event count parameter)and the measurement period (the length of time during which samples are collected). The number ofsamples collected can be increased by using a smaller sampling period or by increasing the length of timethat samples are taken.
Use of a smaller sampling period increases data collection overhead. Since data collection must beperformed on the same platform as the test workload, more frequent sampling increases the intrusiveness ofevent-based profiling and the sampling process adversely affects shared hardware resources like instructionand data caches, translation lookaside buffers and branch history tables. Extremely small sampling periodsmay also cause system instability. Start off conservatively and slowly decrease the sampling period for anevent until the appropriate volume of samples is generated.
An additional complicating factor when choosing the sampling period for an event is the behavior of theworkload itself. Some workloads are CPU-intensive while other workloads are memory-intensive. Someworkloads may be CPU-intensive and require high memory bandwidth to stream data into the CPU. Forexample, a CPU-intensive application that performs few memory access operations will cause relativelyfew data-cache miss events simply because it does not access memory very often. The characteristics ofthe workload may even vary by phase where the phase setting up a computation has a different behaviorfrom the computation phase itself. Thus, the workload behavior determines the frequency of certain kindsof events and changes to the sample period may be necessary in practice.
3.3.3. Event MultiplexingAs mentioned earlier, the number of available performance counters is processor-dependent. AMD Family10h processors, for example, provide four performance counters. The number of available performance

Types of Analysis
60
counters determines the number of events that can be measured together at one time. Ordinarily, this wouldlimit the number of events that can be measured in a single experimental run. However, CodeAnalystfor Linux®, allows users to set more than four performance counters within a profiling session. SeeSection 2.4, “Event Counter Multiplexing” for further details.
NOTE: The semantic for Event Multiplexing used in CodeAnalyst for Linux is different from the onein Windows.
3.3.4. Predefined Profile Configurations
To make the process of configuration easier, CodeAnalyst provides several predefined profileconfigurations in which the choice of events and sampling periods have already been made. Thesepredefined profile configurations are:
• Assess performance
• Investigate data access
• Investigate instruction access
• Investigate L2 cache access
• Investigate branching
CodeAnalyst also provides a configuration named "Current event-based profile" that allows choosing yourown events to measure, change sampling periods (event counts), and change other EBP configurationparameters. See Section 4.4, “Predefined Profile Configurations” for more information.
3.4. Instruction-Based Sampling AnalysisInstruction-Based Sampling (IBS) uses a hardware sampling technique to generate event informationwhich is similar to that produced by Section 3.3, “Event-Based Profiling Analysis” Instruction-BasedSampling can be used to identify and diagnose performance issues in program hot-spots. IBS has theseadvantages:
• Events are precisely attributed to the instructions that caused the events.
• IBS produces a wealth of event data in a single test run.
• Latency is measured for key performance factors such as data cache miss latency.
The information provided through Instruction-Based Sampling covers the most common kinds ofinformation needed for program performance analysis. Event-based profiling, however, offers a widerrange of events that can be monitored, such as events related to HyperTransport™ links.
The processor pipeline stages can be categorized into two main phases—instruction fetch and execution.Each instruction fetch operation produces a block of instruction data that is passed to the decoder stages inthe pipeline. The decoder identifies AMD64 instructions in the fetch block. These AMD64 instructions aretranslated to one or more macro-operations, called "macro-ops" or "ops," that are executed in the executionphase.

Types of Analysis
61
Figure 3.6. IBS op samples for each software module
Figure 3.7. Attribution of IBS op samples to source-level hot-spot
Instruction-Based Sampling provides separate means to sample fetch operations and macro-ops since thefetch and execution phases of the pipeline treat these entities separately. IBS fetch sampling and IBS opsampling may be enabled and collected separately, or both may be enabled and collected together.
3.4.1. IBS Fetch Sampling
IBS fetch sampling is a statistical sampling method. IBS fetch sampling counts completed fetch operations.When the number of completed fetch operations reaches the maximum fetch count (the sampling period),IBS tags the fetch operation and monitors that operation until it either completes or aborts. When a taggedfetch completes or aborts, a sampling interrupt is generated and an IBS fetch sample is taken. An IBS fetchsample contains a timestamp, the identifier of the interrupted process, the virtual fetch address, and severalevent flags and values that described what happened during the fetch operation. Like time-based profilingand event-based profiling, CodeAnalyst uses the IBS sample data and information from the executableimages, debug information, and source to build a profile IBS for software components executing on thesystem. (Instruction-Based Sampling is also system-wide.)
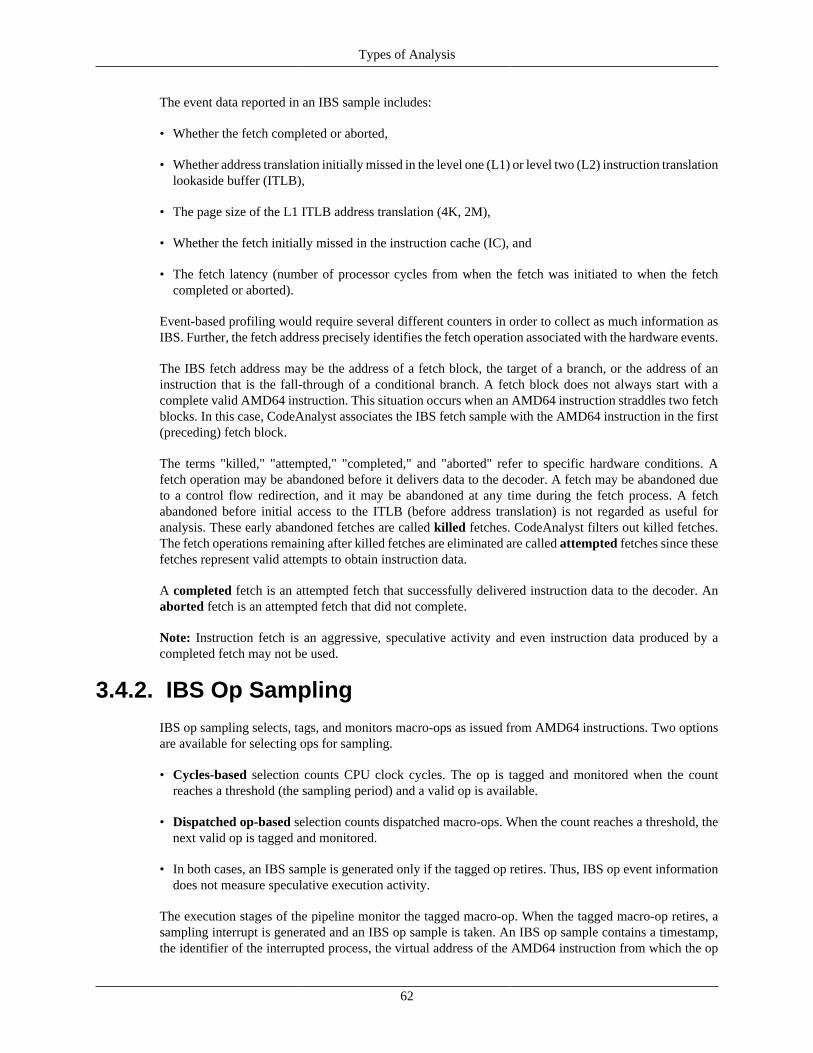
Types of Analysis
62
The event data reported in an IBS sample includes:
• Whether the fetch completed or aborted,
• Whether address translation initially missed in the level one (L1) or level two (L2) instruction translationlookaside buffer (ITLB),
• The page size of the L1 ITLB address translation (4K, 2M),
• Whether the fetch initially missed in the instruction cache (IC), and
• The fetch latency (number of processor cycles from when the fetch was initiated to when the fetchcompleted or aborted).
Event-based profiling would require several different counters in order to collect as much information asIBS. Further, the fetch address precisely identifies the fetch operation associated with the hardware events.
The IBS fetch address may be the address of a fetch block, the target of a branch, or the address of aninstruction that is the fall-through of a conditional branch. A fetch block does not always start with acomplete valid AMD64 instruction. This situation occurs when an AMD64 instruction straddles two fetchblocks. In this case, CodeAnalyst associates the IBS fetch sample with the AMD64 instruction in the first(preceding) fetch block.
The terms "killed," "attempted," "completed," and "aborted" refer to specific hardware conditions. Afetch operation may be abandoned before it delivers data to the decoder. A fetch may be abandoned dueto a control flow redirection, and it may be abandoned at any time during the fetch process. A fetchabandoned before initial access to the ITLB (before address translation) is not regarded as useful foranalysis. These early abandoned fetches are called killed fetches. CodeAnalyst filters out killed fetches.The fetch operations remaining after killed fetches are eliminated are called attempted fetches since thesefetches represent valid attempts to obtain instruction data.
A completed fetch is an attempted fetch that successfully delivered instruction data to the decoder. Anaborted fetch is an attempted fetch that did not complete.
Note: Instruction fetch is an aggressive, speculative activity and even instruction data produced by acompleted fetch may not be used.
3.4.2. IBS Op Sampling
IBS op sampling selects, tags, and monitors macro-ops as issued from AMD64 instructions. Two optionsare available for selecting ops for sampling.
• Cycles-based selection counts CPU clock cycles. The op is tagged and monitored when the countreaches a threshold (the sampling period) and a valid op is available.
• Dispatched op-based selection counts dispatched macro-ops. When the count reaches a threshold, thenext valid op is tagged and monitored.
• In both cases, an IBS sample is generated only if the tagged op retires. Thus, IBS op event informationdoes not measure speculative execution activity.
The execution stages of the pipeline monitor the tagged macro-op. When the tagged macro-op retires, asampling interrupt is generated and an IBS op sample is taken. An IBS op sample contains a timestamp,the identifier of the interrupted process, the virtual address of the AMD64 instruction from which the op

Types of Analysis
63
was issued, and several event flags and values that describe what happened when the macro-op executed.CodeAnalyst uses this and other information to build an IBS profile.
3.4.2.1. Bias in Cycles-Based IBS Op Sampling
A cycles-based selection generally produces more IBS samples than dispatched op-based selections.However, the statistical distribution of IBS op samples collected with a cycles-based selection may beaffected by pipeline stalls and other time-dependent hardware behavior. The statistical bias is due to stallsat the decoding stage of the pipeline. If a macro-op is not available for tagging when the maximum opcount is reached, the hardware skips the opportunity to tag a macro-op and starts counting again from asmall, pseudo-random initial count.
From a practical perspective, the distribution of cycles-based IBS op samples may not be uniform acrossinstructions with the same execution frequency (i.e., across instructions within the same basic block). Thestatistical distribution of IBS op samples collected with dispatched op-based selection is generally moreuniform across instructions with the same execution frequency. This is a useful property in practice as IBSop statistics can be more readily used to make comparisons between instruction behavior. The dispatchedop-based selection is the preferred collection mode and should be used when available.
Note: The cycles-based selection is supported on all IBS-capable AMD processors. The dispatched op-based selection is a newer IBS feature and is not supported on all IBS-capable AMD processors and isonly available in AMD Family 10h processors, revision 4 and beyond. Refer to the relevant version of theAMD BIOS and kernel developer's guide for support details.
3.4.2.2. IBS Op Data
IBS op sampling reports a wide range of event data. The following values are reported for all ops:
• The virtual address of the parent AMD64 instruction from which the tagged op was issued,
• The tag-to-retire time (the number of processor cycles from when the op was tagged to when the opretired), and
• The completion-to-retire time (the number of processor cycles from when the op completed to whenthe op was retired.)
Attribution of event information is precise because the IBS hardware reports the address of the AMD64instruction causing the events. For example, branch mispredicts are attributed exactly to the branch thatmispredicted and cache misses are attributed exactly to the AMD64 instruction that caused the cache miss.IBS makes it easier to identify the instructions which are performance culprits.
Some ops implement branch semantics. Branches include unconditional and conditional branches,subroutine calls and subroutine returns. Event information reported for branch ops include:
• Whether the branch was mispredicted and
• Whether the branch was taken,
IBS also indicates whether a branch operation was a subroutine return and if the return was mispredicted.Some ops may perform a load (memory read), store (memory write), or a load and a store to the samememory address, as in the case of a read-op-write sequence. When an op performs a load and/or store,event information includes:
• Whether a load was performed,
Types of Analysis
64
• Whether a store was performed,
• Whether address translation initially missed in the L1 and/or L2 data translation lookaside buffer(DTLB),
• Whether the load or store initially missed in the data cache (DC),
• The virtual data address for the memory operation, and
• The DC miss latency when a load misses the DC.
Requests made through the Northbridge produce additional event information:
• Whether the access was local or remote and
• The data source that fulfilled the request.
A full list of IBS op event information appears in the section on IBS events. Hardware-level details can befound in the BIOS and Kernel Developer's Guide (BKDG) for the AMD processor in your test platform.
3.4.3. IBS-Derived Events
CodeAnalyst translates the IBS information produced by the hardware into derived event sample countsthat resemble EBP sample counts. All IBS-derived events have "IBS" in the event name and abbreviation.Although IBS-derived events and sample counts look similar to EBP events and sample counts, thesource and sampling basis for the IBS event information are quite different. Arithmetic should never beperformed between IBS derived event sample counts and EBP event sample counts. It is not meaningfulto directly compare the number of samples taken for events which represent the same hardware condition.For example, fewer IBS DC miss samples is not necessarily "better" than a larger quantity of EBP DCmiss samples.
See Section 9.3, “Instruction-Based Sampling Derived Events” for descriptions of the IBS derived events.
3.4.4. Predefined Profile Configurations
AMD CodeAnalyst provides a predefined profile configuration called "Instruction-based sampling" whichcollects both IBS fetch and IBS op samples. It also provides the configuration named "Current Instruction-based profile " which can be changed and customized.
3.5. Basic Block AnalysisBasic block is a section of code that represents a serialized execution path that does not contain any typeof control transfer instruction (i.e. jump or call). A basic block usually begins with the destination of asingle or multiple control transfer instructions and ending with a control transfer instruction.
In the Module Data view, users can aggregate data by using basic block aggregation of samples. Thismode of aggregation is enabled by selecting the "Aggregate samples into basic blocks" option inthe "CodeAnalyst Options" dialog. CodeAnalyst examines each function to identify basic blocks andaggregates samples accordingly. Each basic block is denoted by a range of addresses using the format"[StartAddr, StopAddr ) : (Number of Load / Number of store)". The dialog also displays the numberof load and store instructions within the basic block on the disassembly view tab.

Types of Analysis
65
Figure 3.8. CodeAnalyst Options
Figure 3.9. Module data view of basic block aggregation
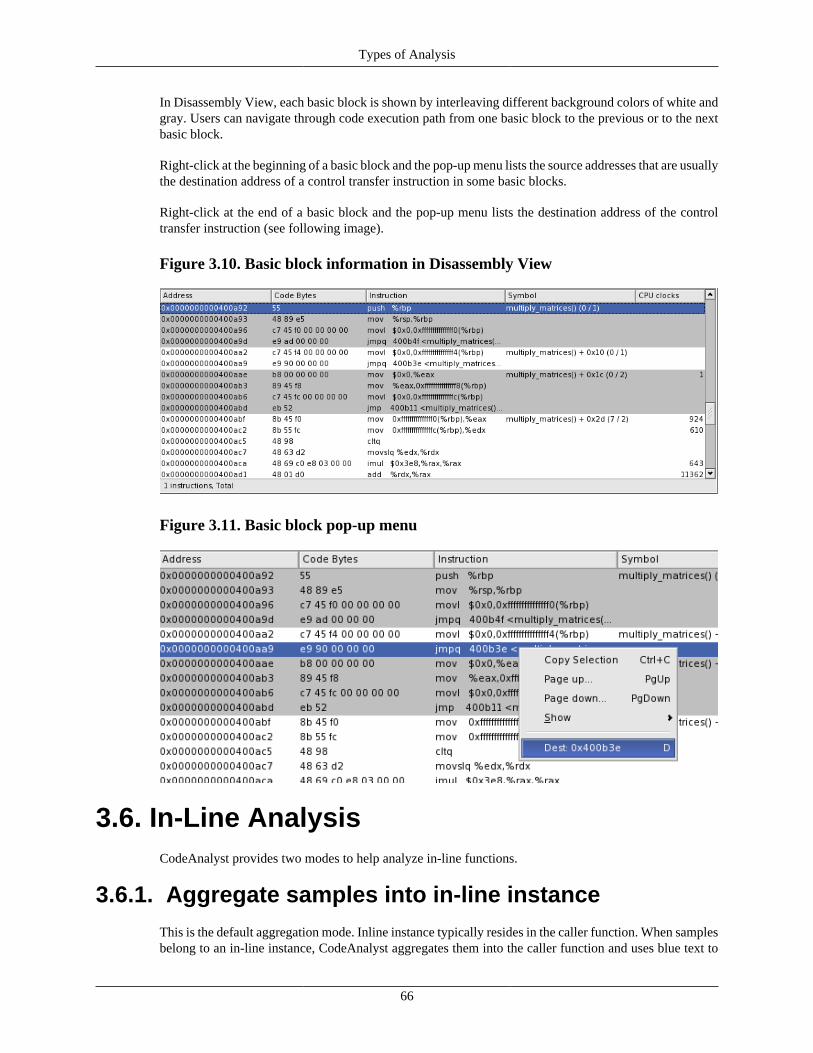
Types of Analysis
66
In Disassembly View, each basic block is shown by interleaving different background colors of white andgray. Users can navigate through code execution path from one basic block to the previous or to the nextbasic block.
Right-click at the beginning of a basic block and the pop-up menu lists the source addresses that are usuallythe destination address of a control transfer instruction in some basic blocks.
Right-click at the end of a basic block and the pop-up menu lists the destination address of the controltransfer instruction (see following image).
Figure 3.10. Basic block information in Disassembly View
Figure 3.11. Basic block pop-up menu
3.6. In-Line AnalysisCodeAnalyst provides two modes to help analyze in-line functions.
3.6.1. Aggregate samples into in-line instanceThis is the default aggregation mode. Inline instance typically resides in the caller function. When samplesbelong to an in-line instance, CodeAnalyst aggregates them into the caller function and uses blue text to

Types of Analysis
67
identify the in-line instance together with in-line function name. In the example in the previous image,multiply_matrices is an in-line function called by main. This mode aggregates samples belonging to theinstance of multiply_matrices as part of main.
Figure 3.12. Aggregate into in-line instance
3.6.2. Aggregate samples into original in-line function
When samples belong to an inline instance, CodeAnalyst aggregates them into each inline instance.CodeAnalyst groups all inline instances and lists them together under the inline function which is presentedin red text. In figure above, the inline function multiply_matrices has one inline instance in function main.

Types of Analysis
68
Figure 3.13. Aggregate into in-line function
3.6.3. Source inlined annotation
When viewing a function in the Source/Disassembly tab, CodeAnalyst annotates the inlined instances withthe source lines of the inlined function. Furthermore, the source lines of the inlined instances are annotatedwith assembly instructions accordingly. This is useful when trying to analyze the samples count withininlined functions which could be from multiple source files.

Types of Analysis
69
Figure 3.14. Annotated inlined instances
3.7. Call-Stack Sampling AnalysisCall-stack sampling (CSS) collects function call information including caller-to-callee relationships. CSSis used in conjunction with time-based profiling (TBP), event-based profiling (EBP), and instruction-basedsampling (IBS). When compared to other techniques, such as instrumentation, CSS is a relatively low-overhead approach to the collection of function call information. However, CSS is based on sampling andits results are subject to statistical variation
CSS collects information from the run-time call stack to identify caller-to-callee relationships betweenfunctions. When CSS is enabled, CodeAnalyst collects information from the run-time call stack of amonitored application process whenever a regular time-, event-, or instruction-based sample is taken forthe process.
CodeAnalyst analyzes the call stack information and produces the following information:
• a summary of function call relationships (who called whom)
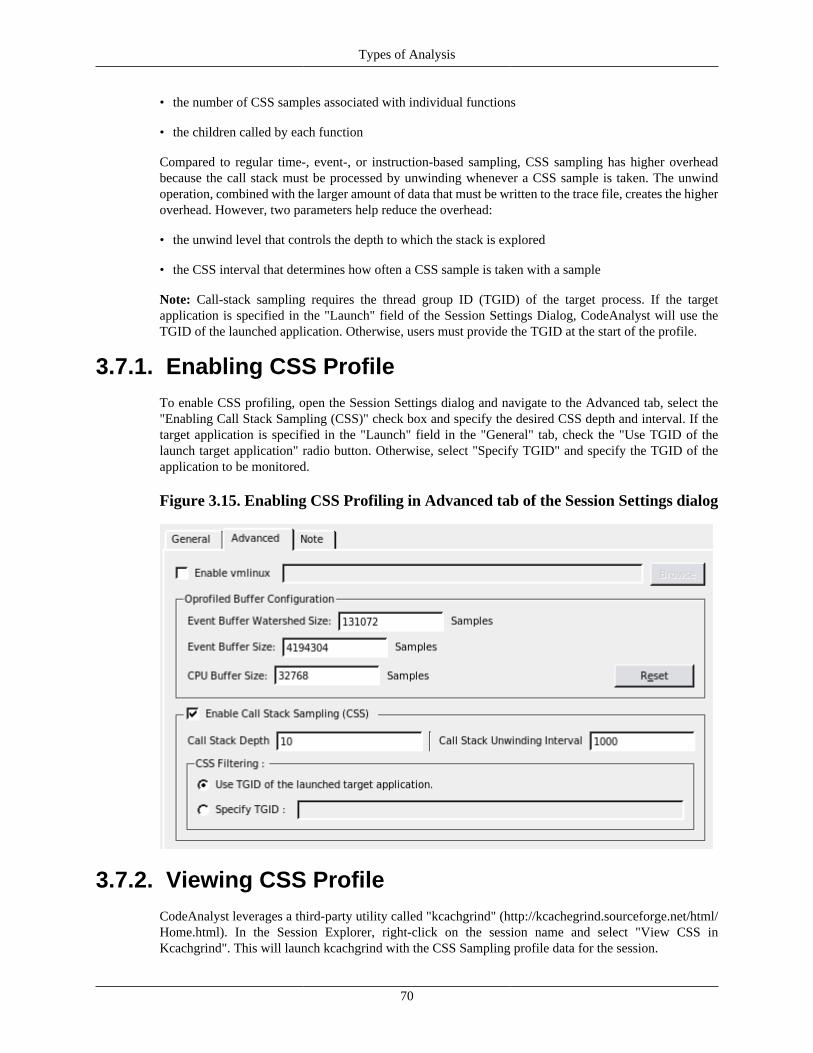
Types of Analysis
70
• the number of CSS samples associated with individual functions
• the children called by each function
Compared to regular time-, event-, or instruction-based sampling, CSS sampling has higher overheadbecause the call stack must be processed by unwinding whenever a CSS sample is taken. The unwindoperation, combined with the larger amount of data that must be written to the trace file, creates the higheroverhead. However, two parameters help reduce the overhead:
• the unwind level that controls the depth to which the stack is explored
• the CSS interval that determines how often a CSS sample is taken with a sample
Note: Call-stack sampling requires the thread group ID (TGID) of the target process. If the targetapplication is specified in the "Launch" field of the Session Settings Dialog, CodeAnalyst will use theTGID of the launched application. Otherwise, users must provide the TGID at the start of the profile.
3.7.1. Enabling CSS ProfileTo enable CSS profiling, open the Session Settings dialog and navigate to the Advanced tab, select the"Enabling Call Stack Sampling (CSS)" check box and specify the desired CSS depth and interval. If thetarget application is specified in the "Launch" field in the "General" tab, check the "Use TGID of thelaunch target application" radio button. Otherwise, select "Specify TGID" and specify the TGID of theapplication to be monitored.
Figure 3.15. Enabling CSS Profiling in Advanced tab of the Session Settings dialog
3.7.2. Viewing CSS ProfileCodeAnalyst leverages a third-party utility called "kcachgrind" (http://kcachegrind.sourceforge.net/html/Home.html). In the Session Explorer, right-click on the session name and select "View CSS inKcachgrind". This will launch kcachgrind with the CSS Sampling profile data for the session.

Types of Analysis
71
Figure 3.16. Invoke kcachgrind from Session Explorer
Figure 3.17. Launch Kcachgrind with CSS data

72
Chapter 4. Configure Profile
4.1. Profile Data CollectionProfile configurations control the kind of performance data that is collected during a session. CodeAnalystprovides several Section 4.4, “Predefined Profile Configurations” that support the most common kinds ofperformance analysis. Profile configurations eliminate the tedium of configuring data collection by handfor each session.
To quickly change to a different profile configuration, select the profile configuration from the drop-downlist of program configurations in the toolbar.
To select a profile configuration via Session Settings:
1. Open the Session Settings dialog box by clicking the session settings button
in the toolbar, or by selecting Tools > Session Settings from the menu bar.
2. Select one of the profile configurations from the drop-down list of profile configurations in the SessionSettings dialog box.

Configure Profile
73
4.1.1. Modifying a Profile Configuration
The predefined profile configurations should provide starting points for program analysis. However,eventually it is necessary to change either the kind of data collected (such as the specific events collectedthrough event-based profiling), the sampling period, or some other aspect of data collection. Custom profileconfigurations can be created, modified and saved through Configuration Management. See Section 4.5,“Manage Profile Configurations” for further details.
4.2. Edit Timer ConfigurationThe Current time-based profile configuration opens a dialog box for changing:
• The profile configuration name.
• The timer interval that determines how often samples are taken.

Configure Profile
74
Figure 4.1. Edit timer configuration
4.3. Edit Event-based and Instruction-basedSampling Configuration
This section discusses how to configure event-based and instruction-based sampling profile. The "EditEBS/IBS Profile Configuration" dialog box allows for changing a profile configuration that uses event-based sampling and/or instruction-based sampling for data collection. This dialog corresponds to the dialogbox opened by using the "Edit" button displayed in "Session Settings "dialog box. This dialog box allowsfor defining performance events to be measured.
It is important to understand the difference between event-based sampling and instruction-based samplingas they use different data collection techniques and different performance monitoring hardware. Formore technical detail about event-based Sampling and instruction-based Sampling, please see Section 3.3,“Event-Based Profiling Analysis” and Section 3.4, “Instruction-Based Sampling Analysis”.
AMD processors can measure a wide range of event types. These events are described in more detailin Section 9.1, “Performance Monitoring Events (PME)”. Consult the "BIOS and Kernel Developer'sGuide" (BKDG) for the AMD processor in your test platform for in-depth information about theperformance monitoring events that it supports, including any processor revision-by-revision differences.For IBS-derived events, please see Section 9.3, “Instruction-Based Sampling Derived Events”

Configure Profile
75
Figure 4.2. Edit EBS/IBS configuration
4.3.1. Profile Name
This drop-down menu shows the name of currently selected profile configuration for editing. Changingselection will re-populate settings with the newly selected configuration. Once changes are made to thecurrent configuration, users must click "Ok" or "Save" to store changes to the current configuration, or"Save As" to store changes as a new configuration.
Note that the pre-defined configurations cannot be modified, but users can save the changes as a newuser-defined configuration. Users can manage the list of configurations by clicking the "Manage Profiles"button which will bring up the "Configuration Management" dialog (See Section 4.5, “Manage ProfileConfigurations” for more info).

Configure Profile
76
4.3.2. Select and Modify Events in Profile Configuration
4.3.2.1. Selected Events Tab
Figure 4.3. Edit EBS/IBS configuration: Selected Events Tab
This tab contains a table listing performance events in the currently selected profile configuration. Forinstance, when you select "Assess Performance" profile configuration, there will be 8 events shown inthe table along with the counts, unitmask, and other information. To modify an event, simply highlightthe event you want to modify. Setting of the selected event will get populated into the "Event Setting"field on the right.
• Count - The "Count" field specifies the event count (sampling period) for an event.
• Unitmasks / Options - Check boxes allow for specifying the unit mask or option for the selected event.
• Usr - Selecting "Usr" enables collection of user-level samples for an event.
• Os - Selecting "Os" enables collection of operating system-level samples for an event.
Users can make desire changes, and then click "Apply Setting" button to save changes.
On an AMD processor, there are a limited number of performance event counters. In case the number ofevents selected is more than the number of available hardware, performance counter event multiplexingwill be enabled to help eliminate the hardware limitation. Here, the "Multiplexing Interval" field will beenabled and default to 1 msec. This parameter basically specifies the profiling period before the next groupof events is multiplexed during profile run; as described in Section 2.4, “Event Counter Multiplexing”.
To remove an event, simply select the event and click "Remove Event" button.
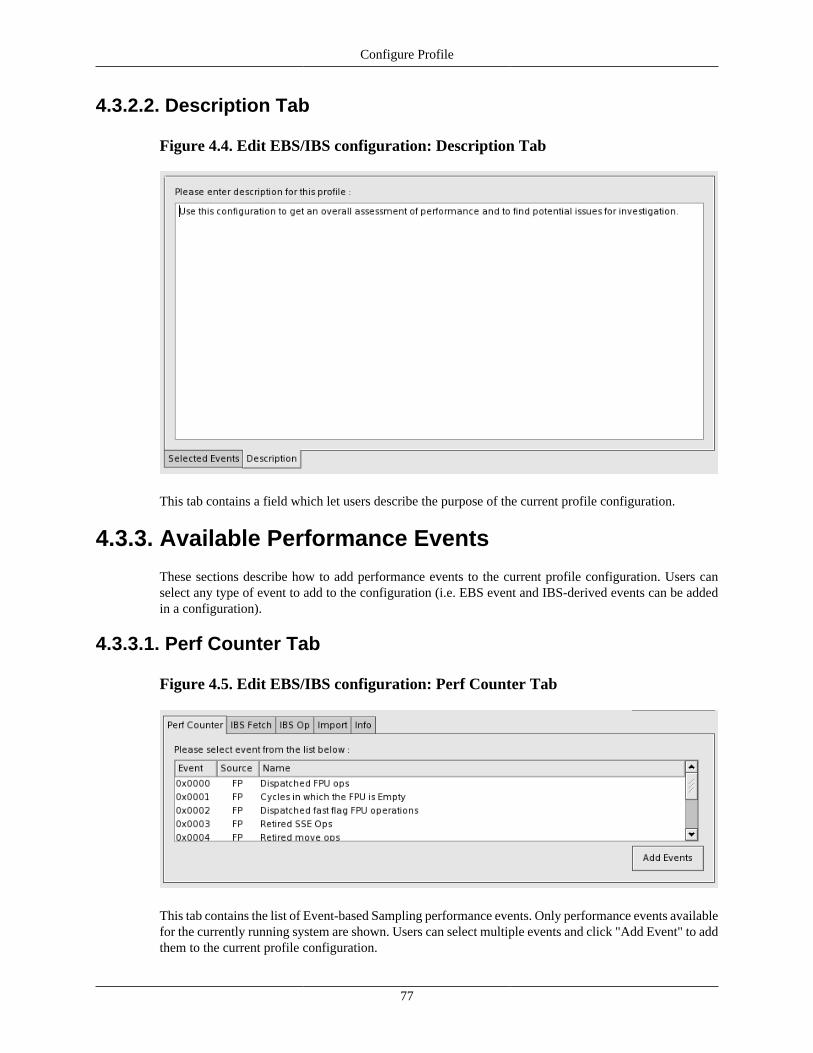
Configure Profile
77
4.3.2.2. Description Tab
Figure 4.4. Edit EBS/IBS configuration: Description Tab
This tab contains a field which let users describe the purpose of the current profile configuration.
4.3.3. Available Performance Events
These sections describe how to add performance events to the current profile configuration. Users canselect any type of event to add to the configuration (i.e. EBS event and IBS-derived events can be addedin a configuration).
4.3.3.1. Perf Counter Tab
Figure 4.5. Edit EBS/IBS configuration: Perf Counter Tab
This tab contains the list of Event-based Sampling performance events. Only performance events availablefor the currently running system are shown. Users can select multiple events and click "Add Event" to addthem to the current profile configuration.
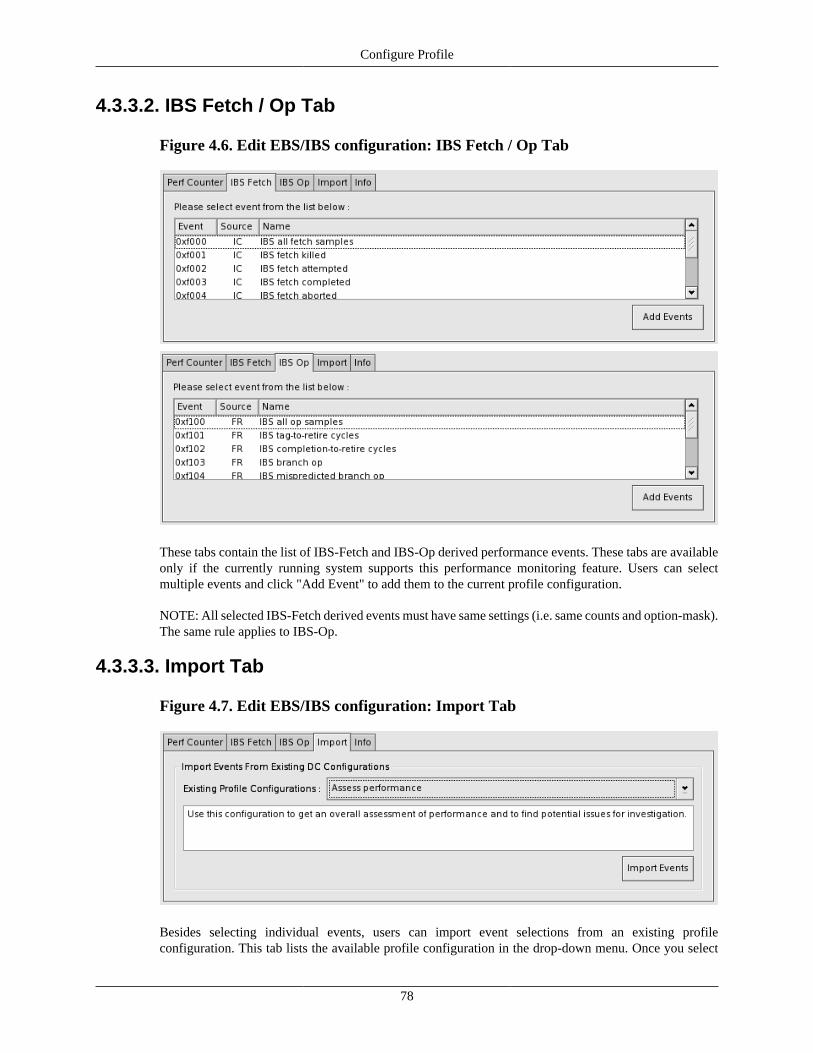
Configure Profile
78
4.3.3.2. IBS Fetch / Op Tab
Figure 4.6. Edit EBS/IBS configuration: IBS Fetch / Op Tab
These tabs contain the list of IBS-Fetch and IBS-Op derived performance events. These tabs are availableonly if the currently running system supports this performance monitoring feature. Users can selectmultiple events and click "Add Event" to add them to the current profile configuration.
NOTE: All selected IBS-Fetch derived events must have same settings (i.e. same counts and option-mask).The same rule applies to IBS-Op.
4.3.3.3. Import Tab
Figure 4.7. Edit EBS/IBS configuration: Import Tab
Besides selecting individual events, users can import event selections from an existing profileconfiguration. This tab lists the available profile configuration in the drop-down menu. Once you select

Configure Profile
79
a configuration, description of the configuration will be shown in the field below. To add events, simplyclick on "Import Events".
4.3.3.4. Info Tab
Figure 4.8. Edit EBS/IBS configuration: Info Tab
This tab shows information of the currently running system such as processor family, model, etc. It alsoshows the XML events file currently in use.
4.4. Predefined Profile ConfigurationsAMD processors offer a wide range of event types for collection and this can overwhelm new users.Predefined profile configurations address the more common aspects of program and system performanceanalysis. CodeAnalyst provides configurations that support various methods of data collection includingtime-based profiling (TBP, event-based profiling (EBP), and Instruction-Based Sampling (IBS).
Profile Configuration Purpose
Time-based profile (TBS) Collect a time-based profile
Assess performance (EBS) Collect a profile that provides an overall assessmentof performance
Investigate data access (EBS) Investigate data cache (DC) and data translationlookaside buffer (DTLB) performance
Investigate instruction access (EBS) Investigate instruction cache (IC) and instructiontranslation lookaside buffer (ITLB) performance
Investigate L2 cache access (EBS) Investigate access to the unified L2 cache
Investigate branching (EBS) Investigate branch behavior including branchmisprediction
Instruction-based sampling (IBS) Investigate instruction fetch and macro-opexecution performance
IBS Op Overall Assessment Get an overall assessment of performance using IBSOp
IBS Op Branch Find poorly predicted branches
IBS Op Load-Store Measure data load / store performance
IBS Op Load-Store (expert) Measure data load / store performance (expert)
IBS Op Load-Store DC Miss measure data load / store DC miss performance
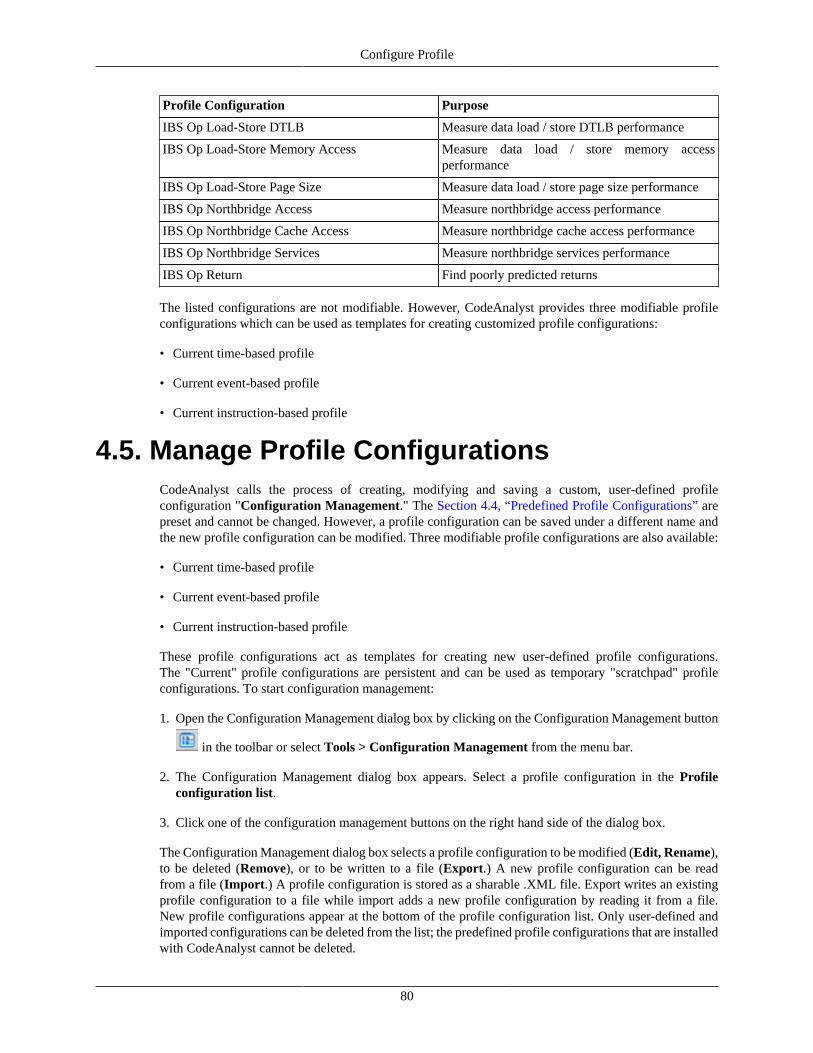
Configure Profile
80
Profile Configuration Purpose
IBS Op Load-Store DTLB Measure data load / store DTLB performance
IBS Op Load-Store Memory Access Measure data load / store memory accessperformance
IBS Op Load-Store Page Size Measure data load / store page size performance
IBS Op Northbridge Access Measure northbridge access performance
IBS Op Northbridge Cache Access Measure northbridge cache access performance
IBS Op Northbridge Services Measure northbridge services performance
IBS Op Return Find poorly predicted returns
The listed configurations are not modifiable. However, CodeAnalyst provides three modifiable profileconfigurations which can be used as templates for creating customized profile configurations:
• Current time-based profile
• Current event-based profile
• Current instruction-based profile
4.5. Manage Profile ConfigurationsCodeAnalyst calls the process of creating, modifying and saving a custom, user-defined profileconfiguration "Configuration Management." The Section 4.4, “Predefined Profile Configurations” arepreset and cannot be changed. However, a profile configuration can be saved under a different name andthe new profile configuration can be modified. Three modifiable profile configurations are also available:
• Current time-based profile
• Current event-based profile
• Current instruction-based profile
These profile configurations act as templates for creating new user-defined profile configurations.The "Current" profile configurations are persistent and can be used as temporary "scratchpad" profileconfigurations. To start configuration management:
1. Open the Configuration Management dialog box by clicking on the Configuration Management button
in the toolbar or select Tools > Configuration Management from the menu bar.
2. The Configuration Management dialog box appears. Select a profile configuration in the Profileconfiguration list.
3. Click one of the configuration management buttons on the right hand side of the dialog box.
The Configuration Management dialog box selects a profile configuration to be modified (Edit, Rename),to be deleted (Remove), or to be written to a file (Export.) A new profile configuration can be readfrom a file (Import.) A profile configuration is stored as a sharable .XML file. Export writes an existingprofile configuration to a file while import adds a new profile configuration by reading it from a file.New profile configurations appear at the bottom of the profile configuration list. Only user-defined andimported configurations can be deleted from the list; the predefined profile configurations that are installedwith CodeAnalyst cannot be deleted.

Configure Profile
81
Figure 4.9. Configuration Management
The following actions are available through the Configuration Management dialog box:
• Click the Rename button to rename the selected, user-defined profile configuration (e.g., my configconfiguration) and to rename the associated file. Only user-defined profile configurations may berenamed.
• Click the Remove button to remove the selected, user-defined profile configuration (e.g., my configconfiguration) and to delete the associated file. Only user-defined profile configurations may beremoved from the list of profile configurations.
• Click the Edit button to modify the selected configuration.
• Click the Import button to import a profile configuration from an existing file. This adds a new profileconfiguration to the list. The import action displays a standard file selection dialog box. Use this dialogbox to select a file to import.
• Click the Export button to write the selected profile configuration to a file. The export action displaysa standard file selection dialog box. Use this dialog box to specify the name and location of the file towhich the profile configuration is written.
• Click OK to close the window without taking further action.
The Edit button opens an edit dialog box. The kind of analysis used by the selected profile configurationdetermines the type of dialog box that displays since each kind of analysis has its own settings. Forexample, selecting "Current time-based profile " then clicking the Edit button, opens the "Edit timer
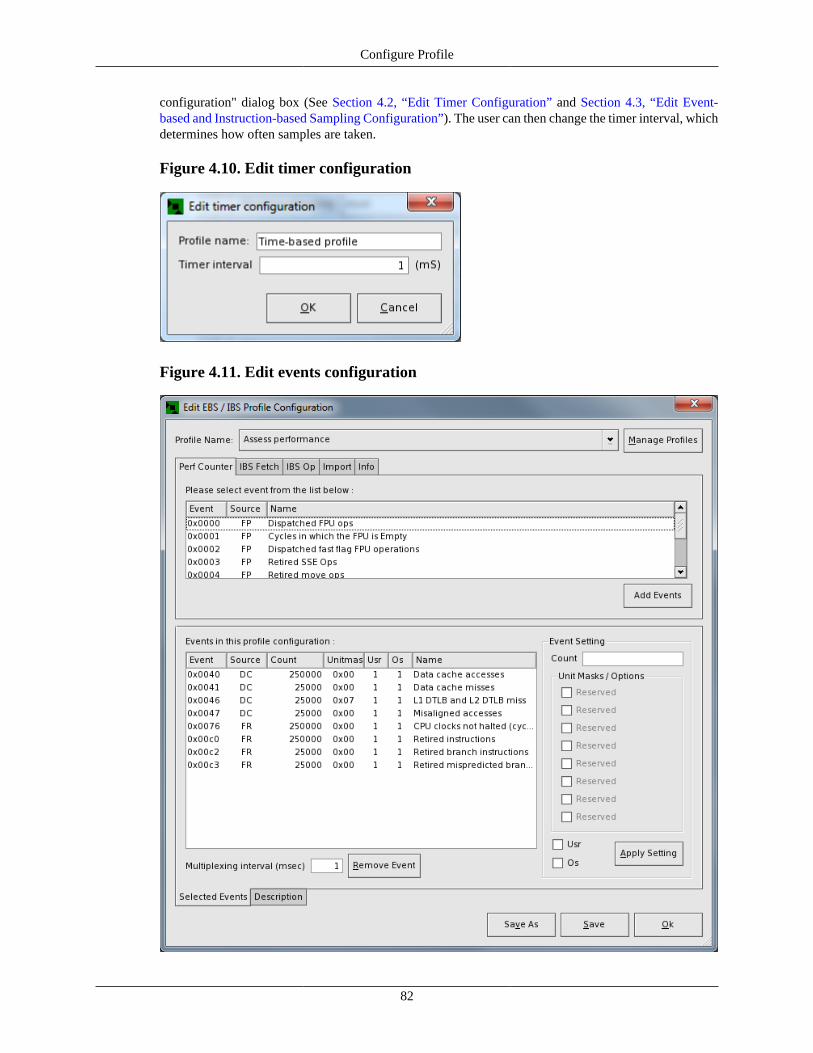
Configure Profile
82
configuration" dialog box (See Section 4.2, “Edit Timer Configuration” and Section 4.3, “Edit Event-based and Instruction-based Sampling Configuration”). The user can then change the timer interval, whichdetermines how often samples are taken.
Figure 4.10. Edit timer configuration
Figure 4.11. Edit events configuration

Configure Profile
83
The Session Settings dialog (See Section 2.7, “Session Settings”) box contains an Edit button that alsoopens a profile configuration edit dialog box. Selecting a profile configuration and clicking the Edit buttonin the Session Settings dialog box is equivalent to opening the Configuration Management dialog box,selecting a profile configuration and clicking the Edit button.
By default, new profile configurations are stored in the /$(HOME)/.CodeAnalyst/Configs/DCConfigssubdirectory.

84
Chapter 5. Collecting Profile
5.1. Collecting Profiles and Performance DataInformation about program performance can be collected in several ways depending upon the kind ofanalysis to be performed. The following sections discuss ways to collect program profiles and performanceinformation:
Section 5.2, “Collecting a Time-Based Profile”
Section 5.3, “Collecting an Event-Based Profile”
Section 5.4, “Collecting an Instruction-Based Sampling Profile”
Collection and analysis of profiles are also covered in the Chapter 8, Tutorial.
5.2. Collecting a Time-Based ProfileIn time-based profiling, the application to be analyzed is run at full speed on the same machine that isrunning AMD CodeAnalyst. Time-based samples (collected at predetermined intervals) can be used toidentify possible bottlenecks, execution penalties, or optimization opportunities. The timer-based profilingfeature can be used with all AMD processors. This page describes how to collect a time-based profile.
The predefined profile (data collection) configuration (Time-based profile) is used to enable collectionof a time-based profile.
5.2.1. Collecting a Time-Based Profile
To collect a time-based profile :
1. Create new project or choose a previously opened project. Select Time-Based Profile from the drop-down profile configuration list in the toolbar.
2. If a new project is to be created, the New project properties dialog box opens. Assign a project nameand location or browse for an existing file.
Figure 5.1. New Project Properties

Collecting Profile
85
3. The Session settings window opens. Assign a session name (optional), enter the path to the applicationprogram to be launched and set the working directory.
4. Under Profile configuration: select time-based profile.
5. Select other desired profiling options and click OK.
Figure 5.2. Session Settings
6.
Click the Start icon to launch the application and begin profiling.
7. The task bar at the bottom of the screen displays "Sampling Session Started" and the percent completed.
The Pause and Stop icons become active.

Collecting Profile
86
Figure 5.3. Task Bar Display
8. When the sampling session is complete, the application under test terminates and the performance datais processed. The work space then displays a module-by-module breakdown of the results in the SystemData table. Select the System Tasks tab to see a task-by-task breakdown of the results. Double-clickon a module or task to drill down into the data.
Figure 5.4. System Data results
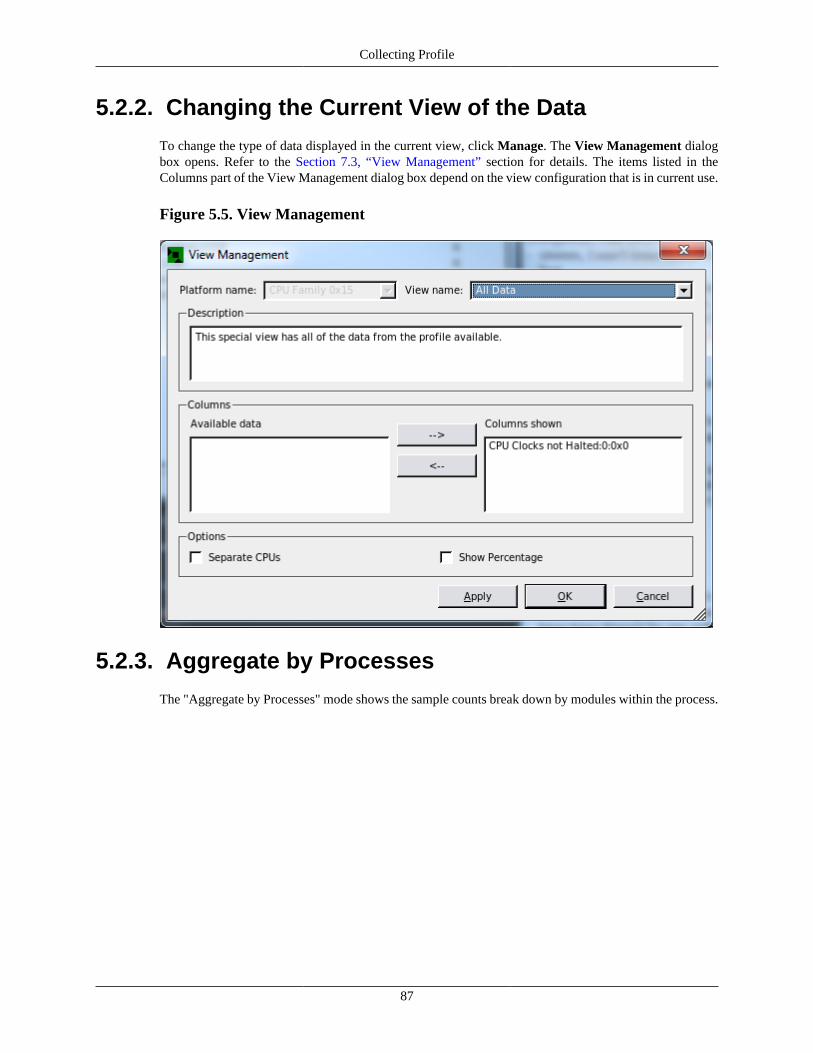
Collecting Profile
87
5.2.2. Changing the Current View of the Data
To change the type of data displayed in the current view, click Manage. The View Management dialogbox opens. Refer to the Section 7.3, “View Management” section for details. The items listed in theColumns part of the View Management dialog box depend on the view configuration that is in current use.
Figure 5.5. View Management
5.2.3. Aggregate by Processes
The "Aggregate by Processes" mode shows the sample counts break down by modules within the process.

Collecting Profile
88
Figure 5.6. Aggregate by Processes
5.3. Collecting an Event-Based ProfileEvent-based profiling (EBP) collects data based on how a program behaves on processors and memory.Information from this type of profile can be analyzed for developing and testing hypothesis aboutperformance issues. AMD processors provide a wide range of hardware events that can be monitored andmeasured.
5.3.1. Collecting an Event-Based Profile
To collect an event-based profile :
1. Create new project or choose a previously opened project. Select an event-based profiling configurationlike "Assess performance" from the drop-down profile configuration list in the toolbar.
2. If a new project is to be created, the New project properties dialog box opens. Assign a project nameand location, or browse for an existing file.
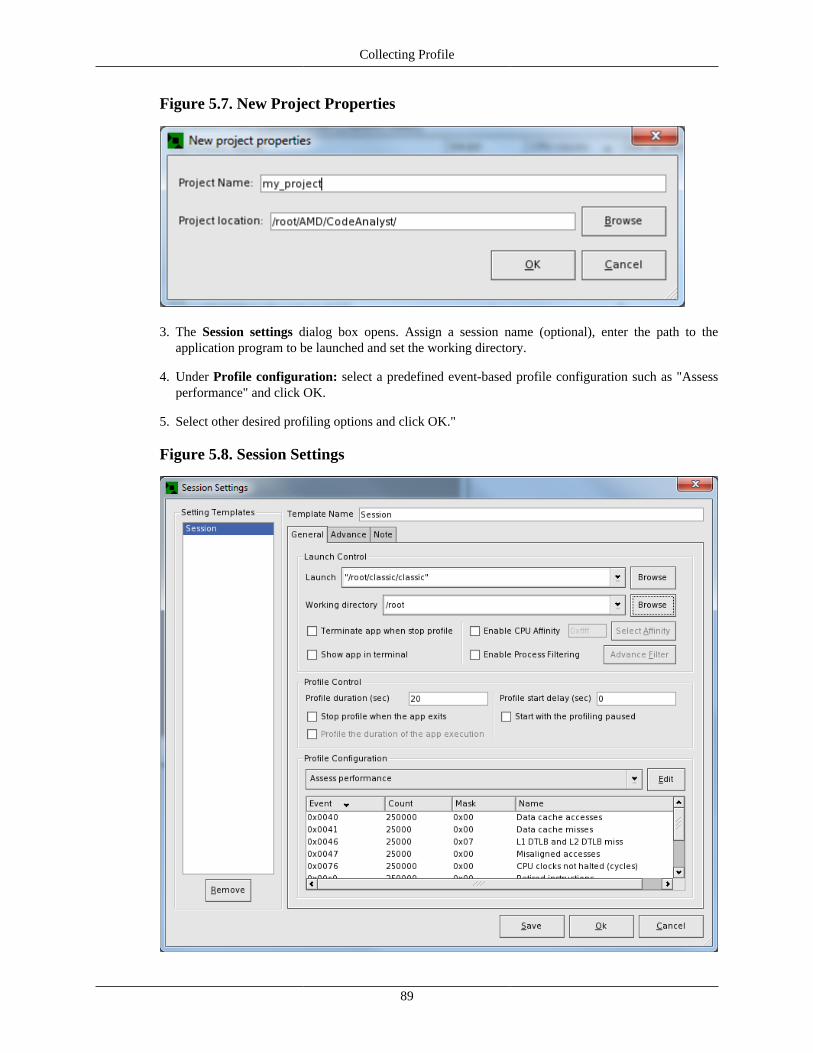
Collecting Profile
89
Figure 5.7. New Project Properties
3. The Session settings dialog box opens. Assign a session name (optional), enter the path to theapplication program to be launched and set the working directory.
4. Under Profile configuration: select a predefined event-based profile configuration such as "Assessperformance" and click OK.
5. Select other desired profiling options and click OK."
Figure 5.8. Session Settings

Collecting Profile
90
6. Click Ok to apply selections.
7.
Click the Start icon to launch the application and begin profiling.
8. The task bar at the bottom of the screen displays "Sampling Session Started" and the percent completed.
The Pause and Stop icons become active.
Figure 5.9. Launch Application
9. When the sampling session is complete, the application under test terminates and the performance datais processed. The work space then displays a module-by-module breakdown of the results in the SystemData table. Select the System Tasks tab to see a task-by-task breakdown of the results. Double-clickon a module or task to drill down into the data.
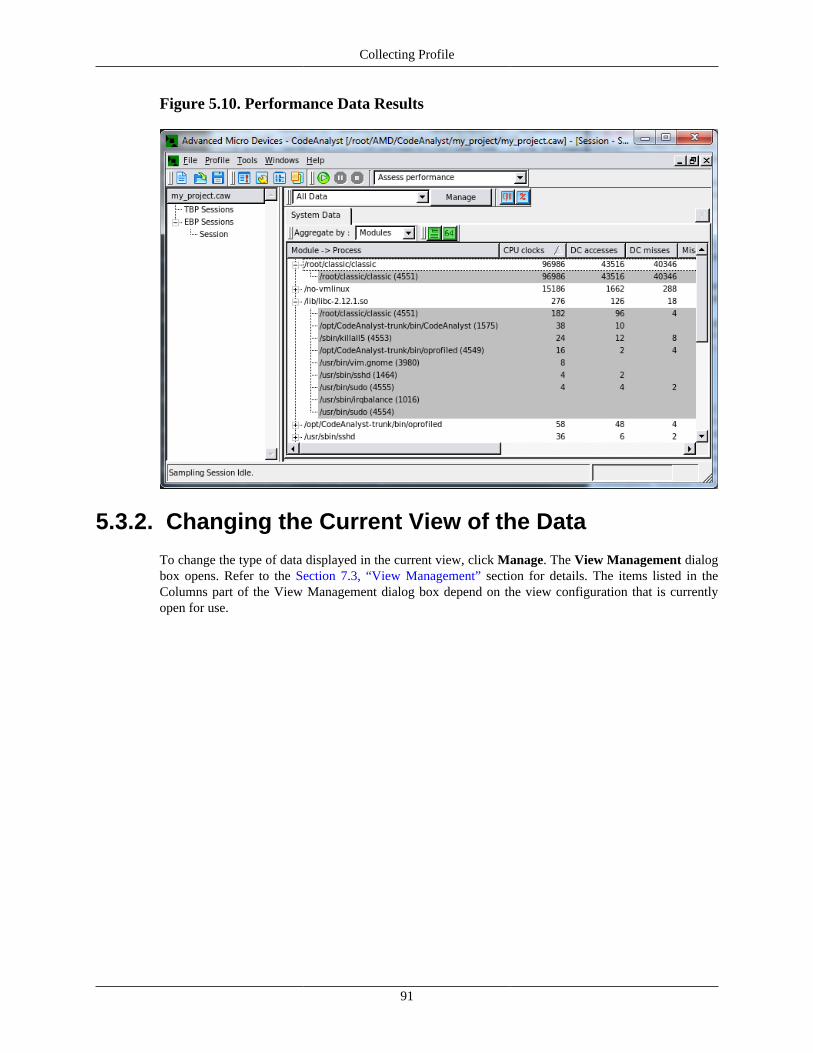
Collecting Profile
91
Figure 5.10. Performance Data Results
5.3.2. Changing the Current View of the Data
To change the type of data displayed in the current view, click Manage. The View Management dialogbox opens. Refer to the Section 7.3, “View Management” section for details. The items listed in theColumns part of the View Management dialog box depend on the view configuration that is currentlyopen for use.

Collecting Profile
92
Figure 5.11. View Management
5.3.3. Aggregate by Processes
The "Aggregate by Processes" mode shows the sample counts break down by modules within the process.
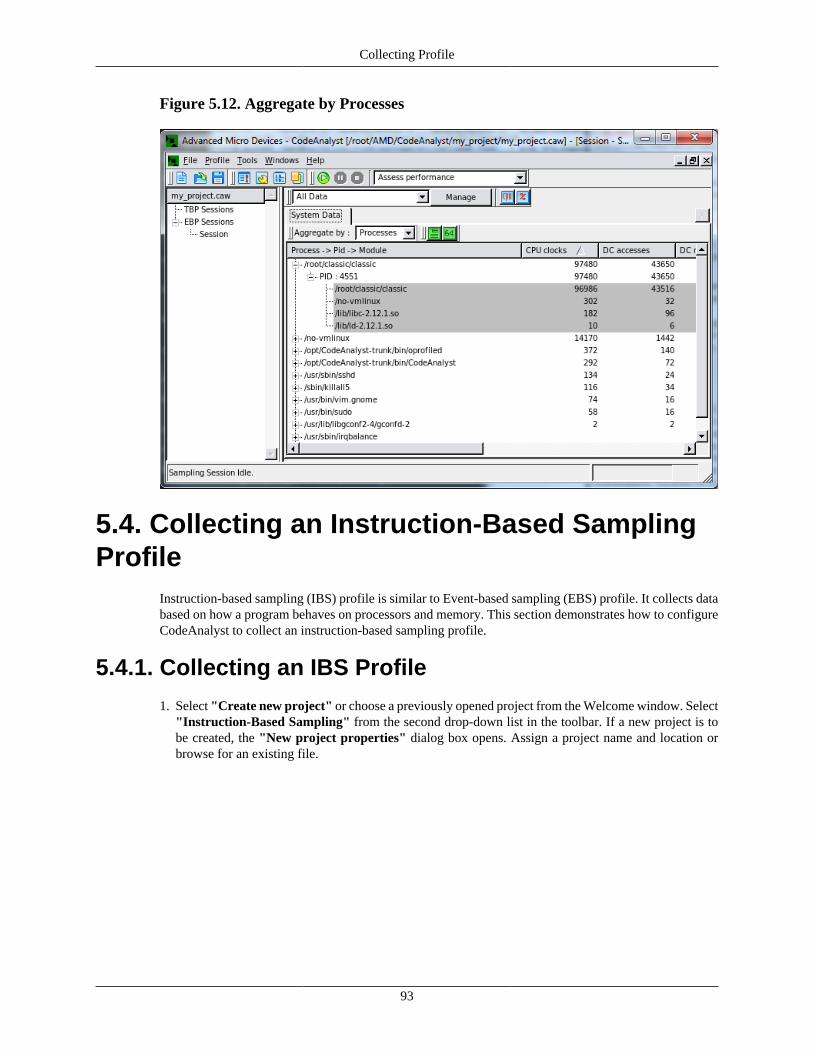
Collecting Profile
93
Figure 5.12. Aggregate by Processes
5.4. Collecting an Instruction-Based SamplingProfile
Instruction-based sampling (IBS) profile is similar to Event-based sampling (EBS) profile. It collects databased on how a program behaves on processors and memory. This section demonstrates how to configureCodeAnalyst to collect an instruction-based sampling profile.
5.4.1. Collecting an IBS Profile
1. Select "Create new project" or choose a previously opened project from the Welcome window. Select"Instruction-Based Sampling" from the second drop-down list in the toolbar. If a new project is tobe created, the "New project properties" dialog box opens. Assign a project name and location orbrowse for an existing file.

Collecting Profile
94
Figure 5.13. New Project Properties
2. The "Session settings" dialog box opens.
• In the "Launch" field, enter the path to the application program to be started, or browse to find theexecutable program.
• The "Working directory" field fills automatically. You may also set the working directory to adifferent location by either entering the path directly or by browsing to it.
• Under "Profile configuration" select the predefined profile configuration "Instruction-BasedSampling."
3. Advanced step: If editing the IBS profile configuration, click "Edit" to open the "Edit EBS/IBS Configuration" dialog box. (See Section 4.3, “Edit Event-based and Instruction-based SamplingConfiguration” for more detail.

Collecting Profile
95
Figure 5.14. Session Settings
4. Click "Ok" to apply selections.
5.
Click the "Start" icon to launch the application and begin profiling. The task bar atthe bottom of the screen displays "Sampling Session Started" and the percent completed. The "Pause"
and "Stop" icons become active. When the sampling session is complete, theapplication-under-test terminates and the performance data is processed. The work space then displaysa module-by-module breakdown of the results in the System Data table. Select the System Tasks tabto see a task-by-task breakdown of the results. Double-click on a module or process to drill down intothe data.

Collecting Profile
96
Figure 5.15. Output from IBS Profile Session
5.4.2. Changing the Current View of the Data
Similar to event-based profiling, IBS profile can produces a broad range of information about programbehavior in a single run. IBS fetch samples provide information about instruction fetch while IBSop samples provide information about the execution of operations (ops) that are issued from AMD64instructions. Several views provide a more focused look at different aspects of fetch and executionbehavior.
The "All Data" view displays sample counts for all IBS-derived events. Predefined views are provided tonarrow down the displayed performance data to the most useful groups of IBS-derived events.
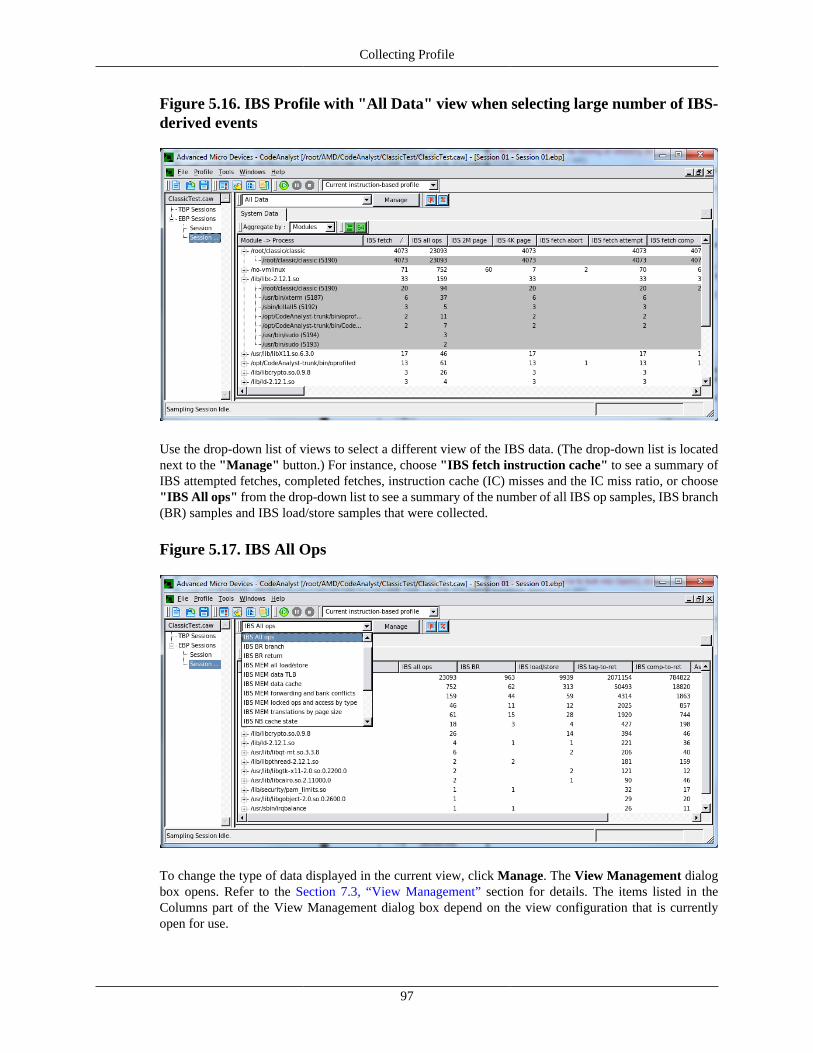
Collecting Profile
97
Figure 5.16. IBS Profile with "All Data" view when selecting large number of IBS-derived events
Use the drop-down list of views to select a different view of the IBS data. (The drop-down list is locatednext to the "Manage" button.) For instance, choose "IBS fetch instruction cache" to see a summary ofIBS attempted fetches, completed fetches, instruction cache (IC) misses and the IC miss ratio, or choose"IBS All ops" from the drop-down list to see a summary of the number of all IBS op samples, IBS branch(BR) samples and IBS load/store samples that were collected.
Figure 5.17. IBS All Ops
To change the type of data displayed in the current view, click Manage. The View Management dialogbox opens. Refer to the Section 7.3, “View Management” section for details. The items listed in theColumns part of the View Management dialog box depend on the view configuration that is currentlyopen for use.
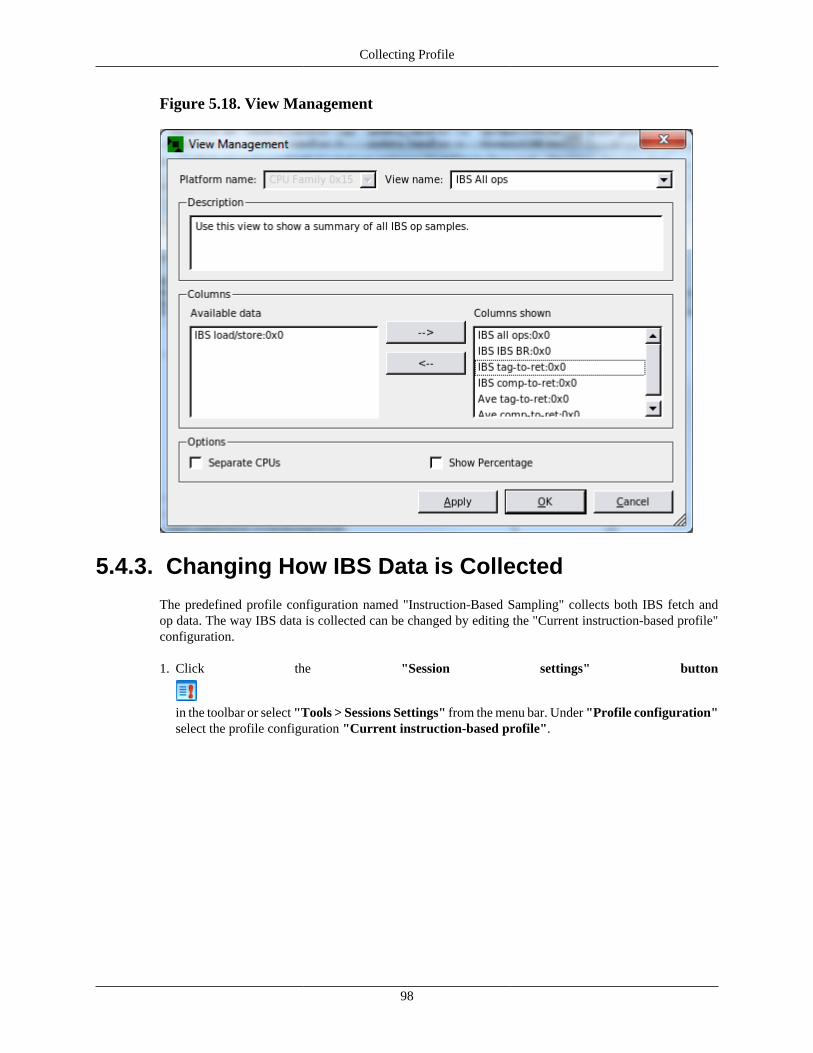
Collecting Profile
98
Figure 5.18. View Management
5.4.3. Changing How IBS Data is Collected
The predefined profile configuration named "Instruction-Based Sampling" collects both IBS fetch andop data. The way IBS data is collected can be changed by editing the "Current instruction-based profile"configuration.
1. Click the "Session settings" button
in the toolbar or select "Tools > Sessions Settings" from the menu bar. Under "Profile configuration"select the profile configuration "Current instruction-based profile".

Collecting Profile
99
Figure 5.19. Edit EBS/IBS configuration
2. In the "Edit EBS/IBS configuration" dialog, users can select IBS-Fetch/Op events from the availableperformance event lists, remove events from the selected list of events, or change the sampling periodsand options of each type of event. Please see Section 4.3, “Edit Event-based and Instruction-basedSampling Configuration” for more detail.
3. Click OK to apply the changes.

100
Chapter 6. Data CollectionConfiguration6.1. Data Collection Configuration
CodeAnalyst provides predefined profile (data collection) and view configurations to set up data collectionand the presentation of results. The CodeAnalyst GUI provides the ability to change profile and viewconfigurations.
CodeAnalyst stores these predefined configurations (and custom user configurations) in XML files. Expertusers may choose to create or modify their own profile and view configurations by editing XML filesdirectly. The two subsections below describe the XML format and tags for profile and view configurationfiles.
Section 6.2, “Profile Configuration File Format”
Section 7.5, “View Configuration File Format”
6.2. Profile Configuration File FormatA data collection configuration file describes how CodeAnalyst is to be configured for data collection.Through the CodeAnalyst GUI, the user chooses one of several data collection configurations. The GUIconfigures data collection according to the selected configuration.
The user may also modify a data collection configuration to fit their needs using the CodeAnalyst GUI.The modified data collection configuration can be saved to a file.
A data collection configuration file contains a single configuration. The file representation of a datacollection configuration is in XML.
6.2.1. XML file format
6.2.1.1. Collection configuration
The following tags mark the beginning and end of configuration information within a data collectionconfiguration file.
<dc_configuration> ... </dc_configuration>
A collection configuration element contains one <tbp>, <ebp> or <sim> element. Each element describesa data collection configuration of the type indicated by its element name. Each such element describeshow to configure CodeAnalyst to collect data.
6.2.1.2. TBP collection configuration
The <tbp> and </tbp> tags mark the beginning and end of a time-based profiling data collectionconfiguration.

Data Collection Configuration
101
A <tbp> element has the following attributes:
name: Configuration name (string)
interval: Sampling interval given in milliseconds (float)
A TBP collection configuration element contains exactly one of the following elements: <tool_tip> and<description>. The <tool_tip> and <description> elements have a common form and are described below.
A time-based profiling configuration has the form:
<dc_configuration> <tbp name="..." interval="10.0"> <tool_tip> ... </tool_tip> <description> ... </description> </tbp> </dc_configuration>
6.2.1.3. EBP collection configuration
The <ebp> and </ebp> tags mark the beginning and end of a event-based profiling data collectionconfiguration.
An <ebp> element has the following attributes:
name: Configuration name (string)
mux_period: Event multiplexing period in milliseconds (integer)
The mux_period attribute specified the event multiplexing period. If the mux_period is zero, eventmultiplexing is disabled. Event multiplexing should not be used when all events can be programmed ontothe hardware counters in a profile run. The number hardware counters can be different on each platformon which measurements are to be taken. For example, AMD Athlon64™ and Opteron™ processors havefour performance counters and thus, the number of <event> elements is limited to a maximum of four.Information from extra <event> elements may be discarded.
An EBP collection configuration element contains exactly one of the following elements: <tool_tip> and<description>.
An <event> element has the following attributes:
select: Event select value (integer)
mask: Unit mask value (integer)
os: Enables OS sampling (Boolean)
user: Enabled user-level sampling (Boolean)
count: Sampling period (integer)
edge_detect: Enable edge detect when counting events (Boolean)
host: Enable host mode event counting Boolean)
guest: Enable guest mode event counting (Boolean)

Data Collection Configuration
102
The values must be validated against the events and specific capabilities supported by the measurementplatform.
An event-based profiling data collection configuration has the form:
<dc_configuration> <ebp name ="..." mux_period="10"> <tool_tip> ... </tool_tip> <description> ... </description> <event select="0x00" mask="0x00" os="T" user="T" host="F" guest="F" edge_detect="F" count="50000"></event> ... </ebp> </dc_configuration>
6.2.1.4. Tool tip
The tags <tool_tip> and </tool_tip> mark the beginning and end of a short "tool tip" description of aconfiguration. The text between the tags is the tool tip description.
<tool_tip> ... </tool_tip>
A tool tip is usually only a few key words with no line breaks.
6.2.1.5. Description
The tags <description> and </description> mark the beginning and end of a short description of aconfiguration. The text between the tags is the description.
<description> ... </description>
A description is usually only a few sentences long. It may contain line breaks. Line breaks and extra spacewill be simplified. Line breaks will be replaced by spaces and runs of space characters will be replacedby single space characters.
6.2.1.6. Attributes
The value of a numeric attribute is returned as a string that can be converted to internal integer and floatingpoint representation. The actual values may be further constrained for the attribute's purpose, e.g., thenumber of simulated instructions must be greater than 0. The default value for a numeric attribute is zero.
The value of a Boolean attribute is returned as one of the strings "T" or "F", which denote the truth valuestrue and false, respectively. The default value of a Boolean attribute is "F".
6.2.2. Examples of XML Files
6.2.2.1. TBP example
Here is an example of a data collection configuration for time-based profiling.
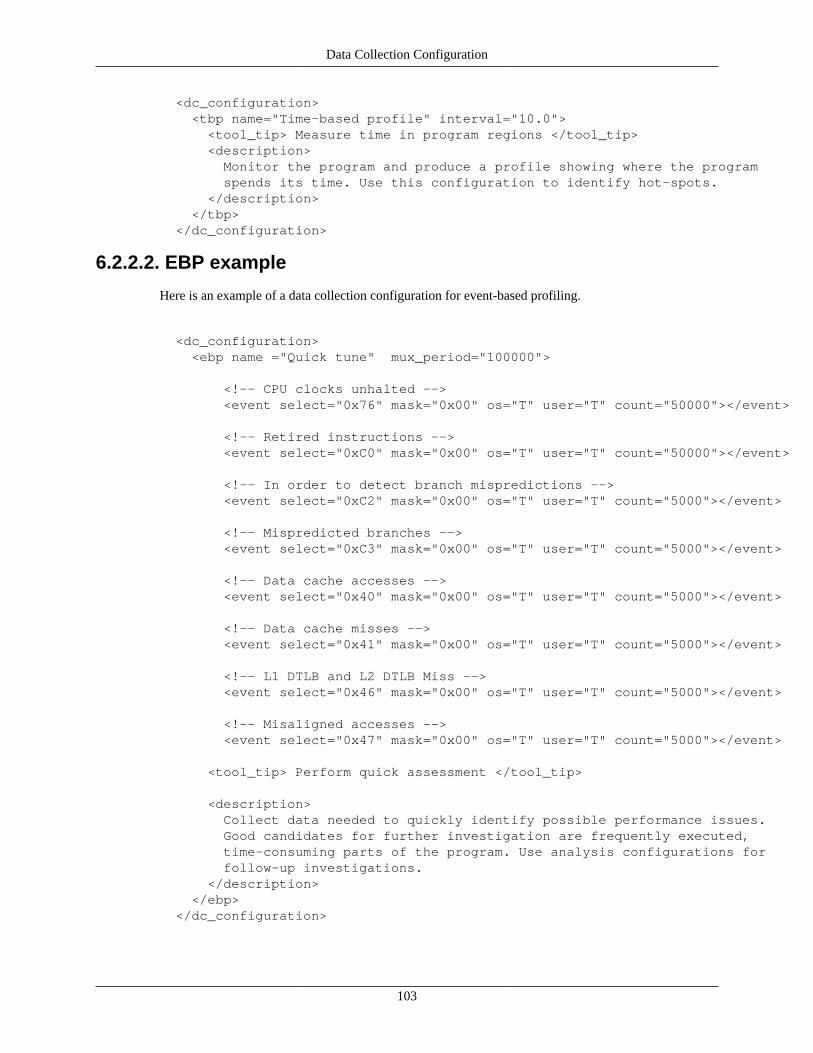
Data Collection Configuration
103
<dc_configuration> <tbp name="Time-based profile" interval="10.0"> <tool_tip> Measure time in program regions </tool_tip> <description> Monitor the program and produce a profile showing where the program spends its time. Use this configuration to identify hot-spots. </description> </tbp> </dc_configuration>
6.2.2.2. EBP example
Here is an example of a data collection configuration for event-based profiling.
<dc_configuration> <ebp name ="Quick tune" mux_period="100000">
<!-- CPU clocks unhalted --> <event select="0x76" mask="0x00" os="T" user="T" count="50000"></event>
<!-- Retired instructions --> <event select="0xC0" mask="0x00" os="T" user="T" count="50000"></event>
<!-- In order to detect branch mispredictions --> <event select="0xC2" mask="0x00" os="T" user="T" count="5000"></event>
<!-- Mispredicted branches --> <event select="0xC3" mask="0x00" os="T" user="T" count="5000"></event>
<!-- Data cache accesses --> <event select="0x40" mask="0x00" os="T" user="T" count="5000"></event>
<!-- Data cache misses --> <event select="0x41" mask="0x00" os="T" user="T" count="5000"></event>
<!-- L1 DTLB and L2 DTLB Miss --> <event select="0x46" mask="0x00" os="T" user="T" count="5000"></event>
<!-- Misaligned accesses --> <event select="0x47" mask="0x00" os="T" user="T" count="5000"></event>
<tool_tip> Perform quick assessment </tool_tip>
<description> Collect data needed to quickly identify possible performance issues. Good candidates for further investigation are frequently executed, time-consuming parts of the program. Use analysis configurations for follow-up investigations. </description> </ebp> </dc_configuration>
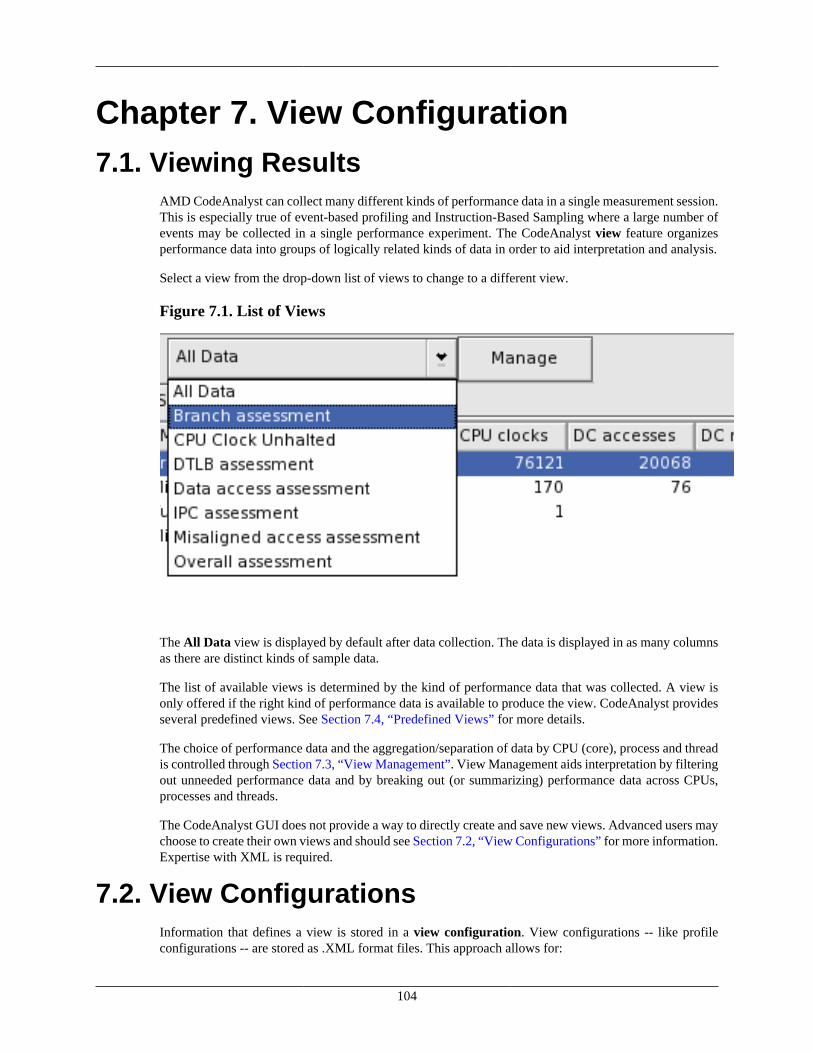
104
Chapter 7. View Configuration7.1. Viewing Results
AMD CodeAnalyst can collect many different kinds of performance data in a single measurement session.This is especially true of event-based profiling and Instruction-Based Sampling where a large number ofevents may be collected in a single performance experiment. The CodeAnalyst view feature organizesperformance data into groups of logically related kinds of data in order to aid interpretation and analysis.
Select a view from the drop-down list of views to change to a different view.
Figure 7.1. List of Views
The All Data view is displayed by default after data collection. The data is displayed in as many columnsas there are distinct kinds of sample data.
The list of available views is determined by the kind of performance data that was collected. A view isonly offered if the right kind of performance data is available to produce the view. CodeAnalyst providesseveral predefined views. See Section 7.4, “Predefined Views” for more details.
The choice of performance data and the aggregation/separation of data by CPU (core), process and threadis controlled through Section 7.3, “View Management”. View Management aids interpretation by filteringout unneeded performance data and by breaking out (or summarizing) performance data across CPUs,processes and threads.
The CodeAnalyst GUI does not provide a way to directly create and save new views. Advanced users maychoose to create their own views and should see Section 7.2, “View Configurations” for more information.Expertise with XML is required.
7.2. View ConfigurationsInformation that defines a view is stored in a view configuration. View configurations -- like profileconfigurations -- are stored as .XML format files. This approach allows for:

View Configuration
105
• Sharing view configurations between users.
• Saving customized view configurations.
• Creating and distributing new view configurations more easily.
Predefined views are installed as .XML files and cannot be permanently changed. Any changes made ina session only appear while the session is open. Advanced customization is possible by making a copy ofthe .XML file containing the view configuration and then modifying the XML representation itself.
The view configuration files that are installed with CodeAnalyst provide a good starting point for creationof new views. Predefined view configuration files are in the /opt/CodeAnalyst/share/codeanalyst/Configs/ViewConfig directory. In this directory, CodeAnalyst stores common view configuration files.Platform specific configuration files are stored in the subdirectories with the corresponding AMDprocessor family name.
NOTE : Since the unit mask for some performance monitoring events vary on different AMD processorfamilies, view configurations that use these events are listed underneath platform specific directory.
See Section 7.5, “View Configuration File Format” for more information about the XML representationof a view.
7.3. View ManagementThe content and format of a view can be modified using view management. Use view management tochange the kinds of performance data shown in a view, to aggregate or separate data by core (CPU), toaggregate or separate data by task, to aggregate or separate data by thread, and to control display of apercentage column.
Two types of View Management dialog are available:
• Global : Manage a collection of session dialogs that are currently using the same view. The changesmade to a view configuration within the dialog will propagate to all opening sessions that are currentlydisplaying the view. Global View Management dialog also allows user to manage platform specificview configurations. Changes made in this dialog are saved to the view configuration file. The user canreset the pre-defined view configuration to the original value in this dialog.
• Local : Manage the view of an individual session. The changes made to a view configuration within thedialog are applied only to an individual session, and are not saved to the view configuration file.
View management can be initiated in any of three ways:
•Click the view management icon in the toolbar. ( Global )
• Select Tools > View Management from the menu bar. ( Global )
• Click the Manage button next to the drop-down list of views. ( Local )

View Configuration
106
7.3.1. View Management Dialog
Figure 7.2. Global View Management Dialog
7.3.1.1. Platform Name
The Platform Name field shows the name of the selected AMD processor family. Processor families areselected from a drop-down list, which is enabled only in the Global View dialog. In Local View dialog,the processor type is determined by the type of processor the profile data of the session was collected on.
7.3.1.2. View Name
The View Name field shows the name of the selected view configuration. View configurations are selectedfrom a drop-down list.
7.3.1.3. Description
The description changes according to the selection in View name.
7.3.1.4. Columns
CodeAnalyst can only display items listed in the Available data list.
• Available data: The items in the Available data list are preselected according to the selected viewconfiguration. Each item is available for inclusion in a view as a column.
• Columns shown: Selects which columns are shown and can be changed by using the directional arrowsto move an item from the list.

View Configuration
107
The selected platform name in Platform Name drop-down menu list determines the types of AMDprocessor family, which in turn determines the available views shown in View name drop-down menu list.Availability of views are determined by the available performance counters on a particular AMD processorfamily. The selected view determines the choices displayed under Available data and under Columnsshown. The performance data to be shown in the selected view can be changed by moving items betweenthe Available data list and the Columns shown list.
To add an item to the Columns shown list and make it visible in the view:
1. Select the item in the Available data list.
2. Click the right arrow -> button.
To remove item from the Columns shown list and remove it from the view:
1. Select the item in the Columns shown list.
2. Click the left arrow <- button.
NOTE : Changes made to view configurations are persistent.
7.3.1.5. Separate CPUsWhen selected, event data is shown for each processor in separate columns in the System Data table. Forexample, on a dual-core processor, timer-based samples display in two columns with the headings:
• Time-based samples - C0
• Time-based samples - C1
7.3.1.6. Show PercentageEnabling Show Percentage displays the percentage column in the view.
7.4. Predefined ViewsAMD CodeAnalyst provides many predefined views. These predefined views cover the most commonkinds of analysis and directly support the predefined profile configurations that control collection ofperformance data. Profile (data collection) configurations choose which performance data are collectedduring a session. Coordinated, predefined view configurations provide purpose-specific views of thisperformance data. A view may also include computed performance measurements (rates and ratios ofevents, for example) that are calculated from the raw performance data.
View availability is determined by the availability of the performance data required for generating theview. Any view that can be displayed from available performance data can be selected for display. Forexample, the misaligned accesses view is offered when data is collected using either the basic assessmentand the data access profile configurations because both of these predefined profile configurations collectthe events needed to display the misaligned accesses view.
The following table summarizes the predefined view configurations associated with each of the predefinedprofile configurations.
Profile Configuration View Configuration
Assess performance • Overall assessment
• IPC assessment
• Branch assessment

View Configuration
108
• Data access assessment
• DTLB assessment
• Misaligned access assessment
Investigate branching • Branch assessment
• Near return report
• Taken branch report
Investigate data access • Data access assessment
• Data access report
• DTLB assessment
• DTLB report
• Misaligned access assessment
Investigate instruction access • Instruction cache report
• ITLB report
Investigate L2 cache access • L2 access report
Instruction-based sampling • IBS fetch overall
• IBS fetch instruction cache
• IBS fetch instruction TLB
• IBS fetch page translations
• IBS All ops
• IBS BR branch
• IBS BR return
• IBS MEM all load/store
• IBS MEM data TLB
• IBS MEM data cache
• IBS MEM forwarding and band conflicts
• IBS MEM locked ops and access by type
• IBS MEM translations by page size
• IBS NB cache state
• IBS NB local/remote
• IBS NB request breakdown

View Configuration
109
7.5. View Configuration File FormatView configurations control the content and formatting of CodeAnalyst views. The CodeAnalyst GUIoffers predefined view configurations which can be selected by a user. View Configurations are storedin .XML formatted files. A new customized view can be created by writing an .XML file for the view. Onlythe most advanced CodeAnalyst users should ever need to create views at the XML level. This sectiondescribes the format and semantics of a view configuration in XML format.
7.5.1. XML File FormatA view configuration file contains a single, non-empty <view_configuration> element. This element, inturn, contains a single, non-empty <view> element. This format allows the possibility of representingmultiple views within a single configuration file. The current implementation assumes that only one<view> will be defined in a configuration file.
The <view> element describes a view and has the following attributes:
• name: Displayable symbolic name given to the view (string)
• separate_cpus: Controls aggregation/separation by CPU (Boolean)
• separate_processes: Controls aggregation/separation by process (Boolean)
• separate_threads: Controls aggregation/separation by thread (Boolean)
• default_view: Identifies this view as a candidate default view (Boolean)
• show_percentage: Toggle the format of the profile data shown between raw and percentage
Boolean attributes are restricted to the string values "T" and "F".
The view's name will appear in a list of available views and should suggest the purpose of the view to theuser. The separation/aggregation attributes are optional and default to false. CodeAnalyst shows a viewafter data collection, a so-called "default view." The default_view attribute is a hint to CodeAnalyst that theview could (or should) be selected as a default view. Please use this attribute sparingly. The default_viewattribute is optional and it's default value is false.
7.5.1.1. <view>
A <view> element contains one each of the following elements:
<data> Describes the event data needed to show the view
<output> Describes how the event data will be shown
<tool_tip> Tool tip to be shown for the view
<description> Short description to be shown for the view
Combining these elements, a view configuration file has the overall structure shown here:
<view_configuration> <view name="View name" separate_cpus="T" separate_processes="F" separate_threads="F"> <data>
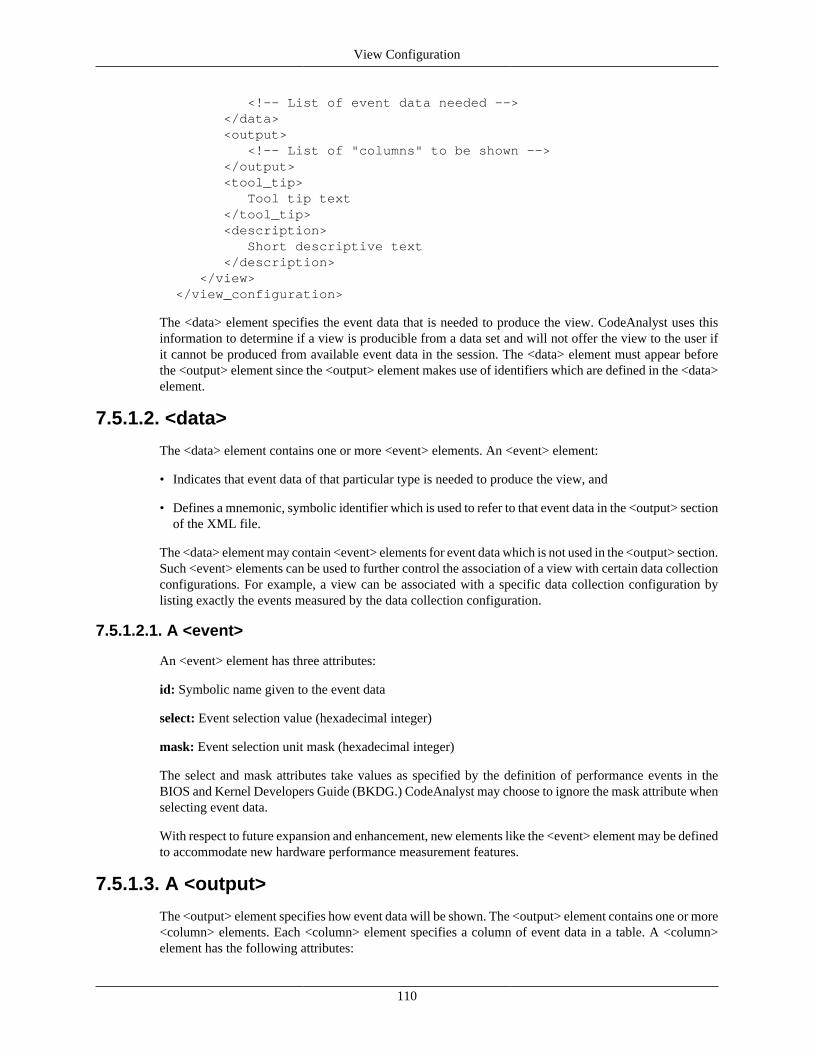
View Configuration
110
<!-- List of event data needed --> </data> <output> <!-- List of "columns" to be shown --> </output> <tool_tip> Tool tip text </tool_tip> <description> Short descriptive text </description> </view> </view_configuration>
The <data> element specifies the event data that is needed to produce the view. CodeAnalyst uses thisinformation to determine if a view is producible from a data set and will not offer the view to the user ifit cannot be produced from available event data in the session. The <data> element must appear beforethe <output> element since the <output> element makes use of identifiers which are defined in the <data>element.
7.5.1.2. <data>
The <data> element contains one or more <event> elements. An <event> element:
• Indicates that event data of that particular type is needed to produce the view, and
• Defines a mnemonic, symbolic identifier which is used to refer to that event data in the <output> sectionof the XML file.
The <data> element may contain <event> elements for event data which is not used in the <output> section.Such <event> elements can be used to further control the association of a view with certain data collectionconfigurations. For example, a view can be associated with a specific data collection configuration bylisting exactly the events measured by the data collection configuration.
7.5.1.2.1. A <event>
An <event> element has three attributes:
id: Symbolic name given to the event data
select: Event selection value (hexadecimal integer)
mask: Event selection unit mask (hexadecimal integer)
The select and mask attributes take values as specified by the definition of performance events in theBIOS and Kernel Developers Guide (BKDG.) CodeAnalyst may choose to ignore the mask attribute whenselecting event data.
With respect to future expansion and enhancement, new elements like the <event> element may be definedto accommodate new hardware performance measurement features.
7.5.1.3. A <output>
The <output> element specifies how event data will be shown. The <output> element contains one or more<column> elements. Each <column> element specifies a column of event data in a table. A <column>element has the following attributes:

View Configuration
111
title: Title to be displayed along with the data (string)
sort: Controls sorting of data in the column (string)
visible: Controls column visibility (Boolean)
The title attribute is a descriptive string that is used to label the data in a table. The sort attribute specifieswhether the data should be sorted or not. The sort attribute has only three permitted values: "ascending","descending" and "none". At most one column should have a sort attribute of "ascending" or "descending";all other columns should be "none". The visible attribute is optional and has the default value true. Acolumn may be hidden by setting the visible attribute to false. Generally, you should not need to definea hidden column.
7.5.1.3.1. <column>
A <column> element is non-empty and contains exactly one of the following empty elements:
<value> Show the selected event data as a simple value
<sum> Show the sum of two selected event data
<difference> Show the difference of two selected event data
<product> Show the product of two selected event data
<ratio> Show the ratio of two selected event data
These elements select and combine the event data to be shown in the column. A <value> element has asingle attribute:
id: Data identifier to select event data
The <sum>, <difference>, <product> and <ratio> elements take two attributes:
left: Data identifier to select data for the left operand
right: Data identifier to select data for the right operand
In the case of <ratio>, for example, the left identifier specifies event data for the numerator and the rightidentifier specifies event data for the denominator.
Note: Simple <value> elements using an event must appear before any <sum>, <ratio>, ... elements in the<output> section that use the same event. This ordering is required by the CodeAnalyst user interface.
With respect to future enhancement, additional elements like <sum>, etc. can be defined to combine eventdata. One such addition may be a <formula> element that defines a formula to be evaluated using eventdata. The formula may use identifiers to refer to event data.
7.5.1.4. A <tool_tip>
A <tool_tip> element is a non-empty XML element that contains the text of a tool tip to be displayed for theview. A <description> element is a non-empty XML element that contains the text of a short description tobe displayed for the view. Leading and trailing space is trimmed from tool tip and description text. Spacesare compressed and new line characters are replaced by a single space.
7.5.2. Example XML FileHere is an example view configuration file. Note that several optional attributes are not used in the exampleand they take on the appropriate default values.

View Configuration
112
<!-- Show instructions per cycle View configuration Date: 17 May 2006 Version: 0.1 -->
<view_configuration>
<view name="IPC" separate_cpus="F" separate_processes="F" separate_threads="F" >
<data> <event id="CPU_clocks" select="76" mask="00" /> <event id="Ret_instructions" select="c0" mask="00" /> </data>
<output> <column title="Instructions" sort="none"> <value id="Ret_instructions" /> </column> <column title="Cycles" sort="none"> <value id="CPU_clocks" /> </column> <column title="IPC" sort="descending"> <ratio left="Ret_instructions" right="CPU_clocks" /> </column> <column title="CPI" sort="none"> <ratio left="CPU_clocks" right="Ret_instructions" /> </column> </output>
<tool_tip> Show instructions per cycle </tool_tip>
<description> Use this view to find hot-spots with low instruction level parallelism. </description>
</view>
</view_configuration>

113
Chapter 8. Tutorial
8.1. AMD CodeAnalyst TutorialThis tutorial demonstrates how to use AMD CodeAnalyst to analyze the performance of an applicationprogram. The tutorial provides step-by-step directions for using AMD CodeAnalyst. We recommendreading the tutorial sections in the order listed below.
• Section 8.2, “Tutorial - Prepare Application”
• Section 8.3, “Tutorial - Creating a CodeAnalyst Project”
• Section 8.4, “Tutorial - Analysis with Time-Based Sampling Profile”
• Section 8.5, “Tutorial - Analysis with Event-Based Sampling Profile”
• Section 8.6, “Tutorial - Analysis with Instruction-Based Sampling Profile”
• Section 8.7, “Tutorial - Profiling a Java Application”
8.1.1. Related Topics
For quick reference to options available in the CodeAnalyst workspace, See Section 2.2, “Exploring theWorkspace and GUI”
8.2. Tutorial - Prepare ApplicationThis tutorial uses the example program that is distributed with AMD CodeAnalyst. Source code for theexample program is installed with CodeAnalyst. To find the source code, locate the directory into whichCodeAnalyst was installed and then find the samples/classic directory.
The example program, classic, implements the straightforward "textbook" algorithm for matrixmultiplication. Matrix multiplication is performed in the function multiply_matrices(). This functionprovides an opportunity for optimization. The classic implementation takes long, non-unit strides throughone of the operand matrices. These long strides cause frequent data translation lookaside buffer (DTLB)misses that penalize execution.
In order to prepare the example program from the tutorial:
1. Go to directory /path_to_CodeAnalyst_source_directory/samples/classic/.
2. At a command prompt, run g++ -g -o classic classic.cpp. This should compile classic.cpp into classicbinary with debugging information. Alternatively, run make with the supplied makefile to generatethe executable.
8.3. Tutorial - Creating a CodeAnalyst ProjectThis section demonstrates how to create a new CodeAnalyst project. All work takes place in the context ofa CodeAnalyst project. You must either create a new project or open an existing project in order to collect
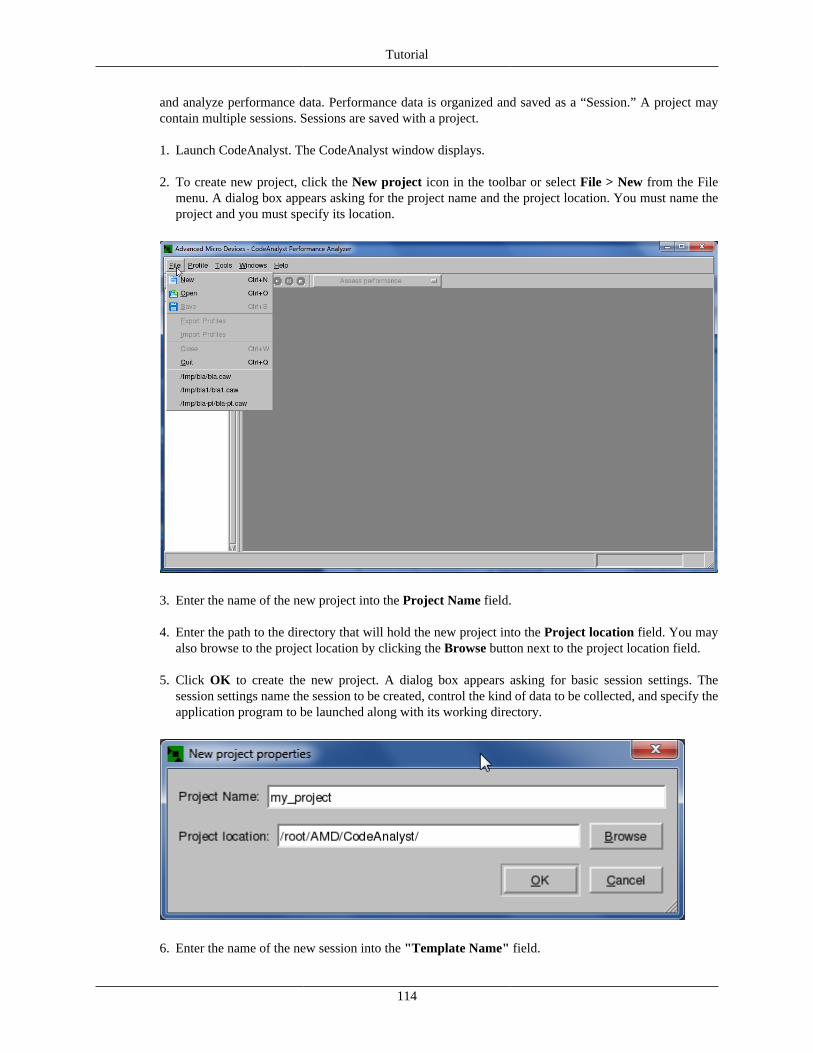
Tutorial
114
and analyze performance data. Performance data is organized and saved as a “Session.” A project maycontain multiple sessions. Sessions are saved with a project.
1. Launch CodeAnalyst. The CodeAnalyst window displays.
2. To create new project, click the New project icon in the toolbar or select File > New from the Filemenu. A dialog box appears asking for the project name and the project location. You must name theproject and you must specify its location.
3. Enter the name of the new project into the Project Name field.
4. Enter the path to the directory that will hold the new project into the Project location field. You mayalso browse to the project location by clicking the Browse button next to the project location field.
5. Click OK to create the new project. A dialog box appears asking for basic session settings. Thesession settings name the session to be created, control the kind of data to be collected, and specify theapplication program to be launched along with its working directory.
6. Enter the name of the new session into the "Template Name" field.

Tutorial
115
7. Enter the "Launch" path to the application program to be launched.
8. Enter the path to the "Working directory". You may browse to either the application program orworking directory by clicking the appropriate Browse button. This tutorial uses the example programthat is installed with CodeAnalyst. The profile configuration controls the method of data collection andthe kind of performance data to be collected.
9. Select Time-based profile (or another profile configuration) from the drop-down list of profileconfigurations. A brief description of the profile configuration is displayed for the selectedconfiguration.

Tutorial
116
10.Click the check box to the left of "Terminate app when stop profile" to select that option. When thisoption is enabled, CodeAnalyst terminates the application program after collecting data. The “Profileduration” option specifies the maximum time period for data collection.
11.Enter "10" into the "Profile duration" field to collect data for a maximum of 10 seconds.
12.Click "OK" to confirm the session settings. CodeAnalyst is now ready to collect data.
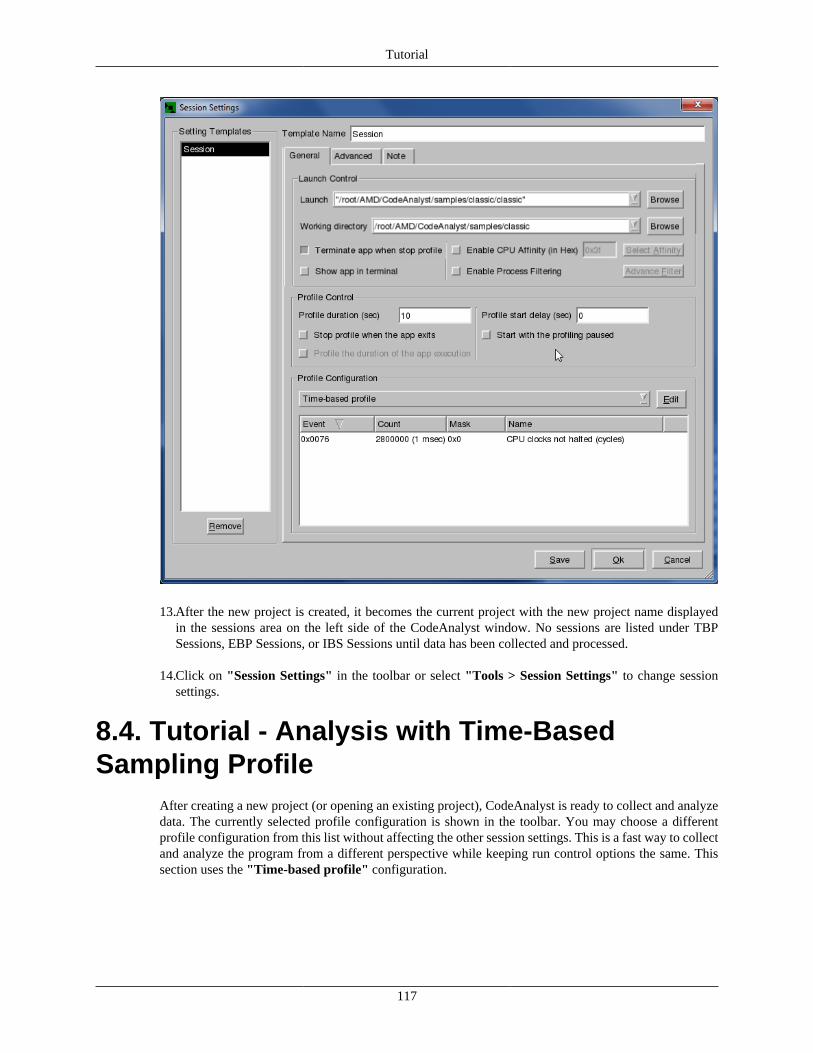
Tutorial
117
13.After the new project is created, it becomes the current project with the new project name displayedin the sessions area on the left side of the CodeAnalyst window. No sessions are listed under TBPSessions, EBP Sessions, or IBS Sessions until data has been collected and processed.
14.Click on "Session Settings" in the toolbar or select "Tools > Session Settings" to change sessionsettings.
8.4. Tutorial - Analysis with Time-BasedSampling Profile
After creating a new project (or opening an existing project), CodeAnalyst is ready to collect and analyzedata. The currently selected profile configuration is shown in the toolbar. You may choose a differentprofile configuration from this list without affecting the other session settings. This is a fast way to collectand analyze the program from a different perspective while keeping run control options the same. Thissection uses the "Time-based profile" configuration.
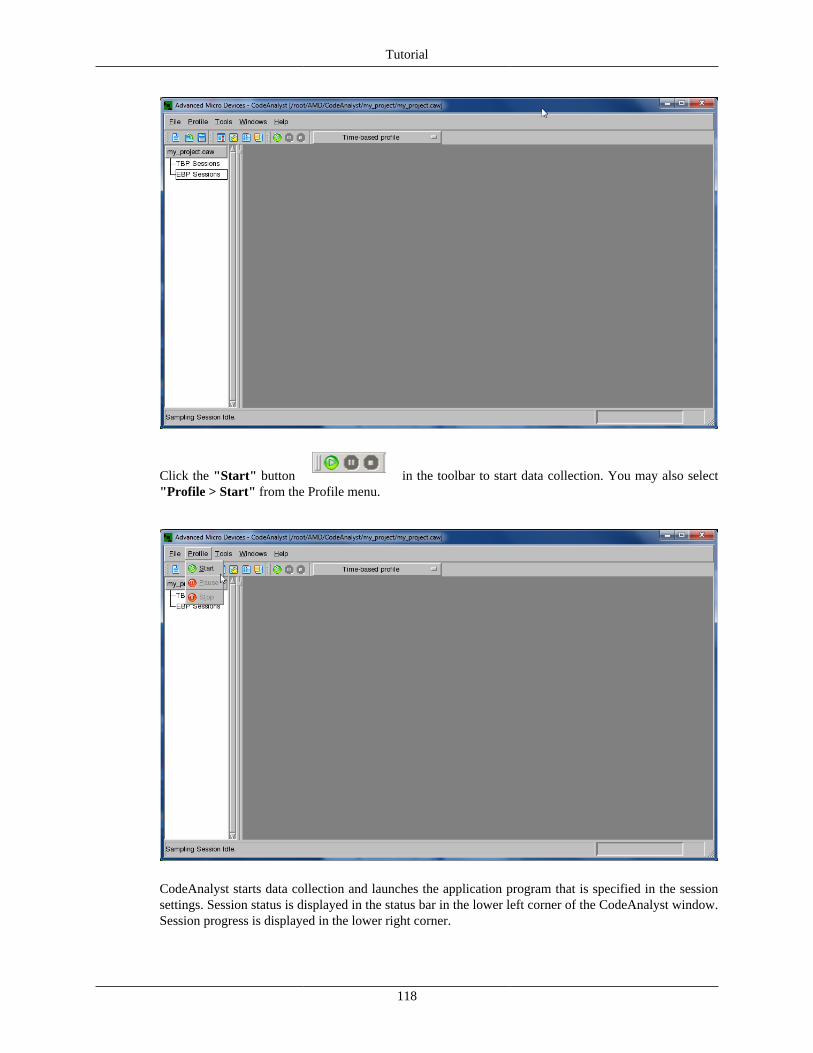
Tutorial
118
Click the "Start" button in the toolbar to start data collection. You may also select"Profile > Start" from the Profile menu.
CodeAnalyst starts data collection and launches the application program that is specified in the sessionsettings. Session status is displayed in the status bar in the lower left corner of the CodeAnalyst window.Session progress is displayed in the lower right corner.

Tutorial
119
After data collection is complete, CodeAnalyst processes the data and displays results in the SystemData tab. A new session appears under “TBP Sessions” in the sessions area at the left-hand side of theCodeAnalyst window.
The System Data table displays a module-by-module breakdown of timer samples. This breakdown showsthe distribution of execution time across modules that were active while CodeAnalyst was collecting data.CodeAnalyst is a system-wide profiling tool and it collects data on all active software components. System-wide profiling assists the analysis of multi-process applications, drivers, operating system modules,libraries, and other software components. Each sample represents 1 millisecond of execution time.
8.4.1. Changing the View of Performance Data
The CodeAnalyst GUI offers one or more views of performance data. A view shows one or more kinds ofperformance data or computed performance measurements that are calculated from the performance data.Select the current view from the drop-down list that appears directly above the result tabs. The “Timer-based profile” view is offered for TBP data.
1. Click the "Manage" button. A dialog box appears to change aspects of the currently selected view.(The tutorial section on Section 8.5, “Tutorial - Analysis with Event-Based Sampling Profile” revisitsSection 7.3, “View Management”.)
One aspect of a view is the separation and aggregation of performance data. An aggregated sample countis the sum total of the samples taken across all CPUs (processes or threads.) Aggregated data is shownby default. Data may be separated by CPU using the check boxes in the view management dialog box.
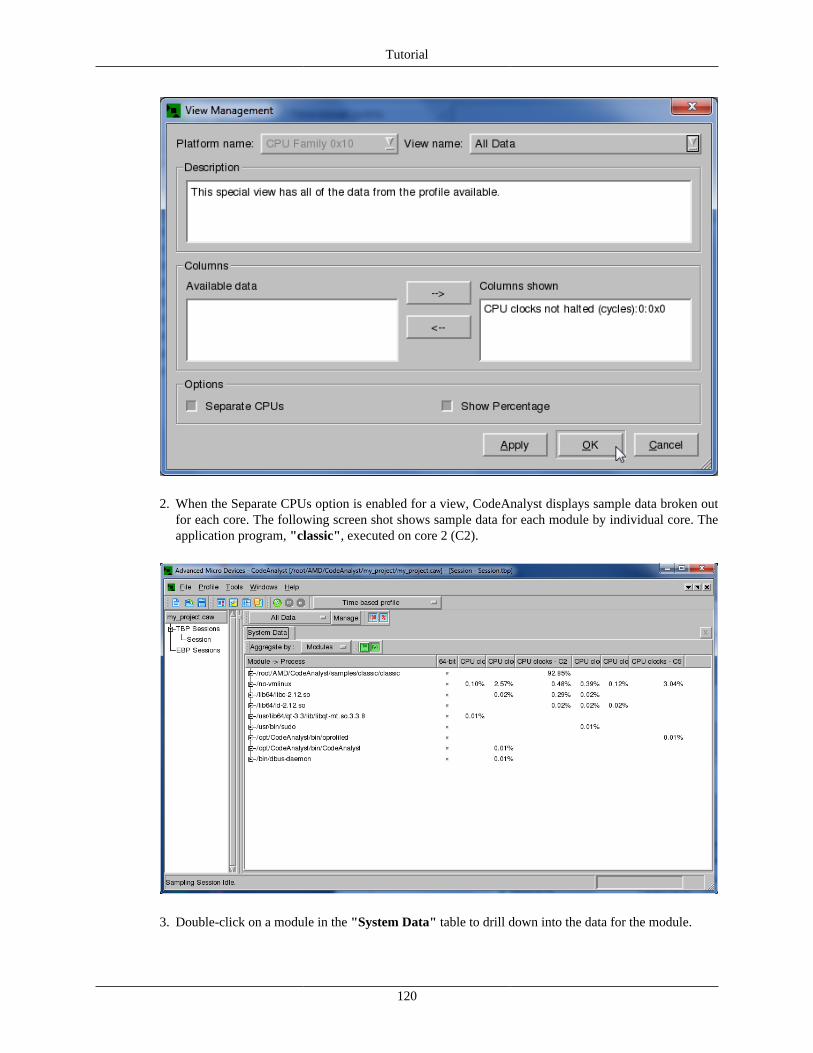
Tutorial
120
2. When the Separate CPUs option is enabled for a view, CodeAnalyst displays sample data broken outfor each core. The following screen shot shows sample data for each module by individual core. Theapplication program, "classic", executed on core 2 (C2).
3. Double-click on a module in the "System Data" table to drill down into the data for the module.

Tutorial
121
4. When viewing the "System Data" tab, double-click on a process to drill down. A new tab is createddisplaying a function-by-function breakdown of timer examples. The distribution of timer samplesacross all of the functions in the module is shown. The functions with the most timer samples take themost time to execute and are the best places to look for optimization opportunities.
5. Double-click on a function to drill down into the data for that function. CodeAnalyst displays a newtab containing the source for the function along with the number of timer samples taken for each lineof code. A code density chart is drawn at the top of the source panel.

Tutorial
122
6. Some users may choose to hide the code density chart in order to devote more screen area within asource panel to code. To hide the code density chart, select "Windows > Show Density Charts" fromthe Tools menu.
7. Click on an expand (+) square to expand and display a region of source or assembly code, or click ona collapse (–) square to hide a region of source or assembly code.
Timer samples for each source line and assembly instruction are shown. The source panel shows theprogram regions that are taking the most execution time. These hot-spots are the best candidates foroptimization.
8.5. Tutorial - Analysis with Event-BasedSampling Profile
This section is a brief introduction to analysis with event-based profiling. A CodeAnalyst project mustalready be opened by following the directions under Section 8.3, “Tutorial - Creating a CodeAnalystProject”, or by opening an existing CodeAnalyst project. It also assumes that session settings have beenestablished and CodeAnalyst is ready to profile an application.
Event-based profiling uses the hardware performance event counters to measure the number of specifickinds of events that occur during execution. Processor clock cycles, retired instructions, data cache
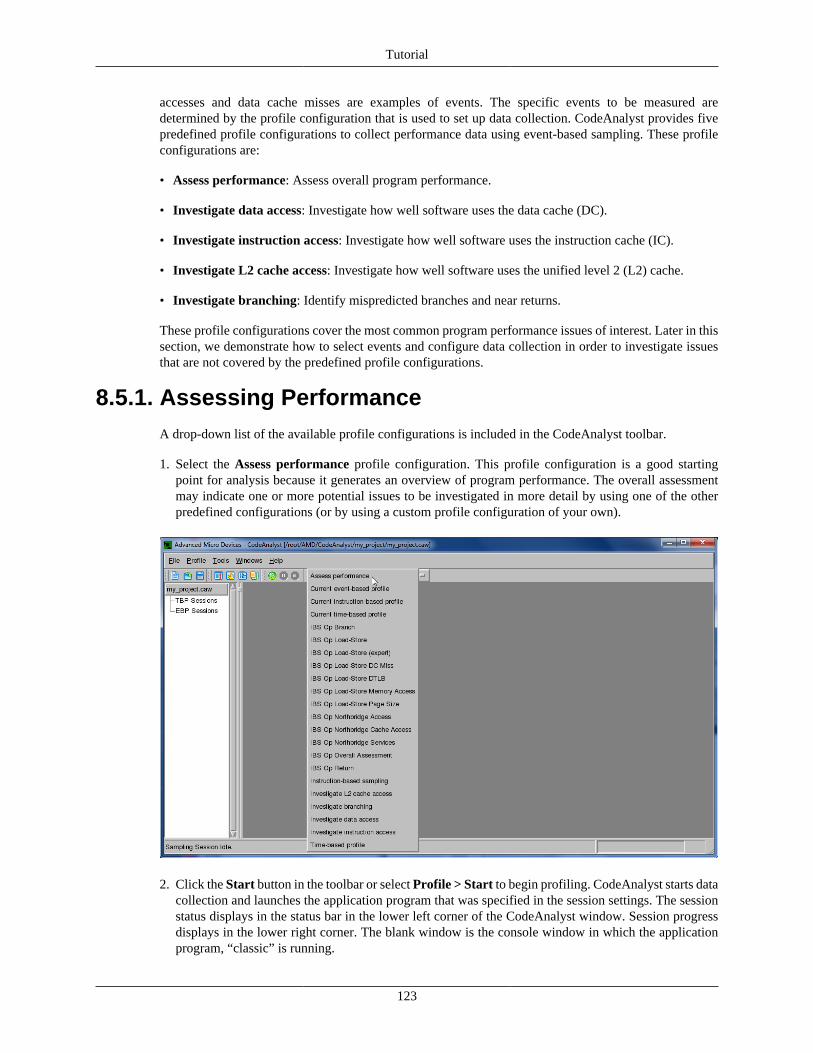
Tutorial
123
accesses and data cache misses are examples of events. The specific events to be measured aredetermined by the profile configuration that is used to set up data collection. CodeAnalyst provides fivepredefined profile configurations to collect performance data using event-based sampling. These profileconfigurations are:
• Assess performance: Assess overall program performance.
• Investigate data access: Investigate how well software uses the data cache (DC).
• Investigate instruction access: Investigate how well software uses the instruction cache (IC).
• Investigate L2 cache access: Investigate how well software uses the unified level 2 (L2) cache.
• Investigate branching: Identify mispredicted branches and near returns.
These profile configurations cover the most common program performance issues of interest. Later in thissection, we demonstrate how to select events and configure data collection in order to investigate issuesthat are not covered by the predefined profile configurations.
8.5.1. Assessing PerformanceA drop-down list of the available profile configurations is included in the CodeAnalyst toolbar.
1. Select the Assess performance profile configuration. This profile configuration is a good startingpoint for analysis because it generates an overview of program performance. The overall assessmentmay indicate one or more potential issues to be investigated in more detail by using one of the otherpredefined configurations (or by using a custom profile configuration of your own).
2. Click the Start button in the toolbar or select Profile > Start to begin profiling. CodeAnalyst starts datacollection and launches the application program that was specified in the session settings. The sessionstatus displays in the status bar in the lower left corner of the CodeAnalyst window. Session progressdisplays in the lower right corner. The blank window is the console window in which the applicationprogram, “classic” is running.

Tutorial
124
When data collection is complete, CodeAnalyst processes the performance data and creates a new sessionunder “EBP Sessions” in the session management area on the left side of the CodeAnalyst window. Resultsare shown in the System Data tab. The System Data table resembles and behaves like its TBP counterparts;however, the type and number of event-based samples are shown instead of timer samples.
The Overall assessment view displays an overview of software performance. The System Data tableshows the number of events and computed performance measurements for each module that was activeduring data collection. The Overall assessment view shows:
• CPU clocks: CPU clocks not halted event
• Instructions per clock cycle (IPC): Retired instructions / CPU clocks
• DC (data cache) miss rate: DC misses / retired instructions
• DTLB (data translation lookaside buffer) miss rate: DTLB miss / retired instructions
• Misaligned access rate: Misaligned accesses / retired instructions
• Mispredict rate: Retired mispredicted branch instructions / retired instructions
In general, when the term rate appears in a computed performance measurement, the rate is expressedas “events per retired instruction.” A rate indicates how frequently an event is occurring. A high rate,such as a high DC miss rate, may indicate the presence of a performance problem and an opportunity foroptimization.
The specific combination of events and computed performance measurements that are shown in a tableare a view. CodeAnalyst may offer more than one view depending upon the kinds of data (e.g., events)that were collected. The drop-down list (immediately above the System Data tab) contains the availableviews. The All Data view is always available. To switch to All Data view, select the "All Data" viewfrom the drop-down list.
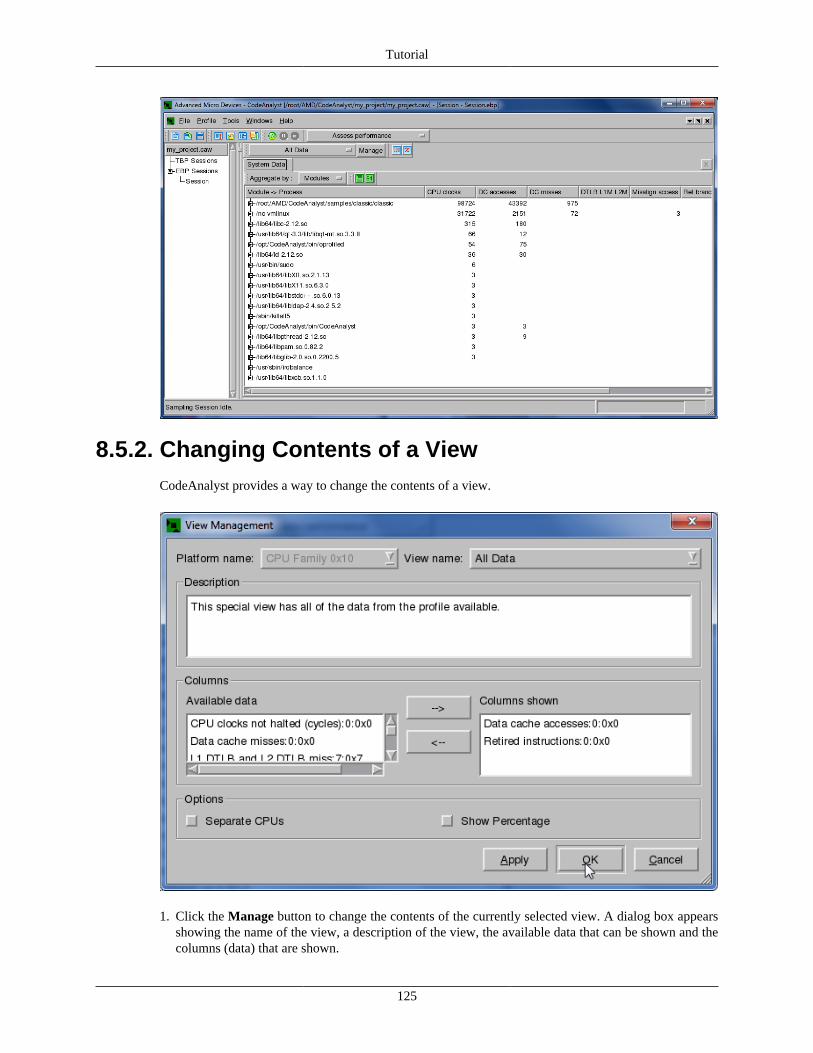
Tutorial
125
8.5.2. Changing Contents of a ViewCodeAnalyst provides a way to change the contents of a view.
1. Click the Manage button to change the contents of the currently selected view. A dialog box appearsshowing the name of the view, a description of the view, the available data that can be shown and thecolumns (data) that are shown.

Tutorial
126
• To add data for an event to the current view, select an event in the Available data list and click theright arrow button.
• To remove data for an event from the current view, select an event in the Columns shown list andclick the left arrow button.
2. Remove all events except Retired instructions and Data cache assesses from the Columns shown list.
3. Click the OK button to confirm and accept the changes. After making these changes, CodeAnalystupdates the System Data table and eliminates the columns for the event data that were removed fromthe view.
4. Select the IPC assessment view from the drop-down list of views.
CodeAnalyst updates the System Data table which now shows the IPC assessment view. This viewconsists of:
• The number of retired instruction samples
• The number of CPU clock samples
• The ratio of instructions per clock cycle (IPC)
• The ratio of clock cycles per instruction (CPI)
The ratio of instructions per clock cycle is a basic measure of execution efficiency and is a good indicatorof instruction level parallelism (ILP).

Tutorial
127
8.5.3. Choosing Events for Data CollectionThe predefined profile configurations cover the most common kinds of performance analysis. AMDprocessors, however, are able to monitor a wide range of performance events.

Tutorial
128
1. To configure data collection using events of your own choice, click on the "Session Settings" buttonin the toolbar. A dialog box appears asking for session settings.
2. Choose the Current event-based profile configuration in the list of profile configurations. You mayfreely edit and change this profile configuration and may use this profile configuration as a scratchpadfor customized EBP configurations.
3. Click the Edit button. A dialog box appears which allows you to edit the “Current EBS/IBS ProfileConfiguration" dialog. The “Current event-based profile” configuration in this example alreadycontains the “CPU clocks not halted” event.
4. In the "Perf Counter" tab, scroll through the list of individual events to find the "Retired instructions"event. Select "Retired instructions" and click "Add Event". The “0x00c0 Retired instructions” eventis added to the list of events in the configuration. Set the "Count" field to "1,000,000", and click"Apply Setting".
5. Find and select the "0x00c1 Retired uops" event and repeat the previous step.
If you make a mistake and need to remove an event from the configuration, select the event and then clickthe "Remove Event" button.
The Event Count field specifies the sampling period for the event. The Event Count determines how oftena sample is taken for the event. If the Event Count is N, then a sample will be taken after the occurrenceof N events of that type. Use smaller Event Count values to sample an event more often. However, morefrequent sampling increases measurement overhead.
Caution: Choose the Event Count value conservatively. Start with a large value first and then decreasethe value until the desired measurement accuracy is achieved. Very small values may cause the system tohang under certain workload conditions.
6. Click OK to confirm the changes and to dismiss the dialog box.

Tutorial
129
7. Click the Start button in the toolbar to begin data collection, or select Profile > Start from theProfile menu. Results are displayed in the System Data tab when data collection is finished. A newsession, “Session 01,” is added to the list of EBP sessions in the session management area. Notice thatCodeAnalyst auto-generates new session names when necessary.
8. Click on the System Data tab and select the All Data view from the list of available views. Threecolumns display containing the number of samples taken for the CPU clocks (not halted), retiredinstruction, and retired micro-op (uops) events.

Tutorial
130
Examine the list of available events. The predefined IPC assessment view is offered because data isavailable for both the retired instruction and CPU clocks not halted events. The decision to offer a view isdata-driven. If the right type of event data is available to display a view, CodeAnalyst offers the view.
9. Select the "IPC assessment" view to display a module-by-module breakdown of IPC and CPImeasurements in the System Data table.

Tutorial
131
8.6. Tutorial - Analysis with Instruction-BasedSampling Profile
This section is a brief introduction to using Instruction-Based Sampling (IBS). A CodeAnalyst projectmust already be opened by following the directions under Section 8.3, “Tutorial - Creating a CodeAnalystProject”, or by opening an existing CodeAnalyst project. It also assumes that session settings have beenestablished and CodeAnalyst is ready to profile an application.
8.6.1. Collecting IBS Data
1. Open the "Session Setting" dialog from the toolbar or "Tools > Sesssion Settings". In the dialog, selectthe "Current Instruction-based profile" profile configuration and click "Edit".
2. In the "Edit EBS/IBS Profile Configuration" dialog, there might be some events in the field "Eventsin this profile configuration". Remove all existing events by selecting each event and click "RemoveEvent" button.
3. In the "IBS Fetch" tab, select all events by pressing "Ctrl+a" on the keyboard, then click the "AddEvents" button.
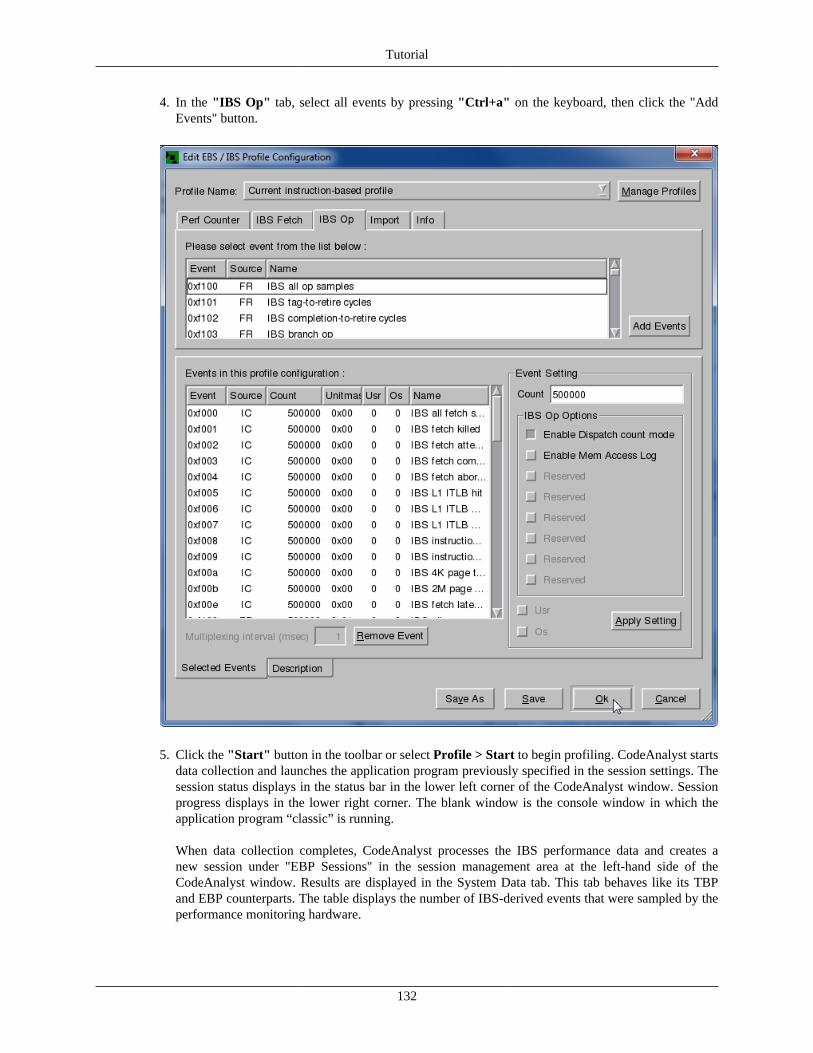
Tutorial
132
4. In the "IBS Op" tab, select all events by pressing "Ctrl+a" on the keyboard, then click the "AddEvents" button.
5. Click the "Start" button in the toolbar or select Profile > Start to begin profiling. CodeAnalyst startsdata collection and launches the application program previously specified in the session settings. Thesession status displays in the status bar in the lower left corner of the CodeAnalyst window. Sessionprogress displays in the lower right corner. The blank window is the console window in which theapplication program “classic” is running.
When data collection completes, CodeAnalyst processes the IBS performance data and creates anew session under "EBP Sessions" in the session management area at the left-hand side of theCodeAnalyst window. Results are displayed in the System Data tab. This tab behaves like its TBPand EBP counterparts. The table displays the number of IBS-derived events that were sampled by theperformance monitoring hardware.

Tutorial
133
8.6.2. Reviewing IBS Results
CodeAnalyst reports IBS performance data as "IBS-derived events". See Section 9.3, “Instruction-BasedSampling Derived Events” for descriptions of the IBS-derived events.
Although IBS derived events look similar to performance monitoring counter (PMC) events, the samplingmethod is quite different. PMC event samples measure the actual number of particular hardware eventsthat occurred during the measurement period. IBS derived events report the number of IBS fetch or opsamples for which a particular hardware event was observed. Consider the three IBS derived events:
• IBS all op samples
• IBS branch op
• IBS mispredicted branch op
The "IBS all op samples" derived event is a count of all IBS op samples that were taken. The "IBSbranch op" derived event is the number of IBS op samples where the monitored macro-op was a branch.These samples are a subset of all the IBS op samples. The "IBS mispredicted branch op" derived eventis the number of IBS op sample branches that mispredicted. These samples are also a subset of the IBSbranch op samples. Unlike PMC events that count the actual number of branches (event select 0x0C2), itwould be incorrect to say that the "IBS branch op" derived event reports the number of branches. Thesampling basis is different.
The "All Data" view shows the number of occurrences of all IBS derived events. Instruction-BasedSampling collects a wide range of performance data in a single run. For instance, when all dervied eventsfrom both IBS fetch and op data are collected, the "All Data" view displays information for over 60 IBSderived events. However, this is not recommended since it could potentially introduce overhead whenprocessing the profile data. CodeAnalyst provides several predefined views that display IBS derived eventsin logically-related groups. The available views are:
• IBS All ops: Breakdown of all IBS op samples by major type
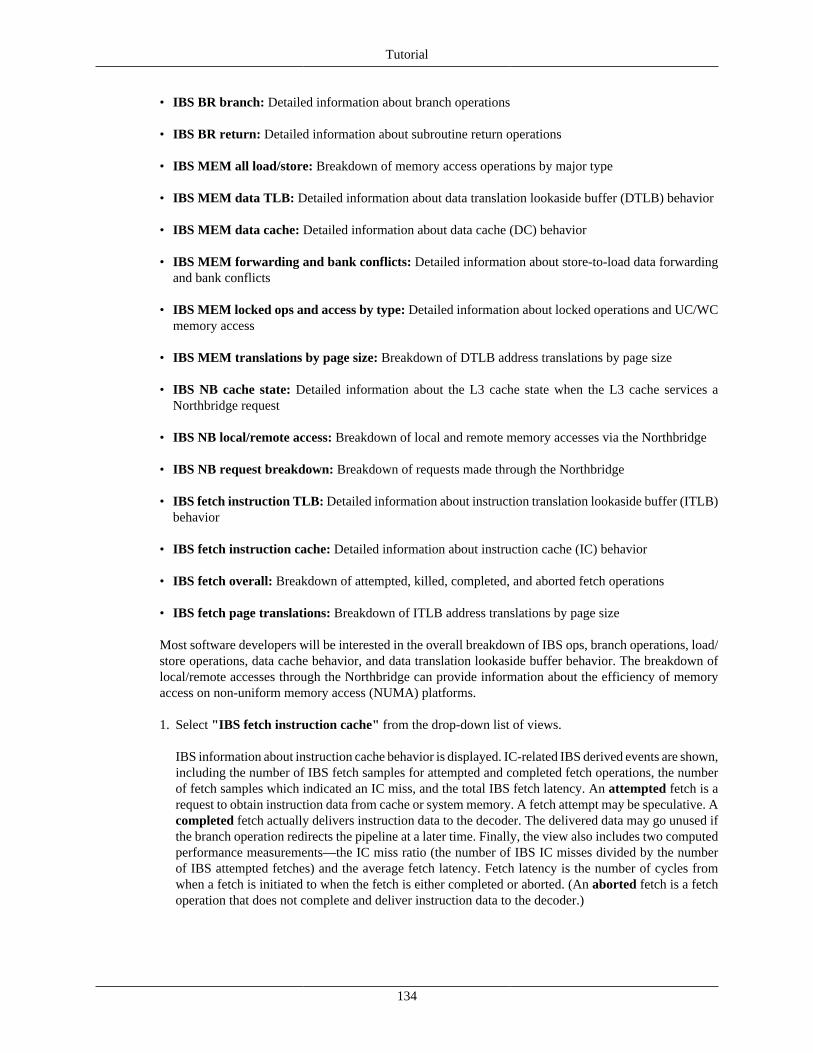
Tutorial
134
• IBS BR branch: Detailed information about branch operations
• IBS BR return: Detailed information about subroutine return operations
• IBS MEM all load/store: Breakdown of memory access operations by major type
• IBS MEM data TLB: Detailed information about data translation lookaside buffer (DTLB) behavior
• IBS MEM data cache: Detailed information about data cache (DC) behavior
• IBS MEM forwarding and bank conflicts: Detailed information about store-to-load data forwardingand bank conflicts
• IBS MEM locked ops and access by type: Detailed information about locked operations and UC/WCmemory access
• IBS MEM translations by page size: Breakdown of DTLB address translations by page size
• IBS NB cache state: Detailed information about the L3 cache state when the L3 cache services aNorthbridge request
• IBS NB local/remote access: Breakdown of local and remote memory accesses via the Northbridge
• IBS NB request breakdown: Breakdown of requests made through the Northbridge
• IBS fetch instruction TLB: Detailed information about instruction translation lookaside buffer (ITLB)behavior
• IBS fetch instruction cache: Detailed information about instruction cache (IC) behavior
• IBS fetch overall: Breakdown of attempted, killed, completed, and aborted fetch operations
• IBS fetch page translations: Breakdown of ITLB address translations by page size
Most software developers will be interested in the overall breakdown of IBS ops, branch operations, load/store operations, data cache behavior, and data translation lookaside buffer behavior. The breakdown oflocal/remote accesses through the Northbridge can provide information about the efficiency of memoryaccess on non-uniform memory access (NUMA) platforms.
1. Select "IBS fetch instruction cache" from the drop-down list of views.
IBS information about instruction cache behavior is displayed. IC-related IBS derived events are shown,including the number of IBS fetch samples for attempted and completed fetch operations, the numberof fetch samples which indicated an IC miss, and the total IBS fetch latency. An attempted fetch is arequest to obtain instruction data from cache or system memory. A fetch attempt may be speculative. Acompleted fetch actually delivers instruction data to the decoder. The delivered data may go unused ifthe branch operation redirects the pipeline at a later time. Finally, the view also includes two computedperformance measurements—the IC miss ratio (the number of IBS IC misses divided by the numberof IBS attempted fetches) and the average fetch latency. Fetch latency is the number of cycles fromwhen a fetch is initiated to when the fetch is either completed or aborted. (An aborted fetch is a fetchoperation that does not complete and deliver instruction data to the decoder.)

Tutorial
135
2. Select IBS All ops from the drop-down list of views.
The "IBS All ops" view displays. This view is an overall summary of the collected IBS op samples. Itshows the total number of IBS op samples, the number of op samples taken for branch operations, andthe number of samples for ops that performed a memory load and/or store operation. Tag-to-retire timeis the number of cycles from when an op was selected (tagged) for sampling to when the op retired.Completion-to-retire time is the number of cycles from when an op completed (finished execution) towhen the op retired. Total and average tag-to-retire and completion-to-retire times are shown in thenext view.
3. Select the "IBS MEM data cache" view from the drop-down list of views.

Tutorial
136
The "IBS MEM data cache" view is displayed. This view shows information related to data cache(DC) behavior. The number of sampled IBS load/store operations is shown along with a breakdownof the number of loads and the number of stores. The number of IBS samples where the load/storeoperation missed in the data cache is shown. The DC miss rate (DC misses divided by the total numberof op samples) and DC miss ratio (DC misses divided by the number of load/store operations) are alsodisplayed.
4. Select the "IBS MEM data TLB" view from the drop-down list of views.
The "IBS MEM data TLB" view is displayed. This view shows information related to data translationlookaside buffer (DTLB) behavior. The number of sampled IBS load/store operations is shown alongwith a breakdown of the number of load operations and the number of store operations. AMD processorsuse a two-level DTLB. Address translation may hit in the L1 DTLB, miss in the L1 DTLB and hit in theL2 DTLB ("L1M L2H"), or miss in both levels of the DTLB ("L1M L2M".) The performance penaltyfor a miss in both levels is relatively high. Nearly half of the sampled load/store operations incurred amiss at both levels of the DTLB. This is the performance culprit in the sample program, classic, whichperforms a "textbook" implementation of matrix multiplication.

Tutorial
137
8.6.3. Drilling Down Into IBS Data
In order to find the source of the performance issue in the example program, we need to drill down intothe classic module.
1. Double-click on the module name classic in the System Data table.
A list of functions within classic is displayed with the IBS information for each function. CodeAnalystretains the "IBS MEM data TLB" view. The function "multiply_matrices" has the most load/storeactivity and incurs the bulk of the DTLB misses.

Tutorial
138
2. Double-click on the function multiply_matrices in the Module Data table, i.e., the table of functionswithin classic.
The source code for the function "multiply_matrices" is displayed with the IBS information for eachsource line in the function. Most load/store activity occurs at line 66, which is the statement withinthe nested loops. This is the statement that reads an element from each of the two operand matricesand computes the running sum of the product of the elements. The DTLB misses are caused by thelarge strides taken through matrix_b. With nearly every iteration the program touches a different page,thereby causing a miss in the DTLB.
3. Click the expand box "+" to the left of line 66
The disassembled instructions for source line 66 are displayed along with the IBS data for eachinstruction. IBS load/store information is attributed to each instruction that performs either a memoryread or write operation. Sources of performance-robbing DTLB misses are precisely identified.
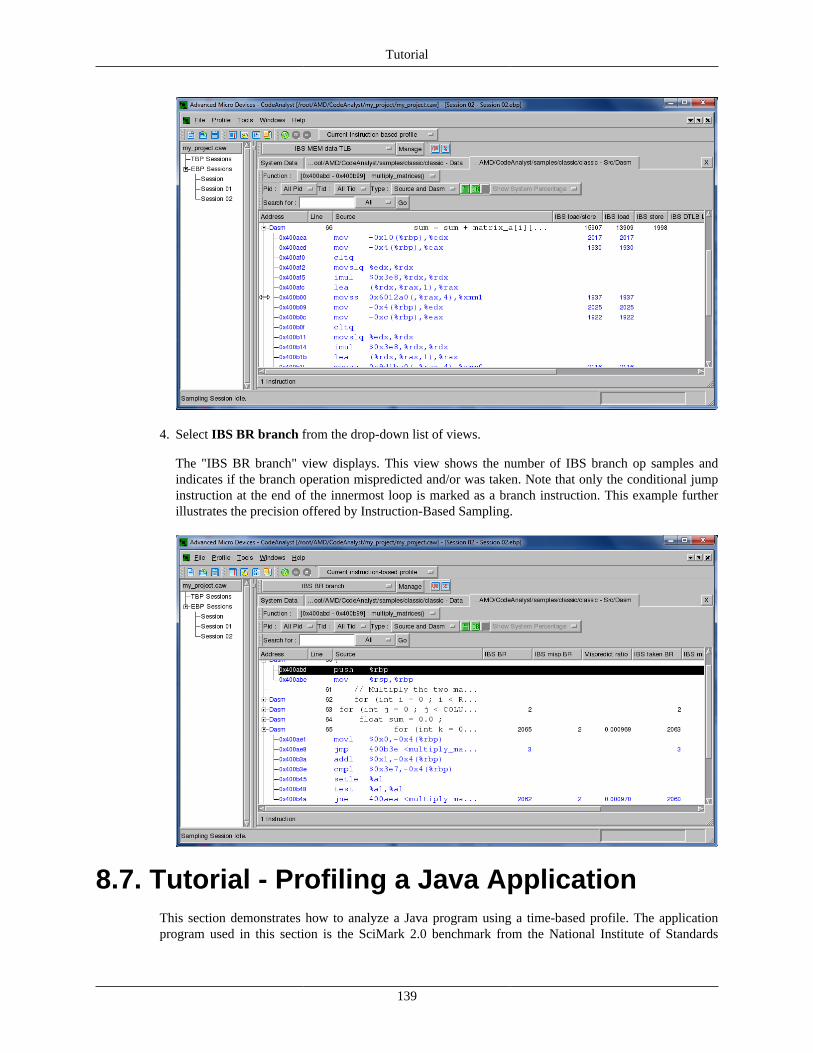
Tutorial
139
4. Select IBS BR branch from the drop-down list of views.
The "IBS BR branch" view displays. This view shows the number of IBS branch op samples andindicates if the branch operation mispredicted and/or was taken. Note that only the conditional jumpinstruction at the end of the innermost loop is marked as a branch instruction. This example furtherillustrates the precision offered by Instruction-Based Sampling.
8.7. Tutorial - Profiling a Java ApplicationThis section demonstrates how to analyze a Java program using a time-based profile. The applicationprogram used in this section is the SciMark 2.0 benchmark from the National Institute of Standards
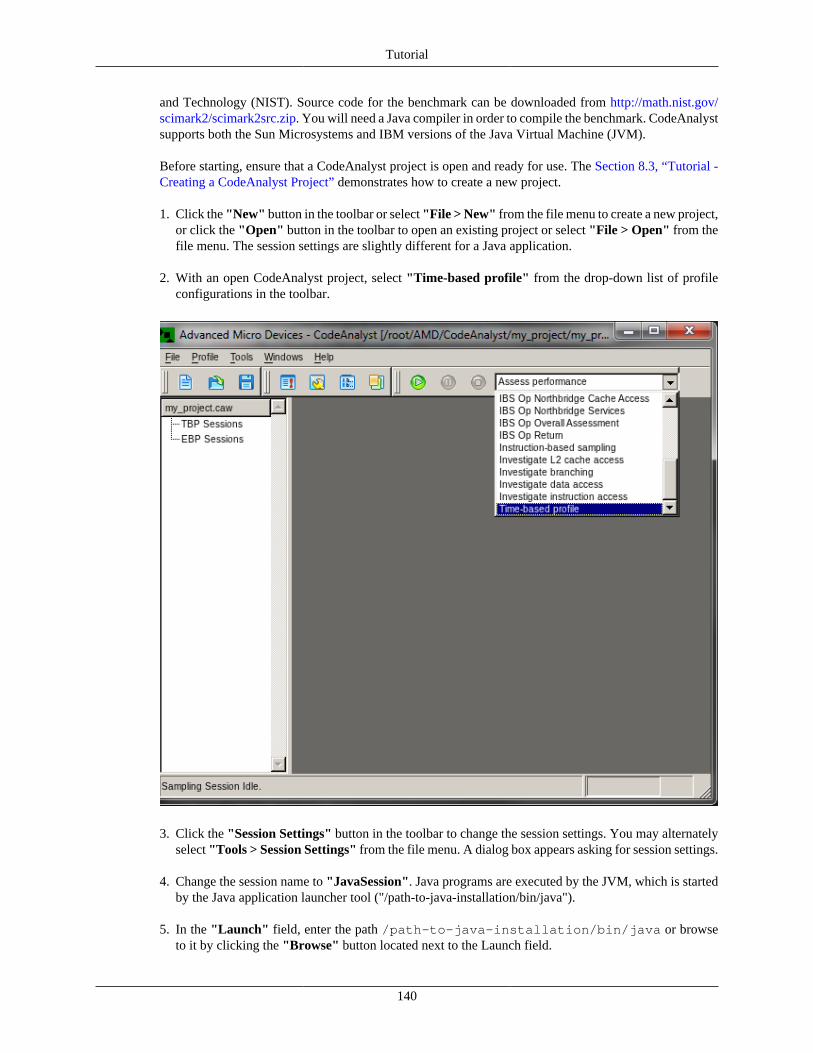
Tutorial
140
and Technology (NIST). Source code for the benchmark can be downloaded from http://math.nist.gov/scimark2/scimark2src.zip. You will need a Java compiler in order to compile the benchmark. CodeAnalystsupports both the Sun Microsystems and IBM versions of the Java Virtual Machine (JVM).
Before starting, ensure that a CodeAnalyst project is open and ready for use. The Section 8.3, “Tutorial -Creating a CodeAnalyst Project” demonstrates how to create a new project.
1. Click the "New" button in the toolbar or select "File > New" from the file menu to create a new project,or click the "Open" button in the toolbar to open an existing project or select "File > Open" from thefile menu. The session settings are slightly different for a Java application.
2. With an open CodeAnalyst project, select "Time-based profile" from the drop-down list of profileconfigurations in the toolbar.
3. Click the "Session Settings" button in the toolbar to change the session settings. You may alternatelyselect "Tools > Session Settings" from the file menu. A dialog box appears asking for session settings.
4. Change the session name to "JavaSession". Java programs are executed by the JVM, which is startedby the Java application launcher tool ("/path-to-java-installation/bin/java").
5. In the "Launch" field, enter the path /path-to-java-installation/bin/java or browseto it by clicking the "Browse" button located next to the Launch field.

Tutorial
141
6. After the path to java, enter jnt.scimark2.commandline (the name of the Java applicationprogram to be launched).
Note: CodeAnalyst automatically checks for the Java application launcher tool and inserts the profilingagent library with option -agentpath into the Launch field. You do not need to enter this option yourself.The agent connects the JVM to CodeAnalyst.
7. Enter the path to the working directory, or browse to the working directory by clicking the "Browse")button next to the working directory field.
8. Ensure the checkbox is selected to enable "Terminate the app after the profile", "Stop datacollection when the app exits", and "Profile the duration of the app execution" options.CodeAnalyst collects data for the entire duration of the benchmark run. Click "OK" to confirm thesession settings and to dismiss the dialog box.
9. Click the "Start" button in the toolbar, or select "Profile > Start" from the menu.
CodeAnalyst starts data collection and launches the Java application program through the Javaapplication launcher tool. When the benchmark program terminates and data collection is finished,CodeAnalyst displays results in three tabbed panels System Data, and Processes. The System Data tableshows a module-by-module breakdown of timer samples. Each timer sample represents approximately1 millisecond of execution time (when using the default timer interval of 1 millisecond).
8.7.1. Reviewing ResultsThe target java application (jnt.scimark2.commandline(3643)) is shown along with the tgid in the"Module->Process" column.

Tutorial
142
When aggregated by process, the view displays distribution of timer samples across the software processesthat were active during data collection. Each process can be expanded to show samples aggregation withrespect to each process ID and its dependent module.

Tutorial
143
1. Double-click on the module jnt.scimark2.commandline to drill down into the performance data forthe benchmark program. CodeAnalyst displays a new tabbed panel containing a function-by-functionbreakdown of timer samples. Use this table to identify functions that consume the most execution time.The hottest functions are the best candidates for optimization.
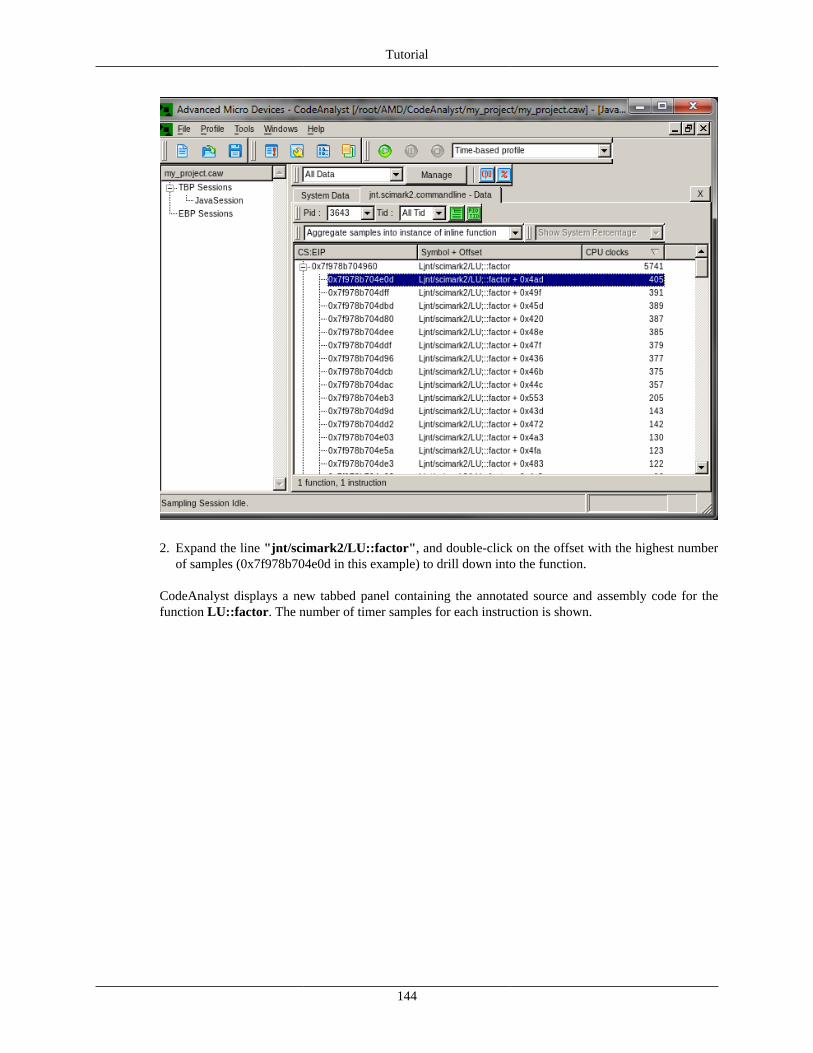
Tutorial
144
2. Expand the line "jnt/scimark2/LU::factor", and double-click on the offset with the highest numberof samples (0x7f978b704e0d in this example) to drill down into the function.
CodeAnalyst displays a new tabbed panel containing the annotated source and assembly code for thefunction LU::factor. The number of timer samples for each instruction is shown.
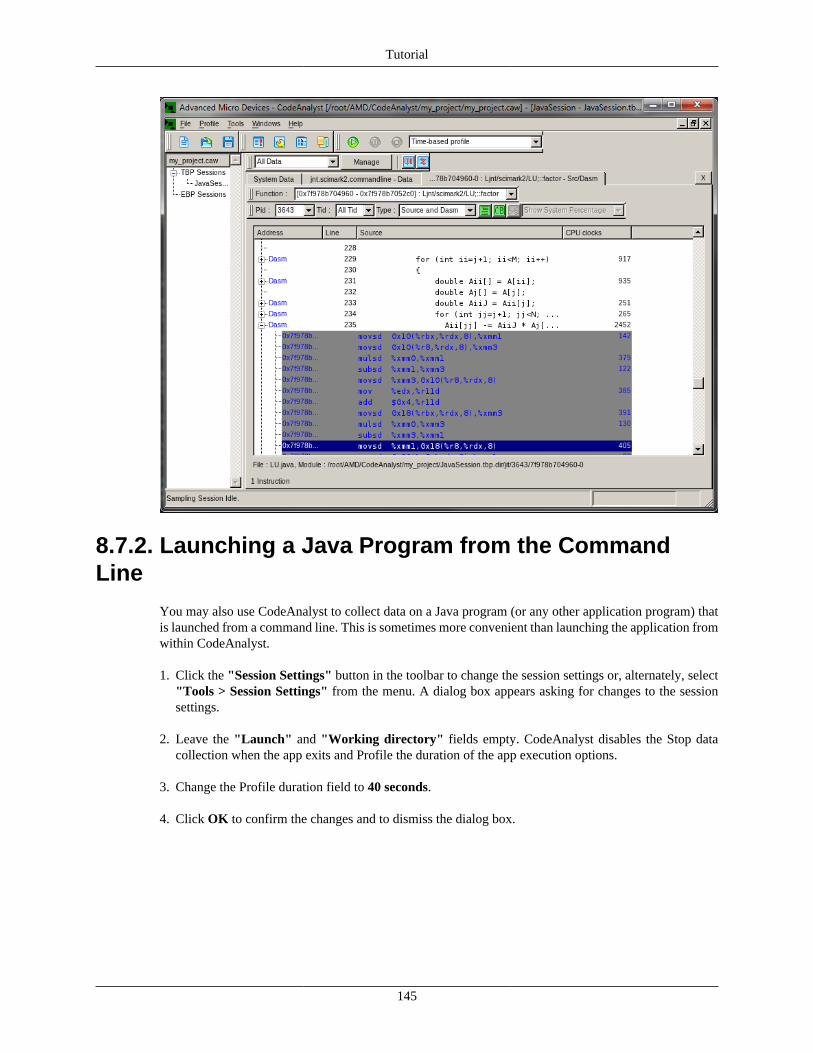
Tutorial
145
8.7.2. Launching a Java Program from the CommandLine
You may also use CodeAnalyst to collect data on a Java program (or any other application program) thatis launched from a command line. This is sometimes more convenient than launching the application fromwithin CodeAnalyst.
1. Click the "Session Settings" button in the toolbar to change the session settings or, alternately, select"Tools > Session Settings" from the menu. A dialog box appears asking for changes to the sessionsettings.
2. Leave the "Launch" and "Working directory" fields empty. CodeAnalyst disables the Stop datacollection when the app exits and Profile the duration of the app execution options.
3. Change the Profile duration field to 40 seconds.
4. Click OK to confirm the changes and to dismiss the dialog box.

Tutorial
146
5. Click the Start button in the toolbar or select "Profile > Start" from the menu. CodeAnalyst startsto collect data and will do so for the next 40 seconds as specified by the Profile duration field in thesession settings dialog box.
6. At the shell command line, enter the following command to start the benchmark program:
java -agentpath:/opt/CodeAnalyst//bin/libCAJVMTIA64.so jnt.scimark2.commandline
You must use the CodeAnalyst profiling agent that is appropriate for the JVM. After 40 seconds hasexpired, CodeAnalyst stops data collection and displays results in its workspace.
Some versions of the JVM have deprecated the use of the -XrunCAJVMPIA option. Java -X optionsare non-standard and are subject to change without notice.

147
Chapter 9. Performance MonitoringEvents9.1. Performance Monitoring Events (PME)
AMD processors provide many performance monitoring events to help analyze the performance ofprograms. The performance monitoring events available for use depend upon the underlying AMDprocessor which executes the program or system under analysis. Each processor family (and possiblyrevision within a family) offers a specific range of performance monitoring events. Use the links below tobrowse the performance monitoring events for each specific processor family.
• BIOS and Kernel Developer's Guide (BKDG) For AMD Family 11h Processor[http://support.amd.com/us/Processor_TechDocs/41256.pdf]
• BIOS and Kernel Developer's Guide (BKDG) For AMD Family 10h Processor[http://support.amd.com/us/Processor_TechDocs/31116.pdf]
• BIOS and Kernel Developer's Guide for AMD Athlon™ and AMD Opteron™ Processors (Rev. A-E)http://support.amd.com/us/Processor_TechDocs/26094.PDF
• BIOS and Kernel Developer's Guide for AMD NPT Family 0Fh Processors (Rev. F-G)http://support.amd.com/us/Processor_TechDocs/32559.pdf
• Section 9.3, “Instruction-Based Sampling Derived Events”
9.2. Unit masks for PMEsThe following three tables show how to construct a unit mask and express combinations of unit masksfor a given event.
Unit Mask [bits 15:8] Mask as Shown in Event Table(bit position in mask)
Unit Mask Hex Value inEvent:Unit Mask
xxxx_xxx1 0 0x0001
xxxx_xx1x 1 0x0002
xxxx_x1xx 2 0x0004
xxxx_1xxx 3 0x0008
xxx1_xxxx 4 0x0010
xx1x_xxxx 5 0x0020
x1xx_xxxx 6 0x0040
Reserved
Unit Mask [bits 15:8] Combined Masks (combined bitpositions)
Unit Mask Hex Value in Event:Unit Mask
xxxx_xx11 0 and 1 0x0003
xxxx_x1x1 0 and 2 0x0005
xxxx_x11x 1 and 2 0x0006

Performance Monitoring Events
148
Unit Mask [bits 15:8] Combined Masks (combined bitpositions)
Unit Mask Hex Value in Event:Unit Mask
xxxx_x111 0 and 1 and 2 0x0007
xxx1_xx1x 1 and 4 0x0012
xxx1_x1x1 0 and 2 and 4 0x0015
xxx1_1111 0 and 1 and 2 and 3 and 4 0x001F
Event Unit Mask Description Event: Unit Mask
0x41 Data cache refill from L2
0 Invalid cache state 0x4101
1 Shared cache state 0x4102
2 Exclusive cache state 0x4104
3 Owner cache state 0x4108
4 Modified cache state 0x4110
All of the above All MOESI states 0x411F
0 and 1 and 3 Invalid and Shared andOwner states
0x410B
9.3. Instruction-Based Sampling DerivedEvents
This section describes the derived events for Instruction-Based Sampling (IBS.) IBS is available on AMDFamily 10h processors.
9.3.1. IBS Fetch Derived Events
9.3.1.1. Event 0xF000
Abbreviation: IBS fetch
The number of all IBS fetch samples. This derived event counts the number of all IBS fetch samples thatwere collected including IBS-killed fetch samples.
9.3.1.2. Event 0xF001
Abbreviation: IBS fetch killed
The number of IBS sampled fetches that were killed fetches. A fetch operation is killed if the fetch didnot reach ITLB or IC access. The number of killed fetch samples is not generally useful for analysis andare filtered out in other derived IBS fetch events (except Event Select 0xF000 which counts all IBS fetchsamples including IBS killed fetch samples.)
9.3.1.3. Event 0xF002
Abbreviation: IBS fetch attempt
Performance Monitoring Events
149
The number of IBS sampled fetches that were not killed fetch attempts. This derived event measures thenumber of useful fetch attempts and does not include the number of IBS killed fetch samples. This eventshould be used to compute ratios such as the ratio of IBS fetch IC misses to attempted fetches.
The number of attempted fetches should equal the sum of the number of completed fetches and the numberof aborted fetches.
9.3.1.4. Event 0xF003
Abbreviation: IBS fetch comp
The number of IBS sampled fetches that completed. A fetch is completed if the attempted fetch deliversinstruction data to the instruction decoder. Although the instruction data was delivered, it may still not beused (e.g., the instruction data may have been on the "wrong path" of an incorrectly predicted branch.)
9.3.1.5. Event 0xF004
Abbreviation: IBS fetch abort
The number of IBS sampled fetches that aborted. An attempted fetch is aborted if it did not complete anddeliver instruction data to the decoder. An attempted fetch may abort at any point in the process of fetchinginstruction data. An abort may be due to a branch redirection as the result of a mispredicted branch.
The number of IBS aborted fetch samples is a lower bound on the amount of unsuccessful, speculativefetch activity. It is a lower bound since the instruction data delivered by completed fetches may not be used.
9.3.1.6. Event 0xF005
Abbreviation: IBS L1 ITLB hit
The number of IBS attempted fetch samples where the fetch operation initially hit in the L1 ITLB(Instruction Translation Lookaside Buffer).
9.3.1.7. Event 0xF006
Abbreviation: IBS ITLB L1M L2H
The number of IBS attempted fetch samples where the fetch operation initially missed in the L1 ITLBand hit in the L2 ITLB.
9.3.1.8. Event 0xF007
Abbreviation: IBS ITLB L1M L2M
The number of IBS attempted fetch samples where the fetch operation initially missed in both the L1 ITLBand the L2 ITLB.
9.3.1.9. Event 0xF008
Abbreviation: IBS IC miss
The number of IBS attempted fetch samples where the fetch operation initially missed in the IC (instructioncache).
Performance Monitoring Events
150
9.3.1.10. Event 0xF009
Abbreviation: IBS IC hit
The number of IBS attempted fetch samples where the fetch operation initially hit in the IC.
9.3.1.11. Event 0xF00A
Abbreviation: IBS 4K page
The number of IBS attempted fetch samples where the fetch operation produced a valid physical address(i.e., address translation completed successfully) and used a 4-KByte page entry in the L1 ITLB.
9.3.1.12. Event 0xF00B
Abbreviation: IBS 2M page
The number of IBS attempted fetch samples where the fetch operation produced a valid physical address(i.e., address translation completed successfully) and used a 2-MByte page entry in the L1 ITLB.
9.3.1.13. Event 0xF00E
Abbreviation: IBS fetch lat
The total latency of all IBS attempted fetch samples. Divide the total IBS fetch latency by the number ofIBS attempted fetch samples to obtain the average latency of the attempted fetches that were sampled.
9.3.2. IBS Op Derived Events
9.3.2.1. Event 0xF100
Abbreviation: IBS all ops
The number of all IBS op samples that were collected. These op samples may be branch ops, resync ops,ops that perform load/store operations, or undifferentiated ops (e.g., those ops that perform arithmeticoperations, logical operations, etc.).
IBS collects data for retired ops. No data is collected for ops that are aborted due to pipeline flushes, etc.Thus, all sampled ops are architecturally significant and contribute to the successful forward progress ofexecuting programs.
9.3.2.2. Event 0xF101
Abbreviation: IBS tag-to-ret
The total number of tag-to-retire cycles across all IBS op samples. The tag-to-retire time of an op is thenumber of cycles from when the op was tagged (selected for sampling) to when the op retired.
9.3.2.3. Event 0xF102
Abbreviation: IBS comp-to-ret
The total number of completion-to-retire cycles across all IBS op samples. The completion-to-retire timeof an op is the number of cycles from when the op completed to when the op retired.
Performance Monitoring Events
151
9.3.3. IBS Op Branches Derived Events
9.3.3.1. Event 0xF103
Abbreviation: IBS BR
The number of IBS retired branch op samples. A branch operation is a change in program control flowand includes unconditional and conditional branches, subroutine calls and subroutine returns. Branch opsare used to implement AMD64 branch semantics.
9.3.3.2. Event 0xF104
Abbreviation: IBS misp BR
The number of IBS samples for retired branch operations that were mispredicted. This event should beused to compute the ratio of mispredicted branch operations to all branch operations.
9.3.3.3. Event 0xF105
Abbreviation: IBS taken BR
The number of IBS samples for retired branch operations that were taken branches.
9.3.3.4. Event 0xF106
Abbreviation: IBS misp taken BR
The number of IBS samples for retired branch operations that were mispredicted taken branches.
9.3.3.5. Event 0xF107
Abbreviation: IBS RET
The number of IBS retired branch op samples where the operation was a subroutine return. These samplesare a subset of all IBS retired branch op samples.
9.3.3.6. Event 0xF108
Abbreviation: IBS misp RET
The number of IBS retired branch op samples where the operation was a mispredicted subroutine return.This event should be used to compute the ratio of mispredicted returns to all subroutine returns.
9.3.3.7. Event 0xF109
Abbreviation: IBS resync
The number of IBS resync op samples. A resync op is only found in certain microcoded AMD64instructions and causes a complete pipeline flush.
9.3.4. IBS Op Load-Store Derived Events
9.3.4.1. Event 0xF200
Abbreviation: IBS load/store

Performance Monitoring Events
152
The number of IBS op samples for ops that perform either a load and/or store operation.
An AMD64 instruction may be translated into one ("single fastpath"), two ("double fastpath"), or several("vector path") ops. Each op may perform a load operation, a store operation or both a load and storeoperation (each to the same address). Some op samples attributed to an AMD64 instruction may performa load/store operation while other op samples attributed to the same instruction may not. Further, somebranch instructions perform load/store operations. Thus, a mix of op sample types may be attributed to asingle AMD64 instruction depending upon the ops that are issued from the AMD64 instruction and theop types.
9.3.4.2. Event 0xF201
Abbreviation: IBS load
The number of IBS op samples for ops that perform a load operation.
9.3.4.3. Event 0xF202
Abbreviation: IBS store
The number of IBS op samples for ops that perform a store operation.
9.3.4.4. Event 0xF203
Abbreviation: IBS L1 DTLB hit
The number of IBS op samples where either a load or store operation initially hit in the L1 DTLB (datatranslation lookaside buffer).
9.3.4.5. Event 0xF204
Abbreviation: IBS DTLB L1M L2H
The number of IBS op samples where either a load or store operation initially missed in the L1 DTLBand hit in the L2 DTLB.
9.3.4.6. Event 0xF205
Abbreviation: IBS DTLB L1M L2M
The number of IBS op samples where either a load or store operation initially missed in both the L1 DTLBand the L2 DTLB.
9.3.4.7. Event 0xF206
Abbreviation: IBS DC miss
The number of IBS op samples where either a load or store operation initially missed in the data cache(DC).
9.3.4.8. Event 0xF207
Abbreviation: IBS DC hit
The number of IBS op samples where either a load or store operation initially hit in the data cache (DC).

Performance Monitoring Events
153
9.3.4.9. Event 0xF208
Abbreviation: IBS misalign acc
The number of IBS op samples where either a load or store operation caused a misaligned access (i.e., theload or store operation crossed a 128-bit boundary).
9.3.4.10. Event 0xF209
Abbreviation: IBS bank conf load
The number of IBS op samples where either a load or store operation caused a bank conflict with a loadoperation.
9.3.4.11. Event 0xF20A
Abbreviation: IBS bank conf store
The number of IBS op samples where either a load or store operation caused a bank conflict with a storeoperation.
9.3.4.12. Event 0xF20B
Abbreviation: IBS forwarded
The number of IBS op samples where data for a load operation was forwarded from a store operation.
9.3.4.13. Event 0xF20C
Abbreviation: IBS cancelled
The number of IBS op samples where data forwarding to a load operation from a store was cancelled.
9.3.4.14. Event 0xF20D
Abbreviation: IBS UC mem acc
The number of IBS op samples where a load or store operation accessed uncacheable (UC) memory.
9.3.4.15. Event 0xF20E
Abbreviation: IBS WC mem acc
The number of IBS op samples where a load or store operation accessed write combining (WC) memory.
9.3.4.16. Event 0xF20F
Abbreviation: IBS locked op
The number of IBS op samples where a load or store operation was a locked operation.
9.3.4.17. Event 0xF210
Abbreviation: IBS MAB hit

Performance Monitoring Events
154
The number of IBS op samples where a load or store operation hit an already allocated entry in the MissAddress Buffer (MAB).
9.3.4.18. Event 0xF211
Abbreviation: IBS L1 DTLB 4K
The number of IBS op samples where a load or store operation produced a valid linear (virtual) addressand a 4-KByte page entry in the L1 DTLB was used for address translation.
9.3.4.19. Event 0xF212
Abbreviation: IBS L1 DTLB 2M
The number of IBS op samples where a load or store operation produced a valid linear (virtual) addressand a 2-MByte page entry in the L1 DTLB was used for address translation.
9.3.4.20. Event 0xF213
Abbreviation: IBS L1 DTLB 1G
The number of IBS op samples where a load or store operation produced a valid linear (virtual) addressand a 1-GByte page entry in the L1 DTLB was used for address translation.
9.3.4.21. Event 0xF215
Abbreviation: IBS L2 DTLB 4K
The number of IBS op samples where a load or store operation produced a valid linear (virtual) address,hit the L2 DTLB, and used a 4 KByte page entry for address translation.
9.3.4.22. Event 0xF216
Abbreviation: IBS L2 DTLB 2M
The number of IBS op samples where a load or store operation produced a valid linear (virtual) address,hit the L2 DTLB, and used a 2-MByte page entry for address translation.
9.3.4.23. Event 0xF219
Abbreviation: IBS DC load lat
The total DC miss latency (in processor cycles) across all IBS op samples that performed a load operation.The miss latency is the number of clock cycles from when the data cache miss was detected to when datawas delivered to the core. Divide the total DC miss latency by the number of sampled load operations toobtain the average DC miss latency.
9.3.5. IBS Op Northbridge Derived Events
9.3.5.1. Event 0xF240
Abbreviation: IBS NB local
The number of IBS op samples where a load operation was serviced from the local processor.

Performance Monitoring Events
155
Northbridge IBS data is only valid for load operations that miss in both the L1 data cache and the L2data cache. If a load operation crosses a cache line boundary, then the IBS data reflects the access to thelower cache line.
9.3.5.2. Event 0xF241
Abbreviation: IBS NB remote
The number of IBS op samples where a load operation was serviced from a remote processor.
9.3.5.3. Event 0xF242
Abbreviation: IBS NB local L3
The number of IBS op samples where a load operation was serviced by the local L3 cache.
9.3.5.4. Event 0xF243
Abbreviation: IBS NB local cache
The number of IBS op samples where a load operation was serviced by a cache (L1 data cache or L2 cache)belonging to a local core which is a sibling of the core making the memory request.
9.3.5.5. Event 0xF244
Abbreviation: IBS NB remote cache
The number of IBS op samples where a load operation was serviced by a remote L1 data cache, L2 cacheor L3 cache after traversing one or more coherent HyperTransport™ links.
9.3.5.6. Event 0xF245
Abbreviation: IBS NB local DRAM
The number of IBS op samples where a load operation was serviced by local system memory (local DRAMvia the memory controller).
9.3.5.7. Event 0xF246
Abbreviation: IBS NB remote DRAM
The number of IBS op samples where a load operation was serviced by remote system memory (aftertraversing one or more coherent HyperTransport links and through a remote memory controller).
9.3.5.8. Event 0xF247
Abbreviation: IBS NB local other
The number of IBS op samples where a load operation was serviced from local MMIO, configuration orPCI space, or from the local APIC.
9.3.5.9. Event 0xF248
Abbreviation: IBS NB remote other

Performance Monitoring Events
156
The number of IBS op samples where a load operation was serviced from remote MMIO, configurationor PCI space.
9.3.5.10. Event 0xF249
Abbreviation: IBS NB cache M
The number of IBS op samples where a load operation was serviced from local or remote cache, and thecache hit state was the Modified (M) state.
9.3.5.11. Event 0xF24A
Abbreviation: IBS NB cache O
The number of IBS op samples where a load operation was serviced from local or remote cache, and thecache hit state was the Owned (O) state.
9.3.5.12. Event 0xF24B
Abbreviation: IBS NB local lat
The total data cache miss latency (in processor cycles) for load operations that were serviced by the localprocessor.
9.3.5.13. Event 0xF24C
Abbreviation: IBS NB remote lat
The total data cache miss latency (in processor cycles) for load operations that were serviced by a remoteprocessor.
157
Chapter 10. Support10.1. Enhancement Requests
Please email the following information about a desired enhancement or change [email protected] [mailto:[email protected]]:
• State which version of AMD CodeAnalyst you are using. Choose Help > About to view the AboutAMD CodeAnalyst dialog box.
• Describe the desired enhancement or change.
• Indicate to us how important this is to you using a scale of 1 to 5 where 1 is most important and 5least important.
10.2. Problem ReportIf a problem is found, take the following action:
1. Run careport.sh script which is located in CodeAnalyst root directory of the source tree, or /opt/CodeAnalyst/bin/careport.sh. This script will generate a report file called CAReport.txt.
2. Please provide the following information:
• Give a description of the problem or issue.
• Briefly describe the steps or sequence of events leading to the observation.
• State how frequently problem occurred.
• Describe the messages AMD CodeAnalyst displayed.
• State which version of the AMD CodeAnalyst was used (under Help > System Info or opcontrol--version).
• Describe the application analyzed.
3. Please send the report file (CAReport.txt) in step 1 and information in step 2 [email protected] [mailto:[email protected]].

158
Appendix A. GNU General PublicLicense
Version 2, June 1991Copyright © 1989, 1991 Free Software Foundation, Inc.
Free Software Foundation, Inc. 51 Franklin Street, Fifth Floor, Boston, MA 02110-1301 USA
Everyone is permitted to copy and distribute verbatim copies of this license document, but changing itis not allowed.Version 2, June 1991
A.1. PreambleThe licenses for most software are designed to take away your freedom to share and change it. By contrast,the GNU General Public License is intended to guarantee your freedom to share and change free software- to make sure the software is free for all its users. This General Public License applies to most of the FreeSoftware Foundation's software and to any other program whose authors commit to using it. (Some otherFree Software Foundation software is covered by the GNU Library General Public License instead.) Youcan apply it to your programs, too.
When we speak of free software, we are referring to freedom, not price. Our General Public Licenses aredesigned to make sure that you have the freedom to distribute copies of free software (and charge for thisservice if you wish), that you receive source code or can get it if you want it, that you can change thesoftware or use pieces of it in new free programs; and that you know you can do these things.
To protect your rights, we need to make restrictions that forbid anyone to deny you these rights or to askyou to surrender the rights. These restrictions translate to certain responsibilities for you if you distributecopies of the software, or if you modify it.
For example, if you distribute copies of such a program, whether gratis or for a fee, you must give therecipients all the rights that you have. You must make sure that they, too, receive or can get the sourcecode. And you must show them these terms so they know their rights.
We protect your rights with two steps:
1. copyright the software, and
2. offer you this license which gives you legal permission to copy, distribute and/or modify the software.
Also, for each author's protection and ours, we want to make certain that everyone understands that thereis no warranty for this free software. If the software is modified by someone else and passed on, we wantits recipients to know that what they have is not the original, so that any problems introduced by otherswill not reflect on the original authors' reputations.
Finally, any free program is threatened constantly by software patents. We wish to avoid the danger thatredistributors of a free program will individually obtain patent licenses, in effect making the programproprietary. To prevent this, we have made it clear that any patent must be licensed for everyone's freeuse or not licensed at all.
GNU General Public License
159
The precise terms and conditions for copying, distribution and modification follow.
A.2. TERMS AND CONDITIONS FOR COPYING,DISTRIBUTION AND MODIFICATION
A.2.1. Section 0This License applies to any program or other work which contains a notice placed by the copyright holdersaying it may be distributed under the terms of this General Public License. The “Program”, below, refers toany such program or work, and a “work based on the Program” means either the Program or any derivativework under copyright law: that is to say, a work containing the Program or a portion of it, either verbatimor with modifications and/or translated into another language. (Hereinafter, translation is included withoutlimitation in the term “modification”.) Each licensee is addressed as “you”.
Activities other than copying, distribution and modification are not covered by this License; they areoutside its scope. The act of running the Program is not restricted, and the output from the Program iscovered only if its contents constitute a work based on the Program (independent of having been made byrunning the Program). Whether that is true depends on what the Program does.
A.2.2. Section 1You may copy and distribute verbatim copies of the Program's source code as you receive it, in anymedium, provided that you conspicuously and appropriately publish on each copy an appropriate copyrightnotice and disclaimer of warranty; keep intact all the notices that refer to this License and to the absence ofany warranty; and give any other recipients of the Program a copy of this License along with the Program.
You may charge a fee for the physical act of transferring a copy, and you may at your option offer warrantyprotection in exchange for a fee.
A.2.3. Section 2You may modify your copy or copies of the Program or any portion of it, thus forming a work based on theProgram, and copy and distribute such modifications or work under the terms of Section A.2.2, “Section1” above, provided that you also meet all of these conditions:
a. You must cause the modified files to carry prominent notices stating that you changed the files andthe date of any change.
b. You must cause any work that you distribute or publish, that in whole or in part contains or is derivedfrom the Program or any part thereof, to be licensed as a whole at no charge to all third parties underthe terms of this License.
c. If the modified program normally reads commands interactively when run, you must cause it, whenstarted running for such interactive use in the most ordinary way, to print or display an announcementincluding an appropriate copyright notice and a notice that there is no warranty (or else, saying thatyou provide a warranty) and that users may redistribute the program under these conditions, and tellingthe user how to view a copy of this License. (Exception: If the Program itself is interactive but doesnot normally print such an announcement, your work based on the Program is not required to print anannouncement.)
These requirements apply to the modified work as a whole. If identifiable sections of that work arenot derived from the Program, and can be reasonably considered independent and separate works inthemselves, then this License, and its terms, do not apply to those sections when you distribute them as
GNU General Public License
160
separate works. But when you distribute the same sections as part of a whole which is a work based on theProgram, the distribution of the whole must be on the terms of this License, whose permissions for otherlicensees extend to the entire whole, and thus to each and every part regardless of who wrote it.
Thus, it is not the intent of this section to claim rights or contest your rights to work written entirely byyou; rather, the intent is to exercise the right to control the distribution of derivative or collective worksbased on the Program.
In addition, mere aggregation of another work not based on the Program with the Program (or with a workbased on the Program) on a volume of a storage or distribution medium does not bring the other workunder the scope of this License.
A.2.4. Section 3You may copy and distribute the Program (or a work based on it, under Section A.2.3, “Section 2” inobject code or executable form under the terms of Section A.2.2, “Section 1” and Section A.2.3, “Section2” above provided that you also do one of the following:
a. Accompany it with the complete corresponding machine-readable source code, which must bedistributed under the terms of Sections 1 and 2 above on a medium customarily used for softwareinterchange; or,
b. Accompany it with a written offer, valid for at least three years, to give any third party, for a charge nomore than your cost of physically performing source distribution, a complete machine-readable copy ofthe corresponding source code, to be distributed under the terms of Sections 1 and 2 above on a mediumcustomarily used for software interchange; or,
c. Accompany it with the information you received as to the offer to distribute corresponding source code.(This alternative is allowed only for noncommercial distribution and only if you received the programin object code or executable form with such an offer, in accord with Subsection b above.)
The source code for a work means the preferred form of the work for making modifications to it. For anexecutable work, complete source code means all the source code for all modules it contains, plus anyassociated interface definition files, plus the scripts used to control compilation and installation of theexecutable. However, as a special exception, the source code distributed need not include anything that isnormally distributed (in either source or binary form) with the major components (compiler, kernel, andso on) of the operating system on which the executable runs, unless that component itself accompaniesthe executable.
If distribution of executable or object code is made by offering access to copy from a designated place,then offering equivalent access to copy the source code from the same place counts as distribution of thesource code, even though third parties are not compelled to copy the source along with the object code.
A.2.5. Section 4You may not copy, modify, sublicense, or distribute the Program except as expressly provided under thisLicense. Any attempt otherwise to copy, modify, sublicense or distribute the Program is void, and willautomatically terminate your rights under this License. However, parties who have received copies, orrights, from you under this License will not have their licenses terminated so long as such parties remainin full compliance.
A.2.6. Section 5You are not required to accept this License, since you have not signed it. However, nothing else grants youpermission to modify or distribute the Program or its derivative works. These actions are prohibited by law
GNU General Public License
161
if you do not accept this License. Therefore, by modifying or distributing the Program (or any work basedon the Program), you indicate your acceptance of this License to do so, and all its terms and conditionsfor copying, distributing or modifying the Program or works based on it.
A.2.7. Section 6Each time you redistribute the Program (or any work based on the Program), the recipient automaticallyreceives a license from the original licensor to copy, distribute or modify the Program subject to theseterms and conditions. You may not impose any further restrictions on the recipients' exercise of the rightsgranted herein. You are not responsible for enforcing compliance by third parties to this License.
A.2.8. Section 7If, as a consequence of a court judgment or allegation of patent infringement or for any other reason (notlimited to patent issues), conditions are imposed on you (whether by court order, agreement or otherwise)that contradict the conditions of this License, they do not excuse you from the conditions of this License.If you cannot distribute so as to satisfy simultaneously your obligations under this License and any otherpertinent obligations, then as a consequence you may not distribute the Program at all. For example, if apatent license would not permit royalty-free redistribution of the Program by all those who receive copiesdirectly or indirectly through you, then the only way you could satisfy both it and this License would beto refrain entirely from distribution of the Program.
If any portion of this section is held invalid or unenforceable under any particular circumstance, the balanceof the section is intended to apply and the section as a whole is intended to apply in other circumstances.
It is not the purpose of this section to induce you to infringe any patents or other property right claims orto contest validity of any such claims; this section has the sole purpose of protecting the integrity of thefree software distribution system, which is implemented by public license practices. Many people havemade generous contributions to the wide range of software distributed through that system in relianceon consistent application of that system; it is up to the author/donor to decide if he or she is willing todistribute software through any other system and a licensee cannot impose that choice.
This section is intended to make thoroughly clear what is believed to be a consequence of the rest of thisLicense.
A.2.9. Section 8If the distribution and/or use of the Program is restricted in certain countries either by patents or bycopyrighted interfaces, the original copyright holder who places the Program under this License may addan explicit geographical distribution limitation excluding those countries, so that distribution is permittedonly in or among countries not thus excluded. In such case, this License incorporates the limitation as ifwritten in the body of this License.
A.2.10. Section 9The Free Software Foundation may publish revised and/or new versions of the General Public Licensefrom time to time. Such new versions will be similar in spirit to the present version, but may differ in detailto address new problems or concerns.
Each version is given a distinguishing version number. If the Program specifies a version number ofthis License which applies to it and “any later version”, you have the option of following the terms andconditions either of that version or of any later version published by the Free Software Foundation. If the

GNU General Public License
162
Program does not specify a version number of this License, you may choose any version ever publishedby the Free Software Foundation.
A.2.11. Section 10If you wish to incorporate parts of the Program into other free programs whose distribution conditions aredifferent, write to the author to ask for permission. For software which is copyrighted by the Free SoftwareFoundation, write to the Free Software Foundation; we sometimes make exceptions for this. Our decisionwill be guided by the two goals of preserving the free status of all derivatives of our free software and ofpromoting the sharing and reuse of software generally.
A.2.12. NO WARRANTY Section 11BECAUSE THE PROGRAM IS LICENSED FREE OF CHARGE, THERE IS NO WARRANTYFOR THE PROGRAM, TO THE EXTENT PERMITTED BY APPLICABLE LAW. EXCEPTWHEN OTHERWISE STATED IN WRITING THE COPYRIGHT HOLDERS AND/OR OTHERPARTIES PROVIDE THE PROGRAM “AS IS” WITHOUT WARRANTY OF ANY KIND, EITHEREXPRESSED OR IMPLIED, INCLUDING, BUT NOT LIMITED TO, THE IMPLIED WARRANTIESOF MERCHANTABILITY AND FITNESS FOR A PARTICULAR PURPOSE. THE ENTIRE RISKAS TO THE QUALITY AND PERFORMANCE OF THE PROGRAM IS WITH YOU. SHOULD THEPROGRAM PROVE DEFECTIVE, YOU ASSUME THE COST OF ALL NECESSARY SERVICING,REPAIR OR CORRECTION.
A.2.13. Section 12IN NO EVENT UNLESS REQUIRED BY APPLICABLE LAW OR AGREED TO IN WRITINGWILL ANY COPYRIGHT HOLDER, OR ANY OTHER PARTY WHO MAY MODIFY AND/OR REDISTRIBUTE THE PROGRAM AS PERMITTED ABOVE, BE LIABLE TO YOU FORDAMAGES, INCLUDING ANY GENERAL, SPECIAL, INCIDENTAL OR CONSEQUENTIALDAMAGES ARISING OUT OF THE USE OR INABILITY TO USE THE PROGRAM (INCLUDINGBUT NOT LIMITED TO LOSS OF DATA OR DATA BEING RENDERED INACCURATE ORLOSSES SUSTAINED BY YOU OR THIRD PARTIES OR A FAILURE OF THE PROGRAM TOOPERATE WITH ANY OTHER PROGRAMS), EVEN IF SUCH HOLDER OR OTHER PARTY HASBEEN ADVISED OF THE POSSIBILITY OF SUCH DAMAGES.
END OF TERMS AND CONDITIONS
A.3. How to Apply These Terms to Your NewPrograms
If you develop a new program, and you want it to be of the greatest possible use to the public, the best wayto achieve this is to make it free software which everyone can redistribute and change under these terms.
To do so, attach the following notices to the program. It is safest to attach them to the start of each sourcefile to most effectively convey the exclusion of warranty; and each file should have at least the “copyright”line and a pointer to where the full notice is found.
<one line to give the program's name and a brief idea of what it does.> Copyright (C) <year> <name ofauthor>
This program is free software; you can redistribute it and/or modify it under the terms of the GNU GeneralPublic License as published by the Free Software Foundation; either version 2 of the License, or (at youroption) any later version.

GNU General Public License
163
This program is distributed in the hope that it will be useful, but WITHOUT ANY WARRANTY; withouteven the implied warranty of MERCHANTABILITY or FITNESS FOR A PARTICULAR PURPOSE.See the GNU General Public License for more details.
You should have received a copy of the GNU General Public License along with this program; if not, writeto the Free Software Foundation, Inc., 51 Franklin Street, Fifth Floor, Boston, MA 02110-1301 USA
Also add information on how to contact you by electronic and paper mail.
If the program is interactive, make it output a short notice like this when it starts in an interactive mode:
Gnomovision version 69, Copyright (C) year name of author Gnomovision comes with ABSOLUTELYNO WARRANTY; for details type “show w”. This is free software, and you are welcome to redistributeit under certain conditions; type “show c” for details.
The hypothetical commands “show w” and “show c” should show the appropriate parts of the GeneralPublic License. Of course, the commands you use may be called something other than “show w” and“show c”; they could even be mouse-clicks or menu items--whatever suits your program.
You should also get your employer (if you work as a programmer) or your school, if any, to sign a“copyright disclaimer” for the program, if necessary. Here is a sample; alter the names:
Yoyodyne, Inc., hereby disclaims all copyright interest in the program “Gnomovision” (which makespasses at compilers) written by James Hacker.
<signature of Ty Coon>, 1 April 1989 Ty Coon, President of Vice
This General Public License does not permit incorporating your program into proprietary programs. If yourprogram is a subroutine library, you may consider it more useful to permit linking proprietary applicationswith the library. If this is what you want to do, use the GNU Library General Public License instead ofthis License.

164
Appendix B. Features ListB.1. New Features in CodeAnalyst 3.0
• New "System Data View" tab
• New "Source/Dasm View" tab
• Annotate inlined instances when viewing source
• Aggregation and filtering by PIDs and TIDs
B.2. New Features in CodeAnalyst 2.9• Redesign "Session Setting" dialog
• Redesign "Event Selection" dialog
• Improve JAVA profile to handle JIT modules unloading
• Improve security and permission management for non-root users
• OProfile daemon/driver monitoring tool
• New CA-OProfile based on OProfile-0.9.6
B.3. New Features in CodeAnalyst 2.8• Support for AMD processor Family 10h Revision 4
• New mode for IBS OP
• Section 3.5, “Basic Block Analysis”
• Section 3.6, “In-Line Analysis”
• True event multiplexing
• Session Import by TBP/EBP file
B.4. New Features in CodeAnalyst 2.7CodeAnalyst 2.7 added support for Instruction-Based Sampling (IBS.) Instruction Sampling is anew performance measurement technique supported by AMD Family 10h processors. IBS has theseadvantages:
• IBS precisely associates hardware event information with the instructions that cause the events. A datacache miss, for example, is associated with the AMD64 instruction performing the memory read or writeoperation that caused the miss. Improved precision makes it easier to pinpoint specific performanceissues.
• IBS collects a wide range of hardware event information in a single measurement run.
Features List
165
• IBS collects new information such as retire delay and data cache miss latency.
See Section 3.4, “Instruction-Based Sampling Analysis” for more information about IBS. The sectionsSection 8.6, “Tutorial - Analysis with Instruction-Based Sampling Profile” and Section 5.4, “Collectingan Instruction-Based Sampling Profile” give step-by-step directions for collecting IBS profile data.
CodeAnalyst reports IBS performance information as derived events. Derived events are similar to theevents reported by Section 3.3, “Event-Based Profiling Analysis”. The IBS-derived events are describedin Section 9.3, “Instruction-Based Sampling Derived Events”
CodeAnalyst supports the new performance monitoring events provided by AMD Family 10hprocessors. See BIOS and Kernel Developer's Guide (BKDG) For AMD Family 10h Processor [http://support.amd.com/us/Processor_TechDocs/31116.pdf] for complete list of performance events.
The online help has been restructured and revised. The new structure follows the CodeAnalyst workflow.See the Chapter 1, Introduction.
B.5. New Features in CodeAnalyst 2.6• Chapter 4, Configure Profile that assist the configuration of profile data collection.
• Chapter 7, View Configuration that make it easier to review and interpret results.
• Section 2.4, “Event Counter Multiplexing” that extends Section 3.3, “Event-Based Profiling Analysis”and makes it possible to measure more than four events in a single run.
166
BibliographyBIOS and Kernel Developer's Guide (BKDG)BIOS and Kernel Developer's Guide (BKDG) For AMD Family 11h Processor
[http://support.amd.com/us/Processor_TechDocs/41256.pdf]
BIOS and Kernel Developer's Guide (BKDG) For AMD Family 10h Processor[http://support.amd.com/us/Processor_TechDocs/31116.pdf]
BIOS and Kernel Developer's Guide for AMD Athlon™ and AMD Opteron™ Processors (Rev. A-E)http://support.amd.com/us/Processor_TechDocs/26094.PDF
BIOS and Kernel Developer's Guide for AMD NPT Family 0Fh Processors (Rev. F-G)http://support.amd.com/us/Processor_TechDocs/32559.pdf
General DocumentationBasic Performance Measurements for AMD Athlon™ 64, AMD Opteron™ and AMD Phenom™ Processors
http://developer.amd.com/Assets/Basic_Performance_Measurements.pdf
Increased performance with AMD CodeAnalyst software and Instruction-Based Sampling (on Linux)http://developer.amd.com/Assets/amd_ca_linux_june_2008.pdf
An introduction to analysis and optimization with AMD CodeAnalyst Performance Analyzerhttp://developer.amd.com/Assets/Introduction_to_CodeAnalyst.pdf
Improving program performance with AMD CodeAnalyst for Linux®http://developer.amd.com/assets/Linux_Summit_PJD_2007_v2.pdf
Instruction-Based Sampling: A New Performance Analysis Technique for AMD Family 10h Processorshttp://developer.amd.com/assets/AMD_IBS_paper_EN.pdf
167
IndexAAdvance Tab, 39assess performance, 123
BBasic Block Analysis, 64basic steps
run, 4Buffer Size
CPU, 40Event, 40
CCall Stack
Depth, 40Unwinding Interval, 41
Call Stack Sampling (CSS), 40Call-Stack Sampling Analysis, 69
Enabling CSS Profile, 70Viewing CSS Profile, 70
cascading session panes, 10change view, 125code density chart, 16CodeAnalyst dialog window, 21CodeAnalyst options, 20Compiling
GCC, 1configuration management, 72CPU Affinity, 42current profiles, 19
Ddata aggregation, 23data collection, 3
choosing events, 127data source display, 12directories tab, 25drill down, 3
EEBP, 92
changing view, 91collecting profile, 88configuration, 17event multiplexing, 59how it works, 59predefined profile, 60sampling and measuring period, 59
EBS/IBS Configuration, 74
enhancement requests, 157Event Buffer Watershed size, 40event counter multiplex, 26Event-Based Profiling Analysis, 57
FFeatures List, 164
GGeneral tab, 22General Tab, 37graphical user interface, 3gui
explore, 4
IIBS
collecting data, 131collecting profile, 93derived events, 64, 148drill into data, 137Fetch Derived Events, 148fetch sampling, 61Op Branches Derived Events, 151op data, 63Op Derived Events, 150Op Load-Store Derived Events, 151Op Northbridge Derived Events, 154op sampling, 62op sampling bias, 63predefined profile, 64review results, 133
icons, 6importing CodeAnalyst Session Directory, 33importing xml, 34In-Line Analysis, 66in-line function
aggregate into original, 67source inlined annotation, 68
in-line instanceaggregate samples, 66
Instruction-Based Sampling Analysis, 60
Jjava app
launch commandline, 145
LLaunch, 38Launch Control, 38
Mmanage button, 18
Index
168
menufile, 6help, 11profile, 7tools, 8windows, 9
menus, 6multiplexing examples, 26
NNew Features in CodeAnalyst 2.6, 165New Features in CodeAnalyst 2.7, 164New Features in CodeAnalyst 2.8, 164New Features in CodeAnalyst 2.9, 164New Features in CodeAnalyst 3.0, 164Note Tab, 41
Oopcontrol, 47
Event-Based Profiling, 49Instruction-Based Sampling, 51Time-Based Profiling, 48
OProfile, 47OProfile Daemon Monitoring Tool, 52Oprofiled Buffer Configuration, 40OProfiled Log, 41overview, 2
Pperformance data
change view, 119platform name, 106PME, 147PME Unit masks, 147predefined views, 107Process Filter, 46profile configuration, 19Profile Configuration, 39profile configuration file, 100Profile Configurations, 79
Manage, 80Profile Control, 39profile data
exporting, 34importing, 27importing and viewing, 52importing local, 29
profile java apps, 21profiles and performance data
collecting, 84Profiling
Prepare Application, 1with OProfile Command-Line Utilities, 48
profilingimporting remote, 32
project panel, 4projects and sessions, 3
RReport Problems, 157review data
java app, 141
Sseparate CPUs, 107Session Settings, 17session settings, 37show percentage, 107single module data tab, 13source/dasm tab, 14status bar, 4system data tab, 12
TTBP
collecting, 84configuring, 73how it works, 56predefined profile, 57sampling and measuring period, 56
TBS, 87changing view, 87
Template Name, 38Templates
Setting, 37TGID for CSS, 41tiling session panes, 10Time-Based Profiling Analysis, 54Toolbar, 5toolbar
float or dock, 5tools, 6tuning cycle, 2tutorial, 113
create project, 113EBS Profile, 122IBS Profile, 131prepare application, 113profiling java app, 139TBS Profile, 117
Types of analysis, 2
Vview
available data, 106column shown, 106
Index
169
columns, 106description, 106name, 106
view configuration, 104file format, 109
view management, 105viewing results, 104vmlinux
enable, 40
WWorking Directory, 38
Xxml file, 109
example, 102, 111xml format, 100