coefficient of earth pressure at rest for normally and ... · peat, which is widely distributed in...
TRANSCRIPT

The Japanese Geotechnical Society
Soils and Foundations
Soils and Foundations 2012;52(2):299–311
0038-0
hosting
Peer re
http://d
nCor
E-m
806 & 20
by Elsev
view und
x.doi.org
Pr
respondi
ail addre
www.sciencedirect.comjournal homepage: www.elsevier.com/locate/sandf
Coefficient of earth pressure at rest for normally and overconsolidatedpeat ground in Hokkaido area
Hirochika Hayashia,n, Nobutaka Yamazoeb, Toshiyuki Mitachic,Hiroyuki Tanakad, Satoshi Nishimotoa
aCivil Engineering Research Institute for Cold Region, 1-3 Hiragishi, Sapporo, JapanbC-way Engineering Co., Ltd., 2-5 Higashi-Sapporo, Sapporo, Japan
cCollege of Industrial Technology, Nihon University, 1-2-1 Izumi-cho, Narashino, JapandGraduate School of Engineering, Hokkaido University, West8 North13, Sapporo, Japan
Available online 29 March 2012
Abstract
Peat, which is widely distributed in Hokkaido, is a very soft and problematic soil. To perform an elasto-plastic Finite Element (FE)
analysis, it is important to accurately determine the initial stress conditions, and among them, the value of the coefficient of earth
pressure at rest (K0 value) is particularly important. A K0-consolidation test using triaxial testing apparatus and a flat dilatometer were
performed to investigate the K0 value for peat ground in Hokkaido, Japan. It was found that the K0 value for normally consolidated
peat and organic clay (K0NC) decreases with an increase in the ignition loss. The K0 value for overconsolidated peat and organic clay
(K0OC) is more strongly dependent on the over consolidation ratio (OCR) than that of usual inorganic clay. That is, it is known that
K0OC is empirically related to K0NC, as expressed by K0OC¼K0NCOCRm, and in peat and organic clay the power of m increases with their
ignition loss. An experimental equation to estimate K0 using a flat dilatometer for peat ground is also proposed.
& 2012 The Japanese Geotechnical Society. Production and hosting by Elsevier B.V. All rights reserved.
Keywords: K0 value; Flat dilatometer; K0-consolidation test; Normal consolidation; OCR; Organic clay; Over consolidation; Peat (IGC: D5/D6)
1. Introduction
Peat ground is widely distributed throughout the Hokkaidoregion of Japan. Peat contains a large amount of organicmatter and has a very high natural water content. Itsunsuitability as a foundation material has brought about
12 The Japanese Geotechnical Society. Production and
ier B.V. All rights reserved.
er responsibility of The Japanese Geotechnical Society
/10.1016/j.sandf.2012.02.007
oduction and hosting by Elsevier
ng author.
ss: [email protected] (H. Hayashi).
serious problems for construction works. In Hokkaido, thepeat layer often overlies thick layers of organic clay andHolocene inorganic clay. Embankment constructions tendto deform the peat ground, not only due to consolidationbut also shear. Hayashi et al. (1994) have demonstrated thata Finite Element (FE) analysis based on Cam-clay model(Schofield and Wroth, 1968) is quite effective in predictingthe deformation of peat ground, since this model is capableof taking deformation caused by consolidation as well asshear into account. In order to perform an elasto-plastic FEanalysis including the Cam-clay model, accurate initialstress conditions need to be determined. The value of thecoefficient of earth pressure at rest (K0 value) is particularlyimportant. In this paper, we propose a method for deter-mining the K0 value for peat ground.Remarkably little research has been done on the K0 value
for peat and organic clay compared to usual inorganic clay, sovery little data is available in the literature. Miyakawa et al.

Surfacesoil 15.0
Peat 10.3
Soil typeWet density
(kN/m3)
0
1
2
3
4
5
0 2 4 6OCR
Dep
th (
m)
Drop by 1m from WH(GL-0m)
Drop by 1m from WH(GL-0.5m)
WH: groundwater level
Fig. 1. Calculated OCR under the assumption of typical peat ground.
Ap
AcoAs
Ac
:Pore water pressure meter
:Settlement plate
GL-10.4
GL-17.8
BkSm
4.250.75
GL-4.80GL-7.95
GL-12.00
GL-22.80
30.022.04.0 4.0
unit: (m)
:Stakes
3.59.01.5
Borehole inclinometer
0.42
GL-5.8
GL-2.8
Fig. 2. Cross-section of the embankment and the subsoil at the Toubetsu
site: Bk: embankment, Sm: sand mat.
H. Hayashi et al. / Soils and Foundations 52 (2012) 299–311300
(1974), Edil and Dhowian (1981), Fujikawa et al. (1983),Kawano et al. (1986), and Mesri and Ajlouni (2007) reportedthe K0 values for peat ground measured with one-dimensionaloedometer test, with stress conditions restricted to the nor-mally consolidated state. As will be explained later, peatground is usually overconsolidated to some degree due tothe in situ stresses which vary with seasonal changes in thegroundwater table. This factor is significant since, combinedwith the extremely low density of peat, it results in high OCR
values. As such, it is very important for determining the K0
value of overconsolidated peat ground for numerical solutions.It should be kept in mind that the engineering properties
of peat ground are extremely heterogeneous. Therefore, thesoil parameters for practical designs should be obtainedfrom a large number of simple and robust tests, rather thanfrom a few complicated and sophisticated tests. It is alsouseful to determine the soil parameters using simple in-situtests that can measure soil parameters continuously to therequired depth. In this study, methods for determining theK0 of peat ground are established by performing laboratoryK0-consolidation tests using triaxial testing apparatus onundisturbed peat and organic clay, as well as the use ofin-situ tests with a flat dilatometer (DMT).
2. Importance of K0 value at various OCR
2.1. OCR for peat ground
Peat is usually found directly from the ground surface.Since the wet density of peat is very low and the ground-water level in the peat ground is very close to the groundsurface, the effective overburden pressure is very low unlessartificial loading is applied. Furthermore, the groundwaterlevel in the peat ground changes seasonally, so peat groundtends to be overconsolidated, even with no increase in anartificial stress. Futatsukawa and Kikuchi (1988) performeda detailed survey of changes in the groundwater levels ofpeat ground from 1985 to 1987 in the suburbs of Sapporo,Hokkaido. They found that the groundwater level was thehighest from March to April and at its lowest duringsummer. The change in the groundwater level between thesetwo seasons varies from 50 cm to 1 m. Let us consider theOCR for an imaginary ground consisting of a top usual soillayer with 0.5 m thickness and a peat layer with 4.5 mthickness, whose gt are 15.0 kN/m3 and 10.3 kN/m3, respec-tively (Fig. 1). For this ground condition, the change in theOCR will be calculated when the groundwater level drops by1 m. These adopted numbers are typical values for the peatground in Hokkaido (CERI, 2002). Two cases of the initialgroundwater level are examined: the ground surface and theboundary between the top soil and the peat layer. Thecalculated OCR is shown in Fig. 1, indicating that the OCR
increases between 2 and 5 with a 1 m lowering of thegroundwater level.
In addition to these seasonal fluctuations, the ground-water levels in the peat ground are also widely influencedby drainage, ranging in an order estimated between several
dozen centimeters to about 1 m (Hokkaido branch of JGS,2002). As will be shown later in Figs. 7–10, which describethe soil profiles of the four investigation sites, peat soils areslightly overconsolidated. Therefore, it is necessary tocarefully examine the relationship between the OCR andK0 under in-situ stress to determine the K0 value for peatground.
2.2. Numerical evaluation for effects of K0 value on lateral
deformation
To evaluate the influence of the K0 value on calculateddeformation, an FE analysis was conducted on a testembankment constructed in Toubetsu, Hokkaido. Fig. 2shows a cross-section of the test embankment and soillayers. Fig. 3 shows the geotechnical properties at the site.The thickness of the peat layer (Ap) was 4.8 m. Its watercontent and ignition loss range were from 500–800%and 60–90%, respectively. Organic clay (Aco), alluvialsand (As) and clay layers (Ac) were found below the peatlayer. The permeability of the sand layer located under the

Soil type
Peat (Ap)
Organic clay(Aco)
sand(As)
Clay(Ac)
0
5
10
15
20
25
0.1 1.0 10.0
qc
(MN/m2)
Dep
th (
m)
Natural water contentwn (%)
Ignition lossLi (%)
Compression indexCc
0 500 1000 0 50 100 0 5 10 0 50 100 150 1.0 2.0 3.0 4.0
OCR
effective overburdenstress
groundwaterlevelGL-0.42m
Yield stress Pc (kN/m2)
Fig. 3. Geotechnical profiles at the Toubetsu site.
H. Hayashi et al. / Soils and Foundations 52 (2012) 299–311 301
Aco layer is high enough to provide drainage. The heightof the embankment was 5 m, and its construction processis illustrated in Fig. 4.
A soil/water-coupled elasto-plastic FE analysis wasconducted based on the finite deformation theory, whichis considered a suitable method for peat ground withextremely large deformation (Yamazoe and Mitachi,2007). In this analysis, the modified Cam-clay model wasused to describe the dilatancy characteristics of peat,organic clay and clay layers. The relationship betweenthe specific volume (v) and effective mean stress (p0) wasassumed to be linear in ln v–ln p0 plot. The purpose of theFE analysis in this study is to clarify the importance of K0
value for peat by demonstrating the influence of differencesin the K0 value on analytical results. It is known thatlateral displacement calculated through FE analysis isgreatly affected by differences in constitutive models.Mitachi et al. (2010) studied the extent to which severalconstitutive models with different yield surface shapes,including the original Cam-clay model (Roscoe et al.,1963), the modified Cam-clay model (Roscoe andBurland, 1968), the Sekiguchi–Ohta model (Sekiguchiand Ohta, 1977) and another model developed by intro-ducing the anisotropy parameter Zn (Sekiguchi and Ohta,1977) into the modified Cam-clay model (Hashiguchi andChen, 1998; Asaoka et al., 2000; Mizuno et al., 2007), wereapplicable to the deformation analysis of peat ground. Theresults showed that models with lower levels of strength anddeformation resistance in the extension mode tended toresult in the overestimation of lateral displacement. Exam-ination of analysis technique differences between infinitesi-mal deformation theory and finite deformation theory alsorevealed that analysis based on the latter (Yamazoe andMitachi, 2007) was more applicable to peat ground. The
models and analysis method used in this study were based onthe results obtained by Mitachi et al. (2010). The sand andembankment were assumed to be elastic materials.As shown in Table 1, the K0OC value of the peat layer
was changed from 0.2 to 1.0 to examine its influence.Table 2 lists other soil parameters used for the analysis,based on the results from oedometer, triaxial compression(CU ) and physical index tests. However, the effectiveangle of shear resistance (f0) of the peat (Ap) layer wasfound using the estimation equation (Eq. (1)) presented byHayashi et al. (2007); where Li is ignition loss (%):
f0 ¼ 0:19Liþ32 ð1Þ
The soil parameters were determined in line with theprocedure proposed by Hayashi et al. (2007) as follows.The compression index ln in relationships between ln v andln p0 was determined by the oedometer test. The swell indexkn was assumed to be 0.1 times of the ln. The initialvolume ratio v0 was calculated using the natural watercontent and the soil particle density. The critical stateparameter M was determined using the f0 given above.The OCR was the ratio of the consolidation yield stressobtained from the oedometer test to the effective over-burden pressure calculated by the wet density of eachsoil layer.Hayashi et al. (2008) reported that the coefficient of
permeability (kf) in peat layers measured by the field test isgreater than that measured by the oedometer test (kl), andkf is 10–30 times as high as kl. Based on these results, k forthe FE analysis was assumed to be 10 times larger thanthat measured by the oedometer test. The change in thecoefficient of permeability lk
n was determined from therelationship between the void ratio and the coefficient in alogarithmic expression (the e-log k relationship) under

-4.0
-3.0
-2.0
-1.0
0.0
Sur
face
set
tlem
ent (
m)
Measured K0OC = 0.2
K0OC = 0.4 K0OC = 0.6
K0OC = 0.8 K0OC = 1.0
0.0
1.0
2.0
3.0
4.0
5.0
6.0
0Elapsed time (days)
Thi
ckne
ss o
f em
bank
men
t (m
) ActualModeling
100 200 300 400 500
0 100 200 300 400 500
Fig. 4. Time history of the embankment construction and the settlement
of the ground surface at the center of the embankment.
Table 1
K0oc of peat layer used.
Case K0OC
1 0.2
2 0.4
3 0.6
4 0.8
5 1.0
H. Hayashi et al. / Soils and Foundations 52 (2012) 299–311302
normal consolidation conditions obtained from theoedometer test.
Fig. 4 shows the process of the embankment construc-tion and the observed settlement on the ground surface atthe center of the embankment. The embankment construc-tion commenced 86 day after sand mat construction. Largesettlement (more than 3 m) due to the embankment loadwas observed. The analysis slightly overestimated thesettlement due to the sand mat construction (elapsed time
between 0 and 86 days), but the settlement caused by theembankment construction (86 days later) can be wellpredicted. Although calculated settlements decreasedslightly with increase in the K0OC value, no significantdifference was observed, considering that practical esti-mates in peat ground tend to be out by 10 cm or more.Fig. 5 shows the observed lateral displacement of the
ground under the toe of the embankment at the comple-tion of the embankment (236 days later). It was as large as60 cm at a depth of 4 m, which is about 25% of thesettlement measured at the center of the embankment. Asshown in the figure, calculated lateral displacements arevery sensitive to the order of the K0OC value, and decreasewith increase in the K0OC value. The difference in themaximum lateral displacements with K0OC values from 0.2to 1.0 is 22 cm. It should be noted that, in practice, therequired accuracy is sometimes as small as 1 cm forexisting facilities near the embankment, so that theimportance of the K0OC value in the analysis needs to berealized.
3. Investigation sites
Investigations of the K0 values of peat ground wereperformed at four sites: Mihara and Shinotsu in EbetsuCity; Tsuruno in Kushiro City; and Riyamunai in Kyouwatown (Fig. 6). In the laboratory, the following tests wereconducted: a K0-consolidation test using a triaxal testingapparatus, a consolidated undrained triaxial compressiontest, an oedometer test, and several other tests for physicalproperties. The in-situ tests performed were a dilatometer(DMT) and an electric cone penetration test (CPT).Figs. 7–10 show the geotechnical properties of the
investigated site in this study. The yield stress pc in thefigures was determined using the e-log p relationshipobtained from the oedometer test. As the pc value for peatwas extremely small, the consolidation pressure for the firststep in the oedometer test was set at 5 kN/m2.The top layer at the Mihara site consists of peat with
400–500% natural water content. The underlying soils areorganic clay, sandy silt and clay, which is a typicalsequence of the ground covered by peat at the groundsurface found in Hokkaido. The OCR of the peat is in therange of 1–2, indicating it is slightly overconsolidated.The Shinotsu site is located near the Mihara site.
Therefore, the ground composition at the Shinotsu issimilar to that at Mihara, except for the relatively largeOCR for the peat ground.Fig. 9 illustrates the engineering properties of the ground
at the Tsuruno site. The soft deposits consisting ofalternating layers of peat, organic clay and clay layers atthe Tsuruno site are thinner than that at the other twosites. The OCR of the peat layer is less than 2, which islower than the OCRs of the organic clay and clay layers.The natural water content of the peat at the Riyamunai
site is 500–850% and its OCR ranges between 2 and 3.

Table 2
Soil parameters used.
Depth (m) Model rt (g/cm3) E (kN/m2) n ln kn v0 M OCR K0NC K0OC k0 (m/d) lk
n
Bk 5.00–0.75 B 1.70 5600 0.33 – – – – – – – – –
Sm 0.75–0.00 B 1.70 5600 0.33 – – – – – – – – –
Ap-u 0.00 to �2.40 A 1.09 – 0.22 0.305 0.031 8.8 1.90 3.20 0.28 0.73 2.0E�02 0.201
Ap-l �2.40 to �4.80 A 1.06 – 0.22 0.356 0.036 14.8 1.90 2.27 0.28 0.55 3.0E�02 0.196
Aco �4.80 to �7.95 A 1.41 – 0.30 0.130 0.013 3.35 1.38 1.26 0.44 0.50 3.0E�03 0.109
As �7.95 to �12.00 B 1.80 9100 0.34 – – – – 0.52 – 1.4Eþ00 –
Ac-u �12.00 to �17.40 A 1.73 – 0.32 0.099 0.010 2.18 1.30 1.31 0.47 0.54 4.0E�04 0.103
Ac-l �17.40 to �22.80 A 1.66 – 0.36 0.120 0.012 2.43 1.03 1.00 0.56 0.56 3.0E�04 0.129
Model-A: Modified Cam-clay model, Model-B: Elastic material, rt: wet density, E: modulus of elasticity, n: Poisson’s ratio, ln, kn: compression index, swell
index in relationships between ln v and ln p0, v0: initial volume ratio, M: critical state parameter, OCR: over consolidation ratio, K0NC: coefficient of earth
pressure at rest in normally consolidated condition, K0OC: coefficient of earth pressure at rest in overconsolidated condition, k0: initial coefficient of
permeability, lkn: change in permeability coefficient in relationships between ln v and ln p0.
0
5
10
15
20
-0.5 0.0 0.5 1.0
Lateral displacement (m)
Dep
th (m
)
Measured K0OC = 0.2K0OC = 0.4 K0OC = 0.6K0OC = 0.8 K0OC = 1.0
inside of embankment outside of embankment
Fig. 5. Lateral displacement of the ground under the toe of the
embankment slope at the completion of the embankment construction.
H. Hayashi et al. / Soils and Foundations 52 (2012) 299–311 303
4. Testing procedures
4.1. K0-consolidation test
A K0-consolidation test using triaxial testing apparatus(Fig. 11) was conducted in accordance with JapaneseGeotechnical Society standards (JGS 0525-2000) on undis-turbed samples that were collected using a thin-walled tubesampler with a fixed piston and an inside diameter of75 mm. To avoid unnecessary disturbance, the diameter of
the peat specimen was the same as the sample retrievedfrom the sampling tube, i.e., 75 mm, and the height of thespecimen was 75 mm. Otherwise, specimens of the othersoil types were trimmed to 50 mm in diameter and 100 mmin height. To accelerate the dissipation of the excess porewater pressure, four pieces of filter paper were placed onthe circumference of the test specimens. Furthermore, anylon mesh was placed on both ends of the test specimens.At the initial state of the consolidation, isotropic con-
solidation pressure was applied. The intensity was lowenough not to cause an excess lateral displacement, i.e.,2 kN/m2 for peat and 5 kN/m2 for the organic clay testspecimens. Then, the lateral pressure in the test wasautomatically controlled so that the lateral strain of thespecimen should be zero, calculated from the axial dis-placement and the volume change.To avoid any decrease in effective load by the generation of
excess pore water pressure, axial loading was applied at theslow rate of 0.2 kN/m2/min. In this study, the pore waterpressure was not measured because the top and bottom endsof the test specimens were kept drained. However, thegenerated excess pore water pressure in the specimen wasconsidered small enough to accurately measure the K0 valueduring consolidation for the following reason. Oda andMitachi (1992) performed a K0-consolidation test in a triaxialcell on clay samples with a coefficient of consolidation (cv) of10–13 cm2/day. They reported that the measured excess porewater pressure at the bottom of the specimen was less than10% of the vertical stress under an axial loading rate of0.9 kN/m2/min or lower. The axial loading rate adopted inthis study is slower than this rate and the cv of peat andorganic clay is similar to or approximately 10 times the valuesof the clay they used. Therefore, it would follow that almostno excess pore water pressure was generated under the axialloading rate of 0.2 kN/m2/min in this experiment.It was observed that the lateral strain of the test
specimens during the K0-consolidation was about 0.01–0.03%, which is sufficiently below the value of 0.05%specified by the Japanese Geotechnical Society (JGS 0525-2000). A comparison of the specimen before and after the
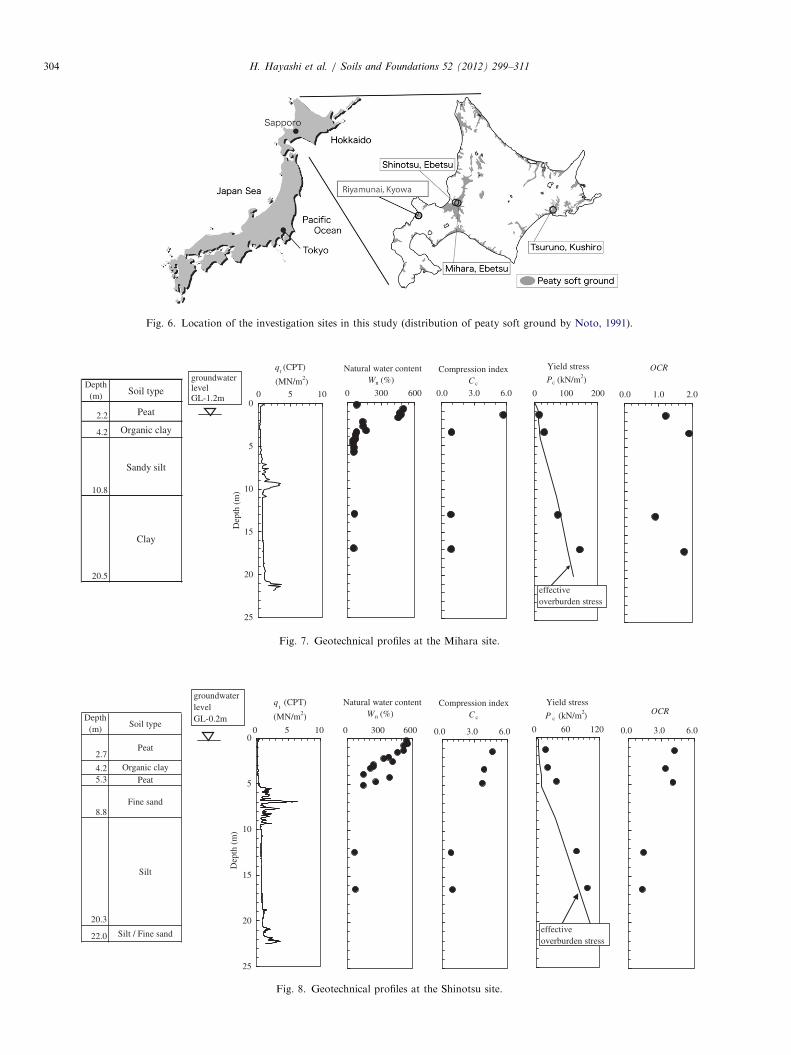
Fig. 6. Location of the investigation sites in this study (distribution of peaty soft ground by Noto, 1991).
Depth(m) Soil type
2.2 Peat
4.2 Organic clay
10.8
Sandy silt
20.5
Clay
0
5
10
15
20
25
0 5 10
qt (CPT)
(MN/m2)
Dep
th (
m)
groundwaterlevelGL-1.2m 0 300 600
Natural water contentWn (%)
0.0 3.0 6.0
Compression indexCc
0 100 200
Yield stress
Pc (kN/m2)
effectiveoverburden stress
0.0 1.0 2.0
OCR
Fig. 7. Geotechnical profiles at the Mihara site.
Depth(m)
Soil type
2.7Peat
4.2 Organic clay5.3 Peat
8.8Fine sand
20.3
Silt
22.0 Silt / Fine sand
0 300 600
Natural water contentWn (%)
0
5
10
15
20
25
0 5 10
qt (CPT)
(MN/m2)
Dep
th (
m)
groundwaterlevelGL-0.2m
0.0 3.0 6.0
Compression indexC c
0 60 120
Yield stress
P c (kN/m )2
effectiveoverburden stress
0.0 3.0 6.0
OCR
Fig. 8. Geotechnical profiles at the Shinotsu site.
H. Hayashi et al. / Soils and Foundations 52 (2012) 299–311304

Depth(m)
Soil type
2.1 Peat
2.6 Organic clay
3.4 Clay
3.9 Fine sand
4.3 Sandy clay4.7 Clay
5.2 Organic clay
6.2 Peat
6.9 Organic clay
7.5 Fine sand
0 300 600
Natural water conetntWn (%)
0
1
2
3
4
5
6
7
8
0 10
Dep
th (
m)
qt(CPT) (MN/m2)
groundwaterlevelGL-1.2m
0.0 4.0 8.0
Compression index
Cc
Yield stressPc (kN/m2)
effective overburden stress
0 50 100 0.0 2.0 4.0
OCR
Fig. 9. Geotechnical profiles at the Tsuruno site.
Depth(m) Soil type
4.8 Peat
12.0 Clay
13.0 Fine sand
Natural water contentWn (%)
Compression index
CC
Yield stressPc (kN/m2)
OCR
0
2
4
6
8
10
12
0 500 1000 0.0 6.0 12.0 0 20 40 0.0 2.0 4.00 5 10
Dep
th (
m)
qt (CPT)(MN/m2)
groundwaterlevelGL-0.4m
Fig. 10. Geotechnical profiles at the Riyamunai site.
H. Hayashi et al. / Soils and Foundations 52 (2012) 299–311 305
test (see Fig. 12) indicated no noticeable large lateraldeformations.
4.2. Consolidated undrained triaxial compression test
A series of isotropically consolidated undrained triaxialcompression test was performed for sampled specimens,following the Japanese Geotechnical Society specifications(JGS 0523-2000). The peat specimens were 75 mm in diameterand 150 mm in height, while the organic clay and clayspecimens were 50 mm in diameter and 100 mm in height.
To obtain strength parameters under the normal con-solidated state, the order of the consolidation pressure waslarge enough to exceed the consolidation yield stress.
Consolidation was terminated when the volume changeversus logarithm of time (t) curve reaches 3t-line, asspecified by the JGS. After that, the specimen wassubjected to undrained shear at an axial strain rate of0.1%/min. Although most of the peat exhibited no peak inaxial strain, the effective angle of shear resistance (f0) wasdefined at an axial strain of 15%.
4.3. Ignition loss test
The specimen was heated at 700–800 1C according toJapanese Industrial Standards (JIS A 1226) with theexception of the ignition duration: i.e., 4 h, which is 3 hlonger than speicified. This is because Nakayama et al.

H. Hayashi et al. / Soils and Foundations 52 (2012) 299–311306
(1989) reported that when ignition time is short, theorganic matter in peat does not completely ignite and anhour testing underestimates 30% of the real ignition lossfor highly organic soils. In addition to the longer ignitiontime, the specimen was prepared for the test at 90 1C ratherthan 110 1C since some of the organic matter may havebeen burned and be lost at 110 1C. Considering theheterogeneity of the peat ground, three specimens weretested and Li in this paper is the average of the measuredvalues for these specimens.
4.4. Flat Dilatometer Test (DMT)
DMT is an in-situ horizontal loading test, penetrating athin blade (93 mm wide� 16 mm thick) into the groundand expanding the center of a metallic membrane in theblade by gas pressure. From the DMT, three indicesare calculated. Only the horizontal stress index, KD
was discussed in this study for evaluating the K0. KD canbe expressed by Eq. (2), where P0 is the measured gaspressure at 0.1 mm expansion of the membrane, u0 is thehydrostatic pressure, and s0v is the effective overburden
Fig. 11. Set up of K0-consolidation test used.
before testing
Fig. 12. Peat specimen tested (Tsuruno, depth: 1.39–1.56 m, initial isotropic co
to two pieces).
pressure.
KD ¼ ðP02u0Þ=s0
v ð2Þ
5. K0 value from laboratory and field tests
5.1. K0 at normal consolidated state
Fig. 13 plots a typical relationship between the axialconsolidation pressure (s0a) and the K0 value for peat retrievedfrom the Tsuruno site at depths of 1.39–1.56 m. When theaxial consolidation pressure exceeds the consolidation yieldstress and enters the normal consolidation stage, the K0 valuebecomes almost constant. The constant K0 value under thenormally consolidated state has been also confirmed byseveral researchers, such as Miyakawa et al. (1974),Fujikawa et al. (1983), Kawano et al. (1986), Edil andDhowian (1981), and Mesri and Ajlouni (2007). In this paper,the K0 value in the normal consolidation is denoted as K0NC.Fig. 14 shows the relationship between Li and K0NC at
the four investigation sites. The K0NC decreases linearlywith increases in Li (i.e., increases in organic matter
after testing
nsolidation pressure: 2 kN/m2): (a) before testing and (b) after testing (cut
0.0
0.5
1.0
1.5
0
K0
K0NC = 0.38
Peat
Yeild stress Pc Loading
Removaling
20 40 60 80
σ'a (kN/m2)
Fig. 13. The typical relationship between axial consolidation pressure s0aand K0 value (Tsuruno site at depths of 1.39–1.56 m).

0.0
0.2
0.4
0.6
0.8
0Ignition loss Li (%)
K0N
CPeatOrganic clayClayMitachi and Fujiwara (1986)
K0NC = 0.47-0.0025 Li (%)
50 100
Fig. 14. The relationship between ignition loss and K0NC.
0.0
0.2
0.4
0.6
0.8
0.2
K0N
C
PeatOrganic clayClay
K0NC = 1-sin�'
0.4 0.6 0.8 1.0sin�'
Fig. 15. The relationship between K0NC and sin f0.
0.1
1
10
101OCR
K0
OCR = 1.37
K0OC = 0.41
Peat
Fig. 16. The typical relationship between OCR and K0OC (Tsuruno site at
depths of 1.39–1.56 m).
0.2
0.4
0.6
0.8
1.0
0
m
PeatOrganic clayClay
m = 0.005 Li (%) + 0.45
50 100Ignition loss Li (%)
Fig. 17. The relationship between m value and ignition loss.
H. Hayashi et al. / Soils and Foundations 52 (2012) 299–311 307
content). For organic clay and peat with relatively low Li,the K0NC is approximately 0.4, which is around 0.1 smallerthan that of inorganic clay. Samples with high Li (Li¼85%and 91%) indicate K0NC values of 0.21 and 0.32, which isvery low compared to that of inorganic clay.
The relationship between Li and K0NC can be approxi-mated as the linear line shown in Fig. 14, includinginorganic clay as well as organic clay. This relation isapproximated as follows, where Li is ignition loss in %.
K0NC ¼ 0:4720:0025Li ð3Þ
Mitachi and Fujiwara (1986) also measured the K0NC ofundisturbed peat collected in Hokkaido, by a similar K0-consolidation test using the triaxial test apparatus. Theirmeasured point is also well fitted by this equation.
For the relationship between K0NC and f0, the followingequation by Jaky (1948) is well known:
K0NC ¼ 12sinf0 ð4Þ
Watabe et al. (2003) confirmed that Eq. (4) givesaccurate results for mineral clay. The relationship betweenK0NC and sin f0 obtained from the isotropically consoli-dated undrained triaxial compression test is shown inFig. 15. It can be seen that Jaky relation can be alsoapplied to peat; in other words, the small K0 value for peatis due to large f0 of peat.
5.2. K0 at the overconsolidated state
As discussed in the previous chapter, the peat layer is ingeneral somewhat overconsolidated and the K0OC value forpeat is strongly affected by the calculated lateral displace-ments by FE analysis. After applying an axial consolidationpressure higher than the consolidation yield stress, unloadingwas performed in the K0-consolidation test, as shown inFig. 13. It can be seen that the K0 value during the unloadingprocess is greater than that at the normal consolidated state.Fig. 16 shows a typical relationship between OCR and K0OC
obtained from the results shown in Fig. 13. At the depth

Table 3
Summary of test results in this study.
Site Depth(m) Soil type wn (%) Li (%) OCR f0(deg) K0NC m K0OC
Mihara 3.00–3.86 Organic clay 82 17 1.9 45.3 0.57 0.49 0.77
12.50–13.36 Clay 64 – 1.0 30.4 0.52 0.53 0.52
16.50–17.36 Clay 57 – 1.8 31.9 0.53 0.52 0.75
Shinotsu 2.14–2.31 Peat 407 45 4.2 36.9 0.29 0.62 0.69
2.99–3.17 Organic clay 325 27 3.3 36.5 0.30 0.57 0.56
3.83–4.00 Organic clay 168 17 3.3 36.5 0.39 0.61 0.82
4.18–4.35 Peat 333 51 4.0 41.3 0.30 0.67 0.67
5.02–5.19 Peat 259 42 4.0 41.3 0.38 0.65 0.80
12.43–12.55 Clay 68 6 1.4 30.4 0.53 0.51 0.61
16.45–16.59 Clay 67 6 1.2 31.9 0.53 0.47 0.55
Tsuruno 1.39–1.56 Peat 423 52 1.4 42.5 0.38 0.64 0.41
1.90–2.07 Peat 421 34 1.4 42.5 0.41 0.69 0.47
2.93–3.11 Clay 81 – 3.2 32.1 0.45 0.54 0.87
4.47–4.64 Clay 96 – 3.0 32.1 0.45 0.49 0.70
4.77–4.95 Organic clay 91 17 1.5 – 0.43 0.48 0.50
5.29–5.47 Peat 540 85 1.3 46.4 0.21 0.83 0.23
6.47–6.65 Organic clay 176 14 2.0 – 0.43 0.53 0.58
Riyamunai 2.41–2.59 Peat 913 91 1.8 48.1 0.32 0.90 0.53
4.57–4.74 Peat 628 59 2.3 50.7 0.35 0.61 0.55
7.47–7.60 Clay 85 11 4.2 30.0 0.48 0.48 0.87
0.1
1
0.01KD
K0
peatorganic clayclay
Marchetti (1986)K0OC = (KD/1.5)0.47-0.6
Iwasaki (1999)K0OC = 0.29 KD
0.57
K0OC = 0.5 KD0.22
0.1 1 10
Fig. 18. The relationship between KD and K0 obtained from K0-
consolidation tests.
0.0
0.2
0.4
0.6
0.8
1.0
0.0K0
K0D
MT =
0.5
KD
0.22
peatorganic clayclay
1:1
1:0.8
1:1.3
0.2 0.4 0.6 0.8 1.0
Fig. 19. The relationship between K0DMT estimated by the proposed
equation and K0 value from K0-consolidation tests.
H. Hayashi et al. / Soils and Foundations 52 (2012) 299–311308
where this sample was retrieved, the OCR was 1.37, and theK0OC at the in situ was estimated as 0.41.
It is well known that the K0OC for inorganic soilsincreases linearly with the OCR in the log–log plot.Schmidt (1966) proposed the following equation for therelationship between OCR and K0OC:
K0OC ¼K0NCOCRm ð5Þ
where m is the gradient when the K0OC and OCR areplotted in log–log scale.
In this study, the relationship between OCR and K0OC
for peat as well as organic clay exhibited the same relationas inorganic soils, as shown in Fig. 16. That is, the K0 of
peat and organic clay are dependent on stress history andcan be expressed by a function of OCR.Fig. 17 shows the relationship between the m value and Li.
The m value for inorganic clay obtained by this study rangedbetween 0.46 and 0.52. Watabe et al. (2003) reported that m
values measured from a large number of clayey sites aroundthe world have similar m values. Hamouche et al. (1995)reported that clays from sites in North America present the m
value of 0.4–0.5 and some sensitive clays show relatively highm values. These researchers suggest that most inorganic clayshave the m value of approximately 0.5, except for some verysensitive clays. In contrast, organic clay and peat have veryhigh m values, particularly peat. For the sample with high

H. Hayashi et al. / Soils and Foundations 52 (2012) 299–311 309
ignition loss (Li¼91%), the m value was as large as 0.90.This indicates that the K0OC of peat is more strongly affectedby OCR than that of inorganic clay. Furthermore, it wasfound that the m value increased linearly with increases in Li
(see Fig. 17), and this relationship can be approximated asfollows:
m¼ 0:005Liþ0:45 ð6Þ
Combined with Eqs. (3), (5) and (6), K0OC can be finallyexpressed as follows, in terms of Li and OCR:
K0OC ¼ ð0:4720:0025LiÞOCRð0:005Liþ0:45Þ ð7Þ
Considering heterogeneity in the peat layer, Eq. (7) isvery useful in practice because it consists of relativelysimple and robust parameters of Li and OCR. The test
Depth(m) Soil type
2.7Peat
4.2 Organic clay5.3 Peat
8.8Fine sand
20.3
Clay
22.0 Silt/Fine sand
0
5
10
15
20
25
0 5 10
KD
Dep
th (
m)
Depth(m) Soil type
2.1
Peat
2.6 Organic clay
3.4Clay
3.9 Fine sand 4.3 Sandy clay4.7 Clay5.2 Organic clay
6.2Peat
6.9 Organic clay
7.5 Fine sand
0
1
2
3
4
5
6
7
8
0 5 10
KD
Dep
th (
m)
Fig. 20. The depth distribution of K0 and K0D
results in this study are summarized in Table 3. The Wn, Li
and f0 values for peat and organic clay shown inTable 3 are within the range of previous data obtained inHokkaido region (JGS, 1990).
5.3. K0 obtained from DMT
For heterogeneous materials such as peat, a simplein situ test would be the most preferable method since itdoes not require soil samples whose properties are sig-nificantly changed vertically and horizontally. The DMTseems an effective method for estimating the K0 value ofpeat ground because of a simple and convenient in situ testmethod. In this study, a method for estimating the K0
value from DMT was examined. As mentioned earlier,
0.0 0.5 1.0 1.5
K 0
Iwasaki (1999)Marchetti (1980)Proposed Eq.(11)Lab test
0.0 0.5 1.0 1.5
K0
Iwasaki (1999)Marchetti (1980)Proposed Eq. (11)Lab test
MT: (a) Shinotsu site and (b) Tsuruno site.

H. Hayashi et al. / Soils and Foundations 52 (2012) 299–311310
KD was an index obtained by DMT, and using KD, severalequations have been proposed to estimate K0, as follows(Eq. (8)—Marchetti, 1980; Eq. (9)—Iwasaki, 1999):
K0DMT ¼ ðKD=1:5Þ0:47�0:6 ð8Þ
K0DMT ¼ 0:29K0:57D ð9Þ
where K0DMT is estimated K0 value using DMT.Fig. 18 shows the relationship between KD and K0 obtained
from the K0-consolidation tests in a log–log plot. Themeasured trend in the relationship between KD and K0 forpeat layers is very different from the lines obtained usingMarchetti’s and Iwasaki’s equations, especially in small KD.The best fitted line for the peat layer is the following equation:
K0DMT ¼ 0:5K0:22D ð10Þ
To verify the applicability of Eq. (10), the relationshipbetween the K0DMT estimated by Eq. (10) and the K0 valuesfrom K0-consolidation tests is shown in Fig. 19. The ratios ofK0 to K0DMT are approximately in the range of 0.8–1.3.Hayashi and Nishimoto (2006) reported that the ratios of K0
to K0DMT estimated by Marchetti’s and Iwasaki’s equationsfor clay layers in Hokkaido are approximately 0.6–1.2. Theseresults show that the applicability of Eq. (10) for peat andorganic clay layers is similar to that of Marchetti’s andIwasaki’s equations for clay.
Fig. 20 shows a comparison of the estimated K0 values byDMT using different equations including the proposed onein this paper, with obtained K0 values from K0-consolida-tion tests, at the Shinotsu and the Tsuruno sites. Theapplicability in K0 estimated by Marchetti’s and Iwasaki’sequations for inorganic clay is relatively good. However,large scatters are observed in the relationship betweenestimated K0DMT and K0 for the peat and organic claylayers. Especially when the KD is very low (KD¼0.07–0.18),the estimates become increasingly inaccurate. This is parti-cularly true where the points show the data at the Tsurunosite: the K0DMT estimated by Marchetti’s equation presentsa negative value. For peat and organic clay layers, Eq. (10)provides much more accurate K0 values.
6. Conclusions
The value of K0 for peat and organic clay was obtainedusing triaxial testing apparatus and a method for estimat-ing K0 was proposed in terms of simple soil parameters:OCR and the ignition loss. A flat dilatometer test was alsoperformed and a new correlation of K0 with KD wasestablished. The main results of this study are summarizedbelow:
(1)
The K0NC for peat and organic clay under the normallyconsolidated state are smaller than that for usualinorganic soils, and the K0NC decreases linearly withincreases in the ignition loss (Li). This relationship isdescribed by K0NC¼0.47–0.0025Li (%).(2)
The peat layer has a tendency to be overconsolidated dueto the seasonal changes in groundwater level. Further-more, the K0OC value for peat is strongly affected by thecalculated lateral displacements by elasto-plastic FEanalysis. Therefore, it is necessary to carefully examinethe relationship between OCR and K0 value under in-situstress to determine the K0 value for peat ground.(3)
The K0 of peat and organic clay are dependent onstress history and can be expressed by a function ofOCR, as indicated in K0OC¼K0NCOCRm.(4)
The K0 value for peat and organic clay layers dependsmore strongly on OCR than that of inorganic clay. Them value, which is the power on OCR, increases linearlywith increases in Li. This relationship is described bym¼0.005Li (%)þ0.45.(5)
When using DMT to estimate the K0 of peat andorganic clay layers, K0DMT¼0.5KD0.22 shows higherapplicability than the conventional equations.
References
Asaoka, A., Nakano, M., Noda, T., 2000. Superloading yield surface
concept for highly saturated soil behavior. Soils and Foundations
40 (2), 99–110.
Civil Engineering Research Institute of Hokkaido, 2002. Manual on
Countermeasures for Peat Ground, pp. 4–5 (in Japanese).
Edil, J.B., Dhowian, A.W., 1981. At-rest lateral pressure of peat soils.
Journal of the Geotechnical Engineering Division, ASCE 107 (GT2),
201–220.
Fujikawa, T., Ogawa, S., Fukuda, M., 1983. Pore water pressure and K0
of clay and peat during consolidation state. In: Proceedings of the
43rd Annual Conference, vol. 3, JSCE, pp. 515–516 (in Japanese).
Futatsukawa, K., Kikuchi, J., 1988. Countermeasure and settlement
properties of peat land in Yonesato of Sapporo. Technical Report
of the Annual Meeting of the Hokkaido Branch, vol. 28, JGS,
pp. 191–200 (in Japanese).
Hayashi, H., Nishikawa, J., Odajima, H., Mitachi, T., Fukuda, F., 1994.
Deformation analysis of peat ground with Cam clay model. In:
Proceedings of the International Symposium on Pre-failure Deforma-
tion Characteristics of Geomaterials, Sapporo, vol. 1, pp. 575–581.
Hayashi, H., Nishimoto, S., 2006. Estimation of K0 for peaty soft ground
using flat dilatometer. In: Proceedings of the 61st Annual Conference,
vol. 3, JSCE, pp. 347–348 (in Japanese).
Hayashi, H., Mitachi, T., Tanaka, H., Nishimoto, S., 2007. Determina-
tion procedure of soil parameters for elasto-plastic FE analysis of peat
ground. In: Proceedings of 13th Asian Regional Conference on
SMGE, vol. 1, pp. 145–148.
Hayashi, H., Mitachi, T., Nishimoto, S., 2008. Evaluation on permeability
of peat using in-situ permeability test and oedmeter test. Journal of
Geotechnical Engineering, JSCE 64 (3), 495–504 in Japanese.
Hamouche, K.K., Leroueil, S., Roy, M., Lutenegger, A.J., 1995. In-situ
evaluation of K0 in eastern Canada clays. Canadian Geotechnical
Journal 32, 677–689.
Hashiguchi, K., Chen, Z.P., 1998. Elastoplastic constitutive equation of
soils with the subloading surface and the rotational hardening.
International Journal for Numerical and Analytical Method in
Geomechanics 22, 197–227.
Hokkaido Branch of JGS, 2002. Settlement of Peat Ground in Hokkaido
and Its Countermeasures, pp. 4–5 (in Japanese).
Iwasaki, K., 1999. Evaluation of lateral earth pressure at rest of cohesive soils
using flat dilatometer. In: Proceedings of the 30th Japan National
Conference on Geotechnical Engineering, JGS, pp. 271–272 (in Japanese).

H. Hayashi et al. / Soils and Foundations 52 (2012) 299–311 311
Jaky, J., 1948. Pressure in silos. In: Proceedings of the 2nd International
Conference on SMGE, vol. 1, pp. 103–109.
Japanese Geotechnical Society, 1990. Engineering of Highly Organic Soil.
pp. 158–162 (in Japanese).
Japanese Geotechnical Society, 2000. Japanese Standards for Test
Methods—Standards and Explanations (in Japanese).
Kawano, K., Yamaguchi H., Ohira, Y., 1986. K0 of peat. In: Proceedings
of the 41st Annual Conference, vol. 3, JSCE, pp. 477–478 (in
Japanese).
Marchetti, S., 1980. In-situ tests by flat dilatometer. Journal of the
Geotechnical Engineering Division, ASCE 106 (GT3), 229–321.
Mesri, G., Ajlouni, M., 2007. Engineering properties of fibrous peats.
Journal of the Geotechnical and Geoenvironmental Engineering,
ASCE 133 (7), 850–866.
Mitachi, T., Fujiwara, Y., 1986. Consolidated undrained triaxial shear
behavior of peat. In: Bulletin of the Faculty of Engineering, Hokkaido
University, vol. 129, pp. 1–14 (in Japanese).
Mitachi, T., Yamazoe, N., Hayashi, H., Ogino, T., 2010. Applicability of
several constitutive models and methods of deformation analysis on
peaty soft ground. Journal of Geotechnical Engineering, JSCE 66 (1),
1–20 (in Japanese).
Miyakawa, I., Shibata, T., Takano, T., 1974. The strength characteristics
of organic soils using K0-consolidation. In: Proceedings of Annual
Meeting of Tohoku Branch, JSCE, pp. 44–46 (in Japanese).
Mizuno, K., Tsuchida, T., Kobayashi, M., Watabe, Y., 2007.
New constitutive equation of clay and the prediction of horizontal
deformations of large scale embankments. Journal of Geotechnical
Engineering, JSCE 63 (4), 936–953 (in Japanese).
Nakayama, M., Yamaguchi, H., Ohira, Y., 1989. Consideration on test
method for ignition loss of soils (part 1). In: Proceedings of the 44th
Annual Conference, vol. 3, JSCE, pp. 864–865 (in Japanese).
Noto, S., 1991. Peat Ground Engineering. Gihodo-shuppan Co., Ltd.,
Tokyo, pp. 4–5 (in Japanese).
Oda, Y., Mitachi, T., 1992. Triaxial K0-consolidation test on saturated
clay. Journal of Geotechnical Engineering, JSCE 448/III-19, 45–52.
Roscoe, K.H., Schofield, A.N., Thurairajah, A., 1963. Yielding of clays in
states wetter than critical. Geotechnique 13 (3), 221–240.
Roscoe, K.H., Burland, J.B., 1968. On the Generalized Stress–Strain
Behavior of ‘wet’ Clay, Engineering Plasticity. Cambridge University
Press, pp. 535–609.
Schmidt, B., 1966. Discussion of earth pressures at rest related to stress
history. Canadian Geotechnical Journal 3, 239–242.
Schofield, A.N., Wroth, C.P., 1968. Critical State Soil Mechanics.
McGraw-Hill, London.
Sekiguchi, H., Ohta, H., 1977. Induced anisotropy and time dependency
of clay. In: Proceedings of 9th International Conference on SMFE,
vol. 1, pp. 229–239.
Watabe, Y., Tanaka, M., Tanaka, H., Tsuchida, T., 2003. K0-consolida-
tion in a triaxial cell and evaluation of in-situ K0 for marine clays with
various characteristics. Soils and Foundations 43 (1), 1–20.
Yamazoe, N., Mitachi, T., 2007. Finite deformation elasto-plastic FE
analysis on the peat ground under vacuum surcharge preloading. Journal
of Geotechnical Engineering, JSCE 63 (4), 1113–1131 (in Japanese).