cognitive and motivational biases in decision and...
TRANSCRIPT

Risk Analysis, Vol. 35, No. 7, 2015 DOI: 10.1111/risa.12360
Cognitive and Motivational Biases in Decision andRisk Analysis
Gilberto Montibeller1 and Detlof von Winterfeldt2,∗
Behavioral decision research has demonstrated that judgments and decisions of ordinary peo-ple and experts are subject to numerous biases. Decision and risk analysis were designed toimprove judgments and decisions and to overcome many of these biases. However, wheneliciting model components and parameters from decisionmakers or experts, analysts oftenface the very biases they are trying to help overcome. When these inputs are biased theycan seriously reduce the quality of the model and resulting analysis. Some of these biasesare due to faulty cognitive processes; some are due to motivations for preferred analysisoutcomes. This article identifies the cognitive and motivational biases that are relevant fordecision and risk analysis because they can distort analysis inputs and are difficult to correct.We also review and provide guidance about the existing debiasing techniques to overcomethese biases. In addition, we describe some biases that are less relevant because they can becorrected by using logic or decomposing the elicitation task. We conclude the article with anagenda for future research.
KEY WORDS: Cognitive biases; decision analysis; decision modeling; motivational biases; risk analysis
1. INTRODUCTION
Since Tversky and Kahneman’s(1) seminal paper,behavioral decision researchers have identified alarge number of biases in human judgment anddecision making, each showing a deviation from anormative rule of probability or utility theory. Mostbehavioral research addresses cognitive biases—faulty mental processes that lead judgments anddecisions to violate commonly accepted norma-tive principles. Equally important, but much lessstudied, are motivational biases, which include con-scious or subconscious distortions of judgments and
1School of Business and Economics, Loughborough University,LE11 3TU, Loughborough, Leicestershire, UK.
2Daniel Epstein Department of Industrial and Systems Engineer-ing, Viterbi School of Engineering, University of Southern Cali-fornia, Los Angeles, CA 90089, USA.
∗Address correspondence to Detlof von Winterfeldt, DanielEpstein Department of Industrial and Systems Engineering,Viterbi School of Engineering, University of Southern California,Los Angeles, CA 90089, USA; [email protected].
decisions because of self-interest, social pressures, ororganizational context.
Some decision and risk analysts use the exis-tence of these biases to argue for the use of model-ing and analysis tools because these tools can correcthuman biases and errors in decision making. How-ever, experts and decisionmakers need to providejudgments in risk and decision modeling, thus ana-lysts must worry about biases that may distort the in-puts into the very models that are supposed to correctthem. For example, when using expert judgments toconstruct a probability distribution as an input to arisk analysis model, one has to worry about the well-known overconfidence bias. Similarly, when obtain-ing expert judgments as inputs to estimate possibleconsequences of decision alternatives, one has to beconcerned with the self-interest of experts, who mayhave a stake in the outcome of the analysis.
In this article, we focus on biases that are rele-vant for decision and risk analysis because they cansignificantly distort the results of an analysis and are
1230 0272-4332/15/0100-1230$22.00/1 C© 2015 Society for Risk Analysis

Biases in Decision and Risk Analysis 1231
difficult to correct. Examples are the overconfidencebias when eliciting probability distributions from ex-perts in risk analysis, or the equal weighting biaswhen decisionmakers assign weights to objectives inmulticriteria decision analysis. In contrast, there aremany biases that are less relevant because they caneasily be corrected in the usual tasks of eliciting in-puts for decision and risk analysis. Examples are thebase rates neglect bias, which can be avoided by elic-iting base rates separately from likelihoods, and thenonregressiveness bias, which can be avoided by elic-iting means, standard deviations, and correlations in-stead of conditional estimates.
Despite the relevance of the topic of biases forrisk and decision analysis modeling, there are fewarticles that cover the topic from the perspectiveof a decision or risk analyst: Meyer and Booker(2)
provide an early taxonomy of biases in expert elic-itation, which included cognitive and group pres-sure biases; von Winterfeldt(3) identified several cog-nitive biases when discussing the implications ofbehavioral research for decision analysis; Weberand Borcherding(4) examined biases in multiattributeweight assessment; Morton and Fasolo(5) reviewedthe implications of biases for multicriteria decisionanalysis modeling; and Fasolo et al.(6) for resource al-location models. Larrick(7) discusses motivational is-sues related to decision-making performance.
This article includes several novel treatments ofthe bias literature. First, it includes motivational bi-ases, which have largely been ignored by behavioraldecision researchers, even though they are importantand pervasive in decision and risk analysis. Second,we view biases from the perspective of an analystconcerned with possible distortions of judgments re-quired for an analysis. Third, we separate biases intothose that are difficult to correct versus those that areeasy to correct. Fourth, we provide guidance on debi-asing techniques, which includes not only the behav-ioral literature on debiasing but also the growing setof “best practices” in the decision and risk analysisfield.
The article has the following structure. The nextsection defines the concept of bias and spells outsome key assumptions and inclusion criteria we usedin the article. The subsequent three sections describethe cognitive and motivational biases, as well as debi-asing tools, present in each step of uncertainty, value,and choice modeling. The final section concludes thearticle and suggests a research agenda for biases inrisk and decision analysis.
2. BIASES AND DEBIASING
The focus of this article is on biases that canoccur when eliciting inputs to a risk or decisionanalysis from experts or decisionmakers. Whenthese inputs are biased they can seriously reduce thequality of the model and resulting analysis. We showin this article how biases can be reduced or evenremoved through decomposition of the elicitationtask, training, and tools. Larrick(7) adopts a similar“engineering” approach to “fixing” biases in decisionand risk analysis. We define more precisely what wemean by cognitive and motivational biases, as wellas the concept of debiasing, next.
2.1. Cognitive and Motivational Biases
A cognitive bias is a systematic discrepancybetween the “correct” answer in a judgmentaltask, given by a formal normative rule, and thedecisionmaker’s or expert’s actual answer to such atask.(8) There is a vast literature on cognitive biasesand excellent compilations of papers are providedin Kahneman et al.(9) and Gilovich et al.(10) In thisarticle we are focusing mainly on individual biases,thus assuming that we have a single decisionmakeror expert, but recognizing that some of these biasesmay be alleviated, or exacerbated, at group level.(11)
We define motivational biases as those in whichjudgments are influenced by the desirability or un-desirability of events, consequences, outcomes, orchoices (see also Kunda,(12) von Winterfeldt,(3) andMolden and Higgins(13)). An example of a motiva-tional bias is the deliberate attempt of experts toprovide optimistic forecasts for a preferred action oroutcome. Another example is the underestimationof the costs of a project to provide more competi-tive bids. Motivational biases do not always have tobe conscious. For example, estimates of the time ittakes to complete a software project are often overlyoptimistic(14) even when there is no outside pressureor value in misrepresenting the actual time. We fo-cus here on outcome motivated biases, as they matterin several modeling steps, but recognize that lack ofmotivation to provide accurate judgments is also anissue in the elicitation of judgments.(13)
2.2. Biases that are Difficult to Correct
We distinguish between biases in decision andrisk analysis that are difficult to correct versus biasesthat are easy to correct. Biases that are difficult to

1232 Montibeller and von Winterfeldt
correct tend to be resistant to logic, decomposition,or the use of training and tools. The overconfidencebias,(15,16) anchoring and insufficient adjustment,(1)
and the equalizing bias(17) are examples. Logic anddecomposition are the most common ways to elim-inate biases that are easy to correct. Examples arethe conjunction fallacy,(18) which can be corrected bydemonstrating the probability logic, and the neglectof base rates,(19,20) which can be fixed by eliciting baserates and conditional probabilities separately. Thisdistinction holds only for cognitive biases—in con-trast, all motivational biases in decision and risk anal-ysis are hard to correct.
2.3. Debiasing
Debiasing refers to attempts to eliminate, or atleast reduce, cognitive or motivational biases. Thenarrow literature on debiasing has focused on cogni-tive biases; early attempts showed the limited efficacyof debiasing tools,(21–23) i.e., to which degree they re-duced the bias and brought judgments close to therequired normative standard, but more recent articleare slightly more optimistic about overcoming biases,particularly with the use of adequate tools.(7,24,25)
The taxonomy suggested by Arkes(24) is use-ful for considering biases and debiasing techniques.It classifies biases by their psychological origin:strategy-based (SB) errors, which occur when de-cisionmakers use a suboptimal cognitive strategy;association-based (AB) errors, which are a con-sequence of automatic mental associations; andpsychophysically-based (PB) errors, which resultfrom incorrect mappings between physical stimuliand psychological responses. The use of analyticalmodels is an effective correction of errors related toSB type, so we would expect that when SB type er-rors occur in decision and risk analysis they can eas-ily be corrected. Correcting AB and PB type errors ismore difficult.
In addition to the behavioral literature on bi-ases and debiasing, we also draw on best practicesdeveloped in decision and risk analysis. Some ofthese have been subjected to experimental tests (e.g.,Seaver et al.(26) and Abbas et al.(27) show how theoverconfidence bias can be reduced by choice of anappropriate elicitation technique), others have beendescribed in applied research article (e.g., Dillonet al.(28) describe attempts to reduce the anchor-ing and overconfidence biases of engineering costestimators).
2.4. An Overview of Biases andDebiasing Techniques
Tables I–III provide an overview of biases anddebiasing techniques. These tables were created as aresult of a review of the bias literature, including pre-vious tables and lists of biases in Refs. 8 and 29–31.The tables cover cognitive biases that are difficult tocorrect (Table I), motivational biases that are diffi-cult to correct (Table II), and cognitive biases thatare easy to correct (Table III). Columns 1 and 2 ofTables I and II describe the biases. Column 3 indi-cates where they occur in decision and risk analysis(the notation of tasks, UMi, VMi, and CMi, refer tothe specific modeling and elicitation tasks in whichthese biases occur in utility modeling, value mod-eling, and choice modeling, respectively). Column4 provides a list of the major debiasing techniques.Table III has a similar structure. Columns 1 and 2of Table III describe several biases that are easy tocorrect in decision and risk analysis. Column 3 inthe same table indicates how these biases can becorrected.
Tables I and II are self-explanatory. A decisionand risk analyst can read them by beginning witha particular bias (columns 1 and 2), looking up (incolumn 3) how they affect particular tasks, and deter-mining (in column 4) how to reduce the bias in thattask. Table III deserves a bit more explanation. Thesource of the biases and errors in Table III are SBerrors, as Arkes(24) calls them. Because they are SBerrors, experts and decisionmakers can easily be con-vinced that they made a mistake and they understandthe logic and are willing to use the correct model.The classical example is the conjunction fallacy. Fewsubjects in experimental studies insist on assigning ahigher probability to the conjunction of two eventsthan to each of the separate events.(18) Once theyagree that they made an error, it is easy to con-vince them that the correct model is to us P(A�B) =P(B|A) P(A) and, if required, elicit the correspond-ing probabilities from them. Other biases in Table IIIare corrected by the use of appropriate tools. Forexample, the sunk cost bias can be eliminated bydefining all outcomes in a decision problem asfuture outcomes, ignoring past costs. Ambiguityaversion can be addressed in decision analysis bydeveloping explicit probability distributions for am-biguous events or variables. This is not to say that de-cisionmakers will not feel the “tug” of sunk costs orambiguity aversion, but the tools of decision and riskanalysis force them to eliminate these considerations.

Biases in Decision and Risk Analysis 1233
Table I. Cognitive Biases in Decision and Risk Analysis that are Difficult to Correct
Evidence of Bias in Decisionand Risk Analysis with
Bias Description Modeling Tasks Affected Debiasing Techniques
Anchoring(PB errors)
The bias occurs when theestimation of a numericalvalue is based on an initialvalue (anchor), which is theninsufficiently adjusted toprovide the final answer.(1)
Evidence: Several areas, such asestimation tasks, pricingdecisions, and also innegotiations.(32,33) Tasks: UM2,UM3, VM3, CM1, CM3, CM4
•Avoid anchors• Provide multiple and
counteranchors• Use different experts who
use different anchors
Availability/ease ofrecall (AB errors)
The bias occurs when theprobability of an event that iseasily recalled isoverstated.(34,35)
Evidence: Simple frequencyestimates;(34,36) frequency oflethal events;(37) rare events thatare anchored on recent examples.Tasks: UM1, UM2, VM1, CM1,CM2, CM3
• Conduct probability training• Provide counterexamples• Provide statistics
Certainty effect(PB errors)
People prefer sure things togambles with similar expectedutilities; they discount theutility of sure thingsdramatically when they are nolonger certain.(38,39)
Evidence: Probability- versuscertainty-equivalent methodsproduce different results.(40,41)
Task: VM3
•Avoid sure things in utilityelicitation
• Separate value and utilityelicitation
• Explore relative risk attitudeparametrically
Equalizing bias(PB errors)
This bias occurs whendecisionmakers allocatesimilar weights to allobjectives(17) or similarprobabilities to allevents.(42,43)
Evidence: Elicitation of probabilitiesin decision trees(42,43) andelicitation of weights in valuetrees.(17) Tasks: UM2, VM4, CM3
• Rank events or objectivesfirst, then assign ratioweights
• Elicit weights or probabilitieshierarchically
Gain-loss bias(PB errors)
This bias occurs as alternativedescriptions of a choice and itsoutcomes(44) either as gains oras losses and may lead todifferent answers(44–46) (seealso status quo bias below).
Evidence: Several areas involvingchoices of risky options,evaluation of a single option onan attribute, and the wayconsequences are described topromote a choice.(46,47) Tasks:VM2, VM3, VM4, CM3
• Clearly identify the statusquo (SQ)
• For value functions, expressvalues as marginal changesfrom SQ
• For utility functions, elicitutilities for gains and lossesseparately
Myopic problemrepresentation(AB errors)
This bias occurs when anoversimplified problemrepresentation is adopted(48)
based on an incompletemental model of the decisionproblem.(49,50)
Evidence: focus on a small numberof alternatives,(51,52) a smallnumber of objectives,(53,54) or asingle future state of the world.(55)
See also Payne et al.(48) Tasks:UM1, VM1, CM1, CM2
• Explicitly encourage to thinkabout more objectives, newalternatives, and otherpossible states of the future
Omission ofimportant variables(AB errors)
The bias occurs when animportant variable isoverlooked.(56)
Evidence: Definition ofobjectives;(53,54) identification ofdecision alternatives;(57,58) andhypothesis generation.(59,60)
Tasks: UM1, VM1, CM1, CM2
• Prompt for alternatives andobjectives
•Ask for extreme or unusualscenarios
• Use group elicitationtechniques
Overconfidence(AB errors)
The bias(15,16) occurs when thedecisionmakers provideestimates for a givenparameter that are above theactual performance(overestimation) or when therange of variation theyprovide is too narrow(overprecision).(61)
Evidence: Widespread occurrence inquantitative estimates, such as indefense, legal, financial, andengineering decisions.(61,62) Alsopresent in judgments about thecompleteness of a hypothesisset.(59,63) Tasks: UM1, UM2,UM3, CM2, CM3, CM4
• Provide probability training• Start with extreme estimates
(low and high), avoid centraltendency anchors
• Use counterfactuals tochallenge extremes
• Use fixed value instead offixed probability elicitations
(Continued)

1234 Montibeller and von Winterfeldt
Table I. (Continued)
Evidence of Bias in Decisionand Risk Analysis with
Bias Description Modeling Tasks Affected Debiasing Techniques
Proxy bias(PB errors)
Proxy attributes receive largerweights than the respectivefundamental objectives.(71)
Evidence: Elicitation of weights inmultiattribute utility and valuemeasurement.(71) Tasks: VM2,VM4
•Avoid proxy attributes• Build models relating proxies
and fundamental objectivesand provide weights forfundamental objectives
Range insensitivitybias (PB errors)
Weights of objectives are notproperly adjusted to changesin the range of attributes.(68,72)
Evidence: Elicitation of weights inmultiattribute utility and valuemeasurement.(68,72) Task: VM4
•Make attribute rangesexplicit and use swingweighting procedures
• Use trade-off or pricing-outprocedures
• Use multiple elicitationprocedures and cross-checks
Scaling (PB errors) A family of stimulus-responsebiases(73,74) that comprises:contraction bias, logarithmicresponse bias, rangeequalizing bias, centering bias,and equal frequency bias.
Evidence: Assessment of physicaland social measurements ofvarious kinds.(73,74) Tasks:UM2,VM2, CM4
• Develop scales that matchstimuli and responses, beingaware of these biases
• Choose appropriate scalingtechniques for the task athand
Splitting biases(PB errors)
This bias occurs when the waythe objectives are grouped ina value tree affects theirweights;(64–66) or the way afault tree is pruned affects theprobabilities placed on theremaining branches.
Evidence: Elicitation of weights inmulticriteria models.(64,66–69)
Elicitation of probabilities in faulttrees.(59,70) Tasks: VM4, CM3
•Avoid splits with largeprobability or weight ratios
• Use hierarchical estimationof weights or probabilities
• Use ratio judgments insteadof direct estimation ordistribution of points
Note: Type of modeling: VM, value modeling; UM, uncertainty modeling; CM, choice modeling.Main source of bias: AB, association-based errors; PB, psychophysically-based errors.(24)
In the following sections, we will ignore the biases inTable III and focus instead on those in Tables Iand II.
The layout of Tables I and II makes it easy forthose who want to study the effects of a specific biason the decision and risk analysis tasks. However,for a practicing decision and risk analyst, it is moreinstructive to examine biases and debiasing tech-niques from the perspective of the task at hand—e.g.,eliciting probability distributions from experts whenmodeling uncertainties or obtaining weights for crite-ria from decisionmakers when modeling values. Thefollowing sections are therefore structured by the de-cision and risk analysis tasks: modeling uncertainty,value, and choice; and the specific judgmental sub-tasks. In each subsection, we will first provide anoverview of the task and subtasks and then reviewthe applicable biases and debiasing techniques.
3. BIASES IN MODELING UNCERTAINTY
A major purpose of risk analysis is to charac-terize the uncertainty about the variable of interest(target variable) by defining its probability distribu-tion. This is accomplished by decomposing the targetvariable into component variables and events, whosedistributions are defined and then aggregated (fordetails, see Morgan and Henrion,(100) Bedford andCooke,(101) and Lawrence et al.(102)). Fig. 1 shows aschematic overview of the judgmental subtasks whenmodeling uncertainty: the definition of target vari-able, component variables, and events (UM1); theassessment of probabilities for component variablesand conditioning events by experts (UM2); and theaggregation of probabilities from each expert (UM3).Table IV provides an overview of the biases and de-biasing techniques relevant for these tasks, which wedetail next.

Biases in Decision and Risk Analysis 1235
Table II. Motivational Biases in Decision and Risk Analysis
Evidence of Bias in Decision andRisk Analysis with Modeling
Bias Description Tasks Affected Debiasing Techniques
Affect influenced(AB errors)
This bias occurs when there isan emotional predispositionfor, or against, a specificoutcome or option that taintsjudgments.(75,76)
Evidence: Several studies that assess therole of affect causing an inverseperceived relationship between positiveand negative consequences related topandemics and human-caused hazards,etc. (see Siegrist and Sutterlin(77) fordetails). There is also evidence thataffect influences the estimation ofprobabilities of events.(78) Tasks: UM2,VM3, VM4, CM1, CM3, CM4
•Avoid loaded descriptions ofconsequences in theattributes
• Cross-check judgments withalternative elicitationprotocols when elicitingvalue functions, weights, andprobabilities
•Use multiple experts withalternative points of view
Confirmation(AB errors)
The bias occurs when there is adesire to confirm one’s belief,leading to unconsciousselectivity in the acquisitionand use of evidence.(79)
Evidence: Several experimental settings,such as in information gathering,selection tasks, evidence updating, andown-judgment evaluation.(79,80) Also inreal-world contexts, such as medicaldiagnostics, judicial reasoning, andscientific thinking.(79) Tasks: UM1, CM2,CM3
•Use multiple experts withdifferent points of viewabout hypotheses
• Challenge probabilityassessments withcounterfactuals
• Probe for evidence foralternative hypotheses
Desirability of apositive event orconsequence(AB errors)
The bias occurs when thedesirability of an outcomeleads to an increase in theextent to which it is expectedto occur.(81) It is also called“wishful thinking”(82) or“optimism bias.”(83)
Evidence: Prediction of outcomes in gamesof chance;(81) impact on estimates ofprobabilities of future outcomes inexpert foresight;(84,85) estimates ofcosts(28) and duration(14) in projects; aswell as some possible effect in sporttournaments.(86) Tasks: UM2, UM3,CM3, CM4
•Use multiple experts withalternative points of view
•Use scoring rule and placehypothetical bets against thedesired event orconsequence
•Use decomposition andrealistic assessment ofpartial probabilities
Undesirability of anegative event orconsequence(AB errors)
This bias occurs when there is adesire to be cautious,prudent, or conservative inestimates that may be relatedto harmfulconsequences.(87,88)
Evidence: Most evidence related toprobabilities of life events;(87,88) but alsoin long-term estimations of future eventsin expert foresight(84) and estimates ofrisks and benefits about riskytechnologies;(89) some risk assessmentsthat are intentionally biased toward“conservative” estimates in each step (asdiscussed in the recent report by theInstitute of Medicine(90)). Tasks: UM2,UM3, CM3, CM4
•Use multiple experts withalternatives points of view
•Use scoring rules and placehypothetical bets in favor ofthe undesired event orconsequence
•Use decomposition andrealistic assessment ofpartial probabilities toestimate the eventprobability
Desirability ofoptions/choice(AB errors)
This bias leads to over- orunderestimating probabilities,consequences, values,or weights in a direction thatfavors a desired alternative.(3)
Evidence: Only anecdotal evidence, such asthe biased estimates of probabilities andimpacts in risk assessment by Defra.(91)
Tasks: UM2, VM3, VM4, CM1, CM3,CM4
•Use analysis with multiplestakeholders providingdifferent value perspectives
•Use multiple experts withdifferent opinions
•Use incentives and adequatelevels of accountability
Note: Type of modeling: VM, value modeling; UM, uncertainty modeling; CM, choice modeling.Main source of bias: AB, association-based errors; PB, psychophysically-based errors.(24)

1236 Montibeller and von Winterfeldt
Table III. Cognitive Biases in Decision and Risk Analysis that are Easy to Correct
How to Correct the Bias in DecisionBias Description and Risk Analysis
Ambiguity aversion/Ellsberg’sparadox (SB errors)
People tend to prefer gambles with explicitlystated probabilities over gambles withdiffuse or unspecified probabilities.(92)
•Model and quantify ambiguity as probabilitydistribution•Model as parametric uncertainty (e.g., over
the bias parameter of a Bernoulii process) orsecondary probability distribution
Base rate fallacy/neglect (SBerrors)
People tend to ignore base rates whenmaking probability judgments and relyinstead on specific individuatinginformation.(19,20)
• Split the task into an assessment of the baserates for the events and the likelihood orlikelihood ratio of the data, given the events
Conjunction fallacy (SBerrors)
The conjunction (joint occurrence) of twoevents is judged to be more likely than theconstituent event, especially if theprobability judgment is based on a referencecase that is similar to the conjunction.(18)
• Demonstrate the logic of joint probabilitieswith Venn diagrams•Assess the probability of the two events
separately and then assess conditionalprobability of one event, given the otherevent
Conservatism (SB errors) In some Bayesian estimation tasks, peopledo not sufficiently revise their probabilitiesafter receiving information about the eventsunder consideration.(93,94)
• Decompose the task into an estimation ofprior probabilities (odds) and likelihoods(ratios)
Endowment effect/status quobias/sunk cost (SB errors)
People ask to get paid more for an item theyown than they are willing to pay for it whenthey do not own it; their disutility for losingis greater than their utility for gaining thesame amount;(95) people consider sunk costwhen making prospective decisions.(96)
• Show the logic that maximum buying pricesand minimum selling prices should converge• Show the logic of symmetry of gains and
losses• Do not include sunk cost in analysis
Gambler’s fallacy/hot hand(SB errors)
People often think that irrelevantinformation about the past matters to predictfuture events, for example, that, whentossing a coin, it is more likely that “heads”comes up after a series of “tails”; for details,see Bar-Eli et al.(97)
• Explain of the probability logic and theindependence of events
Insensitivity to sample size (SBerrors)
According to the laws of probability,extreme averages or proportions are lesslikely in large samples than in small samples.People tend to ignore sample size andconsider extremes equally likely in small andlarge samples.(98)
• Use statistics to determine the probability ofextreme outcomes in samples of varying sizes• Use the sample data and show how and why
extreme statistics are logically less likely forlarger samples
Nonregressive prediction (SBerrors)
When two variables X and Y are imperfectlycorrelated, the conditional estimate of Y,given a specific value of X, should beregressed toward the mean of Y.(19)
• Use statistics directly• If data are insufficient, decompose the task
into an estimate of the standard deviationsand the correlation and then calculate theregression line
Subadditivity/superadditivityof probability (SB errors)
When judging individual subevents, the sumof the probabilities is often systematicallysmaller or larger than the directly estimatedprobability of the total event. This is trueeven for mutually exclusive events; fordetails, see Macchi et al.(99)
• Explain the logic of additivity of mutuallyexclusive events•Also, one can begin by obtaining ratios of the
probabilities of subevents and applying theratios to the probability of the total event
Note: SB, strategy-based errors.(24)

Biases in Decision and Risk Analysis 1237
Fig. 1. Steps in modeling uncertainty. UM1 = Definition of targetvariable, component variables and events; UM2 = Assessment ofprobabilities for component variables and conditioning events byexperts; UM3 = Aggregation of probabilities.
3.1. Definition of Target Variable, ComponentVariables, and Events (UM1)
The first step in uncertainty modeling is to definean exhaustive set of uncertainties U = {U1, U2, . . . ,UM}, i.e., the component events or variables (Fig. 1,step UM1), which describe in full the target vari-able Ut. Research on the generation of componentvariables or events is rather limited, although thereexists some literature on event structuring and hy-pothesis generation (e.g., Fischhoff et al.;(59) seeGettys et al.(103) for further references).
Biases
Both naıve subjects and experts generatea relatively small number of hypotheses, whencompared with an exhaustive set of hypotheses (foran overview, see Thomas et al.(60)). This phenomenonis referred to as an omission of important vari-ables bias.(56) Myopic problem representation is a re-lated bias that results in an incomplete problem de-scription due to oversimplified mental models.(48–50)
The generation of a myopic, often nonexhaustiveset of hypotheses is accompanied by the overcon-fidence bias(15,16) when judging the exhaustivenessof such set.(59,63) Subjects also showed overconfi-dence when presented with a larger set of hypothe-ses versus the hypotheses generated by the subjectsthemselves.(104) Furthermore, the hypotheses gener-ated were the ones with the highest perceived a prioriprobability,(67,105) and the number of hypotheses gen-erated was constrained by working memory capacityand time pressure to generate them. The availabil-ity bias(34,35) and the confirmation bias(79) also in-fluence hypothesis generation and definition, leadingsubjects to generate events and hypotheses that aremore easily recalled and to retain those that supporttheir favored hypothesis.(80)
Debiasing
In addition to promoting precise definitions ofevents and hypotheses,(3) it is common in this stepto use group elicitation(106) and counterfactuals to
Table IV. Uncertainty Modeling Subtasks and Associated Biases
Subtask Biases Debiasing Suggestions
UM1: Definition of target variable andevents
•Availability bias (C)• Confirmation bias (M)•Myopic problem representation
bias (C)•Omission bias (C)•Overconfidence bias (C)
Prompting for missing events and variables;group elicitation; stimulation of creativity.
UM2: Assessment of probabilities •Affect influenced bias (M)•Anchoring bias (C)•Availability bias (C)•Desirability biases (M)• Equalizing bias (C)•Overconfidence bias (C)• Scaling biases (C)
Providing probability training; using multipleexperts, counterfactuals, hypotheticalgambles, and fixed value techniques.
UM3: Aggregation of probabilities •Anchoring bias (C)•Desirability biases (M)•Overconfidence bias (C)
Defining balanced expert groups; mixingindividual-group elicitations; asking forcounterfactuals and hypothetical gambles.
Note: C, Cognitive bias (see Table I for details); M, Motivational bias (see Table II for details).

1238 Montibeller and von Winterfeldt
stimulate creativity and try to reduce the omissionand availability biases. The evidence about the qual-ity of group interaction indicates that nominal groups(where members generate ideas in isolation) outper-form traditional brainstorming groups, in terms ofboth heterogeneity and quality of ideas.(107) Thesebenefits of group interaction can be enhanced by ask-ing the experts to write the hypotheses on post-itsand glue them on a wall, or by using computer soft-ware, which then projects all the hypotheses beinggenerated on a screen.(108) This can be coupled withthe presence of a facilitator to ensure group mem-bers do not suffer from evaluation apprehension andminimize production blocking.(107) Klayman(80) sug-gests some ways of debiasing the confirmation bias,such as using experts who know the specific domainof the phenomenon well, making sure there is a con-crete context for the elicitation, asking for alternativeexplanations, and providing feedback on past esti-mates. MacGregor(109) proposes several useful guide-lines on decomposition, such as decomposing whenthe uncertainty about the target is high, using mul-tiple decomposition approaches to estimate compo-nent values, and relying on multiple estimators foreach component variable.
3.2. Assessment of Probabilities for ComponentVariables and Conditioning Events by Experts(UM2)
Once the component events and variables havebeen defined, a (discrete) probability distributionover events or a (continuous) density function dj
associated with each component variable Uj (j =1, 2, . . . , M) is elicited from the experts (Fig. 1,UM2). (See details about such elicitation proceduresin overviews by Hora(110) and Morgan.(111))
For discrete events, the typical method for elic-iting probabilities is by using the split fractionmethod,(110) which begins with a rank order of therelative likelihoods, followed by ratio assessments,and calculations of probabilities. There are two mainmethods for eliciting continuous probability distri-butions, as discussed by Spetzler and Stael vonHolstein:(112) asking the expert to provide the proba-bility, given a value of the target variable (fixed valuemethods) or, inversely, asking for the value of thetarget variable given a probability (fixed probabil-ity methods). In some cases, hypothetical gambles orscoring rules(8) can be used to motivate experts toprovide truthful answers.
Biases
There is a strong influence of the scalingbiases(73,74) on probability elicitation, for example,the use of a linearly spaced or logarithmic spacedvariable is likely to influence the results.(3) Seaveret al.(26) and Abbas et al.(27) show that the elicitationmethod (fixed value vs. fixed probability) influencesthe results, mainly due to the anchoring bias.(1) Thesame bias also occurs in eliciting probability distri-butions when the expert uses a small set of data tomake the estimates and does not include alternativescenarios.(3,111,112)
The overconfidence bias is a serious problemin eliciting continuous distributions,(21,113,114) as itprevents decisionmakers to consider extreme cases,beyond the defined endpoints of the target vari-able, and leads to excessively narrow ranges.(115,116)
The availability bias also plays an important rolein probability elicitation, as it leads to overstate-ment of probabilities for events that are easilyremembered.(3,110,111) The equalizing bias causesprobability distributions over discrete events to betoo “flat” because subjects appear to begin with anequal probability distribution and make only half-hearted adjustments.(42,43)
Finally, the desirability bias leads to assigninghigher probabilities to events and outcomes that aredesirable,(81) or to assigning lower probabilities tothose that are undesirable.(88) In the former case, wecall it the desirability of a positive event bias, whichoccurs when the desirability of an outcome leads toan increase in the extent to which it is expected tooccur.(81) It is often called “wishful thinking”(82) or“optimism bias.”(83) (A real-world example is pro-vided by Dillon et al.,(28) who report significant costunderestimation for large projects.) In the latter case,we call it the undesirability of a negative event bias,which occurs when there is a desire to be cautious,prudent, or conservative in estimates that may be re-lated to harmful consequences.(87,88) This bias oftenoccurs in environmental risk analyses, which delib-erately use “conservative” models and estimates. Inaddition, the affect heuristic(75,76) may cause what wedenominated as the affect influenced bias, which oc-curs when the outcomes of an event trigger an emo-tional reaction that might cause a misestimation ofits probability of occurrence(78) and the desirabilityof options bias,(3) which may lead experts to under-/overestimate probabilities in a direction that favorspreferred alternatives.

Biases in Decision and Risk Analysis 1239
Debiasing
The elicitation of probabilities is typically pre-ceded by a training session to familiarize experts withthe elicitation protocol and warn them about pos-sible biases, particularly about the overconfidenceand availability biases.(112,117,118) Fischhoff(21) sug-gests tools for debiasing overconfidence, but theywere shown to have limited efficacy in overcomingthe bias. This is not surprising, given that it is an ABerror.(24)
Both Seaver et al.(26) and Abbas et al.(27) showthat the fixed value method produces less overcon-fidence than the commonly used fractile method foreliciting continuous probability distributions. In thefixed value method the experts are given a set of val-ues of the uncertain variable and asked for proba-bilities of the true value falling above or below; inthe fractile method, the experts are given percentiles(e.g., the 75th) and asked for the values of the un-certain variable that represents each percentile (e.g.,“What is the value of the uncertain variables, forwhich the probability of the true value falling be-low it is 75%?”). In addition, alternative assessmentprotocols should be employed to elicit a distribu-tion and cross-check judgments.(8,112,119,120) The useof split fractions, ranking, and ratio assessments re-duce the equalizing bias.
Risk analysts use decomposition, multipleexperts, and the exploration of the extremes ofa target variable (including counterfactuals andalternative scenarios) as ways of trying to reduce theoverconfidence and availability biases.(3,14) Interms of tackling the anchoring bias, Chapmanand Johnson(121) show that prompting assessors toidentify features of the target variable different thanthe anchor, or to consider reasons in conflict with theanchor, are effective in reducing it.
Hypothetical bets and scoring rules(8,119) canreduce motivational biases. For example, after ob-taining a median (50–50) estimate of an uncertainvariable, an expert should be indifferent between twobets with the same reward on either side of the me-dian. Most experts, however, when asked about suchhypothetical bets show a strong preference for oneside or the other and it is then easy to convince themto move the median until they are truly indifferent.
3.3. Aggregation of Probabilities (UM3)
There are two types of aggregation of compo-nent probability judgments: within-individual expert
aggregation is used to calculate the overall eventprobability dTe for each e-th expert (Fig. 1, UM3);across-experts aggregation is used to combine in-dividual probabilities dTe. The first type is purelycomputational and involves no additional judgmen-tal task. The second type can be done mathematicallyor behaviorally, with the latter involving potential bi-ases. (See also the comprehensive reviews on the ag-gregation of probability distributions by Clemen andWinkler(122) and on the social aspects of group fore-casting by Seaver(26) and by Kerr and Tindale.(123))
Biases
There are two main biases in behavioralaggregation: group-overconfidence, caused bygroup polarization;(11) and anchoring to initialestimates(107) or irrelevant information.(11) Grouppolarization also may exacerbate individual biaseswhen the group is trying to reach consensus ona judgment, which are then propagated to thegroup decision-making process,(107,124) including thedesirability of a positive or a negative event biases.
Debiasing
These biases may be alleviated by carefullydesigning the experts’ interaction(125) (which mayrange from several versions of the Delphi method,forced consensus, or free-form discussions) and byusing a facilitator to support the group.(126–128) Forinstance, anchoring across experts may be alleviatedby keeping the expert’s name anonymous, by man-aging the order and the way information is presentedto the group, and by the type of decision rule that isemployed to define the group’s estimate.(123) Over-confidence, which tends to be higher in free-form dis-cussions than in more structured formats,(123) may becounteracted by assembling a diverse group of opin-ions, by guaranteeing procedural justice, and by re-ducing power imbalances among the group members.
A useful protocol for group elicitation of prob-abilities and probability distributions was developedin the course of conducting a major expert elicitationexercise in the context of a nuclear power plant riskanalysis.(118) In a first round of meetings, expertsexchange their views and concerns about a particularrisk issue. They then conduct separate individualstudies and meet again to discuss their approaches(not their specific probability judgments). In thesame meeting their probability distributions are thenindividually elicited. Subsequently, the results of

1240 Montibeller and von Winterfeldt
O
ONO2O1
x1
g1
x2
g2 gN
xN
w1 w2 wN
VM1
VM2
VM3
VM4
...
Fig. 2. Steps in modeling value. VM1 = Definition of Objectives;VM2 = Definition of Attributes; VM3 = Elicitation of Partial Val-ues; VM4 = Elicitation of Attribute Weights.
their elicitations are displayed, disagreements arediscussed, and, if needed, experts are re-elicited.After re-elicitation, the individual probability distri-butions are averaged. There is no requirement forconsensus. The advantage of this protocol over otherprocedures that aim at group agreement(126) is thatit provides a broad spectrum of opinions and coun-teracts individual overconfidence by the breadth ofopinions across experts. The disadvantage is that theresult does not represent a group consensus, whichmay be required or desirable in some situations.
4. MODELING VALUES3
We will limit our discussion in this section tomultiattribute utility models.(130,131) These modelsdecompose the assessment of alternatives or op-tions along multiple criteria or attributes, followedby weighting attributes and calculation of an overallvalue or utility. Typically, experts provide estimatesof the performance of the options on the criteria anddecisionmakers provide attribute weights and singleattribute value or utility functions. Value functionsare elicited when there is little or no risk involved inthe decision and utility functions are used in case ofrisk and uncertainty.(132)
There are four judgment steps and one aggrega-tion step involved in developing a multicriteria mod-els (see also Keeney and Raiffa(130) and Keeney(133)).A schematic overview of the subtasks is provided inFig. 2: the definition of objectives (VM1); the def-inition of an attribute associated with each objec-tive (VM2); the elicitation of a value function for
3An abridged version of this section appeared in the proceedingsof the 48th Hawaiian International Conference on Systems Sci-ence (HICSS).(129)
each attribute (VM3); and the elicitation of attributeweights (VM4). Each step is briefly described below,with a discussion about the most prevalent biases andhow to overcome them. Table V summarizes the bi-ases and debiasing techniques for these steps.
4.1. Definition of Objectives (VM1)
The initial task in any multicriteria decision anal-ysis is the specification of which objectives the deci-sionmakers want to pursue and, therefore, should beused in the evaluation of decision alternatives. Theseobjectives O = (O1, O2, . . . , ON) are typically or-ganized as a value tree(131) as shown in Fig. 2 (stepVM1). They are either directly elicited in interviewswith the decisionmakers, or constructed from multi-ple interviews and general knowledge.(54,134)
Biases
Identifying and structuring objectives rely heav-ily on decisionmakers’ mental models.(135) Researchshows that the myopic problem representation biastends to generate incomplete problem descriptions,due to oversimplified mental models.(48–50)
Following a value-focused thinking princ-iple(133)—a compelling argument that fundamentalobjectives, instead of means objectives, should beemployed in such assessments (see also Baron(136)
and Edvardsson and Hansson(137))—one wouldexpect that defining objectives could be an easytask for decisionmakers. On the contrary, recentevidence(53,54) shows that subjects find it difficult togenerate a comprehensive set of objectives. Thesestudies report a strong omission bias,(56) wheresome important objectives were overlooked bydecisionmakers, often due to an availability bias,in which only some salient objectives are availablein the memory.(53) This omission bias may lead topoor recommendations,(48) as some important conse-quences are completely disregarded in the analysis.The simulation performed by Fry et al.(138) assessedthe impact of omissions of objectives and shows thatit tends to increase with the rise of both the numberof objectives and the number of missing objectives.
Debiasing
There is limited empirical evidence showing howthe omitted variable bias in this context might beavoided, but the general advice is that decisionmak-ers need external probes. Bond et al.(54) found that

Biases in Decision and Risk Analysis 1241
Table V. Value Modeling Subtasks and Associated Biases
Subtasks Biases Debiasing Suggestions
VM1: Definition of objectives •Availability bias (C)•Myopic problem representation
bias (C)•Omission bias (C)
Providing categories; prompting for moreobjectives; stimulating creativity.
VM2: Definition of attributes •Gain-loss bias (C)• Proxy bias (C)• Scaling biases (C)
Using natural scales for attributes; carefulselecting attribute endpoints.
VM3: Elicitation of value or utility functions •Affect influenced bias (M)•Anchoring bias (C)• Certainty effect bias (C)•Desirability of options bias (M)•Gain-loss bias (C)
Separating value and utility modeling;separating assessments of gains and losses;using group procedures.
VM4: Elicitation of attribute weights •Affect influenced bias (M)•Desirability of options bias (M)• Equalizing bias (C)•Gain-loss bias (C)• Proxy bias (C)• Range insensitivity bias (C)• Splitting bias (C)
Using groups to construct value structure;avoiding the use of direct importanceassessments; cross-checking weights withtrade-off and pricing-out methods;avoiding the use of proxy attributes.
Note: C, Cognitive bias (see Table I for details); M, Motivational bias (see Table II for details).
the use of generic categories and the challenge to in-crease the number of objectives generated a more ex-haustive set of objectives. Leon(139) discovered thatvalue-focused thinking helped in eliciting not onlymore objectives, but also objectives that were per-ceived to have better features as evaluation criteria.
From a prescriptive perspective, Keeney(133) sug-gests several probes to help decisionmakers in gener-ating objectives, including writing a wish list, thinkingabout features of good (and bad) alternatives, imag-ining consequences of actions, considering goals andconstraints, and adopting other stakeholders’ per-spectives, which may help in reducing the myopicproblem representation bias. Other tools to iden-tify objectives are the use of causal maps,(140) net-works of ideas with a means-end structure,(141,142) oraffinity diagrams, where objectives are elicited andclustered.(143)
To obtain a comprehensive set of objec-tives, practitioners often interview multiple stake-holders.(144) Creating a comprehensive list ofobjectives from multiple inputs is usually un-controversial because the decisionmaker(s) canalways zero-out selected objectives in the weightingprocess (see below). Another way of obtainingmultiple perspectives is to elicit the objectives ingroups, using decision conferencing supported by afacilitator.(126,127)
4.2. Definition of Attributes (VM2)
An attribute Xi measures how well different op-tions achieve the objective Oi (Fig. 2, step VM2). Thedecision analyst has to make a choice of the mostsuitable attribute. There is not, as far as we are aware,any descriptive research on the impact of this choice.
Biases
Research on scaling biases,(73,74) a family of bi-ases that occur when stimulus and response scalesare mismatched, is relevant to the definition of at-tributes. This research shows that different ways ofpresenting and scaling an attribute, as well as thedefinition of upper and lower limits of the attributescale, are the main causes of bias. Five biases are en-compassed by this family: contraction bias (under-estimating large sizes/differences and overestimat-ing small/size differences); logarithmic response bias(using step changes in the number of digits used inthe response, which fit a log scale); range equal-izing bias (using most of the range of responsewhatever is the size of the range of the stimuli);centering bias (producing a symmetric distributionof responses centered on the midpoint of the rangeof stimuli); and equal frequency bias (using equallyall parts of the response scale).

1242 Montibeller and von Winterfeldt
Studies on attribute framing effects(46,145) arealso relevant in the definition of attributes, as theyshow that the gain-loss bias may occur when an at-tribute has a positive or negative connotation (e.g.,whether assessing the degree of success, or instead,failure of a decision alternative). Poulton(74) suggestssome generic ways of dealing with each magnitudejudgment bias, and Levin et al.(46) mention in whichsituations the gain-loss bias is more prevalent.
Proxy attributes are often used in multiattributeutility analysis when fundamental attributes are hardto measure. For example, it is often easier to mea-sure the amounts of pollutants emitted per year bya power plant than to determine the health effectsthat result from the pollution. Fischer et al.(71) haveshown that proxy attributes lead to the proxy bias—distortion in weights in multiattribute utility models.
Debiasing
Whenever possible the attribute scales shoulduse natural units (such as dollars to measure prof-itability), making sure that the range of the scaleencompasses the spread of performances of the al-ternatives. When natural scales are not available,constructed attributes should be used with specialattention to steps of the scale and its endpoints.(3)
Care should also be taken in considering whetherthe attribute has a positive or negative frame inassessing performances. From a broader perspective,Keeney(133) emphasizes the importance of the se-lection of appropriate attributes, and Keeney andGregory(146) provide excellent guidelines on how tochoose and build an appropriate attribute. The ana-lyst must ensure that the attributes are unambiguousfor the assessment of consequences, comprehensivein covering the range of consequences, measure asdirectly as possible a fundamental objective, and areunderstandable by the decisionmakers.
4.3. Elicitation of Partial Values (VM3)
Once each Xith attribute is defined, a partialvalue function vi or utility function ui is elicited (in-dicated as a generalized function gi in Fig. 2). Valuefunctions express the decisionmaker’s strengths ofpreference for decisions under certainty; and util-ity functions express both risk attitude and strengthsof preference for decisions under uncertainty. Thereare several elicitation procedures for both valueand utility functions,(8,147) with the former requiring
judgments about preferences and strengths of pref-erences among riskless outcomes, and the latterrequiring choices among gambles.
Biases
Several studies show that the results of an elic-itation of utility functions depend on the design ofstimuli and responses.(41,148) In addition to randomnoise,(149–151) both the anchoring bias,(121) and thegain-loss bias(46) have been identified in this con-text. Another bias that impacts utility assessment isthe certainty effect,(38,39) which suggests that peopleprefer sure things to gambles with similar expectedutilities, and discount the utility of sure things dra-matically when they are no longer certainty.(40,41) Inaddition, the desirability of options bias(3) might dis-tort the utility function in a direction that favors apreferred alternative, and the affect influenced biasmay trigger oversensitivity to some increases in con-sequences (e.g., the first death in a terrorist attack)over others (e.g., the 100th death).(76)
Examples of the impact of the gain-loss bias arethe special role that the status quo plays in utilityassessment,(152) or the influence of the elicitation pro-cedure employed (certainty equivalent or probabilityequivalent) on the shape of the function.(40) Anotherexample is the impact that presenting a gamble interms of gains or losses has on the utility function be-ing elicited.(40) They may be mitigated by Arkes’s(24)
suggestions on how to reduce PB errors. In termsof anchoring, Chapman and Johnson(121) have shownthat value judgments are influenced by irrelevantstarting points, but found out that prompting the sub-jects to consider reasons different than the anchorhas alleviated the bias.
Debiasing
Many practitioners adopt simplified forms ofelicitation and representation of partial values, giventhe noise associated with these elicitations and thedependency of the responses on the framing ofstimuli.(3) In many ways, value and utility functionsare more “constructed” than “elicited.”(153) Thesesimplifications include using value functions as proxyfor utility functions, as advocated by von Winter-feldt and Edwards;(8) deriving utility functions fromvalue functions;(132) or using standardized shapes forutility functions, such as linear value functions(3) orexponential utility functions.(154) If utility functionsare elicited using gambles, the analyst should avoid

Biases in Decision and Risk Analysis 1243
sure things in the elicitation to reduce the certaintyeffect.
Often, multicriteria models are created tosupport group decision making using decisionconferences,(126) with the decision analyst as afacilitator.(127) This opens up the issue on how indi-vidual value assessments should be combined (seeBelton and Pictet(155)) and biases in groups. Thereis evidence that the degree of shared mental mod-els by group members increases the effectivenessin reaching a decision and satisfaction with thedecision-making process;(124) and that aggregationrules that are perceived by the group as proce-durally fair can increase satisfaction with and le-gitimacy of decision making.(123) However, groupsare more confident than individuals,(123) sometimesshowing overconfidence(11) and, as mentioned previ-ously, they may polarize, thus exacerbating cognitiveand motivational biases.
4.4. Elicitation of Attribute Weights (VM4)
The next step in multiattribute utility model-ing is the elicitation of weights wi, i = 1, . . . n, as-sociated with each Oi-th objective or Xi-th attribute(Fig. 2, step VM4). Weights are scaling constants thatrepresent value tradeoffs and aggregate the partialvalues.(130) gi(xi). There are many common mistakesin defining weights,(4,156) and several elicitation pro-tocols for eliciting weights in an appropriate way.(8)
Biases
Research has identified a family of biases af-fecting the elicitation of weights. According to thesplitting bias objectives that are defined in moredetail receive a larger portion of the weights thanobjectives that are defined in less detail(64–66) (butsee some criticisms about the experimental settingsof these studies in Poyhonen and Hamalainen(157)).With the equalizing bias decisionmakers tendto allocate similar weights to all objectives.(17,42)
The gain-loss bias may also affect weights, forinstance, if tradeoffs are elicited considering relativeimprovements or degradations of performances.(4)
According to the proxy bias objectives are over-weighted when measured by a proxy attribute insteadof by a fundamental attribute.(71) Due to the rangeinsensitivity bias, weights are insensitive to the rangeof attribute values.(68,72) Because weights are scal-ing constants that should depend on attribute ranges,this insensitivity can lead to highly distorted weight
judgments. In addition, the desirability of optionsbias(3) may lead to the over-/underweighting of at-tributes to favor a preferred alternative, and theaffect influenced bias might cause a distortion ofweights in favor of attributes that cause positive feel-ings and against those that provoke negative ones.
Debiasing
Elicitation procedures that ask for direct assess-ments of importance (e.g., distributing 100 pointsover attributes) should not be used,(68) but evenmethods that explicitly make decisionmakers con-sider the range of attributes, such as swing-weightsand the trade-off method, may suffer from rangeinsensitivity bias.(69) In practice, most decisionanalysts use simple methods, such as swing weights,cross-checked with selected tradeoffs,(3) and theyconsider the weighting process as an interactive andconstructive process rather than one of discovery.(48)
To reduce the splitting bias one should avoid ex-cessive detail in some objectives and little detail inothers.(158) This can often be achieved by obtainingobjectives and attributes from multiple stakeholders,which provide different degrees of detail to differentparts for the value tree (e.g., environmentalistsprovide detail about environmental objectivesand engineers provide detail about cost and per-formance). To reduce the equalizing bias, onecan set up the lower and upper anchors of eachattribute in a way (as in the case study describedby Morton et al.(159)) that they indeed allow similarweights for all objectives. Alternatively, one canuse ranking and ratio weighting methods, coupledwith hierarchical weighting, which generally producesteeper weights.(160) Another way of dealing with thejoint effects of the splitting bias and the equalizingbias is the calibration method proposed by Jacobiand Hobbs.(17) Finally, the use of either natural orconstructed attributes for fundamental objectives, asrecommended by Keeney and Gregory,(146) avoidsthe proxy bias.
5. MODELING CHOICES
Choices under uncertainty are usually modeledwith decision trees.(161,162) Alternatively, the ana-lyst may use influence diagrams,(163) which providea more compact representation. Fig. 3 schematicallyshows the subtasks of modeling choices representedby a decision tree: the identification of decision alter-natives (CM1); the identification of event nodes and
1244 Montibeller and von Winterfeldt
D
C1
C2
P1,2
P2,1
P2,2
P2, k2
a1
a2
P1,1
P1,k1
CZ
PZ,1
PZ,2
PZ, kZ
aZ
......
...
X1,1
CM1
CM2
X1, k1
XZ, kZ
CM3
X1,2
X2, 1
X2, 2
X2, k2...
XZ, 1
XZ, 2
CM4
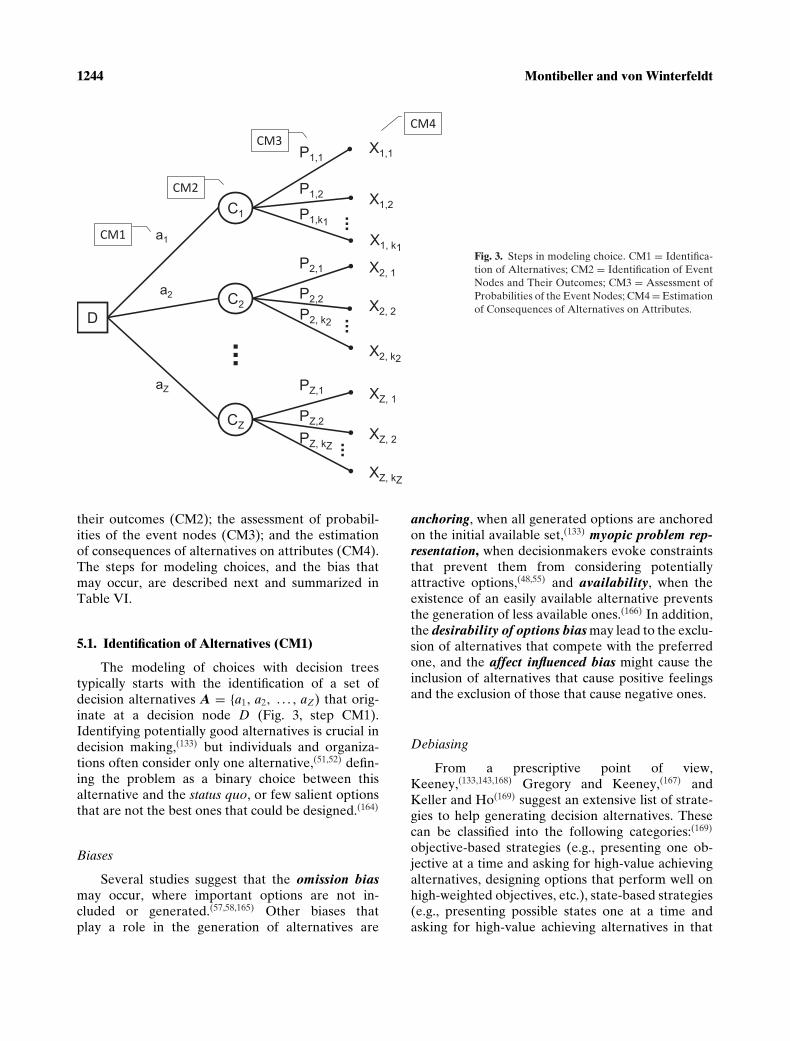
Fig. 3. Steps in modeling choice. CM1 = Identifica-tion of Alternatives; CM2 = Identification of EventNodes and Their Outcomes; CM3 = Assessment ofProbabilities of the Event Nodes; CM4 = Estimationof Consequences of Alternatives on Attributes.
their outcomes (CM2); the assessment of probabil-ities of the event nodes (CM3); and the estimationof consequences of alternatives on attributes (CM4).The steps for modeling choices, and the bias thatmay occur, are described next and summarized inTable VI.
5.1. Identification of Alternatives (CM1)
The modeling of choices with decision treestypically starts with the identification of a set ofdecision alternatives A = {a1, a2, . . . , aZ) that orig-inate at a decision node D (Fig. 3, step CM1).Identifying potentially good alternatives is crucial indecision making,(133) but individuals and organiza-tions often consider only one alternative,(51,52) defin-ing the problem as a binary choice between thisalternative and the status quo, or few salient optionsthat are not the best ones that could be designed.(164)
Biases
Several studies suggest that the omission biasmay occur, where important options are not in-cluded or generated.(57,58,165) Other biases thatplay a role in the generation of alternatives are
anchoring, when all generated options are anchoredon the initial available set,(133) myopic problem rep-resentation, when decisionmakers evoke constraintsthat prevent them from considering potentiallyattractive options,(48,55) and availability, when theexistence of an easily available alternative preventsthe generation of less available ones.(166) In addition,the desirability of options bias may lead to the exclu-sion of alternatives that compete with the preferredone, and the affect influenced bias might cause theinclusion of alternatives that cause positive feelingsand the exclusion of those that cause negative ones.
Debiasing
From a prescriptive point of view,Keeney,(133,143,168) Gregory and Keeney,(167) andKeller and Ho(169) suggest an extensive list of strate-gies to help generating decision alternatives. Thesecan be classified into the following categories:(169)
objective-based strategies (e.g., presenting one ob-jective at a time and asking for high-value achievingalternatives, designing options that perform well onhigh-weighted objectives, etc.), state-based strategies(e.g., presenting possible states one at a time andasking for high-value achieving alternatives in that

Biases in Decision and Risk Analysis 1245
Table VI. Choice Modeling Subtasks and Associated Biases
Subtasks Biases Debiasing Suggestion
CM1: Identification of alternatives •Affect influenced bias (M)•Anchoring bias (C)•Availability bias (C)•Desirability of options bias (M)•Myopic problem representation
bias (C)•Omission bias (C)
Prompting for alternatives; using objectivesto generate alternatives; using groupprocesses; stimulating creativity.
CM2: Identification of events and outcomes •Availability bias (C)• Confirmation bias (M)•Myopic problem representation
bias (C)•Omission bias (C)•Overconfidence bias (C)
Asking for counterfactuals; using multipleexperts; adopting group processes;prompting for alternative hypotheses.
CM3: Assessment of probabilities •Affect influenced bias (M)•Anchoring bias (C)•Availability bias (C)• Confirmation bias (M)•Desirability biases (M)• Equalizing bias (C)•Gain-loss bias (C)•Overconfidence bias (C)• Splitting bias (C)
Avoiding initial anchors; using ratiotechniques, not point spreads; using fixedvalues, not fixed probabilities; asking forcounterfactuals and alternative competinghypotheses.
CM4: Estimation of consequences •Affect influenced bias (M)•Anchoring bias (C)•Desirability biases (M)•Overconfidence bias (C)• Scaling biases (C)• Splitting bias
Using model and data for estimation;avoiding anchors; asking forcounterfactuals; using hypotheticalgambles.
Note: C, Cognitive bias (see Table I for detains); M, Motivational bias (see Table II for details).
future state, etc.), and alternative-based strategies(e.g., imagining an ideal option and designing alter-natives from it, using existing options to generatenew ones, etc.). Presenting one objective at a timeand asking respondents to generate alternativesthat meet this objective generates more alternativesthan when no objectives or all objectives togetherare presented.(57,165) More recently, Butler andScherer(58) have shown that presenting objectivesleads not only to more, but also to better, alterna-tives. Farquhar and Pratkanis(170) also mention theuse of phantom alternatives as a way of stimulatingcreativity, e.g., the inclusion of an unfeasible “ideal”alternative helping decisionmakers to create newoptions as described by Phillips.(171)
Tools such as causal maps(141,172) and strategy-generation tables(173) can be used to develop alter-natives. In addition, group-based techniques, such as
the ones discussed in Section 3.1, either computer-ized or not, can be employed for the generation ofalternatives.
5.2. Identification of Event Nodes and TheirOutcomes (CM2)
In a decision tree, a chance node Cr (with r =1, 2, . . . , Z) represents an uncertainty associated witha discrete set of mutually exclusive and collectivelyexhaustive events (Fig. 3, step CM2).
Biases
The issues discussed in Section 3.1 also apply tothis step. In particular the identification of the eventnodes may suffer from the myopic problem repre-sentation and omission biases; the definition of the

1246 Montibeller and von Winterfeldt
set of outcomes from each chance node may sufferfrom overconfidence bias regarding their exhaustive-ness and their range; and such definition may also beaffected by both availability and confirmation bias.
Debiasing
Most debiasing tools discussed in Section 3.1 alsoapply here. Influence diagrams(163) are powerful toolsto support the structuring of decisions under uncer-tainty. Counterfactuals and the development of long-range scenarios may help to reduce the omission biasand the associated overconfidence that the generatedset of events is exhaustive.(174)
5.3. Assessment of Probabilities of the Event Nodes(CM3)
This step requires the assessment of conditionalprobabilities Pr,l (with l = 1, 2, . . . , kr) for each of therth events defined at chance nodes in a decision tree(Fig. 3, step CM3).
Biases
Similar biases described in Section 3.2 occurwhen there is a discrete set of outcomes. Differentelicitation methods(8) may generate anchoring andgain-loss biases. The availability and desirability ofa positive/negative event biases also may exert influ-ence on the probabilities’ estimates. The desirabilityof options bias may lead to over-/underestimationto favor preferred alternatives. The overconfidencebias, as well as the confirmation and the affect influ-enced biases, might distort probability estimates.
Additionally, two biases may occur in thisstep: the equalizing bias(42,43) in which experts as-sign similar elicited probabilities to all outcomes;and the splitting bias(59,70) in which decisionmak-ers do not sufficiently adjust their estimates whenthe decision tree is rearranged and some of itsbrunches are pruned. Birnbaum(175) shows that whenchoosing among gambles, splitting events with pos-itive outcomes leads to a preferences for a gamblewith the split events; while splitting events with neg-ative outcomes leads to a preference of the gamblewithout the split events.
Debiasing
Prescriptive guidelines to reduce such biases aresimilar to the ones mentioned in Section 3.2. Fox andClemen(42) suggest several strategies to minimize the
splitting bias, such as trying to make sure the deci-sionmaker’s attention is focused in a balanced wayacross the outcome space, or using multiple represen-tations (alternative partitions).
5.4. Estimation of Consequences of Alternatives onAttributes (CM4)
In this step the consequences Xr,l (with l = 1,2, . . . , kr) of implementing each rth alternative giventhe lth event are estimated (Fig. 3, step CM4), usingdata collection, modeling of systems, and the use ofexpert judgment.
Biases
When using expert judgment the scaling bi-ases may occur, as well as overconfidence(3) andanchoring.(121) Another concern is the strong ef-fect that the desirability of a positive/negativeconsequence biases may exert on the estimatesof consequences that experts provide, with evi-dence both from lab experiments(81) and real-worldinterventions.(28) The desirability of options biasmay lead to overestimations of positive conse-quences and underestimations of negative con-sequences for preferred alternatives. The affectinfluenced bias might cause an overestimation of un-desirable consequences that cause negative feelingsand of desirable consequences that cause positivefeelings.(76)
Debiasing
From a prescriptive point of view, decision an-alysts should use predictive models and data when-ever they provide a sound basis for estimation ofconsequences.(3) If the consequences are translatedto either value or utility, then the same issues dis-cussed in Section 3 apply in this step.
6. CONCLUSIONS AND A RESEARCHAGENDA FOR THE FUTURE
This article provided a review of a comprehen-sive list of cognitive biases, identified the biases thatcan significantly affect the judgments in decision andrisk analysis, and showed how the use of debiasingtechniques can reduce their effect. In the process, weidentified a subset of cognitive biases in decision andrisk analysts that are difficult to correct as well asseveral biases that can easily be corrected. We also

Biases in Decision and Risk Analysis 1247
reviewed several motivational biases, which areequally important to analysts, but are rarely dis-cussed in the literature. We concluded that, unlikecognitive biases, all motivational biases are relevantto decision and risk analysis.
Considering the importance of eliciting judg-ments (probabilities, values, utilities, weights, etc.)in decision and risk analysis, it is somewhat surpris-ing that relative little attention has been previouslypaid to the possible distortions of an analysis due tothese biases. We thus next suggest a research agenda,which is based on our review of the existing literatureon biases and evidence about their effects, as well ason the framework we suggested to classify them.
Further Exploration of Motivational Biases
Motivational biases are very important in deci-sion and risk analysis, ranging from issues related toobvious conflicts of interest to subtle influences ofprofessional association or preferences for outcomesof an analysis. While there exists some literature onmotivational biases, it is not directly connected to thejudgment tasks involved in decision and risk analysis.Therefore, much more research is needed to betterunderstand the effect of motivational biases in deci-sion and risk analysis and how to reduce these biases.
We take it for granted that the most obviousmotivational biases can be dealt with by a deliber-ate selection of experts and decisionmakers who pro-vide the judgments that are inputs to decision andrisk analysis models. To accomplish this, many or-ganizational safeguards are in place, for example,to avoid conflicts of interest or stakes in the out-come of an analysis. We propose that the experi-mental research instead focus on the less obvious,often subconscious motivational biases—for exam-ple, the well-established tendency of engineers andcost estimators to overestimate the performance andunderestimate cost and time completion of a project.
Testing Best Practice Methods for ReducingCognitive Biases
Decision and risk analysts employ many “bestpractices” in debiasing, but few of those have beentested experimentally. Thus a high-priority item onour research agenda is to identify these best prac-tices, and to test them in controlled experiments.Examples are the use of counterfactuals to re-duce anchoring, the fixed value methods to reduce
overconfidence, and probing and prompting strate-gies to reduce omission biases.
Testing Best Practice Methods for ReducingMotivational Biases
This is a virtually unexplored field. Decisionand risk analysts use some “tricks” to reduce mo-tivational biases (counterfactuals, hypothetical bets,scoring rules), but with the exception of scoring rules,none of these have been tested. Regarding scoringrules the evidence of their efficacy is mixed, largelybecause of their well-known “flat maxima”(8) prop-erty (they do not penalize experts much for wrongpredictions). There is a huge opportunity for exper-imental researchers to explore current best practicesand to test their effectiveness in reducing motiva-tional biases.
Decision and risk analysis were designed toimprove judgment and decision making. The fieldsare closely intertwined with cognitive behavioralresearch and much can be learned from cognitivepsychology to improve the elicitation of the keycomponents of decision and risk analysis models. Wehope that with the addition of a research componentfocused on motivational aspects of judgment anddecision making, as well as a stronger researchapproach to the study of debiasing tools in this con-text, a rich literature can be created to inform bothpsychologists and decision and risk analysts with theultimate purpose to improve decision making.
ACKNOWLEDGMENTS
We would like to thank two anonymous review-ers and the area editor, Michael Siegrist, for help-ful comments and suggestions, which have helpedus to improve the article. Detlof von Winterfeldtacknowledges support from the U.S. Departmentof Homeland Security (DHS) through the NationalCenter for Risk and Economic Analysis of Terror-ism Events (CREATE) at the University of South-ern California (USC) under award number 2010-ST-061-RE0001. However, any opinions, findings, andconclusions or recommendations in this documentare those of the authors and do not necessarily re-flect views of the U.S. Department of Homeland Se-curity, or the University of Southern California, orCREATE. Gilberto Montibeller would like to thankthe LSE Decision Sciences team, in particular Bar-bara Fasolo and Larry Phillips, for the insightful

1248 Montibeller and von Winterfeldt
discussions about behavioral decision research dur-ing the development of this article.
REFERENCES
1. Tversky A, Kahneman D. Judgment under uncertainty:Heuristics and biases. Science, 1974; 185(4157):1124–1131.
2. Meyer MA, Booker JM. Eliciting and Analyzing ExpertJudgment: A Practical Guide. London: Academic Press;1991.
3. von Winterfeldt D. On the relevance of behavioral decisionresearch for decision analysis. Pp. 133–154 in Shanteau J,Mellers BA, Schum DA (eds). Decision Science and Tech-nology: Reflections on the Contributions of Ward Edwards.Norwell: Kluwer, 1999.
4. Weber M, Borcherding K. Behavioral influences on weightjudgments in multiattribute decision making. European Jour-nal of Operational Research, 1993; 67(1):1–12.
5. Morton A, Fasolo B. Behavioural decision theory for multi-criteria decision analysis: A guided tour. Journal of the Op-erational Research Society, 2009; 60:268–275.
6. Fasolo B, Morton A, von Winterfeldt D. Behavioural issuesin portfolio decision analysis. Pp. 149–165 in Salo A, KeislerJ, Morton A (eds). Portfolio Decision Analysis. New York:Springer; 2011.
7. Larrick RP. Debiasing. Pp. 316–338 in Koehler DJ, Harvey N(eds). Blackwell Handbook of Judgment and Decision Mak-ing. Malden, MA: Blackwell, 2007.
8. von Winterfeldt D, Edwards W. Decision Analysis and Be-havioral Research. New York: Cambridge University Press,1986.
9. Kahneman D, Slovic P, Tversky A. Judgment Under Uncer-tainty: Heuristics and Biases. Cambridge: Cambridge Univer-sity Press, 1982.
10. Gilovich T, Griffin DW, Kahneman D. Heuristics and Biases:The Psychology of Intuitive Judgement. Cambridge: Cam-bridge University Press; 2002.
11. Kerr NL, MacCoun RJ, Kramer GP. Bias in judgment: Com-paring individuals and groups. Psychological Review, 1996;103(4):687–719.
12. Kunda Z. The case for motivated reasoning. PsychologicalBulletin, 1990; 108(3):480–498.
13. Molden DC, Higgins ET. Motivated thinking. Pp. 390–409in Holyoak KJ, Morrison RG (eds). The Oxford Handbookof Thinking and Reasoning. New York: Oxford UniversityPress, 2012.
14. Connolly T, Dean D. Decomposed versus holistic estimatesof effort required for software writing tasks. ManagementScience, 1997; 43(7):1029–1045.
15. Lichtenstein S, Fischhoff B. Do those who know more alsoknow more about how much they know? Organizational Be-havior and Human Performance, 1977; 20(2):159–183.
16. Lichtenstein S, Fischhoff B, Phillips LD. Calibration of prob-abilities: The state of the art to 1980. Pp. 306–334 in Kahne-man D, Slovic P, Tversky A (eds). Cambridge: CambridgeUniversity Press, 1982.
17. Jacobi SK, Hobbs BF. Quantifying and mitigating the split-ting bias and other value tree-induced weighting biases. De-cision Analysis, 2007; 4(4):194–210.
18. Tversky A, Kahneman D. Extensional versus intuitive rea-soning: The conjunction fallacy in probability judgment. Psy-chological Review, 1983; 90(4):293–315.
19. Kahneman D, Tversky A. On the psychology of prediction.Psychological Review, 1973; 80(4):237–251.
20. Bar-Hillel M. The base-rate fallacy in probability judgments.Acta Psychologica, 1980; 44(3):211–233.
21. Alpert M, Raiffa H. A progress report on the training ofprobability assessors. Pp. 294–305 in Kahneman D, Slovic
P, Tversky A (eds). Judgment Under Uncertainty: Heuris-tics and Biases. Cambridge: Cambridge University Press,1982.
22. Fischhoff B. Debiasing. Pp. 422–444 in Kahneman D, SlovicP, Tversky A (eds). Judgment Under Uncertainty: Heuristicsand Biases. Cambridge: Cambridge University Press, 1982.
23. Kahneman D, Tversky A. Intuitive prediction: Biases andcorrective procedures. Pp. 313–327 in Makridakis S, Wheel-wright SC (eds). Forecasting: TIMS Studies in ManagementScience. Amsterdam: North-Holland, 1979.
24. Arkes HR. Costs and benefits of judgment errors: Implica-tions for debiasing. Psychological Bulletin, 1991; 110(3):486–498.
25. Milkman KL, Chugh D, Bazerman MH. How can decisionmaking be improved? Perspectives on Psychological Science,2009; 4(4):379–383.
26. Seaver DA, von Winterfeldt D, Edwards W. Eliciting sub-jective probability distributions on continuous variables.Organizational Behavior and Human Performance, 1978;21(3):379–391.
27. Abbas AE, Budescu DV, Yu H-T, Haggerty R. A compari-son of two probability encoding methods: Fixed probabilityvs. fixed variable values. Decision Analysis, 2008; 5(4):190–202.
28. Dillon RL, John R, von Winterfeldt D. Assessment of costuncertainties for large technology projects: A methodologyand an application. Interfaces, 2002; 32(4):52–66.
29. Hogarth RM, Makridakis S. Forecasting and planning: Anevaluation. Management Science, 1981; 27(2):115–138.
30. Baron J. Thinking and Deciding, 4th ed. New York: Cam-bridge University Press; 2008.
31. Shah AK, Oppenheimer DM. Heuristics made easy: Aneffort-reduction framework. Psychological Bulletin, 2008;134(2):207–222.
32. Mussweiler T, Strack F. The semantics of anchoring. Orga-nizational Behavior and Human Decision Processes, 2001;86(2):234–255.
33. Furnham A, Boo HC. A literature review of the anchoringeffect. Journal of Socio-Economics, 2011; 40(1):35–42.
34. Tversky A, Kahneman D. Availability: A heuristic for judg-ing frequency and probability. Cognitive Psychology, 1973;5(2):207–232.
35. Bazerman MH, Moore DA. Judgment in Managerial Deci-sion Making, 8th ed. Hoboken, NJ: John Wiley & Sons, 2013.
36. Wanke M, Schwarz N, Bless H. The availability heuristic re-visited: Experienced ease of retrieval in mundane frequencyestimates. Acta Psychologica. 1995; 89(1):83–90.
37. Lichtenstein S, Slovic P, Fischhoff B, Layman M, Combs B.Judged frequency of lethal events. Journal of ExperimentalPsychology: Human Learning and Memory, 1978; 4(6):551–578.
38. Allais M. Le Comportement de l’Homme Rationnel de-vant le Risque: Critique des Postulats et Axiomes de l’EcoleAmericaine. Econometrica, 1953; 21(4):503–546.
39. Kahneman D, Tversky A. Prospect theory: An analysis of de-cision under risk. Econometrica, 1979; 47(2):263–291.
40. Hershey JC, Schoemaker PJH. Probability versus certaintyequivalence methods in utility measurement: Are they equiv-alent? Management Science, 1985; 31(10):1213–1231.
41. Schoemaker PJH, Hershey JC. Utility measurement: Signal,noise, and bias. Organizational Behavior and Human Deci-sion Processes, 1992; 52(3):397–424.
42. Fox CR, Clemen RT. Subjective probability assessment indecision analysis: Partition dependence and bias towardthe ignorance prior. Management Science, 2005; 51(9):1417–1432.
43. Fox CR, Bardolet D, Lieb D. Partition dependence in de-cision analysis, resource allocation, and consumer choice.Pp. 229–251 in Zwick R, Rapoport A (eds). Experimental

Biases in Decision and Risk Analysis 1249
Business Research, Vol III: Marketing, Accounting, andCognitive Perspectives. Dordrecht: Springer, 2005.
44. Tversky A, Kahneman D. The framing of decisions and thepsychology of choice. Science, 1981; 211(4481):453–458.
45. Frisch D. Reasons for framing effects. Organizational Behav-ior and Human Decision Processes, 1993; 54(3):399–429.
46. Levin IP, Schneider SL, Gaeth GJ. All frames are not createdequal: A typology and critical analysis of framing effects. Or-ganizational Behavior and Human Decision Processes, 1998;76(2):149–88.
47. Kuhberger A. The influence of framing on risky decisions:A meta-analysis. Organizational Behavior and Human Deci-sion Processes, 1998; 75(1):23–55.
48. Payne JW, Bettman JR, Schkade DA, John W Payne JRBand DAS. Measuring constructed preferences: Towards abuilding code. Journal of Risk and Uncertainty, 1999; 19(1–3):243–270.
49. Legrenzi P, Girotto V, Johnson-Laird PN. Focussing in rea-soning and decision making. Cognition, 1993; 49(1–2):37–66.
50. Legrezni P, Girotto V. Mental models in reasoning and de-cision making. Pp. 95–118 in Oakhill J, Garnham A (eds).Mental Models in Cognitive Science: Essays in Honour ofPhil Johnson-Laird. Hove: Psychology Press, 1996.
51. Eisenhardt KM. Making fast strategic decisions in high-velocity environments. Academy of Management Journal,1989; 32(3):543–576.
52. Nutt PC. How decision makers evaluate alternatives andthe influence of complexity. Management Science, 1998;44(8):1148–1166.
53. Bond SD, Carlson KA, Keeney RL. Generating objectives:Can decision makers articulate what they want? Manage-ment Science, 2008; 54(1):56–70.
54. Bond SD, Carlson KA, Keeney RL. Improving the genera-tion of decision objectives. Decision Analysis, 2010; 7(3):238–255.
55. Russo JE, Schoemaker PJH. Decision Traps: Ten Barriersto Brilliant Decision-Making and How to Overcome Them.New York: Doubleday, 1989.
56. Jargowsky PA. Omitted variable bias. Pp. 919–924 in Ency-clopedia of Social Measurement, Vol. 2. New York: Elsevier,2005.
57. Pitz GF, Sachs NJ, Heerboth J. Procedures for elicitingchoices in the analysis of individual decisions. Organiza-tional Behavior and Human Performance, 1980; 26(3):396–408.
58. Butler AB, Scherer LL. The effects of elicitation aids, knowl-edge, and problem content on option quantity and qual-ity. Organizational Behavior and Human Decision Processes,1997; 72(2):184–202.
59. Fischhoff B, Slovic P, Lichtenstein S. Fault trees: Sensitivityof estimated failure probabilities to problem representation.Journal of Experimental Psychology: Human Perception andPerformance, 1978; 4(2):330–344.
60. Thomas RP, Dougherty MRP, Sprenger AM, Harbison JI.Diagnostic hypothesis generation and human judgment. Psy-chological Review, 2008; 115(1):155–185.
61. Moore DA, Healy PJ. The trouble with overconfidence. Psy-chological Review, 2008; 115(2):502–517.
62. Lin S-W, Bier VM. A study of expert overconfidence. Relia-bility Engineering & System Safety, 2008; 93(5):711–721.
63. Mehle T. Hypothesis generation in an automobile malfunc-tion inference task. Acta Psychologica, 1982; 52(1–2):87–106.
64. Borcherding K, von Winterfeldt D. The effect of varyingvalue trees on multiattribute evaluations. Acta Psychologica.1988; 68(1–3):153–170.
65. Weber M, Eisenfuhr F, von Winterfeldt D. The effects ofsplitting attributes on weights in multiattribute utility mea-surement. Management Science, 1988; 34(4):431–445.
66. Poyhonen M, Vrolijk H, Hamalainen RP. Behavioral andprocedural consequences of structural variation in valuetrees. European Journal of Operational Research. 2001;134(1):216–227.
67. Weber EU, Bockenholt U, Hilton DJ, Wallace B. De-terminants of diagnostic hypothesis generation: Effects ofinformation, base rates, and experience. Journal of Experi-mental Psychology: Learning, Memory, and Cognition, 1993;19(5):1151–1164.
68. von Nitzsch R, Weber M. The effect of attribute ranges onweights in multiattribute utility measurements. ManagementScience, 1993; 39(8):937–943.
69. Fischer GW. Range sensitivity of attribute weights in multi-attribute value models. Organizational Behavior and HumanDecision Processes, 1995; 62(3):252–266.
70. Ofir C. Ease of recall vs recalled evidence in judgment: Ex-perts vs laymen. Organizational Behavior and Human Deci-sion Processes, 2000; 81(1):28–42.
71. Fischer GW, Damodaran N, Laskey KB, Lincoln D. Pref-erences for proxy attributes. Management Science, 1987;33(2):198–214.
72. Gabrielli WF, von Winterfeldt D. Are Importance WeightsSensitive to the Range of Alternatives in MultiattributeUtility Measurement? Research Report 78–6, Social ScienceResearch Institute, University of Southern California: LosAngeles, CA, 1978.
73. Poulton EC. Biases in quantitative judgements. Applied Er-gonomics, 1982; 13(1):31–42.
74. Poulton EC. Bias in Quantifying Judgements. Hove: Erl-baum, 1989.
75. Finucane ML, Alhakami A, Slovic P, Johnson SM. The af-fect heuristic in judgments of risks and benefits. Journal ofBehavioral Decision Making, 2000; 13(1):1–17.
76. Slovic P, Finucane ML, Peters E, MacGregor DG. Risk asanalysis and risk as feelings: Some thoughts about affect, rea-son, risk, and rationality. Risk Analysis, 2004; 24(2):311–322.
77. Siegrist M, Sutterlin B. Human and nature-caused hazards:The affect heuristic causes biased decisions. Risk Analysis,2014; 34(8):1482–1494.
78. Rottenstreich Y, Hsee CK. Money, kisses, and electricshocks: On the affective psychology of risk. Psychological Sci-ence, 2001; 12(3):185–190.
79. Nickerson RS. Confirmation bias: A ubiquitous phenomenonin many guises. Review of General Psychology, 1998;2(2):175–220.
80. Klayman J. Varieties of confirmation bias. Pp. 365–418 inBusemeyer J, Hastie R, Medin D (eds). Psychology of Learn-ing and Motivation: Vol 32 Decision Making from a Cogni-tive Perspective. New York: Academic Press, 1995.
81. Krizan Z, Windschitl PD. The influence of outcome desirabil-ity on optimism. Psychological Bulletin, 2007; 133(1):95–121.
82. Seybert N, Bloomfield R. Contagion of wishful thinking inmarkets. Management Science, 2009; 55(5):738–751.
83. Weinstein ND. Unrealistic optimism about future lifeevents. Journal of Personality and Social Psychology 1980;39(5):806–820.
84. Tichy G. The over-optimism among experts in assessmentand foresight. Technological Forecasting and Social Change,2004; 71(4):341–363.
85. Ecken P, Gnatzy T, von der Gracht HA. Desirability bias inforesight: Consequences for decision quality based on Delphiresults. Technological Forecasting and Social Change, 2011 ;78(9):1654–1670.
86. Bar-Hillel M, Budescu DV, Amar M. Predicting World Cupresults: Do goals seem more likely when they pay off? Psy-chonomic Bulletin & Review, 2008; 15(2):278–283.
87. Dolinski D, Gromski W, Zawisza E. Unrealistic pessimism.Journal of Social Psychology, 1987; 127(5):511–516.

1250 Montibeller and von Winterfeldt
88. Chapin J. Self-protective pessimism: Optimistic bias inreverse. North American Journal of Psychology, 2001;3(2):253–262.
89. Marks G, von Winterfeldt D. “Not in my back yard”: Influ-ence of motivational concerns on judgments about a riskytechnology. Journal of Applied Psychology, 1984; 69(3):408–415.
90. Institute of Medicine, editor. Environmental Decisionsin the Face of Uncertainty [Internet]. Washington,DC: National Academies Press, 2013. Available at:http://www.nap.edu/catalog.php?record_id=12568.
91. Rothstein H, Downer J. “Renewing Defra”: Exploring theemergence of risk-based policymaking in UK central govern-ment. Public Administration, 2012; 90(3):781–799.
92. Ellsberg D. Risk, ambiguity, and the Savage axioms. Quar-terly Journal of Economics, 1961; 75(4):643–699.
93. Phillips LD, Edwards W. Conservatism in a simple probabil-ity inference task. Journal of Experimental Psychology, 1966;72(3):346–354.
94. Edwards W. Conservatism in human information processing.Pp. 17–52 in Kleinmuntz B (ed). Formal Representation ofHuman Judgment. New York: Wiley, 1968.
95. Kahneman D, Knetsch JL, Thaler RH. Anomalies: The en-dowment effect, loss aversion, and status quo bias. Journal ofEconomic Perspectives, 1991; 5(1):193–206.
96. Arkes HR, Blumer C. The psychology of sunk cost. Orga-nizational Behavior and Human Decision Processes, 1985;35(1):124–140.
97. Bar-Eli M, Avugos S, Raab M. Twenty years of “hot hand”research: Review and critique. Psychology of Sport and Ex-ercise, 2006; 7(6):525–553.
98. Tversky A, Kahneman D. Belief in the law of small numbers.Psychological Bulletin, 1971; 76(2):105–110.
99. Macchi L, Osherson D, Krantz DH. A note on super-additive probability judgment. Psychological Review, 1999;106(1):210–214.
100. Morgan MG, Henrion M. Uncertainty: A Guide to Dealingwith Uncertainty in Quantitative Risk and Policy Analysis.Cambridge: Cambridge University Press, 1992.
101. Bedford T, Cooke RM. Probabilistic Risk Analysis: Founda-tions and Methods. Cambridge: Cambridge University Press,2001.
102. Lawrence M, Goodwin P, O’Connor M, Onkal D. Judgmen-tal forecasting: A review of progress over the last 25 years.International Journal of Forecasting, 2006; 22(3):493–518.
103. Gettys CF, Mehle T, Fisher S. Plausibility assessments inhypothesis generation. Organizational Behavior and HumanDecision Processes, 1986; 37(1):14–33.
104. Koehler DJ. Hypothesis generation and confidence in judg-ment. Journal of Experimental Psychology: Learning, Mem-ory, and Cognition, 1994; 20(2):461–469.
105. Dougherty MRP, Gettys CF, Thomas RP. The role of mentalsimulation in judgments of likelihood. Organizational Behav-ior and Human Decision Processes, 1997; 70(2):135–148.
106. Phillips LD. Group elicitation of probability distributions:Are many heads better than one? Pp. 313–330 in ShanteauJ, Mellers BA, Schum DA (eds). Decision Science and Tech-nology: Reflections on the Contributions of Ward Edwards.Norwell: Kluwer, 1999.
107. Kerr NL, Tindale RS. Group performance and decision mak-ing. Annual Review of Psychology, 2004; 55(1):623–655.
108. Franco LA, Montibeller G. “On-the-spot” modeling andanalysis: The facilitated modeling approach. Pp. 1–17 inCochran JJ, Cox LA, Keskinocak P, Kharoufeh JP, Smith JC(eds). Wiley Encyclopedia of Operations Research and Man-agement Science. Hoboken, NJ: John Wiley & Sons, 2011.
109. MacGregor DG. Decomposition for judgmental forecastingand estimation. Pp. 107–123 in Armstrong JS (ed). Principles
of Forecasting: A Handbook for Researchers and Practition-ers. Springer, 2001.
110. Hora SC. Eliciting probabilities from experts. Pp. 129–153 inEdwards W, Miles RF, von Winterfeldt D (eds). Advances inDecision Analysis: From Foundations to Applications. NewYork: Cambridge University Press, 2007.
111. Morgan MG. Use (and abuse) of expert elicitation in supportof decision making for public policy. Proceedings of the Na-tional Academy of Sciences of the United States of America,2014; 111(20):7176–7184.
112. Spetzler CS, Stael von Holstein C-A. Probability encoding indecision analysis. Management Science, 1975; 22(3):340–358.
113. Klayman J, Soll JB, GonzA¡lez-Vallejo C, Barlas S. Over-confidence: It depends on how, what, and whom you ask. Or-ganizational Behavior and Human Decision Processes, 1999;79(3):216–247.
114. Budescu DV, Du N. Coherence and consistency of in-vestors’ probability judgments. Management Science, 2007;53(11):1731–1744.
115. Hora SC, Hora JA, Dodd NG. Assessment of probability dis-tributions for continuous random variables: A comparison ofthe bisection and fixed value methods. Organizational Be-havior and Human Decision Processes, 1992; 51(1):133–155.
116. Hora SC. Probability judgments for continuous quantities:Linear combinations and calibration. Management Science,2004; 50(5):597–604.
117. Merkhofer MW. Quantifying judgmental uncertainty:Methodology, experiences, and insights. IEEE Transactionson Systems, Man and Cybernetics, 1987; 17(5):741–752.
118. Keeney RL, von Winterfeldt D. Eliciting probabilities fromexperts in complex technical problems. IEEE Transactionson Engineering Management, 1991; 38(3):191–201.
119. Winkler RL. Scoring rules and the evaluation of probabili-ties. Test, 1996; 5(1):1–26.
120. Jose VRR, Winkler RL. Evaluating quantile assessments.Operations Research, 2009; 57(5):1287–1297.
121. Chapman GB, Johnson EJ. Anchoring, activation, and theconstruction of values. Organizational Behavior and HumanDecision Processes, 1999; 79(2):115–153.
122. Clemen RT, Winkler RL. Combining probability distribu-tions from experts in risk analysis. Risk Analysis, 1999;19(2):187–203.
123. Kerr NL, Tindale RS. Group-based forecasting?: A socialpsychological analysis. International Journal of Forecasting,2011; 27(1):14–40.
124. Tindale RS, Kameda T, Hinsz VB. Group Decision Making.Pp. 381–403 in Cooper J, Hogg M (eds). Handbook of SocialPsychology. London: Sage, 2003.
125. Gurcay B, Mellers BA, Baron J. The power of social influ-ence on estimation accuracy. Journal of Behavioral DecisionMaking, forthcoming. doi: 10.1002/bdm.1843.
126. Phillips LD. Decision conferencing. Pp. 375–399 in EdwardsW, Miles RF, von Winterfeldt D (eds). Advances in Deci-sion Analysis: From Foundations to Applications. New York:Cambridge University Press, 2007.
127. Franco LA, Montibeller G. Facilitated modelling in opera-tional research. European Journal of Operational Research,2010; 205(3):489–500.
128. Bolger F, Rowe G. The aggregation of expert judgment: Dogood things come to those who weight? Risk Analysis, 2014;35(1):5–11.
129. Montibeller G, von Winterfeld D. Biases and debiasing inmulti-criteria decision analysis. Pp. 1218–1226 in Proceedingsof the 48th Hawaii International Conference on System Sci-ences. Kauai, Hawaii: IEEE Computer Society, 2015.
130. Keeney RL, Raiffa H. Decisions with Multiple Objectives:Preferences and Value Trade-Offs. Cambridge: CambridgeUniversity Press, 1993.

Biases in Decision and Risk Analysis 1251
131. Belton V, Stewart TJ. Multiple Criteria Decision Anal-ysis: An Integrated Approach. Norwell, MA: Springer,2002.
132. Keeney RL, von Winterfeldt D. Practical value models. Pp.232–252 in Edwards W, Miles RF, von Winterfeld D (eds).Advances in Decision Analysis: From Foundations to Appli-cations. New York: Cambridge University Press, 2007.
133. Keeney RL. Value-Focused Thinking: A Path to CreativeDecisionmaking. Cambridge, MA: Harvard University Press,1996.
134. Berkeley D, Humphreys P. Structuring decision problemsand the “bias heuristic”. Acta Psychologica, 1982; 50(3):201–252.
135. Johnson-Laird PN. Mental models and deduction. Trends inCognitive Sciences, 2001; 5(10):434–442.
136. Baron J. Biases in the quantitative measurement of values forpublic decisions. Psychological Bulletin, 1997; 122(1):72–88.
137. Edvardsson K, Hansson SO. When is a goal rational? So-cial Choice and Welfare 2005; 24(2):343–361.
138. Fry PC, Rinks DB, Ringuest JL. Comparing the predictivevalidity of alternatively assessed multi-attribute preferencemodels when relevant decision attributes are missing. Eu-ropean Journal of Operational Research, 1996; 94(3):599–609.
139. Leon OG. Value-focused thinking versus alternative-focusedthinking: Effects on generation of objectives. OrganizationalBehavior and Human Decision Processes, 1999; 80(3):213–227.
140. Eden C. Analyzing cognitive maps to help structure issues orproblems. European Journal of Operational Research, 2004;159(3):673–686.
141. Belton V, Ackermann F, Shepherd I. Integrated supportfrom problem structuring through to alternative evaluationusing COPE and V·I·S·A. Journal of Multi-Criteria Deci-sion Analysis, 1997; 6(3):115–130.
142. Montibeller G, Belton V. Causal maps and the evaluation ofdecision options—A review. Journal of the Operational Re-search Society, 2006; 57(7):779–791.
143. Parnell GS, Conley HW, Jackson JA, Lehmkuhl LJ, An-drew JM. Foundations 2025: A value model for evaluat-ing future air and space forces. Management Science, 1998;44(10):1336–50.
144. von Winterfeldt D. Value tree analysis: An introduction andan application to offshore oil drilling. Pp. 349–77 in Klein-dorfer PR, Kunreuther HC (eds). Insuring and ManagingHazardous Risks: From Seveso to Bhopal and Beyond. NewYork: Springer, 1987.
145. Levin IP, Gaeth GJ, Schreiber J, Lauriola M. A new look atframing effects: Distribution of effect sizes, individual differ-ences, and independence of types of effects. OrganizationalBehavior and Human Decision Processes, 2002; 88(1):411–29.
146. Keeney RL, Gregory RS. Selecting attributes to measurethe achievement of objectives. Operations Research, 2005;53(1):1–11.
147. Farquhar PH. Utility assessment methods. Management Sci-ence, 1984; 30(11):1283–300.
148. Johnson EJ, Schkade DA. Bias in utility assessments: Fur-ther evidence and explanations. Management Science, 1989;35(4):406–424.
149. Keller LR. An empirical investigation of relative risk aver-sion. IEEE Transactions on Systems, Man, and Cybernetics,1985; SMC-15(4):475–482.
150. Smidts A. The relationship between risk attitude andstrength of preference: A test of intrinsic risk attitude. Man-agement Science, 1997; 43(3):357–370.
151. Hey JD, Morone A, Schmidt U. Noise and bias in elic-iting preferences. Journal of Risk and Uncertainty, 2009;39(3):213–235.
152. Fishburn PC, Kochenberger GA. Two-piece von Neumann-Morgenstern utility functions. Decision Sciences, 1979;10(4):503–518.
153. Slovic P. The construction of preference. American Psychol-ogist, 1995; 50(5):364–371.
154. McNamee P, Celona J. Decision Analysis for the Profes-sional, 4th ed. Menlo Park, CA: SmartOrg, 2005.
155. Belton V, Pictet J. A framework for group decision using aMCDA model: Sharing, aggregating or comparing individualinformation? Journal of Decision Systems, 1997; 6:283–303.
156. Keeney RL. Common mistakes in making value trade-offs.Operations Research, 2002; 50(6):935–945.
157. Poyhonen M, Hamalainen RP. Notes on the weighting biasesin value trees. Journal of Behavioral Decision Making. 1998;11(2):139–150.
158. Hamalainen RP, Alaja S. The threat of weighting biasesin environmental decision analysis. Ecological Economics,2008; 68(1–2):556–569.
159. Morton A, Airoldi M, Phillips LD. Nuclear risk managementon stage: A decision analysis perspective on the UK’s Com-mittee on Radioactive Waste Management. Risk Analysis,2009; 29(5):764–779.
160. Stillwell WG, von Winterfeldt D, John RS. Comparing hi-erarchical and nonhierarchical weighting methods for elicit-ing multiattribute value models. Management Science, 1987;33(4):442–450.
161. Howard RA. The foundations of decision analysis. IEEETransactions on Systems Science and Cybernetics, 1968;4(3):211–219.
162. Raiffa H. Decision Analysis: Introductory Lectures onChoices Under Uncertainty. Oxford: Addison-Wesley,1968.
163. Howard RA, Matheson JE. Influence diagrams. DecisionAnalysis, 2005; 2(3):127–143.
164. Cox, Jr. LA. What’s wrong with risk matrices? Risk Analysis,2008; 28(2):497–512.
165. Jungermann H, von Ulardt I, Hausmann L. The role of thegoal for generating actions. Pp. 223–236 in Humphreys P,Svenson O, Vari A (eds). Analysing and Aiding DecisionProcesses. Elsevier, 1983.
166. Del Missier F, Ferrante D, Costantini E. Focusing effectsin predecisional information acquisition. Acta Psychologica,2007; 125(2):155–174.
167. Gregory RS, Keeney RL. Creating policy alternatives usingstakeholder values. Management Science, 1994; 40(8):1035–1048.
168. Keeney RL. Stimulating creative design alternatives us-ing customer values. IEEE Transactions on SystemsMan and Cybernetics Part C, 2004; 34(4):450–459.
169. Keller LR, Ho JL. Decision problem structuring: Generatingoptions. IEEE Transactions on Systems Man and Cybernet-ics 1988; 18(5):715–728.
170. Farquhar PH, Pratkanis AR. Decision structuring with phan-tom alternatives. Management Science, 1993 ; 39(10):1214–1226.
171. Phillips LD. A theory of requisite decision models. Acta Psy-chologica, 1984; 56(1–3):29–48.
172. Montibeller G, Franco LA, Lord E, Iglesias A. Structur-ing resource allocation decisions: A framework for build-ing multi-criteria portfolio models with area-grouped op-tions. European Journal of Operational Research, 2009;199(3):846–856.
173. Howard RA. Decision analysis: Practice and promise. Man-agement Science, 1988; 34(6):679–695.
174. Schoemaker PJH. Multiple scenario development: Its con-ceptual and behavioral foundation. Strategic ManagementJournal, 1993; 14(3):193–213.
175. Birnbaum MH. New paradoxes of risky decision making. Psy-chological Review, 2008; 115(2):463–501.