cognitive predictors of aggression, prosocial behaviour
TRANSCRIPT

i
COGNITIVE PREDICTORS OF
AGGRESSION, PROSOCIAL
BEHAVIOUR AND PEER ACCEPTANCE
ACROSS EARLY CHILDHOOD: THE
ROLE OF COOL AND HOT EXECUTIVE
FUNCTION AND THEORY OF MIND
SARAH ELIZABETH O'TOOLE1
A thesis submitted in partial fulfilment of the
requirements of the University of Greenwich
for the Degree of Doctor of Philosophy
September 2016
1 Nèe Poland

ii
DECLARATION
“I certify that this work has not been accepted in substance for any degree, and is not
concurrently being submitted for any degree other than that of Doctor of Philosophy being
studied at the University of Greenwich. I also declare that this work is the result of my own
investigations except where otherwise identified by references and that I have not plagiarised
the work of others”.
Signed
_________________________________________
Sarah E. O'Toole (Student)
_________________________________________
Dr. Claire P. Monks (1st Supervisor)
_________________________________________
Dr. Stella Tsermentseli (2nd Supervisor)
iii
ACKNOWLEDGEMENTS
I would first like to acknowledge my supervisors, Dr Claire Monks and Dr Stella
Tsermentseli. Thank you for giving me this opportunity. I would not have been able to get this
far without your support and encouragement. You both went above and beyond to support me
in this PhD. You have been there to support me through the lows and the highs. I am truly
grateful to you both for making me a better researcher. I would also like to thank Dr Trevor
Thompson, Dr Damian Poulter, and Dr Ian Tharp for their invaluable assistance with my
statistics. Thank you for giving up your time to help. I would like to acknowledge the
University of Greenwich for funding my PhD and for their support with conferences and
training throughout my PhD. I would like to acknowledge the schools, teachers and children
who took part in this research, with special thanks to Sidrah Rafique. I am very grateful to
you all for your participation, enthusiasm and commitment to this research.
I am grateful to have been part of such a great and supportive department and to all
the PhD students. Thank you especially to Katie, Vicki, Claudia and Jess for welcoming me
into the knights and making me feel at home and supporting me through this PhD. Thank you
to Katie Rix (aka. Dodge), who has been a great mentor and friend. Your guidance and
support were invaluable and you are a fantastic Pictionary partner! Jess, I am glad that we
started our PhD together; you have been a great friend and great training course buddy. Vicki
and Claudia, thank you for keeping me going throughout this PhD. You all went out of your
way to make me feel welcome and I will miss us all being the Knights of the Round Table! I
am also incredibly grateful to Michelle Muncey, who is not just a fantastic administrator, but
fountain of all Greenwich knowledge. Thank you for always going out of your way to help
me and answering all my questions!
I would like to acknowledge my amazing family. I am incredibly grateful to my
parents, Lorraine and David, for supporting me to achieve this PhD. You have believed in me
and encouraged me throughout my life and I would not have been able to get here without
you. Thank you to my Grandad for your continued support and encouragement in my studies.
I am especially grateful to you for taking the time to read my publications! Thank you also to
my new family, the O'Tooles, for all your support throughout my years of studying. Lastly, I
would like to say a big thank you to my wonderful husband, Antony. I would never have even
found this PhD without your help. I am so lucky to have you in my life, without your
unconditional love and support, encouragement and belief I would never have made it this far.
You have supported me throughout my years of studying and I am forever grateful to you.
iv
ABSTRACT
Executive function (EF) and theory of mind (ToM) have been linked to children’s social
outcomes, including aggression, prosocial behaviour and peer acceptance. However,
understanding of these relations is limited by the focus of research on broad behaviour categories
and on cool-cognitive EF skills, to the neglect of hot-affective EF, and the lack of longitudinal
studies. This research examined the links between EF, ToM and social outcomes across early
childhood. 106 children (initially 3- to 6-years-old) were assessed at three time points,
approximately 6 months apart, across 12 months. At each time point children completed tasks
assessing their cool EF (inhibition, working memory, planning), hot EF (affective decision
making, delay of gratification), ToM (first- and second-order false belief understanding) and
verbal ability. Teacher reports of children’s proactive and reactive, physical and relational
aggression, prosocial behaviour and peer acceptance were obtained at each time point and Peer
reports were gathered at Time 1. EF, including cool and hot skills, and ToM were more strongly
associated with physical, rather than relational, aggression. However, the role of individual EFs
varied across subtypes of aggression, supporting a multi-dimensional model of aggression that
differentiates between functions and forms. Although initial EF and ToM did not predict change
in social outcomes across early childhood, the role of these cognitive skills changed across time
points. EF and ToM were more strongly associated with social outcomes towards the beginning
of early childhood than towards the end. This may reflect the significant advances in EF and ToM
that were evident across early childhood. Cool EF skills were consistently correlated across time
points, but hot EF skills were not related at any of the time points, suggesting that separable cool
and hot domains of EF may not be apparent in early childhood. The present research emphasised
the importance of examining the link between cognition and behaviour within the context of
development.
v
CONTENTS
1. INTRODUCTION ......................................................................................................................... 14
1.1. Overview of Thesis ............................................................................................................... 17
2. REVIEW OF BACKGROUND LITERATURE .......................................................................... 19
2.1. Chapter Overview ................................................................................................................. 19
2.2. Aggressive and Prosocial Behaviour and their Links to Peer Acceptance ............................ 19
2.2.1. Aggression ......................................................................................................................... 19
2.2.1.1. Function of Aggression ............................................................................................. 20
2.2.1.2. Form of Aggression ................................................................................................... 24
2.2.1.3. Development of Aggression ...................................................................................... 28
2.2.2. Prosocial Behaviour ...................................................................................................... 30
2.2.3. Peer Acceptance ............................................................................................................ 33
2.3. The Relation between Executive Function and Aggression, Prosocial behaviour and Peer
Acceptance ........................................................................................................................................ 35
2.3.1. Executive Function ........................................................................................................ 36
2.3.1.1. Cool and Hot Executive Function ............................................................................. 39
2.3.2. Executive Function, Aggression, Prosocial Behaviour and Peer Acceptance ............... 43
2.3.3. Cool and Hot Executive Function, Aggression, Prosocial Behaviour and Peer
Acceptance .................................................................................................................................... 48
2.4. Theory of Mind, Executive Function, Aggression, Prosocial Behaviour and Peer Acceptance
51
2.4.1. Theory of Mind ............................................................................................................. 52
2.4.1.1. The Link between Executive Function and Theory of Mind .................................... 54
2.4.1.2. Cool and Hot Executive Function and Theory of Mind ............................................ 56
2.4.2. Theory of Mind, Aggression, Prosocial Behaviour, Peer Acceptance .......................... 57
2.5. Developmental Pathways of Aggressive and Prosocial Behaviour and Peer Acceptance:
Integrating the Contribution of Executive Function and Theory of Mind ........................................ 63
2.5.1. Models of Social Behaviour Development ................................................................... 64
2.5.2. Longitudinal Research Examining the Role of Executive Function and Theory of Mind
in Aggression ................................................................................................................................ 65
2.5.3. Intersection of Executive Function, Theory of Mind, Aggression, Prosocial Behaviour and
Peer Acceptance ................................................................................................................................ 68
2.6. Chapter Summary .................................................................................................................. 70
2.7. Present Research ................................................................................................................... 75
3. METHODOLOGY ........................................................................................................................ 80
3.1. Design ................................................................................................................................... 80
3.2. Participants ............................................................................................................................ 81
3.3. Measures ............................................................................................................................... 84
vi
3.3.1. Behaviour ...................................................................................................................... 84
3.3.2. Executive Function ........................................................................................................ 91
3.3.3. Theory of Mind ........................................................................................................... 100
3.3.4. Verbal Ability .............................................................................................................. 103
3.4. Procedure ............................................................................................................................. 103
4. STUDY 1: COOL AND HOT EXECUTIVE FUNCTION AS PREDICTORS OF TEACHER
AND PEER REPORTED PROSOCIAL AND AGGRESSIVE BEHAVIOUR IN EARLY
CHILDHOOD ..................................................................................................................................... 107
4.1. Chapter Overview ............................................................................................................... 108
Introduction ............................................................................................................................. 108
4.3. Method ................................................................................................................................ 110
4.3.1. Design ......................................................................................................................... 110
4.3.2. Participants .................................................................................................................. 110
4.3.3. Measures...................................................................................................................... 110
4.3.4. Procedure ..................................................................................................................... 112
4.3.5. Data Analysis .............................................................................................................. 112
4.4. Results ................................................................................................................................. 113
4.4.1. Preliminary Analysis ................................................................................................... 113
4.4.2. Main Analysis ............................................................................................................. 120
4.5. Discussion ........................................................................................................................... 134
5. STUDY 2: COGNITIVE PREDICTORS OF EARLY CHILDHOOD AGGRESSION AND
PEER ACCEPTANCE ........................................................................................................................ 142
5.1. Chapter Overview ............................................................................................................... 144
5.2. Introduction ......................................................................................................................... 144
5.3. Method ................................................................................................................................ 147
5.3.1. Design ......................................................................................................................... 147
5.3.2. Participants .................................................................................................................. 147
5.3.3. Measures...................................................................................................................... 147
5.3.4. Procedure ..................................................................................................................... 148
5.3.5. Data Analysis .............................................................................................................. 148
5.4. Results ................................................................................................................................. 149
5.4.1. Gender Differences ..................................................................................................... 149
5.4.2. Predictive role of EF and ToM in aggression and prosocial behaviour ...................... 149
5.4.3. Relation of EF, ToM, Aggression and Prosocial Behaviour to Peer Acceptance ....... 159
5.5. Discussion ........................................................................................................................... 164
6. STUDY 3: DEVELOPMENT OF COOL AND HOT EXECUTIVE FUNCTION AND THEORY
OF MIND ACROSS EARLY CHILDHOOD..................................................................................... 170
6.1. Chapter Overview ............................................................................................................... 172

vii
6.2. Introduction ......................................................................................................................... 172
6.3. Method ................................................................................................................................ 174
6.3.1. Design ......................................................................................................................... 174
6.3.2. Participants .................................................................................................................. 175
6.3.3. Measures...................................................................................................................... 175
6.3.4. Procedure ..................................................................................................................... 176
6.3.5. Data Analysis .............................................................................................................. 177
6.4. Results ................................................................................................................................. 178
6.4.1. Change in cognitive abilities over early childhood. .................................................... 178
6.4.2. Relations among cognitive abilities over early childhood .......................................... 191
6.4.3. Predictive Associations between EF and ToM ............................................................ 197
6.5. Discussion ........................................................................................................................... 204
6.5.1. Change in Cognitive Abilities across Early Childhood ............................................... 205
6.5.2. Relations among Cognitive Abilities over Early Childhood ....................................... 208
6.5.3. Limitations .................................................................................................................. 213
6.5.4. Conclusions ................................................................................................................. 214
7. STUDY 4: COGNITIVE PREDICTORS OF EARLY CHILDHOOD AGGRESSION,
PROSOCIAL BEHAVIOUR AND PEER ACCEPTANCE: LONGITUDINAL ASSOCIATIONS . 216
7.1. Chapter Overview ............................................................................................................... 217
7.2. Introduction ......................................................................................................................... 217
7.3. Method ................................................................................................................................ 220
7.3.1. Design ......................................................................................................................... 220
7.3.2. Participants .................................................................................................................. 220
7.3.3. Measures...................................................................................................................... 220
7.3.4. Procedure ..................................................................................................................... 221
7.3.5. Data Analysis .............................................................................................................. 221
7.4. Results ................................................................................................................................. 223
7.4.1. Aggression ................................................................................................................... 223
7.4.2. Prosocial Behaviour .................................................................................................... 249
7.4.3. Peer Acceptance .......................................................................................................... 259
7.4.4. Overall summary ......................................................................................................... 274
7.5. Discussion ........................................................................................................................... 276
7.5.1. Aggression ................................................................................................................... 277
7.5.2. Prosocial Behaviour .................................................................................................... 281
7.5.3. Peer Acceptance .......................................................................................................... 282
7.5.4. Limitations .................................................................................................................. 285
7.5.5. Conclusions ................................................................................................................. 286

viii
8. GENERAL DISCUSSION .......................................................................................................... 288
8.1. Chapter Overview ............................................................................................................... 288
8.2. Summary of Findings .......................................................................................................... 288
8.3. Relation of Findings to the Research Questions ................................................................. 292
8.4. Application of Findings to the Wider literature......................................................308
8.5. Limitations .......................................................................................................................... 323
8.6. Conclusions ......................................................................................................................... 325
8.7. Implications ......................................................................................................................... 326
8.8. Future Directions ................................................................................................................. 328
9. REFERENCES ............................................................................................................................ 330
10. APPENDIX ............................................................................................................................. 378

ix
TABLES
Chapter Three
Table 3.1. Mean age at each time point for the three cohorts................................................... 81
Table 3.2. Age of children at each phase in months ................................................................. 83
Table 3.3. Summary of tasks and variables in the present study ............................................ 106
Chapter Four
Table 4.1. Summary statistics for the predictors and dependent variables............................. 114
Table 4.2. Bivariate correlations between variables ............................................................... 117
Table 4.3. Partial correlations controlling for child age, gender and verbal ability ............... 120
Table 4.4. Hierarchical linear regression results for Teacher reported proactive and reactive
relational aggression ............................................................................................................... 122
Table 4.5. Hierarchical linear regression results for Teacher reported proactive and reactive
physical aggression ................................................................................................................. 127
Table 4.6. Hierarchical multiple regression results for teacher and Peer reported prosocial
behaviour ................................................................................................................................ 129
Table 4.7. Hierarchical linear regression results for Peer reported proactive and reactive
relational aggression ............................................................................................................... 131
Table 4.8. Hierarchical linear regression results for Peer reported proactive and reactive
physical aggression ................................................................................................................. 133
Chapter Five
Table 5.1. Summary statistics for the predictors and dependent variables............................. 149
Table 5.2. Correlations between variables.............................................................................. 151
Table 5.3. Hierarchical regression results for Teacher reported proactive and reactive
relational and physical aggression .......................................................................................... 155
Table 5.4. Hierarchical regression results for Peer reported proactive and reactive relational
and physical aggression .......................................................................................................... 157
Table 5.5. Hierarchical regression results for Teacher and Peer reported prosocial behaviour
................................................................................................................................................ 159
Table 5.6. Hierarchical regression results for peer acceptance .............................................. 161
Table 5.7. Hierarchical regression results for Peer reported acceptance and rejection .......... 163

x
Chapter Six
Table. 6.1. Mean and standard deviations for EF and ToM from Time 1 to Time 3 ............. 179
Table 6.2. Summary of change in cognitive abilities from early to middle childhood .......... 190
Table 6.3. Correlations between Time 1 variables and Time 2 and 3 variables ..................... 192
Table 6.4. Correlations between variables at Time 1 ............................................................. 194
Table 6.5. Correlations between variables at Time 2 ............................................................. 195
Table 6.6. Correlations between variables at T3 .................................................................... 196
Table 6.7. Regression analysis for inhibition as a predictor of ToM ..................................... 198
Table 6.8. Regression analyses for ToM as a predictor of inhibition ..................................... 199
Table 6.9. Regression analyses for planning as a predictor of ToM ...................................... 200
Table 6.10. Regression analyses for ToM as a predictor of planning .................................... 201
Table 6.11. Regression analyses for working memory as a predictor of ToM ....................... 202
Table 6.12. Regression analyses for ToM as a predictor of working memory ....................... 202
Table 6.13. Regression analyses for delay of gratification as a predictor of ToM ................. 203
Table 6.14. Regression analyses for ToM as a predictor of delay of gratification ................. 204
Chapter Seven
Table 7.1. Teacher reported aggression scores for the full sample and for each cohort across
time points .............................................................................................................................. 224
Table 7.2. Correlations across time 1 to 3 for subtypes of aggression ................................... 225
Table 7.3. Time 1 EF and ToM as predictors of initial and development of proactive and
reactive relational aggression ................................................................................................. 234
Table 7.4. Time 1 EF and ToM as predictors of initial and development of proactive and
reactive physical aggression ................................................................................................... 235
Table 7.5. Association among cognitive abilities and aggression at Time 1.......................... 237
Table 7.6. Association among cognitive abilities and aggression at Time 2.......................... 238
Table 7.7. Association among cognitive abilities and social behaviour at Time 3 ................ 239
Table 7.8. Time 1 and 2 EF and ToM as predictors of Time 2 Aggression ........................... 242
Table 7.9. Time 1 to 3 EF and ToM as predictors of Time 3 Aggression .............................. 246
Table 7.10. Teacher reported prosocial behaviour scores for the full sample and for each
cohort across time points ........................................................................................................ 249
Table 7.11. Correlations across time points for prosocial behaviour ..................................... 250
Table 7.12. Time 1 EF and ToM as predictors of initial and development of prosocial
behaviour ................................................................................................................................ 253

xi
Table 7.13. Association among cognitive abilities and prosocial behaviour at Time 1, 2 and 3
................................................................................................................................................ 255
Table 7.14. EF and ToM as predictors of prosocial behaviour at Time 2 and Time 3 ........... 258
Table 7.15. Teacher reported peer acceptance scores for the full sample and for each cohort
across time points ................................................................................................................... 259
Table 7.16. Correlations across time points for peer acceptance ........................................... 260
Table 7.17. Time 1 EF, ToM, aggression and prosocial behaviour as predictors of initial and
development of peer acceptance ............................................................................................. 263
Table 7.18. Correlations between aggression, prosocial behaviour and peer acceptance at
Time 1, 2 and 3 for each cohort……………………………………………………………..268
Table 7.19. Association among cognitive abilities and peer acceptance at Time 1, 2 and 3 . 265
Table 7.20. EF,ToM, aggression and prosocial behaviour as predictors of peer acceptance at
Time 2 and 3 ......................................................................................................................... 2722
Table 7.21. Summary of main findings ................................................................................ 2744

xii
FIGURES
Chapter Three
Figure 3.1. Illustrations used in peer nomination interview ..................................................... 90
Figure 3.2. Images presented in the Fish-Shark Go/No-Go Task.………………….………...94
Figure 3.2. Diagram showing the Tower of London start position and an example test problem
.................................................................................................................................................. 96
Chapter Three
Figure 4.1. The relation between working memory and reactive relational aggression for
children low, average and high in prosocial behaviour .......................................................... 125
Chapter Three
Figure 6.1. Inhibition score across the three time points for boys and girls ........................... 182
Figure 6.2. Changes in mean response time on Go trials of Go/No-Go task ......................... 183
Figure 6.3. Mean working memory score across time and cohort ......................................... 184
Figure 6.4. Average planning score across time and cohort ................................................... 186
Figure 6.5. Mean affective decision making scores for each cohort and for boys and girls .. 187
Figure 6.6. Mean delay of gratification score for each cohort and for boys and girls............ 188
Figure 6.7. Mean ToM score for each cohort at each time point ........................................... 189
Chapter Three
Figure 7.1. Mean proactive relational aggression score (PRA) for each cohort from Time 1 to
3 .............................................................................................................................................. 228
Figure 7.2. Mean reactive relational aggression (RRA) score for each cohort at Time 1 to 3
................................................................................................................................................ 229
Figure 7.3. Mean proactive physical aggression score (PPA) at each time point for the whole
sample ..................................................................................................................................... 230
Figure 7.4. Mean proactive physical aggression (PPA) score for each cohort form Time 1 to 3
................................................................................................................................................ 230
Figure 7.5. Mean reactive physical aggression score (RPA) for each cohort from Time 1 to 3
................................................................................................................................................ 231

xiii
Figure 7.6. Mean scores for subtypes of aggression across the three time points for boys and
girls. ........................................................................................................................................ 232
Figure 7.7. Mean prosocial behaviour score at each time point for the whole sample .......... 251
Figure 7.8. Mean prosocial behaviour score for each cohort from T1 - T3 ........................... 251
Figure 7.9. Mean peer acceptance across the three time points for each cohort .................... 261

14
1. INTRODUCTION
During early childhood important advances are evident in cognitive and social
domains (P. J. Anderson, 2008; Hongwanishkul, Happaney, Lee, & Zelazo, 2005; Wildeboer
et al., 2015). In line with the development of the prefrontal cortex, children show gains in
their ability to regulate their behaviour and emotions (executive function; EF) as well as their
ability to understand the mental states of others (theory of mind (ToM); Best & P. Miller,
2010; Wellman, Cross, & Watson, 2001). It is also around 4-years-of-age in the United
Kingdom that children transition from nursery to more formal schooling and as a result they
are required to integrate into a larger peer group, requiring them to learn to negotiate and
interact with peers. Being able to effectively manage emotions and behaviour and establish
successful interpersonal relationships are important prerequisites for school readiness (Rimm-
Kaufman, Pianta, Cox, Carolina, & Hill, 2006). It has been argued, however, that many
children beginning school are not behaviourally ready for this transition (Blair, 2002).
Children who show impaired self-regulation and social competence face greater difficulties
adjusting to the school environment, learning and relating socially to other children (Hartas,
2011). These children are also at a greater risk not just for short-term, but long-term
academic, social and psychological problems (Blair, 2002; McClelland, Morrison, & Holmes,
2000). Identifying factors that contribute to the successful socialisation of children therefore
has important implications for ensuring that children successfully transition to school and
have positive developmental outcomes.
The ability to competently interact with others is one of the most important
achievements of childhood (Hartup, 1992). Interactions with peers enable children to learn
how to join groups, to form and maintain friendships, to take turns, to avoid conflict and
bullying and to help others. The transition to school provides young children with the
opportunity to form interpersonal relationships (Rubin, Bukowski, & Parker, 1998) and
children begin to develop friendships, as they are more able to hold conversations without the
scaffolding of adults (Dunn, 1994). Thus, experiences with peers constitute an important
developmental context, enabling children to acquire these social skills and to develop
interpersonal relationships. Poor self-regulatory abilities may disrupt children's social skills
development, consequently reducing a child's repertoire of socially appropriate behaviours for
use in interactions with their peers (Eisenberg et al., 1995). Impulsive children, for example,
display more disruptive and aggressive behaviour than children who show low levels of
impulsivity (Hirvonen, Poikkeus, Pakarinen, Lerkkanen, & Nurmi, 2015). Understanding the

15
links between children's emerging cognitive abilities and their developing social behaviours
may therefore have important benefits for children's development.
The main focus of this thesis is on early childhood aggression. Additional secondary
domains of interest are prosocial behaviour and peer acceptance. With the transition to school
children show increased aggressive and prosocial behaviour when negotiating with their peers
(Zsolnai, Lesznyák, & Kasik, 2012). Prosocial behaviour is related to greater school readiness
and academic success, as well as greater social competence and peer acceptance (Chen, Cen,
Li, & He, 2005; Greener, 2000; McClelland et al., 2000). Aggressive behaviour, in contrast,
has been found to result in substantial social, psychological, health and economic
consequences, including: lower academic achievement, poorer social skills, higher
internalising and externalising symptoms, risky behaviours, and peer rejection (Campbell,
Spieker, Burchinal, & Poe, 2006; Chen et al., 2005; Coie, Lochman, Terry, & Hyman, 1992).
This perspective has driven research into the development and prevention of aggression (often
to the neglect of other social behaviours, such as prosocial behaviour; Gentile & Gellig,
2012). However, great variability exists in the motivation for and expression of aggressive
behaviours (Crick, Casas, & Ku, 1999; Dodge, 1991; Ostrov & Crick, 2007). Thus, not all
aggressive children are subject to negative outcomes. Aggression can allow children to obtain
resources and dominance (Hawley, 2002; Pellegrini et al., 2011) and lead to greater peer
acceptance (Poulin & Boivin, 2000). Current approaches to understanding and treating
aggression have typically focused on aggression as a whole; that is a broad category that
includes a range of aggressive behaviours. This approach may be facilitating an incomplete
understanding of aggression.
Aggressive children may not represent a universal group that shows impaired
cognitive abilities (Crick et al., 1999). This view of aggressive children as having poor
behavioural control, limited understanding of others perspectives and being rejected may
therefore be facilitating an incomplete understanding of aggression. Children that are using
aggression to reach a goal or to manipulate social networks may actually demonstrate superior
EF and ToM abilities (Heilbron & Prinstein, 2008; White, Jarrett, & Ollendick, 2012) and
these children may be more accepted within the peer group (Poulin & Boivin, 2000).
Research focusing on the identification of cognitive profiles of aggressive children may
therefore have valuable implications for current understanding of the aetiology, prevention
and treatment of aggression. If aggression can be separated into subtypes that have distinct
relations to cognitive abilities, then this may suggest that different treatment strategies for
aggression are required. Interventions tailored to distinct subtypes of aggression may be more

16
efficacious in reducing aggressive behaviour (Antonius et al., 2010). The research presented
in this thesis will therefore add to current literature by examining the underlying cognitive
mechanisms of and relation to peer acceptance of subtypes of aggression. Though, it is
important that research does not neglect prosocial behaviour development. While much
valuable information can be gained from the study of aggressive behaviour development, it is
also important to examine a range of social behaviours, including prosocial behaviour.
Identifying pathways to reduce childhood aggression may decrease the risk of maladaptive
developmental outcomes. However, identifying factors that can promote prosocial behaviour
development may help children to thrive in their development, including aggressive and non-
aggressive children. The present research will also add to current understanding of the links
between cognitive abilities and prosocial behaviour.
It is important to understand social behaviour development within the context of
childhood. The majority of prior research has examined the links between cognition and
behaviour using correlational or cross-sectional designs (Di Norcia, Pecora, Bombi,
Baumgartner, & Laghi, 2014; Moore, Barresi, & Thompson, 1998; Willoughby, Kupersmidt,
Voegler-Lee, & Bryant, 2011), and the longitudinal associations have been neglected.
Childhood has been differentiated into distinct phases: infancy (0- to 1-years-old); early
childhood, which can be further divided into toddlerhood (1- to 3-years-old) and the pre-
school period (3- to 5-years-old); middle childhood (6- to 9-years-old); late
childhood/preadolescence (9- to 11-years-old); and adolescence (12- to 18-years-old). These
phases of childhood are characterised by distinct developmental challenges (Leman, Bremner,
Parke, & Gauvain, 2012). In early childhood, for instance, children experience advances in
multiple cognitive domains, such as emotional intelligence (Batty & Taylor, 2006),
behavioural regulation (Hughes, Ensor, Wilson, & Graham, 2010), empathy (Moreno, Klute,
& Robinson, 2008), perspective taking (Wellman et al., 2001), and moral understanding
(Lane, Wellman, Olson, LaBounty, & Kerr, 2010). Furthermore, important social
developments are taking place. Children begin school, are required to interact with others
outside their family unit and form and interact within larger peer groups (Rubin et al., 1998).
Understanding the relation between these cognitive abilities and social behaviours across
early childhood, when important developments are taking place, may therefore provide
greater insight into the relation between cognition and behaviour within the context of
development. The research presented in this thesis is the first exploration of the links between
EF (including cool and hot domains), ToM, aggression, prosocial behaviour, and peer
acceptance across early childhood.
17
1.1. Overview of Thesis
The structure of this thesis will be outlined within this section.
In Chapter Two the background literature relating to the areas of focus in this thesis
is reviewed. Previous research and theory relating to aggression, prosocial behaviour, peer
acceptance, EF and ToM, are discussed. Definitions and developmental trends of these social
outcomes and cognitive abilities are first presented. Following this the association between
EF, ToM, aggressive and prosocial behaviour as well as peer acceptance are discussed. The
aims and research questions of the present research are stated and the original contribution of
this thesis to the literature is also outlined.
In Chapter Three the methodology of the research is outlined. The cross-sequential
design (incorporating cross-sectional and longitudinal designs) is described. In addition, the
sample, the measures and the procedure are presented.
Chapters Four, Five, Six and Seven report the four studies that were carried out as
part of this thesis. The first two studies were correlational in design and based on data from
the first time point when children were between 3- and 6-years-old. Chapter Four presents the
first study which investigated the relation between EF, including cool-cognitive and hot-
affective domains, to aggressive and prosocial behaviour. The first study also investigated the
interaction between EF and prosocial behaviour on aggression. The second study, presented in
Chapter Five, extends the first study by investigating the joint contribution of EF and ToM to
aggressive and prosocial behaviour in children between 3- and 6-years-old. The relation
between EF, ToM, aggressive and prosocial behaviour and peer acceptance was also
examined in the second study.
The third and fourth study were longitudinal and build on the first two studies by
examining the development of social behaviours within the context of early childhood.
Chapter Six reports study three which examined the development of cool-cognitive and hot-
affective domains of EF as well as ToM between 4- and 7-years-of-age. The relation of cool
and hot EF skills to one another and to ToM were also explored. Chapter Seven presents
study four which investigates the development of aggression, prosocial behaviour and peer
acceptance from 4- to 7-years-of-age. Further, study four explores the role of EF and ToM in
the development of these social outcomes across the course of a year as well as within each of
the three time points. Within each study chapter there is an overview of the background
18
literature specific to the focus of the relevant study, the method used, the findings and a
discussion of the results.
Chapter Eight includes the general discussion. In this chapter the findings from the
four studies are integrated and related to the research questions presented in Chapter Two.
Further, the contribution of the findings to ongoing debates within the literature are outlined.
The wider implications of the research are also discussed, along with the limitations and
implications of the current research.
19
2. REVIEW OF BACKGROUND LITERATURE
2.1. Chapter Overview
In this chapter the background literature from the main areas of focus in this thesis,
executive function, theory of mind, aggression, prosocial behaviour and peer acceptance will
be reviewed. The links between these areas and the gaps in the field will be highlighted. This
chapter will conclude by outlining the aims and objectives of the current thesis.
2.2. Aggressive and Prosocial Behaviour and their Links to Peer Acceptance
Aggression and prosocial behaviour are broad terms which have been used to
describe a varied range of behaviours. In the following section definitions of these two
behaviours will be outlined. The developmental trends and outcomes of children’s aggressive
and prosocial behaviour will then be discussed. This will include a discussion of the links
between aggressive and prosocial behaviour and peer acceptance. Understanding the typical
development of social behaviour will enable atypical development to be placed in context.
2.2.1. Aggression
A wide range of behaviours are included under the umbrella of aggression and
consequently developing a definition that accurately captures the heterogeneous nature of
aggression has posed a challenge for researchers (Kempes, Matthys, de Vries, & van
Engeland, 2005). During the last few decades definitions of aggression have moved away
from broad and rigid explanations focused exclusively on behavioural processes, to include
intentions and goals (Krahè, 2013). A widely used definition, proposed by Baron and
Richardson (1994), refers to aggression as any behaviour that is carried out against another
living being with the intention of causing them harm. Harm refers to any type of behaviour
which the victim is motivated to avoid, including psychological as well as physical harm. Due
to the varied nature of aggression, subtypes based on the underlying function and form of the
aggressive act have been delineated. Function refers to the purpose or goal of the aggression
(Dodge, 1991) and form refers to the behavioural manifestation of aggression (Crick, Casas,
& Ku, 1999; Lansford et al., 2012; Vaillancourt, Brendgen, Boivin, & Tremblay, 2003). The
function and form of aggression are outlined in more detail below. The present thesis will
follow a multi-dimensional model of aggression that differentiates between function and
form.
20
2.2.1.1. Function of Aggression
A widely accepted dichotomy of aggression based on function differentiates between
reactive and proactive aggression (Dodge & Coie, 1987; Hartup, 1974). Reactive aggression
(also referred to as hostile or affective aggression) describes a defensive reaction to a real or
perceived threat. This type of aggression is considered as being more likely to be driven by
the desire to harm someone and is often associated with anger and frustration (Dodge, 1991;
Ostrov, Murray-Close, Godleski, & Hart, 2013). An example of reactive aggression is a child
who responds to a peer pushing them by hitting the peer. The function of reactive aggression
is therefore to eliminate the threat (Dodge, 1991). Proactive aggression (also known as
instrumental aggression), on the other hand, refers to a more deliberate, coercive behaviour
that is employed in order to achieve a desired goal (Dodge & Coie, 1987; Hartup, 1974;
Vitaro & Brendgen, 2005). This type of aggression is motivated by an individual's desire to
reach their own objectives and can occur without provocation (Dodge, 1991; Dodge & Coie,
1987). An example of proactive aggression is a child who kicks a peer because they want the
toy the peer is playing with. The function of this type of aggression, in contrast, is not based
on the interpretation of a threat, but rather the appraisal that aggression is an effective way of
getting what you want (Crick & Dodge, 1996).
There are three central differences between reactive and proactive aggression
(Bushman & Anderson, 2001; Dodge, 1991). Firstly, the two subtypes have a different
primary goal (Dodge, 1991; Dodge & Coie, 1987). Reactive aggression is carried out with the
ultimate goal of causing harm and eliminating a threat, perceived or actual, whereas in
proactive aggression harm is the means to some other end (e.g. obtaining a desired toy).
Secondly, anger always accompanies reactive aggression, but is not always present in
proactive aggression (Hubbard et al., 2002; Ostrov et al., 2013). Lastly, the subtypes differ in
the degree of planning involved (Kempes et al., 2005). Reactive aggression is viewed as an
impulsive, unplanned behaviour that involves little (if any) consideration of the consequences
of the behaviour. In contrast, proactive aggression is viewed as a premeditated and planned
behaviour, which involves at least some calculation of the rewards and costs. Thus, two
children may carry out the same aggressive act, but with aim of achieving different goals.
This functional dichotomy has its roots in two contrasting theories. Explanations of
reactive aggression have been based on the frustration-aggression model (Berkowitz, 1978;
Dollard, Doob, Miller, Mowrer, & Sears, 1939). The frustration-aggression model posits that
aggression is triggered by perceived frustration; an external interference with an individual’s

21
goal-directed behaviour (behaviour orientated towards attaining a particular goal). According
to this theory, reactive aggression results from the drive to remove the source of frustration
and restore the path to the desired goal. In contrast, social learning theory has been used to
account for proactive aggression (Bandura, 1973, 1983). This theory posits that proactive
aggression is a learned behaviour that is controlled by external rewards. Children learn to
aggress by observing and modelling the aggressive behaviour of others. A child's aggressive
behaviour is reinforced if they perceive this behaviour as leading to rewards. That is, a child
learns to associate aggression with positive outcomes. Understanding of reactive and
proactive aggression has therefore emerged from two different theoretical standpoints.
In line with these different theoretical underpinnings, distinct etiological pathways of
reactive and proactive aggression have been proposed (Dodge, 1991; Dodge & Coie, 1987;
Scarpa, Haden, & Tanaka, 2010). In support of the proposition that reactive aggression is
more a facet of temperament whereas proactive aggression is more reflective of social
learning processes (Dodge, 1991; Vitaro & Brendgen, 2005), reactive aggression has been
found to be under stronger genetic control than proactive aggression (Tuvblad, Raine, Zheng,
& Baker, 2009). Further, anger, fear and hyper-vigilance to threatening stimuli are thought to
underlie reactive aggression (Dodge, 1991; Ostrov et al., 2013; Scarpa et al., 2010). A child
who has been subject to trauma, abuse, harsh parenting or insecure attachments during their
early life, for instance, may be hyper-vigilant to threat and consequently may engage in more
reactively aggressive behaviour. Parents of reactively aggressive children have been found to
be more controlling and punitive (Dickson et al., 2015; Vitaro, Brendgen, & Barker, 2006).
When processing social information children who are reactively aggressive tend to over-
attribute hostile intent to others, particularly in ambiguous social interactions (Social
Information Processing Model; Dodge & Coie, 1987) and are less able to identify their own
and others' emotions (Marsee & Frick, 2007; Orobio de Castro, Merk, Koops, Veerman, &
Bosch, 2005).
Exposure to experiences that enhance a child's repertoire of aggressive responses and
limit their repertoire of non-aggressive responses, on the other hand, is thought to underlie
proactive aggression (Dodge, 1991). Dodge (1991) posited that a child who has been exposed
to high rates of violence in their neighbourhood or amongst their family unit will develop a
greater repertoire of aggressive responses. When these responses are explicitly or implicitly
endorsed by the environment there is a greater chance that these responses will be more easily
accessible in future situations and evaluated more positively, promoting the use of proactive
aggression. In line with this, proactive aggression has been found to be related to the appraisal

22
that aggression is a viable means of reaching a goal (Dodge & Coie, 1987). Proactively
aggressive children are more likely to be exposed to family role models who value the use of
aggression to resolve conflicts or for personal gain (Connor, Steingard, Cunningham,
Anderson, & Melloni, 2004; Dodge, Lochman, Harnish, Bates, & Pettit, 1997). Proactively
aggressive children also tend to focus on the positive outcomes of aggression and neglect
potential negative consequences (Dodge, Lochman, Harnish, Bates, & Pettit, 1997; Marsee &
Frick, 2007; Orobio de Castro et al., 2005). Reactive and proactive aggression may therefore
be largely separable in terms of their etiology.
In addition to distinct etiologies, reactive and proactive aggression have been found
to be associated with contrasting developmental outcomes. Reactive aggression has been
found to be related to other types of externalising behaviour problems (problematic
behaviours directed outwards, e.g. conduct problems, delinquency), as well as internalising
(problematic behaviours directed towards the self, e.g. depression, anxiety), attention
difficulties, low prosocial behaviour and negative peer perceptions of leadership and
cooperation skills in children 6- to 16-years-old (Card & Little, 2006; Fite, Rubens, Preddy,
Raine, & Pardini, 2014; Mathieson & Crick, 2010; Price & Dodge, 1989; Scarpa et al., 2010;
White, Jarrett, & Ollendick, 2012). Added to this, reactive aggression has been found to be
predictive of greater peer victimisation and social withdrawal (Poulin & Boivin, 2000;
Salmivalli & Helteenvuori, 2007). Proactive aggression has also been found to be associated
with delinquency, attention problems and externalising problems, but in contrast was not
related to internalising problems or lower prosocial behaviour (Card & Little, 2006; Price &
Dodge, 1989; Scarpa et al., 2010; White et al., 2012). The link between proactive aggression
and externalising problems may be reflective of the fact proactively aggressive children are
often embedded in social networks of similarly proactively aggressive peers (Bender & Lösel,
1997; Dishion, McCord, & Poulin, 1999). Proactive aggression, though, is not just associated
with negative characteristics. Proactively aggressive children are viewed by their peers as
leaders and as having a sense of humour (Dodge & Coie, 1987; Poulin & Boivin, 2000).
Furthermore, proactively aggressive children are at a lower risk of peer victimisation and
demonstrate lower levels of social withdrawal (Poulin & Boivin, 2000; Salmivalli &
Helteenvuori, 2007).
Although some aggression in childhood is normative (Alink et al., 2006), evidence
indicates that high and consistent reactive aggression is strongly related to adverse outcomes,
but the picture is not so straightforward for proactive aggression. Despite being associated
with some negative outcomes, proactive aggression has also been found to have some positive

23
ramifications for the aggressive individual. This differential pattern of developmental
outcomes may reflect the fact that reactive aggression is more typically associated with
conflict and anger than proactive aggression (Ostrov et al., 2013). Due to its greater
association with anger, reactive aggression may be more salient to observers than proactive
aggression as it may involve emotional dysregulation and frustration. Further due to its more
volatile nature reactive aggression may be viewed more negatively compared to proactive
aggression. However, differential outcomes of reactive and proactive aggression have been
observed across informants (e.g. Mothers and Teachers) and on objective physiological
measures (e.g. heart rate), suggesting that these differences may not merely be a reflection of
the saliency of the behaviours (Poulin & Boivin, 2000; Scarpa et al., 2010; White et al.,
2012).
The distinction between reactive and proactive aggression has faced criticism.
Opponents of the dichotomy have argued that reactive and proactive aggression are highly
correlated and therefore do not represent separable constructs (Bushman & Anderson, 2001).
There is often substantial correlation between the two functional subtypes of aggression, with
highly aggressive children displaying some degree of both reactive and proactive aggression
(Baş & Yurdabakan, 2012; Hubbard, McAuliffe, Morrow, & Romano, 2010; Kempes et al.,
2005; Smeets et al., 2016). Meta-analyses have revealed that the overall correlation between
reactive and proactive aggression is between .64 and .68, with some studies finding
correlations as high as .87 (Card & Little, 2006; Polman, Orobio De Castro, Koops, Van
Boxtel, & Merk, 2007). Only a small subset of children are characterised as exclusively using
reactive or proactive aggression. For example, early research suggested that nearly 50% of
rejected children engage in both reactive and proactive aggression, compared to 9% who only
use proactive aggression and 14% who only engage in reactive aggression (Dodge & Coie,
1987). It has been argued that reactive and proactive aggression are best thought of as
continuous dimensions that exist to varying degrees in each child, rather than as rigid
categories into which children are placed (Hubbard et al., 2010).
However, despite the high correlation between reactive and proactive aggression,
there is strong evidence that a multi-dimensional model is more appropriate than a uni-
dimensional model in explaining aggression in children and adolescents (Poulin & Boivin,
2000). Reactive and proactive aggression although correlated have been found to represent
distinct and separable constructs (Baş & Yurdabakan, 2012; Colins, 2016; Kaat et al., 2014;
Little, Brauner, Jones, Matthew, & Hawley, 2003; Smeets et al., 2016). The consistently high
correlation found between reactive and proactive aggression is not surprising given that

24
studies have frequently confounded the function and form of aggression (e.g. Baş &
Yurdabakan, 2012; Dodge & Coie, 1987; Poulin & Boivin, 2000; Smeets et al., 2016). When
the function (e.g. why the child is aggressive) and form (e.g. how the child is aggressive) of
aggression is taken into account there is stronger evidence for distinct subtypes. For example,
in a sample of 109 children (3- to 6- and 8- to 13-years-of-age) 43% showed reactive and
physical aggression, 18% showed mainly proactive and relational aggression, and 7% showed
high levels of aggression across all subtypes (Frey, Newman, & Onyewuenyi, 2013). While
the functional dichotomy in isolation may be limited in its explanation of childhood
aggression, when applied to the different forms of aggression it may lead to a more complete
understanding of aggression and necessitate different intervention approaches (Barker et al.,
2010; Hubbard et al., 2010; Kempes et al., 2005; Little et al., 2003).
2.2.1.2. Form of Aggression
In addition to different functions, distinct forms of aggression have been outlined
(Crick, Casas, & Ku, 1999; Lansford et al., 2012; Vaillancourt, Brendgen, Boivin, &
Tremblay, 2003).Three main forms of aggression have been identified: physical aggression
which includes actual or threatened physical harm (e.g. hitting, kicking, or threatening to
fight) as well as damage to belongings; verbal aggression which refers to teasing and
ridiculing; and relational aggression which involves acts involving manipulation or damage
(actual or threatened) to a victim’s social relationships through means such as social exclusion
or rumour spreading (Crick et al., 1999; Crick & Grotpeter, 1995; Infante & Wigley, 1986;
Smith, 2011). Both physical and verbal aggression are direct forms of aggression (Björkqvist,
Ősterman, & Kaukiainen, 1992). That is, they take place face-to-face between the perpetrator
and victim. Relational aggression, in contrast, can be either direct (e.g. telling someone they
cannot join in a game) or indirect, occurring behind the victim’s back or involving a third
party (e.g. spreading a rumour about another child). Thus, aggression encompasses a wide
range of behaviours that can occur both overtly and covertly (Björkqvist et al., 1992; Card,
Stucky, Sawalani, & Little, 2008). Cyber aggression is a more recent form of aggression that
has been identified and is defined as behaviour aimed at harming a victim through computers,
mobile telephones, and other electronic devices, and perceived as aversive by the victim
(Hinduja & Patchin, 2008; Ybarra, Diener-West, & Leaf, 2007). However, cyber bullying is
not often evident until later in childhood, possibly due to the more limited literacy skills of
younger children (Monks & Smith, 2006).

25
Relational aggression overlaps heavily with the concept of social aggression. Social
aggression refers to the use of non-confrontational and typically indirect behaviours that
intentionally aim to damage a victims interpersonal relationships and/or their social status
(Galen & Underwood, 1997). Direct and indirect as well as verbal and non-verbal behaviours
are included under the umbrella of social aggression (Underwood, 2003). In addition, socially
aggressive behaviours, such as social exclusion, rumour spreading and negative facial
expressions, tend to require the involvement of members of the social community (Galen &
Underwood, 1997). There are subtle differences between the concepts of relational aggression
and social aggression. Although both forms of aggression are aimed at causing social, rather
than physical harm, relational aggression, in contrast to social aggression, primarily involves
direct behaviours and does not include negative facial expressions or gestures (Crick &
Grotpeter, 1995). Furthermore, unlike social aggression, relational aggression includes both
confrontational (e.g. publically excluding a peer from the group) and non-confrontational acts
(e.g. character defamation) and may or may not involve members of the social community
(Galen & Underwood, 1997). In addition, the term indirect aggression is also frequently used
to describe socially or relationally aggressive behaviours (Björkqvist et al., 1992). However,
this term refers only to covert behaviours. In this thesis the term relational aggression is used
as it best captures the methods of social harm used by children during early childhood. Young
children tend to rely on direct and confrontational methods to achieve social harm (Monks,
Palermiti, Ortega, & Costabile, 2011).
It has been argued that children's use of aggression may vary depending on gender
(Björkqvist et al., 1992). For instance, boys have been found to rely on physical aggression
more than girls (Card, Stucky, Sawalani, & Little, 2008; Crick & Grotpeter, 1995; Hay et al.,
2011; Lussier, Corrado, & Tzoumakis, 2012; Yuan et al., 2014). This gender difference has
been found to emerge early in life (9- to 36-months-old) (Alink et al., 2006; Hay et al., 2011)
and remain into middle childhood and adolescence (Card et al., 2008; Lansford et al., 2012).
The picture is less clear for relational aggression. Research with children 7- to 10-years-old
failed to find any gender differences in relational aggression (Lansford et al., 2012). However,
a study of children 9- to 15-years-of-age found that gender difference in relational aggression
are apparent around 10- to 11-years-of-age, with girls being rated as higher in relational
aggression (R. Smith, Rose, & Schwartz-Mette, 2009). In line with this, Vaillancourt et al.
(2007) found that across middle childhood girls show an increase in relational aggression,
whereas boys show a decrease. Gender differences in physical aggression may therefore

26
emerge early in life, but differences in relational aggression may not be apparent until
children are approaching adolescence.
These gender differences may reflect the fact that girls are often socialised away
from physical aggression (Archer, 2004; Coie & Dodge, 1998) and girls develop verbal and
social-perspective taking skills more rapidly than boys, meaning girls may be better able to
use more subtle, indirect forms of aggression (Crick et al., 1999). Further, girls tend to form
small, intimate social groups, whereas boys form bigger, less defined peer groups
(Lagerspetz, Björkqvist, & Peltonen, 1988). Relational aggression may therefore be a more
effective tactic for manipulating the social context in girls’ peer groups. The nature and
magnitude of gender differences has also been found to vary depending on the reporter (Card
et al., 2008; Zsolnai et al., 2012). Parents, Teachers and Peers tend to report the presence of
gender differences, whereas children themselves do not report gender differences. Teachers
and Parents may be biased by gender stereotypes and perceive gender difference when in
reality there are none. Children, on the other hand, may be less able to self-reflect on their
behaviour and consequently may miss aspects of their own behaviour (Bukowski, Cillessen,
& Velasquez, 2012).
Research into gender differences in aggression that has only considered the form of
aggression may be providing only a partial picture. Form is unlikely to be independent of
function. For example, boys have been found to demonstrate significantly higher levels of
both reactive and proactive direct aggression compared to girls, who showed higher rates of
proactive indirect aggression (Frey et al., 2013; Lussier et al., 2012). Added to this, proactive
aggression has been found to impact preschool (3- to 5-years-old) boys’ and girls’ use of
physical aggression differently (Lussier et al., 2012). Physical aggression was higher amongst
girls who had a greater tendency for proactive aggression. Function of aggression may
therefore influence gender differences in the form of children's aggression. Hence, research
into gender differences in childhood aggression needs to consider both the form and function
of the aggression.
Research that has explored the developmental consequences of engaging in different
forms of aggression has found that both physical and relational aggression are associated with
maladaptive outcomes. For instance, children between 9- to 12-years-old, who demonstrate
higher levels of physical aggression have been found to concurrently exhibit higher levels of
externalising problems, emotional dysregulation, delinquency and conduct problems and to
experience higher rates of later peer rejection (Card, Stucky, & Little, 2008; Crick, 1996;

27
Kawabata & Crick, 2013). In contrast, children rated as relationally aggressive were found to
exhibit higher levels of internalising problems, including increased feelings of loneliness,
depression and isolation, greater peer rejection, as well as delinquency and conduct problems
(Card et al., 2008; Crick & Grotpeter, 1995; Crick, 1996). Both forms of aggression appear to
be associated with adverse social and psychological factors, but physical aggression appears
to be associated more with externalising problems, whereas relational aggression appears to
be associated more with behaviours reflecting internalising problems. Relational aggression,
though, has been found to have some positive correlates. Highly relationally aggressive 4-
year-old children were found to have more mutual friendships (Burr, Ostrov, Jansen, & Crick,
2005) and relationally aggressive adolescents (9- to 13-years-old) have been found to report
more positive qualities, greater intimacy and exclusivity in their friendships compared to
physically aggressive adolescents (Banny, Heilbron, Ames, & Prinstein, 2011; Grotpeter &
Crick, 1996). Though, greater exclusivity and intimacy in friendships is not always positive.
For instance, exclusivity and intimacy have been linked to greater peer rejection (Sebanc,
2003).
Form and function of aggression, however, are likely to interact in their influence on
developmental outcomes. Relational and physical aggression are associated with different
behavioural problems and interaction styles depending on their function (Frey et al., 2013;
Mathieson & Crick, 2010). Reactive relational aggression has been found to uniquely predict
externalising (e.g. disruptive, disobedient, destroys property) and internalising problems (e.g.
withdrawn, lonely, worries), whereas proactive relational aggression only predicted
externalising problems (Mathieson & Crick, 2010). Furthermore, children, between 8- to 11-
years-old, deemed proactively and relationally aggressive have been found to demonstrate
more agreeable interactions towards peers, such as starting conversations (Frey et al., 2013).
In contrast, reactive and proactive physical aggression were both predictive of externalising,
but not internalising, problems (Mathieson & Crick, 2010). Reactive physical aggression has
been found to be associated with an argumentative interaction style and increased rough and
tumble play (Frey et al., 2013). Hence, when evaluating the developmental outcomes of
aggression, it is important to consider the function as well as the form of aggression.
Despite strong evidence that distinct forms of aggression associated with different
correlates and outcomes exist, previous research has often found that physical and relational
aggression are significantly correlated (R. Smith et al., 2009). Only a small minority of
children can be classified as predominately physically or relationally aggressive. There is
though strong support that physical and relational aggression represent dissociable constructs.

28
For example, a two factor structure, including physical and relational aggression, was
supported in children between 7- to 10-years-old across nine countries (e.g. USA, China,
Colombia, Kenya), supporting the existence of multiple forms of aggression (Lansford et al.,
2012). Further, an accelerated longitudinal study of children between 4- to 11-years-old
suggested that the distinction between physical and relational aggression was evident at 4-
years-of-age and remained stable from 4- to 11-years-of-age (Vaillancourt et al., 2003).
2.2.1.3. Development of Aggression
The frequency and nature of aggression changes with development. In early
childhood, children typically engage in more direct, overt forms of aggression (Monks, Smith,
& Swettenham, 2003). In typical development, direct physical aggression begins to increase
around 8- to 12-months-of-age and peaks around 2- to 3-years-old (Alink et al., 2006; Nærde,
Ogden, Janson, & Zachrisson, 2014). Direct physical aggression then typically declines over
early childhood (Alink et al., 2006). This developmental pattern of physical aggression is
evident for boys and girls (Alink et al., 2006; Gray, Carter, Briggs-gowan, Jones, &
Wagmiller, 2014). This decline in physical aggression (Broidy et al., 2003) may reflect the
fact that with age physical aggression becomes increasingly less socially acceptable and the
potential negative consequences of physical aggression (e.g. social difficulties, school
exclusion, physical harm) increase (Tremblay, 2000). However, not all children follow this
normative decreasing trajectory; there is variation between children (Gray et al., 2014). A
study which followed 572 children from 1.5- to 3.5-years-of-age, for instance, identified three
distinct trajectories of physical aggression (Tremblay et al., 2004). The majority of the sample
(58%) followed a trajectory of increasing modest physical aggression, but there was also a
group which showed little or no physical aggression (28%) and a group that showed a high
and increasing aggression trajectory (14%). Although an increase in aggression during
toodlerhood is therefore considered normative, some children still show higher or lower levels
of aggression than others.
The preschool period appears to be characterised by a further increase in aggressive
behaviour. For example, more children assumed hostile bullying roles at 4- to 6-years-of-age
than 3-year-old-children (Belacchi & Farina, 2010). Bullying refers to a systematic abuse of
power that involves repeated aggressive acts against a victim that cannot easily defend
themselves (Olweus, 1999; Rigby, 2002). Further, in situations that are frustrating for the
child themselves (e.g. if they were hit by a peer or a peer took their toy), 4- to 5-year-old
children engaged in higher rates of direct physical and verbal aggression than children 3-

29
years-of-age (Zsolnai et al., 2012). Some aggression may therefore be normative during
toddlerhood and the preschool period. This early reliance on direct physical aggression has
been proposed to reflect the limited verbal and social skills of young children (Björkqvist et
al., 1992). As children move into middle childhood and adolescence and develop greater
verbal skills and social intelligence, they increasingly rely on more indirect, covert forms of
relational aggression, which likely reflects the more sophisticated nature of indirect relational
aggression (Björkqvist et al., 1992). Young children, though, have been found to be capable
of engaging in relational aggression, albeit in its more direct forms (Crick et al., 1999; Monks
et al., 2011). Increased relation aggression may reflect the fact that it is seen as a more
socially acceptable behaviour than physical aggression (Murray-Close & Crick, 2006) and
thought to be less likely to lead to punishment by adults (Goldstein & Tisak, 2006).
There is, though, variation in aggressive behaviour development across early
childhood to adulthood. A study that investigated trajectories of aggression in children from
1.5- to 6-years-of-age found that although some children showed a decrease in their physical
and relational aggression, others showed an increase (Wildeboer et al., 2015). Further, two
distinct developmental trajectories of aggression were found for indirect relational aggression
between 4- and 10-years-of-age: a low stable path and an increasing path (Vaillancourt,
Miller, Fagbemi, Côtè, & Tremblay, 2007). The majority of children follow a declining
trajectory of relational and physical aggression from 10- to 18-years-of-age, but a small
number of children show an increase (Cleverley, Szatmari, Vaillancourt, Boyle, & Lipman,
2012; Xie, Drabick, & Chen, 2011). Although there is individual variation, overall evidence
suggests that direct physical and relational aggression peak in early childhood, whereas
indirect aggression is more frequent in later childhood.
Gender differences in the development of aggression, particularly relational
aggression, are apparent. Girls showed higher levels of relational aggression at 8-years-old
and did not exhibit a decline in relational aggression from 8- to 11-years-old, compared to
boys who had a lower initial rate of relational aggression and did show a decline (Spieker et
al., 2012). In line with this, relational and physical aggression followed increasing trajectories
for girls, but not boys from 9- to 10- to 10- to 11-years-of-age (Kawabata & Crick, 2013).
Relational and physical aggression remained relatively stable for boys. Added to this,
different patterns of physical and relational aggression between boys and girls were identified
in a sample of children between 11- to 12-years-old who were followed over a three year
period (Yuan et al., 2014). Highly physically aggressive boys followed a stable trajectory,
whereas highly physically aggressive girls showed a decreasing trajectory. For children low in

30
relational aggression, boys demonstrated an increasing trajectory, while girls showed a stable
trajectory. Further, for moderately relationally aggressive children, boys exhibited an
increasing trajectory, whereas girls demonstrated a decreasing trajectory.
Compared to the development of forms of aggression, the development of reactive
and proactive aggression has been less widely researched. Reactive and proactive aggression
have been posed to follow similar developmental trajectories, at least in adolescence (Barker,
Tremblay, Nagin, Vitaro, & Lacourse, 2006; Fite, Colder, Lochman, & Wells, 2008). For
instance, reactive and proactive aggression have been found to follow similar trajectories in
adolescent males between 13- to 17-years-of-age (Barker et al., 2006). The trajectories
identified included: a high-stable group (that showed a peak around 15-years-of-age), a
moderate-decreasing group, and a low-stable group. The majority of adolescents (50%) were
assigned to the low-stable group. A study that followed children from an earlier age (7- to 12-
years-of-age) also identified similar trajectories for reactive and proactive aggression (Cui,
Colasante, Malti, Ribeaud, & Eisner, 2015). Three trajectories were identified for reactive
aggression: high-stable, moderate-decreasing and low-increasing. Three trajectories were also
identified for proactive aggression: high-decreasing, low-increasing and low-stable. Despite
strong individual variation, when investigating different functions and forms of aggression it
is therefore important to consider the developmental stage of the children being studied.
2.2.2. Prosocial Behaviour
To date the vast majority of research into children's social behaviour has focussed on
maladaptive behaviours, and positive social behaviours, like prosocial behaviour, have been
less widely researched. Prosocial behaviour refers to intentional, voluntary acts that have
beneficial results for another person (Eisenberg, 1990). Behaviours such as sharing,
cooperating, helping and comforting are considered prosocial (Hughes & Ensor, 2010;
Kakavoulis, 1998). These behaviours can be carried out for egoistic, practical or other-
orientated reasons. If a behaviour benefits another person then it is considered prosocial, in
spite of whether it is carried out for altruistic or self-beneficial reasons (Hay, 1994). Children
as young as 12-months-old have been found to be capable of demonstrating prosocial
behaviour, particularly helping and comforting behaviours (Kakavoulis, 1998). By 3-years-
of-age the majority of children show some prosocial behaviours (Baillargeon & Normand,
2011).

31
As children develop beyond toddlerhood, their level of prosocial behaviour has
typically been found to increase, particularly rates of helping, sharing and comforting
(Jackson & Tisak, 2001). Children between 3- and 5-years-of-age frequently demonstrate
prosocial acts, including cooperating, helping and sharing (Cassidy et al., 2003). Further, an
increasing number of children between 3- and 6-years-of-age have been found to demonstrate
prosocial behaviour in bullying situations (Belacchi & Farina, 2010). That is, older children
were more likely to act as defenders, standing up to the bully on behalf of the victim,
consolers, comforting the victim, and mediators, negotiating between the victim and the bully.
Though, children in early childhood (3- to 5-years-old) behave more prosocially and expect to
receive more prosocial behaviour when there is no cost to themselves (Paulus & Moore,
2014).
Prosocial behaviour is thought to increase with age as a function of successful
socialisation, cognitive maturation and emotional regulation. Children who witness parents,
peers or others model prosocial behaviours are more likely to engage in prosocial behaviours
themselves (Hay, 1994). Children between 3- to 5-years-old, for example, demonstrated more
prosocial behaviours if they nominated a prosocial best friend (Eivers, Brendgen, Vitaro, &
Borge, 2012). Though, this may reflect the fact that children seek out friendship groups of
similar peers (Hamm, 2000). The development of greater prosocial moral reasoning and
perspective taking abilities has also been linked to increased prosocial behaviour. Children (4-
to 5-years-old) and adolescents (15-years-old) who engaged in more other orientated prosocial
moral reasoning and showed stronger perspective taking abilities demonstrated higher levels
of prosocial behaviour (Laible, Murphy, & Augustine, 2014; P. Miller, Eisenberg, Fabes, &
Shell, 1996). In addition, empathy (understanding and sharing the feelings or another
individual) has also been linked to prosocial behaviour. Adolescents who showed higher
levels of empathy engaged in higher levels of prosocial behaviour (Laible et al., 2014).
Although there is strong evidence that prosocial behaviour increases with age, there
is debate as to whether this is true for all types of prosocial behaviour. In particular there is
mixed evidence regarding cooperation. Some research has found that cooperation increases
with age (Marcus, Telleen, & Roke, 1979), while other research has found it decreases with
age (Jackson & Tisak, 2001). This may reflect the fact that prosocial behaviour undergoes
increasing differentiation during early childhood (Paulus & Moore, 2014). Children between
4- to 5-years-old (but not 3-year-old children) differentiated between a friend and a disliked
peer in their sharing behaviour. That is, 4- and 5-year-olds were more likely to share with a

32
friend than a disliked peer, than 3-year-old children, who did not differentiate. Different
prosocial behaviours may therefore follow varying developmental trajectories.
There may also be gender differences in the development of prosocial behaviour.
Although some research has failed to find gender differences in early childhood (Yagmurlu,
2013), the majority of evidence suggests the presence of a gender difference favouring girls in
prosocial behaviour (Fabes & Eisenberg, 1998). Girls have been found to be more likely to
start exhibiting prosocial behaviour between 2- and 3-years-of-age than boys, who were
actually more likely to stop displaying prosocial behaviour during this period (Hay, 1994).
Girls, 3- to 6-years-old, are also more likely to assume prosocial defending roles in bullying
situations compared to boys (Belacchi & Farina, 2010). Gender differences, though, have
been found to be greater when prosocial behaviour was assessed based on self- or other-
reports than observational methods (Fabes & Eisenberg, 1998). Gender differences in
prosocial behaviour may reflect, at least in part, gender stereotypes (Eisenberg, Spinrad, &
Knafo-Noam, 2015).
Prosocial behaviour has been found to be associated with a host of positive
outcomes. Children who demonstrate prosocial behaviour tend to benefit from more frequent
positive interactions with peers between 3- and 4-years-of-age (Farver & Branstetter, 1994)
and siblings between 1.5- and 2-years-of-age (Dunn & Munn, 1986) and are better able to
negotiate the demands of family and school environments (Gresham, 1998). It is not just the
presence of maladaptive social behaviours that leads to negative developmental outcomes, but
also the absence of adaptive behaviours like prosocial behaviour. Indeed, prosocial behaviour
has been found to predict adjustment in the transition to school (McIntyre, Blacher, & Baker,
2006). Children who were rated by Parents and Teachers as lower in social skills
demonstrated higher levels of internalising and externalising behaviour problems, attention
problems and had more negative Teacher relationships. Increased prosocial behaviour in
young children may therefore be associated with positive developmental ramifications.
Just because a child is prosocial, however, does not mean that the child is not also
aggressive. Prosocial behaviour and aggression do not always occur in isolation (Hawley,
2002). Prosocial and aggressive behaviour may reflect normative ways of children learning to
manage peer conflict. In conflict situations, including being teased by a peer or social
exclusion, children between 4- to 6-years-old engaged in more aggressive (e.g. hitting) and
prosocial (e.g. negotiation) strategies than 3-year-old children (Zsolnai et al., 2012). Some
children, though, have been found to use aggressive and prosocial strategies interchangeably

33
to gain dominance, control resources, influence play and achieve a high status among peers
(Hawley & Little, 1999; Hawley, 2002; Pellegrini et al., 2011; Vaughn, Vollenweider, Bost,
Azria-Evans, & Blake, 2003). These children have been referred to as bistrategic controllers
(Hawley, 2002). Despite their tendency for high levels of relational and physical aggression,
these children are often well liked within the peer group and experience higher levels of
intimacy and fun in their friendships, although their friendships are also characterised by high
levels of conflict (Hawley, Little, & Card, 2007). Bistrategic controllers contradict the
traditional view of aggressive children as socially inept. Indeed, bistrategic controllers have
well developed social skills and moral understanding (Hawley, 2003). Some children may
therefore be highly skilled in using both prosocial and aggressive strategies for their own
personal gain when interacting with the peer group. Further research therefore needs to
consider the development of both aggressive and prosocial behaviour as well as their
interaction.
2.2.3. Peer Acceptance
Entry into formal schooling provides young children with the opportunity to
develop inter-personal relationships (Rubin, Bukowski, & Parker, 1998). Children, even in
early childhood, form groups that possess common goals and rules of conduct and such
groups have a dominance hierarchy (Beazidou & Botsoglou, 2016). In the context of a peer
group, a child has a social standing that is defined by their social status and outlines their
relation to the peer group (Rubin et al., 1998). Several terms have been used to refer to
children's relations with their peers, including peer acceptance and popularity (Doll, 1996).
Peer acceptance is the extent to which a child is socially accepted and liked by their peers
(Doll, 1996). Although sometimes used interchangeably, the term popularity is not equivalent
to peer acceptance. Popularity can refer to both sociometric popularity (like peer acceptance)
or perceived popularity (well known, socially central children who are not necessarily well
liked; Cillessen & Marks, 2011). Both peer acceptance and popularity refer to the degree to
which children are accepted within the peer group. Peer rejection, on the other hand, refers to
the extent to which children are rejected or disliked by their peers, and is also commonly
assessed in relation to children's social standing (Newcomb & Bukowski, 1983). This thesis
focuses on peer acceptance and rejection as the current research is interested in children's
sociometric standing. Peer acceptance and rejection reflect the extent to which the group
accepts or rejects the child, opposed to the child's own view of their standing within the group
(Bagwell, 2004; Bukowski, Pizzamiglio, Newcomb, & Hoza, 1989).
34
Children become increasingly concerned with their social standing within the
peer group across childhood and adolescence as integration into the peer group becomes a
major concern (Parker, Rubin, Erath, Wojslawowicz, & Buskirk, 2006; Silk et al., 2012).
Children's peer acceptance, though, has been found to be relatively stable across childhood
(Coie, 1990), even during early childhood (Walker, 2009). Peer acceptance and rejection
reflect independent dimensions of social standing; children may receive both positive and
negative nominations from peers and acceptance and rejection appear to make unique
contributions to children's adjustment (Bukowski et al., 1989). Greater peer acceptance, for
example, has been linked to higher academic achievement (O’Neil, Welsh, Parke, Wang, &
Strand, 1997) and lower feelings of loneliness and social dissatisfaction in children and
adolescents (Parker & Asher, 1993). Greater peer rejection, in contrast, was related to
decreases in academic achievement, poorer adjustment to school and internalising and
externalising behaviour problems in childhood and adolescence as well as psychological
disorders in adolescence (Buhs, Ladd, & Herald, 2006; Coie et al., 1992).
Peer acceptance and rejection are strongly related to children's aggressive and
prosocial behaviour (Farver & Branstetter, 1994; Salmivalli & Helteenvuori, 2007). Prosocial
children are more accepted by their peers (Farver & Branstetter, 1994), whereas aggressive
children are more rejected by their peers (Card & Little, 2006). However, understanding of
the relation between the function and form of aggression and peer acceptance is limited. Some
studies have found that both reactive and proactive aggression are associated with peer
rejection across childhood and adolescence (Card & Little, 2006), whereas other studies have
found that reactive aggression, contrary to proactive aggression, is related to greater peer
rejection and victimisation (Poulin & Boivin, 2000; Salmivalli & Helteenvuori, 2007) and
fewer reciprocal friendships (Brendgen, Vitaro, Tremblay, & Lavoie, 2001; Raine et al.,
2006). Some research has suggested that proactive aggression is associated with greater peer
acceptance (Poulin & Boivin, 2000). The finding that reactive aggression is more strongly
related to peer rejection and proactive aggression is more strongly associated with peer
acceptance may account for why reactive, but not proactive aggression, is associated with
internalising symptoms (Morrow, Hubbard, McAuliffe, Rubin, & Dearing, 2006; Pedersen,
Vitaro, Barker, & Borge, 2007).
Physical and relational aggression have both been linked to peer rejection in children
between 9- to 12-years-old (Card et al., 2008; Crick, 1996; Grotpeter & Crick, 1996;
Kawabata & Crick, 2013). Relationally aggressive children may not always be rejected.
Controversial preschool age children (children who receive positive and negative peer

35
nominations) have been found to engage in higher levels of relational aggression (Nelson,
Robinson, & Hart, 2005). However, gender may influence the relation between peer
acceptance and form of aggression. Girl's relational aggression was positively correlated with
acceptance by boys, but not girls, during middle childhood to adolescence (8- to 14-years-of-
age), whereas boy's relational aggression was positively correlated with acceptance by boys
and girls during middle childhood to adolescence (R. Smith et al., 2009). Physical aggression
was negatively correlated with peer acceptance for boys and girls. While physical aggression
appears to be linked to lower peer acceptance, relational aggression appears to be associated
with greater peer acceptance, at least in girls.
2.3. The Relation between Executive Function and Aggression, Prosocial behaviour
and Peer Acceptance
Theories of aggression no longer consider aggression as one heterogeneous category,
but rather distinguish between the different underlying functions and forms of aggression
(Dodge, 1991; Dodge & Coie, 1987; Grotpeter & Criek, 1996). Different developmental
trajectories, aetiologies, and preceding factors have been proposed, suggesting that
heterogeneous paths lead to the different types of aggression (Hubbard et al., 2010; Kempes et
al., 2005). However, research into the antecedents and underlying mechanisms of aggression
has continued to largely ignore the function and form of aggression. This is particularly true
of the executive function (EF) literature. EF has been implicated in children's social behaviour
(Jacobson, Williford, & Pianta, 2011) and despite emerging evidence that the relation between
EF and aggression may vary depending on the function and form of aggression (Heilbron &
Prinstein, 2008; Rathert, Fite, Gaertner, & Vitulano, 2011; White et al., 2012), the majority of
research has continued to focus on the role of EF in aggression as a whole. Understanding the
relation between EF and the different functions and forms of aggression will lead to a more
complete understanding of aggression. Further, the differentiation between cognitive and
affective EF skills offers the potential to shed a new light not just on the development of
aggression, but also prosocial behaviour development and peer acceptance.
This section of the literature review will begin by defining the term EF and will
outline its organisation, neurological underpinnings, and development. It will explore the
distinction between cool and hot EF, which may shed a new light on research into the real-
world applications of EF. This section will then go onto discuss the current state of the
literature that has examined the association between EF and children's aggressive and
prosocial behaviour development as well as peer acceptance.

36
2.3.1. Executive Function
Numerous definitions of executive function (EF) have been put forward, but as of yet
no one definition has been widely adopted (De Luca & Leventer, 2008). Common themes,
though, are apparent across definitions (P. Anderson, 2008; De Luca & Leventer, 2008). For
instance, most definitions conceive of EF as an umbrella term that encompasses a range of
interrelated, higher-order cognitive processes that are responsible for goal-directed, future-
orientated behaviour (Gioia, Isquith, & Guy, 2001; Goldstein, Naglieri, Princoptta, & Otero,
2014; Lezak, 1982). In other words, EF is like the brain’s conductor; it is responsible for
controlling, organising and directing an individual's cognitive activity, emotional responses
and behaviour in order to achieve a goal. EF is essential for every-day adaptive behaviour,
especially when individuals are presented with novel tasks or situations (V. Anderson, P.
Anderson, Jacobs, & Spencer-Smith, 2008). Children with impaired EF, for example, are
likely to show impairments in their ability to manage home, school and social situations; they
may present as impulsive, disorganised and demonstrate an inability to plan actions in
advance, a resistance to change activities and a failure to learn from mistakes (P. Anderson,
2008).
A further common theme across definitions is that EF is a multifaceted construct,
encompassing independent factors that typically work together (Peterson & Welsh, 2014). A
definitive conclusion, however, as to which cognitive processes should be included under the
umbrella of EF has yet to be reached (Goldstein et al., 2014). This may largely reflect the fact
that many cognitive processes have been suggested to represent EF subcomponents, some of
which are strongly related to one another (Best, P. Miller, & Jones, 2008; Otero & Barker,
2014). There is, though, ongoing debate as to whether these EF processes form a unitary
construct or represent distinct factors of EF, particularly during early childhood. Some
research has found that EF is best described as a single construct in young children (Fuhs &
Day, 2011; Hughes, Ensor, Wilson, & Graham, 2010; Wiebe, Espy, & Charak, 2008; Wiebe
et al., 2011), whereas other research has supported the existence of separable, but related, EF
skills (Best et al., 2008; Diamond, 2006; Isquith, Gioia, & Espy, 2004).
A highly influential model of EF was proposed by Miyake and colleagues (2000).
This model proposed that EF includes three separable factors: (1) working memory: the
ability to hold information in mind and manipulate it; (2) cognitive flexibility: the ability to
flexibly switch perspectives; and (3) inhibition: the ability to ignore distraction and to
withhold a dominant response in favour of another response. This model was developed based
37
on data collected from an adult sample. However, this three factor model has been supported
in early childhood (2- to 5-years-old; Isquith et al., 2004) and later childhood (8- to 13-years-
old; Lehto, Juujärvi, Kooistra, & Pulkkinen, 2003). Diamond (2006) proposed that these core
EF components provide the basis for more complex EF skills to develop, including planning,
reasoning and problem solving. In addition to the foundational EFs described by Miyake and
colleagues (2000), planning is frequently cited in the literature as a critical goal-orientated
behaviour (Best et al., 2008). Planning has been posited to be essential to goal setting because
it involves the ability to plan actions in advance and approach tasks in an organised, strategic
and efficient manner (P. Anderson, 2002). A three factor EF structure, including behavioural
regulation (e.g. inhibition, self-monitoring), emotional regulation (e.g. emotional control,
shifting) and metacognition (e.g. working memory, planning) in individuals between 5- to 18-
years-of-age has been supported (Gioia, Isquith, Retzlaff, & Espy, 2002). The afore-
mentioned models of EF therefore identify a range of cognitive skills that form EF, used in
affectively neutral situations. It should be borne in mind that although models identify
separate EF subcomponents, this does not necessarily indicate that the neurocognitive
processes underlying these factors is fully understood (Zelazo et al., 2003).
The prefrontal cortex (PFC) is thought to mediate EF (Otero & Barker, 2014). The
PFC forms part of the frontal lobes. The frontal lobes comprise the largest area of the brain,
accounting for nearly one-third of the cerebral cortex, and are located at the most anterior
region of the brain (Damasio, Anderson, & Tranel, 2011). Historically, the terms 'EF' and
'frontal lobe functioning' have been used interchangeably by researchers, reflecting the finding
of neuropsychological studies that individuals who experience damage to their PFC
demonstrate severe problems controlling and regulating their behaviour (Stuss & Alexander,
2000). Further, the PFC shows significant activation when individuals are performing EF
tasks (Baker et al., 1996). However, PFC functioning does not equate to EF; EF likely reflects
complex interactions between many brain regions (Otero & Barker, 2014). Indeed, the PFC
has connections to numerous other brain regions, including the brain stem, occipital,
temporal, parietal lobes, as well as limbic and subcortical regions (Fuster, 1993) and damage
to the PFC does not always result in EF deficits (Della Salla, Gray, Spinnler, & Trivelli,
1998). Further, diffuse brain injury can lead to impaired EF (Stuss, 2006). PFC functioning
and EF are therefore now considered distinct but related constructs (Stuss, 1992, 2006). Intact
EF may be strongly related to PFC functioning, but not exclusively related.
Historically it was believed that EF did not develop until early adolescence (Isquith,
Crawford, Espy, & Gioia, 2005). However, there is now evidence to the contrary. Research

38
has found that EF skills can be seen around the end of the first year of life (P. Anderson,
2008) and continue to develop into adolescence and even adulthood (Zelazo et al., 2013).
These gains in EF parallel the development of the PFC (Anderson, 1998; Happaney, Zelazo,
& Stuss, 2004). Both are known to be present in an immature state in young children and
follow a protracted developmental course through adolescence and into adulthood (Steinberg,
2005). Early childhood, though, is a particularly important period for EF development;
between 3 and 6-years-of-age substantial gains in EF are demonstrated (Best & P. Miller,
2010; Garon, Bryson, & Smith, 2008). The PFC also shows significant growth during this
period (Anderson, 1998; Happaney, Zelazo, & Stuss, 2004). Significant improvement in
children's performance on measures of inhibition, working memory, flexibility and planning
have been found between 4- and 6-years-of-age (Fuhs & Day, 2011; Hughes et al., 2010;
Hughes & Ensor, 2011). However, younger children (5-year-olds) demonstrate greater
improvement during the transition to school compared to older children (6-year-olds)
(Röthlisberger, Neuenschwander, Cimeli, & Roebers, 2013). Early childhood may represent a
period of high malleability for EF (Zelazo & Carlson, 2012). Although significant gains in EF
are witnessed during early childhood, advances continue to be seen into adulthood (Brocki &
Bohlin, 2004; Gur et al., 2012).
Individual EF skills, however, have been found to follow distinct developmental
pathways. Inhibition emerges first and is relatively stable by 5- or 6-years-of-age, whereas
other EF subcomponents, such as working memory and planning, show more protracted
development and do not reach adult levels of proficiency until much later (Smidts, Jacobs, &
Anderson, 2004; Welsh, Pennington, & Groisse, 1991). Further, while development of some
EF components, such as attention can be seen to plateau as individuals approach adulthood,
performance in other domains, such as flexibility, show continued improvement for 6- to 17-
years-of-age and therefore may not reach maturity until later on in development (Zhan et al.,
2010). Working memory also continues to show advances in preadolescence, unlike inhibition
(Brocki & Bohlin, 2004). Added to this, early emerging fundamental EFs may be essential for
the development of more complex EF skills. Inhibition at 8- to 11-years-of-age predicted
working memory at 12- to 15-years-of-age (Tillman, Brocki, Sørensen, & Lundervold, 2015).
Inhibition and working memory were significantly related to one another and both predicted
planning ability in children 2- to 6-years-old (Senn, Espy, & Kaufmann, 2004). Interestingly,
inhibition was a stronger predictor of planning in younger children (2- to 4-years-old),
whereas working memory was more strongly related to planning in older children (4- to 6-
years-old). The association between EF abilities may therefore change as children develop.

39
2.3.1.1. Cool and Hot Executive Function
Traditionally, EF has been viewed through a purely cognitive lens, meaning the role
of emotion and motivation in EF has largely been neglected (Peterson & Welsh, 2014).
Zelazo and Müller (2002) paved the way for research focussing on the more affective side of
EF when they posited that EF, along with its supporting neural systems, varies as a function
of motivational significance (Zelazo & Carlson, 2012). These researchers proposed a model
of EF that differentiates between cool and hot EF. Cool EF refers to the more purely cognitive
skills that are elicited by relatively abstract, decontextualized problems (Zelazo & Müller,
2002). When an individual engages in a cool EF task the stimuli do not have an emotional
influence on cognitive processes. For example, the Dimensional Change Card Sort Task,
which requires children to sort cards first according to one dimension (e.g. colour) and then to
switch to another dimension (e.g. shape), is abstract and artificial in nature, and does not
result in any meaningful consequences for the child. Whereas hot EF denotes the more
affective aspects of EF, that are evoked by problems that are emotionally and motivationally
significant. Thus, hot (opposed to cool) EF is required when an individual is trying to solve a
problem that has meaningful consequences for them (Zelazo, Qu, & Müller, 2005). For
instance, the marshmallow test, in which a child is given the choice of eating one
marshmallow immediately or two later, reflects a more realistic, everyday use of EF and has
meaningful consequences for the child. Hot EF may be required for problems in the domain
of self and social understanding. Social situations are almost always motivationally significant
because other people’s behaviour frequently has emotional and meaningful consequences for
those involved (Zelazo & Müller, 2002; Zelazo et al., 2005).
It is only relatively recently that research has begun to consider hot as well as cool
EF and, as a result, understanding of the organisation and development of hot EF lags behind
that of cool EF (Peterson & Welsh, 2014; Zelazo & Müller, 2002). Cool EF is purported to
include those cognitive skills traditionally perceived to encompass EF, such as inhibition,
working memory and cognitive flexibility, when used in affectively neutral situations (Zelazo
& Müller, 2002; Zelazo & Carlson, 2012). In contrast, hot EF has been suggested to include
affective cognitive abilities. Examples of affective cognitive skills include: the ability to delay
gratification, that is being able to forego immediate rewards in order to obtain later larger
rewards (Mischel, Shoda, & Rodriguez, 1989), as well as affective decision making, which
refers to the ability to make decisions regarding events that have motivationally significant
consequences, such as meaningful rewards and losses (Kerr & Zelazo, 2004). However, there
is some contradiction in the literature regarding the organisation of hot EF. While some
40
researchers have posited that social-cognitive abilities, such as theory of mind, emotional
intelligence and moral judgement, are subcomponents of hot EF (e.g. V. Anderson et al.,
2008), others have suggested that although the manifestation of these abilities is closely
associated with hot EF, they are not representative of hot EF (e.g. Zelazo, Qu, & Müller,
2005). Further research in this area is therefore essential to better understand the relation
between social-cognitive abilities, such as theory of mind, and hot EF.
Different brain regions have been purported to underlie cool and hot EF, supporting
the view that distinct EF components can be identified (Happaney et al., 2004; Zelazo &
Müller, 2002; Zelazo et al., 2005). Cool EF has been associated with the dorsolateral PFC
(DL-PFC), whereas hot EF has been linked to the orbitofrontal cortex (OFC) and related
medial regions. The OFC and medial PFC form part of the frontostriatal circuit which has
strong connections to the amygdala and the limbic system (Antoine Bechara, 2004; Happaney
et al., 2004). These areas are associated with emotional and social processing and have been
identified as important areas in the linking of cognition and emotion. The DL-PFC, on the
other hand, does not share such direct connections to the limbic system (Zelazo & Müller,
2002; Zelazo et al., 2005). In fact, these connections are partly mediated by the OFC. It is
important to remember, though, that the DL-PFC, OFC, and medial cortex are all parts of a
single, integrated system and that they typically work together, even in a single situation
(Happaney et al., 2004; Zelazo et al., 2005). Thus, it is likely that cool and hot EF interact in
certain situations. Indeed, when attempting to solve a motivationally significant problem, it is
likely that a successful approach may involve stepping back and reconceptualising the
problem in a more neutral, decontextualised way and then attempting to solve it using cool EF
(Zelazo et al., 2013). Indeed, research has indicated that performance on cool and hot EF
problems is moderately and positively correlated (.50) in young children (Brock et al., 2009).
For instance, studies of children 3- to 5-years-old have found that children who demonstrate
superior inhibition and working memory perform better on measures of delay of gratification
and affective decision making (Allan & Lonigan, 2011; Hongwanishkul et al., 2005;
Willoughby et al., 2011).
The development of hot EF in relation to cool EF is not currently well understood.
Cool EF shows significant gains during early childhood (Fuhs & Day, 2011; Hongwanishkul
et al., 2005; Hughes & Ensor, 2011), but few studies have investigated whether this is also an
important period for hot EF. The limited research that has been conducted suggests that both
cool and hot EF subcomponents demonstrate improvement with age, with substantial progress
witnessed between 2- and 5-years-of-age (Hongwanishkul, Happaney, Lee, & Zelazo, 2005;

41
Kerr & Zelazo, 2004). For example, 4-year-olds have been found to be better able to delay
gratification compared to 3-year-olds (Carlson, Claxton, & Moses, 2013; Carlson & Moses,
2001). Delay of gratification in childhood is one of the most widely researched hot EF skills.
Much less is known about the development of other hot EF skills, such as affective decision
making, particularly during early childhood. There is some evidence that affective decision
making may also show advances in early childhood. For instance, 3-year-old children show
significantly poorer affective decision making than 4-and 5-year-old children, who do not
differ (Heilman, Miu, & Benga, 2009; Hongwanishkul et al., 2005; Kerr & Zelazo, 2004).
However, improvements on more complex measures of affective decision making have been
found between 8- and 19-years-of-age (Schiebener, García-Arias, García-Villamisar,
Cabanyes-Truffino, & Brand, 2015). Not all hot EF skills may therefore follow the same
trajectory and some may follow a more protracted developmental course than cool EF.
The distinction between cool and hot EF has faced criticism, with some researchers
failing to find support for a multidimensional model, including cognitive and affective
dimensions, in early childhood (3- to 6-years-old; Allan & Lonigan, 2014; Masten et al.,
2012). However, there is increasing evidence that a multidimensional model is supported in
children between 3- to 5-years-old (Kim, Nordling, Yoon, Boldt, & Kochanska, 2014;
Willoughby et al., 2011). This study revealed that a two factor model consisting of hot delay
of gratification and cool inhibition was superior to a one factor model in predicting behaviour
problems reported by fathers and teachers. These contradictory findings may reflect
differences in the measures used to assess hot EF. In the study by Allan and Lonigan (2014)
modified cool EF tasks were used to assess hot EF; children completed laboratory tasks
traditionally associated with cool EF (e.g. Grass/Snow task), but lost rewards for incorrect
responses. In studies that have supported a multi-dimensional model (e.g. Kim et al., 2014;
Willoughby, Kupersmidt, Voegler-Lee, & Bryant, 2011), on the other hand, delay of
gratification tasks (e.g. snack delay) were used as a measure of hot EF. It has been argued that
it is not just the affective salience of the situation but also the cognitive processes required
that differentiates cool and hot EF (Zelazo & Carlson, 2012). Distinguishing between cool
and hot EF on the basis of affective regulation alone therefore may not adequately capture the
difference between cool and hot EF domains.
According to the model outlined by Zelazo and Müller (2002) cool and hot EF
represent distinct, separable constructs. These researchers argue that cool and hot EF skills do
not just differ based on the emotional salience of a situation, but their underlying neural
correlates. Neurological studies carried out with adults have supported a dissociation between

42
executive processes considered cool and hot. For example, adults (24- to 68-years old) with
lesions to their VM-PFC demonstrated impaired affective decision making but intact working
memory performance, whereas adults with DL-PFC lesions showed the opposite pattern
(Bechara, Damasio, Tranel, & Anderson, 1998). This suggests a double dissociation between
these abilities and supports the view that they are associated with different regions of the PFC.
Added to this, more recent research has found that adults (18- to 68-years-old) with traumatic
brain injury showed impaired affective decision making, but intact inhibition (Fonseca et al.,
2012), indicating separate cool and hot domains. This research has been carried out with adult
populations, and so the organisation of cool and hot EF in children may vary. Though, there is
increasing evidence that a two-factor model, differentiating between cool and hot domains of
EF, is supported in early childhood (Kim et al., 2014; Willoughby et al., 2011). At present,
however, this model of EF is largely theoretical. More research needs to be undertaken to
increase understanding of the organisation and underlying neurological correlates of EF,
particularly in childhood.
The distinction between cool and hot EF, adopted in this thesis, is valuable because it
encourages researchers to adopt a broader conceptualisation of EF that captures its more
affective and motivational aspects (Hongwanishkul et al., 2005). This new perspective allows
the construct of EF to be extended to everyday decision making and problem solving, outside
of the laboratory, which rarely occurs in the absence of motivational and emotional
influences. Thus, this enables greater connections to be made between EF performance and
real-world consequences, such as social behaviour (Peterson & Welsh, 2014; Zelazo &
Carlson, 2012). In further support of the distinction between cool and hot EF, a
multidimensional model has been found to be superior to a unidimensional model in
predicting children's behaviour problems (Kim et al., 2014). A study that compared the ability
of a single and multidimensional model to predict children's behaviour problems found that
overall a multidimensional model, including separate cool and hot domains, evidenced greater
model fit in explaining children's problem behaviour (Kim et al., 2014). However, this was
true only for Father and Teacher reported behaviour problems. For Mother reported behaviour
problems a unidimensional and multidimensional model performed equally well in predicting
behaviour problems. In addition to the type of hot EF measures used, informants might also
influence the results.

43
2.3.2. Executive Function, Aggression, Prosocial Behaviour and Peer
Acceptance
EF has been identified as an important factor in the development of children's social
behaviour (Beauchamp & V. Anderson, 2010; Yeates et al., 2007). Deficits in EF have been
found to disrupt children’s social skills development, reducing children’s repertoire of
socially appropriate behaviours for use in interactions with their peers (Eisenberg et al., 1995)
and affecting their standing within the peer group (Tseng & Gau, 2013). Studies have found
that children's EF, incorporating skills such as inhibition, planning, cognitive flexibility, and
working memory, is predictive of their level of social competence from 2- to 12-years-of-age
(Espy, Sheffield, Wiebe, Clark, & Moehr, 2011; Hughes & Ensor, 2011; Jacobson et al.,
2011; Masten et al., 2012; Riccio, Hewitt, & Blake, 2011). According to this prior research,
children who showed superior performance on EF tasks demonstrated higher levels of
prosocial behaviour and peer acceptance, whereas children who showed poorer EF
performance exhibited greater disruptive behaviour, aggression and peer rejection. This
research indicates that impaired EF is a risk factor for disruptive behaviour and peer rejection,
while superior EF promotes prosocial behaviour and peer acceptance. Impairments in EF may
result in children having ineffective interactions with the environment; for example, they may
have difficulties learning rules or organising information which may result in social behaviour
problems (Séguin & Boulerice, 1999), including disruptive behaviour (Hughes & Ensor,
2008) and peer rejection (Masten et al., 2012). Thus, gaining a greater understanding of how
EF, particularly individual EF subcomponents, are related to children's social outcomes, like
aggression, may aid the identification of underlying mechanisms of positive social behaviour
development in children.
A particularly important EF skill for children's social behaviour development and
relation with the peer group appears to be inhibition. Poor inhibition has been found to be
associated with social behaviour problems in early and late childhood. For instance, children
(5- to 6-years-old) rated by their Teachers as highly impulsive experienced greater peer
rejection, after taking into account, age, gender and IQ (Gomes & Livesey, 2008). Further,
after controlling for age, deficits in inhibition were found to significantly predict externalising
behaviour problems in children 3- to 6-years-old (Allan & Lonigan, 2014). Further, children
who demonstrated trajectories of high impulsivity (which is reflective of poor inhibition) from
5- to 7- to 10- to 11-years-of-age were rated by their Teachers as more disruptive,
demonstrating greater conduct problems and experiencing more peer problems at 10- to 11-
years-of-age, compared to children who were low in impulsivity (Hirvonen et al., 2015).

44
Though, inhibition may not be related to aggression in adolescence. Adolescents (13- to 17-
years-old) diagnosed with disruptive behaviour disorder did not differ from typically
developing adolescents on measures of inhibition (Hummer, Wang, Kronenberger, Dunn, &
Mathews, 2015). Added to this, the relation between inhibition and aggression may not
remain once attention problems are taken into account. A study which examined EF in
children between 3.5- and 5.5-years-of-age found that after taking into account attention
problems, the relation between inhibition and disruptive behaviour problems was no longer
significant (Schoemaker, Bunte, Wiebe, Andrews, & Matthys, 2012). These contradictory
findings may reflect the different assessments of behaviour problems used. Studies by
Hummer et al., (2015) and Schoemaker et al., (2013) used clinical diagnoses, such as ADHD
or disruptive behaviour disorders, whereas other research with typically developing
populations has relied on Teacher or Parent reports (e.g. Allan & Lonigan, 2014; Hirvonen et
al., 2015; Raaijmakers et al., 2008; Utendale & Hastings, 2011). Differences may
consequently be found based on how behaviours are assessed and whether or not children
have a clinical diagnosis.
A further explanation for these contradictory findings is the fact that studies have
typically considered broad categories of social behaviour, such as externalising problems or
disruptive behaviour. Research considering specific categories of behaviour, like aggression,
may provide clearer findings. There have been some studies carried out that have explored the
role of EF in aggression more specifically. For example, a study was conducted that explored
the role of inhibition in 180 children who were either 4- or 6-years-of-age (Utendale, Hubert,
Saint-Pierre, & Hastings, 2011). This study found that inhibition was significantly negatively
related to maternal reports of externalising behaviours, aggression, and attention problems.
That is, children who evidenced poorer EF performance demonstrated greater behaviour
problems. Furthermore, impaired inhibition remained a significant predictor of aggression
even after attention problems were controlled for. A further study found that Parent reported
aggression was associated with impaired inhibition in preschool children (Raaijmakers et al.,
2008). Children rated as high in aggression were significantly more impaired on measures of
inhibition compared to children rated as low in aggression. Impaired inhibition, therefore,
appears to be a significant risk factor for aggression in children, at least in early childhood.
Poor behavioural control may limit a child’s ability to consider multiple aspects of a social
situation and to respond thoughtfully, which may lead to the child mismanaging aspects of a
social interaction, resulting in aggressive behaviour (Pascualvaca et al., 1997). Individual EF
processes, though, mature at different rates, with inhibition being one of the earlier EFs to

45
develop (Smidts et al., 2004; Welsh et al., 1991). Consequently, as children develop and their
EF matures, other EF subcomponents may become more central to their social behaviour
skills.
The majority of previous research that has examined the relation between EF and
aggression has taken a broad conceptualisation of aggression and has failed to distinguish
between subtypes of aggression, which consequently may be masking the true nature of the
relation between EF and aggression. This may be a further reason for prior contradictory
findings. The link between the function of aggression and EF has rarely been explored.
Research has tended to either confound reactive and proactive aggression or focus solely on
reactive aggression (e.g. Masten et al., 2012; Utendale & Hastings, 2011). Reactive
aggression has been associated with problems with emotional regulation and anger, whereas
proactive aggression has been argued to involve more careful planning, which does not fit
with a deficit model (Heilbron & Prinstein, 2008). Poor EF, therefore, may be characteristic
of reactive, but not proactive, aggression. Emerging research suggests that EF may be
differently implicated in the two functional subtypes. For example, effortful control, a concept
that overlaps with EF, particularly inhibition and the ability to delay gratification, has been
found to be associated with reactive but not proactive aggression in children between 9- and
12-years-of-age (Rathert et al., 2011). Effortful control was assessed by caregivers and
included measures of attentional shifting (e.g. 'Can easily shift from one activity to another')
and inhibition (e.g. 'Can wait before entering into new activities if s/he is asked to'), which are
also considered to fall under the umbrella of EF (Allan & Lonigan, 2014). Effortful control
was negatively related to Teacher reports of children’s reactive aggression, but unrelated to
proactive aggression. Thus, children with greater effortful control demonstrated less reactive
aggression, but children's effortful control did not vary as a function of their level of proactive
aggression. This emerging evidence therefore indicates that functional subtypes of aggression
may be associated with varying cognitive abilities. EF skills, such as attentional shifting and
inhibition, may therefore be more strongly implicated in reactive, but not proactive
aggression.
It is important to note, however, that the children in Rathert et al's., (2011) study
were approaching adolescence. The findings from this study may therefore not apply to
younger children. Inhibition has been found to develop relatively early in childhood and
consequently the relation between inhibition and aggression may change as children develop
(Smidts et al., 2004). Though, a study with a sample that spanned a wide age range (6- to 16-
years-old) supported the relation between EF and reactive aggression (White et al., 2012).
46
Maternal reports on the Behaviour Rating Inventory of EF (BRIEF; Gioia, Isquith, Guy, &
Kenworthy, 2000) were used to measure children’s EF. The BRIEF measures specific
behaviour problems occurring at home and school that reflect EF. The BRIEF consists of two
factors: behaviour regulation (e.g. inhibition, shifting, emotional control) and metacognition
(e.g. initiation, working memory, planning, organisation and monitoring). Reactive aggression
was associated with impaired EF in terms of both behavioural regulation and metacognition.
Proactive aggression was not associated with deficits in EF in either domain. These findings
remained even after controlling for age, gender, IQ, ADHD diagnosis and psychotropic
medication use. However, the measure of aggression only included 6 items and was
completed by mothers, who may not be aware of how their child behaves in other settings,
such as at school. Furthermore, although rating EF based on integrated aspects of everyday
problem solving may have high ecological validity, this approach typically results in low
experimental control and process specificity and thus results in low internal validity.
Emerging evidence therefore supports the notion that EF deficits are associated with
reactive but not proactive aggression. Although these studies distinguished between functions
of aggression, they did not consider different forms of aggression. The relation between EF
and different forms of aggression is also poorly understood. Studies have mainly investigated
the link between EF and physical aggression, ignoring other forms of aggression, such as
relational aggression (e.g. Raaijmakers et al., 2008; Utendale & Hastings, 2011). Further
research in this area is important because the relation between EF and aggression may vary
depending on the form of the aggression. Physical aggression, for example, is often
characterised as impulsive and thus may be related to EF deficits. Indeed, research has found
that even after controlling for ADHD status and IQ, physical aggression is associated with
deficits in EF in males between 13- to 15-years-old (Séguin & Boulerice, 1999). Relational
aggression, in contrast, has been posited to involve greater social and cognitive skill than
physical aggression (Heilbron & Prinstein, 2008) For instance, relational aggression typically
requires the perpetrator to understand the social network and who will be prepared to ally with
them in making the victim feel left out, which may involve greater planning skills.
Furthermore, relational aggression may require a greater ability to delay gratification as the
social harm elicited by relational aggression may not be immediately obvious, like the
physical harm caused by physical aggression. Physical aggression may therefore be associated
with poor EF, but relational aggression may reflect intact or superior EF.
A study which investigated the role of working memory in aggression in 116
children between 9- and 12-years-of-age found that impairment in working memory was

47
associated with Teacher rated physical and relational aggression (McQuade, Murray-Close,
Shoulberg, & Hoza, 2013). This study therefore contradicts the view that relational aggression
is related to superior EF. The relation between EF and aggression, however, may be
moderated by how skilful children are in their use of aggression. Children have been found to
be capable of using aggression in a skilled way; by using aggressive as well as prosocial
strategies interchangeably to control resources and achieve a high status among peers
(Pellegrini et al., 2011). These children have been referred to as bistrategic controllers
(Hawley, 2002). The children in McQuade et al's. (2013) study may have been unskilled users
of aggression as they demonstrated impaired social skills and experienced peer rejection.
Thus, there may be subgroups of relationally aggressive children: unskilled users with EF
deficits and skilled users with intact or superior EF. Further research though is needed to
confirm this hypothesis.
Alternatively, the relation between forms of aggression and EF may vary depending
on the EF processes assessed. Self-reported effortful control, which included measures of
inhibition and attention, predicted physical but not relational aggression in adolescents
between 9- to 12-years-old (Terranova, Morris, & Boxer, 2008). Poorer effortful control
predicted greater involvement in physical aggression assessed by Teachers and Peers 6
months later, even after taking into account initial physical and relational aggression. Self-
regulatory abilities, such as inhibition, may therefore be related to physical, but not relational,
aggression. In line with this, self- and mother-reported effortful control was related to reactive
physical, but not reactive relational aggression in adolescents between 10- to 17-years-old
(Dane & Marini, 2014). The relation between poor inhibition and physical aggression
therefore appears to remain into early adulthood. These studies, however, did not take into
account function; whether this differential relation holds for proactive physical and relational
aggression could therefore not be determined.
There is a paucity of research that has investigated the link between EF and the
function and form of aggression and as a result understanding of the role of EF in aggression
is limited. Further studies in this area are needed because research has indicated that the
relation between EF and aggression may vary depending on the function and form of
aggression. Despite the importance of early childhood for the development of both EF and
aggression, the relation between EF and the function and form of aggression in young
children has yet to be examined. Further studies are needed to confirm the finding of a
differential relation in early childhood. EF deficits appear to be strongly related to reactive
and physical aggression and less strongly related to proactive and relational aggression
48
(Rathert et al., 2011; White et al., 2012). In addition, physical and relational aggression can be
used both reactively and proactively, so there may be an interaction between the function and
form of aggression. This has yet to be investigated. The moderating role of prosocial
behaviour also needs to be taken into account, because how skilful children are at balancing
aggressive and prosocial behaviour strategies may influence the association between EF and
aggression.
2.3.3. Cool and Hot Executive Function, Aggression, Prosocial Behaviour and
Peer Acceptance
Despite a distinction being made between cool and hot EF, research investigating the
role of EF in children's social behaviour has mainly focussed on cool EF, ignoring the role of
hot EF. Understanding of the relation between hot EF and children's social behaviour is
consequently limited. The few studies that have examined the relation between hot EF and
aggression have tended to focus on clinical samples. Children with oppositional defiant
disorder (ODD) or conduct disorder (CD), for example, have been found to demonstrate
impairments in cool EF (e.g. inhibition) and hot EF (e.g. affective decision making; Hobson,
Scott, & Rubia, 2011). Aggression is a key characteristic of these disorders (Pardini & Frick,
2013), indicating that there may be links between cool and hot EF and childhood aggression.
Dolan and Lennox (2013), however, found that although children with both CD and ADHD
showed poorer planning skills than typically developing children, there was no difference in
planning ability, inhibition or cognitive flexibility between typically developing children and
children with CD only. In addition, there was no significant difference between the groups in
their affective decision making, but children with CD and CD with ADHD demonstrated
deficits in their ability to delay gratification compared to typically developing children. In the
absence of ADHD, the relation between cool and hot EF and aggressive disorders appears
uncertain.
ODD and CD are clinical disorders that include significant levels of aggression; little
attention has been paid to the role of hot EF in social behaviour development within the
typically developing population. The few studies that have been carried out with typically
developing populations have found a link between cool and hot EF and disruptive behaviour.
For example, overall EF, which included cool (e.g. inhibition) and hot (e.g. delay of
gratification) skills, was related to internalising and externalising behaviour problems in
children between 3- to 6-years-old (Allan & Lonigan, 2011). This study, though, did not
consider cool and hot domains of EF separately, meaning that the relative importance of cool
49
and hot EF to behaviour problems could not be explored. Hot EF may be particularly
important in the context of peer aggression in typical development because it is a
motivationally significant situation (Zelazo et al., 2005). Behaving aggressively may have
meaningful ramifications for both the victim and the perpetrator and consequently may tap hot
EF skills to a greater extent than cool EF skills.
Cool, but not hot, EF has been found to be associated with later academic
achievement and classroom adjustment in children between 3- and 5-years-of-age (Brock,
Rimm-Kaufman, Nathanson, & Grimm, 2009; Garner & Waajid, 2012; Kim et al., 2014).
Children with greater inhibitory and attentional control were rated by Teachers and Parents as
evidencing higher academic achievement and as displaying more learning related behaviours
(e.g. keeping on task when encountering difficulties) and classroom engagement. In contrast,
hot EF, but not cool EF, has been found to be associated with social and disruptive behaviour
in children between 3- to 5-years-old (Garner & Waajid, 2012; Kim et al., 2014). Children
who showed a greater ability to delay gratification and higher levels of observed positive
emotionality (expression of positive emotions in peer interactions) exhibited lower levels of
internalising or externalising problems and fewer problems accepting authority and following
rules, even after taking into account child age, gender and parental income. These findings
indicate that cool EF is more strongly implicated in academic competence, whereas hot EF is
more strongly associated with behaviour problems. These studies though focused on the role
of EF in classroom adjustment and disruptive behaviour, which includes, but is not
synonymous with aggression.
To date there have been just two studies that have investigated the role of cool and
hot EF in childhood aggression more specifically. A study of 74 children between 2- to 3-
years-old revealed that children who showed poor performance on measures of hot inhibition,
but not cool inhibition, were rated by their Teachers as more aggressive (Di Norcia, Pecora,
Bombi, Baumgartner, & Laghi, 2015). However, a further study which investigated whether
children’s (3- to 5-years-of-age) cool and hot EF was related to their behavioural functioning
did not find a significant association between hot EF and aggression (Willoughby et al.,
2011). In order to measure EF, children completed four tasks from the Preschool Self-
Regulation Assessment: Balance Beam and Pencil Tap (cool EF: inhibition) and Snack Delay
and Tongue Tasks (hot EF: delay of gratification). The study found that hot EF was uniquely
associated with inattentive-overactive behaviour and cool EF was uniquely associated with
academic achievement. Neither cool nor hot EF, however, were uniquely associated with
inattentive-defiant or aggressive behaviour reported by Teachers. This lack of a significant

50
link between EF and aggression may reflect the fact that the study did not distinguish between
the different functions and forms of aggression. The relation between cool and hot EF and
aggression may vary depending on the function and form of the aggression. Indeed, there is
evidence that cool EF is implicated in reactive but not proactive aggression (Rathert et al.,
2011; White et al., 2012). Thus, the association between hot EF and aggression may also vary
according to the type of aggression. To date there has been no study that has examined the
relation between cool and hot EF and the different functions and forms of aggression.
There is also a dearth of research that has considered the relation between hot EF and
prosocial behaviour and peer acceptance. The limited studies that have been carried out in this
area have found that children who exhibited superior performance on cool EF tasks assessing
skills, such as inhibition, planning and working memory, were rated as higher in prosocial
behaviour and were more accepted by their peers than children who performed poorly on cool
EF tasks (Jacobson et al., 2011; Masten et al., 2012; Riccio et al., 2011). Cool EF, thus,
appears to be implicated in prosocial behaviour and peer acceptance. This research, though,
did not consider hot EF. There is some evidence to suggest that hot EF, particularly hot
inhibition, may also be related to prosocial behaviour and peer acceptance, but studies in this
area are particularly limited. Poorer delay of gratification at 4-years-old has been found to
predict peer problems in school at 9-years-of-age (Lizhu & Jiangyang, 2007). Young
children's (3- to 5-years-old) use of self-distraction during delay of gratifications tasks has
also been found to be related to peer acceptance (Walden, Lemerise, & Smith, 1999).
Children who focussed their attention elsewhere and not on the prohibited item (a story
character hidden inside a box) during the delay of gratification task were more accepted by
their peers.
Prosocial behaviour (e.g. cooperation) has been found to be associated with greater
performance on measures of hot inhibition in children between 2- to 3-years-old (Di Norcia et
al., 2015). Added to this, a study of hot inhibition in 55 children found that children's
performance on the Windows Task was associated with prosocial behaviour, but only for
children below 3.5-years-of-age (Moore et al., 1998). In the Windows Task children are
presented with two boxes, one of which is baited with a reward and one which is empty.
Children are required to point to the un-baited box to win the reward. For children between 3-
years-old to 3.5-years-old, better hot inhibition was related to greater sharing, but for children
between 3-years, 7-months-old to 4.5-years-old there was no significant correlation between
inhibition and prosocial behaviour. This finding suggests that hot EF may only be associated
with prosocial behaviour for a short period in very early childhood. However, Garner and
51
Waajid (2012) found that children between 3- to 5-years-old with greater hot EF skills
demonstrated more prosocial behaviours, such as comforting others, helping and cooperating
with others. This difference in findings may relate to the very different measures of hot EF
used in the two studies. In the study by Moore et al. (1998) hot inhibition was measured using
a relatively abstract task, while in the study by Garner and Waajid (2012) positive
emotionality was measured via observations, which is a more ecologically valid measure of
hot EF. The Windows Task may not have captured how children apply their hot EF skills in
real-life situations and consequently may not have been related to prosocial behaviour.
The relation between cool and hot EF and children's aggressive and prosocial
behaviour is therefore a neglected area of research. Although there is evidence that cool and
hot EF are associated with aggressive disorders, such as ODD or CD (Hobson et al., 2011),
there is a particular dearth of research examining the association between EF and aggression
in typically developing samples. Furthermore, the limited research that has been carried out
has tended to focus on disruptive behaviour and classroom adjustment, which is not
synonymous with aggression (Brock et al., 2009; Garner & Waajid, 2012; Kim et al., 2014).
The two studies that did investigate the relation between cool and hot EF and aggression,
however, found contradictory results (Di Norcia et al., 2015; Willoughby et al., 2011), which
may reflect the fact these studies did not consider the function or form of aggression.
Investigating the role of hot, as well as cool, EF in aggressive and prosocial behaviour may
shed new light on these relations as a greater understanding of the unique role of cool and hot
EF skills in aggressive subtypes and prosocial behaviour would be obtained. Further, it may
lead to the identification of additional EF factors that could be targeted in interventions.
2.4. Theory of Mind, Executive Function, Aggression, Prosocial Behaviour and Peer
Acceptance
Individual differences in children's EF, along with being implicated in social
behaviour development, are associated with children's developing theory of mind (ToM;
Devine & Hughes, 2014). ToM is central to children's emerging ability to understand and
interact in the social world (Bellagamba, Laghi, Lonigro, & Pace, 2012) and has been
implicated in both children's prosocial and aggressive behaviour (Diesendruck, 2006; Hughes,
Dunn, & White, 1998; Lonigro, Laghi, Baiocco, & Baumgartner, 2013). Despite the fact that
EF and ToM are strongly associated with one another and with social development, research
has rarely examined the role of both EF and ToM in children's emerging social behaviour. It
is only through investigating the links between EF, ToM and social outcomes that a more
52
complete understanding of the cognitive mechanisms underlying children's prosocial and
aggressive behaviour development and peer acceptance can be obtained.
This section of the literature review focuses on the relation between ToM and
children's aggressive and prosocial behaviour as well as their peer acceptance. This section
will start by defining ToM and describing its development and relation to EF. This section
will conclude by reviewing the literature regarding the role of ToM in children's aggression,
prosocial behaviour and peer acceptance.
2.4.1. Theory of Mind
Theory of mind (ToM) relates to an individual's understanding of the mental world
and falls under the umbrella of what is known as folk psychology or everyday psychology
(Flavell, 2004; Goldman, 1993). Specifically, ToM describes the ability to attribute mental
states, such as beliefs, desires and intentions, to oneself and others in order to explain and
predict behaviour (Wimmer & Perner, 1983). ToM allows individuals to reflect on the
contents of their own and others minds (Baron-Cohen, 2000) and identify causes and
explanations of peoples' actions (Wellman & Lagattuta, 2000). ToM is considered an
important achievement in social-cognitive development (Slaughter & Repacholi, 2003). It
allows the toddler to progress from a literal observer of human behaviour to a folk
psychologist, capable of making complex mental-state attributions and engaging in elaborate
social and communicative interactions. Attainment of ToM enables children to be able to
distinguish between accidental and intended behaviour, wishes and reality, and truth and
deception (Bellagamba et al., 2012). Thus, ToM is fundamental to understanding and
engaging in the social world.
A central focus of ToM research is on children’s understanding of belief, especially
false-belief (Baron-Cohen, Leslie, & Frith, 1985). A child’s understanding that a person can
hold a false-belief, that is a belief which contradicts reality, indicates that the child is able to
make a distinction between the mental and the physical world. In order to understand mental-
states children must realise that although mental-states may reflect reality and may be
manifest in overt behaviour, they are nonetheless internal and mental and thus distinct from
real-world events, situations, or behaviours (Slaughter & Repacholi, 2003). It is not, therefore,
that children who fail to demonstrate ToM do not have any knowledge of mental states, but
rather that they fail to understand representational mental states. For instance, a simple
understanding of belief involves construing a person to hold a belief about a state of affairs.

53
But an everyday understanding of belief requires the notion that a person has a representation
of the world, the contents of which could be (and in the case of false-beliefs are) quite
different from the contents of the world itself. Thus, children who demonstrate ToM are able
to understand that people live their lives in a mental world as much as in a world of real
situations and occurrences.
ToM development begins in infancy and continues into adolescence (Lalonde &
Chandler, 2002). ToM is not an automatic process for children; children must first develop
precursory skills, including joint attention, appreciation of intentionality and pretend play (C.
Miller, 2006). As in the case of EF, though, early childhood appears to be an important period
in the development of ToM. Between 3- and 6-years-of-age children demonstrate dramatic
gains in their ToM ability (Wellman et al., 2001; Wimmer & Perner, 1983). For example,
children below 4-years-of-age typically fail to appreciate first-order false beliefs (Kaysili,
2011). That is, young children fail to accurately predict an individual's behaviour based on
that individual's mental state (mis)representations (i.e. their false beliefs) (Slaughter &
Repacholi, 2003). After 4-years-of-age children are typically able to understand first-order
false beliefs (Kaysili, 2011). This is a robust finding, that is found regardless of the type of
first-order false belief task (e.g. unexpected transfer, unexpected contents), type of false belief
question (e.g. what the character will know, say, think, or do), nature of the protagonist (e.g.
real person, doll, storybook character) and nature of the target object (e.g. real object, toy,
picture), as well as if children are encouraged to stop and reflect on the situation before
answering the false belief question (Wellman et al., 2001).
ToM does not stop developing around 4- or 5-years-of-age, though, children continue
to show increasing ToM performance across childhood (Calero, Salles, Semelman, & Sigman,
2013). Children are increasingly able to solve more complex, higher-order ToM tasks as they
progress towards adolescence. Age is positively correlated with understanding of beliefs,
desires and emotions in children 6- to 8-years-of-age (Calero et al., 2013). It is around 6- to 7-
years-of-age that children are typically able to appreciate second-order false beliefs (S. Miller,
2009). Second-order false belief understanding represents a higher order aspect of ToM
because it requires the child to infer the protagonist’s belief about another individual's belief
(Perner & Wimmer, 1985). In addition to second-order false beliefs, later developments in
children's ToM abilities include: recognising when an individual makes a faux pas in
conversation (Baron-Cohen, O’Riordan, Stone, Jones, & Plaisted, 1999); interpretation of
ambiguous situations (Pillow & Henrichon, 1996); moral dilemmas of truth and rightness
(Chandler, Sokol, & Hallett, 2001); and social deception, including social bluffs and white

54
lies (Happé, 1994). With their emerging ToM skills, children are better able to interact with
their peers as conflicts arising from misunderstanding become less common and children
develop a greater repertoire of skills for avoiding distressing or embarrassing situations
(Hughes & Leekam, 2004). Though, these new abilities also enable children to better conceal
or clarify their motives in order to manipulate social situations.
2.4.1.1. The Link between Executive Function and Theory of Mind
ToM and EF are two highly related constructs (Devine & Hughes, 2014) and
advances in EF are believed to be intertwined with ToM development (Carlson et al., 2013).
Numerous studies have found a robust association between individual differences in EF and
ToM independent of age and IQ (Carlson, Moses, & Breton, 2002; Carlson & Mandell, 2004;
Hughes, 1998a, 1998b). Opposing explanations have been suggested to account for the link
between EF and ToM. According to the expression account, children fail ToM tasks, not
because they lack a ToM, but because of the peripheral demands on EF that ToM tasks pose
(Carlson & Moses, 2001; Moses, 2001). EF therefore plays an important role in the
expression of ToM. For instance, success on a false belief task, requires a child to inhibit a
dominant tendency to state their own true knowledge of current reality and focus instead on
abstract mental states, while simultaneously holding in mind the protagonist’s actions and the
location of the object in question. In line with this account, reducing the EF demands of a
false belief task (e.g. reducing the prepotency of reality) results in improved performance
(Carlson, Moses, & Hix, 1998; J. Russell & Hill, 2001). The expression account therefore
posits that as children’s EF reaches a sufficient level of development for them to negotiate the
demands of ToM tasks, they are able to express their otherwise latent ToM (Carlson et al.,
1998).
There are two main sources of evidence that indicate that an expression account is
not supported. Firstly, studies have reported a significant association between EF and ToM
even when tasks that make minimal demands on EF are used (Hughes, 1998a; Perner, Lang,
& Kloo, 2002). Secondly, children with autism have been found to fail a false belief task but
to pass a false photograph task, which involves equivalent EF requirements as false belief
tasks, but does not require false belief understanding (Leekam & Perner, 1991). ToM tasks as
a result cannot be construed entirely as EF tasks. This has led to proposals regarding the
emergence of EF and ToM. Emergence accounts posit that there is a functional dependency
between EF and ToM. One theory that has been put forward proposes that the development of
ToM is a prerequisite for the achievement of EF (Perner, 1998). According to this argument,
55
children need to have developed a sufficient understanding of their own mind before they can
engage in executive control. For example, in order to successfully inhibit a response a child
needs to recognise a habitual action schema will lead to goal failure and so must be
suppressed in favour of a novel action. Thus, this view posits that successful inhibition, like
appreciation of false belief, is based on metarepresentation: in the case of inhibition,
representation of an incorrect action schema and its relation to action; and for false belief,
representation of a mental state and its relation to action.
An alternative emergence argument is that EF provides a platform for the
development of ToM (Carlson & Moses, 2001; Hughes, 1998a; J. Russell, 1996). According
to Russell (1996) the experience of agency (the ability to monitor one’s actions and to act
with volition) is necessary for acquiring insight into intentional action, which is in turn
fundamental for developing a ToM. This rudimentary form of self-awareness is required for
understanding mental states. Mental states are abstract, especially when they do not
correspond with reality (as in the case of false beliefs). Exposure to opportunities for
reflecting on discrepancies between mental states and reality is proposed to be fundamental
for ToM development (Brown, Donelan-McCall, & Dunn, 1996). Developmental advances in
EF may enable children to engage in and capitalise on these everyday experiences. It is
important to note, however, that EF may be necessary but not sufficient for the emergence of
ToM (Sabbagh, Fen, Calrson, Moses, & Lee, 2006).
Most research supports the view that some level of EF is required for a ToM to
develop (e.g. Benson, Sabbagh, Carlson, & Zelazo, 2013). For instance, a meta-analysis of
102 studies of EF and ToM in children between 3- to 6-years-old concluded that even after
taking into account age and verbal ability there was a significant relation between EF and
ToM development (Devine & Hughes, 2014). In particular, inhibition and working memory
appear to be associated with ToM development (Hughes, 1998b). In line with an emergence
account, EF at 2-years-old has been found to predict ToM at 3-years-of-age, but early ToM
has not been found to predict later EF (Carlson & Mandell, 2004; Hughes & Ensor, 2007).
Added to this, EF at 2- to 4-years-of-age was significantly associated with ToM at 3- to 5-
years-of-age, but early ToM was not significantly related to later EF (Hughes & Ensor, 2007;
Hughes, 1998a). This finding remained even after taking into account gender, age, initial ToM
and EF, verbal ability and social disadvantage. This supports the view that children’s ToM
performance is dependent on their emerging EF abilities. However, after reviewing the
literature Perner and Lang (1999) posited that the association between EF and ToM may be
bidirectional; being able to understand one’s own mind allows better insights into how to
56
exert self-control, and the exercise of self-control is one of the main grounds for building such
an understanding. Further empirical research, though, is needed to substantiate this
proposition.
Some research has failed to find evidence that EF is predictive of ToM. A study that
explored the relation between EF and ToM in a sample of typically developing and atypically
developing children who were diagnosed with ADHD or autism found that EF performance
was not significantly related to ToM ability (Yang, Zhou, Yao, Su, & Mcwhinnie, 2009).
However, the samples were matched based on chronological (and not developmental) age and
thus the typically developing sample performed at ceiling on the ToM tests. Overall,
therefore, there is strong support for the argument that EF predicts ToM development.
Research investigating the developmental ordering of ToM and EF is valuable because it may
have important implications for understanding of cognitive development and reveal specific
links between cognitive and social development. This would be aided by research examining
the relation between specific EF skills (e.g. inhibition, working memory or planning), as well
as hot EF skills and ToM.
2.4.1.2. Cool and Hot Executive Function and Theory of Mind
The distinction between cool and hot EF has led some researchers to reconceptualise
the relation between ToM and EF. It has been proposed that ToM may be more closely related
to hot EF than cool EF (Zelazo et al., 2005). Zelazo et al. (2005) has suggested that ToM is
hot EF as expressed in the domain of self and social understanding. These researchers argue
that it is not that ToM causes EF or that EF causes ToM, but rather that ToM and EF both
depend on common underlying cognitive mechanisms and neural systems. Indeed, evidence
from imaging and lesion studies indicates that the same regions of the PFC underlie ToM and
EF, particularly those regions associated with hot EF. For example, studies have shown that
ToM involves activation of the medial PFC (Siegal & Varley, 2002), a region that has been
proposed to also underlie hot EF (Zelazo et al., 2005). Added to this, hot EF has been found to
be more strongly associated with social behaviour, whereas cool EF was more strongly related
to academic achievement (Garner & Waajid, 2012). This suggests that hot EF may play a
central role in children’s developing social understanding. Accordingly, it may be that ToM is
more strongly related to hot, rather than cool, EF.
To date research has focused on the role of hot delay of gratification in ToM and
findings have been mixed. Cool inhibition and hot delay of gratification at 2-years-old
57
predicted ToM at 3-years-old (Carlson & Mandell, 2004). Though, delay of gratification does
not necessarily contribute to understanding of ToM above and beyond that of inhibition
(Carlson & Moses, 2001). Other studies, in contrast, have found that in children 3- to 5-years-
old, cool inhibition was significantly related to ToM tasks, whereas hot delay of gratification
was unrelated to ToM (Carlson et al., 2013, 2002). This relation was found for both ToM
tasks with low (e.g. Sources and Think-Know) and high executive demands (e.g. location
false belief and appearance-reality; Carlson et al., 2013). The role of other hot EF skills, such
as affective decision making, in ToM have yet to be explored. Examining the relation between
ToM and a broader range of hot EF skills may shed light on the EF-ToM relation.
2.4.2. Theory of Mind, Aggression, Prosocial Behaviour, Peer Acceptance
ToM, like EF, has been suggested to be an important cognitive factor in children's
developing social behaviour (Hughes & Ensor, 2006). The capacity to simultaneously
represent multiple, and at times conflicting, beliefs may enable children to better coordinate
their own thoughts and beliefs with those of others, resulting in more successful social
interactions (Astington, 2003) and greater peer acceptance (Slaughter, Imuta, Peterson, &
Henry, 2015). Indeed, ToM has been implicated in children's prosocial behaviour in early
childhood (Moore et al., 1998). Teachers and observers perceived children (3- to 5-years-old)
with better ToM and emotion understanding to be more socially competent (Cassidy et al.,
2003). In line with this, a longitudinal study that followed children from 3- to 6-years-of-age
found support for the association between ToM and prosocial behaviour (Eggum et al., 2011).
ToM and emotion understanding at 3-years-of-age was positively related to Parent reported
prosocial behaviour at 6-years-of-age. Prosocial behaviour at 3-years-old, however, was
positively associated with ToM at 4-years-old. In addition, prosocial behaviour at 4-years-old
was positively related to emotion understanding at 6-years-old. This finding suggests that
there may be bidirectional links between ToM and prosocial behaviour. That is, superior
understanding of the mental states of others may enable children to engage in more prosocial
behaviours, but prosocial behaviour may also enhance children’s understanding of others’
minds and emotions. Further longitudinal studies are therefore needed in order to explore the
direction of this relation. In addition, future research into gender differences in the association
between EF and prosocial behaviour may be valuable as ToM has been found to be positively
associated with boys’ (4- to 5-years-old) prosocial behaviour, but not girls’ (Yagmurlu, 2013).
Children (3- to 5-years-old) with superior ToM skills, including false belief and
emotion understanding, are also more accepted by their peers (Cassidy et al., 2003). Added to
58
this, well liked children (4- to 6-years-old) have been found to demonstrate greater ToM
abilities than rejected children (Slaughter, Dennis, & Pritchard, 2002). Some studies though
have failed to find a relation between ToM and peer acceptance. Diesendruck and Ben-
Eliyahu (2006), for example, failed to find an association between the aspects of ToM false
belief understanding and emotion understanding and peer acceptance in children between 4-
to 6-years-old. ToM may be related to peer acceptance, but only in children approaching
middle childhood. False belief understanding was related to peer acceptance in children
between 5- to 6-years-old but not in children between 4- and 5-years-old (Slaughter, Dennis,
& Pritchard, 2002). Further, ToM may be associated with peer acceptance in girls but not
boys. Teacher reported social intelligence was related to peer acceptance in girls 4- to 5-years-
old, but not boys (Braza et al., 2009) and deception was also related to peer acceptance in
girls 4- to 6-years-old, but not boys (Badenes, Estevan, & Bacete, 2000). In attempt to address
these mixed findings, Slaughter and colleagues (2015) conducted a meta-analysis of 20
studies examining the link between ToM and peer acceptance in children between 2- and 10-
years-of-age. The meta-analysis revealed that ToM was positively related to peer acceptance
in both preschool (2- to 5-years-old) and school-aged children (6- to 10-years-old). However,
although this relation held for boys and girls and for peer acceptance and rejection, the
association was stronger for girls and for peer acceptance. Advances in ToM may therefore
result in more effective forms of social interaction (Hughes, 2011), which in turn influences
how children interact with and are perceived by their peers.
Research that has examined the link between ToM and childhood aggression has
found contradictory results. Some studies have found that poorer ToM abilities are related to
increased childhood aggression. A longitudinal study, for example, found that children who
bullied other children during adolescence showed poorer ToM performance than children who
did not bully others in adolescence (Shakoor et al., 2012). In comparison to children who did
not bully others at age 12, children classed as bullies exhibited poorer first- and second-order
false belief understanding at 5-years-of-age. However, this relation did not remain significant
once IQ, child maltreatment, maternal warmth and gender were taken into account. The
measure of bullying, though, confounded physical and relational aggression and ignored the
functions of aggression. Added to this, bullying is not the same as aggression, it typically
involves an abuse of power and is directed towards specific victims (Monks & Coyne, 2011;
P. Smith & Monks, 2008). Further bullying, but not victimisation, has been linked to
proactive aggression (Camodeca & Goossens, 2005). It cannot be determined from this study,
therefore, whether poorer ToM performance is related to specific functions or forms of

59
aggression as this association may be confounded by the failure to take into account subtypes
of aggression. Furthermore, it would be interesting to know how bullies’ ToM developed
from 5- to 12-years-of-age; although children who bullied others in adolescence showed
poorer ToM skills in early childhood, their ToM skills may be equivalent (or even superior) to
non-bullies in adolescence. Other research, in contrast, has failed to find a relation between
ToM and aggressive behaviour in children. For instance, in a study of 204 children between 8-
and 11-years-of-age, ToM did not significantly differ between bullies and non-bullies in three
domains: cognitive, emotional or moral (Gini, 2006). This finding suggests that children who
engage in bullying have the same ToM abilities as children who do not bully their peers.
Again, this study focussed on bullying in older children, which provides a limited picture of
the link between ToM and aggression in young children. A study that examined the
association between ToM and aggression in 104 children between 4- and 6-years-of-age,
however, did not support the view that aggressive children are characterised by impaired ToM
(Monks, Smith, & Swettenham, 2005). Children who were rated by their peers as high in
aggression (including physical, relational or verbal aggression) did not differ significantly in
their first- or second-order false belief understanding to children who were not rated by peers
as aggressive. According to these studies, ToM deficits do not underlie aggression in
childhood.
Only certain ToM skills may be related to aggressive behaviour. Lonigro, Laghi,
Baiocco and Baumgartner (2013) found that children (9- to 10-years-of-age) rated on the
Strengths and Difficulties Questionnaire as antisocial by their teachers may exhibit deficits in
some ToM domains, but not others. Children who engaged in antisocial behaviour (e.g.
teasing or lying) possessed the same cognitive ToM abilities as children who engaged in
prosocial behaviour (e.g. comforting or cooperating with others). That is, antisocial and
prosocial children were equally able to understand others' thoughts, desires and beliefs.
However, prosocial children were better able to recognise others' emotions than antisocial
children. They were able to more precisely distinguish real from expressed emotions in order
to adapt their own reactions to social expectancies. Furthermore, prosocial children were
found to be more aware of moral emotions than antisocial children. Understanding of one’s
own and others’ emotional and moral states appears to play a significant role in prosocial
behaviour. In contrast, understanding of thoughts, beliefs and desires does not seem to be
associated with children's antisocial or prosocial behaviour. ToM may be necessary, but not
sufficient, in determining social behaviour. This study though was correlational; it could be

60
that prosocial behaviour enables children to have a greater insight into the emotional and
moral states of others or there may be even be bidirectional associations.
There is also evidence that some aggressive children are actually characterised by
superior ToM. For example, a study that compared the social cognitive skills of 193 children
between 7- and 10-years-old found that children who were categorised as ringleader bullies
(individuals who initiate the bullying) based on self and peer nominations had superior
understanding of mental states and emotions compared to children not categorised as bullies
(Sutton, Smith, & Swettenham, 1999). Children categorised as ringleader bullies did not score
higher on ToM than children who were classed as outsiders (children who refrain from getting
involved in bullying situations). At least some aggressive children may therefore be
characterised by superior social-cognitive skills. Alternatively, aggressive children may
demonstrate a 'nasty' or deviant ToM. Hughes, Dunn and White (1998) found that 4-year-old
children with disruptive behaviour problems may show a deviant ToM. Children who
received high Mother and Teacher ratings of hyperactivity and conduct problems did not
differ significantly from children rated as non-disruptive on their understanding of false belief
or deception, but the groups did differ significantly on their emotional false belief
understanding. Disruptive children were more likely to succeed on emotion false belief tasks
if they involved a nasty (rather than a nice) surprise. The non-disruptive children, in contrast,
were equally likely to pass the nice or nasty tasks. Disruptive children may therefore exhibit
superior ToM in relation to negative emotional situations, but may not demonstrate superior
ToM in other domains. This deviant bias in disruptive children’s ToM may accurately reflect
their social environments. Research, thus, has yet to clearly determine whether it is impaired
or superior ToM abilities that are related to increased aggression in children.
Although there is a strong body of evidence that indicates that superior ToM is
related to higher levels of prosocial behaviour in early childhood (Diesendruck & Ben-
Eliyahu, 2006; Eggum et al., 2011; Lonigro et al., 2013), the relation between ToM and
aggression is not so clear. Studies that have examined the role of ToM in childhood
aggression have resulted in a mass of contradictory findings. While some research has found
that aggressive children are characterised by impaired ToM (e.g. Diesendruck, 2006), other
research has found that aggressive children (children regarded as ringleader bullies) display
superior ToM (e.g. Sutton et al., 1999). Further still, other studies have found that aggressive
and non-aggressive children do not differ on ToM skills (e.g. Monks et al., 2005). This
contradiction in the literature may have resulted from research relying on too simplistic a
definition of aggression that fails to consider the different functions and forms of aggression.

61
Aggressive children are not a homogeneous group and consequently one explanation of the
development of aggression may not be sufficient (Sutton, Smith, & Swettenham, 2001).
Aggressive behaviour may vary depending on the context in which it occurs and the skills
which it requires. Relationally aggressive adolescents (10- to 14-years-old) were rated as
more socially intelligent by their peers than physically aggressive adolescents (Kaukiainen et
al., 1999). A relationally aggressive behaviour like social exclusion requires the perpetrator to
understand who will be prepared to join in making the victim feel left out and what kind of
justification for this exclusion others will accept; whereas physical aggression does not
demand such sophisticated social understanding. Superior ToM may therefore be beneficial to
some types of aggression, but not others. The role of ToM in subtypes of aggression, though,
has thus far been largely neglected by researchers.
The few studies that have explored the role of ToM across different forms of
aggression suggest that the relation between ToM and aggression may vary depending on the
type of aggression. So far research has focussed on comparing ToM in physical and relational
aggression. Physical aggression has been found to be significantly negatively related to ToM
in children between 3- and 5-years-of-age (Werner, Cassidy, & Juliano, 2006). That is, the
poorer children's ToM skills, the higher their level of observed physical aggression. In
contrast, ToM was not significantly related to observed relational aggression. However, there
were few instances of relational aggression in this study, which may have accounted for the
lack of an association. In addition, the relation between ToM and subtypes of aggression may
differ across genders (Walker, 2005). For instance, a study that explored false belief
understanding in children between 4- and 5-years-of-age found that for boys there was a
significant positive relation between ToM and aggressive or disruptive behaviour. For girls,
on the other hand, there was a significant positive association between ToM and prosocial
behaviour. Though, the findings from this study should be treated with caution because
receptive language (understanding language heard or read) was not measured and receptive
language is strongly related to ToM ability (Hughes & Ensor, 2007).
ToM and prosocial behaviour have been found to have an interactive effect in
predicting children's level of physical and indirect aggression (Renouf et al., 2009). ToM was
positively related to Teacher reported indirect aggression (e.g. covert relational aggression),
but unrelated to Teacher reported physical aggression. There was a significant interaction
between ToM and prosocial behaviour on indirect aggression. A higher level of ToM was
significantly associated with a higher level of indirect aggression for children with a low or
average level of prosocial behaviour, but ToM was unrelated to indirect aggression for

62
children with a high level of prosocial behaviour. Prosocial behaviour has also been found to
mediate the relation between ToM at age 5 and peer acceptance and rejection at age 7 (Caputi,
Lecce, Pagnin, & Banerjee, 2012). Prosocial behaviour may account for why some children
with superior ToM are aggressive, but accepted by the peer group, whereas others with
superior ToM skills are not aggressive. The study by Renouf et al. (2009) is the only study
thus far to have examined the moderating role of prosocial behaviour in the association
between ToM and aggression; further studies in this area are therefore essential.
To date there has been only one study that has examined the possibility of a
differential association between ToM and reactive and proactive aggression (Renouf et al.,
2010). This study followed children (n = 574) from 5- to 6-years-of-age. The study revealed
that there was no significant main effect of ToM on reactive aggression. There was, though, a
significant interaction between ToM and peer victimisation on reactive aggression. For
children who experienced high or medium levels of peer victimisation, a low level of ToM
was related to a higher level of reactive aggression. But, for children who experienced low
peer victimisation, ToM was unrelated to reactive aggression. ToM, however, significantly
predicted proactive aggression; a higher level of ToM was related to a higher level of
proactive aggression. This relation was qualified by a significant interaction between ToM
and peer victimisation. For children who experienced low or moderate levels of peer
victimisation, ToM was unrelated to proactive aggression. However, for children who
experienced a high level of peer victimisation, ToM was positively associated with proactive
aggression. The nature of the relation between ToM and aggression therefore appears to vary
across reactive and proactive aggression. Further research comparing ToM in reactive and
proactive aggression is needed.
Research exploring the role of ToM in subtypes of aggression, especially functional
subtypes, is limited. This is an important avenue for future research because there is some
evidence to suggest that the relation between ToM and aggression may vary depending on the
function and form of aggressive behaviour. For instance, differential associations between
ToM and reactive and proactive aggression have been found depending on peer victimisation
(Renouf et al., 2010). Furthermore, ToM deficits appear to be characteristic of physical, but
not relational, aggression (Werner et al., 2006). Superior ToM can be used for prosocial or
antisocial reasons (Lonigro et al., 2013) and as a result superior ToM may be positively
related to some types of aggression. Superior antisocial ToM, for example, may be positively
related to proactive relational aggression as this subtype of aggression requires an
understanding of how to manipulate social relationships and networks to achieve a goal.

63
Though, it has been proposed that the relation between ToM and relational aggression may be
moderated by prosocial behaviour (Renouf et al., 2009). In addition, this field of research is
further limited by the fact that there is no study as of yet that has examined the role of ToM in
aggression accounting for both the function and form of aggression. Research exploring the
role of ToM in subtypes of aggression, taking into account the moderating role of prosocial
behaviour, would be beneficial in furthering understanding of the socio-cognitive basis of
aggression.
2.5. Developmental Pathways of Aggressive and Prosocial Behaviour and Peer
Acceptance: Integrating the Contribution of Executive Function and Theory of Mind
There is increasing support that EF and ToM are implicated in children's aggression,
prosocial behaviour and peer acceptance (Jacobson et al., 2011; Lonigro et al., 2013).
However, the majority of these studies have not considered the longitudinal associations
between both EF and ToM, social behaviour and peer acceptance. This has hindered
understanding of the nature and directionality of these relations. Furthermore, early childhood
(3- to 5-years-of-age) is an important period for the development of both EF and ToM (V.
Anderson et al., 2008; De Luca & Leventer, 2008; Kaysili, 2011; Wellman et al., 2001).
Dramatic gains in EF and ToM are observed during this period. Consequently, the link
between EF and ToM abilities and aggressive and prosocial behaviour as well as the links
between these cognitive abilities and social behaviours to peer acceptance may change across
development. This cannot be assessed from cross-sectional research. Longitudinal research
that tracks the relations between EF and ToM and aggressive and prosocial behaviour and
their links to peer acceptance across early childhood would therefore enable developmental
trends to be examined.
In this section of the review, two models of social behaviour development which
integrate the EF and ToM literature are outlined. Although these are broad models of social
behaviour development, that do not make specific predictions about the nature of the relation
between cognitive factors and social outcomes, these models identify potential direct and
indirect pathways that can influence children's aggressive and prosocial behaviour
development. Following on from this, longitudinal studies that have explored the association
between EF, ToM and aggressive and prosocial behaviour in children will be discussed.
Lastly, longitudinal research contributing to current understanding of the intersection of
cognitive abilities, social behaviour and peer acceptance will be reviewed.

64
2.5.1. Models of Social Behaviour Development
An integrative model of social behaviour development based on the social
neuroscience and developmental literature was proposed by Yeates and colleagues (Yeates et
al., 2007). Originally developed to explain the social outcomes of children with brain injuries,
this model has applications to social development in typically as well as atypically developing
children. According to this model there are three main factors that predict children's social
behaviour development: cognitive-EF, social-affective function and social problem solving.
Cognitive-EF reflects cool EF abilities and social-affective function refers to skills that fall
under the umbrella of hot EF. Social problem solving includes (but is not synonymous to)
ToM. This model posits that cognitive-EF and social-affective function have direct effects on
social interaction and indirect effects via social problem solving. Social interaction refers to
affiliative, withdrawn and aggressive behaviours. The pathways outlined in this model are
bidirectional; thus, cognitive-EF can influence aggressive behaviour and vice versa. In
addition, the model states that insult related factors (e.g. type, severity and region of brain
insult) as well as non-insult related factors (e.g. parenting style, family dynamics and
socioeconomic status) can influence all pathways. This model, though, is largely heuristic in
nature. It acts more as an overarching framework and does not generate any specific
predictions regarding risk and resilience pathways. However, it provides a useful foundation
for researchers who are attempting to identify pathways to adverse and adaptive social
development in children.
More recently Beauchamp and Anderson (Beauchamp & V. Anderson, 2010) have
proposed the Socio-Cognitive Integration of Abilities Model (SOCIAL) with the aim of
providing an integrated model of the cognitive and affective skills that contribute to the
development of social behaviour. This model is founded on empirical research and clinical
principles. The SOCIAL framework posits that social competence is dependent on the normal
maturation of the brain, cognition and behaviour, within a supportive environmental context.
According to the model, there is a bidirectional relation between mediators, cognitive
functions and social competence. Mediators include internal, individual factors (e.g.
temperament, personality), external, environmental factors (e.g. family environment,
socioeconomic status) and brain development and integrity, which relates to the neurological
underpinnings of social skills. Three cognitive functions were identified as important to social
skills development: attention-executive, communication and socio-emotional. The attention-
executive component refers to attentional control processes and EFs, such as self-monitoring,
inhibition, and self-regulation. The attention-executive component, thus, includes EF skills
65
that fall under the umbrella of cool and hot EF. Communication includes social
communication skills, such as joint attention and expressive and receptive communication.
The socio-emotional component refers to affective processes, such as attribution, ToM and
moral reasoning. The model further suggests that both cognitive functions and social
behaviours influence children's social adjustment, including their acceptance within the peer
group, both direct and indirectly. The factors identified in the model combine to determine the
presence and integrity of social skills; that is they determine how well an individual interacts
with their social environment.
Both models of social behaviour outlined above posit that EF and ToM may be
directly related to aggression and prosocial behaviour in children. In addition, the models
suggest that EF might also be indirectly related to aggressive and prosocial behaviour in
children via social-cognitive abilities, such as ToM. Due to the proposed association between
ToM and hot EF (Zelazo et al., 2005), ToM may partially mediate the relation between hot EF
and aggression. Added to this, the models propose both cognitive abilities and social
behaviours influence children's acceptance within the peer group. These models, though, are
very broad and the components are ill defined. The nature of the association between EF or
ToM abilities and social behaviour is not clearly delineated. For example, neither model
specifies which EF subcomponents are related to different types of social behaviour and in
what way. Further research that investigates the nature of the relation between EF and ToM
and social behaviour would therefore increase understanding of the development of
aggressive and prosocial behaviour, as well as identify possible pathways for intervention.
2.5.2. Longitudinal Research Examining the Role of Executive Function and
Theory of Mind in Aggression
According to social neuroscience models, both EF and ToM play an important role in
the development of aggression and prosocial behaviour (Beauchamp & V. Anderson, 2010;
Yeates et al., 2007). EF and ToM have been found to be strongly associated (Devine &
Hughes, 2014) and as a result research focusing on the role of only one of these cognitive
domains in aggressive and prosocial development may be providing a limited understanding
of cognitive predictors of aggression and prosocial behaviour. There is a growing number of
studies that have investigated the relation between both EF and ToM and aggressive and
prosocial behaviour at one time point, which have found that EF and ToM is associated with
aggression and prosocial behaviour both during early childhood (3- to 4-years-old; Hughes et
al., 1998) and middle childhood (5- to 9-years-old; Fahie & Symons, 2003). However, when

66
the unique contribution of EF and ToM to disruptive behaviour in 2-year-old children was
examined, ToM was related to disruptive behaviour after EF was controlled for, but EF was
not associated with disruptive behaviour after ToM was controlled for (Hughes & Ensor,
2006). During early childhood, substantial gains in EF and ToM (Hughes & Ensor, 2011;
Wellman et al., 2001) are evident and use of physical aggression typically declines in favour
of relational aggression (Björkqvist et al., 1992). In addition prosocial behaviour increases
during early childhood (Jackson & Tisak, 2001). The relation between EF and ToM and
aggressive and prosocial behaviour may therefore alter with development. However, few
longitudinal studies have been carried out. Longitudinal studies will enable the stability and
directionality of pathways between cognitive abilities and social behaviour to be examined.
Razza and Blair (2009) conducted a longitudinal study that followed 68 children
from 4- to 6-years-of-age in order to explore the association between cognitive abilities and
social competence. The study revealed that there were longitudinal associations between ToM
and social competence; false belief understanding at 4- to 5-years-of-age was positively
related to Teacher rated social competence at 5- to 6-years-of-age, which included social
cooperation (e.g. shows self-control), social interaction (e.g. tries to understand another
child’s behaviour) and social independence (e.g. is confident in social situations). In addition,
social competence in the preschool years independently predicted later ToM, suggesting there
is a bidirectional relation between ToM and social competence.
Razza and Blair (2009) further found that after taking into account initial social
competence, EF, which included working memory, inhibition and cognitive flexibility, did
not significantly predict later social competence. EF at 4- to 5-years-of-age did though predict
concurrent and later ToM. However, once the link between early ToM and later ToM was
taken into consideration then the association between EF at 4- to 5-years-old and ToM at 5- to
6-years-old was no longer significant. Thus, this study suggests that EF does not directly
predict ToM, but likely affects it indirectly through its concurrent association with ToM.
However, given that false belief understanding is usually acquired by 5-years-of-age, it is
possible that the relation among these constructs may differ across the preschool and school-
age period. A study that followed children from 3- to 4-years-of-age found that at age 4-years
there was a significant association between EF and problem behaviour, including aggression,
reported by Mothers and Teachers, even after age 3-years problem behaviours, social
disadvantage, verbal ability and age 4 ToM were taken into account (Hughes & Ensor, 2008).
By 4-years-of-age, the relation between behaviour problems and EF appears to be
independent of co-varying associations with ToM and verbal ability.

67
These studies, though, only considered cool EF. Hot EF has been posited to be
particularly important to both social behaviour and ToM development (Garner & Waajid,
2012; Kim et al., 2014; Zelazo et al., 2005). Hot EF may be more strongly related to later
social competence than cool EF. A prospective longitudinal study that followed 199 children
from 3- to 6-years-of-age to explore whether self-regulatory and social-cognitive factors
influenced children’s peer-directed aggression did include measures of cool and hot inhibition
(Olson, Lopez-Duran, Lunkenheimer, Chang, & Sameroff, 2011). However, these measures
were combined to form a single EF composite. Further, despite the fact that subtypes of
aggression were assessed, including Teacher rated reactive and proactive aggression and
observed verbal (e.g. taunts, threatens physical harm, insults), physical (e.g. hits, kicks, bites,
scratches, pinches, spits on, and/or pulls hair of peer) and object aggression (e.g. smashes or
bangs peer’s toys or possessions), a composite measure of aggression was used. The study
found that children's inhibition significantly predicted their current and later aggression. In
addition, there was a significant interaction between inhibition and anger/frustration.
Inhibition predicted concurrent levels of aggression in children who manifested medium or
high levels of anger, but not low levels. This may reflect links between EF and reactive
aggression, which is more strongly related to anger and frustration than proactive aggression
(Ostrov et al., 2013). After taking into account continuity in children’s aggression, early
inhibition no longer predicted school-age peer aggression.
This study also found that ToM was significantly related to children's concurrent
aggression. Children who demonstrated relatively poor ToM tended to manifest higher levels
of aggression than children who exhibited higher ToM. But after controlling for the effects of
inhibition, ToM no longer significantly predicted preschool peer aggression. Furthermore,
preschool ToM was not significantly associated with kindergarten aggression. During the
early preschool period, deficits in children’s self-regulatory and social cognitive skills were
salient contributors to high levels of peer aggression. However, deficits in children’s early
developmental skills did not predict changes in peer aggression across the transition to school.
Children’s self-regulatory and social-cognitive skills undergo rapid developmental changes
across the preschool period (P. Anderson, 2008). It may be that these early skills deficits play
a key role in the origins of children’s aggression. Once aggressive behaviours begin to
stabilize, however, other individual or environmental risk factors may become the primary
predictors of children’s later aggressive behaviour. It is also important to note that these
studies did not differentiate between the function and form of aggression. The relation

68
between EF and ToM and aggression across early childhood may not be identical across the
different functions and forms.
2.5.3. Intersection of Executive Function, Theory of Mind, Aggression, Prosocial
Behaviour and Peer Acceptance
Despite models of social behaviour development suggesting pathways between
children's cognitive abilities and social behaviour to their peer acceptance (Beauchamp & V.
Anderson, 2010; Yeates et al., 2007), there has been no study to date that has examined the
intersection between children's cognitive abilities, social behaviours and peer acceptance.
Research that has studied these factors separately has indicated that poor EF (Masten et al.,
2012) and ToM (Deković & Gerris, 1994) are related to peer rejection. Further, prosocial
behaviour is positively related and aggression negatively related to peer acceptance (See
section 2.2.3 on peer acceptance; Farver & Branstetter, 1994; Jacobson et al., 2011). Though,
the relation between subtypes of aggression and peer acceptance is debated (Card et al., 2008;
Morrow et al., 2006; Pedersen et al., 2007; Poulin & Boivin, 2000; R. Smith et al., 2009).
Longitudinal research in this area is particularly limited. Peer acceptance becomes an
increasing concern for children as they approach later childhood and adolescence (Silk et al.,
2012) and aggression typically declines (Broidy et al., 2003), whereas prosocial behaviour
increases (Jackson & Tisak, 2001). Further, important advances in EF and ToM are evident
(P. Anderson, 2008; Wellman, Cross, & Watson, 2001). Identifying the unique contribution of
cognitive abilities and social behaviours to children's peer acceptance and rejection may
provide a more comprehensive understanding of social behaviour development and may
highlight factors that need to be considered in interventions.
There is some evidence to suggest that early cognitive abilities are associated with
later peer acceptance. Poor EF at age 3-years, for example, was associated with peer rejection
at age 10-years (Waller, Hyde, Baskin-Sommers, & Olson, 2016). However, the children
included in this study were rated as high in callous-unemotional traits (lack of empathy and
guilt). These results may consequently not generalise to typically developing children.
Superior perspective taking abilities (an aspect of ToM) were associated with greater peer
acceptance at 6- to 7-, 8- to 9-, 10- to 11-years-of-age in typically developing children
(Deković & Gerris, 1994). The relation between ToM and peer rejection, though, may vary
across developmental stages. A study that followed a younger cohort from 6- to 8-years-of-
age and an older cohort from 9- to 10-years-of-age, found a different pattern of relations
between faux pas understanding and peer acceptance and rejection in the younger and older

69
cohorts (Banerjee, Watling, & Caputi, 2011). In the younger cohort, peer rejection at 7-years-
old negatively predicted faux pas understanding at 8-years-old. In the older cohort, on the
other hand, peer rejection at 9-years-old negatively predicted ToM at 10-years-old, which in
turn was negatively related to peer rejection at 11-years-old. Further, ToM at 9-years-of-age
positively predicted peer acceptance at 10-years-of-age. Understanding of faux pas is a more
advanced ToM ability and is not seen until later childhood (Baron-Cohen et al., 1999), which
may explain why understanding of faux pas was not as strongly related to peer rejection in the
younger cohort. This study, though, suggests that there may be bidirectional relations between
ToM and peer acceptance and rejection.
Cognitive abilities and social behaviour may interact in their effect on peer
acceptance (Deković & Gerris, 1994). A longitudinal study that assessed children at 4.5-, 6-,
9-, 10- and 15-years-of-age, found that early EF predicted concurrent and future peer
problems (Holmes, Kim-Spoon, & Deater-Deckard, 2015). Poor EF (assessed by Parent
reports and behavioural tasks) was related to greater peer rejection (assessed by Self-,
Teachers and Caregiver reports), but this relation became weaker as children approached
adolescence. Peer problems, however, also predicted poorer concurrent and later EF. Added
to this, reactive (but not proactive aggression) mediated the link between impulsivity at 3-
years-of-age and peer rejection at 10-years-of-age (Evans, Fite, Hendrickson, Rubens, &
Mages, 2015). Not all subtypes of aggression may therefore be implicated in peer acceptance.
Prosocial behaviour has also been found to interact with ToM in its relation with peer
acceptance. Prosocial behaviour at 5-years-of-age was negatively related to peer rejection at
6-years-of-age and prosocial behaviour at 6-years-of-age was negatively associated with peer
rejection and acceptance at 7-years-of-age (Caputi et al., 2012). ToM, in contrast, was not
directly related to peer rejection, but ToM at 6-years-old was positively associated with peer
acceptance at 7-years-old. ToM at 5-years-of-age, however, was indirectly related to peer
acceptance and rejection at 7-years-of-age, via its effect on prosocial behaviour at 6-years-of-
age. Further research exploring the intersection between cognitive abilities, social behaviours
and peer acceptance may therefore provide valuable insight into children's social
development. Identifying the predictive relations between these cognitive and social domains
may highlight pathways to be targeted in interventions to promote positive social
development. Considering only one domain may have limited influence on children's social
development.

70
2.6. Chapter Summary
This thesis focuses on three important social domains in early childhood: aggression,
prosocial behaviour and peer acceptance. Childhood aggression has received wide research
attention and is the main domain of interest in this thesis. Childhood aggression is a
significant risk factor not for just short-term, but long-term, academic, social and
psychological problems (Campbell et al., 2006; Coie, Dodge, & Coppotelli, 1982).
Consequently, a substantial body of research has focused on identifying factors that predict
and explain childhood aggression in order to inform prevention and intervention methods. In
this thesis, two promising areas of research, EF and ToM, were reviewed. EF and ToM are
highly related constructs (Benson et al., 2013; Devine & Hughes, 2014; Hughes & Ensor,
2006), that both develop rapidly during early childhood (V. Anderson et al., 2008; Wellman et
al., 2001), and have been found to be strongly related to aggressive behaviour in children
(Diesendruck, 2006; Hughes et al., 1998; McQuade et al., 2013; Utendale & Hastings, 2011).
However, there are several important gaps in this field that may result in an incomplete
understanding of the relation between EF, ToM and childhood aggression.
Firstly, understanding of the relation between both EF and ToM and childhood
aggression has been hindered by the fact that studies have often failed to acknowledge the
heterogeneous nature of aggression. Aggression can have either a reactive or a proactive
function and can involve different forms of behaviour, including physical and relational
aggression (Crick et al., 1999; Dodge & Coie, 1987). Previous research has tended to conflate
the different functions and forms of aggression or only focus on one subtype of aggression
(usually reactive or physical aggression) and then generalise these findings to aggression as a
whole (e.g. Masten et al., 2012; Olson et al., 2011; Utendale & Hastings, 2011). This
approach may be masking the true nature of the relation between cognitive abilities and
aggression. Indeed, there is emerging evidence suggesting that the cognitive profiles of
aggression may vary across the different functions and forms.
Reactive aggression is viewed as a 'hot-headed' response to frustration that involves
anger (Dodge, 1991; Ostrov et al., 2013), whereas proactive aggression is suggested to be a
more coercive behaviour that involves at least some forethought and evaluation of the
consequences (Dodge, 1991; Kempes et al., 2005). In line with this, poor EF performance has
been found to be related to increased reactive, but not proactive, aggression (Rathert et al.,
2011; White et al., 2012). Further, poor ToM was related to increased reactive aggression in
children who experienced low or moderate levels of peer victimisation, whereas superior ToM
71
was associated with increased proactive aggression in children who experienced high levels of
peer victimisation (Renouf et al., 2010). Physical and relational aggression have also been
found to have differential cognitive profiles. It has been argued that while physical aggression
may reflect poor behaviour control and social understanding, relational aggression, in
contrast, does not fit with a deficit model (Heilbron & Prinstein, 2008) and may involve
superior social intelligence (Kaukiainen et al., 1999). In line with this, physical aggression has
been found to be associated with poor EF (Séguin & Boulerice, 1999), particularly poor
inhibition, but not relational aggression (Dane & Marini, 2014; Terranova et al., 2008). Poor
ToM has also been found to be characteristic of physical, but not relational, aggression
(Werner et al., 2006).
It is important to bear in mind that form is not independent of function. All forms
(e.g. relational, physical) of aggression can be used reactively or proactively. The function
and form of aggression may therefore interact. Indeed, function has been found to influence
the association between relational aggression and problem behaviour (Mathieson & Crick,
2010). Reactive relational aggression uniquely predicted externalising and internalising
problems, whereas proactive relational aggression only predicted externalising problems. The
relation between cognitive abilities and aggression is, thus, likely to be influenced by an
interaction between the function and form of aggression. To date there have been no studies
that have examined the role of EF and ToM in aggression that have considered both the
function and form of aggression. This is an important avenue for future research because it
may shed a new light on the underlying mechanisms of aggression that is more reflective of
how children are using aggression in their everyday lives.
The presently limited understanding of the role of hot EF in children’s aggressive
behaviour represents a further gap in our knowledge of the link between EF and social
behaviour. Despite a distinction being made between cool and hot dimensions of EF (Zelazo
& Müller, 2002), the relation between hot EF and childhood aggression has largely been
neglected by researchers. This is a valuable area of research because hot EF may be
particularly important in aggressive interactions because they are often emotionally and
motivationally significant scenarios (Zelazo et al., 2005) as aggressive situations may have
consequences not just for the victim but also for the perpetrator (be they positive or negative).
The few studies that have been carried out in this field though have tended to focus on
aggressive disorders or academic performance and classroom adjustment (Garner & Waajid,
2012; Hobson et al., 2011; Kim et al., 2014). The two studies that have investigated the role
of cool and hot EF in children's aggression resulted in contradictory findings (Di Norcia et al.,
72
2015; Willoughby et al., 2011), which may reflect the fact that these studies did not take into
account the function or form of aggression. The association between cool EF and aggression
has been found to vary across aggressive subtypes (Rathert et al., 2011; White et al., 2012),
so the same may be true for hot EF. There is no study to date that has examined the relation
between cool and hot EF and subtypes of aggression in typically developing children.
Thirdly, the majority of research investigating the role of EF and ToM in children’s
aggression has been carried out at one time point, preventing developmental trends in these
relations from being analysed. Early childhood ( 3- to 5-years-old) is an important period for
both EF and ToM development (Best & P. Miller, 2010; Wellman et al., 2001), substantial
growth is evident in these domains during early childhood in line with development of the
prefrontal cortex (V. Anderson et al., 2008; Wellman et al., 2001). Further, physical
aggression typically declines over early childhood (Alink et al., 2006; Broidy et al., 2003),
whereas relational aggression is thought to increase (Björkqvist et al., 1992), especially in
girls (Spieker et al., 2012). EF and ToM may therefore be highly important for aggressive
behaviour during early childhood, but as children develop these factors may become less
central to their aggressive behaviour. In line with this, EF has been found to predict social
behaviour problems in early, but not later childhood (Olson et al., 2011). Furthermore,
subcomponents of EF have individual developmental trajectories (Smidts et al., 2004; Welsh
et al., 1991) and as a result, the centrality of specific EF subcomponents in social behaviour
may change depending of the developmental stage of the child. Studies that consider the role
of both EF and ToM in childhood aggression would therefore be valuable in gaining a greater
understanding not just of how these cognitive abilities relate to one another, but their joint
role in aggressive behaviour.
In comparison to the aggression literature, research investigating the relation between
EF and ToM and prosocial behaviour is more limited. This is an important area of research
because prosocial behaviour is associated with advantageous developmental outcomes,
including academic success and peer acceptance (Chen et al., 2005; Greener, 2000). Thus,
promoting prosocial behaviour in children may have positive effects on their development.
Both EF and ToM have been implicated in children’s prosocial behaviour (Jacobson et al.,
2011; Moore et al., 1998). Children who exhibit superior EF and ToM engage in higher levels
of prosocial behaviour than children who demonstrate inferior EF and ToM (Diesendruck &
Ben-Eliyahu, 2006; Jacobson et al., 2011). However, there are several gaps in the literature
that limit current knowledge of the relation between these cognitive abilities and prosocial
behaviour.

73
As in the aggression literature, the majority of research has focussed on the role of
cool EF in prosocial behaviour and ignored the role of hot EF. There is some evidence,
though, that hot EF may be positively related to prosocial behaviour (Garner & Waajid, 2012;
Moore et al., 1998). Though, these studies used only one measure of hot EF: hot inhibition.
Further research focussing on the role of both cool and hot EF in prosocial behaviour, using
more than one measure of hot EF, is needed to enhance understanding of this relation.
Secondly, the nature of this association across development is unclear. Some research has
found that EF may only be implicated in prosocial behaviour below 3.5-years-of-age (Moore
et al., 1998), while other research has suggested this relation exists across early childhood
(Garner & Waajid, 2012). Longitudinal research examining the association between EF, ToM
and prosocial behaviour across early childhood, as these cognitive abilities are emerging, will
therefore elucidate developmental trends in these associations.
Further, the indirect links between cognitive abilities and social behaviours are not
well understood. For example, prosocial behaviour has been found to moderate the relation
between ToM and aggression (Renouf et al., 2009). ToM was positively associated with
relational aggression in children who showed low or average levels of prosocial behaviour,
but was unrelated to aggression in children with high levels of prosocial behaviour. Children's
level of prosocial behaviour may account for why some children use their ToM abilities for
aggressive purposes, while others do not. However, this is the only study that has examined
the moderating role of prosocial behaviour to date. In addition, it has been posited that
aggressive children with low prosocial behaviour may be characterised by EF deficits, but that
aggressive children with high prosocial behaviour may actually exhibit superior EF
(McQuade et al., 2013), but this has yet to be empirically tested. Research investigating the
role of EF and ToM in childhood aggression therefore needs to take into account the
moderating influence of prosocial behaviour as this may increase understanding of the
heterogeneous development of aggression in childhood.
Another important gap in the literature that may hinder current understanding of the
underlying cognitive mechanisms of both aggressive and prosocial behaviour is the presently
limited knowledge of the organisation of hot EF and its links to cool EF and ToM. Hot EF has
been proposed to be a separable affective domain of EF that differs not just in the cognitive
processes it comprises but the brain region that mediates its (VM-PFC: Zelazo & Müller,
2002; Zelazo et al., 2005). However, studies that have explored whether a uni- or multi-
dimensional model best captures the organisation of cool and hot EF has resulted in mixed
findings (Allan & Lonigan, 2014; Kim et al., 2014; Masten et al., 2012; Willoughby et al.,

74
2011). Though, a multi-dimensional model was better at explaining children's problem
behaviours than a uni-dimensional model (Kim et al., 2014). The executive processes that
comprise hot EF, however, is currently poorly understood. Added to this, hot EF has been
proposed to be central to ToM (Zalazo et al., 2005) due to their joint association with medial
regions of the PFC (Sabbagh et al., 2009; Siegal & Varley, 2002) and because social
interaction is likely to involve an emotional component (Zalazo et al., 2005). Although a
growing body of research has considered the relation between delay of gratification and ToM,
the relation between other executive skills considered to reflect hot EF (e.g. affective decision
making) and ToM has yet to be empirically studied. Identifying the factors that comprise hot
EF and their relation to cool EF and ToM, will increase current understanding of normative
cognitive development. This may inform current theoretical models of the relation between
these cognitive abilities and social behaviours.
Research investigating the role of EF and ToM in aggressive and prosocial behaviour
will increase current understanding of cognitive and affective predictors of subtypes of
aggression and prosocial behaviour. It is not just identifying predictors, but also exploring
outcomes of social behaviours, that will provide a more comprehensive understanding of
social development. Social neuroscience models have indicated that cool and hot EF and ToM
are important for children's aggressive and prosocial behaviour and that both these cognitive
abilities and social behaviours are central to children's peer acceptance (Beauchamp & V.
Anderson, 2010). Well liked children have been found to demonstrate superior EF and ToM
abilities (Cassidy et al., 2003; Masten et al., 2012) and engage in lower levels of aggression
and higher levels of prosocial behaviour than rejected children (Sandstrom & Cillessen,
2006). The relation between the function and form of aggression and peer acceptance,
however, is debated. Reactive and physical aggression, for example, is associated with greater
peer rejection, but the use of proactive or relational aggression has been found to be related to
greater peer acceptance (Poulin & Boivin, 2000; R. Smith et al., 2009). Although EF, ToM
and aggressive and prosocial behaviour are related, their unique contribution to peer
acceptance is still not fully understood. Understanding the influence of function and form of
aggression in predicting peer acceptance, after taking into account EF and ToM, may have
important implications not just for understanding the development of peer acceptance, but
also the varying outcomes of subtypes of aggression.
75
2.7. Present Research
The main aim of the research presented in this thesis is to increase current
understanding of the longitudinal associations between EF, ToM and aggressive and prosocial
behaviour and their links to peer acceptance across early childhood. The current research
focused on the underlying role of EF and ToM in these social domains because: (1) both EF
and ToM show substantial development during early childhood (P. Anderson, 2008; Wellman
et al., 2001) and advances in these abilities have been theorised to correspond to improved
social competence (Zalazo et al., 2005); (2) there is strong evidence that EF and ToM are
fundamentally linked and that EF provides a platform for the emergence of ToM (Devine &
Hughes, 2014); and (3) newer conceptualisations of EF have differentiated between cool and
hot EF (Zelazo & Müller, 2002), which may have important implications for understanding of
social behaviour development. Hot EF is purported to be more strongly related to social
situations than cool EF because social situations involve personal and meaningful
consequences (Garner & Wajid, 2012; Zalazo et al., 2005).
The main objective is to examine whether subtypes of aggression based on function
and form have varied cognitive profiles. This research will adopt a multi-dimensional model
of aggression differentiating between reactive and proactive functions and physical and
relational forms. Reactive and proactive functions of aggression were examined because this
is a widely accepted dichotomy in the literature (Dodge, 1991; Kempes et al., 2005; Poulin &
Boivin, 2000). Further, physical and relational aggression will be included, but not verbal
aggression. The present research focused on physical and relational aggression because prior
studies attempting to identify cognitive mechanisms of aggression have focussed on these
subtypes. These studies have indicated that physical and relational aggression may be
differently associated with cognitive abilities, such as EF (Dane & Marini, 2014; Terranova et
al., 2008). Added to this, physical and relational aggression have been found to be differently
related to psychological and social outcomes (Card et al., 2008; Crick, 1996). The current
literature therefore supports the view of physical and relational aggression as separable types
of aggression. Due to the focus of the present exploratory research being on identifying
cognitive predictors of distinct subtypes of aggression, only physical and relational aggression
were included.
Added to this, these functions and forms will be considered because there is strong
evidence that these are distinct aspects of aggression characterised by different theoretical
underpinnings, underlying factors, developmental paths and outcomes (Hubbard et al., 2010;
76
Kempes et al., 2005). Both function and form are considered in the present research as they
are not independent domains of aggression and consequently are likely to interact (Mathieson
& Crick, 2010). Through adopting a multi-dimensional approach to aggression a greater
understanding of the development of aggression and its associated cognitive correlates can be
gained. The present research will therefore be the first to explore the underlying role of EF
and ToM in the function and form of aggression. This research will provide greater insight
into the currently limited understanding of the relation between individual EF skills and ToM
and the function and form of aggression.
An additional objective of this research will be on identifying the underlying role of
EF and ToM in prosocial behaviour and peer acceptance. Greater research attention has been
paid to identifying correlates of aggression compared to other social behaviours. This is
driven in part by the negative consequences associated with aggression across a range of
domains, including social, psychological, academic and economic (Campbell et al., 2006;
Chen et al., 2005). The same factors associated with the absence of aggression, may not
reflect the presence of greater prosocial behaviour. Research focusing on understanding
positive social development, such as prosocial behaviour, rather than focusing on just the
absence of behaviours often considered maladaptive, such as aggression, would be valuable to
increasing understanding of social development. Further, the majority of children use a
combination of prosocial and aggressive strategies (Zsolnai et al., 2012), some more skilfully
than others (Hawley, 2002; Vaughn et al., 2003). The moderating role of prosocial behaviour
on the relation between EF and social behaviour has yet to be studied. Identifying the
moderating role of prosocial behaviour may therefore increase understanding of the varied
development of aggressive behaviour.
A further objective of this research will be elucidating the association between
cognitive abilities, the function and form of aggression, prosocial behaviour and peer
acceptance. Peer acceptance becomes of increasing concern to children across early childhood
(Silk et al., 2012). Models of social development have proposed that cognitive abilities, such
as EF and ToM, and social behaviours, including aggression and prosocial behaviour, have
been linked to peer acceptance (Card et al., 2008; Cassidy et al., 2003; Farver & Branstetter,
1994; Masten et al., 2012). Though, whether the relation between aggression and peer
acceptance holds for all subtypes of aggression is debated (Morrow et al., 2006; Nelson et al.,
2005; Poulin & Boivin, 2000). Understanding the links between these cognitive and social
factors will inform current theory on the development of social behaviours and may increase
understanding of the reasons why children choose to engage in aggressive or prosocial

77
behaviour (e.g. greater peer acceptance). In particular, this may inform conceptualisations of
aggression by examining whether subtypes of aggression have distinct relations to peer
acceptance.
Cognitive abilities, like EF, have been found to be more strongly related to social
behaviour problems in early childhood compared to later childhood (Olson et al., 2011). EF
and ToM evidence substantial gains between 3- and 6-years-of-age (P. Anderson, 2008;
Wellman et al., 2001) and it is also during this period in the UK that children begin more
formal schooling. Developmental advances in EF and ToM may therefore alter the relation
between these cognitive abilities and aggressive and prosocial behaviour. This is the first
research to examine the longitudinal relations between cool and hot EF and ToM in children's
prosocial and aggressive behaviour and peer acceptance between 4- and 7-years-of-age. The
current research may provide new understanding of the developmental trends in the relation
between cognitive abilities and social outcomes across early childhood. The longitudinal links
between the cognitive and social factors was the focus of this thesis because it may lead to
important theoretical contributions for models of social development that have been
developed based on largely segregated bodies of literature. Added to this, it may inform more
targeted interventions. For example, identifying the differential relation of cognitive abilities
and peer acceptance to the functions and forms of aggression may provide insight into the
development of interventions that will be effective for a wider range of aggressive children.
In addition to investigating the links between cognitive processes and social
outcomes, this research will also explore the development of and associations between cool
and hot EF and ToM. Understanding of hot EF lags behind that of cool EF substantially and
as a result prior studies have adopted varying conceptualisations of hot EF (e.g. Di Norcia et
al., 2015; Garner & Waajid, 2012; Moore et al., 1998). This has meant that the extent to
which cool and hot EF represent distinct domains of EF is debated (Allan & Lonigan, 2014;
Kim et al., 2014) and the predictive links between hot EF and ToM are poorly understood
(Carlson et al., 2013). The present research will be the first to explore the developmental
associations between cool and hot domains of EF and ToM across early childhood.
Identifying the developmental associations between cognitive abilities may not only inform
current conceptualisations of cognitive development, but also may have important
implications for understanding of the link between cognition and behaviour.
The following research questions were generated: (1) What is the nature of the
relation between cool and hot EF and the function and form of aggression? (2) What is the

78
nature of the simultaneous role of EF and ToM in the function and form of aggression? (3)
How does the relation between EF and ToM and aggression change across early childhood?
(4) What is the nature of the role of cool and hot EF and ToM in prosocial behaviour? (5)
How does the relation between EF and ToM and prosocial behaviour change across early
childhood? (6) How does the association between cool and hot EF and their relation to ToM
change across early childhood? (7) What is the nature of the relation between EF, ToM,
aggression, prosocial behaviour and peer acceptance across early childhood?
The present thesis comprises four studies which attempt to address the research
questions. Chapter four presents the first study which examined the unique contribution of
cool and hot EF to the function and form of aggression, as well as prosocial behaviour, in
children between 3- to 6-years-old. Further, this study explored whether the relation between
cool and hot EF and aggression was moderated by prosocial behaviour. The first study
therefore addresses research questions one, two and three. Chapter five outlines the second
study which investigated the joint role of EF (including cool and hot domains) and ToM in
aggressive and prosocial behaviour in children between 3- and 6-years-old. The second study
further examined whether EF, ToM and aggressive behaviour predicted peer acceptance.
Study two consequently addressed research question one, four and six. Chapter six reports
study three which examined the development of cool and hot EF and ToM over the course of
one year for the 4-, 5- and 6-year-old cohorts. This study contributes towards understanding
research question 6. Chapter seven presents study four which investigates the longitudinal
associations between EF, ToM, aggression, prosocial behaviour and peer acceptance. Study
four therefore addresses research question three, five and six.
In line with the limited research in this area (Dane & Marini, 2014; Terranova et al.,
2008; Werner et al., 2006), it was tentatively hypothesised that EF (including cool and hot
dimensions) and ToM would be negatively associated with reactive and physical aggression.
It was also tentatively predicted that EF and ToM would be positively associated with
proactive and relational aggression. Although prior research has often failed to find a link
between either EF or ToM and proactive or relational aggression, these studies have
considered only function or form (e.g. Dane & Marini, 2014; McQuade et al., 2013; White et
al., 2012; Werner et al., 2006). Relational aggression has been posited to involve greater
social skill as it requires understanding and manipulating social relationships (Heilbron &
Prinstein, 2008). Further, proactive aggression has been argued to involve greater planning
(Poulin & Boivin, 2000). When relational aggression is used proactively it may therefore be
associated with greater cognitive abilities. In addition, EF and ToM were predicted to be

79
positively related to prosocial behaviour and peer acceptance, in line with prior studies (Espy
et al., 2011; Hughes & Ensor, 2011; Jacobson et al., 2011; Masten et al., 2012). It was also
hypothesised that prosocial behaviour would moderate the link between EF and aggression as
prosocial behaviour has been found to moderate the link between ToM, a skill which is highly
related to EF, and aggression (Renouf et al., 2009). For children who are low in prosocial
behaviour, EF may be positively associated with aggression, but for children high in prosocial
behaviour, EF may be negatively related to aggression.
It was further hypothesised that EF (including cool and hot domains) and ToM would
demonstrate significant improvement across early childhood, in line with prior research (P.
Anderson, 2008; Wellman et al., 2001). In accordance with the proposition that cool and hot
EFs are separable (Zelazo & Müller, 2002), it was predicted that cool EF skills would be
consistently correlated across early childhood and so too would hot EF skills. Added to this it
was further hypothesised that earlier cool and hot EF processes would predicted later ToM.
Hot EF processes are purported to involve the same medial regions of the PFC (Sabbagh et
al., 2009) and hot EF is thought to be central to emotionally significant problem solving,
which ToM often is (Zelazo & Müller, 2002; Zelazo et al., 2005). Lastly, it was predicted that
age related changes in the relation between individual EF subcomponents and aggression may
be observed between 4- and 7-years-of-age. Early childhood is characterised by important
cognitive and social developments; advances in EF and ToM are evident as children begin
school in the UK (P. Anderson, 2008; Wellman et al., 2001).

80
3. METHODOLOGY
3.1. Design
The current study used a cohort-sequential design. Also known as an accelerated
longitudinal design, the cohort-sequential design combines both cross-sectional and
longitudinal approaches (Bell, 1953). In this design, several short-term longitudinal studies of
different age cohorts are carried out simultaneously, these can then be linked together to
approximate a true, long-term longitudinal study (Bell, 1953; Duncan & Duncan, 2012). Data
is collected from each cohort at each time point, but not at every age; thus, missing data is due
to study design (Warner, Schaie & Caskie, 2005). Cohort-sequential designs are increasingly
being used in developmental psychology to estimate long-term growth in a range of domains
(Ducan & Duncan, 2012). For instance, accelerated designs have been used to examine
developmental trajectories of prosocial, anti-social, disruptive and aggressive behaviour
across early and middle childhood, as well as adolescence and adulthood (Brodbeck,
Bachmann, Croudace, & Brown, 2013; Kofler et al., 2011; Roth-Hanania, Davidov, & Zahn-
Waxler, 2011; Vaillancourt et al., 2003; Zhou et al., 2007).
A cohort-sequential design was chosen because it offers several advantages over
cross-sectional and longitudinal designs (Bell, 1953; Duncan & Duncan, 2012). Although a
true longitudinal design would provide the most rich developmental data, the cohort-
sequential approach enables a large age range to be studied over a shorter follow-up period
and consequently reduces the problem of cumulative testing effects and participant attrition
(Bell, 1953; Duncan & Duncan, 2012). In addition, following several cohorts is beneficial
because it increases confidence in the generalisability of the results as trends observed in each
age cohort can be corroborated. Furthermore, it means aging effects can be studied
independently of context and cohort effects.
The present study followed three cohorts of children (4-, 5-, 6-year-olds) over a 12
month period. Data were collected at three time points; initial recruitment (Time 1; April –
July 2014), approximately 6 months after recruitment (Time 2; October – December 2014)
and approximately 12 months after recruitment (Time 3; April – July 2015). The age of each
cohort at the three time points is presented in Table 3.1. In the current research there were six
dependent variables derived from Teaching staff (Teachers and Teaching Assistants) reports:
proactive physical aggression, proactive relational aggression, reactive physical aggression,
reactive relational aggression, prosocial behaviour and peer acceptance. Teacher reported
dependent variables were continuous, interval level measurements. In addition, there were

81
seven dependent variables based on peer reports. Peer reported dependent variables were
continuous, standardised measures of proactive and reactive, physical and relational
aggression, prosocial behaviour, peer acceptance and peer rejection. In the present study there
were six predictors: three cool EF predictors (inhibition, planning and working memory), two
hot EF predictors (affective decision making and delay of gratification) and one ToM
predictor, which incorporated first- and second-order false belief understanding. These
variables were continuous, interval level measures. There were also two control variables:
gender and receptive vocabulary. Gender was a categorical variable; boys were coded as '1'
and girls were coded as '2'. Receptive vocabulary was a continuous, interval level measure.
For a list of variables refer to Table 3.3.
Table 3.1. Mean age at each time point for the three cohorts
Mean age (years) 4 4.5 5 5.5 6 6.5 7
4-year-old cohort T1 T2 T3
5-year-old cohort T1 T2 T3
6-year-old cohort T1 T2 T3
Note. T1 = Time point 1. T2 = Time point 2. T3 = Time point 3.
3.2. Participants
Fourteen mainstream primary schools in the South East of England were contacted
via telephone or email requesting their participation in the current study (Appendix A).
Headteachers of three schools gave informed consent for their school to participate. Of these
schools, two schools were selected for the current study due to the time constraints of testing.
The two schools selected were comparable on the percentage of students receiving free school
meals: 26.6% and 24.7% (Department for Education, 2014). An opt-in procedure was used,
so a parent/guardian was required to give permission for their child to participate in the study
(the recruitment strategy is outlined in Appendix B). A recruitment letter along with a consent
form was sent to Parents/Guardians of children attending all 14 Nursery, Reception and Year
1 classes at the two schools (Appendix D). Informed consent was obtained from a
parent/guardian for 201 children across the 14 classes. At each school, the Reception and
82
Year 1 class that had the highest number of children with parental consent was selected to
participate in the research (resulting in children from two Reception and two Year 1 classes
participating). Due to the limited number of Nursery children with informed consent all four
nursery classes were selected to participate.
Based on school records, children diagnosed with a psychiatric disorder, such as
ADHD, autism, or a conduct disorder, or a medical disorder, such as a motor disability, and
children who had a statement of special education needs, such as a learning disability or
dyslexia, were excluded from the study because these disorders may have affected their
performance on the cognitive tasks. Based on this criterion, one child was excluded from
participating in the study. The final sample consisted of 106 children (51 (48.11%) boys and
55 (51.89%) girls). Thirty seven children were recruited from four nursery classes, 38
children were recruited from two Reception classes and 31 children were recruited from two
Year 1 classes.
Children were assigned to one of three cohorts based on their age: 4-, 5- and 6-year-
old cohort. The children were then followed up approximately six and 12 months later. For
the age of children across cohorts and time points see Table 3.2. At the second time point 99
children were followed up (7% attrition). Attrition was due to children no longer attending the
school or currently being too ill to attend school. At time three 98 children were followed up
(1% attrition). Attrition at time three was due to the child no longer attending the school.
The Class Teachers (n = 16) and Teaching Assistants (n = 23) of the children
participating in the study were also recruited in the present study to provide information on
children’s social behaviour. At time 1 three Nursery Teachers and five Nursery Assistants,
two Reception Teachers and two Reception Teaching Assistants and two Year 1 Teachers and
three Year 1 Teaching Assistants were recruited. At time two a further three Reception
Teachers and two Reception Teaching assistants, three Year 1 Teachers and four Year 1
Teaching Assistants, and three Year 2 Teachers and 3 Year two Teaching Assistants were
recruited. At time 3 a further three Reception Teaching Assistants and one Year 2 Teaching
Assistant were recruited. Informed consent was obtained from Teacher and Teaching
assistants (Appendix C).
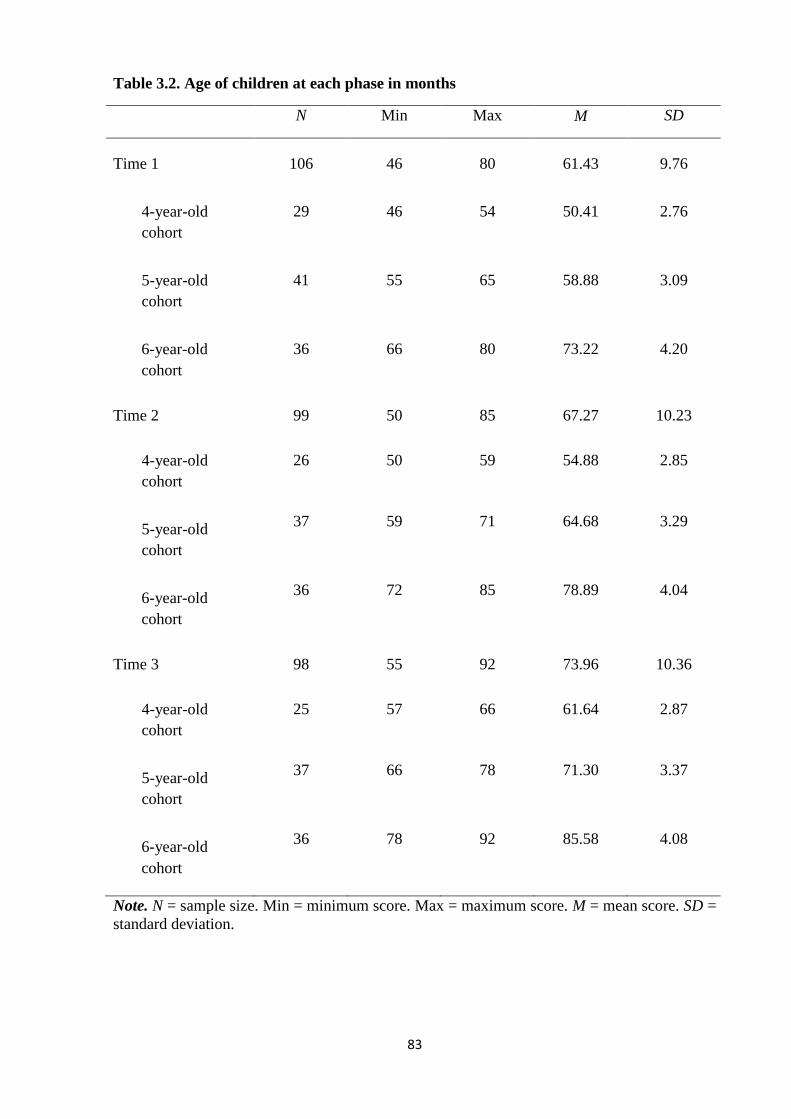
83
Table 3.2. Age of children at each phase in months
N Min Max M SD
Time 1 106 46 80 61.43 9.76
4-year-old
cohort
29 46 54 50.41 2.76
5-year-old
cohort
41 55 65 58.88 3.09
6-year-old
cohort
36 66 80 73.22 4.20
Time 2 99 50 85 67.27 10.23
4-year-old
cohort
26 50 59 54.88 2.85
5-year-old
cohort
37 59 71 64.68 3.29
6-year-old
cohort
36 72 85 78.89 4.04
Time 3 98 55 92 73.96 10.36
4-year-old
cohort
25 57 66 61.64 2.87
5-year-old
cohort
37 66 78 71.30 3.37
6-year-old
cohort
36 78 92 85.58 4.08
Note. N = sample size. Min = minimum score. Max = maximum score. M = mean score. SD =
standard deviation.
84
3.3. Measures
For a summary of the tasks used in the current research see Table 3.3.
3.3.1. Behaviour
The most commonly used methods of assessing children's social behaviour include
observations, behaviour ratings and peer nominations (Bukowski et al., 2012; Whitcomb &
Merrell, 2013). Merrell (2001) suggests that observation and behaviour rating assessments
represent first choice measures of children's social behaviour and peer nomination techniques
are second choice measures. Observational techniques enable researchers to capture real-time
individual social behaviour as well as dyadic and group interactions in a more objective
manner than other techniques allow (Brownell, Lemerise, Pelphrey, & Roisman, 2015;
Cavell, Meehan, & Fiala, 2003). Behaviour is recorded as it occurs and is consequently less
susceptible to informant perceptions and biases (Cavell et al., 2003). Though, there is still an
element of human judgement involved in observations, so they are unlikely to be completely
free from bias or error (Brownell et al., 2015). A further critique of observations is that they
normally occur over limited time periods and occasions which may mean they fail to reliably
capture an adequate sample of children's social behaviours (Cavell et al., 2003; Hintze &
Matthews, 2004; Hintze, 2005). Observational measures may therefore not always be
representative of the child's typical behaviour or generalisable to other times and settings
(Cavell et al., 2003).
Behaviour ratings of children's social behaviour are typically gathered from Parents
or Teachers. Parents and Teachers are familiar with the child and observe them in different
settings (McClelland & Scalzo, 2006). Behaviour ratings are therefore an effective means of
collecting information on children's behaviour across a broader range of contexts than can be
easily achieved using observational methods. Further, parent or teacher reports are effective
methods of assessing the behaviour of children who may be too young to self-report
(McClelland & Scalzo, 2006). Merrell (2001) argues that although self-reports provide useful
information about a child's social behaviour, they should not be considered first choice
measures due to concerns over reliability. Little attention has been paid to the development of
self-report measures and there has been limited empirical work undertaken to investigate the
accuracy of self-report measures, particularly in early childhood (Whitcomb & Merrell,
2013). Young children may lack the cognitive and linguistic capacities required to report on
their own behaviour. Added to this, children tend to evaluate their own behaviour more
85
favourably meaning undesirable behaviours such as aggression may be underreported in self-
reports (Krahè, 2013; Whitcomb & Merrell, 2013). Agreement between self-reports,
observations, teachers and peers has been found to be low in children between 4- and 6-years-
of-age (Monks et al., 2003; Vlachou, Botsoglou, & Andreou, 2013).
The research basis for the use of peer nomination techniques is extensive and
generally indicates that peer nominations are reliable indicators of children's social standing
and behaviour (Bukowski et al., 2012). Peer rating approaches require peers to nominate, rate
or rank children on various dimensions of social status or behaviour. Peer nomination
techniques to gather reports of behaviour and sociometric status have been used with
participants in early childhood through to adolescence (Caputi et al., 2012; Monks et al.,
2003, 2005; R. Smith et al., 2009). Peer nomination methods may result in more valid and
reliable information than Teacher or Parent ratings as peers witness interactions and events
that adults are unlikely to observe or that may cease when an adult is present (Brownell et al.,
2015). A further strength of peer nominations is that they are derived from multiple assessors,
meaning they take advantage of the collective knowledge of the group (Bukowski et al.,
2012). This increases reliability and decreases the biases inherent in single source methods.
Peers, teachers and observers exhibit good convergence on a number of aspects of social
behaviour (Cillessen & Mayeux, 2004; Monks et al., 2003; Vlachou et al., 2013).
Social development involves adaptation across a range of contexts and consequently
a multi-informant approach may provide more valid and reliable insights into children's social
behaviour than single informant or self-reports (Brownell et al., 2015; Merrell, 2001). In the
present research, behaviour ratings and peer nominations were used. Behaviour ratings were
chosen because this method captures a broader range of child’s behaviours over a longer time
period than may be possible using observation methods. Further, capturing the children’s
internal reasons for using aggression is more challenging using observations. Peer
nominations were used, rather than self-reports, because they are based on the knowledge of
the peer group and are less likely to be subject to social desirability.
Teaching staff and peers provided information on children's aggressive and prosocial
behaviour, as well as children's acceptance within the peer group. Teacher and Teaching
assistant reports were used in this research, as opposed to Parent reports, because Teaching
staff are external to the peer group and observe children's behaviour in a variety of school
contexts, especially during primary school where children spend a substantial amount of the
school day with the same Teacher and Teaching assistant(s) (Cheah, Nelson, & Rubin, 2001).

86
Teaching staff are also able to compare a child’s behaviour against peers of the same age
more readily than Parents. Teaching staff may therefore be able to provide more objective
information about children's behaviour (Coie & Dodge, 1988). Teacher and Teaching
assistant reports were combined in the present research to gain multiple perspectives in order
to increase reliability.
The majority of research investigating cognitive predictors of children's aggressive
and prosocial behaviour has relied exclusively on Teacher reports (e.g. Allan & Lonigan,
2011; Garner & Waajid, 2012; Hirvonen, Poikkeus, Pakarinen, Lerkkanen, & Nurmi, 2015;
Rathert, Fite, Gaertner, & Vitulano, 2011). Other informants, such as peers, have often been
neglected. Peers are an equally valuable source of information as peers observe each other in
multiple contexts inside and outside the classroom, allowing them to develop extensive
knowledge regarding the characteristics of their age-mates (Bukowski et al., 2012).
Furthermore, peer reports are based on direct insider knowledge and consequently may be
more valid than reports based on outsider knowledge. Peer reports were therefore also
gathered in this research.
Although agreement between Teacher and Peer reports of children's behaviour have
often been observed, concordance rates are typically low to moderate and have been found to
vary based on the form of aggression and the target child's gender (Crick, Casas, & Mosher,
1997; Crick, 1996; Little, Brauner, Jones, Matthew, & Hawiey, 2003; McMahon et al., 2013;
Monks et al. , 2003; Tomada & Schneider, 1997). It would appear there is some disagreement
between teachers and peers in behaviour ratings. Aggregating teaching staff and peer reports
may lead to important differences being missed. Considering multiple informants views,
rather than a single reporter or an aggregate of reporters, allows social behaviour across
situations to be examined (Little et al., 2003), and as a result this may increase understanding
of the varied nature of aggression. In this research Teaching staff and Peer reports were
therefore considered as separate and not aggregated.
3.3.1.1. Teaching Staff Measures
Preschool Proactive and Reactive Aggression Scale (PPRA; Ostrov & Crick, 2007).
To assess the function and form of children's aggression Teachers and Teaching assistants
completed the PPRA for each child in their class participating in the study (Appendix H). Few
measures of young children's aggression that differentiate between function and form are
available. Ostrov and Crick (2007) developed the PPRA based on the widely used Proactive

87
and Reactive Teacher-Report Measure for school-aged children (Dodge & Coie, 1987) as well
as an adolescent self-report measure (Little et al., 2003) in order to assess preschool children's
(3- to 6-years-old) level of aggression. The PPRA consisted of a series of statements
describing an aggressive act. The current study used only the ten items from the measure
pertaining to aggression; the two items assessing prosocial behaviour were removed as they
assessed proactive and reactive prosocial behaviour. Teaching staff rated how true each
statement was of the child on a five-point Likert scale, ranging from one meaning 'never or
almost never true' to five meaning 'always or almost always true'.
The PPRA has four subscales: proactive physical aggression (e.g. this child often
threatens others physically to get what s/he wants), reactive physical aggression (e.g. if other
children make this child angry, s/he will often physically hurt them), proactive relational
aggression (e.g. to get what this child wants, s/he often tells others that s/he won’t be their
friend anymore), and reactive relational aggression (e.g. if other children hurt this child, s/he
often keeps them from being in their group of friends). Teaching staff ratings for each
subscale were averaged to create four aggression scores. Teacher and Teaching Assistant
ratings were combined as they were highly and significantly correlated (proactive relational
aggression r = .42, p < .001; reactive relational aggression, r = .39, p < .001; proactive
physical aggression, r = .51, p < .001; reactive physical aggression, r = .67, p < .001). The
PPRA has been found to have good internal consistency (proactive physical aggression, α =
.88; reactive physical aggression, α = .92; proactive relational aggression, α = .88; reactive
relational aggression, α = .82; Ostrov & Crick, 2007) and it has been found to be moderately
associated with naturalistic observations (r = .26 - .42 for proactive physical aggression, r =
.27 - .47 for reactive physical aggression, r = .37 - .38 for proactive relational aggression, r =
.28 - .41 for reactive relational aggression; Murray-Close & Ostrov, 2009; Ostrov et al.,
2013).
Teaching staff reports of children's aggressive behaviour using the PPRA were
gathered at each time point. This measure has not previously been used with children 6-years-
of-age and above. The maximum age of children in the present study, though, was 7-years-of-
age. The age range in the current study therefore did not deviate substantially from the
standard age range the scale has been used with. Furthermore, it has been suggested that the
measure will apply to school-aged children because it was developed based on measures
designed for use with school-age children and adolescents (personal communication Jamie
Ostrov, December 2013).
88
Preschool Social Behaviour Scale (PSBS; Crick, Casas, & Mosher, 1997). The
PSBS has five subscales: relational aggression, overt aggression, prosocial behaviour, peer
acceptance and depressed affect. Teaching staff completed the prosocial behaviour subscale
for each child in their class participating in the study at each time point, in order to assess
children's level of prosocial behaviour over the 15 month period (Appendix H). The prosocial
behaviour subscale consisted of four items that described different prosocial acts, including ‘is
helpful to peers’ and ‘is good at sharing and taking turns’. Teaching staff also completed the
peer acceptance scale from the PSBS for each child to measure children's level of acceptance
within their peer group (Appendix H). The peer acceptance scale has two items that assess
acceptance by peers of the same and opposite gender (e.g. this child is well liked by peers of
the same/opposite sex). The PSBS has been used in studies of children in the preschool years
(3- to 5-years-old) through to middle childhood (6- to 9-years-old) and so was appropriate for
use at all three time points (Crick et al., 1997; Gomez-Garibello & Talwar, 2015). Teaching
staff rated how true each statement was of the child on a five-point Likert scale, with one
meaning 'never or almost never true' and five meaning 'always or almost always true'.
Teaching staff ratings for each subscale were averaged to create a prosocial and peer
acceptance score. Teacher and Teaching Assistant ratings were combined as they were highly
and significantly correlated (prosocial behaviour, r = .58, p < .001; peer acceptance r = .60, p
< .001). The Prosocial Behaviour Scale has been found to have good internal consistency (α =
.88; Crick et al., 1997). In addition, internal consistency of the Peer Acceptance Scale has
been found to be very good (α = .95).
3.3.1.2. Peer Nominations
Sociometric Status. Peer nominations of acceptance and rejection were gathered to
assess children's sociometric status. In line with the procedure developed by Coie, Dodge, and
Coppotelli (1982), children were asked to nominate the peers they liked most in their class
(peer acceptance) and the peers they liked least in their class (peer rejection). Each child
received a tally by their name if they were nominated. Children were allowed to make an
unlimited number of nominations as this has been found to be a more reliable approach than a
limited methodology, where children are only allowed to nominate a set number of peers
(Marks, Babcock, Cillessen, & Crick, 2013). Cross-gender nominations were also allowed.
Previous studies involving sociometric nominations have allowed cross-gender nominations
(Chen, Cen, Li, & He, 2005; Coie & Dodge, 1988; Monks, Palermiti, Ortega, & Costabile,
2011) and in the pilot study children nominated both same and opposite gender peers. The
researcher summed the number of nominations for peer acceptance and rejection for each

89
child and then standardised the scores by nominator population (e.g. number of children in the
class participating in the study) to account for the varying population sizes (Bukowski et al.,
2012; Crick & Grotpeter, 1995). In accordance with previous research, peer acceptance and
rejection were treated as separate variables in order to explore separate patterns of liking and
disliking (Caputi et al., 2012; Tseng, Banny, Kawabata, Crick, & Gau, 2013; Véronneau,
Vitaro, Brendgen, Dishion, & Tremblay, 2010).
Aggressive and Prosocial Behaviour. Children nominated peers in their class who
behaved aggressively or prosocially. An interview procedure using cartoons as aids was
developed for the present study. The cartoons were used to illustrate aggressive and prosocial
behaviours to children in order to enhance their understanding of the behaviour in question.
The interview procedure was developed based on the technique used by Monks et al., (2003).
Monks et al. (2003) used cartoons of stick figures to illustrate different forms of aggression.
This was extended in the present study to also include the function of aggression. Children
were shown five A4 landscape pictures of gender neutral stick figures (see Figure 3.1). There
was one picture for each type of behaviour: prosocial: a child helping another child who had
fallen over; reactive physical aggression: a child kicking another child because they were
angry with them; proactive relational aggression: a child not inviting another child to their
party because they didn't do what the child wanted; reactive relational aggression: a child not
letting another child play with them because they were angry with them; proactive physical
aggression: a child hitting another child to get the child's crayon. The pictures were developed
by the researcher and were based on items from the PPRA and PSBS.
The researcher presented one picture at a time to the child. The pictures were always
presented in the same order. The prosocial picture was presented first to allow the child to feel
more comfortable disclosing nominations to the researcher. The aggressive pictures were then
presented in the following order: reactive physical, proactive relational, reactive relational and
proactive physical aggression. The aggressive pictures were presented in this order so that the
function and form of aggression were varied to reduce the chance of children confusing the
types of aggression. After the researcher presented the child with the picture they asked the
child 'What do you think is happening in this picture?' The researcher then clarified the
behaviour depicted in the picture (even if the child had provided an accurate explanation) and
emphasised why the stick figure child in the picture was behaving aggressively, pointing to
the relevant stick figure (e.g. 'This child is hitting the other child because they want the blue
crayon'). The researcher then asked the child 'So why is this child [hitting] the other child?',
pointing to the relevant stick figure in order to confirm the child understood the function of
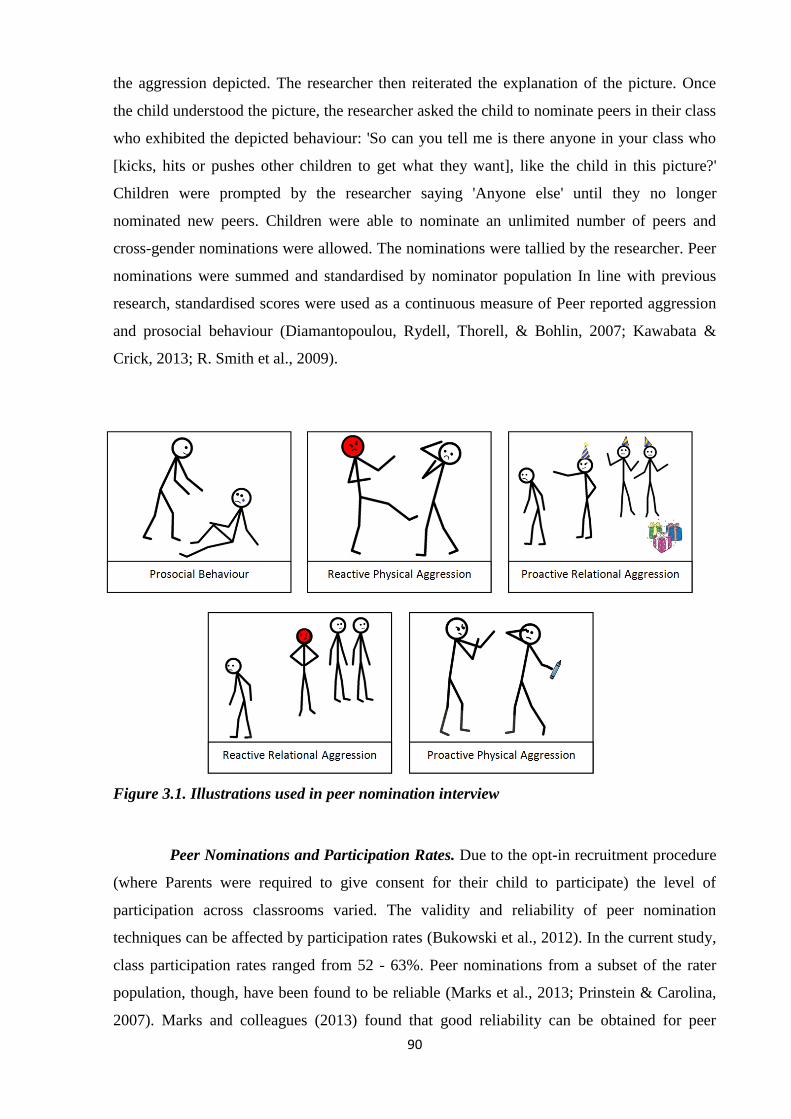
90
the aggression depicted. The researcher then reiterated the explanation of the picture. Once
the child understood the picture, the researcher asked the child to nominate peers in their class
who exhibited the depicted behaviour: 'So can you tell me is there anyone in your class who
[kicks, hits or pushes other children to get what they want], like the child in this picture?'
Children were prompted by the researcher saying 'Anyone else' until they no longer
nominated new peers. Children were able to nominate an unlimited number of peers and
cross-gender nominations were allowed. The nominations were tallied by the researcher. Peer
nominations were summed and standardised by nominator population In line with previous
research, standardised scores were used as a continuous measure of Peer reported aggression
and prosocial behaviour (Diamantopoulou, Rydell, Thorell, & Bohlin, 2007; Kawabata &
Crick, 2013; R. Smith et al., 2009).
Figure 3.1. Illustrations used in peer nomination interview
Peer Nominations and Participation Rates. Due to the opt-in recruitment procedure
(where Parents were required to give consent for their child to participate) the level of
participation across classrooms varied. The validity and reliability of peer nomination
techniques can be affected by participation rates (Bukowski et al., 2012). In the current study,
class participation rates ranged from 52 - 63%. Peer nominations from a subset of the rater
population, though, have been found to be reliable (Marks et al., 2013; Prinstein & Carolina,
2007). Marks and colleagues (2013) found that good reliability can be obtained for peer

91
nominations of overt aggression and prosocial behaviour with participation rates as low as
40%. Further, reliability increased rapidly from zero to 50% participation and gains in
reliability were not as large past 50%. As participation rates were above 50% in the present
study peer reports were considered to be a valid and reliable measure of children's behaviour.
Sociometric measures are affected by participation rates to a greater extent. It has been
suggested that reliable findings can be obtained with participation rates of 60% for
sociometric measures (Cillessen & Marks, 2011; Crick & Ladd, 1989). Although some of the
class participation rates were lower than 60%, peer reports of children's sociometric status
were still used in the present study as peer reports can be corroborated with teacher reports.
Sociometric and Behaviour Ratings - Time 2 and 3. Peer nominations were
collected at Time 1 only. At Time 2 children had progressed to the next year group at school
and as a result some of the children had transferred from their original class at Time 1 into a
new class. If peer reports were collected at Time 2 and 3, therefore, some children would be
required to report on the behaviour of peers who were no longer in their class. In one case,
only three children from the same initial class at Time 1 were together in the same new class
at Time 2. The reliability of the peer reports as a result may have been reduced as children
would have had more limited opportunities to interact with and observe the behaviour of peers
that were not in their class. Peer reports at Time 2 and 3 were consequently not collected.
3.3.2. Executive Function
Inhibition and working memory were assessed as measures of cool EF in this
research because there is growing evidence that inhibition and working memory represent
distinct fundamental domains of EF that develop early in childhood (Anderson & Reidy,
2012; Anderson, 2002; Espy et al., 2004; Hummer, Wang, Kronenberger, Dunn, & Mathews,
2015; M. Miller, Giesbrecht, Müller, McInerney, & Kerns, 2012; Schoemaker, Bunte, Espy,
Deković, & Matthys, 2014). The more complex cool EF skill planning was also assessed as
planning abilities have been identified in young children (Welsh et al., 1991) and have been
found to be associated with children's inhibition and working memory skills (Senn et al.,
2004). Inhibition is the most studied cool EF skill in relation to children's social behaviour
and there is strong support that poor inhibition is related to increased aggression and low
prosocial behaviour (Hirvonen et al., 2015; Jacobson et al., 2011; Masten et al., 2012;
Utendale et al., 2011; Verlinden et al., 2014). In contrast, few studies have examined the role
of working memory and planning in young children's social behaviour, but there is emerging

92
evidence poor working memory and planning may also be associated with increased
aggression and low prosocial behaviour (McQuade et al., 2013).
The hot EF skills that were explored in the current research were affective decision
making and the ability to delay gratification. Understanding of the organisation and
development of hot EF lags behind that of cool EF (Zelazo & Müller, 2002; Zelazo et al.,
2003). Consequently, there is debate surrounding which skills constitute hot EF. There
appears to be strong consensus in the literature, though, that affective decision making and
delay of gratification represent hot EF skills (Hongwanishkul, Happaney, Lee, & Zelazo,
2005; Kerr & Zelazo, 2004; Zelazo & Müller, 2002). Both affective decision making and
delay of gratification are apparent in early childhood and evidence substantial development
over this period (Hongwanishkul et al., 2005; Kerr & Zelazo, 2004). Although there is limited
research examining the relation between hot EF and children's social behaviour, there is
emerging evidence that affective decision making as well as the ability to delay gratification
are related to children's prosocial and disruptive behaviour (Brock et al., 2009; Garner &
Waajid, 2012; Masten et al., 2012).
There are two main approaches to the assessment of EF in young children:
performance based or rating measures (Anderson & Reidy, 2012; Mahone & Slomine, 2007).
Performance based measures (e.g. Tower of London) involve standardised assessment
procedures and typically assess accuracy and/or response time. Rating measures (e.g. BRIEF),
in contrast, involve an informant (in the case of children this is usually a Parent or Teacher)
reporting on difficulties carrying out everyday tasks that reflect EF. Compared to performance
based tests, rating measures capture more global aspects of behaviour and may therefore be
more ecologically valid than performance based measures that are carried out in relatively
artificial, standardised conditions (P. Anderson & Reidy, 2012; McCloskey & Perkins, 2013;
Thorell & Catale, 2014). But, rating measures may be subject to informant biases, such as
context effects and differences in the way observers judge behaviour, and there is
considerable overlap between some rating measures, such as the BRIEF, and behavioural
problems, like ADHD (Thorell & Catale, 2014). Rating measures are based on the underlying
assumption that they are measuring behaviours that are related to EF processes assessed by
performance based measures (Toplak, West, & Stanovich, 2013). Though, the correlation
between rating and performance based measures is often low (Miranda, Colomer, Mercader,
Fernández, & Presentación, 2015; Toplak et al., 2013). Further, a rating measure that
differentiates between cool and hot domains of EF has yet to be developed. Although
performance tasks are not pure measures of EF skills, they have greater experimental control
93
and process specificity than rating measures (P. Anderson & Reidy, 2012; McCloskey &
Perkins, 2013; Thorell & Catale, 2014). The aim of the present research was to examine
specific domains of cool and hot EF and as a result performance based measures were used.
3.3.2.1. Cool Executive Function
Inhibition. The fish and shark version of the Go/No-Go paradigm developed by
Simpson and Riggs (2006) was used in the present study to measure children's cognitive
inhibition. This was a computerised task which the researcher developed on Superlab 5.0. The
task was presented to children on a laptop computer with a 13.5" screen. Children responded
on a response pad that had a red central button. An image of a fish or a shark appeared in the
centre of the screen on a white background. The image of the fish and shark were distinct to
ensure that children were able to differentiate between the images (see Figure X). Children
were instructed to catch the fish in their fishing net by pressing the red button on the response
pad (Go trials), but to avoid catching the shark in their net by withholding pressing the button
(No-Go trials) because the shark would break the fishing net. The child must therefore inhibit
the dominant response to press the button when a shark is presented.
The image of the fish or shark was presented for 1500msec (or until the child pressed
the button), with an inter-stimulus interval of 1000msec. After a correct response (e.g.
pressing the button when a fish was on screen), positive feedback was provided; children saw
an image of a fish in a net and heard a bubbling sound. After an incorrect response (e.g.
pressing the button when the shark was on screen), negative feedback was provided; children
saw a picture of a broken net with the shark escaping and heard a buzzer sound. Feedback was
provided for 1000msec. If the child did not respond no feedback was presented.

94
Figure 3.2. Images presented in the Fish-Shark Go/No-Go Task
At the start of the task animated instructions were displayed on the screen, which the
researcher read to the child. In accordance with the procedure outlined by Simpson and Riggs
(2006) each child completed six practice trials (3 Go and 3 No-Go trials), before completing
40 test trials (30 Go and 10 No-Go trials). The 40 test trials were divided into five blocks.
Each block contained eight trials, which included six fish and two sharks. The trials were
block randomised so that the fish and sharks in each block were presented to each child in a
random order. To assess children's cognitive inhibition the proportion of correct Go and No-
Go trials, as well as average response time to Go trials and to No-Go trials was recorded.
Children completed this task at all three time points.
Many different Go/No-Go paradigms have been developed and they have been
widely used in the literature to assess inhibition in both children and adults (P. Anderson &
Reidy, 2012). The nature of the task and the degree of inhibition required can be modified to
enable the use of the task with young children (Willoughby, Blair, Wirth, & Greenberg,
2010). The Fish/Shark version was chosen because it is developmentally appropriate for the
age range of children across the time points in this research; the Fish/Shark version has been
used in studies of children as young as 3-years-of-age (Chevalier et al., 2012; Wiebe,
Sheffield, & Espy, 2012). Both the stimuli (e.g. fish and sharks) and the speed that the stimuli
Go Trial
No-Go Trial
Correct go trial
feedback
Incorrect no-go
trial feedback

95
are presented are age appropriate for the children in the present research. Furthermore, in
comparison to other inhibition tasks, the Go/No-Go task requires relatively few trials, which
makes it more appropriate for young children whose shorter attention spans make completion
of long tasks more difficult. Test-retest reliability has been found to be good for the
Fish/Shark version, exceeding .80 (Schoemaker et al., 2012).
Planning. Children completed the Tower of London (ToL) to measure their planning
skills at all three time points (Shallice, 1982). Tower tasks are commonly used within the
literature to assess planning. Tower tasks require the individual to formulate a course of action
before moving the beads in order to perform better. The ToL has been widely used to assess
planning ability across the lifespan, from children as young as 3-years-old to adulthood
(Albert & Steinberg, 2011; Monks et al., 2005). Performance on the ToL is predictive of
everyday functioning impairments in clinical groups, indicating good criterion validity
(Masson, Dagnan, & Evans, 2010; Sullivan, Riccio, & Castillo, 2009). Repeated assessments
using the ToL have been carried out to assess planning ability across developmental periods
(Albert & Steinberg, 2011; Hughes, Ensor, Wilson, & Graham, 2010; Hughes & Ensor,
2007).
The ToL involves two identical wooden pegboards that are placed adjacent to each
other in front of the child. Each pegboard has three wooden pegs on which three wooden
beads can be placed (one green, one red, one blue). The child is required to replicate a series
of patterns constructed by the researcher in a set number of moves (see Figure 3.). The
researcher first explained the task to the child and then presented the child with two 2-move
problems as a practice (see Appendix I for instructions). If required the researcher helped the
child solve the practice problems to ensure that the child understood the task. Children were
then presented with the 12 trials from Shallice's (1982) original problem set: two 2-move
tasks; two 3-move tasks; four 4-move tasks; and four 5-move tasks.
The child's pegboard was always placed directly in front of the child and the
researcher’s pegboard was always placed to the right of it. The task was carried out in line
with the approach used in Monks et al. (2005). At the start of each problem trial the researcher
first arranged the child's beads into the start position and then constructed the test problem on
their own pegboard (see Figure 3.). In order to successfully complete each problem the child
needed to adhere to two rules. First, the child needed to complete the trial in the specified
number of moves. The researcher informed the child of the required number of moves at the
start of each trial. Second, the child could remove only one bead from a peg at a time. Each

96
problem was presented to the child a maximum of two times and they were given two minutes
to complete each problem. In the present study, children were presented each problem twice
rather than three times as was done in Monks et al.'s (2005) study because there is debate
surrounding whether multiple presentations of a test problem reduces the novelty of the task
(Culbertson & Zillmer, 1998). If two minutes passed and the child had not completed the trial
then the trial was marked as a fail and the researcher moved the child onto the next problem.
The task was ceased after the child completed all problems or failed two problems
consecutively.
Children's performance was assessed based on the method outlined by Culbertson
and Zillmer (1998) and Monks et al. (2005). The number of problem trials successfully
completed was assessed. Children were awarded 2 points if they completed the problem on
the first trial, 1 point if they completed the problem on the second trial and 0 points if they
failed to complete the problem. Scores ranged from 0 (none correct) to 24 (all correct on the
first trial). The number of errors children made on each trial was also measured. An error
referred to making more moves than was specified or removing more than one bead from a
peg at a time. The total number of errors on all attempted test trials was summed. In addition,
solution time for each trial was measured. Solution time was the time from presentation of the
problem to the completion (or discontinuation) of the problem. The average solution time for
the number of attempted test trials was calculated.
Figure 3.3. Diagram showing the Tower of London start position and an example test
problem
Start position 2 move test problem

97
Working Memory. The digit span forward and backward subtests from the Wechsler
Intelligence Scale for Children - 3rd Edition (WISC-III; Wechsler, 1991) were used to assess
children's verbal working memory. Children completed the digit span at each of the three time
points. Very few assessments of working memory in early childhood have been developed
and those available tend to tap memory more broadly, rather than working memory. Although
the WISC-III was developed for use with children between 6- and 16-years-of-age, the digit
span subtests have been successfully used with children 4- to 5-years-old (Alloway,
Gathercole, Kirkwood, & Elliott, 2008; Bull, Espy, & Wiebe, 2008). In addition, the test-
retest reliability for the forward subtest has been found to be good (.81) and adequate for the
backward subtest (.64) in a study of children between 4- and 11-years-of-age (Alloway,
2007). The digit span task therefore appears to be a developmentally sensitive task of working
memory in children below 6-years-of-age.
The task was carried out in accordance with the WISC-III guidelines (Wechsler,
1991). The researcher read a series of number sequences to the child at the rate of
approximately one number per second. In the forward subtest the child was required to recall
the list of digits in the same order as spoken. The forward subtest is considered a measure of
storage capacity. In the backward subtest the child was required to recall the list of digits in
the reverse order. The backward subtest is thought to measure working memory as it requires
manipulation of information; that is the number sequence has to be mentally reversed. The
task started with a digit span length of two and increased to nine digits on the forward subtest
and eight digits on the backward subtest. There were two trials at each span length. The task
ceased when the child failed both trials at any given span length. Children were awarded 1
point for each correct trial. Scores from the forward and backward subtest were summed and
potential scores ranged from 0 to 30. Raw scores as opposed to age standardised scores were
used because age standardised scores are not available for children below 6-years-of-age in
the WISC-III. This scoring method has been adopted in previous research (Alloway et al.,
2008; Bull et al., 2008).
3.3.2.2. Hot EF
Affective Decision Making. A modified version of the Children's Gambling Task
(CGT) developed by Kerr and Zelazo (2004) was used to measure children's affective
decision making at each of the three time points in the present study. The CGT was developed
based on the widely used IOWA gambling task (Bechara et al., 1994). Gambling tasks reflect
98
real life decision making in terms of risks and the uncertainty of rewards and punishments.
The CGT is less cognitively demanding than the IOWA gambling task as the number of decks
is reduced from four to two and the stimuli and rewards are more appropriate for children.
The CGT has been found to be developmentally appropriate for children in early childhood
(3- to 5-years-of-age; Heilman, Miu, & Benga, 2009; Hongwanishkul, Happaney, Lee, &
Zelazo, 2005; Kerr & Zelazo, 2004; Mata, Sallum, Miranda, Bechara, & Malloy-Diniz, 2013)
and has been used in longitudinal research (Rueda, Checa, & Cómbita, 2012). The CGT also
provides a more tangible reward than other child versions of the IOWA gambling task, such
as the Hungry Donkey Task, and consequently may be a more sensitive measure of hot EF in
young children (Crone & Molen, 2010).
In the current study this task was referred to as the Children's Decision Making Task
(CDMT) because it was felt that referring to the word gambling may have negative
connotations for parents and schools. The CGT was modified so that it did not involve the use
of food (e.g. sweets) because children completed this task during the school day and allergy
information was not obtained from Parents or Teachers. In contrast to the original CGT in
which the aim is to win sweets, the CDMT involved the child trying to win as many beads as
possible which they could trade for rewards in the form of stickers. This method was
developed based on previous research which has found that young children are able to
understand that tokens (e.g. beads) can be traded for rewards (e.g. stickers) (O’Connor,
McCormack, & Feeney, 2014). Pilot testing also indicated that children in the present study
were easily able to grasp the rules of the game.
The procedure used in the present study was the same as that outlined by Kerr and
Zelazo (2004). Each child was presented with two decks of A5 cards: one deck with a striped
pattern on the back and the other with a dotted pattern on the back. When turned the cards
revealed happy faces, which corresponded with the number of beads won, and sad faces,
which corresponded with the number of beads lost. The sad faces were covered by a flap that
was opened after the child had attended to the happy faces, to ensure that the child had first
focussed on the reward information. The order of the cards was fixed so that one deck was
always advantageous and one deck was always disadvantageous. The advantageous deck
always resulted in a win of 1 bead and a loss of either 0 or 1 beads, whereas the
disadvantageous deck always resulted in a win of 2 beads, but a more variable loss of 0, 4, 5,
or 6 beads. The advantageous deck therefore resulted in a net average gain of 5 beads per
block of 10 cards, whereas the disadvantageous deck resulted in a net average loss of 5 beads
99
per block of 10 cards. The gain/loss contingencies were proportional to those used in the
IOWA gambling task (Bechara, 2004; Appendix J).
There were two sets of decks of cards: one where stripes were disadvantageous and
one where stripes were advantageous. Card set was counterbalanced and the left and right
positioning of each deck was determined randomly for each child. The task was set up in the
same way for each child. The decks were placed on the table in front of the child and between
the two decks was a graduated cylinder in which the child could put the beads that they had
won. The cylinder had level marks that identified how many stickers the child won if they
filled the cylinder to that point. The level marks ranged from 1 to 6. To start the task the
researcher placed 15 beads in the child's cylinder. There were 6 demonstration trials in which
the researcher taught the child the rules of the task (see Appendix K for instructions). The
child then completed 50 test trials.
Children's affective decision making was assessed based on whether they made
predominately advantageous or disadvantageous decisions. In order to measure affective
decision making difference scores were calculated by taking the proportion of
disadvantageous decisions away from the proportion of advantageous decisions. Difference
scores ranged from -1 to 1. Positive scores indicated more advantageous decision making and
negative scores indicated more disadvantageous decision making. A difference score for the
last 30 trials (blocks 3 to 5) was calculated in the present study so the relationship between
overall decision making and social behaviour could be examined. This scoring method is used
for the IOWA Gambling Task (Antoine Bechara, 2004; Hobson et al., 2011) and is based on
the finding that a more reliable index of affective decision making is obtained from the latter
half of the IOWA Gambling Task (Monterosso, Ehrman, Napier, O’Brien, & Childress,
2001). This method has been previously applied to the CGT (Hongwanishkul et al., 2005).
However, Hongwanishkul et al’s, (2005) study included 40 trials in contrast to the 50 trials in
the present study. In the present study a difference score for blocks 3 to 5 (last 30 trials) was
calculated because differences in 3- to 4-year-olds affective decision making are observed
over blocks 3 to 5 (Kerr & Zelazo, 2004).
Delay of Gratification. The Gift Delay task was used to assess children's ability to
delay gratification (Kochanska, Murray, Jacques, Koenig, & Vandegeest, 1996). The
researcher told the child that they had bought them a special surprise as a thank you for
completing all the tasks, but that they had forgotten to wrap the gift. The researcher then sat
the child so that they had their back to the researcher and told the child not to turn around and

100
peek while they wrapped the gift so that it would be a surprise. The researcher then pretended
to noisily wrap the gift (the gift was already wrapped) behind the child's back in a
standardised manner (rifling through a carrier bag, cutting the wrapping paper with scissors,
folding the paper around the gift and tearing off the tape) for 60 seconds. Gifts included
pencils, pens, notebooks, and card games, which children kept at the end as a thank you for
completing the study. Children were assessed on their ability to control their temptation to
peek. Children were awarded two points if they did not turn around in their seat, one point if
they peeked over their shoulder and zero points if they turned around completely to peek. The
latency to the child's first peek over their shoulder and their first turn around to peek, as well
as the number of times they peaked over the shoulder or turned around was also measured.
The Gift Delay task was chosen because it is developmentally appropriate for the age
range of children in the present research. This task has previously been carried out with
children between 2- and 6-years-of-age (Carlson, 2005; Kochanska, Murray, & Harlan, 2000).
Added to this, the Gift Delay has been reported to be sensitive to age related changes in
performance across early childhood (3- to 6-years-old) and represents a sufficient level of
difficulty for children between these ages (Carlson, 2005). In addition, the Gift Delay Task
has been found to be reliable with an interclass correlation of .90 (Smith-Donald, Raver,
Hayes, & Richardson, 2007). Children completed this task at all three time points; a range of
gifts were used, including pencils, pens, notebooks, and card games to maintain the novelty of
the task across at each time point.
3.3.3. Theory of Mind
Understanding of false belief was assessed as a measure of children's ToM. False
belief understanding is the most widely used measure of young children's ToM (Wellman et
al., 2001). Children's false belief shows conceptual change across early childhood (Kaysili,
2011; Wellman et al., 2001; Wimmer & Perner, 1983) and is strongly related to EF (Devine &
Hughes, 2014). False belief understanding is important in social development research
because it is a skill that enables children to better coordinate their own thoughts and beliefs
with those of others and allows children to distinguish between accidental and intended
behaviour, wishes and reality, and truth and deception and consequently is important for
social regulation (Astington, 2003; Bellagamba et al., 2012). False belief understanding has
been implicated in children's prosocial and aggressive behaviour (Cassidy et al., 2003;
Diesendruck & Ben-Eliyahu, 2006; Hughes, White, Sharpen, & Dunn, 2000; Moore, Barresi,
& Thompson, 1998; Shakoor et al., 2012).
101
False Belief Understanding. To assess children's first order false belief
understanding the deceptive contents and Sally-Anne task were carried out. A variant of the
Sally-Anne task was used to assess second order false belief understanding. These tasks were
selected because they have been widely used with preschool and school-aged children, so are
developmentally appropriate for the age range of the children across the time points in the
current research (Hughes, 1998a; Monks et al., 2005; Razza & Blair, 2009). The deceptive
contents and Sally-Anne tasks have been found to have good internal consistent and test-retest
reliability (k = .53 for deceptive contents and k = .62 for Sally-Anne; Hughes et al., 2000;
Hughes, 1998b). These tasks were also found to be reliable for children who ranged in verbal
ability (Hughes et al., 2000). Added to this, acceptable convergent validity across the
deceptive contents and Sally-Anne task has been found, suggesting they are tapping the same
construct (Grant, Grayson, & Boucher, 2001).
In the Deceptive Contents Task (Perner et al., 1987) the researcher showed the child
a prototypical container that they should be familiar with (e.g. a Smarties tube) and asked the
child what they thought was inside the container. The researcher then revealed the contents of
the container to the child. The container actually contained and unexpected item (e.g. pencils).
The researcher asked the child two control questions: "When you first saw the box, what did
you think was inside?" (correct answer: Smarties) and "What is in the box really?" (correct
answer: pencils). The researcher then asked the child the false belief question: "If I show this
box to another child in your class what will they think is inside the box?" (correct answer:
Smarties). This task therefore required the child to attribute a false belief to another child.
Children completed this task at all three time points. To reduce the risk of retest effects the
container and the contents used at each time point were altered. At time 1, children were
shown a Smarties tube containing pencils. At time 2, children were shown an egg box
containing stones. At time 3, children were shown a crayon box containing coins.
In the first version of the Sally-Anne tasks (Baron-Cohen et al., 1985), which
assessed first-order false belief understanding, the child was introduced to two dolls: Sally
and Anne. Once the child was able to identify each doll, the researcher acted out a story with
the dolls. The child was told "Look, Sally has got a yellow box which matches her dress and
Anne has got a blue box which matches her trousers. Sally is lucky because she's got a marble
as well". The children were then asked, "Can you put Sally's marble in her box?" (to ensure
that they knew which box belonged to each doll). They were then told, "Sally is going out to
play" and the researcher put the Sally doll behind their back, out of the child’s view. The child
was then asked to help Anne move the marble, "Anne wants to move the marble from Sally's

102
box and put it in her own box. Can you help her?" The researcher then brought the Sally doll
back and asked the child, "Where will Sally look for her marble?" (false belief question:
correct answer is in her own (Sally's) box). Children were therefore required to attribute a
false belief to Sally. The researcher also asked the child two control questions: "Where is the
marble really?" (correct answer: Ann’s box) and "Where was the marble in the beginning?"
(correct answer: Sally’s box) to ensure they had followed the story.
The second version of the Sally-Anne task measured second-order false belief
understanding (Riviere, 1997). Children were introduced to the same two dolls (Sally and
Anne) as in the first version, but the researcher acted out a slightly different variant of the
story with the aid of a doll house. In this version, when the child was told Sally was going out
to play, the researcher said to the child in an exaggerated whisper, "Sally isn't really going out
to play, she is going to watch Anne through the window to see what Anne is up to, but Anne
won't see her". The researcher placed the Sally doll behind the doll house, peeping through
the window. The child was reminded that Anne didn't know that Sally was watching her,
"Look, Sally is watching through the window, but Anne hasn't seen her". The researcher then
encouraged the child to help Anne move the marble, "Anne wants to move the marble from
Sally's box and put it in her own box. Can you help her?" As the child moved the marble, they
were reminded, "Sally is watching, but Anne hasn't seen her." The researcher then brought the
Sally doll back and asked the child the true belief question, "Where will Sally look for the
marble?" (correct answer: Anne's box). The child was then asked the second-order false belief
question, "Where does Anne think that Sally will look for the marble?" (correct answer:
Sally's box). Children were therefore required to attribute a false belief about a belief to Anne.
The child was then asked three control questions: "Where is the marble really?" (correct
answer: Anne's box), "Where was the marble in the beginning?" (correct answer: Sally's box),
and "Did Anne know that Sally was watching?" (correct answer: no). Children completed
both versions of the Sally-Anne task at all three time points. To prevent carryover effects the
two versions were not presented to the child in the same session. To prevent retest effects the
containers were different at each of the three time points (e.g. box, bag, chest).
The false belief tasks were scored in the same way. Children received 0 points if they
failed the false belief task and 1 point if they passed. In line with previous studies (Hughes et
al., 2000; Hughes, Dunn, & White, 1998; Hughes & Ensor, 2007), children were credited (1
point) with passing a false belief task only if they answered the test question and the control
questions correctly. Following the approach of previous research (Monks et al., 2005; Olson
103
et al., 2011; Razza & Blair, 2009), an aggregate ToM score was calculated. Potential scores
ranged from 0 to 3.
3.3.4. Verbal Ability
Children's receptive vocabulary was assessed using the short version of the British
Vocabulary Picture Scale (BPVS; Dunn, Whetton, & Pintilie, 1982). Receptive vocabulary
refers to an individual's ability to recognise and understand the meaning of a word. Receptive
vocabulary was measured because it has been found to be related to both EF and aggression
(Ayduk, Rodriguez, Mischel, Shoda, & Wright, 2007; Cuevas et al., 2014; Hughes, 1998a).
The BPVS was used in the current study as it was developed for use across the lifespan,
starting from 2-years-of-age (Dunn et al., 1982) and has been previously used in studies using
a British sample (Hughes, 1998b; Monks et al., 2005; O’Connor et al., 2014).
The BPVS was carried out at each of the three time points in accordance with
guidelines laid out in the manual. The BPVS booklet was placed in front of the child on the
table. The researcher then said a word and the child was required to select a picture (from 4
options) that best illustrated the words meaning. Children first completed practice trials. As
many practice trials as needed to secure four consecutive correct responses were administered.
On average children completed four practice trials. Children then completed the test trials.
The appropriate starting point based on the child’s age was used. There was a maximum of 32
trials of increasing difficulty. The task was stopped when children made four errors within six
consecutive responses. Age standardised vocabulary scores were used as a measure of
children's receptive vocabulary.
3.4. Procedure
This 15 month longitudinal study was approved by the University of Greenwich's
Research Ethics Committee. A pilot study was first carried out to test the procedure and
ensure that the tasks were understood by the children and were developmentally appropriate
for the entire age range. Some minor amendments to task instructions for the CDMT, ToL and
Peer reports were made based on the pilot study (See Appendix G for a detailed description of
pilot study results). The pilot study was carried out in March 2014 and the main study began
in April 2014 and finished in July 2015. There were three assessment phases, approximately 6
months apart. The first assessment phase was carried out from April 2014 to July 2014. The
second phase was carried out from October 2014 to December 2014. The third and final
assessment phase was carried out from April 2015 to July 2015. Data collection lasted

104
approximately 4 to 5 weeks per school. Assessment phases were scheduled for times in the
school year that allowed staff and students sufficient time to get to know one another. Before
the study began the researcher was introduced to the children involved in the study by a
Teacher so that the children were aware of who they were and felt more comfortable with the
researcher.
At the start of each assessment phase questionnaires were distributed to the relevant
Teachers and Teaching assistants along with a letter specifying the deadline by which they
needed to be returned. Teaching staff were given approximately three weeks to complete the
questionnaires in their own time. A box was left in a convenient place at the school for the
teaching staff to return the questionnaires. The name of the child each questionnaire referred
to was written on the top of the questionnaires. Once the questionnaires had been collected the
researcher removed the child's name and replaced it with the child's unique ID code (that was
generated by the researcher) so that the questionnaires were anonymous. Only the researcher
had a copy of the list of names and corresponding ID codes. This was an electronic file that
was password protected.
At each assessment phase children completed the tasks individually with the
researcher in a quiet room at their school. The tasks were spread over three sessions that each
lasted between 20 to 45 minutes on average in order to prevent fatigue. At the beginning of
each session the researcher told the child that they wanted the child's help playing some
games and verbal assent was obtained. If a child did not want to participate then the
researcher would collect another child from the class. The child who did not want to
participate would be asked on a different day if they would like to participate in the study.
During each session the child was reassured that they had done well on the tasks. The child
was given a sticker half way through the session to motivate them and at the end of the
session as a thank you for taking part in the tasks. If the child wanted to stop a session at any
point then they were allowed to do so.
At all three time points the tasks were presented in the same order to all children. In
the first session children completed the BPVS and the CDMT. The CDMT was always
completed in the first session as it relies on the use of stickers as appetitive rewards. As
children receive stickers for completing each session it was felt that the stickers may become
less appetitive by the end of the three sessions. In the second session children completed the
ToL, Digit Span, Go/No-Go and the Sally-Anne 1st Order Task. In the final session, children
completed the Deceptive Contents Task, the Sally-Anne 2nd Order Task, the peer
105
nominations, and the Gift Wrap Task. The peer nominations were gathered in the final session
so that the child had a chance to get to know the researcher and would feel more comfortable
disclosing nominations to them. Debrief sheets were distributed to Teaching staff and
Parents/Guardians on completion of the study (Appendix E - F).

106
Table 3.3. Summary of tasks and variables in the present study
Note. PPRA = Preschool Proactive and Reactive Aggression Scale. PSBS = Preschool Social
Behaviour Scale. ToL = Tower of London. CDMT = Children's Decision Making Task.
BPVS = British Picture Vocabulary Scale.
Task Rater Type Variable
PPRA (Ostrov & Crick,
2007) Teaching Staff DV
Reactive physical aggression
Reactive relational aggression
Proactive physical aggression
Proactive relational aggression
PSBS (Crick, Casas, &
Mosher, 1997) Teaching Staff DV
Prosocial behaviour
Peer acceptance
Behaviour Peer
Nominations Peers DV
Reactive physical aggression
Reactive relational aggression
Proactive physical aggression
Proactive relational aggression
Prosocial behaviour
Peer acceptance
Peer rejection
Go/No-Go (Simpson &
Riggs, 2006) Child IV Cool EF: Inhibition
ToL (Shallice, 1982) Child IV Cool EF: Planning
Digit Span (Wechsler,
1991) Child IV Cool EF: Working memory
Gift Delay (Kochanska
et al., 1996) Child IV Hot EF: Delay of gratification
CDMT (Kerr & Zelazo,
2004) Child IV
Hot EF: Affective decision
making
BPVS ( Dunn et al.,
1982) Child IV Receptive vocabulary
107
4. STUDY 1: COOL AND HOT EXECUTIVE FUNCTION AS
PREDICTORS OF TEACHER AND PEER REPORTED PROSOCIAL
AND AGGRESSIVE BEHAVIOUR IN EARLY CHILDHOOD
Abstract
Objective: EF has been implicated in prosocial and aggressive behaviour in early childhood.
Research in this field, however, is limited and has focused almost exclusively on cool-
cognitive EF. Furthermore, understanding of the role of EF in aggression has been hindered
by the lack of research taking into account the function and form of aggression. This study
examined the role of cool and hot EF in Teacher and Peer reported aggression, differentiating
between reactive and proactive as well as physical and relational aggression.
Method: Children (N=106; 46- to 80-months-old) completed laboratory tasks measuring cool
(inhibition, planning, working memory) and hot EF (affective decision making, delay of
gratification).
Results: The relation between EF and aggression varied depending on informant. Cool EF
significantly contributed to understanding of Teacher reported aggression. Inhibition was a
central predictor of aggression. Planning and working memory, in contrast, were significant
independent predictors of proactive relational aggression only. Cool EF was significantly
related to Peer reported proactive and reactive physical, but not relational aggression. Hot EF
was not associated with any subtype of Teacher or Peer reported aggression. Prosocial
behaviour moderated the relation between working memory and Teacher reported reactive
relational aggression only. Neither cool nor hot EF were related to Teacher or Peer reported
prosocial behaviour.
Conclusion: This study therefore suggests that cool EF, particularly inhibition, is associated
with childhood aggression, but not prosocial behaviour. However, the relation between EF
and aggression varies depending on whether teachers or peers are reporting on children's
behaviour.
Adapted for publication: Poland, S., Monks, C. P., & Tsermentseli, S. (2016). Cool and hot
executive function as predictors of aggression in early childhood: Differentiating between the
function and form of aggression. British Journal of Development Psychology, 34, 181 – 197.
doi: 10.1111/bjdp.12122
The findings published in this article are those based on Teacher reports. The findings relating
to Peer reports are included in this chapter but not the published article.

108
4.1. Chapter Overview
This chapter presents study one which was based on data from the first time point of
the longitudinal study. This study examines the unique contribution of cool and hot EF to the
different functions and forms of aggression reported by Teachers and Peers.
4.2. Introduction
Models of social behaviour development have posited that EF is fundamental to
children's ability to appropriately interact with their peers (Beauchamp & V. Anderson, 2010;
Yeates et al., 2007). Children who are better able to learn social rules, organise and process
social information and inhibit maladaptive behaviours have been found to be more prosocial
and less aggressive (Espy et al., 2011; Jacobson et al., 2011; Riccio et al., 2011).
Understanding of the role of EF in prosocial and aggressive behaviour, however, is hindered
by three main limitations of the background literature: (1) studies including hot as well as
cool EF are limited; (2) aggressive children have typically been treated as one homogenous
category and the function and form of aggression have been ignored; and (3) interactions
between prosocial behaviour and EF have not been studied. The present study therefore aimed
to address these limitations in order to better understand the underlying cognitive mechanisms
of prosocial and aggressive behaviour.
Although social neuroscience models have posited that cool and hot domains of EF
are associated with aggressive and prosocial behaviour (Beauchamp & V. Anderson, 2010;
Yeates et al., 2007), studies including hot as well as cool EF are limited. Identifying the role
of hot, as well as cool, EF in prosocial behaviour is important as the few studies that have
been carried out have resulted in mixed findings; with some studies finding that children,
between 3- and 5-years-old, with greater positive emotionality (positive emotions displayed in
peer interactions) demonstrated more prosocial behaviours than children with poor hot EF
(Garner & Waajid, 2012), whereas other studies have failed to find a relation between cool
and hot EF and prosocial behaviour in children between 3- to 6-years-old (Allan & Lonigan,
2011; Hirvonen et al., 2015; Hughes & Ensor, 2011). This may reflect the differing measures
of hot EF used across studies and highlights the need for further research with a more
consistent conception of hot EF.
Further research identifying the role of cool and hot EF in aggression is also needed
as hot EF has been suggested to be more strongly related to disruptive and externalising
behaviour in early childhood than cool EF (Brock et al., 2009; Garner & Waajid, 2012; Kim
et al., 2014). Disruptive and externalising behaviour, though, are not synonymous with
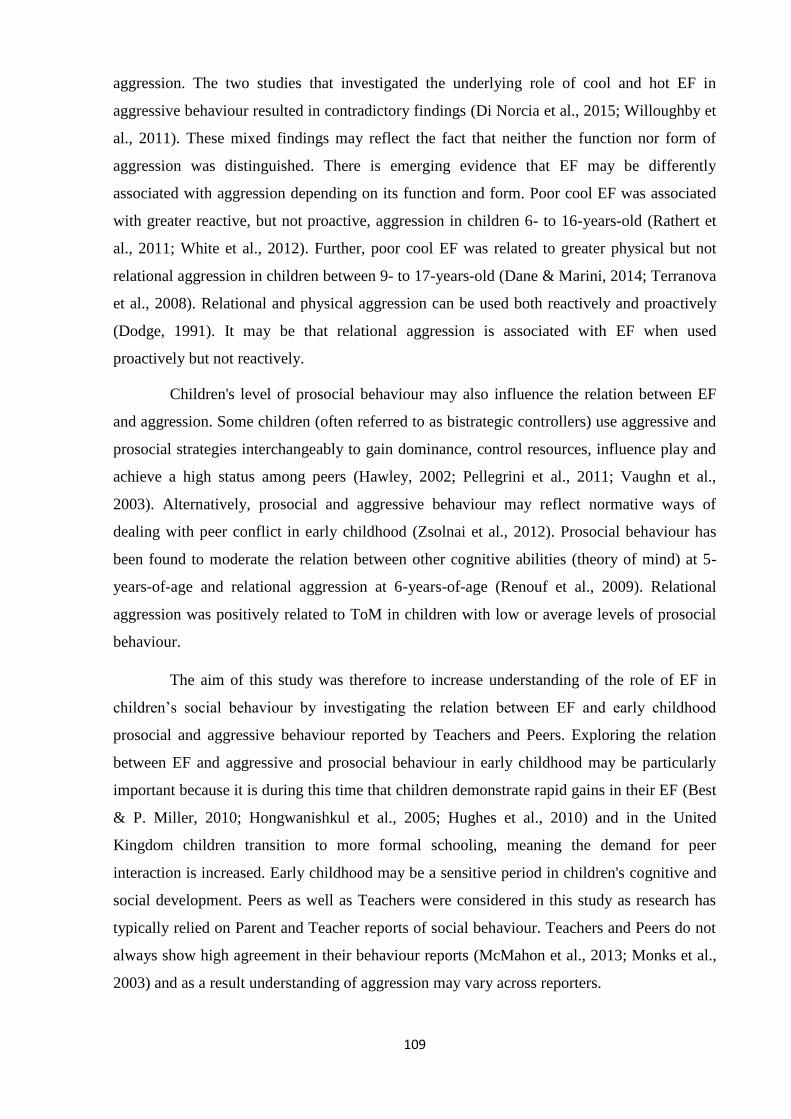
109
aggression. The two studies that investigated the underlying role of cool and hot EF in
aggressive behaviour resulted in contradictory findings (Di Norcia et al., 2015; Willoughby et
al., 2011). These mixed findings may reflect the fact that neither the function nor form of
aggression was distinguished. There is emerging evidence that EF may be differently
associated with aggression depending on its function and form. Poor cool EF was associated
with greater reactive, but not proactive, aggression in children 6- to 16-years-old (Rathert et
al., 2011; White et al., 2012). Further, poor cool EF was related to greater physical but not
relational aggression in children between 9- to 17-years-old (Dane & Marini, 2014; Terranova
et al., 2008). Relational and physical aggression can be used both reactively and proactively
(Dodge, 1991). It may be that relational aggression is associated with EF when used
proactively but not reactively.
Children's level of prosocial behaviour may also influence the relation between EF
and aggression. Some children (often referred to as bistrategic controllers) use aggressive and
prosocial strategies interchangeably to gain dominance, control resources, influence play and
achieve a high status among peers (Hawley, 2002; Pellegrini et al., 2011; Vaughn et al.,
2003). Alternatively, prosocial and aggressive behaviour may reflect normative ways of
dealing with peer conflict in early childhood (Zsolnai et al., 2012). Prosocial behaviour has
been found to moderate the relation between other cognitive abilities (theory of mind) at 5-
years-of-age and relational aggression at 6-years-of-age (Renouf et al., 2009). Relational
aggression was positively related to ToM in children with low or average levels of prosocial
behaviour.
The aim of this study was therefore to increase understanding of the role of EF in
children’s social behaviour by investigating the relation between EF and early childhood
prosocial and aggressive behaviour reported by Teachers and Peers. Exploring the relation
between EF and aggressive and prosocial behaviour in early childhood may be particularly
important because it is during this time that children demonstrate rapid gains in their EF (Best
& P. Miller, 2010; Hongwanishkul et al., 2005; Hughes et al., 2010) and in the United
Kingdom children transition to more formal schooling, meaning the demand for peer
interaction is increased. Early childhood may be a sensitive period in children's cognitive and
social development. Peers as well as Teachers were considered in this study as research has
typically relied on Parent and Teacher reports of social behaviour. Teachers and Peers do not
always show high agreement in their behaviour reports (McMahon et al., 2013; Monks et al.,
2003) and as a result understanding of aggression may vary across reporters.

110
This was the first study to investigate the association between cool and hot EF and
the function and form of aggression and the moderating role of prosocial behaviour. The
present study was exploratory in nature. The main research question was: what is the relation
between cool and hot EF and aggressive and prosocial behaviour in early childhood? Further
research questions included: is hot EF more strongly associated with social behaviour than
cool EF; does the relation between EF and aggression vary across different functions and
forms; does prosocial behaviour moderate the relation between EF and aggression; and does
the role of cool and hot EF in aggression vary across Teacher and Peer reports? Based on the
background literature it was hypothesised that both cool and hot EF would be associated with
prosocial and aggressive behaviour in early childhood. Specific hypotheses regarding the role
of EF in the different functions and forms of aggression were not made as research in this
field is limited. Lastly, it was hypothesised that prosocial behaviour would moderate the
relation between EF and aggression.
4.3. Method
4.3.1. Design
This study was based on data from the first time point of the 12 month longitudinal
study and was correlational in design. Predictor variables were continuous and included three
cool EF variables: inhibition, working memory, and planning; and two hot EF variables:
affective decision making and delay of gratification. Teaching staff and Peer reported
prosocial behaviour and aggression were continuous dependent variables. Three child factors
were also measured: age, gender, and verbal ability. Gender was coded 1 for boy and 2 girl.
4.3.2. Participants
The sample included children recruited at Time 1 of the 12 month longitudinal study
and is described in detail in the methodology chapter (Chapter 3). One hundred and six
children (51 boys and 55 girls) were included. Children were between 46- to 80-months-old
(M = 61.47, SD = 9.80). The Class Teachers (n = 7) and Teaching Assistants (n = 10) of the
children participating in the study were also recruited to provide information on children’s
social behaviour.
4.3.3. Measures
A detailed description of the measures is provided in the methodology chapter (Chapter 3).

111
4.3.3.1. Teaching Staff Behaviour Reports
Teaching staff completed the PPRA (Ostrov & Crick, 2007) and the prosocial
behaviour subscale from the PSBS (Crick, Casas, & Mosher, 1997) for each child in their
class participating in the study to assess the function and form of children’s aggression. For
the PPRA and the PSBS teachers rated how true each statement was of the child on a five-
point Likert scale, with one meaning 'never or almost never true' and five meaning 'always or
almost always true'. Teaching staff ratings for the four subtypes of aggression and prosocial
behaviour were averaged.
4.3.3.2. Peer Behaviour Reports
Children were asked to nominate peers in their class who behaved like the
prosocial/aggressive stick figure child in a cartoon. Nominations for each child were tallied
and standardised by rater population.
4.3.3.3. Cool EF
Inhibition. A computerised fish and shark version of the Go/No-Go paradigm
(Simpson & Riggs, 2006) was used in the present study to measure children's inhibition. To
assess children's inhibition the proportion of correct No-Go trials was recorded.
Planning. Children completed the ToL to measure their planning skills (Shallice,
1982). Children were awarded 2 points if they completed the problem on the first trial, 1 point
if they completed the problem on the second trial and 0 points if they failed to complete the
problem. Scores ranged from 0 (none correct) to 24 (all correct on the first trial).
Working Memory. The digit span forward and backwards subtests (WISC-III;
Wechsler, 1991) were used to assess children's working memory. Children were awarded 1
point for each correct trial. Scores from the forward and backward subtest were summed and
potential scores ranged from 0 to 30.
4.3.3.4. Hot EF
Affective Decision Making. To assess affective decision making children completed
the CDMT (Kerr & Zelazo, 2004). Affective decision making was assessed on whether
predominately advantageous or disadvantageous decisions were made during the last three
trial blocks.

112
Delay of Gratification. The Gift Delay task was used to assess children's ability to
delay gratification (Kochanska et al., 1996). Children were awarded 2 points if they did not
turn around in their seat, 1 point if they peeked over their shoulder and 0 points if they turned
around completely to peek.
Verbal Ability. Children's receptive vocabulary was assessed using the short version
of the British Vocabulary Picture Scale (BPVS; Dunn, Whetton, & Pintilie, 1982).
Standardised scores according to age were used.
4.3.4. Procedure
This study formed part of a larger investigation into the relation between children's
cognitive abilities and social behaviour across early childhood. The procedure is outlined in
the methodology chapter (Chapter 3). This study is based on data collected at the first time
point between April and July 2014. Children completed tasks individually in a quiet room at
their school. The tasks were administered in a fixed order: BPVS, CDMT, ToL, Digit Span,
Go/No-Go, peer nominations, Gift Wrap. The tasks were spread across three sessions, with
each session lasting between 20 to 45 minutes. Teachers completed the questionnaire in their
own time during the assessment phase.
4.3.5. Data Analysis
Analyses were carried out using SPSS version 22 (2013). Preliminary analyses were
first conducted to analyse potential confounds and initial relations between variables. T-test
were conducted to investigate gender differences on children's mean cool and hot EF
performance and Teacher and Peer reported prosocial and aggressive behaviour. Pearson's
correlations were used to examine initial bivariate relations between the variables. Partial
correlations, controlling for age, gender and verbal ability, were then carried out to examine
the relations between individual EF predictors and social behaviour after taking into account
child factors. The main analyses were then carried out. Hierarchical linear regressions were
used to discern whether cool and hot EF predicted Teacher and Peer reported aggressive and
prosocial behaviour. Hierarchical regression analyses were carried out in addition to
correlational analyses as hierarchical regression allows the contribution of multiple EF
predictors to the outcome variable, as well as the predictive role of individual EF skills, to be
explored (J. Cohen et al., 2003; Kelley & Maxwell, 2010). Further, through hierarchical
regression whether hot EF significantly adds to understanding of aggressive and prosocial
behaviour beyond that of cool EF can be examined (B. Cohen, 2008; J. Cohen et al., 2003).

113
Hierarchical regression also allowed the interaction between prosocial behaviour and EF to be
explored (B. Cohen, 2008).
4.4. Results
4.4.1. Preliminary Analysis
Descriptive statistics are reported in Table 4.1. Parametric statistical tests make the
assumption that the sampling distributions of variables of interest are normally distributed (B.
Cohen, 2008; Little, 2013). If this assumption is violated then significance tests of models and
their defining parameter estimates may not be accurate. The sampling distribution cannot be
directly inspected, so the distribution of the variables of interest is examined as if the data are
normally distributed then it can be assumed the sampling distribution is also normally
distributed (Mayers, 2013). Histograms and Q-Q plots were visually inspected to examine
whether variables were normally distributed. These graphs revealed that Teacher reported
proactive physical aggression and Peer reported reactive physical and proactive relational
aggression were not normally distributed. These outcome variables also had significant
skewness and kurtosis values (B. Cohen, 2008; Mayers, 2013). In addition, the predictor
variables inhibition, planning and delay of gratification were not normally distributed and had
significant skewness and kurtosis values. All other variables followed an approximately
normal distribution, with adequate levels of skewness and kurtosis. The assumption of
normality may therefore have been violated in some instances. According to central limit
theorem, however, regardless of the shape of the population distribution, the distribution of
sample means will be normal if the sample size is sufficiently large (usually considered to be
a sample greater than 30), and parametric tests will be accurate (B. Cohen, 2008; Little,
2013). As the current sample exceeded 100 participants (and data transformations can make
interpretation more difficult) parametric tests using the present data were carried out (B.
Cohen, 2008).
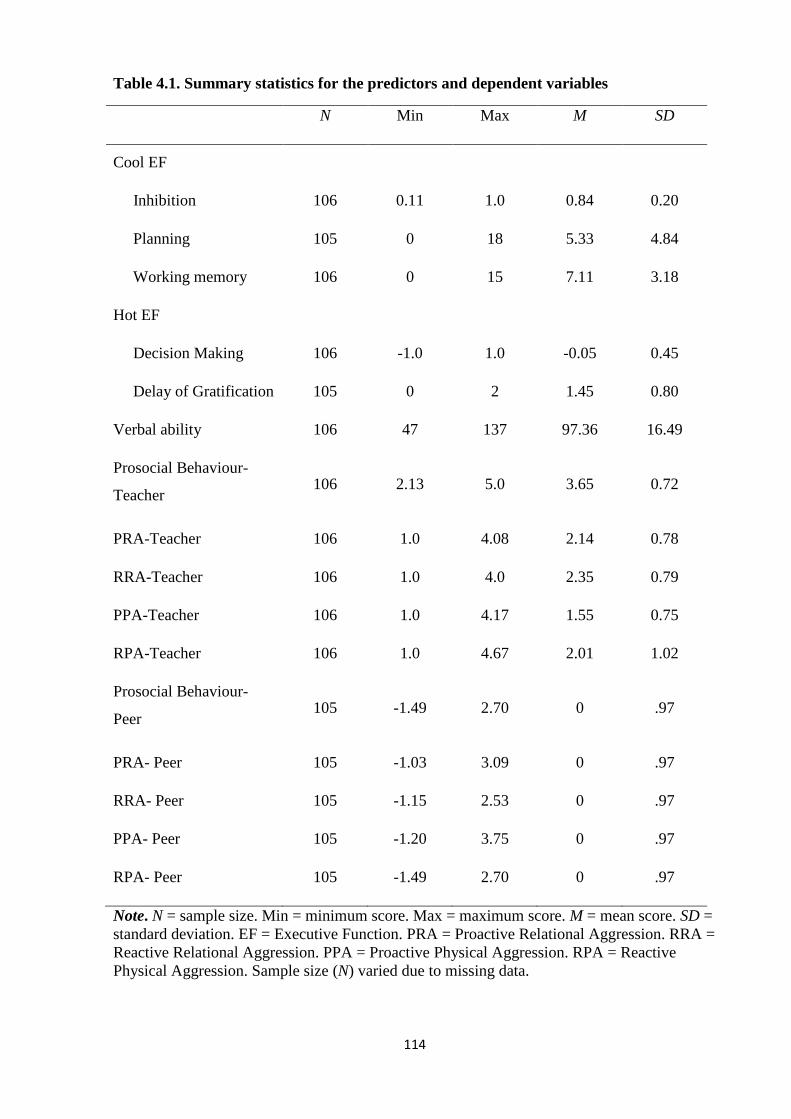
114
Table 4.1. Summary statistics for the predictors and dependent variables
N Min Max M SD
Cool EF
Inhibition 106 0.11 1.0 0.84 0.20
Planning 105 0 18 5.33 4.84
Working memory 106 0 15 7.11 3.18
Hot EF
Decision Making 106 -1.0 1.0 -0.05 0.45
Delay of Gratification 105 0 2 1.45 0.80
Verbal ability 106 47 137 97.36 16.49
Prosocial Behaviour-
Teacher 106 2.13 5.0 3.65 0.72
PRA-Teacher 106 1.0 4.08 2.14 0.78
RRA-Teacher 106 1.0 4.0 2.35 0.79
PPA-Teacher 106 1.0 4.17 1.55 0.75
RPA-Teacher 106 1.0 4.67 2.01 1.02
Prosocial Behaviour-
Peer 105 -1.49 2.70 0 .97
PRA- Peer 105 -1.03 3.09 0 .97
RRA- Peer 105 -1.15 2.53 0 .97
PPA- Peer 105 -1.20 3.75 0 .97
RPA- Peer 105 -1.49 2.70 0 .97
Note. N = sample size. Min = minimum score. Max = maximum score. M = mean score. SD =
standard deviation. EF = Executive Function. PRA = Proactive Relational Aggression. RRA =
Reactive Relational Aggression. PPA = Proactive Physical Aggression. RPA = Reactive
Physical Aggression. Sample size (N) varied due to missing data.

115
CDMT. A 2(Deck: stripes advantageous, stripes disadvantageous) X 2(Position:
stripes on the left, stripes on the right) ANOVA was carried out to examine whether card deck
and the left or right position of the striped deck influenced children's performance. The
ANOVA revealed that there was no significant main effect of deck, F(1, 106) = 0.97, p = .33,
or card position, F(1, 106) = 0.97, p = .33. There was also no significant interaction between
deck and position, F(1, 106) = 2.36, p = .13. Neither deck nor card position were therefore
controlled for in subsequent analysis.
Gender differences. Independent samples t-tests were carried out to explore whether
boys (n = 50) and girls (n = 55) differed on their cognitive abilities and social behaviour. The
analysis revealed that there was a significant gender difference on children’s inhibition,
t(87.35) = -2.44, p = .02, and on children’s delay of gratification, t(92.35) = -2.59, p = .01.
Boys demonstrated significantly worse inhibition (M = .79, SD = .03) than girls (M = .88, SD
= .15). Boys also performed significantly poorer on measures of delay of gratification (M =
1.24, SD = 0.87) than girls (M = 1.64, SD = 0.68). There was a significant gender difference
on Teacher reported physical aggression when used proactively, t(93.19) = 2.13, p = .04, and
reactively, t(95.06) = 2.54, p = .01. Teachers reported that boys were higher in proactive (M =
1.71, SD = 0.83) and reactive (M = 2.26, SD = 1.11) physical aggression than girls (proactive:
M = 1.40, SD = 0.63; reactive: M = 1.77, SD = 0.88). However, there were no significant
gender differences in Teacher reported relational aggression when used reactively, t(104) = -
1.75, p = .08, or proactively, t(104) = -1.87, p = .07. There was a significant gender
difference on Peer reported reactive physical aggression, t(72.57) = 4.39, p < .001. Boys were
nominated significantly more by their peers as reactively physically aggressive (M = .41, SD
= 1.13) than girls (M = -.37, SD = 0.59). There was no significant gender difference on Peer
reported proactive physical aggression, t(103) = .40, p = .69. Further, there was no significant
gender difference in Peer reported relational aggression, whether reactive, t(103) = 1.42, p =
.16, or proactive t(103) = 1.79, p = .08. Some gender differences on measures of children's EF
and aggressive behaviour were apparent, so gender was controlled for in the main analysis.
Association between EF, aggression and prosocial behaviour. Pearson's
correlations were conducted to examine the relations between subtypes of aggression. The
analysis revealed that for both Teacher and Peer reports subtypes of aggression were
significantly and positively correlated with one another (r = .29 - .95). The magnitude of the
correlations was moderate to high (A. Rubin, 2013). Children high in one type of aggression
were therefore likely to also be high in the other types of aggression, according to both
Teacher and Peer reports. The concordance between Teacher and Peer reports of aggressive

116
and prosocial behaviour was also explored using bivariate correlations. Teacher and Peer
reports of proactive relational aggression (r = .24, p = .01), proactive physical aggression (r =
.28, p < .001), and reactive physical aggression (r = .51, p < .001) were significantly and
positively correlated. These findings revealed that Teaching staff and Peers tended to show
moderate to strong agreement on children's level of aggression for three of the four subtypes.
Teacher and Peer reported reactive relational aggression were positively, but not significantly
correlated (r = .15, p = .07). Teacher and peer reports of prosocial behaviour were marginally
significantly correlated (r = .16, p = .05), suggesting that there was low concordance between
Teachers and Peers on reports of children's prosocial behaviour.
Pearson's correlations were conducted to examine whether child age and verbal
ability were associated with children's EF, aggression and prosocial behaviour. The analysis
revealed that age was significantly and positively associated with the cool EF skills planning
and working memory, as well as the hot EF skill delay of gratification. This suggests that with
age, children’s planning, working memory and ability to delay gratification improve. Age did
not significantly correlate with measures of Teacher or Peer reported aggression or prosocial
behaviour. This finding suggests that levels of aggressive and prosocial behaviour are
relatively stable in early childhood. Verbal ability was significantly and positively correlated
with the cool EF skills inhibition, planning, and working memory, meaning as children’s
verbal ability increased so too did their performance on measures of inhibition, planning and
working memory. Verbal ability was also significantly and positively correlated with Peer
reported prosocial behaviour. Children with greater verbal ability received more nominations
for being prosocial than children with poor verbal ability. Peer reported aggression was not
significantly related to verbal ability. Verbal ability was positively correlated with Teacher
reported prosocial behaviour and negatively related to Teacher reported reactive physical
aggression. The correlational analysis indicated that child age and verbal ability were
associated with some measures of children's EF and social behaviour. Consequently, child age
and verbal ability were controlled for in subsequent analysis. The correlation matrix showing
correlations between all variables is reported in Table 4.2.

117
Table 4.2. Bivariate correlations between variables
1 2 3 4 5 6 7 8 9 10 11 12 13 14 15 16 17 18
1.Age - - -.11 .15 .46*** .60*** .09 .23* .11 -.10 -.02 -.16 -.11 .02 .01 .02 .06 .01
2.Gender - .03 .24* .06 .02 .10 .25* .15 .18* .17* -.21* -.24* -.30 -.17* -.14 -.04 -.41***
3.Verbal Ability - .28** .20* .17* -.09 .08 .18* -.10 -.10 -.15 -.18* .30** -.10 .05 -.04 -.11
4.Inhibition - .18* .33** .08 .42*** .26** -.22* -.21* -.38*** -.48*** .14 -.26** -.17* -.33*** -.36***
5.Planning - .45*** .14 .19* .14 -.20* -.17* -.22* -.20* .06 .05 .07 .07 -.08
6.Working
Memory - -.06 .23* .24* -.03 -.01 -.22* -.21* .24* -.05 .09 -.03 -.15
7.Decision
Making - -.05 -.09 .05 .10 .15 .10 -.01 .06 .04 .04 .12
8.Delay - .21* -.16 -.15 -.30** -.35*** .09 -.12 -.06 -.09 -.13
9.Prosocial-T - -.35*** -.32** -.48*** -.56*** .16 -.25* -.09 -.16 -.26**
10.PRA-T - .95*** .59*** .62*** -.02 .24* .20* .20* .14
11.RRA-T - .53*** .61*** -.05 .20* .15 .18* .12
12.PPA-T - .91*** -.08 .35*** .29** .28** .50***
13.RPA-T - -.13 .34*** .25** .26** .50**
14.Prosocial-P - .07 .30** .12 .10
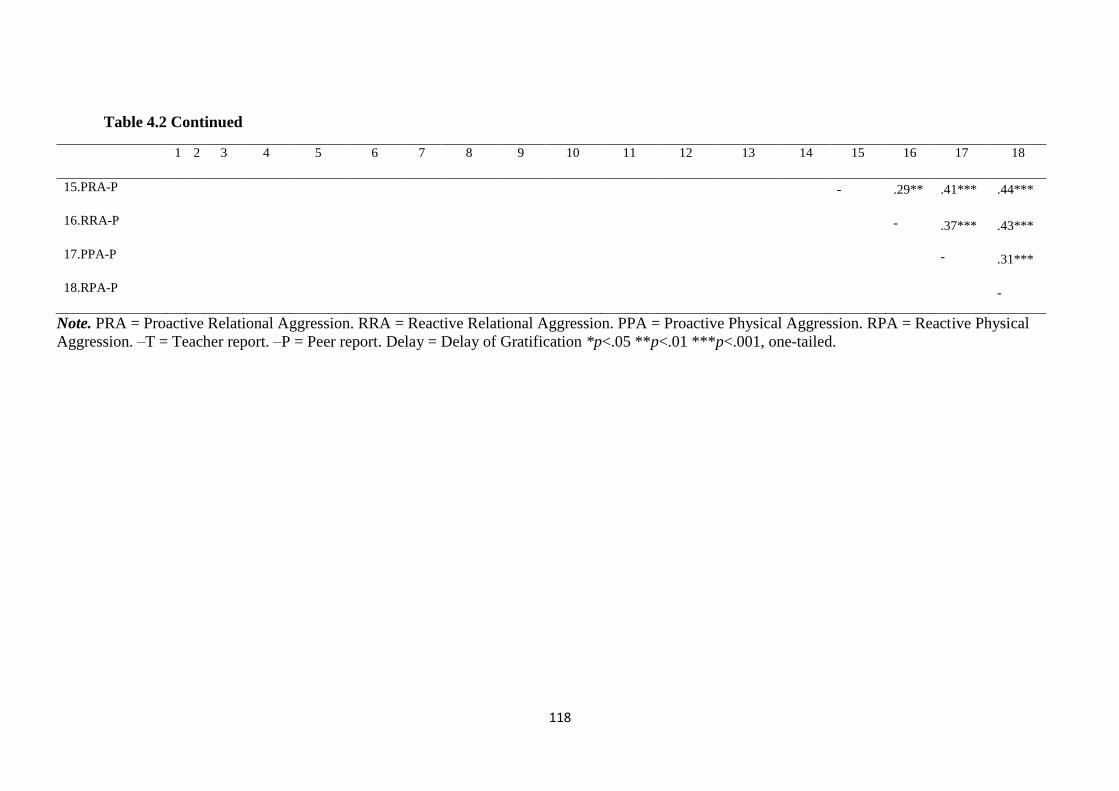
118
Note. PRA = Proactive Relational Aggression. RRA = Reactive Relational Aggression. PPA = Proactive Physical Aggression. RPA = Reactive Physical
Aggression. –T = Teacher report. –P = Peer report. Delay = Delay of Gratification *p<.05 **p<.01 ***p<.001, one-tailed.
Table 4.2 Continued
1 2 3 4 5 6 7 8 9 10 11 12 13 14 15 16 17 18
15.PRA-P - .29** .41*** .44***
16.RRA-P - .37*** .43***
17.PPA-P - .31***
18.RPA-P -

119
Partial correlations, controlling for child age, gender and verbal ability, were carried
out to investigate the associations between individual cool and hot EF predictors and
children's social behaviour. Correlation results are reported in Table 4.3. After taking into
account control factors, inhibition was significantly and positively correlated with Teacher
(but not peer) reported prosocial behaviour. Further, inhibition was significantly and
negatively correlated with Teacher and Peer reported reactive and proactive physical
aggression and proactive relational aggression, as well as Teacher reported reactive relational
aggression. Inhibition was marginally significantly and negatively correlated with Peer
reported reactive relational aggression. Working memory was significantly and positively
associated with Peer reported prosocial behaviour, after accounting for control variables. A
marginally significant, negative correlation existed between working memory and Peer
reported reactive physical aggression. Planning was not significantly associated with Teacher
or Peer reported aggressive or prosocial behaviour after taking into account child control
factors. After taking into account control variables, decision making was positively and
marginally significantly related to Teacher reported proactive physical aggression and delay
of gratification was significantly and negatively associated with Teacher reported reactive and
proactive, physical and relational aggression and Peer reported proactive relational
aggression.
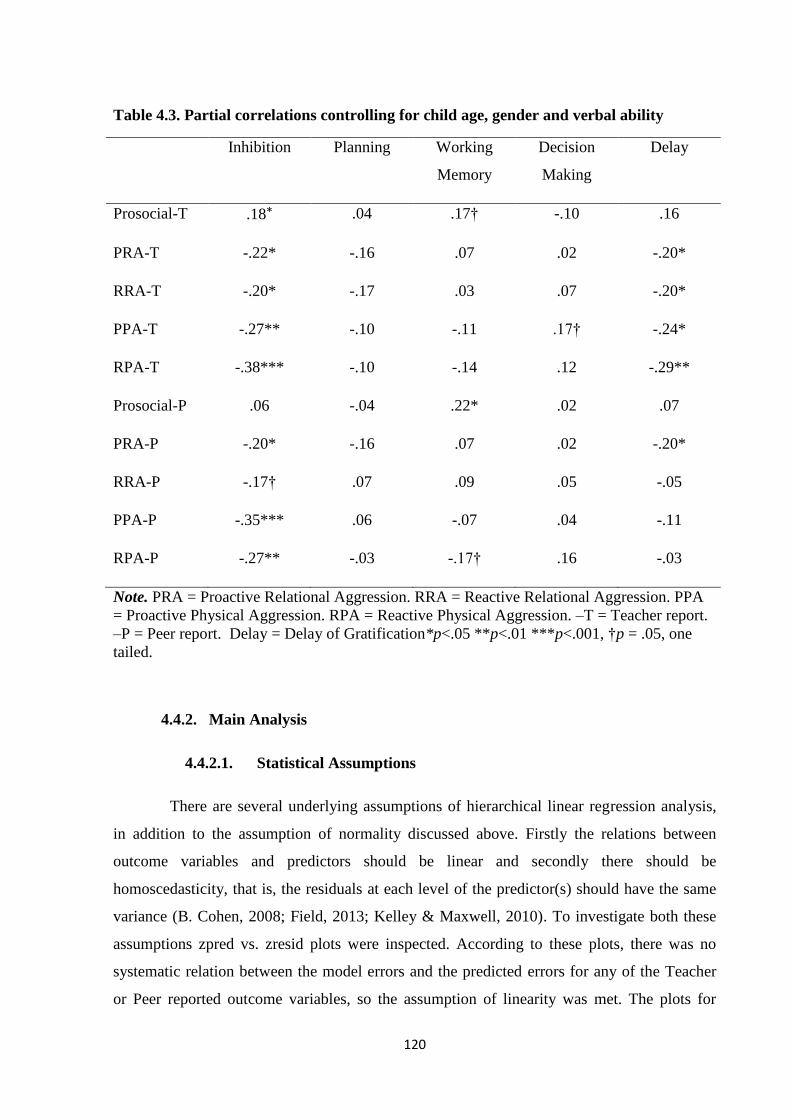
120
Table 4.3. Partial correlations controlling for child age, gender and verbal ability
Inhibition Planning Working
Memory
Decision
Making
Delay
Prosocial-T .18* .04 .17† -.10 .16
PRA-T -.22* -.16 .07 .02 -.20*
RRA-T -.20* -.17 .03 .07 -.20*
PPA-T -.27** -.10 -.11 .17† -.24*
RPA-T -.38*** -.10 -.14 .12 -.29**
Prosocial-P .06 -.04 .22* .02 .07
PRA-P -.20* -.16 .07 .02 -.20*
RRA-P -.17† .07 .09 .05 -.05
PPA-P -.35*** .06 -.07 .04 -.11
RPA-P -.27** -.03 -.17† .16 -.03
Note. PRA = Proactive Relational Aggression. RRA = Reactive Relational Aggression. PPA
= Proactive Physical Aggression. RPA = Reactive Physical Aggression. –T = Teacher report.
–P = Peer report. Delay = Delay of Gratification*p<.05 **p<.01 ***p<.001, †p = .05, one
tailed.
4.4.2. Main Analysis
4.4.2.1. Statistical Assumptions
There are several underlying assumptions of hierarchical linear regression analysis,
in addition to the assumption of normality discussed above. Firstly the relations between
outcome variables and predictors should be linear and secondly there should be
homoscedasticity, that is, the residuals at each level of the predictor(s) should have the same
variance (B. Cohen, 2008; Field, 2013; Kelley & Maxwell, 2010). To investigate both these
assumptions zpred vs. zresid plots were inspected. According to these plots, there was no
systematic relation between the model errors and the predicted errors for any of the Teacher
or Peer reported outcome variables, so the assumption of linearity was met. The plots for
121
Teacher reported proactive physical aggression and prosocial behaviour, as well as for Peer
reported proactive physical and relational aggression evidenced slight funnelling, suggesting
minor heteroscedasticity. In these instances, the assumption of homoscedasticity was violated.
A third assumption is that the residuals are independent; residuals should not be
correlated with one another (J. Cohen et al., 2003; Kelley & Maxwell, 2010). In order to
investigate this assumption Durbin-Watson values were calculated. The Durbin-Watson
values ranged from 1.35 to 1.93 for Teacher reported prosocial and aggressive behaviour and
from 1.74 to 2.25 for Peer reported behaviour. The lower and upper bound Durbin-Watson
values were identified (Savin & White, 1977). These values fell between the lower bound
value of 1.31 and the upper bound of 2.00, which means the test is inconclusive. However, it
has been reported that as long as the Durbin-Watson statistic is greater than the lower bound
and is less than 2.5, it can be assumed that the assumption of independent errors was met
(Wang & Jain, 2003).
A fourth assumption is that the errors of outcome variables are normally distributed
(J. Cohen et al., 2003; Kelley & Maxwell, 2010). P-P plots of standardised residuals were
inspected to investigate this assumption. The values did not deviate substantially from the
line, apart from for Teacher reported proactive physical aggression and Peer reported
proactive and reactive relational aggression. The assumption of normally distributed errors
was therefore violated in these instances. Lastly, hierarchical linear regressions assume that
the predictors are not highly correlated with one another (multicolinearity; J. Cohen et al.,
2003; Kelley & Maxwell, 2010). Inspection of the correlation matrix (Table 4.2)
demonstrated that none of the predictors were highly correlated (above .80) with one another.
Furthermore, VIF and tolerance values were calculated to investigate multicolinearity
between predictors. All VIF values were lower than 10 and the average VIF did not
substantially exceed 1. Added to this, tolerance values were all above .20. Thus, VIF and
tolerance statistics indicated that the assumption of no multicolinearity between predictors
was met.
The assumption of linearity, independent errors and no multicolinearity were
therefore met. The assumption of homoscedasticity and normally distributed errors, however,
was violated in the case of Teacher reported proactive physical aggression and prosocial
behaviour and Peer reported aggression. Boot-strapped regressions were carried out for all
subtypes of Peer reported aggression and for Teacher reported proactive physical aggression
and prosocial behaviour. Bootstrapped regressions do not make assumptions about the

122
distribution of the outcome variable and therefore are not affected by violations of the
assumption of homoscedasticity and normality (B. Cohen, 2008). The bootstrapped results did
not vary from the non-bootstrapped results.
Table 4.4. Hierarchical linear regression results for Teacher reported proactive and
reactive relational aggression
Proactive Relational Aggression
(Teacher Report)
Reactive Relational Aggression
(Teacher Report)
R2 ΔR
2 B SE B β R
2 ΔR
2 B SE B β
Step 1 .20*** - .16** -
Age -0.01 -.01 -.09 -0.001 .01 -.01
Gender 0.36 .14 .23* 0.33 .15 .21*
Verbal Ability -0.004 .004 -.09 -0.004 .01 -.09
Prosocial
behaviour
(Teacher)
-0.40 .10 -.37*** -0.38 .10 -.35***
Step 2 .27*** .08* .23** .07†
Inhibition -0.83 .40 -.21* -0.77 .41 -.19†
Planning -0.03 .02 -.20† -0.03 .02 -.21†
Working
Memory 0.07 .03 .26* 0.05 .03 .21
Step 3 .28*** .01 .24** .02
Decision Making 0.08 .16 .05 0.16 .17 .09
Delay of
Gratification -0.08 .10 -.08 0.09 .11 -.09
Step 4 .35*** .06 .37*** .12**
Inhibition X
Prosocial -0.31 .58 -.06 -0.55 .57 -.10
Planning X
Prosocial -0.02 .02 -.07 -0.02 .02 -.10
WM X Prosocial -0.07 .04 -.19† -0.10 .04 -.27*
ADM X
Prosocial -0.26 .24 -.11 -0.29 .24 -.12
Delay X
Prosocial 0.004 .14 .003 0.04 .14 .03
Note. WM = Working Memory. ADM = Affective Decision Making. Delay = Delay of
Gratification. *p<.05 **p<.01 ***p<.001 † p < .08.
123
4.4.2.2. Teacher Reports
Two children were excluded from the analysis due to missing data (N = 104).
Hierarchical linear regressions were carried out for each of the four subtypes of Teacher
reported aggression. Control variables, including age in months, gender, verbal ability and
prosocial behaviour, were entered into the model first in order to control for potential
confounding effects. These child factors have previously been found to be related to EF and
aggression (V. Anderson et al., 2008; Cuevas et al., 2014; Lussier et al., 2012). Further, in the
present study, analysis revealed there were gender differences on measures of cool and hot EF
and for Teacher reported aggression. Added to this, analysis indicated that child age, verbal
ability and prosocial behaviour significantly correlated with measures of EF and aggression.
Cool EF predictors (inhibition, planning, working memory) were entered second and Hot EF
predictors (decision making, delay of gratification) were entered third. Cool EF predictors
were entered first because there is strong evidence that cool EF skills are associated with
aggression, but the relation between hot EF skills and aggression is less researched. Further,
entering hot EF predictors after cool EF predictors allows the unique contribution of hot EF
skills to aggression, after taking into account cool EF, to be examined. In the final step,
interaction terms between prosocial behaviour and cool and hot EF predictors were entered to
explore the potential moderating effect of prosocial behaviour. To avoid multicolinearity
between predictors and interaction terms, predictor variables were centred around their mean
(Aiken & West, 1991).
Proactive relational aggression. Regression results for proactive relational
aggression are presented in Table 4.4. Control variables, including age, gender, verbal ability
and prosocial behaviour, significantly accounted for 20% of the variance in Teacher reported
proactive relational aggression, R2
= .20, F(4, 103) = 6.08, p < .001. Gender was a significant
predictor. Being a girl was associated with higher levels of proactive relational aggression
than being a boy. Prosocial behaviour was a significant negative predictor, meaning as
children’s level of prosocial behaviour increased their level of proactive relational aggression
decreased. Adding cool EF predictors into the model significantly increased the amount of
variance in proactive relational aggression explained to 28%, ΔR2=.08, ΔF(3, 96) = 3.41, p =
.02. Inhibition was a significant negative predictor and planning was a marginally significant
negative predictor. Children who demonstrated better performance on measures of inhibition
and planning were rated by Teachers as lower in proactive relational aggression than children
who showed poorer performance. Working memory, in contrast, was a significant positive
predictor. Children who evidenced greater working memory skills were rated by their
124
Teachers as higher in proactive relational aggression than children who showed poorer
working memory skills. The inclusion of hot EF predictors into the model did not
significantly increase the amount of variance in proactive relational aggression explained, ΔR2
=.01, ΔF(2, 94) = 0.51, p = .60. After taking into account cool EF predictors, hot EF
components did not significantly contribute to understanding of proactive relational
aggression. The addition of the interaction terms in the model did not significantly increase
the amount of variance accounted for, ΔR 2=.06, ΔF(5, 89) = 1.75, p = .13). Prosocial
behaviour did not moderate the relation between either cool or hot EF skills and Teacher
reported proactive relational aggression.
Reactive relational aggression. Regression results for reactive relational aggression
are presented in Table 4.4. Together, the control variables significantly accounted for 16% of
the variance in reactive relational aggression, R2
= .16, F(4, 103) = 4.80, p = .001. Gender was
a significant predictor. Girls demonstrated higher levels of Teacher reported reactive
relational aggression than boys. Prosocial behaviour was a significant negative predictor. As
children’s level of prosocial behaviour increased, their level of Teacher reported reactive
relational aggression decreased. The addition of cool EF predictors into the model, led to 23%
of the variance in reactive relational aggression being explained. This increase was marginally
significant, ΔR2
= .17, ΔF(3, 96) = 2.69, p = .05. None of the cool EF predictors were
significant independent predictors. The inclusion of hot EF processes accounted for 24% of
the variance in Teacher reported reactive relational aggression, but this increase was not
significant, ΔR2
= .02, ΔF(2, 94) = 0.94, p = .40. Hot EF skills did not increase understanding
of reactive relational aggression, beyond that of cool EF. Adding the interaction terms
significantly increased the amount of variance in reactive relational aggression accounted for
to 37%, ΔR2=.12, ΔF(5, 89) = 3.49, p = .01. There was a significant interaction between
working memory and prosocial behaviour (see Figure 4.1).
To further investigate the interaction between working memory and prosocial
behaviour, children were categorised into three groups according to their level of prosocial
behaviour (Aiken & West, 1991; Renouf et al., 2009). Children’s prosocial behaviour was
rated on a scale of 1 to 5, with 5 represent high prosocial behaviour. Children who received a
score of 4 or more were categorised as highly prosocial (n = 33) and children who scored 2.99
or below were categorised as low (n = 16). Children who scored between 3 and 3.9 were
classed as showing an average level of prosocial behaviour (n = 56). A regression with
working memory as the predictor variable and Teacher reported reactive relational aggression
as the outcome variable was carried out for each prosocial group. For children high in

125
prosocial behaviour working memory was significantly and negatively related to reactive
relational aggression, β = -.36, t(32) = -2.12, p = .04. There was a non-significant positive
relation between working memory and reactive relational aggression for children low, β = .27,
t(15) = 1.06, p = .31, or average in prosocial behaviour, β = .24, t(55) = 1.80, p = .08. For
highly prosocial children, having poor working memory capabilities was associated with
higher levels of reactive relational aggression. Prosocial behaviour therefore moderated the
relation between working memory and Teacher reported reactive relational aggression.
Figure 4.1. The relation between working memory and reactive relational aggression for
children low, average and high in prosocial behaviour
Proactive physical aggression. Regression results for proactive physical aggression
are presented in Table 4.5. The control variables significantly accounted for 29% of the
variance in Teacher reported proactive physical aggression, R2
= .29, F(4, 103) = 10.08, p <
.001. Prosocial behaviour was a significant negative predictor, meaning as children’s
prosocial behaviour increased their proactive physical aggression decreased. Adding cool EF
predictors into the model explained 33% of the variance in proactive physical aggression, but
this increase was not significant, ΔR2
=.04, ΔF(3, 96) = 1.87, p = .14. Inhibition, though, was a
significant negative predictor. The addition of hot EF components into the model significantly
accounted for 36% of the variance in proactive physical aggression, but this increase was not
significant, ΔR2
=.03, ΔF(2, 94) = 2.27, p = .11. Neither cool nor hot EF skills significantly
increased understanding of Teacher reported proactive physical aggression, after taking into
0
0.5
1
1.5
2
2.5
3
3.5
4
4.5
0 5 10 15 20
Re
acti
ve R
ela
tio
nal
Agg
ress
ion
Working Memory
Low ProsocialBehaviour
Average ProsocialBehaviour
High Prosocialbehaviour
Low ProsocialBehaviour
Average ProsocialBehaviour
High ProsocialBehaviour
126
account child factors. When the interaction terms were added into the model, the model
significantly explained 38% of the variance, but this increase was not significant, ΔR2
=.02,
ΔF(5, 89) = 0.57, p = .72. Prosocial behaviour therefore did not moderate the relation between
cool or hot EF skills and Teacher reported proactive physical aggression.
Reactive physical aggression. Regression results for reactive physical aggression are
presented in Table 4.5. Together, the control variables significantly explained 38% of the
variance in reactive physical aggression, R2
= .38, F(4, 103) = 14.87, p < .001. Gender was a
significant predictor. Being a boy was associated with higher Teacher reported reactive
physical aggression than being a girl. Prosocial behaviour was a significant negative
predictor, suggesting that children with higher prosocial behaviour showed lower levels of
Teacher reported reactive physical aggression than children with lower prosocial behaviour.
The addition of cool EF predictors into the model significantly increased the amount of
variance in reactive physical aggression accounted for to 46%, ΔR2
=.08, ΔF(3, 96) = 4.70, p =
.004. Inhibition was a significant negative predictor, suggesting as children’s level of
inhibition increased their reactive physical aggression decreased. The inclusion of hot EF
processes significantly explained 47%, but this increase was not significant, ΔR2=.02, ΔF(2,
94) = 1.68, p = .19. Cool, but not hot EF, skills therefore significantly added to understanding
of Teacher reported reactive physical aggression. The final model accounted for 48% of the
variance in reactive physical aggression, but this increase was not significant, ΔR2=.01, ΔF(5,
89) = 0.17, p = .97, indicating prosocial behaviour did not moderate the relation between cool
or hot EF components and Teacher reported reactive physical aggression.

127
Table 4.5. Hierarchical linear regression results for Teacher reported proactive and
reactive physical aggression
Proactive Relational Aggression (Teacher
Report)
Reactive Relational Aggression (Teacher
Report)
R2 ΔR
2 B SE B β R
2 ΔR
2 B SE B β
Step 1 .29*** - .38*** -
Age -0.01 .01 -.15† -0.01 .01 -.08
Gender -0.22 .13 -.15 -0.37 .16 -.18*
Verbal Ability -0.01 .004 -.12 -0.01 .01 -.13
Prosocial
behaviour
(Teacher)
-0.45 .09 -.43*** -0.72 .12
-
.51**
*
Step 2 .33*** .04 .46*** .08**
Inhibition
-0.80 .37 -.21* -1.61 .45
-
.31**
*
Planning -0.01 .02 -.09 -0.02 .02 -.09
Working
Memory 0.01 .03 .02 0.01 .03 .04
Step 3 .36***
.03
.47*** .02
Decision
Making 0.26 .15 .15 0.22 .18 .09
Delay of
Gratification -0.09 .09 -.09 -0.14 .11 -.10
Step 4 .38*** .02 .48*** .01
Inhibition X
Prosocial -0.02 .54 -.00 -0.15 .67 -.02
Planning X
Prosocial 0.01 .02 .05 0.002 .03 .01
WM X
Prosocial 0.01 .04 .03 -0.01 .05 -.03
ADM X
Prosocial 0.10 .23 .04 0.17 .28 .05
Delay X
Prosocial 0.16 .14 .12 0.09 .17 .05
Note. WM = Working Memory. ADM = Affective Decision Making. Delay = Delay of
Gratification. *p<.05 **p<.01 ***p<.001 † p < .08.

128
Prosocial Behaviour. A hierarchical linear regression was carried out for Teacher
reported prosocial behaviour. Control variables, including age in months, gender and verbal
ability were entered into the model first in order to control for potential confounding effects.
Cool EF predictors (inhibition, planning, working memory) were entered second and Hot EF
predictors (decision making, delay of gratification) were entered third. Hot EF predictors were
entered after cool EF predictors so that whether hot EF skills significantly contributed to
understanding of prosocial behaviour after taking into account cool EF could be examined.
Regression results for Teacher reported prosocial behaviour are presented in Table
4.6. The regression analysis revealed that child factors were not significantly associated with
Teacher reported prosocial behaviour, R2
= .07, F(3, 103) = 2.41, p = .07. Cool EF did not
significantly contribute to understanding of prosocial behaviour, ΔR2
= .05, ΔF(3, 97) = 1.70, p
= .17, nor did hot EF processes, ΔR2
= .02, ΔF(2, 95) = 0.85, p = .43. Children's prosocial
behaviour was therefore not related to their cool or hot EF skills.

129
Table 4.6. Hierarchical multiple regression results for teacher and Peer reported
prosocial behaviour
Prosocial Behaviour
(Teacher Report)
Prosocial Behaviour
(Peer Report)
R
2 ΔR
2 B SE B β R
2 ΔR
2 B
SE
B β
Step 1 .07† - .09* -
Age 0.01 .01 .13 0.01 .01 .06
Gender 0.19 .14 .13 -0.07 .19 -.03
Verbal Ability 0.01 .004 .19† 0.02 .01 .31**
Step 2 .11 .05 .14 .05
Inhibition 0.59 .40 .16 0.03 .53 .01
Planning 0.002 .02 .01 -0.02 .02 -.09
Working
Memory 0.04 .03 .16 0.09 .04 .28*
Step 3 .13 .02 .15 .01
Decision
Making -0.14 .17 -.09 0.11 .14 .09
Delay of
Gratification 0.08 .10 .09 0.17 .22 .08
Note. *p<.05 **p<.01 ***p<.001, †p = .08.
4.4.2.1. Peer Reports
Hierarchical linear regressions were carried out for the four subtypes of Peer reported
aggression. The model was the same as carried out for Teacher reported aggression, but Peer
reported prosocial behaviour replaced Teacher reported prosocial behaviour in the model.
Proactive relational aggression. Regression results are presented in Table 4.7. Child
factors were not significantly associated with Peer reported proactive relational aggression, R2

130
= .05, F(4, 103) = 1.34, p = .26. Cool EF did not significantly add to understanding of
proactive relational aggression, ΔR2
= .06, ΔF(3, 96) = 2.04, p = .11. Components of hot EF
did not significantly add to understanding of proactive relational aggression either, ΔR2
= .003,
ΔF(2, 94) = 0.15, p = .86, after controlling for cool EF. Cool and hot EF predictors were
therefore not associated with Peer reported proactive relational aggression, after taking into
account child factors. The inclusion of interaction terms into the model did not significantly
contribute to understanding of proactive relational aggression, ΔR2
= .08, ΔF(5, 89) = 1.66, p =
.15, meaning prosocial behaviour did not moderate the relation between EF and Peer reported
aggression.
Reactive relational aggression. Regression results are presented in Table 4.7. Child
factors significantly accounted for 11% of the variance in Peer reported reactive relational
aggression, R2
= .11, F(4, 103) = 2.90, p = .03. Prosocial behaviour was a significant positive
predictor, meaning that children who received more prosocial nominations also received more
nominations for reactive relational aggression. The addition of cool EF predictors into the
model increased the amount of variance accounted for to 15%, but this increase was not
significant, ΔR2
= .04, ΔF(3, 96) = 1.66, p = .18. Hot EF predictors did not significantly
increase the amount of variance in reactive relational aggression explained, ΔR2
= .004, ΔF(2,
94) = 0.23, p = .79). After taking into account child factors, cool and hot EF processes did not
significantly increase understanding of Peer reported reactive relational aggression. The
inclusion of interaction terms increased the amount of variance in reactive relational
aggression explained to 20%, but this increase was not significant, ΔR2
= .05, ΔF(5, 89) = 1.03,
p = .40. Prosocial behaviour did not moderate the relation between EF and Peer reported
reactive relational aggression.
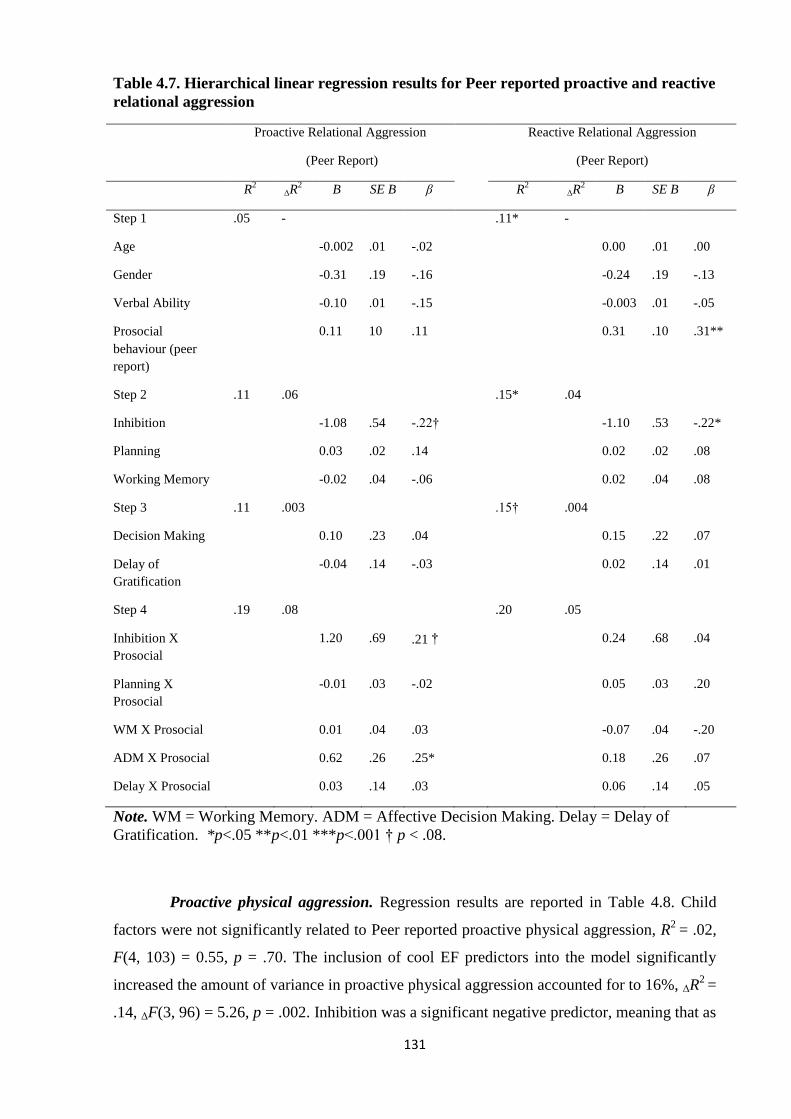
131
Table 4.7. Hierarchical linear regression results for Peer reported proactive and reactive
relational aggression
Proactive Relational Aggression
(Peer Report)
Reactive Relational Aggression
(Peer Report)
R2 ΔR
2 B SE B β R
2 ΔR
2 B SE B β
Step 1 .05 - .11* -
Age -0.002 .01 -.02 0.00 .01 .00
Gender -0.31 .19 -.16 -0.24 .19 -.13
Verbal Ability -0.10 .01 -.15 -0.003 .01 -.05
Prosocial
behaviour (peer
report)
0.11 10 .11 0.31 .10 .31**
Step 2 .11 .06 .15* .04
Inhibition -1.08 .54 -.22† -1.10 .53 -.22*
Planning 0.03 .02 .14 0.02 .02 .08
Working Memory -0.02 .04 -.06 0.02 .04 .08
Step 3 .11 .003 .15† .004
Decision Making 0.10 .23 .04 0.15 .22 .07
Delay of
Gratification
-0.04 .14 -.03 0.02 .14 .01
Step 4 .19 .08 .20 .05
Inhibition X
Prosocial
1.20 .69 .21† 0.24 .68 .04
Planning X
Prosocial
-0.01 .03 -.02 0.05 .03 .20
WM X Prosocial 0.01 .04 .03 -0.07 .04 -.20
ADM X Prosocial 0.62 .26 .25* 0.18 .26 .07
Delay X Prosocial 0.03 .14 .03 0.06 .14 .05
Note. WM = Working Memory. ADM = Affective Decision Making. Delay = Delay of
Gratification. *p<.05 **p<.01 ***p<.001 † p < .08.
Proactive physical aggression. Regression results are reported in Table 4.8. Child
factors were not significantly related to Peer reported proactive physical aggression, R2
= .02,
F(4, 103) = 0.55, p = .70. The inclusion of cool EF predictors into the model significantly
increased the amount of variance in proactive physical aggression accounted for to 16%, ΔR2
=
.14, ΔF(3, 96) = 5.26, p = .002. Inhibition was a significant negative predictor, meaning that as

132
children’s level of inhibition increased the number of peer nominations they received for
proactive physical aggression decreased. Adding hot EF predictors into the model did not
significantly increase the amount of variance in proactive physical aggression explained, ΔR2
= .002, ΔF(2, 94) = 0.13, p = .88. Cool, but not hot, EF therefore significantly increased
understanding of Peer reported proactive physical aggression. The inclusion of interaction
terms into the model explained 20% of the variance of proactive physical aggression, but this
increase was not significant, ΔR2
= .04, ΔF(5, 89) = 0.78, p = .57. Prosocial behaviour did not
moderate the relation between EF and Peer reported proactive physical aggression.
Reactive physical aggression. Regression results are reported in Table 4.8. Child
factors significantly accounted for 19% of the variance in reactive physical aggression, R2
=
.19, F(4, 103) = 5.85, p < .001. Gender was a significant predictor. Boys received more peer
nominations for reactive physical aggression than girls. Adding cool EF predictors into the
model significantly increased the amount of variance in reactive physical aggression
accounted for to 27%, ΔR2
= 0.08, ΔF(3, 96) = 3.59, p = .02. Inhibition was a significant
negative predictor, meaning as children’s inhibition increased their number of nominations for
reactive physical aggression decreased. The inclusion of hot EF skills into the model
increased the amount of variance explained to 30%, but this increase was not significant, ΔR2
= .03, ΔF(2, 94) = 1.89, p = .16). After taking into account cool EF, hot EF components did
not significantly contribute to understanding of Peer reported reactive physical aggression.
The addition of the interaction terms accounted for 35% of the variance in reactive physical
aggression, but this increase was not significant ΔR2
= .05, ΔF(8, 89) = 1.38, p = .24. Prosocial
behaviour did not moderate the relation between EF and reactive physical aggression.
Prosocial behaviour. A hierarchical linear regression was carried out for Peer
reported prosocial behaviour. The model was the same as carried out for Teacher reported
prosocial behaviour. Regression results are reported in Table 4.6. Child factors significantly
explained 9% of the variance in Peer reported prosocial behaviour, R2
= .09, F(3, 103) = 3.37,
p = .02. Verbal ability was a significant positive predictor, meaning as children's verbal ability
increased so too did the number of peer nominations for prosocial behaviour. The inclusion of
cool EF into the model increased the variance explained to 14%, though this increase was not
significant, ΔR2
= .05, ΔF(3, 97) = 1.78, p = .16. Adding hot EF predictors increased the
variance in prosocial behaviour accounted for to 15%, but this increase was not significant,
ΔR2
= .01, ΔF(2, 95) = 0.51, p = .60. Cool and hot EF skills therefore were not related to Peer
reported prosocial behaviour.

133
Table 4.8. Hierarchical linear regression results for Peer reported proactive and
reactive physical aggression
Proactive Physical Aggression (Peer
Report) Reactive Physical Aggression (Peer Report)
R2 ΔR
2 B
SE
B β R
2 ΔR
2 B
SE
B β
Step 1 .02 - .19*** -
Age 0.004 .01 .04 -0.003 .01 -.03
Gender -0.06 .19 -.03 -0.77 .18 -.40***
Verbal Ability -0.01 .01 -.08 -0.01 .01 -.16
Prosocial
behaviour (peer
report)
0.14 .10 .14 0.13 .10 .13
Step 2 .16* .14** .27*** .08*
Inhibition -1.94 .53 -.40*** -1.20 .49 -.25*
Planning 0.02 .02 .10 0.002 .02 .01
Working Memory -0.02 .04 -.05 -0.06 .04 -.18
Step 3 .16* .002 .30*** .03
Decision Making 0.11 .22 .05 0.37 .20 .17†
Delay of
Gratification 0.03 .14 .02 0.12 .13 .10
Step 4 .20 .07 .35*** .05
Inhibition X
Prosocial -0.39 .68 -.07 0.49 .61 .08
Planning X
Prosocial
-
0.001 .03 -.004 0.01 .03 .02
WM X Prosocial -0.03 .04 -.07 -0.02 .04 -.06
ADM X Prosocial 0.24 .26 .10 0.18 .24 .07
Delay X Prosocial 0.23 .14 .18 -0.27 .12 -.22*
Note. WM = Working Memory. ADM = Affective Decision Making. Delay = Delay of
Gratification. *p<.05 **p<.01 ***p<.001 † p < .08

134
4.5. Discussion
The present study was the first to examine the role of hot as well as cool EF in
Teacher and Peer reported prosocial behaviour and aggression, differentiating between the
function and form of aggression, in early childhood. The findings revealed that the role of
cool EF in aggression varied across informants. In support of research that has implicated EF
in aggression (Beauchamp & V. Anderson, 2010), cool EF was significantly associated with
Teacher reported proactive and reactive relational aggression and reactive physical
aggression, but not proactive physical aggression. However, cool EF was significantly related
to Peer reported proactive and reactive physical, but not relational, aggression, supporting
prior studies that have found a differential role of EF across forms of aggression (Dane &
Marini, 2014; Terranova et al., 2008). Components of hot EF were not associated with
aggression reported by Teachers or Peers. The present study also found that EF was not
associated with Teacher or Peer reported prosocial behaviour. This was also the first study to
examine the moderating role of prosocial behaviour. Prosocial behaviour moderated the
relation between working memory (cool EF) and Teacher reported reactive relational
aggression.
The current study adds to previous research (Jacobson et al., 2011; Utendale &
Hastings, 2011) by suggesting that cool EF is associated with Teacher reported aggression
across the different functions and forms in typically developing children between 3- to 6-
years-old. This contradicts the finding of White et al. (2012) that EF was related to reactive
aggression only. White et al’s (2012) sample, though, included children diagnosed with
mental health disorders, such as ADHD or conduct disorder, which may have accounted for
the association between EF and reactive aggression. Consistent with previous research (Allan
& Lonigan, 2011; Utendale et al., 2011; Verlinden et al., 2014), inhibition was significantly
related to Teacher reported aggression. Poor inhibition was associated with higher levels of
aggression for all the subtypes, apart from reactive relational aggression. Though, inhibition
did significantly correlate with reactive relational aggression. This finding builds on those of
previous studies by suggesting that poor inhibition is related to increased aggression,
irrespective of function or form in early childhood. Young children with poor inhibition may
be less able to withhold a physically or relationally aggressive act in response to frustration
(e.g. teasing), or to achieve a goal (e.g. obtaining a desired toy). This contrasts with Rathert et
al's (2011) finding that inhibition was associated with reactive but not proactive physical
aggression. However, Rathert et al. (2011) carried out their study with children between 9- to
135
12-years-old. Inhibition may be central to all types of aggression in early childhood and may
become more specifically related to reactive aggression as children develop. Indeed,
inhibition is thought to be one of the earliest EFs to emerge and provides a basis for the
development of more complex EFs (Smidts et al., 2004; Tillman et al., 2015).
There were some differences in the role of individual cool EF skills across subtypes
of Teacher reported aggression. Poor planning skills were associated with higher levels of
Teacher reported proactive relational aggression only. This finding adds to research that has
proposed that planning is associated with social behaviour more broadly (Jacobson et al.,
2011), by suggesting planning may be particularly important to proactive relational
aggression. When attempting to achieve a goal, such as obtaining a desired toy, a child may
be less able to generate a non-aggressive strategy. Few studies have examined the relation
between planning and aggression in young children and consequently further research in this
field would be beneficial. Working memory was positively associated with Teacher reported
proactive relational aggression. Although the relation between working memory and
aggression showed a positive trend across subtypes, working memory may be particularly
important to proactive relational aggression because it may allow a child to more effectively
consider and process how relational aggression can be used to achieve a desired goal. This
contradicts the findings of McQuade et al. (2013) who reported that poor working memory
capabilities were characteristic of both physical and relational aggression. McQuade et al.
(2013), however, used the backwards digit span as a measure of working memory whereas the
present study combined scores from the forward and backward subtest. The measure used in
this study may therefore capture a broader memory construct that incorporates storage and
working memory (Martinussen, Hayden, Hogg-Johnson, & Tannock, 2005).
It is important to note that the subtypes of Teacher reported aggression in this study
were significantly and positively correlated, particularly relational subtypes of aggression.
Proactive and reactive subtypes of relational aggression were highly positively correlated,
meaning that these subtypes of aggression may not have represented separable constructs, and
may explain why the role of EF skills across these subtypes of relational aggression were
similar. Although prior studies have supported the existence of distinct functions of relational
aggression (Colins, 2016; Little et al., 2003; Smeets et al., 2016), it may be that Teachers have
difficultly differentiating between these types of behaviour. Interestingly, Peer reported
subtypes of aggression were not as highly correlated. The fact that Teachers are external to
the peer group may mean they are not able to determine the underlying motivation of an
aggressive act as easily as Peers who are internal participants (Bukowski et al., 2012).

136
Though, comparing across Teacher and Peer reported relational aggression, the role of
individual EF skills was similar. The results of this study, however, should be interpreted with
this limitation in mind.
A different pattern of results emerged for Peer reported aggression. Cool EF was
significantly associated with Peer reported proactive and reactive physical aggression, but not
proactive or reactive relational aggression. Children with poorer inhibition received more
nominations for physical aggression than children with greater inhibition. Inhibition was,
though, positively correlated with Peer reported proactive relational aggression, after
controlling for age, gender and verbal ability. This supports research which has suggested that
inhibition is central to young children's aggressive behaviour (Hirvonen et al., 2015; Utendale
et al., 2011). This is in line with the results for Teacher reported aggression, which also
indicated that inhibition was an important factor in all types of aggression. Inhibition may be
central to young children's aggression (regardless of subtype or informant) because it
undergoes rapid development during early childhood and is required for effective interactions
with the environment (P. Anderson, 2008; Beauchamp & V. Anderson, 2010). Children with
poor inhibition may be less able to withhold inappropriate social responses.
In contrast to research that has found EF is associated with aggression broadly (Allan
& Lonigan, 2014; Espy et al., 2011; Jacobson et al., 2011; Riccio et al., 2011), the current
findings suggest that EF is implicated in physical but not relational aggression in early
childhood, according to peer reports. This finding further contradicts research which has
suggested that EF is associated with reactive but not proactive physical aggression (Rathert et
al., 2011; White et al., 2012). These contradictions may reflect the fact previous research has
relied on Teacher and Parent reports of children's aggressive behaviour. Some research has
suggested that there is low concordance between Teacher and Peer reports (McMahon et al.,
2013; Monks et al., 2003). In the present study there was low to moderate agreement between
Teacher and Peer reports of children's aggression across the subtypes.
Disparities between Teacher and Peer reports may reflect actual differences in
children’s behaviour across contexts. Children may demonstrate different levels of aggression
in the classroom in front of their teacher than in the playground with their peers (Little et al.,
2003). Alternatively, Teachers and Peers may not have the same understanding of the function
and form of aggression. Children in the present study were between 3- and 6-years-of-age and
consequently may have lacked the cognitive capabilities to understand the constructs and the
differences between them. However, although the correlations between Peer reported

137
subtypes of aggression were significant, they were moderate correlations, especially
compared to associations between Teacher reported subtypes. A further explanation may be
that different types of reports were gained. Teachers rated the level of children's aggression,
whereas peers nominated children who were aggressive. Peers may therefore have only
nominated the most salient aggressive children. This study, however, highlighted some
interesting difference in understanding of aggression based on Teacher and Peer reports. This
is an area that warrants further research. Observational research would be beneficial in
exploring differences in Teacher and Peer accounts in order to compare how Teachers and
Peers are categorising aggressive children.
The present findings provide little support for the argument that relationally
aggressive children may be characterised by superior functioning (Heilbron & Prinstein,
2008). Apart from in the case of working memory, which showed a positive trend across
Teacher reported subtypes, stronger EF skills were related to lower levels of Teacher reported
physical and relational aggression. Furthermore, EF skills were not related to Peer reported
relational aggression, regardless of function. However, children in the current study were
younger than children in previous studies, who were typically in middle childhood to
adolescence. Between 3- and 5-years-of-age children experience rapid gains in their EF
(Hughes & Ensor, 2008; Willoughby et al., 2012) and as a result the relation between EF and
aggression may change as children’s EF matures. Further the type of relational aggression
children use has also been found to change with age (Björkqvist et al., 1992). Children
increasingly use relational aggression as they develop. Longitudinal studies are therefore
needed to explore potential developmental trends in the relation between EF and aggressive
subtypes.
Child factors, including age, gender, verbal ability and prosocial behaviour, were
associated with aggression in early childhood. According to Teacher reports, relational
aggression was associated with being a girl and physical aggression was associated with being
a boy. Although gender was not a significant predictor of proactive physical aggression, Boys
exhibited a significantly greater mean rate of proactive physical aggression than girls. Gender
differences were only found for Peer reported reactive physical aggression; boys were
nominated significantly more than girls. These findings expand on those of previous studies
(Lussier et al., 2012) by suggesting that gender differences are apparent in the form of
aggression regardless of the function, at least based on teacher reports.
138
A further important child factor was prosocial behaviour. Prosocial behaviour was
negatively related to all Teacher reported aggressive subtypes. Based on Teacher reports,
children who were perceived as more prosocial were rated as lower in aggression. Prosocial
behaviour, though, only significantly and positively predicted Peer reported reactive relational
aggression. In contrast to Teacher reported aggression, children nominated as prosocial were
more likely to be nominated as reactively relationally aggressive. These children may be
skilled users of aggression and may be using prosocial and relationally aggressive strategies
interchangeably when angered (Hawley, 2002; Zsolnai et al., 2012). Peers may be more aware
of these skilled children because they are inside the peer group, unlike Teachers who are
external. However, although not significantly, Peer reported prosocial behaviour was
positively related to the other Peer reported subtypes of aggression. It is possible that children
may be nominating the same peers (maybe their friends) for all types of behaviour (Bukowski
et al., 2012).
In addition to being directly related to aggression, prosocial behaviour moderated the
relation between working memory and Teacher reported reactive relational aggression. For
children high in prosocial behaviour, working memory was significantly and negatively
related to Teacher reported reactive relational aggression. For children low or average in
prosocial behaviour, working memory was positively, but non-significantly, associated with
Teacher reported reactive relational aggression. This is in line with the findings of Renouf et
al. (2009), who found ToM was positively associated with relational aggression in children
who were low or average in prosocial behaviour. Prosocial behaviour may moderate the
relation between cognitive abilities and relational aggression, at least when used reactively.
With the transition to school, children are more likely to experience peer conflict, which may
facilitate the development of cognitive abilities. Highly prosocial children may be able to
more effectively recall and process affiliative strategies when angered because they
experience more prosocial interactions with their peers. Children low in prosocial behaviour,
in contrast, may experience fewer positive peer experiences and consequently recall and
generate more aggressive strategies. Prosocial behaviour did not moderate the association
between EF and Peer reported aggression. This finding does not support the view of
bistrategic controllers as having intact or superior EF (Hawley, 2002; Pellegrini et al., 2011;
Vaughn et al., 2003). However, these children may represent a minority subgroup of
aggressive children. Further research to confirm this hypothesis is needed.
After taking into account cool EF, hot EF processes did not significantly contribute
to understanding of Teacher or Peer reported aggression of any function or form. This does

139
not support previous research which indicated that hot EF skills was negatively related to
disruptive and aggressive behaviour (Garner & Waajid, 2012; Kim et al., 2014). The lack of a
significant relation between components of hot EF and aggression may reflect the
developmental stage of the sample. The current study focused on early childhood, whereas
previous research has focused on middle childhood to adolescence. During early childhood,
children’s EF skills show dramatic advancement and as children develop it has been argued
that their EF becomes increasingly modularised (Hughes & Ensor, 2008; Karmiloff-Smith,
1992). This may account for why EF was significantly associated with aggression, but few EF
subcomponents were independent predictors. During early childhood, EF abilities, like
affective decision making, may not represent distinct EF components. Indeed, Willoughby et
al. (2011) found that EF, including cool and hot domains together, was associated with
aggression, but that hot EF skills were not uniquely related to aggression. As children develop
and their EF becomes more advanced and modular (Hughes & Ensor, 2008; Karmiloff-Smith,
1992), hot EF may become more dissociable from cool EF and as a result may become more
central to aggression. Longitudinal research would therefore be valuable in order for
developmental trends in the relation between EF and aggression to be explored.
Cool inhibition and working memory and hot delay of gratification were significantly
and positively correlated with prosocial behaviour reported by Teachers. Cool working
memory was also significantly and positively associated with Peer reported prosocial
behaviour. However, in line with research which failed to find an association between cool
and hot EF skills and prosocial behaviour (Allan & Lonigan, 2011; Hughes & Ensor, 2011),
neither cool nor hot EF processes predicted prosocial behaviour when aggression and control
variables were taken into account in the present study. This study expands on previous
research by suggesting that EF is not related to prosocial behaviour reported by either
Teachers or Peers. The present findings did not support those of Jacobson et al. (2011) who
found that EF was related to prosocial behaviour in children between 4- and 12-years-of-age.
Though, in their study, Jacobson et al. (2011) used a questionnaire rating of EF, which may
capture more global aspects of EF than performance tests. The current findings also do not
support those of Garner and Waajid (2012) that children with better hot EF skills show more
prosocial behaviours than children with poor hot EF skills. However, Garner and Waajid
(2012) assessed positive emotionality as a measure of hot EF. Understanding of the
organisation of hot EF is limited and there is debate as to which skills constitute hot EF. It
may be that positive emotionality is more a domain of temperament or emotional intelligence

140
than hot EF. Greater consensus on which skills fall under the domain of hot EF would enable
a greater understanding of the role of these processes in social behaviour to be gained.
In sum, the present study revealed that the role of EF in aggression varies depending
on whether Teachers or Peers are reporting on children's aggression. According to the present
findings, cool EF, particularly inhibition, is central to Teacher reported aggression, across the
different functions and forms, in children between 3- to 6-years-old. There were slight
differences across subtypes of Teacher reported aggression. Proactive relational aggression
was negatively related to planning and positively related to working memory. Added to this,
prosocial behaviour moderated the relation between working memory and Teacher reported
reactive relational aggression. In contrast, cool EF was associated with Peer reported
proactive and reactive physical, but not relational, aggression. Inhibition was central to Peer
reported physical aggression. Hot EF was not related to either Teacher or Peer reported
aggression. Based on the present finding, cool (but not hot) EF appears to be important in
early childhood aggression. Neither cool nor hot EF components were related to Teacher or
Peer reported prosocial behaviour, suggesting that EF may be associated with aggressive but
not prosocial behaviour in young typically developing children.
This is an important area of research because it will lead to a more comprehensive
understanding of the development of both prosocial and aggressive behaviour and may inform
more targeted interventions that are effective for a wider range of aggressive children. The
present findings, however, should be considered in light of some limitations. Firstly, the mean
level of Teacher reported proactive physical aggression was lower than the other subtypes,
which may explain why cool EF did not significantly contribute to understanding of this type
of aggression. Secondly, the mean score for planning performance was low and the mean
score for delay of gratification was close to the maximum score, indicating potential floor and
ceiling effects. Further research with more sensitive measures of planning and delay of
gratification in young children may enable greater understanding of the role of these abilities
in early childhood aggression. Thirdly, it should be noted that class participation rates ranged
from 52 to 63%, meaning that the peer nominations may have lacked reliability. However,
research has suggested that peer nominations of social behaviours are reliable with class
participation rates as low as 50% (Marks et al. , 2013). Added to this, low class participation
rates may affect the representativeness of the sample. That is, the most aggressive children
may not be included in the sample. Though, in the present study children representing the full
range of the PPRA scale were included. These findings should be corroborated with studies
including larger class participation rates. Fourthly, the findings from the present study,
141
particularly in relation to the interaction effects, need to be corroborated in studies with larger
samples as the current study may have lacked power to detect smaller effects. Finally, the
correlational design of this study limited exploration of developmental trends in the relation
between EF and aggression. In early childhood slight differences in the role of EF across
subtypes of aggression were apparent. Further differences may emerge as children’s EF
develops. Future research investigating longitudinal links between EF and aggressive
subtypes across childhood would increase understanding of age related trends.
The present study represented a first step towards understanding the cognitive profile
of subtypes of aggression. This study increased current understanding of the unique role of
cool and hot domains of EF in the function and form of early childhood aggression. This
study, though, is likely to only paint a partial picture. Other cognitive abilities have been
implicated in children’s aggressive behaviour, such as ToM. ToM is strongly associated with
EF (Devine & Hughes, 2014; Hughes & Ensor, 2007) and has also been found to be related to
aggressive and prosocial behaviour (Eggum et al., 2011; Hughes & Ensor, 2006; Shakoor et
al., 2012). The emergence of ToM is thought to be functionally dependent on the presence of
EF (Carlson & Mandell, 2004; J. Russell, 1996). Study one therefore first attempted to
identify the role of EF in aggression and examined the unique contribution of separate cool
and hot domains of EF to aggression in order to investigate whether hot EF is more strongly
related to aggression than cool EF (Brock et al., 2009; Garner & Waajid, 2012). Study two
then aimed to expand on the findings of study one by exploring the role of related cognitive
abilities in aggression. Considering the role of multiple cognitive abilities, such as EF and
ToM, in childhood aggression and prosocial behaviour may provide a more detailed
understanding of the link between cognition and behaviour and may identify further factors
that can be targeted by methods attempting to promote positive social development. Added to
this, the different functions and forms of aggression have not only been related to various
predictors (Dane & Marini, 2014; Rathert et al., 2011), but also outcomes (Card & Little,
2006; Poulin & Boivin, 2000; R. Smith et al., 2009). Not all types of aggression may be
related to poor cognitive correlates and not all types of aggression may be associated with
negative outcomes. Study two will further build on study one by also exploring the relation
between the function and form of aggression and peer acceptance.
142
5. STUDY 2: EXECUTIVE FUNCTION AND THEORY OF MIND AS
PREDICTORS OF AGGRESSION, PROSOCIAL BEHAVIOUR AND
PEER ACCEPTANCE
Abstract
Objective: Despite current conceptualisation of social development underscoring the need for
research elucidating the combined contribution of EF and ToM to aggressive and prosocial
behaviour, studies have continued to largely treat EF and ToM as separate factors. Building
on the first study, the present study will therefore examine the simultaneous role of EF and
ToM in the function and form of aggression and prosocial behaviour in order to provide a
more detailed understanding of the development of aggressive and prosocial behaviour in
early childhood. Added to this, the present study will build on the first study by exploring the
relation between subtypes of aggression and peer acceptance in order to further understand the
heterogeneous nature of aggression.
Method: Children (n=106) between 46- to 80-months-old completed tasks assessing cool EF
(inhibition, working memory, planning), hot EF (affective decision making, delay of
gratification) and ToM (first and second order false belief understanding). Teaching staff and
peers rated children’s prosocial and aggressive behaviour and peer acceptance.
Results: The findings revealed that EF, including cool and hot domains, and ToM
significantly predicted early proactive and reactive physical, but not relational, aggression
reported by Teachers and Peers. Poor inhibition was central to increased physical aggression,
irrespective of function. However, better affective decision making skills were related to
increased proactive physical aggression only. EF and ToM did not significantly predict early
prosocial behaviour. Prosocial and aggressive behaviour (but not EF and ToM) was
significantly related to Teacher and Peer reported acceptance, but not Peer reported rejection.
Teacher and Peer reported prosocial behaviour and aggression (apart from for Peer reported
proactive relational aggression) were positively related to aggression.
Conclusion: The present findings suggest that the role of EF and ToM in aggression may
vary across the different functions and forms. Physical, but not relational, aggression may be
related to EF and ToM in early childhood. Further, not all aggressive children may
demonstrate poor EF. Proactively and physically aggressive children may demonstrate
superior cognitive abilities at least in some domains, such as affective decision making.
Distinct subtypes of aggression may therefore be apparent due to the varying cognitive

143
correlates, but the outcomes of aggression may not vary across subtypes in early childhood as
functions and forms (apart from Peer reported proactive relational aggression) were positively
associated with peer acceptance. Prosocial behaviour, but not aggression, was central to peer
acceptance.
Adapted for publication: O'Toole, S. E., Monks, C. P., & Tsermentseli, S. (accepted for
publication). Executive function and theory of mind as predictors of aggression, prosocial
behaviour and peer acceptance in early childhood: The moderating role of gender. Social
Development.
The findings published in this article are based on the Teacher reported data and include the
functions (e.g. physical and relational) of aggression, but not the form. Peer reported data is
presented in this chapter but is not included in the published article.

144
5.1. Chapter Overview
This chapter presents the findings of study two. Study two was based on data from
the first time point of the longitudinal study and examined the association between EF, ToM,
aggressive and prosocial behaviour and peer acceptance. This study follows on from study
one (Chapter 4) because as well as considering the role of EF in aggressive and prosocial
behaviour, the role of ToM, a cognitive ability highly related to EF (Devine & Hughes, 2014),
is also taken into account. This will enable a more comprehensive understanding of the
underlying cognitive factors in children’s prosocial and aggressive behaviour to be gained,
whereas study one was more focussed on the different contributions that various aspects of
cool and hot EF in relation to prosocial behaviour and the particular functions and forms of
aggression. Further, the present study builds on study one by investigating whether subtypes
of aggression based on function and form are differently related to peer acceptance, adding to
research attempting to identify whether aggressive subtypes are distinct. This study therefore
expands on study one (Chapter 4) as it investigates not just whether predictors of subtypes of
aggression vary, but also whether the outcomes of aggression differ across the functions and
forms of aggression, which will provide greater insight into the heterogeneous nature of
aggression.
5.2. Introduction
Models of social behaviour developed from the neuroscience literature argue that
children's emerging social behaviours are dependent on a wide range of cognitive abilities,
including EF, but also other abilities such as ToM (Beauchamp & V. Anderson, 2010; Yeates
et al., 2007). The first study in this thesis (Chapter 4) represents the only study to date that has
examined the unique contribution of cool and hot EF to the different functions and forms of
aggression in children between 3- to 6-years-old (Poland, Monks, & Tsermentseli, 2016).
According to study one, inhibition was central to aggression, but planning and working
memory were important to proactive relational aggression only. Subtle differences in the role
of individual EF skills between subtypes of aggression may be evident. However, hot EF did
not contribute to understanding of aggression of either function or form after cool EF was
taken into account. The focus of the first study in this thesis was on EF due to the dearth of
research examining cool and hot subcomponents in relation to aggression and prosocial
behaviour. However, this likely paints only a partial picture of the development of aggression.
Reactive and physical aggression have been found to be associated with poorer ToM, whereas
proactive and relational aggression have been found to be unrelated ToM (Renouf et al., 2010;
145
Werner et al., 2006). Identifying the association between these cognitive abilities and the
function and form of aggression may result in a more comprehensive understanding of
aggression that is more reflective of the way children use aggression in real life.
The study presented in this chapter focussed on the role of EF and ToM in children's
aggressive and prosocial behaviour as EF and ToM are highly related (Devine & Hughes,
2014). There is a strong body of evidence which suggests that the presence of a certain level
of EF is necessary for the emergence of ToM (Carlson & Mandell, 2004; Hughes & Ensor,
2007; J. Russell, 1996). Added to this, it has been suggested that hot EF may be particularly
important to ToM due to their reliance on the same brain regions and their relation to
emotionally significant situations (Zelazo et al., 2005). Despite their strong association, EF
and ToM have largely been treated as separate risk factors of childhood aggression. Hence,
there are gaps in current understanding of how these cognitive abilities work together in the
genesis and development of aggressive and prosocial behaviour. Current conceptualisations of
social and cognitive development underscore the need for research incorporating
simultaneous assessments of EF and ToM in order to elucidate their combined contribution to
aggressive and prosocial behaviour (Arsenio, Cooperman, & Lover, 2000; Beauchamp & V.
Anderson, 2010; Yeates et al., 2007). Poor EF and ToM, for example, could result in additive,
interactive or hierarchical contributions to children's early aggression.
In addition to understanding the underlying cognitive factors of aggressive and
prosocial behaviour, it is also important to identify their relation to developmental outcomes,
such as peer acceptance. Identifying predictors as well as outcomes will provide a more
comprehensive understanding of the reasons children choose to engage in aggressive or
prosocial behaviour and may consequently inform more targeted interventions. Aggression
has been linked to peer acceptance (Dodge et al., 2003). Popular children have been found to
engage in low levels of aggressive behaviour and high levels of prosocial behaviour, whereas
rejected children show the opposite pattern of behaviour (Sandstrom & Cillessen, 2006).
However, there is some evidence that aggression may be differently related to peer acceptance
depending on its function and form. The use of reactive or physical aggression was associated
with greater peer rejection, but the use of proactive or relational aggression was actually
related to greater peer acceptance (Poulin & Boivin, 2000; Smith, Rose, & Schwartz-Mette,
2009). These studies focussed on form or function in isolation and did not take into account
children's cognitive abilities. EF and ToM have been directly linked to peer acceptance
(Diesendruck & Ben-Eliyahu, 2006; Jacobson et al., 2011; Masten et al., 2012) and social
cognitive abilities have been found to mediate the relation between early peer rejection and

146
later aggression (Dodge et al., 2003). Understanding the interaction of form and function in
predicting peer acceptance, after taking into account EF and ToM, may have important
implications not just for understanding the development of peer acceptance, but also the
varying outcomes of subtypes of aggression.
The study presented in this chapter therefore aimed to examine the joint role of EF,
including cool and hot skills, and ToM in aggression and prosocial behaviour in order to
better understand their joint contribution to early aggressive and prosocial behaviour
development. This study also took into account the heterogeneous nature of aggression. The
role of EF and ToM in reactive and proactive functions and physical and relational forms of
aggression was investigated in order to establish whether the association between these
cognitive abilities and aggression varies across subtypes. The research presented in this
chapter expands on the first study of this thesis (Chapter Four) as it enables the unique
associations among a broader range of cognitive abilities to prosocial behaviour and subtypes
of aggressions to be explored and as a result may provide a more comprehensive
understanding of the underlying cognitive mechanisms of these behaviours. Unlike in the first
study, in this study the joint role of EF and ToM was explored and cool and hot EF were not
treated as separate constructs. This was due to the strong association between EF and ToM
(Devine & Hughes, 2014; after controlling for EF only small amounts of variance would be
left to be explained) and the fact that this was an initial exploratory study that aimed to
identify the combined role of these cognitive abilities in aggressive and prosocial behaviour.
Further, study one provided little support for the view that cool and hot EF represented
distinct constructs. The current study also aimed to investigate the unique contribution of EF
and ToM as well as aggressive subtypes to peer acceptance in order to increase knowledge of
the outcomes of varying types of aggression.
In line with the findings of prior studies (Rathert et al., 2011; Renouf et al., 2010;
White et al., 2012) and study one (Chapter 4) which have suggested that reactive and
physical, but not proactivel and relational, aggression were negatively related to EF and ToM
it was hypothesised that poor EF and ToM would be associated with greater aggression. Study
one (Chapter 4) found that relational aggression was positively associated with some EF
abilities, but previous research has found mixed results regarding the links between EF, ToM
and relational forms of aggression (Heilbron & Prinstein, 2008; Kaukiainen et al., 1999;
Werner et al., 2006). Consequently, no specific hypotheses regarding the relation between EF
and ToM and proactive and relational aggression were made. Based on prior studies which
have indicated that greater prosocial behaviour and peer acceptance are associated with

147
superior EF and ToM (Diesendruck & Ben-Eliyahu, 2006; Jacobson et al., 2011; Masten et
al., 2012), it was predicted that EF and ToM would be positively related to prosocial
behaviour and peer acceptance. Further, in line with prior findings (Poulin & Boivin, 2000; R.
Smith et al., 2009), it was predicted that reactive and physical aggression would be negatively
related to peer acceptance and proactive and relational aggression positively related.
5.3. Method
5.3.1. Design
This was a correlational study based on data from the first time point of the 12 month
longitudinal study. Variables measured included children’s cool and hot EF skills, ToM,
Teaching Staff and Peer reported aggression, prosocial behaviour and peer acceptance. As in
the previous study, three child factors were also included to control for confounding effects:
age, gender (boy = 1, girl = 2), and verbal ability.
5.3.2. Participants
The sample included the 106 children (M = 61.47, SD = 9.80, range 48 to 80 months)
and their Teachers and Teaching Assistants recruited at Time 1. The sample is described in
detail in the methodology chapter (Chapter 3).
5.3.3. Measures
A detailed description of the measures is provided in the methodology chapter
(Chapter 3). The same measures of cool and hot EF outlined in Chapter Four (Study One)
were used in the present research. Cool EF skills assessed included inhibition, planning and
working memory and hot EF skills measured were affective decision making and delay of
gratification. In addition, children’s ToM was assessed using two first-order false belief tasks
(unexpected contents (Wimmer & Perner, 1983) and change of location (Riviere, 1997)) and
one second-order false belief task (change of location; Riviere, 1997). A composite ToM
score was created. Children scored 1 point for each task they successfully completed (scores
ranged from 0 to 3). Children’s verbal ability was also measured using the BPVS (Dunn et al.,
1982).
Teaching staff reported on the function and form of children’s aggression using the
PPRA (Ostrov & Crick, 2007) and on children’s prosocial behaviour and peer acceptance
using subscales from the PSBS (Crick et al., 1997). Peers nominated children in their class

148
who were using aggressive and prosocial strategies. Peers reported on the function and form
of children's aggression.
5.3.4. Procedure
This study formed part of a larger investigation into the relation between children's
cognitive abilities and social behaviour across early childhood. The procedure is outlined in
the methodology chapter (Chapter 3). This study is based on data collected at the first time
point between April and July 2014. Children completed the tasks in a fixed order across three
assessment sessions: session 1: CDMT and BPVS; session 2: ToL, Digit Span, Change of
Location and Go/No-Go; session 3: Unexpected Contents, Riviere Change of Location, peer
nomination interview and Gift Wrap. Children were assessed individually in a quiet room at
their school. Each assessment session lasted between 20 to 45 minutes. Teaching staff
completed the questionnaires at their own convenience during the testing phase.
5.3.5. Data Analysis
Preliminary analyses were carried out to examine potential confounding effects. T-
tests were conducted to investigate gender differences on children's ToM and peer acceptance
reported by Teachers and Peers. Gender differences in ToM and peer acceptance were
examined as these relations are debated. Some research has found that there are no differences
between genders on ToM abilities (Werner et al., 2006) or peer acceptance (Masten et al.,
2012), whereas other studies have found that girls outperform boys on ToM tasks (Calero et
al., 2013; Walker, 2005) and that boys are more rejected than girls (Ettekal & Ladd, 2015).
Gender differences in relation to EF and aggression are reported in chapter four. The main
analysis was separated into two parts. First the unique contribution of EF and ToM to
aggression and prosocial behaviour was explored. Following this the role of EF, ToM and
aggressive and prosocial behaviour in peer acceptance was investigated. Pearson’s
correlations were carried out to examine the initial bivariate relations between individual
variables. Next, hierarchical regressions were used to examine the unique association between
multiple predictors and dependent variables. Hierarchical regressions were used because this
technique allows the researcher to look at relations after controlling for the effects of other
variables (P. Cohen et al., 2003; Kelley & Maxwell, 2010). For example, in the present study
hierarchical regressions enabled the association between aggression and peer acceptance to be
examined after controlling for EF and ToM.

149
5.4. Results
Descriptive statistics for ToM and peer acceptance are reported in Table 5.1.
Descriptive statistics for EF and aggression are presented in Table 4.1 in Chapter Four. Two
children were excluded from the analysis due to missing data on at least one measure,
meaning the final sample included 104 children.
Table 5.1. Summary statistics for the predictors and dependent variables
N Min Max M SD
ToM 104 0 3 1.42 0.88
Teacher reported
Acceptance 106 2.0 5.0 3.92 0.70
Peer reported
Acceptance 105 -1.70 2.29 .00 .97
Peer reported rejection 105 -1.98 2.22 .00 .97
Note. N = sample size. Min = minimum score. Max = maximum score. M = mean score. SD =
standard deviation.
5.4.1. Gender Differences
There was a significant effect of gender on Peer reported rejection, t(103) = 2.38, p =
.02. Boys received significantly more dislike nominations (M = .23, SD = 1.04) than girls (M
= -.21, SD = .86). There was no significant effect of gender on Peer, t(103) = 0.57, p = .57, or
Teacher reported acceptance, t(103) = 0.47, p = .64, or ToM, t(102) = -1.04, p = .30. Gender
differences for EF and aggression are reported in Chapter Four. Gender therefore had a
significant effect on some variables in the present study and consequently was controlled for
in the main analysis.
5.4.2. Predictive role of EF and ToM in aggression and prosocial behaviour
Pearson’s correlations revealed that cool EF skills were significantly associated with
Teacher reported aggression. Correlations are reported in Table 5.2. Inhibition was negatively

150
related to proactive and reactive physical and relational aggression. Planning was negatively
associated with proactive and reactive physical aggression and proactive relational aggression.
Working memory was negatively related to proactive and reactive physical aggression.
Components of hot EF were also significantly related to Teacher reported aggression. Delay
of gratification was negatively related to proactive and reactive physical aggression. Affective
decision making, however, was not significantly associated with any of the aggressive
subtypes. ToM was significantly negatively correlated with Teacher reported aggression.
False belief understanding was negatively related to proactive and reactive physical
aggression. Pearson's correlations indicated that Peer reported aggression was significantly
correlated with inhibition only. Inhibition was negatively related to proactive and reactive
physical aggression and proactive relational aggression. None of the other cool or hot EF
skills were significantly associated with Peer reported aggression. Added to this, ToM did not
significantly correlate with Peer reported aggression.
Cool EF skills were significantly associated with prosocial behaviour reported by
Teachers and Peers. Inhibition and working memory were positively associated with Teacher
reported prosocial behaviour. Working memory was also positively correlated with Peer
reported prosocial behaviour. Hot EF skills were associated with Teacher reported prosocial
behaviour only. Delay of gratification was positively related to prosocial behaviour reported
by Teachers. ToM was marginally significantly and positively associated with Teacher
reported prosocial behaviour, but was not significantly related to Peer reported prosocial
behaviour.
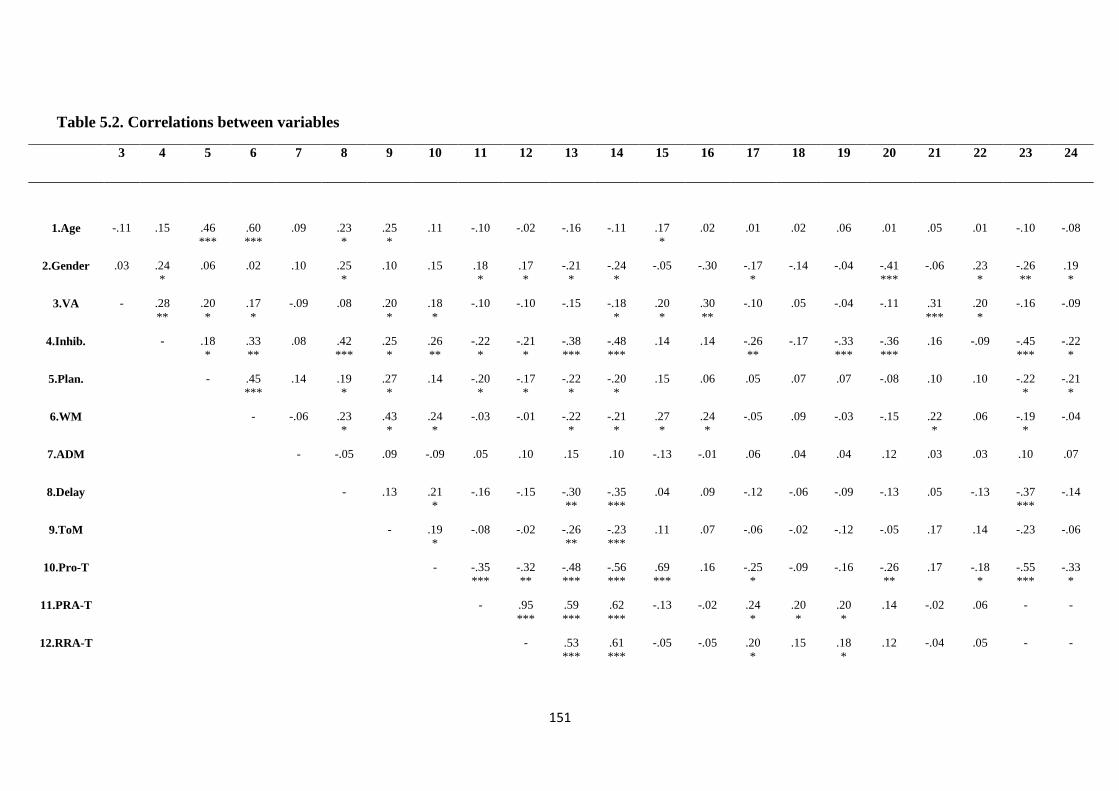
151
Table 5.2. Correlations between variables
3 4 5 6 7 8 9 10 11 12 13 14 15 16 17 18 19 20 21 22 23 24
1.Age -.11 .15 .46
***
.60
***
.09 .23
*
.25
*
.11 -.10 -.02 -.16 -.11 .17
*
.02 .01 .02 .06 .01 .05 .01 -.10 -.08
2.Gender .03 .24
*
.06 .02 .10 .25
*
.10 .15 .18
*
.17
*
-.21
*
-.24
*
-.05 -.30 -.17
*
-.14 -.04 -.41
***
-.06 .23
*
-.26
**
.19
*
3.VA - .28
**
.20
*
.17
*
-.09 .08 .20
*
.18
*
-.10 -.10 -.15 -.18
*
.20
*
.30
**
-.10 .05 -.04 -.11 .31
***
.20
*
-.16 -.09
4.Inhib. - .18
*
.33
**
.08 .42
***
.25
*
.26
**
-.22
*
-.21
*
-.38
***
-.48
***
.14 .14 -.26
**
-.17 -.33
***
-.36
***
.16 -.09 -.45
***
-.22
*
5.Plan. - .45
***
.14 .19
*
.27
*
.14 -.20
*
-.17
*
-.22
*
-.20
*
.15 .06 .05 .07 .07 -.08 .10 .10 -.22
*
-.21
*
6.WM - -.06 .23
*
.43
*
.24
*
-.03 -.01 -.22
*
-.21
*
.27
*
.24
*
-.05 .09 -.03 -.15 .22
*
.06 -.19
*
-.04
7.ADM - -.05 .09 -.09 .05 .10 .15 .10 -.13 -.01 .06 .04 .04 .12 .03 .03 .10 .07
8.Delay - .13 .21
*
-.16 -.15 -.30
**
-.35
***
.04 .09 -.12 -.06 -.09 -.13 .05 -.13 -.37
***
-.14
9.ToM - .19
*
-.08 -.02 -.26
**
-.23
***
.11 .07 -.06 -.02 -.12 -.05 .17 .14 -.23 -.06
10.Pro-T - -.35
***
-.32
**
-.48
***
-.56
***
.69
***
.16 -.25
*
-.09 -.16 -.26
**
.17 -.18
*
-.55
***
-.33
*
11.PRA-T - .95
***
.59
***
.62
***
-.13 -.02 .24
*
.20
*
.20
*
.14 -.02 .06 - -
12.RRA-T - .53
***
.61
***
-.05 -.05 .20
*
.15 .18
*
.12 -.04 .05 - -

152
Table 5.2 Continued
3 4 5 6 7 8 9 10 11 12 13 14 15 16 17 18 19 20 21 22 23 24
13.PPA-T - .91
***
-.23
*
-.08 .35
***
.29
**
.28
**
.50
***
-.12 .19
*
- -
14.RPA-T - -.17 -.13 .34
***
.25
**
.26
**
.50
**
-.15 .21
*
- -
15.Accept-
T
- .18
*
-.14 .04 -.13 -.11 .27* -.07 -.19
*
-.07
16.Pro-P - .07 .30
**
.12 .10 .66
***
.10 -.16 -.07
17.PRA-P - .29
**
.41
***
.44
***
.15 .14 .35
***
.22
*
18.RRA-P - .37
***
.43
***
.31
***
.15 .26
**
.18
19.PPA-P - .31
***
.13 .06 .27
**
.20
*
20.RPA-P - .12 .29** .49
***
.12
21.Accept-
P
- .05 -.15 -.03
22.Rejectio
n-P
- .24
*
.06
23. PA-T - .63
***
24. RA-T -
Note. VA = Verbal Ability. Inhib. = Inhibition. Plan. = Planning. WM = Working Memory. ADM = Affective Decision Making. Delay = Delay of Gratification. ToM =
Theory of Mind. PRA = Proactive Relational Aggression. RRA = Reactive Relational Aggression. PPA = Proactive Physical Aggression. RPA = Reactive Physical
Aggression. PA = Physical Aggression. RA = Relational Aggression. T = Teacher report. P = Peer report.*p<.05 **p<.01 ***p<.001, one tailed.

153
Hierarchical multiple regressions were carried out for Teacher and Peer reported
subtypes of aggression and prosocial behaviour. In the first step child age, gender and verbal
ability were entered to control for confounding effects. Age was controlled for due to the wide
age span of the sample and the fact age was correlated with some measures of cognition and
behaviour (Table 5.2). Gender and verbal ability were also controlled because these variables
were associated with some cognitive and behavioural domains (Table 5.2). In the second step
cool and hot EF and ToM predictors were entered simultaneously as EF and ToM are highly
related (Devine & Hughes, 2014).
Assumptions of multiple regression were examined. For Teacher reported aggressive
behaviour Durbin-Watson values ranged from 1.61 to 2.20 and for Teacher reported prosocial
behaviour the value was 1.34. Durbin-Watson values ranged between 1.98 and 2.26 for Peer
reported aggressive subtypes and the value for Peer reported prosocial behaviour was 1.74.
These values fall between the lower limit of 1.48 and the upper limit of 2.5, meaning that the
assumption of independent errors was met (Savin & White, 1977; Wang & Jain, 2003). VIF
and tolerance values indicated that there was no evidence of multicollinearity between
predictors (J. Cohen et al., 2003; Kelley & Maxwell, 2010). P-P plots of standardised
residuals indicated that for Teacher reported proactive physical aggression and for Peer
reported proactive and reactive relational aggression the assumption of normally distributed
errors was violated (J. Cohen et al., 2003; Kelley & Maxwell, 2010). Added to this, zpred vs.
zresid plots suggested that there was slight heteroscedasticity for Teacher reported proactive
physical aggression and for Peer reported proactive physical and relational aggression (B.
Cohen, 2008; Kelley & Maxwell, 2010). Due to violations of the assumptions of normally
distributed errors and homoscedasticity bootstrapped regressions were carried out for Teacher
reported proactive physical aggression and for Peer reported proactive and reactive relational
aggression. The bootstrapped results, however, did not vary from the non-bootstrapped
results.
5.4.2.1. Teacher Reported Aggression
Full regression results for Teacher reported aggression are presented in Table 5.3.
Proactive physical aggression. Control variables significantly accounted for 12% of
the variance in proactive physical aggression, R2
= .12, F(3, 103) = 4.49, p = .01. Adding EF
and ToM into the model significantly increased the amount of variance explained to 26%, ΔR2
= .14, ΔF(6, 94) = 2.88, p = .01. Inhibition was a significant negative independent predictor
and affective decision making was a significant positive independent predictor.

154
Reactive physical aggression. Control variables significantly explained 13% of the
variance in reactive physical aggression, R2
= .13, F(3, 103) = 5.03, p = .003. The inclusion of
EF and ToM predictors into the model significantly increased the amount of variance
accounted for to 31%, ΔR2
= .18, ΔF(6, 94) = 4.13, p < .001. Inhibition was a significant
negative independent predictor.
Proactive relational aggression. Control variables accounted for 7% of the variance
in proactive relational aggression, but this association was not significant, R2
= .07, F(3, 103)
= 2.45, p = .07. The addition of EF and ToM skills into the model led to 17% of the variance
in proactive relational aggression being explained, but this increase was not significant ΔR2
=
.11, ΔF(6, 94) = 2.01, p = .07.
Reactive relational aggression. Control variables explained 5% of the variance in
reactive relational aggression, R2
= .05, F(3, 103) = 1.77, p = .16, but this was not significant.
Adding EF and ToM skills into the model resulted in 15% of the variance being explained,
but this increase was not significant ΔR2
= .10, ΔF(6, 94) = 1.93, p = .08.

155
Table 5.3. Hierarchical regression results for Teacher reported proactive and reactive relational and physical aggression
PPA RPA PRA RRA
ΔR2 B SE B β ΔR
2 B SE B β ΔR2 B SE B β
ΔR
2 B SE B β
Step 1 .12** .13** .07 .05
Age -0.02 .01 -.21* -0.02 .01 -.16 -0.01 .01 -.14 -0.01 .01 -.06
Gender -0.31 .14 -.21* -0.50 .19 -.25* 0.28 .15 .18 0.26 .15 .16
VA -0.01 .004 -.21* -0.02 .01 -.23* -0.01 .01 -.16 -0.01 .01 -.16
Step 2 .14* .18** .11 .10
Inhibition -0.93 .42 -.25* -1.78 .55 -.34** -0.94 .46 -.24* -0.87 .47 -.22
Planning -0.02 .02 -.13 -0.03 .02 -.12 -0.04 .02 -.22 -0.04 .02 -.23†
WM 0.01 .03 .03 0.003 .04 .01 0.06 .03 .22 0.05 .03 .18
ADM 0.34 .16 .20* 0.33 .21 .14 0.14 .18 .08 0.21 .18 .12
Delay
-0.12 .10 -.13 -0.19 .13 -.15 -0.11 .11 -.11 -0.11 .11 -.11
ToM -0.12 .09 -.14 -0.12 .12 -.11 -0.02 .10 -.02 0.001 .10 .001
Note. PRA = Proactive Relational Aggression. RRA = Reactive Relational Aggression. PPA = Proactive Physical Aggression. RPA = Reactive Physical
Aggression. VA = Verbal Ability. WM = Working Memory. ADM = Affective Decision Making. Delay = Delay of Gratification. ToM = Theory of Mind.
*p<.05 **p<.01 ***p<.001 † p = .05

156
5.4.2.2. Peer Reported Aggression
Full regression results for Peer reported aggression are presented in Table 5.4.
Proactive physical aggression. Control variables accounted for 1% of the variance in
Peer reported proactive physical aggression, but this relation was not significant, R2
= .01,
F(3, 103) = 0.17, p = .92. Adding EF and ToM predictors into the model significantly
increased the amount of variance accounted for to 16%, ΔR2
= .15, ΔF(6, 94) = 2.79, p = .02.
Inhibition was a significant negative independent predictor.
Reactive physical aggression. Control variables significantly accounted for 18% of
the variance in Peer reported reactive physical aggression, R2
= .18, F(3, 103) = 7.10, p <
.001. The inclusion of EF and ToM into the model significantly increased the amount of
variance explained to 28%, ΔR2
= .11, ΔF(6, 94) = 2.31, p = .04. Inhibition was a significant
negative independent predictor.
Proactive relational aggression. Control variables accounted for 4% of the variance
in Peer reported proactive relational aggression, but this association was not significant, R2
=
.04, F(3, 103) = 1.40, p = .25. The addition of EF and ToM into the model did not
significantly increase understanding of proactive relational aggression, ΔR2
= .06, ΔF(6, 94) =
0.95, p = .46.
Reactive relational aggression. Control variables explained 2% of the variance in
Peer reported reactive relational aggression and this association was not significant, R2
= .02,
F(3, 103) = 0.69, p = .56. The inclusion of EF and ToM skills into the model did not
significantly increase understanding of reactive relational aggression, ΔR2
= .06, ΔF(6, 94) =
0.97, p = .45.
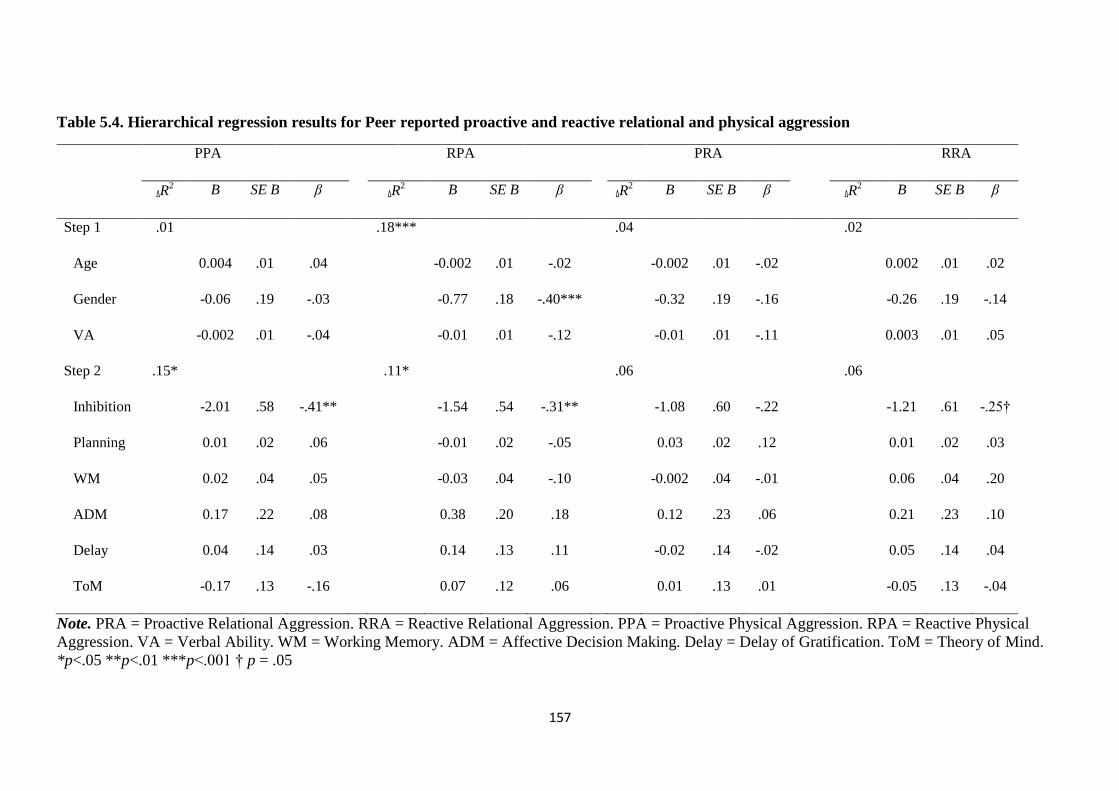
157
Table 5.4. Hierarchical regression results for Peer reported proactive and reactive relational and physical aggression
PPA RPA PRA RRA
ΔR2 B SE B β ΔR
2 B SE B β ΔR2 B SE B β
ΔR
2 B SE B β
Step 1 .01 .18*** .04 .02
Age 0.004 .01 .04 -0.002 .01 -.02 -0.002 .01 -.02 0.002 .01 .02
Gender -0.06 .19 -.03 -0.77 .18 -.40*** -0.32 .19 -.16 -0.26 .19 -.14
VA -0.002 .01 -.04 -0.01 .01 -.12 -0.01 .01 -.11 0.003 .01 .05
Step 2 .15* .11* .06 .06
Inhibition -2.01 .58 -.41** -1.54 .54 -.31** -1.08 .60 -.22 -1.21 .61 -.25†
Planning 0.01 .02 .06 -0.01 .02 -.05 0.03 .02 .12 0.01 .02 .03
WM 0.02 .04 .05 -0.03 .04 -.10 -0.002 .04 -.01 0.06 .04 .20
ADM 0.17 .22 .08 0.38 .20 .18 0.12 .23 .06 0.21 .23 .10
Delay 0.04 .14 .03 0.14 .13 .11 -0.02 .14 -.02 0.05 .14 .04
ToM -0.17 .13 -.16 0.07 .12 .06 0.01 .13 .01 -0.05 .13 -.04
Note. PRA = Proactive Relational Aggression. RRA = Reactive Relational Aggression. PPA = Proactive Physical Aggression. RPA = Reactive Physical
Aggression. VA = Verbal Ability. WM = Working Memory. ADM = Affective Decision Making. Delay = Delay of Gratification. ToM = Theory of Mind.
*p<.05 **p<.01 ***p<.001 † p = .05

158
5.4.2.3. Teacher Reported Prosocial Behaviour
Child factors accounted for 7% of the variance in Teacher reported prosocial
behaviour, but this relation was not significant, R2
= .07, F(3, 103) = 2.41, p = .07. Adding EF
and ToM into the model did not significantly increase the amount of variance accounted for,
ΔR2
= .07, ΔF(6, 94) = 1.21, p = .31. Full regression results for Teacher reported prosocial
behaviour are presented in Table 5.5.
5.4.2.4. Peer Reported Prosocial Behaviour
Child factors significantly explained 7% of the variance in Peer reported prosocial
behaviour, R2
= .07, F(3, 103) = 3.37, p = .02. The inclusion of EF and ToM into the model
did not significantly increase the amount of variance accounted for, ΔR2
= .06, ΔF(6, 94) = 1.12,
p = .35. Full regression results for Peer reported prosocial behaviour are presented in Table
5.5.
5.4.2.5. Summary
When the simultaneous role of EF and ToM in early childhood aggression was
examined, it was found that EF and ToM were associated with proactive and reactive
physical, but not relational, aggression reported by Teachers and Peers. Inhibition appeared to
be central to physical aggression. Children with poorer inhibition were rated as higher in
Teacher and Peer reported proactive and reactive physical aggression. However, affective
decision making was a positive independent predictor of Teacher reported proactive physical
aggression only, suggesting children with greater decision making skills were rated higher in
proactive physical aggression by their Teachers. ToM was not independently predictive of
Teacher or Peer reported aggression. Prosocial behaviour, rated by Teachers and Peers, was
not significantly predicted by children’s EF and ToM.
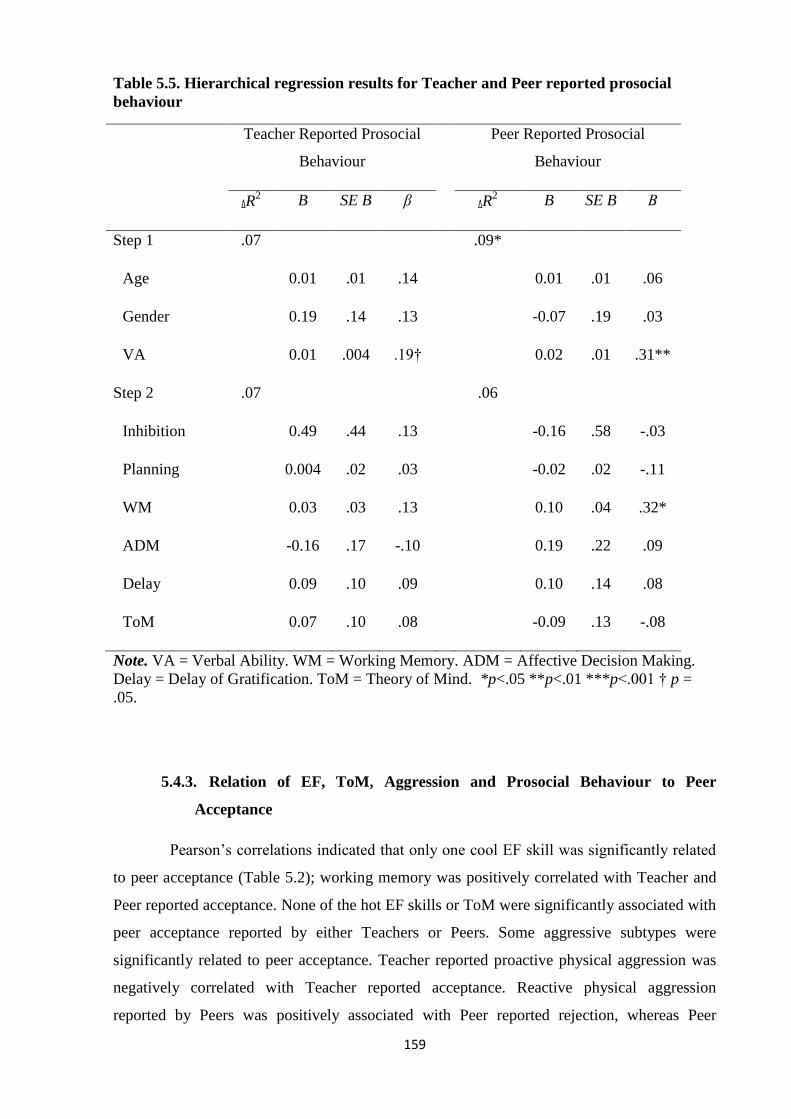
159
Table 5.5. Hierarchical regression results for Teacher and Peer reported prosocial
behaviour
Teacher Reported Prosocial
Behaviour
Peer Reported Prosocial
Behaviour
ΔR2 B SE B β ΔR
2 B SE B Β
Step 1 .07 .09*
Age 0.01 .01 .14 0.01 .01 .06
Gender 0.19 .14 .13 -0.07 .19 .03
VA 0.01 .004 .19† 0.02 .01 .31**
Step 2 .07 .06
Inhibition 0.49 .44 .13 -0.16 .58 -.03
Planning 0.004 .02 .03 -0.02 .02 -.11
WM 0.03 .03 .13 0.10 .04 .32*
ADM -0.16 .17 -.10 0.19 .22 .09
Delay 0.09 .10 .09 0.10 .14 .08
ToM 0.07 .10 .08 -0.09 .13 -.08
Note. VA = Verbal Ability. WM = Working Memory. ADM = Affective Decision Making.
Delay = Delay of Gratification. ToM = Theory of Mind. *p<.05 **p<.01 ***p<.001 † p =
.05.
5.4.3. Relation of EF, ToM, Aggression and Prosocial Behaviour to Peer
Acceptance
Pearson’s correlations indicated that only one cool EF skill was significantly related
to peer acceptance (Table 5.2); working memory was positively correlated with Teacher and
Peer reported acceptance. None of the hot EF skills or ToM were significantly associated with
peer acceptance reported by either Teachers or Peers. Some aggressive subtypes were
significantly related to peer acceptance. Teacher reported proactive physical aggression was
negatively correlated with Teacher reported acceptance. Reactive physical aggression
reported by Peers was positively associated with Peer reported rejection, whereas Peer

160
reported reactive relational aggression was positively correlated with Peer reported
acceptance.
Hierarchical multiple regressions were carried out to examine the role of cognitive
abilities in Teacher and Peer reported acceptance. In step one, child age, gender and verbal
ability were entered to control for confounding effects. Then in step two, cool and hot EF
skills and ToM were entered simultaneously as these variables are highly related (Devine &
Hughes, 2014) and in the final step prosocial behaviour and aggression were entered.
Aggressive behaviour was entered after EF and ToM because EF and ToM have been found
to predict aggressive behaviour (Sharp, 2008; Utendale et al., 2011) and peer acceptance
(Jacobson et al., 2011; Masten et al., 2012). The role of the function and form of aggression in
peer acceptance, however, has yet to be investigated. The unique contribution of aggressive
subtypes, after controlling for the more established predictors of EF and ToM, to peer
acceptance could therefore be explored.
Teacher reported subtypes of aggression evidenced significant positive correlations
(Table 5.2). In particular, relational forms of aggression were highly positively related (.95)
and so were physical forms (.91). Due to the magnitude of these correlations the assumption
of multicolinearity was violated when these subtypes of aggression were entered together as
predictors of peer acceptance. In order to address this issue, functional subtypes were
collapsed to form physical and relational aggression variables. Teacher reported physical and
relational aggression were significantly and positively correlated (r = .63, p < .001), but the
magnitude of the correlation was reduced and the assumption of multicolinearity was no
longer violated. VIF and tolerance values were within the accepted range (J. Cohen et al.,
2003; Kelley & Maxwell, 2010). For regressions based on Teacher reports, aggression
predictors included physical and relational aggression. Peer reported subtypes of aggression
were moderately correlated (.29 - .44; Table 5.2), but the assumption of multicolinearity was
not violated in Peer reported regressions. For regression based on Peer reports, the function
and form of aggression were therefore included.
For Teacher reported peer acceptance the Durbin-Watson value was 1.97 and for
Peer reported acceptance and rejection the values were 1.93 and 2.26, respectively. These
values fall between the lower limit of 1.37 and the upper limit of 2.5, meaning that the
assumption of independent errors was met (Savin & White, 1977; Wang & Jain, 2003). P-P
plots of standardised residuals indicated that the assumption of normally distributed errors
was met (J. Cohen et al., 2003; Kelley & Maxwell, 2010). Added to this, zpred vs. zresid plots
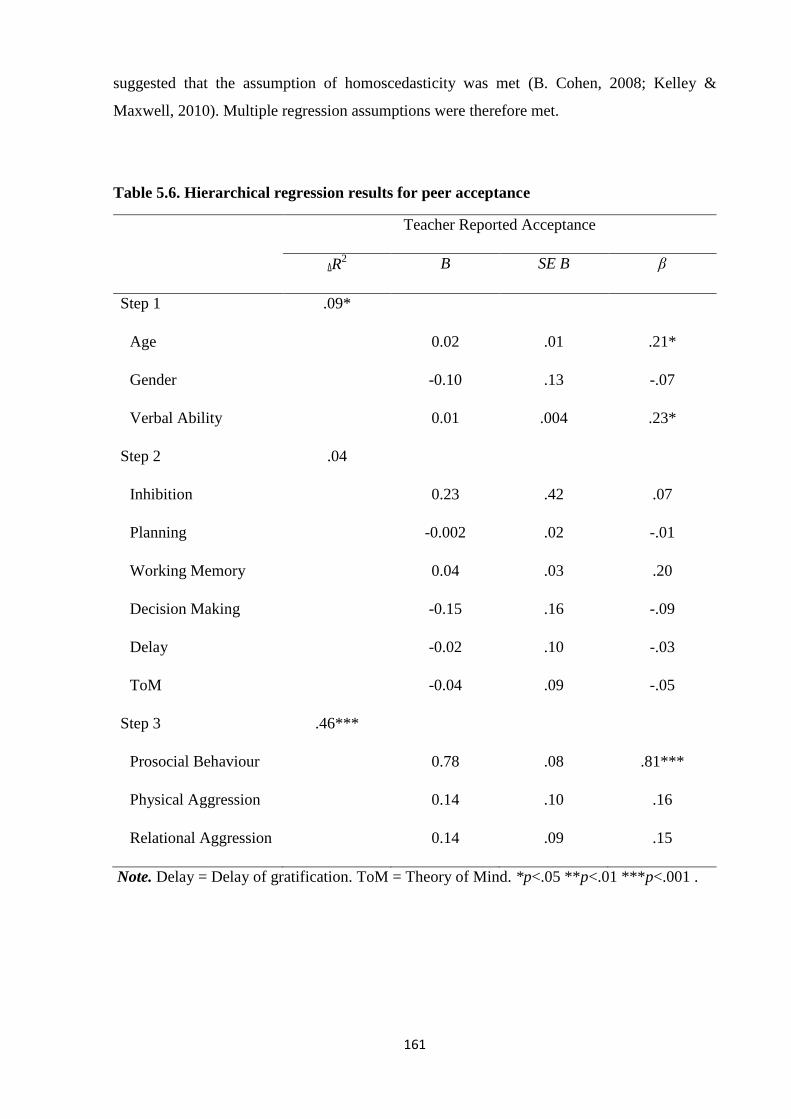
161
suggested that the assumption of homoscedasticity was met (B. Cohen, 2008; Kelley &
Maxwell, 2010). Multiple regression assumptions were therefore met.
Table 5.6. Hierarchical regression results for peer acceptance
Teacher Reported Acceptance
ΔR2 B SE B β
Step 1 .09*
Age 0.02 .01 .21*
Gender -0.10 .13 -.07
Verbal Ability 0.01 .004 .23*
Step 2 .04
Inhibition 0.23 .42 .07
Planning -0.002 .02 -.01
Working Memory 0.04 .03 .20
Decision Making -0.15 .16 -.09
Delay -0.02 .10 -.03
ToM -0.04 .09 -.05
Step 3 .46***
Prosocial Behaviour 0.78 .08 .81***
Physical Aggression 0.14 .10 .16
Relational Aggression 0.14 .09 .15
Note. Delay = Delay of gratification. ToM = Theory of Mind. *p<.05 **p<.01 ***p<.001 .
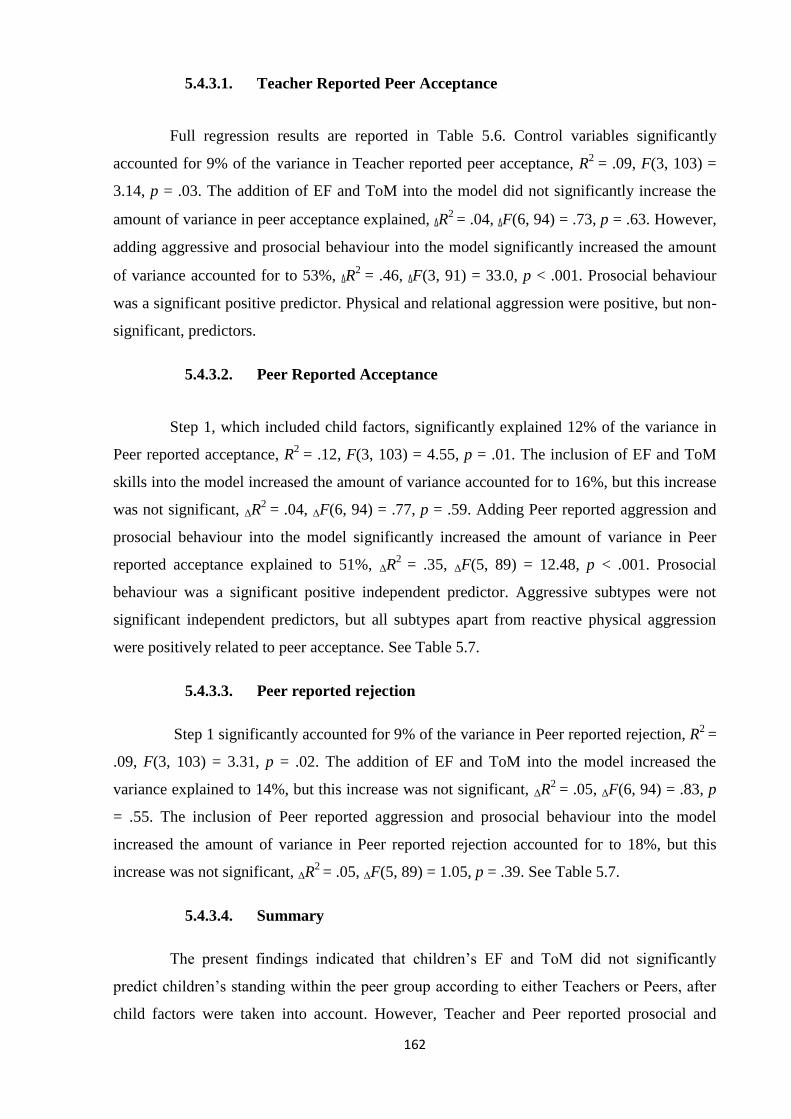
162
5.4.3.1. Teacher Reported Peer Acceptance
Full regression results are reported in Table 5.6. Control variables significantly
accounted for 9% of the variance in Teacher reported peer acceptance, R2
= .09, F(3, 103) =
3.14, p = .03. The addition of EF and ToM into the model did not significantly increase the
amount of variance in peer acceptance explained, ΔR2
= .04, ΔF(6, 94) = .73, p = .63. However,
adding aggressive and prosocial behaviour into the model significantly increased the amount
of variance accounted for to 53%, ΔR2
= .46, ΔF(3, 91) = 33.0, p < .001. Prosocial behaviour
was a significant positive predictor. Physical and relational aggression were positive, but non-
significant, predictors.
5.4.3.2. Peer Reported Acceptance
Step 1, which included child factors, significantly explained 12% of the variance in
Peer reported acceptance, R2
= .12, F(3, 103) = 4.55, p = .01. The inclusion of EF and ToM
skills into the model increased the amount of variance accounted for to 16%, but this increase
was not significant, ΔR2
= .04, ΔF(6, 94) = .77, p = .59. Adding Peer reported aggression and
prosocial behaviour into the model significantly increased the amount of variance in Peer
reported acceptance explained to 51%, ΔR2
= .35, ΔF(5, 89) = 12.48, p < .001. Prosocial
behaviour was a significant positive independent predictor. Aggressive subtypes were not
significant independent predictors, but all subtypes apart from reactive physical aggression
were positively related to peer acceptance. See Table 5.7.
5.4.3.3. Peer reported rejection
Step 1 significantly accounted for 9% of the variance in Peer reported rejection, R2
=
.09, F(3, 103) = 3.31, p = .02. The addition of EF and ToM into the model increased the
variance explained to 14%, but this increase was not significant, ΔR2
= .05, ΔF(6, 94) = .83, p
= .55. The inclusion of Peer reported aggression and prosocial behaviour into the model
increased the amount of variance in Peer reported rejection accounted for to 18%, but this
increase was not significant, ΔR2
= .05, ΔF(5, 89) = 1.05, p = .39. See Table 5.7.
5.4.3.4. Summary
The present findings indicated that children’s EF and ToM did not significantly
predict children’s standing within the peer group according to either Teachers or Peers, after
child factors were taken into account. However, Teacher and Peer reported prosocial and

163
aggressive behaviour was significantly associated with peer acceptance. In particular, children
who were more prosocial experienced greater peer acceptance than children who were less
prosocial. Prosocial and aggressive behaviour reported by Peers was not significantly
predictive of Peer reported rejection.
Table 5.7. Hierarchical regression results for Peer reported acceptance and rejection
Peer Reported
Acceptance
Peer Reported
Rejection
ΔR2 B SE
B
β ΔR2 B SE B β
Step 1 .12** .09*
Age 0.01 .01 .11 0.003 .01 .03
Gender -0.14 .18 -.07 -0.44 .19 -.23*
Verbal Ability 0.02 .01 .34** 0.01 .01 .20*
Step 2 .04 .05
Inhibition -0.10 .58 -.02 -0.61 .59 -.12
Planning -0.02 .02 -.08 0.02 .02 .09
Working Memory 0.07 .04 .23 0.01 .04 .03
Decision Making 0.24 .22 .11 0.10 .22 .05
Delay 0.07 .14 .06 -0.09 .14 -.07
ToM 0.04 .13 .04 0.17 .13 .16
Step 3 .35*** .05
Prosocial
Behaviour
0.56 .09 .56*** 0.01 .11 .01
PRA -0.01 .10 -.01 0.25 .13 .25
RRA 0.12 .09 .12 0.001 .12 .001
PPA 0.02 .09 .02 -0.05 .12 -.05
RPA 0.10 .09 .10 0.03 .11 .03
Note. PRA = Proactive Relational Aggression. RRA = Reactive Relational Aggression. PPA
= Proactive Physical Aggression. RPA = Reactive Physical Aggression. Delay = Delay pf
Gratification. ToM = Theory of Mind. *p<.05 **p<.01 ***p<.001.

164
5.5. Discussion
The study presented in this chapter expanded on the first study (Chapter 4) by
examining the simultaneous role of EF and ToM in early aggression and prosocial behaviour
in order to better understand how these cognitive abilities work together in the development
of aggressive and prosocial behaviour. The current findings revealed that EF, including cool
and hot skills, and ToM were predictive of proactive and reactive physical, but not relational,
aggression reported by both Teachers and Peers. Inhibition (cool EF) appeared to be
particularly important to physical forms of aggression, whereas affective decision making (hot
EF) was central to proactive, but not reactive, physical aggression. EF and ToM, though, were
not predictive of prosocial behaviour in early childhood reported by Teachers or Peers. This
study further added to the first study by investigating the associations among EF, ToM,
aggression, prosocial behaviour and peer acceptance, meaning the differing profile of
subtypes of aggression could be better understood. The findings indicated that prosocial and
aggressive behaviour, but not EF and ToM, were related to Teacher and Peer reported
acceptance. Prosocial behaviour was particularly important to peer acceptance. Neither EF,
ToM, aggression nor prosocial behaviour were related to Peer reported rejection.
In line with previous research (Gini, 2006; Sharp, 2008; Utendale et al., 2011), the
current study suggested that EF and ToM are related to Teacher and Peer reported aggression.
However, cognitive abilities were not associated with aggression broadly, but related to
physical and not relational forms of aggression. This adds to studies which have found that EF
and ToM are related to physical aggression only (Dane & Marini, 2014; Terranova et al.,
2008; Werner et al., 2006), by suggesting that this pattern may also be evident in early
childhood, irrespective of function. Inhibition was an independent negative predictor of
physical aggression reported by Teachers and Peers, suggesting it may be central to early
physical aggression. Physical aggression may be more strongly associated with inhibition than
relational aggression because withholding a physically aggressive act (unlike withholding a
relationally aggressive act) involves inhibiting a behavioural act and may therefore rely on
greater control over one’s body and actions. In contrast to previous studies (Rathert et al.,
2011; White et al., 2012), however, this relation is evident for reactive and proactive physical
aggression. During early childhood, inhibition may be related to physical aggression
irrespective of the underlying motivation for the aggression because at this age aggression
tends to be more direct or face to face (Björkqvist et al., 1992). With the transition to middle
childhood, indirect aggression (aggression occurring behind the victim’s back) increases and
therefore the underlying cognitive processes of aggression may change during later childhood.

165
Superior EF and ToM, for example, may be associated with indirect aggression as indirect
aggression requires greater understanding of how to manipulate social networks and more
delayed rewards than direct aggression (Heilbron & Prinstein, 2008).
The present study considered the role of both cool and hot EF skills in children’s
aggression. Cool and hot domains of EF were associated with physical aggression, adding to
previous studies (Di Norcia et al., 2015; Garner & Waajid, 2012; Kim et al., 2014) by
suggesting that cool and hot EF processes are related to specific types of aggression in early
childhood. This finding does not support Willoughby et al. (2011), who failed to find a
relation between hot EF skills and aggression in young children. However, the mean rate of
aggression in Willoughby et al.’s study was low and they also failed to find an association
between cool EF and aggression. Added to this, the current findings partially contradicted the
results of the first study (Poland et al., 2016; Study 1, Chapter 4) which failed to find an
association between hot EF components and aggression. Cool and hot EF were treated as
distinct domains of EF in the first study as the aim was to examine whether hot EF
contributed to subtypes of aggression above that of cool EF. In the present study, in contrast,
cool and hot EF processes were considered together as their joint role, along with ToM, in
subtypes of aggression was of interest. EF undergoes rapid development during early
childhood (P. Anderson, 2002) and as a result distinct cool and hot domains of EF may not be
discernible in early childhood. EF may therefore be broadly related to aggression, but hot EF
skills may not contribute to aggression beyond that of cool EF processes. In line with this
argument, study one revealed that delay of gratification (a hot EF skill) was significantly
correlated with proactive and reactive physical aggression reported by Teachers, but when
cool EF was taken into account this relation was no longer significant. Though, in line with
study one, hot EF skills showed limited associations with aggression. An important focus for
future research is to explore longitudinally whether there is evidence to support distinct cool
and hot EF subcomponents and their relation to childhood aggression. This will be explored
in Chapter Seven.
Affective decision making, an aspect of hot EF, was an independent positive
predictor of Teacher reported proactive physical aggression only. Children who were highly
proactively physically aggressive demonstrated greater affective decision making skills.
Greater decision making under emotionally significant conditions may better enable children
to process the rewards and losses associated with using physical aggression to achieve a goal
(Zelazo & Müller, 2002; Zelazo et al., 2005). While reactive aggression has been linked to
cool EF (Rathert et al., 2011; White et al., 2012), proactive aggression may be associated with

166
affective decision making because it involves more motivationally significant and tangible
rewards (e.g. obtaining a desired toy) than reactive aggression (e.g. relieving frustration of
being pushed by a peer) and may thus tap hot EF to a greater extent. Proactively aggressive
children appear to be weighing up the costs and benefits of using aggression and choosing
aggression as the best means of achieving their desired goal. Proactive aggression is thought
to be related to the fact that children learn aggression is a viable means of achieving a goal
(Dodge, 1991). Proactively aggressive children may therefore have experienced prior success
in using aggression and may consequently evaluate it as an effective means of obtaining a
goal.
Affective decision making, however, was not a significant independent predictor of
Peer reported proactive physical aggression. Peers may be nominating children who use
aggression in an attempt to get what they want, without considering whether or not these
children are successful. Teachers, on the other hand, may be rating children as higher in
proactive physical aggression if they use physical aggression effectively as a means of getting
what they want. Instances of effective proactive physical aggression may be more often
reported to Teachers, whereas unsuccessful uses of proactive physical aggression may not be
as commonly reported by victims or peers. This has not been directly investigated, but
children's physical aggression has been found to be associated with their social information
processing and in particular the generation of strategies to competently deal with peer conflict
(Werner et al., 2006). Physically aggressive children were less likely to select affiliative,
passive strategies as appropriate and aggressive strategies as inappropriate responses to a peer
ruining their work. An alternative explanation may be that Teachers are only aware of those
children who use proactive physical aggression frequently, so are perhaps at the more extreme
end, whereas peers may be more aware of what is going on within the peer group and so
nominate all children who engage in proactive physical aggression, even if they only do so
occasionally. Understanding the rewards and losses children associate with proactive
aggression and whether or not children who attempt to use physical aggression to achieve a
desired goal are successful or not would further increase knowledge of the relation between
affective decision making and aggression. Additionally, further research attempting to
understand the ways in which Teachers and Peer are rating aggression would be beneficial to
explanations of the varying findings across informants.
Interestingly, despite EF and ToM being jointly associated with early physical
aggression, ToM was not independently related to aggression reported by Teachers or Peers.
Previous studies have typically found a relation between ToM and aggression in older
167
children and adolescents (Lonigro et al., 2013), but not in young children (Monks et al.,
2005). In early childhood EF, especially inhibition, may be central to aggression as children's
EF is undergoing substantial development (P. Anderson, 2008) and children are likely to start
having their first involvement with peer groups which is going to involve learning to regulate
behaviour. Furthermore, it has been argued that a certain level of EF is required for a ToM to
emerge (Carlson & Mandell, 2004). ToM may consequently not be associated with early
childhood aggression when EF is taken into account. Indeed, this is supported by the finding
that ToM was positively correlated with Teacher reported physical aggression, but when EF
and ToM were considered together ToM was no longer independently related to physical
aggression. ToM may become more central to aggression in later childhood as it continues to
develop and as children's EF has reached greater maturity.
According to the current study, EF and ToM did not predict prosocial behaviour
reported by either Teachers or Peers in early childhood, in contrast to previous studies (Caputi
et al., 2012; Eggum et al., 2011). Studies which have found a relation between ToM and
prosocial behaviour have considered a broad range of ToM abilities, including understanding
of emotions and deception, whereas the present study assessed only false-belief
understanding. It is possible that not all domains of ToM may be implicated in prosocial
behaviour. Prosocial and aggressive behaviour, however, did significantly predict peer
acceptance. In line with previous research (Sandstrom & Cillessen, 2006), highly prosocial
children were rated by Teachers and Peers as more accepted within the peer group. Prosocial
children may experience more positive interactions with their peers and may use more
affiliative negotiation techniques when experiencing conflict with their peers (Zsolnai et al.,
2012), which may result in greater acceptance within the peer group.
Unlike prosocial behaviour, Teacher and Peer reported aggression was not
independently related to peer acceptance. However, it is interesting to note that correlational
analyses revealed that Teacher reported physical and relational aggression as well as Peer
reported proactive and reactive physical and reactive relational aggression were positively
related to peer acceptance, suggesting not all aggressive children may be subject to low peer
acceptance. Recent research into defending and peer acceptance has found that children who
are demonstrating aggression in defence of a peer (similar to defender-stop behaviour, which
involves direct confrontation of aggressors) may be well liked by their peers (Lee, Smith, &
Monks, 2015). This finding needs to be interpreted with caution as Teacher and Peer reported
aggression were not independently significant predictors. Peer reported prosocial behaviour
and aggression did not significantly predict Peer reported rejection. Peer acceptance and

168
rejection have been found to be distinct concepts (Véronneau et al., 2010) and consequently
different underlying factors may be associated with acceptance and rejection.
In contrast to previous work (Holmes et al., 2015; Masten et al., 2012), children's EF
and ToM skills were unrelated to peer acceptance and rejection reported by Teachers and
Peers in early childhood. The link between children's cognitive abilities and their standing
within the peer group may not be straightforward. Children who are rejected by their peers
may be less able to access social settings which promote the development of EF and ToM,
which may then exacerbate their low acceptance within the peer group. In line with this,
research has found that experiencing early peer problems can lead to poorer EF in early
childhood, which in turn leads to an increased risk of peer problems in middle childhood and
adolescence (Holmes et al., 2015). An important focus for future research is therefore the
longitudinal relations between cognitive abilities and peer acceptance. This will also be
examined in Chapter Seven.
This study was the first to examine the associations among EF and ToM and the
function and form of aggression, as well as the links between these cognitive abilities,
prosocial and aggressive behaviour and peer acceptance in early childhood. However, larger
scale studies are needed to replicate the present findings. A further limitation of this study
was that there was a high correlation between Teacher reported reactive and proactive
aggression that shared the same form (physical or relational), suggesting that Teachers may
not be differentiating between reactive and proactive aggression at least in early childhood.
This meant that functions of aggression in relation to peer acceptance could not be examined
due to multicolinearity. Functions of aggression may have shed light on the unusual finding
that physical and relational aggression were related to greater peer acceptance. Future
research attention should be dedicated to developing measures of the function and form of
aggression that enable Teachers to more readily differentiate between them. This study was
also limited in that it relied on false-belief understanding as a measure of ToM, which may
only provide a partial picture of the role of ToM in aggression and prosocial behaviour. Other
ToM skills, such as emotion understanding, may be implicated in children’s aggressive
behaviour and peer acceptance. Future research should assess a wider range of ToM skills.
Lastly, this study was carried out at one time point meaning indirect pathways between
cognitive skills, prosocial and aggressive behaviour and peer acceptance could not be
examined. Longitudinal research would increase understanding of the direction and nature of
the relations between cognitive abilities and aggression across early childhood.

169
The study presented in this chapter emphasises the importance of considering the
multidimensional nature of aggression in order to increase understanding of its varied nature.
Early childhood physical aggression (but not relational aggression) was predicted by EF and
ToM, suggesting that the specific cognitive processes underlying aggression may vary
depending on its function and form in early childhood. A finding which held for both Teacher
and Peer reported aggression. This study further highlights the importance of considering the
role of simultaneous EF and ToM skills in order to understand their joint contribution to
aggression and prosocial behaviour. Identifying not just the correlates but also the outcomes
of aggressive and prosocial behaviour is also important. The intersection of cognitive abilities,
aggression, prosocial behaviour and peer acceptance is a valuable topic that warrants further
investigation as understanding the types of aggression children are using and how they
interact with cognition and peer acceptance across development may help to improve
intervention efforts and subsequently the outcomes for children who are demonstrating
aggressive behaviours or are rejected by their peers.
This study represents a first step towards understanding the complex relations
between children's cognitive abilities, aggressive and prosocial behaviour and peer acceptance
during early childhood. This study, though, was carried out at a single time point, meaning
that longitudinal links between these domains could not be examined. Early childhood
represents an important period for both cognitive and social development. Rapid gains in EF
and ToM are evident between 3- and 5-years-of-age (P. Anderson, 2008; Wellman et al.,
2001) and children begin to interact with a peer group. The nature of the relation between EF,
ToM, aggression, prosocial behaviour and peer acceptance may consequently change across
early childhood reflecting developmental changes in the cognitive and social domain. Before
attempting to identify the links between these cognitive abilities, social behaviours and peer
acceptance, it would be valuable to first explore the relation between cool and hot EF skills
and ToM. EF and ToM are thought to be functionally dependent, with EF being necessary for
the development of ToM (Carlson & Mandell, 2004; Hughes & Ensor, 2007; J. Russell,
1996). Understanding how cool and hot EF and ToM develop over early childhood and the
predictive relations between EF and ToM may provide important insights into typical and
atypical cognitive development and how these abilities may work together to influence the
genesis and development of aggressive and prosocial behaviour across early childhood. This
is the focus of the third study.

170
6. STUDY 3: DEVELOPMENT OF COOL AND HOT EXECUTIVE
FUNCTION AND THEORY OF MIND ACROSS EARLY
CHILDHOOD
Abstract
Objective: EF and ToM are two highly related cognitive abilities that undergo rapid
development during early childhood. In comparison to cool EF, however, understanding of
the development of hot EF and its relation to both cool EF and ToM is limited. Both EF and
ToM have been proposed to be fundamental to social behaviours, like aggression and
prosocial behaviour, so understanding how these cognitive abilities develop and work
together will inform theories of social development. The study presented in this chapter
therefore aimed to build on studies one and two by examining the development of cool and
hot domains of EF and ToM and exploring the longitudinal associations between these
cognitive abilities during an important period in cognitive development, early childhood.
Method: 106 typically developing children were followed for 12 months. Children were
assigned to a cohort based on their age at the first assessment: 4-year-old (M = 50.41 months,
SD = 2.76 months, N = 29), 5-year-old (= 58.89 months, SD = 3.09 months, N = 41) and 6-
year-old (M = 73.22 months, SD = 4.20 months, N = 36) cohort. Children completed a range
of EF and ToM tasks at three time points approximately 6 months apart.
Results: The findings revealed that between 4- and 7-years-of-age there was significant
improvement in performance on measures of cool EF skills (working memory, planning and
response time), hot EF skills (affective decision making and delay of gratification) and ToM
(first- and second-order false belief understanding). However, no improvement in inhibition
or planning errors was observed. Cool EF skills were positively correlated at each of the three
time points, but hot EF skills were not related at any of the time points. Only one domain of
hot EF (delay of gratification) was associated with cool EF. Added to this, EF and ToM were
positively related. Early EF (planning and delay of gratification) predicted later ToM, but
early ToM did not predict later EF.
Conclusion: The findings expand on previous studies which have found that children’s EF
and ToM undergo important development during early childhood, by indicating that both cool
and hot domains of EF undergo substantial development across early childhood. Although
cool EF skills were correlated across early childhood, hot EF skills were not associated,
suggesting that delay of gratification and affective decision making may not be tapping the

171
same underlying construct. Added to this, early cool and hot EF processes appear to provide a
platform for the development of ToM.
Adapted for publication: O'Toole, S. E., Monks, C. P., Tsermentseli, S. (in prep). The
organisation and development of cool and hot executive function across early childhood.
Journal of Experimental Child Psychology.
This paper includes a subset of the sample from the thesis, children initially aged between 4-
and 6-years-old. The paper focuses on the association between core cool and hot EF measures
across early childhood and their links to ToM. The chapter presented in this thesis includes
additional EF variables: response time and planning errors.
172
6.1. Chapter Overview
Study three is presented in this chapter. Study three examines the development of
cool and hot EF and ToM across early childhood, as well as the predictive relations between
EF and ToM. The study presented in this chapter adds to the results of the first two studies as
it attempts to elucidate the development of hot EF, which is currently poorly understood, and
its relation to cool EF and ToM. Gaining a greater understanding of the executive processes
that fall under the umbrella of hot EF and how these relate to other cognitive abilities may
provide important insights into the organisation and development of fundamental cognitive
abilities across early childhood. This may inform theoretical models of EF as well as current
understanding of typical and atypical cognitive development which may increase
understanding of how these cognitive abilities may be related to social behaviours, such as
aggression and prosocial behaviour.
6.2. Introduction
Children's emerging EF and ToM abilities have been posited to be fundamental to
their developing social behaviour and peer interactions (Beauchamp & V. Anderson, 2010;
Yeates et al., 2007). Studies one (Chapter 4) and two (Chapter 5) of this thesis indicated that
EF and ToM may be particularly important in young children's aggression and that the role of
these cognitive abilities in aggression may vary when they are considered simultaneously.
Early childhood is an important period in children's cognitive development as substantial
gains in EF are demonstrated between 3- and 6-years-of-age (Best & P. Miller, 2010; Brocki
& Bohlin, 2004; Garon et al., 2008; Senn et al., 2004) and it is around 4- to 5-years-of-age
that children begin to appreciate false beliefs (Kaysili, 2011; Wellman et al., 2001). Further,
the emergence of EF is thought to provide a platform for the development of ToM (Carlson,
Claxton, & Moses, 2013). These developmental changes in EF and ToM may influence the
relation of these cognitive abilities to social behaviours. The objective of the present study
therefore was to examine the nature of the change and the relation between cool and hot EF
and ToM abilities across early childhood. Understanding the relation between cool and hot EF
and ToM may have important implications not just for current theories of cognitive
development but also for understanding of how cool and hot EF and ToM may work together
to influence social behaviour development.
The study presented in this chapter had three mains aims as part of the overall
objective. Firstly, this study aimed to compare the development of the hot EF skills delay of
173
gratification and affective decision making to one another and to cool EF skills (inhibition,
planning and working memory) across early childhood. Understanding of the organisation and
development of hot EF lags behind that of cool EF (Peterson & Welsh, 2014; Zelazo &
Müller, 2002). Delay of gratification in childhood is one of the most widely researched hot EF
skills and there is strong evidence that delay of gratification improves during early childhood
(Carlson, Claxton, & Moses, 2013; Carlson & Moses, 2001). Research exploring the
development of other hot EF skills, such as affective decision making, during early childhood
is limited. There is some evidence that affective decision making may also show advances in
early childhood, but that development may be more protracted (Heilman et al., 2009;
Hongwanishkul et al., 2005; Kerr & Zelazo, 2004; Schiebener et al., 2015). Not all hot EF
skills may therefore follow the same trajectory.
To gain a greater understanding of the development of EF, this study further aimed to
explore the longitudinal relations between cool and hot EF skills across early childhood. The
degree to which cool and hot EF represent distinct or overlapping constructs is debated (Allan
& Lonigan, 2014; Kim et al., 2014; Masten et al., 2012; Willoughby et al., 2011). The hot EF
skills delay of gratification and affective decision making have been found to be negatively
correlated, but affective decision making (and not delay of gratification) has been found to be
positively correlated with the cool EF skill working memory (Carlson, Moses, & Breton,
2002; Hongwanishkul et al., 2005). These studies, though, have examined the association
between cool and hot EF at one time point. Due to the rapid gains in EF observed during early
childhood, the relation between cool and hot EF skills may change as children develop, which
may have implications for current models of EF.
The third main aim of this study was to investigate the relation between EF,
including cool and hot domains, and ToM across early childhood. There is a strong body of
evidence that EF provides a platform for the emergence of ToM (Carlson & Mandell, 2004;
Hughes & Ensor, 2007). ToM, however, may be more strongly associated with hot EF than
cool EF (Zelazo et al., 2005). Imaging and lesion studies have indicated that both hot EF and
ToM involve activation of the medial PFC (Siegal & Varley, 2002). Though, findings
regarding the relation between hot EF skills and ToM have been mixed. While some studies
have found that delay of gratification at 2-years-old predicted ToM at 3-years-old (Carlson &
Mandell, 2004), other studies have found that delay of gratification is not related to ToM
when inhibition is taken into account (Carlson et al., 2013, 2002; Carlson & Moses, 2001).
The role of other hot EF skills, such as affective decision making, in ToM has yet to be
174
explored. Examining the relation between ToM and a broader range of hot EF skills may shed
light on the EF-ToM relation.
The study presented in this chapter examined the developmental associations
between cool and hot EF and ToM in a sample of 4-, 5- and 6-year-olds across three time
points over the course of a year. The present study focused on early childhood as this is a
sensitive period in which EF and ToM ungergo rapid advancement (P. Anderson, 2008;
Wellman et al., 2001). Gender differences in EF and ToM were also examined as previous
research has resulted in mixed findings as to whether girls outperform boys on measures of
EF and ToM (Carlson & Moses, 2001; Carlson & Mandell, 2004; Devine & Hughes, 2013;
Hughes & Dunn, 1998; Mathieson & Banerjee, 2011; Schiebener, García-Arias, García-
Villamisar, Cabanyes-Truffino, & Brand, 2015). This study will therefore build on studies one
(Chapter 4) and two (Chapter 5) as understanding the early typical development of EF and
ToM will inform theories of how these cognitive abilities work together to influence
pathways of social behaviour development.
It was hypothesised that due to rapid progress in children's cognitive abilities during
early childhood (P. Anderson, 2008; Wellman et al., 2001), that cool and hot EF and ToM
would show improvement across the three time points. Furthermore, it was hypothesised that
there would be a significant difference between cohorts on cognitive abilities. Older cohorts
were predicted to perform better on measures of EF and ToM compared to younger cohorts.
Added to this, based on research which has suggested that EF and ToM are related (Devine &
Hughes, 2014), it was hypothesised that both cool and hot EF domains would be associated
with ToM. It was also predicted that early EF would predict later ToM, but that the reverse
would not be true.
6.3. Method
In this section the methodology used in the present study is briefly outlined. A more
detailed description of the method is presented in Chapter Three.
6.3.1. Design
A cohort-sequential design was used. Three cohorts of children (4-, 5- and 6-year-old
cohorts) were followed over a 12 month period. Data were collected at three time points;
initial recruitment (Time 1), approximately 6 (Time 2) and 12 months (Time 3) after
recruitment. At each of the time points children's cool and hot EF skills and ToM were

175
assessed. Two child factors were also included to control for confounding effects: gender (boy
= 1, girl = 2), and verbal ability at Time 1.
6.3.2. Participants
One hundred and six children (51 (48.11%) boys and 55 (51.89%) girls) were
selected to participate in the current study. Children were assigned to one of three cohorts
based on their age: 4-year-old (N = 29, M = 50.41 months, SD = 2.76 months, range = 46 – 54
months), 5-year-old (N = 41, M = 58.89 months, SD = 3.09 months, range = 55 – 65 months)
and 6-year-old cohort (N = 36, M = 73.22 months, SD = 4.20 months, range = 66 – 80
months). At initial assessment the children ranged between 46- to 80-months-of-age. The
children were followed up approximately six and 12 months later. At the second time point 99
children were followed up (7% attrition) and at the third time point 98 children were followed
up (1% attrition).
6.3.3. Measures
In this study additional measures of cool and hot EF were included as the present
study focused on the development of EF. Response time, planning errors and latency to first
peek over shoulder and first turn around, and number of times peeked over shoulder and
turned around on the Gift Wrap tasks were also included. These additional measures were
included in this study in order to gain a greater understanding of the development of a range
of cool and hot processes, but were not included in the studies that examined the link between
EF and social outcomes because their relation to other EF skills and to social behaviours were
not consistent and there was not a strong theoretical rationale for their links to social
behaviour. Further, including these measures in the other studies would have resulted in the
number of predictors to participants being high, meaning the the power of the analysis may
have been reduced (Mayers, 2013).
6.3.3.1. Cool EF
Inhibition. Children's inhibition was assessed using a computerised fish and shark
Go/No-Go task (Simpson & Riggs, 2006). The proportion of correct No-Go trials and average
response time on Go trials were used as measure of inhibition.
Planning. The ToL was used to measure children's planning skills (Shallice, 1982).
Children's overall score (ranging from 0 to 24) and number of errors were used to assess
planning.

176
Working Memory. The digit span forward and backwards subtests (WISC-III;
Wechsler, 1991) were used to assess children's working memory. Scores on the forward and
backward subtests were summed to obtain a working memory score.
6.3.3.2. Hot EF
Affective Decision Making. To measure affective decision making children
completed the CDMT (Kerr & Zelazo, 2004). Affective decision making was assessed on
whether predominately advantageous or disadvantageous decisions were made during the last
three trial blocks.
Delay of Gratification. The Gift Delay task was used to assess children's ability to
delay gratification (Kochanska et al., 1996). Children’s overall score (ranging from 0 to 2),
latency to first peek over shoulder and first turn around, and number of times peeked over
shoulder and turned around were used as measures of ability to delay gratification.
6.3.3.3. ToM
False Belief Understanding. ToM was assessed using two first-order false belief
tasks (unexpected contents (Wimmer & Perner, 1983) and change of location (Baron-Cohen
et al., 1985)) and one second-order false belief task (change of location; Riviere, 1997). A
composite ToM score was created. Children scored 1 point for each task they successfully
completed (scores ranged from 0 to 3).
6.3.3.4. Verbal Ability
The BPVS was used to assess children's receptive vocabulary at time one (Dunn,
Whetton, & Pintilie, 1982). Standardised scores according to age were used.
6.3.4. Procedure
Data for the present study was collected between April 2014 and July 2015. There
were three assessment phases, approximately 6 months apart. At each assessment phase
children completed the tasks individually with the researcher in a quiet room at their school.
The tasks were spread over three sessions that each lasted between 20 to 45 minutes. Children
completed the tasks in a fixed order across the three assessment sessions: session 1: BPVS
and CDMT; session 2: ToL, digit span, change of location and Go/No-Go; session 3:
unexpected contents, Riviere change of location and gift wrap.

177
6.3.5. Data Analysis
Analyses were carried out in three stages. First, developmental changes in children's
EF and ToM performance were examined using mixed ANOVAs, following the approach of
Gur et al. (2012) and Röthlisberger et al. (2013). Mixed ANOVAs were carried out because
this technique enables mean changes within and across participants to be examined (Mayers,
2013). The within-subject factor was time (T1, T2, T3), which allowed for change in
cognitive abilities across the duration of the study to be explored. The first between-subject
factor was cohort (4-, 5- and 6-year-old cohort). Differences between cohorts were examined
because the age span of the sample was wide and previous research has suggested that early
childhood may be characterised by rapid change in cognitive abilities (P. Anderson, 2008;
Wellman et al., 2001; Zhan et al., 2010), consequently there may be important differences
between cohorts. The second between-subject factor was gender in order to investigate
whether gender influenced the development of EF and ToM. Gender differences in EF and
ToM were examined as previous research has resulted in mixed findings (Carlson & Moses,
2001; Carlson & Mandell, 2004; Devine & Hughes, 2013; Hughes & Dunn, 1998; Mathieson
& Banerjee, 2011; Schiebener, García-Arias, García-Villamisar, Cabanyes-Truffino, & Brand,
2015). Further, studies one (Chapter 4) and two (Chapter 5) found evidence of gender
differences in some domains of EF. Follow up Pairwise Comparisons were carried out to
examine main effects in more detail. All follow up analyses were adjusted for multiple
comparisons. Unless otherwise stated, a Bonferroni correction was applied.
Next, the association between cognitive abilities across the time points and the
relation between EF and ToM skills at each time point were investigated using Pearson's
correlations. Following this, in line with the approach of Hughes and Ensor (2007),
hierarchical regression analyses were carried out to examine the predictive relations between
EF and ToM. Hierarchical regressions explored whether Time 1 and Time 2 EF predicted
later ToM and whether Time 1 and Time 2 ToM predicted later EF. This approach enabled the
direction of the relation between EF and ToM to be tentatively explored, while controlling for
potential confounding factors such as gender and verbal abiliy.
Before the analysis was conducted, outliers were Winsorized as they may bias the
results (Reifman & Keyton, 2010). Winsorizing is the process of replacing the outlier with the
highest value that is not an outlier. At Time 1 there were two outliers for planning errors. At
Time 2 there were two outliers for inhibition and one outlier for inhibition at Time 3. This
approach was adopted, rather than removing the outliers, because it preserves the information
178
that a case had the highest or lowest value in the distribution but protects against the influence
of the outlier on analyses (Reifman & Keyton, 2010).
6.4. Results
6.4.1. Change in cognitive abilities over early childhood.
Development of children's cognitive abilities across the 12 months and between
cohorts was first examined. For descriptive statistics for cognitive abilities at each time point
for the whole sample and for the three cohorts see Table. 6.1.
Statistical Assumptions. Histograms and Q-Q plots of variables at each time point
were visually inspected to examine the assumption of normality. At Time 1 inhibition,
planning, planning errors, and delay of gratification measures were not normally distributed
and had significant skewness and kurtosis values. At Time 2 and Time 3, the distribution for
inhibition and delay of gratification score showed slight deviation from normality. Number of
times peeking and latency to first peeks were heavily skewed at time 2 and 3, so these
variables were excluded from the analysis. All other variables followed an approximately
normal distribution at each of the time points as well as between groups, with adequate levels
of skewness and kurtosis. The assumption of normality was therefore violated in some
instances. As discussed in Chapter Four, according to central limit theorem when the sample
size is large (as it is in this study) the distribution of sample means is assumed to be normal
and parametric tests can still be used (B. Cohen, 2008; Little, 2013). Added to this, mixed
ANOVA techniques are robust to minor violations of normality (Mayers, 2013).
Further assumptions of mixed ANOVA include the assumption of sphericity
(Mayers, 2013). Sphericity refers to the assumption that there is equal variance across pairs of
within-group conditions and can be examined using Mauchly's test. Mauchly’s test was not
significant for inhibition score (p = .29), working memory (p = .06), planning (p = .99),
planning errors (p = .20), affective decision making (p = .68), delay of gratification (p = .41)
or ToM (p = .77), but was significant for inhibition response time (p = .04). The assumption
of sphericity was therefore met for all cognitive variables apart from inhibition response time.
A Greenhouse-Geisser correction was applied to the mixed ANOVA for inhibition response
time to account for the violation of sphericity. The assumption of homogeneity of between
group variances also needs to be satisfied. This assumption states that variances should be
equal across between-group conditions and can be investigated using Levene’s test as well as
the variance ratio (also known as Hartley's Fmax). Levene's test was significant for inhibition at
Time 1, planning at Time 2, planning errors at Time 3, affective decision making at Time 1
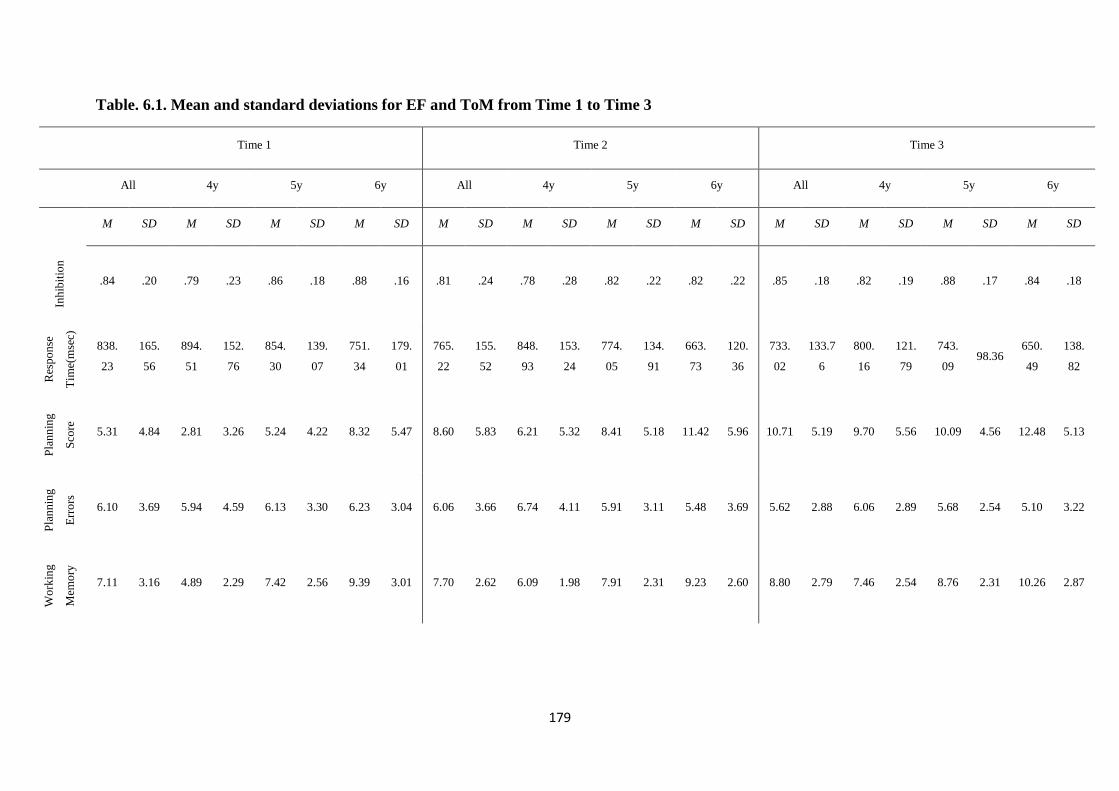
179
Table. 6.1. Mean and standard deviations for EF and ToM from Time 1 to Time 3
Time 1 Time 2 Time 3
All 4y 5y 6y All 4y 5y 6y All 4y 5y 6y
M SD M SD M SD M SD M SD M SD M SD M SD M SD M SD M SD M SD
Inh
ibit
ion
.84 .20 .79 .23 .86 .18 .88 .16 .81 .24 .78 .28 .82 .22 .82 .22 .85 .18 .82 .19 .88 .17 .84 .18
Res
po
nse
Tim
e(m
sec)
838.
23
165.
56
894.
51
152.
76
854.
30
139.
07
751.
34
179.
01
765.
22
155.
52
848.
93
153.
24
774.
05
134.
91
663.
73
120.
36
733.
02
133.7
6
800.
16
121.
79
743.
09 98.36
650.
49
138.
82
Pla
nn
ing
Sco
re
5.31 4.84 2.81 3.26 5.24 4.22 8.32 5.47 8.60 5.83 6.21 5.32 8.41 5.18 11.42 5.96 10.71 5.19 9.70 5.56 10.09 4.56 12.48 5.13
Pla
nn
ing
Err
ors
6.10 3.69 5.94 4.59 6.13 3.30 6.23 3.04 6.06 3.66 6.74 4.11 5.91 3.11 5.48 3.69 5.62 2.88 6.06 2.89 5.68 2.54 5.10 3.22
Wo
rkin
g
Mem
ory
7.11 3.16 4.89 2.29 7.42 2.56 9.39 3.01 7.70 2.62 6.09 1.98 7.91 2.31 9.23 2.60 8.80 2.79 7.46 2.54 8.76 2.31 10.26 2.87
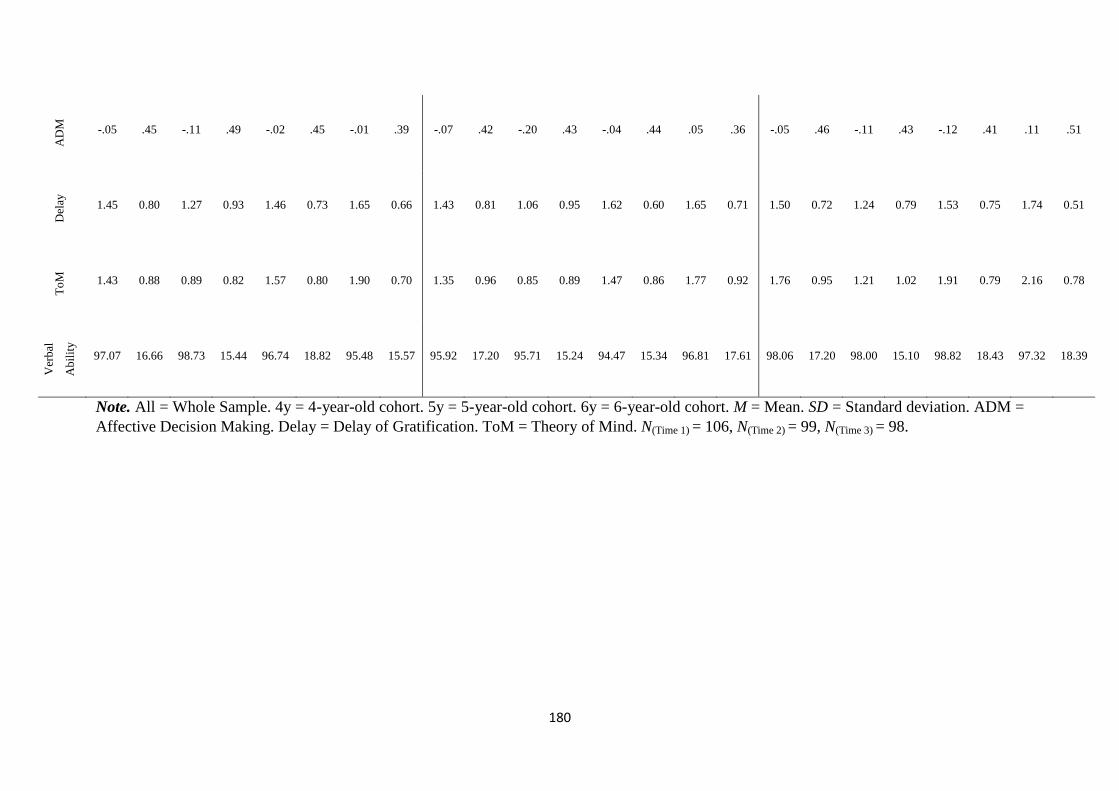
180
AD
M
-.05 .45 -.11 .49 -.02 .45 -.01 .39 -.07 .42 -.20 .43 -.04 .44 .05 .36 -.05 .46 -.11 .43 -.12 .41 .11 .51
Del
ay
1.45 0.80 1.27 0.93 1.46 0.73 1.65 0.66 1.43 0.81 1.06 0.95 1.62 0.60 1.65 0.71 1.50 0.72 1.24 0.79 1.53 0.75 1.74 0.51
To
M
1.43 0.88 0.89 0.82 1.57 0.80 1.90 0.70 1.35 0.96 0.85 0.89 1.47 0.86 1.77 0.92 1.76 0.95 1.21 1.02 1.91 0.79 2.16 0.78
Ver
bal
Ab
ilit
y
97.07 16.66 98.73 15.44 96.74 18.82 95.48 15.57 95.92 17.20 95.71 15.24 94.47 15.34 96.81 17.61 98.06 17.20 98.00 15.10 98.82 18.43 97.32 18.39
Note. All = Whole Sample. 4y = 4-year-old cohort. 5y = 5-year-old cohort. 6y = 6-year-old cohort. M = Mean. SD = Standard deviation. ADM =
Affective Decision Making. Delay = Delay of Gratification. ToM = Theory of Mind. N(Time 1) = 106, N(Time 2) = 99, N(Time 3) = 98.

181
and delay of gratification at Time 1 and 2 (all p < .05). In some instances therefore variances
between groups may be heterogeneous, violating the assumptions of mixed ANOVA.
However, mixed ANOVA is robust against unequal variances between groups when group
sizes are relatively equal (Mayers, 2013; Zimmerman, 2004), so mixed ANOVAs were still
carried out.
Inhibition. Although there were two measures of inhibition: proportion of correct
No-Go trials and average response time on Go-trials, these variables were analysed
separately. This approach was adopted rather than a multivariate approach due to the low
correlation between inhibition score and response time across time points. In order to carry
out a multivariate analysis it is recommended that the dependent variables are moderately
correlated (between .3 and .7 for positive correlations and no greater than -.40 for negative
correlations) (Mayers, 2013). Inhibition score and response time were low to moderately
correlated at Time 1 (r = .24, p = .001), but at Time 2 (r = .18, p = .04) and 3 (r = -.05, p =
.30) the correlation was very low, suggesting that these variables may represent distinct
constructs. Theoretically, inhibition score and response time have often been viewed as
separate aspects of EF. Adopting a multivariate approach to examine a combination of these
variables may therefore not be appropriate; as due to their low correlation a multivariate effect
would not be expected (Mayers, 2013).
To examine whether children's inhibition scores differed across the three time points
and between cohorts a 3(T1, T2, T3) x 3(4-, 5-, 6-year-old-cohort) x 2(boy, girl) mixed
ANOVA was carried out. The mixed ANOVA for inhibition score revealed that there was no
significant main effect of time, F(2, 184) = 1.67, p = .19, ŋp2
= .02, suggesting that there was
no significant change in children's inhibition score across the three time points. There was
also no significant main effect of cohort, F(2, 92) = 0.32, p = .73, ŋp2
= .01. This indicates that
cohorts did not significantly differ on their average inhibition score across the three time
points. There was also no significant interaction between time and cohort, F(4, 184) = 1.46, p
= .22, ŋp2
= .03. There was a significant main effect of gender on inhibition, F(1, 92) = 7.0, p
= .01, ŋp2
= .07. Pairwise comparisons indicated that boys had significantly lower inhibition
scores compared to girls (p = .01), as shown in Figure 6.1. The interaction between cohort and
gender was not significant, F(2, 92) = 0.48, p = .62, ŋp2
= .01. There was also no significant
interaction between time and gender, F(2, 184) = 0.85, p = .43, ŋp2
= .01 and no significant
three way interaction between time, cohort and gender, F(4, 184) = 1.45, p = .22, ŋp2
= .03.

182
Figure 6.1. Inhibition score across the three time points for boys and girls
A mixed ANOVA carried out on response time, revealed that there was a
significant effect of time, F(1.87, 172.05) = 21.92, p < .001, ŋp2
= .19. According to follow up
Pairwise Comparisons compared to Time 1, children showed significantly faster response
times at Time 2 and Time 3 (all p < .001). However, response times did not significantly
differ between Time 2 and Time 3 (p = .07). Figure 6.2 (a) displays mean response time
across time points. There was also a significant effect of cohort, F(2, 92) = 22.54, p < .001,
ŋp2
= .33. Follow up analyses indicated that the 4-year-old cohort had a significantly slower
average response time compared to the 6-year-old cohort (p < .001), but not the 5-year-old
cohort (p = .08). Added to this, the 5-year-old cohort had a significantly slower response time
than the 6-year-old cohort (p < .001). Figure 6.2 (b) displays mean response time for each
cohort across time. The interaction between time and cohort was not significant, F(3.74,
172.05) = 0.54, p = .70, ŋp2
= .01. There was a significant main effect of gender on response
time, F(1, 92) = 8.19, p = .01, ŋp2
= .08. Pairwise comparisons found boys had significantly
faster average response times than girls (p = .01), as illustrated in Figure 6.2 (c). There was
no significant interaction between cohort and gender, F(2, 92) = 1.26, p = .29, ŋp2
= .03. Time
and gender also did not significantly interact, F(1.87, 172.05) = 1.16, p = .32, ŋp2
= .01. There
was no significant three way interaction between time, cohort and gender, F(3.74, 172.05) =
1.004, p = .40, ŋp2
= .02.
0.7
0.75
0.8
0.85
0.9
1 2 3
Inhibition Score
Time Point
Boys
Girls

183
Figure 6.2. Changes in mean response time on Go trials of Go/No-Go task
Working Memory. A mixed ANOVA suggested that there was a significant main
effect of time on working memory performance, F(2, 184) = 27.03, p < .001, ŋp2
= .23. Follow
up Pairwise Comparisons revealed that working memory performance was significantly
greater at Time 3 compared to Time 1 and Time 2 (all p < .001), but there was no significant
720
740
760
780
800
820
840
860
1 2 3
Response Time (msec)
Time Point
500
600
700
800
900
1000
4 4.5 5 5.5 6 6.5 7
Response Time (msec)
Mean Age (years)
4-year-olds
5-year-olds
6-year-olds
500
600
700
800
900
1 2 3
Response Time (msec)
Time Point
Boys
Girls
a)
b)
c)

184
difference between Time 1 and Time 2 (p = .16). Figure 6.3 (a) shows the mean working
memory scores across the three time points. In addition, there was a significant main effect of
cohort, F(2, 92) = 14.96, p < .001, ŋp2
= .25. Pairwise Comparisons revealed that the 4-year-
old cohort had a significantly lower mean working memory score compared to the 6-year-old
cohort (p < .001), but not the 5-year-old cohort (p = .09). The 5-year-old cohort had a
significantly lower mean working memory score than the 6-year-old cohort (p = .002). The
interaction between time and cohort was marginally significant, F(4, 184) = 2.43, p = .049,
ŋp2
= .05. Mean working memory performance across the year for each cohort is shown in
Figure 6.3 (b). There was no significant main effect of gender on working memory
performance, F(1, 92) = 0.02, p = .90, ŋp2
< .001. Boys and girls did not significantly differ in
their mean working memory performance. Added to this, cohort and gender did not
significantly interact, F(2, 92) = 0.29, p =.75, ŋp2
= .01, nor did time and gender, F(2, 184) =
2.06, p = .13, ŋp2
= .02. There was also no significant three way interaction between time,
cohort and gender, F(4, 184) = 0.97, p =.43, ŋp2
= .02.
Figure 6.3. Mean working memory score across time and cohort
0
2
4
6
8
10
1 2 3
Working Memory
Score
Time Point
b)
a)
0
2
4
6
8
10
12
4 4.5 5 5.5 6 6.5 7
Working memory
score
Mean age (years)
4-year-olds
5-year-olds
6-year-olds

185
Planning. The two measures of planning (planning score and errors) were analysed
separately. A univariate, rather than a multivariate, approach was adopted as planning score
and errors were only moderately correlated at Time 1 (r = .35, p < .001). At Time 2 (r = .04, p
= .34) and Time 3 (r = .03, p = .39) the correlation between these two variables was low.
These measures were therefore not associated with one another enough to warrant a
multivariate approach (Mayers, 2013). A mixed ANOVA found that there was a significant
main effect of time on planning score, F(2, 182) = 44.35, p < .001, ŋp2
= .33. Follow up
Pairwise Comparisons indicated that compared to Time 1 children demonstrated significantly
greater planning skills at Time 2 and 3 (all p < .001). Furthermore, planning score was
significantly greater at Time 3 compared to Time 2 (p < .001). Change in mean planning score
across the three time points is illustrated in Figure 6.4 (a). Added to this, there was a
significant main effect of cohort, F(1, 91) = 8.41, p < .001, ŋp2
= .16. Pairwise Comparisons
indicated that the 4-year-old cohort had a significantly lower average planning score than the
6-year-old cohort (p < .001), but not the 5-year-old cohort (p = 1.0). Furthermore, the 5-year-
old cohort had a significantly lower average planning score compared to the 6-year-old cohort
(p = .004). Figure 6.4 (b) shows mean planning score for each cohort. The interaction between
time and cohort was not significant, F(4, 182) = 0.88, p = .48, ŋp2
= .02. There was no
significant main effect of gender on planning abilities, F(1, 91) = 0.27, p = .60, ŋp2
= .003.
There was no significant interaction between cohort and gender, F(2, 91) = 0.62, p = .54, ŋp2
=
.01. There was also no significant interaction between time and gender, F(2, 182) = 0.13, p =
.88, ŋp2
= .001 and there was no significant three way interaction between time, cohort and
gender, F(4, 182) = .31, p =.87, ŋp2
= .01.
Changes in planning errors over the course of a year and between cohorts and gender
was investigated using a mixed ANOVA. There was no significant main effect of time, F(2,
182) = 0.66, p = .52, ŋp2
= .01, or cohort, F(2, 91) = 1.41, p = .25, ŋp2
= .03. This finding
suggests that the number of errors children made across the three time points did not differ
significantly, nor were there significant differences in the number of planning errors made
across cohorts. There was also no significant interaction between time and cohort, F(4, 182) =
0.98, p = .42, ŋp2
= .02. There was no significant main effect of gender, F(1, 91) = 0.12, p =
.73, ŋp2
= .001, and there was no significant interaction between cohort and gender, F(2, 91) =
0.03, p = .97, ŋp2
= .001. In addition, there was no significant three way interaction, F(4, 182)
= 0.29, p =.89, ŋp2
= .01.

186
Figure 6.4. Average planning score across time and cohort
Affective decision making. A mixed ANOVA indicated that there was a significant
main effect of cohort, F(2, 92) = 4.57, p = .01, ŋp2
= .09. Follow up Pairwise Comparisons
revealed that the 4-year-old cohort made significantly more disadvantageous decisions than
the 6-year-old (p = .01), but not the 5-year-old cohort (p = .72). The 5-year-old and 6-year-old
cohort did not significantly differ in the proportion of disadvantageous decisions (p = .16).
Mean affective decision making scores for each cohort across the three time points are
illustrated in Figure 6.5 (a). There was, however, no significant main effect of time, F(2, 184)
= 0.29, p = .75, ŋp2
= .003. The interaction between time and cohort was also not significant,
F(4, 184) = 2.004, p = .10, ŋp2
= .04. There was a significant main effect of gender on
affective decision making, F(1, 92) = 4.67, p = .03, ŋp2
= .05. Follow up Pairwise
Comparisons for gender effects indicated that boys demonstrated significantly more
disadvantageous decisions than girls (p = .03), as demonstrated in Figure 6.5 (b). Cohort and
gender did not significantly interact, F(2, 92) = 2.48, p = .09, ŋp2
= .05, nor did time and
0
2
4
6
8
10
12
1 2 3
Planning Score
Time Point
0
2
4
6
8
10
12
14
4 4.5 5 5.5 6 6.5 7
Planning Score
Mean Age (years)
4-year-olds
5-year-olds
6-year-olds
b)
a)

187
gender, F(2, 184) = 0.30, p = .75, ŋp2
= .003. There was also no significant three way
interaction between time, cohort and gender F(4, 184) = 0.98, p =.42, ŋp2
= .02.
Figure 6.5. Mean affective decision making scores for each cohort and for boys and girls
Delay of gratification. Delay score was the only measure of delay of gratification
that was included in the analysis. Number of times peeked over shoulder and turned around as
well as latency to first peek and first turn around were excluded from the analysis as the
distribution of these variables evidenced considerable positive skew and included a large
number of outliers. A mixed ANOVA revealed that there was a significant main effect of
cohort, F(2, 92) = 6.23, p = .003, ŋp2
= .12. Pairwise Comparisons indicated that the average
delay score of the 4-year-old cohort was significantly lower than the 6-year-old cohort (p =
.002), but not the 5-year-old cohort (p = .11). Added to this, the 5-year-old and 6-year-old
cohort did not significantly differ in mean delay score (p = .35). Figure 6.6 (a) demonstrates
mean changes in delay of gratification for each cohort. The main effect of time was not
significant, F(2, 184) = 0.68, p = .51, ŋp2
= .01. The interaction between time and cohort was
-0.3
-0.2
-0.1
0
0.1
0.2
4 4.5 5 5.5 6 6.5 7
Affective Decision Making
Mean Age (years)
4 year olds
5 year olds
6 year olds
b)
a)
-0.16
-0.14
-0.12
-0.1
-0.08
-0.06
-0.04
-0.02
0
0.02
1 2 3
Affective Decision making
Time point
Boys
Girls
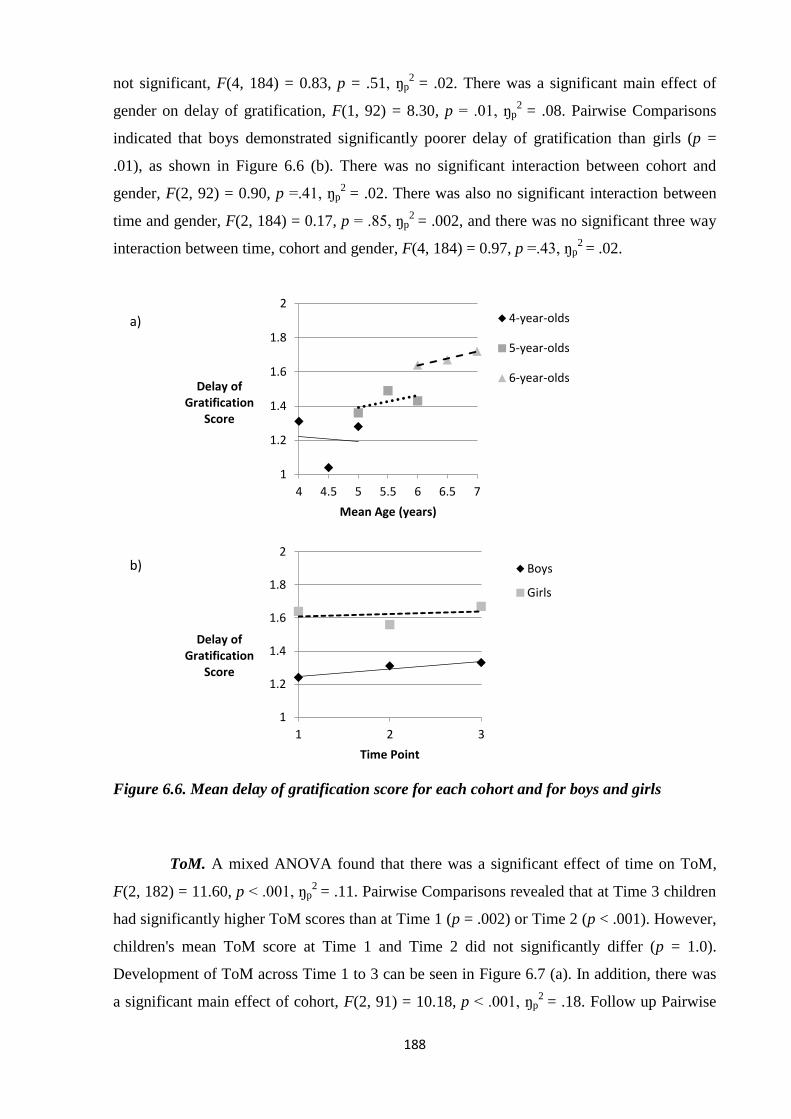
188
1
1.2
1.4
1.6
1.8
2
1 2 3
Delay of Gratification
Score
Time Point
Boys
Girls
not significant, F(4, 184) = 0.83, p = .51, ŋp2
= .02. There was a significant main effect of
gender on delay of gratification, F(1, 92) = 8.30, p = .01, ŋp2
= .08. Pairwise Comparisons
indicated that boys demonstrated significantly poorer delay of gratification than girls (p =
.01), as shown in Figure 6.6 (b). There was no significant interaction between cohort and
gender, F(2, 92) = 0.90, p =.41, ŋp2
= .02. There was also no significant interaction between
time and gender, F(2, 184) = 0.17, p = .85, ŋp2
= .002, and there was no significant three way
interaction between time, cohort and gender, F(4, 184) = 0.97, p =.43, ŋp2
= .02.
Figure 6.6. Mean delay of gratification score for each cohort and for boys and girls
ToM. A mixed ANOVA found that there was a significant effect of time on ToM,
F(2, 182) = 11.60, p < .001, ŋp2
= .11. Pairwise Comparisons revealed that at Time 3 children
had significantly higher ToM scores than at Time 1 (p = .002) or Time 2 (p < .001). However,
children's mean ToM score at Time 1 and Time 2 did not significantly differ (p = 1.0).
Development of ToM across Time 1 to 3 can be seen in Figure 6.7 (a). In addition, there was
a significant main effect of cohort, F(2, 91) = 10.18, p < .001, ŋp2
= .18. Follow up Pairwise
1
1.2
1.4
1.6
1.8
2
4 4.5 5 5.5 6 6.5 7
Delay of Gratification
Score
Mean Age (years)
4-year-olds
5-year-olds
6-year-olds
a)
b)

189
1
1.2
1.4
1.6
1.8
2
1 2 3
ToM Score
Time Point
Comparisons revealed that the 4-year-old cohort had a significantly lower average ToM score
across the three time points compared to the 6-year-old (p < .001), but not the 5-year-old
cohort (p = .13). The 5-year-old cohort also had a significantly lower average ToM score than
the 6-year-old cohort (p = .03). Figure 6.7 (b) displays mean ToM scores for each cohort
across the year. The interaction between time and cohort was not significant, F(4, 182) = 1.02,
p = 0.40, ŋp2
= .02. There was no significant main effect of gender, F(1, 91) = 0.20, p = .66,
ŋp2
= .002. Cohort and gender did not significantly interact, F(2. 91) = 0.07, p = .93, ŋp2
=
.002, nor did time and gender, F(2, 182) = 2.53, p = .08, ŋp2
= .03. There was also no
significant three way interaction between time, cohort and gender, F(4, 182) = 1.86, p =.12,
ŋp2
= .04.
Figure 6.7. Mean ToM score for each cohort at each time point
0
0.5
1
1.5
2
2.5
4 4.5 5 5.5 6 6.5 7
ToM Score
Mean age (years)
4-year-olds
5-year-olds
6-year-olds
a)
b)

190
Summary. Table 6.2 provides a summary of the results. The results indicated that
children’s cognitive abilities show significant improvement during early childhood. Children
demonstrated significant improvements in their inhibition response time, working memory,
planning, affective decision making, delay of gratification and ToM skills, but not inhibition
or planning errors between 4- and 7-years-of-age. Cool EF skills and ToM appear to show
similar patterns of development. The 6-year-old cohort evidenced significantly greater
performance on measures of working memory, planning, and ToM compared to the 4-year-
old and the 5-year-old cohort. However, the 4-year-old and 5-year-old cohort did not
significantly differ on performance on these measures. Hot EF skills appeared to follow
similar developmental patterns. The 4-year-old cohort demonstrated significantly poorer
affective decision making and delay of gratification than the 6-year-old, but not the 5-year-
old, cohort. Furthermore, the 5-year-old and 6-year-old cohort did not significantly differ on
decision making or delay of gratification. Response time showed significant improvement
between all cohorts. The findings also indicated that gender differences were apparent in
some cognitive abilities. Boys had significantly poorer inhibition, affective decision making
and delay of gratification and faster response times than girls.
Table 6.2. Summary of change in cognitive abilities from early to middle childhood
Cognitive Ability Key Findings
Cool EF
Inhibition Inhibition score
There was no significant improvement in inhibition over the
three time points.
There was no significant difference in mean inhibition between
the three cohorts.
Boys demonstrated significantly poorer inhibition than girls.
Inhibition response time
Children showed significantly faster response times at T3
compared to T1 and T2.
There was no significant difference in response time between
the three cohorts.
Boys evidenced significantly faster response times than girls.
Working
Memory
Children showed significantly superior working memory at T3
compared to T1 and T2.
The 6-year-old cohort showed significantly superior working
memory to children in the 4 and 5-year-old cohorts.
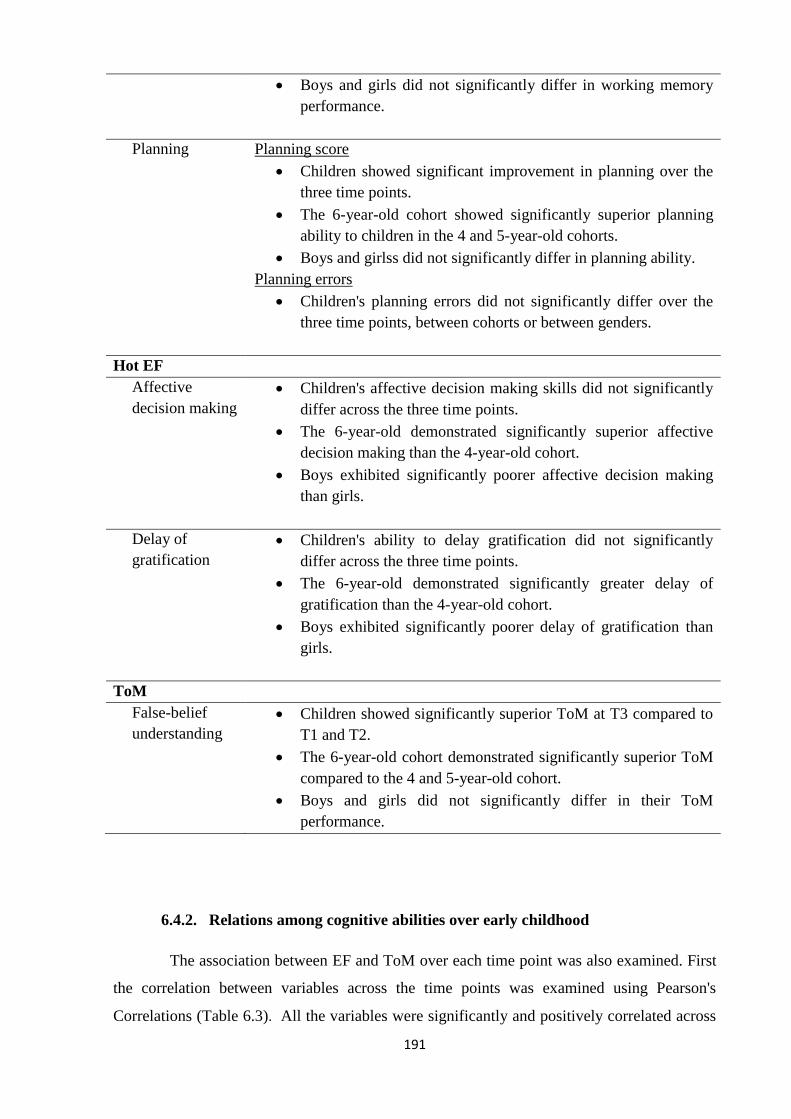
191
Boys and girls did not significantly differ in working memory
performance.
Planning Planning score
Children showed significant improvement in planning over the
three time points.
The 6-year-old cohort showed significantly superior planning
ability to children in the 4 and 5-year-old cohorts.
Boys and girlss did not significantly differ in planning ability.
Planning errors
Children's planning errors did not significantly differ over the
three time points, between cohorts or between genders.
Hot EF
Affective
decision making
Children's affective decision making skills did not significantly
differ across the three time points.
The 6-year-old demonstrated significantly superior affective
decision making than the 4-year-old cohort.
Boys exhibited significantly poorer affective decision making
than girls.
Delay of
gratification
Children's ability to delay gratification did not significantly
differ across the three time points.
The 6-year-old demonstrated significantly greater delay of
gratification than the 4-year-old cohort.
Boys exhibited significantly poorer delay of gratification than
girls.
ToM
False-belief
understanding
Children showed significantly superior ToM at T3 compared to
T1 and T2.
The 6-year-old cohort demonstrated significantly superior ToM
compared to the 4 and 5-year-old cohort.
Boys and girls did not significantly differ in their ToM
performance.
6.4.2. Relations among cognitive abilities over early childhood
The association between EF and ToM over each time point was also examined. First
the correlation between variables across the time points was examined using Pearson's
Correlations (Table 6.3). All the variables were significantly and positively correlated across

192
the time points, apart from planning errors and affective decision making. Planning errors at
Time 1 were not significantly correlated with planning errors at Time 2 or 3, but planning
errors at Time 2 were significantly correlated with planning errors at Time 3. Added to this,
affective decision making at Time 1 was significantly and positively correlated with decision
making at Time 2, but not Time 3. Further, Time 2 and Time 3 decision making were not
significantly correlated. Excluding these variables, higher scores on cognitive abilities at Time
1 were significantly associated with higher scores at Time 2 and Time 3.
Table 6.3. Correlations between Time 1 variables and Time 2 and 3 variables
Time 2 Time 3
Time 1
Inhibition score .65*** (.63***) .43*** (.44***)
Inhibition response time
(msec) .53***(.42***) .43*** (.30**)
Planning score .46*** (.29**) .34*** (.21*)
Planning errors .12 (.13) .02 (.03)
Working Memory .70*** (.53***) .77*** (.68)
Decision Making .22* (.20***) .14 (.17*)
Delay of gratification .57*** (.51***) .41*** (.33***)
ToM .53*** (.37***) .49*** (.31***)
VA .63*** (.63***) .47*** (.47***)
Time 2 Time 2 Time 3
Inhibition score - .51*** (.46***)
Inhibition response time - .55*** (.43***)

193
(msec)
Planning score - .49*** (.37***)
Planning errors - .21* (.17*)
Working Memory - .77*** (.68***)
Decision Making - .19 (.16)
Delay of gratification - .44*** (.34***)
ToM - .61*** (.47***)
VA - .61*** (.61***)
Note. ToM = Theory of Mind. VA = Verbal Ability. *p < .05, **p < .01, ***p < .001, one-
tailed. Partial correlations controlling for concurrent age and verbal ability are reported in
parenthesis.
Next, the relation between individual EF and ToM abilities at each time point was
explored using Pearson's correlations.
Time 1. Pearson's correlations (Table 6.4) revealed that at Time 1, inhibition score
was significantly and positively correlated with response time, planning score, planning
errors, working memory, delay of gratification and ToM. However, after concurrent age and
verbal ability were controlled for, inhibition remained significantly and positively associated
with response time, working memory and delay of gratification. Response time was
significantly and negatively associated with planning, working memory and delay of
gratifications, but these relations did not remain once age and verbal ability were controlled
for. Planning was significantly and positively correlated with planning errors, working
memory, delay of gratification and ToM. Planning remained significantly and positively
related to planning errors and working memory once age and verbal ability were taken into
account. Working memory was significantly and positively associated with delay of
gratification and ToM. Only the significant relation between working memory and ToM
remained when age and verbal ability were controlled for.

194
Table 6.4. Correlations between variables at Time 1
1 2 3 4 5 6 7 8
1.Inhibition -
.24*
(.38**)
.18*
(.09)
.20*
(.13)
.33***
(.23*)
.08
(.06)
.42***
(.45***)
.25*
(.06)
2.Response
Time(msec)
-
.25*
(-.09)
-.05
(-.04)
-.16*
(.14)
-.03
(.02)
-.18*
(-.10)
-.11
(-.08)
3.Planning
Score
- .35***
(.29**)
.45***
(.24*)
.14
(.14)
.19*
(.10)
.27**
(-.04)
4.Planning
Errors
- .14
(.03)
-.10
(-.11)
.04
(.03)
.002
(-.19*)
5.WM -
-.06
(-.16)
.23*
(.12)
.43***
(.19*)
6.ADM -
-.05
(-.06)
.09
(.05)
7.Delay -
.13
(.04)
8.ToM -
Note. *p < .05, **p < .01, ***p < .001, one-tailed. WM = Working Memory, ADM =
Affective Decision Making, Delay = Delay of Gratification, ToM = Theory of Mind. Partial
correlations controlling for concurrent age and verbal ability are reported in parenthesis.
Time 2. At Time 2 (Table 6.5), inhibition remained significantly and positively
associated with response time, planning, working memory, delay of gratification and ToM,
but was no longer significantly correlated with planning errors. When Time 2 age and verbal
ability were controlled for, inhibition remained positively associated with response time,
working memory, delay of gratification and became significantly and positively associated
with affective decision making. Response time was significantly and negatively correlated
with planning, working memory, and was significantly and negatively associated with delay
of gratification. The relations, though, did not remain when age and verbal ability were
controlled for. Planning remained significantly and positively correlated with working
memory, delay of gratification and ToM. Planning was no longer associated with errors at
Time 2. Once age and verbal ability were taken into account, neither planning or planning
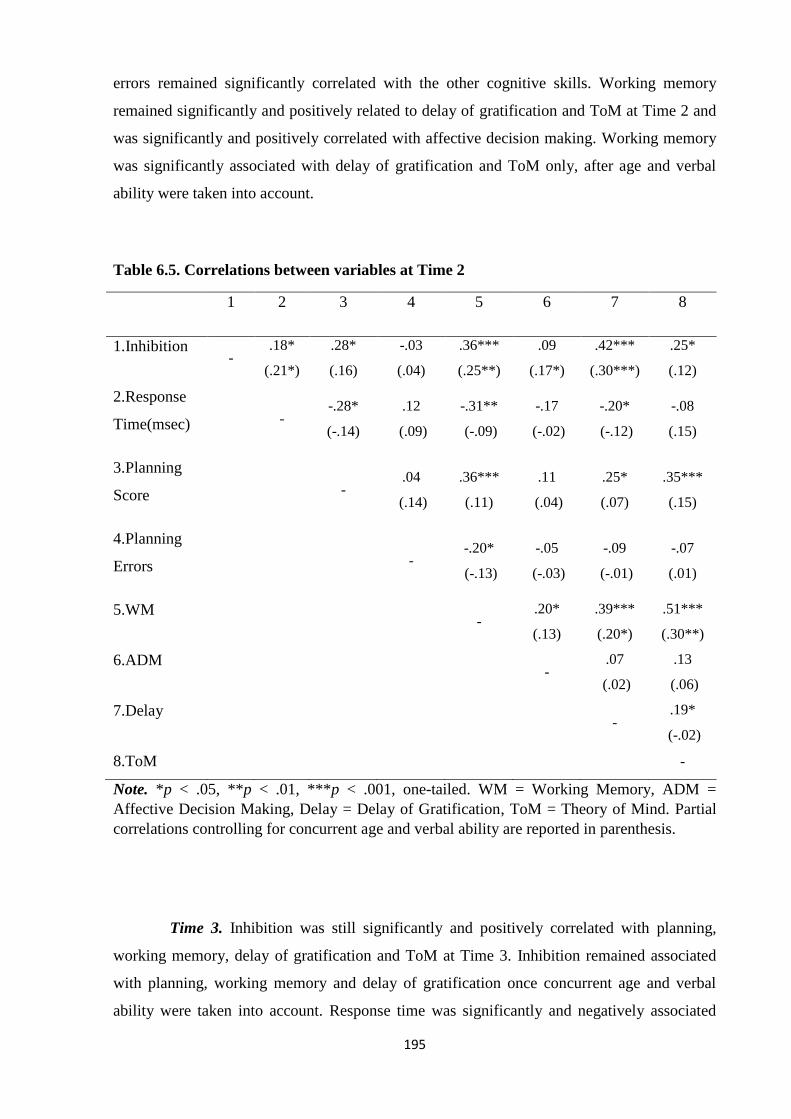
195
errors remained significantly correlated with the other cognitive skills. Working memory
remained significantly and positively related to delay of gratification and ToM at Time 2 and
was significantly and positively correlated with affective decision making. Working memory
was significantly associated with delay of gratification and ToM only, after age and verbal
ability were taken into account.
Table 6.5. Correlations between variables at Time 2
1 2 3 4 5 6 7 8
1.Inhibition -
.18*
(.21*)
.28*
(.16)
-.03
(.04)
.36***
(.25**)
.09
(.17*)
.42***
(.30***)
.25*
(.12)
2.Response
Time(msec) - -.28*
(-.14)
.12
(.09)
-.31**
(-.09)
-.17
(-.02)
-.20*
(-.12)
-.08
(.15)
3.Planning
Score - .04
(.14)
.36***
(.11)
.11
(.04)
.25*
(.07)
.35***
(.15)
4.Planning
Errors - -.20*
(-.13)
-.05
(-.03)
-.09
(-.01)
-.07
(.01)
5.WM -
.20*
(.13)
.39***
(.20*)
.51***
(.30**)
6.ADM -
.07
(.02)
.13
(.06)
7.Delay -
.19*
(-.02)
8.ToM -
Note. *p < .05, **p < .01, ***p < .001, one-tailed. WM = Working Memory, ADM =
Affective Decision Making, Delay = Delay of Gratification, ToM = Theory of Mind. Partial
correlations controlling for concurrent age and verbal ability are reported in parenthesis.
Time 3. Inhibition was still significantly and positively correlated with planning,
working memory, delay of gratification and ToM at Time 3. Inhibition remained associated
with planning, working memory and delay of gratification once concurrent age and verbal
ability were taken into account. Response time was significantly and negatively associated
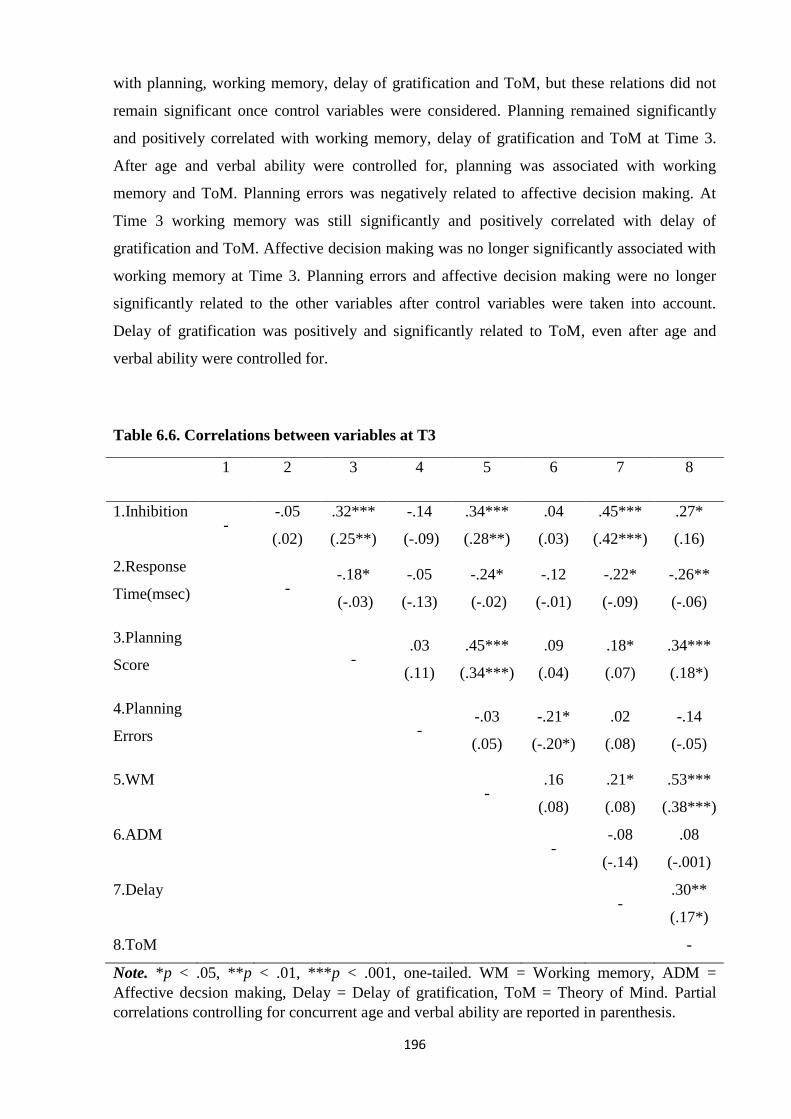
196
with planning, working memory, delay of gratification and ToM, but these relations did not
remain significant once control variables were considered. Planning remained significantly
and positively correlated with working memory, delay of gratification and ToM at Time 3.
After age and verbal ability were controlled for, planning was associated with working
memory and ToM. Planning errors was negatively related to affective decision making. At
Time 3 working memory was still significantly and positively correlated with delay of
gratification and ToM. Affective decision making was no longer significantly associated with
working memory at Time 3. Planning errors and affective decision making were no longer
significantly related to the other variables after control variables were taken into account.
Delay of gratification was positively and significantly related to ToM, even after age and
verbal ability were controlled for.
Table 6.6. Correlations between variables at T3
1 2 3 4 5 6 7 8
1.Inhibition -
-.05
(.02)
.32***
(.25**)
-.14
(-.09)
.34***
(.28**)
.04
(.03)
.45***
(.42***)
.27*
(.16)
2.Response
Time(msec) - -.18*
(-.03)
-.05
(-.13)
-.24*
(-.02)
-.12
(-.01)
-.22*
(-.09)
-.26**
(-.06)
3.Planning
Score - .03
(.11)
.45***
(.34***)
.09
(.04)
.18*
(.07)
.34***
(.18*)
4.Planning
Errors - -.03
(.05)
-.21*
(-.20*)
.02
(.08)
-.14
(-.05)
5.WM -
.16
(.08)
.21*
(.08)
.53***
(.38***)
6.ADM -
-.08
(-.14)
.08
(-.001)
7.Delay -
.30**
(.17*)
8.ToM -
Note. *p < .05, **p < .01, ***p < .001, one-tailed. WM = Working memory, ADM =
Affective decsion making, Delay = Delay of gratification, ToM = Theory of Mind. Partial
correlations controlling for concurrent age and verbal ability are reported in parenthesis.
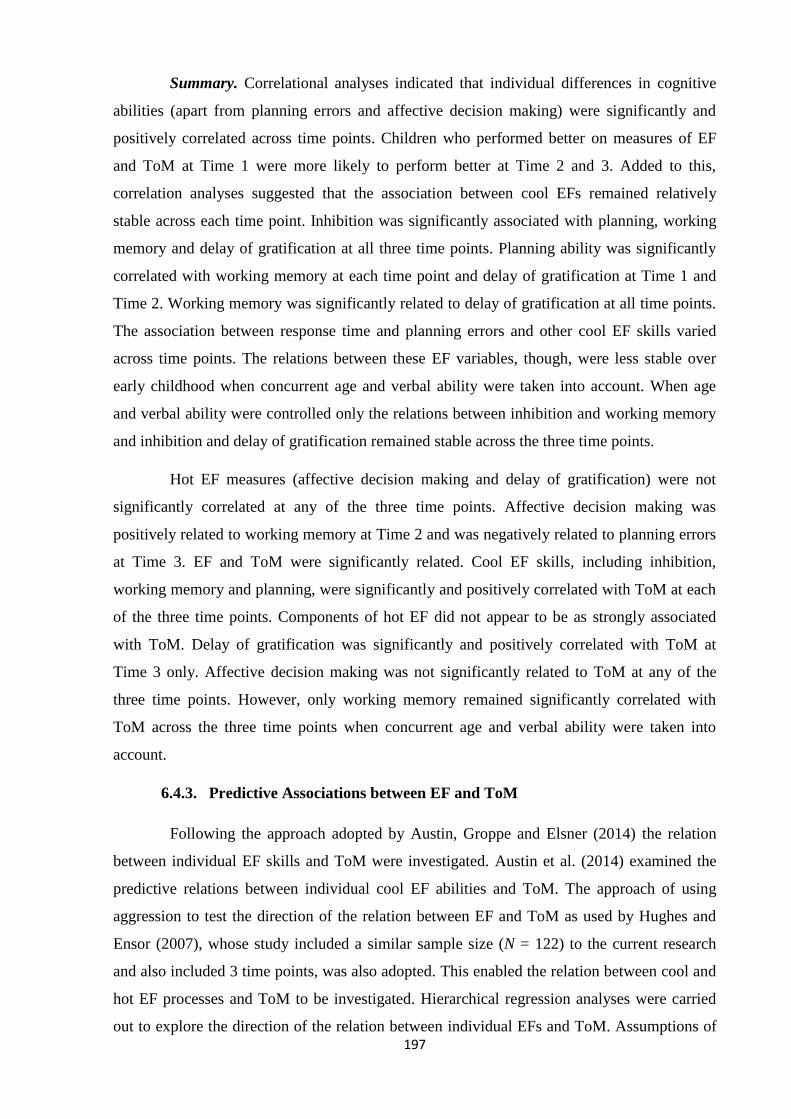
197
Summary. Correlational analyses indicated that individual differences in cognitive
abilities (apart from planning errors and affective decision making) were significantly and
positively correlated across time points. Children who performed better on measures of EF
and ToM at Time 1 were more likely to perform better at Time 2 and 3. Added to this,
correlation analyses suggested that the association between cool EFs remained relatively
stable across each time point. Inhibition was significantly associated with planning, working
memory and delay of gratification at all three time points. Planning ability was significantly
correlated with working memory at each time point and delay of gratification at Time 1 and
Time 2. Working memory was significantly related to delay of gratification at all time points.
The association between response time and planning errors and other cool EF skills varied
across time points. The relations between these EF variables, though, were less stable over
early childhood when concurrent age and verbal ability were taken into account. When age
and verbal ability were controlled only the relations between inhibition and working memory
and inhibition and delay of gratification remained stable across the three time points.
Hot EF measures (affective decision making and delay of gratification) were not
significantly correlated at any of the three time points. Affective decision making was
positively related to working memory at Time 2 and was negatively related to planning errors
at Time 3. EF and ToM were significantly related. Cool EF skills, including inhibition,
working memory and planning, were significantly and positively correlated with ToM at each
of the three time points. Components of hot EF did not appear to be as strongly associated
with ToM. Delay of gratification was significantly and positively correlated with ToM at
Time 3 only. Affective decision making was not significantly related to ToM at any of the
three time points. However, only working memory remained significantly correlated with
ToM across the three time points when concurrent age and verbal ability were taken into
account.
6.4.3. Predictive Associations between EF and ToM
Following the approach adopted by Austin, Groppe and Elsner (2014) the relation
between individual EF skills and ToM were investigated. Austin et al. (2014) examined the
predictive relations between individual cool EF abilities and ToM. The approach of using
aggression to test the direction of the relation between EF and ToM as used by Hughes and
Ensor (2007), whose study included a similar sample size (N = 122) to the current research
and also included 3 time points, was also adopted. This enabled the relation between cool and
hot EF processes and ToM to be investigated. Hierarchical regression analyses were carried
out to explore the direction of the relation between individual EFs and ToM. Assumptions of

198
multiple regression were met for all analyses. The Durbin-Watson values were within the
accepted range, indicating that the assumption of independent errors was met (Savin & White,
1977; Wang & Jain, 2003). VIF and tolerance values indicated that there was no evidence of
multicollinearity between predictors (J. Cohen et al., 2003; Kelley & Maxwell, 2010). P-P
plots of standardised residuals suggested that the assumption of normally distributed errors
was met (J. Cohen et al., 2003; Kelley & Maxwell, 2010). Zpred vs. zresid plots indicated that
the assumption of homoscedasticity was met
Hierarchical regression analyses included only those individual EF skills that
correlated with ToM. The cool EF skills inhibition, planning and working memory and the hot
EF skill delay of gratification were therefore included. This approach enabled the relation of
cool and hot processes to ToM to be comprehensively investigated. First, whether EF at Time
1 and Time 2 predicted later ToM was examined. In the first step, concurrent age and verbal
ability and initial ToM were entered in order to control for potential confounding effects. The
EF subcomponent was then entered in the second step in order to examine the predictive role
of EF after taking into account control variables.
Inhibition-ToM. Regression analyses revealed that inhibition at Time 1 did not
significantly predict ToM at Time 2, ΔR2 = .02, ΔF(1, 92) = 2.48, p = .12 , or Time 3 ΔR
2 = .02,
ΔF(1, 91) = 3.01, p = .09. Inhibition at Time 2 also did not significantly predict ToM at Time
3, ΔR2 = .01, ΔF(1. 92) = 1.33, p = .25. For the full regression results for inhibition as a
predictor of ToM see Table 6.7. Regression analyses further revealed that ToM at Time 1 did
not significantly predict inhibition at Time 2, ΔR2 = .003, ΔF(1, 92) = 0.55, p =.46, or Time 3,
ΔR2 = .02, ΔF(1, 91) = 2.03, p = .16. ToM at Time 2 did not significantly predict inhibition at
Time 3 either, ΔR2 = .02, ΔF(1, 91) = 2.80, p = .10. For full regression results for inhibition as
a predictor of ToM see Table 6.8.
Table 6.7. Regression analysis for inhibition as a predictor of ToM
T1 Inhibition T2 ToM T1 Inhibition T3 ToM T2 Inhibition T3 ToM
B SE B β B SE B β B SE
B
β
Step 1 Step 1 Step 1
T2
Age 0.02 .01 .21*
T3
Age 0.02 .01 .23*
T3
Age 0.02 .01 .21*
Gender -0.20 .16 -.11 Gender -0.17 .16 -.09 Gender -0.04 .15 -.02
T2 0.01 .01 .20* T3 VA 0.02 .01 .29** T3 VA 0.02 .004 .26**

199
VA
T1
ToM 0.43 .11 .39***
T1
ToM 0.39 .11 .36***
T1
ToM 0.48 .08 .49***
Step 2 Step 2 Step 2
T1
Inhib. 0.80 .51 .16
T1
Inhib. 0.82 .47 .17
T3
Inhib. 0.39 .34 .10
DV DV DV
T2
ToM
R2 = .35*** T3
ToM
R2 = .35
T3
ToM
R2 = .46***
ΔR2 = .02 ΔR
2 = .02 ΔR
2 = .01
Note. T1 = Time 1. T2 = Time 2. T3 = Time 3. VA = Verbal Ability. Inhib. = Inhibition. ToM
= Theory of Mind.*p<.05 **p<.01 ***p<.001.
Table 6.8. Regression analyses for ToM as a predictor of inhibition
T1 ToM T2 Inhibition T1 ToM T3 Inhibition T2 ToM T3 Inhibition
B
SE
B β
B SE B β
B SE B β
Step 1 Step 1 Step 1
T2
Age -0.002 .002 -.09
T3
Age <.001 .002 -.03
T3
Age 0.001 .002 .05
Gender 0.003 .04 .01 Gender 0.04 .03 .11 Gender 0.05 .03 .13
T2
VA 0.004 .001 .25**
T3 VA 0.001 .001 .13
T3 VA 0.001 .001 .11
T1
Inhib. 0.71 .11 .57***
T1
Inhib. 0.35 .10 .38***
T1
Inhib. 0.34 .07 .45***
Step 2 Step 2 Step 2
T1
ToM -0.02 .02 -.06
T1
ToM 0.03 .02 .15
T3
ToM 0.03 .02 .17
DV DV DV
T2
Inhib.
R2 = .52*** T3
Inhib.
R2 = .24*** T3
Inhib.
R2 = .29***
ΔR2 = .003 ΔR
2 = .02 ΔR
2 = .02
Note. T1 = Time 1. T2 = Time 2. T3 = Time 3. VA = Verbal Ability. Inhib. = Inhibition. ToM
= Theory of Mind.*p<.05 **p<.01 ***p<.001.
Planning-ToM. Regression analyses revealed that planning at Time 1 did not
significantly predict ToM at Time 2, ΔR2 = .01, F(1, 92) = 1.35, p = .25, or Time 3 ΔR
2 = .01,

200
ΔF(1, 91) = 1.31, p = .26. However, planning at Time 2 did significantly predict ToM at Time
3, ΔR2 = .04, ΔF(1, 92) = 7.48, p = .01. Greater planning ability at Time 2 was related to better
performance on ToM measures at Time 3. For the full regression results for planning as a
predictor of ToM see Table 6.9. Regression analyses revealed that ToM at Time 1 did not
significantly predict planning at Time 2, ΔR2 = .02, ΔF(1, 92) = 2.66, p = .11, or Time 3, ΔR
2 =
.01, ΔF(1, 91) = 1.57, p = .21. ToM at Time 2 did significantly predict planning at Time 3, ΔR2
= .03, ΔF(1, 92) = 4.39, p = .04. For full regression results for inhibition as a predictor of ToM
see Table 6.10.
Table 6.9. Regression analyses for planning as a predictor of ToM
T1 Planning T2
ToM
T1 Planning T3 ToM
T2 Planning T3 ToM
B SE B β B SE B β B SE B Β
Step 1 Step 1 Step 1
T2
Age 0.02 .01 .21*
T3
Age 0.02 .01 .23*
T3
Age 0.02 .01 .21*
Gender -0.20 .16 -.11 Gender -0.17 .16 -.09 Gender -0.04 .15 -.02
T2 VA 0.01 .01 .20* T3 VA 0.02 .01 .29** T3 VA 0.02 .004 .26**
T1
ToM 0.43 .11 .39***
T1
ToM 0.39 .11 .36***
T1
ToM 0.48 .08 .49***
Step 2 Step 2 Step 2
T1
Plan. .002 .02 .12
T1
Plan. 0.02 .02 .12
T3
Plan. 0.04 .01 .22**
DV DV DV
T2
ToM
R2 = .35*** T3
ToM
R2 = .32*** T3
ToM
R2 = .46***
ΔR2 = .01 ΔR
2 = .01 ΔR
2 = .04**
Note. T1 = Time 1. T2 = Time 2. T3 = Time 3. VA = Verbal Ability. Plan. = Planning. ToM =
Theory of Mind.*p<.05 **p<.01 ***p<.001.

201
Table 6.10. Regression analyses for ToM as a predictor of planning
T1 ToM T2
Planning
T1 ToM T3
Planning
T2 ToM T3
Planning
B SE B β B SE B β B SE B β
Step 1 Step 1 Step 1
T2 Age 0.13 .06 .23* T3 Age 0.08 .06 .17 T3 Age 0.07 .05 .14
Gender -0.17 1.02 -.02 Gender 0.35 .99 .03 Gender 0.33 .92 .03
T2 VA 0.07 .03 .20* T3 VA 0.06 .03 .19 T3 VA 0.06 .03 .20*
T1 Plan. 0.35 .13 .30** T1 Plan. 0.22 .12 .21 T1 Plan. 0.36 .09 .41***
Step 2 Step 2 Step 2
T1 ToM 2.13 .69 .17 T1 ToM 0.81 .65 .14 T3 ToM 1.09 .53 .20*
DV DV DV
T2 Plan. R2 = .27*** T3 Plan. R
2 = .16*** T3 Plan. R
2 = .29***
ΔR2 = .02 ΔR
2 = .01 ΔR
2 = .03*
Note. T1 = Time 1. T2 = Time 2. T3 = Time 3. VA = Verbal Ability. Plan. = Planning. ToM =
Theory of Mind.*p<.05 **p<.01 ***p<.001.
Working memory-ToM. Regression analyses revealed that working memory at Time
1 did not significantly predict ToM at Time 2, ΔR2 = .01, ΔF(1, 92) = 0.67, p = .42, or Time 3
ΔR2 = .02, ΔF(1, 91) = 3.37, p = .07. Working memory at Time 2 was marginally significantly
related to ToM at Time 3, ΔR2 = .02, ΔF(1, 92) = 3.66, p = .06. Greater working memory at
Time 2 was associated with better performance on ToM measures at Time 3. For the full
regression results for inhibition as a predictor of ToM see Table 6.11. Regression analyses
revealed that ToM at Time 1 did not significantly predict inhibition at Time 2, ΔR2 = .01,
ΔF(1, 92) = 0.91, p = .34, or Time 3, ΔR2 = .001, ΔF(1, 91) = 0.32, p = .57. ToM at Time 2 did
not significantly predict inhibition at Time 3 either, ΔR2 = .002, ΔF(1, 92) = 0.56, p = .46. For
full regression results for inhibition as a predictor of ToM see Table 6.12.

202
Table 6.11. Regression analyses for working memory as a predictor of ToM
T1 WM T2 ToM T1 WM T3 ToM T2 WM T3 ToM
B SE B β B SE B β B SE B Β
Step 1 Step 1 Step 1
T2
Age 0.02 .01 .21*
T3
Age 0.02 .01 .23*
T3
Age 0.02 .01 .21*
Gender -0.20 .16 -.11 Gender -0.17 .16 -.09 Gender -0.04 .15 -.02
T2
VA 0.01 .01 .20*
T3
VA 0.02 .01 .29**
T3
VA 0.02 .004 .26**
T1
ToM 0.43 .11 .39***
T1
ToM 0.39 .11 .36***
T1
ToM 0.48 .08 .49***
Step 2 Step 2 Step 2
T1
WM 0.03 .03 .09
T1
WM 0.06 .03 .20
T3
WM 0.07 .04 .19†
DV DV DV
T2
ToM
R2 = .35*** T3
ToM
R2 = .32*** T3
ToM
R2 = .46***
ΔR2 = .01 ΔR
2 = .02 ΔR
2 = .02†
Note. T1 = Time 1. T2 = Time 2. T3 = Time 3. VA = Verbal Ability. WM = Working Memory.
ToM = Theory of Mind.*p<.05 **p<.01 ***p<.001 †p = .05.
Table 6.12. Regression analyses for ToM as a predictor of working memory
T1 ToM T2 WM T1 ToM T3 WM T2 ToM T3 WM
B SE B β
B
SE
B β
B SE B β
Step 1 Step 1 Step 1
T2
Age 0.04 .02 .17
T3
Age -0.02 .02 -.05
T3
Age 0.01 .02 .05
Gender -0.31 .37 -.06 Gender -0.64 .37 -.12 Gender -0.24 .37 -.04
T2 VA 0.04 .01 .23** T3 VA 0.01 .01 .05 T3 VA -0.004 .01 -.02
T1
WM 0.45 .08 .54***
T1
WM 0.71 .08 .79
T1
WM 0.81 .09 .76***
Step 2 Step 2 Step 2
T1
ToM 0.24 .25 .08
T1
ToM 0.14 .25 .04
T3
ToM 0.17 .23 .06
DV DV DV
T2 R2 = .53*** T3 R
2 = .59*** T3 R
2 = .60***

203
WM WM WM
ΔR2 = .01 ΔR
2 = .001 ΔR
2 = .002
Note. T1 = Time 1. T2 = Time 2. T3 = Time 3. VA = Verbal Ability. WM = Working Memory.
ToM = Theory of Mind.*p<.05 **p<.01 ***p<.001.
Delay of gratification-ToM. Regression analyses revealed that delay of gratification
at Time 1 did not significantly predict ToM at Time 2, ΔR2 < .001, ΔF(1, 92) = 0.05, p = .83.
However delay of gratification at Time 1 did significantly predict ToM at Time 3 ΔR2 = .03,
ΔF(1, 91) = 0.03, p = .05. Delay of gratification at Time 2 also significantly predicted ToM at
Time 3, ΔR2 = .03, ΔF(1, 92) = 5.04, p = .03. Better delay of gratification at Time 1 and 2 was
associated with greater ToM abilities at Time 3. For the full regression results for inhibition as
a predictor of ToM see Table 6.13. Regression analyses further revealed that ToM at Time 1
did not significantly predict delay of gratification at Time 2, ΔR2 < .001 , ΔF(1, 92) = 0.06, p =
.81, or Time 3, ΔR2 = .02, ΔF(1, 91) = 2.87, p = .09. ToM at Time 2 did not significantly
predict delay of gratification at Time 3 either, ΔR2 = .02, ΔF(1, 92) = 2.75, p = .10. For full
regression results for inhibition as a predictor of ToM see Table 6.14.
Table 6.13. Regression analyses for delay of gratification as a predictor of ToM
T1 Delay T2 ToM T1 Delay T3 ToM T2 Delay T3 ToM
B SE B β B SE B β B SE B β
Step 1 Step 1 Step 1
T2
Age 0.02 .01 .21*
T3
Age 0.02 .01 .23*
T3
Age 0.02 .01 .21*
Gender -0.20 .16 -.11
Gender -0.17 .16 -.09
Gender -0.04 .15 -.02
T2 VA 0.01 .01 .20* T3 VA 0.02 .01 .29** T3 VA 0.02 .004 .26**
T1
ToM 0.43 .11 .39***
T1
ToM 0.39 .11 .36***
T1
ToM 0.48 .08 .49***
Step 2 Step 2 Step 2
T1
Delay 0.03 .11 .02
T1
Delay 0.21 .11 .18*
T3
Delay 0.21 .10 .18*
DV DV DV
T2
ToM
R2 = .35*** T3
ToM
R2 = .32 T3
ToM
R2 = .46
ΔR2 = < .001 ΔR
2 = .03* ΔR
2 = .03*
Note. T1 = Time 1. T2 = Time 2. T3 = Time 3. VA = Verbal Ability. Delay = Delay of
Gratification. ToM = Theory of Mind.*p<.05 **p<.01 ***p<.001.

204
Table 6.14. Regression analyses for ToM as a predictor of delay of gratification
T1 ToM T2 Delay T1 ToM T3 Delay T2 ToM T3 Delay
B SE B β B SE B β B SE B β
Step 1 Step 1 Step 1
T2
Age 0.01 .01 .17*
T3
Age 0.01 .01 .14
T3
Age 0.01 .01 .13
Gender 0.07 .14 .04
Gender 0.24 .14 .17
Gender 0.24 .13 .17
T2
VA 0.01 .004 .18*
T3
VA 0.004 .004 .09
T3
VA 0.004 .004 .09
T1
Delay 0.45 .09 .45***
T1
Delay 0.26 .09 .29**
T1
Delay 0.32 .09 .36***
Step 2 Step 2 Step 2
T1
ToM -0.02 .09 -.03
T1
ToM 0.15 .09 .18
T3
ToM 0.12 .07 .17
DV DV DV
T2
Delay
R2 = .36*** T3
Delay
R2 = .21*** T3
Delay
R2 = .25***
ΔR2 = <.001 ΔR
2 = .02 ΔR
2 = .02
Note. T1 = Time 1. Time 2 = Time 2. Time 3 = Time 3. VA = Verbal Ability. Delay = Delay of
Gratification. ToM = Theory of Mind.*p<.05 **p<.01 ***p<.001.
Summary. The findings revealed that some early EF skills predicted later ToM.
Better performance on measures of planning at Time 2 and delay of gratification at Time 2
and Time 3 were associated with greater ToM abilities at Time 3. Both cool and hot EF skills
were therefore associated with ToM. In contrast, there was less support for a ToM as a
predictor of EF. Only Time 2 ToM predicted Time 3 planning. The relation between planning
and ToM may be bidirectional.
6.5. Discussion
The study presented in this chapter was the first to investigate the developmental
associations between cool and hot EF processes and ToM across early childhood. This study
had three main objectives. The first goal of the study was to compare the development of cool
and hot EF components due to limited understanding of the development of hot EF skills in
relation to cool EF processes. In line with the hypotheses, between 4- and 7-years-of-age
significant improvement in the cool EF skills, inhibition response time, working memory and
planning, and the hot EF skills, delay of gratification and affective decision making, were
evident. However, no improvement in inhibition score or planning errors was observed, which
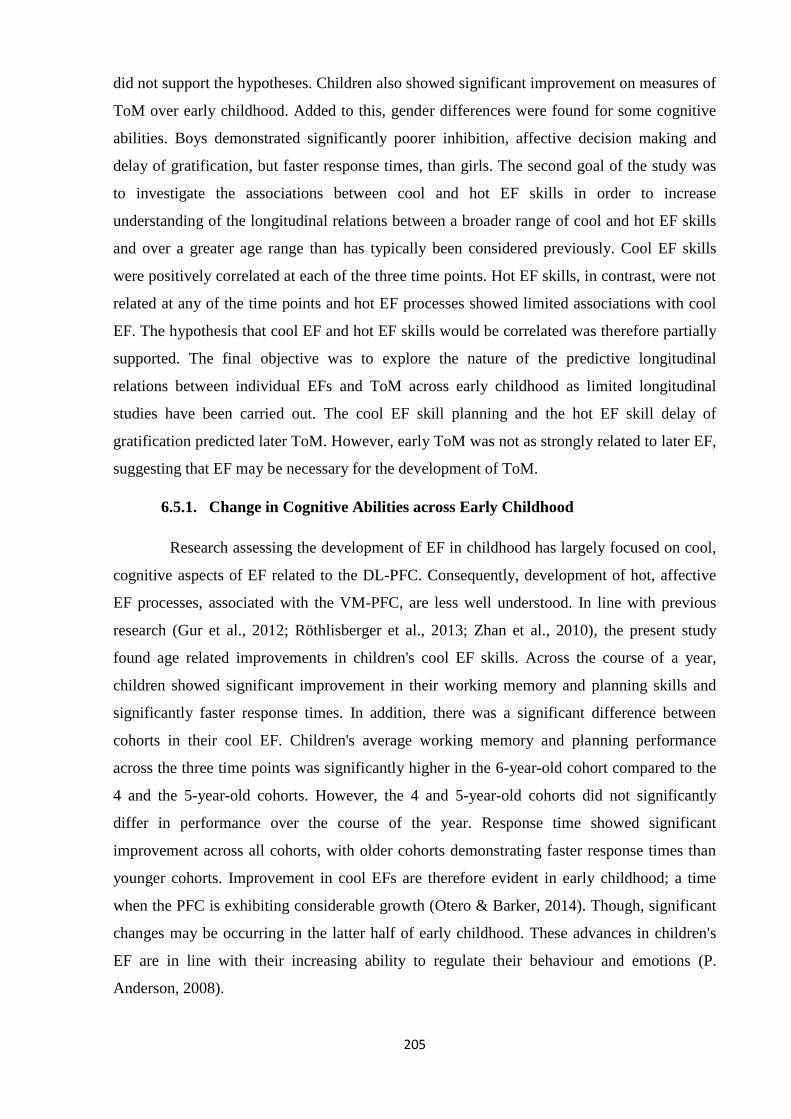
205
did not support the hypotheses. Children also showed significant improvement on measures of
ToM over early childhood. Added to this, gender differences were found for some cognitive
abilities. Boys demonstrated significantly poorer inhibition, affective decision making and
delay of gratification, but faster response times, than girls. The second goal of the study was
to investigate the associations between cool and hot EF skills in order to increase
understanding of the longitudinal relations between a broader range of cool and hot EF skills
and over a greater age range than has typically been considered previously. Cool EF skills
were positively correlated at each of the three time points. Hot EF skills, in contrast, were not
related at any of the time points and hot EF processes showed limited associations with cool
EF. The hypothesis that cool EF and hot EF skills would be correlated was therefore partially
supported. The final objective was to explore the nature of the predictive longitudinal
relations between individual EFs and ToM across early childhood as limited longitudinal
studies have been carried out. The cool EF skill planning and the hot EF skill delay of
gratification predicted later ToM. However, early ToM was not as strongly related to later EF,
suggesting that EF may be necessary for the development of ToM.
6.5.1. Change in Cognitive Abilities across Early Childhood
Research assessing the development of EF in childhood has largely focused on cool,
cognitive aspects of EF related to the DL-PFC. Consequently, development of hot, affective
EF processes, associated with the VM-PFC, are less well understood. In line with previous
research (Gur et al., 2012; Röthlisberger et al., 2013; Zhan et al., 2010), the present study
found age related improvements in children's cool EF skills. Across the course of a year,
children showed significant improvement in their working memory and planning skills and
significantly faster response times. In addition, there was a significant difference between
cohorts in their cool EF. Children's average working memory and planning performance
across the three time points was significantly higher in the 6-year-old cohort compared to the
4 and the 5-year-old cohorts. However, the 4 and 5-year-old cohorts did not significantly
differ in performance over the course of the year. Response time showed significant
improvement across all cohorts, with older cohorts demonstrating faster response times than
younger cohorts. Improvement in cool EFs are therefore evident in early childhood; a time
when the PFC is exhibiting considerable growth (Otero & Barker, 2014). Though, significant
changes may be occurring in the latter half of early childhood. These advances in children's
EF are in line with their increasing ability to regulate their behaviour and emotions (P.
Anderson, 2008).
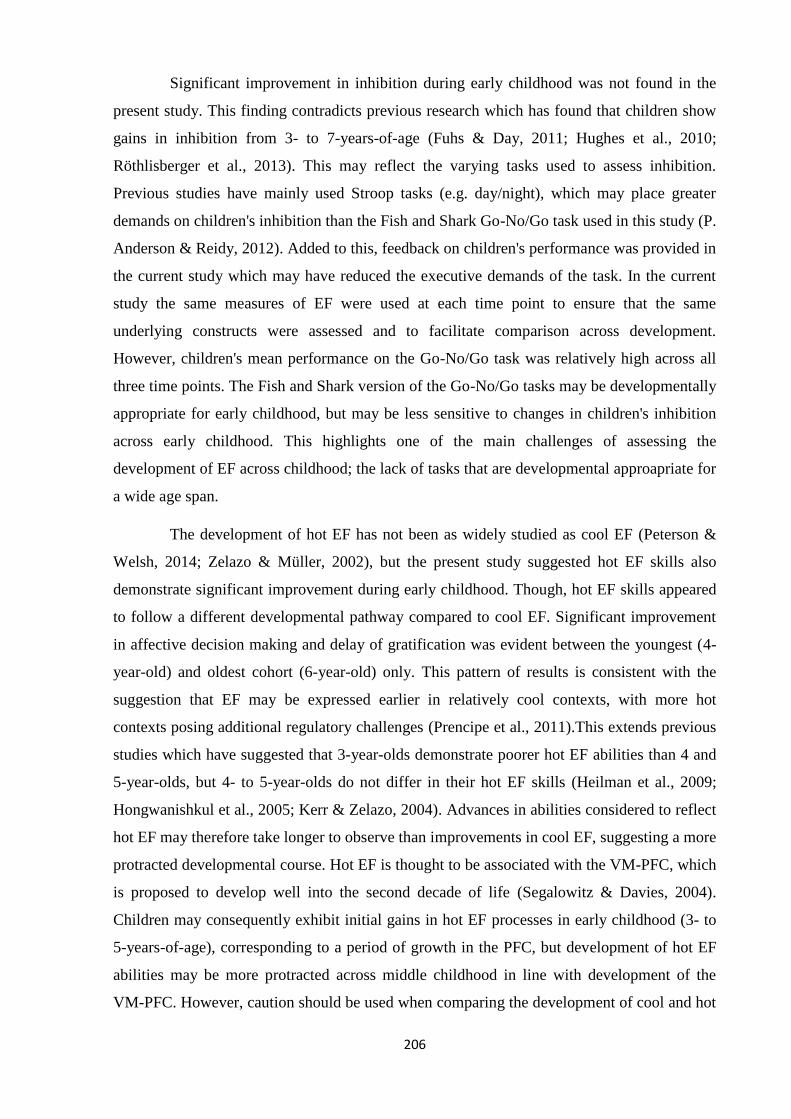
206
Significant improvement in inhibition during early childhood was not found in the
present study. This finding contradicts previous research which has found that children show
gains in inhibition from 3- to 7-years-of-age (Fuhs & Day, 2011; Hughes et al., 2010;
Röthlisberger et al., 2013). This may reflect the varying tasks used to assess inhibition.
Previous studies have mainly used Stroop tasks (e.g. day/night), which may place greater
demands on children's inhibition than the Fish and Shark Go-No/Go task used in this study (P.
Anderson & Reidy, 2012). Added to this, feedback on children's performance was provided in
the current study which may have reduced the executive demands of the task. In the current
study the same measures of EF were used at each time point to ensure that the same
underlying constructs were assessed and to facilitate comparison across development.
However, children's mean performance on the Go-No/Go task was relatively high across all
three time points. The Fish and Shark version of the Go-No/Go tasks may be developmentally
appropriate for early childhood, but may be less sensitive to changes in children's inhibition
across early childhood. This highlights one of the main challenges of assessing the
development of EF across childhood; the lack of tasks that are developmental approapriate for
a wide age span.
The development of hot EF has not been as widely studied as cool EF (Peterson &
Welsh, 2014; Zelazo & Müller, 2002), but the present study suggested hot EF skills also
demonstrate significant improvement during early childhood. Though, hot EF skills appeared
to follow a different developmental pathway compared to cool EF. Significant improvement
in affective decision making and delay of gratification was evident between the youngest (4-
year-old) and oldest cohort (6-year-old) only. This pattern of results is consistent with the
suggestion that EF may be expressed earlier in relatively cool contexts, with more hot
contexts posing additional regulatory challenges (Prencipe et al., 2011).This extends previous
studies which have suggested that 3-year-olds demonstrate poorer hot EF abilities than 4 and
5-year-olds, but 4- to 5-year-olds do not differ in their hot EF skills (Heilman et al., 2009;
Hongwanishkul et al., 2005; Kerr & Zelazo, 2004). Advances in abilities considered to reflect
hot EF may therefore take longer to observe than improvements in cool EF, suggesting a more
protracted developmental course. Hot EF is thought to be associated with the VM-PFC, which
is proposed to develop well into the second decade of life (Segalowitz & Davies, 2004).
Children may consequently exhibit initial gains in hot EF processes in early childhood (3- to
5-years-of-age), corresponding to a period of growth in the PFC, but development of hot EF
abilities may be more protracted across middle childhood in line with development of the
VM-PFC. However, caution should be used when comparing the development of cool and hot
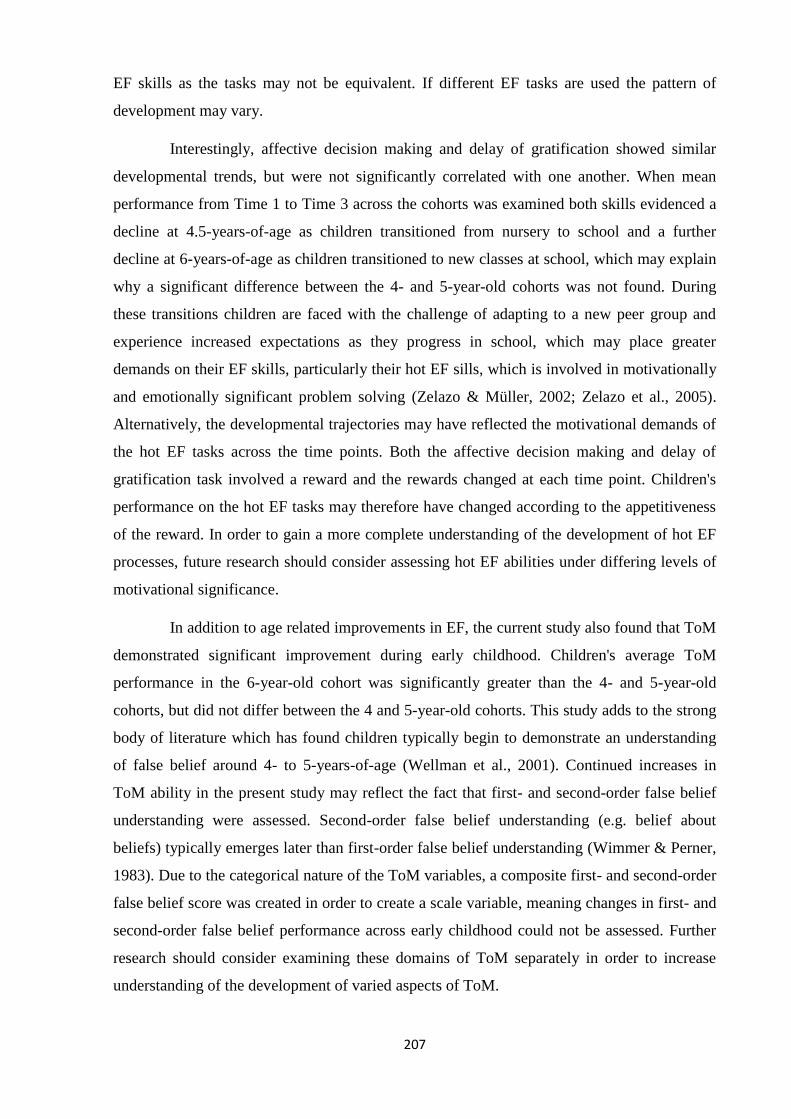
207
EF skills as the tasks may not be equivalent. If different EF tasks are used the pattern of
development may vary.
Interestingly, affective decision making and delay of gratification showed similar
developmental trends, but were not significantly correlated with one another. When mean
performance from Time 1 to Time 3 across the cohorts was examined both skills evidenced a
decline at 4.5-years-of-age as children transitioned from nursery to school and a further
decline at 6-years-of-age as children transitioned to new classes at school, which may explain
why a significant difference between the 4- and 5-year-old cohorts was not found. During
these transitions children are faced with the challenge of adapting to a new peer group and
experience increased expectations as they progress in school, which may place greater
demands on their EF skills, particularly their hot EF sills, which is involved in motivationally
and emotionally significant problem solving (Zelazo & Müller, 2002; Zelazo et al., 2005).
Alternatively, the developmental trajectories may have reflected the motivational demands of
the hot EF tasks across the time points. Both the affective decision making and delay of
gratification task involved a reward and the rewards changed at each time point. Children's
performance on the hot EF tasks may therefore have changed according to the appetitiveness
of the reward. In order to gain a more complete understanding of the development of hot EF
processes, future research should consider assessing hot EF abilities under differing levels of
motivational significance.
In addition to age related improvements in EF, the current study also found that ToM
demonstrated significant improvement during early childhood. Children's average ToM
performance in the 6-year-old cohort was significantly greater than the 4- and 5-year-old
cohorts, but did not differ between the 4 and 5-year-old cohorts. This study adds to the strong
body of literature which has found children typically begin to demonstrate an understanding
of false belief around 4- to 5-years-of-age (Wellman et al., 2001). Continued increases in
ToM ability in the present study may reflect the fact that first- and second-order false belief
understanding were assessed. Second-order false belief understanding (e.g. belief about
beliefs) typically emerges later than first-order false belief understanding (Wimmer & Perner,
1983). Due to the categorical nature of the ToM variables, a composite first- and second-order
false belief score was created in order to create a scale variable, meaning changes in first- and
second-order false belief performance across early childhood could not be assessed. Further
research should consider examining these domains of ToM separately in order to increase
understanding of the development of varied aspects of ToM.
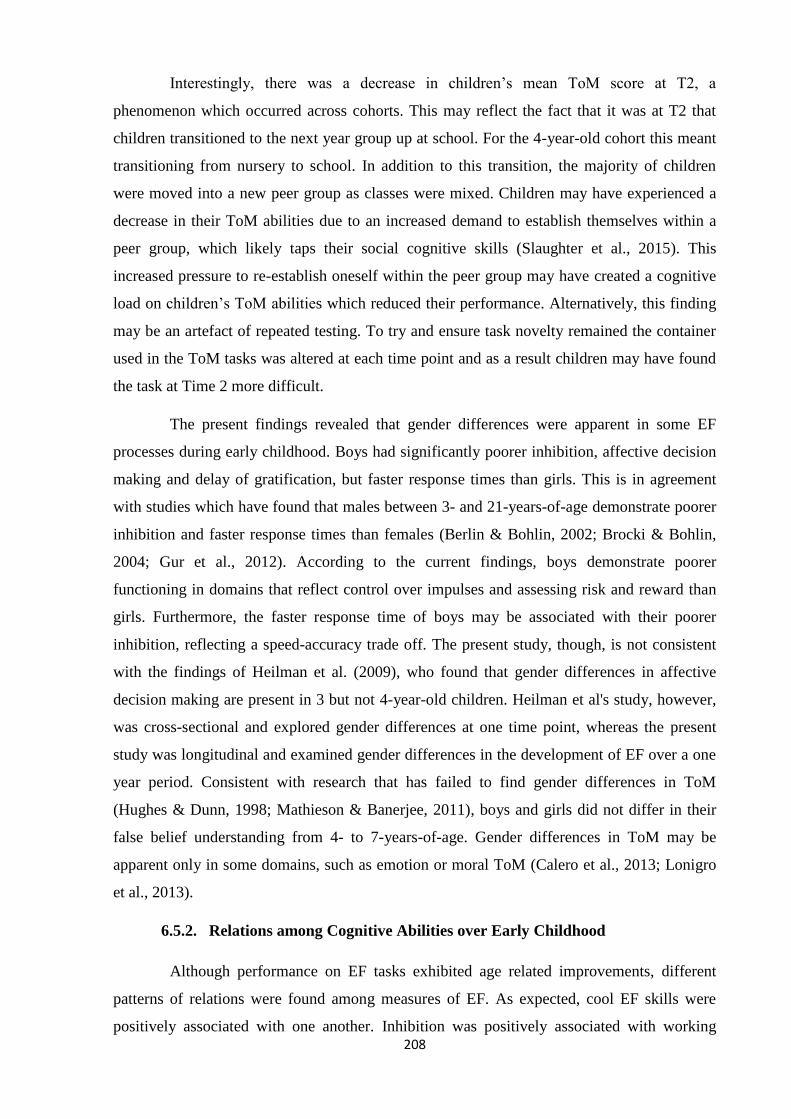
208
Interestingly, there was a decrease in children’s mean ToM score at T2, a
phenomenon which occurred across cohorts. This may reflect the fact that it was at T2 that
children transitioned to the next year group up at school. For the 4-year-old cohort this meant
transitioning from nursery to school. In addition to this transition, the majority of children
were moved into a new peer group as classes were mixed. Children may have experienced a
decrease in their ToM abilities due to an increased demand to establish themselves within a
peer group, which likely taps their social cognitive skills (Slaughter et al., 2015). This
increased pressure to re-establish oneself within the peer group may have created a cognitive
load on children’s ToM abilities which reduced their performance. Alternatively, this finding
may be an artefact of repeated testing. To try and ensure task novelty remained the container
used in the ToM tasks was altered at each time point and as a result children may have found
the task at Time 2 more difficult.
The present findings revealed that gender differences were apparent in some EF
processes during early childhood. Boys had significantly poorer inhibition, affective decision
making and delay of gratification, but faster response times than girls. This is in agreement
with studies which have found that males between 3- and 21-years-of-age demonstrate poorer
inhibition and faster response times than females (Berlin & Bohlin, 2002; Brocki & Bohlin,
2004; Gur et al., 2012). According to the current findings, boys demonstrate poorer
functioning in domains that reflect control over impulses and assessing risk and reward than
girls. Furthermore, the faster response time of boys may be associated with their poorer
inhibition, reflecting a speed-accuracy trade off. The present study, though, is not consistent
with the findings of Heilman et al. (2009), who found that gender differences in affective
decision making are present in 3 but not 4-year-old children. Heilman et al's study, however,
was cross-sectional and explored gender differences at one time point, whereas the present
study was longitudinal and examined gender differences in the development of EF over a one
year period. Consistent with research that has failed to find gender differences in ToM
(Hughes & Dunn, 1998; Mathieson & Banerjee, 2011), boys and girls did not differ in their
false belief understanding from 4- to 7-years-of-age. Gender differences in ToM may be
apparent only in some domains, such as emotion or moral ToM (Calero et al., 2013; Lonigro
et al., 2013).
6.5.2. Relations among Cognitive Abilities over Early Childhood
Although performance on EF tasks exhibited age related improvements, different
patterns of relations were found among measures of EF. As expected, cool EF skills were
positively associated with one another. Inhibition was positively associated with working
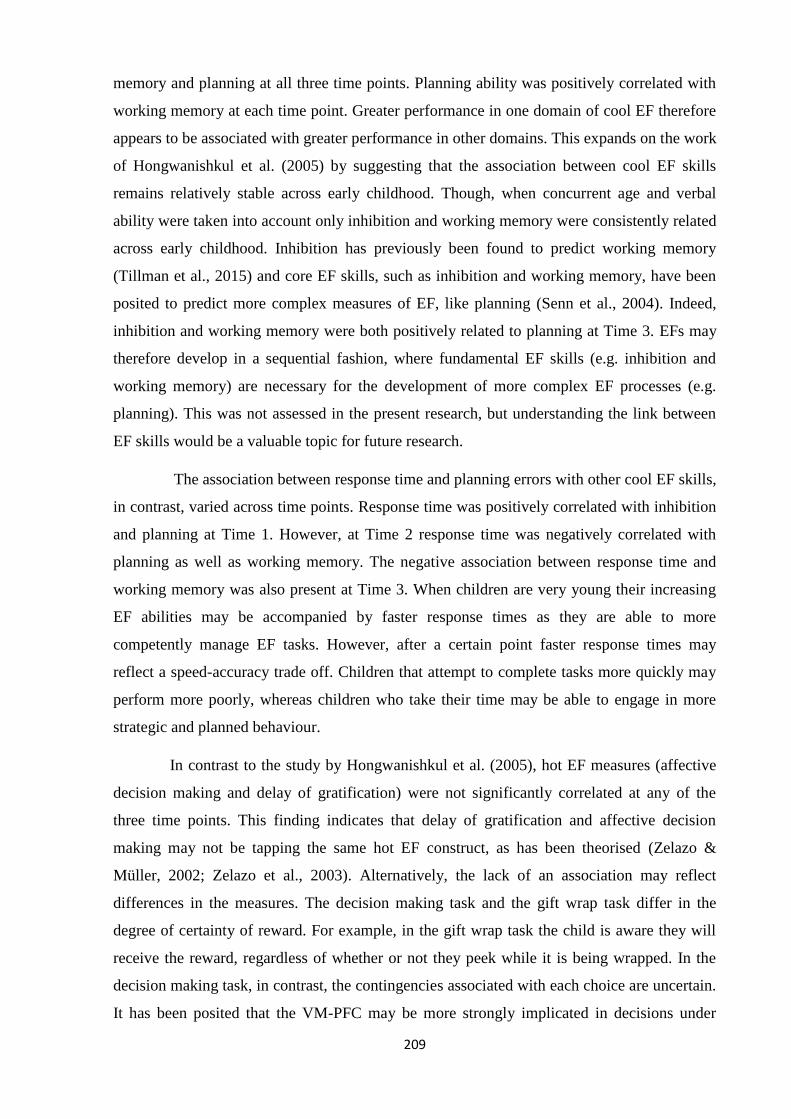
209
memory and planning at all three time points. Planning ability was positively correlated with
working memory at each time point. Greater performance in one domain of cool EF therefore
appears to be associated with greater performance in other domains. This expands on the work
of Hongwanishkul et al. (2005) by suggesting that the association between cool EF skills
remains relatively stable across early childhood. Though, when concurrent age and verbal
ability were taken into account only inhibition and working memory were consistently related
across early childhood. Inhibition has previously been found to predict working memory
(Tillman et al., 2015) and core EF skills, such as inhibition and working memory, have been
posited to predict more complex measures of EF, like planning (Senn et al., 2004). Indeed,
inhibition and working memory were both positively related to planning at Time 3. EFs may
therefore develop in a sequential fashion, where fundamental EF skills (e.g. inhibition and
working memory) are necessary for the development of more complex EF processes (e.g.
planning). This was not assessed in the present research, but understanding the link between
EF skills would be a valuable topic for future research.
The association between response time and planning errors with other cool EF skills,
in contrast, varied across time points. Response time was positively correlated with inhibition
and planning at Time 1. However, at Time 2 response time was negatively correlated with
planning as well as working memory. The negative association between response time and
working memory was also present at Time 3. When children are very young their increasing
EF abilities may be accompanied by faster response times as they are able to more
competently manage EF tasks. However, after a certain point faster response times may
reflect a speed-accuracy trade off. Children that attempt to complete tasks more quickly may
perform more poorly, whereas children who take their time may be able to engage in more
strategic and planned behaviour.
In contrast to the study by Hongwanishkul et al. (2005), hot EF measures (affective
decision making and delay of gratification) were not significantly correlated at any of the
three time points. This finding indicates that delay of gratification and affective decision
making may not be tapping the same hot EF construct, as has been theorised (Zelazo &
Müller, 2002; Zelazo et al., 2003). Alternatively, the lack of an association may reflect
differences in the measures. The decision making task and the gift wrap task differ in the
degree of certainty of reward. For example, in the gift wrap task the child is aware they will
receive the reward, regardless of whether or not they peek while it is being wrapped. In the
decision making task, in contrast, the contingencies associated with each choice are uncertain.
It has been posited that the VM-PFC may be more strongly implicated in decisions under

210
uncertainty (Bechara, 2004) and consequently affective decision making may be more
strongly associated with this region of the PFC and may be distinct from delay of
gratification. In line with this, affective decision making has been found to be dissociated
from working memory (Bechara, Damasio, Tranel, & Anderson, 1998). Understanding of the
organisation of hot EF lags behind that of cool EF and consequently there have been limited
hot EF skills proposed and as a result there are few hot EF measures available. The lack of an
association between these two proposed hot EF skills also leads one to question whether
separable cool and hot EF domains exist, or whether EF is just used differently under
affective and emotionally-neutral situations.
Affective decision making, as assessed by Gambling Tasks, may be a distinct
cognitive process that is not reflective of EF, cool or hot (Toplak, Sorge, Benoit, West, &
Stanovich, 2010). However, it is only relatively recently that research has begun to consider
hot as well as cool EF and, as a result understanding of the organisation of hot EF lags behind
that of cool EF (Peterson & Welsh, 2014; Zelazo & Müller, 2002). Neuropsychological and
neuroimaging studies strongly suggest that decision making and cool EF represent dissociable
functions, at least in adults. Impaired gambling task performance has been found to be
independent of performance on cool EF measures, including inhibition and working memory,
in adults (Bechara et al., 1998; Fonseca et al., 2012). However, other studies with adult
clinical and non-clinical populations have found affective decision making and cool EFs to be
highly related (Brand, Fujiwara, & Markowitsch, 2005; Hinson, Jameson, & Whitney, 2003).
The current findings add to this debate by suggesting that performance on affective decision
making and cool EF tasks may be dissociable and reflect different underlying factors in early
childhood. It remains an open question, though, whether these aspects of EF are indeed
dissociable or whether they are associated with development. Further identifying executive
processes that fall under the umbrella of hot EF and whether these skills represent a
dissociable hot construct is greatly needed. It could be that hot EF, although perhaps distinct
from cool EF, may be a heterogeneous construct. Issues with the conceptualisation of EF are
addressed further in the general discussion (Chapter 8).
In support of research which has posited that cool and hot EF skills are associated
(Happaney et al., 2004; Zelazo et al., 2005), delay of gratification was positively related to
inhibition, working memory and planning at all three time points. However, only inhibition
was consistently related to delay of gratification across early childhood when age and verbal
ability were taken into account. This may reflect the fact they both involve impulse control
(Kim et al., 2014; Kochanska et al., 1996, 2000). Affective decision making, in contrast, was
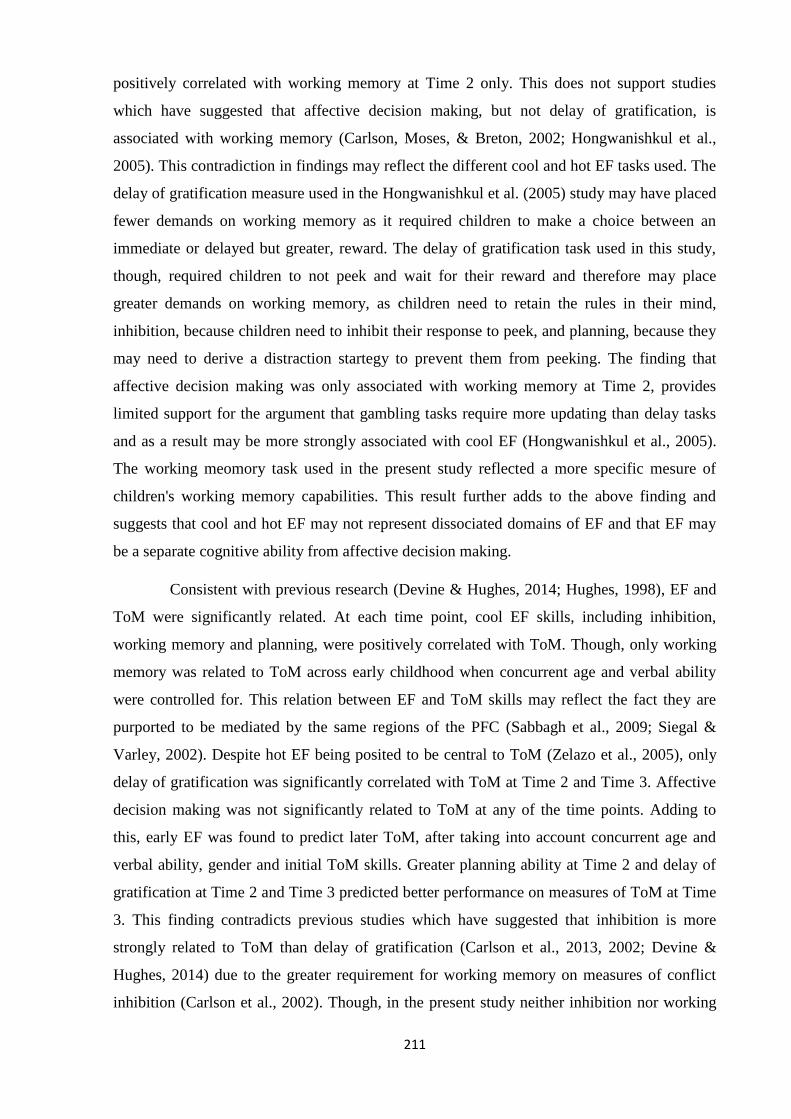
211
positively correlated with working memory at Time 2 only. This does not support studies
which have suggested that affective decision making, but not delay of gratification, is
associated with working memory (Carlson, Moses, & Breton, 2002; Hongwanishkul et al.,
2005). This contradiction in findings may reflect the different cool and hot EF tasks used. The
delay of gratification measure used in the Hongwanishkul et al. (2005) study may have placed
fewer demands on working memory as it required children to make a choice between an
immediate or delayed but greater, reward. The delay of gratification task used in this study,
though, required children to not peek and wait for their reward and therefore may place
greater demands on working memory, as children need to retain the rules in their mind,
inhibition, because children need to inhibit their response to peek, and planning, because they
may need to derive a distraction startegy to prevent them from peeking. The finding that
affective decision making was only associated with working memory at Time 2, provides
limited support for the argument that gambling tasks require more updating than delay tasks
and as a result may be more strongly associated with cool EF (Hongwanishkul et al., 2005).
The working meomory task used in the present study reflected a more specific mesure of
children's working memory capabilities. This result further adds to the above finding and
suggests that cool and hot EF may not represent dissociated domains of EF and that EF may
be a separate cognitive ability from affective decision making.
Consistent with previous research (Devine & Hughes, 2014; Hughes, 1998), EF and
ToM were significantly related. At each time point, cool EF skills, including inhibition,
working memory and planning, were positively correlated with ToM. Though, only working
memory was related to ToM across early childhood when concurrent age and verbal ability
were controlled for. This relation between EF and ToM skills may reflect the fact they are
purported to be mediated by the same regions of the PFC (Sabbagh et al., 2009; Siegal &
Varley, 2002). Despite hot EF being posited to be central to ToM (Zelazo et al., 2005), only
delay of gratification was significantly correlated with ToM at Time 2 and Time 3. Affective
decision making was not significantly related to ToM at any of the time points. Adding to
this, early EF was found to predict later ToM, after taking into account concurrent age and
verbal ability, gender and initial ToM skills. Greater planning ability at Time 2 and delay of
gratification at Time 2 and Time 3 predicted better performance on measures of ToM at Time
3. This finding contradicts previous studies which have suggested that inhibition is more
strongly related to ToM than delay of gratification (Carlson et al., 2013, 2002; Devine &
Hughes, 2014) due to the greater requirement for working memory on measures of conflict
inhibition (Carlson et al., 2002). Though, in the present study neither inhibition nor working

212
memory significantly predicted ToM. Studies that have found a stronger relation between
inhibition and ToM compared to delay of gratification have typically been carried out with
children between 3- and 5-years-old (Carlson et al., 2013, 2002; Devine & Hughes, 2014).
This may be the case in early childhood, therefore, but as children transition toward middle
childhood and develop a more advanced ToM (S. Miller, 2009) the relation between EF and
ToM may change. Further longitudinal research extending beyond early childhood is needed.
Early ToM did not show strong associations with later EF. After controlling for
concurrent age and verbal ability, gender and initial planning, only Time 2 ToM predicted
Time 3 planning. This supports previous studies which have suggested that EF provides a
platform for the emergence of ToM (Carlson et al., 2013; Hughes & Ensor, 2007; Hughes,
1998b). EF may affect the emergence of ToM as children may need to acquire a certain level
of EF before they can appreciate the possibility of different perspectives on a situation and the
experience of engaging in goal-directed behaviour may provide a foundation for children’s
developing understanding of intentionality (J. Russell, 1996). The present study suggests that
planning and delay of gratification are important as children near the end of early childhood.
Superior ability to engage in strategic behaviour and to withhold emotionally significant
situations may enable children to gain a greater understanding of the intentions of others and a
greater ability to withhold dominant, motivationally significant responses. Though, the
relation between planning and ToM may be bidirectional (Perner & Lang, 1999).
Understanding the links between others mental states and behaviour may also influence the
development of children's ability to plan their own behaviour.
The opposing expression account was not as strongly supported as ToM showed
limited predictive relations to EF. ToM at Time 2 predicted Time 3 planning only. If EF and
ToM tasks were tapping similar underlying constructs, as stated in the expression account,
then it is difficult to explain why such an asymmetry in the longitudinal relations would
emerge. Incidental task demands may attenuate the EF-ToM relation (Devine & Hughes,
2014), but it cannot explain fully the link between these two domains. However, although the
current results suggest that the relation between early EF and later false belief understanding
is stronger than the reverse, the EFs involved and direction of the effects may vary for other
aspects of ToM. Emerging awareness of desires, for example, may facilitate the development
of self-control (Perner & Lang, 1999).
It has been argued that ToM may be more strongly related to hot EF rather than cool
EF (Zelazo et al., 2005) due to their reliance on the same regions of the PFC (M. A. Sabbagh

213
et al., 2009; Siegal & Varley, 2002) and their involvement in emotionally significant problem
solving (Zelazo & Müller, 2002; Zelazo et al., 2005). Indeed, some researchers have argued
that ToM is a domain of hot EF (V. Anderson et al., 2008). In line with this the present
findings revealed that delay of gratification predicted later ToM towards the end of early
childhood. However, affective decision making was not related to ToM across early
childhood. This is surprising given the reliance of ToM on medial regions of the PFC
(Sabbagh et al., 2009), which are also associated with negotiating situations which involve
uncertainty of reward or punishment (Ridderinkhof, Ullsperger, & Crone, 2004). Affective
decision making, though, showed limited associations with the other measure of hot EF in the
present study (delay of gratification) and limited relations to cool EF skills. Affective decision
making may be mediated by the same brain regions as ToM, therefore, but may not be an
aspect of EF and as a result may not be associated with the emergence of ToM. However,
although false belief understanding is an important aspect of ToM, it is not the only ToM
ability. Affective decision making may be implicated in the more affective domains of ToM,
such as emotion or moral understanding. Indeed, hot EF is argued to be associated with
emotionally charged problem solving (which false belief tasks are not; Zelazo et al., 2005)
and some researchers have conceptualised positively emotionality as an aspect of hot EF
(Garner & Waajid, 2012). Hot EF may be a heterogeneous construct and not all hot EF skills
may be implicated in ToM.
6.5.3. Limitations
There were some limitations of this study. The tasks used to assess children’s
cognitive abilities have been widely used and are well validated measures, but they may not
have been developmentally sensitive across the entire age span of the study (4 – 7 years).
Although the tasks could have been altered at each time point, researchers cannot then be
certain that the same aspect of cognition is being assessed each time. Future attention should
be focused on developing more sensitive measures of cognitive abilities, particularly in
relation to hot EF components, that are appropriate for use in longitudinal research. In
addition, greater research attention needs to be directed towards identifying cool and hot EF
tasks that are of equivalent difficulty in order to facilitate comparisons of the development of
cool and hot domains of EF. A further limitation is that although multiple EF skills were
assessed, only one aspect of ToM was assessed: false belief understanding. ToM is a diverse
construct that includes a range of abilities and as result the relation between EF and ToM may
vary across different domains of ToM. Added to this, the sample size and cohort-sequential
design prevented pathways between individual cool and hot EF skills and ToM across

214
childhood being simultaneously analysed. This meant that the unique contribution of cool and
hot EF processes, while controlling for other EF skills, to ToM could not be examined.
Further research examining the relations between a wider range of EF and ToM tasks will
increase understanding of this association. Finally, direct and indirect pathways between cool
and hot EF skills as well as ToM could not be examined as the sample size was too small for
this type of analysis and the use of a cohort-sequential design meant that true longitudinal
relations between 4 and 7-years-of-age could not be modelled. Whether cool EF mediated the
relation between hot EF processes and ToM, for example, could therefore not be investigated.
Future research aimed at exploring predictive links between these abilities would greatly
increase understanding of how these abilities develop and may inform techniques to improve
cognitive abilities in children.
6.5.4. Conclusions
The current study added to the EF literature by considering the development of hot
EF components and its relation to both cool EF and ToM across early childhood. It is only
relatively recently that EF research has turned its attention to hot EF. Cool EF was a relatively
coherent construct across early childhood, whereas hot EF was not. The present findings
suggest that current conceptualisations of hot EF may need to be re-examined as affective
decision making was not related to delay of gratification and showed limited associations to
cool EF skills. Gambling style tasks may tap EF skills, but affective decision making may be
separate from EF. The present study also provided a first step towards considering the
predictive role of a wider range of hot EF skills in ToM across early childhood. While many
theoretically important questions about the EF–ToM relation remain, the current findings
highlight the importance of considering multiple related cognitive skills and provide a basis
for future research in this area. In order to increase understanding of the links between hot EF
skills and social understanding and behaviour greater research attention needs to be directed
towards establishing which executive processes fall under the hot umbrella and whether these
skills are dissociable from cool EF or form part of a unitary EF construct. This may lead to a
more unified body of literature.
Although further work needs to be undertaken in the measurement of EF,
(particularly hot EF) in early childhood, understanding the development of cool and hot EF
processes and their relation to other associated cognitive abilities, like ToM, in typically
developing children may provide important insights for understanding the link between
cognition and behaviour. EF and ToM have been implicated in children's peer directed
behaviour, including disruptive and aggressive behaviour (Brock et al., 2009; Hobson et al.,
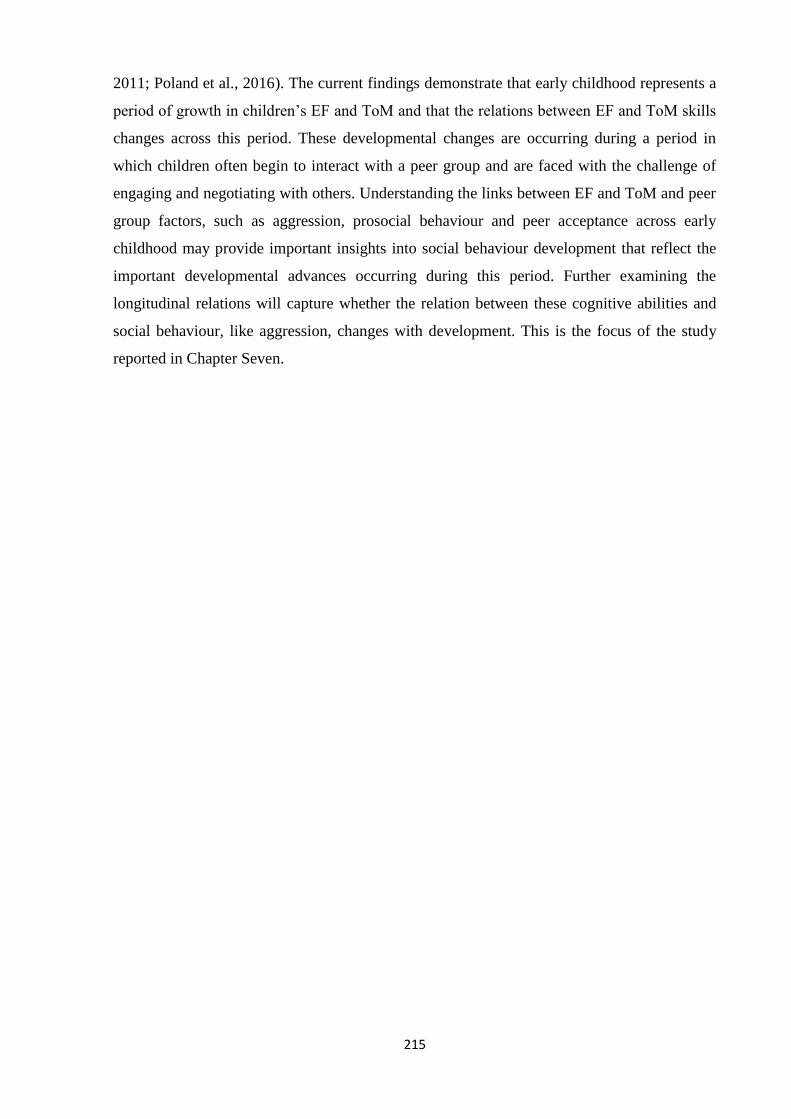
215
2011; Poland et al., 2016). The current findings demonstrate that early childhood represents a
period of growth in children’s EF and ToM and that the relations between EF and ToM skills
changes across this period. These developmental changes are occurring during a period in
which children often begin to interact with a peer group and are faced with the challenge of
engaging and negotiating with others. Understanding the links between EF and ToM and peer
group factors, such as aggression, prosocial behaviour and peer acceptance across early
childhood may provide important insights into social behaviour development that reflect the
important developmental advances occurring during this period. Further examining the
longitudinal relations will capture whether the relation between these cognitive abilities and
social behaviour, like aggression, changes with development. This is the focus of the study
reported in Chapter Seven.

216
7. STUDY 4: COGNITIVE PREDICTORS OF EARLY CHILDHOOD
AGGRESSION, PROSOCIAL BEHAVIOUR AND PEER
ACCEPTANCE: LONGITUDINAL ASSOCIATIONS
Abstract
Objective: EF and ToM have been implicated in children's social outcomes, including their
aggressive and prosocial behaviour and peer acceptance. Early childhood represents an
important period in children's cognitive and social development and as a result the relation
between cognitive skills, like EF and ToM, and social outcomes may change. However, there
has yet to be a longitudinal study that has examined the changing relations between EF and
ToM and social outcomes across early childhood. This study therefore aimed to examine the
longitudinal associations between, EF (cool and hot), ToM, aggression, prosocial behaviour
and peer acceptance across early childhood.
Method: 106 typically developing children were followed for 12 months. Children were
assigned to a cohort based on their age at the first assessment: 4-years-old (N = 29), 5-years-
old (N = 41) and 6-years-old (N = 36). Children completed a range of EF and ToM tasks and
Teachers reported on children’s aggression, prosocial behaviour and peer acceptance at three
time points approximately 6 months apart.
Results: The findings revealed that across early childhood aggression decreased and prosocial
behaviour and peer acceptance increased. However, subtypes of aggression showed different
patterns of development across the three cohorts. This study also revealed EF and ToM were
associated with reactive and proactive physical aggression at Time 1 and reactive relational
aggression at Time 2. Prosocial behaviour and aggression were related to peer acceptance
across early to middle childhood, whereas EF and ToM was related to Time 2 peer acceptance
only. EF and ToM predicted prosocial behaviour at Time 2 only.
Conclusion: This study suggested that children's aggression, prosocial behaviour and peer
acceptance undergo important changes during early to middle childhood. Further the present
study indicated that EF and ToM may be predictive of aggression in early childhood, but not
as children approach middle childhood. Though, the role of individual EF and ToM skills in
aggression may vary across subtypes as well as across developmental stages. Aggression and
prosocial behaviour appear to be more important to children's peer acceptance than their EF
and ToM across early to middle childhood.
217
7.1. Chapter Overview
This chapter outlines study four, which investigated the longitudinal associations at
three time points among EF, ToM, aggression, prosocial behaviour and peer acceptance
across early childhood. This study builds on the previous three studies as it examines whether
the relations between these cognitive abilities and social outcomes vary across early
childhood, a period which is characterised by rapid advancement in EF and ToM (P.
Anderson, 2008; Wellman et al., 2001). This will provide greater insight into the development
of aggressive and prosocial behaviour.
7.2. Introduction
The research presented in this chapter expands on the previous studies reported
earlier in this thesis (Chapter 4, 5, 6) as the longitudinal associations between cool and hot
EF, ToM and three related social domains, aggression, prosocial behaviour and peer
acceptance, from 4- to 7-years-of-age were explored. Social neuroscience models (as outlined
in the Literature Review, Chapter 2, Section 2.5.1) have suggested that EF and ToM are
fundamental to children's developing social behaviour (Beauchamp & V. Anderson, 2010;
Yeates et al., 2007). However, these models have paid limited attention to developmental
changes in children's cognitive and social skills. Building on prior studies (Rathert et al.,
2011; Werner et al., 2006; White et al., 2012), studies one (Chapter 4) and two (Chapter 5)
indicated that the role of EF and ToM in aggression may vary across the different functions
and forms in children 3- to 6-years-old. These studies, though, like the majority of previous
research (e.g. Garner & Waajid, 2012; Hughes, White, Sharpen, & Dunn, 2000; Willoughby,
Kupersmidt, Voegler-Lee, & Bryant, 2011), were carried out at one time point and the
longitudinal associations were not assessed. It cannot be determined from these correlational
studies therefore whether the role of EF and ToM in social behaviours, like aggression, and
the differential relations of EF and ToM in aggressive subtypes remain stable across early
childhood.
The main aim of this study was to examine the longitudinal links between EF, ToM,
subtypes of aggression and prosocial behaviour. During early childhood, children's EF and
ToM skills undergo rapid development and as a result children evidence marked gains in their
ability to regulate their emotions and behaviours, control their impulses, evaluate rewards and
losses and appreciate alternative perspectives (Study 3, Chapter 6; P. Anderson, 2008; V.
Anderson et al., 2008; Wellman et al., 2001). Once children have mastered more fundamental
EF (e.g. inhibition) and ToM (e.g. first-order false belief understanding) skills, more complex

218
abilities (e.g. planning, second-order false belief understanding) can develop which may
enable children to interact more effectively within the social world (S. Miller, 2009; Senn et
al., 2004). Added to this, across early childhood EF processes may become more
differentiated (Karmiloff-Smith, 1992) and consequently affective domains of EF may
become more distinct across childhood. These developmental advances may lead to changes
in the underlying role of EF and ToM in social domains. For instance, a prospective
longitudinal study that followed children from 3- to 6-years-of-age revealed that children's
ToM and inhibition (including cool and hot measures) significantly predicted children's
concurrent, but not their later aggression (Olson et al., 2011).
It is also during early childhood that children typically begin school (occurring at
around 4-years-of-age in the UK) and children are therefore required to learn to interact and
negotiate with their peers. Important developmental trends in children's social behaviour are
also evident during early childhood. Children's use of direct physical aggression tends to
decline and rates of indirect relational aggression increase across early to middle childhood
(Björkqvist et al., 1992; Gray et al., 2014; Monks et al., 2003). Further, greater bullying
behaviour is evident across early childhood (Belacchi & Farina, 2010a). Prosocial behaviour
has been found to increase over early childhood (Jackson & Tisak, 2001) and children show
increasing prosocial behaviour in response to bullying (e.g. defending) between 3- and 6-
years-of-age (Belacchi & Farina, 2010). The relation between EF, ToM and aggression may
vary not just due to the rapid developments in children’s cognitive abilities, but also the
changing nature of their social behaviours during early childhood. Early aggression and
prosocial behaviour should therefore be understood within the context of early childhood and
emerging cognitive control and social understanding.
Limited longitudinal research has examined the role of EF and ToM in prosocial and
aggressive behaviour and the few studies that have were only carried out across two time
points and considered broad cognitive and aggressive constructs (Olson et al., 2011; Razza &
Blair, 2009). In these studies, social behaviours were considered at two time points, but most
cognitive abilities were only assessed at the initial time point. These studies as a result may
fail to capture the changing nature of children's cognitive and social skills. Added to this,
individual EF skills were not taken into account nor were the function and form of aggression.
Studies one (Chapter 5) and two (Chapter 6) indicated that the role of individual EF skills
across subtypes of aggression may vary and that not all EF skills are negatively related to
aggression. Failing to consider individual EF subcomponents and the heterogeneous nature of
aggression may therefore be resulting in a limited understanding of the development of
219
aggressive behaviour. The current study was the first to examine the longitudinal relation
between cool and hot EF skills, ToM, prosocial behaviour and the function and form of
aggression in order to increase understanding of the varied nature of aggression.
A further aim of the present study was to explore the intersection between cognitive
abilities, aggressive and prosocial behaviour and peer acceptance across early childhood.
Study two (Chapter 5) provided the first examination of the role of EF and ToM as well as
aggressive and prosocial behaviour in peer acceptance. Study two revealed that prosocial
behaviour, but not cognitive abilities, predicted peer acceptance. Children become
increasingly concerned with peer acceptance as they approach later childhood and
adolescence (Parker et al., 2006; Silk et al., 2012) and developmental changes in children's
aggressive and prosocial behaviour as well as their EF and ToM may differently impact their
standing within the peer group. Study two indicated that physical and relational aggression
were positively associated with peer acceptance, but as children are socialised away from
aggression (Eivers et al., 2012) and direct aggression declines (Broidy et al., 2003; Cleverley
et al., 2012), the relation between aggression and peer acceptance may change. Understanding
the interaction of the form and function of aggression in predicting peer acceptance may have
important implications not just for understanding the development of peer acceptance, but
also the varying outcomes of subtypes of aggression. The present study was therefore the first
study to examine the longitudinal relations among these variables and explore whether the
findings of study two remain stable across early childhood.
The study presented in this chapter investigated the longitudinal associations among
EF, ToM, aggression, prosocial behaviour and peer acceptance in three cohorts (4, 5 and 6-
year-olds) over the course of 12 months. The present study will build on the earlier studies of
this thesis (Chapters 4, 5 and 6) by identifying whether the relation of cognitive correlates and
social outcomes of the function and form of aggression as well as prosocial behaviour change
across early childhood. This study may therefore have important implications not just for
current theoretical models of the development of aggressive and prosocial behaviour, but may
also have practical implications for interventions as it will increase understanding of the
associated factors of aggression and prosocial behaviour. Based on the findings of study one
and two it was tentatively hypothesised that EF and ToM would be associated with proactive
and reactive physical aggression across the three time points and that EF and ToM may be
associated with proactive and reactive relational aggression in older children. Hypotheses
regarding the role of individual EF skills were not generated due to limited research in this
area. It was also tentatively hypothesised that prosocial and aggressive behaviour would be

220
related to peer acceptance across the three time points, following the results of study two.
Specific hypotheses regarding prosocial behaviour were not made as prior results have been
mixed.
7.3. Method
The methodology is briefly presented in this section. A more detailed description of
the method is presented in Chapter Three.
7.3.1. Design
A cohort-sequential design was used. Three cohorts of children (4, 5 and 6-year-old
cohort) were followed over a 12 month period. Data were collected at initial recruitment
(Time 1) and approximately 6 (Time 2) and 12 months (Time 3) after recruitment. It was at
Time 2 that children transitioned into a different school year. At each of the time points
children's social behaviour and their cool and hot EF abilities and ToM were assessed. Two
child factors were also measured to control for confounding effects: gender (boy = 1, girl = 2),
and verbal ability.
7.3.2. Participants
One hundred and six children (51 (48.11%) boys and 55 (51.89%) girls) were
selected to participate in the current study. Children were assigned to one of three cohorts
based on their age: 4-year-old (N = 29, M = 50.41 months, SD = 2.76 months, range = 46 – 54
months), 5-year-old (N = 41, M = 58.89 months, SD = 3.09 months, range = 55 – 65 months)
and 6-year-old cohort (N = 36, M = 73.22 months, SD = 4.20 months, range = 66 – 80
months). At the second time point 99 children were followed up (7% attrition) and at the third
time point 98 children were followed up (1% attrition). The Class Teachers and Teaching
Assistants of the children participating in the study were also recruited.
7.3.3. Measures
Children completed three cool EF tasks, measuring: inhibition, planning and working
memory. Proportion of correct No-Go trials on the Fish and Shark Go/No-Go task (Simpson
& Riggs, 2006) was used as a measure of inhibition. Planning was assessed as overall score
on the ToL (Shallice, 1982). Overall score on the Digit Span forward and backwards subtests
(WISC-III; Wechsler, 1991) were used as a measure of working memory. Children also
completed two hot EF tasks, measuring: affective decision making and delay of gratification.

221
Whether predominately advantageous or disadvantageous decisions were made during the last
three trial blocks on the CDMT was used as a measure of affective decision making. Delay of
gratification was assessed as children's overall score on the Gift Wrap task (Kochanska et al.,
1996). Children’s ToM was assessed using two first-order false belief tasks (unexpected
contents (Wimmer & Perner, 1983) and change of location (Baron-Cohen et al., 1985) and
one second-order false belief task (change of location; Riviere, 1997). A composite ToM
score was created (Monks et al., 2005). The BPVS was used to assess children's receptive
vocabulary (Dunn et al., 1982). Standardised scores according to age were used. To maintain
task novelty at each time point, some aspects of tasks were altered (for a description of these
changes refer to the Chapter 3). Teaching staff reported on the function and form of children’s
aggression using the PPRA (Ostrov & Crick, 2007) and on children’s prosocial behaviour and
peer acceptance using subscales from the PSBS (Crick et al., 1997).
7.3.4. Procedure
Data for the present study was collected between April 2014 and July 2015. There
were three assessment phases, approximately 6 months apart. At each time point children
completed a series of tasks individually with the researcher in a fixed order. The tasks were
spread across three sessions: session 1: CDMT and BPVS; session 2: ToL, digit span, change
of location and Go/No-Go; session 3: unexpected contents, Riviere change of location, peer
nomination interview and gift wrap. Teaching staff completed the questionnaires at their own
convenience during each testing phase.
7.3.5. Data Analysis
To understand the underlying longitudinal role of EF and ToM in subtypes of
aggression, prosocial behaviour and peer acceptance across early childhood, the analysis was
split into three parts. First, the development of aggression, prosocial behaviour and peer
acceptance across the three time points was examined. Pearson's correlations were initially
conducted in order to establish whether these behaviours remained relatively stable across
early childhood. After this, Mixed ANOVAs were carried out to explore the development of
aggression, prosocial behaviour and peer acceptance across the three time points. This
technique was used because it allows mean changes within and across participants to be
examined (Mayers, 2013). The within-subject factor was time (T1, T2, T3), which allowed for
change in social outcomes across the duration of the study to be explored. The between-
subject factor was cohort (4, 5 and 6-year-old cohort), meaning differences across age groups
could be investigated. Cohort was included as a between-subject factor because the age span

222
of the sample was wide and previous research has indicated that aggressive and prosocial
behaviour may vary depending on children's age (Belacchi & Farina, 2010; Wildeboer et al.,
2015). Gender was also included in the model as a between-subject factor in order to
investigate whether boys and girls differed in their level of aggression and prosocial
behaviour across the course of a year. Gender was included as previous evidence has
indicated that girls are more prosocial and less physically aggressive, but more relationally
aggressive, than boys (Fabes & Eisenberg, 1998; R. Smith et al., 2009). Follow up Pairwise
Comparisons were carried out to examine main effects in more detail. All follow up analyses
were adjusted using for multiple comparisons using a Bonferroni correction.
Next, in line with the approach used by Bull et al., (2008), an overall picture of the
role of EF and ToM in children's aggression, prosocial behaviour and peer acceptance was
obtained and then the relations within each time point were explored as important cognitive
and social changes occur during early childhood. The role of Time 1 EF and ToM in
children's initial and developmental trajectories of aggression, prosocial behaviour and peer
acceptance was investigated. Individual intercept and regression slopes were calculated in
SPSS for each participant in order to model children's initial level of aggression, prosocial
behaviour and peer acceptance and the development of these social outcomes across the three
time points (Pfister, Schwarz, Carson, & Jancyzk, 2013). Individual regression slopes indicate
whether children's aggression, prosocial behaviour or peer acceptance is increasing or
decreasing over time. Hierarchical regressions were then carried out to explore the predictive
relation between Time 1 EF and ToM and children's initial aggression, prosocial behaviour
and peer acceptance as well as trajectories of these behaviours from Time 1 to Time 3,
following the approach of Bull et al. (2008). Hierarchical regression analyses were used as
this technique allows the simultaneous contribution of EF and ToM predictors to the outcome
variables, as well as the predictive role of individual EF and ToM skills, to be explored (J.
Cohen et al., 2003; Kelley & Maxwell, 2010). Further, hierarchical regressions enabled Time
1 age and verbal ability and child gender to be controlled for. This part of the analysis
therefore reflects the overall findings from Time 1 to Time 3.
Following the approach of Bull et al., (2008), after the role of initial cognitive
abilities on the development of aggressive and prosocial behaviour and peer acceptance was
established, the underlying role of EF and ToM in aggression, prosocial behaviour and peer
acceptance at each time point was examined. It is important to explore the association
between variables at each time point due to the changing nature of social behaviour and
cognitive abilities during early childhood which may mean the association between EF, ToM,
223
aggression, prosocial behaviour and peer acceptance may change across development. To
examine the relation between the predictor variables (EF and ToM) and aggressive subtypes,
prosocial behaviour and peer acceptance within and across time points, correlation and
regression analyses were carried out. Correlations were first conducted to gain an initial
understanding of the bivariate relations between individual predictor variables and social
outcomes at each time point. A series of hierarchical regressions were then carried out to
explore the joint role of predictors in children's aggression, prosocial behaviour and peer
acceptance at each time point. Hierarchical regressions were used because this method
enables the role of EF and ToM in social outcomes to be examined while controlling for
cognitive skills at the previous time point (B. Cohen, 2008; J. Cohen et al., 2003). Before the
analysis was conducted, outliers were Winsorized as they may bias the results (Reifman &
Keyton, 2010). Outliers were replaced with the next highest value that was not an outlier. This
approach was adopted, rather than removing the outliers, because it preserves the information
that a case had the highest or lowest value in the distribution but protects against the influence
of the outlier on analyses (Reifman & Keyton, 2010).
7.4. Results
7.4.1. Aggression
7.4.1.1. Mean change in aggression from Time 1 to Time 3
Descriptive statistics for aggressive subtypes at each time point are reported in Table
7.1. Pearson's correlations were carried out to examine the association between Teacher
reported aggressive behaviour across the three time points and correlations are reported in
Table 7.2. Partial correlations, controlling for age and gender, were also carried out as
children's levels of aggression have been found to show differences across age groups and
genders (Study 1, Chapter 4; Study 2, Chapter 5; Belacchi & Farina, 2010; Spieker et al.,
2012). Aggressive subtypes were significantly and positively correlated across time points,
indicating that reported levels of aggression remained relatively stable across early childhood.
Children who scored higher at Time 1 on subtypes of aggression were more likely to also
score high on these behaviours at Time 2 and 3. These correlations remained significant even
after age and gender were controlled for, apart from for the correlation between Time 1 and
Time 2 proactive physical aggression.
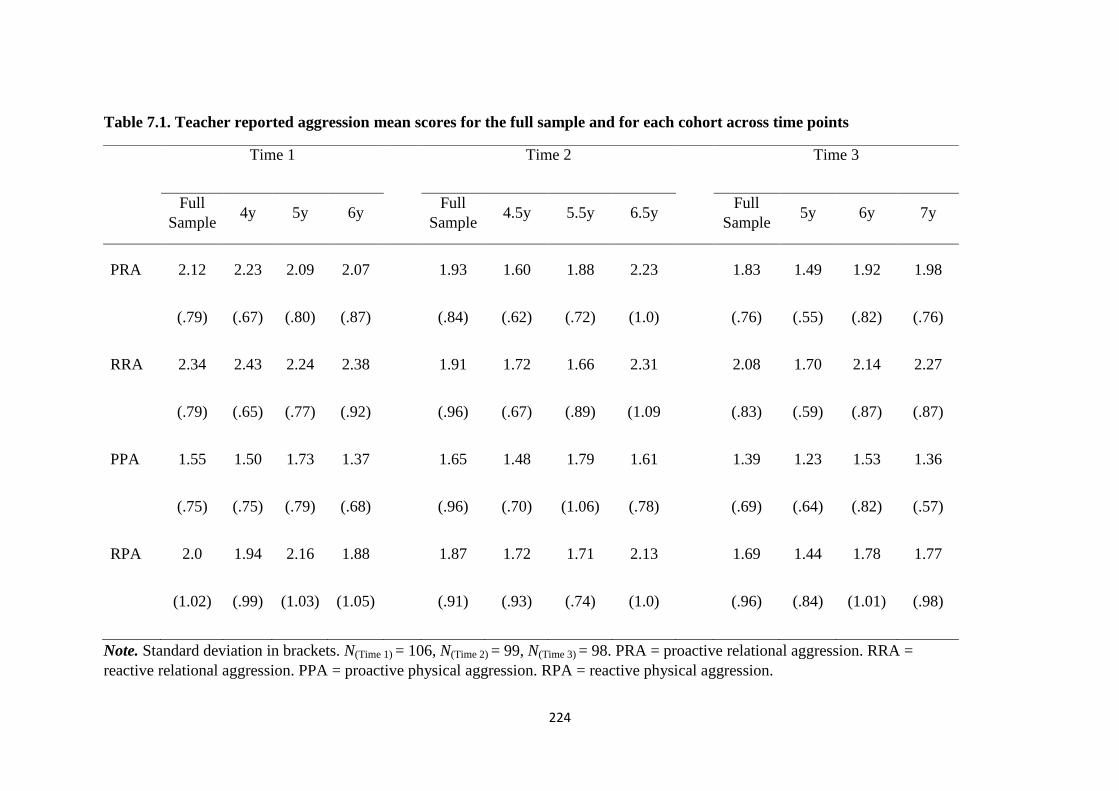
224
Table 7.1. Teacher reported aggression mean scores for the full sample and for each cohort across time points
Note. Standard deviation in brackets. N(Time 1) = 106, N(Time 2) = 99, N(Time 3) = 98. PRA = proactive relational aggression. RRA =
reactive relational aggression. PPA = proactive physical aggression. RPA = reactive physical aggression.
Time 1 Time 2 Time 3
Full
Sample 4y 5y 6y
Full
Sample 4.5y 5.5y 6.5y
Full
Sample 5y 6y 7y
PRA 2.12
(.79)
2.23
(.67)
2.09
(.80)
2.07
(.87)
1.93
(.84)
1.60
(.62)
1.88
(.72)
2.23
(1.0)
1.83
(.76)
1.49
(.55)
1.92
(.82)
1.98
(.76)
RRA 2.34
(.79)
2.43
(.65)
2.24
(.77)
2.38
(.92)
1.91
(.96)
1.72
(.67)
1.66
(.89)
2.31
(1.09
2.08
(.83)
1.70
(.59)
2.14
(.87)
2.27
(.87)
PPA 1.55
(.75)
1.50
(.75)
1.73
(.79)
1.37
(.68)
1.65
(.96)
1.48
(.70)
1.79
(1.06)
1.61
(.78)
1.39
(.69)
1.23
(.64)
1.53
(.82)
1.36
(.57)
RPA 2.0
(1.02)
1.94
(.99)
2.16
(1.03)
1.88
(1.05)
1.87
(.91)
1.72
(.93)
1.71
(.74)
2.13
(1.0)
1.69
(.96)
1.44
(.84)
1.78
(1.01)
1.77
(.98)

225
Table 7.2. Correlations across time 1 to 3 for subtypes of aggression
T1 PRA T1 RRA T1 PPA T1 RPA T2 PRA T2 RRA T2 PPA T2 RPA T3 PRA T3 RRA T3 PPA T3 RPA
T1 PRA - .95***
(.95***)
.59***
(.55***)
.62***
(.58***)
.33***
(.39***)
.34***
(.41***)
.13
(.13)
.17
(.18*)
.34***
(.39***)
.33***
(.38***)
.14
(.12)
.16
(.16)
T1 RRA - .53***
(.50***)
.61***
(.59***)
.35***
(.39***)
.36***
(.40***)
.11
(.10)
.21*
(.21*)
.36***
(.38***)
.36***
(.38***)
.15
(.13)
.20*
(.19*)
T1 PPA - .91***
(.90***)
.11
(.19*)
.20*
(.29**)
.19*
(.21*)
.13
(.16)
.20*
(.25**)
.20*
(.25**)
.27**
(.26**)
.28**
(.28**)
T1 RPA - .18*
(.25**)
.28**
(.36**)
.25**
(.26**)
.25**
(.27**)
.27**
(.30**)
.27**
(.31**)
.31**
(.29**)
.38***
(.38***)
T2 PRA - .86***
(.85***)
.62***
(.64***)
.73***
(.72***)
.78***
(.76***)
.79***
(.77***)
.52***
(.54***)
.57***
(.58***)
T2 RRA - .65** *
(.67***)
.69***
(.68***)
.64***
(.61***)
.68***
(.66***
.54***
(.56***)
.60***
(.61***)
T2 PPA - .77***
(.79***)
.53***
(.54***)
.52***
(.55***)
.71***
(.72***)
.73***
(.74***)
T2 RPA - .61***
(.59***)
.60***
(.58***)
.66***
(.67***)
.72***
(.71***)
T3 PRA - .95***
(.95***)
.62***
(.64***)
.65***
(.64***)
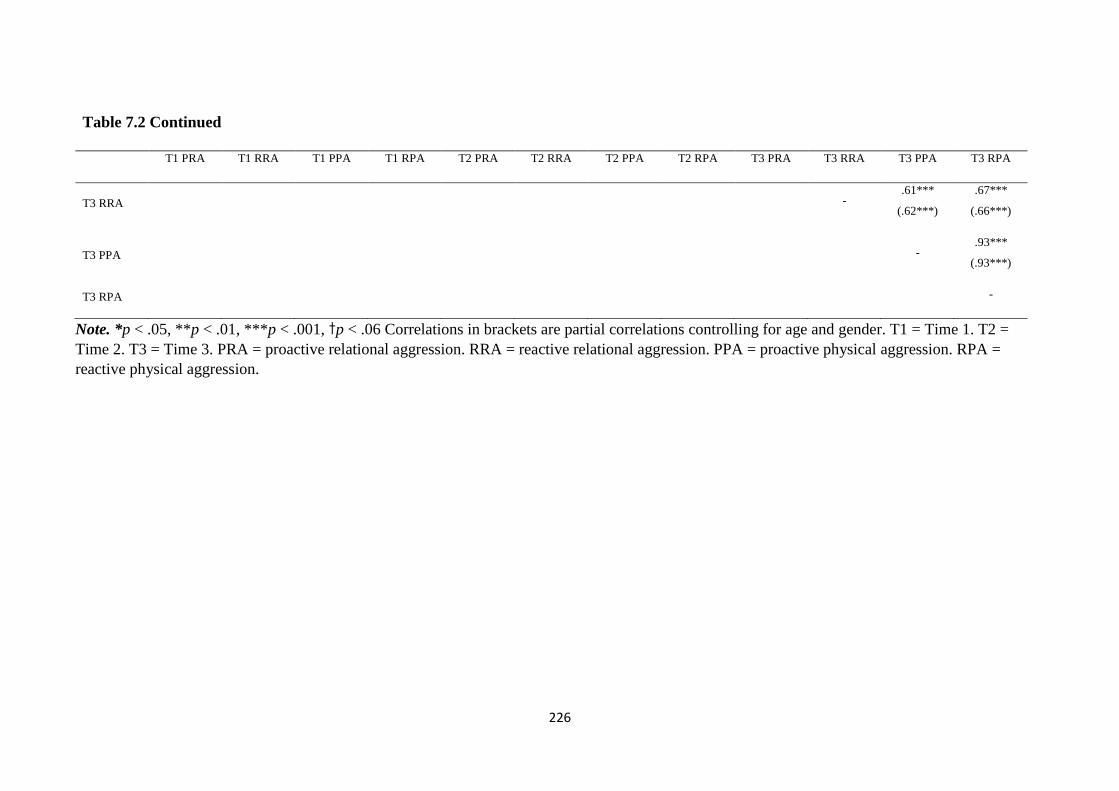
226
Table 7.2 Continued
T1 PRA T1 RRA T1 PPA T1 RPA T2 PRA T2 RRA T2 PPA T2 RPA T3 PRA T3 RRA T3 PPA T3 RPA
T3 RRA - .61***
(.62***)
.67***
(.66***)
T3 PPA - .93***
(.93***)
T3 RPA -
Note. *p < .05, **p < .01, ***p < .001, †p < .06 Correlations in brackets are partial correlations controlling for age and gender. T1 = Time 1. T2 =
Time 2. T3 = Time 3. PRA = proactive relational aggression. RRA = reactive relational aggression. PPA = proactive physical aggression. RPA =
reactive physical aggression.

227
A 3(T1, T2, T3) x 3(4-, 5-, 6-year-old cohort) x 2(boy, girl) mixed ANOVA was
carried out for each subtype of aggression to examine whether children’s aggression differed
across the three time points as well as between cohorts and genders. Assumptions of Mixed
ANOVA were first investigated. Histograms and Q-Q plots of Teacher reported aggressive
subtypes at each time point revealed the assumption of normality was violated in some
instances. Proactive physical aggression deviated from normality at all three time points. At
Time 3, reactive physical aggression also was not normally distributed. As discussed in
Chapter Five, the central limit theory posits that when the sample size is sufficiently large the
distribution of sample means is assumed to be normally distributed and parametric tests can
be carried out (B. Cohen, 2008; Little, 2013). Further, mixed ANOVA techniques are robust
to minor violations of normality (Mayers, 2013).
A second assumption of mixed ANOVA is sphericity (Mayers, 2013). Mauchly’s test
indicated that the assumption of sphericity was violated for all subtypes of aggression (p <
.001). Due to the violation of sphericity a Greenhouse-Geisser correction was applied to
analyses. A further assumption is homogeneity of between-group variances. Levene’s tests
indicated that variances were not equal for Time 1 reactive relational aggression (p = .03),
Time 2 proactive relational aggression (p = .02), Time 2 reactive relational aggression (p =
.02), and Time 2 proactive physical aggression (p = .04). The assumption of homogeneity of
variances was therefore violated in some instances. Mixed ANOVA, however, is a robust
technique against unequal variances between groups when group sizes are relatively equal
(Mayers, 2013; Zimmerman, 2004), so mixed ANOVA's were still carried out.
Proactive relational aggression. The mixed ANOVA revealed that there was a
significant main effect of time, F(1.52, 140.24) = 10.70, p < .001, ŋp2
= .10. Pairwise
comparisons suggested that proactive relational aggression was significantly higher at Time 1
compared to Time 2 (p = .02) and Time 3 (p < .001), but scores at Time 2 and Time 3 did not
significantly differ (p = .16). There was no significant main effect of cohort, F(2, 92) = 1.29,
p = .28, ŋp2
= .03. However, there was a significant interaction between time point and cohort,
F(3.05, 140.24) = 5.89, p = .001, ŋp2
= .11. Figure 7.1 reveals that in the 4-year-old cohort
there seems to be a decreasing trend across time, but that for the 5 and 6-year-old cohort their
mean level or proactive relational aggression is relatively stable. There was no significant
main effect of gender, F(1, 92) = 2.52, p = .12, ŋp2
= .03. There was no significant interaction
between time and gender, F(1.52, 140.24) = 0.39, p = .68, ŋp2
= .004, or between cohort and
gender, F(2, 92) = 1.22, p = .30, ŋp2
= .03. There was also no significant three way interaction
between time, cohort and gender, F(3.05, 140.24) = 0.69, p = .56, ŋp2
= .02.
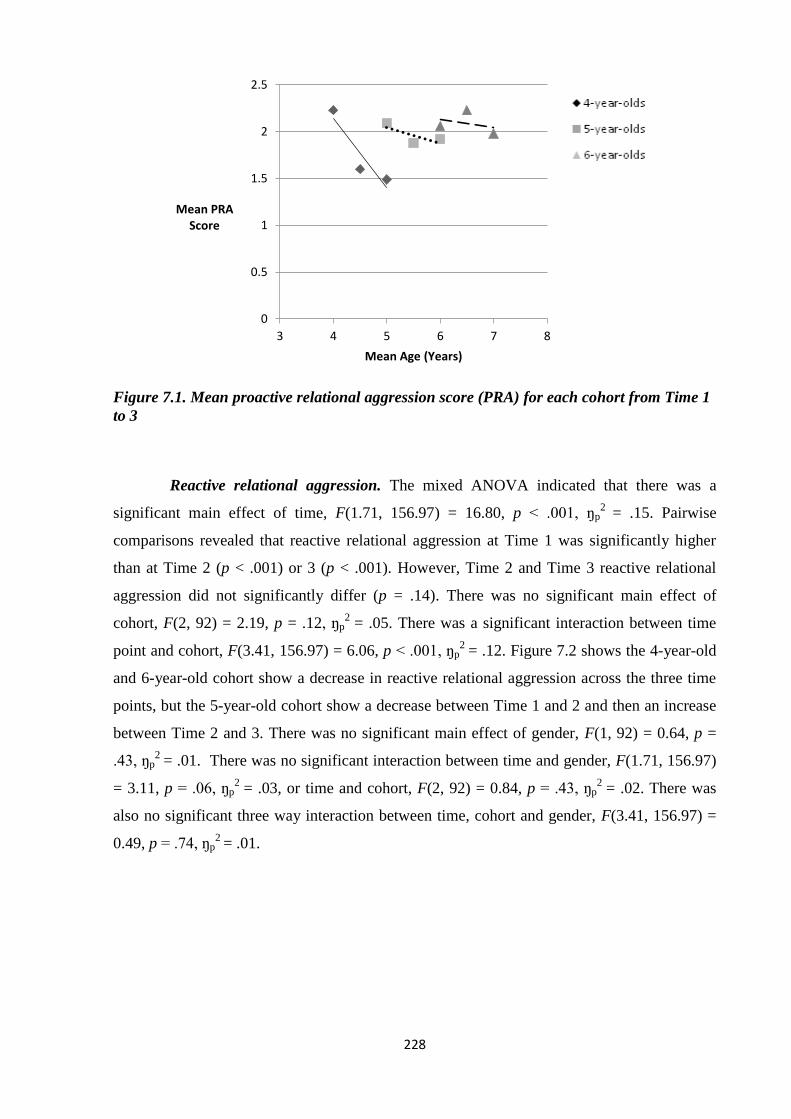
228
Figure 7.1. Mean proactive relational aggression score (PRA) for each cohort from Time 1
to 3
Reactive relational aggression. The mixed ANOVA indicated that there was a
significant main effect of time, F(1.71, 156.97) = 16.80, p < .001, ŋp2
= .15. Pairwise
comparisons revealed that reactive relational aggression at Time 1 was significantly higher
than at Time 2 (p < .001) or 3 (p < .001). However, Time 2 and Time 3 reactive relational
aggression did not significantly differ (p = .14). There was no significant main effect of
cohort, F(2, 92) = 2.19, p = .12, ŋp2
= .05. There was a significant interaction between time
point and cohort, F(3.41, 156.97) = 6.06, p < .001, ŋp2
= .12. Figure 7.2 shows the 4-year-old
and 6-year-old cohort show a decrease in reactive relational aggression across the three time
points, but the 5-year-old cohort show a decrease between Time 1 and 2 and then an increase
between Time 2 and 3. There was no significant main effect of gender, F(1, 92) = 0.64, p =
.43, ŋp2
= .01. There was no significant interaction between time and gender, F(1.71, 156.97)
= 3.11, p = .06, ŋp2
= .03, or time and cohort, F(2, 92) = 0.84, p = .43, ŋp2
= .02. There was
also no significant three way interaction between time, cohort and gender, F(3.41, 156.97) =
0.49, p = .74, ŋp2
= .01.
0
0.5
1
1.5
2
2.5
3 4 5 6 7 8
Mean PRA Score
Mean Age (Years)
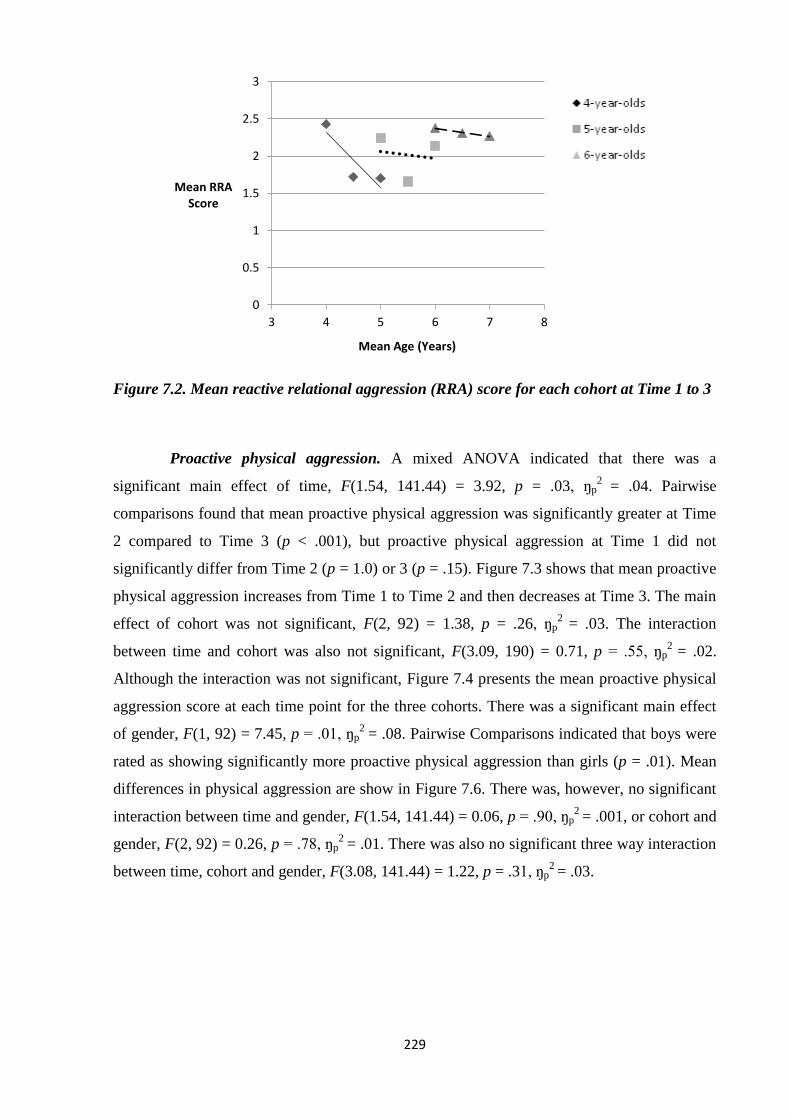
229
Figure 7.2. Mean reactive relational aggression (RRA) score for each cohort at Time 1 to 3
Proactive physical aggression. A mixed ANOVA indicated that there was a
significant main effect of time, F(1.54, 141.44) = 3.92, p = .03, ŋp2
= .04. Pairwise
comparisons found that mean proactive physical aggression was significantly greater at Time
2 compared to Time 3 (p < .001), but proactive physical aggression at Time 1 did not
significantly differ from Time 2 (p = 1.0) or 3 (p = .15). Figure 7.3 shows that mean proactive
physical aggression increases from Time 1 to Time 2 and then decreases at Time 3. The main
effect of cohort was not significant, F(2, 92) = 1.38, p = .26, ŋp2
= .03. The interaction
between time and cohort was also not significant, F(3.09, 190) = 0.71, p = .55, ŋp2
= .02.
Although the interaction was not significant, Figure 7.4 presents the mean proactive physical
aggression score at each time point for the three cohorts. There was a significant main effect
of gender, F(1, 92) = 7.45, p = .01, ŋp2
= .08. Pairwise Comparisons indicated that boys were
rated as showing significantly more proactive physical aggression than girls (p = .01). Mean
differences in physical aggression are show in Figure 7.6. There was, however, no significant
interaction between time and gender, F(1.54, 141.44) = 0.06, p = .90, ŋp2
= .001, or cohort and
gender, F(2, 92) = 0.26, p = .78, ŋp2
= .01. There was also no significant three way interaction
between time, cohort and gender, F(3.08, 141.44) = 1.22, p = .31, ŋp2
= .03.
0
0.5
1
1.5
2
2.5
3
3 4 5 6 7 8
Mean RRA Score
Mean Age (Years)
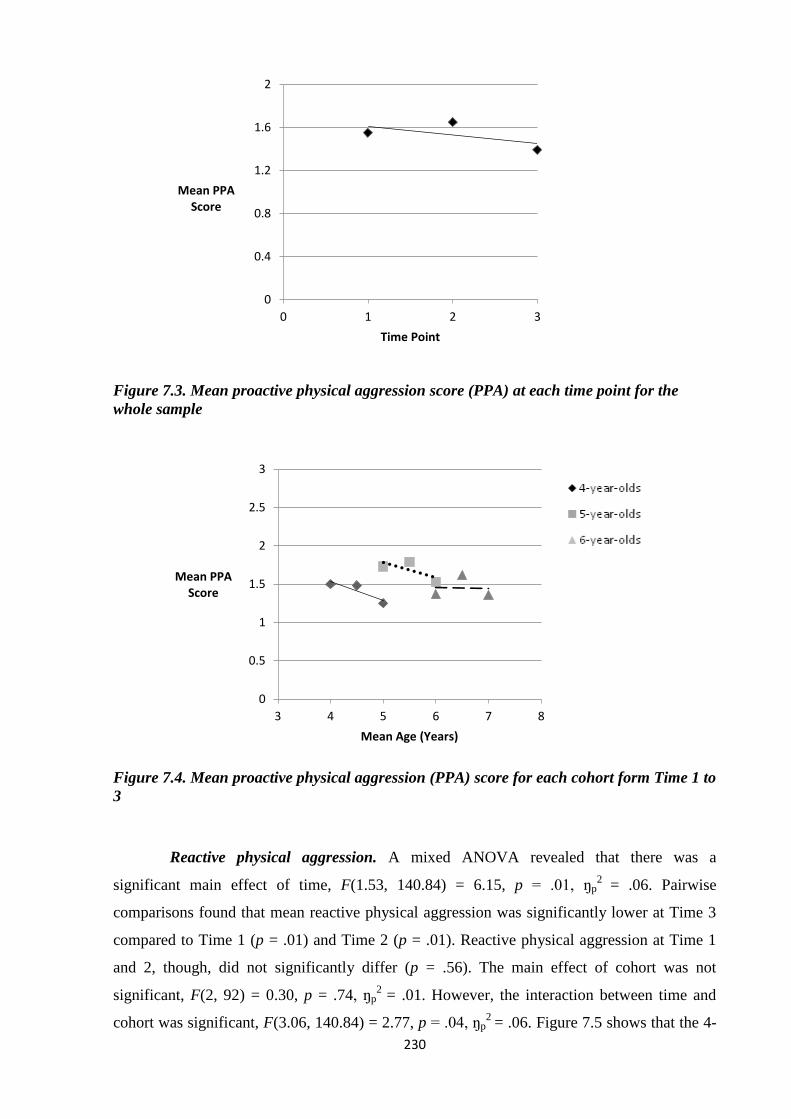
230
Figure 7.3. Mean proactive physical aggression score (PPA) at each time point for the
whole sample
Figure 7.4. Mean proactive physical aggression (PPA) score for each cohort form Time 1 to
3
Reactive physical aggression. A mixed ANOVA revealed that there was a
significant main effect of time, F(1.53, 140.84) = 6.15, p = .01, ŋp2
= .06. Pairwise
comparisons found that mean reactive physical aggression was significantly lower at Time 3
compared to Time 1 (p = .01) and Time 2 (p = .01). Reactive physical aggression at Time 1
and 2, though, did not significantly differ (p = .56). The main effect of cohort was not
significant, F(2, 92) = 0.30, p = .74, ŋp2
= .01. However, the interaction between time and
cohort was significant, F(3.06, 140.84) = 2.77, p = .04, ŋp2
= .06. Figure 7.5 shows that the 4-
0
0.4
0.8
1.2
1.6
2
0 1 2 3
Mean PPA Score
Time Point
0
0.5
1
1.5
2
2.5
3
3 4 5 6 7 8
Mean PPA Score
Mean Age (Years)

231
year-old cohort appear to evidence a peak in reactive physical aggression at Time 2, whereas
reactive physical aggression appears to decrease at Time 2 and then increase at Time 3 for the
5 and 6-year-old cohort. There was a significant main effect of gender, F(1, 92) = 8.47, p =
.01, ŋp2
= .08. Pairwise Comparisons revealed that boys were rated as showing significantly
more reactive physical aggression than girls (p = .01). There was no significant interaction
between time and gender, F(1.53, 140.84) = 1.27, p = .28, ŋp2
= .01, or cohort and gender,
F(2, 92) = 0.27, p = .77, ŋp2
= .01. There was no significant three way interaction between
time, cohort and gender, F(3.06, 140.84) = 1.89, p = .12, ŋp2
= .04.
Figure 7.5. Mean reactive physical aggression score (RPA) for each cohort from Time 1 to
3
Summary. Overall the results indicated that children's aggressive behaviour showed
significant change over time. Proactive and reactive, physical and relational aggression
evidenced a significant decrease over time. However, the main effect of time was qualified by
a significant time and cohort interaction for proactive and reactive relational aggression and
reactive (but not proactive) physical aggression. Mean change in proactive and reactive
relational aggression for each cohort appeared to follow a similar trend. The 4-year-old cohort
showed a decreasing trend in relational aggression across the three time points, whereas the 5-
year-old cohort showed an initial decrease in relational aggression at Time 2, followed by an
increase at Time 3. Relational aggression appeared to remain relatively stable across the three
time points for the 6-year-old cohort. Mean change in reactive physical aggression varied
across each cohort. The 4-year-old cohort demonstrated an increase in mean reactive physical
0
0.5
1
1.5
2
2.5
3
3 4 5 6 7 8
Mean RPA Score
Mean Age (Years)

232
aggression at Time 2, whereas the 5-year-old and 6-year-old cohort exhibited a decrease at
Time 2. Changes in subtypes of aggression therefore appear to vary between cohorts, apart
from for proactive physical aggression. Added to this, there were gender differences in
physical aggression. Boys exhibited significantly higher mean proactive and reactive physical
aggression across the three time points compared to girls.
Figure 7.6. Mean scores for subtypes of aggression across the three time points for boys
and girls. *p ≤ .01. PRA = proactive relational aggression. RRA = reactive relational
aggression. PPA = proactive physical aggression. RPA = reactive physical
7.4.1.2. Association between Time 1 EF and ToM and Trajectories of
Aggression
To examine the role of Time 1 EF and ToM on developmental trajectories of
subtypes of aggression over early childhood, individual intercept and regression slopes were
generated for each participant. Intercept and slope values were then used as dependent
variables in hierarchical regressions to examine whether EF and ToM at Time 1 predicted
initial aggressive behaviour as well as development of these behaviours over time. In step
one, gender along with Time 1 age and verbal ability were entered to control for potential
confounding effects. In step 2, EF and ToM skills were entered simultaneously. Assumptions
of multiple regression were met. The Durbin-Watson values were within the accepted range,
indicating that the assumption of independent errors was met (Savin & White, 1977; Wang &
Jain, 2003). VIF and tolerance values indicated that there was no evidence of multicollinearity
between predictors (J. Cohen et al., 2003; Kelley & Maxwell, 2010).
*
*
*
*
0
0.5
1
1.5
2
2.5
PRA RRA PPA RPA
Boys
Girls

233
Proactive relational aggression. Control variables significantly accounted for 10%
of the variance in intercept scores for proactive relational aggression, R2
= .10, F(3, 95) =
3.36, p = .02. However, the inclusion of EF and ToM into the model did not significantly
increase the amount of variance explained, ΔR2
= .08, ΔF(6, 86) = 1.34, p = .25. Control
variables were not significantly associated with development of proactive relational
aggression, R2
= .06, F(3, 95) = 1.94, p = .13. EF and ToM did not significantly contribute to
understanding of development of proactive relational aggression, ΔR2
= .06, ΔF(6, 86) = 1.05, p
= .40. For full regression results see Table 7.3.
Reactive relational aggression. Control variables were not significantly associated
with intercept scores for reactive relational aggression, R2
= .04, F(3, 96) = 1.41, p = .25. EF
and ToM were not significantly predictive of intercept scores for reactive relational
aggression, ΔR2
= .10, ΔF(6, 87) = 1.62, p = .15. Further, control variables were not
significantly related to development of reactive relational aggression, R2
= .05, F(3, 96) =
1.45, p = .22. EF and ToM did not significantly increase understanding of the development of
reactive relational aggression, ΔR2
= .07, ΔF(6, 87) = 1.12, p = .36. . For full regression results
see Table 7.3.
Proactive physical aggression. Control variables did not significantly predict
intercept scores for proactive physical aggression, R2
= .08, F(3, 78) = 2.13, p = .10. EF and
ToM were also not significantly related to intercept scores for proactive physical aggression,
ΔR2
= .11, ΔF(6, 69) = 1.56, p = .17. Control variables were not significantly associated with
development of proactive physical aggression, R2
= .07, F(3, 78) = 1.96, p = .13. EF and ToM
did not significantly contribute to understanding of development of proactive physical
aggression, ΔR2
= .06, ΔF(6, 69) = 0.74, p = .62. For full regression results see Table 7.4.
Reactive physical aggression. Control variables accounted for 9% of the variance in
intercept scores for reactive physical aggression, but this association was marginally
significant, R2
= .09, F(3, 86) = 2.80, p = .05. The inclusion of EF and ToM into the model,
however, significantly increased the amount of variance in intercept scores for reactive
physical aggression explained to 25%, ΔR2
= .16, ΔF(6, 77) = 2.72, p = .02. Inhibition was a
significant independent negative predictor. Control variables did not significantly predict the
development of reactive physical aggression, R2
= .06, F(3, 86) = 1.60, p = .20. Added to this,
EF and ToM were not significantly related to development of reactive physical aggression,
ΔR2
= .11, ΔF(6, 77) = 1.62, p = .15. For full regression results see Table 7.4.

234
Table 7.3. Time 1 EF and ToM as predictors of initial and development of proactive and reactive relational aggression
PRA Initial PRA Slope RRA Initial RRA Slope
ΔR2
B SE B ß ΔR2
B SE B ß ΔR2
B SE B ß ΔR2
B SE B ß
Step 1 .10* .06 .04 .05
T1 Age -0.02 .01 -.22* 0.02 .01 .24* -0.02 .01 -.15 0.01 .01 .20†
Gender 0.41 .20 .20† -0.09 .14 -.07 0.24 .21 .12 0.03 .14 .02
T1 VA -0.01 .01 -.18 0.002 .004 .05 -0.01 .01 -.13 -0.001 .004 -.03
Step 2 .08 .06 .10 .07
Inhibition -0.89 .69 -.17 0.23 .49 .06 -1.31 .73 -.24 0.57 .47 .16
Planning -0.04 .03 -.18 0.01 .02 .07 -0.05 .03 -.22 0.01 .02 .07
WM 0.08 .05 .23 -0.06 .03 -.24 0.06 .05 .18 -0.06 .03 -.25
ADM 0.13 .24 .06 -0.06 .17 -.04 0.23 .25 .10 -0.10 .16 -.06
Delay of
Grat.
-0.16 .15 -.12 0.13 .11 .15 -0.12 .16 -.09 0.10 .10 .12
ToM -0.09 .14 -.08 -0.07 .10 -.09 -0.05 .15 -.04 -0.01 .10 -.02
Note. *p < .05, **p < .01, ***p < .001, †p = .05. T1 = Time 1. PRA = proactive relational aggression. RRA = reactive relational aggression.
PPA = proactive physical aggression. RPA = reactive physical aggression. VA = verbal ability. WM = working memory. ADM = affective
decision making. Delay of Grat. = delay of gratification. ToM = theory of mind.

235
Table 7.4. Time 1 EF and ToM as predictors of initial and development of proactive and reactive physical aggression
PPA Initial PPA Slope RPA Initial RPA Slope
ΔR2
B SE B ß ΔR2
B SE B ß ΔR2
B SE B ß ΔR2
B SE B ß
Step 1 .08 .07 .09† .06
T1 Age -0.02 .01 -.18 0.02 .01 .24* -0.02 .01 -.17 0.02 .01 .22†
Gender -0.24 .23 -.12 -0.17 .15 -.13 -0.27 .27 -.11 -0.13 .15 -.10
T1 VA -0.01 .01 -.19 0.003 .004 .08 -0.02 .01 -.25* <.001 .01 .01
Step 2 .11 .06 .16* .11
Inhibition -1.53 .76 -.29† 0.85 .49 .26 -2.51 .85 -.38** 1.29 .48 .37
Planning -0.04 .03 -.15 -0.002 .02 -.01 -0.03 .04 -.09 -0.01 .02 -.07
WM 0.01 .05 .04 0.01 .03 .06 -0.01 .06 -.03 -0.03 .03 -.13
ADM 0.44 .26 .19 -0.10 .17 -.07 0.34 .29 .12 0.04 .17 .03
Delay of
Grat.
0.05 .16 .04 -0.12 .10 -.16 0.02 .19 .01 0.01 .10 .01
ToM -0.21 .16 -.17 0.02 .10 .03 -0.29 .18 -.20 -0.07 .10 -.09
Note. *p < .05, **p < .01, ***p < .001, †p < .05. T1 = Time 1. PRA = proactive relational aggression. RRA = reactive relational aggression.
PPA = proactive physical aggression. RPA = reactive physical aggression. VA = verbal ability. WM = working memory. ADM = affective
decision making. Delay of Grat. = delay of gratification. ToM = theory of mind.

236
Summary. The results suggested EF and ToM at Time 1 predicted initial reactive
physical aggression only. In particular, poor inhibition appeared to be central to increased
reactive physical aggression initially. EF and ToM, though, did not significantly predict the
development of subtypes of aggression during early childhood.
7.4.1.3. Association between EF, ToM and Aggression at each Time Point
The relation between cognitive abilities and subtypes of aggression at each time
point was examined. Correlational analyses were first carried out to examine the association
between predictor variables (EF and ToM) and aggressive behaviour at each time point.
Descriptive statistics for predictor variables across time points are reported in Chapter Six,
Table. 6.1. Pearson's correlations were first conducted to explore initial correlations and then
partial correlations controlling for age and verbal ability were carried out. Age was controlled
for because the sample spanned a wide age range and cognitive abilities and social behaviour
change with age (Fuhs & Day, 2011; Hongwanishkul et al., 2005; Wellman et al., 2001).
Verbal ability was controlled for because verbal ability has been linked to cognitive processes
(V. Anderson et al., 2008; Cuevas et al., 2014; Lussier et al., 2012).
Correlations between variables at Time 1 are presented in Table 7.3. The analyses
revealed that cool EF skills were significantly correlated with some measures of aggression at
Time 1. Inhibition was negatively associated with reactive and proactive, physical and
relational aggression. However, when age and verbal ability were controlled for, poor
inhibition was only significantly related to increased reactive and proactive physical
aggression. Planning ability was negatively correlated with proactive and reactive physical
aggression and proactive relational aggression. These correlations were no longer significant
after age and verbal ability were taken into account. Working memory was negatively related
to physical, but not relational forms of aggression. Though, when age and verbal ability were
controlled for these relations did not remain significant. At Time 1, only hot delay of
gratification was associated with some measures of aggression. Physical, but not relational,
aggression was negatively associated with delay of gratification and this relation remained
after controlling for age and verbal ability. Affective decision making was not significantly
correlated with any of the subtypes of aggression at Time 1. ToM was negatively related to
physical aggression. This relation did not remain significant after taking into account age and
verbal ability.

237
Table 7.5. Association among cognitive abilities and aggression at Time 1
PRA RRA PPA RPA
Inhibition -.22*
(-.16)
-.21*
(-.15)
-.38***
(-.31***)
-.48***
(-.42***)
Planning -.20*
(-.15)
-.17
(-.16)
-.22*
(-.11)
-.20*
(-.11)
Working Memory -.03
(.07)
-.01
(.04)
-.22*
(-.12)
-.21*
(-.15)
Affective
Decision Making
.05
(.04)
.10
(.09)
.15
(.15)
.10
(.08)
Delay of
Gratification
-.16
(-.14)
-.15
(-.15)
-.30**
(-.29**)
-.35***
(-.34***)
ToM -.08
(.02)
-.02
(.04)
-.23*
(-.15)
-.23*
(-.13)
Note. Partial correlations controlling for age and verbal ability are reported in brackets. *p <
.05, **p < .01, ***p < .001, one tailed. PRA = Proactive Relational Aggression. RRA =
Reactive Relational Aggression. PPA = Proactive Physical Aggression. RPA = Reactive
Physical Aggression. ToM = Theory of Mind.
Correlations between variables at Time 2 are presented in Table 7.6. At Time 2,
approximately 6 months after Time 1, the associations between variables had changed.
Working memory was negatively associated with physical subtypes of aggression only after
taking into account age and verbal ability. Added to this delay of gratification was negatively

238
correlated with reactive physical and relational aggression, after controlling for age and
verbal ability only. ToM was negatively associated with relational, but not physical,
aggression. However, after controlling for age and verbal ability this association did not
remain significant.
Table 7.6. Association among cognitive abilities and aggression at Time 2
PRA RRA PPA RPA
Inhibition -.07
(-.10)
-.11
(-.15)
-.08
(-.07)
-.18
(-.19†)
Planning
-.04
(-.19†)
-.03
(-.18)
-.11
(-.13)
-.11
(-.20†)
Working Memory
.04
(-.17)
.02
(-.18)
-.15
(-.21*)
-.13
(-.26**)
Affective Decision
Making
.04
(-.06)
.00
(-.10)
-.05
(-.07)
-.01
(-.09)
Delay of
Gratification
.003
(-.12)
-.13
(- .26*)
-.15
(-.17)
-.18
(-.25*)
ToM 25*
(-.14)
.25*
(.14)
.08
(.09)
.09
(.04)
Note. Partial correlations controlling for age and verbal ability are reported in brackets. *p < .05, **p
< .01, ***p < .001, †p < .06, one-taiked. PRA = Proactive Relational Aggression. RRA = Reactive
Relational Aggression. PPA = Proactive Physical Aggression. RPA = Reactive Physical Aggression.
ToM = Theory of Mind.
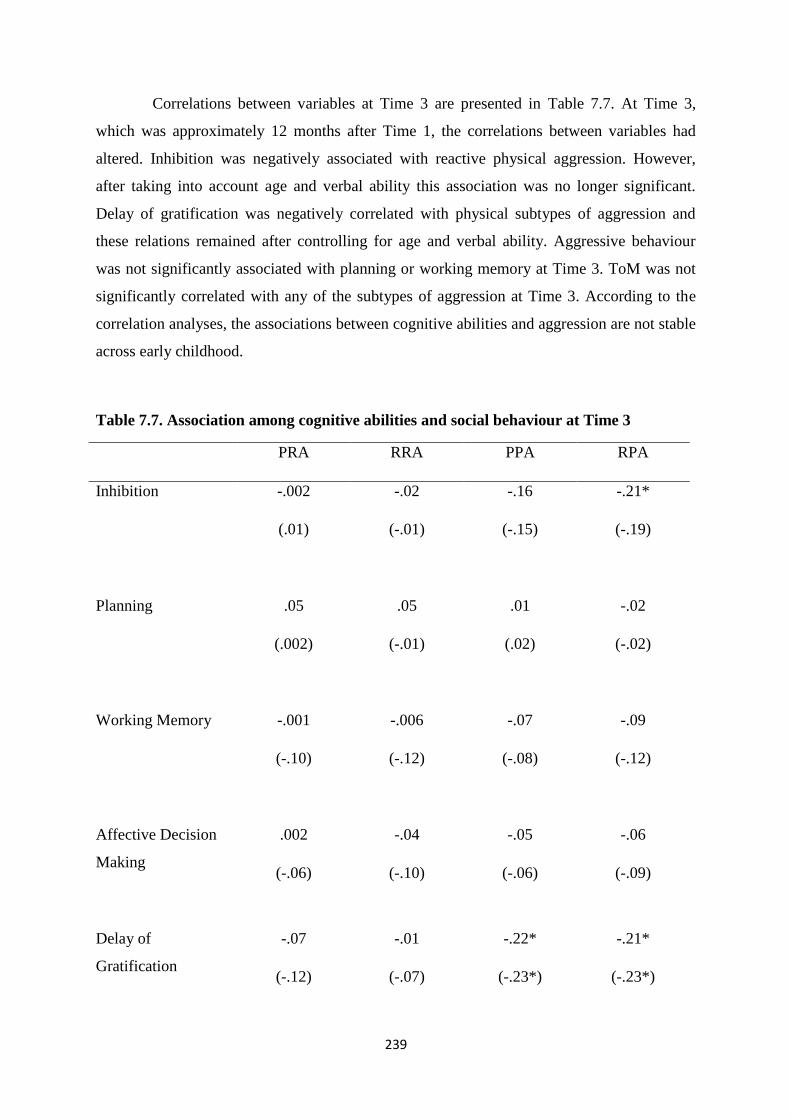
239
Correlations between variables at Time 3 are presented in Table 7.7. At Time 3,
which was approximately 12 months after Time 1, the correlations between variables had
altered. Inhibition was negatively associated with reactive physical aggression. However,
after taking into account age and verbal ability this association was no longer significant.
Delay of gratification was negatively correlated with physical subtypes of aggression and
these relations remained after controlling for age and verbal ability. Aggressive behaviour
was not significantly associated with planning or working memory at Time 3. ToM was not
significantly correlated with any of the subtypes of aggression at Time 3. According to the
correlation analyses, the associations between cognitive abilities and aggression are not stable
across early childhood.
Table 7.7. Association among cognitive abilities and social behaviour at Time 3
PRA RRA PPA RPA
Inhibition
-.002
(.01)
-.02
(-.01)
-.16
(-.15)
-.21*
(-.19)
Planning
.05
(.002)
.05
(-.01)
.01
(.02)
-.02
(-.02)
Working Memory
-.001
(-.10)
-.006
(-.12)
-.07
(-.08)
-.09
(-.12)
Affective Decision
Making
.002
(-.06)
-.04
(-.10)
-.05
(-.06)
-.06
(-.09)
Delay of
Gratification
-.07
(-.12)
-.01
(-.07)
-.22*
(-.23*)
-.21*
(-.23*)

240
ToM .01
(-.07)
.06
(-.03)
-.10
(-.11)
-.04
(-.04)
Note. Partial correlations controlling for age and verbal ability are reported in brackets. *p <
.05, **p < .01, ***p < .001, one-tailed. PRA = Proactive Relational Aggression. RRA =
Reactive Relational Aggression. PPA = Proactive Physical Aggression. RPA = Reactive
Physical Aggression. ToM = Theory of Mind.
Having examined the correlations between individual cognitive skills and subtypes
of aggression at each time point, hierarchical linear regressions were carried out to explore
the combined contribution of EF and ToM to aggression within and across time points. In this
chapter the role of Time 1 and Time 2 EF and ToM on Time 2 aggression, as well as, Time 1,
2 and 3 EF and ToM on Time 3 aggression was examined. The role of Time 1 EF and ToM in
Time 1 aggressive behaviour is presented in study two (Chapter 5).
In the first step, gender and concurrent age and verbal ability were entered in order
to control for potential confounding effects. Concurrent age was controlled for as the sample
spanned a wide age range and age was significantly correlated with some measures of
cognition and aggressive behaviour (Table 5.2). Gender and concurrent verbal ability were
also controlled for because these variables were also related to measures of cognition and
behaviour. In the first set of regressions, the role of T1 and T2 EF and ToM in T2 aggressive
subtypes were examined. Cool and hot EF skills and ToM were entered simultaneously.
Following this, the role of Time 1, 2 and 3 EF and ToM in Time 3 aggressive subtypes were
examined. Predictors for each time point were entered into different steps in order to explore
the association between concurrent predictors and aggressive behaviour after controlling for
the influence of previous cognitive abilities.
Assumptions of multiple regression were met for all analyses. The Durbin-Watson
values were within the accepted range, indicating that the assumption of independent errors
was met (Savin & White, 1977; Wang & Jain, 2003). VIF and tolerance values indicated that
there was no evidence of multicollinearity between predictors (J. Cohen et al., 2003; Kelley
& Maxwell, 2010). P-P plots of standardised residuals suggested that the assumption of
normally distributed errors was violated for Time 3 proactive and reactive physical
241
aggression (J. Cohen et al., 2003; Kelley & Maxwell, 2010). Added to this, Zpred vs. zresid
plots indicated that the assumption of homoscedasticity was violated for Time 3 proactive
and reactive physical aggression (B. Cohen, 2008; Kelley & Maxwell, 2010). Bootstrapped
regressions were therefore carried out for Time 3 reactive and proactive physical aggression
as bootstrapped analyses do not make assumptions regarding the distribution. However,
bootstrapped regression results did not differ from the non-bootstrapped results.
Proactive relational aggression. EF and ToM did not significantly increase
understanding of proactive relational aggression, after taking into account child factors, at
Time 1 (see Chapter 5 for results). Table 7.8 reports the regression results for Time 2
proactive relational aggression. After controlling for gender and Time 2 age and verbal
ability, Time 1 EF and ToM did not significantly add to understanding of Time 2 proactive
relational aggression, ΔR2
= .10, ΔF(6, 88) = 1.92, p = .09. Added to this, Time 2 EF and ToM
did not significantly increase understanding of Time 2 proactive relational aggression, after
taking into account Time 1 predictors, ΔR2
= .10, ΔF(6, 82) = 2.06, p = .07.
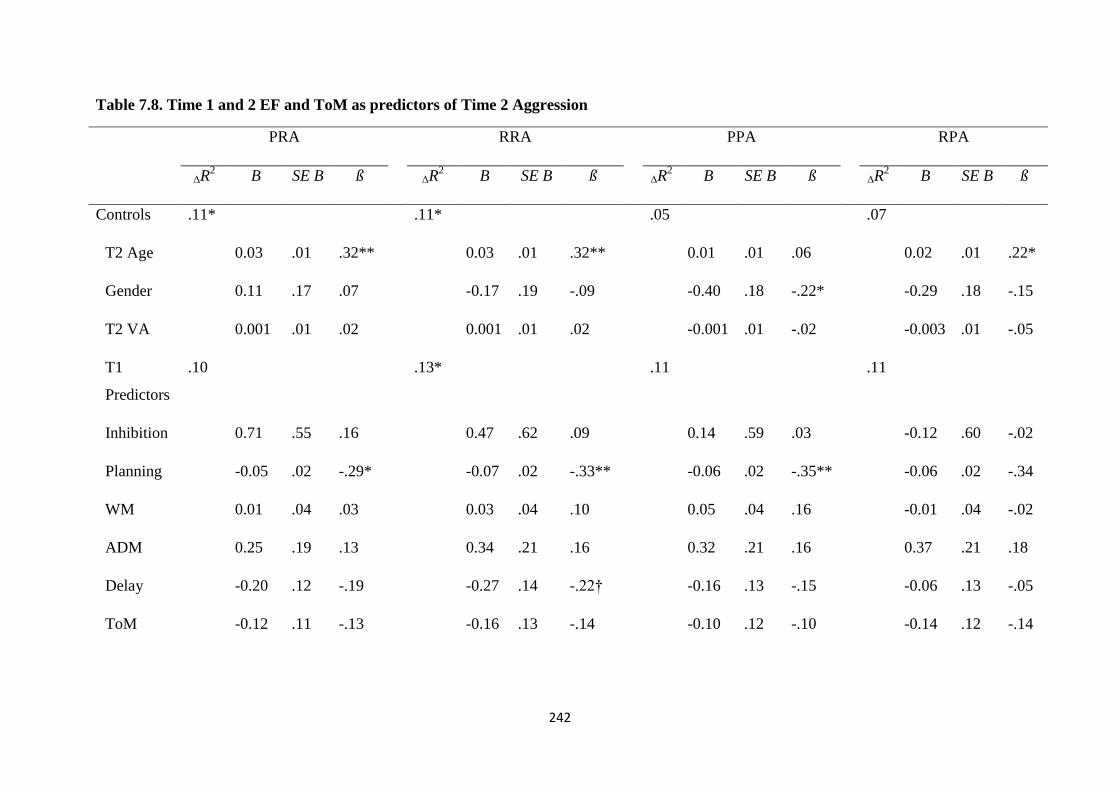
242
Table 7.8. Time 1 and 2 EF and ToM as predictors of Time 2 Aggression
PRA RRA PPA RPA
ΔR2
B SE B ß ΔR2
B SE B ß ΔR2
B SE B ß ΔR2
B SE B ß
Controls .11* .11* .05 .07
T2 Age 0.03 .01 .32** 0.03 .01 .32** 0.01 .01 .06 0.02 .01 .22*
Gender 0.11 .17 .07 -0.17 .19 -.09 -0.40 .18 -.22* -0.29 .18 -.15
T2 VA 0.001 .01 .02 0.001 .01 .02 -0.001 .01 -.02 -0.003 .01 -.05
T1
Predictors
.10 .13* .11 .11
Inhibition 0.71 .55 .16 0.47 .62 .09 0.14 .59 .03 -0.12 .60 -.02
Planning -0.05 .02 -.29* -0.07 .02 -.33** -0.06 .02 -.35** -0.06 .02 -.34
WM 0.01 .04 .03 0.03 .04 .10 0.05 .04 .16 -0.01 .04 -.02
ADM 0.25 .19 .13 0.34 .21 .16 0.32 .21 .16 0.37 .21 .18
Delay -0.20 .12 -.19 -0.27 .14 -.22† -0.16 .13 -.15 -0.06 .13 -.05
ToM -0.12 .11 -.13 -0.16 .13 -.14 -0.10 .12 -.10 -0.14 .12 -.14

243
Table 7.8 Continued
PRA RRA PPA RPA
ΔR2
B SE B ß ΔR2
B SE B ß ΔR2
B SE B ß ΔR2
B SE B ß
T2
Predictors .10 .12* .08 .10
Inhibition -0.73 .51 -.20 -0.63 .56 -.15 -0.02 .56 -.01 -0.46 .55 -.12
Planning -0.02 .02 -.15 -0.02 .02 -.10 -0.01 .02 -.04 -0.03 .02 -.17
WM -0.05 .05 -.16 -0.08 .05 -.20 -0.12 .05 -.35* -0.10 .05 -.27
ADM -0.17 .22 -.08 -0.22 .24 -.09 -0.08 .24 -.04 -0.11 .24 -.05
Delay -0.05 .13 -.04 -0.19 .14 -.16 -0.06 .14 -.05 -0.21 .14 -.18
ToM 0.27 .11 .31* 0.32 .13 .31** 0.20 .12 .22 0.20 .12 .21
Note. *p < .05, **p < .01, ***p < .001. PRA = Proactive Relational Aggression. RRA = Reactive Relational Aggression. PPA = Proactive
Physical Aggression. RPA = Reactive Physical Aggression. T1 = Time 1. T2 = Time 2. T3 = Time 3. VA = Verbal Ability. WM = Working
Memory. ADM = Affective Decision Making. Delay = Delay of Gratification. ToM = Theory of Mind.

244
Regression results for Time 3 proactive relational aggression are presented in Table
7.8. After controlling for gender and concurrent age and verbal ability, Time 1 EF and ToM
did not significantly contribute to understanding of Time 3 proactive relational aggression,
ΔR2
= .05, ΔF(6, 87) = 0.84, p = .54. Time 2 EF and ToM did not significantly add to
understanding of Time 3 proactive relational aggression, after controlling for Time 1
predictors ΔR2
= .08, ΔF(6, 81) = 1.43, p = .21. After Time 1 and 2 predictors were controlled
for, Time 3 EF and ToM did not significantly increase understanding of concurrent proactive
relational aggression, ΔR2
= .04, ΔF(6, 75) = 0.69, p = .66.
Reactive relational aggression. EF and ToM did not significantly contribute to
understanding of reactive relational aggression, after taking into account child factors, at
Time 1 (see Chapter 5 for results). Regression results for Time 2 aggression are reported in
Table 7.8. Time 1 EF and ToM significantly increased the amount of variance accounted for
to 23% of the variance in Time 2 reactive relational aggression, after controlling for gender
and concurrent age and verbal ability, ΔR2
= .13, ΔF(6, 88) = 2.38, p = .04. Time 1 Planning
was a significant negative independent predictor and Time 1 delay of gratification was a
marginally significant negative independent predictor (p = .05). After taking into account
Time 1 predictors, EF and ToM at Time 2 significantly increased the variance in Time 2
reactive relational aggression explained to 35% , ΔR2
= .12, ΔF(6, 82) = 2.41, p = .03. Time 2
ToM was a significant positive independent predictor of Time 2 reactive relational
aggression.
Time 1 EF and ToM did not significantly contribute to understanding of Time 3
reactive relational aggression, after controlling for child factors, ΔR2
= .03, ΔF(6, 87) = 0.70, p
= .65. Time 2 EF and ToM did not significantly add to understanding of Time 3 reactive
relational aggression, after controlling for Time 1 predictors ΔR2
= .08, ΔF(6, 81) = 1.43, p =
.21. After Time 1 and 2 predictors were controlled for, Time 3 EF and ToM did not
significantly increase understanding of concurrent reactive relational aggression, ΔR2
= .02,
ΔF(6, 75) = 0.27, p = .95. Regression results for Time 3 aggression are presented in Table 7.9.
Proactive physical aggression. Time 1 EF and ToM significantly added to
understanding of Time 1 proactive physical aggression, after taking into account child factors
(see Chapter 5 for results). Inhibition was a significant negative independent predictor.
However, EF and ToM at Time 1 did not significantly contribute to understanding of Time 2
proactive physical aggression, after controlling for gender and concurrent age and verbal

245
ability, ΔR2
= .11, ΔF(6, 88) = 1.91, p = .09. EF and ToM at Time 2 also did not significantly
add to understanding of proactive physical aggression at Time 2, after taking into account
previous cognitive abilities, ΔR2
= .08, ΔF(6, 82) = 1.37, p = .24. Regression results for Time 2
aggression are reported in Table 7.8.
Regression results for Time 3 aggression were presented in Table 7.9. After gender
and concurrent age and verbal ability were taken into account, Time 1 EF and ToM did not
significantly increase understanding of Time 3 proactive physical aggression, ΔR2
= .08, ΔF(6,
87) = 1.41, p = .22. Time 2 EF and ToM did not significantly predict Time 3 proactive
physical aggression, after controlling for Time 1 predictors ΔR2
= .02, ΔF(6, 81) = 0.34, p =
.92. After Time 1 and 2 predictors were controlled for, Time 3 EF and ToM did not
significantly contribute to understanding of reactive relational aggression at Time 3, ΔR2
=
.03, ΔF(6, 75) = 0.41, p = .87.
Reactive physical aggression. At Time 1 EF and ToM significantly added to
understanding of reactive physical aggression, after taking into account child factors (see
Chapter 5 for results). Inhibition was a significant negative independent predictor. After
gender and concurrent age and verbal ability were controlled for, Time 1 EF and ToM did not
significantly add to understanding of reactive physical aggression at Time 2, ΔR2
= .11, ΔF(6,
88) = 2.03, p = .07. Further, Time 2 EF and ToM did not significantly add to understanding
of Time 2 reactive physical aggression, after Time 1 cognitive abilities were taken into
account, ΔR2
= .10, ΔF(6, 82) = 1.95, p = .08. Regression results for Time 2 aggression are
reported in Table 7.8.
Time 1 EF and ToM did not significantly increase understanding of Time 3 reactive
physical aggression, after controlling for gender and concurrent age and verbal ability ΔR2
=
.08, ΔF(6, 87) = 1.46, p = .20. After Time 1 predictors were taken into account, Time 2 EF
and ToM did not significantly predict Time 3 reactive physical aggression, ΔR2
= .05, ΔF(6,
81) = 0.89, p = .51. Time 3 EF and ToM did not significantly contribute to understanding of
reactive physical aggression at Time 3, after Time 1 and 2 predictors were controlled for, ΔR2
= .02, ΔF(6, 75) = 0.26, p = .95. Table 7.9 presents regression results for Time 3 aggression.
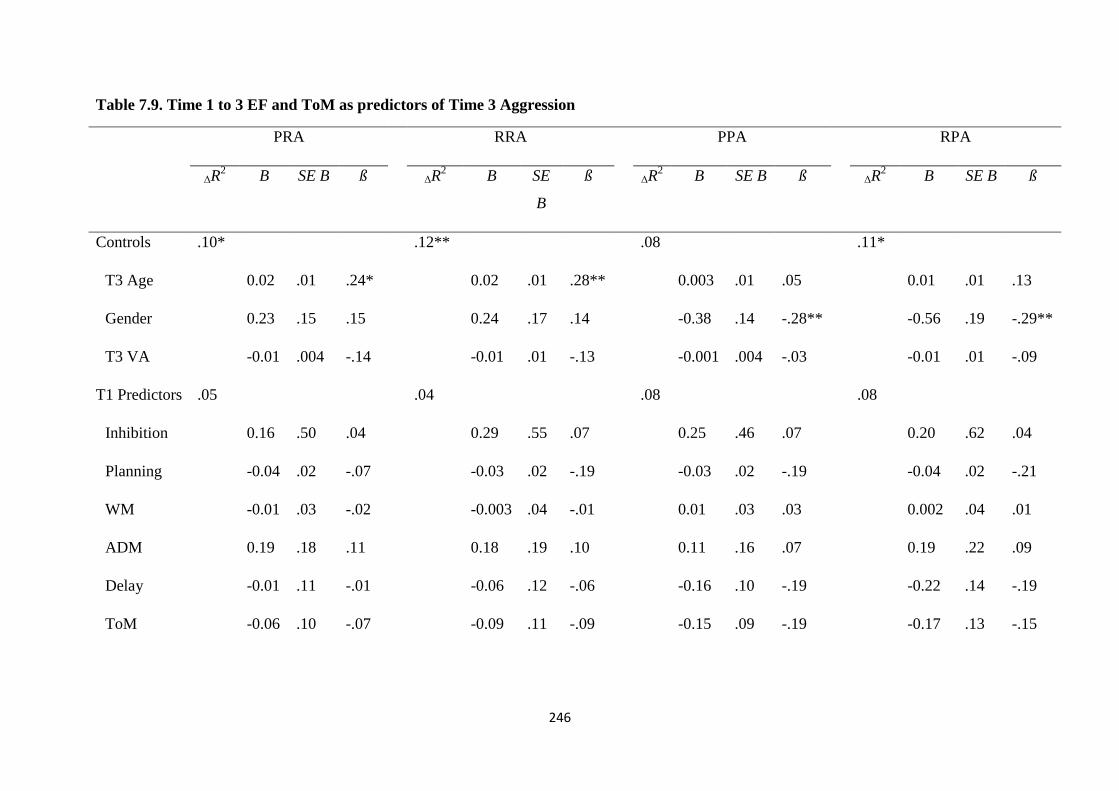
246
Table 7.9. Time 1 to 3 EF and ToM as predictors of Time 3 Aggression
PRA RRA PPA RPA
ΔR2
B SE B ß ΔR2
B SE
B
ß ΔR2
B SE B ß ΔR2
B SE B ß
Controls .10* .12** .08 .11*
T3 Age 0.02 .01 .24* 0.02 .01 .28** 0.003 .01 .05 0.01 .01 .13
Gender 0.23 .15 .15 0.24 .17 .14 -0.38 .14 -.28** -0.56 .19 -.29**
T3 VA -0.01 .004 -.14 -0.01 .01 -.13 -0.001 .004 -.03 -0.01 .01 -.09
T1 Predictors .05 .04 .08 .08
Inhibition 0.16 .50 .04 0.29 .55 .07 0.25 .46 .07 0.20 .62 .04
Planning -0.04 .02 -.07 -0.03 .02 -.19 -0.03 .02 -.19 -0.04 .02 -.21
WM -0.01 .03 -.02 -0.003 .04 -.01 0.01 .03 .03 0.002 .04 .01
ADM 0.19 .18 .11 0.18 .19 .10 0.11 .16 .07 0.19 .22 .09
Delay -0.01 .11 -.01 -0.06 .12 -.06 -0.16 .10 -.19 -0.22 .14 -.19
ToM -0.06 .10 -.07 -0.09 .11 -.09 -0.15 .09 -.19 -0.17 .13 -.15
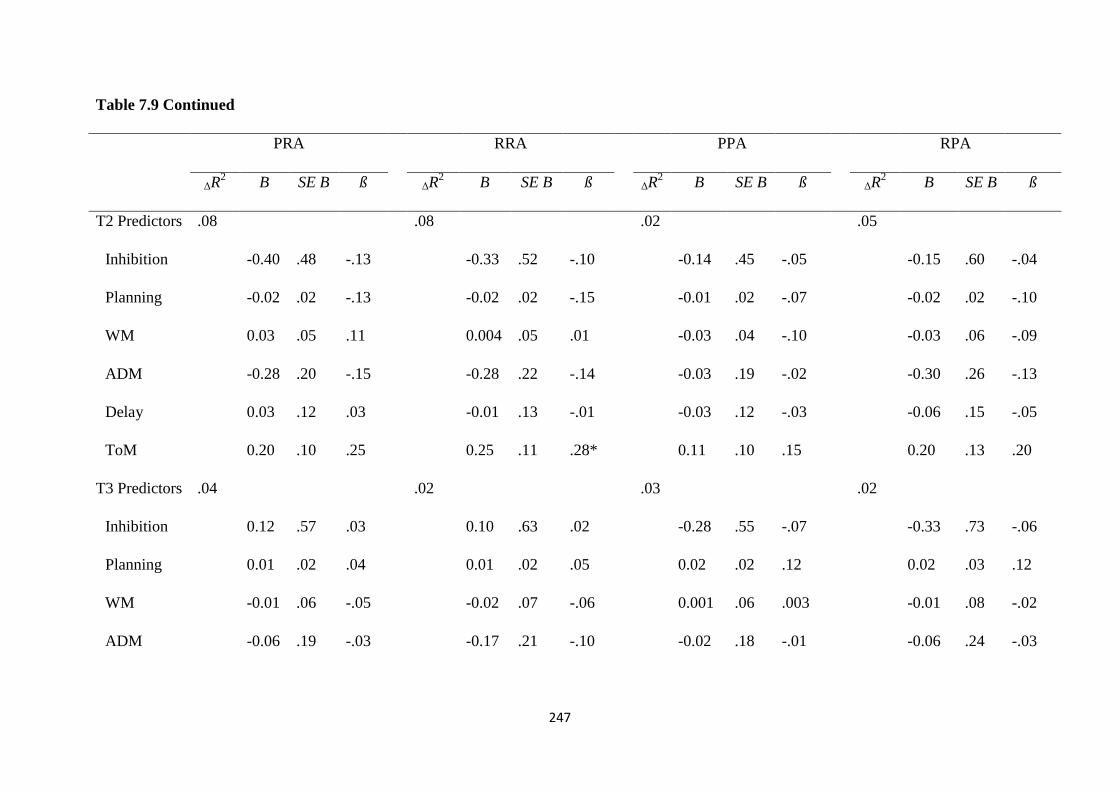
247
Table 7.9 Continued
PRA RRA PPA RPA
ΔR2
B SE B ß ΔR2
B SE B ß ΔR2
B SE B ß ΔR2
B SE B ß
T2 Predictors .08 .08 .02 .05
Inhibition -0.40 .48 -.13 -0.33 .52 -.10 -0.14 .45 -.05 -0.15 .60 -.04
Planning -0.02 .02 -.13 -0.02 .02 -.15 -0.01 .02 -.07 -0.02 .02 -.10
WM 0.03 .05 .11 0.004 .05 .01 -0.03 .04 -.10 -0.03 .06 -.09
ADM -0.28 .20 -.15 -0.28 .22 -.14 -0.03 .19 -.02 -0.30 .26 -.13
Delay 0.03 .12 .03 -0.01 .13 -.01 -0.03 .12 -.03 -0.06 .15 -.05
ToM 0.20 .10 .25 0.25 .11 .28* 0.11 .10 .15 0.20 .13 .20
T3 Predictors .04 .02 .03 .02
Inhibition 0.12 .57 .03 0.10 .63 .02 -0.28 .55 -.07 -0.33 .73 -.06
Planning 0.01 .02 .04 0.01 .02 .05 0.02 .02 .12 0.02 .03 .12
WM -0.01 .06 -.05 -0.02 .07 -.06 0.001 .06 .003 -0.01 .08 -.02
ADM -0.06 .19 -.03 -0.17 .21 -.10 -0.02 .18 -.01 -0.06 .24 -.03

248
Table 7.9 Continued
PRA RRA PPA RPA
ΔR2
B SE B ß ΔR2
B SE B ß ΔR2
B SE B ß ΔR2
B SE B ß
Delay -0.23 .14 -.21 -0.14 .15 -.12 -0.09 .13 -.09 -0.10 .18 -.07
ToM -0.11 .12 -.13 -0.02 .14 -.02 -0.08 .12 -.10 0.02 .16 .02
Note. *p < .05, **p < .01, ***p < .001. PRA = Proactive Relational Aggression. RRA = Reactive Relational Aggression. PPA = Proactive
Physical Aggression. RPA = Reactive Physical Aggression. T1 = Time 1. T2 = Time 2. T3 = Time 3. VA = Verbal Ability. WM = Working
Memory. ADM = Affective Decision Making. Delay = Delay of Gratification. ToM = Theory of Mind.

249
Summary. In sum, the results suggest that the association between individual EF and
ToM skills and the combined role of these cognitive abilities in aggressive behaviour does not
remain stable across early childhood. EF and ToM appear to be especially important in
children's aggressive behaviour during the beginning of early childhood. Time 1 EF and ToM
significantly predicted Time 1 proactive and reactive physical aggression (Chapter 5). Further,
EF and ToM at Time 1 and Time 2 significantly contributed to Time 2 reactive relational
aggression. However, EF and ToM did not significantly contribute to understanding of
subtypes of aggression at Time 3.
7.4.2. Prosocial Behaviour
7.4.2.1. Mean Change in Prosocial Behaviour from Time 1 to Time 3
Following the approach carried out to examine the development of subtypes of
aggression, correlations and mixed ANOVA's were conducted to explore the development of
prosocial behaviour across the three time points and between cohorts. Descriptive statistics for
prosocial behaviour are presented in Table 7.10.
Table 7.10. Teacher reported prosocial behaviour mean scores for the full sample and
for each cohort across time points
Note. Standard deviation in brackets. N(Time 1) = 106, N(Time 2) = 99, N(Time 3) = 98.
Pearson's correlations were carried out to examine the association between Teacher
reported aggressive behaviour across the three time points and correlations are reported in
Table 7.11. Prosocial behaviour was significantly and positively correlated across time points,
indicating that reported levels of prosocial behaviour remained relatively stable across early
childhood. This relation remained significant even after age and gender were controlled for.
Age and gender were controlled for because they have both been found to be associated with
prosocial behaviour (Study 1, Chapter 4; Study 2, Chapter 5).
Time 1 Time 2 Time 3
Full
Sample 4y 5y
C3
(6y)
Full
Sample 4.5y 5.5y 6.5y
Full
Sample 5y 6y 7y
Pro-
social
3.64
(0.72)
3.63
(0.62)
3.51
(0.66)
3.81
(0.84)
3.94
(0.77)
3.85
(0.73)
4.0
(0.74)
3.95
(0.83)
4.06
(0.76)
4.02
(0.80)
4.11
(0.76)
4.03
(0.76)
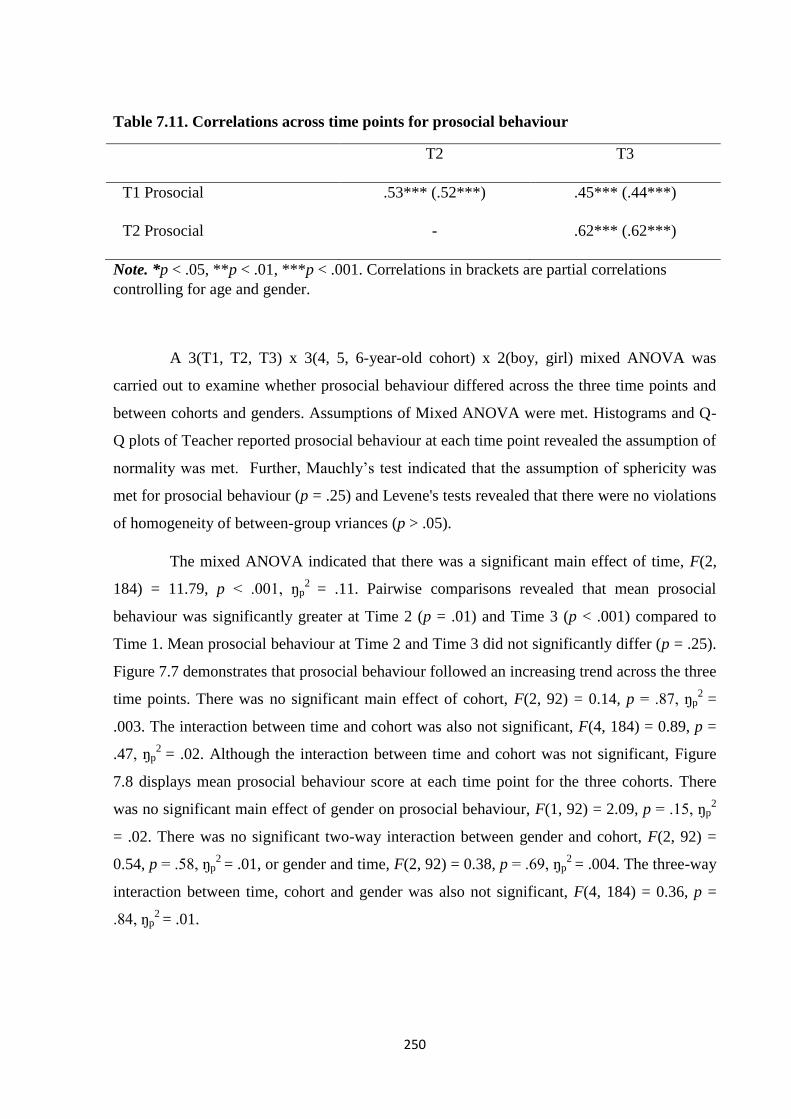
250
Table 7.11. Correlations across time points for prosocial behaviour
T2 T3
T1 Prosocial .53*** (.52***) .45*** (.44***)
T2 Prosocial - .62*** (.62***)
Note. *p < .05, **p < .01, ***p < .001. Correlations in brackets are partial correlations
controlling for age and gender.
A 3(T1, T2, T3) x 3(4, 5, 6-year-old cohort) x 2(boy, girl) mixed ANOVA was
carried out to examine whether prosocial behaviour differed across the three time points and
between cohorts and genders. Assumptions of Mixed ANOVA were met. Histograms and Q-
Q plots of Teacher reported prosocial behaviour at each time point revealed the assumption of
normality was met. Further, Mauchly’s test indicated that the assumption of sphericity was
met for prosocial behaviour (p = .25) and Levene's tests revealed that there were no violations
of homogeneity of between-group vriances (p > .05).
The mixed ANOVA indicated that there was a significant main effect of time, F(2,
184) = 11.79, p < .001, ŋp2
= .11. Pairwise comparisons revealed that mean prosocial
behaviour was significantly greater at Time 2 (p = .01) and Time 3 (p < .001) compared to
Time 1. Mean prosocial behaviour at Time 2 and Time 3 did not significantly differ (p = .25).
Figure 7.7 demonstrates that prosocial behaviour followed an increasing trend across the three
time points. There was no significant main effect of cohort, F(2, 92) = 0.14, p = .87, ŋp2
=
.003. The interaction between time and cohort was also not significant, F(4, 184) = 0.89, p =
.47, ŋp2
= .02. Although the interaction between time and cohort was not significant, Figure
7.8 displays mean prosocial behaviour score at each time point for the three cohorts. There
was no significant main effect of gender on prosocial behaviour, F(1, 92) = 2.09, p = .15, ŋp2
= .02. There was no significant two-way interaction between gender and cohort, F(2, 92) =
0.54, p = .58, ŋp2
= .01, or gender and time, F(2, 92) = 0.38, p = .69, ŋp2
= .004. The three-way
interaction between time, cohort and gender was also not significant, F(4, 184) = 0.36, p =
.84, ŋp2
= .01.

251
Figure 7.7. Mean prosocial behaviour score at each time point for the whole sample
Figure 7.8. Mean prosocial behaviour score for each cohort from T1 - T3
Summary. Prosocial behaviour evidenced a significant increase between Time 1 and
3. There was no significant effect of cohort, indicating that the same increasing trend was
evident across all three cohorts. Further, there were no gender differences in prosocial
behaviour across early childhood.
3.4
3.5
3.6
3.7
3.8
3.9
4
4.1
4.2
4.3
3 4 5 6 7 8
Mean Prosocial Behaviour
Score
Mean Age (Years)
3
3.5
4
4.5
5
0 1 2 3
Mean Prosocial Behaviour
Score
Time Point

252
7.4.2.2. Association between Time 1 EF and ToM and Developmental
Trajectories of Prosocial Behaviour
The role of Time 1 EF and ToM on developmental trajectories of prosocial behaviour
across early childhood was explored. Individual intercept and regression slopes were
generated for each participant and used in hierarchical regressions. The same steps as
described for aggressive behaviour were carried out. Step one included control variables
(gender, age and verbal ability) and step two included EF and ToM. Assumptions of multiple
regression were met. The Durbin-Watson values were within the accepted range, indicating
that the assumption of independent errors was met (Savin & White, 1977; Wang & Jain,
2003). VIF and tolerance values indicated that there was no evidence of multicollinearity
between predictors (J. Cohen et al., 2003; Kelley & Maxwell, 2010).
Control variables did not significantly predict intercept scores for prosocial
behaviour, R2
= .05, F(3, 95) = 1.64, p = .19. EF and ToM were not significantly associated
with intercept scores for prosocial behaviour, ΔR2
= .05, ΔF(6, 86) = 0.76, p = .61. Added to
this, control variables were not significantly associated with development of prosocial
behaviour, R2
= .02, F(3, 95) = 0.51, p = .68. EF and ToM did not significantly contribute to
understanding of the development of prosocial behaviour, ΔR2
= .03, ΔF(6, 86) = 0.39, p = .89.
Full regression results are reported in Table 7.12.
Summary. The results revealed that EF and ToM at Time 1 did not significantly
predict children's initial prosocial behaviour. Added to this, initial EF and ToM were not
significantly associated with the longitudinal trajectories of children's prosocial behaviour.
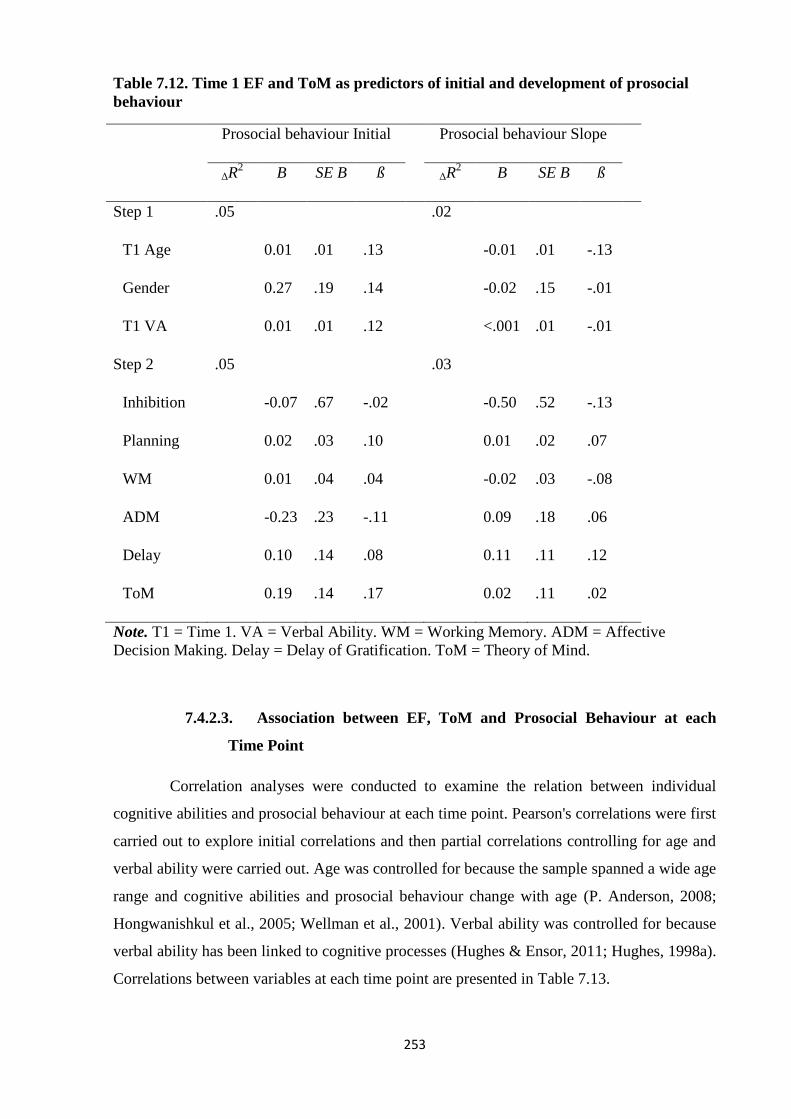
253
Table 7.12. Time 1 EF and ToM as predictors of initial and development of prosocial
behaviour
Prosocial behaviour Initial Prosocial behaviour Slope
ΔR2
B SE B ß ΔR2
B SE B ß
Step 1 .05 .02
T1 Age 0.01 .01 .13 -0.01 .01 -.13
Gender 0.27 .19 .14 -0.02 .15 -.01
T1 VA 0.01 .01 .12 <.001 .01 -.01
Step 2 .05 .03
Inhibition -0.07 .67 -.02 -0.50 .52 -.13
Planning 0.02 .03 .10 0.01 .02 .07
WM 0.01 .04 .04 -0.02 .03 -.08
ADM -0.23 .23 -.11 0.09 .18 .06
Delay 0.10 .14 .08 0.11 .11 .12
ToM 0.19 .14 .17 0.02 .11 .02
Note. T1 = Time 1. VA = Verbal Ability. WM = Working Memory. ADM = Affective
Decision Making. Delay = Delay of Gratification. ToM = Theory of Mind.
7.4.2.3. Association between EF, ToM and Prosocial Behaviour at each
Time Point
Correlation analyses were conducted to examine the relation between individual
cognitive abilities and prosocial behaviour at each time point. Pearson's correlations were first
carried out to explore initial correlations and then partial correlations controlling for age and
verbal ability were carried out. Age was controlled for because the sample spanned a wide age
range and cognitive abilities and prosocial behaviour change with age (P. Anderson, 2008;
Hongwanishkul et al., 2005; Wellman et al., 2001). Verbal ability was controlled for because
verbal ability has been linked to cognitive processes (Hughes & Ensor, 2011; Hughes, 1998a).
Correlations between variables at each time point are presented in Table 7.13.

254
The analyses revealed that at Time 1 cool EF skills were significantly correlated with
prosocial behaviour. Inhibition was positively related to prosocial behaviour. This relation
remained after controlling for age and verbal ability. Working memory was also positively
associated with prosocial behaviour. However, after age and verbal ability were taken into
account working memory was not significantly correlated with prosocial behaviour. At Time
1, hot delay of gratification was positively associated with prosocial behaviour, but this
correlation was only marginally significant after controlling for age and verbal ability.
Affective decision making was not significantly correlated with prosocial behaviour at Time
1. Added to this, ToM was not significantly related to prosocial behaviour.
At Time 2, prosocial behaviour was positively correlated with planning and working
memory, even after taking into account age and verbal ability. However, inhibition was no
longer significantly related to prosocial behaviour. At Time 3, inhibition was positively
correlated with prosocial behaviour. However, after taking into account age and verbal ability,
the association between inhibition and prosocial behaviour was only marginally significant.
Delay of gratification was positively related to prosocial behaviour. These relations remained
after controlling for age and verbal ability. Prosocial behaviour, though, was no longer
significantly associated with planning or working memory at Time 3. ToM was positively
related to prosocial behaviour, but this correlation was no longer significant after taking into
account age and verbal ability. According to the correlation analyses, the associations
between cognitive abilities and prosocial behaviour are not stable across early childhood.
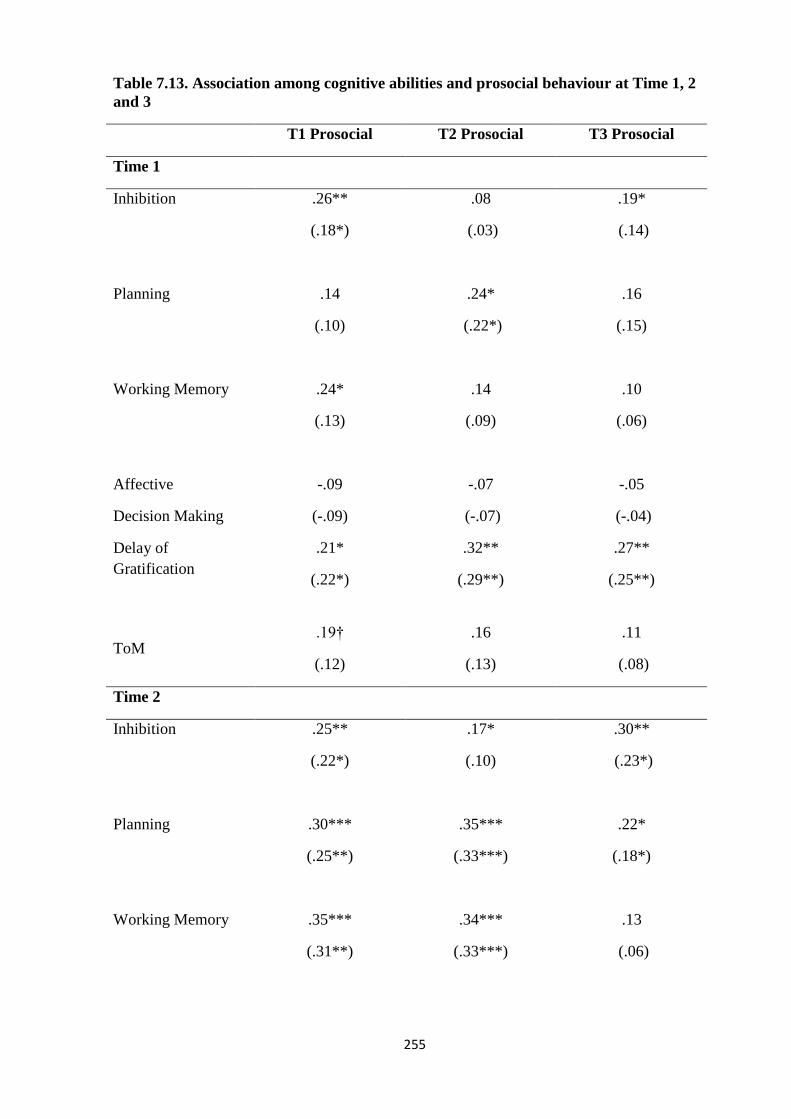
255
Table 7.13. Association among cognitive abilities and prosocial behaviour at Time 1, 2
and 3
T1 Prosocial T2 Prosocial T3 Prosocial
Time 1
Inhibition
.26**
(.18*)
.08
(.03)
.19*
(.14)
Planning
.14
(.10)
.24*
(.22*)
.16
(.15)
Working Memory
.24*
(.13)
.14
(.09)
.10
(.06)
Affective
Decision Making
-.09
(-.09)
-.07
(-.07)
-.05
(-.04)
Delay of
Gratification
.21*
(.22*)
.32**
(.29**)
.27**
(.25**)
ToM .19†
(.12)
.16
(.13)
.11
(.08)
Time 2
Inhibition
.25**
(.22*)
.17*
(.10)
.30**
(.23*)
Planning
.30***
(.25**)
.35***
(.33***)
.22*
(.18*)
Working Memory
.35***
(.31**)
.34***
(.33***)
.13
(.06)

256
Table 7.13 Continued
T1 Prosocial T2 Prosocial T3 Prosocial
Time 2
Affective
Decision Making
.10
(.08)
.15
(.13)
.05
(.05)
Delay of
Gratification
.14
(.11)
.20*
(.15)
.18*
(.15)
ToM .10
(.02)
.08
(.01)
-.09
(-.18*)
Time 3
Inhibition
.26**
(.25**)
.23*
(.19*)
.24*
(.20*)
Planning
.38***
(.35***)
.13
(.07)
.04
(-.02)
Working Memory
.35***
(.32**)
.28**
(.24**)
.12
(.07)
Affective
Decision Making
.07
(.03)
.06
(.07)
.18*
(.21*)
Delay of
Gratification
.21*
(.15)
.19*
(.12)
.24**
(.18*)
ToM .23*
(.16)
.19*
(12)
.20*
(.14)
Note. Partial correlations controlling for age and verbal ability are reported in brackets. *p <
.05, **p < .01, ***p < .001, †p < .06, one tailed. T1 = Time 1. T2 = Time 2. T3 = Time 3.
ToM = Theory of Mind.
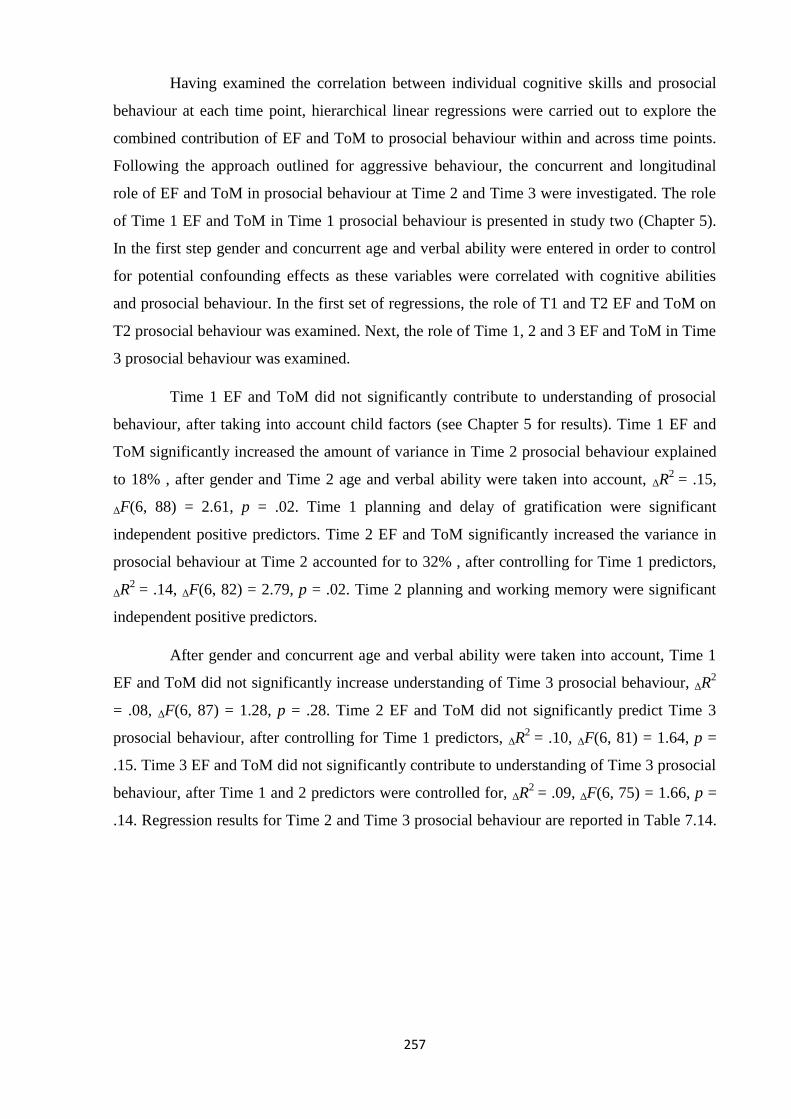
257
Having examined the correlation between individual cognitive skills and prosocial
behaviour at each time point, hierarchical linear regressions were carried out to explore the
combined contribution of EF and ToM to prosocial behaviour within and across time points.
Following the approach outlined for aggressive behaviour, the concurrent and longitudinal
role of EF and ToM in prosocial behaviour at Time 2 and Time 3 were investigated. The role
of Time 1 EF and ToM in Time 1 prosocial behaviour is presented in study two (Chapter 5).
In the first step gender and concurrent age and verbal ability were entered in order to control
for potential confounding effects as these variables were correlated with cognitive abilities
and prosocial behaviour. In the first set of regressions, the role of T1 and T2 EF and ToM on
T2 prosocial behaviour was examined. Next, the role of Time 1, 2 and 3 EF and ToM in Time
3 prosocial behaviour was examined.
Time 1 EF and ToM did not significantly contribute to understanding of prosocial
behaviour, after taking into account child factors (see Chapter 5 for results). Time 1 EF and
ToM significantly increased the amount of variance in Time 2 prosocial behaviour explained
to 18% , after gender and Time 2 age and verbal ability were taken into account, ΔR2
= .15,
ΔF(6, 88) = 2.61, p = .02. Time 1 planning and delay of gratification were significant
independent positive predictors. Time 2 EF and ToM significantly increased the variance in
prosocial behaviour at Time 2 accounted for to 32% , after controlling for Time 1 predictors,
ΔR2
= .14, ΔF(6, 82) = 2.79, p = .02. Time 2 planning and working memory were significant
independent positive predictors.
After gender and concurrent age and verbal ability were taken into account, Time 1
EF and ToM did not significantly increase understanding of Time 3 prosocial behaviour, ΔR2
= .08, ΔF(6, 87) = 1.28, p = .28. Time 2 EF and ToM did not significantly predict Time 3
prosocial behaviour, after controlling for Time 1 predictors, ΔR2
= .10, ΔF(6, 81) = 1.64, p =
.15. Time 3 EF and ToM did not significantly contribute to understanding of Time 3 prosocial
behaviour, after Time 1 and 2 predictors were controlled for, ΔR2
= .09, ΔF(6, 75) = 1.66, p =
.14. Regression results for Time 2 and Time 3 prosocial behaviour are reported in Table 7.14.

258
Table 7.14. EF and ToM as predictors of prosocial behaviour at Time 2 and Time 3
Prosocial Behaviour T2 Prosocial Behaviour T3
ΔR2
B SE B ß ΔR2
B SE B ß
Controls .03 Controls .05
T2 Age 0.003 .01 .04 T3 Age -0.001 .01 -.01
Gender 0.13 .16 .09 Gender .19 .16 .12
T2 VA 0.01 .01 .15 T3 VA 0.01 .01 .16
T1 Predictors .15* T1 Predictors .08
Inhibition -0.54 .51 -.13 Inhibition 0.12 .51 .03
Planning -0.001 .03 -.002 Planning -0.01 .04 -.05
WM 0.04 .02 .27* WM 0.03 .02 .17
ADM -0.16 .18 -.09 ADM -0.14 .18 -.08
Delay 0.31 .11 .33** Delay 0.20 .11 .21
ToM 0.17 .10 .19 ToM 0.09 .10 .10
T2 Predictors .14* T2 Predictors .10
Inhibition 0.002 .46 .001 Inhibition 0.71 .48 .22
Planning 0.04 .02 .27* Planning 0.01 .02 .11
WM 0.11 .04 .37* WM 0.001 .05 .003
ADM 0.27 .19 .15 ADM 0.12 .21 .07
Delay -0.01 .12 -.01 Delay -0.03 .12 -.03
ToM -0.14 .10 -.17 ToM -0.26 .10 -.33*
T3 Predictors .09
Inhibition 0.36 .56 .09
Planning -0.02 .02 -.10
WM -0.03 .06 -.12
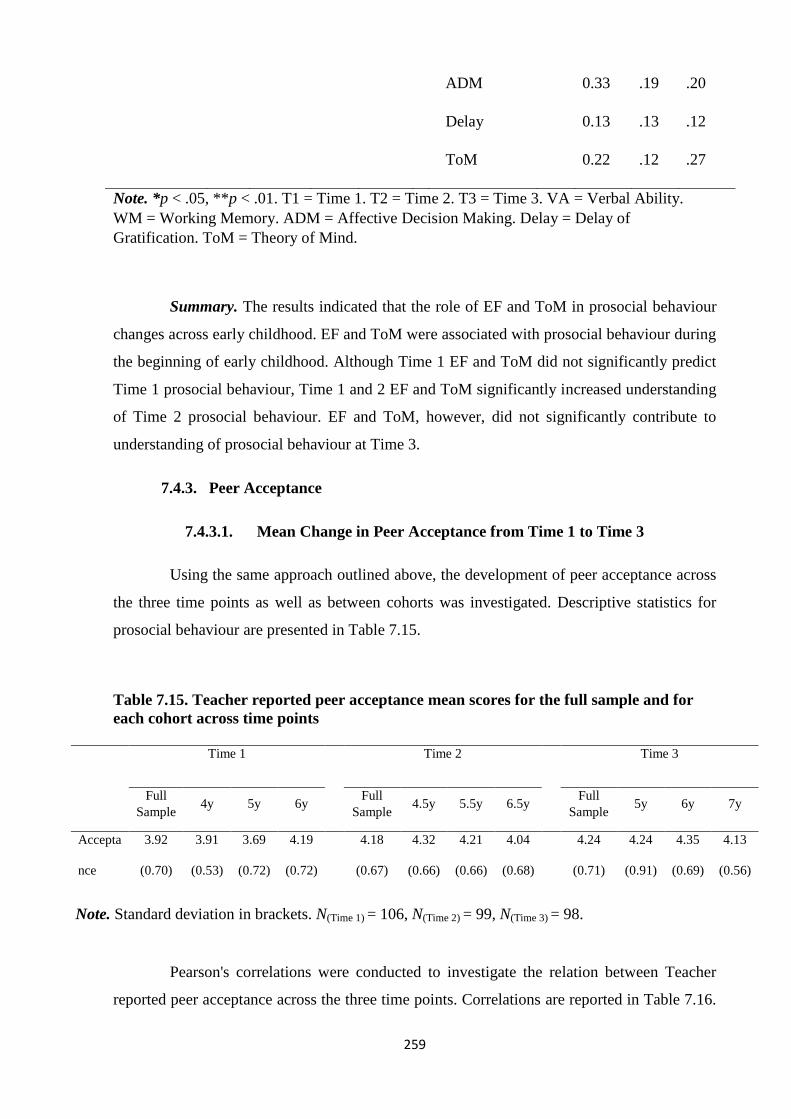
259
ADM 0.33 .19 .20
Delay 0.13 .13 .12
ToM 0.22 .12 .27
Note. *p < .05, **p < .01. T1 = Time 1. T2 = Time 2. T3 = Time 3. VA = Verbal Ability.
WM = Working Memory. ADM = Affective Decision Making. Delay = Delay of
Gratification. ToM = Theory of Mind.
Summary. The results indicated that the role of EF and ToM in prosocial behaviour
changes across early childhood. EF and ToM were associated with prosocial behaviour during
the beginning of early childhood. Although Time 1 EF and ToM did not significantly predict
Time 1 prosocial behaviour, Time 1 and 2 EF and ToM significantly increased understanding
of Time 2 prosocial behaviour. EF and ToM, however, did not significantly contribute to
understanding of prosocial behaviour at Time 3.
7.4.3. Peer Acceptance
7.4.3.1. Mean Change in Peer Acceptance from Time 1 to Time 3
Using the same approach outlined above, the development of peer acceptance across
the three time points as well as between cohorts was investigated. Descriptive statistics for
prosocial behaviour are presented in Table 7.15.
Table 7.15. Teacher reported peer acceptance mean scores for the full sample and for
each cohort across time points
Note. Standard deviation in brackets. N(Time 1) = 106, N(Time 2) = 99, N(Time 3) = 98.
Pearson's correlations were conducted to investigate the relation between Teacher
reported peer acceptance across the three time points. Correlations are reported in Table 7.16.
Time 1 Time 2 Time 3
Full
Sample 4y 5y 6y
Full
Sample 4.5y 5.5y 6.5y
Full
Sample 5y 6y 7y
Accepta
nce
3.92
(0.70)
3.91
(0.53)
3.69
(0.72)
4.19
(0.72)
4.18
(0.67)
4.32
(0.66)
4.21
(0.66)
4.04
(0.68)
4.24
(0.71)
4.24
(0.91)
4.35
(0.69)
4.13
(0.56)

260
Peer acceptance was significantly and positively correlated across time points, indicating that
reported levels of peer acceptance remained relatively stable across early childhood. This
relation remained significant even after age and gender were controlled for.
Table 7.16. Correlations across time points for peer acceptance
T2 T3
T1 Acceptance .22* (.26)* .27** (.28**)
T2 Acceptance - .52*** (.52***)
Note. *p < .05, **p < .01, ***p < .001. Correlations in brackets are partial correlations
controlling for age and gender. T1 = Time 1. T2 = Time 2. T3 = Time 3.
A 3(T1, T2, T3) x 3(4-, 5-, 6-year-old cohort) x 2(boy, girl) mixed ANOVA was
carried out to examine whether peer acceptance differed across the three time points and
between cohorts and genders. Assumptions of Mixed ANOVA were met. Histograms and Q-
Q plots of Teacher reported peer acceptance at each time point revealed the assumption of
normality was met. Added to this, Mauchly’s test indicated that the assumption of sphericity
was met for prosocial behaviour (p = .13) and Levene's tests revealed that there were no
violations of homogeneity of between-group variances (p > .05).
The mixed ANOVA revealed that there was a significant main effect of time, F(2,
184) = 5.54, p = .01, ŋp2
= .06. Pairwise comparisons indicated that mean peer acceptance was
significantly greater at Time 3 compared to Time 1 (p = .01). Mean peer acceptance at Time 1
and Time 2 did not significantly differ (p = .06), nor did mean peer acceptance significantly
differ between Time 2 and Time 3 (p = 1.0). There was no significant main effect of cohort,
F(2, 95) = 0.18, p = .84, ŋp2
= .004. However, there was a significant interaction between time
and cohort, F(4, 184) = 4.11, p = .003, ŋp2
= .08. Figure 7.9 presents mean peer acceptance at
each time point for the three cohorts. Teacher reported peer acceptance significantly increased
between Time 1 and 2 for both the 4 and 5-year-old cohort. However, between Time 2 and 3
peer acceptance decreased slightly for the 4-year-old cohort and increased for the 5-year-old
cohort. The 6-year-old cohort showed a decrease in peer acceptance from Time 1 to Time 2
and then an increase between Time 1 and Time 3. There was no significant main effect of
gender on peer acceptance, F(1, 92) = 0.003, p = .96, ŋp2
< .001. There was no significant
two-way interaction between time and gender, F(2, 184) = .48, p = .62, ŋp2
= .01, or cohort
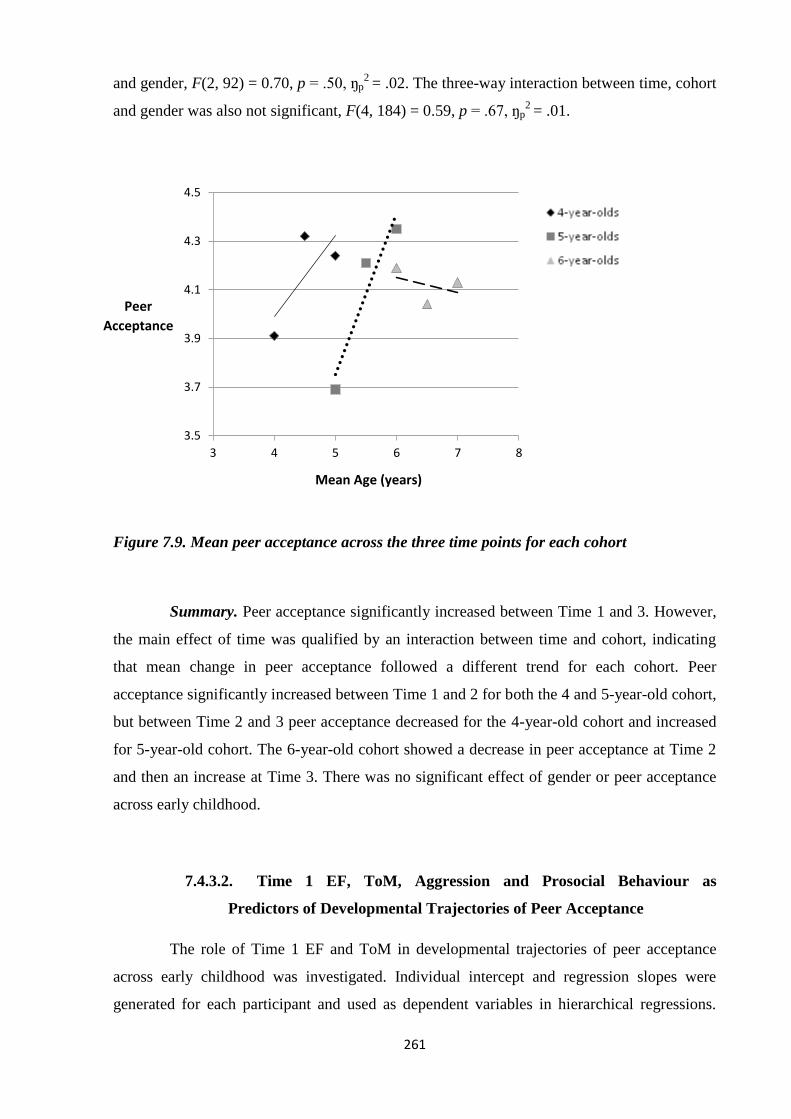
261
and gender, F(2, 92) = 0.70, p = .50, ŋp2
= .02. The three-way interaction between time, cohort
and gender was also not significant, F(4, 184) = 0.59, p = .67, ŋp2
= .01.
Figure 7.9. Mean peer acceptance across the three time points for each cohort
Summary. Peer acceptance significantly increased between Time 1 and 3. However,
the main effect of time was qualified by an interaction between time and cohort, indicating
that mean change in peer acceptance followed a different trend for each cohort. Peer
acceptance significantly increased between Time 1 and 2 for both the 4 and 5-year-old cohort,
but between Time 2 and 3 peer acceptance decreased for the 4-year-old cohort and increased
for 5-year-old cohort. The 6-year-old cohort showed a decrease in peer acceptance at Time 2
and then an increase at Time 3. There was no significant effect of gender or peer acceptance
across early childhood.
7.4.3.2. Time 1 EF, ToM, Aggression and Prosocial Behaviour as
Predictors of Developmental Trajectories of Peer Acceptance
The role of Time 1 EF and ToM in developmental trajectories of peer acceptance
across early childhood was investigated. Individual intercept and regression slopes were
generated for each participant and used as dependent variables in hierarchical regressions.
3.5
3.7
3.9
4.1
4.3
4.5
3 4 5 6 7 8
Mean Age (years)
Peer
Acceptance
262
Step one predictors included control variables and step two included initial (T1) EF and ToM.
In step three subtypes of initial (T1) aggression and prosocial behaviour were included.
However, in line with study two (Chapter 5) only physical and relational subtypes were
considered and not reactive and proactive functions due to high multicollinearity.
Assumptions of multiple regression were met. The Durbin-Watson values were within the
accepted range, indicating that the assumption of independent errors was met (Savin & White,
1977; Wang & Jain, 2003). VIF and tolerance values indicated that there was no evidence of
multicollinearity between predictors (J. Cohen et al., 2003; Kelley & Maxwell, 2010).
Control variables significantly predicted intercept scores for peer acceptance, R2
=
.09, F(3, 93) = 2.84, p = .04. EF and ToM, however, were not significantly associated with
intercept scores for peer acceptance, ΔR2
= .01, ΔF(6, 84) = 0.20, p = .98. The inclusion of
aggressive and prosocial behaviour into the model significantly increased the amount of
variance accounted for to 42%, ΔR2
= .32, ΔF(3, 81) = 14.83, p < .001. Prosocial behaviour was
a significant positive independent predictor.
Control variables were not significantly associated with development of peer
acceptance, R2
= .08, F(3, 93) = 2.55, p = .06. EF and ToM did not significantly contribute to
understanding of the development of peer acceptance, ΔR2
= .03, ΔF(6, 84) = 0.40, p = .88.
Further, the addition of aggressive and prosocial behaviour into the model did not
significantly increase the amount of variance in trajectories of peer acceptance explained, ΔR2
= .07, ΔF(3, 81) = 2.34, p = .08.
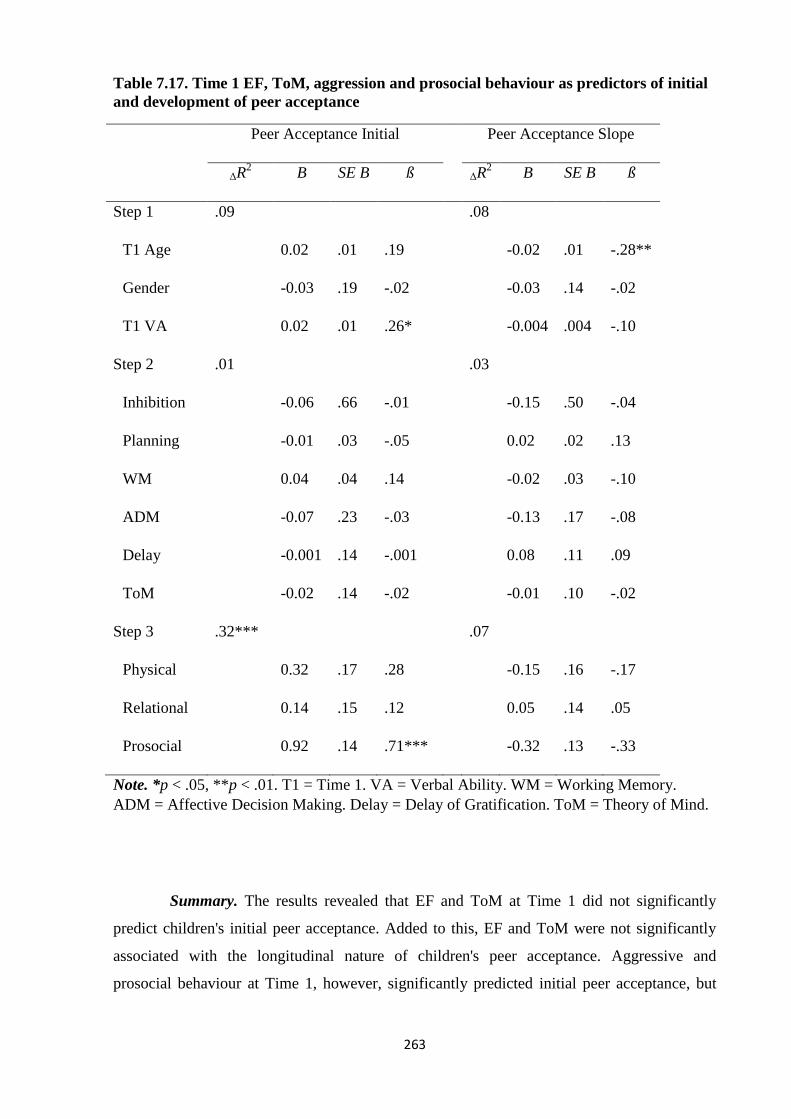
263
Table 7.17. Time 1 EF, ToM, aggression and prosocial behaviour as predictors of initial
and development of peer acceptance
Peer Acceptance Initial Peer Acceptance Slope
ΔR2
B SE B ß ΔR2
B SE B ß
Step 1 .09 .08
T1 Age 0.02 .01 .19 -0.02 .01 -.28**
Gender -0.03 .19 -.02 -0.03 .14 -.02
T1 VA 0.02 .01 .26* -0.004 .004 -.10
Step 2 .01 .03
Inhibition -0.06 .66 -.01 -0.15 .50 -.04
Planning -0.01 .03 -.05 0.02 .02 .13
WM 0.04 .04 .14 -0.02 .03 -.10
ADM -0.07 .23 -.03 -0.13 .17 -.08
Delay -0.001 .14 -.001 0.08 .11 .09
ToM -0.02 .14 -.02 -0.01 .10 -.02
Step 3 .32*** .07
Physical 0.32 .17 .28 -0.15 .16 -.17
Relational 0.14 .15 .12 0.05 .14 .05
Prosocial 0.92 .14 .71*** -0.32 .13 -.33
Note. *p < .05, **p < .01. T1 = Time 1. VA = Verbal Ability. WM = Working Memory.
ADM = Affective Decision Making. Delay = Delay of Gratification. ToM = Theory of Mind.
Summary. The results revealed that EF and ToM at Time 1 did not significantly
predict children's initial peer acceptance. Added to this, EF and ToM were not significantly
associated with the longitudinal nature of children's peer acceptance. Aggressive and
prosocial behaviour at Time 1, however, significantly predicted initial peer acceptance, but

264
not change in peer acceptance between Time 1 and Time 3. In particular, greater prosocial
behaviour was central to higher initial peer acceptance.
7.4.3.3. Association between EF, ToM, Aggression, Prosocial Behaviour
and Peer Acceptance at each Time Point
The relation between individual cognitive abilities, aggression, prosocial behaviour
and peer acceptance at each time point was examined. Pearson's correlations were first carried
out to explore initial correlations and then partial correlations controlling for age and verbal
ability were carried out. Age was controlled for because the sample spanned a wide age range
and cognitive abilities change with age (Hughes, 1998a). Verbal ability was controlled for
because verbal ability has been linked to cognitive processes (Hughes & Ensor, 2011;
Hughes, 1998a). Correlations between variables at each time point are presented in Table
7.18.
At Time 1 the only cognitive ability that was significantly associated with peer
acceptance was working memory. Working memory was positively correlated with peer
acceptance, but after age and verbal ability were taken into account this relation did not
remain significant. At Time 2, working memory remained significantly and positively related
to peer acceptance and this association remained significant after age and verbal ability were
controlled. However, at Time 2 cool inhibition and hot delay of gratification were positively
and marginally significantly correlated with peer acceptance. The relation between delay of
gratification and peer acceptance remained marginally significant after control variables were
taken into account, but the association between inhibition and peer acceptance did not. At
Time 3, neither EF nor ToM were significantly associated with peer acceptance.
Prosocial behaviour was significantly and positively related to peer acceptance at all
three time points. This relation remained even after concurrent age and verbal ability were
taken into account. Time 1 proactive physical aggression was the only aggressive subtypes
significantly related to peer acceptance. Proactive physical aggression was negatively related
to peer acceptance, however, this association did not remain significant after control variables
were taken into account. At Time 2 and 3, all measures of aggression were significantly and
negatively correlated with peer acceptance, even after age and verbal ability were controlled
for.
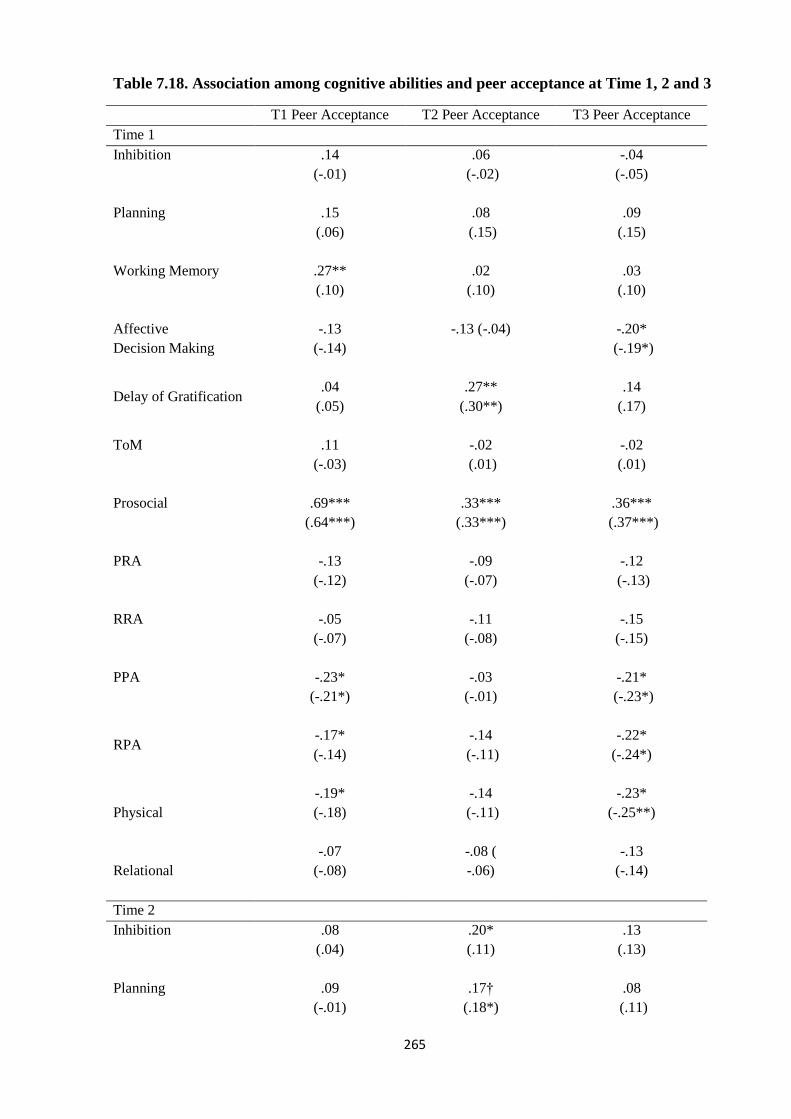
265
Table 7.18. Association among cognitive abilities and peer acceptance at Time 1, 2 and 3
T1 Peer Acceptance T2 Peer Acceptance T3 Peer Acceptance
Time 1
Inhibition
.14
(-.01)
.06
(-.02)
-.04
(-.05)
Planning
.15
(.06)
.08
(.15)
.09
(.15)
Working Memory
.27**
(.10)
.02
(.10)
.03
(.10)
Affective
Decision Making
-.13
(-.14)
-.13 (-.04) -.20*
(-.19*)
Delay of Gratification
.04
(.05)
.27**
(.30**)
.14
(.17)
ToM
.11
(-.03)
-.02
(.01)
-.02
(.01)
Prosocial
.69***
(.64***)
.33***
(.33***)
.36***
(.37***)
PRA
-.13
(-.12)
-.09
(-.07)
-.12
(-.13)
RRA
-.05
(-.07)
-.11
(-.08)
-.15
(-.15)
PPA
-.23*
(-.21*)
-.03
(-.01)
-.21*
(-.23*)
RPA
-.17*
(-.14)
-.14
(-.11)
-.22*
(-.24*)
Physical
-.19*
(-.18)
-.14
(-.11)
-.23*
(-.25**)
Relational
-.07
(-.08)
-.08 (
-.06)
-.13
(-.14)
Time 2
Inhibition
.08
(.04)
.20*
(.11)
.13
(.13)
Planning
.09
(-.01)
.17†
(.18*)
.08
(.11)
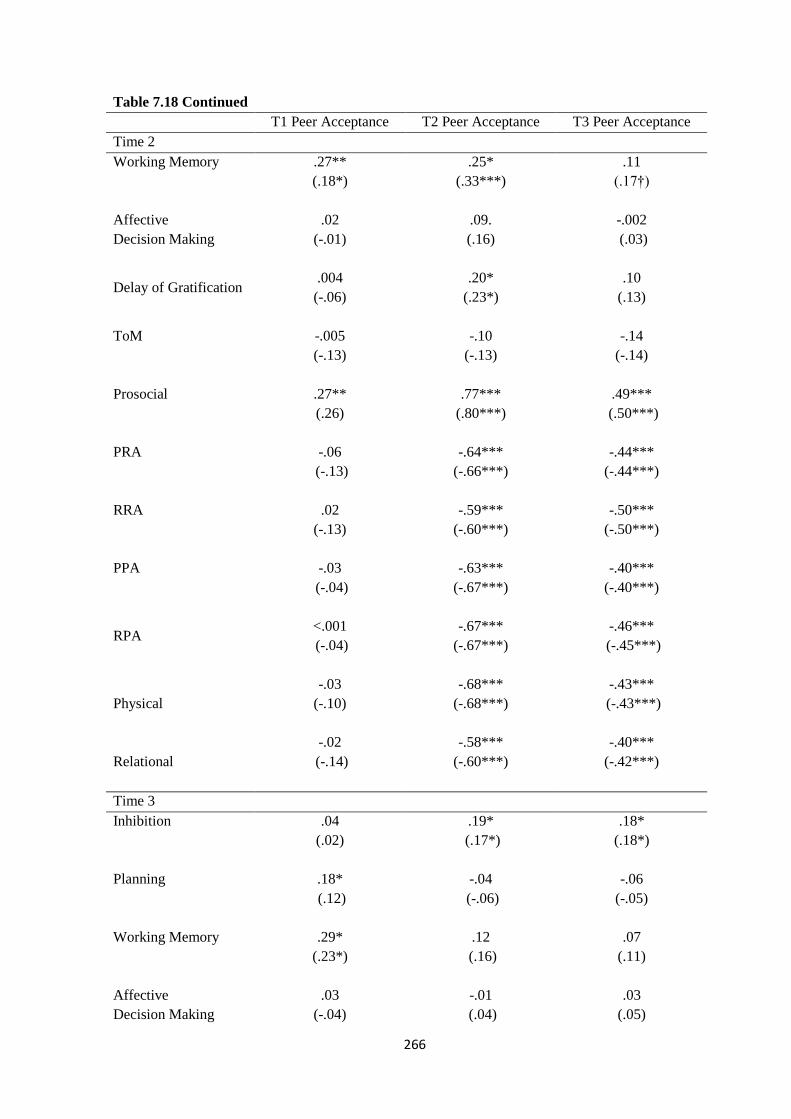
266
Table 7.18 Continued
T1 Peer Acceptance T2 Peer Acceptance T3 Peer Acceptance
Time 2
Working Memory
.27**
(.18*)
.25*
(.33***)
.11
(.17†)
Affective
Decision Making
.02
(-.01)
.09.
(.16)
-.002
(.03)
Delay of Gratification
.004
(-.06)
.20*
(.23*)
.10
(.13)
ToM
-.005
(-.13)
-.10
(-.13)
-.14
(-.14)
Prosocial
.27**
(.26)
.77***
(.80***)
.49***
(.50***)
PRA
-.06
(-.13)
-.64***
(-.66***)
-.44***
(-.44***)
RRA
.02
(-.13)
-.59***
(-.60***)
-.50***
(-.50***)
PPA
-.03
(-.04)
-.63***
(-.67***)
-.40***
(-.40***)
RPA
<.001
(-.04)
-.67***
(-.67***)
-.46***
(-.45***)
Physical
-.03
(-.10)
-.68***
(-.68***)
-.43***
(-.43***)
Relational
-.02
(-.14)
-.58***
(-.60***)
-.40***
(-.42***)
Time 3
Inhibition
.04
(.02)
.19*
(.17*)
.18*
(.18*)
Planning
.18*
(.12)
-.04
(-.06)
-.06
(-.05)
Working Memory
.29*
(.23*)
.12
(.16)
.07
(.11)
Affective
Decision Making
.03
(-.04)
-.01
(.04)
.03
(.05)

267
Table 7.18 Continued
T1 Peer Acceptance T2 Peer Acceptance T3 Peer Acceptance
Time 3
Delay of Gratification
.14
(.07)
.18*
(.16)
.06
(.08)
ToM
.08
(-.03)
.02
(-.01)
.04
(.07)
Prosocial
.14
(.11)
.50***
(.49***)
.68***
(.69***)
PRA
-.15
(-.16)
-.49***
(-.46***)
-.46***
(-.46***)
RRA
-.18*
(-.21*)
-.54***
(-.50***)
-.50***
(-.50***)
PPA
-.08
(-.05)
-.56***
(-.55***)
-.51***
(-.51***)
RPA
-.12
(-.10)
-.64***
(-.63***)
-.53***
(-.53***)
Physical
-.08
(-.11)
-.58***
(-.55***)
-.58***
(-.44***)
Relational
-.10
(-.19*)
-.43***
(-.38***)
-.36***
(-.36***)
Note. Partial correlations controlling for age and verbal ability are reported in brackets. *p <
.05, **p < .01, 8**p < .001, †p < .06, one tailed. T1 = Time 1. T2 = Time 2. T3 = Time 3.
ToM = Theory of Mind. PRA = Proactive Relational Aggression. RRA = Reactive Relational
Aggression. PPA = Proactive Physical Aggression. RPA = Reactive Physical Aggression.
The correlational analysis revealed that the correlations between aggressive and
prosocial behaviour became stronger across time points. This may reflect childrens increasing
age and the concurrent increase in the importance of peer acceptance (Silk et al., 2012). To
investigate this hypothesis further, correlations between aggression, prosocial behaviour and
peer acceptance across the three time points for each cohort were examined.

268
Table 7.19. Correlations between aggression, prosocial behaviour and peer acceptance at Time 1, 2 and 3 for each cohort.
4-year-old Cohort 5-year-old Cohort 6-year-old Cohort
Mean age 4 4.5 5 5 5.5 6 6 6.5 7
T1 Peer Acceptance
Prosocial
.64*** .003 .43* .70*** .42** .30* .68*** .49** .48**
PRA
.25 -.04 .25 .01 .16 -.21 -.45** -.40** -.35*
RRA
.32* .04 .29 .12 .24 -.20 -.44** -.48** -.41**
PPA
.11 .06 .09 -.08 -.14 -.43*** -.51** -.05 -41**
RPA
.17 .11 .17 -.04 -.17 -.40** -.44** -.32* -.49*
Physical Aggression
.19 .16 .20 -.05 -.16 -.41** -.52** -.36* -.56***
Relational Aggression
.31* .02 .31 .08 .20 -.20 -.42** -.45** -.41**
4-year-old Cohort 5-year-old Cohort 6-year-old Cohort
Mean age 4 4.5 5 5 5.5 6 6 6.5 7
T2 Peer Acceptance
Prosocial
- .71*** .56** - .83*** .47** - .81*** .50**
PRA
- -.73*** -.62*** - -.61*** -.60*** - -.63*** -.26*
RRA - -.63*** -.61*** - -.51** -.61*** - -.64*** -.37*
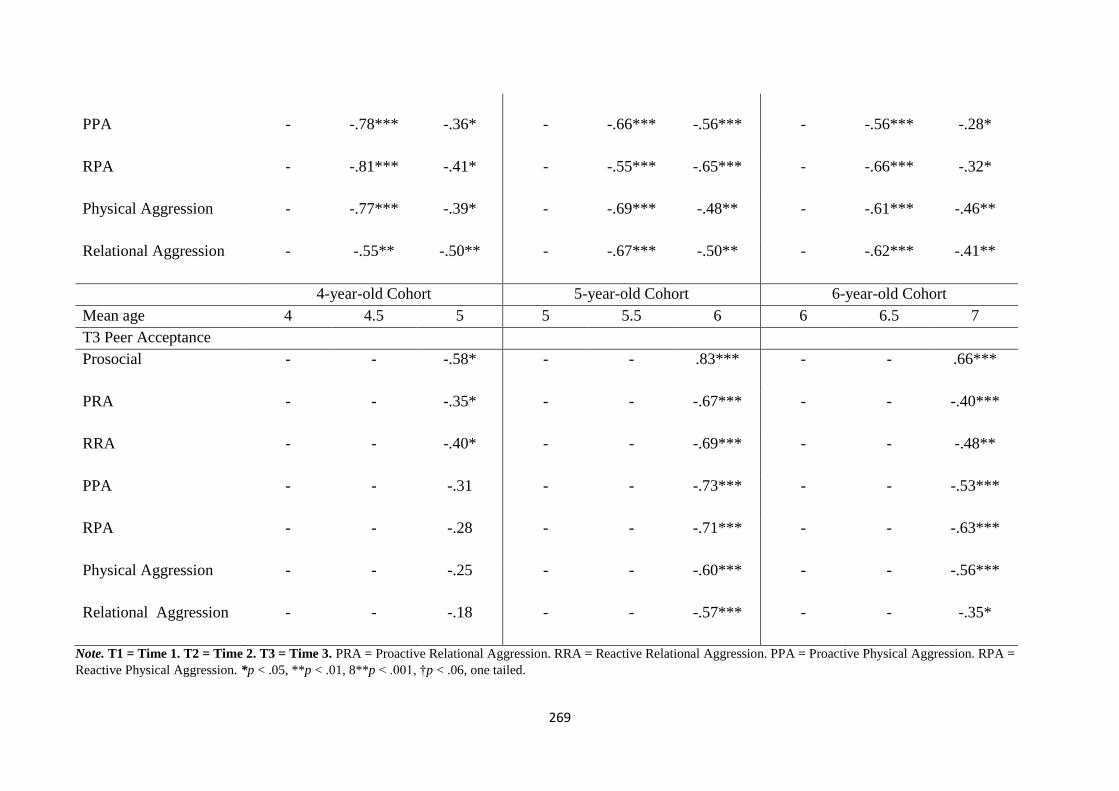
269
PPA
- -.78*** -.36* - -.66*** -.56*** - -.56*** -.28*
RPA
- -.81*** -.41* - -.55*** -.65*** - -.66*** -.32*
Physical Aggression
- -.77*** -.39* - -.69*** -.48** - -.61*** -.46**
Relational Aggression
- -.55** -.50** - -.67*** -.50** - -.62*** -.41**
4-year-old Cohort 5-year-old Cohort 6-year-old Cohort
Mean age 4 4.5 5 5 5.5 6 6 6.5 7
T3 Peer Acceptance
Prosocial
- - -.58* - - .83*** - - .66***
PRA
- - -.35* - - -.67*** - - -.40***
RRA
- - -.40* - - -.69*** - - -.48**
PPA
- - -.31 - - -.73*** - - -.53***
RPA
- - -.28 - - -.71*** - - -.63***
Physical Aggression
- - -.25 - - -.60*** - - -.56***
Relational Aggression
- - -.18 - - -.57*** - - -.35*
Note. T1 = Time 1. T2 = Time 2. T3 = Time 3. PRA = Proactive Relational Aggression. RRA = Reactive Relational Aggression. PPA = Proactive Physical Aggression. RPA =
Reactive Physical Aggression. *p < .05, **p < .01, 8**p < .001, †p < .06, one tailed.

270
Correlations examing the relation between aggressive and prosocial behaviour across
cohorts revealed that whereas prosocial behaviour was consistently highly, positively
correlated with peer acceptance across the course of a year for each cohort, aggression
became more strongly associated with peer acceptance. For each cohort, concurrent
aggression and peer acceptance were most strongly associated. Interestingly, initial aggression
was positively associated with peer acceptance in the 4-year-old cohort. These relations
became negative at Time 2. Results indicate that there are age related changes in the relation
between aggression and peer acceptance.
Following the correlation analyses, hierarchical linear regressions were carried out to
explore the contribution of EF and ToM, as well as aggressive and prosocial behaviour to peer
acceptance within each time point. In this analysis only concurrent predictors of peer
acceptance were examined. In contrast to previous analyses, earlier predictors were not
controlled for due to the fact both cognitive and behavioural predictors were included in this
analysis. Controlling for previous predictors would mean the number of predictors compared
to the sample size would greatly reduce the power of the analysis (B. Cohen, 2008). This is an
exploratory analysis and therefore the relations at each time point were examined in order to
gain an initial understanding of these associations. The role of Time 1 EF and ToM and
aggressive and prosocial behaviour in peer acceptance is presented in Chapter Five. In the
present chapter, the first set of regressions investigated the role of T2 EF and ToM and
aggressive and prosocial behaviour in T2 peer acceptance. Next, the role of Time 3 EF and
ToM and aggressive and prosocial behaviour in Time 3 peer acceptance was examined. In the
first step gender and concurrent age and verbal ability were entered in order to control for
potential confounding effects as these variables were correlated with cognitive abilities and
social behaviour. In the second step concurrent EF and ToM skills were entered and in the
third step concurrent aggressive and prosocial behaviour were entered. As with the analysis
above, only physical and relational subtypes were included due to multicolineariry.
Aggressive and prosocial behaviour was entered after EF and ToM because EF and ToM were
found to predict aggressive behaviour and the role of the function and form of aggression in
peer acceptance has yet to be investigated. The unique contribution of aggressive subtypes,
after controlling for EF and ToM, to peer acceptance could therefore be explored. Full
regression results are reported in Table 7.19.
Time 1 prosocial and aggressive behaviour were significantly related to Time 1 peer
acceptance (Study 2, Chapter 5). In particular, greater prosocial behaviour was associated
with higher peer acceptance. Time 1 EF and ToM did not significantly predict Time 1 peer
271
acceptance. Time 2 EF and ToM did not significantly contribute to understanding of
concurrent peer acceptance, after taking into account control variables (see Chapter Five for
results). Time 2 EF and ToM significantly increased the amount of variance in Time 2 peer
acceptance explained to 33% , after gender and Time 2 age and verbal ability were taken into
account, ΔR2
= .21, ΔF(6, 89) = 4.61, p < .001. Planning and working memory were significant
positive independent predictors, whereas ToM was a significant negative independent
predictor. Time 2 aggressive and prosocial behaviour significantly increased the amount of
variance in peer acceptance at Time 2 accounted for to 74% , after controlling for Time 2 EF
and ToM, ΔR2
= .41, ΔF(3, 86) = 26.78, p < .001. Prosocial behaviour was a significant
positive independent predictor.
After gender and concurrent age and verbal ability were taken into account, Time 3
EF and ToM did not significantly increase understanding of Time 3 peer acceptance, ΔR2
=
.05, ΔF(6, 88) = 0.78, p = .59. Time 3 aggressive and prosocial behaviour, however,
significantly increased the the variance in Time 3 peer acceptance accounted for to 53% , after
controlling for Time 3 EF and ToM, ΔR2
= .46, ΔF(3, 85) = 27.70, p < .001. Prosocial
behaviour is a significant positive independent predictor. Regression results for Time 2 and
Time 3 peer acceptance are reported in 7.19.

272
Table 7.20. EF,ToM, aggression and prosocial behaviour as predictors of peer acceptance at Time 2 and 3
T2 Peer Acceptance T3 Peer Acceptance
ΔR2
B SE B ß ΔR2
B SE B ß
Controls .12** Controls .02
T2 Age -0.01 .01 -.19† T3 Age -0.01 .01 -.09
Gender 0.09 .13 .07 Gender -0.06 .15 -.04
T2 VA 0.01 .004 .27** T3 VA 0.01 .004 .11
T2 EF &
ToM
.21*** T3 EF &
ToM
.05
Inhibition -0.24 .31 -.08 Inhibition 0.71 .50 .18
Planning 0.02 .01 .21* Planning -0.02 .02 -.15
WM 0.11 .03 .42*** WM 0.02 .04 .08
ADM 0.26 .15 .16 ADM 0.09 .17 .06
Delay 0.12 .09 .14 Delay 0.03 .12 .03
ToM -0.20 .07 -.28* ToM 0.01 .10 .01

273
Table 7.20 Continued
T2 Peer Accptance T3 Peer Acceptance
ΔR2
B SE B ß ΔR2
B SE B ß
T2
Behaviour
.41*** T3
Behaviour
.46***
Physical -0.17 .09 -.19 Physical -0.24 .16 -.19
Relational -0.03 .08 -.04 Relational -0.12 .15 -.11
Prosocial 0.51 .08 .59*** Prosocial 0.63 .09 .68***
Note. T2 = Time 2. T3 = Time 3.VA = Verbal Ability. WM = Working Memory. ADM = Affective Decision Making. Delay = Delay of Gratification.
ToM = Theory of Mind. Physical = Physical Aggression. Relational = Relational Aggression. *p < .05, **p < .01, ***p < .001, †p = .05.

274
Summary. The results revealed that the role of EF and ToM and prosocial and
aggressive behaviour in peer acceptance does not remain stable across early childhood. At
Time 1 aggression and prosocial behaviour significantly predicted peer acceptance, but EF
and ToM were unrelated to peer acceptance. At Time 2, however, EF and ToM were
significantly related to peer acceptance. Further, aggressive and prosocial behaviour were
significantly associated with peer acceptance after EF and ToM were taken into account. At
Time 3, aggression and prosocial behaviour remained significantly predictive of peer
acceptance, but EF and ToM were no longer significantly related to peer acceptance.
7.4.4. Overall summary
Table 7.21. Summary of main findings
Key Findings
Aggression Change across early childhood
Proactive and reactive, physical and relational aggression
significantly decreased from T1 to T3.
For proactive and reactive relational aggression, the 4-year-
old cohort showed a decreasing trend, the 5-year-old cohort
showed a decrease at T2 and the an increase at T3 and in the
6-year-old levels were relatively stable across time points.
For reactive physical aggression, the 4-year-old cohort
demonstrated an increase at T2, whereas the 5 and 6-year-old
cohort showed a decrease at T2.
For proactive physical aggression, all cohorts showed a
decreasing trend across time points.
Overall findings
T1 EF and ToM significantly predicted initial RPA only.
T1 EF and ToM did not significantly predict development of
aggression from T1 to T3.
Findings within each time point

275
The predictive role of EF and ToM in aggressive subtypes
was not stable between T1 and T3.
T1 EF and ToM significantly predicted T1 PPA and RPA.
T1 and T2 EF and ToM significantly predicted T2 RRA.
T1, T2 and T3 EF and ToM did not significantly predict T3
aggression.
Prosocial
behaviour
Change across early childhood
Prosocial behaviour significantly increased from T1 to T3
across all cohorts.
Overall findings
T1 EF and ToM did not predict initial prosocial behaviour or
development of prosocial behaviour from T1 to T3.
Findings within each time point
The predictive role of EF and ToM in prosocial behaviour
was not stable between T1 and T3.
T1 EF and ToM did not significantly predict T1 prosocial
behaviour.
T1 and T2 EF and ToM did significantly predict T2 prosocial
behaviour.
T1, T2 and T3 EF and ToM did not significantly predict T3
prosocial behaviour.
Peer Acceptance Change across early childhood
Peer acceptance significantly increased from T1 to T3.
Peer acceptance significantly increased from T1 to T2 in the 4
and 5-year-old cohort, but between T2 and T3 decreased for
the 4-year-old cohort and increased for the 5-year-old cohort.
The 6-year-old cohort showed a decrease at T2 and then an
increase at T3.
Overall findings
T1 EF and ToM did not predict initial peer acceptance or
change in peer acceptance from T1 to T3.

276
T1 aggressive and prosocial behaviour significantly predicted
initial peer acceptance, but not change in peer acceptance
from T1 to T3.
Findings within each time point
The predictive role of EF and ToM as well as aggressive and
prosocial was not stable between T1 and T3.
T1 prosocial and aggressive behaviour (but not T1 EF and
ToM) significantly predicted T1 Peer acceptance.
T2 EF and ToM as well as T2 aggressive and prosocial
behaviour significantly predicted T2 peer acceptance.
T3 aggressive and prosocial behaviour (but not T3 EF and
ToM) significantly predicted T3 peer acceptance.
7.5. Discussion
The study presented in this chapter was the first to examine the longitudinal
associations between EF, ToM, aggression, prosocial behaviour and peer acceptance across
early childhood. This study expanded on prior research as it investigated the role of individual
cool and hot EF processes along with ToM in the function and form of aggression as well as
prosocial behaviour. Further, the relation between both these cognitive abilities and social
behaviours to peer acceptance was also explored. This study made three major contributions
to the literature. Firstly, changes in subtypes of aggression, prosocial behaviour and peer
acceptance across early childhood were examined. The findings revealed that prosocial
behaviour and peer acceptance increased and aggression decreased from Time 1 to Time 3, in
line with prior studies (Jackson & Tisak, 2001; Parker et al., 2006). During early childhood,
important changes in children’s social behaviour therefore occur. However, changes in
aggression across the three time points differed for subtypes of aggression, supporting
research which has proposed aggression follows different developmental trajectories
depending on its type (Kempes et al., 2005; Poulin & Boivin, 2000). Proactive and reactive
relational aggression showed a linear decrease in the 4-year-old cohort, a decrease at Time 2
in the 5-year-old cohort and remained relatively stable in the 6-year-old cohort. Proactive and
reactive physical aggression followed a differing trend. Proactive physical aggression
remained relatively stable from Time 1 to Time 3 for the three cohorts, but reactive physical
277
aggression demonstrated an increase at Time 2 in the 4-year-old cohort, but a decrease at
Time 2 in the 5 and 6-year-old cohort. The present findings therefore support a multi-
dimensional model of aggression (Kim et al., 2013; Willoughby et al.,2010).
Second, this study investigated whether EF and ToM at Time 1 predict initial as well
as change in aggression, prosocial behaviour and peer acceptance from Time 1 to Time 3 in
order to gain an overview of the role of initial cognitive abilities in the nature of the
development of these social outcomes across early childhood. The present findings indicated
that Time 1 EF and ToM, particularly cool inhibition, predicted initial reactive physical
aggression, but not change in aggression from Time 1 to Time 3. Time 1 EF and ToM also did
not significantly predict initial or change in prosocial behaviour and peer acceptance.
Prosocial and aggressive behaviour at Time 1, though, predicted initial peer acceptance, but
not change in peer acceptance. Third, the association among EF, ToM and social outcomes
within and across each time point was explored as early childhood is characterised by
dramatic cognitive and social developments (P. Anderson, 2008; V. Anderson et al., 2008;
Wellman et al., 2001). The results revealed that the role of EF and ToM skills changed across
early childhood. Time 1 proactive and reactive physical aggression were predicted by Time 1
EF and ToM. Time 2 reactive relational aggression and Time 2 prosocial behaviour were
predicted by Time 1 and 2 EF and ToM. Aggressive and prosocial behaviour predicted peer
acceptance at each time point, but only Time 2 EF and ToM predicted Time 2 peer
acceptance. The current findings therefore have important theoretical implications for models
of social development. This study suggests that models of social development need to take
into account the changing nature of cognitive abilities and social behaviours across early
childhood.
7.5.1. Aggression
Overall, aggression, irrespective of function or form, showed a decreasing trend
across Time 1 to Time 3, supporting previous research which has found that aggression
declines across early childhood (Tremblay et al., 2004; Vaillancourt et al., 2007; Wildeboer et
al., 2015). This may reflect children's increasing use of prosocial behaviour. Children may be
increasingly socialised away from aggression by parents, teachers and peers (Eivers et al.,
2012) and may learn to use more prosocial strategies when negotiating frustrating peer
interactions (Zsolnai et al., 2012). This decline may further reflect children's increasing
cognitive control and social understanding (Study 3, Chapter 6), which is discussed in more
detail below. Though, this represents the mean trajectory for the whole sample. Individual
differences in trajectories of aggression are likely (Cleverley et al., 2012; Vaillancourt et al.,
278
2007b; Xie et al., 2011). That is, although the majority of children showed a decline in
aggression, some children are likely to show increasing or stable levels of aggression.
Examining different groups of trajectories, however, was beyond the scope of this study, but
represents an important avenue for future research.
In line with research which has argued forms of aggression follow different
developmental trajectories (Kempes et al., 2005; Poulin & Boivin, 2000), the current findings
revealed that physical and relational aggression followed different patterns of development
across the 4, 5 and 6-year-old cohorts. Interestingly, proactive and reactive relational
aggression followed similar trends between 4- and 7-years-of-age, supporting prior studies
with adolescents which have found that proactive and reactive functions of aggression
evidence similar developmental trends (Barker et al., 2010; Cui et al., 2015). Relational
aggression is typically used less frequently in early childhood and tends to occur in more
direct forms in early childhood (Monks et al., 2003) and as a result relational aggression may
show similar developmental trends whether used reactively or proactively in early childhood.
Differences may be more apparent in later childhood, when relational aggression increases
and children use more indirect aggression. However, this similar pattern may also reflect the
fact that Teachers find it challenging to differentiate between the functions of aggression
(Bushman & Anderson, 2001). Though, proactive and reactive physical aggression reported
by Teachers followed distinct trajectories.
Proactive physical aggression remained relatively stable across cohorts, which may
reflect the low rates of proactive physical aggression in this sample. Reactive physical
aggression on the other hand varied across cohorts. Proactive physical aggression may peak in
the toddler years as children may resort to physical aggression to get what they want due to
their limited verbal skills and behavioural and emotional regulation (Björkqvist et al., 1992;
Hartas, 2011; Rimm-Kaufman et al., 2006), but as children move into early childhood and
their verbal and self-regulation skills increase physical aggression may decline and children
may learn more affiliative ways of achieving their goals. Reactive physical aggression may
follow a different pattern to proactive aggression, though, as young children may still
continue to struggle with withholding aggression in frustrating peer interactions (e.g. being
teased by a peer; Zsolnai et al., 2012). In line with this argument, the 4-year-old cohort
demonstrated an increase in mean reactive physical aggression at Time 2 as they transitioned
from nursery to school. With this transition, children are required to interact with a new peer
group for longer periods of time, which may place greater demands on their social and

279
cognitive skills. Consequently children may resort to physical aggression more frequently
when frustrated initially.
Boys demonstrated significantly greater physical aggression than girls, supporting
previous studies (Hay et al., 2011; Lussier et al., 2012). Further, this is in line with research
which has suggested that gender differences in physical aggression emerge in infancy (Hay et
al., 2011) and remain in childhood (Card et al., 2008; Lansford et al., 2012). Boys may
engage in higher physical aggression than girls because physical aggression is considered
more normative for boys (Lagerspetz et al., 1988; Ostrov & Keating, 2004). Alternatively,
Teachers may rate boys higher in physical aggression because physical aggression is
considered more stereotypical of boys rather than girls (Condry & Ross, 1985; Underwood,
Galen, & Paquette, 2001). Level of relational aggression, in contrast, did not significantly
differ between boys and girls. Gender differences in relational aggression may not be apparent
until children are approaching adolescence (R. Smith et al., 2009). Relational aggression has
been found to follow an increasing trajectory from 10- to 11-years-of-age for girls, but not
boys (Kawabata & Crick, 2013). This may reflect differences in the structure of boy's and
girl's peer groups (Lagerspetz et al., 1988). Relational aggression may be a more effective
tactic in girl's peer groups as they are typically smaller and more intimate than boy's peer
groups.
After establishing the development of aggression over the course of a year for the
three cohorts, the predictive role of EF and ToM in subtypes of aggression across early
childhood was examined to increase current understanding of the underlying cognitive profile
of subtypes of aggression. Time 1 EF and ToM predicted initial reactive physical aggression
only. In line with the findings of study one (Chapter 5) and two (Chapter 6) inhibition
appeared to be central to reactive physical aggression. Children with poor inhibition
demonstrated higher rates of reactive physical aggression reported by Teachers. This supports
previous studies which have suggested that inhibition is central to reactive but not proactive
aggression (Rathert et al., 2011; White et al., 2012). The association between inhibition and
reactive aggression is in alignment with the perspective that reactive aggression develops
from poor regulation (Dodge, 1991). Children with poorer inhibition may be less able to
regulate their behaviour and emotions and withhold using a physically aggressive act in
response to frustration. Proactive aggression, in opposition, is more planned and calculated
and as a result may be less concerned with the ability to regulate behaviour and emotions
(Dodge, 1991) and consequently may be less reliant on EF.

280
Interestingly, Time 1 EF and ToM did not predict whether children followed an
increasing or decreasing trajectory of aggression of any function or form across the three time
points. EF and ToM may have been implicated in initial reactive physical aggression during
early childhood due to the greater association between reactive physical aggression and
behavioural and emotional regulation compared to the other functions and forms (Dodge,
1991). However, initial EF and ToM may not have predicted trajectories of aggression across
early childhood because the rapid development of EF and ToM across early childhood (Study
3; Chapter 6; V. Anderson et al., 2008; Wellman et al., 2001) may mean that the relation
between EF and ToM may change over this period. This is in line with a study that found
effortful control at 3-years-old was associated with aggression when children were 3-years-of-
age, but not when children were 5- to 6-years-of-age (Olson et al., 2011). Inhibition is thought
to be a fundamental EF subcomponent that children reach proficiency in before other EF
processes (Smidts et al., 2004; Tillman et al., 2015) and provide the basis for the development
of more complex EF skills, such as planning (Senn et al., 2004). Inhibition may therefore be
important to aggression early on when there is greater individual difference in children's
inhibition, but once children have reached a sufficient level of inhibition, more complex EF
processes that are beginning to emerge may become more central to aggression.
This argument is supported by the finding of the present study that not only were
subtypes of aggression characterised by varying underlying cognitive mechanisms, but that
these relations changed across early childhood. Time 1 proactive and reactive physical
aggression were associated with Time 1 EF and ToM. Time 2 reactive relational aggression
was predicted by Time 1 and 2 EF and ToM. EF and ToM, however, did not significantly
contribute to understanding of subtypes of aggression at Time 3. This not only suggests that
subtypes of aggression are characterised by different cognitive profiles, but also that the
underlying cognitive factors of subtypes of aggression change across early childhood. These
changing relations may reflect children's increasingly advancing EF and ToM (P. Anderson,
2008; Wellman et al., 2001). Indeed, ToM was predictive of reactive relational aggression at
Time 2, but not Time 1. Children do not typically pass first-order false belief tasks until 4- or
5-years-of-age and second-order false belief tasks until 6- or 7-years-of-age (S. Miller, 2009;
Wellman et al., 2001). When children have developed a sufficient level of ToM it may then
become associated with their aggressive behaviour.
However, not all subtypes of aggression were predicted by EF and ToM. The
developing nature of aggression may also play a role in the varying associations between EF,
ToM and aggression. Inhibition may have predicted physical aggression at Time 1 as physical
281
aggression is more common in infancy and young children (Gray et al., 2014) as they begin to
interact with the peer group, but have limited verbal skills to express their wishes or
frustrations and do not have sufficiently developed inhibition to withhold aggressive
behaviour. Then as children progress towards middle childhood, relational aggression is more
common (Björkqvist et al., 1992; Spieker et al., 2012), which may reflect children's greater
social understanding and increasing verbal ability (Björkqvist et al., 1992; Hughes, 1998a;
Wellman & Lagattuta, 2000). Once children's EF and ToM is sufficiently developed, other
factors may be more central to their aggression. In line with this, inhibition was not related to
aggression in studies of adolescents (Hummer et al., 2015). Alternatively, there may be
bidirectional relations between cognitive abilities and social development. Children's initial
EF and ToM may influence the type of peer interactions they experience, which in turn may
influence their emerging EF and ToM, as well as their later social development (Brink et al.,
2015).
7.5.2. Prosocial Behaviour
In line with prior findings (Jackson & Tisak, 2001), prosocial behaviour significantly
increased across early childhood. There was no significant interaction between time and
cohort on prosocial behaviour, indicating that prosocial behaviour followed the same
increasing trajectory across the 4, 5 and 6-year-old cohort. According to the current findings
early childhood is not just characterised by dramatic changes in aggression, but also in
prosocial behaviour. During early childhood, children's use of aggressive behaviour is
declining and their use of prosocial behaviour is increasing, which may reflect increasing
socialisation pressures (Hay, 1994). In addition, there were no gender differences in mean
prosocial behaviour across Time 1 to Time 3. This may reflect the age of the sample. Gender
differences in prosocial behaviour have typically been found in infancy (Hay, 1994), but are
not apparent in early childhood (Yagmurlu, 2013). Girls may engage in prosocial behaviour
earlier than boys and consequently girls may be more prosocial in infancy (Hay, 1994).
However, by the time children reach early childhood boys may have caught up with girls in
their level of prosocial behaviour.
Consistent with the previous results reported study one (Chapter 4) and two (Chapter
5), Time 1 EF and ToM did not predict initial prosocial behaviour. Further, Time 1 EF and
ToM were also not associated with the nature of children's prosocial behaviour from Time 1
to Time 3. Thus, adding to the previous results, initial EF and ToM did not predict whether
children's prosocial behaviour increased or decreased across early childhood. Although
greater cognitive functioning in areas such as EF and ToM may be associated with reduced

282
aggression, they are not necessarily related to greater positive outcomes, such as prosocial
behaviour. Prosocial behaviour development may be more strongly related to other cognitive
abilities, such as moral reasoning or empathy (Laible et al., 2014), or socialisation by parents
and peers (Eivers et al., 2012; Hay, 1994). Though, it should be noted that prosocial
behaviour was assessed using four questions and overall prosocial behaviour was considered,
whereas aggression was assessed using 12 questions and the different functions and forms of
aggression were considered. The prosocial behaviour measure may therefore have not
captured the full range of individual variability in children's prosocial behaviour. Prosocial
behaviour includes a range of behaviours, such as sharing, cooperating and helping
(Eisenberg, 1990; Hay, 1994), and these behaviours may be differently related to children's
cognitive abilities.
The present study, though, suggested that the role of EF and ToM in prosocial
behaviour may not be stable across early childhood. Time 2 prosocial behaviour was
predicted by Time 1 and 2 EF and ToM. Time 1 planning and delay of gratification and Time
2 working memory and planning were significant independent predictors. Time 1 and Time 3
prosocial behaviour were not predicted by earlier or concurrent EF and ToM. The association
between EF, ToM and prosocial behaviour may not be straightforward; there may be indirect
relations. That is, children's early prosocial behaviour may be related to the development of
their EF and ToM. Children who are more prosocial may have greater access to peer
situations that will enhance the development of their cognitive and social skills (Farver &
Branstetter, 1994; McIntyre et al., 2006). Greater behaviour control and understanding of
others perspectives may then lead to children engaging in more prosocial interactions
(Hughes, 2001).
7.5.3. Peer Acceptance
The present findings revealed that between Time 1 and Time 3 peer acceptance
significantly increased for the whole sample, in line with research suggesting that peer
acceptance becomes increasingly important to children across childhood (Silk et al., 2012).
There were no gender differences in peer acceptance across early childhood. There were,
however, significantly different patterns of change in peer acceptance from Time 1 to Time 3
across 4, 5 and 6-year-olds. Peer acceptance significantly increased between Time 1 and 2 for
both the 4 and 5-year-old cohorts, but between Time 2 and 3 peer acceptance decreased for
the 4-year-old cohort and increased for the 5-year-old cohort. The 6-year-old cohort showed a
decrease in peer acceptance at Time 2 and then an increase at Time 3. Overall peer acceptance
283
may be increasing across early childhood as children become more concerned with their
standing within the peer group, but differences between cohorts in the development of peer
acceptance across the time points may reflect the changing nature of children's social
standing. Children's standing within the peer group may be fluid and may change across time
(Cairns, Leung, Buchanan, & Cairns, 1995). At Time 2 children transitioned to the next year
group at school and the majority of children transferred to a new class. These changing peer
group dynamics may result in children's position within the peer group altering.
According to this study, prosocial and aggressive behaviour were associated with
initial peer acceptance, in support of previous findings (Study 2, Chapter 5; Card & Little,
2006; Ettekal & Ladd, 2015). Prosocial behaviour was an independent positive predictor,
meaning children with greater prosocial behaviour were more accepted by their peers. Highly
prosocial children may have access to a greater number of peer interactions and may
experience more positive peer interactions, which may consequently lead to greater
acceptance within the peer group (Farver & Branstetter, 1994; Walker, 2004). Expanding on
study two, though, prosocial and aggressive behaviour were not associated with the
development of peer acceptance across early childhood. That is, children's Time 1 prosocial
and aggressive behaviour were not associated with whether their peer acceptance increased or
decreased across the course of the year. Aggressive and prosocial behaviour may be important
to peer acceptance at the beginning of early childhood as children are transitioning into the
peer group, but may be less important across early childhood.
When the relation between prosocial and aggressive behaviour and peer acceptance
within each time point was examined, concurrent prosocial behaviour was a consistent
positive predictor of peer acceptance. Children's prosocial behaviour significantly increases
across early childhood, therefore children's concurrent level, not their initial level, of
prosocial behaviour may be central to their peer acceptance at each time point. It is interesting
to note, physical and relational aggression at Time 1 were positively associated with peer
acceptance, but at Time 2 and 3 were negatively related. Before children have been socialised
away from aggression, it could be that aggressive children are more dominant within the peer
group (Pellegrini et al., 2011) or that these children are using aggression in defence of a peer
(Lee, Smith, & Monks, 2015) and as a result they are more accepted within the peer group.
This finding, though, should be treated with caution as physical and relational aggression
were not independent predictors.
Correlational analyses revealed that there may be age related changes in the relation
between aggressive and prosocial behaviour and peer acceptance. Although prosocial
284
behaviour was consistently highly, positively correlated with peer acceptance reported by
Teachers across the course of a year for each cohort, Time 2 prosocial behaviour was most
strongly related to Time 2 peer acceptance. It was at this time that children transition to the
next year group at school and the majority were introduced into a new peer group. During this
transition, prosocial behaviour may be particularly important to peer acceptance as prosocial
children may engage in more positive behaviours to establish themselves within a new peer
group (Farver & Branstetter, 1994; Walker, 2004). In contrast, aggression became more
strongly associated with peer acceptance at each time point for each cohort, with concurrent
relations being the strongest. Interestingly, there were age related differences between the
cohorts. In the 4-year-old cohort, Time 2 was most strongly associated with Time 2 peer
acceptance reported by Teachers. However, in the 5- and 6-year-old cohort, Time 2 and 3
aggression were most strongly associated with concurrent peer acceptance. This finding may
relect the time in the school year these social outcomes were measured. For instance, at Time
2, children in the 4-year-old cohort transitioned from nursery to more formal schooling.
Prosocial behaviour may be particularly impotant to peer acceptance at this time as children
are moving ito a new peer group and interacting with their peers (Walker, 2004). In the 5- and
6-year-old cohort, the increasing association between aggression and peer acceptance may
reflect the increasing centrality of peer acceptance to children (Silk et al., 2012). It is
important to note, however, that the increasing correlations across the course of year may
reflect repeated assessments. Teachers may have become more familiar with the measures or
may have exhibited demand characteristics. Further research examing age related changes in
peer acceptance is needed.
In contrast to previous work (Holmes et al., 2015; Masten et al., 2012), EF and ToM
skills were unrelated to initial peer acceptance or trajectories of peer acceptance across early
childhood. The link between children's cognitive abilities and their standing within the peer
group may not be straightforward. Children who are rejected by their peers may be less able
to access social settings which promote the development of EF and ToM, which may in turn
exacerbate their low acceptance within the peer group (Holmes et al., 2015). This is supported
by the changing role of cognitive abilities across early childhood. EF and ToM were related to
peer acceptance at Time 2, but not Time 1 or 3. Alternatively social behaviour may interact
with children's EF and ToM abilities. Children with poor EF and ToM, may engage in more
aggressive behaviour, and as a result may be more rejected by their peers. In support of this
argument, prosocial behaviour has been found to interact with cognitive abilities on its
influence on aggression (Study 1, Chapter 4; Poland et al., 2016; Renouf et al., 2009).
285
Time 1 and 2 planning and working memory were positively related to peer
acceptance. Children who are better able to recall and process social information and respond
in a more thoughtful and planned manner may engage in more positive peer interactions and
consequently may experience greater peer acceptance. ToM, however, was negatively related
to peer acceptance. In contrast to expectation, children with greater ToM experienced lower
peer acceptance. Children may not have been using their ToM for affiliative reasons. Some
children have been found to demonstrate a nasty ToM (Lonigro et al., 2013). These children
that are using their ToM in an antisocial way may consequently be more rejected by their
peers. In line with this argument, greater ToM was associated with higher reactive relational
aggression at Time 2. This hypothesis, though, needs further investigation.
7.5.4. Limitations
This study was the first to examine the longitudinal associations among EF, ToM,
aggression, prosocial behaviour and peer acceptance across early childhood. This study made
novel contributions to current understanding of the development of the function and form of
aggression across early childhood, the longitudinal links between EF, ToM and subtypes of
aggression and the longitudinal associations between EF, ToM, aggressive and prosocial
behaviour and peer acceptance. The findings of this study, though, should be considered in
light of the following limitations. The sample size (although large in comparison to studies in
this field) and cohort-sequential design prevented the use of more advanced modelling
techniques, such as structural equation modelling, to examine indirect relations between
variable across early childhood. Indirect pathways between cognitive abilities, social
behaviour and peer acceptance, for example, could have been explored. A further limitation
was that the study relied on Teacher reports of children's aggression, prosocial behaviour and
peer acceptance. Teachers are external to the peer group and consequently may not always be
aware of children's behaviour or standing within the peer group. Studies one (Chapter 4) and
two (Chapter 5), for instance, indicated that the results differed across informants. Future
studies using observations would be beneficial in investigating the link between cognitive
abilities and actual aggression in relation to findings based on Teacher and Peer reports.
The same measures of EF and ToM were used across time points. Although this
means greater confidence that the same underlying construct was being measured at each time
point, sensitivity to developmental changes across early childhood may have been hindered.
For example, delay of gratification evidenced a potential ceiling effect at Time 1 and therefore
may not have been sensitive to developments in delay of gratification across early childhood.

286
Future research should be directed to the development of EF and ToM tasks that are
appropriate for use across early childhood. Added to this, individual cool and hot EF skills
were used, but a composite ToM score consisting of first- and second-order false belief
understanding was used. Children attain these domains of ToM at different ages and
consequently the role of ToM in social outcomes may have varied across these domains.
7.5.5. Conclusions
This study emphasised the importance of understanding the link between cognition
and behaviour within the context of early childhood, a period characterised by important
advances in cognitive and social domains (Hongwanishkul et al., 2005; Hughes & Ensor,
2011; Wellman et al., 2001). The role of EF and ToM in aggressive and prosocial behaviour
as well as the links between these cognitive abilities and social behaviours to peer acceptance
changed across early childhood. This may reflect bidirectional or indirect pathways of
development, the investigation of which was beyond the scope of this study. Children's
emerging EF and ToM abilities may influence the access they have to peer situations which
will enhance their behavioural regulation and social understanding, which may further
influence their social behaviour. The current findings have important implications for current
neuroscience models of social behaviour, which neglect the role of development (Beauchamp
& V. Anderson, 2010; Yeates et al., 2007). The proposed relations of the models may not
hold across development and may in fact change as children's cognitive and social abilities
advance. This is discussed further in the General Discussion in Chapter 8.
The current findings support a multi-dimensional model of aggression that includes
distinct functions and forms (Crick et al., 1999; Dodge, 1991). Subtypes of aggression, for
example, followed different developmental trajectories. Proactive and reactive relational
aggression followed similar trajectories across cohorts, whereas proactive and reactive
physical aggression followed distinct trajectories across cohorts. Further, subtypes of
aggression were differently related to EF and ToM. Inhibition was central to proactive and
reactive physical aggression at Time 1, whereas planning (T1), delay of gratification (T1) and
ToM (T2) were central to reactive relational aggression at Time 2. The development of and
cognitive correlates of subtypes of aggression may therefore vary between the different
functions and forms. However, it is important to bear in mind that differences may reflect the
difficulty of teasing apart the functions of aggression. Identifying the different cognitive
correlates of the functions and forms of aggression across early childhood, however, will

287
enable a more comprehensive understanding of the varied development of aggression. This is
discussed further in the General Discussion (Chapter 8).
In addition to theoretical contributions, the present study may have important
practical implications. This study indicates that an important future avenue for research into
aggression interventions may be the function and form of aggression. Interventions may be
more effective if they consider the function and form of aggression as different cognitive
correlates may be related to subtypes of aggression. Further, some cognitive abilities may be
positively related to certain subtypes of aggression, whereas others are negatively related. In
addition, peer acceptance may represent another important factor that should be considered by
aggression interventions. Aggression was positively related to peer acceptance at Time 1, but
negatively related at Time 2 and 3. During the beginning of early childhood, aggression may
lead to greater peer acceptance. Interventions may therefore need to take into account the fact
that in early childhood aggression may have some positive benefits for the child. Interventions
may also need to take into account the developmental stage of the child. The underlying
cognitive correlates of social outcomes appears to change across early childhood and as a
result interventions may need to take into account the changing nature of social outcomes.
Added to this, initial EF and ToM did not predict change in aggression, prosocial behaviour
or peer acceptance across early childhood. Interventions aimed at addressing initial EF and
ToM abilities may not have a long term influence on social development across early
childhood. Instead interventions may need to address cognitive correlates of social behaviours
across early childhood as they develop.

288
8. GENERAL DISCUSSION
8.1. Chapter Overview
This chapter will provide an integrated discussion of the findings from studies one to
four (Chapter 4 – 7). A summary of the main findings from these studies will first be
presented. The findings will then be related to the research questions identified in Chapter
Two. Following this, the contribution of studies one to four to important debates and issues
within the wider literature will be discussed. The limitations of this research and its
conclusions will be identified. Finally, the implications drawn from studies one to four will be
presented and avenues for future research will be outlined.
8.2. Summary of Findings
The overarching aim of the research presented in this thesis was to explore the
underlying role of EF and ToM in aggression, prosocial behaviour and peer acceptance across
early childhood. This was the first piece of research to examine the role of cool as well as hot
EF skills and ToM in both the function and form of aggression and was the first to explore the
associations between cool and hot EF skills, ToM, aggression, prosocial behaviour and peer
acceptance longitudinally across early childhood. In order to address the main aim, four
studies were carried out based on data from a sample of 106 children between 46- and 80-
months-old who were studied over the course of 12 months. Children were assessed at three
time points: initial recruitment (Time 1), 6 months later (Time 2) and 12 months later (Time
3). These four studies aimed to elucidate the nature of the relation between EF and ToM and
aggression, prosocial behaviour and peer acceptance during early childhood. The findings of
studies one to four are summarised and integrated below.
The research presented in study one (Chapter 4) was the first to examine the unique
contribution of cool and hot domains of EF to Teacher and Peer reported aggression,
differentiating between the functions (reactive and proactive) and forms (physical and
relational) of aggression, in children 3- to 6-years-old. The role of EF in aggression varied
depending on informant. Cool EF, particularly inhibition, was predictive of Teacher reported
reactive and proactive relational aggression and reactive physical aggression, but not
proactive physical aggression. The role of some individual cool EF skills varied across
Teacher reported subtypes. Proactive relational aggression, for example, was negatively
related to planning and positively related to working memory. In contrast, Peer reported
289
proactive and reactive physical, but not relational, aggression was associated with cool EF.
Inhibition was central to Peer reported physical aggression only. Components of hot EF,
however, did not contribute to understanding of Teacher or Peer reported aggression of any
function or form after cool EF was taken into account. Study one therefore did not support the
hypothesis that hot EF will be more strongly associated with aggression compared to cool EF.
Study one further examined the role of cool and hot EF skills in prosocial behaviour. Neither
cool nor hot EF skills were related to Teacher or Peer reported prosocial behaviour. This was
the first study to examine the moderating role of prosocial behaviour on the relation between
cognitive abilities and the function and form of aggression. Prosocial behaviour moderated the
relation between working memory and Teacher reported reactive relational aggression, in line
with the hypotheses. For children high in prosocial behaviour working memory was
significantly and negatively related to reactive relational aggression. For children low or
average in prosocial behaviour working memory was positively, but non-significantly, related
to reactive relational aggression.
Study one represented the first step towards understanding the role of separate cool
and hot domains in the function and form of aggression. This allowed for the contribution of
cool and hot domains to subtypes of aggression to be compared. Study two (Chapter 5)
expanded on this as it focused on the differential role of ToM as well as EF across subtypes of
aggression. Social neuroscience models have argued that social interactions, like aggression,
and peer acceptance may be the result of an interplay between a range of cognitive abilities,
such as EF and ToM (Beauchamp & V. Anderson, 2010; Yeates et al., 2007). Investigating
the role of EF and ToM in behaviours, like aggression, will therefore provide a more
comprehensive understanding of their development. Study two (Chapter 5) provided the first
investigation of the associations between EF, ToM, aggression, prosocial behaviour and peer
acceptance in children 3- to 6-years-old. Study two revealed that cool and hot EF skills and
ToM predicted Teacher and Peer reported reactive and proactive physical, but not relational,
aggression. Inhibition (cool EF) was a significant negative predictor of both Teacher and Peer
reported reactive and proactive physical aggression. However, affective decision making (hot
EF) was a significant positive predictor of Teacher reported proactive physical aggression.
Study two was also the first to examine the relation between cool and hot EF processes, ToM,
aggression and peer acceptance. Study two further expanded on study one by exploring the
differential outcomes of subtypes of aggression. Aggressive and prosocial behaviour, but not
cool and hot EF abilities and ToM, were significantly related to Teacher and Peer reported
acceptance. According to Teacher and Peer reports, prosocial behaviour was positively related

290
to acceptance, but was not significantly associated with Peer reported rejection. Studies one
and two therefore provide partial support for the hypotheses that EF and ToM will be
negatively related to reactive and physical aggression and positively associated with proactive
and relational aggression. Physical aggression when used reactively was associated with poor
inhibition, but was related to greater affective decision making when used proactively.
Further, proactive and reactive relational aggression were associated with poorer and superior
domains of EF. Studies one and two, though, did not support the hypothesis that EF and ToM
would be positively associated with prosocial behaviour.
Studies one and two examined the role of cool and hot EF skills and ToM in early
childhood aggression, prosocial behaviour and peer acceptance at one time point. Studies
three (Chapter 6) and four (Chapter 7) examined the longitudinal associations between these
cognitive abilities and social outcomes, during a sensitive period in children's cognitive and
social development, early childhood. Study three was the first longitudinal study to compare
the development of cool and hot EF abilities over the course of 12 months in 4, 5, and 6-year-
olds. Before attempting to identify the links between cognitive abilities and behaviours, it is
important to explore the development of cool and hot EF processes and their interconnection
with related functions (e.g. ToM) as the brain regions associated with cognitive processes
implicated in social behaviour are subject to change with age (Stuss & Anderson, 2004; Stuss,
1992). Significant age related improvements were evident in children's cool EF skills
inhibition response time, working memory, and planning, but not the cool EF skills inhibition
score or planning errors. Significant age improvements were also found for the hot EF skills
affective decision making and delay of gratification. ToM also showed improvement with
age. Overall, the hypothesis that children’s cognitive abilities will show substantial
improvement during early childhood was therefore supported. Cool EF skills were positively
correlated at each time point, in line with the hypothesis. Hot EF skills, in contrast, were not
related at any of the time points and hot EF skills showed limited associations with cool EF
capabilities, in opposition to the hypothesis. Study three also investigated the direction of the
predictive relations between EF, including a broader range of cool and hot EF skills than has
previously been examined, and ToM. Early EF predicted later ToM. Planning at Time 2 and
delay of gratification at Time 2 and Time 3 positively predicted ToM at Time 3. Early ToM,
on the other hand, was not strongly related to later EF. The hypothesis that early EF would
predict later ToM was therefore supported. Identifying the typical development of EF and
ToM and their predictive relations will inform current understanding of the interplay between
these cognitive abilities in children's developing social understanding and behaviour.

291
Building on study three, study four (Chapter 7) examined the longitudinal relations
among EF, ToM, aggression, prosocial behaviour and peer acceptance in three cohorts (4, 5
and 6-year-old cohort) over the course of a year. This study expanded on previous research by
investigating the development of the different functions and forms of aggression, prosocial
behaviour, and peer acceptance and was the first study to examine the role of EF and ToM in
subtypes of aggression as well as prosocial behaviour and peer acceptance across early
childhood. In line with the hypotheses, prosocial behaviour and peer acceptance increased and
aggression decreased from Time 1 to Time 3. Development of aggression, though, differed
across subtypes. Relational (proactive and reactive) aggression showed a linear decrease in
the 4-year-old cohort, a decrease at Time 2 in the 5-year-old cohort and remained relatively
stable in the 6-year-old cohort. Proactive and reactive physical aggression followed a differing
trend. Proactive physical aggression remained relatively stable from Time 1 to Time 3, but
reactive physical aggression demonstrated an increase at Time 2 in the 4-year-old cohort, but
a decrease at Time 2 in the 5 and 6-year-old cohort.
Initial reactive physical aggression was significantly predicted by Time 1 EF and
ToM. However, development of reactive physical aggression from Time 1 to 3 was not
significantly predicted by Time 1 EF and ToM. Further, Time 1 EF and ToM did not
significantly predict initial or change in prosocial behaviour or peer acceptance. Aggressive
and prosocial behaviour at Time 1, though, predicted initial peer acceptance, but not change in
peer acceptance from Time 1 to 3. Study four further revealed that the relation between EF
and ToM and social outcomes was not stable across early childhood. Time 1 EF and ToM
significantly predicted T1 proactive and reactive physical aggression. Time 1 and Time 2 EF
and ToM significantly predicted Time 2 reactive relational aggression. Time 1, 2 and 3 EF
and ToM did not significantly predict Time 3 aggression. Time 1 prosocial behaviour was not
significantly predicted by Time 1 EF and ToM, but Time 2 prosocial behaviour was
significantly predicted by Time 1 and Time 2 EF and ToM. Time 3 prosocial behaviour was
not significantly predicted by Time 1, 2 or 3 EF and ToM. Time 1 aggression (but not Time 1
EF and ToM) significantly predicted Time 1 peer acceptance. Added to this, Time 2 EF and
ToM and Time 2 aggressive and prosocial behaviour significantly predicted Time 2 peer
acceptance. Time 3 aggressive and prosocial behaviour (but not Time 3 EF and ToM)
significantly predicted Time 3 peer acceptance. Study four supported the hypothesis that there
would be age related changes in the relation between EF and ToM and aggression, prosocial
behaviour and peer acceptance.
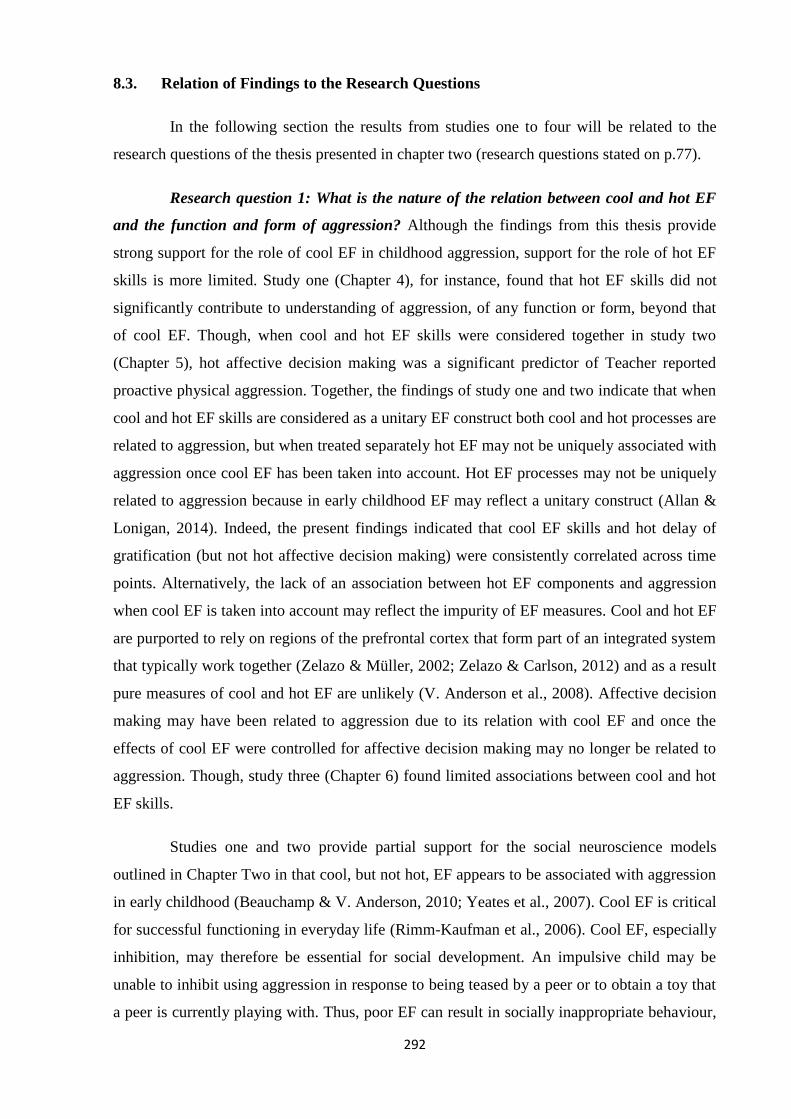
292
8.3. Relation of Findings to the Research Questions
In the following section the results from studies one to four will be related to the
research questions of the thesis presented in chapter two (research questions stated on p.77).
Research question 1: What is the nature of the relation between cool and hot EF
and the function and form of aggression? Although the findings from this thesis provide
strong support for the role of cool EF in childhood aggression, support for the role of hot EF
skills is more limited. Study one (Chapter 4), for instance, found that hot EF skills did not
significantly contribute to understanding of aggression, of any function or form, beyond that
of cool EF. Though, when cool and hot EF skills were considered together in study two
(Chapter 5), hot affective decision making was a significant predictor of Teacher reported
proactive physical aggression. Together, the findings of study one and two indicate that when
cool and hot EF skills are considered as a unitary EF construct both cool and hot processes are
related to aggression, but when treated separately hot EF may not be uniquely associated with
aggression once cool EF has been taken into account. Hot EF processes may not be uniquely
related to aggression because in early childhood EF may reflect a unitary construct (Allan &
Lonigan, 2014). Indeed, the present findings indicated that cool EF skills and hot delay of
gratification (but not hot affective decision making) were consistently correlated across time
points. Alternatively, the lack of an association between hot EF components and aggression
when cool EF is taken into account may reflect the impurity of EF measures. Cool and hot EF
are purported to rely on regions of the prefrontal cortex that form part of an integrated system
that typically work together (Zelazo & Müller, 2002; Zelazo & Carlson, 2012) and as a result
pure measures of cool and hot EF are unlikely (V. Anderson et al., 2008). Affective decision
making may have been related to aggression due to its relation with cool EF and once the
effects of cool EF were controlled for affective decision making may no longer be related to
aggression. Though, study three (Chapter 6) found limited associations between cool and hot
EF skills.
Studies one and two provide partial support for the social neuroscience models
outlined in Chapter Two in that cool, but not hot, EF appears to be associated with aggression
in early childhood (Beauchamp & V. Anderson, 2010; Yeates et al., 2007). Cool EF is critical
for successful functioning in everyday life (Rimm-Kaufman et al., 2006). Cool EF, especially
inhibition, may therefore be essential for social development. An impulsive child may be
unable to inhibit using aggression in response to being teased by a peer or to obtain a toy that
a peer is currently playing with. Thus, poor EF can result in socially inappropriate behaviour,
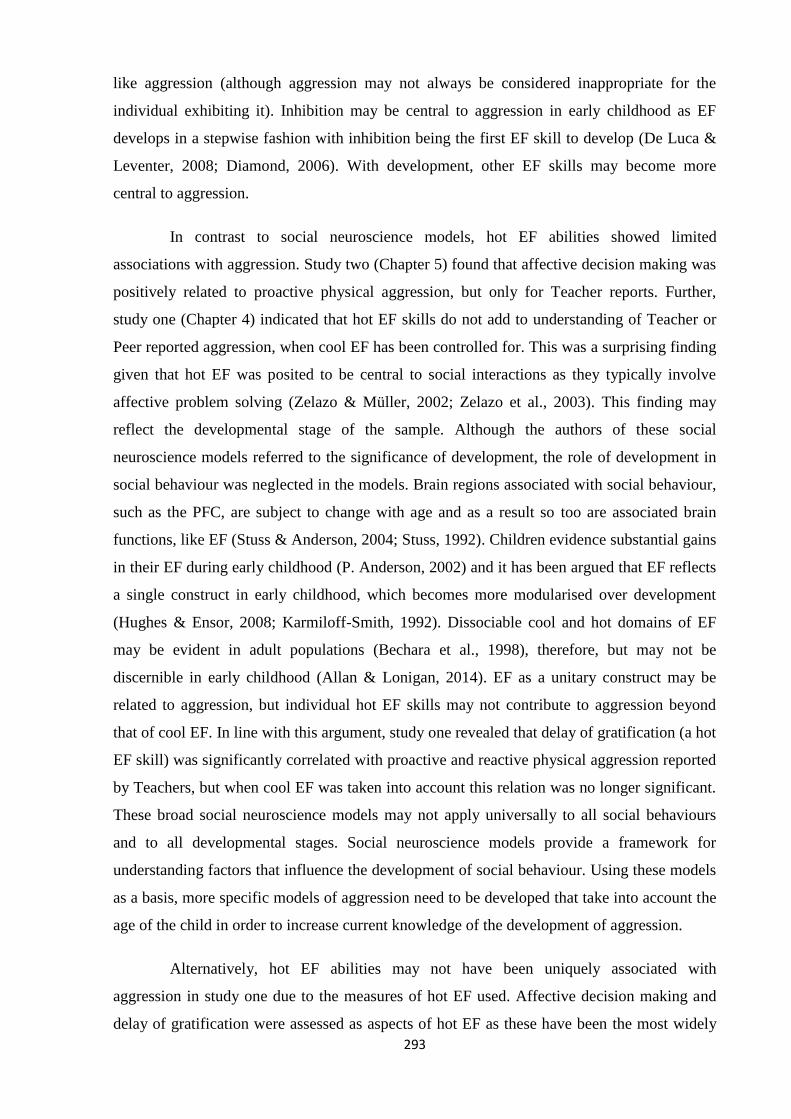
293
like aggression (although aggression may not always be considered inappropriate for the
individual exhibiting it). Inhibition may be central to aggression in early childhood as EF
develops in a stepwise fashion with inhibition being the first EF skill to develop (De Luca &
Leventer, 2008; Diamond, 2006). With development, other EF skills may become more
central to aggression.
In contrast to social neuroscience models, hot EF abilities showed limited
associations with aggression. Study two (Chapter 5) found that affective decision making was
positively related to proactive physical aggression, but only for Teacher reports. Further,
study one (Chapter 4) indicated that hot EF skills do not add to understanding of Teacher or
Peer reported aggression, when cool EF has been controlled for. This was a surprising finding
given that hot EF was posited to be central to social interactions as they typically involve
affective problem solving (Zelazo & Müller, 2002; Zelazo et al., 2003). This finding may
reflect the developmental stage of the sample. Although the authors of these social
neuroscience models referred to the significance of development, the role of development in
social behaviour was neglected in the models. Brain regions associated with social behaviour,
such as the PFC, are subject to change with age and as a result so too are associated brain
functions, like EF (Stuss & Anderson, 2004; Stuss, 1992). Children evidence substantial gains
in their EF during early childhood (P. Anderson, 2002) and it has been argued that EF reflects
a single construct in early childhood, which becomes more modularised over development
(Hughes & Ensor, 2008; Karmiloff-Smith, 1992). Dissociable cool and hot domains of EF
may be evident in adult populations (Bechara et al., 1998), therefore, but may not be
discernible in early childhood (Allan & Lonigan, 2014). EF as a unitary construct may be
related to aggression, but individual hot EF skills may not contribute to aggression beyond
that of cool EF. In line with this argument, study one revealed that delay of gratification (a hot
EF skill) was significantly correlated with proactive and reactive physical aggression reported
by Teachers, but when cool EF was taken into account this relation was no longer significant.
These broad social neuroscience models may not apply universally to all social behaviours
and to all developmental stages. Social neuroscience models provide a framework for
understanding factors that influence the development of social behaviour. Using these models
as a basis, more specific models of aggression need to be developed that take into account the
age of the child in order to increase current knowledge of the development of aggression.
Alternatively, hot EF abilities may not have been uniquely associated with
aggression in study one due to the measures of hot EF used. Affective decision making and
delay of gratification were assessed as aspects of hot EF as these have been the most widely

294
used assessments of hot EF in the literature. However, study three (Chapter 6) revealed that
affective decision making was not significantly correlated with delay of gratification at any of
the three time points, suggesting that these two measures may not have been assessing the
same underlying construct. Research into hot EF lags behind that of cool EF substantially and
as a result understanding of the organisation of hot EF and assessment techniques to measure
hot EF are limited (V. Anderson et al., 2008). In line with this research, other studies have
failed to find a link between delay of gratification and affective decision making
(Hongwanishkul et al., 2005). Delay of gratification was related to cool EF, but affective
decision making showed limited associations with cool EF skills, further suggesting that
affective decision making may not reflect an aspect of EF. Research with older children and
adults has found that affective decision making is distinct from EF (Bechara et al., 1998;
Toplak, Sorge, Benoit, West, & Stanovich, 2010). Affective decision making may therefore
represent a separate construct that is not reflective of hot EF. This also leads on to the
question of whether cool and hot EF represent distinct domains of EF or whether EF is a
unitary construct. Children may just use their EF differently in affective situations as
emotional problem solving may place greater demands than abstract problem solving on their
EF. Indeed, there is mixed support for the existence of separate cool and hot factors in young
children (Allan & Lonigan, 2014; Kim et al., 2014).
Research question 2: What is the nature of the role of EF and ToM in the function
and form of aggression? In support of previous studies (e.g. Gini, 2006; Sharp, 2008;
Utendale, Hubert, Saint-Pierre, & Hastings, 2011), this research indicated that EF and ToM
were related to aggression. However, the results of this thesis suggested that the role of EF
and ToM in aggression may vary according to the function and form of the aggressive
behaviour. Study two (Chapter 5), revealed that EF and ToM were related to Teacher and Peer
reported physical, but not relational, forms of aggression in early childhood. This adds to
studies which have found that EF and ToM are related to physical aggression only (Dane &
Marini, 2014; Terranova et al., 2008; Werner et al., 2006), by suggesting that this pattern may
also be evident in early childhood and irrespective of function. Although the high correlation
between reactive and proactive aggression reported by Teachers suggests that this may reflect
difficulty distinguishing between functions of aggression. However, the same pattern of
results was found for Peer reported aggression that did not evidence such high correlations
between subtypes. Poor EF has been hypothesised to lead to difficulties in social problem
solving, which may explain the link between EF and aggression (Lough, Gregory, & Hodges,
2001). Social information processing theories propose that aggressive behaviour is influenced

295
by higher order cognitive-emotional processing (Lösel, Bliesener, & Bender, 2007).
Aggressive children may have difficulties using and remembering relevant aspects of their
interactions with peers and frequently attend to the most recent cues rather than attending to
all cues, when making attributions about the behaviours of peers (Milich & Dodge, 1984).
Physical aggression may therefore be more strongly associated with children’s ability to
regulate their emotions and behaviour as physical aggression is more focused on the intent to
cause physical harm whereas relational aggression focuses on the manipulation of social
networks.
This finding, though, contradicts studies which have found that EF is associated with
reactive, but not proactive, aggression (Rathert et al., 2011; White et al., 2012). Studies which
have found that EF is only associated with reactive aggression have focussed on older
children (6 - 16 years) than in study two (3 - 6 years). During early childhood aggression
tends to be more direct and children do not typically display behaviours characteristic of
bullying (Björkqvist et al., 1992; Monks & Coyne, 2011). That is, children’s aggression is not
targeted at specific victims or reflective of an abuse of power. As children progress to middle
childhood their EF and ToM abilities improve (De Luca & Leventer, 2008; Wellman et al.,
2001) and with this children may be more capable of engaging in more socially sophisticated
aggressive behaviours, like indirect aggression and bullying (Monks & Coyne, 2011).
Cognitive abilities, like ToM, may as a result become more central to relational aggression in
later childhood when the types of aggression children are engaging in are going to require
greater understanding of the intentions and wishes of others (Sutton et al., 1999).
Study two (Chapter 4) supports models of aggression that propose distinct subtypes
of aggression based on function and form (Dodge, 1991; Grotpeter & Crick, 1996).
According to the findings of study two, cognitive predictors of aggression may vary
depending on its function and form. Inhibition was related to physical but not relational forms
of aggression and affective decision making was predictive of proactive but not reactive
physical aggression. Theories of aggression suggest that reactive and proactive aggression
stem from different theoretical underpinnings and are related to different correlates (Crick &
Dodge, 1996; Dodge, 1991; Dodge & Coie, 1987). Reactive physical aggression may be
predicted by poor EF due to its association with anger and failure to take into account
consequences (Dodge, 1991; Ostrov et al., 2013). Proactive physical aggression, on the other
hand, may be related to greater affective decision making because it is not thought to be
associated with poor emotion regulation and is thought to reflect consideration of
consequences (Bushman & Anderson, 2001; Orobio de Castro et al., 2005). Proactive

296
physical aggression is thought to result from children being exposed to environments that
promote the use of aggression as a viable means of achieving one’s goals (Dodge, 1991).
Achieving one’s goal (e.g. obtaining a desired toy) may therefore reinforce the child’s use of
proactive physical aggression and may result in children evaluating the consequences of this
type of aggression more positively. How effectively children use proactive aggression to
achieve their goals may therefore mediate the relation between cognitive abilities and
aggression. That is, children who use aggression effectively may demonstrate superior EF, but
children who do not frequently accomplish their goals through aggression may exhibit poor
EF. Understanding the effectiveness of children's proactive aggression would therefore
increase knowledge of the relation between EF and aggression.
The results of study one (Chapter 4), though, evidence some disparities to the
findings of study two (Chapter 5). Study one indicated that EF was significantly associated
with Teacher reported proactive and reactive relational and reactive physical aggression,
which does not support the view that subtypes of aggression are differently related to EF
(Dane & Marini, 2014; Rathert et al., 2011; Werner et al., 2006; White et al., 2012). This
contrast in findings may reflect differences in the analysis. In study one the unique effects of
cool and hot EF skills were examined, whereas in study two the joint role of cool and hot EF
processes, along with ToM, was investigated. When a broader range of cognitive abilities are
taken into account they may be more strongly associated with physical rather than relational
aggression. This is similar to the finding of Willoughby et al. (2011) that cool and hot EF are
differently related to measures of disruptive behaviour and academic achievement depending
on whether they are considered jointly or independently. Alternatively, the contradiction in
the present research may reflect differences in the way physical and relational aggression
were assessed. Physical aggression is more direct and overt, whereas relational aggression can
be more covert (Monks et al., 2003). Teachers may consequently be more aware of and report
more variation in children's physical aggression. Teacher reports of aggression may therefore
capture individual differences in physical aggression more reliably than relational aggression.
In line with this, in study one and two Peer reported aggression was related to cognitive
abilities but not Peer reported relational aggression. Alternatively, this difference in findings
may reflect developmental changes in EF (discussed in relation to research question 1).
Studies one (Chapter 4) and two (Chapter 5), however, both highlighted the
importance of inhibition in childhood aggression. Consistent with previous research (Allan &
Lonigan, 2011; Utendale et al., 2011; Verlinden et al., 2014), poor inhibition was related to
higher aggression as rated by Teachers and Peers. This finding builds on previous research by

297
suggesting that poor inhibition is related to aggression across the different functions and
forms in early childhood. Due to the more direct nature of aggression in early childhood,
young children with poor inhibition may be less able to withhold a physically or relationally
aggressive act in response to frustration (e.g. teasing), or to achieve a goal (e.g. obtaining a
desired toy). Inhibition is thought to be the first EF skill to develop and forms the basis for the
development of other EF skills (De Luca & Leventer, 2008; Senn et al., 2004). During early
childhood, therefore, mastery of inhibition may be fundamental to social development.
Studies one and two, though, provided evidence that the role of some individual EF skills
varies across subtypes of aggression. Study one, for example, suggested that poor planning
but superior working memory were associated with higher levels of Teacher reported
proactive relational aggression only. Further, study one revealed that for children high in
Teacher reported prosocial behaviour, working memory was negatively related to Teacher
reported reactive relational aggression. Study two also found that greater affective decision
making was associated with Teacher reported proactive physical aggression only. Together
these findings suggest that the subtypes of aggression might be differently associated with
individual cool and hot EF skills, supporting the view of separable subtypes of aggression that
are differently associated with cognitive correlates (Crick et al., 2006; Dodge, 1991; Grotpeter
& Crick, 1996; Ostrov et al., 2008). Proactively and relationally aggressive children may
demonstrate superior working memory and affective decision making skills because they are
better able to process and evaluate how to use aggression to achieve their goal (Dodge, 1991;
Dodge & Coie, 1987). This further supports the view that not all aggressive children show
impaired cognitive abilities (Sutton et al., 1999; Sutton et al., 2001). In line with the view of
bistrategic controllers (Hawley, 2002), those children using aggression proactively as a means
of obtaining resources may demonstrate greater cognitive abilities in at least some domains.
The findings of studies one (Chapter 4) and two (Chapter 5) have important
implications for models of social behaviour development. Despite social neuroscience models
providing a framework for understanding the link between cognitive abilities and the
development of aggression, these models do not make specific predictions regarding the
nature of the relation between individual EFs and aggression or take into account the varied
nature of aggression. The current results indicate that the role of individual EF skills may
differ across subtypes of aggression, with some skills (working memory) being positively
related to aggression and others negatively (inhibition). Considering broad cognitive
constructs may not be sufficient to understand the true nature of the role of cognitive skills in
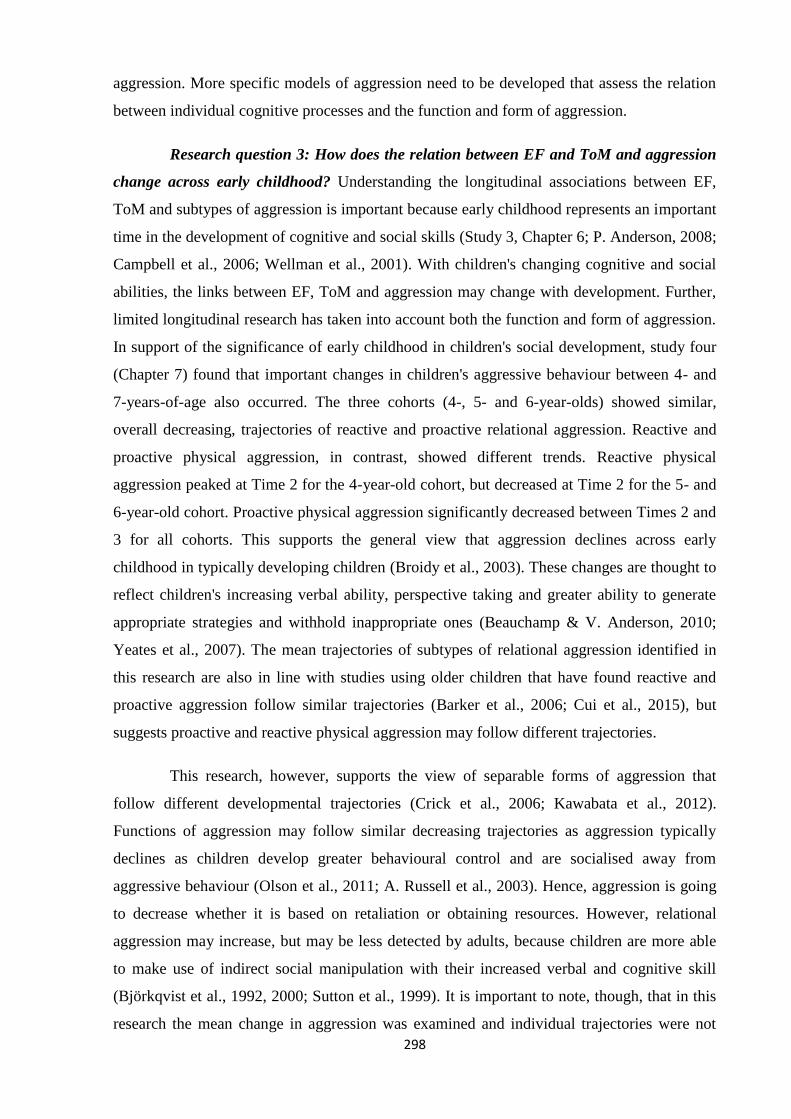
298
aggression. More specific models of aggression need to be developed that assess the relation
between individual cognitive processes and the function and form of aggression.
Research question 3: How does the relation between EF and ToM and aggression
change across early childhood? Understanding the longitudinal associations between EF,
ToM and subtypes of aggression is important because early childhood represents an important
time in the development of cognitive and social skills (Study 3, Chapter 6; P. Anderson, 2008;
Campbell et al., 2006; Wellman et al., 2001). With children's changing cognitive and social
abilities, the links between EF, ToM and aggression may change with development. Further,
limited longitudinal research has taken into account both the function and form of aggression.
In support of the significance of early childhood in children's social development, study four
(Chapter 7) found that important changes in children's aggressive behaviour between 4- and
7-years-of-age also occurred. The three cohorts (4-, 5- and 6-year-olds) showed similar,
overall decreasing, trajectories of reactive and proactive relational aggression. Reactive and
proactive physical aggression, in contrast, showed different trends. Reactive physical
aggression peaked at Time 2 for the 4-year-old cohort, but decreased at Time 2 for the 5- and
6-year-old cohort. Proactive physical aggression significantly decreased between Times 2 and
3 for all cohorts. This supports the general view that aggression declines across early
childhood in typically developing children (Broidy et al., 2003). These changes are thought to
reflect children's increasing verbal ability, perspective taking and greater ability to generate
appropriate strategies and withhold inappropriate ones (Beauchamp & V. Anderson, 2010;
Yeates et al., 2007). The mean trajectories of subtypes of relational aggression identified in
this research are also in line with studies using older children that have found reactive and
proactive aggression follow similar trajectories (Barker et al., 2006; Cui et al., 2015), but
suggests proactive and reactive physical aggression may follow different trajectories.
This research, however, supports the view of separable forms of aggression that
follow different developmental trajectories (Crick et al., 2006; Kawabata et al., 2012).
Functions of aggression may follow similar decreasing trajectories as aggression typically
declines as children develop greater behavioural control and are socialised away from
aggressive behaviour (Olson et al., 2011; A. Russell et al., 2003). Hence, aggression is going
to decrease whether it is based on retaliation or obtaining resources. However, relational
aggression may increase, but may be less detected by adults, because children are more able
to make use of indirect social manipulation with their increased verbal and cognitive skill
(Björkqvist et al., 1992, 2000; Sutton et al., 1999). It is important to note, though, that in this
research the mean change in aggression was examined and individual trajectories were not

299
examined. There is likely to be variability in children, with some children showing increasing
and other children showing decreasing aggression (Gray et al., 2014; Tremblay et al., 2004).
The findings of studies three (Chapter 6) and four (Chapter 7) indicate that important
developments in children's cognitive and social abilities are taking place across early
childhood and therefore highlight the need to consider the relation between EF, ToM and
aggressive behaviour within the context of these significant cognitive and social
developments. Changes in aggressive behaviour are thought to reflect children's increasing
cognitive abilities, particularly their improved behavioural control (EF) and understanding of
others minds (ToM; Beauchamp & V. Anderson, 2010; Yeates et al., 2007). The present
research supported this view. According to the results of study four (Chapter 7) Time 1 EF
and ToM predicted initial reactive physical aggression. Though, Time 1 EF and ToM did not
significantly predict whether children followed an increasing or decreasing trajectory of
aggression of any function or form. In particular, poor inhibition was associated with higher
initial reactive physical aggression. This is in line with the findings of studies one (Chapter 4)
and two (Chapter 5), as well as previous research (e.g. Utendale & Hastings, 2011), that
inhibition is central to early childhood aggression. Physical aggression may be more strongly
associated with inhibition than relational aggression because withholding a physically
aggressive act (unlike withholding a relationally aggressive act) involves inhibiting a
behavioural response. This may be especially important when the aggression is being carried
out reactively as reactive aggression, in contrast to proactive aggression, is theorised to be a
'hot-headed' retaliatory response to provocation that involves little consideration of the
consequences (Dodge, 1991; Ostrov et al., 2013; Scarpa et al., 2010). Inhibition is thought to
be a fundamental EF skill that is the basis for the development of other EF abilities (Senn et
al., 2004; Smidts et al., 2004; Welsh et al., 1991). As a result, inhibition may be important to
the emergence of aggression in young children as they are mastering both behavioural control
and experiencing their first interactions with a peer group, but early EF may not predict
developmental paths of aggression after children have gained strong inhibition and better
understanding of peer interactions. Indeed, previous studies have failed to find an association
between inhibition and aggression in adolescence (Hummer et al., 2015).
The role of cognitive abilities, like EF, in aggression may change across
development. In support of this argument, the analysis of the relation between EF and ToM
and aggression within each time point in study four (Chapter 7) revealed that these relations
are not stable between 4- and 7-years-of-age. Time 1 proactive and reactive physical
aggression were associated with Time 1 EF and ToM. In particular poor inhibition and greater
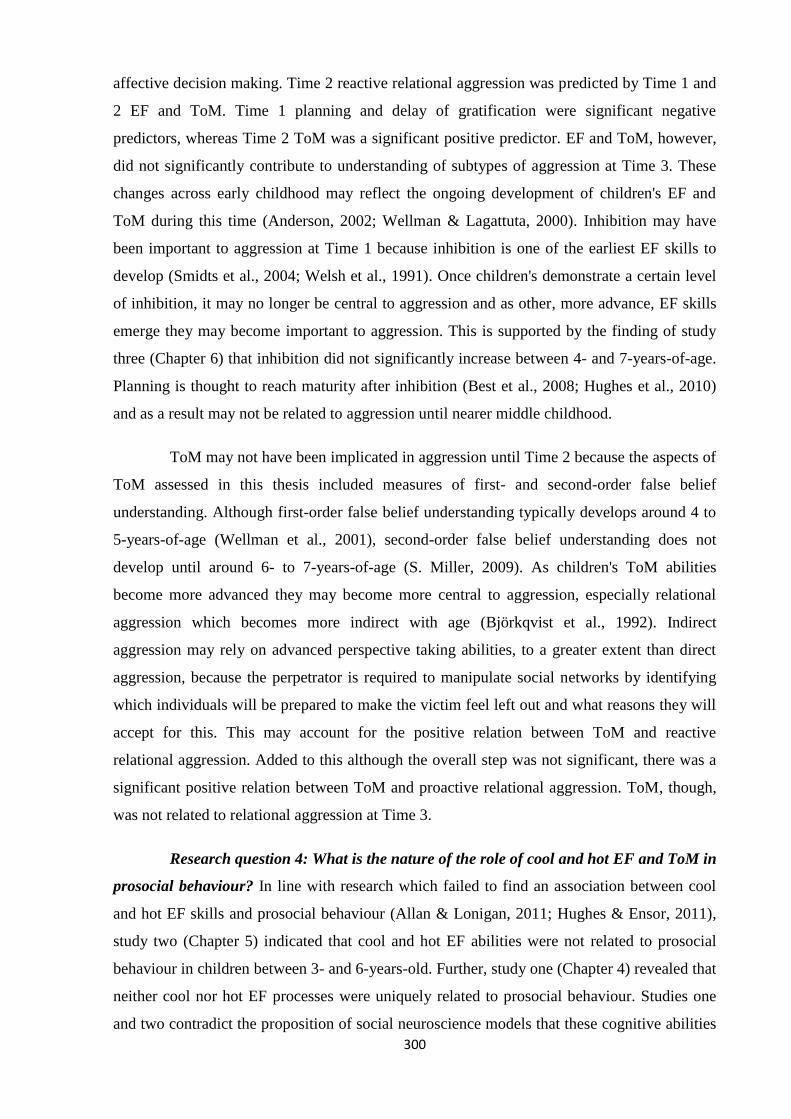
300
affective decision making. Time 2 reactive relational aggression was predicted by Time 1 and
2 EF and ToM. Time 1 planning and delay of gratification were significant negative
predictors, whereas Time 2 ToM was a significant positive predictor. EF and ToM, however,
did not significantly contribute to understanding of subtypes of aggression at Time 3. These
changes across early childhood may reflect the ongoing development of children's EF and
ToM during this time (Anderson, 2002; Wellman & Lagattuta, 2000). Inhibition may have
been important to aggression at Time 1 because inhibition is one of the earliest EF skills to
develop (Smidts et al., 2004; Welsh et al., 1991). Once children's demonstrate a certain level
of inhibition, it may no longer be central to aggression and as other, more advance, EF skills
emerge they may become important to aggression. This is supported by the finding of study
three (Chapter 6) that inhibition did not significantly increase between 4- and 7-years-of-age.
Planning is thought to reach maturity after inhibition (Best et al., 2008; Hughes et al., 2010)
and as a result may not be related to aggression until nearer middle childhood.
ToM may not have been implicated in aggression until Time 2 because the aspects of
ToM assessed in this thesis included measures of first- and second-order false belief
understanding. Although first-order false belief understanding typically develops around 4 to
5-years-of-age (Wellman et al., 2001), second-order false belief understanding does not
develop until around 6- to 7-years-of-age (S. Miller, 2009). As children's ToM abilities
become more advanced they may become more central to aggression, especially relational
aggression which becomes more indirect with age (Björkqvist et al., 1992). Indirect
aggression may rely on advanced perspective taking abilities, to a greater extent than direct
aggression, because the perpetrator is required to manipulate social networks by identifying
which individuals will be prepared to make the victim feel left out and what reasons they will
accept for this. This may account for the positive relation between ToM and reactive
relational aggression. Added to this although the overall step was not significant, there was a
significant positive relation between ToM and proactive relational aggression. ToM, though,
was not related to relational aggression at Time 3.
Research question 4: What is the nature of the role of cool and hot EF and ToM in
prosocial behaviour? In line with research which failed to find an association between cool
and hot EF skills and prosocial behaviour (Allan & Lonigan, 2011; Hughes & Ensor, 2011),
study two (Chapter 5) indicated that cool and hot EF abilities were not related to prosocial
behaviour in children between 3- and 6-years-old. Further, study one (Chapter 4) revealed that
neither cool nor hot EF processes were uniquely related to prosocial behaviour. Studies one
and two contradict the proposition of social neuroscience models that these cognitive abilities

301
are central to prosocial behaviour (Beauchamp & V. Anderson, 2010; Yeates et al., 2007).
These are broad models that include a range of behaviours. The results of this research
indicate that the same factors may not underlie prosocial and aggressive behaviour and that
more specific models for different types of behaviour need to be developed.
There are three potential explanations for this lack of association. First, it may be that
EF, particularly hot inhibition, is related to prosocial behaviour in infancy, but not as children
transition into early childhood. Previous studies have found an association between hot
inhibition and prosocial behaviour in children between 2- and 3.5-years-of-age, but not
children 3.5- to 4.5-years-old (Di Norcia et al., 2014; Moore et al., 1998). Infants typically
show limited EF skills and consequently those infants who demonstrate superior EF may be
more prosocial, but as children mature and their EF reaches a sufficient level it may be less
central to prosocial behaviour. In early childhood, great emphasis is usually placed on
socialising children to be prosocial, especially when they enter school (A. Russell et al.,
2003), and as a result individual differences in children's cognitive abilities may be less
central to their prosocial behaviour skills.
Alternatively, the lack of an association between EF and prosocial behaviour may
reflect the measure of prosocial behaviour used. Prosocial behaviour has been conceptualised
and assessed in different ways in past research. For instance, some studies have used Parent
and/or Teacher reports of children's prosocial behaviours, including comforting and
cooperation (Jacobson et al., 2011; Masten et al., 2012; Riccio et al., 2011). Other studies in
contrast, have obtained Teacher or Relative reports of children's social competence, which
includes a broad range of behaviours, including prosocial behaviours and positive peer
interactions (Di Norcia et al., 2014; Garner & Waajid, 2012). While other research has
assessed children's sharing using a laboratory task (Moore et al., 1998). Prosocial behaviour
includes a broad range of behaviours and children may demonstrate different rates of
prosocial behaviour across varied contexts (Hay, 1994). Consequently, the relation between
prosocial behaviour and EF may vary based on who is assessing the behaviour and the type of
prosocial behaviour measured. Though, in the present research EF and ToM were not related
to either Teacher or Peer reported prosocial behaviour. However, relatively simple measures
of prosocial behaviour were used. Peers provided nominations for children who were
prosocial and may therefore not have considered a range of prosocial behaviours or may have
nominated the most salient prosocial children. Further, the Teacher report consisted of four
questions and may not have captured the full variation in children's prosocial behaviour.

302
Third, research has also used varied measures of hot EF. Some studies have relied on
laboratory measures of cool and hot EF skills and have combined these measures to create an
overall EF composite (Jacobson et al., 2011; Masten et al., 2012; Riccio et al., 2011). While
other studies have created separate cool and hot EF scores (Di Norcia et al., 2014). In
contrast, some researchers have measured single hot EF skills using more abstract tasks. For
example, some studies have assessed positive emotionality as a measure of hot EF (Garner &
Waajid, 2012). The relation between hot EF and prosocial behaviour may vary depending on
how researchers conceptualise and measure hot EF. The diverse hot EF tasks included in the
literature may not be assessing the same underlying hot construct, if indeed a separable hot EF
domain is present in early childhood.
Study two also indicated that ToM did not predict prosocial behaviour, in contrast to
previous studies (Caputi et al., 2012; Eggum et al., 2011). These contrasting findings may
also reflect differences in the way prosocial behaviour was assessed (discussed above) or how
ToM was conceptualised. Previous studies have assessed a range of ToM skills including
false beliefs, deception and appearance-reality distinction (Cassidy et al., 2003; Moore et al.,
1998). Prosocial behaviour may be related to some aspects of ToM, but not others. In the
present research, for example, first- and second-order false belief were assessed as a measure
of ToM. Second-order false belief understanding is not typically achieved until around 6- to
7-years-of-age (S. Miller, 2009) and the children were between 3- and 6-years-of-age in study
two (Chapter 5). Consequently, they may not yet have obtained knowledge of second-order
false beliefs and as a result this may not have been associated with their prosocial behaviour.
On the other hand, the relation between ToM and prosocial behaviour may be bidirectional in
early childhood (Eggum et al., 2011). Children who are more prosocial may participate in
more positive peer group interactions that promote the development of ToM skills, which in
turn may increase their prosocial behaviour. In line with this, study four (Chapter 6) revealed
that the relation between cognitive abilities and prosocial behaviour changed between 4- and
7-years-of-age.
Research question 5: How does the relation between EF and ToM and prosocial
behaviour change across early childhood? In line with prior findings (Jackson & Tisak,
2001), study four (Chapter 7) revealed that prosocial behaviour significantly increased across
early childhood. Prosocial behaviour significantly increased between Time 1 (4- to 6-years-
of-age) and Time 2 (4.5- to 6.5-years-of-age), but not between Time 2 (4.5- to 6.5-years-of-
age) and Time 3 (5- to 7-years-of-age). Prosocial behaviour therefore may increase
significantly in early childhood but then as children progress towards middle childhood

303
changes in prosocial behaviour may slow down. This may reflect the fact that it is during
early childhood (typically around 4-years-of-age in the UK) that children transition from
nursery into more formal schooling and as a result are required to interact with a peer group.
This transition requires children to learn to interact with their peers and children may witness
and imitate their peers prosocial behaviour (Hay, 1994). Consistent with the results of the first
two studies, study four (Chapter 7) found that Time 1 EF and ToM did not predict initial
prosocial behaviour or change in children's prosocial behaviour from Time 1 to Time 3.
Although EF and ToM may be associated with reduced aggression, they are not necessarily
related to prosocial behaviour. Prosocial behaviour development may be more strongly related
to other cognitive abilities, such as moral reasoning or empathy (Laible et al., 2014), or
socialisation by parents and peers (Eivers, Brendgen, Vitaro, & Borge, 2012; Hay, 1994).
Study four (Chapter 7), however, also looked at the relation between EF and ToM
and prosocial behaviour at each time point. The findings revealed that the role of EF and ToM
in prosocial behaviour varied across childhood, which may reflect changing social milestones
in early childhood. Although Time 1 and Time 3 prosocial behaviour were not predicted by
earlier or concurrent EF and ToM, Time 2 prosocial behaviour was predicted by Time 1 and 2
EF and ToM. Time 1 planning and delay of gratification and Time 2 working memory and
planning were significant positive predictors. Interestingly, it was at Time 2 that the children
in the present research progressed to the next year group at school, which for the majority
involved integrating with a new peer group as most classes were mixed at this point. Older
children (5 - 6 years) have been found to exhibit more prosocial strategies in stressful peer
situations than younger children (3 - 5 years; Zsolnai et al., 2012). Children who
demonstrated greater earlier and concurrent EF and ToM may consequently demonstrate more
prosocial behaviour when integrating with a new peer group as they may be better able to
understand the perspectives of others and process and plan affiliative strategies. During
important transitions, greater EF and ToM may be associated with children's prosocial
behaviour (Prencipe et al., 2011; Zelazo & Carlson, 2012), but when children are not
undergoing these transitions other factors, such as Parent and Teacher socialisation may be
more important to prosocial behaviour. There may also be bidirectional relations between
cognitive abilities and prosocial behaviour. Children with stronger EF and ToM abilities may
be more likely to engage in more prosocial interactions that facilitate the further development
of their EF and ToM skills (Hughes, 2001).
304
Research question 6: How does the association between cool and hot EF and their
relation to ToM change across early childhood? Study three (Chapter 6) indicated that
between 4- and 7-years-of-age significant improvements in children's cool and hot EF skills
as well as their ToM skills were evident. This is in line with the finding that the PFC, which
has been found to be related to both EF and ToM (Otero & Barker, 2014; Siegal & Varley,
2002), undergoes significant development in early childhood (Damasio et al., 2011). Over the
course of 12 months, 4, 5 and 6-year-olds showed greater performance on the following
measures of cool EF: working memory, planning and faster response times. However, in
contrast to prior studies (P. Anderson, 2008; Senn et al., 2004; Smidts et al., 2004), children
did not show significantly greater inhibition over early childhood. This may reflect the task
used to assess inhibition. Children performed consistently well on the Fish and Shark Go/No-
Go task across early childhood. This task may therefore have not been developmentally
sensitive to advances in children's EF across early childhood. EF is a fundamental EF
subcomponent and has been argued to be the first to emerge (Senn et al., 2004), consequently
children may show superior inhibition early in life and as a result the Fish and Shark Go/No-
Go may not have been tapping into more subtle advances in children's inhibition. A
significant reduction in planning errors across early childhood was also not found. Individual
differences in planning errors were not stable across early childhood and planning errors
showed limited associations with other cool EF measures. This measure may consequently
not have been tapping into children's cool EF.
Performance on measures of hot EF did not show significant improvement across the
course of 12 months for the whole sample, however the oldest children (6-year-old cohort)
outperformed the youngest children (4-year-old cohort) on measures of delay of gratification
and affective decision making over early childhood. The current findings therefore suggest
that early childhood represents an important period in the development of cool and hot
domains of EF. This extends prior cross-sectional research (Fuhs & Day., 2011;
Hongwanishkul et al., 2005) which has examined the development of cool and hot EF as the
present study was longitudinal. These advances are in line with children's increasing ability to
regulate their behaviour and emotions (P. Anderson, 2008). Gains in these cognitive abilities
reflect children's increasing ability to remember and follow instructions, to plan, to switch
between activities, to be patient, and to evaluate rewards and losses (P. Anderson, 2008;
Sèguin & Boulerice, 1999). These advances enable children to more effectively engage with
their environment and can lead to more successful peer interactions (Hughes & Ensor, 2008).
A greater understanding of the development of EF and its relation to children's social

305
development may consequently be gained from research considering both cool and hot EFs.
The failure to find improvement in inhibition across early childhood highlights a common
challenge for longitudinal research examining EF development: finding tasks that are
developmentally appropriate for a wide age span.
In agreement with prior research (Brocki & Bohlin, 2004; Gur et al., 2012), boys
demonstrated significantly poorer inhibition, affective decision making and delay of
gratification, but faster response times that girls. This pattern in boys of poorer impulse
control and evaluation of rewards and losses, but faster responding suggests a speed-accuracy
trade off. This study extends prior cross-sectional research as it suggests that boys perform
consistently more poorly on measures of inhibition, delay of gratification and affective
decision making across early childhood compared to girls. This findings may have important
practical implications. Boys consistently lag behind girls in academic achievement (Weis,
Heikamp, Trommsdorff, 2013) and have been found to be more disruptive than girls (Brock et
al., 2009). These domains of cool and hot EF have been linked to children's academic
achievement, learning related behaviours and disruptive behaviour (Brock et al., 2009; Garner
& Wajid, 2012). Targeting these domains of EF in early childhood in interventions may have
a positive effect on boys academic achievement.
Despite age related improvements in cool and hot EF skills, different patterns of
relations between cool and hot EFs emerged. In support of prior research (Hongwanishkul et
al., 2005), this study suggested that cool EF represented a relatively coherent construct across
early childhood, but that hot EF did not. Individual differences in cool domains of EF (e.g.
inhibition, planning, working memory and response time) were consistently associated across
early childhood, meaning children who showed superior cool EF at Time 1 continued to show
better performance at Time 1 and 2. However, only individual differences in hot delay of
gratification, but not affective decision making were consistently related across early
childhood. Added to this, cool EF skills were consistently related across early childhood, but
affective decision making and delay of gratification were not related at any of the three time
points, indicating that cool, but not hot, EF measures represent the same underlying construct.
However, both affective decision making and delay of gratification showed similar
developmental trajectories across early childhood, which may reflect the similar motivational
demands of the tasks. Further, cool inhibition and working memory were consistently
positively correlated with hot delay of gratification across early childhood, whereas hot
affective decision making was positively related to cool working memory at Time 3 only,

306
suggesting affective decision making, but not delay of gratification, may be separable from
broader EF during early childhood.
The present research therefore provided limited support for a multi-dimensional
model of EF including separable cool and hot domains, in line with some prior studies (Kim
et al., 2013; Willoughby et al., 2010). This is discussed in more detail in the next section.
Much less is known about the development and organisation of hot EF compared to cool EF
(Peterson & Welsh, 2014). The current research addressed an important gap in our
understanding of EF and the relation between affective and cognitive domains of EF. This is
an important avenue for future research and may have important implications for
understanding of cognitive development in both typical and atypical development. Children
diagnosed with disorders such as conduct disorder or autism demonstrate deficits in cognitive
and emotional domains (Zelazo et al., 2005). Understanding the developmental associations
between cool and hot domains of EF may therefore shed new light on understanding of and
treatment of these disorders.
Study three (Chapter 6) further revealed that children demonstrated significant
improvement in their ToM across early childhood and boys and girls performance did not
differ, in line with previous research (Mathieson & banerjee, 2011). First-order false belief
understanding typically emerges around 4- to 5-years-of-age (Wellman et al., 2001), whereas
second-order false belief understanding develops around 6- to 7-years-of-age (S. Miller et al.,
2009). The continued improvement in ToM evident in this study may therefore reflect the
development of a more complex understanding of belief. Advances in ToM are reflected in
children's increasing ability to understand the perspectives of others and may result in more
successful peer interactions (Hughes & Leekham, 2004). However, false belief understanding
represent only one domain of ToM (Lalonde & Chandler, 2002). ToM is a complex ability
and research examining the development of a wider range of ToM skills would be valuable.
A significant finding of study three (Chapter 6) was that early EF predicted later
ToM, but early ToM did not as strongly predict later EF, across early childhood. This
asymmetrical relation supports an emergence account that there is a fundamental dependency
between EF and ToM (Devine & Hughes, 2014). More specifically, it is in line with the
argument proposed by Russell (1996) that EF is a prerequisite for ToM. According to Russell,
the ability to self-monitor one's actions and to hold in mind and shift between arbitrary rules
or cognitive domains is fundamental to the development of an understanding of others’ minds
(ToM). EF and ToM may be linked in early typical development when these two abilities are
307
emerging (i.e. around 4-years-of-age), but may become less influenced by each other beyond
the point at which conceptual understanding of ToM is largely achieved (Pellicano, 2007).
There was partial support for the argument that hot EF would be more strongly associated
with ToM than cool EF (Zelazo et al., 2005). Hot delay of gratification at Time 1 and 2
predicted Time 3 ToM, whereas cool planning at Time 2 predicted ToM at Time 3 only. Hot
EF may demonstrate strong links with ToM due to their reliance on the same medial regions
of the PFC (Sabbagh et al., 2009; Siegal & Varley, 2002) and their emotionally significant
nature (Zelazo et al., 2005). However, ToM was not related to affective decision making
during early childhood. Not all domains of hot EF may therefore be implicated in ToM.
Understanding the relation between cool and hot EF and ToM may inform current theories of
the underlying cognitive mechanisms of social development. This is discussed further in the
next section.
Research question 7: What is the nature of the relation between EF, ToM,
aggression, prosocial behaviour and peer acceptance? Study two (Chapter 5) revealed that
prosocial and aggressive behaviour were related to Teacher and Peer reported acceptance, but
not Peer reported rejection. In support of the findings of study two, study four (Chapter 7)
found that aggressive and prosocial behaviour were associated with initial peer acceptance. In
line with previous studies (Jacobson et al., 2011; Masten et al., 2012), prosocial children were
more accepted by their peers. Prosocial children may have greater access to peer situations
that enable them to develop greater social skills and as a result be more accepted by their
peers. Rejected 4-year-old children spent less time engaged in cooperative play and friendly
behaviour (Denham & Holt, 1993). Interactions with friends provides a context for children to
learn to regulate their emotions (Walden et al., 1999) and how to resolve conflicts (Fonzi et
al., 1997). A meta-analysis of 41 studies of children between 5- to 12-years-old revealed that
well liked children demonstrated better problem solving, friendship relations and more
positive social actions and traits (Newcomb et al., 1993). Though, study four indicated that
prosocial behaviour did not predict change in peer acceptance across early childhood,
suggesting that aggressive and prosocial behaviour may be important to peer acceptance
initially in early childhood as children are transitioning into the peer group, but may be less
important across childhood. Prior research has found that prosocial behaviour predicted peer
acceptance at 4-years-of-age, but peer acceptance, not prosocial behaviour, at 4-years-old
predicted peer acceptance at 5-years-old (Denham & Holt, 1993). During early childhood,
peer reputation may solidify and emerge as a more central predictor of acceptance than social
behaviours. Once a child's reputation within the peer group is established, a reputational bias
308
may influence not only the child's response to their peers, but peers perceptions and responses
to the child (Hymel, Wagner, & Butler, 1990).
Studies two (Chapter 5) and four (Chapter 7) found that aggression was associated
with peer acceptance, in support of previous findings (Card & Little, 2006; Ettekal & Ladd,
2015). However, correlational analyses in study two revealed that the association between
aggressive subtypes and peer acceptance varied across Teacher and Peer reports at Time 1.
Teacher reported aggression was negatively related to Teacher reported peer acceptance,
whereas Peer reported aggression was positively related to Peer reported acceptance and
rejection. Though, the only significant correlations were between Teacher reported proactive
physical aggression and peer acceptance and Peer reported reactive relational aggression and
peer acceptance and reactive physical aggression and rejection. Teachers’ impressions of
students may be subject to the halo effect (Bressoux, Lima, Pansu, 2013). Teacher may
perceive children in a more positive way, regardless of their actual aggressive behaviour, than
peers, who may not experience the same pressure to evaluate students in a positive way. Peers
may witness a greater range of other students’ behaviour across wider contexts than Teachers
as they are internal members of the peer group, consequently their evaluations of children’s
acceptance may vary to Teachers (Bukowski et al., 2012).
Interestingly, according to Peer reports, reactive relational aggression was positively
associated with peer liking and reactive physical aggression was positively associated with
peer rejection. This may reflect the different forms of aggression children are using.
Relationally aggressive children have been found to have more mutual friendships (Burr et al.,
2005), whereas physically aggressive children have been found to experience greater peer
rejection (Card et al., 2008). Though, despite not all the correlations being significant, peer
reported aggression was positively associated with peer acceptance across the functions and
forms. These correlations may reflect controversial children, children who experience high
peer liking and rejection concurrently (Coie et al., 1987) or the unstable nature of peer
relations during early childhood (Cairns et al., 1995). This finding needs further exploration in
future studies.
The regressional analysis in study two, however, revealed that physical and relational
aggression (although not independently significant predictors) were positively related to peer
acceptance reported by Teachers, when taking into account age, gender, verbal ability and the
other subtypes of aggression. Further, proactive and reactive physical and reactive relational
aggression were positively related to Peer reported acceptance, whereas proactive relational

309
aggression was negatively related (though aggressive subtypes were not independent
predictors). In early childhood, it appears that not all aggressive children may be subject to
low peer acceptance. This is in opposition to studies which have indicated that physical
aggression is related to lower peer acceptance and relational aggression is associated with
greater peer acceptance (R. Smith et al., 2009). In early childhood, physical and relational
aggression tend to be more direct and indirect aggression is uncommon (Monks et al., 2003).
Direct aggression may be more salient than indirect aggression to both Teachers, who are
external to the peer group, and peers, who may not be aware of indirect aggression if they are
not involved. Young directly aggressive children may consequently be more salient or
dominant within the peer group (Pellegrini et al., 2011) and therefore more accepted.
Peer reported proactive relational aggression, however, was negatively related to
peer acceptance. This is in opposition to previous research which has found reactive
aggression is negatively related and proactive aggression is positively related to aggression
(Poulin & Boivin, 2000; Smith et al., 2009). Though, these studies only considered function,
without examining the form of aggression. It may depend on the motivation for children's
aggression. Children who are using aggression for reasons such as defending a peer (which
may be considered to be reactive aggression) may be well liked by their peers (Lee, Smith, &
Monks, 2015), whereas children who use proactive aggression to obtain resources (e.g. toys)
from their peers may be less accepted. However, proactive physical aggression was positively
related to peer acceptance reported by peers. The effectiveness of aggression may also play a
role. Proactively relationally aggressive children may not have been successful in their
aggressive acts and therefore may have experienced lower peer acceptance. Alternatively, this
lack of an association may reflect difficulties young children may have with distinguishing
between the functions of aggression, as may have been the case with Teacher reports. Studies
two (Chapter 5) and four (Chapter 7) indicated that Peer reported rejection was not related to
aggressive or prosocial behaviour. This contrasts with studies that have found that aggressive
children are subject to greater peer rejection (Card et al., 2008; Kawabata & Crick, 2013).
Peer acceptance and rejection represent distinct domains of peer relations (Bukowski et al.,
1989) and as a result different factors may be associated with acceptance and rejection. Peer
nominations of rejection may be influenced by the school climate. Schools that have policies
and norms supporting positive peer interactions may result in children being less willing to
openly admit to disliking some peers (Chang, 2004). The findings discussed above support
the assumption of social development models that social adjustment and behaviour is
influenced by self- and other-perceptions (Yeates et al., 2007). The results varied slightly
310
depending on whether Teacher or Peer reports were used. This highlights the importance of
considering the view of multiple informants.
Study two also found that children's EF and ToM skills were unrelated to peer
acceptance reported by Teachers or Peers in early childhood. Added to this, study four
indicated that EF and ToM skills at Time 1 were unrelated to initial peer acceptance or
trajectories of peer acceptance across early childhood. This is in contrast to previous work
which has supported a link between EF, ToM and peer acceptance (Holmes et al., 2015;
Masten et al., 2012). The link between children's cognitive abilities and their standing within
the peer group may not be straightforward. Children who are rejected by their peers may be
less able to access social settings which promote the development of EF and ToM, which may
then exacerbate their low acceptance within the peer group. In line with this, research has
found that experiencing early peer problems can lead to poorer EF in early childhood, which
in turn leads to an increased risk of peer problems in middle childhood and adolescence
(Holmes et al., 2015).
This is supported by the finding of study four (Chapter 7) that the relation between
cognitive abilities and social behaviour changes across early childhood. At Time 1 and Time
3, for example, aggressive and prosocial behaviour were related to peer acceptance, but at
Time 2 aggressive and prosocial behaviour, as well as EF and ToM were related to peer
acceptance. This finding supports the hypothesis that the associations among cognitive
abilities and social behaviours may be subject to age related changes. There may be indirect
links between EF, ToM and peer acceptance. Prosocial behaviour remained positively related
to peer acceptance across early childhood, but the relation between aggression and peer
acceptance changed. According to Teacher reports at Time 2 and Time 3 physical and
relational aggression were negatively related to peer acceptance. That is, towards the end of
early childhood, higher aggressive behaviour was associated with lower peer acceptance.
Aggressive, as well as prosocial strategies, may be seen as appropriate strategies when
interacting with peers in early childhood (Zsolnai et al., 2012), but as children are socialised
away from aggression may be viewed more negatively. This may reflect the increasingly
severe consequences (e.g. school exclusion, injury) of peer directed aggression as children age
(Tremblay, 2000).
8.4. Application of Findings to the Wider Literature
The findings from this thesis have important implications for several ongoing debates
in the research literature. These contributions are reviewed below.

311
Differentiation of the Function and Form of Aggression The present research
contributes to the ongoing debate surrounding whether distinctions between the function and
form of aggression are valid (Bushman & Anderson, 2001; Heilbron & Prinstein, 2008).
Theories no longer consider aggression as one heterogeneous category, but instead distinguish
between subtypes of aggression based on the form or underlying function of the aggressive
behaviour (Dodge, 1991; Dodge & Coie, 1987; Grotpeter & Crick, 1996). However despite
these distinctions being proposed, there has been debate amongst researchers as to whether
subtypes of aggression are useful, resulting in multiple approaches to the study of aggression.
Many studies consider aggression as a single construct (e.g. Jacobson et al., 2011; Masten et
al., 2012), while others differentiate between either function or form (e.g. Rathert et al., 2011;
Werner et al., 2006), and few studies take into account both the function and form of
aggression (e.g. Frey et al., 2013; Mathieson & Crick, 2010). This makes comparing results
across studies more challenging and may hinder understanding of the development of
aggression.
In support of the validity of the function and form of aggression, the current research
provides evidence that subtypes of aggression are associated with different correlates, show
different developmental trajectories and result in varying outcomes. In line with research
which has argued that subtypes of aggression have different underlying aetiologies (Dodge,
1991; Hubbard et al., 2010; Poulin & Boivin, 2000), the findings from this thesis argue that
the underlying role of EF and ToM in subtypes of aggression may vary. For instance
according to the results of study two (Chapter 5), EF and ToM were associated with reactive
and proactive physical, but not relational, aggression, as reported by Teachers and Peers.
Added to this, the first two studies (Chapter 4 and 5) revealed that, although inhibition was
central to aggression, the role of other individual EF skills differed across subtypes. Poor
planning and superior working memory, for example, were related to Teacher reported
proactive relational aggression. Affective decision making was related to proactive physical
aggression according to Teachers. Individual EF skills may therefore be differently related to
subtypes of aggression, supporting the view that the functions and forms of aggression are
associated with different correlates.
In further support for the existence of distinct subtypes of aggression, study four
(Chapter 7) revealed that aggression follows different developmental trajectories depending
on its function and form. Reactive and proactive relational aggression appeared to follow
similar trajectories. Relational aggression appeared to decrease between 4- to 5.5-years-of-age
and then began to increase around 5.5-years-old. Relational aggression remained relatively

312
stable between 6- and 7-years-of-age. This fits with the theory that relational aggression
increases in middle childhood, coinciding with advances in verbal ability (Björkqvist et al.,
1992). Proactive and reactive physical aggression, on the other hand, followed different
developmental trajectories. Proactive physical aggression remained relatively stable from 4 to
7-years-of-age. Proactive physical aggression may peak in the toddler years as overt
aggressive behaviour is more common in young children (Alink et al., 2006; Gray, Carter,
Briggs-gowan, Jones, & Wagmiller, 2014; Nærde, Ogden, Janson, & Zachrisson, 2014), most
likely reflecting the fact their limited verbal skills mean it is difficult for them to verbally
express and negotiate their wishes (Björkqvist et al., 1992). Reactive physical aggression
demonstrated a peak around 4.5-years-of-age and then declined. It is during this time that
children typically transition from nursery into more formal schooling in the UK, which
involves children learning to negotiate with their peers. Reactive physical aggression may
therefore increase as children are learning to cope with frustrating peer situations (Zsolnai et
al., 2012) and then may decline as children learn to use more affiliative strategies. Indeed
young children have been found to initially use aggressive and affiliative strategies to
establish dominance within the peer group and then affiliation was used to maintain
dominance (Pellegrini et al., 2011).
Gender differences in children's use of aggression have also been found. The
findings of study four (Chapter 7) revealed that there was a significant gender difference for
physical aggression. In line with previous studies (Card et al., 2008; Coie et al., 1982; Crick
& Grotpeter, 1995; Hay et al., 2011; Lussier et al., 2012), boys were higher in physical
aggression than girls. Expanding on this finding, though, boys were rated significantly higher
in both proactive and reactive physical aggression than girls. There was no difference in
relational aggression. Gender differences in relational aggression may not become apparent
until later childhood (R. Smith et al., 2009; Vaillancourt et al., 2003). Boys and girls may
show differing trajectories of relational and physical aggression. In addition to following
distinct developmental pathways, subtypes of aggression also appear to vary across genders.
These findings further support the view that considering subtypes of aggression will provide a
more complete understanding of its development. Interventions targeting cognitive factors
may consequently be most effective at different points in development depending on the
subtype of aggression.
In opposition to the existence of separable subtypes of aggression, the findings of
this thesis suggested that the outcomes of subtypes of aggression did not necessarily differ.
Study two (Chapter 5) revealed that Teacher reported physical and relational aggression were

313
both positively associated with peer acceptance and Peer reported proactive and reactive
physical and reactive relational (but not proactive relational aggression) were positively
associated with peer acceptance. Added to this, study four (Chapter 7) indicated although the
relation between aggression and peer acceptance changed over early childhood, forms of
Teacher reported aggression were not differently related to peer acceptance. Relational
aggression may be associated with more mutual friendships compared to physical aggression
(Burr et al., 2005), but this is different to peer acceptance (Cillessen & Marks, 2011). Further,
physical and relational aggression may be differently related to peer acceptance across
genders. Boy's physical aggression has been found to be negatively correlated and relational
aggression positively associated with acceptance by boys and girls (R. Smith et al., 2009). In
contrast, girl's physical aggression was negatively related to acceptance by boys and girls, but
girl's relational aggression was positively related to peer acceptance reported by boys but not
girls. This research therefore provides limited support for a differential relation between
functions and forms of aggression and peer acceptance. Though, only peer acceptance was
considered. Subtypes of aggression may differ in relation to other domains such as leadership
or internalising and externalising behaviours (Card & Little, 2006; Fite et al., 2014;
Mathieson & Crick, 2010). It cannot be conclusively determined from this research whether
distinctions between the function and form of aggression can be made based on outcomes.
The different functions and forms (particularly functions) of aggression are often
reported to be highly correlated. In the present thesis, subtypes of aggression reported by
Teachers and Peers were moderately to highly positively correlated. Children high in one type
of aggression were also likely to be rated as high in other types of aggression, supporting
research which has found that only a small minority of children are classified as showing
predominately one type of aggression (Bushman & Anderson, 2001; R. Smith et al., 2009).
This questions the argument that the functions and forms of aggression represent distinct
subtypes of aggression. If children are demonstrating high levels of all types of aggression, is
differentiating between them meaningful and useful? It has been argued that reactive and
proactive aggression are best thought of as continuous dimensions that exist to varying
degrees in each child, rather than as rigid categories into which children are placed (Hubbard
et al., 2010). Although aggressive children may therefore show various types of aggression,
considering the degree to which children show particular functions or forms of aggression
may provide a greater insight into the development of aggression. However, aggression may
have mixed motives and not a purely proactive or reactive function (Bushman & Anderson,
2001).

314
In line with previous studies (Card & Little, 2006), correlations in the present
research demonstrated that functions of aggression were more highly correlated than forms.
Distinguishing between forms, but not functions, may therefore be useful. The difficulty in
differentiating between functions and forms, especially functions, of aggression may reflect
issues with assessment techniques. Teacher and Parent reports may be biased by their overall
impression of the child (Polman et al., 2007) and Teachers and Parents may find
differentiating between the psychological constructs of reactive and proactive aggression
challenging. Further, the underlying internal reason for a child's aggression cannot be directly
observed. A passing of time between provocation and retaliation could suggest proactive
aggression, but the motivation may actually be reactive. Although self-report measures have
been proposed to assess functions of aggression in adolescence (Rieffe et al., 2016), these
measures are too complex for use with young children. Further despite lower intercorrelations
between functions when self-report measures were used, proactive without reactive
aggression was only reported by 1% of 578 9 to 13-year-olds (Rieffe et al., 2016). Children
are unlikely to use pure subtypes of aggression.
Reliable distinctions between forms, but not functions, may therefore be possible.
Rather than trying to distinguish between different functions of aggression, it may instead be
more beneficial to identify how effectively children are using these types of aggression and
their standing within the peer group. The present research indicated that the relation between
aggression and peer acceptance changed from positive to negative across early childhood.
Though, this may depend on who is assessing peer acceptance: Teachers or Peers. Further,
working memory was positively related to proactive relational aggression and affective
decision making was positively associated with proactive physical aggression, which may
reflect the fact that these children were skilled users of aggression who used aggression
successfully to achieve their goals. Children who are skilled users of aggression and who are
well accepted by their peers may consequently show superior cognitive abilities, whereas
unskilled and not well accepted children may show poorer cognitive abilities. This may have
important implications for interventions as interventions may need to be tailored to different
types of aggressive children.
Distinction of cool and hot executive function. The research presented in this thesis
adds to current debate surrounding whether a hot dimension of EF exists and whether cool
and hot EF skills represent a unitary construct or are reflective of distinct EF domains.
Traditionally, EF has been viewed through a purely cognitive lens, meaning the role of
emotion and motivation in EF has largely been neglected (Peterson & Welsh, 2014). Zelazo

315
and Müller (2002) posited that EF, along with its supporting neural systems, can be separated
into cool and hot domains (Zelazo & Carlson, 2012). To date, support for the existence of a
multidimensional model has been mixed, especially in early childhood: with some researchers
finding evidence to support this two factor model (Kim et al., 2014; Willoughby et al., 2011)
and other researchers failing to identify a two factor model (Allan & Lonigan, 2014; Masten
et al., 2012). This has led to the validity of this distinction being debated. The present research
does not support the existence of distinct cool and hot domains of EF in early childhood. Cool
and hot EF skills showed little differentiation in development across early childhood and
correlations between cool and hot tasks did not indicate separable factors.
In support of research that has suggested cool and hot EF follow parallel
developmental trajectories (Hongwanishkul et al., 2005; Kerr & Zelazo, 2004), study three
(Chapter 6) indicated that early childhood represents an important period in the development
of both cool and hot EF skills. Between 4- and 7-years-of-age significant improvement in the
cool EF skills, working memory and planning, and the hot EF skills, delay of gratification and
affective decision making, were evident. Early childhood may consequently represent a
sensitive period in the development of both cool and hot EF abilities (Zelazo & Carlson,
2012). In early childhood therefore cool and hot EF may not be dissociable. Instead, EF may
represent a unitary construct that includes both cool and hot EF skills. However, hot EF skills
appeared to follow a more protracted developmental course. While cool EF skills showed
improvement across time points, improvement was only evident between the youngest and
oldest cohort for hot EF skills. Different regions of the PFC have been purported to mediate
cool and hot EF (Zelazo & Müller, 2002; Zelazo & Carlson, 2012). The PFC develops in a
protracted manner and is one of the last brain regions to reach maturity (Fuster, 2002;
Segalowitz & Davies, 2004; Steinberg, 2005) and as a result cool and hot EF may become
more differentiated with development (Bechara et al., 1998) as children's cognitive abilities
become associated with more specific brain regions (Karmiloff-Smith, 1992). Though, it is
important to note that differences in the development of cool and hot EF skills may reflect
non-task equivalence. Cool and hot EF tasks may not have been similar in terms of difficulty
and as a result had different EF tasks been used then the pattern of development may have
varied.
Further evidence that contradicts the existence of distinct cool and hot EF domains,
was the finding in study three (Chapter 6) that cool EF skills were positively correlated at
each time point, but hot EF skills were not related to each other at any time point. The hot EF
measures assessing delay of gratification and affective decision making therefore do not seem

316
to be tapping the same underlying hot factor. In addition, the hot EF skill delay of
gratification showed greater association with cool EF skills across early childhood compared
to affective decision making, suggesting cognitive and affective domains may be integrated
(Allan & Lonigan, 2014). It is only relatively recently that research has begun to consider hot
as well as cool EF and, as a result, understanding of the organisation and development of hot
EF lags behind that of cool EF (Peterson & Welsh, 2014; Zelazo & Müller, 2002). In
comparison to the extensive research into cool EF skills, few studies have been carried out to
date that have attempted to elucidate which skills encompass hot EF and how these relate to
cool EF. This has resulted in limited understanding of what skills fall under the umbrella of
hot EF and research has consequently relied on varying measures of hot EF (Allan &
Lonigan, 2011; Di Norcia et al., 2015; Garner & Waajid, 2012; Moore et al., 1998).
Delay of gratification and affective decision making are the main cognitive
processes that have been assessed as reflective of hot EF (e.g. Allan & Lonigan, 2014; Dolan
& Lennox, 2013; Hobson et al., 2011; Hongwanishkul et al., 2005). Affective decision
making, as assessed by gambling tasks, may be a distinct cognitive process that is not
reflective of hot EF (Toplak et al., 2010). Gambling tasks may not be appropriate measures of
EF, cool or hot, as the present research found little association between EF and affective
decision making, in line with other findings (Bechara et al., 1998; Hongwanishkul et al.,
2005). Although this may be expected if cool and hot EF are dissociable (Bechara et al.,
1998), affective decision making did not correlate with other proposed hot EF skills (e.g.
delay of gratification). Cool and hot EF may become more differentiated across development
(Diamond, 2006; Karmiloff-Smith, 1992). Though, there was little support that cool and hot
EF become more separable across early childhood in this research. This may be a process,
however, that extends beyond early childhood. Limited understanding of hot EF is reflected in
the few tasks available that measure hot EF, especially in young children, and this makes
researching cool and hot EF development challenging for researchers. If understanding of hot
EF is to progress then greater research attention needs to be directed towards identifying hot
EF skills and developing task to measure these skills.
Although it has been argued that the distinction between cool and hot EF encourages
researchers to adopt a broader conceptualisation of EF that captures its more affective and
motivational aspects (Hongwanishkul et al., 2005), this research provided no support for the
utility of separate cool and hot domains. Study one (Chapter 4), for example, revealed that
components of hot EF did not contribute to understanding of aggression of any function or
form above and beyond that of cool EF. Added to this, study two (Chapter 5) revealed that

317
when the joint contribution of cool and hot EF skills (along with ToM) to aggression was
considered, EF significantly predicted physical forms of aggression, suggesting EF may be
best characterised as a single construct. These findings therefore do not support the view that
hot EF is a distinct domain of EF and suggests that considering separate cool and hot EF
domains does not add to understanding of aggressive behaviour. However, considering
individual cool and hot EF skills may be beneficial. For instance, study two (Chapter 5) found
that affective decision making was particularly important to proactive physical aggression
reported by Teachers. Though, whether this represents hot EF is questionable (see above).
Further, study three (Chapter 6) found that delay of gratification showed the strongest
association with ToM. Delay of gratification at Time 2 and 3 predicted Time 3 ToM, whereas
planning at Time 2 only predicted ToM at Time 3. Despite evidence that cool and hot EF are
not dissociable in early childhood, the use of measures tapping both cool and hot processes
may be beneficial in providing a greater understanding of the links between individual EF
skills and social behaviour. Cool and hot EF may represent integrated aspects of EF, separate
from decision making, but EF may be used differently under abstract and emotionally charged
situations. Affective problems may place a greater cognitive load on children's EF, which may
consequently result in poorer EF.
The link between EF and ToM. In addition to contributing to the current literature
on models of EF, the current research also adds to understanding of the link between EF and
ToM. There is a substantial body of literature that has focused on establishing the nature of
the EF-ToM relation. In line with previous studies (Devine & Hughes, 2014; Hughes, 1998a;
Wellman et al., 2001), the findings from the current thesis indicate that advances in EF and
ToM are strongly and positively related and that both EF and ToM undergo substantial gains
in early childhood, in typically developing children. The research presented in this thesis
builds on current literature as it examined the longitudinal associations between individual
cool and hot EF skills and ToM across early childhood. The findings revealed that early EF
was more strongly predictive of later ToM, than early ToM was of later EF. This relation was
found when age, gender, verbal ability and early cognitive functions were taken into account,
supporting an emergence account and not an expression account of the relation between EF
and ToM. According to the current results, EF provides a basis for the development of ToM.
This EF-ToM relation supports the theory proposed by Russell (1996) that children's direct
experience of the intentional nature of actions leads to advancement in their mental state
awareness and opposes the alternative view that understanding of the representational nature
of the mind leads to improved self-control (Perner & Lang, 1999). The current findings are

318
consistent with the notion that EF skills have a direct impact on ToM. Early EF impairments
may limit a child's later ability to understand and predict the mental states of others
(Pellicano, 2007; J. Russell, 1996). However, Hughes (1998b) has suggested that social
interaction may mediate the relation between EF and ToM. Poor EF may lead to a child being
unable to effectively regulate their behaviour during social interactions, which may result in
fewer and poorer quality social interactions with peers (Hughes et al., 2000). This in turn
could have an adverse effect on the development of ToM.
Interestingly, although cool EFs were significantly and positively correlated with
ToM across early childhood, only Time 2 planning predicted Time 3 ToM after age, gender,
verbal ability and Time 1 planning ability were taken into account. Cool EF skills may
therefore have correlated with ToM due to their joint association with verbal ability or age
(Hughes, 1998a). The age span of the sample was quite wide across time points. At the first
time point children were between 3- to 6-years-old and as a result the majority of them may
have mastered first-order false belief understanding (Wellman et al., 2001). EF may be
important to the emergence of false-belief understanding, but once a conceptual
understanding of false beliefs is obtained EF may no longer be predictive of ToM in typical
development (Pellicano, 2007). Second-order false belief understanding typically emerges
later, around 6- to 7-years-of-age (S. Miller, 2009), and as result may be related to EF at these
ages. This may explain why planning at Time 2 was predictive of ToM at Time 3. Working
memory at Time 2 was also marginally significantly related to ToM at Time 3.
Hot delay of gratification at Time 1 and Time 2 predicted ToM at Time 3. Hot
affective decision making, however, did not significantly correlate with ToM across early
childhood. The current findings therefore provide limited support for the notion that hot EF
processes as more strongly associated with ToM due to their joint association with the medial
regions of the PFC (Siegal & Varley, 2002; Zelazo et al., 2005) and their emotionally
significant nature (Zelazo & Cunningham, 2007; Zelazo et al., 2005). Though, delay of
gratification did appear to be more strongly related to ToM than cool EF. However, the link
between delay of gratification and ToM contradicts studies which have found inhibition and
not delay of gratification are central to ToM (Carlson & Moses, 2001). Inhibition showed
little individual variation across early childhood, which may have reflected a ceiling effect. A
more sensitive measure of inhibition across early childhood may have uncovered the link
between inhibition and ToM. In line with the theory proposed by Russell (1996) children's
emerging ability to self-monitor, which he considers central to all executive tasks, and to act
with volition are a necessary precondition for understanding mental states. Thus, it may be the
319
self-monitoring aspect and not the emotional significance of the task that is associated with
ToM. Perhaps, at least in relation to false-belief understanding as these tasks are emotionally
neutral. Other more emotionally charged ToM skills (e.g. deception) may be more strongly
related to hot EF skills.
Cognitive deficits characterise aggressive children. The findings from this thesis
have implications for the debate concerning whether or not aggressive children are
characterised by cognitive deficits or whether some aggressive children actually display
superior social-cognitive skills. Overall, the findings from this thesis support the view that
children, at least in early childhood, with poorer cognitive abilities are rated as more
aggressive by their Teachers and Peers. In particular, poor inhibition was related to increased
aggression across the different functions and forms. Young children with poor inhibition may
be less able to withhold a physically or relationally aggressive act in response to perceived
provocation (e.g. teasing), or to achieve a goal (e.g. obtaining a desired toy). Though,
according to the findings of study four (Chapter 7), poor inhibition is only predictive of
aggression during the beginning of early childhood (4- to 6-years-of-age). Inhibition was
negatively associated with physical aggression at Time 1, but not at Time 2 or 3. This may
reflect the more direct nature of children’s aggression in early childhood (Björkqvist et al.,
1992; Monks & Coyne, 2011). Research which has found that some aggressive children
exhibit superior cognitive abilities has typically been carried out with children in middle to
late childhood and adolescence (Sutton et al., 1999). The nature of children’s aggression
changes with development. Aggression during early childhood is often much more direct and
non-specific and victims of aggression are not consistent over time (Monks & Coyne, 2011;
Monks et al., 2003). However, as children progress to middle childhood, they begin to be
more targeted in their acts of aggression and bullying behaviours are witnessed. It is also
during this transition to middle childhood that children begin to engage in more indirect
aggression (Björkqvist et al., 1992). With these developments, the nature of the relation
between cognitive abilities and aggression may change and greater EF and ToM abilities may
be required for children to be effective in their use of these types of aggression.
The current thesis, however, did provide partial evidence that certain subtypes of
aggression may be related to greater EF in some domains in early childhood. For example,
study one (Chapter 4) revealed that working memory was positively related to proactive
relational aggression. Study one further found that for children low or average in Teacher
reported prosocial behaviour, greater working memory was related to higher Teacher reported
reactive relational aggression (albeit non-significantly), whereas for children high in prosocial

320
behaviour, poor working memory was related to higher reactive relational aggression. Added
to this, the results of study two (Chapter 5) indicated that greater affective decision making
was related to higher Teacher reported proactive physical aggression. The findings from study
four (Chapter 7) also suggested that at Time 2 superior ToM abilities were related to higher
levels of reactive relational aggression. Proactive functions and relational forms of aggression
therefore appear to be associated with greater EF and ToM in some domains. Higher rates of
proactive and relational aggression may be linked to better EF and ToM performance as these
subtypes require more forethought, organisation and manipulation of the peer group (Dodge,
1991; Heilbron & Prinstein, 2008). This is especially true when aggression is used indirectly
(Heilbron & Prinstein, 2008); a type of aggression more common in older children
(Björkqvist et al., 1992). This may explain why greater ToM was associated with increased
reactive relational aggression at Time 2, but not Time 1. Indirect aggression may have been
uncommon at Time 1 and may have begun to increase at Time 1 and therefore ToM may have
been positively related to reactive relational aggression.
The finding that some superior EFs and greater ToM are related to proactive and
relational aggression links to the idea of bistrategic controllers (Hawley, 2003). That is,
children who effectively use both aggressive and prosocial strategies to gain and control
resources. Bistrategic controllers have been found to show superior social skills (Hawley,
2003) and are well accepted by their peers (Hawley, Little, & Card, 2007). Proactive physical
aggression may have been associated with better affective decision making as these children
may have been better able to evaluate the use of aggression to control resources, especially
when they were unable to inhibit their impulse to use aggression. In line with this study one
(Chapter 4) found that better working memory was related to greater proactive relational
aggression. Children with superior working memory may have been better able to process
how relationally aggressive strategies could be used to reach their goal. However, study one
also found that better working memory was related to lower reactive relational aggression in
highly prosocial children, which does not support the view of prosocial and aggressive
children showing greater cognitive skills. These children, though, may not have been using
aggression and prosocial strategies effectively to control resources, especially as these
children were engaging in reactive 'hot-headed' aggression. Further, bistrategic controllers
likely reflect a small subset of aggressive children. Proactive aggression may be more
strongly related to bistrategic behaviour than reactive aggression as it is associated with
achieving one’s goals, including social dominance and resources (Dodge, 1991). However,
the results of this thesis must be related to the theory of bistrategic controllers with caution as

321
children's resource control and dominance in the peer group was not assessed. Future research
examining links between the function and form of aggression and resource control may shed
light on whether the cognitive profile of aggressive and bistrategic children differs.
This research therefore resulted in mixed findings regarding the characterisation of
children as cognitively impaired or cognitively skilled. Research that has considered cognitive
abilities, such as EF or ToM, more broadly as unitary constructs may have found that poor
performance is related to increased aggression (Jacobson et al., 2011; Masten et al., 2012).
However, when individual EF and ToM skills are taken into account the picture may not be so
straightforward. Individual EF and ToM skills may be differently related to subtypes of
aggression. Further, the changing nature of children's cognitive abilities and social behaviours
should be taken into account; as children's EF and ToM advance and their aggression
becomes more indirect the relation between these cognitive abilities and aggression may
change.
Multiple informants on children's behaviour. In the present thesis both Teacher and
Peer reports of children's aggressive and prosocial behaviour were gathered. This research
therefore provided important contributions towards the ongoing issue of whether single or
multiple informants of children's behaviour should be used. In line with research which has
found varying results depending on the informant (Kim et al., 2014), the present research
found that the underlying mechanisms of aggressive subtypes varied depending on whether
Teachers or Peers were rating children’s aggression. For example, study one (Chapter 4)
found that when Teacher reports of aggression were used, cool EF was associated with
physical and relational aggression, but when peer reports were used, cool EF was related to
physical aggression only. Added to this, the second study (Chapter 5) revealed there were
slight differences in the outcomes of subtypes of aggression across informants. The present
findings therefore suggest that understanding of aggression may vary depending on the type
of informant used. This expands on models of social behaviour which have highlighted that
evaluations of social adjustment vary depending on whether self- or other-perceptions are
gathered (Beauchamp & V. Anderson, 2010; Yeates et al., 2007), by suggesting the relation
between cognitive correlates and aggression may vary across informants. Evaluations of
behaviour problems vary between Teachers and Parents (Kim et al., 2014) and self and peers
(Monks et al., 2003). These differing evaluations of behaviours, such as aggression, may lead
to a different pattern of results regarding cognitive correlates being obtained across
informants.
322
Disparities between Teacher and Peer reports may reflect actual differences in
children's behaviour across contexts. Children may demonstrate different levels of aggression
in the classroom in front of their Teachers than in the playground with their peers (Little et al.,
2003). In particular, children who are more skilled in their aggressive behaviour or who are
using more indirectly aggressive methods, may choose to be aggressive when in the
playground with their peers, but not in the classroom with their Teachers in order to prevent
being detected and punished (Brownell et al., 2015; Little et al., 2003). Peers may
consequently observe interactions and events that adults are unlikely to observe or that may
cease when an adult is present (Brownell et al., 2015). In line with this study one (Chapter 4)
revealed that the correlation between Teacher and Peer reports of aggression, although
positive, was moderate. A finding that is common across studies (Monks et al., 2011, 2003;
Vlachou et al., 2013).
Alternatively, disparities in the reports may reflect the different types of reports that
were obtained. Teachers rated the level of children's aggression, whereas peers nominated
children who were aggressive. Peers may have nominated the most salient aggressive children
or their friends (Bukowski et al., 2012). Though, while Teacher ratings were a combination of
the Class Teacher and Teaching Assistant reports, peer nominations were derived from those
children in the class participating in the study, meaning the peer nominations took advantage
of the collective knowledge of the group (Bukowski et al., 2012). Though, these may have
been influenced by class participation rates (Marks et al., 2013). Further, Teacher reports may
have reflected the overall impression of the child (Polman et al., 2007). It is also important to
bear in mind that Teachers and peers may not have the same understanding of the function
and form of aggression. Children in the present study were between 3- and 6-years-of-age and
consequently may have lacked the cognitive capabilities to understand the function and form
of aggression and the differences between them. Comparing across these ratings may
therefore be confounded by the different nature of the measurements. Though, whether
Teachers are able to tease apart the functions of aggression is questioned (Hubbard et al.,
2010; Rieffe et al., 2016). Study one (Chapter 4) revealed that the correlations between
Teacher reported aggressive subtypes were greater than between Peer reported subtypes.
The findings from this thesis reveal that understanding of aggression varies
depending on the informant reporting on the aggressive behaviour. Though, identifying
whether these differences reflect actual behaviour differences or methodological artefacts was
beyond the scope of this research. The present thesis emphasises the importance of
considering multiple informants and not generalising findings based on single informants.

323
Future research attempting to identify the source of these differences would greatly add to
understanding of the development of aggression.
8.5. Limitations
The present thesis made several novel contributions to the literature. This thesis was
the first to examine the role of cool and hot EF skills and ToM in the functions and forms of
aggression, prosocial behaviour and peer acceptance, cross-sectionally and longitudinally
across early childhood. The current research, however, had some limitations. Although the
present sample size is large in comparison to previous studies carried out in the field (e.g. Di
Norcia et al., 2015; Rathert et al., 2011; White et al., 2012), the findings from this thesis,
particularly in relation to the interaction effects, need to be corroborated by studies with larger
sample sizes as the present research may have lacked power to detect smaller effects.
Secondly, the cohort-sequential design allowed for a larger age range to be studied, but due to
the relatively small number of participants within each of the three cohorts, comparisons
across the cohorts were limited. For instance, in studies one (Chapter 4) and two (Chapter 5)
the regression models could not be tested across the three cohorts to compare the relation
between cognitive abilities and social outcomes between the three age groups. Added to this,
in studies three (Chapter 6) and four (Chapter 7), trajectories of cognitive abilities and social
outcomes across Time 1 and Time 3 for each of the cohorts could not be examined, nor could
true longitudinal trajectories from 4- to 7-years-of-age be modelled. The mean level of
cognitive abilities and social outcomes across cohorts was examined in study three and four,
but true longitudinal developments from Time 1 to 3 for the separate cohorts could not be
explored, limiting understanding of developmental changes. The sample size and cohort-
sequential design presented a further limitation in that more advanced statistical modelling
techniques (such as structural equation modelling) could not be conducted to examine the
direction of effects and indirect effects across early childhood.
A fourth limitation of the present research was that first- and second-order false
belief understanding were the only aspects of ToM assessed. False belief understanding was
measured as it is the most widely researched ToM skill (Wellman et al., 2001) and it typically
emerges during early childhood (Kaysili, 2011). However, other aspects of ToM, such as
deception or emotion understanding, may be related not just to children's aggressive and
prosocial behaviour, but also to cool and hot EF abilities. ToM is a diverse construct and
including a wider range of ToM skills would have enabled a more complete understanding of
the links between EF and ToM as well as between ToM and behaviour to be gained. Adding

324
to this, a fifth limitation is that individual EF skills were examined, but a composite including
first- and second-order ToM was used. This meant the relation between these different aspects
of ToM and aggressive and prosocial behaviour were not investigated First- and second-order
false belief understanding were not treated as separate variables in the present research
because both these measures are tapping children's ability to understand that beliefs can be
different from reality, so the degree to which they represent distinct ToM domains could be
debated. Further, few children passed the second-order false belief understanding task at Time
1 (this ability does not typically emerge until 6- to 7-years-of-age; S. Miller, 2009), so there
was very little variability in children's scores initially. However, it would have been
interesting to identify whether the association between first- and second-order false belief and
social behaviours as well as EF varied.
Another limitation is that although the EF tasks used in this research have been
widely used and are well validated measures of EF, not all the tasks may have been
developmentally sensitive to changes in EF across the entire age range of the study (4 - 7
years). The approach of using identical tasks at each time point was adopted to try and ensure
the same underlying aspect of EF was measured at each time point, but may have limited
developmental sensitivity to some extent and may have resulted in practice effects. For
example, performance on tasks assessing inhibition, affective decision making and delay of
gratification did not significantly change across the three time points. Mean scores on
measures of inhibition and delay of gratification were relative high across the three time
points, suggesting a ceiling effect. Further, mean scores on the affective decision making task
were relatively low from Time 1 to Time 3, indicating there may have been a floor effect.
However, the oldest and youngest cohort did significantly differ in their delay of gratification
and affective decision making. Changes in these abilities may have been more protracted and
may have been masked when whole sample means were considered. Development of EF tasks
that are developmentally sensitive with a wide age range, especially across early childhood,
would encourage more researchers to carry out longitudinal research.
A final limitation of the present research is that the reliability of peer reports may
have been reduced by class participation rates. Class participation rates ranged between 52
and 63% in the current research. Although good reliability for overt aggression and prosocial
behaviour has been found with participation rates as low as 40% (Marks et al., 2013),
reliability of the current peer nominations may have been effect. This may be particularly true
for sociometric nominations as participation rates were lower than 60% in some instances
(Cillessen & Marks, 2011). Added to this, peer reports were not gathered longitudinally as
325
when children progressed to the next year group at school classes were mixed which meant
some classes had very low participation rates. Comparing the longitudinal links between
cognitive abilities and social outcomes across Teachers and Peers would have been valuable
as the first two studies of this thesis indicated that there were differences across informants.
Future longitudinal research utilising peer reports would therefore add to current literature. To
overcome the issue of changes in classes across early childhood dyadic nominations could be
used.
8.6. Conclusions
The research presented in this thesis has five main contributions to the cognitive and
developmental literature. Firstly, the findings from the present thesis highlight the importance
of considering the function and form of aggression as aggressive subtypes showed different
patterns of development across early childhood and different cognitive correlates were
associated with the various functions and forms of aggression. EF and ToM were implicated
in proactive and reactive physical, but not relational, aggression. Further, although poor
inhibition appears to be a central predictor of aggression, proactive and relational aggression
were positively related to some EF skills, such as planning and working memory. The role of
individual EF skills may vary depending on the function and form of aggression and not all
subtypes of aggression may be characterised by poor EF in early childhood. These findings
therefore suggest that only through considering the function and form of aggression can the
heterogeneous development of aggression be fully understood.
Secondly, the current results revealed that separable cool and hot domains of EF may
not be apparent in early childhood. Although cool EF was related to aggression in early
childhood, hot EF processes did not contribute to understanding of aggression beyond that of
cool EF. Further, cool delay of gratification was consistently correlated with cool EFs, but did
not correlate with affective decision making across early childhood. Between 4- and 7-years-
of-age cool and hot EF skills evidenced significant advancement. It has been argued that EF
becomes more modularised across childhood (Karmiloff-Smith, 1992). During early
childhood cool and hot EF may not represent dissociable domains of EF, but may become
more separable in later childhood. Though, the present research suggests that greater attention
needs to be directed towards identifying what cognitive processes fall under the umbrella of
hot EF as affective decision making was not related to delay of gratification or cool EF across
early childhood.

326
Third, cool and hot EF skills and ToM were predictive of aggression but not
prosocial behaviour in early childhood. This finding emphasises the need for researchers to
consider a broad range of social behaviours rather than assuming the same underlying factors
are true of all social behaviours. Researchers should examine correlates of children’s
prosocial behaviour, rather than focusing on the absence of aggressive behaviour. Fourth, the
current research suggested that comparing the results across multiple informants is important.
Depending on whether Teacher or Peer reports were used the associations between EF, ToM,
aggression and peer acceptance varied. Whether these differences reflect actual behavioural
differences or are a reflection of varying measurement techniques could not be examined in
the present research. However, this research indicates that the findings of studies based on
single informant techniques or using composite behavioural scores across informants may not
generalise to reports from all informants and may provide only a partial picture. Important
differences across informants may be evident and further research exploring the underlying
reason for these differences would be valuable.
Fifth, this research highlights the importance of considering the longitudinal
associations between cognitive abilities and social outcomes. The findings indicated that the
nature of the relation between EF, ToM, aggression, prosocial behaviour and peer acceptance
may change as children develop. For example, EF and ToM were related to aggression at
Time 1 and Time 2, but not Time 3 and prosocial behaviour at Time 2 only. EF and ToM
show significant improvement during early childhood and aggression and prosocial behaviour
showed significant changes across cohorts. With these developments the role of EF and ToM
in aggression and prosocial behaviour appears to change. The role of EF and ToM in social
outcomes, like aggression, at one point in development may not be true of other points in a
child's lifespan. The present thesis therefore highlights the importance of examining the link
between cognition and behaviour within the context of development.
8.7. Implications
The research presented in the current thesis has important theoretical implications for
current understanding of EF and of the links between EF, ToM and social outcomes. These
will be reviewed here briefly as they have been discussed in detail earlier in this section. This
research indicates that differential cool and hot domains of EF may not be apparent in early
childhood. Further, the organisation of hot EF needs to be reviewed as affective decision
making may not reflect an aspect of hot EF, even though it has been widely considered by
prior research to represent a hot EF skill. Added to this, the current findings suggest that

327
although social neuroscience models provide a valuable framework for researchers
investigating the development of social behaviours, steps towards more specific models need
to be made. The same model may not apply to all types of social behaviour (e.g. aggressive
and prosocial behaviour) and to all stages of development. In particular, more specific models
of aggressive behaviour development are needed, that take into account the function and form
of aggression and the role of individual cognitive skills.
The findings from this thesis have implications not just for theoretical understanding
of cognitive and social development, but also for interventions. Much research attention has
been dedicated to the role of EF in education and whether promoting EF will improve
children’s academic abilities (Brock et al., 2009; Kim et al., 2014). The present thesis adds to
this by indicating that EF may also be an important factor to target in interventions for
aggression. However, targeting EF alone may not be sufficient as some EF skills were found
to be positively related to certain aggressive subtypes. Added to this, improving EF and ToM
may reduce aggression but will not necessarily promote prosocial behaviour. This research
also suggests that interventions should take into account the developmental stage of the child.
In the beginning of early childhood (Time 1) EF and ToM were predictive of aggression and
aggression was actually associated with greater peer acceptance, but towards the end of early
childhood (Time 3) EF and ToM were no longer associated with aggression and aggression
was related to lower peer acceptance.
This thesis suggests that interventions/ programmes to improve EF may be more
successful if they consider a broad range of EF skills, including cool and hot EF processes, as
children show significant gains in EF across early childhood. Cool EF skills and the hot EF
skill delay of gratification were positively associated across the three time points and as a
result improving one domain of EF may have positive repercussions for other EF skills.
However, affective decision making did not appear to be highly related to hot or cool EF, so
targeting this skill may not benefit EF development. EF, especially delay of gratification, was
also found to predict ToM during childhood. EF may therefore have positive ramifications for
children’s perspective taking skills. Classroom or therapeutic interventions targeting EF may
be beneficial to the development of social-cognitive abilities, such as ToM, as well as
reducing problematic behaviour in children, like aggression.
The current findings suggest that interventions aimed at reducing aggression may be
more effective if they take into account the function and form of aggression. The present
results indivated that subtypes of aggression may have different underlying cognitive factors.

328
Interventions designed to target aggression broadly may therefore consequently be effective
for some types of aggressive children, but not others. For example, improving inhibition may
reduce physical but not relational aggression. Interventions targeted at specific functions and
forms of aggression may therefore be more effective at reducing aggression across a wider
range of aggressive children.
8.8. Future Directions
The findings from this thesis set out several directions for future research. Future
studies should adopt a broader conceptualisation of ToM. The present research considered
false belief understanding, but other ToM skills should be taken into account. For instance,
previous studies have suggested that aggressive children may have intact cognitive ToM skills
(e.g. false belief understanding), but may demonstrate poor performance on measure of
emotional or moral ToM abilities (Lonigro, Laghi, Baiocco and Baumgartner (2013). Added
to this, it has also been suggested that aggressive children may exhibit a ‘nasty’ deviant ToM,
in which they demonstrate superior emotional false belief understanding in antisocial
situations (Hughes et al., 1998). These ToM processes may be differently implicated in the
function and form of aggression. For example, children that use relational aggression to
proactively gain what they want may demonstrate a nasty ToM because these individuals may
need to better understand how to manipulate the perspectives of others in negatively
emotional situations. Research examining the link between emotional and moral ToM skills
and subtypes of aggression may shed new light on this relation.
A further focus for future research is understanding the organisation of hot EF.
Knowledge of the processes that fall under the umbrella of hot EF is limited. The findings
from this thesis indicated that affective decision making may not be representative of hot EF.
Much greater research attention therefore needs to be directed to identifying hot EF skills. The
relation between hot EF skills and cool EF skills also warrants further study, especially during
early childhood. Identifying whether EF is best represented by a single construct or a multi-
dimensional construct including cool and hot domains will have important theoretical
implications for current understanding of EF. This problem is exacerbated by the lack of tasks
measuring hot EF in childhood, particularly in early childhood. In addition to increasing
understanding of hot EF, attempts to develop measures of hot EF would greatly benefit the
literature.
An important focus for future research in this field should be the undertaking of more
longitudinal studies. According to the present results, early childhood represents an important
329
period in the development of children’s cognitive abilities and social behaviour and the
underlying role of cognitive skills, such as EF and ToM, in social behaviours, like aggression,
changes with development. However, studies that follow children over a longer period of time
as they begin to engage in more indirect aggression would lead to greater understanding of the
underlying role of EF and ToM in aggression. Carrying out a true longitudinal study (opposed
to a cohort-sequential design) with a larger sample would also enable the direction of the
relation between EF, ToM and social outcomes to be explored. Further, indirect pathways
between EF, ToM, aggression, prosocial behaviour and peer acceptance could be examined.
This would allow a more complete understanding of the intersection between these cognitive
abilities and social outcomes to be gained.

330
9. REFERENCES
Aiken, L. S., & West, S. G. (1991). Multiple Regression: Testing and Interactions. Newbury
Park, CA: Sage.
Albert, D., & Steinberg, L. (2011). Age differences in strategic planning as indexed by the
tower of London. Child Development, 82, 1501–1517. doi:10.1111/j.1467-
8624.2011.01613.x
Alink, L. R. A, Mesman, J., Van Zeijl, J., Stolk, M. N., Juffer, F., Koot, H. M., … Van
Ijzendoorn, M. H. (2006). The early childhood aggression curve: Development of
physical aggression in 10- To 50-month-old children. Child Development, 77, 954–966.
doi:10.1111/j.1467-8624.2006.00912.x
Allan, N. P., & Lonigan, C. J. (2011). Examining the dimensionality of effortful control in
preschool children and its relation to academic and socioemotional indicators.
Developmental Psychology, 47, 905–15. doi:10.1037/a0023748
Allan, N. P., & Lonigan, C. J. (2014). Exploring dimensionality of effortful control using hot
and cool tasks in a sample of preschool children. Journal of Experimental Child
Psychology, 122, 33–47. doi:10.1016/j.jecp.2013.11.013
Alloway, T. P. (2007). Working memory, reading, and mathematical skills in children with
developmental coordination disorder. Journal of Experimental Child Psychology, 96,
20–36. doi:10.1016/j.jecp.2006.07.002
Alloway, T. P., Gathercole, S. E., Kirkwood, H., & Elliott, J. (2008). Evaluating the validity
of the Automated Working Memory Assessment. Educational Psychology, 28, 725–734.
doi:10.1080/01443410802243828
Anderson, P. J. (2002). Assessment and development of executive function (EF) during
childhood. Child Neuropsychology, 8, 71–82. doi:10.1076/chin.8.2.71.8724
Anderson, P. J. (2008). Towards a developmental model of executive function. In V.
Anderson, R. Jacobs, & P. J. Anderson (Eds.), Executive functions and the frontal lobes:
A lifespan perspective (pp. 3 – 23). New York, USA: Psychology Press.

331
Anderson, P. J., & Reidy, N. (2012). Assessing executive function in preschoolers.
Neuropsychology Review, 22, 345–360. doi:10.1007/s11065-012-9220-3
Anderson, V. (1998). Assessing executive functions in children : Biological, psychological,
and developmental considerations. Assessment of Attention and Executive Function, 8,
319–349. doi:10.1080/713755568
Anderson, V., Anderson, P. J., Jacobs, R., & Spencer-Smith, M. (2008). Development and
assessment of executive function: From preschool to adolescence. In P. Anderson, Vicki;
Jacobs, Rani; Anderson (Ed.), Executive functions and the frontal lobes: A lifespan
perspective (pp. 123 – 155). New York, USA: Psychology Press.
Antonius, D., Fuchs, L., Herbert, F., Kwon, J., Fried, J. L., … Malaspina, D. (2010).
Psychiatric assessment of aggressive patients. American Journal of Psychiatry, 167,
253–259. doi:10.1176/appi.ajp.2009.09010063
Archer, J. (2004). Sex differences in aggression in real-world settings: A meta-analytic
review. Review of General Psychology, 8, 291–322. doi:10.1037/1089-2680.8.4.291
Arsenio, W. F., Cooperman, S., & Lover, A. (2000). Affective predictors of preschoolers’
aggression and peer acceptance: Direct and indirect effects. Developmental Psychology,
36, 438–448. doi:10.1037/0012-1649.36.4.438
Astington, J. W. (2003). Sometimes necessary, never sufficient: False-belief understanding
and social competence. In B. Repacholi & V. Slaughter (Eds.), Individual differences in
theory of mind: Implications for typical and atypical development (pp. 13–29). New
York, USA: Psychology Press.
Austin, G., Groppe, K., & Elsner, B. (2014). The reciprocal relationship between executive
function and theory of mind in middle childhood: A 1-year longitudinal perspective.
Frontiers in Psychology, 5, 1–11. doi:10.3389/fpsyg.2014.00655
Ayduk, O., Rodriguez, M. L., Mischel, W., Shoda, Y., & Wright, J. (2007). Verbal
intelligence and self-regulatory competencies: Joint predictors of boys’ aggression.
Journal of Research in Personality, 41, 374–388. doi:10.1016/j.jrp.2006.04.008
Badenes, L. V., Estevan, R. A. C., & Bacete, F. J. G. (2000). Theory of mind and peer
rejection at school. Social Development, 9, 271–283. doi:10.1111/1467-9507.00125

332
Bagwell, C. L. (2004). Friendships, peer networks, and antisocial behavior. In J. Kupersmidt
& K. Dodge (Eds.), Children’s peer relations: From development to intervention (pp.
37–57). Washington DC: American Psychological Association.
Baillargeon, R. H., & Normand, C. L. (2011). The development of prosocial behaviors in
young children: A prospective population-based cohort study. The Journal of Genetic
Psychology, 172, 221–251. doi:10.1080/00221325.2010.533719
Baker, S. C., Rogers, R. D., Owen, A. M., Frith, C. D., Dolan, R. J., Frackowiak, R. S. J., &
Robbins, T. W. (1996). Neural systems engaged by planning: A PET study of the tower
of London task. Neuropsychologia, 34, 515–526. doi:10.1016/0028-3932(95)00133-6
Banerjee, R., Watling, D., & Caputi, M. (2011). Peer relations and the understanding of faux
pas: Longitudinal evidence for bidirectional associations. Child Development, 82, 1887–
1905. doi:10.1111/j.1467-8624.2011.01669.x
Banny, A. M., Heilbron, N., Ames, A., & Prinstein, M. J. (2011). Relational benefits of
relational aggression: Adaptive and maladaptive associations with adolescent friendship
quality. Developmental Psychology, 47, 1153–1166. doi:10.1037/a0022546
Barker, E. D., Tremblay, R. E., Nagin, D. S., Vitaro, F., & Lacourse, E. (2006). Development
of male proactive and reactive physical aggression during adolescence. Journal of Child
Psychology and Psychiatry and Allied Disciplines, 47, 783–790. doi:10.1111/j.1469-
7610.2005.01585.x
Barker, E. D., Vitaro, F., Lacourse, E., Fontaine, N. M. G., Carbonneau, R., & Tremblay, R.
E. (2010). Testing the developmental distinctiveness of male proactive and reactive
aggression with a nested longitudinal experimental intervention. Aggressive Behavior,
36, 127–140. doi:10.1002/ab.20337
Baron, R. A., & Richardson, D. R. (1994). Aggression: Definition and perspectives. In R. A.
Baron & D. R. Richarson (Eds.), Human aggression (2nd ed., pp. 1 – 37). London:
Plenum Press.
Baron-Cohen, S. (2000). Theory of mind and autism: A fifteen year review. In S. Baron-
Cohen, H. Tager-Flusberg, & J. D. Cohen (Eds.), Understanding other minds:
Perspectives from autism (2nd ed., pp. 3–20). New York, USA: Oxford University Press.

333
Baron-Cohen, S., Leslie, A. M., & Frith, U. (1985). Does the autistic child have a “theory of
mind”? Cognition, 21, 37–46. doi:10.1016/0010-0277(85)90022-8
Baron-Cohen, S., O’Riordan, M., Stone, V., Jones, R., & Plaisted, K. (1999). Recognition of
faux pas by normally developing children with Asperger syndrome or high-functioning
autism. Journal of Autism and Developmental Disorders, 29, 407–418.
doi:10.1023/A:1005608014889
Baş, A. U., & Yurdabakan, I. (2012). Factor structure of the reactive-proactive aggression
questionnaire in Turkish children and gender, grade-level, and socioeconomic status
differences in reactive and proactive aggression. Journal of Psychoeducational
Assessment, 30, 284–297. doi:10.1177/0734282911428892
Batty, M., & Taylor, M. J. (2006). The development of emotional face processing during
childhood. Developmental Science, 9, 207–220. doi:10.1111/j.1467-7687.2006.00480.x
Beauchamp, M. H., & Anderson, V. (2010). SOCIAL: An integrative framework for the
development of social skills. Psychological Bulletin, 136, 39–64. doi:10.1037/a0017768
Beazidou, E., & Botsoglou, K. (2016). Peer acceptance and friendship in early childhood: The
conceptual distinctions between them. Early Child Development and Care, 186, 1615–
1631. doi:10.1080/03004430.2015.1117077
Bechara, A. (2004). The role of emotion in decision-making: Evidence from neurological
patients with orbitofrontal damage. Brain and Cognition, 55, 30–40.
doi:10.1016/j.bandc.2003.04.001
Bechara, A., Damasio, H., Tranel, D., & Anderson, S. W. (1998). Dissociation Of working
memory from decision making within the human prefrontal cortex. The Journal of
Neuroscience, 18, 428–437. doi:0270-6474/97/180428-10$05.00/0
Belacchi, C., & Farina, E. (2010a). Prosocial/hostile roles and emotion comprehension in
preschoolers. Aggressive Behavior, 36, 371–389. doi:10.1002/ab.20361
Bell, R. Q. (1953). Convergence: An accelerated longitudinal approach. Child Development,
24, 145–152. doi:10.2307/1126345

334
Bellagamba, F., Laghi, F., Lonigro, A., & Pace, C. S. (2012). Re-enactment of intended acts
from a video presentation by 18- and 24-month-old children. Cognitive Processing, 13,
381–386. doi:10.1007/s10339-012-0518-0
Bender, D., & Lösel, F. (1997). Protective and Risk Effects of Peer Relations and Social
Support on Antisocial Behaviour in Adolescents from Multi-Problem Milieus. Journal of
Adolescence, 20, 661–678. doi: 10.1006/jado.1997.0118
Benson, J. E., Sabbagh, M. A., Carlson, S. M., & Zelazo, P. D. (2013). Individual differences
in executive functioning predict preschoolers’ improvement from theory-of-mind
training. Developmental Psychology, 49, 1615–1627. doi:10.1037/a0031056
Berkowitz, L. (1978). Whatever happened to the frustration-aggression hypothesis? American
Behavioral Scientist, 32, 691–708.
Berlin, L., & Bohlin, G. (2002). Response inhibition, hyperactivity, and conduct problems
among preschool children. Journal of Clinical Child Psychology, 31, 242–257.
doi:10.1207/S15374424JCCP3102
Best, J. R., & Miller, P. H. (2010). A developmental perspective on executive function. Child
Development, 81, 1641–60. doi:10.1111/j.1467-8624.2010.01499.x
Best, J. R., Miller, P. H., & Jones, L. L. (2008). Executive functions after age 5 : Changes and
correlates. Developmental Review, 29, 180–200. doi:10.1016/j.dr.2009.05.002
Björkqvist, K., Ősterman, K., & Kaukiainen, A. (1992). The development of direct and
indirect aggressive strategies in males and females. In K. Björkqvist & P. Niemelä
(Eds.), Of mice and women: Aspects of female aggression (pp. 51–64). San Diego, CA:
Academic Press.
Björkvist, K., Österman, K., & Kaukiainen, A. (2000). Social intellicence - empathy =
aggression? Aggression and Violent Behavior, 5, 191–200. doi:10.1016/S1359-
1789(98)00029-9
Blair, C. (2002). School readiness: Integrating cognition and emotion in a neurobiological
conceptualization of children’s functioning at school entry. American Psychologist, 57,
111–127. doi:10.1037//0003-066X.57.2.111
335
Brand, M., Fujiwara, E., & Markowitsch, H. J. (2005). Decision-making deficits of Korsakoff
patients in a new gambling task with explicit rules: Associations with executive
functions. Neuropsychology, 19, 267–277. doi:10.1037/0894-4105.19.3.267
Braza, F., Azurmendi, A., Muñoz, J. M., Carreras, M. R., Braza, P., García, A., … Sánchez-
Martín, J. R. (2009). Social cognitive predictors of peer acceptance at age 5 and the
moderating effects of gender. The British Journal of Developmental Psychology, 27,
703–716. doi:http://dx.doi.org/10.1348/026151008X360666
Brendgen, M., Vitaro, F., Tremblay, R. E., & Lavoie, F. (2001). Reactive and proactive
aggression: Predictions to physical violence in different contexts and moderating effects
of parental monitoring and caregiving behavior. Journal of Abnormal Child Psychology,
29, 293–304. doi:10.1023/A:1010305828208
Brink, K., Lane, J. D., & Wellman, H. M. (2015). Developmental pathways for social
understanding: Linking social cognition to social contexts. Frontiers in Psychology, 6,
719. doi:10.3389/fpsyg.2015.00719
Bressoux, P., Lima, L., & Pansu, P. (2013, August). Halo effect in teachers' judgement about
students' achievement. Paper presented at the 15th Biennial EARLI Conference for
Research on Learning and Instruction, Munich.
Brock, L. L., Rimm-Kaufman, S. E., Nathanson, L., & Grimm, K. J. (2009). The
contributions of “hot” and “cool” executive function to children’s academic
achievement, learning-related behaviors, and engagement in kindergarten. Early
Childhood Research Quarterly, 24, 337–349. doi:10.1016/j.ecresq.2009.06.001
Brocki, K. C., & Bohlin, G. (2004). Executive functions in children aged 6 to 13: A
dimensional and developmental Study. Developmental Neuropsychology, 26, 571–593.
doi:10.1207/s15326942dn2602
Brodbeck, J., Bachmann, M. S., Croudace, T. J., & Brown, A. (2013). Comparing growth
trajectories of risk behaviors from late adolescence through young adulthood: An
accelerated design. Developmental Psychology, 49, 1732–1738. doi:10.1037/a0030873
Broidy, L. M., Nagin, D. S., Tremblay, R. E., Bates, J. E., Brame, B., Dodge, K. A, … Vitaro,
F. (2003). Developmental trajectories of childhood disruptive behaviors and adolescent

336
delinquency: A six-site, cross-national study. Developmental Psychology, 39, 222–45.
doi:http://dx.doi.org/10.1037/0012-1649.39.2.222
Brown, J. R., Donelan-McCall, N., & Dunn, J. (1996). Why talk about mental states? The
significance of children’s conversations with friends, siblings, and mothers. Child
Development, 67, 836–849. doi:10.2307/1131864
Brownell, C. A., Lemerise, E. A., Pelphrey, K. A., & Roisman, G. I. (2015). Measuring
socioemotional development. In M. E. Lamb & R. M. Lerner (Eds.), Handbook of Child
Psychology and Developmental Science: Volume 3 Scioemotional Processes (7th ed., pp.
11–57). New Jersey, USA: John Wiley & Sons.
Buhs, E. S., Ladd, G. W., & Herald, S. L. (2006). Peer exclusion and victimization: Processes
that mediate the relation between peer group rejection and children’s classroom
engagement and achievement? Journal of Educational Psychology, 98, 1–13.
doi:10.1037/0022-0663.98.1.1
Bukowski, W. M., Cillessen, A. H. N., & Velasquez, A. M. (2012). Peer Ratings. In B.
Laursen, T. D. Little, & N. A. Card (Eds.), Handbook of developmental research
Methods (pp. 211 – 231). New York, USA: The Guilford Press.
Bukowski, W. M., Pizzamiglio, M. T., Newcomb, A. F., & Hoza, B. (1989). Popularity and
friendship: Issues in theory, measurement, and outcome. In T. J. Berndt & G. W. Ladd
(Eds.), Peer Relationships in Child Development (pp. 15–45). New York, NY: Wiley.
Bull, R., Espy, K. A., & Wiebe, S. A. (2008). Short-term memory, working memory, and
executive functioning in preschoolers: Longitudinal predictors of mathematical
achievement at age 7 years. Developmental Neuropsychology, 33, 205–28.
doi:10.1080/87565640801982312
Burr, J. E., Ostrov, J. M., Jansen, E. A., & Crick, N. R. (2005). Relational aggression and
friendship during early childhood: I Won’t be your friend!". Early Education and
Development, 16, 37–41. doi:10.1207/s15566935eed1602
Bushman, B. J., & Anderson, C. A. (2001). Is it time to pull the plug on the hostile versus
instrumental aggression dichotomy? Psychological Review, 108, 273–279.
doi:10.1037//0033-295x.108.1.273
337
Cairns, R. B., Leung, M. C., Buchanan, L., & Cairns, B. D. (1995). Friendships and social
networks in childhood and adolescence:Fluidity, reliability, and interrelations. Child
Development, 66, 1330–1345. doi:10.2307/1131650
Calero, C. I., Salles, A., Semelman, M., & Sigman, M. (2013). Age and gender dependent
development of Theory of Mind in 6- to 8-years old children. Frontiers in Human
Neuroscience, 7, 1–7. doi:10.3389/fnhum.2013.00281
Camodeca, M., & Goossens, F. A. (2005). Aggression, social cognitions, anger and sadness in
bullies and victims. Journal of Child Psychology and Psychiatry and Allied Disciplines,
46, 186–197. doi:10.1111/j.1469-7610.2004.00347.x
Campbell, S. B., Spieker, S., Burchinal, M., & Poe, M. D. (2006). Trajectories of aggression
from toddlerhood to age 9 predict academic and social functioning through age 12.
Journal of Child Psychology and Psychiatry, and Allied Disciplines, 47, 791–800.
doi:10.1111/j.1469-7610.2006.01636.x
Caputi, M., Lecce, S., Pagnin, A., & Banerjee, R. (2012). Longitudinal effects of theory of
mind on later peer relations: The role of prosocial behavior. Developmental Psychology,
48, 257–70. doi:10.1037/a0025402
Card, N. A., & Little, T. D. (2006). Proactive and reactive aggression in childhood and
adolescence: A meta-analysis of differential relations with psychosocial adjustment.
International Journal of Behavioral Development, 30, 466–480.
doi:10.1177/0165025406071904
Card, N. A., Stucky, B. D., Sawalani, G. M., & Little, T. D. (2008). Direct and indirect
aggression during childhood and adolescence: A meta-analytic review of gender
differences, intercorrelations , and relations to maladjustment. Child Development, 79,
1185–1229. doi:10.1111/j.1467-8624.2008.01184.x
Carlson, S. M. (2005). Developmentally sensitive measures of executive function in preschool
children. Developmental Neuropsychology, 28, 595–616.
doi:10.1207/s15326942dn2802_3

338
Carlson, S. M., Claxton, L. J., & Moses, L. J. (2013). The Relation between executive
function and theory of mind is more than skin deep. Journal of Cognition and
Development, 16, 186–197. doi:10.1080/15248372.2013.824883
Carlson, S. M., & Moses, L. J. (2001). Individual differences in inhibitory control and
children’s theory of mind. Child Development, 72, 1032–1053. doi:10.1111/1467-
8624.00333
Carlson, S. M., Moses, L. J., & Breton, C. (2002). How specific is the relation between
executive function and theory of mind? Contributions of inhibitory control and working
memory. Infant and Child Development, 11, 73–92. doi:10.1002/icd.298
Carlson, S. M., Moses, L. J., & Hix, H. R. (1998). The role of inhibitory processes in young
children’s difficulties with deception and false belief. Child Development, 69, 672–691.
doi:10.1111/j.1467-8624.1998.tb06236.x
Carlson, S., Mandell, D. J., & Williams, J. L. (2004). Executive function and theory of mind:
Stability and prediction from ages 2 to 3. Developmental Psychology, 40, 1105–1122.
doi:10.1037/0012-1649.40.6.1105
Cassidy, K. W., Werner, R. S., Rourke, M., Zubernis, L. S., College, B. M., & Balaraman, G.
(2003). The relationship between psychological understanding and positive social
behaviours. Social Development, 12, 198–221. doi:10.1111/1467-9507.00229
Cavell, T. A., Meehan, B. T., & Fiala, S. E. (2003). Assessing social competence in children
and adolescents. In C. R. Reynolds & R. W. Kamphaus (Eds.), Handbook of
psychological and educational assessment of children: Personality, behavior and context
(2nd ed., pp. 433–455). New York, USA: The Guilford Press.
Chandler, M., Sokol, B., & Hallett, D. (2001). Moral responsibility and the interpretive turn:
Children’s changing conceptions of truth and rightness. In B. Malle, L. Moses, & D.
Baldwin (Eds.), Intentions and intentionality: Foundations of social cognition (pp. 345–
366). Boston, MA: MIT Press.
Chang, L. (2004). The role of classroom norms in contextualizing the relations of children’s
social behaviors to peer acceptance. Developmental Psychology, 40, 691–702.
doi:10.1037/0012-1649.40.5.691
339
Cheah, C. S. L., Nelson, L. J., & Rubin, K. H. (2001). Nonsocial play as a risk factor in social
and emotional development. In A. Goncu & E. L. Klein (Eds.), Children in play, story
and school (pp. 39–72). New York, USA: The Guilford Press.
Chen, X., Cen, G., Li, D., & He, Y. (2005). Social functioning and adjustment in Chinese
children: The imprint of historical time. Child Development, 76, 182–95.
doi:10.1111/j.1467-8624.2005.00838.x
Cillessen, A. H. N., & Marks, P. E. L. (2011). Conceptualizing and measuring popularity. In
A. H. N. Cillessen, D. Schwartz, & L. Mayeux (Eds.), Popularity in the peer system (pp.
25–56). New York, USA: Guildford Press.
Cillessen, A. H. N., & Mayeux, L. (2004). From censure to reinforcement: Developmental
changes in the association between aggression and social status. Child Development, 75,
147–163. doi:10.1111/j.1467-8624.2004.00660.x
Cleverley, K., Szatmari, P., Vaillancourt, T., Boyle, M., & Lipman, E. (2012). Developmental
trajectories of physical and indirect aggression from late childhood to adolescence: Sex
differences and outcomes in emerging adulthood. Child and Adolescent Psychiatry, 51,
1037–1051. doi:10.1016/j.jaac.2012.07.010
Cohen, B. H. (2008). Explaining Psycholoy Statistics. New Jersey, USA: John Wiley & Sons.
Cohen, J., Cohen, P., West, S. G., & Aiken, L. S. (2003). Applied Multiple
Regression/Correlation Analysis for the Behavioural Sciences (3rd ed.). New York,
USA: Lawrence Erlbaum Associates Inc.
Coie, J. D. (1990). Toward a theory of peer rejection. In S. R. Asher & J. D. Coie (Eds.), Peer
rejection in childhood (pp. 365–402). Cambridge: Cambridge University Press.
Coie, J. D., & Dodge, K. A. (1988). Multiple sources of data on social behavior and social
status in the school: A cross-age comparison. Child Development, 59, 815–829.
doi:10.1111/j.1467-8624.1988.tb03237.x
Coie, J. D., & Dodge, K. A. (1998). Aggression and antisocial behavior. In N. Eisenberg &
W. Damon (Eds.), Handbook of Child Psychology: Vol 3. Social, emotional, and
personality development (5th ed., pp. 779–862). New York, USA: Wiley.
340
Coie, J. D., Dodge, K. A., & Coppotelli, H. (1982). Dimensions and types of social status: A
cross-age perspective. Developmental Psychology, 18, 557–570. doi:10.1037//0012-
1649.18.4.557
Coie, J. D., Lochman, J. E., Terry, R., & Hyman, C. (1992). Predicting early adolescent
disorder from childhood aggression and peer rejection. Journal of Consulting and
Clinical Psychology, 60, 783–792. doi:10.1037//0022-006x.60.5.783
Colins, O. F. (2016). Assessing reactive and proactive aggression in detained adolescents
outside of a research context. Child Psychiatry and Human Development, 47, 159–172.
doi:10.1007/s10578-015-0553-z
Condry, J. C., & Ross, D. F. (1985). Sex and aggression: The influence of gender label on the
perception of aggression in children. Child Development, 56, 225–233.
doi:10.2307/1130189
Connor, D. F., Steingard, R. J., Cunningham, J. A, Anderson, J. J., & Melloni, R. H. (2004).
Proactive and reactive aggression in referred children and adolescents. The American
Journal of Orthopsychiatry, 74, 129–136. doi:10.1037/0002-9432.74.2.129
Crick, N. R. (1996). The role of overt aggression, relational aggression, and prosocial
behaviour in the prediction of children’s future social adjustment. Child Development,
67, 2317–2327. doi:10.1111/j.1467-8624.1996.tb01859.x
Crick, N. R., Casas, J. F., & Ku, H. C. (1999). Relational and physical forms of peer
victimization in preschool. Developmental Psychology, 35, 376–85. doi:10.1037/0012-
1649.35.2.376
Crick, N. R., Casas, J. F., & Mosher, M. (1997). Relational and overt aggression in preschool.
Developmental Psychology, 33, 579–588. doi:10.1037/0012-1649.33.4.579
Crick, N. R., & Dodge, K. A. (1996). Social information-processing mechanisms on reactive
and proactive aggression. Child Development, 67, 993–1002. doi: 10.2307/1131875
Crick, N. R., & Grotpeter, J. K. (1995). Relational aggression, gender, and social-
psychological adjustment. Child Development, 66, 710–722. doi:10.1111/j.1467-
8624.1995.tb00900.x.

341
Crick, N. R., & Ladd, G. W. (1989). Nominator attrition: Does it affect the accuracy of
children’s sociometric classifications? Merrill-Palmer Quarterly, 35, 197–207.
Crick, N. R., Ostrov, J. M., & Werner, N. E. (2006). A longitudinal study of relational
aggression, physical aggression, and children’s social-psychological adjustment. Journal
of Abnormal Child Psychology, 34, 131–142. doi:10.1007/s10802-005-9009-4
Crone, E. A., & van der Molen, M. W. (2010). Developmental changes in real life decision
making: Performance on a gambling task previously shown to depend on the
ventromedial prefrontal cortex. Developmental Neuropsychology, 25, 251–279.
doi:10.1207/s15326942dn2503
Cuevas, K., Deater-Deckard, K., Kim-Spoon, J., Wang, Z., Morasch, K. C., & Bell, M. A.
(2014). A longitudinal intergenerational analysis of executive functions during early
childhood. The British Journal of Developmental Psychology, 32, 50–64.
doi:10.1111/bjdp.12021
Cui, L., Colasante, T., Malti, T., Ribeaud, D., & Eisner, M. P. (2015). Dual trajectories of
reactive and proactive aggression from mid-childhood to early adolescence: Relations to
sensation seeking, risk taking, and moral reasoning. Journal of Abnormal Child
Psychology, 663–675. doi:10.1007/s10802-015-0079-7
Culbertson, W. C., & Zillmer, E. A. (1998). The Tower of London(DX): A standardized
approach to assessing executive functioning in children. Archives of Clinical
Neuropsychology, 13, 285–301. doi: 10.1016/s0887-6177(97)00033-4
Damasio, A., Anderson, S. W., & Tranel, D. (2011). The frontal lobes. In K. M. Heilman &
E. Valenstein (Eds.), Clinical neuropsychology (pp. 417–465). New York, USA: Oxford
University Press.
Dane, A. V., & Marini, Z. A. (2014). Overt and relational forms of reactive aggression in
adolescents: Relations with temperamental reactivity and self-regulation. Personality and
Individual Differences, 60, 60–66. doi:10.1016/j.paid.2013.12.021
De Luca, C. R., & Leventer, R. J. (2008). Developmental trajectories of executive functions
across the lifespan. In V. Anderson, R. Jacobs, & P. J. Anderson (Eds.), Executive

342
functions and the frontal lobes: A lifespan perspective (pp. 23–57). New York, USA:
Psychology Press.
Deković, M., & Gerris, J. R. M. (1994). Developmental analysis of social cognitive and
behavioural differences between popular and rejected children. Journal of Applied
Developmental Psychology, 15, 367–386. doi:10.1016/0193-3973(94)90038-8
Della Salla, S., Gray, C., Spinnler, H., & Trivelli, C. (1998). Frontal lobe functioning in man:
The riddle revisited. Archives of Clinical Neuropsychology, 13, 663–682.
doi:10.1016/S0887-6177(97)00093-0
Denham, S. A., & Holt, R. W. (1993). Preschoolers’ likability as cause or consequence of
their social behavior. Developmental Psychology, 29, 271–275. doi:10.1037/0012-
1649.29.2.271
Devine, R. T., & Hughes, C. (2013). Silent films and strange stories: Theory of mind, gender,
and social experiences in middle childhood. Child Development, 84, 989–1003.
doi:10.1111/cdev.12017
Devine, R. T., & Hughes, C. (2014). Relations between false belief understanding and
executive function in early childhood: A meta-analysis. Child Development, 85, 1777–
1794. doi:10.1111/cdev.12237
Di Norcia, A., Pecora, G., Bombi, A. S., Baumgartner, E., & Laghi, F. (2014). Hot and cool
inhibitory control in Italian toddlers: Associations with social competence and behavioral
problems. Journal of Child and Family Studies, 24, 909–914. doi:10.1007/s10826-014-
9901-z
Diamantopoulou, S., Rydell, A., Thorell, L. B., & Bohlin, G. (2007). Impact of executive
functioning and symptoms of Attention Deficit Hyperactivity Disorder on children’s peer
relations and school performance, Developmental Neuropsychology,32, 521–542. doi:
10.1080/87565640701360981
Diamond, A. (2006). The early development of executive functions. In E. Bialystok & F. I.
M. Craik (Eds.), Lifespan cognition: Mechanisms of change (pp. 70–95). Oxford: Oxford
University Press.
343
Dickson, D. J., Richmond, A. D., Brendgen, M., Vitaro, F., Laursen, B., Dionne, G., &
Boivin, M. (2015). Aggression can be contagious: Longitudinal associations between
proactive aggression and reactive aggression among young twins. Aggressive Behavior,
41, 455–466. doi:10.1002/ab.21582
Diesendruck, G., & Ben-Eliyahu, A. (2006). The relationships among social cognition, peer
acceptance, and social behavior in Israeli kindergarteners. International Journal of
Behavioral Development, 30, 137–147. doi:10.1177/0165025406063628
Dishion, T., McCord, J., & Poulin, F. (1999). When Interventions Harm. American
Psychologist, 54, 755–764. doi:10.1037/0003-066X.54.9.755
Dodge, K. A, Lochman, J. E., Harnish, J. D., Bates, J. E., & Pettit, G. S. (1997). Reactive and
proactive aggression in school children and psychiatrically impaired chronically
assaultive youth. Journal of Abnormal Psychology, 106, 37–51. doi:10.1037/0021-
843X.106.1.37
Dodge, K. A. (1991). The structure and function of reactive and proactive aggression. In D. J.
Pepler & K. H. Rubin (Eds.), The development and treatment of childhood aggression
(pp. 201–215). Hillsdale, New Jersey: Lawrence Erlbaum Associates Inc.
Dodge, K. A., & Coie, J. D. (1987). Social-information-processing factors in reactive and
proactive aggression in children’s peer groups. Journal of Personality and Social
Psychology, 53, 1146–1158. doi:10.1037//0022-3514.53.6.1146
Dodge, K. A., Lansford, J. E., Burks, V. S., Bates, J. E., Pettit, G. S., Fontaine, R., & Price, J.
M. (2003). Peer rejection and social information-processing factors in the development
of aggressive behavior problems in children. Child Development, 74, 374–393.
doi:10.1111/1467-8624.7402004
Dolan, M., & Lennox, C. (2013). Cool and hot executive function in conduct-disordered
adolescents with and without co-morbid attention deficit hyperactivity disorder:
Relationships with externalizing behaviours. Psychological Medicine, 43, 2427–2436.
doi:10.1017/S0033291712003078
Doll, B. (1996). Children without friends: Implications for practice and policy. School
Psychology Review, 25(2), 165–183.
344
Dollard, J., Doob, L. W., Miller, N. E., Mowrer, O. H., & Sears, R. R. (1939). Frustration and
Aggression. New Haven, CT: Yale Univeristy Press.
Ducan, S. C., & Duncan, T. E. (2012). Accelerated longitudinal designs. In B. Laursen, T. D.
Little, & N. A. Card (Eds.), Handbook of developmental research methods (pp. 31 – 46).
New York, USA: The Guilford Press.
Dunn, J. (1994). Changing minds and changing relationships. In C. Lewis & P. Mitchell
(Eds.), Origins of an understanding of mind (pp. 297–310). Hillsdale, NJ: Lawrence
Erlbaum Associates Inc.
Dunn, L. M., Whetton, C., & Pintilie, D. (1982). British Picture Vocabulary Scale. Windsor,
UK: NFER-Nelson.
Department for Education (2014). School and college performance tables. UK.
Eggum, N. D., Eisenberg, N., Kao, K., Spinrad, T. L., Bolnick, R., Hofer, C., … Fabricius, W.
V. (2011). Emotion understanding, theory of mind, and prosocial orientation: Relations
over time in early childhood. The Journal of Positive Psychology, 6, 4–16.
doi:10.1080/17439760.2010.536776
Eisenberg, N. (1990). Prosocial development in early and mid-adolescence. In R.
Montemayor, G. R. Adams, & T. P. Gullotta (Eds.), From childhood to adolescence: A
transitional period? (pp. 240–269). Newbury Park, California: Sage Publications.
Eisenberg, N., Fabes, R. A., Murphy, B. C., Maszk, P., Smith, M., & Karbon, M. (1995). The
role of emotionality and regulation in children’s social functioning: a longitudinal study.
Child Development, 66, 1360–1384. doi:10.2307/1131652
Eisenberg, N., Spinrad, T. L., & Knafo-Noam, A. (2015). Prosocial development. In M. E.
Lamb & R. M. Lerner (Eds.), Handbook of child psychology and developmental science:
Volume 3 socioemotional processes (pp. 610–656). New Jersey, USA: John Wiley &
Sons.
Eivers, A. R., Brendgen, M., Vitaro, F., & Borge, A. I. H. (2012). Concurrent and longitudinal
links between children’s and their friends' antisocial and prosocial behavior in preschool.
Early Childhood Research Quarterly, 27, 137–146. doi:10.1016/j.ecresq.2011.05.001

345
Ellickson, P. L., & Hawes, J. A. (1989). An assessment of active versus passive methods for
obtaining parental consent. Evaluation Review, 13, 45–55.
doi:10.1177/0193841x8901300104
Espy, K. A., McDiarmid, M. M., Cwik, M. F., Stalets, M. M., Hamby, A., & Senn, T. E.
(2004). The contribution of executive functions to emergent mathematic skills in
preschool children. Developmental Neuropsychology, 26, 465–486.
doi:10.1207/s15326942dn2601_6
Espy, K. A., Sheffield, T. D., Wiebe, S. A., Clark, C. A. C., & Moehr, M. J. (2011). Executive
control and dimensions of problem behaviors in preschool children. Journal of Child
Psychology and Psychiatry, 52, 33–46. doi:10.1111/j.1469-7610.2010.02265.x
Ettekal, I., & Ladd, G. W. (2015). Developmental pathways from childhood aggression-
disruptiveness, chronic peer rejection, and deviant friendships to early-adolescent rule
breaking. Child Development, 86, 614–631. doi:10.1111/cdev.12321
Evans, S. C., Fite, P. J., Hendrickson, M. L., Rubens, S. L., & Mages, A. K. (2015). The Role
of reactive aggression in the link between hyperactive/impulsive behaviors and peer
rejection in adolescents. Child Psychiatry and Human Development, 46, 903–912.
doi:10.1007/s10578-014-0530-y
Fabes, R. A., & Eisenberg, N. (1998). Meta-analyses of age and sex differences in children’s
and adolescents' prosocial behavior. In W. Damon (Ed.), Handbook of child psychology:
Volume 3 social, emotional and personality development. New Jersey, USA: John Wiley
& Sons.
Fahie, C. M., & Symons, D. K. (2003). Executive functioning and theory of mind in children
clinically referred for attention and behavior problems. Journal of Applied
Developmental Psychology, 24, 51–73. doi:10.1016/S0193-3973(03)00024-8
Farver, J. A. M., & Branstetter, W. H. (1994). Preschoolers’ prosocial responses to their peers'
distress. Developmental Psychology, 30, 334–341. doi:10.1037/0012-1649.30.3.334
Field, A. (2013). Discovering Statistics Using IMB SPSS Statistics (4th ed.). London: Sage
Publications.

346
Fite, P. J., Colder, C. R., Lochman, J. E., & Wells, K. C. (2008). Developmental trajectories
of proactive and reactive aggression from fifth to ninth grade. Journal of Clinical Child
and Adolescent Psychology, 37, 412–421. doi:10.1080/15374410801955920
Fite, P. J., Rubens, S. L., Preddy, T. M., Raine, A., & Pardini, D. A. (2014).
Reactive/proactive aggression and the development of internalizing problems in males:
the moderating effect of parent and peer relationships. Aggressive Behavior, 40, 69–78.
doi:10.1002/ab.21498
Flavell, J. H. (2004). Theory-of-mind developnnent: Retrospect and prospect. Merrill-Palmer
Quarterly, 50, 274–290. doi:10.1353/mpq.2004.0018
Fonseca, R., Zimmermann, N., Cotrena, C., Cardoso, C., Kristensen, C., & Oliveira, R.
(2012). Neuropsychological assessment of executive functions in traumatic brain injury:
Hot and cold components. Psychology and Neuroscience, 5, 183–190.
doi:10.3922/j.psns.2012.2.08
Fonzi, A., Schneider, B. H., Tani, F., & Tomada, G. (1997). Predicting children’s friendship
status from their dyadic interaction in structured situations of potential conflict. Child
Development, 68, 496–506. doi:10.2307/1131674
Frey, K. S., Newman, J. B., & Onyewuenyi, A. C. (2013). Aggressive forms and functions on
school playgrounds: Profile variations in interaction styles, bystander actions, and
victimization. The Journal of Early Adolescence, 34, 285–310.
doi:10.1177/0272431613496638
Fuhs, M. W., & Day, J. D. (2011). Verbal ability and executive functioning development in
preschoolers at head start. Developmental Psychology, 47, 404–16.
doi:10.1037/a0021065
Fuster, J. M. (1993). Frontal lobes. Current Opinion in Neurobiology, 3, 160–165.
doi:10.1016/0959-4388(93)90204-C
Fuster, J. M. (2002). Frontal lobe and cognitive development. Journal of Neurocytology, 31,
373–385. doi:10.1023/A:1024190429920

347
Galen, B. R., & Underwood, M. K. (1997). A developmental investigation of social
aggression among children. Developmental Psychology, 33, 589–600.
doi:10.1037//0012-1649.33.4.589
Garner, P. W., & Waajid, B. (2012). Emotion knowledge and self-regulation as predictors of
preschoolers’ cognitive ability, classroom behavior, and social competence. Journal of
Psychoeducational Assessment, 30, 330–343. doi:10.1177/0734282912449441
Garon, N., Bryson, S. E., & Smith, I. M. (2008). Executive function in preschoolers: A review
using an integrative framework. Psychological Bulletin, 134, 31–60. doi:10.1037/0033-
2909.134.1.31
Gentile, J. P., & Gellig, P. M. (2012). Aggression. In P. M. Gellig & J. P. Gentile (Eds.),
Psychiatry of iItellectual disability (pp. 210–249). Oxford: Wiley.
Gini, G. (2006). Social cognition and moral cognition in bullying: What’s wrong? Aggressive
Behavior, 32, 528–539. doi:10.1002/ab.20153
Gioia, G. A., Isquith, P. K., & Guy, S. C. (2001). Assessment of executive functions in
children with neurological impairment. In R. J. Simeonsson & L. Rosenthal (Eds.),
Psychological and developmental assessment: Children with disabilities and chronic
conditions (pp. 317–356). New York, USA: Guildford Press.
Gioia, G. A., Isquith, P. K., Guy, S. C., & Kenworthy, L. (2000). Behavior rating inventory of
executive function. Child Neuropsychology, 6, 235–238. doi:10.1076/chin.6.3.235.3152
Gioia, G. A., Isquith, P. K., Retzlaff, P. D., & Espy, K. a. (2002). Confirmatory factor
analysis of the Behavior Rating Inventory of Executive Function (BRIEF) in a clinical
sample. Child Neuropsychology, 8, 249–257. doi:10.1076/chin.8.4.249.13513
Goldman, A. I. (1993). The psychology of folk psychology. Behavioral and Brain Sciences,
16(1), 15–28. doi:10.1017/S0140525X00028648
Goldstein, S. E., & Tisak, M. S. (2006). Early Adolescents’ Conceptions of Parental and
Friend Authority Over Relational Aggression. The Journal of Early Adolescence, 26,
344–364. doi:10.1177/0272431606288552
348
Goldstein, S., Naglieri, J. A., Princoptta, D., & Otero, T. M. (2014). Introduction: A history of
executive functioning as a theoretical and clinical construct. In S. Goldstein & J. A.
Naglieri (Eds.), Handbook of executive functioning (pp. 3–13). New York, USA:
Springer.
Gomes, L., & Livesey, D. (2008). Exploring the link between impulsivity and peer relations
in 5- and 6-year-old children. Child: Care, Health and Development, 34, 763–770.
doi:10.1111/j.1365-2214.2008.00878.x
Gomez-Garibello, C., & Talwar, V. (2015). Can you read my mind? Age as a moderator in
the relationship between theory of mind and relational aggression. International Journal
of Behavioral Development, 39, 552–559. doi:10.1177/0165025415580805
Grant, C. M., Grayson, A., & Boucher, J. (2001). Using tests of false belief with children with
autism: How valid and reliable are they? Autism, 5, 135–145.
doi:10.1177/1362361301005002004
Gray, S. A. O., Carter, A. S., Briggs-gowan, M. J., Jones, S. M., & Wagmiller, R. L. (2014).
Growth trajectories of early aggression, overactivity, and inattention: Relations to
second-grade reading. Developmental Psychology, 50, 2255–2263.
doi:10.1037/a0037367
Greener, S. H. (2000). Peer assessment of children’s prosocial behaviour. Journal of Moral
Education, 29, 47–60. doi:10.1080/030572400102925
Grotpeter, J. K., & Crick, N. R. (1996). Relational aggression, overt aggression, and
friendship. Child Development, 67, 2328–2338. doi:10.2307/1131626
Gur, R. C., Richard, J., Calkins, M. E., Chiavacci, R., Hansen, J. A., Bilker, W. B., … Gur, R.
E. (2012). Age group and sex differences in performance on a computerized
neurocognitive battery in children age 8-21. Neuropsychology, 26, 251–65.
doi:10.1037/a0026712
Hamm, J. V. (2000). Do birds of a feather flock together? The variable bases for African
American, Asian American, and European American adolescents’ selection of similar
friends. Developmental Psychology, 36, 209–219. doi:10.1037/0012-1649.36.2.209
349
Happaney, K., Zelazo, P. D., & Stuss, D. T. (2004). Development of orbitofrontal function:
Current themes and future directions. Brain and Cognition, 55, 1–10.
doi:10.1016/j.bandc.2004.01.001
Happé, F. G. E. (1994). An advanced test of theory of mind: Understanding of story
characters’ thoughts and feelings by able autistic, mentally handicapped, and normal
children and adults. Journal of Autism and Developmental Disorders, 24, 129–154.
doi:10.1007/BF02172093
Hartas, D. (2011). Children’s language and behavioural, social and emotional difficulties and
prosocial behaviour during the toddler years and at school entry. British Journal of
Special Education, 38, 83–91. doi:10.1111/j.1467-8578.2011.00507.x
Hartup, W. W. (1974). Aggression in childhood: Developmental perspectives. American
Psychologist, 29, 336–341. doi:10.1037/h0037622
Hartup, W. W. (1992). Peer relations in early and middle childhood. In V. B. Van Hasselt &
M. Hersen (Eds.), Handbook of social development: A lifespan perspective (pp. 257–
281). New York, USA: Plenun.
Hawley, P. H. (2002). Social dominance and prosocial and coercive strategies of resource
control in preschoolers. International Journal of Behavioral Development, 26, 167–176.
doi:10.1080/01650250042000726
Hawley, P. H. (2003). Prosocial and coercive configurations of resource control in early
adolescence: A case for the well-adapted machiavellian. Merrill-Palmer Quarterly,
49(3), 279–309. doi:10.1353/mpq.2003.0013
Hawley, P. H., & Little, T. D. (1999). On winning some and losing some: A social relations
approach to social dominance in toddlers. Merrill-Palmer Quarterly, 45, 185–214.
Hawley, P. H., Little, T. D., & Card, N. A. (2007). The allure of a mean friend: Relationship
quality and processes of aggressive adolescents with prosocial skills. International
Journal of Behavioral Development, 31, 170–180. doi:10.1177/0165025407074630
Hay, D. F. (1994). Prosocial development. Child Psychology and Psychiatry and Allied
Disciplines, 35, 29–71. doi:10.1111/j.1469-7610.1994.tb01132.x
350
Hay, D. F., Nash, A., Caplan, M., Swartzentruber, J., Ishikawa, F., & Vespo, J. E. (2011). The
emergence of gender differences in physical aggression in the context of conflict
between young peers. British Journal of Developmental Psychology, 29, 158–75.
doi:10.1111/j.2044-835X.2011.02028.x
Heilbron, N., & Prinstein, M. J. (2008). A review and reconceptualization of social
aggression: Adaptive and maladaptive correlates. Clinical Child and Family Psychology
Review, 11, 176–217. doi:10.1007/s10567-008-0037-9
Heilman, R. M., Miu, A. C., & Benga, O. (2009). Developmental and sex-related differences
in preschoolers’ affective decision making. Child Neuropsychology, 15, 73–84.
doi:10.1080/09297040802266436
Hinson, J. M., Jameson, T. L., & Whitney, P. (2003). Impulsive decision making and working
memory. Journal of Experimental Psychology: Learning, Memory, and Cognition, 29,
298–306. doi:10.1037/0278-7393.29.2.298
Hintze, J. M. (2005). Psychometrics of direct observation. School Psychology Review, 34,
507–519.
Hintze, J. M., & Matthews, W. J. (2004). The generalizability of systematic direct
observations across time and setting: A preliminary investigation of the psychometrics of
behavioral observation. School Psychology Review, 33, 258–270.
Hirvonen, R., Poikkeus, A., Pakarinen, E., Lerkkanen, M., & Nurmi, J. (2015). Identifying
Finnish children’s impulsivity trajectories from kindergarten to grade 4: Associations
with academic and socioemotional development. Early Education and Development, 26,
615–644. doi:10.1080/10409289.2015.1012190
Hobson, C. W., Scott, S., & Rubia, K. (2011). Investigation of cool and hot executive
function in ODD/CD independently of ADHD. Journal of Child Psychology and
Psychiatry, and Allied Disciplines, 52, 1035–43. doi:10.1111/j.1469-7610.2011.02454.x
Holmes, C. J., Kim-Spoon, J., & Deater-Deckard, K. (2015). Linking executive function and
peer problems from early childhood through middle adolescence. Journal of Abnormal
Child Psychology, 44, 31–42. doi:10.1007/s10802-015-0044-5
351
Hongwanishkul, D., Happaney, K. R., Lee, W. S. C., & Zelazo, P. D. (2005). Assessment of
hot and cool executive function in young children: Age-related changes and individual
differences. Developmental Neuropsychology, 28, 617–44.
doi:10.1207/s15326942dn2802_4
Hubbard, J. A., McAuliffe, M. D., Morrow, M. T., & Romano, L. J. (2010). Reactive and
proactive aggression in childhood and adolescence: precursors, outcomes, processes,
experiences, and measurement. Journal of Personality, 78, 95–118. doi:10.1111/j.1467-
6494.2009.00610.x
Hubbard, J. A., Smithmyer, C. M., Ramsden, S. R., Parker, E. H., Flanagan, K. D., Dearing,
K. F., … Simons, R. F. (2002). Observational, physiological, and self-report measures of
children’s anger: relations to reactive versus proactive aggression. Child Development,
73, 1101–1118. doi:10.1111/1467-8624.00460
Hughes, C. (1998a). Executive function in preschoolers: Links with theory of mind and verbal
ability. British Journal of Developmental Psychology, 16, 233–253. doi:10.1111/j.2044-
835x.1998.tb00921.x
Hughes, C. (1998b). Finding your marbles: Does preschoolers’ strategic behaviour predict
later understanding of mind? Developmental Psychology, 34, 1326–1339.
doi:10.1037//0012-1649.34.6.1326
Hughes, C. (2001). Executive dysfunction in autism: Its nature and implications for the
everyday problems experienced by individuals with autism. In J. Burack, T. Charman, N.
Yirmiya, & P. Zelazo (Eds.), The development of autism (pp. 255 – 274). Mahwah, New
Jesrsey: Erlbaum.
Hughes, C. (2011). Social Understanding and Social lives: From Toddlerhood through to the
Transition to School. Hove, UK: Psychology Press.
Hughes, C., Adlam, A., Happé, F., Jackson, J., Taylor, A., & Caspi, A. (2000). Good test-
retest reliability for standard and advanced false-belief tasks across a wide range of
abilities. Journal of Child Psychology and Psychiatry, and Allied Disciplines, 41, 483–
490. doi:10.1111/1469-7610.00633
352
Hughes, C., & Dunn, J. (1998). Understanding mind and emotion : Longitudinal associations
with mental-state talk between young friends, Developmental Psychology, 34, 1026–
1037. doi: 10.1037//0012-1649.34.5.1026
Hughes, C., Dunn, J., & White, A. (1998). Trick or treat?: Uneven understanding of mind and
emotion and executive dysfunction in “ hard-to-manage” preschoolers. Journal of Child
Psychology and Psychiatry, 39, 981–994. doi:10.1111/1469-7610.00401
Hughes, C., & Ensor, R. (2006). Behavioural problems in 2-year-olds: Links with individual
differences in theory of mind, executive function and harsh parenting. Journal of Child
Psychology and Psychiatry, and Allied Disciplines, 47, 488–97. doi:10.1111/j.1469-
7610.2005.01519.x
Hughes, C., & Ensor, R. (2007). Executive function and theory of mind: Predictive relations
from ages 2 to 4. Developmental Psychology, 43, 1447–1459. doi:10.1037/0012-
1649.43.6.1447
Hughes, C., & Ensor, R. (2008). Does executive function matter for preschoolers’ problem
behaviors? Journal of Abnormal Child Psychology, 36, 1–14. doi:10.1007/s10802-007-
9107-6
Hughes, C., & Ensor, R. (2010). Do early social cognition and executive function predict
individual differences in preschoolers prosocial and antisocial behaviour? In B. W.
Sokol, U. Müller, J. I. M. Carpendale, A. R. Young, & G. Larocci (Eds.), Self and social
regulation: Social interaction and the development of social understanding and
executive functions (pp. 418–443). New York, USA: Oxford University Press.
Hughes, C., & Ensor, R. (2011). Individual differences in growth in executive function across
the transition to school predict externalizing and internalizing behaviors and self-
perceived academic success at 6 years of age. Journal of Experimental Child
Psychology, 108, 663–76. doi:10.1016/j.jecp.2010.06.005
Hughes, C., Ensor, R., Wilson, A., & Graham, A. (2010). Tracking executive function across
the transition to school: a latent variable approach. Developmental Neuropsychology, 35,
20–36. doi:10.1080/87565640903325691

353
Hughes, C., & Leekam, S. (2004). What are the links between theory of mind and social
relations? Review, reflections and new directions for studies of typical and atypical
development. Social Development, 13, 590–619. doi:10.1111/j.1467-9507.2004.00285.x
Hughes, C., White, A., Sharpen, J., & Dunn, J. (2000). Antisocial, angry, and unsympathetic:
“hard-to-manage” preschoolers’ peer problems and possible cognitive influences.
Journal of Child Psychology and Psychiatry, and Allied Disciplines, 41, 169–179.
doi:10.1111/1469-7610.00558
Hummer, T. A., Wang, Y., Kronenberger, W. G., Dunn, D. W., & Mathews, V. P. (2015).
The relationship of brain structure to age and executive functioning in adolescent
disruptive behavior disorder. Psychiatry Research, 231, 210–7.
doi:10.1016/j.pscychresns.2014.11.009
Hymel, S., Wagner, E., & Butler, L. (1990). Reputational bias: View from the peer group. In
S. R. Asher & J. D. Coie (Eds.), Peer rejection in childhood (pp. 156–188). New York,
USA: Cambridge University Press.
IBM SPSS Statistics for Windows, Version 22.0. (2013). Armonk, NY: IMB Corp.
Infante, D. A., & Wigley, C. J. (1986). Verbal aggressiveness: An interpersonal model and
measure. Communication Monographs, 53, 61–69. doi:10.1080/03637758609376126
Isquith, P. K., Crawford, J. S., Espy, K. A., & Gioia, G. A. (2005). Assessment of executive
function in preschool-aged children. Mental Retardation and Developmental Disabilities
Research Reviews, 11, 209–215. doi:10.1002/mrdd.20075
Isquith, P. K., Gioia, G. A., & Espy, K. A. (2004). Executive function in preschool children:
Examination through everyday behavior. Developmental Neuropsychology, 26, 403–422.
doi:10.1207/s15326942dn2601_3
Jackson, M., & Tisak, M. S. (2001). Is prosocial behaviour a good thing? Developmental
changes in children’s evaluations of helping, sharing, cooperating, and comforting.
British Journal of Developmental Psychology, 19, 349–367.
doi:10.1348/026151001166146

354
Jacobson, L. A., Williford, A. P., & Pianta, R. C. (2011). The role of executive function in
children’s competent adjustment to middle school. Child Neuropsychology, 17, 255–80.
doi:10.1080/09297049.2010.535654
Kaat, A. J., Farmer, C. A., Gadow, K. D., Findling, R. L., Bukstein, O. G., Arnold, L. E., …
Aman, M. G. (2014). Factor validity of a proactive and reactive aggression rating scale.
Journal of Child and Family Studies, 24, 2734–2744. doi:10.1007/s10826-014-0075-5
Kakavoulis, A. (1998). Aggressive and prosocial behaviour in young Greek children.
International Journal of Early Years Education, 6, 343–350.
doi:10.1080/0966976980060308
Karmiloff-Smith, A. (1992). Beyond modularity: A developmental perspective on cognitive
science. Cambridge, MA: MIT Press.
Kaukiainen, A., Björkqvist, K., Lagerspetz, K., Österman, K., Salmivalli, C., Rothberg, S., &
Ahlbom, A. (1999). The relationships between social intelligence, empathy, and three
types of aggression. Aggressive Behavior, 25, 81–89. doi:10.1002/(SICI)1098-2337
Kawabata, Y., & Crick, N. R. (2013). Relational and physical aggression, peer victimization,
and adjustment problems in Asian American and European American children. Asian
American Journal of Psychology, 4, 211–216. doi:10.1037/a0031205
Kawabata, Y., Tseng, W. L., Murray-Close, D., & Crick, N. R. (2012). Developmental
trajectories of chinese children’s relational and physical aggression: Associations with
social-psychological adjustment problems. Journal of Abnormal Child Psychology, 40,
1087–1097. doi:10.1007/s10802-012-9633-8
Kaysili, B. K. (2011). The development of theory of mind according to false belief
performance of children ages 3 to 5. Educational Sciences: Theory and Practice, 11,
1821–1826.
Kelley, K., & Maxwell, S. E. (2010). Multiple regression. In G. R. Hancock & R. O. Mueller
(Eds.), The reviewers guide to quantitative methods in the social sciences (pp. 281–299).
New York, USA: Routledge.
Kempes, M., Matthys, W., de Vries, H., & van Engeland, H. (2005). Reactive and proactive
aggression in children: A review of theory, findings and the relevance for child and
355
adolescent psychiatry. European Child & Adolescent Psychiatry, 14, 11–19.
doi:10.1007/s00787-005-0432-4
Kerr, A., & Zelazo, P. D. (2004). Development of “hot” executive function: the children’s
gambling task. Brain and Cognition, 55, 148–57. doi:10.1016/S0278-2626(03)00275-6
Kim, S., Nordling, J. K., Yoon, J. E., Boldt, L. J., & Kochanska, G. (2014). Effortful control
in “hot” and “cool” tasks differentially predicts children’s behaviour problems and
academic performance. Journal of Abnormal Child Psychology, 41, 43–56.
doi:10.1007/s10802-012-9661-4
Kochanska, G., Murray, K., Jacques, T. Y., Koenig, A. L., & Vandegeest, K. A. (1996).
Inhibitory control in young children and its role in emerging internalization. Child
Development, 67, 490–507. doi:10.2307/1131828
Kochanska, G., Murray, K. T., & Harlan, E. T. (2000). Effortful control in early childhood:
continuity and change, antecedents, and implications for social development.
Developmental Psychology, 36, 220–32. doi:10.2307/1131828
Kofler, M. J., McCart, M. R., Zajac, K., Ruggiero, K. J., Saunders, B. E., & Kilpatrick, D. G.
(2011). Depression and delinquency covariation in an accelerated longitudinal sample of
adolescents. Journal of Consulting and Clinical Psychology, 79, 458–69.
doi:10.1037/a0024108
Krahè, B. (2013). Defining and measuring aggression. In The Social Psychology of
Aggression (2nd ed., pp. 7–33). Hove, UK: Psychology Press.
Lagerspetz, K. M. J., Björkqvist, K., & Peltonen, T. (1988). Is indirect aggression typical of
females? Gender differences in aggressiveness in 11- to 12- year-old children.
Aggressive Behavior, 14, 403–414. doi:10.1002/1098-2337
Laible, D. J., Murphy, T. P., & Augustine, M. (2014). Adolescents’ aggressive and prosocial
behaviors: links with social information processing, negative emotionality, moral affect,
and moral cognition. The Journal of Genetic Psychology, 175(3-4), 270–286.
doi:10.1080/00221325.2014.885878
Lalonde, C. E., & Chandler, M. J. (2002). Children’s understanding of interpretation. New
Ideas in Psychology, 20, 163–198. doi:10.1016/S0732-118X(02)00007-7
356
Lane, J. D., Wellman, H. M., Olson, S. L., LaBounty, J., & Kerr, D. C. R. (2010). Theory of
mind and emotion understanding predict moral development in early childhood. British
Journal of Developmental Psychology, 28, 871–889. doi:10.1348/026151009X483056
Lansford, J. E., Skinner, A. T., Sorbring, E., Di Giunta, L., Deater-Deckard, K., Dodge, K. A.,
… Chang, L. (2012). Boys’ and girls' relational and physical aggression in nine
countries. Aggressive Behavior, 38, 298–308. doi:10.1002/ab.21433
Lee, S-H., Smith, P. K., & Monks, C. P. (2016). Participant roles in peer victimisation among
young children in South Korea: Peer-, self- and teacher-nominations. Aggressive
Behavior, 42, 287–298. doi: 10.1002/ab.21623
Leekam, S. R., & Perner, J. (1991). Does the autistic child have a metarepresentational
deficit? Cognition, 40, 203–218. doi:10.1016/0010-0277(91)90025-Y
Lehto, J. E., Juujärvi, P., Kooistra, L., & Pulkkinen, L. (2003). Dimensions of executive
functioning: Evidence from children. British Journal of Developmental Psychology, 21,
59–80. doi:10.1348/026151003321164627
Leman, P., Bremner, A., Parke, R. D., & Gauvain, M. (2012). Developmental Psychology.
Berkshire, UK: McGraw Hill.
Lezak, M. D. (1982). The problem of assessing executive functions. International Journal of
Psychology, 17, 281–297. doi:10.1080/00207598208247445
Little, T. D. (2013). The Oxford Handbook of Quantitative Methods: Volume 1 Foundations.
Oxford: Oxford University Press.
Little, T. D., Brauner, J., Jones, S. M., Matthew, K., & Hawiey, P. H. (2003). Rethinking
aggression: A typological examination of the functions of aggression. Merrill-Palmer
Quarterly, 4, 343–369. doi:10.1353/mpq.2003.0014
Lizhu, Y., & Jiangyang, W. (2007). A follow-up study of self-imposed delay of gratification
at age 4 as a predictor of children’s school-based social competences at age 9. Acta
Psychologica Sinica, 39, 668–678.

357
Lonigro, A., Laghi, F., Baiocco, R., & Baumgartner, E. (2013). Mind reading skills and
empathy: Evidence for nice and nasty ToM behaviours in school-aged children. Journal
of Child and Family Studies, 23, 581–590. doi:10.1007/s10826-013-9722-5
Losel, F., Bliesener, T., & Bender, D. (2007). Social information processing, experiences of
aggression in social contexts, and aggressive behavior in adolescents. Criminal Justice
and Behavior, 34, 330–347. doi:10.1177/0093854806295833
Lough, S., Gregory, C., & Hodges, J. R. (2001). Dissociation of social cognition and
executive function in frontal variant frontotemporal dementia. Neurocase : Case Studies
in Neuropsychology, Neuropsychiatry, and Behavioural Neurology, 7, 123–130.
doi:10.1093/neucas/7.2.123
Lussier, P., Corrado, R., & Tzoumakis, S. (2012). Gender differences in physical aggression
and associated developmental correlates in a sample of Canadian preschoolers.
Behavioural Sciences and Law, 30, 643–671. doi:10.1002/bsl.2035
Mahone, E. M., & Slomine, B. S. (2007). Managing Dysecutive Disorders. In S. J. Hunter &
J. Donders (Eds.), Pediatric Neuropsychological Intervention (pp. 287 –314).
Cambridge: Cambridge University Press.
Marcus, R. F., Telleen, S., & Roke, E. J. (1979). Relation between cooperation and empathy
in young children. Developmental Psychology, 15, 346–347. doi:10.1037//0012-
1649.15.3.346
Marks, P. E. L., Babcock, B., Cillessen, A. H. N., & Crick, N. R. (2013). The effects of
participation rate on the internal reliability of peer nomination measures. Social
Development, 22, 609–622. doi:10.1111/j.1467-9507.2012.00661.x
Marsee, M. A., & Frick, P. J. (2007). Exploring the cognitive and emotional correlates to
proactive and reactive aggression in a sample of detained girls. Journal of Abnormal
Child Psychology, 35, 969–981. doi:10.1007/s10802-007-9147-y
Martinussen, R., Hayden, J., Hogg-Johnson, S., & Tannock, R. (2005). A meta-analysis of
working memory impairments in children with attention-deficit/hyperactivity disorder.
Journal of the American Academy of Child & Adolescent Psychiatry, 44, 377–384.

358
Masson, J. D., Dagnan, D., & Evans, J. (2010). Adaptation and validation of the Tower of
London test of planning and problem solving in people with intellectual disabilities.
Journal of Intellectual Disability Research, 54, 457–467. doi:10.1111/j.1365-
2788.2010.01280.x
Masten, A. S., Herbers, J. E., Desjardins, C. D., Cutuli, J. J., McCormick, C. M., Sapienza, J.
K., … Zelazo, P. D. (2012). Executive function skills and school success in young
children experiencing homelessness. Educational Researcher, 41, 375–384.
doi:10.3102/0013189X12459883
Mata, F., Sallum, I., Miranda, D. M., Bechara, A., & Malloy-Diniz, L. F. (2013). Do general
intellectual functioning and socioeconomic status account for performance on the
Children’s Gambling Task? Frontiers in Neuroscience, 7, 1–9.
doi:10.3389/fnins.2013.00068
Mathieson, K., & Banerjee, R. (2011). Peer play, emotion understanding, and socio-moral
explanation: The role of gender. British Journal of Developmental Psychology, 29, 188–
196. doi:10.1111/j.2044-835X.2010.02020.x
Mathieson, L. C., & Crick, N. R. (2010). Reactive and proactive subtypes of relational and
concurrent and longitudinal adjustment. School Psychology Review, 39, 601–611.
Mayers, A. (2013). Introduction to Statistics and SPSS in Psychology. London, UK: Pearson
Education Limited.
McClelland, M. M., Morrison, F. J., & Holmes, D. L. (2000). Children at risk for early
academic problems: The role of learning-related social skills. Early Childhood Research
Quarterly, 15, 307–329. doi: 10.1016/s0885-2006(00)00069-7
McClelland, M. M., & Scalzo, C. (2006). Social skills deficits. In M. Hersen (Ed.),
Clinician’s handbook of child behavioral assessment (pp. 313–333). Burlington, MA:
ElsevierAcademic Press.
McCloskey, G., & Perkins, L. A. (2013). Assessment of executive functions using tests of
cognition. In G. McCloskey & L. A. Perkins (Eds.), Essentials of executive functions
assessment (pp. 131–188). New Jersey, USA: John Wiley & Sons.

359
McIntyre, L. L., Blacher, J., & Baker, B. L. (2006). The transition to school: Adaptation in
young children with and without intellectual disability. Journal of Intellectual Disability
Research, 50, 349–361. doi:10.1111/j.1365-2788.2006.00783.x
McMahon, S. D., Todd, N. R., Martinez, A., Coker, C., Sheu, C. F., Washburn, J., & Shah, S.
(2013). Aggressive and prosocial behavior: Community violence, cognitive, and
behavioral predictors among urban African American youth. American Journal of
Community Psychology, 51, 407–421. doi:10.1007/s10464-012-9560-4
McQuade, J. D., Murray-Close, D., Shoulberg, E. K., & Hoza, B. (2013). Working memory
and social functioning in children. Journal of Experimental Child Psychology, 115, 422–
435. doi:10.1016/j.jecp.2013.03.002
Merrell, K. (2001). Assessment of children’s social skills: Recent developments, best
practices, and new directions. Exceptionality, 9, 3–18.
doi:10.1207/S15327035EX091&2_2
Milich, R., & Dodge, K. A. (1984). Social information processing in child psychiatric
populations. Journal of Abnormal Child Psychology, 12, 471–489. doi:
10.1007/bf00910660
Miller, C. A. (2006). Developmental relationships between language and theory of mind.
American Journal of Speech-Language Pathology, 15, 142–154. doi:10.1044/1058-0360
Miller, M. R., Giesbrecht, G. F., Müller, U., McInerney, R. J., & Kerns, K. A. (2012). A latent
variable approach to determining the structure of executive function in preschool
children. Journal of Cognition and Development, 13, 395–423.
doi:10.1080/15248372.2011.585478
Miller, P. A., Eisenberg, N., Fabes, R. A., & Shell, R. (1996). Relations of moral reasoning
and vicarious emotion to young children’s prosocial behaviour toward peers and adults.
Developmental Psychology, 32, 210–219. doi:10.1037//0012-1649.32.2.210
Miller, S. A. (2009). Children’s understanding of second-order mental states. Psychological
Bulletin, 135, 749–773. doi:10.1037/a0016854
Miranda, A., Colomer, C., Mercader, J., Fernández, M. I., & Presentación, M. J. (2015).
Performance-based tests versus behavioral ratings in the assessment of executive

360
functioning in preschoolers: associations with ADHD symptoms and reading
achievement. Frontiers in Psychology, 6, 545. doi:10.3389/fpsyg.2015.00545
Mischel, W., Shoda, Y., & Rodriguez, M. L. (1989). Delay of gratification in children.
Science, 244, 933–938. doi:10.1126/science.2658056
Miyake, A., Friedman, N. P., Emerson, M. J., Witzki, A. H., Howerter, A., & Wager, T. D.
(2000). The unity and diversity of executive functions and their contributions to complex
“Frontal Lobe” tasks: A latent variable analysis. Cognitive Psychology, 41, 49–100.
doi:10.1006/cogp.1999.0734
Monks, C. P., & Coyne, I. (2011). Bullying in Different Contexts. Cambridge: Cambridge
University Press.
Monks, C. P., Palermiti, A., Ortega, R., & Costabile, A. (2011). A cross-national comparison
of aggressors, victims and defenders in preschools in England, Spain and Italy. The
Spanish Journal of Psychology, 14, 133–144. doi:10.5209/rev
Monks, C. P., Smith, P. K., & Swettenham, J. (2003). Aggressors, victims, and defenders in
preschool: Peer, self, and teacher reports. Merrill-Palmer Quarterly, 49, 453–469.
doi:10.1353/mpq.2003.0024
Monks, C. P., Smith, P. K., & Swettenham, J. (2005). Psychological correlates of peer
victimisation in preschool: Social cognitive skills, executive function and attachment
profiles. Aggressive Behavior, 31, 571–588. doi:10.1002/ab.20099
Monterosso, J., Ehrman, R., Napier, K. L., O’Brien, C. P., & Childress, A. R. (2001). Three
decision-making tasks in cocaine-dependent patients: Do they measure the same
construct? Addiction, 96, 1825–1837. doi:10.1080/09652140120089571
Moore, C., Barresi, J., & Thompson, C. (1998). The cognitive basis of future-oriented
prosocial behavior. Social Development, 7, 198–219. doi:10.1111/1467-9507.00062
Moreno, A. J., Klute, M. M., & Robinson, J. L. (2008). Relational and individual resources as
predictors of empathy in early childhood. Social Development, 17, 613–637.
doi:10.1111/j.1467-9507.2007.00441.x
361
Morrow, M. T., Hubbard, J. A., McAuliffe, M. D., Rubin, R. M., & Dearing, K. F. (2006).
Childhood aggression, depressive symptoms, and peer rejection: The mediational model
revisited. International Journal of Behavioral Development, 30, 240–248.
doi:10.1177/0165025406066757
Moses, L. J. (2001). Executive accounts of theory-of-mind development. Child Development,
72, 688–690. doi:10.1111/1467-8624.00306
Murray-Close, D., & Crick, N. R. (2006). Children’s moral reasoning regarding physical and
relational aggression. The Journal of Early Adolescence, 26, 344–364.
doi:10.1177/0272431606288552
Nærde, A., Ogden, T., Janson, H., & Zachrisson, H. D. (2014). Normative development of
physical aggression from 8 to 26 months. Developmental Psychology, 50, 1710–1720.
doi:10.1037/a0036324
Nelson, D. A., Robinson, C. C., & Hart, C. H. (2005). Relational and physical aggression of
preschool-age children: Peer status and linkages across informants. Early Education and
Development, 16, 115–140. doi:10.1207/s15566935eed1602_2
Newcomb, A. F., & Bukowski, W. M. (1983). Social impact and social preference as
determinants of children’s peer group status. Developmental Psychology, 19, 856–867.
doi:10.1037/0012-1649.19.6.856
Newcomb, A. F., Bukowski, W. M., & Pattee, L. (1993). Children’s peer relations: A meta-
analytic review of popular, rejected, neglected, controversial, and average sociometric
status. Psychological Bulletin, 113, 99–128. doi:10.1037/0033-2909.113.1.99
O’Connor, E., McCormack, T., & Feeney, A. (2014). Do children who experience regret
make better decisions? A developmental study of the behavioral consequences of regret.
Child Development, 85, 1995–2010. doi:10.1111/cdev.12253
O’Neil, R., Welsh, M., Parke, R. D., Wang, S., & Strand, C. (1997). A longitudinal
assessment of the academic correlates of early peer acceptance and rejection. Journal of
Clinical Child Psychology, 26, 290–303. doi:10.1207/s15374424jccp2603
Olson, S. L., Lopez-Duran, N., Lunkenheimer, E. S., Chang, H., & Sameroff, A. J. (2011).
Individual differences in the development of early peer aggression: Integrating

362
contributions of self-regulation, theory of mind, and parenting. Development and
Psychopathology, 23, 253–266. doi:10.1017/S0954579410000775
Orobio de Castro, B., Merk, W., Koops, W., Veerman, J. W., & Bosch, J. D. (2005).
Emotions in social information processing and their relations with reactive and proactive
aggression in referred aggressive boys. Journal of Clinical Child and Adolescent
Psychology, 34, 105–116. doi:10.1207/s15374424jccp3401
Ostrov, J. M., & Crick, N. R. (2007). Forms and functions of aggression during early
childhood: A short-term longitudinal study. School Psychology Review, 36, 22–43.
doi:10.1007/s10802-007-9179-3
Ostrov, J. M., & Keating, C. F. (2004). Gender differences in preschool aggression during
free play and structured interactions: An observational study. Social Development, 13,
255–277. doi:10.1111/j.1467-9507.2004.000266.x
Ostrov, J. M., Murray-Close, D., Godleski, S. A., & Hart, E. J. (2013). Prospective
associations between forms and functions of aggression and social and affective
processes during early childhood. Journal of Experimental Child Psychology, 116, 19–
36. doi:10.1016/j.jecp.2012.12.009
Ostrov, J. M., Ries, E. E., Stauffacher, K., Godleski, S. A., & Mullins, A. D. (2008).
Relational aggression, physical aggression and deception during early childhood: A
multimethod, multi-informant short-term longitudinal study. Journal of Clinical Child &
Adolescent Psychology, 37, 664–675. doi:10.1080/15374410802148137
Otero, T. M., & Barker, L. A. (2014). The frontal lobes and executive functioning. In S.
Goldstein & J. A. Naglieri (Eds.), Handbook of executive functioning (pp. 29–45). New
York, USA: Springer.
Pardini, D., & Frick, P. J. (2013). Multiple developmental pathways to conduct disorder:
Current conceptualizations and clinical implications. Journal of the Canadian Academy
of Child and Adolescent Psychiatry, 22(1), 20–25.
Parker, J. G., & Asher, S. R. (1993). Friendship and friendship quality in middle childhood:
Links with peer group acceptance and feelings of loneliness and social dissatisfaction.
Developmental Psychology, 29, 611–621. doi:10.1037/0012-1649.29.4.611
363
Parker, J. G., Rubin, K. H., Erath, S. A., Wojslawowicz, J. C., & Buskirk, A. A. (2006). Peer
relationships, child development, and adjustment: A developmental psychopathology
perspective. In D. Cicchetti & D. J. Cohen (Eds.), Developmental psychopathology: Vol.
1. theory and method (2nd ed., pp. 419–493). New York, NY: Wiley.
Pascualvaca, D. M., Anthony, B. J., Arnold, L. E., Rebok, G. W., Ahearn, M. B., Kellam, S.
G., & Mirsky, A. F. (1997). Attention performance in an epidemiological sample of
urban children: The role of gender and verbal intelligence. Child Neuropsychology, 3,
13–27. doi:10.1080/09297049708401365
Paulus, M., & Moore, C. (2014). The development of recipient-dependent sharing behavior
and sharing expectations in preschool children. Developmental Psychology, 50, 914–921.
doi:10.1037/a0034169
Pedersen, S., Vitaro, F., Barker, E. D., & Borge, A. I. H. (2007). The timing of middle-
childhood peer rejection and friendship: Linking early behavior to early-adolescent
adjustment. Child Development, 78, 1037–1051. doi:10.1111/j.1467-8624.2007.01051.x
Pellegrini, A. D., Van Ryzin, M. J., Roseth, C., Bohn-Gettler, C., Dupuis, D., Hickey, M., &
Peshkam, A. (2011). Behavioral and social cognitive processes in preschool children’s
social dominance. Aggressive Behavior, 37, 248–257. doi:10.1002/ab.20385
Pellicano, E. (2007). Links between theory of mind and executive function in young children
with autism: clues to developmental primacy. Developmental Psychology, 43, 974–990.
doi:10.1037/0012-1649.43.4.974
Perner, J. (1998). The meta-intentional nature of executive functions and theory of mind. In P.
Carruthers & J. Boucher (Eds.), Language and Thought (pp. 270–283). Cambridge:
Cambridge University Press.
Perner, J., & Lang, B. (1999). Development of theory of mind and executive control. Trends
in Cognitive Sciences, 3, 337–344. doi:10.1016/s1364-6613(99)01362-5
Perner, J., Lang, B., & Kloo, D. (2002). Theory of mind and self-control: More than a
common problem of inhibition. Child Development, 73, 752–767. doi:10.1111/1467-
8624.00436
Perner J., Leekam S. R., & Wimmer, H. (1987). 2-year-olds difficulty with false belief: The

364
case for a conceptual deficit. British Journal of Developmental Psychology, 5, 125–137.
doi: 10.1111/j.2044-835X.1987.tb01048.x
Perner, J., & Wimmer, H. (1985). “John thinks thatMary thinks that...” attribution of second-
order beliefs by 5- to 10-year-old children. Journal of Experimental Child Psychology,
39, 437–471. doi:10.1016/0022-0965(85)90051-7
Peterson, E., & Welsh, M. C. (2014). The development of hot and cool executive functions in
childhood and adolescence: Are we getting warmer? In S. Goldstein & J. A. Naglieri
(Eds.), Handbook of executive functioning (pp. 45 – 69). New York, USA: Springer.
Pfister, R., Schwarz, K., Carson, R., & Jancyzk, M. (2013). Easy methods for extracting
individual regression slopes: Comparing SPSS, R, and Excel. Tutorials in Quantitative
Methods for Psychology, 9(2), 72–78. doi: 10.20982/tqmp.09.2.p072
Pillow, B. H., & Henrichon, A. J. (1996). There’s more to the picture than meets the eye:
young children's difficulty understanding biased interpretation. Child Development, 67,
803–819. doi:10.1111/j.1467-8624.1996.tb01765.x
Poland, S. E., Monks, C. P., & Tsermentseli, S. (2016). Cool and hot executive function as
predictors of aggression in early childhood: Differentiating between the function and
form of aggression. British Journal of Developmental Psychology, 34, 181–197.
doi:10.1111/bjdp.12122
Polman, H., Orobio de Castro, B., Koops, W., Van Boxtel, H. W., & Merk, W. W. (2007). A
meta-analysis of the distinction between reactive and proactive aggression in children
and adolescents. Journal of Abnormal Child Psychology, 35, 522–535.
doi:10.1007/s10802-007-9109-4
Poulin, F., & Boivin, M. (2000). Reactive and proactive aggression: Evidence of a two-factor
model. Psychological Assessment, 12, 115–122. doi:10.1037//1040-3590.12.2.115
Prencipe, A., Kesek, A., Cohen, J., Lamm, C., Lewis, M. D., & Zelazo, P. D. (2011).
Development of hot and cool executive function during the transition to adolescence.
Journal of Experimental Child Psychology, 108, 621–637.
doi:10.1016/j.jecp.2010.09.008

365
Price, J. M., & Dodge, K. A. (1989). Reactive and proactive aggression in childhood:
Relations to peer status and social context dimensions. Journal of Abnormal Child
Psychology, 17, 455–471. doi:10.1007/bf00915038
Prinstein, M. J., & Carolina, N. (2007). Assessment of adolescents’ preference- and
reputation-based peer status using sociometric experts. Merrill-Palmer Quarterly, 53(2),
243–261. doi:10.1353/mpq.2007.0013
Raaijmakers, M. A. J., Smidts, D. P., Sergeant, J. A., Maassen, G. H., Posthumus, J. A., van
Engeland, H., & Matthys, W. (2008). Executive functions in preschool children with
aggressive behavior: impairments in inhibitory control. Journal of Abnormal Child
Psychology, 36, 1097–1107. doi:10.1007/s10802-008-9235-7
Raine, A., Dodge, K., Loeber, R., Gatzke-kopp, L., Lynam, D., Stouthamer-loeber, M., & Liu,
J. (2006). The reactive–proactive aggression questionnaire: Differential correlates of
reactive and proactive aggression in adolescent boys. Aggressive Behavior, 32, 159–171.
doi:10.1002/ab.20115.The
Rathert, J., Fite, P. J., Gaertner, A. E., & Vitulano, M. (2011). Associations between effortful
control, psychological control and proactive and reactive aggression. Child Psychiatry
and Human Development, 42, 609–621. doi:10.1007/s10578-011-0236-3
Razza, R. A., & Blair, C. (2009). Associations among false-belief understanding, executive
function, and social competence: A longitudinal analysis. Journal of Applied
Developmental Psychology, 30, 332–343. doi:10.1016/j.appdev.2008.12.020
Reifman, A., & Keyton, K. (2010). Winsorizing. In N. J. Salkind (Ed.), Encyclopedia of
Research Design: Volume Three (pp. 1636–1637). CA, USA: Sage.
Renouf, A., Brendgen, M., Parent, S., Vitaro, F., Zelazo, D. P., Boivin, M., … Séguin, J. R.
(2009). Relations between theory of mind and indirect and physical aggression in
kindergarten: Evidence of the moderating role of prosocial behaviors. Social
Development, 19, 535–555. doi:10.1111/j.1467-9507.2009.00552.x
Renouf, A., Brendgen, M., Séguin, J. R., Vitaro, F., Boivin, M., Dionne, G., … Pérusse, D.
(2010). Interactive links between theory of mind, peer victimization, and reactive and

366
proactive aggression. Journal of Abnormal Child Psychology, 38, 1109–23.
doi:10.1007/s10802-010-9432-z
Riccio, C. A., Hewitt, L. L., & Blake, J. J. (2011). Relation of measures of executive function
to aggressive behavior in children. Applied Neuropsychology, 18, 1–10.
doi:10.1080/09084282.2010.525143
Ridderinkhof, K. R., Ullsperger, M., & Crone, E. A. (2004). The role of the medial frontal
cortex in cognitive control, Science, 306, 443–447. doi:10.1126/science.1100301
Rieffe, C., Broekhof, E., Kouwenberg, M., Faber, J., Tsutsui, M., & Guroglu, B. (2016).
Disentangling proactive and reactive aggression in children using self-report. European
Journal of Developmental Psychology, 13, 439–451.
doi:10.1080/17405629.2015.1109506
Rimm-Kaufman, S. E., Pianta, R. C., Cox, M. J., Carolina, N., & Hill, C. (2006). Teachers’
judgments of problems in the transition to kindergarten. Early Childhood Research
Quarterly, 166, 147–166. doi: 10.1016/s0885-2006(00)00049-1
Rogers, P. (2006). Maximising the return of parent consent forms (pp. 1–5).
Roth-Hanania, R., Davidov, M., & Zahn-Waxler, C. (2011). Empathy development from 8 to
16 months: Early signs of concern for others. Infant Behavior and Development, 34,
447–458. doi:10.1016/j.infbeh.2011.04.007
Röthlisberger, M., Neuenschwander, R., Cimeli, P., & Roebers, C. M. (2013). Executive
functions in 5- to 8-year-olds: Developmental changes and relationship to academic
achievement. Journal of Educational and Developmental Psychology, 3, 153–167.
doi:10.5539/jedp.v3n2p153
Rubin, A. (2013). Interpreting the strength and importance of relationships. In A. Rubin (Ed.),
Statistics for evidence-based practice and evaluation (pp. 137–154). CA, USA:
Brooks/Cole.
Rubin, K. H., Bukowski, W. M., & Parker, J. G. (1998). Peer interactions, relationships, and
groups. In W. Damon, R. M. Lerner, & N. Eisenberg (Eds.), Handbook of child
psychology: Social, emotional, and personality development (Volume 3) (6th ed., pp.
571–645). New York, NY: Wiley.
367
Rueda, M. R., Checa, P., & Cómbita, L. M. (2012). Enhanced efficiency of the executive
attention network after training in preschool children: Immediate changes and effects
after two months. Developmental Cognitive Neuroscience, 2, 192–204.
doi:10.1016/j.dcn.2011.09.004
Russell, A., Hart, C., Robinson, C., & Olsen, S. (2003). Children’s sociable and aggressive
behaviour with peers: A comparison of the US and Australia, and contributions of
temperament and parenting styles. International Journal of Behavioral Development, 27,
74–86. doi:10.1080/01650250244000038
Russell, J. (1996). Agency: Its Role in Mental Development. Oxford: Erlbaum.
Russell, J., & Hill, E. L. (2001). Action-monitoring and intention reporting in children with
autism. Journal of Child Psychology and Psychiatry, and Allied Disciplines, 42, 317–
328. doi:10.1111/1469-7610.00725
Sabbagh, M. A., Fen, X., Calrson, S. M., Moses, L. H., & Lee, K. (2006). The development of
executive functioning and theory of mind: A comparison of chinese and US
preschoolers. Psychological Science, 17, 74–81. doi:10.1111/j.1467-
9280.2005.01667.x.The
Sabbagh, M. A., Bowman, L. C., Evraire, L. E., & Ito, J. M. B. (2009). Neurodevelopmental
correlates of theory of mind in preschool children. Child Development, 80, 1147–1162.
doi:10.1111/j.1467-8624.2009.01322.x
Salmivalli, C., & Helteenvuori, T. (2007). Reactive, but not proactive aggression predicts
victimization among boys. Aggressive Behavior, 33, 198–206. doi:10.1002/ab.20210
Sandstrom, M. J., & Cillessen, A. H. N. (2006). Likeable versus popular: Distinct
implications for adolescent adjustment. International Journal of Behavioral
Development, 30, 305–314. doi:10.1177/0165025406072789
Savin, N., & White, K. (1977). The Durbin-Watson test for serial correlation with extreme
sample sizes or many regressors. Econometrica, 45, 1989–1996. doi:10.2307/1914122
Scarpa, A., Haden, S. C., & Tanaka, A. (2010). Being hot-tempered: Autonomic, emotional,
and behavioral distinctions between childhood reactive and proactive aggression.
Biological Psychology, 84, 488–496. doi:10.1016/j.biopsycho.2009.11.006
368
Schiebener, J., García-Arias, M., García-Villamisar, D., Cabanyes-Truffino, J., & Brand, M.
(2015). Developmental changes in decision making under risk: The role of executive
functions and reasoning abilities in 8- to 19-year-old decision makers. Child
Neuropsychology, 21, 759–778. doi:10.1080/09297049.2014.934216
Schoemaker, K., Bunte, T., Espy, K. A., Deković, M., & Matthys, W. (2014). Executive
functions in preschool children with ADHD and DBD: an 18-month longitudinal study.
Developmental Neuropsychology, 39, 302–315. doi:10.1080/87565641.2014.911875
Schoemaker, K., Bunte, T., Wiebe, S. A., Andrews, K., & Matthys, W. (2012). Executive
function deficits in preschool children with ADHD and DBD. Journal of Child
Psychology and Psychiatry, 53, 111–119. doi:10.1111/j.1469-7610.2011.02468.x
Schoemaker, K., Mulder, H., Deković, M., & Matthys, W. (2013). Executive functions in
preschool children with externalizing behavior problems: A meta-analysis. Journal of
Abnormal Child Psychology, 41, 457–71. doi:10.1007/s10802-012-9684-x
Sebanc, A. M. (2003). The friendship features of preschool children: Links with prosocial
behavior and aggression. Social Development,12, 249–268. doi:10.1111/1467-
9507.00232
Segalowitz, S. ., & Davies, P. L. (2004). Charting the maturation of the frontal lobe: An
electrophysiological strategy. Brain and Cognition, 55, 116–133. doi:10.1016/S0278-
2626(03)00283-5
Séguin, J., & Boulerice, B. (1999). Executive functions and physical aggression after
controlling for attention deficit hyperactivity disorder, general memory, and IQ. Journal
of Child Psychology and Psychiatry, 40, 1197–1208. doi:10.1111/1469-7610.00536
Senn, T. E., Espy, K. A., & Kaufmann, P. M. (2004). Using path analysis to understand
executive function organization in preschool children. Developmental
Neuropsychologyeuropsychology, 26, 445–464. doi:10.1207/s15326942dn2601_5
Shakoor, S., Jaffee, S. R., Bowes, L., Ouellet-morin, I., Moffitt, T. E., Arseneault, L., &
Happe, F. (2012). A prospective longitudinal study of children’s theory of mind and
adolescent involvement in bullying. Journal of Child Psychology and Psychiatry, 53,
254–261. doi:10.1111/j.1469-7610.2011.02488.x

369
Shallice, T. (1982). Specific impairments of planning. Philosophical Transactions of the
Royal Society of London, B, 298, 199–209. doi:10.1098/rstb.1982.0082.
Sharp, C. (2008). Theory of Mind and conduct problems in children: Deficits in reading the
“emotions of the eyes.” Cognition & Emotion, 22, 1149–1158.
doi:10.1080/02699930701667586
Siegal, M., & Varley, R. (2002). Neural systems involved in “theory of mind”. Nature
Reviews. Neuroscience, 3, 463–71. doi:10.1038/nrn844
Silk, J. S., Stroud, L. R., Siegle, G. J., Dahl, R. E., Lee, K. H., & Nelson, E. E. (2012). Peer
acceptance and rejection through the eyes of youth: Pupillary, eyetracking and ecological
data from the chatroom interact task. Social Cognitive and Affective Neuroscience, 7, 93–
105. doi:10.1093/scan/nsr044
Simpson, A., & Riggs, K. J. (2006). Conditions under which children experience inhibitory
difficulty with a “‘button-press’” go ⁄ no-go task. Journal of Experimental Child
Psychology, 94, 18–26. doi:10.1016/j.jecp.2005.10.003
Slaughter, V., Dennis, M. J., & Pritchard, M. (2002). Theory of mind and peer acceptance in
preschool children. British Journal of Developmental Psychology, 20, 545–564.
doi:10.1348/026151002760390945
Slaughter, V., Imuta, K., Peterson, C. C., & Henry, J. D. (2015). Meta-analysis of theory of
mind and peer popularity in the preschool and early school years. Child Development,
86, 1159–1174. doi:10.1111/cdev.12372
Slaughter, V., & Repacholi, B. (2003). Individual differences in theory of mind: What are we
investigating? In B. Repacholi & V. Slaughter (Eds.), Individual differences in theory of
mind: Implications for typical and atypical development (pp. 1–13). New York, USA:
Psychology Press.
Smeets, K. C., Oostermeijer, S., Lappenschaar, M., Cohn, M., van der Meer, J. M. J., Popma,
A., … Buitelaar, J. K. (2016). Are proactive and reactive aggression meaningful
distinctions in adolescents? A variable- and person-based approach. Journal of Abnormal
Child Psychology, 45, 1–14. doi:10.1007/s10802-016-0149-5

370
Smidts, D. P., Jacobs, R., & Anderson, V. (2004). The object classification task for children
(OCTC): A measure of concept generation and mental flexibility in early childhood.
Development and Psychopathology, 26, 385–401. doi: 10.1207/s15326942dn2601_2
Smith, P. K., & Monks, C. P. (2008). Concepts of bullying: Developmental and cultural
aspects. International Journal of Adolescent Medicine and Health, 20, 101–112.
doi:10.1515/IJAMH.2008.20.2.101
Smith, R. L., Rose, A. J., & Schwartz-Mette, R. A. (2009). Relational and overt aggression in
childhood and adolescence: Clarifying mean-level gender differences and associations
with peer acceptance. Social Development, 19, 243–269. doi:10.1111/j.1467-
9507.2009.00541.x
Spieker, S. J., Campbell, S. B., Vandergrift, N., Pierce, K. M., Cauffman, E., Susman, E. J., &
Roisman, G. I. (2012). Relational aggression in middle childhood: Predictors and
adolescent outcomes. Social Development, 21, 354–375. doi:10.1111/j.1467-
9507.2011.00631.x
Steinberg, L. (2005). Cognitive and affective development in adolescence. Trends in
Cognitive Sciences, 9, 69–74. doi:10.1016/j.tics.2004.12.005
Stuss, D. T. (1992). Biological and psychological development of executive functions. Brain
and Cognition, 20, 8–23. doi:10.1016/0278-2626(92)90059-U
Stuss, D. T. (2006). Frontal lobes and attention: Processes and networks, fractionation and
integration. Journal of the International Neuropsychological Society, 12, 261–271.
doi:10.1017/S1355617706060358
Stuss, D. T., & Alexander, M. P. (2000). Executive functions and the frontal lobes: A
conceptual view. Psychological Research, 63, 289–298. doi:10.1007/s004269900007
Stuss, D. T., & Anderson, V. (2004). The frontal lobes and theory of mind: Developmental
concepts from adult focal lesion research. Brain and Cognition, 55, 69–83.
doi:10.1016/S0278-2626(03)00271-9
Sullivan, J. R., Riccio, C. A., & Castillo, C. L. (2009). Concurrent validity of the tower tasks
as measures of executive function in adults: a meta-analysis. Applied Neuropsychology,
16, 62–75. doi:10.1080/09084280802644243
371
Sutton, J., Smith, P. K., & Swettenham, J. (1999). Social cognition and bullying: Social
inadequacy or skilled manipulation? British Journal of Developmental Psychology,
17(3), 435–450. doi:10.1348/026151099165384
Sutton, J., Smith, P. K., & Swettenham, J. (2001). Bullying and “theory of mind”: A critique
of the “social skills deficit” view of anti-social behaviour. Social Development, 8, 117–
127. doi:10.1111/1467-9507.00083
Terranova, A. M., Morris, A. S., & Boxer, P. (2008). Fear reactivity and effortful control in
overt and relational bullying: A six-month longitudinal study. Aggressive Behavior, 34,
104–115. doi:10.1002/ab.20232
Thorell, L. B., & Catale, C. (2014). The assessment of exeucitve functioning using the
childhood executive functioning invenvory (CHEXI). In S. Goldstein & J. A. Naglieri
(Eds.), Handbook of executive functioning (pp. 359–377). New York, USA: Springer.
Tillman, C., Brocki, K. C., Sørensen, L., & Lundervold, A. J. (2015). A longitudinal
examination of the developmental executive function hierarchy in children with
externalizing behavior problems. Journal of Attention Disorders, 19, 496–506.
doi:10.1177/1087054713488439
Tomada, G., & Schneider, B. H. (1997). Relational aggression, gender, and peer acceptance:
invariance across culture, stability over time, and concordance among informants.
Developmental Psychology, 33, 601–609. doi:10.1037/0012-1649.33.4.601
Toplak, M. E., Sorge, G. B., Benoit, A., West, R. F., & Stanovich, K. E. (2010). Decision-
making and cognitive abilities: A review of associations between Iowa Gambling Task
performance, executive functions, and intelligence. Clinical Psychology Review, 30,
562–581. doi:10.1016/j.cpr.2010.04.002
Toplak, M. E., West, R. F., & Stanovich, K. E. (2013). Practitioner review: Do performance-
based measures and ratings of executive function assess the same construct? Journal of
Child Psychology and Psychiatry and Allied Disciplines, 54, 131–143.
doi:10.1111/jcpp.12001

372
Tremblay, R. E. (2000). The development of agressive behaviour during childhood: What
have we learned in the past century? International Journal of Behavioral Development,
24, 129–141. doi:10.1080/016502500383232
Tremblay, R. E., Nagin, D. S., Séguin, J. R., Zoccolillo, M., Zelazo, P. D., Boivin, M., …
Japel, C. (2004). Physical aggression during early childhood: trajectories and predictors.
Peadiatrics, 114, 43–50. doi:10.1542/peds.114.1.e43
Tseng, W. L., Banny, A. M., Kawabata, Y., Crick, N. R., & Gau, S. S. F. (2013). A cross-
lagged structural equation model of relational aggression, physical aggression, and peer
status in a Chinese culture. Aggressive Behavior, 39, 301–15. doi:10.1002/ab.21480
Tseng, W. L., & Gau, S. S. F. (2013). Executive function as a mediator in the link between
attention-deficit/hyperactivity disorder and social problems. Journal of Child Psychology
and Psychiatry, and Allied Disciplines, 54, 996–1004. doi:10.1111/jcpp.12072
Tuvblad, C., Raine, A., Zheng, M., & Baker, L. A. (2009). Genetic and environmental
stability differs in reactive and proactive aggression. Aggressive Behavior, 35, 437–452.
doi:10.1002/ab.20319.Genetic
Underwood, M. K., Galen, B. R., & Paquette, J. A. (2001). Top ten challenges for
understanding gender and aggression in children: Why can’t we all just get along? Social
Development, 10, 248–266. doi:10.1111/1467-9507.00162
Utendale, W. T., & Hastings, P. D. (2011). Developmental changes in the relations between
inhibitory control and externalizing problems during early childhood. Infant and Child
Development, 20, 181–193. doi:10.1002/icd
Utendale, W. T., Hubert, M., Saint-Pierre, A. B., & Hastings, P. D. (2011). Neurocognitive
development and externalizing problems: The role of inhibitory control deficits from 4 to
6 Years. Aggressive Behavior, 37, 476–488. doi:10.1002/ab.20403
Vaillancourt, T., Brendgen, M., Boivin, M., & Tremblay, R. E. (2003). A Longitudinal
confirmatory factor analysis of indirect and physical aggression: Evidence of two factors
over time? Child Development, 74, 1628–1638. doi:10.1037/e552582012-161
Vaillancourt, T., Miller, J. L., Fagbemi, J., Côtè, S., & Tremblay, R. E. (2007). Trajectories
and predictors of indirect aggression: Results from a nationally representative
373
longitudinal study of Canadian children aged 2 – 10. Aggressive Behavior, 33, 314–326.
doi:10.1002/ab
Vaughn, B. E., Vollenweider, M., Bost, K. K., Azria-Evans, M. R., & Blake, S. J. (2003).
Negative interactions and social competence for preschool children in two samples:
Reconsidering the interpretation of aggressive behavior for young children. Merrill-
Palmer Quarterly, 49, 245 – 278. doi:10.1353/mpq.2003.0017
Verlinden, M., Veenstra, R., Ghassabian, A., Jansen, P. W., Hofman, A., Jaddoe, V. W. V, …
Tiemeier, H. (2014). Executive functioning and non-verbal intelligence as predictors of
bullying in early elementary school. Journal of Abnormal Child Psychology, 42, 953–
966. doi:10.1007/s10802-013-9832-y
Véronneau, M. H., Vitaro, F., Brendgen, M., Dishion, T. J., & Tremblay, R. E. (2010).
Transactional analysis of the reciprocal links between peer experiences and academic
achievement from middle childhood to early adolescence. Developmental Psychology,
46, 773–790. doi:10.1037/a0019816
Vitaro, F., & Brendgen, M. (2005). Proactive and reactive aggression: A developmental
perspective. In R. E. Tremblay, W. W. Hartup, & J. Archer (Eds.), Developmental
origins of aggression (pp. 178–201). New York, USA: Guildford Press.
Vitaro, F., Brendgen, M., & Barker, E. D. (2006). Subtypes of aggressive behaviors: A
developmental perspective. International Journal of Behavioral Development, 30, 12–
19. doi:10.1177/0165025406059968
Vlachou, M., Botsoglou, K., & Andreou, E. (2013). Assessing bully/victim problems in
preschool children: A multimethod approach. Journal of Criminology, 2013, 1–8.
doi:10.1155/2013/301658
Walden, T., Lemerise, E., & Smith, M. C. (1999). Friendship and popularity in preschool
classrooms. Early Education and Development, 10, 351–371.
doi:10.1207/s15566935eed1003_7
Walker, S. (2004). Teacher reports of social behaviour and peer acceptance in early
childhood: Sex and social status differences. Child Study Journal, 34, 13–28.

374
Walker, S. (2005). Gender differences in the relationship between young children’s peer-
related social competence and individual differences in theory of mind. The Journal of
Genetic Psychology, 166, 297–312. doi:10.3200/GNTP.166.3.297-312
Walker, S. (2009). Sociometric stability and the behavioral correlates of peer acceptance in
early childhood. The Journal of Genetic Psychology, 170, 339–358.
doi:10.1080/00221320903218364
Waller, R., Hyde, L. W., Baskin-Sommers, A. R., & Olson, S. L. (2016). Interactions between
callous unemotional behaviors and executive function in early childhood predict later
aggression and lower peer-liking in late-childhood. Journal of Abnormal Child
Psychology. doi:10.1007/s10802-016-0184-2
Wang, G. C. S., & Jain, C. L. (2003). Analysis of Residuals: Autocorrelation. In G. C. S.
Wang & C. L. Jain (Eds.), Regression analysis: Modelling and forecasting (pp. 71–91).
New York, USA: Graceway Publishing Company.
Warner Schaie, K., & Caskie, G. I. L. (2005). Methodological issues in aging research. In D.
M. Teti (Ed.), Handbook of research methods in developmental science (pp. 3–21).
Massachusetts, USA: Blackwell Publising Ltd.
Wechsler, D. (1991). Wechsler Intelligence Scale for Children—Third Edition. San Antonio,
TX: Psychological Corporation.
Wellman, H. M., Cross, D., & Watson, J. (2001). Meta-analysis of theory-of-mind
development: The truth about false belief. Child Development, 72, 655–84.
doi:10.1111/1467-8624.00304
Wellman, H. M., & Lagattuta, K. H. (2000). Developing understandings of mind. In S. Baron-
Cohen, H. Tager-Flusberg, & D. J. Cohen (Eds.), Understanding other minds:
Perspectives from autism (2nd ed., pp. 21–49). New York, USA: Oxford University
Press.
Welsh, M. C., Pennington, B. F., & Groisse, D. B. (1991). A normative-developmental study
of executive function: A window of prefrontal function in children. Developmental
Neuropsychology, 7, 131–149. doi:10.1080/87565649109540483

375
Werner, R. S., Cassidy, K. W., & Juliano, M. (2006). The role of social-cognitive abilities in
preschoolers’ aggressive behaviour. British Journal of Developmental Psychology, 24,
775–799. doi:10.1348/026151005X78799
Whitcomb, S. A., & Merrell, K. W. (2013). Assessing social skills and social-emotional
strengths. In S. A. Whitcomb & K. W. Merrell (Eds.), Behavioral, social, and emotional
assessment of children and adolescents (4th ed., pp. 379–410). New York, USA:
Routledge.
White, B. A., Jarrett, M. A., & Ollendick, T. H. (2012). Self-regulation deficits explain the
link between reactive aggression and internalizing and externalizing behavior problems
in children. Journal of Psychopathology and Behavioral Assessment, 35, 1–9.
doi:10.1007/s10862-012-9310-9
Wiebe, S. A., Espy, K. A., & Charak, D. (2008). Using confirmatory factor analysis to
understand executive control in preschool children: I. Latent structure. Developmental
Psychology, 44, 575–587. doi:10.1037/0012-1649.44.2.575
Wiebe, S. A., Sheffield, T., Nelson, J. M., Clark, C. A. C., Chevalier, N., & Espy, K. A.
(2011). The structure of executive function in 3-year-olds. Journal of Experimental
Child Psychology, 108, 436–452. doi:10.1016/j.jecp.2010.08.008
Wildeboer, A., Thijssen, S., van IJzendoorn, M. H., van der Ende, J., Jaddoe, V. W. V.,
Verhulst, F. C., … Bakermans-Kranenburg, M. J. (2015). Early childhood aggression
trajectories: Associations with teacher-reported problem behaviour. International
Journal of Behavioral Development, 39, 221–234. doi:10.1177/0165025414562239
Willoughby, M., Kupersmidt, J., Voegler-Lee, M., & Bryant, D. (2011). Contributions of hot
and cool self-regulation to preschool disruptive behavior and academic achievement.
Developmental Neuropsychology, 36, 162–180. doi:10.1080/87565641.2010.549980
Willoughby, M. T., Blair, C. B., Wirth, R. J., & Greenberg, M. (2010). The measurement of
executive function at age 3 years: Psychometric properties and criterion validity of a new
battery of tasks. Psychological Assessment, 22, 306–317. doi:10.1037/a0018708

376
Willoughby, M. T., Wirth, R. J., & Blair, C. B. (2012). Executive function in early childhood:
Longitudinal measurement invariance and developmental change. Psychological
Assessment, 24, 418–431. doi:10.1037/a0025779
Wimmer, H., & Perner, J. (1983). Beliefs about beliefs: Representation and constraining
function of wrong beliefs in young children’s understanding of deception. Cognition, 13,
103–128. doi:10.1016/0010-0277(83)90004-5
Xie, H., Drabick, D. A. G., & Chen, D. (2011). Developmental trajectories of aggression from
late childhood through adolescence: Similarities and differences across gender.
Aggressive Behavior, 37, 387–404. doi:10.1002/ab.20404
Yagmurlu, B. (2013). Relations among sociocognitive abilities and prosocial behavior.
Journal of Child and Family Studies, 23, 591–603. doi:10.1007/s10826-013-9726-1
Yang, J., Zhou, S., Yao, S., Su, L., & Mcwhinnie, C. (2009). The relationship between theory
of mind and executive function in a sample of children from mainland China. Child
Psychiatry and Human Development, 40, 169–182. doi:10.1007/s10578-008-0119-4
Yeates, K. O., Bigler, E. D., Dennis, M., Gerhardt, C. A., Rubin, K. H., Stancin, T., …
Vannatta, K. (2007). Social outcomes in childhood brain disorder: A heuristic integration
of social neuroscience and developmental psychology. Psychological Bulletin, 133, 535–
556. doi:10.1037/0033-2909.133.3.535
Yuan, C., Shao, A., Chen, X., Xin, T., Wang, L., & Bian, Y. (2014). Developmental trajectory
and gender differences in Chinese adolescents’ physical and relational aggression: An
analysis using the latent class growth model. Journal of Aggression, Conflict and Peace
Research, 6, 44–55. doi:10.1108/JACPR-11-2012-0013
Zelazo, P. D., Anderson, J. E., Richler, J., Wallner-Allen, K., Beaumont, J. L., & Weintraub,
S. (2013). NIH Toolbox Cognition Battery (CB): measuring executive function and
attention. Monographs of the Society for Research in Child Development, 78, 16–33.
doi:10.1111/mono.12032.
Zelazo, P. D., & Carlson, S. M. (2012). Hot and cool executive function in childhood and
adolescence: Development and plasticity. Child Development Perspectives, 6, 354–360.
doi:10.1111/j.1750-8606.2012.00246.x

377
Zelazo, P. D., & Cunningham, W. A. (2007). Executive Function: Mechanisms underlying
emotion regulation. In J. J. Gross (Ed.), Handbook of emotion regulation (pp. 135 –
159). New York, USA: Springer.
Zelazo, P. D., & Müller, U. (2002). Executive function in typical and atypical development.
In U. Goswami (Ed.), Handbook of childhood cognitive development (pp. 445–470).
Oxford: Blackwell Publising Ltd.
Zelazo, P. D., Müller, U., Frye, D., Marcovitch, S., Argitis, G., Boseovski, J., … Sutherland,
A. (2003). The development of executive function in early childhood. Monographs of the
Society for Research in Child Development, 68, 7–137.
Zelazo, P. D., Qu, L., & Müller, U. (2005). Hot and cool aspects of executive function:
Relations in early development. In W. Schneider, R. Schumann-Hengsteler, & B. Sodian
(Eds.), Young children’s cognitive development: Interrelationships among executive
functioning, working memory, verbal ability and theory of mind (pp. 71 – 95). Mahwah,
New Jesrsey: Lawrence Erlbaum Associates Inc.
Zhan, J. Y., Wilding, J., Cornish, K., Shao, J., Xie, C. H., Wang, Y. X., … Zhao, Z. Y.
(2010). Charting the developmental trajectories of attention and executive function in
Chinese school-aged children. Child Neuropsychology, 17, 82–95.
doi:10.1080/09297049.2010.525500
Zhou, Q., Hofer, C., Eisenberg, N., Reiser, M., Spinrad, T. L., & Fabes, R. A. (2007). The
developmental trajectories of attention focusing, attentional and behavioral persistence,
and externalizing problems during school-age years. Developmental Psychology, 43,
369–385. doi:10.1037/0012-1649.43.2.369
Zimmerman, D. W. (2004). A note on preliminary tests of equality of variances. The British
Journal of Mathematical and Statistical Psychology, 57, 173–181. doi:10.1016/0167-
7152(85)90016-1
Zsolnai, A., Lesznyák, M., & Kasik, L. (2012). Pre-school children’s aggressive and pro-
social behaviours in stressful situations. Early Child Development and Care, 182, 1503–
1522. doi:10.1080/03004430.2011.623779

378
10. APPENDIX
Appendix A: Recruitment letter to headteacher
The Role of Executive Function and Theory of Mind in Children's Social Behaviour
Sarah Poland (PhD student)
Department of Psychology and
Counselling
University of Greenwich
Bronte B312, Avery Hill Road,
Eltham, London, SE9 2UG
Supervisors:
Dr Claire Monks
Dr Stella Tsermentseli
Dear Headteacher,
I am a Psychology MPhil/PhD student at the University of Greenwich and I am currently
conducting a study into factors that influence the development of children's aggressive
behaviour. Aggressive behaviour is an increasingly significant problem in classrooms and can
lead to severe maladaptive outcomes for children, such as poor academic achievement and
school drop-out. My research focuses on the role of executive function and theory of mind in
children's aggressive behaviour. Executive function is an umbrella term for cognitive abilities
that allow for purposeful, goal directed behaviour. This includes the ability to plan behaviour,
think flexibly about a situation and to follow rules. Executive function is not just associated
with disruptive behaviour, such as aggression, but is involved in school adjustment. Theory of
mind is the ability to understand why other people behave the way they do and is implicated in
children's social behaviour. It is hoped that this research will increase understanding of the
role of these factors in the development of childhood aggression and inform the development
of interventions to help reduce this behaviour.
If you would be willing for your school to be involved in the study it would be greatly
appreciated.
The study will follow children in Nursery, Reception and Year 1 over a 12 month period. The
study will involve myself coming into the school for a 4 week period in order to collect data
from the class teachers, teaching assistants and children (I have a CRB check). I will come
into the school 3 times across the 12 months (approximately 6 months apart). The current class
teachers and teaching assistants will be asked to complete the Preschool Proactive and
Reactive Aggression Scale and the prosocial behaviour subscale from the Preschool Social
Behaviour Scale for each child in their class in order to gain a measure of each child's level of
aggressive and prosocial behaviour. These questionnaires should take teachers/teaching

379
assistants 2 – 5 minutes per child to complete. Children will be asked to take part in 3
assessment session. The sessions will be a maximum of 30 minutes each in order to prevent
fatigue. During these sessions children will complete executive function tasks, theory of mind
tasks, a verbal ability task and a peer nomination task. These tasks are designed to be fun and
are age-appropriate. The school would be asked to provide a quite room or area in which
children could individually complete the tasks.
I am writing to ask your permission to approach teachers, teaching assistants and
parents/caregivers of children in the relevant classes about this study. Parents/caregivers will
be asked to provide written consent confirming that they are happy for their child to take part
in the study. If you are happy for me to contact those concerned about the research please
complete and return back to me the consent form below. If you would like to discuss the study
further or have any questions please do not hesitate to contact me.
The data from this study will be published. All data will be treated confidentially and all data
will be published anonymously; the name of the school, teachers and children will not be
published. Should any of the participants wish to withdraw their data from the study they will
have up until the 31/07/15 to withdraw their data.
This research aims to increase understanding of the development of aggression in children and
identify possible ways in which to reduce aggression. Your schools participation in this
research would be greatly appreciated. To thank you for your participation I will provide you
with a summary of the findings of the research once it is completed.
Thank you for taking the time to consider my research. I will be following up this letter with a
phone call in two weeks.
Kind Regards,
Sarah Poland.
Study: The Role of Executive Function and Theory of Mind in the Function and Form of
Children’s Aggression.
I am willing for the teachers, teaching assistants and parents/caregivers of children in
the relevant classes in my institution to be approached about participating in the above
mentioned research study.
School
Headteacher
Signature
Date

380
Appendix B: Recruitment Strategy
Gaining parent/guardian consent can be a challenge (Rogers, 2006). In order to
increase participation rates in the present study the letter sent to parents/guardians was printed
on bright orange paper and headed with the title 'IMPORTANT INFORMATION' in bold. In
addition, a letter from the headteacher of the school outlining the schools interest in the
research accompanied the letter to parents. These methods were used because they have been
found to increase response rates (Ellickson & Hawes, 1989; Rogers, 2006). Furthermore,
based on suggestions from the literature (Rogers, 2006), a recruitment strategy was
developed. At the first stage, the teachers distributed the consent letters to the children in their
class to take home. One of the schools also sent out a text to parents/guardians to inform them
that their child was bringing home an important letter. In the second stage, approximately two
weeks later, teachers were either asked to remind children to bring back the letter to school or
a text was sent out to remind parents. The final phase, approximately 3 weeks after stage 1,
involved sending out a second letter to the parents of children who had not yet responded. In
both schools, the researcher had a point of contact between them and the school who was
motivated to assist with recruitment, which has also been found to increase response rates
(Ellickson & Hawes, 1989).
381
Appendix C: Recruitment letter to teachers and teaching assistants
The Role of Executive Function and Theory of Mind in Children's Social Behaviour
Sarah Poland (PhD student)
Department of Psychology and
Counselling
University of Greenwich
Bronte B312, Avery Hill Road,
Eltham, London, SE9 2UG
Supervisors:
Dr Claire Monks
Dr Stella Tsermentseli
Dear Teacher / Teaching Assistant,
Your school has given permission for me to contact you regarding my research. I am a
MPhil/PhD student at the University of Greenwich and I am currently conducting a study into
factors that influence the development of aggression in childhood. My research focuses on the
role of executive function and theory of mind in children's aggressive behaviour. Executive
function is an umbrella term for cognitive abilities that allow for purposeful, goal directed
behaviour. This includes the ability to plan behaviour, think flexibly about a situation and to
follow rules. Theory of mind is the ability to understand why other people behave the way
they do. It is hoped that this research will increase understanding of the role of these factors in
the development of childhood aggression and inform the development of interventions to help
reduce this behaviour.
The study will follow children in Nursery, Reception and Year 1 over a 12 month period. The
study will involve myself coming into the school 3 times, approximately 6 months apart. Each
time I visit the school, I would ask the relevant class teacher and teaching assistants to
complete a short questionnaire for each child in their class to gain a measure of the children’s
prosocial and aggressive behaviour. Thus, if you are a Nursery teacher/teaching assistant I will
ask you to complete the questionnaire at Time 1 only. If you are a Reception teacher/teaching
assistant I will ask you to complete the questionnaires at Time 1 and 2. If you are a Year 1
teacher/teaching assistant I will ask you to complete the questionnaires at all three time points
and if you are a Year 2 teacher/teaching assistant I will be ask you to complete the
questionnaires at Time 3 only. The questionnaire should take 2 – 5 minutes per child to
complete.
The data from this study will be written up as part of my thesis and may be published. All data
will be treated confidentially and all data will be published anonymously; the name of the
school, teachers and children will not be published. Individual child data will not be available.
Should you wish to withdraw your data from the study you will have up until the 31/07/15 to

382
withdraw your data. Withdrawal of your data will not affect your standing with the school or
university.
Your participation in this study would be greatly appreciated.
If you would like to participate in the study please complete the attached consent form and
return it to me. If you do not wish to participate it will not affect your standing with your
school or the University of Greenwich. If you have any questions do not hesitate to contact
me. To thank you for your participation I will provide you with a summary of the findings of
the research once it is completed.
Thank you for taking the time to consider my research.
Kind Regards,
Sarah Poland.

383
PARTICIPANT CONSENT FORM The Role of Executive Function and Theory of Mind in Children’s Social
Behaviour
To be completed by the participant.
Please read the following statements and sign below if you agree to participate in the study:
I have read the information sheet about this study.
I have had an opportunity to ask questions and discuss this study.
If I have had questions, I have received satisfactory answers.
I have received enough information about this study.
I understand that I am free to withdraw from this study: o At any time (until 31/07/2015) o Without giving a reason for withdrawing o If I am, or intend to become, a student at the University of Greenwich,
without affecting my future with the University.
I agree to take part in this study
Signed (participant): Date:
Name in block letters:
Class:
Signature of researcher: Date:
The data from this study may be published (anonymously) and may be used in further research projects in anonymous form. If you do not agree to this please tick the box opposite.
384
Appendix D: Recruitment letter to parents/guardians
IMPORTANT!
Please complete the attached form and return to school
Dear Parent/Caregiver, Your child's school has agreed to participate in my research and I am writing to ask
for your consent for your child to participate in the study.
The study is being carried out to explore the development of social behaviour in
children, with a focus on prosocial and aggressive behaviour. Children who
participate in the study will be asked to complete a selection of age appropriate tasks
with myself (Sarah Poland) at school. The tasks are designed to be fun games. I will
be coming into the school three times across the next 12 months and each time I will
ask those children participating in the study to complete the tasks.
Your child’s participation would be greatly appreciated.
Please complete the attached consent form to consent to/or withdraw your child from
the study and return it to your child’s class teacher.
For more detailed information about the study, please see the information sheet
overleaf. If you have any questions please do not hesitate to contact me.
Thank you for taking the time to consider my research.
Kind regards, Sarah Poland.
Sarah Poland (PhD student)
Department of Psychology
University of Greenwich
Bronte B312, Avery Hill Road,
Eltham, London, SE9 2UG
Supervisors:
Dr Claire Monks
Dr Stella Tsermentseli

385
Information Sheet
The Role of Executive Function and Theory of Mind in Children’s Social Behaviour
This study is being carried out as part of my MPhil/PhD and investigates social behaviour in
children, focussing on prosocial and aggressive behaviour. The research explores the effect of
children’s executive function and theory of mind abilities on their behaviour. Executive
function is the ability to control behaviour. For example, it includes the ability to filter
distractions and plan behaviour. Theory of mind refers to the ability to understand why other
people behave the way they do. It is hoped that this research will increase understanding of the
role of these factors in the development of children’s social behaviours, such as aggression.
The study will involve children being asked to take part in a selection of fun and age
appropriate tasks, which look at children’s executive function and theory of mind skills.
Children will complete these tasks with me (Sarah Poland) at their school (I have DBS
clearance). The tasks are designed to be like games. For example, the fish/shark task is a
computer task that asks children to catch fish by pressing a button each time a fish appears on
the screen, but to avoid catching sharks by not pressing the button when they see a shark. For
more details about the tasks please contact me. These tasks are not tests of children’s abilities
and individual child data will not be made available. The tasks will be spread across a
maximum of three sessions, with each session lasting no longer than 30 minutes. In addition,
as part of the study teachers and teaching assistants will be asked to complete a questionnaire
for each child participating in the study asking about their prosocial and aggressive behaviour.
I will return to the school again after 6 months and 12 months to complete the tasks again with
the children.
The data from this study will be written up as part of my thesis and may be published. All data
will be treated confidentially and all data will be published anonymously; the name of the
school, teachers and children will not be published. Should you wish to withdraw your child's
data from the study you will have up until the 31/07/2015 to withdraw their data. Withdrawing
your child's data from the study will not affect your or your child's standing with the school or
the university.
If you are happy for your child to participate in the study please complete the attached consent
form and return it to your child’s class teacher. If you have any questions please do not
hesitate to contact me. If you would like to see a summary of the findings of the research once
it is completed please let me know.
Thank you for taking the time to consider my research. Your child’s participation would be
greatly appreciated.
CONSENT FORM (please complete and return to school)
To be completed by the parent/caregiver of the child participant.
Contact Details Researcher: Contact Details Project Supervisors:
Sarah Poland
02083319925
Dr Claire Monks
Dr Stella Tsermentseli

386
Child’s name:
Child’s class:
Please tick the relevant option below:
I do give consent for my child to participate in the study
I do not give consent for my child to participate in the study
Please read the following statements and sign below:
I have received an information sheet about this study.
The information sheet provided me with contact information should I wish to ask any questions about the study.
I have received enough information about this study
I understand that I am free to withdraw my child from this study: o At any time (until the 31/07/2015) o Without giving a reason for withdrawing o Without affecting my/my child’s current/future standing with the
University
Signed (parent/caregiver):
Date:
The data from this study may be published (anonymously) and may be used in further projects in anonymous form. If you do not agree to this, please tick the box opposite.

387
Appendix E: Teacher/Teaching assistant debrief letter
The Role of Executive Function and Theory of Mind in the Function and Form of
Children's Aggression
Thank you for taking the time to participate in my research. Your participation is greatly appreciated.
I am carrying out this study as part of my Psychology MPhil/PhD programme. The purpose of this study
was to investigate the role of executive function and theory of mind in children's aggressive behaviour.
Executive function is an umbrella term for cognitive abilities that allow for purposeful, goal directed
behaviour. Theory of mind is the ability to understand why other people behave the way they do. My
research explores whether children's executive function and theory of mind abilities are associated with
levels of aggressive behaviour.
The two questionnaires you completed for each child in your class will be used to gain a measure of
children's level of prosocial and aggressive behaviour. The Preschool Proactive and Reactive Aggression
Scale distinguishes between the different functions and forms of aggression. There are two main functions
of aggression: proactive and reactive. Proactive aggression is when aggression is used to obtain
something, whereas reactive aggression is when aggression is a response to provocation. The
questionnaire also identifies two forms of aggression: physical, which includes hitting and kicking, and
relational, which involves social exclusion. Your responses will be used to assess the level of each type of
aggression children display. My research will explore the relationship between children's executive
function and theory of mind skills and the function and form of children's aggressive behaviour.
The data from this study will be written up as part of my thesis and may be published. Your questionnaire
responses are confidential and anonymous. Data will be published anonymously; the name of the school,
teachers and children will not be published. Individual child data will not be available or published. Data
will be kept for 7 years and will then be securely destroyed.
Should you wish to withdraw your data from the study please complete and return the form below. You
will have up until the XX/XX/XX to withdraw your data. Withdrawal of your data will not affect your
standing with the University of Greenwich.
If you have any questions concerning the research please feel free to contact myself (Sarah Poland) at
[email protected], or one of my supervisors (Dr Claire Monks: [email protected];
or Dr Stella Tsermentseli: [email protected]).
Thank you for taking the time to participate in my research.
Study: The role of Executive Function and Theory of Mind in the Function and Form of Children's
aggression.
I wish to withdraw my data from the above study.
Name
Signature
Date

388
Appendix F: Parent/Guardian debrief letter
The Role of Executive Function and Theory of Mind in the Function and Form of
Children's Aggression
Thank you for letting your child participate in my research. Your child's participation is greatly
appreciated.
I am carrying out this study as part of my Psychology MPhil/PhD programme. The purpose of this study
was to investigate the role of executive function and theory of mind in children's aggressive behaviour.
Executive function is an umbrella term for cognitive abilities that allow for purposeful, goal directed
behaviour. Theory of mind is the ability to understand why other people behave the way they do. My
research explores whether children's executive function and theory of mind abilities are associated with
levels of aggressive behaviour.
The study followed Reception and Year 1 teachers and children over 12 months. Teachers completed
questionnaires for each child in their class which measured levels of prosocial and aggressive behaviour.
Children completed several age-appropriate, fun tasks measuring their executive function and theory of
mind skills. Children's level of aggression and executive function and theory of mind performance will be
explored to see if there is an association.
The data from this study will be written up as part of my thesis and may be published. All data is
confidential and anonymous. Data will be published anonymously; the name of the school, teachers and
children will not be published. Individual child data will not be available or published. Data will be kept
for 7 years and will then be securely destroyed.
Should you wish to withdraw your child's data from the study please complete and return the form below.
You will have up until the XX/XX/XX to withdraw your child's data. Withdrawal of your child’s data will
not affect your own or your child’s standing with the University of Greenwich.
If you have any questions concerning the research please feel free to contact myself (Sarah Poland) at
[email protected], or one of my supervisors (Dr Claire Monks: [email protected];
or Dr Stella Tsermentseli: [email protected]).
Thank you for letting your child participate in my research.
Study: The role of Executive Function and Theory of Mind in the Function and Form of Children's
aggression.
I wish to withdraw my child's data from the above study.
Child's Name
Parent/Caregiver
Signature
Date

389
Appendix G: Pilot Study
Pilot Study
A pilot study was carried out before the main study commenced. The aim of the pilot
study was to ensure the tasks were understood by the children and that they were
developmentally appropriate for the age range. The pilot study further aimed to test the
procedure of the study and to identify any adjustments that were required.
Sample and Method
The pilot study was carried out at one of the schools recruited for the main study.
Eleven children from one Reception class and one Year 2 Class were recruited. Children were
between 4 and 7 years of age. A further 3 children (aged 7 years) were recruited from a
second Year 2 class during the pilot study as additional children at the upper end of the age
range were needed. The children who participated in the pilot study did not form part of the
sample in the main study. The teachers and teaching assistants of the children in the pilot
study also participated.
Before starting the pilot study the researcher was introduced to the children by a
teacher to help the children feel more comfortable with the researcher. Teaching staff
completed the PPRA-TR and the social behaviour and peer acceptance scale from the PSBS-T
for each child in their class participating in the study. Each child took part in three assessment
sessions. In the first session children completed the BPVS and the CDMT. In the second
session, children completed the ToL, Digit Span, Sally-Anne 1st order task and the Go/No-Go
and in the final session, children completed the Deceptive Contents, the Sally-Anne 2nd
order, the peer nomination and the Gift Delay tasks.
Outcomes of Pilot Study
The pilot study revealed that three sessions were sufficient. Each session lasted
between 20 to 45 minutes. Both the school and the children appeared to find the length and
number of sessions manageable. Being introduced by a teacher first to the children worked
well in helping the children feel more comfortable working with the researcher. Teaching
staff did not indicate any issues with the questionnaires. There were no issues apparent with
the BPVS, Go/No-Go, ToM or Gift Wrap tasks. Although, the Digit Span task was not
developed for children younger than 6 years of age, children aged 3 to 5 years were able to
understand and complete the forward subtest. In addition, the majority of the children were
able to understand the concept of recalling numbers backwards and were able to complete one
or two trials on the backward subtest. The pilot study, though, did highlight a few issues with
some of the tasks.

390
Modifications to Child Decision Making Task
Children were able to quickly understand the rules of the CDMT and were able in
general to stay focussed to complete 50 trials. In addition, children were able to understand
that the beads could then be exchanged for stickers. However, during the task some children
attempted to take cards from the middle of the deck as opposed to the front. To address these
issues it was decided that this rule would be emphasised to a greater extent at the start. The
researcher did this by tapping the front of each card and stressing that only the front card in
the box could be taken. In addition, children were very keen to open the flap to reveal the sad
faces and some children attempted to do this before attending to the reward information (e.g.
happy faces). To reduce this issue it was emphasised during the 6 practice trials that you had
to first attend to the happy faces. During the task the researcher also reminded the child if they
went to open the flap that they had not yet looked at how many beads they had won. A further
issue that was highlighted with the CDMT was that two of the children did not complete all
50 trials because they ran out of beads. To address this issue it was decided that rather than
starting with 10 beads the children would start with 15 beads. Furthermore, if children ran out
of beads the task would be re-started. These modifications were tested with the three
additional Year 2 children. Children gained a better understanding of the rules of the task and
were able to complete all trials.
Modifications to Tower of London Task
Children, including children that were at the upper end of the age range, found
learning the rules of the ToL difficult during the pilot study. In particular, children appeared
to struggle with the rule of only removing one bead from a peg at a time. In the pilot study
only a 1-move problem was included as a practice. To address this issue therefore it was
decided that demonstration of the rules would be longer and that children would be given two
2-move problems as a practice. In addition, children often started trying to solve the problem
before the researcher had finished constructing the problem on their board. To address this
issue the research emphasised at the beginning of the task that the child had to wait until the
researcher said they could start. A further issue that was raised by the pilot study was that it
was not possible to reliably record initiation time without filming children completing the
task. Initiation time was therefore not included as a measure of performance in the main
study. These modifications were tested with the additional children. Children were able to
grasp the rules of the task more easily with these modifications.
Modifications to Peer Report Method
Children were able to understand the difference between the function and form of
aggression illustrated by the stick figure images. The first two children, though, did not make
391
any nominations. In the pilot study the peer nominations of children's social behaviour were
gathered before sociometric measures. After the first two children the procedure was altered
so that sociometric measures were gathered before behaviour reports. In addition, reassurance
was provided by the researcher before the task began that the nominations were confidential
and that there were no right or wrong answers. These alterations seemed to make children feel
more at ease providing peer nominations. In the pilot study 10 pictures were presented to the
children: two pictures of each type of behaviour. The children found having multiple pictures
of the same type of behaviour confusing and a bit tedious. It also caused issues with scoring
because often the same nominations were made for both of the pictures. In the main study it
was therefore decided that only one picture of each type of aggression would be used. The
pictures that were included in the final study were selected based on children's understanding
of the pictures during the pilot study; the pictures that children more readily understood were
selected.

392
Appendix H: Teacher Questionnaire (PPRA-TR & PSBS-T)
Please think about how the child behaves during the school day; both inside the classroom
and out on the playground. Please circle the number which you feel best represents how
true the statement is of the child. Please answer all questions.
Never or
Almost
Never
True
Not Often Sometime
s Often
Always or
Almost
Always
True
1. When this child is hurt
by someone, s/he will
often physically fight back.
1 2 3 4 5
2. If other children hurt
this child, s/he often
keeps them from being in
their group of friends.
1 2 3 4 5
3. If other children make
this child mad, s/he will
often physically hurt
them.
1 2 3 4 5
4. This child often keeps
others from being in
her/his group of friends to
get what s/he wants.
1 2 3 4 5
5. This child often starts
physical fights to get what
s/he wants.
1 2 3 4 5
6. This child often
threatens others
physically to get what s/he
wants.
1 2 3 4 5
7. If other children anger
this child, s/he will often
1 2 3 4 5

393
hit, kick, or punch them.
8. When s/he is angry at
others, this child will often
tell them that s/he won’t
be their friend anymore.
1 2 3 4 5
9. When s/he is upset with
others, this child will often
ignore or stop talking to
them.
1 2 3 4 5
10. To get what this child
wants, s/he often tells
others that s/he won’t be
their friend anymore.
1 2 3 4 5
11. This child often hit,
kicks, or punches to get
what s/he wants.
1 2 3 4 5
12. To get what this child
wants, s/he often will
ignore or stop talking to
others.
1 2 3 4 5
13. This child is well liked
by peers of the same sex.
1 2 3 4 5
14. This child is well liked
by peers of the opposite
sex.
1 2 3 4 5
15. Is good at sharing and
taking turns.
1 2 3 4 5
16. Is helpful to peers.
1 2 3 4 5
17. Is kind to peers.
1 2 3 4 5
18. Says or does nice
things for other kids.
1 2 3 4 5

394
Appendix I: ToL Instructions
(Prior to each trial place the participant’s beads in the start configuration then reconfigure
the researcher’s board into the next problem.)
“See these two boards? They are both alike. This board will be your one and this board will
be mine. I am going to put my beads on the pegs in different ways and then you see whether
you can make your beads look like mine. You can only move your beads the same number of
times I moved my beads though. So if I make two moves, you can only make two moves.
Watch me.”
“I am going to move my beads first. Now, there is one rule you have to follow. You have to
move your beads one at a time. You cannot have two beads off the peg at the same time,
like this. You must always put the bead back on a peg before moving the next one, like this.
Do you understand the rule?”
(Remove all beads from the researcher’s board and set up the demonstration problem.)
“Right, now you see if you can make your beads look like mine. I made two moves, so you
can only make two moves to get your beads to look like mine.”
If the participant violates a rule, stop the participant and return the beads to their previous
pegs. “You broke the rule. Remember you cannot have more than one bead off a peg at the
same time. Go ahead, finish making your beads look like mine.”
If the participant fails the practice problem by making extra moves, return the participants
beads to the start configuration: “That was a good try, but you made extra moves.
Remember you can only make x moves. Now you try again.”
When the child correctly solves the practice problem say, “Well done! You did great!”
“Now I am going to set up more bead patterns and then you see if you can make them in the
same number of moves as me. You may find that some of the patterns are difficult, but do
the best you can.”
Following the set-up of each test problem say, “Now you make your beads look like mine in x
number of moves.”

395
Appendix J: CDMT reward/loss contingencies
Card No. 1 2 3 4 5 6 7 8 9 10
- Deck 0 0 -4 0 -6 0 4 0 5 -6
+ Deck 0 0 -1 0 -1 0 -1 0 -1 -1
Card No. 11 12 13 14 15 16 17 18 19 20
- Deck 0 -6 0 -5 -4 0 -6 -4 0 0
+ Deck 0 -1 -1 0 0 0 -1 -1 0 -1
Card No. 21 22 23 24 25 26 27 28 29 30
- Deck 0 -6 0 -6 0 -4 -5 -4 0 0
+ Deck 0 0 0 -1 -1 -1 0 0 -1 -1
Card No. 31 32 33 34 35 36 37 38 39 40
- Deck -6 -4 -5 0 0 0 -4 -6 0 0
+ Deck 0 0 0 -1 -1 0 -1 0 -1 -1
Card No. 41 42 43 44 45 46 47 48 49 50
- Deck 0 0 -4 0 -6 0 -4 0 -5 -6
+ Deck 0 0 -1 0 -1 0 -1 0 -1 -1
396
Appendix K: CDMT Instructions
(Card set is counterbalanced and left and right positioning of the decks is determined
randomly for each child)
"In this game you have to try and win as many beads as possible. We can put the beads you
win in this tube here. The more beads you manage to win, the more stickers you get to keep.
Look, if you fill the tube then you win 6 stickers. I am going to give you 15 beads to play the
game and I will show you how the game works and how you can win more beads."
Count out 15 beads and place them in child's tube.
"Right, you get to pick a card from either of these two decks. Let me show you. Lets pick this
card first."
Select 3 cards consecutively from each deck, starting with the striped cards. Place the card in
front of the child.
"Look, there are two happy faces - that means you win 2 beads."
"Ok, now we have to open this up and see if there are any sad faces. Look, there are 4 sad
faces - that means you lose 4 beads, so we have to give 4 back."
After 4 test trials: "We don't like sad faces, do we? Because we lose beads. We like happy
faces, right? Because we win beads and the more beads you win the more stickers you get to
keep."
After 6 test trials: "Remember, we like happy faces because we win beads, but we don't like
sad faces because we lose beads. The more beads you win the more stickers you get to win!
"Now we are ready to start playing the game. You get to choose whichever card you want to
play with every time. You can play from the dots or the stripes or from both. You get to chose
one card every time and you can pick as many cards as you want until I say stop and then the
game will be done. So remember, you want to make sure that you win as many beads as
possible! If you fill the tube you win 5 stickers! Are you ready to play? O.k, which card do you
want to pick first?
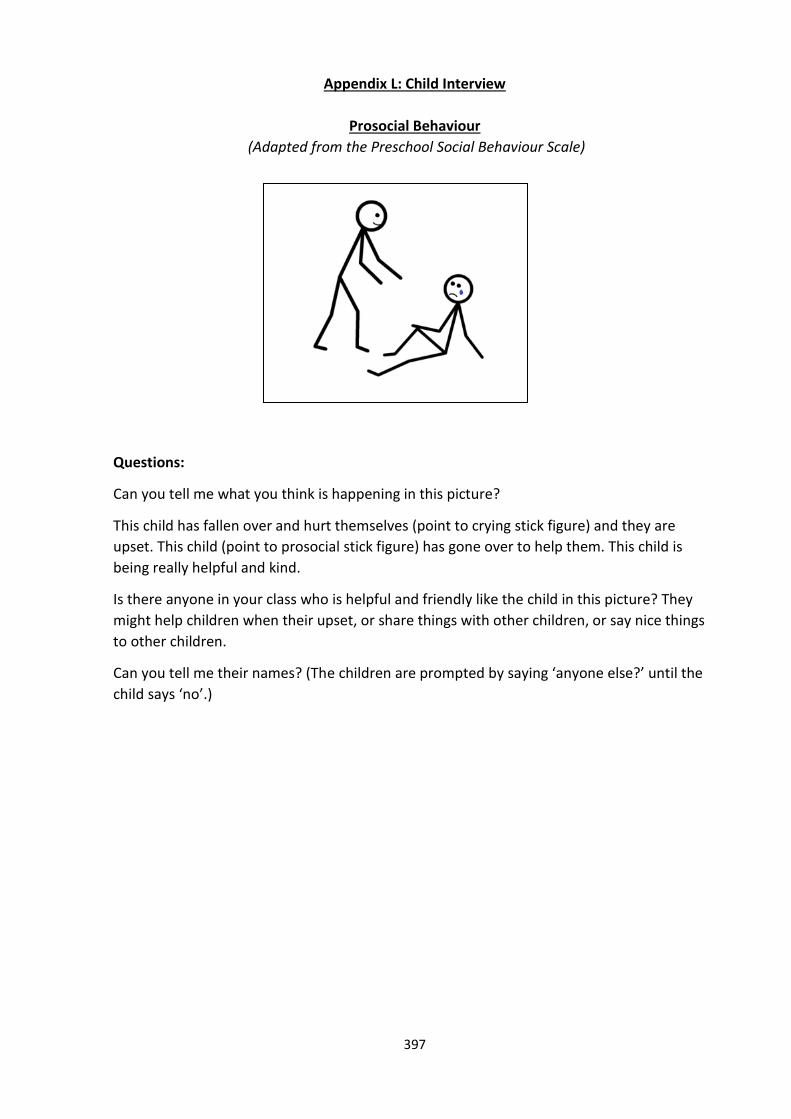
397
Appendix L: Child Interview
Prosocial Behaviour
(Adapted from the Preschool Social Behaviour Scale)
Questions:
Can you tell me what you think is happening in this picture?
This child has fallen over and hurt themselves (point to crying stick figure) and they are
upset. This child (point to prosocial stick figure) has gone over to help them. This child is
being really helpful and kind.
Is there anyone in your class who is helpful and friendly like the child in this picture? They
might help children when their upset, or share things with other children, or say nice things
to other children.
Can you tell me their names? (The children are prompted by saying ‘anyone else?’ until the
child says ‘no’.)
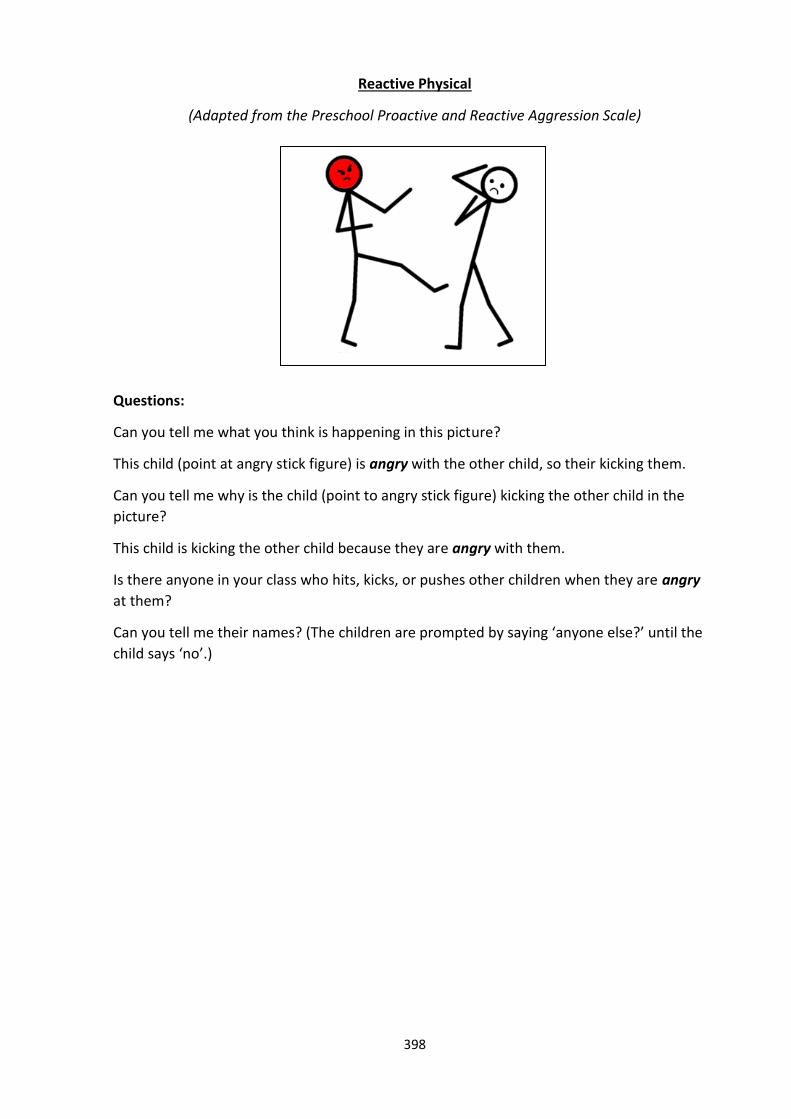
398
Reactive Physical
(Adapted from the Preschool Proactive and Reactive Aggression Scale)
Questions:
Can you tell me what you think is happening in this picture?
This child (point at angry stick figure) is angry with the other child, so their kicking them.
Can you tell me why is the child (point to angry stick figure) kicking the other child in the
picture?
This child is kicking the other child because they are angry with them.
Is there anyone in your class who hits, kicks, or pushes other children when they are angry
at them?
Can you tell me their names? (The children are prompted by saying ‘anyone else?’ until the
child says ‘no’.)
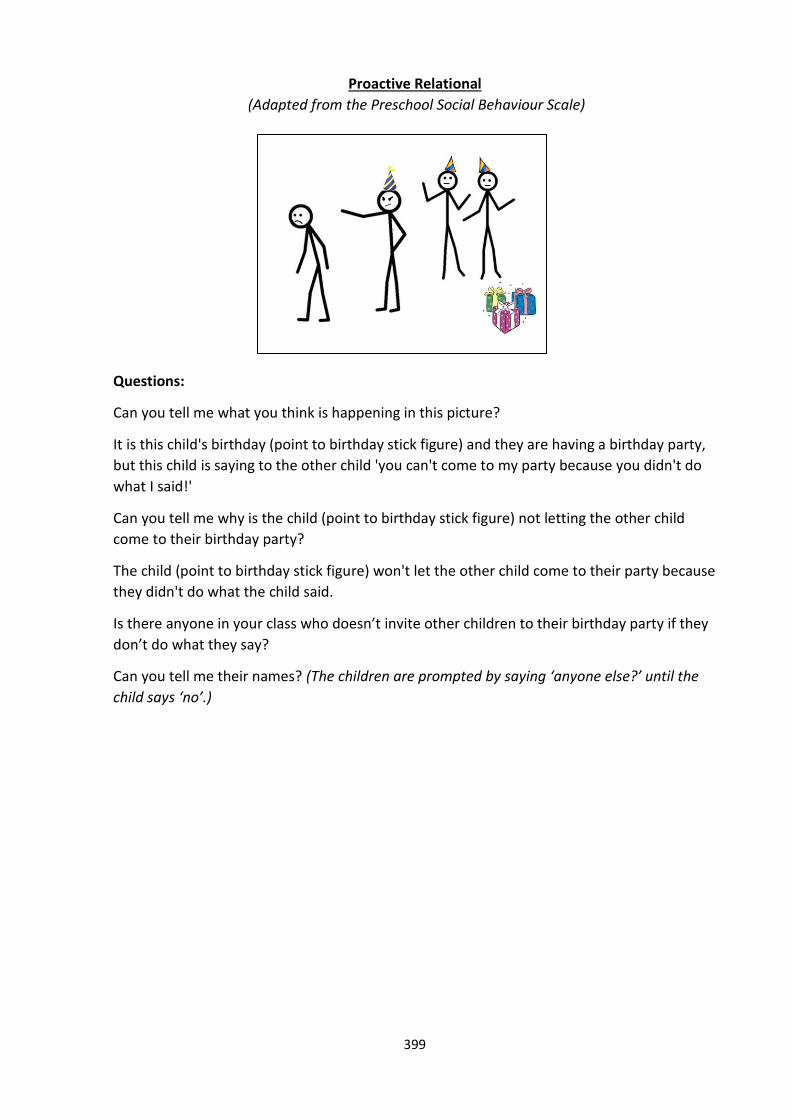
399
Proactive Relational
(Adapted from the Preschool Social Behaviour Scale)
Questions:
Can you tell me what you think is happening in this picture?
It is this child's birthday (point to birthday stick figure) and they are having a birthday party,
but this child is saying to the other child 'you can't come to my party because you didn't do
what I said!'
Can you tell me why is the child (point to birthday stick figure) not letting the other child
come to their birthday party?
The child (point to birthday stick figure) won't let the other child come to their party because
they didn't do what the child said.
Is there anyone in your class who doesn’t invite other children to their birthday party if they
don’t do what they say?
Can you tell me their names? (The children are prompted by saying ‘anyone else?’ until the
child says ‘no’.)

400
Reactive Relational
(Adapted from the Preschool Social Behaviour Scale)
Questions:
Can you tell me what you think is happening in this picture?
This child (point to angry stick figure) is saying to the other child 'go away, you can't play
with use because I am angry with you!'
Can you tell me why is the child not letting the other child be their friend of play with them
in the picture?
This child (point to angry stick figure) won't let the other child play with them because they
are angry with them.
Is there anyone in your class who tells other children they play with them or be their friend if
they are angry with them?
Can you tell me their names? (The children are prompted by saying ‘anyone else?’ until the
child says ‘no’.)

401
Proactive Physical
(Adapted from the Preschool Proactive and Reactive Aggression Scale)
Questions:
Can you tell me what you think is happening in this picture?
This child (point to aggressive stick figure) is hitting the other child because they want the
blue crayon.
Can you tell me why is the child hitting the other child in the picture?
The child (point to aggressive stick figure) is hitting the other child because they want the
blue crayon.
Is there anyone in your class who hits, kicks or pushes other children to get what they want?
Can you tell me their names? (The children are prompted by saying ‘anyone else?’ until the
child says ‘no’.)