cohesion policy - european...
TRANSCRIPT

Synthesis report
EN
Evaluation report April 2010
Ex-Post Evaluation of Cohesion Policy programmes 2000-06 co-financed by the ERDF (Objective 1 & 2)
Cohesion Policy

Ex Post Evaluation of Cohesion Policy Programmes
2000-2006 financed by the
European Regional Development Fund in
Objective 1 and 2 Regions
Synthesis Report
March 2010
The Vienna Institute for International Economic Studies ISMERI EUROPA
Synthesis Report Ex-post Evaluation of the ERDF 2000-2006
2
Acknowledgments
This Report has been prepared by Terry Ward, Applica, in cooperation with Enrico Wolleb, ISMERI Europa. They were assisted by Lydia Greunz, Loredana Sementini and Fadila Sanoussi of Applica, Andrea Naldini and Marco Pompili of ISMERI Europa and Roman Römisch of wiiw.
The authors would like to thank the members of the Expert Panel for their comments during the course of the evaluation and the country experts for providing essential material for Chapter 4 on regional developments in each of the 25 EU Member States. They are equally grateful to Veronica Gaffey and Kai Stryczynski of the Evaluation Unit of DG Regional Policy for valuable comments on earlier versions of the report as well as to members of the Steering Committee.
The report is a based on all the various Work Packages and studies undertaken for the evaluation, which are listed below together with those responsible for the reports produced, all of which are available on the DG Regional Policy website:
http://ec.europa.eu/regional_policy/sources/docgener/evaluation/rado2_en.htm
This report is a synthesis of the findings of these studies and of the substantial amount of material and evidence collected. It is not a summary of them, for which readers are referred to the Work Packages themselves.
The views expressed in this report are those of the authors and do not necessarily reflect the official opinion of the European Commission or indeed of any of the authors of the Work Packages. Any errors or omissions remain the responsibility of the authors.
Quotation is authorised as long as the source is acknowledged.
Ex-post Evaluation of the ERDF 2000-2006 Synthesis Report
3
WORK PACKAGES AND MAIN AUTHORS
WP Title Main Authors Organisation
WP1 Terry Ward Applica Lydia Greunz Applica Loredana Sementini Applica Andrea Naldini ISMERI Europa
Analysis, synthesis, co-ordination
Enrico Wolleb ISMERI Europa Roman Römisch wiiw WP2 Mary van Overbeke ADE
Data feasibility study Christophe Sauboin ADE
WP3 John Bradley EMDS Gerhard Untiedt GEFRA Jan In 't Veld European Commission, DG ECFIN
Macroeconomic modelling
Janos Varga European Commission, DG ECFIN WP4 Structural Change and
Globalisation Massimo Florio Julie Pellegrin Michael Ploder Michal Miedzinsky
CSIL - Centre for Industrial StudiesCSIL - Centre for Industrial StudiesJoanneum Research Technopolis
WP5a Transport Simon Nielsen Simon Ellis Francesco Dionori
Steer Davies Gleave Steer Davies Gleave Steer Davies Gleave
WP5b Mary van Overbeke ADE
Environment, Climate Change Benoit Lixon ADE
WP6b Annegret Bötel Rambøll Management Benita Kidmose Rytz Rambøll Management Xavier Le Den Rambøll Management
Enterprise support - evidence from the 30 biggest programmes
Thomas Westergaard-Kabelmann Rambøll Management WP6c Enterprise support -
econometric and counterfactual approach
Björn Alecke Anne Otto Gerhard Untiedt
GEFRA IAB GEFRA
WP7 Manuela Samek Lodovici IRS-Istituto per la Ricerca Sociale
Gender Equality and Demographic Change Flavia Pesce
Silvia Vignetti
IRS-Istituto per la Ricerca SocialeCSIL
WP9 Rural development Herta Tödtling-Schönhofer METIS Isabelle Naylon METIS Erich Dallhammer
Bernd Schuh ÖIR ÖIR
WP10 Efficiency Hugh Kelly RGL Forensics Oliver Hogan RGL Forensics Chris Hidle Faber Maunsell - AECOM Jose Carbajo Frontier Economics WP11 John Bachtler EPRC Laura Polverari EPRC
Management and Implementation Systems for Cohesion Policy Keith Clement
Frederike Gross Irene McMaster Hildegard Oraze Herta Tödtling-Schönhofer Isabel Naylon
EPRC EPRC EPRC METIS METIS METIS

Synthesis Report Ex-post Evaluation of the ERDF 2000-2006
4
LIST OF EXPERTS WHO ADVISED ON THE WORK PACKAGES
WP Title Experts Organisation
WP1 Analysis, synthesis co-ordination
Michael Dunford Sebastiano Fadda Augusto Mateus
University of Sussex University of Rome III Technical University of Lisbon
WP4 Structural Change and Globalisation
Maurice Baslé Andres Rodriguez Pose Harvey Armstrong
University of Rennes London School of Economics Sheffield University
WP5a Transport Roger Vickerman Kent University José Manuel Vassallo Polytechnic University of Madrid Gabriele Pasqui Politecnino di Milano WP5b Environment, Climate
Change Kit Strange Luc De Cordier Milan Scasny
Resource Recovery Forum, UK Union Wallon des Entreprises Charles University, Czech Republic
WP6b Enterprise support - evidence from the 30 biggest programmes
Dirk Czarnitzki Marianne Simonsen
University of Leuven University of Aarhus
WP6c Enterprise support - econometric and counterfactual approach
Alberto Martini Joachim Ragnitz
Progetto Valutazione Ifo Institute, Dresden
WP7 Gender Equality and Demographic Change
Gianfranco Viesti Charlotte Höhn Paola Villa
Italian Trade Commission Former President of Bundesinstitut für Bevölkerungsforschung Università degli Studi di Trento
WP9 Rural development Janet Dwyer University of Gloucestershire Hans Wiskerke Wageningen University Ilari Karppi University of Tampere WP10 Efficiency Jacques Timmermans Former staff member of European
Court of Auditors Nigel Grout Chartered Institute of Arbitrators of
the Institute of Highways and Transportation
Bent Flyvbjerg University of Oxford WP11 Management and
Implementation Systems for Cohesion Policy
Daniel Tarschys Danielle Anne Bossaert Michael Narodoslawsky
University of Stockholm European Institute of Public Administration Graz University of Technology

Ex-post Evaluation of the ERDF 2000-2006 Synthesis Report
5
Acronyms
CSF Community Support Framework DG Directorate-General DG REGIO Directorate General for Regional Policy EAGGF European Agricultural Guidance and Guarantee Fund EBRD European Bank for Reconstruction and Development EC European Commission EIB European Investment Bank ERDF European Regional Development Fund ESF European Social Fund EU European Union EUROSTAT Statistical Office of the European Communities FDI Foreign Direct Investment FIFG Financial Instrument for Fisheries Guidance FOI Field of interventions GDP Gross Domestic Product GHG Greenhouse Gas ICT Information and Communication Technology ISPA Instrument for Structural Policies for Pre-Accession NUTS Nomenclature of Territorial Units for Statistics OECD Organisation for Economic Co-operation and Development OP Operational Programme PPS Purchasing Power Standard R&D Research and Development RTDI Research, Technological Development and Innovation SME Small or medium-sized enterprise TEN-T Trans European Transport Network WP Work Package
Member State acronyms
BE Belgium LU Luxembourg CZ The Czech Republic HU Hungary DK Denmark MT Malta DE Germany NL The Netherlands EE Estonia AT Austria IE Ireland PL Poland EL Greece PT Portugal ES Spain SI Slovenia FR France SK Slovakia IT Italy FI Finland CY Cyprus SE Sweden LV Latvia UK United Kingdom LT Lithuania

Synthesis Report Ex-post Evaluation of the ERDF 2000-2006
6
CONTENTS INTRODUCTION....................................................................................................................................7 THE APPROACH ADOPTED ......................................................................................................................... 8 THE CHALLENGES OF THE EVALUATION ....................................................................................................... 10 CHANGING CIRCUMSTANCES AND NEW ISSUES............................................................................................... 11 EU15 VERSUS EU10 AND OBJECTIVE 1 VERSUS OBJECTIVE 2 REGIONS................................................................ 12 OUTLINE OF REPORT.............................................................................................................................. 13 CHAPTER 1 – THE NATURE OF COHESION POLICY, 2000-2006 ..........................................................17 1.1 THE POLICY CONTEXT................................................................................................................... 17 1.2 ALLOCATION OF ERDF FINANCING BETWEEN BROAD POLICY AREAS ........................................................... 28 1.3 ALLOCATION OF ERDF FUNDING BETWEEN TYPES OF AREA...................................................................... 33 1.4 POLICY OBJECTIVES, ECONOMIC THEORY AND POLICY RECOMMENDATIONS................................................... 42 1.5 THE ABSORPTION OF THE ERDF ALLOCATED....................................................................................... 43 CHAPTER 2 – REGIONAL DEVELOPMENTS, 2000-2006 .......................................................................46 2.1 INTRODUCTION........................................................................................................................... 46 2.2 MACROECONOMIC DEVELOPMENTS OVER THE PERIOD 2000-2006 .......................................................... 46 2.3 THE GROWTH PERFORMANCE OF ASSISTED AND NON-ASSISTED REGIONS, 2000-2006................................... 53 2.4 MAIN POINTS TO EMERGE............................................................................................................... 63 CHAPTER 3 – POLICY OUTCOMES AND EFFECTS IN MAIN POLICY AREAS ............................................65 3.1 ENTERPRISE SUPPORT.................................................................................................................... 65 3.2 EVALUATING ENTERPRISE SUPPORT IN EASTERN GERMANY USING COUNTERFACTUAL METHODS .......................... 73 3.3 RESTRUCTURING IN OBJECTIVE 2 REGIONS .......................................................................................... 75 3.4 TRANSPORT ............................................................................................................................... 77 3.5 UNIT COSTS OF MAJOR PROJECTS ..................................................................................................... 88 3.6 SUPPORT FOR THE ENVIRONMENT..................................................................................................... 89 3.7 CLIMATE CHANGE AND SUSTAINABLE DEVELOPMENT ............................................................................ 101 3.8 RURAL DEVELOPMENT ................................................................................................................. 102 3.9 GENDER EQUALITY AND DEMOGRAPHIC CHANGE................................................................................. 106 3.10 CONTRIBUTION OF THE MANAGEMENT AND IMPLEMENTATION SYSTEM TO DELIVERING EFFECTIVE POLICIES ......... 110 CHAPTER 4 – THE EFFECT OF COHESION POLICY ON ECONOMIC GROWTH AND REGIONAL DEVELOPMENT .................................................................................................................................112 4.1 USING MACROECONOMIC MODELS TO ESTIMATE THE EFFECTS OF COHESION POLICY ..................................... 112 4.2 THE EFFECT OF COHESION POLICY ON THE REGIONS ASSISTED................................................................. 120 CHAPTER 5 – CONCLUSIONS AND IMPLICATIONS FOR FUTURE POLICY.............................................153 5.1 MAIN CONCLUSIONS................................................................................................................... 153 5.2 IMPLICATIONS FOR COHESION POLICY IN THE FUTURE ........................................................................... 163 ANNEX – CASE STUDY REGIONS........................................................................................................170

Ex-post Evaluation of the ERDF 2000-2006 Synthesis Report
7
1 Introduction
The purpose of the present report is to synthesise the results of the ex post evaluation of cohesion policy in Objective 1 and Objective 2 regions across the EU over the 2000-2006 programming period. The particular focus is on the ERDF (European Regional Development Fund),
The aim is threefold:
• to examine how the finance provided by the ERDF was used in the regions concerned in both the EU15 countries and the EU10 countries which entered the Union in 2004;
• to consider the effects of ERDF support in these regions and how far they furthered the pursuit of the goals of cohesion policy;
• to draw lessons from the experience over the period in order to improve both the design and operation of policy in future years, especially from 2014 onwards.
In practice, however, though the focus is on the ERDF which accounted for almost two-thirds of the finance made available over the period, its effects cannot be separated from those of the other sources of finance which make up the Structural Funds. These are the ESF (European Social Fund), aimed at supporting human resource development and disadvantaged groups, the EAGGF (the European Agriculture Guidance and Guarantee Fund), for supporting rural development and the FIFG (Financial Instrument for Fisheries Guidance), for restructuring the fishing industry. Together they are intended to provide the financial means of pursuing integrated development strategies across the EU.
A further source of finance, the Cohesion Fund, is complementary to the ERDF and was used over the period to support investment in transport and environmental infrastructure in Member States with relatively low levels of national income – specifically, Greece, Spain, Portugal and Ireland in the EU15 and all of the EU10 countries which entered the Union in May, 20041.
Evaluations either have been carried out, or are in the process of being carried out, on each of the above Funds2. Together with the present evaluation, they are intended to give an overall view of how the substantial amount of finance made available under EU cohesion policy has been used and to what effect. Their purpose is to provide responses to the questions which EU taxpayers have a right to know the answers to – how the money was spent and what was achieved.
At various points in the present report, reference is made to the operation of these other funds. Indeed, it is not possible in practice to distinguish the effect of the ERDF on the development of the regions receiving support from that of the other Structural Funds which contributed to the strategies pursued over the period.
A theme running throughout the report is the fact that cohesion policy has multiple goals rather than a single objective. This was just as much the case in the 2000-2006 period as now. In line with the EU Treaty objectives at the time, it was concerned with:
1 Member States with Gross National Product of under 90% of the EU average are eligible for receipt of funding. Ireland was eligible for the first part of the period up to the end of 2003 but ceased to be eligible from the beginning of 2004.
2 The ex post evaluation of the ESF and the FIFG are in the process of being finalised at the time of writing. The ex post evaluations of the EAGGF and the Cohesion Fund are due to be completed before the end of 2011. All the evaluation will be published on the websites of the DGs responsible for the Funds – DG Employment for the ESF, DG Agriculture for the EAGGF, DG Fisheries for the FIFG and DG Regional Policy for the Cohesion Fund.

Synthesis Report Ex-post Evaluation of the ERDF 2000-2006
8
‘promot(ing) economic and social progress and a high level of employment and to achieve balanced and sustainable development, in particular through …. the strengthening of economic and social cohesion…’3
Although territorial cohesion was added explicitly to economic and social cohesion only subsequently, in practice, it is implicit in the aim of ‘balanced and sustainable development’, so that policy objectives were much the same in the period being examined here as now. This is evident from the form which cohesion policy took in the various parts of the EU in the period.
These multiple goals complicate the evaluation. It means that the performance of the policy cannot be judged simply in terms of the economic convergence of the regions assisted towards the EU average. It is all the more so since the relative weight attached to the objectives differed across regions reflecting their needs and priorities. Moreover, the relative weight concerned was rarely spelled out in any detail in programming documents or policy statements, which further adds to the difficulties of the evaluation.
THE APPROACH ADOPTED Ex post evaluations of previous programming periods have attempted to provide a comprehensive coverage of the programmes supported by the ERDF in all of the regions in each of the EU Member States. Such an approach had limited success, largely because of the sheer number of programmes involved. This made it impossible to go into the detail necessary to properly assess the results and effects of all of them within a reasonable time-frame and with a reasonable amount of resources. Accordingly, the reports produced tended to be overly general and superficial in their analysis of the performance of policy over the period in question, failing to provide firm, empirically supported conclusions regarding its achievements and deficiencies. As such, they were limited in the advice and guidance they could offer for the formulation and implementation of cohesion policy in the future.
In response to these failings and the evident difficulty of assessing all 230 or so programmes in 25 Member States comprehensively without a massive expansion in the resources devoted to the task and the time taken, the present evaluation instead adopted a more selective approach. This was to divide the evaluation into 14 Work Packages which examined separate issues of policy relevance and which between them covered most of the expenditure co-financed by the ERDF (details of these Work Packages and of those responsible for them are set out at the beginning of this report). In particular, three Work Packages covered policy areas which absorbed the bulk of funding:
• enterprise and innovation
• transport
• the environment
Broadly defined to include support for tourism as part of enterprise support and the physical as well as the natural environment as part of the environment, these together accounted for around 85% of total ERDF funding in the programming period.
A number of cross-cutting issues were also examined:
• gender equality, which was included in the guidelines to the Structural Funds as a horizontal priority,
3 Treaty of Amsterdam, Article B, 1997.
Ex-post Evaluation of the ERDF 2000-2006 Synthesis Report
9
• demographic change, which was included as part of the study of gender equality since it raised similar issues, even though it was not an explicit horizontal priority in the guidelines;
• sustainable development and climate change, which were included as part of two separate Work Packages
• the cost effectiveness of major projects, which was concerned with trying to compare the unit costs of major construction projects across the EU.
In addition, three separate studies were carried out into issues of policy relevance:
• the contribution of Objective 2 support for restructuring in the regions assisted in the context of globalisation;
• the contribution of the ERDF to the development of rural areas, which was the specific focus of the EAGGF but there were many rural areas in the regions supported by the ERDF under Objective 1 and Objective 2;
• the performance of the system for managing and implementing the ERDF in different countries and regions and its contribution to the design and implementation of effective cohesion policies as well as the spill-over of the principles embedded in the system into other policy areas.
Two further pieces of work were also undertaken as part of the evaluation:
• the construction of a database of quantitative indicators used by Member States to monitor policy in the different programme areas,
• the deployment of two macroeconomic models, specially constructed to incorporate the expenditure on investment financed by the Structural Funds, to estimate the effects of intervention on the growth of the economies receiving funding.
To provide the background to the different Work Packages – to set out the context in which cohesion policy was operated – and to compile a common set of data to feed into them, analysis was undertaken as well on:
• the growth of GDP and employment in assisted and non-assisted regions and changes in regional disparities in the EU over the 2000-2006 period;
• the allocation of Objective 1 and 2 funding between policy areas, the counterpart national co-financing and the contribution from the private sector to expenditure;
• the development policies pursued across the EU and their coherence with economic theory and the recommendations of major international organisations;
• regional developments over the programming period and the ERDF contribution to tackling development problems in all 25 Member States in the form of succinct national reports;
• the types of NUTS 3 regions receiving financial support under Objective 2 and how the ERDF was allocated between policy areas in the regions concerned4.
4 These various pieces of analysis were carried out under Work Package 1 by the people and organisations listed in the description above, who were also responsible for assisting in the coordination of the ex post evaluation and in advising on the analysis undertaken in the various Work Packages.

Synthesis Report Ex-post Evaluation of the ERDF 2000-2006
10
The authors responsible for the studies carried out under the various Work Packages are listed above, together with the experts who, in each case, gave advice and guidance throughout the course of the studies.
The approach adopted in each of the Work Packages was in most cases similar. It was to begin by setting out the rationale for policy intervention in the area concerned, or as regards the issue being examined, in the light of economic theory. This was followed by an overview of developments across the EU in the policy area in question and of the policy measures and projects supported by the ERDF, together with an examination of the outputs produced and the results of these on the basis of available data. Case studies of development in selected regions across the EU, which had received funding under either Objective 1 or Objective 2, were then carried out in order to examine in more detail the way the funding was used, the problems encountered and the effects of the projects supported.
The case studies covered regions with differing characteristics, with different needs and priorities, in different parts of the EU and at different stages of economic development. They were, therefore, intended to gain an insight into the achievements of policy in different contexts and their specific contribution to furthering cohesion policy goals. Altogether 72 regional case studies at either the NUTS 1 or NUTS 2 level were carried out in the different Work Packages (see Annex for a list of the case study regions), 12 regions were included in more than one Work Package.
While there are inherent difficulties in drawing general conclusions from case studies because of their selective nature, they are the only viable way of finding out what the effects of policy were in practice and what kind of impact they had on the development of the region concerned. In short, they provide concrete evidence of policy achievements and essential support for more general analysis of developments in the regions assisted by the ERDF.
It should be stressed that the present report is not a summary of the various Work Packages and other studies which have undertaken for the evaluation. Instead, it is a synthesis of the findings which attempts to draw out the main points which emerged from each of them and from examining all the material compiled as a whole.
THE CHALLENGES OF THE EVALUATION The context in which cohesion policy was implemented, the often small scale of the funding in relation to the forces it was intended to counteract and the many other factors at work mean that it is unrealistic in most cases to expect to be able to trace a direct link between policy and regional developments. This is all the more so in view of the often lengthy time lags involved between measures being implemented and having a discernible effect on developments. The difficulty of tracing an effect is compounded by the long time lags in relevant data becoming available to examine the link in question. A stark illustration of this that data on regional GDP per head, which are central to assessing the impact of policy on the development of assisted regions, were available only up to 2006 when the evaluation was carried out. This is two years before expenditure co-financed by the fund was due to be completed (under the n+2 rule) and three years before the actual completion date, which was extended as part of the measures for combating the recession.
There was also a lack, in many cases, of a clear indication in concrete terms of the objectives of the policy implemented in a form which would enable the success or failure of the measures taken to be properly assessed. Often the aims of the policy were expressed in terms so general (e.g. an improvement in regional competitiveness) to make it difficult, if not impossible, to judge

Ex-post Evaluation of the ERDF 2000-2006 Synthesis Report
11
after the event whether they were achieved or not. Though quantitative targets were often set and an indicator system established, as required by the Structural Fund regulations, in many cases neither were linked in a meaningful way to ultimate policy objectives.
Where targets were set, they were often not taken seriously in the sense of being carefully determined in relation to the funding made available and what it could plausibly achieve. Accordingly, they were either attained far too easily – in a few cases, in the first few months of the programme being initiated – and, therefore, represented no challenge at all, or were unattainable given the funds deployed. In most cases, they did not play a central role either in the design or in the monitoring of policy and rarely featured in the policy debate. No authorities were held accountable for not meeting the targets set and few questions were asked when the targets were easily achieved.
In consequence, whether the targets were achieved or not cannot be taken as evidence of success or failure of the measures implemented and they are generally of limited relevance for the evaluation. Though systems for monitoring expenditure were established over the period in all Member States together with a set of indicators for assessing the outcome of spending, they were not a central part of the decision-making process.
Nevertheless, numerous evaluations have been carried out across the EU which have made use of the systems established to assess particular programmes. Though many focused narrowly on issues of financial implementation, a number examined the achievements of policy and are drawn upon here. Moreover, quantitative indicators do say something about the achievements of the programmes carried out even if far from everything. They at least provide evidence that the projects supported had tangible outputs and produced results which, according to economic theory, can be expected to have contributed to regional development and the pursuit of the wider objectives of cohesion policy.
These wider objectives complicate the evaluation exercise. Policy was concerned with social and territorial objectives as well as economic ones. These objectives, however, are even less tangible than the economic aims of policy and tend to pose even greater problems of measuring outcomes. Issues such as the quality of life or territorial balance are less susceptible to quantification than economic growth and as yet few indicators exist which can be used to judge whether they are improving or worsening. Nevertheless, they need to feature in the evaluation as much as the more tangible outcomes.
CHANGING CIRCUMSTANCES AND NEW ISSUES The evaluation needs equally to take account of the changes in underlying circumstances which occurred over the period which inevitably affected the focus of programmes in the various policy areas. The context in which cohesion policy was initially determined was, therefore, very different in certain aspects from that which prevailed at the end of the programming period. New issues arose during the period, or existing issues became more pressing, which posed new challenges for regional development and, accordingly, for cohesion policy.
Prominent examples include:
• the continuing process of globalisation, which altered the environment in which firms were operating, by putting increased pressure on those seeking to compete in terms of low labour costs and opening up opportunities for the relocation of labour-intensive activities to low wage countries;

Synthesis Report Ex-post Evaluation of the ERDF 2000-2006
12
• the growing emphasis on the sustainability of development in the context of global warming and the mounting concerns with safeguarding the environment;
• the ageing of the population, the implications of which became more apparent as the period went on, and the increase in migration which affected many regions, both those experiencing high levels of inflow and those experiencing significant outflows.
All of these issues, which were not a prominent part of the policy agenda when the programmes for the period were initially formulated, were covered explicitly in the evaluation. The aim was, in part, to check the extent to which programmes were flexible enough to respond to a changing context and new challenges, as well as assessing the measures taken themselves.
EU15 VERSUS EU10 AND OBJECTIVE 1 VERSUS OBJECTIVE 2 REGIONS A distinction was made throughout the evaluation between the operation of cohesion policy in EU15 regions and that in the regions of the EU10 (the Member States which entered the Union in May 2004). This is because the period over which financial support from the ERDF was provided was much shorter for the latter, beginning only with their entry into the EU. They, accordingly, had much less time than regions in the EU15 to make use of the funding, which means that what can be expected to have been achieved is also much less. It is equally the case that GDP per head in most regions was much further below the EU average than that in the least prosperous EU15 regions. The problems of economic development which cohesion policy needed to tackle were, therefore, bigger in scale and more wide-ranging than in the EU15.
An equally important distinction was also made between regions supported under Objective 1 and those supported under Objective 2 (for all eligible areas, see map at the end of this section). The latter were predominantly in the EU15. Only three regions, Cyprus, Praha and Bratislava, in the EU10 did not qualify for Objective 1 support and were assisted under Objective 2. The separation of the two groups of regions is because of differences in the scale and, in many cases, the nature of problems faced and because of the size of funding involved was much smaller in the case of Objective 2 than Objective 1.
Regions receiving Objective 1 support were those with GDP per head below 75% of the EU average at the time eligibility for funding for the 2000-2006 period was determined. Those in the EU15 can be divided into two broad groups. The first group consists of regions, mostly in the Southern Member States, in which economic development was lagging behind. The main focus of policy was, accordingly, on extending and improving their endowment of infrastructure of various kinds so as to help create the conditions for sustained growth. The second group contains regions in other parts of the EU15 with mixed characteristics. It includes those where development had occurred in the past but which were left with declining industries, in much the same way as many Objective 2 regions but to a larger extent. It also includes very sparsely populated regions in the northern and central parts of Finland and Sweden, where the concern was to help to establish competitive businesses partly in order to maintain population.
There are equally important differences between Objective 1 regions which were surrounded by other Objective 1 regions, such as those in the south for the most part – in the extreme, where all the regions in a country were Objective 1, as in Greece and Portugal – and those which were located in the midst of stronger regional economies, such as those in Belgium, Austria or the UK.
Nevertheless, the Objective 1 regions share one important feature. They are all defined at the NUTS 2 level which means that their boundaries are readily identifiable and a set of regional statistics exist which can be used to examine developments over the programming period. The

Ex-post Evaluation of the ERDF 2000-2006 Synthesis Report
13
regions assisted under Objective 2, on the other hand, were, in general, much smaller – in most cases areas (or zones) within NUTS 3 regions – and more diverse in terms of their characteristics and the problems they faced. They comprised three relatively distinct types of region which had been separately targeted in the preceding programming period:
• those hit by the decline of traditional industries;
• rural areas with economic problems;
• coastal areas dependent on fishing.
The diversity of Objective 2 regions adds to the difficulty of assessing the effect of the support given. This is reinforced by the small size of the areas assisted and the fact that, in most cases, they do not coincide with statistical boundaries, which means that there is no set of consistent data available to examine developments. Although estimates can be made from the data for NUTS 2 and NUTS 3 regions on the growth of GDP per head and of employment, the results obtained are essentially based on the assumption that the performance in these terms in the areas assisted is reflected in the performance of the regions as a whole. This assumption is difficult to verify. Given the lack of data, relatively small scale of Objective 2 funding and the size of the areas targeted, case studies are an even more vital part of the evaluation than for Objective 1.
OUTLINE OF REPORT
Chapter 1: The nature of cohesion policy over the 2000-2006 period
The report begins, in Chapter 1, by considering the nature of cohesion policy over the 2000-2006 period – what the aims of the policy were and how they evolved over the period as underlying circumstances changed and new issues emerged.
It indicates the scale of the finance made available under the ERDF and the other Structural Funds, as well as national government co-financing and the private sector contribution, and how it was divided between Objective 1 and Objective 2 regions.
It also considers the division of funding between policy areas in different Member States and how far funding was targeted on the main drivers of development identified by economic theory and was consistent with the recommendations of international organisations.
In addition, it examines the way that funding was allocated across different types of region - urban, rural or intermediate – at the NUTS 3 level and the division in each type of region between policy areas to see how this was affected by the type of region concerned.
Chapter 2: Economic developments over the 2000-2006 period
Chapter 2 reviews economic developments over the period 2000-2006, beginning with the macroeconomic context in which cohesion policy was implemented, before examining growth of GDP per head and employment in regions receiving Structural Fund support as compared with non-assisted regions.
The macroeconomic context here includes the overall growth in GDP, the fiscal policy pursued over the period and the scale of government investment, all of which are likely to have affected developments at regional level It also includes the process of globalisation and EU enlargement both of which had an effect on the policies followed at regional level.
Regional economic developments are analysed at both the EU level, differentiating developments in the EU15 from those in the EU10, and at national level, since cohesion policy is about reducing

Synthesis Report Ex-post Evaluation of the ERDF 2000-2006
14
disparities within countries as well as across the EU as a whole. The chapter examines the changes in regional disparities at the various levels in terms of GDP per head and considers the way that these were affected by changes in commuter flows. It also examines changes in disparities in household disposable income per head across region, which is a more relevant indicator of living standards and, therefore, of social cohesion.
Chapter 3: The outcome in selected policy areas
Chapter 3 examines the evidence from the studies undertaken on particular policy areas, focusing first on the two main broad areas of intervention, enterprise support and infrastructure, specifically transport and environmental infrastructure which accounted for the bulk of expenditure in this area.
The issues examined in respect of enterprise support include:
• the effect of aid to enterprises on employment across the EU;
• the effect of grants for investment to firms on investment per worker and grants for R&D on the level of expenditure on this per worker;
• the effects of support under Objective 2 on restructuring in the context of globalisation.
The issues considered in the case of support for investment in transport include:
• the relative weight given to investment in the different modes of transport, especially in rail as opposed to road in view of the horizontal priority over the period of taking explicit account of environmental considerations when deciding on projects to fund;
• the importance attached to investment in public transport in urban areas for similar reasons;
• the outcome of investment in terms of the construction completed and the results of this.
The issues examined as regards support for protecting and improving the environment include:
• the share of funding going to support for investment in environmental infrastructure, on the one hand, and the clean-up of the natural and physical environment, on the other;
• the results in terms of increased access to clean drinking water and wastewater treatment systems ;
• the effect of the expenditure funded on cohesion policy objectives;
• the support provided by the ERDF in relation to climate change.
The further concern of Chapter 3 is to present the results of the other studies carried out as part of the evaluation. These covered:
• ERDF support for rural development and the focus of this as compared with the financing provided by the EAGGF;
• gender equality and demographic change and the extent to which they were reflected in the design of programmes and the projects supported, especially the first which was a horizontal priority in the programming period;
• the cost effectiveness of major projects and how the unit cost of these varied across regions, as well as the factors underlying such variations.

Ex-post Evaluation of the ERDF 2000-2006 Synthesis Report
15
Chapter 4: The effects of policy on regional development and wider objectives
Chapter 4 considers the overall effects of policy on regions in the different Member States.
The chapter begins by reviewing the results of simulations carried out using two macroeconomic models, QUEST and HERMIN, to estimate the effects of the expenditure co-financed by the Structural Funds in the 2000-2006 programming period on GDP growth in Member States. Given the complexities of economies and the difficulties of tracing a direct link between the expenditure supported and economic performance, such models represent the only practical means of estimating the effects of cohesion policy.
The second part of the chapter examines developments in Objective 1 and Objective 2 regions in the different Member States across the EU and relates these to the various pieces of evidence assembled during the evaluation on the results of the expenditure funded over the period.
Chapter 5: Conclusions and implications for future policy
The final chapter sets out the conclusions of the evaluation. It is divided into two parts. The first part summarises the main findings as regards the effects of cohesion policy in the regions receiving Objective 1 and Objective 2 support in the different parts of the EU over the 2000-2006 period, distinguishing between EU15 and EU10 countries.
The second part of the chapter draws out the main lessons to emerge from the evaluation for the future shape of cohesion policy after 2013. These relate to a number of different aspects, including the process of evaluation itself, the indicators to use for the design and assessment of policy, the concentration of funding and the form it should take and the decision-making process surrounding this.

Synthesis Report Ex-post Evaluation of the ERDF 2000-2006
16

Ex-post Evaluation of the ERDF 2000-2006 Synthesis Report
17
1 Chapter 1 – The nature of cohesion policy, 2000-2006
1.1 THE POLICY CONTEXT The form which cohesion policy took in the 2000-2006 period inevitably reflected the underlying circumstances which prevailed across the EU at the time the policy was formulated. Although there were some modifications to the programmes and the allocation of expenditure both between and within them over the period, the initial situation in the late 1990s had a major influence on the objectives set and the priorities attached to them. This situation differed in a number of respects from that which evolved as the period went on.
1.1.1 A focus on employment
In the first place, while enlargement of the Union was already being contemplated, when it would occur and how many countries it would involve were still uncertain and in any case some years off. The focus of attention, therefore, was very much on the 15 Member States which comprised the EU at the time. Secondly, the major economic preoccupation in most cases was the limited rate of employment creation, despite several years of sustained economic growth following the recession of the earlier 1990s, and the resulting persistence of a high level of unemployment. This was the theme, for example, of the Luxembourg job summit at the end of 1997, which led to the formulation of the European Employment Strategy. It was also a major issue at the Lisbon summit in early 2000, which set employment targets for the EU to be attained by 2010 in addition to the aim of transforming the EU into a more dynamic, knowledge-based economy which became a major policy theme during the period.
The concern with employment is apparent in the focus on both the creation and the maintenance of jobs in the policy documents drawn up and the quantitative targets set when the programmes for the period were formulated. The aim in many regions receiving assistance was to try to avoid an overly rapid decline in traditional industries, as much as to support the growth of new sectors of activity. A significant part of enterprise support, accordingly, went to firms in labour-intensive sectors in an attempt to maintain employment as well as to improve their competitiveness.
1.1.2 Globalisation and EU enlargement giving rise to new challenges
Such a policy focus became increasingly difficult to sustain as the period went on and as the continuing process of globalisation, coupled with the dismantling of trade barriers, led to increasing competitive pressure on firms in traditional industries, many of which were concentrated in assisted regions. Rising imports of basic manufactures into the internal market and growing difficulties in exporting were accompanied by greater opportunity to relocate labour-intensive activities to low wage countries. This was a result of both the industrialisation of these countries and of technological advances, which made it possible organise the production process in many industries across widely separated locations.
The process of globalisation, and the increased competitive pressure it brought with it, was reinforced in the EU15 by EU enlargement. Not only did this intensify competition in internal markets but it offered an opportunity to relocate labour-intensive activities to low-wage countries closer to home. Accordingly, the accession countries in Central and Eastern Europe provided an alternative destination for such activities, which by being closer gave rise to fewer logistical problems and was, therefore, in many cases, more cost effective than countries in South-East Asia.

Synthesis Report Ex-post Evaluation of the ERDF 2000-2006
18
1.1.3 Increased migration
At the same time, enlargement led to an influx of workers from many of the new Member States, but especially from Poland and the Baltic countries, into parts of the EU15, particularly those which refrained from imposing restrictions on their entry, such as Ireland and the UK. In both countries this helped to feed the growing demand for labour – in Ireland, in the construction industry in particular. In some activities in Poland, however, it also gave rise to shortages of skilled labour, so potentially hindering the longer-term development of the economy. Nevertheless, in the short-term, it helped to reduce unemployment, which was close to 20% in the early years of the decade before entry.
In Spain, and to a lesser extent in Italy, inflows of migrants were not so much from the East but from the South, from Africa in particular, many of them illegal, leading to a marked growth in population of working age in a number of regions after years of little increase. As in Ireland, many of the migrants into Spain went into the construction industry, employment in which increased by over 50% in the country as a whole over the programming period and by even more in some regions. In Italy, because of the much slower growth of the economy, the inflow gave rise to greater social problems than in Spain and, in the South especially, to an expanding clandestine cheap source of labour to be employed in the informal economy.
1.1.4 Growing concern with sustainable development
Globalisation and enlargement were accompanied over the period by a growing concern with the environmental damage caused by human activities and, in particular, with global warming and its implications. The result was increasing emphasis on the need to ensure that economic development was sustainable and consistent with the preservation of the natural assets of the region in which it occurred. This emphasis was not evident in the policy documents drawn up at the beginning of the programming period, even though concern with environmental protection was embodied in the horizontal priority included in the Structural Fund guidelines. Sustainable development was adopted soon after as an EU strategy at Goteborg in 2001, followed by Member States signing up to the Kyoto protocol in 2002.
1.1.5 Population ageing becoming more apparent
A further issue which came to prominence over the programming period, but again was not explicitly reflected in the initial programmes, was the ageing of the population as a consequence of demographic trends, in the form of low fertility rates and declining mortality rates. This has well-publicised implications for the growth of the work force, since working-age population is set to decline in future years as demographic trends unwind, and, accordingly, for the capacity of economies to generate the income needed to support people in retirement. It also has implications for the demand for social services and the pattern of consumption generally, which vary in significance across regions according to their characteristics and the composition of their populations.
An aim of the evaluation was to examine how far this changing context affected the policies which were implemented over the period and led to adaptation of the initial programmes to take account of the changes concerned. This is not only to assess the relevance of the policies implemented but more generally to consider the degree of flexibility of the management systems to respond to new developments.

Ex-post Evaluation of the ERDF 2000-2006 Synthesis Report
19
1.1.6 A different context in the EU10
This aim applies only to the EU15. The countries which entered the EU in May 2004 had very little time to alter programmes and in any case were faced by a very different set of circumstances as regards both economic development and the design and implementation of cohesion policy. In particular, in most regions, there was a lack of basic infrastructure of adequate standard, posing a major constraint on sustained development, together with very limited experience of implementing regional policy, allied to a lack of capacity for doing so. The problems of development were, therefore, essentially long-term in nature, involving not only infrastructure deficiencies but also low levels of productivity in most activities and a concentration of employment in low value-added sectors. The programming period, however, was very short – initially, the countries had only around 4½ years for funds to be allocated and spent – so that it was possible only to make a start on programmes which would have a significant effect on development.
1.1.7 The multiple nature of cohesion policy objectives
The broad objective of policy over the period was to strengthen economic and social cohesion. In the case of lagging regions receiving funding under Objective 1, the emphasis in the initial programme documents was, for the most part, on alleviating the constraints on economic development. In the case of problem regions in the more developed parts of the EU, those receiving funding under Objective 2, but also some of those receiving funding under Objective 1, the emphasis was on improving the competitiveness of businesses. These broad objectives were the same in EU10 countries as in the EU15.
While the main focus in the regions in both sets of countries was an economic one, there were other aims too, not least a concern to ensure that development was balanced across regions and that the more peripheral and/or rural ones did not lose out. This was the case not only between NUTS 2 regions but also within them. It was especially true in countries which were a single NUTS 2 region, such as Denmark, as well as in a number of the EU10 countries which were designated as Objective 1 regions – the three Baltic States, Slovenia and Malta – but it was also evident in many other regions. This was the case not only in the larger regions but also in some of the smaller ones. In Burgenland in Austria, for example, an Objective 1 region with a population of only around 280,000, an important concern was to stimulate development in the more rural and less prosperous central and southern part more than in the more favourably placed northern part.
1.1.8 Potential conflicts between objectives
A dilemma was to choose a strategy for deploying the Structural Funds which strengthened the development potential of the region, or country, as a whole but, at the same time, maintained or improved territorial balance by achieving a more even spatial distribution of economic activity. The relative weight attached to these two options tended to determine the allocation of funding –the extent to which financial resources were concentrated in areas which offered the highest immediate potential for growth, typically agglomerations (in smaller countries, invariably the capital city), as opposed to being spread more widely across the region, or even concentrated in areas where development problems were most acute.
In practice, the decision of how and where to allocate funding is a political one since in some degree it depends on the importance attached to social cohesion, as well as territorial balance, and avoiding widening disparities between people living in different areas, as against economic growth.
Synthesis Report Ex-post Evaluation of the ERDF 2000-2006
20
Even if priority is given to economic considerations, there is no compelling evidence to suggest that concentrating resources in existing agglomerations is most likely to yield the best return in terms of growth in the longer-term, whatever its short-term merits. As the Barca report points out5, existing agglomerations are not necessarily the result of market forces, a tangible demonstration that such a concentration represents the most efficient spatial distribution of economic activity. Since most agglomerations tend to have been artificially created by government intervention in the past, stimulating the development of a new centre of economic activity may be no less an effective use of funds than deploying them to strengthen an existing one. This is especially the case if a long-term perspective is taken.
The argument in favour of supporting existing centres of economic activity is not only that this represents the best strategy for the region, or country, to achieve a high rate of short-run growth, but that it is also the best one in the long-term because growth will ‘trickle down’ to other areas. The evidence for this, however, is limited and even if it should eventually occur, the approach runs the risk of worsening social cohesion and engendering instability and political unrest before it does so.
In practice, whatever the merits of one approach over the other, social cohesion considerations tend to push governments, both regional and national, to seek to reduce regional disparities in infrastructure endowment and public and other essential services of various kinds across regions, so that particular areas are not disadvantaged in these terms.
Whether or not such an allocation of funding conflicts with the pursuit of sustainable development over the long-term is by no by means clear, irrespective of its possible effect in slowing down growth in the short-term.
1.1.9 The regional dimension of policy
Cohesion policy as conducted through the ERDF is essentially about reducing imbalances between regions. This includes, imbalances within regions defined at the NUTS 2 level as well as between them. Although changes in disparities at the NUTS 2 level have tended to be how cohesion policy as a whole is judged, the logic of the Objective 2 approach in the 20002-2006 programming period is that the situation in small regions below the NUTS 2 level is also important.
It can be argued further that the sustained growth of any particular region defined at the NUTS 2 level is dependent on maintaining a certain balance between the different areas which it comprises. Indeed, sustainable development, in addition to the preservation of the natural environment and the avoidance of excessive depletion of exhaustible resources, could be defined to incorporate this condition, as well as perhaps avoiding excessive disparities between social groups within each of the areas concerned6. What kind of balance should be maintained and, accordingly, what kind of policy should be adopted in pursuit of this, however, varies between regions according to their specific characteristics.
A related point is that, in many cases, NUTS 2 regions correspond with neither functional, or economic, regions nor administrative regions. In these cases, the appropriate regional level for development policy to be determined differs from that which is the focus of cohesion policy at EU level. This is reflected, as indicated in Chapter 2 below, in commuting being on a significant scale
5 Fabrizio Barca, An agenda for a reformed cohesion policy, April 2009.
6 The study of sustainable development as part of Work Package 11 adopted such a wide definition.
Ex-post Evaluation of the ERDF 2000-2006 Synthesis Report
21
in the case of many of the regions concerned. As a consequence, GDP per head in these regions no longer reflects their relative prosperity7.
1.1.10 The scale of funding
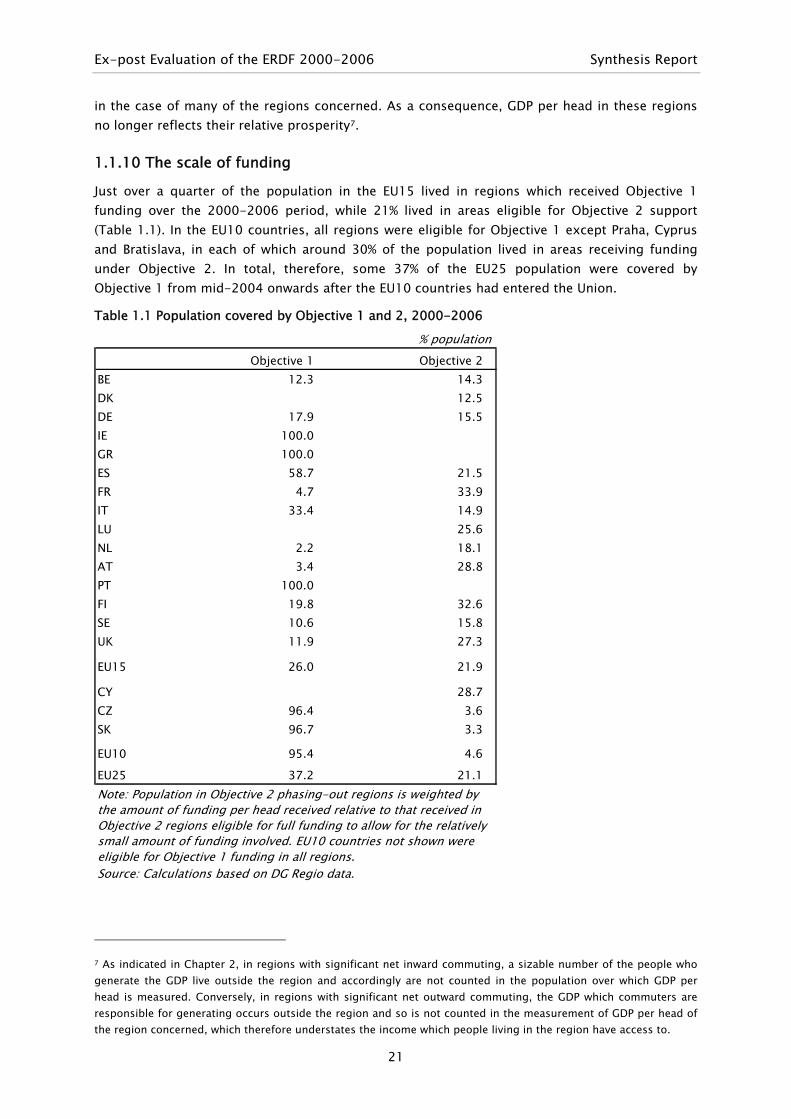
Just over a quarter of the population in the EU15 lived in regions which received Objective 1 funding over the 2000-2006 period, while 21% lived in areas eligible for Objective 2 support (Table 1.1). In the EU10 countries, all regions were eligible for Objective 1 except Praha, Cyprus and Bratislava, in each of which around 30% of the population lived in areas receiving funding under Objective 2. In total, therefore, some 37% of the EU25 population were covered by Objective 1 from mid-2004 onwards after the EU10 countries had entered the Union.
Table 1.1 Population covered by Objective 1 and 2, 2000-2006
% populationObjective 1 Objective 2
BE 12.3 14.3DK 12.5DE 17.9 15.5IE 100.0GR 100.0ES 58.7 21.5FR 4.7 33.9IT 33.4 14.9LU 25.6NL 2.2 18.1AT 3.4 28.8PT 100.0FI 19.8 32.6SE 10.6 15.8UK 11.9 27.3
EU15 26.0 21.9
CY 28.7CZ 96.4 3.6SK 96.7 3.3
EU10 95.4 4.6
EU25 37.2 21.1
Source: Calculations based on DG Regio data.
Note: Population in Objective 2 phasing-out regions is weighted by the amount of funding per head received relative to that received in Objective 2 regions eligible for full funding to allow for the relatively small amount of funding involved. EU10 countries not shown were eligible for Objective 1 funding in all regions.
7 As indicated in Chapter 2, in regions with significant net inward commuting, a sizable number of the people who generate the GDP live outside the region and accordingly are not counted in the population over which GDP per head is measured. Conversely, in regions with significant net outward commuting, the GDP which commuters are responsible for generating occurs outside the region and so is not counted in the measurement of GDP per head of the region concerned, which therefore understates the income which people living in the region have access to.
Synthesis Report Ex-post Evaluation of the ERDF 2000-2006
22
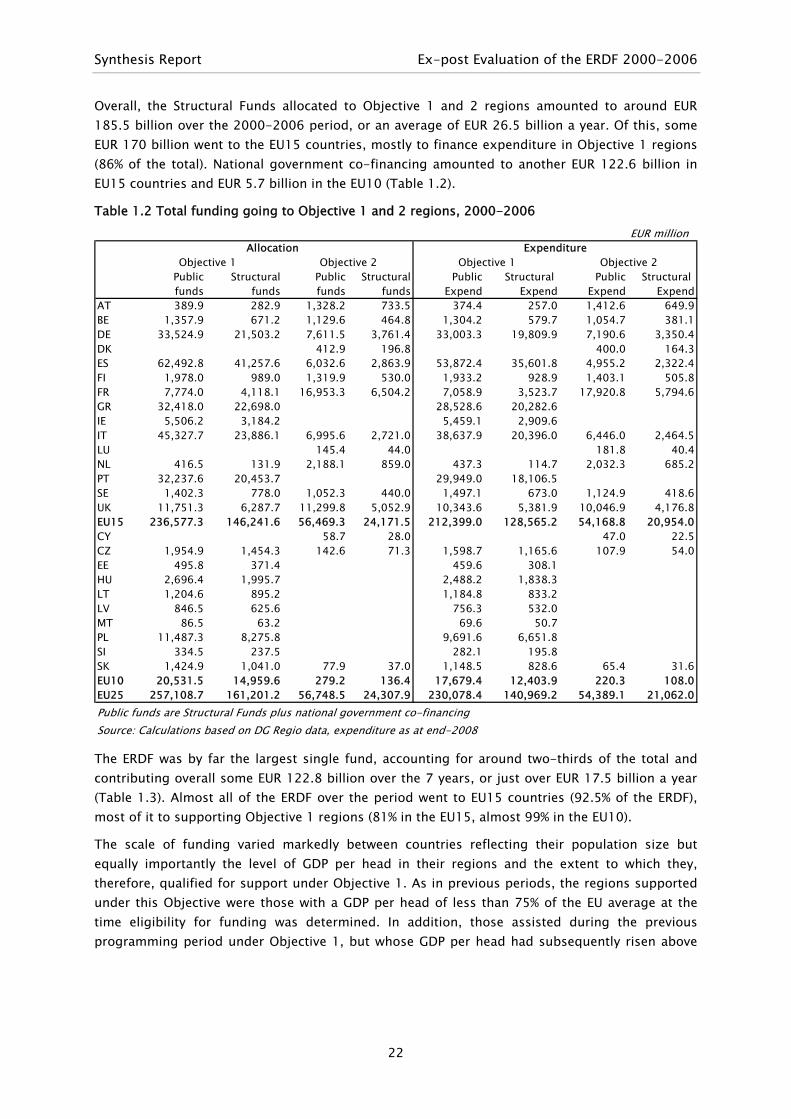
Overall, the Structural Funds allocated to Objective 1 and 2 regions amounted to around EUR 185.5 billion over the 2000-2006 period, or an average of EUR 26.5 billion a year. Of this, some EUR 170 billion went to the EU15 countries, mostly to finance expenditure in Objective 1 regions (86% of the total). National government co-financing amounted to another EUR 122.6 billion in EU15 countries and EUR 5.7 billion in the EU10 (Table 1.2).
Table 1.2 Total funding going to Objective 1 and 2 regions, 2000-2006 EUR million
Public Structural Public Structural Public Structural Public Structural funds funds funds funds Expend Expend Expend Expend
AT 389.9 282.9 1,328.2 733.5 374.4 257.0 1,412.6 649.9BE 1,357.9 671.2 1,129.6 464.8 1,304.2 579.7 1,054.7 381.1DE 33,524.9 21,503.2 7,611.5 3,761.4 33,003.3 19,809.9 7,190.6 3,350.4DK 412.9 196.8 400.0 164.3ES 62,492.8 41,257.6 6,032.6 2,863.9 53,872.4 35,601.8 4,955.2 2,322.4FI 1,978.0 989.0 1,319.9 530.0 1,933.2 928.9 1,403.1 505.8FR 7,774.0 4,118.1 16,953.3 6,504.2 7,058.9 3,523.7 17,920.8 5,794.6GR 32,418.0 22,698.0 28,528.6 20,282.6IE 5,506.2 3,184.2 5,459.1 2,909.6IT 45,327.7 23,886.1 6,995.6 2,721.0 38,637.9 20,396.0 6,446.0 2,464.5LU 145.4 44.0 181.8 40.4NL 416.5 131.9 2,188.1 859.0 437.3 114.7 2,032.3 685.2PT 32,237.6 20,453.7 29,949.0 18,106.5SE 1,402.3 778.0 1,052.3 440.0 1,497.1 673.0 1,124.9 418.6UK 11,751.3 6,287.7 11,299.8 5,052.9 10,343.6 5,381.9 10,046.9 4,176.8EU15 236,577.3 146,241.6 56,469.3 24,171.5 212,399.0 128,565.2 54,168.8 20,954.0CY 58.7 28.0 47.0 22.5CZ 1,954.9 1,454.3 142.6 71.3 1,598.7 1,165.6 107.9 54.0EE 495.8 371.4 459.6 308.1HU 2,696.4 1,995.7 2,488.2 1,838.3LT 1,204.6 895.2 1,184.8 833.2LV 846.5 625.6 756.3 532.0MT 86.5 63.2 69.6 50.7PL 11,487.3 8,275.8 9,691.6 6,651.8SI 334.5 237.5 282.1 195.8SK 1,424.9 1,041.0 77.9 37.0 1,148.5 828.6 65.4 31.6EU10 20,531.5 14,959.6 279.2 136.4 17,679.4 12,403.9 220.3 108.0EU25 257,108.7 161,201.2 56,748.5 24,307.9 230,078.4 140,969.2 54,389.1 21,062.0Public funds are Structural Funds plus national government co-financingSource: Calculations based on DG Regio data, expenditure as at end-2008
Allocation ExpenditureObjective 1 Objective 2 Objective 1 Objective 2
The ERDF was by far the largest single fund, accounting for around two-thirds of the total and contributing overall some EUR 122.8 billion over the 7 years, or just over EUR 17.5 billion a year (Table 1.3). Almost all of the ERDF over the period went to EU15 countries (92.5% of the ERDF), most of it to supporting Objective 1 regions (81% in the EU15, almost 99% in the EU10).
The scale of funding varied markedly between countries reflecting their population size but equally importantly the level of GDP per head in their regions and the extent to which they, therefore, qualified for support under Objective 1. As in previous periods, the regions supported under this Objective were those with a GDP per head of less than 75% of the EU average at the time eligibility for funding was determined. In addition, those assisted during the previous programming period under Objective 1, but whose GDP per head had subsequently risen above
Ex-post Evaluation of the ERDF 2000-2006 Synthesis Report
23
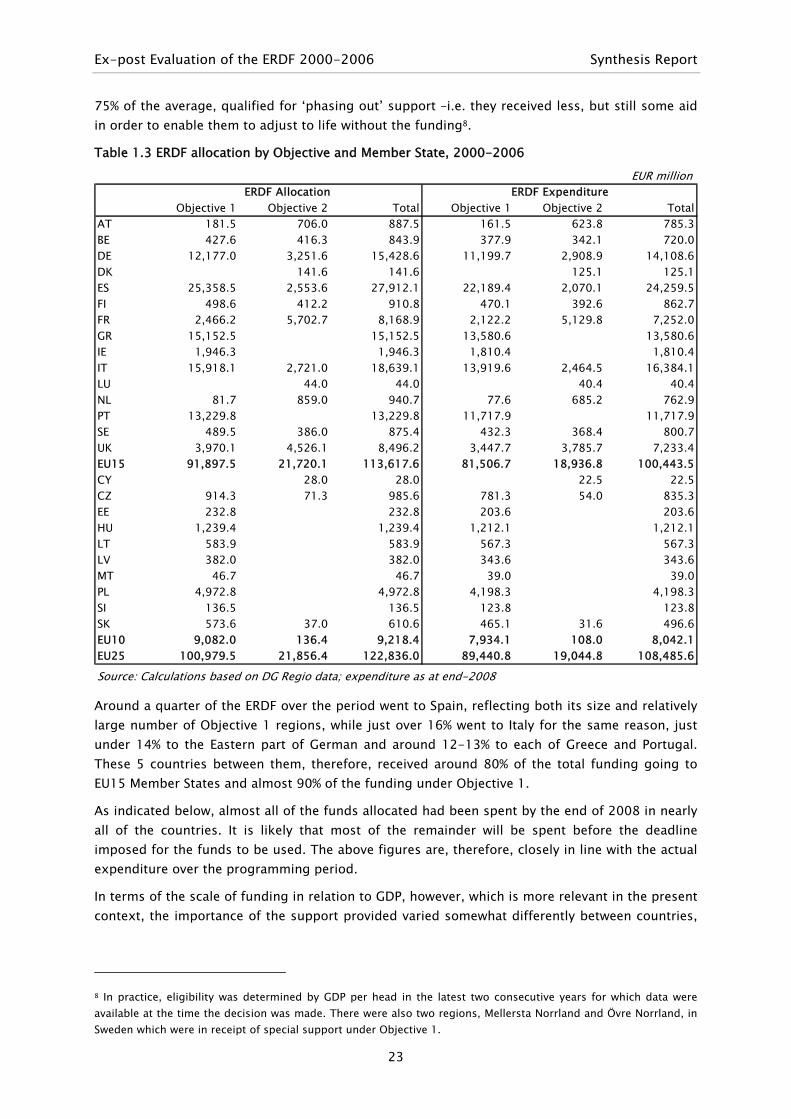
75% of the average, qualified for ‘phasing out’ support –i.e. they received less, but still some aid in order to enable them to adjust to life without the funding8.
Table 1.3 ERDF allocation by Objective and Member State, 2000-2006
EUR million
Objective 1 Objective 2 Total Objective 1 Objective 2 TotalAT 181.5 706.0 887.5 161.5 623.8 785.3BE 427.6 416.3 843.9 377.9 342.1 720.0DE 12,177.0 3,251.6 15,428.6 11,199.7 2,908.9 14,108.6DK 141.6 141.6 125.1 125.1ES 25,358.5 2,553.6 27,912.1 22,189.4 2,070.1 24,259.5FI 498.6 412.2 910.8 470.1 392.6 862.7FR 2,466.2 5,702.7 8,168.9 2,122.2 5,129.8 7,252.0GR 15,152.5 15,152.5 13,580.6 13,580.6IE 1,946.3 1,946.3 1,810.4 1,810.4IT 15,918.1 2,721.0 18,639.1 13,919.6 2,464.5 16,384.1LU 44.0 44.0 40.4 40.4NL 81.7 859.0 940.7 77.6 685.2 762.9PT 13,229.8 13,229.8 11,717.9 11,717.9SE 489.5 386.0 875.4 432.3 368.4 800.7UK 3,970.1 4,526.1 8,496.2 3,447.7 3,785.7 7,233.4EU15 91,897.5 21,720.1 113,617.6 81,506.7 18,936.8 100,443.5CY 28.0 28.0 22.5 22.5CZ 914.3 71.3 985.6 781.3 54.0 835.3EE 232.8 232.8 203.6 203.6HU 1,239.4 1,239.4 1,212.1 1,212.1LT 583.9 583.9 567.3 567.3LV 382.0 382.0 343.6 343.6MT 46.7 46.7 39.0 39.0PL 4,972.8 4,972.8 4,198.3 4,198.3SI 136.5 136.5 123.8 123.8SK 573.6 37.0 610.6 465.1 31.6 496.6EU10 9,082.0 136.4 9,218.4 7,934.1 108.0 8,042.1EU25 100,979.5 21,856.4 122,836.0 89,440.8 19,044.8 108,485.6
Source: Calculations based on DG Regio data; expenditure as at end-2008
ERDF Allocation ERDF Expenditure
Around a quarter of the ERDF over the period went to Spain, reflecting both its size and relatively large number of Objective 1 regions, while just over 16% went to Italy for the same reason, just under 14% to the Eastern part of German and around 12-13% to each of Greece and Portugal. These 5 countries between them, therefore, received around 80% of the total funding going to EU15 Member States and almost 90% of the funding under Objective 1.
As indicated below, almost all of the funds allocated had been spent by the end of 2008 in nearly all of the countries. It is likely that most of the remainder will be spent before the deadline imposed for the funds to be used. The above figures are, therefore, closely in line with the actual expenditure over the programming period.
In terms of the scale of funding in relation to GDP, however, which is more relevant in the present context, the importance of the support provided varied somewhat differently between countries,
8 In practice, eligibility was determined by GDP per head in the latest two consecutive years for which data were available at the time the decision was made. There were also two regions, Mellersta Norrland and Övre Norrland, in Sweden which were in receipt of special support under Objective 1.
Synthesis Report Ex-post Evaluation of the ERDF 2000-2006
24
as well as, of course, between regions receiving assistance under Objective 1 and those in receipt under Objective 2.
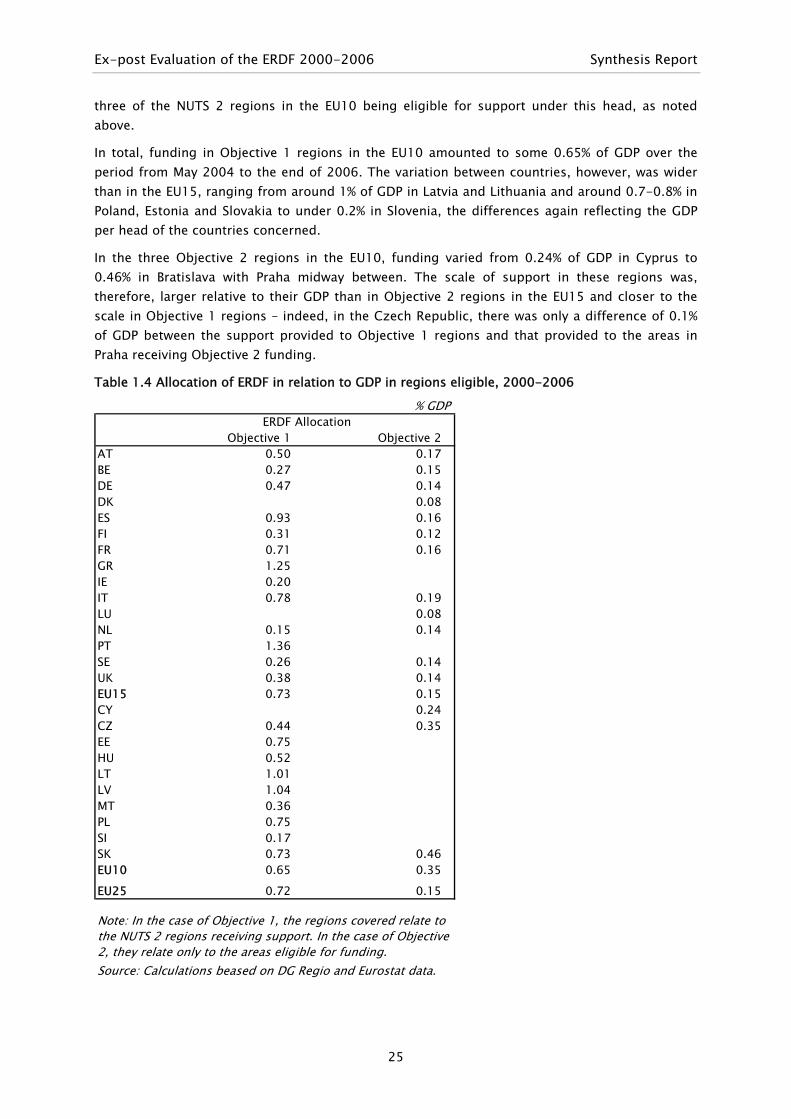
Overall, the ERDF allocated to regions in the EU15 receiving Objective 1 support amounted to 0.7% of GDP, on average, over the period, while for those in receipt of Objective 2 support – counting only the areas eligible for funding – it amounted to 0.15% of GDP. Both figures may seem relatively small, but it implies that, in Objective 1 regions, if account is taken of the fact that not all of the funding went to capital formation – i.e. some took the form of capital transfers to support enterprises – the funds received contributed around 2-3% to total fixed investment and around 15% to government investment9. Assuming the additionality requirement was respected, this means that the ERDF increased investment by this amount in the regions concerned.
What it is not possible to do from published data, as noted below, is to relate the funds made available under cohesion policy to the overall expenditure on regional development which occurred across the EU over the period. The lack of this essential information means that it is necessary to rely on these kinds of broad estimate to indicate the size of the contribution made by the ERDF to development expenditure.
In Objective 2 regions, the support was much less, though still not negligible, amounting perhaps to around 3% or so of government investment in the regions receiving funding.
The scale of funding in relation to GDP varied markedly across Member States in the EU15, reflecting the account taken of their relative prosperity when deciding the amount they should receive. The scale also varied in relation to investment, reflecting not only the overall amount of support but also the differing ways in which this was used in the different regions, and, in particular, how much was allocated to enterprise support as opposed to the development of infrastructure of various kinds.
In the case of Objective 1 regions, the amount of funding received in relative terms was largest in Portugal and Greece, the countries with the lowest levels of GDP per head, averaging around 1.3-1.4% of GDP in both cases (Table 1.4), which implies that it contributed around 25-30% or more to government fixed investment in the regions in these countries. In the Objective 1 regions in Spain, taken together, it amounted to around 0.9% of GDP, in those in Italy – all in the south of the country – it amounted to 0.8% and in those in France, which were mainly the DOMs (Nord Pas de Calais and Corse receiving phasing-out support), it averaged 0.7% (though over 1% in the DOMs if taken separately).
Elsewhere, the scale of support relative to GDP was less, ranging from 0.5% in Burgenland, the one Austrian region receiving Objective 1 funding, to 0.2% in the two phasing-out regions in Ireland and slightly less in Flevoland, the one phasing-out region in the Netherlands.
In Objective 2 regions in the EU15, there was not the same variation at all. In all Member States, funding under Objective 2 amounted to around 0.15% of GDP in the areas receiving support over the period, the only exceptions being Denmark and Luxembourg, where it was only half this.
In the EU10 countries, in which funding was provided for a much shorter period, just over half of the ERDF allocated (52%) went to Poland, 15% to Hungary and just over 10% to the Czech Republic. Virtually all of the funding was to Objective 1 regions (EUR 9.2 billion in total), all but
9 There are no data at EU level for government fixed investment by region, but at the national level, this amounted to 3-4% of GDP over the period in the southern Member States though less in most other EU15 countries – less than 2% of GDP in Germany and the UK.
Ex-post Evaluation of the ERDF 2000-2006 Synthesis Report
25
three of the NUTS 2 regions in the EU10 being eligible for support under this head, as noted above.
In total, funding in Objective 1 regions in the EU10 amounted to some 0.65% of GDP over the period from May 2004 to the end of 2006. The variation between countries, however, was wider than in the EU15, ranging from around 1% of GDP in Latvia and Lithuania and around 0.7-0.8% in Poland, Estonia and Slovakia to under 0.2% in Slovenia, the differences again reflecting the GDP per head of the countries concerned.
In the three Objective 2 regions in the EU10, funding varied from 0.24% of GDP in Cyprus to 0.46% in Bratislava with Praha midway between. The scale of support in these regions was, therefore, larger relative to their GDP than in Objective 2 regions in the EU15 and closer to the scale in Objective 1 regions – indeed, in the Czech Republic, there was only a difference of 0.1% of GDP between the support provided to Objective 1 regions and that provided to the areas in Praha receiving Objective 2 funding.
Table 1.4 Allocation of ERDF in relation to GDP in regions eligible, 2000-2006
% GDP
Objective 1 Objective 2AT 0.50 0.17BE 0.27 0.15DE 0.47 0.14DK 0.08ES 0.93 0.16FI 0.31 0.12FR 0.71 0.16GR 1.25IE 0.20IT 0.78 0.19LU 0.08NL 0.15 0.14PT 1.36SE 0.26 0.14UK 0.38 0.14EU15 0.73 0.15CY 0.24CZ 0.44 0.35EE 0.75HU 0.52LT 1.01LV 1.04MT 0.36PL 0.75SI 0.17SK 0.73 0.46EU10 0.65 0.35
EU25 0.72 0.15
Source: Calculations beased on DG Regio and Eurostat data.
ERDF Allocation
Note: In the case of Objective 1, the regions covered relate to the NUTS 2 regions receiving support. In the case of Objective 2, they relate only to the areas eligible for funding.

Synthesis Report Ex-post Evaluation of the ERDF 2000-2006
26
1.1.11 The time profile of expenditure
Expenditure from the funding allocated was not spread evenly over the programming period but tended to build up relatively slowly and to be higher towards the end of the period. This reflects the time it takes to select suitable projects for funding as well as the lengthy delays in agreeing these in a number of countries, which reflect in turn the efficiency of the administrative procedures for managing funding and implemented programmes.
The peak year for payments from the Funds under Objective 1 was 2006 or 2007 (Figure 1.1) but earlier under Objective 2 (Figure 1.2). (Both figures show payments made by the European Commission in response to Member State requests, based on the expenditure incurred.) Much of the funding, therefore, was spent after the end of the programming period itself.
Figure 1.1 Payments from the Structural Funds under Objective 1, 2000-2009
Source: DG Regio data as at March 2010
0
2,000
4,000
6,000
8,000
10,000
12,000
14,000
16,000
2000 2001 2002 2003 2004 2005 2006 2007 2008 2009
EUR million
ERDFESFEAGGFFIFG
Figure 1.2 Payment from the Structural Funds under Objective 2, 2000-2009
Source: DG Regio data as at March 2010
0
500
1,000
1,500
2,000
2,500
3,000
3,500
4,000
2000 2001 2002 2003 2004 2005 2006 2007 2008 2009
EUR million
ERDFESF
The time taken for expenditure to build up and the degree of concentration towards the end of the period varies markedly between Member States. At one extreme, in Greece, only just over 20% of payments from the ERDF under Objective 1 had been made by the end of 2003, four years into the programming period, and almost 60% of payments were made from 2006 onwards (Table 1.5). At the other extreme, in Ireland, over half the payments from the ERDF had been made by

Ex-post Evaluation of the ERDF 2000-2006 Synthesis Report
27
the end of 2003 and 90% by the end of 2006. Payments under Objective 2 showed less of a tendency to be concentrated at the end of the period (Table 1.6).
Table 1.5 Payments from the ERDF under Objective 1 to Member States, 2000-2009
Cumulative % of payments (by end of year)2000 2001 2002 2003 2004 2005 2006 2007 2008 2009
BE 7.1 7.7 23.0 27.7 42.7 61.9 75.2 86.7 100.0 100.0DE 3.7 12.2 22.2 33.0 47.9 62.4 76.9 92.2 99.8 100.0IE 6.9 15.5 35.2 51.2 69.2 80.5 90.3 94.2 100.0 100.0GR 0.0 10.2 16.2 21.9 31.8 40.7 55.1 75.8 95.0 99.9ES 0.0 12.9 26.9 41.6 57.7 70.6 78.5 87.5 94.6 99.8FR 3.9 7.0 10.7 21.9 36.2 50.8 64.3 79.6 93.6 100.0IT 6.1 7.1 13.9 27.5 38.6 53.3 70.0 84.4 96.2 100.0NL 6.9 6.9 7.4 23.4 27.0 52.4 74.3 89.4 100.0 100.0AT 7.1 12.4 26.5 41.8 56.8 66.8 75.2 87.3 100.0 100.0PT 6.9 14.8 27.2 42.8 57.1 68.6 77.9 86.1 97.6 100.0FI 7.0 8.7 24.3 34.7 49.4 63.2 76.6 92.0 100.0 100.0SE 7.0 9.0 23.9 43.4 59.5 75.1 88.6 99.7 99.7 100.0UK 5.6 6.9 15.1 23.5 35.5 57.5 69.2 85.5 95.6 98.3EU15 3.1 11.2 21.5 33.7 47.3 60.3 72.4 85.4 96.3 99.8CZ 10.5 19.7 38.9 75.2 97.9 100.0EE 10.2 28.4 52.1 85.3 100.0 100.0LV 10.2 19.7 28.4 70.5 100.0 100.0LT 10.5 24.9 40.6 69.7 100.0 100.0HU 10.6 24.1 50.3 90.8 100.0 100.0MT 10.5 18.4 38.5 79.4 100.0 100.0PL 10.5 19.5 40.1 71.3 98.9 100.0SI 10.5 33.5 66.6 90.3 100.0 100.0SK 10.6 17.2 31.7 66.7 100.0 100.0EU10 10.5 20.8 41.1 74.6 99.2 100.0
Note: The figures relate to payments from the ERDF to the Member States over the period shown. They are based on information available as of March 2010 and more requests for payment might still be received. They exclude the 5% payment which will made once the programmes are closed.Source: Calculations based on DG Regio data as at March 2010

Synthesis Report Ex-post Evaluation of the ERDF 2000-2006
28
Table 1.6 Payments from the ERDF under Objective 2 to Member States, 2000-2009
Cumulative % of payments (by end of year)2000 2001 2002 2003 2004 2005 2006 2007 2008 2009
BE 0.0 3.8 8.9 18.9 34.9 47.0 61.1 78.3 91.2 94.9DK 7.0 8.6 18.1 33.2 45.2 57.6 65.8 86.2 93.3 100.0DE 0.0 7.4 17.3 25.8 40.7 55.1 71.1 85.6 97.1 100.0ES 0.0 12.0 29.4 49.4 62.5 75.0 85.3 87.0 95.9 97.5FR 0.0 7.0 12.1 28.4 47.4 63.1 75.2 88.0 98.0 100.0IT 0.0 7.1 7.1 17.6 31.4 50.3 68.5 85.0 97.0 100.0LU 0.0 0.0 6.9 6.9 31.9 47.0 64.2 82.0 94.2 100.0NL 0.0 7.7 12.5 23.9 34.8 52.3 73.2 83.0 97.8 100.0AT 0.0 10.0 16.5 29.7 45.2 59.5 74.0 88.4 97.3 100.0FI 7.0 12.6 23.4 32.7 49.5 62.6 76.2 91.2 100.0 100.0SE 0.0 7.1 23.4 40.1 56.1 72.8 87.6 96.9 100.0 100.0UK 0.0 7.1 8.9 17.4 38.9 61.1 71.2 78.6 94.7 99.4EU15 0.2 7.8 14.1 26.7 43.7 60.5 73.8 85.0 96.7 99.5CZ 10.5 16.9 27.2 56.2 96.5 100.0CY 10.5 16.9 36.5 59.4 97.1 100.0SK 10.6 17.1 17.1 59.9 100.0 100.0EU10 10.5 16.9 26.3 57.9 97.6 100.0Note: See Note to Table 1.5Source: Calculations based on DG Regio data as at March 2010
1.2 ALLOCATION OF ERDF FINANCING BETWEEN BROAD POLICY AREAS
1.2.1 Objective 1 funding in the EU15
The allocation of funding between broad policy areas indicates the relative weight given to different policy objectives over the period in different parts of the EU. Taking the Structural Funds as a whole, including national government co-financing, Transport and telecommunications was the largest single item, absorbing around a quarter of the total financial support provided in Objective 1 regions in the EU15 in the 2000-2006 period. Support for Human resources, which was mostly financed from the ESF, accounted for some 21%, Enterprise support for 18% and Agriculture and fisheries together with Rural development, which was predominantly financed by the EAGGF, for 14%.
These proportions varied across the EU, with the share of funding going to Human resources ranging from a third in the UK to 14% in Italy and the share going to Agriculture and Rural development ranging from 21% in Finland to 8% in Belgium and the UK. The variations in the share of going to other policy areas are reflected in the division of the ERDF summarised below.
Focusing on the financing provided by the ERDF, which, as noted above, accounted for around two-thirds of the overall Structural Funds support, Transport and telecommunications was even more important, accounting for 37% of the total (Table 1.7). The proportion reached 63% in Greece, 54% in Ireland and 43% in Spain, reflecting deficiencies in transport networks in the regions concerned at the beginning of the programming period. Very little, by contrast, went to this policy area in Belgium, Austria and Finland, again reflecting their needs. In these three countries, as well as in Sweden, funding for Enterprise support accounted for over 60% of the total. By contrast, well under 20% of funding went to this policy area in Greece, Ireland and France (where the DOMs made up most of the Objective 1 regions).

Ex-p
ost E
valu
atio
n of
the
ERD
F 20
00-2
006
Sy
nthe
sis
Repo
rt
29
Tabl
e 1.
7 Al
loca
tion
of E
RDF
in O
bjec
tive
1 re
gion
s in
the
EU15
by
polic
y ar
ea, 2
000-
2006
%
ER
DF
allo
cate
d in
eac
h co
untry
BED
EIE
GR
ESFR
ITN
LAT
PTFI
SEUK
EU15
Tota
l 1.A
gric
ultu
re a
nd fi
sher
ies
0.0
0.0
1.6
0.7
0.0
0.9
0.7
0.0
0.0
0.0
0.0
0.0
0.9
0.3
1.1
Agric
ultu
re a
nd fo
rest
ry0.
00.
00.
00.
00.
00.
10.
70.
00.
00.
00.
00.
00.
60.
21.
2 Fi
sher
ies
0.0
0.0
1.6
0.7
0.0
0.8
0.0
0.0
0.0
0.0
0.0
0.0
0.2
0.2
Tota
l 2.E
nter
pris
e En
viro
nmen
t72
.744
.115
.511
.422
.113
.831
.326
.261
.022
.287
.060
.243
.726
.32.
1 As
sist
ing
larg
e bu
sine
sses
11.1
6.5
0.0
1.0
4.5
2.6
4.4
1.9
12.8
6.6
16.3
0.0
3.9
4.4
2.2
Assi
stin
g SM
Es+
craf
t sec
tor
37.8
22.9
4.5
8.6
9.4
8.3
20.2
17.1
39.3
10.8
43.9
40.5
29.3
14.4
2.3
RTD
I23
.814
.711
.01.
88.
22.
96.
67.
19.
04.
826
.819
.710
.67.
5To
tal 3
.Hum
an R
esou
rces
0.4
2.5
3.9
1.5
0.4
15.1
0.2
0.0
0.0
1.8
0.0
0.0
4.3
1.7
3.1
Labo
ur m
arke
t pol
icy
0.0
0.0
0.0
0.1
0.2
0.0
0.0
0.0
0.0
0.7
0.0
0.0
0.1
0.2
3.2
Soci
al in
clus
ion
0.0
0.0
3.9
0.0
0.0
0.6
0.0
0.0
0.0
0.2
0.0
0.0
0.5
0.2
3.3
Educ
atio
n an
d tr
aini
ng0.
42.
50.
01.
40.
114
.50.
20.
00.
00.
90.
00.
03.
71.
3To
tal 4
.Tra
nspo
rt a
nd te
leco
ms
2.4
29.8
62.9
53.6
42.9
24.3
29.4
13.2
3.5
29.0
4.4
19.1
21.2
37.0
4.1
Tran
spor
t1.
327
.858
.344
.539
.421
.722
.44.
30.
024
.52.
27.
112
.831
.74.
2 Te
leco
mm
unic
atio
ns a
nd IS
1.1
2.0
4.6
9.2
3.5
2.6
7.1
8.9
3.5
4.5
2.2
12.0
8.4
5.2
Tota
l 5.E
nvir
onm
ent
and
ener
gy3.
611
.912
.27.
216
.416
.912
.21.
35.
39.
23.
21.
35.
011
.75.
1 En
ergy
infr
astr
uctu
re1.
20.
31.
21.
20.
81.
41.
61.
03.
22.
91.
60.
61.
71.
35.
2 En
viro
nmen
tal i
nfra
stru
ctur
e2.
411
.611
.16.
015
.615
.510
.70.
32.
16.
31.
60.
63.
410
.4To
tal 6
.Ter
rito
rial
pol
icy
20.3
10.9
3.4
21.4
17.9
27.0
22.4
56.5
28.7
36.3
3.3
16.8
22.4
21.1
6.1
Tour
ism
10.9
2.5
2.2
3.6
2.1
9.4
10.0
15.4
28.7
5.3
1.7
9.4
5.8
4.7
6.2
Plan
ning
and
reh
abili
tatio
n9.
48.
30.
09.
18.
67.
88.
930
.20.
013
.40.
00.
713
.89.
36.
3 So
cial
infr
astr
uctu
re0.
00.
00.
08.
57.
28.
01.
84.
40.
014
.01.
60.
92.
46.
16.
4 D
evel
opm
ent o
f rur
al a
reas
0.0
0.0
1.1
0.2
0.0
1.8
1.7
6.5
0.0
3.6
0.0
5.8
0.4
1.0
7.Te
chni
cal a
ssis
tanc
e0.
60.
80.
54.
20.
31.
93.
72.
81.
51.
42.
02.
62.
51.
9To
tal O
bjec
tive
110
0.0
100.
010
0.0
100.
010
0.0
100.
010
0.0
100.
010
0.0
100.
010
0.0
100.
010
0.0
100.
0
Sour
ce: C
alcu
latio
ns b
ased
on
DG R
egio
dat
a

Synt
hesi
s Re
port
Ex-p
ost E
valu
atio
n of
the
ERD
F 20
00-2
006
30
Tabl
e 1.
8 Al
loca
tion
of E
RDF
in O
bjec
tive
1 re
gion
s in
the
EU10
by
polic
y ar
ea, 2
000-
2006
%
ER
DF
allo
cate
d in
eac
h co
untry
CZEE
LVLT
HU
MT
PLSI
SKEU
10EU
25To
tal 1
.Agr
icul
ture
and
fis
heri
es0.
00.
00.
00.
00.
40.
00.
00.
00.
00.
10.
31.
1 Ag
ricul
ture
and
fore
stry
0.0
0.0
0.0
0.0
0.4
0.0
0.0
0.0
0.0
0.1
0.2
1.2
Fish
erie
s0.
00.
00.
00.
00.
00.
00.
00.
00.
00.
00.
2To
tal 2
.Ent
erpr
ise
Envi
ronm
ent
25.5
23.8
40.9
16.9
25.6
2.2
18.9
36.7
3.4
20.6
25.8
2.1
Assi
stin
g la
rge
busi
ness
es3.
31.
011
.03.
32.
40.
02.
85.
71.
13.
04.
32.
2 As
sist
ing
SMEs
+cr
aft s
ecto
r20
.48.
424
.77.
215
.32.
211
.619
.91.
612
.614
.32.
3 RT
DI
1.8
14.3
5.2
6.4
8.0
0.0
4.5
11.1
0.8
5.0
7.3
Tota
l 3.H
uman
Res
ourc
es0.
00.
00.
00.
00.
00.
00.
00.
00.
00.
01.
53.
1 La
bour
mar
ket p
olic
y0.
00.
00.
00.
00.
00.
00.
00.
00.
00.
00.
23.
2 So
cial
incl
usio
n0.
00.
00.
00.
00.
00.
00.
00.
00.
00.
00.
13.
3 Ed
ucat
ion
and
trai
ning
0.0
0.0
0.0
0.0
0.0
0.0
0.0
0.0
0.0
0.0
1.2
Tota
l 4.T
rans
port
and
tel
ecom
s31
.317
.129
.933
.329
.927
.953
.913
.944
.243
.737
.64.
1 Tr
ansp
ort
26.8
14.2
24.5
24.4
22.2
26.5
43.3
5.4
42.3
35.3
32.0
4.2
Tele
com
mun
icat
ions
and
IS4.
52.
95.
38.
97.
61.
410
.58.
51.
88.
45.
5To
tal 5
.Env
iron
men
t an
d en
ergy
14.2
3.7
12.9
11.4
6.4
41.7
10.2
10.8
16.8
10.7
11.6
5.1
Ener
gy in
fras
truc
ture
2.8
2.3
5.2
10.3
1.4
0.4
2.2
5.4
0.8
2.7
1.4
5.2
Envi
ronm
enta
l inf
rast
ruct
ure
11.4
1.4
7.7
1.1
5.0
41.3
8.0
5.4
16.0
7.9
10.2
Tota
l 6.T
erri
tori
al p
olic
y25
.849
.112
.435
.733
.522
.915
.133
.322
.221
.521
.16.
1 To
uris
m11
.89.
82.
614
.76.
510
.74.
827
.85.
86.
94.
96.
2 Pl
anni
ng a
nd r
ehab
ilita
tion
9.0
3.6
0.0
2.0
8.6
5.9
5.5
5.4
1.6
5.5
9.0
6.3
Soci
al in
fras
truc
ture
4.9
35.7
9.8
16.6
18.0
6.2
4.8
0.0
10.1
8.7
6.3
6.4
Dev
elop
men
t of r
ural
are
as0.
00.
00.
02.
40.
40.
00.
00.
04.
70.
50.
97.
Tech
nica
l ass
ista
nce
3.2
6.3
3.9
2.7
4.2
5.3
2.0
5.3
13.3
3.4
2.1
Tota
l Obj
ectiv
e 1
100.
010
0.0
100.
010
0.0
100.
010
0.0
100.
010
0.0
100.
010
0.0
100.
0
Sour
ce: C
alcu
latio
ns b
ased
on
DG R
egio
dat
a
Ex-post Evaluation of the ERDF 2000-2006 Synthesis Report
31
Territorial policy, comprising a mix of different types of measure, including support for the development of rural areas, planning and rehabilitation (the clean-up and renovation of urban and rural areas), social infrastructure and tourism, accounted for 21% in the EU15 and as much as 36% in Portugal. Agriculture and fisheries (mostly agriculture) and the Environment and energy (mostly the former), each accounted for 7.5% of funding.
The three general messages which are reflected in the division of Objective 1 funding are:
• first, that it varied markedly between regions, which in turn reflects differences in relative priorities and the most pressing needs.
• secondly, that funding tended to be relatively widely dispersed across policy areas in individual regions;
• thirdly, that a significant proportion of funding in many cases went to policy areas not directly connected to economic development – to territorial policy and environmental infrastructure, especially.
1.2.2 Objective 1 funding in the EU10
In Objective 1 regions in the EU10 countries, the average division of ERDF support over the (shorter) period was similar to that in the EU15, except more went to Transport and telecommunications (44%) and less to Enterprise support (21%) (Table 1.8). An almost identical share of funding as in the EU15 went to Territorial policy and Environmental infrastructure, these two together accounting for almost a third of the total on average, and much more in Hungary, Lithuania, Slovenia and, most especially, Estonia. In the last, some 35% of total ERDF financing was assigned to Social infrastructure. In the EU10 as in the EU15, therefore, funding was distributed over a large number of policy areas, including those not closely linked to economic development per se.
1.2.3 Objective 2 funding
The main difference in the allocation of Objective 2 funding between policy areas from that of Objective 1 was the higher priority attached to Enterprise support (which accounted for 48% of the total ERDF in the EU15) and Territorial policy (31%) and the correspondingly lower priority attached to Transport and telecommunications (11%) (Table 1.9).
In 6 countries, over half of funding went to Enterprise support, while in three (France, Luxembourg and the Netherlands), over 40% of funding went to Territorial policy, mainly to Planning and rehabilitation and Tourism, and in a fourth (Italy), the proportion was over a third.
As in the case of Objective 1, therefore, Objective 2 funding differed across the EU according to the relative priority attached to the different policy areas and while there was some relative concentration on one or two broad areas, funding was fairly widely dispersed. Moreover, more than in the case of Objective 1, a significant part of funding was directed at policy areas which had more to do with social cohesion and territorial balance than economic growth.
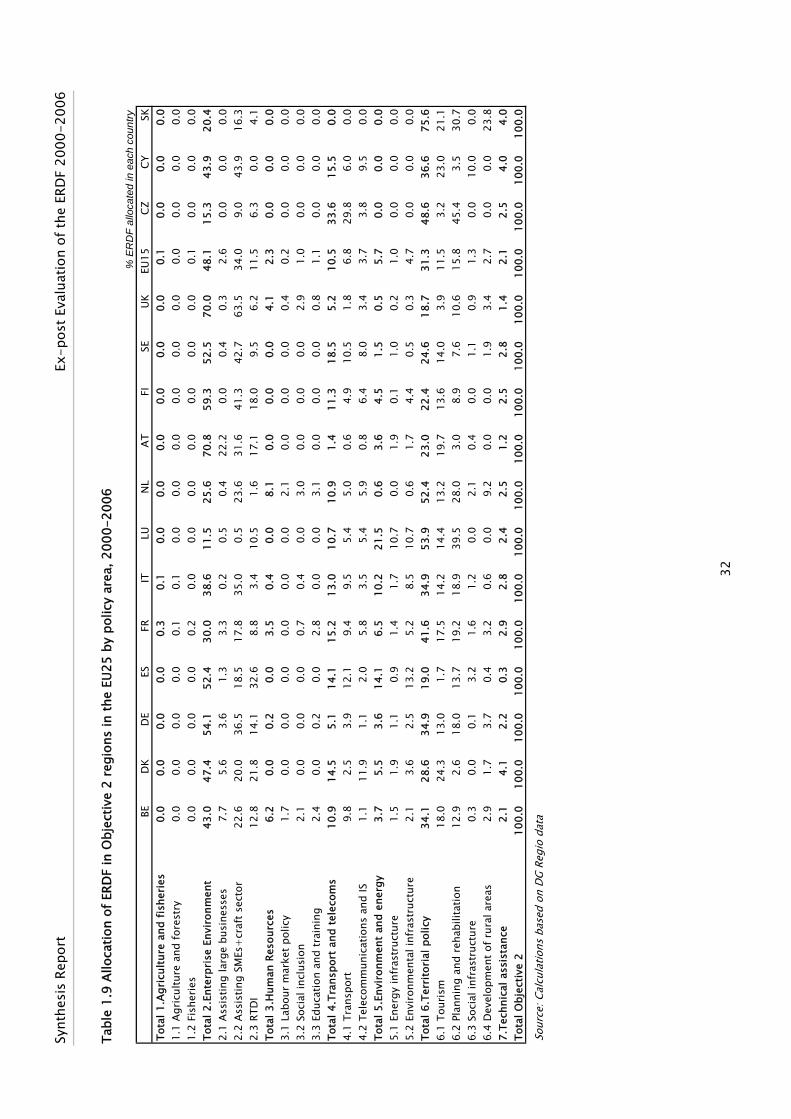
Synt
hesi
s Re
port
Ex-p
ost E
valu
atio
n of
the
ERD
F 20
00-2
006
32
Tabl
e 1.
9 Al
loca
tion
of E
RDF
in O
bjec
tive
2 re
gion
s in
the
EU25
by
polic
y ar
ea, 2
000-
2006
%
ER
DF
allo
cate
d in
eac
h co
untry
BED
KD
EES
FRIT
LUN
LAT
FISE
UKEU
15CZ
CYSK
Tota
l 1.A
gric
ultu
re a
nd f
ishe
ries
0.0
0.0
0.0
0.0
0.3
0.1
0.0
0.0
0.0
0.0
0.0
0.0
0.1
0.0
0.0
0.0
1.1
Agric
ultu
re a
nd fo
rest
ry0.
00.
00.
00.
00.
10.
10.
00.
00.
00.
00.
00.
00.
00.
00.
00.
01.
2 Fi
sher
ies
0.0
0.0
0.0
0.0
0.2
0.0
0.0
0.0
0.0
0.0
0.0
0.0
0.1
0.0
0.0
0.0
Tota
l 2.E
nter
pris
e En
viro
nmen
t43
.047
.454
.152
.430
.038
.611
.525
.670
.859
.352
.570
.048
.115
.343
.920
.42.
1 As
sist
ing
larg
e bu
sine
sses
7.7
5.6
3.6
1.3
3.3
0.2
0.5
0.4
22.2
0.0
0.4
0.3
2.6
0.0
0.0
0.0
2.2
Assi
stin
g SM
Es+
craf
t sec
tor
22.6
20.0
36.5
18.5
17.8
35.0
0.5
23.6
31.6
41.3
42.7
63.5
34.0
9.0
43.9
16.3
2.3
RTD
I12
.821
.814
.132
.68.
83.
410
.51.
617
.118
.09.
56.
211
.56.
30.
04.
1To
tal 3
.Hum
an R
esou
rces
6.2
0.0
0.2
0.0
3.5
0.4
0.0
8.1
0.0
0.0
0.0
4.1
2.3
0.0
0.0
0.0
3.1
Labo
ur m
arke
t pol
icy
1.7
0.0
0.0
0.0
0.0
0.0
0.0
2.1
0.0
0.0
0.0
0.4
0.2
0.0
0.0
0.0
3.2
Soci
al in
clus
ion
2.1
0.0
0.0
0.0
0.7
0.4
0.0
3.0
0.0
0.0
0.0
2.9
1.0
0.0
0.0
0.0
3.3
Educ
atio
n an
d tr
aini
ng2.
40.
00.
20.
02.
80.
00.
03.
10.
00.
00.
00.
81.
10.
00.
00.
0To
tal 4
.Tra
nspo
rt a
nd te
leco
ms
10.9
14.5
5.1
14.1
15.2
13.0
10.7
10.9
1.4
11.3
18.5
5.2
10.5
33.6
15.5
0.0
4.1
Tran
spor
t9.
82.
53.
912
.19.
49.
55.
45.
00.
64.
910
.51.
86.
829
.86.
00.
04.
2 Te
leco
mm
unic
atio
ns a
nd IS
1.1
11.9
1.1
2.0
5.8
3.5
5.4
5.9
0.8
6.4
8.0
3.4
3.7
3.8
9.5
0.0
Tota
l 5.E
nvir
onm
ent
and
ener
gy3.
75.
53.
614
.16.
510
.221
.50.
63.
64.
51.
50.
55.
70.
00.
00.
05.
1 En
ergy
infr
astr
uctu
re1.
51.
91.
10.
91.
41.
710
.70.
01.
90.
11.
00.
21.
00.
00.
00.
05.
2 En
viro
nmen
tal i
nfra
stru
ctur
e2.
13.
62.
513
.25.
28.
510
.70.
61.
74.
40.
50.
34.
70.
00.
00.
0To
tal 6
.Ter
rito
rial
pol
icy
34.1
28.6
34.9
19.0
41.6
34.9
53.9
52.4
23.0
22.4
24.6
18.7
31.3
48.6
36.6
75.6
6.1
Tour
ism
18.0
24.3
13.0
1.7
17.5
14.2
14.4
13.2
19.7
13.6
14.0
3.9
11.5
3.2
23.0
21.1
6.2
Plan
ning
and
reh
abili
tatio
n12
.92.
618
.013
.719
.218
.939
.528
.03.
08.
97.
610
.615
.845
.43.
530
.76.
3 So
cial
infr
astr
uctu
re0.
30.
00.
13.
21.
61.
20.
02.
10.
40.
01.
10.
91.
30.
010
.00.
06.
4 D
evel
opm
ent o
f rur
al a
reas
2.9
1.7
3.7
0.4
3.2
0.6
0.0
9.2
0.0
0.0
1.9
3.4
2.7
0.0
0.0
23.8
7.Te
chni
cal a
ssis
tanc
e2.
14.
12.
20.
32.
92.
82.
42.
51.
22.
52.
81.
42.
12.
54.
04.
0To
tal O
bjec
tive
210
0.0
100.
010
0.0
100.
010
0.0
100.
010
0.0
100.
010
0.0
100.
010
0.0
100.
010
0.0
100.
010
0.0
100.
0
Sour
ce: C
alcu
latio
ns b
ased
on
DG R
egio
dat
a

Ex-post Evaluation of the ERDF 2000-2006 Synthesis Report
33
1.3 ALLOCATION OF ERDF FUNDING BETWEEN TYPES OF AREA The evaluation was concerned to examine not only the allocation of ERDF funding between policy areas but also between types of geographical area at a more detailed level than NUTS 2 regions. The question addressed was whether there was a relative concentration of the expenditure financed by the ERDF in rural areas or urban areas. The analysis was conducted at a NUTS 3 regional level and was concerned not only with the total amount of expenditure financed under Objective 1 and Objective 2 but also how this was divided between policy areas in the different types of region.
The NUTS 3 regions were grouped into types of area according to the OECD classification system. Under this system, regions are defined as being predominantly urban, intermediate or rural depending on the proportion of population living in small areas, or what are termed ‘local units’, where population density is above or below a 150 people per square km (see Box). Rural and intermediate regions can be further divided into those which are close to a city and, therefore, have access to the services and amenities – as well as jobs – which it can provide, and those which are more remote, which essentially have to be more reliant on local services and jobs.
Box – Definition of types of area The basis of the OECD classification of regions is the ‘local unit’, a small area for which there are at least some data for all EU Member States and which corresponds to a commune or district. NUTS 3 regions are divided in the following way between types of area:
• rural areas, if more than half of the population of the region live in local units with population density below 150 per square km
• predominantly urban areas, if 85% or more people live in local units with a population density of over 150 per square km
• intermediate areas, if 50-85% or more live in local units with population density of over 150 per square km.
The last two types of area can be further divided between those which are close to a city and those which are more remote. Specifically, the former are defined as areas where at least half the population can reach a town or city of over 100,000 people in less than an hour, which implies they have relatively easy access to a reasonable range of support services and amenities, the latter as those for which this is not the case.
1.3.1 Objective 1 regions in the EU15
Given that rural areas tend on average to lag behind more urban ones in terms of their GDP per head (partly, it should be noted, because of the depressing effect of outward commuting on this), it would be expected that much of the financial support provided by the ERDF went to such regions. In fact, over the 2000-2006 period as a whole, almost EUR 25 billion of the total amount of ERDF support to Objective 1 regions in the EU15 went to NUTS 3 regions defined as being rural. This represents some 27% of the total funding from this source, almost twice the proportion of population of the countries concerned living in these regions (just under 15%), signalling that there was indeed a relative concentration of financial support in rural areas (Table 1.10, in which the data are based on commitments up to the end of 2006).
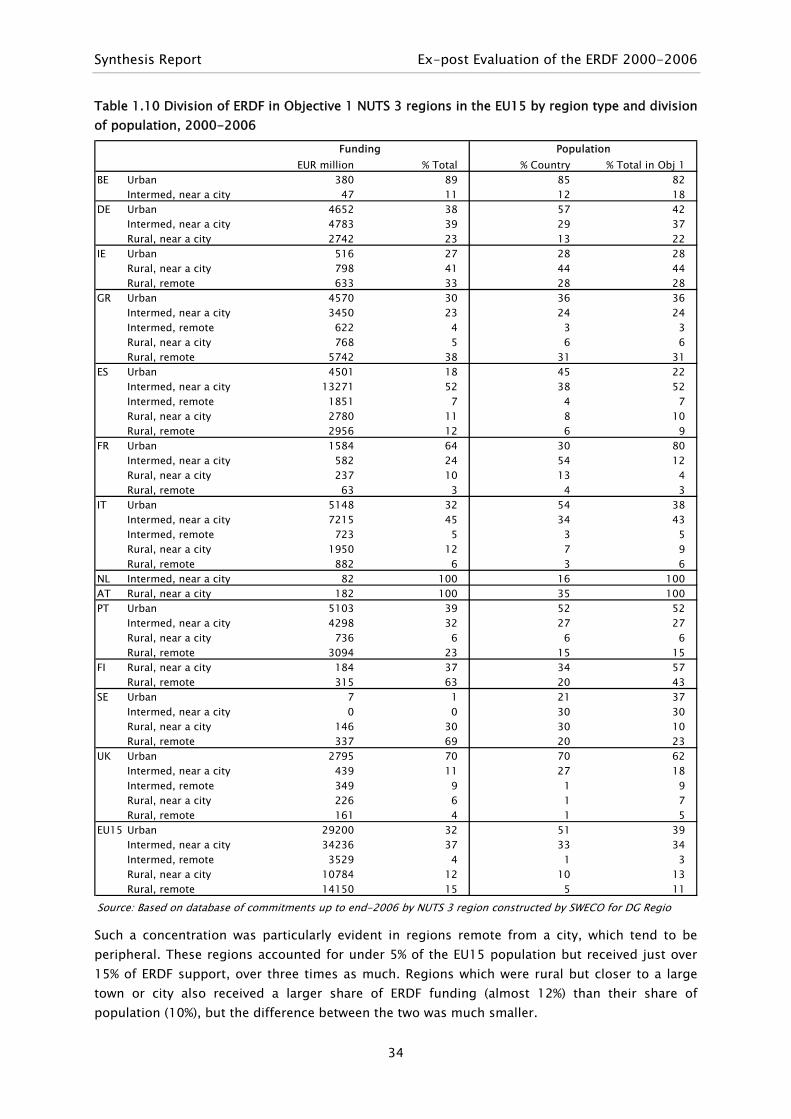
Synthesis Report Ex-post Evaluation of the ERDF 2000-2006
34
Table 1.10 Division of ERDF in Objective 1 NUTS 3 regions in the EU15 by region type and division of population, 2000-2006
EUR million % Total % Country % Total in Obj 1BE Urban 380 89 85 82
Intermed, near a city 47 11 12 18DE Urban 4652 38 57 42
Intermed, near a city 4783 39 29 37Rural, near a city 2742 23 13 22
IE Urban 516 27 28 28Rural, near a city 798 41 44 44Rural, remote 633 33 28 28
GR Urban 4570 30 36 36Intermed, near a city 3450 23 24 24Intermed, remote 622 4 3 3Rural, near a city 768 5 6 6Rural, remote 5742 38 31 31
ES Urban 4501 18 45 22Intermed, near a city 13271 52 38 52Intermed, remote 1851 7 4 7Rural, near a city 2780 11 8 10Rural, remote 2956 12 6 9
FR Urban 1584 64 30 80Intermed, near a city 582 24 54 12Rural, near a city 237 10 13 4Rural, remote 63 3 4 3
IT Urban 5148 32 54 38Intermed, near a city 7215 45 34 43Intermed, remote 723 5 3 5Rural, near a city 1950 12 7 9Rural, remote 882 6 3 6
NL Intermed, near a city 82 100 16 100AT Rural, near a city 182 100 35 100PT Urban 5103 39 52 52
Intermed, near a city 4298 32 27 27Rural, near a city 736 6 6 6Rural, remote 3094 23 15 15
FI Rural, near a city 184 37 34 57Rural, remote 315 63 20 43
SE Urban 7 1 21 37Intermed, near a city 0 0 30 30Rural, near a city 146 30 30 10Rural, remote 337 69 20 23
UK Urban 2795 70 70 62Intermed, near a city 439 11 27 18Intermed, remote 349 9 1 9Rural, near a city 226 6 1 7Rural, remote 161 4 1 5
EU15 Urban 29200 32 51 39Intermed, near a city 34236 37 33 34Intermed, remote 3529 4 1 3Rural, near a city 10784 12 10 13Rural, remote 14150 15 5 11
Source: Based on database of commitments up to end-2006 by NUTS 3 region constructed by SWECO for DG Regio
Funding Population
Such a concentration was particularly evident in regions remote from a city, which tend to be peripheral. These regions accounted for under 5% of the EU15 population but received just over 15% of ERDF support, over three times as much. Regions which were rural but closer to a large town or city also received a larger share of ERDF funding (almost 12%) than their share of population (10%), but the difference between the two was much smaller.

Ex-post Evaluation of the ERDF 2000-2006 Synthesis Report
35
More significantly, the share of Objective 1 funding going to remote rural areas was also greater than the share of population living in Objective 1 regions (15% as opposed to 11%). This means that within Objective 1 regions there was equally a relatively concentration of support on these areas. This was not the case for rural areas close to a large town or city, where the share of support was slightly smaller than their share of population.
This pattern was common to nearly all EU15 countries. It was particularly evident in Finland and Sweden, where the funding was channelled to sparsely populated regions and where it was concentrated on the most ‘rural’ areas within these regions. It was also evident in Portugal. It was not evident in Italy, while in the UK, funding was concentrated in urban rather than rural areas, reflecting perhaps the greater problems in the former than the latter.
1.3.2 Objective 1 regions in the EU10
In the EU10, where nearly all regions were eligible for Objective 1 support, there was in general less concentration of funding in rural areas. Of the total of EUR 9 billion of ERDF funding, around a third went to rural areas, only marginally more than their share of population (Table 1.11).
Only in Hungary did a significantly larger share of the ERDF go to remote rural areas than their share of population. In Poland, Latvia, Lithuania and, to a lesser extent, Slovenia, the share was smaller, in Estonia, much the same (in the other countries, there are no remote rural areas).
If account is also taken of rural areas close to a city, the position is:
• in Slovakia, Slovenia, the Czech Republic and Hungary, there was a relative concentration of Objective 1 funding on rural areas, if only comparatively small in the last three countries.
• in Poland, Latvia and Lithuania, funding was concentrated in predominantly urban rather than rural areas, despite the expressed policy aim of pursuing balanced growth;
• in Estonia, there was a balanced distribution of funding between rural and urban areas.
The above figures, however, need to be interpreted with care. As argued elsewhere in this report, the fact that expenditure takes place in a particular area does not mean that its effects are confined to the area concerned. This is especially so in the case of NUTS 3 regions which tend to be relatively small in spatial terms and where, accordingly, any investment supported might bring significant benefits to those living in neighbouring regions. A stimulus to economic activity, therefore, can mean more jobs for those commuting from other regions as well as for those living in the region itself. Indeed, those living in a rural area might gain more from investment outside the area than from investment inside, particularly if business conditions are more favourable in the former area.
This argument, however, tends to hold more for rural areas close to a city than those which are remote, where it more difficult to reach a sizable centre of economic activity or population.
At the same time, it should also be bone in mind that the figures relate only to the ERDF rather than to the Structural Funds as a whole, and it may be that support from the other Funds was allocated across types of region in a different way. For example, it might be that support to rural areas was concentrated on education and training in order to improve the skills of the work force rather than on infrastructure or enterprise support.

Synthesis Report Ex-post Evaluation of the ERDF 2000-2006
36
Table 1.11 Division of ERDF in Objective 1 regions by type of region and division of population in the EU10, 2004-2006
EUR million % Total % Country % Total in Obj 1CZ Intermed, near a city 854 93 84 94
Rural, near a city 59 6 5 6EE Urban 25 11 13 13
Intermed, near a city 146 63 64 64Intermed, remote 38 16 12 12Rural, remote 24 10 11 11
LV Urban 145 38 32 32Intermed, near a city 52 14 16 16Intermed, remote 63 17 13 13Rural, near a city 88 23 28 28Rural, remote 34 9 11 11
LT Urban 306 52 25 25Intermed, near a city 188 32 50 50Intermed, remote 14 2 5 5Rural, near a city 40 7 11 11Rural, remote 36 6 9 9
HU Urban 181 15 17 17Intermed, near a city 544 44 42 42Rural, near a city 230 19 22 22Rural, remote 285 23 20 20
MT Urban 47 100 100 100PL Urban 1388 28 22 22
Intermed, near a city 1745 35 39 39Rural, near a city 1751 35 35 35Rural, remote 89 2 4 4
SI Intermed, near a city 42 31 37 37Intermed, remote 9 6 5 5Rural, near a city 81 60 54 54Rural, remote 4 3 4 4
SK Intermed, near a city 340 59 63 71Rural, near a city 234 41 25 29
EU10 Urban 2097 23 19 17Intermed, near a city 3904 43 48 49Intermed, remote 124 1 1 1Rural, near a city 2484 27 27 28Rural, remote 473 5 6 6
EU25 Urban 31298 31 46 30Intermed, near a city 38140 38 36 40Intermed, remote 3653 4 1 2Rural, near a city 13265 13 13 19Rural, remote 14624 14 5 9
Source: Based on database of commitments up to end-2006 by NUTS 3 region constructed by SWECO for DG Regio
Funding Population
1.3.3 Objective 2 regions
Around 21% of Objective 2 funding went to rural areas in EU15 countries (around EUR 4.6 billion overall). Of this, some EUR 1.3 billion, or just under 6% of the total, went to rural areas remote from a city (Table 1.12). This, however, is well over twice the proportion of the population living in these areas (2.5%) if the population living in Objective 1 regions is excluded – i.e. if the comparison is confined to regions potentially eligible for support under Objective 2. The proportion of funding going to rural areas close to a city (15%) was also significantly larger than their share of population (9%).

Ex-post Evaluation of the ERDF 2000-2006 Synthesis Report
37
Table 1.12 Division of ERDF in Objective 2 regions by region type and division of population
EUR million % Total % Country excl Obj 1 % Total in Obj 2BE Urban 338 81 85 77
Intermediate 14 3 11 10Rural near a city 65 16 4 14
DK Intermediate 27 19 32 15Rural near a city 64 46 18 47Rural remote 50 36 21 38
DE Urban 1888 58 61 53Intermediate 759 23 28 26Rural near a city 575 18 11 19Rural remote 29 1 0 1
ES Urban 1778 70 77 73Intermediate 614 24 19 22Rural near a city 116 5 3 4Rural remote* 46 2 1 1
FR Urban 662 12 25 11Intermediate 3427 60 57 59Rural near a city 1163 20 14 22Rural remote 451 8 4 8
IT Urban 1263 46 62 46Intermediate 935 34 31 38Rural near a city 321 12 6 13Rural remote 202 7 1 3
LU Intermediate* 44 100 100 100NL Urban 328 38 85 60
Intermediate 455 53 14 34Rural close to a city 75 9 1 6
AT Urban 22 3 24 4Intermediate 116 16 32 14Rural near a city 378 54 33 54Rural remote 190 27 11 27
FI Urban* 1 0 37 0Intermediate 34 8 30 20Rural near a city 242 59 24 60Rural remote 135 33 10 19
SE Urban* 2 1Intermediate 60 16 30 16Rural near a city 159 41 54 42Rural remote 165 43 16 42
UK Urban 3367 74 71 73Intermediate 1049 23 29 25Rural near a city 111 2 1 2
EU15 Rural remote 9704 45 56 44Urban 7499 35 33 35Intermediate 3264 15 9 16Rural near a city 1254 6 2 5
CZ Urban 71 100 100 100CY Intermediate 28 100 100 100SK Urban 37 100 100 100
Source: Based on database of commitments up to end-2006 by NUTS 3 region constructed by SWECO for DG Regio
Funding Population
Note: Objective 2 includes Objective 2 phasing out regions. The population in these has been weighted by funding received per head, which in most cases was substantially smaller than in non-phasing out regions, in order to improve comparability between the two types of region.
Accordingly, Objective 2 funding was relatively concentrated in rural areas across the EU15, implying that these areas were regarded as the most problematic outside of Objective 1 and, therefore, most in need of support. This was the case in all Member States without exception, the

Synthesis Report Ex-post Evaluation of the ERDF 2000-2006
38
most extreme example being in Austria, where around 80% of Objective 2 funding went to rural areas, which accounted for only 44% of the population.
Within Objective 2 regions, the allocation of funding between different types of area was broadly in line with population in most countries, so that – after adjusting for phasing out areas – there was only limited variation in the funding per head across areas.
1.3.4 Division of expenditure by type of area in Objective 1 regions
In practice, the division of Objective 1 funding did not tend to vary much between policy areas in the different types of region, at least at the EU15 level. The main difference was that a larger share of funding went to RTDI in urban areas than elsewhere, while a larger share went to transport in rural areas, especially in those remote from a city (Table 1.13).
The relative concentration of RTDI in urban areas was common across countries, with the sole exception of the UK and to a lesser extent Sweden. Except for RTDI, however, there were few systematic differences in the allocation of expenditure between types of region. There was, therefore, no common mix of policy measures which was applied to urban or rural areas over the period across Member States and, accordingly, no common strategy for the development of each type of region. This might reflect differences in expenditure needs in particular types of region between countries or differences in the strategy for responding to those needs as well as in the priority attached to taking action in the different policy areas. For example, in Spain and the UK, a much larger share of funding went to planning and rehabilitation in urban areas than in other types, in Italy and Portugal, a relatively large share went to this policy area in rural areas, especially remote ones, rather than in urban areas.
Nevertheless, a widespread feature which does emerge is that, except in Greece and Spain, a larger share of funding was devoted to enterprise support in rural areas remote from a city than in those close to a city. This could reflect the greater need to sustain economic activity in the former in order to maintain population, whereas, as noted above, in areas close to a city, there is a greater possibility of commuting and, therefore, more reliance on the economic activity and jobs which are present there.
There were also no big differences across the EU10 countries in the division of funding in different types of region (Table 1.14). As in the EU15, apart from the share of funding for RTDI in urban areas being larger than elsewhere, there were no systematic differences in the allocation of expenditure.
1.3.5 Division of expenditure by type of area in Objective 2 regions
There were more systematic differences in the division of ERDF financing between the different types of area in Objective 2 regions (Table 1.15). In particular:
• as in Objective 1 regions, but even more, so much larger share of funding went to RDTI in urban areas than others;
• as a counterpart, a much larger share of funding went to support of tourism in rural areas than elsewhere;
• a larger share of funding was allocated to planning and rehabilitation in urban areas than other;
• a larger share of funding in rural than other areas went to environmental infrastructure.

Ex-p
ost E
valu
atio
n of
the
ERD
F 20
00-2
006
Sy
nthe
sis
Repo
rt
39
Tabl
e 1.
13 D
ivis
ion
of E
RDF
in O
bjec
tive
1 N
UTS
3 re
gion
s by
reg
ion
type
in th
e EU
15 b
y po
licy
area
, 200
0-20
06
% to
tal e
xpen
ditu
reAg
ricul
ture
an
d fo
rest
ryD
evel
op-
men
t of r
ural
Fi
sher
ies
Aid
to
firm
sTo
uris
mRT
DI
Hum
an
reso
urce
sTr
ansp
ort
Tele
com
sEn
ergy
Envi
ron-
men
tal i
nfra
-Pl
anni
ng
and
Soci
al in
fra-
stru
ctur
eTe
chni
cal
assi
stan
ce
Tota
l
BEUr
ban
51.1
9.7
24.5
0.4
1.2
1.1
11.5
0.4
88.9
Inte
rmed
, nea
r a
45.7
17.7
22.4
0.8
2.0
1.5
9.3
0.6
11.1
DE
Urba
n0.
20.
120
.21.
832
.24.
724
.72.
00.
15.
27.
01.
638
.2In
term
ed, n
ear
a 0.
30.
028
.42.
89.
82.
826
.32.
00.
218
.78.
60.
139
.3Ru
ral,
near
a c
ity1.
20.
034
.94.
810
.61.
427
.31.
60.
710
.06.
90.
722
.5IE
Urba
n1.
23.
41.
813
.03.
959
.33.
70.
88.
63.
80.
526
.5Ru
ral,
near
a c
ity1.
43.
72.
111
.63.
856
.84.
41.
18.
63.
33.
141
.0Ru
ral,
rem
ote
1.6
4.0
2.5
10.2
3.6
54.3
5.2
1.5
8.6
2.8
5.6
32.5
GRUr
ban
0.1
8.1
1.1
2.6
1.7
44.4
15.9
1.7
3.1
10.0
8.6
2.6
30.2
Inte
rmed
, nea
r a
0.1
0.7
12.7
2.8
2.6
1.5
42.4
7.7
0.5
4.9
11.4
9.5
3.4
22.8
Inte
rmed
, rem
ote
1.3
7.6
11.5
1.2
1.5
23.1
9.2
0.7
12.8
13.8
15.6
1.6
4.1
Rura
l, ne
ar a
city
1.6
13.0
5.4
0.5
1.0
39.1
6.9
1.0
13.0
6.3
8.0
4.3
5.1
Rura
l, re
mot
e0.
01.
011
.44.
80.
51.
044
.67.
61.
18.
18.
28.
33.
237
.9ES
Urba
n0.
114
.80.
414
.73.
419
.41.
20.
211
.130
.83.
60.
317
.7In
term
ed, n
ear
a ci
t0.
114
.30.
38.
93.
335
.00.
80.
111
.620
.34.
80.
352
.3In
term
ed, r
emot
e0.
110
.40.
29.
51.
633
.31.
70.
513
.721
.86.
90.
27.
3Ru
ral,
near
a c
ity0.
318
.30.
36.
23.
634
.80.
50.
310
.320
.54.
60.
211
.0Ru
ral,
rem
ote
0.4
10.5
0.2
7.6
4.6
38.2
0.5
0.1
13.5
21.3
2.8
0.2
11.7
FRUr
ban
0.0
3.5
0.1
11.0
10.7
4.6
7.9
20.2
2.2
2.2
14.8
15.5
6.1
1.2
64.2
Inte
rmed
, nea
r a
3.5
11.5
10.4
1.1
16.5
28.1
2.5
1.6
9.5
4.3
9.3
1.7
23.6
Rura
l, ne
ar a
city
5.5
1.5
1.2
31.3
28.9
0.5
0.9
10.3
7.9
7.9
4.2
9.6
Rura
l, re
mot
e3.
37.
97.
92.
720
.25.
71.
336
.80.
713
.62.
6IT
Urba
n25
.35.
311
.728
.54.
01.
38.
910
.11.
73.
032
.3In
term
ed, n
ear
a ci
t30
.77.
25.
524
.33.
52.
08.
814
.41.
62.
145
.3In
term
ed, r
emot
e30
.86.
70.
527
.01.
52.
610
.017
.41.
81.
64.
5Ru
ral,
near
a c
ity31
.17.
44.
316
.110
.10.
512
.512
.83.
12.
112
.3Ru
ral,
rem
ote
37.1
6.5
1.0
12.8
2.3
0.6
14.4
20.9
3.1
1.4
5.5
NL
Inte
rmed
, nea
r a
7.9
20.3
15.1
7.0
18.6
6.3
20.0
2.1
2.8
100.
0AT
Rura
l, ne
ar a
city
58.0
28.7
4.2
1.5
3.1
3.0
1.5
100.
0PT
Urba
n0.
10.
126
.03.
39.
21.
026
.55.
63.
54.
58.
510
.51.
338
.6In
term
ed, n
ear
a ci
t0.
21.
10.
125
.12.
64.
61.
222
.54.
72.
96.
511
.416
.30.
832
.5Ru
ral,
near
a c
ity0.
80.
117
.23.
63.
90.
227
.74.
23.
55.
117
.413
.92.
65.
6Ru
ral,
rem
ote
0.1
6.3
0.0
23.1
3.1
2.6
0.1
21.3
2.8
6.0
5.4
13.5
14.5
1.3
23.4
FIRu
ral,
near
a c
ity3.
446
.228
.67.
28.
93.
70.
31.
736
.8Ru
ral,
rem
ote
4.4
44.5
23.6
10.7
9.8
3.2
1.6
2.1
63.2
SEUr
ban
5.8
71.3
1.1
21.8
1.3
Inte
rmed
, nea
r a
cit
100.
00.
0Ru
ral,
near
a c
ity4.
80.
242
.89.
521
.49.
69.
62.
129
.8Ru
ral,
rem
ote
0.0
1.6
40.1
19.4
18.4
6.2
10.9
0.1
0.2
0.1
0.6
2.3
68.9
UKUr
ban
0.2
28.5
8.2
10.4
7.7
9.3
5.4
0.7
0.8
23.8
2.6
2.5
70.4
Inte
rmed
, nea
r a
cit
1.0
30.6
10.2
10.2
8.0
17.1
5.0
0.2
1.3
9.9
3.6
2.9
11.0
Inte
rmed
, rem
ote
0.1
44.2
9.0
26.9
0.1
9.1
2.7
0.7
0.8
2.3
1.8
2.5
8.8
Rura
l, ne
ar a
city
1.9
23.7
9.7
3.1
16.7
12.7
2.3
0.1
16.7
4.6
3.4
5.1
5.7
Rura
l, re
mot
e35
.26.
05.
31.
028
.06.
83.
43.
02.
06.
92.
44.
1EU
15Ur
ban
0.0
0.3
0.1
19.8
3.5
13.3
2.9
26.6
5.4
1.4
6.4
13.9
4.6
1.8
31.8
Inte
rmed
, nea
r a
0.1
0.3
0.1
21.2
3.0
7.0
2.4
30.3
2.8
0.9
10.5
15.0
5.4
1.1
37.3
Inte
rmed
, rem
ote
0.1
0.2
17.3
4.4
7.9
1.1
27.9
3.1
1.0
11.6
17.6
6.9
1.0
3.8
Rura
l, ne
ar a
city
0.4
0.2
0.2
24.7
4.3
7.2
2.7
29.0
3.8
0.8
10.1
11.5
3.5
1.6
11.7
Rura
l, re
mot
e0.
01.
50.
516
.73.
73.
91.
534
.64.
82.
08.
812
.27.
52.
115
.4So
urce
: Bas
ed o
n da
taba
se o
f com
mitm
ents
up
to e
nd-2
006
by N
UTS
3 re
gion
con
stru
cted
by
SWEC
O fo
r DG
Regi
o
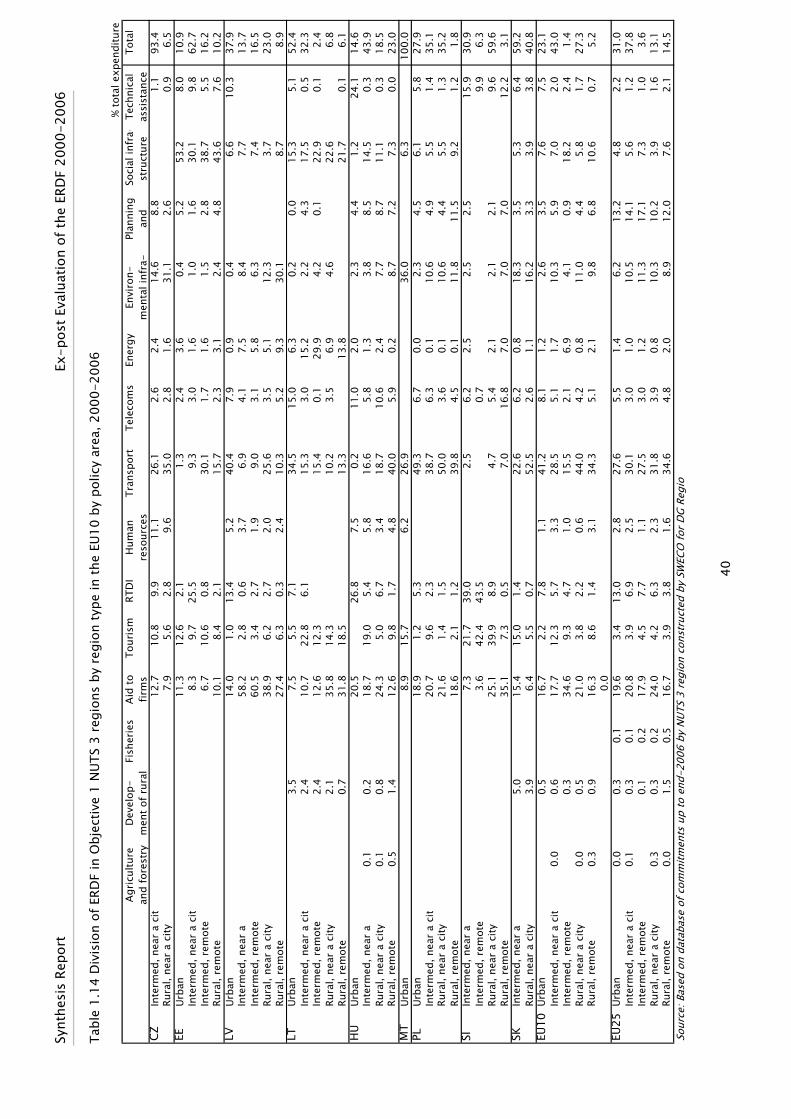
Synt
hesi
s Re
port
Ex-p
ost E
valu
atio
n of
the
ERD
F 20
00-2
006
40
Tabl
e 1.
14 D
ivis
ion
of E
RDF
in O
bjec
tive
1 N
UTS
3 re
gion
s by
reg
ion
type
in th
e EU
10 b
y po
licy
area
, 200
0-20
06
% to
tal e
xpen
ditu
reAg
ricul
ture
an
d fo
rest
ryD
evel
op-
men
t of r
ural
Fi
sher
ies
Aid
to
firm
sTo
uris
mRT
DI
Hum
an
reso
urce
sTr
ansp
ort
Tele
com
sEn
ergy
Envi
ron-
men
tal i
nfra
-Pl
anni
ng
and
Soci
al in
fra-
stru
ctur
eTe
chni
cal
assi
stan
ce
Tota
l
CZIn
term
ed, n
ear
a ci
t12
.710
.89.
911
.126
.12.
62.
414
.68.
81.
193
.4Ru
ral,
near
a c
ity7.
95.
62.
89.
635
.02.
81.
631
.12.
60.
96.
5EE
Urba
n11
.312
.62.
11.
32.
43.
60.
45.
253
.28.
010
.9In
term
ed, n
ear
a ci
t8.
39.
725
.59.
33.
01.
61.
01.
630
.19.
862
.7In
term
ed, r
emot
e6.
710
.60.
830
.11.
71.
61.
52.
838
.75.
516
.2Ru
ral,
rem
ote
10.1
8.4
2.1
15.7
2.3
3.1
2.4
4.8
43.6
7.6
10.2
LVUr
ban
14.0
1.0
13.4
5.2
40.4
7.9
0.9
0.4
6.6
10.3
37.9
Inte
rmed
, nea
r a
58.2
2.8
0.6
3.7
6.9
4.1
7.5
8.4
7.7
13.7
Inte
rmed
, rem
ote
60.5
3.4
2.7
1.9
9.0
3.1
5.8
6.3
7.4
16.5
Rura
l, ne
ar a
city
38.9
6.2
2.7
2.0
25.6
3.5
5.1
12.3
3.7
23.0
Rura
l, re
mot
e27
.46.
30.
32.
410
.35.
29.
330
.18.
78.
9LT
Urba
n3.
57.
55.
57.
134
.515
.06.
30.
20.
015
.35.
152
.4In
term
ed, n
ear
a ci
t2.
410
.722
.86.
115
.33.
015
.22.
24.
317
.50.
532
.3In
term
ed, r
emot
e2.
412
.612
.315
.40.
129
.94.
20.
122
.90.
12.
4Ru
ral,
near
a c
ity2.
135
.814
.310
.23.
56.
94.
622
.66.
8Ru
ral,
rem
ote
0.7
31.8
18.5
13.3
13.8
21.7
0.1
6.1
HU
Urba
n20
.526
.87.
50.
211
.02.
02.
34.
41.
224
.114
.6In
term
ed, n
ear
a 0.
10.
218
.719
.05.
45.
816
.65.
81.
33.
88.
514
.50.
343
.9Ru
ral,
near
a c
ity0.
10.
824
.35.
06.
73.
418
.710
.62.
47.
78.
711
.10.
318
.5Ru
ral,
rem
ote
0.5
1.4
12.6
9.8
1.7
4.8
40.0
5.9
0.2
8.7
7.2
7.3
0.0
23.0
MT
Urba
n8.
915
.76.
226
.936
.06.
310
0.0
PLUr
ban
18.9
1.2
5.3
49.3
6.7
0.0
2.3
4.5
6.1
5.8
27.9
Inte
rmed
, nea
r a
cit
20.7
9.6
2.3
38.7
6.3
0.1
10.6
4.9
5.5
1.4
35.1
Rura
l, ne
ar a
city
21.6
1.4
1.5
50.0
3.6
0.1
10.6
4.4
5.5
1.3
35.2
Rura
l, re
mot
e18
.62.
11.
239
.84.
50.
111
.811
.59.
21.
21.
8SI
Inte
rmed
, nea
r a
7.3
21.7
39.0
2.5
6.2
2.5
2.5
2.5
15.9
30.9
Inte
rmed
, rem
ote
3.6
42.4
43.5
0.7
9.9
6.3
Rura
l, ne
ar a
city
25.1
39.9
8.9
4.7
5.4
2.1
2.1
2.1
9.6
59.6
Rura
l, re
mot
e35
.17.
30.
57.
016
.87.
07.
07.
012
.23.
1SK
Inte
rmed
, nea
r a
5.0
15.4
15.0
1.4
22.6
6.2
0.8
18.3
3.5
5.3
6.4
59.2
Rura
l, ne
ar a
city
3.9
6.4
5.5
0.7
52.5
2.6
1.1
16.2
3.3
3.9
3.8
40.8
EU10
Urba
n0.
516
.72.
27.
81.
141
.28.
11.
22.
63.
57.
67.
523
.1In
term
ed, n
ear
a ci
t0.
00.
617
.712
.35.
73.
328
.55.
11.
710
.35.
97.
02.
043
.0In
term
ed, r
emot
e0.
334
.69.
34.
71.
015
.52.
16.
94.
10.
918
.22.
41.
4Ru
ral,
near
a c
ity0.
00.
521
.03.
82.
20.
644
.04.
20.
811
.04.
45.
81.
727
.3Ru
ral,
rem
ote
0.3
0.9
16.3
8.6
1.4
3.1
34.3
5.1
2.1
9.8
6.8
10.6
0.7
5.2
0.0
EU25
Urba
n0.
00.
30.
119
.63.
413
.02.
827
.65.
51.
46.
213
.24.
82.
231
.0In
term
ed, n
ear
a ci
t0.
10.
30.
120
.83.
96.
92.
530
.13.
01.
010
.514
.15.
61.
237
.8In
term
ed, r
emot
e0.
10.
217
.94.
57.
71.
127
.53.
01.
211
.317
.17.
31.
03.
6Ru
ral,
near
a c
ity0.
30.
30.
224
.04.
26.
32.
331
.83.
90.
810
.310
.23.
91.
613
.1Ru
ral,
rem
ote
0.0
1.5
0.5
16.7
3.9
3.8
1.6
34.6
4.8
2.0
8.9
12.0
7.6
2.1
14.5
Sour
ce: B
ased
on
data
base
of c
omm
itmen
ts u
p to
end
-200
6 by
NUT
S 3
regi
on c
onst
ruct
ed b
y SW
ECO
for D
G Re
gio

Ex-p
ost E
valu
atio
n of
the
ERD
F 20
00-2
006
Sy
nthe
sis
Repo
rt
41
Tabl
e 1.
15 D
ivis
ion
of E
RDF
in O
bjec
tive
2 N
UTS
3 re
gion
s by
reg
ion
type
in th
e EU
15 b
y po
licy
area
, 200
0-20
06
% To
tal e
xpen
ditu
reAg
ricul
ture
an
d fo
rest
ryD
evel
op-
men
t of
rura
lare
as
Aid
to
firm
sTo
uris
mRT
DI
Hum
an
reso
urce
sTr
ansp
ort
Tele
com
sEn
ergy
Envi
ron-
men
tal i
nfra
-st
ruct
ure
Plan
ning
an
d re
habi
l.
Soci
al
infr
a-st
ruct
ure
Tech
nica
l as
sist
ance
To
tal
expe
nd
BEUr
ban
4.1
29.8
17.0
16.6
5.0
5.1
0.4
0.3
2.2
16.6
2.4
0.5
81.1
Inte
rmed
iate
10.5
33.0
28.4
5.2
3.5
6.9
0.2
0.1
9.4
2.8
3.2
Rura
l clo
se to
a c
ity57
.026
.37.
31.
96.
70.
715
.7D
KIn
term
edia
te1.
019
.139
.412
.516
.52.
25.
04.
418
.9Ru
ral c
lose
to a
city
2.4
35.2
27.2
20.2
4.1
6.6
0.1
3.8
0.3
45.5
Rura
l rem
ote
7.9
31.6
29.8
8.7
6.8
5.1
0.6
6.5
3.0
35.5
DE
Urba
n3.
00.
336
.16.
115
.50.
84.
81.
80.
31.
019
.94.
06.
358
.1In
term
edia
te0.
07.
052
.919
.94.
70.
01.
50.
20.
13.
88.
10.
61.
123
.3Ru
ral c
lose
to a
city
0.0
10.7
34.4
20.7
2.9
5.9
0.1
0.4
18.2
5.3
1.4
17.7
Rura
l rem
ote
23.3
11.0
35.0
0.8
17.9
0.4
11.5
0.9
ESUr
ban
17.5
34.3
2.0
14.5
2.4
0.6
10.9
13.2
4.3
0.3
69.6
Inte
rmed
iate
32.9
21.8
0.9
11.2
2.2
0.4
20.1
7.0
3.0
0.4
24.0
Rura
l clo
se to
a c
ity11
.914
.00.
715
.94.
41.
421
.411
.718
.10.
64.
6Ru
ral r
emot
e16
.62.
97.
03.
32.
735
.99.
321
.40.
91.
8FR
Urba
n2.
114
.18.
320
.15.
314
.02.
91.
32.
427
.10.
02.
311
.6In
term
edia
te0.
03.
619
.714
.97.
93.
111
.32.
91.
06.
125
.61.
32.
560
.1Ru
ral c
lose
to a
city
0.0
4.2
21.5
21.5
5.6
5.5
9.0
4.2
1.6
4.8
18.7
1.3
2.0
20.4
Rura
l rem
ote
0.1
2.2
25.2
19.4
4.4
2.6
14.2
5.7
0.8
4.6
13.1
0.3
7.5
7.9
ITUr
ban
40.8
6.4
5.5
10.7
2.2
1.7
6.1
21.6
2.1
2.9
46.4
Inte
rmed
iate
33.7
11.9
2.9
12.5
1.9
1.2
8.8
22.2
2.7
2.4
34.4
Rura
l clo
se to
a c
ity35
.112
.80.
39.
46.
42.
48.
121
.31.
92.
311
.8Ru
ral r
emot
e40
.410
.61.
04.
70.
60.
78.
326
.94.
52.
37.
4LU
Inte
rmed
iate
7.7
16.1
12.5
7.9
2.1
21.3
25.1
6.3
1.1
100.
0N
LUr
ban
12.2
16.0
7.8
1.6
10.3
8.2
4.3
1.2
30.4
4.9
3.1
38.2
Inte
rmed
iate
39.0
21.6
2.8
1.7
8.7
2.0
0.3
22.9
1.1
53.0
Rura
l clo
se to
a c
ity39
.021
.62.
81.
78.
72.
00.
322
.91.
18.
8AT
Urba
n30
.54.
317
.61.
61.
26.
834
.10.
33.
63.
1In
term
edia
te49
.620
.323
.80.
43.
60.
91.
00.
416
.4Ru
ral c
lose
to a
city
48.2
19.7
18.9
2.9
1.9
6.2
1.5
0.3
0.5
53.6
Rura
l rem
ote
43.7
32.6
6.5
1.1
0.4
5.7
4.5
3.8
1.5
26.9
FIUr
ban
6.1
4.2
6.0
47.2
23.0
13.4
0.3
Inte
rmed
iate
53.5
10.2
5.4
11.8
15.5
3.6
8.2
Rura
l clo
se to
a c
ity46
.018
.37.
810
.015
.72.
258
.7Ru
ral r
emot
e41
.00.
720
.516
.20.
99.
89.
01.
932
.8SE
Urba
n12
.814
.48.
923
.524
.93.
511
.90.
5In
term
edia
te1.
646
.317
.922
.94.
35.
80.
80.
415
.5Ru
ral c
lose
to a
city
1.6
40.0
18.4
5.7
5.9
17.8
0.1
0.6
4.7
0.1
5.0
41.2
Rura
l rem
ote
3.7
42.7
18.0
10.0
5.6
15.9
0.2
0.4
1.7
0.4
1.3
42.7
UKUr
ban
1.8
63.4
3.5
5.1
3.6
1.0
3.8
0.2
15.3
0.9
1.5
74.4
Inte
rmed
iate
6.2
68.1
5.5
4.0
3.4
0.6
2.7
7.5
0.5
1.4
23.2
Rura
l clo
se to
a c
ity4.
375
.30.
93.
87.
10.
46.
40.
01.
82.
4EU
15Ru
ral r
emot
e0.
61.
339
.84.
914
.32.
66.
92.
70.
63.
418
.02.
42.
544
.7Ur
ban
0.0
3.3
34.1
13.0
7.7
2.1
8.6
2.3
0.7
6.3
18.5
1.4
1.9
34.5
Inte
rmed
iate
0.0
3.7
33.6
17.7
6.3
3.3
6.9
3.8
1.4
8.0
12.3
1.4
1.8
15.0
Rura
l clo
se to
a c
ity0.
02.
133
.818
.24.
62.
69.
24.
81.
46.
011
.71.
73.
85.
8CZ
Urba
n7.
710
.027
.23.
129
.819
.52.
610
0.0
CYIn
term
edia
te22
.737
.311
.62.
77.
514
.14.
010
0.0
SKUr
ban
32.8
8.5
21.5
3.0
3.4
27.4
3.4
100.
0So
urce
: Bas
ed o
n da
taba
se o
f com
mitm
ents
up
to e
nd-2
006
by N
UTS
3 re
gion
con
stru
cted
by
SWEC
O fo
r DG
Regi
o

Synthesis Report Ex-post Evaluation of the ERDF 2000-2006
42
Moreover, in most countries, as for Objective 1 regions, enterprise support accounted for a larger share of funding in remote rural areas than in those close to a city, which added to the larger share going to tourism in the former. Accordingly, there was much more direct support for economic activity in remote rural areas than in less remote ones, again reflecting perhaps the greater need for an internal source of income and jobs.
1.4 POLICY OBJECTIVES, ECONOMIC THEORY AND POLICY RECOMMENDATIONS As noted above, the division of funding between policy areas indicates the effort devoted to tackling problems and/or improving the situation and, accordingly the relative focus of policy in the different regions. The issue considered here is how far this focus was in line with both the findings of theories of economic development and the policy recommendations in this regard of international organisations and, accordingly, with the external advice available on the strategy to pursue to further economic development.
Six different strands of theory can be identified from the literature which span the different models of growth developed over the years and which underlie the recommendations of international organisations. Each of these six strands puts emphasis on the need for policy to focus on a particular set of drivers of economic development:
• a first strand emphasises the importance of economic integration, liberalisation of trade and markets and financial stability for sustained regional development, a view endorsed by international organisations;
• a second strand stresses the role of investment and a favourable business environment as engines of growth; this is reflected in the wide array of measures recommended by international organisations in this regard, such as support for SMEs, incentives to attract FDI, the increased availability of venture capital and the provision of business support services;
• a third strand focuses on human capital and policies for making fuller use of the potential of the work force, such as increasing the participation of various social groups as well as raising skills and competences through investing in education and training;
• a fourth strand lays stress on innovation and technology and, accordingly, on measures for increasing both public and private investment in R&D as well as for strengthening links between research centres and business and the capacity to make effective use of new developments;
• a fifth strand emphasises the economic benefits of agglomeration from technological and other externalities and a large market for skilled labour as well as for goods and services. This provides support for both the removal of constraints on the continuing growth of existing agglomerations and measures which encourage the development of new centres of economic activity;
• a sixth strand stresses the importance of various aspects of the regional environment for growth, including social, political and institutional dimensions as well as economic, the emphasis being on the coherence of the system as a whole rather than on individual elements. Policy recommendations include measures to encourage cooperation between firms, a widening of participation in decision-making and the development of effective administrative authorities.
Ex-post Evaluation of the ERDF 2000-2006 Synthesis Report
43
As is clear from consideration of the allocation of funding outlined above, elements of all six of these strands are evident in the regional policies followed across the EU over the period. All Member States receiving Structural Fund support implemented measures to increase physical capital endowment, enhance human resources, promote R&D and improve the economic, social and institutional as well as the business environment. They also endeavoured for the most part to maintain macroeconomic stability (a point picked up in Chapter 2 below).
Moreover, the simultaneous focus of policy on different drivers of growth is compatible with theories and recommendations which stress the complementarity of action in different policy areas, such as investment in human capital and support for R&D or improving accessibility while at the same time strengthening business conditions. Indeed, such an integrated approach is a key aspect of the way that cohesion policy is intended to operate. The relative weight attached to each of the elements, however, varied across the EU as is also evident from the division of funding. Nevertheless, given the way that the division varied, this seems in broad terms to reflect the differences in the nature and scale of problems and in policy priorities.
It could also reflect an additional factor which is not a driver of growth as such but which is a key constraint on the policy pursued. This is the need to ensure that the development path chosen is a sustainable one, an objective which all the main international organisations subscribe to and which has become a central part of EU policy. In a regional context, this means that the economic growth stimulated should be compatible with the protection of the environment and the preservation of natural assets and scarce resources. This further implies that development policy cannot be the same all regions but must be in line with the geophysical features, the ecology and so on, as well as the potential areas of specialisation which might be developed.
Equally, theories of economic growth, as well as the policy recommendations linked to them, tend to leave out of account the two other objectives of policy, namely, the maintenance and improvement of social and territorial cohesion. Policy-makers across the EU, however, cannot afford to ignore the need for balanced development and to try to ensure that all social groups, wherever they live, share in the gains from such development. The dispersion of funding across a range of policy areas is consistent with this plurality of objectives.
1.5 THE ABSORPTION OF THE ERDF ALLOCATED In all Member States, the finance allocated from the ERDF had mostly been spent by the end of 2008, the initial deadline for expenditure for the 2000-2006 programming period. Since this deadline was extended into 2009 in the latter part of 2008 as a response to the recession induced by the financial crisis, it is likely that all or virtually all of the budget allocated for the period will have been spent in all, or nearly all, countries by the new deadline10.
At the end of 2008, almost 89% of the resources allocated from the ERDF to Objective 1 programmes in the EU15 had been spent, with the figure falling below 87% only in the UK (Table 1.16). Given that 5% of the funding is held back until after the programmes have been formally closed, this means that only a very small proportion of the overall amount remained to be spent.
10 Note that the data referred to here relate to the position at the end of 2008. Later data presented earlier on the time profile of payments (see Section 1.1.11) confirm this point.

Synthesis Report Ex-post Evaluation of the ERDF 2000-2006
44
Expenditure in Objective 2 regions was slightly less relative to the funding allocated (87%) and in Belgium, Spain and the Netherlands, it amounted to only some 80-82% of the allocation, implying that there might be some problems in spending all the funds available in these countries.
Table 1.16 Expenditure from the ERDF in relation to the budget allocated, 2000-2006
Expenditure as % allocated
Objective 1 Objective 2AT 89.0 88.4BE 88.4 82.2DE 92.0 89.5DK 88.3ES 87.5 81.1FI 94.3 95.2FR 86.1 90.0GR 89.6IE 93.0IT 87.4 90.6LU 91.8NL 95.0 79.8PT 88.6SE 88.3 95.4UK 86.8 83.6EU15 88.7 87.2CY 80.4CZ 85.5 75.7EE 87.5HU 97.8LT 97.2LV 89.9MT 83.5PL 84.4SI 90.7SK 81.1 85.4EU10 87.4 79.2EU25 88.6 87.1Note: Expenditure as at end-2008Source: Calculations based on DG Regio data
In the EU10 countries, expenditure in Objective 1 regions at the end of 2008 was virtually the same in relation to the amount allocated as in the EU15, with the proportion falling much below 85% only in Malta and Slovakia, signalling perhaps a problem of absorption in the latter in particular. In Objective 2 regions, however, expenditure at end-2008 was only around 80% of allocation in Cyprus and only just over 75% in the Czech Republic, again indicating a possible problem of absorbing all the funding available. Nevertheless, overall, there is only limited sign of the absorption problems which were widely feared before these countries began to receive ERDF support.
The division of expenditure between broad policy areas, as at the end of 2008, was much the same, in most Member States as the division of funding initially allocated. There were only few areas in which expenditure diverged significantly from what was planned. In particular:

Ex-post Evaluation of the ERDF 2000-2006 Synthesis Report
45
• in Objective 1 regions in the EU15, the share of expenditure on enterprise support was less than the budget allocated in most countries, in some (such as Germany) because of less being taken up by SMEs, in others (Hainaut in Belgium, Spain, Flevoland and Burgenland in Austria) because of an under-spend on support for RTDI;
• also in Objective 1 regions in the EU15, the share of expenditure on transport exceeded the amount allocated in all countries, but most especially in Spain, Ireland and Italy. This was accompanied by an under-spend on Telecommunications, reflecting difficulties of carrying out the measures planned;
• in Objective 1 regions in the EU10, the share of expenditure on technical assistance, aimed at developing capacity to both manage and make use of development funding effectively, was less than the budget allocated in all countries apart from Estonia, most especially in the Czech Republic and Hungary;
• again in Objective 1 regions in the EU10, the share of expenditure going to enterprise support, especially SMEs, was also less than the share of funding allocated in most countries, perhaps reflecting difficulties of finding suitable firms to take this up;
• in Objective 2 regions in the EU15, the share of expenditure on support for RTDI fell short of that allocated in 9 of the 13 countries receiving funding, most especially in Denmark, Germany, Italy, Austria and, above all, in Spain;
• again in Objective 2 regions in the EU15, the share of expenditure on territorial policy also exceeded the share allocated in 9 of the 13 countries;
• in Objective 2 regions in the EU10, the shifts in the composition of expenditure relative to the shares allocated were more pronounced, especially in Praha and Bratislava, in the former from Territorial policy to Transport, in the latter from Enterprise support to Territorial policy. In all three regions, the share of spending on Technical assistance was less than budgeted, in Praha and Cyprus, markedly so.
Synthesis Report Ex-post Evaluation of the ERDF 2000-2006
46
2 Chapter 2 – Regional developments, 2000-2006
2.1 INTRODUCTION The main concern in this chapter is to set out the economic developments which occurred at regional level across the EU25 over the 2000-2006 programming period and, in particular, to compare developments in the regions receiving funding under cohesion policy with those in non-assisted regions. The focus is mainly on the years from 2000 to 2006. Because of the special arrangements introduced in response to the financial crisis, however, the expenditure co-financed by the Structural Funds extended well beyond 2006 into 2009, as indicated in the previous chapter. Accordingly, it potentially affected developments after the period which is the focus here and these ought ideally to be included in the analysis as well. This is difficult to do in practice, since at the time the evaluation was carried out, the regional accounts data covering all the EU25 countries on a comparable basis were available only up to 2006. Nevertheless, some account is taken of developments at national level after 2006 and of their potential impact on those at regional level.
The first part of the chapter considers the macroeconomic context in which the development of the regions assisted, and the policy for assisting them, took place, which inevitably affected the growth they achieved or, indeed, were capable of achieving. It also considers the macroeconomic policies that were followed, which are likely to have influenced the finance available for regional policies and the priority attached to them. In addition, it examines the wider economic context and the effect on this of the continuing process of globalisation and EU enlargement during the period.
The second part of the chapter reviews the growth of regional economies and the associated developments in employment and productivity which occurred over the programming period, distinguishing regions receiving funding under Objective 1 and under Objective 2 from others. It then goes on to consider the extent to which differential growth rates in GDP reduced disparities between regions in these terms as well as in terms of income per head which is, in principle, a more relevant indicator of social cohesion A distinction is made throughout between regions in the EU15 and those in the EU10 countries which only began to receive ERDF support (as well as support from the other Structural Funds and the Cohesion Fund) after entry into the EU in May 2004.
2.2 MACROECONOMIC DEVELOPMENTS OVER THE PERIOD 2000-2006 The development of regions is intrinsically bound up with the development of the national economies of which they form part. The rate of growth they can achieve is greatly affected by the growth rate of the regions surrounding them as well as by the growth occurring in both the country in which they are located and other Member States, given the highly integrated nature of the EU economy. There are a number of reasons for this. Most importantly, a significant share of the goods and services produced in a region will go to markets outside, either in the country or in other part of the EU. In addition, the willingness of businesses to invest in the region, as well as the funds available to do so, is likely to be affected by conditions in the wider economy and not just in the region itself.
The same applies to the willingness, and ability, of national governments to devote resources to regional development which will equally be affected by the state of public finances – itself

Ex-post Evaluation of the ERDF 2000-2006 Synthesis Report
47
influenced by the rate of growth of the national economy – and by the macroeconomic policy pursued.
2.2.1 Growth of GDP in the EU15 Member States
The underlying economic conditions across the EU fluctuated markedly over the years 2000-2006 and beyond. The formulation of programmes at the beginning of the period coincided with a relatively high rate of economic growth. In 2000, growth of GDP in the EU15 was particularly high, at close to 4%, following two years when it was also above the long-term trend. Although there were differences between countries, in all of them, growth averaged more than 2% a year in the first two years of the period (Table 2.1).
Table 2.1 Growth in GDP in EU Member States, 1995-2008
Annual average % change1995-99 1999-06 1999-01 2001-03 2003-06 2006-07 2007-08
EU25 2.7 2.3 2.9 1.3 2.5 2.8 0.8EU15 2.6 2.2 2.9 1.2 2.4 2.6 0.6
DE 1.7 1.3 2.2 -0.1 1.7 2.5 1.3PT 4.1 1.4 3.0 0.0 1.3 1.9 0.0IT 1.5 1.4 2.8 0.2 1.4 1.6 -1.0DK 2.7 1.9 2.1 0.4 2.7 1.6 -1.2NL 4.1 2.0 2.9 0.2 2.6 3.6 2.0FR 2.5 2.1 2.9 1.1 2.2 2.3 0.4BE 2.4 2.1 2.3 1.2 2.6 2.8 1.1AT 2.8 2.1 2.1 1.2 2.8 3.5 2.0UK 3.3 2.7 3.2 2.5 2.7 2.6 0.7SE 3.1 3.1 2.7 2.2 3.9 2.6 -0.2FI 4.8 3.2 3.9 1.7 3.8 4.2 1.0ES 3.9 3.6 4.3 2.9 3.6 3.7 1.2GR 3.2 4.3 4.3 4.5 4.1 4.0 2.9LU 5.6 4.7 5.4 2.8 5.4 5.2 -0.9IE 9.9 6.1 7.5 5.5 5.6 6.0 -2.3MT : 1.5 -1.6 1.1 2.7 3.7 2.1CY 3.5 3.6 4.5 2.0 4.1 4.4 3.7PL 5.7 3.7 2.7 2.6 5.1 6.6 5.0SI 4.4 4.1 3.6 3.4 4.9 6.8 3.5CZ 1.0 4.2 3.1 2.7 5.9 6.1 3.0HU 3.7 4.4 4.7 4.3 4.2 1.2 0.6SK 3.9 4.9 2.4 4.7 6.7 10.4 6.4LT 4.8 7.3 5.5 8.5 7.7 8.9 3.0EE 5.9 8.5 8.7 7.7 8.9 7.2 -3.6LV 5.0 8.6 7.5 6.8 10.5 10.0 -4.6
MT: Data relate to 2000-06 and 2000-01Source: Eurostat, National accounts
Note: The EU15 and EU10 countries are ordered separately in terms of GDP growth over the period 1999-2006
From mid- 2001 on, however, growth in the majority of EU15 countries slowed appreciably, falling to an average of only just over 1% a year in 2002 and 2003, so depressing government revenue across the EU and, potentially, the funds available for cohesion policy. This was particularly the case in Germany, where GDP fell over these two years, even if marginally, and
Synthesis Report Ex-post Evaluation of the ERDF 2000-2006
48
Portugal, where it remained unchanged. It was also the case in Italy and the Netherlands, where GDP increased barely at all.
On the other hand, in 6 of the EU15 countries, growth hardly slowed down at all over these two years and in four countries, it averaged around 3% a year or more. These four included Greece and Spain, two of the Cohesion countries.
In the subsequent three years, 2003-2006, GDP growth recovered everywhere. The recovery, however, was less in three countries in which cohesion policy was particularly important, Germany, Italy and Portugal, than elsewhere. This was especially the case in Portugal, where growth of GDP averaged only just over 1% a year over the period 2003-2006, considerably less than over the years before 2001. In Germany and Italy, growth was only slightly higher and less than experienced in the 1990s during the previous programming period.
In the other EU15 Member States, growth was close to the long-term trend. The main exceptions were the Netherlands and Ireland, where it was slightly lower than in the earlier programming period but still relatively high. By contrast, in both Greece and Sweden growth was higher than in the earlier period, at around 4% a year.
While growth in 2007 was for the most part much the same or higher than over the preceding three years, there was a marked slowdown in 2008 in most countries as the financial crisis began to take effect. The economic climate for the conduct of regional development policy, therefore, became unfavourable. By then, however, the funding made available for the 2000-2006 programming period had already been committed, so it is likely to have had a minimal effect on policy.
In Italy and Portugal, together to a lesser extent in Germany, the national economic context was unfavourable throughout much of the period. On the other hand, in Greece and Spain, the other major recipients of Structural Fund support, the reverse was the case and regional development policy was implemented in the context of relatively high and sustained rates of economic growth.
2.2.2 Growth of GDP in the EU10 Member States
In the EU10 countries, with the exception of Malta, growth was universally higher than in most EU15 countries throughout most of the period, during both the pre-accession years and the years after entry.
In most EU10 countries, entry into the EU was accompanied by an increase in the rate of growth. In all except Malta (where growth was still higher than before), growth of GDP averaged over 4% a year in the three years 2004-2006 and in all apart from Cyprus, Hungary and Slovenia (where it was only marginally below), 5% a year or more. The growth rate was particularly high in Slovakia and the three Baltic States.
In 2007, growth slowed down only in Hungary, where macroeconomic problems predate the financial crisis. Growth was also reasonably high in most countries in 2008. In Estonia and Latvia, however, the reversal of fortunes was dramatic. In both, GDP fell sharply after rising markedly for many years before then. In Hungary, growth continued to slow down, while in Lithuania, growth was considerably less than in preceding years.
Only in these four countries, therefore – though in Lithuania only to a minor extent – and then only at the very end of period, is regional development likely to have been adversely affected by unfavourable economic conditions at the national level.

Ex-post Evaluation of the ERDF 2000-2006 Synthesis Report
49
2.2.3 Budget policy over the programming period
Since there are no data readily available on the amount of national funding going to regional development across the EU, the only way of getting an indication of its scale and how it changed over the period is by examining the stance of budgetary policy and the size of government investment11.
The national funds made available to support regional development in Member States will tend to be affected by budgetary policy. The more restrictive the policy, on average the less the funding is likely to be and vice versa. Figures for the budget balance, if related to the growth of GDP, suggest that budgetary policy was relatively expansionary during the first three years of the period (i.e. public expenditure increased relative to revenue from taxes) and then became relatively restrictive from 2003 or so onwards (see Box).
Box – Budgetary policy and the budget balance The restrictive or expansionary nature of policy cannot be judged from movements in the budget balance alone. This is because both government revenue and expenditure, and accordingly the balance between them, are affected not only by decisions to increase or reduce tax rates and public spending programmes but by the rate of economic growth. The higher the rate of growth, the larger the increase in revenue yielded by a given set of tax rates and the lower the increase in spending on a given set of expenditure programmes (largely because of the social protection element) and correspondingly, the more the budget deficit will tend to shrink or the surplus increase. Conversely, the lower the rate of growth, the more the deficit will tend to increase without any changes in tax rates or expenditure programmes.
This is less the case in Belgium, where concern to reduce the high level of accumulated government debt led to the budget being restrictive throughout most of the period, the only exception being in 2005. The tightening of the budget was particularly pronounced in Germany, the Netherlands, Sweden and Denmark from 2003 on.
On the other hand, in the UK, budgetary policy was significantly expansionary over the first four years of the period and then remained broadly unchanged from then on. In Greece, policy was also expansionary during the period up until 2004 when the Olympic Games took place and then, according to the official figures at least, was tightened in 2005 and 2006 before being relaxed again.
In Italy and Portugal, alone among the EU15 countries, the budget deficit increased between 2003 and 2006, though it was then reduced in 2007. The rise, however, was small and given the low rate of economic growth in both countries, it suggests some budget tightening over the period. Moreover, in Portugal, it followed two years of zero growth when the budget deficit was kept unchanged implying a significant tightening of policy.
In the EU10 countries, the budget deficit was in most cases smaller – or in Estonia, the surplus larger – in 2006 than in 2003 before the countries entered the Union. The exceptions are Hungary
11 A recent study carried out for DG Regional Policy, Distribution of Competences in relation to Regional Development Policies in the Member States of the European Union (Ismeri Europa and Applica sprl) attempted to compile data for national expenditure on regional development for a selected number of Member States but was unable to do so for most of the countries. Moreover for the few countries for which it was possible, the data were not entirely satisfactory nor directly comparable with the data on the deployment of the Structural Funds. This has the further implication that it is not possible on the basis of published data to verify that the additionality requirement has been respected.
Synthesis Report Ex-post Evaluation of the ERDF 2000-2006
50
and Slovakia, especially the former, where the deficit increased between these two years, signifying an expansionary fiscal policy. In Hungary, this led to financial problems and a significant tightening of policy in 2007 and 2008.
Policy was also expansionary in the three Baltic States, where the high rate of growth would otherwise have led to a much more substantial reduction in the deficit or increase in the surplus.
In the Czech Republic, Poland and Slovenia, fiscal policy seems to have been largely neutral over the period. In both Cyprus and Malta, however, there is evidence of some tightening in budgetary policy after entry into the EU.
2.2.4 Government fixed investment over the programming period
The budgetary policy pursued over the period is reflected to some extent in the funding made available for public investment12, which tends to be the category of government expenditure which can most easily – or less painfully – be postponed. There is still, however, a political choice over the items of expenditure to be reduced if government spending is cut back when the budget is tightened, so there is no automatic link between fiscal restraint and reductions in investment.
Nevertheless, in most of the countries in which budgetary policy was relatively restrictive over the period, especially the latter part, public investment was comparatively low in relation to GDP. This was the case in Germany, Austria, Belgium, Denmark and Italy, while in the Netherlands, public investment was much higher but was reduced after 2003 (Table 2.2). It was not the case in Sweden, however, where despite the tightening of fiscal policy, public investment remained relatively high and was increased slightly as a share of GDP. This was also the case in France, where policy also seems to have been tightened over the period, if by less.
In Portugal, the tightening of fiscal policy was reflected in a marked cutback in public investment which was reduced from almost 4% of GDP in 2001 to only just over 2% of GDP in 2008.
In Greece, public investment was relatively high in the early years of the period up until the Olympic Games and then was reduced significantly in 2005.
In Spain and Ireland, public investment remained high throughout the period, while in the UK, there was some increase, reflecting the expansionary nature of policy, even if the level of investment was relatively low13.
12 For regional development, government investment is the most relevant category of government expenditure. Ideally, as argued above, the focus should be directly on national government expenditure on regional development, but this cannot be identified in the public sector accounts of any country. Nor can the necessary data be extracted easily from national published sources. Indeed, in most cases, the data cannot be extracted at all, so there are no statistics on development expenditure at national level which can be compared with the expenditure financed by the Structural Funds. A further problem is that the data for government investment are defined in the ESA 95 system of national accounts to be net of sales less purchases of assets. This means that they do not measure ‘new’ fixed investment as such if there are asset transactions (if the government, for example, sells a building or a piece of land or shares in a public company), Since such transactions have tended to become more important over time, with the trend towards privatisation, the figures for government investment have become less and less reliable as a measure of new investment. It is assumed here that asset transactions are small and do not have a significant distorting effect on the investment, figures, but this may well not be the case.
13 It should be noted that in the UK especially, the figures for government investment are distorted by the sales of assets, which are counted as negative expenditure and so as an offset to expenditure on fixed investment, and which tend to be more important than in other countries, The decline in investment in 2005 seems to be entirely a consequence of an increase in such sales.

Ex-post Evaluation of the ERDF 2000-2006 Synthesis Report
51
In the EU10 countries, public investment was generally higher than in the EU15 Member States from the time of their accession to the Union. By 2006, public investment was around 4% of GDP or above in all of the countries, except Slovenia, where it was only slightly lower, Cyprus and Slovakia. It was particularly high in the three Baltic States, where it increased to over 5% of GDP in 2007.
At the same time, public investment was cut back markedly in Hungary in 2007 and 2008 as part of the measures to reduce the budget deficit.
With the exception of Hungary, therefore, and to a much lesser extent, Slovakia, the provision of EU funding on a significant scale was reflected in an increase in public investment.
It should be reiterated, that the above figures for government investment do not necessarily reflect investment in regional development but that, in the absence of the relevant data, they provide an indication of the scale of this and how it might have changed over the period.
Table 2.2 General government fixed capital formation in relation to GDP, 2000-2008
% GDP2000 2001 2002 2003 2004 2005 2006 2007 2008
EU25 2.3 2.4 2.3 2.4 2.4 2.2 2.5 2.5 2.6
EU15 2.2 2.3 2.2 2.3 2.3 2.2 2.4 2.4 2.5
LU 3.8 4.3 4.9 4.6 4.2 4.5 3.6 3.4 3.9IE 3.5 4.3 4.3 3.7 3.5 3.5 3.7 4.4 5.4ES 3.2 3.3 3.5 3.6 3.4 3.6 3.7 3.8 3.8NL 3.1 3.3 3.5 3.6 3.2 3.3 3.3 3.3 3.3GR 3.6 3.6 3.4 3.6 3.7 2.9 3.0 3.0 2.9FR 3.1 3.0 2.9 3.1 3.1 3.3 3.2 3.3 3.2SE 2.8 2.9 3.1 2.9 2.9 3.0 3.1 3.1 3.3PT 3.8 3.9 3.5 3.1 3.1 2.9 2.4 2.3 2.1FI 2.5 2.6 2.7 2.9 2.9 2.6 2.4 2.5 2.5IT 2.3 2.4 1.7 2.5 2.4 2.4 2.3 2.3 2.2DK 1.7 1.9 1.8 1.6 1.9 1.8 1.9 1.7 1.8BE 2.0 1.7 1.7 1.7 1.6 1.8 1.6 1.6 1.6DE 1.8 1.7 1.7 1.6 1.4 1.4 1.4 1.5 1.5UK 1.2 1.4 1.5 1.5 1.7 0.7 1.8 1.8 2.3AT 1.5 1.2 1.3 1.2 1.1 1.1 1.1 1.0 1.0
CZ 3.6 3.5 3.9 4.5 4.8 4.9 5.0 4.7 4.8EE 3.8 4.1 5.3 4.4 3.8 4.0 5.1 5.4 5.6CY 2.9 2.9 3.0 3.4 4.0 3.1 3.0 3.0 3.0LV 1.3 1.1 1.3 2.4 3.1 3.1 4.6 5.7 4.9LT 2.4 2.2 2.9 3.0 3.4 3.4 4.1 5.2 4.9HU 3.2 3.7 4.9 3.5 3.5 4.0 4.4 3.6 2.8MT 3.9 3.4 4.1 4.7 3.9 4.9 4.1 4.0 2.7PL 2.4 3.4 3.4 3.3 3.4 3.4 3.9 4.1 4.6SI 3.2 3.2 3.0 3.2 3.5 3.2 3.7 3.7 4.2SK 2.8 3.1 3.3 2.6 2.4 2.1 2.2 1.9 1.8Note: Countries are ordered according to the average over the periodSource: Eurostat, General Government accounts and national accounts
Synthesis Report Ex-post Evaluation of the ERDF 2000-2006
52
2.2.5 Globalisation and enlargement
As noted in the previous chapter, regional development over the period was affected not only by the rate of growth of national economies and by budgetary policy, but also by the continuing process of globalisation as well as by the enlargement of the EU in 2004. In economic terms, the two had a similar effect on regions in the EU15 by increasing the competitive pressure on local businesses in both the internal market and markets in other parts of the world.
The pressure was especially acute on manufacturers in traditional industries, such as textiles or clothing, where the process of globalisation meant that specialisation in labour-intensive activities was no longer a viable option. These activities in a wide range of sectors, and not just traditional industries, could potentially be shifted to wherever wage costs were lowest, so that regions reliant on them had to seek new areas of specialisation.
The transition of the Central and Eastern countries from the early 1990s on expanded the possibilities open to companies seeking low cost locations in which to produce. They were, moreover, closer to home than developing countries in South-East Asia or Latin America and, accordingly, posed fewer logistical problems. Their accession to the EU added to their attractiveness as business locations.
In consequence, there was a significant relocation of labour-intensive parts of the production process from EU15 regions to those in the EU10, as well as in Bulgaria and Romania, over the programming period. This was not confined to basic industries, such as textiles, but extended to more advanced sectors, such as motor vehicle manufacture and electrical and electronic engineering, where assembly plants, in particular, have been moved to regions where labour costs were lower.
As a result, while the regions specialising in labour-intensive and more basic activities, especially in manufacturing, have in most cases been more affected by globalisation and EU enlargement than others, the effects have been felt by other regions as well. The regions which have been hit hardest, therefore, include those with car plants, electronic component factories, computer assembly plants and similar medium-to-high tech manufacturing as well as those specialising in textiles and clothing, steel production, wood products and other low-to-medium tech industries. These regions include many which were already experiencing a decline in traditional industries, such as the Objective 1 regions in ‘Northern’ Member States, though also regions in some parts of the South, such as Norte, the textile-producing region, in Portugal. They include as well many of the regions receiving funding under Objective 2 in both the South and North of the Union.
In addition, however, they include regions which have to some extent lost investment because of the globalisation process and EU enlargement. These are Objective 1 regions, in particular, in the South of Italy or the Eastern part of Germany, which represented alternative potential locations for labour-intensive activities but can no longer compete in terms of wage costs with regions in the less developed parts of the EU10 or in developing countries outside of the EU. In some sense, therefore, these regions have been deprived of a possible development path as a result of these events.
The differential effect of globalisation and enlargement on regional economies needs to be taken into account when interpreting the economic performance of different regions over the programming period. To the extent that both Objective 1 and Objective 2 regions are likely to have been more affected than others means that, other things being equal, they would be

Ex-post Evaluation of the ERDF 2000-2006 Synthesis Report
53
expected, on average, to have experienced lower growth of output than other, non-assisted, regions.
2.3 THE GROWTH PERFORMANCE OF ASSISTED AND NON-ASSISTED REGIONS, 2000-2006 Regions in the EU15 receiving Objective 1 funding over the 2000-2006 programming period had on average a higher rate of economic growth during these years than regions which received no EU funding at all under cohesion policy. This was true not only across the EU15 as a whole but equally in all Member States with the sole exception of Belgium, where the one Objective 1 region grew by less over the period than non-assisted regions in the country (Table 2.3).
Table 2.3 Growth of GDP per head in Objective 1, Objective 2 and other NUTS 2 regions, 1995-2000 and 2000-2006
1995-2000
2000-2006
1995-2000
2000-2006
1995-2000
2000-2006
1995-2000
2000-2006
BE 1.9 1.2 1.8 1.0 2.6 1.4 2.8 1.7DK 2.5 1.6DE 2.3 1.7 2.3 1.4 1.7 1.3 2.2 1.3IE 9.1 4.3GR 3.5 3.8ES 3.6 2.4 4.1 2.1 4.3 1.4FR 2.7 1.5 2.1 1.2 2.3 1.2 2.6 0.8IT 1.9 0.9 1.4 0.5 1.6 0.8 1.6 0.8LU 4.7 3.3NL 2.7 2.0 2.6 2.4 3.7 1.5AT 3.3 2.1 2.8 2.1 3.2 2.1 2.6 1.2PT 3.5 1.0FI 3.6 3.4 4.7 2.9 5.2 2.2SE 1.7 3.3 2.4 2.8 3.7 2.8 3.5 2.5UK 2.9 2.3 2.5 1.7 3.2 1.9 3.8 1.8
EU15 3.1 2.0 2.6 1.6 2.5 1.3 2.7 1.4
CZ 0.8 4.1 3.9 4.6EE 7.1 8.9CY 2.4 1.9LV 6.4 9.3LT 5.6 7.8HU 4.6 4.2MT 0.9PL 5.2 3.4SI 4.3 3.8SK 3.7 4.2 3.6 4.9
EU10 4.5 4.2 3.4 3.9
EU25 3.7 3.0 2.6 1.6 2.5 1.4 2.7 1.4Note: Regions are defined at the NUTS 2 level
Objective 1 Objective 2 > 45% Objective 2 20-45% Other regions
Source: Eurostat, Regional Accounts, Cambridge Econometrics for price deflators where Eurostat data are not available and own calculations
Objective 2 >45% are regions in which over 45% of the population lived in areas receiving funding under Objective 2Objective 2 20-45% are regions in which 20-45% of the population lived in areas receiving funding under Objective 2GDP growth is measured at constant prices and takes account of the broad sectoral division of value-added in the different regions

Synthesis Report Ex-post Evaluation of the ERDF 2000-2006
54
Between 2000 and 2006, therefore, growth of GDP per head in the Objective 1 regions in the EU15 taken together averaged some 2% a year as against growth of 1.4% a year in regions not receiving any assistance from the Structural Funds (or, more precisely, not receiving a significant amount of assistance, since the comparatively few regions with small areas which were eligible for Objective 2 funding are included in this category).
In all Member States, apart from Belgium, the growth rate achieved in Objective 1 regions was higher than that in non-assisted ones (defined as indicated above). This was particularly the case in Austria, Sweden and France, where the difference in growth rates was close to 1%, and it was even the case in Italy, if only marginally, despite the relatively low rate of growth in Objective 1 regions.
Only in Belgium, Italy and Portugal was the growth performance of Objective 1 regions over this period inferior to that in non-assisted regions at EU15 level. In these terms, therefore, there was some convergence of GDP per head in the weakest regions towards that in the strongest. This was especially so for the Greek regions, though in this case, growth was heavily concentrated around Athens and in some regions, there was little growth at all.
It was equally the case, again with the exception of Belgium, that growth in Objective 1 regions was higher than that in those receiving smaller, though still significant, amounts of funding under Objective 2.
In addition, in the majority of countries, regions receiving more support under Objective 2 experienced a higher rate of GDP per head than those receiving a smaller amount of funding or no funding at all.
The growth performance of assisted regions relative to others over the period was in most cases significantly better than in the preceding programming period. Since the great majority of the regions receiving Objective 1 or Objective 2 funding between 2000 and 2006 also received funding in the period before, this might imply that it takes time for structural support to be reflected in increased economic growth.
In Objective 1 regions on average, therefore, growth of GDP per head over the years 1995-2000 was slightly higher than in other regions, though less so than in the later years. This, however, masks the fact that, in most of the countries, growth in Objective 1 regions was either lower than in other regions or much the same. The only two countries where this was not the case were Austria and Italy.
In Objective 2 regions, the growth rate achieved over the period 1995-2000 was either similar to that in non-assisted regions or lower.
In the EU10 countries, growth of GDP per head in all the Objective 1 regions, except Malta, outstripped the EU average over the period 2000-2006, so that in all cases there was some convergence towards the level in the rest of the Union. Growth was especially high, as noted above, in the three Baltic States.
At the same time, growth in the capital city regions in both the Czech Republic and Slovakia exceeded that in the rest of the respective countries, so that internal disparities in GDP per head widened over the period. Internal disparities also widened in Hungary and Poland, where in each case, there was equally a relative concentration of growth in the capital city region, and in Poland in the other more developed regions with relatively high levels of GDP per head (changes in regional disparities within countries are examined below).
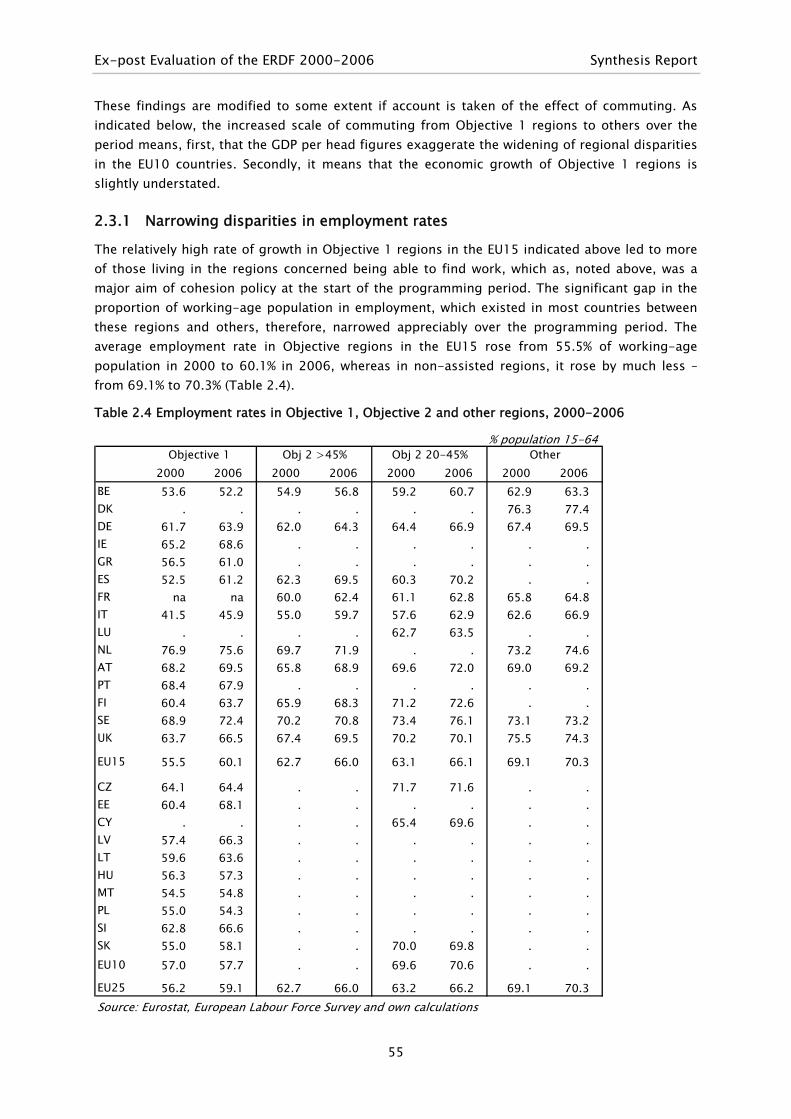
Ex-post Evaluation of the ERDF 2000-2006 Synthesis Report
55
These findings are modified to some extent if account is taken of the effect of commuting. As indicated below, the increased scale of commuting from Objective 1 regions to others over the period means, first, that the GDP per head figures exaggerate the widening of regional disparities in the EU10 countries. Secondly, it means that the economic growth of Objective 1 regions is slightly understated.
2.3.1 Narrowing disparities in employment rates
The relatively high rate of growth in Objective 1 regions in the EU15 indicated above led to more of those living in the regions concerned being able to find work, which as, noted above, was a major aim of cohesion policy at the start of the programming period. The significant gap in the proportion of working-age population in employment, which existed in most countries between these regions and others, therefore, narrowed appreciably over the programming period. The average employment rate in Objective regions in the EU15 rose from 55.5% of working-age population in 2000 to 60.1% in 2006, whereas in non-assisted regions, it rose by much less – from 69.1% to 70.3% (Table 2.4).
Table 2.4 Employment rates in Objective 1, Objective 2 and other regions, 2000-2006
% population 15-64
2000 2006 2000 2006 2000 2006 2000 2006BE 53.6 52.2 54.9 56.8 59.2 60.7 62.9 63.3DK . . . . . . 76.3 77.4DE 61.7 63.9 62.0 64.3 64.4 66.9 67.4 69.5IE 65.2 68.6 . . . . . .GR 56.5 61.0 . . . . . .ES 52.5 61.2 62.3 69.5 60.3 70.2 . .FR na na 60.0 62.4 61.1 62.8 65.8 64.8IT 41.5 45.9 55.0 59.7 57.6 62.9 62.6 66.9LU . . . . 62.7 63.5 . .NL 76.9 75.6 69.7 71.9 . . 73.2 74.6AT 68.2 69.5 65.8 68.9 69.6 72.0 69.0 69.2PT 68.4 67.9 . . . . . .FI 60.4 63.7 65.9 68.3 71.2 72.6 . .SE 68.9 72.4 70.2 70.8 73.4 76.1 73.1 73.2UK 63.7 66.5 67.4 69.5 70.2 70.1 75.5 74.3
EU15 55.5 60.1 62.7 66.0 63.1 66.1 69.1 70.3
CZ 64.1 64.4 . . 71.7 71.6 . .EE 60.4 68.1 . . . . . .CY . . . . 65.4 69.6 . .LV 57.4 66.3 . . . . . .LT 59.6 63.6 . . . . . .HU 56.3 57.3 . . . . . .MT 54.5 54.8 . . . . . .PL 55.0 54.3 . . . . . .SI 62.8 66.6 . . . . . .SK 55.0 58.1 . . 70.0 69.8 . .EU10 57.0 57.7 . . 69.6 70.6 . .
EU25 56.2 59.1 62.7 66.0 63.2 66.2 69.1 70.3Source: Eurostat, European Labour Force Survey and own calculations
OtherObj 2 20-45%Objective 1 Obj 2 >45%

Synthesis Report Ex-post Evaluation of the ERDF 2000-2006
56
While there was an increase in employment rates in Objective 1 regions in most countries over the period, the rise was not universal. In Hainaut in Belgium, Flevoland in the Netherlands and the Objective 1 regions in Portugal, there was a reduction in employment rates rather than an increase. In Hainaut and in the Portuguese regions, this reflects increasing difficulty of finding work in a context of relatively slow economic growth. (In Flevoland, the employment rate was already well above the EU average in 2000 and, despite the small fall, it remained so in 2006.)
By contrast, in Spain, the average employment rate in Objective 1 regions increased by almost 9 percentage points, narrowing the gap markedly with regions elsewhere in the EU. The increase, however, was much the same as in other Spanish regions, so the gap with these regions remained as wide as before.
In Sweden, the gap in the employment rate between Objective 1 regions – the sparsely populated areas in the North and Centre of the country – and non-assisted ones narrowed significantly between 2000 and 2006, whereas before then it had been widening.
In regions receiving significant amounts of Objective 2 funding, employment rates rose either by more than in non-assisted regions or by much the same extent in all EU15 countries.
In the EU10 Objective 1 regions, there was relatively little or no increase in employment rates in the Czech Republic, Hungary and Malta, while in Poland, the rate fell slightly. In all three Baltic States, however, where employment growth was accompanied by a significant reduction in working-age population, employment rates increased markedly.
There was also an increase in employment rates in Slovenia and Slovakia, in the latter, in contrast to the capital city region (Bratislava), where the rate remained broadly unchanged. This was also the case in Praha, just as in the rest of the Czech Republic.
2.3.2 Narrowing of disparities in GDP per head across the EU
The higher rate of economic growth in the lagging regions across the EU, described above, was associated with a narrowing of disparities in GDP per head across regions, which is one of the main goals of cohesion policy. While it is not possible to attribute this directly to the measures carried out with the aid of the Structural Funds, it is, nevertheless, consistent with these having the intended effect. This is especially the case in view of the damaging consequences that globalisation is likely to have had on economic growth in many of the lagging regions as compared with others. Other things being equal, therefore, the expectation is that these regions together with others assisted under cohesion policy would have, on average, experienced slower growth than non-assisted regions.
Between 2000 and 2006, the extent of regional dispersion in GDP per head across the EU25 considered as a whole declined significantly, as measured by a commonly-used indicator of dispersion (the mean, population-weighted, logarithmic deviation index – see Box). This followed a similar, though slightly smaller, decline over the preceding 5 years (Table 2.5).

Ex-post Evaluation of the ERDF 2000-2006 Synthesis Report
57
Box The mean logarithmic deviation index The mean logarithmic deviation index is defined as:
Where n is the number of observations, μ is the average GDP per head, and yi is the GDP per head of a region i.
In calculating the index, each region is weighted by its population in order to allow explicitly for the large variation which exists in the size of regions and to give a more accurate measure of regional disparities across the EU. This is important since unweighted indices, which are often used, show significantly different changes. Other measures of disparity, such as the standard deviation or variance show similar results, so long as they are population weighted.
This overall reduction in disparities was a result primarily of the catching up of regions in the EU10 countries where in both periods, as seen above, GDP growth was much higher than in the EU15. If regions in the EU15 and the EU10 are considered separately, the change over the period was less clear-cut.
Table 2.5 Dispersion of GDP per head in PPS between NUTS 2 regions in the EU25, 1995, 2000 and 2006
1995 2000 2006IE 1.6 2.2 1.9NL 0.7 0.9 1.0AT 2.7 2.3 1.8SE 0.9 1.7 1.6UK 3.6 5.0 5.4BE 5.0 5.2 5.2DE 2.7 2.7 2.4FI 1.1 1.7 1.3FR 3.0 3.4 3.2ES 2.3 2.6 2.0IT 4.1 4.0 3.8GR 3.0 2.4 4.2PT 2.4 2.9 2.9
EU15 3.8 3.9 3.7
CZ 2.5 4.5 5.3HU 4.0 6.4 8.5SK 5.9 6.0 8.0PL 1.4 2.5 3.1
EU10 4.9 4.9 5.5
EU25 8.3 7.5 6.3
Source: Estimates based on Eurostat, Regional Accounts
Mean log deviation index
Note: Countries are ordered within the EU15 and EU10 according to GDP per head in PPS terms in 2006.
∑ ⎟⎟⎠
⎞⎜⎜⎝
⎛=
i i y nI
μ ln
1

Synthesis Report Ex-post Evaluation of the ERDF 2000-2006
58
In the EU15 countries, the extent of the narrowing of regional disparities over the period 2000-2006 was relatively small (the mean logarithmic deviation index falling from 3.9 to 3.7). This, however, followed a widening of disparities, even if small, over the preceding 5 years (from 3.8 in 1995). Disparities in GDP per head in 2006 in the EU15, therefore, were marginally narrower than they had been 11 years earlier.
In the EU10 countries, regional disparities widened between 2000 and 2006, largely because of the stronger growth of the capital city regions than others. This differs from the preceding 5-year period when the index remained unchanged, primarily as a result of the relatively high growth in regions with the lowest GDP per head – in the three Baltic States and in Poland, especially – which offset the capital city effect.
Within EU15 countries, regional disparities narrowed over the period 2000-2006 in 8 of the 13 countries in which there was more than one NUTS 2 region. The extent of this was particularly large in Austria and Spain. In another two countries, Belgium and Portugal, disparities remained unchanged. There were only three countries, therefore, where regional disparities widened – the Netherlands (marginally), the UK and Greece.
In Greece, the extent of widening was substantial as a result of the much higher growth in Attiki, where Athens is situated, than in other regions (Between 2000 and 2006, GDP per head in Attiki grew by over 5% a year as against growth of 3% a year in the other regions taken together.) In the UK, the widening was associated with increased commuting as indicated below.
The experience over the 2000-2006 period is almost the exact reverse of that in the previous 5 years when disparities narrowed in only three countries – Austria, Italy (marginally) and Greece – remained unchanged in one (Germany) and widened in the other 9.
In all four of the EU10 Member States with more than one NUTS 2 region, regional disparities widened between 2000 and 2006, the increase in the index being particularly large in Hungary and Slovakia.
Regional disparities also widened in all four countries over the period 1995-2000, most especially in the Czech Republic and Hungary for the same reason as in the subsequent years – i.e. the much higher growth in the capital city regions than in others.
As a result of the widening in internal disparities, regional inequality in GDP per head in the Czech Republic, Hungary and Slovakia was among the highest in the EU25 in 2006, and in the last two much higher than in any other country.
In general, therefore, while disparities in EU15 countries in most cases narrowed over the period 2000-2006, those in the EU10 widened. This followed a 5-year period when the reverse was the case, when disparities widened in nearly all EU15 countries.
At the same time, it should be recalled, as noted above, that GDP per head in all EU10 regions apart from Malta increased relative to the EU25 average over the period 2000-2006. There was, therefore, almost universal convergence in these regions towards the EU average during these years.
2.3.3 Narrowing of disparities in commuter-adjusted GDP per head and household income per head
As noted at the outset, the NUTS 2 regions which are the focus here – and which equally tend to be the focus of cohesion policy – do not in many cases correspond to functional regions from an

Ex-post Evaluation of the ERDF 2000-2006 Synthesis Report
59
economic perspective. One of the consequences of this is that commuter flows, instead of taking place largely within regions, cross regional boundaries to a significant extent and, moreover, tend to be in one direction, either into or out of regions. This means that the commuters concerned contribute to the GDP in the region in which they work but are not counted as part of its population, which accordingly pushes up GDP per head. It also pushes down GDP per head in the region where commuters live since they do not contribute to its GDP but are counted in the ‘heads’ over which it is measured.
Commuting is an important reason for the pronounced disparities in GDP per head between regions in a number of countries indicated above (see Box). It is also a potential reason for the differential rates of GDP per growth indicated above. If, for example, people living in an Objective 1 region moved out to live elsewhere but continued to work in the region, then GDP per head would have risen because of the fall in population without any growth in GDP occurring as such (see Box for examples). It is, therefore, important to make an explicit adjustment for commuting in order to distinguish ‘genuine’ increases in GDP per head from spurious ones, so as to be sure that the narrowing of disparities in GDP per head over the period was a real phenomenon14.
In practice, according to the data available – which are relatively uncertain and, accordingly should be regarded as indicative only – commuting did not change a great deal over the programming period. Indeed, net outward commuting from Objective 1 regions seems on average to have increased slightly, which suggests that the rate of growth of GDP per head indicated above may understate the increase in their economic potential which occurred.
The small increase in outward commuting from lagging regions, by depressing their GDP per head, tends in itself to widen regional disparities measured in these terms. Adjusted for the effect of commuting, disparities in GDP per head between regions in the EU15, therefore, narrowed by slightly more than indicated above (Table 2.6).
The effect of commuting is especially marked in the UK, where the relatively wide disparity in GDP per head between regions owes a great deal to this effect. After adjusting for commuting, the degree of disparity in GDP per head in 2006 was much the same as in 2000. The effect of commuting on regional disparities is even more pronounced in Belgium, but here the effect is slightly weaker in 2006 than in 2000 because of a small decline in flows. Adjusted for commuting, therefore, regional disparities in GDP per head widened a little over the period. This was also the case in Portugal, though the degree of widening was less.
14 The adjustment is made by relating the number of people employed in a region, including both those who are resident there and those who live elsewhere, to the number of people living in a region who are employed either in the region or outside. This gives a ratio which can be applied to GDP to allow for the effect of commuting:
(Er+Eo)/(Er+Or)
where Er is the number in employment in the region who live there, Eo is the number employed in the region who live in another region and Or is the number in employment in a region who work in another region. If the ratio is 1, then the same number of people travel to work outside the region as travel in to work and commuting has no effect on regional GDP per head. If it is positive, then more travel in to work than travel out and vice versa if it is negative.
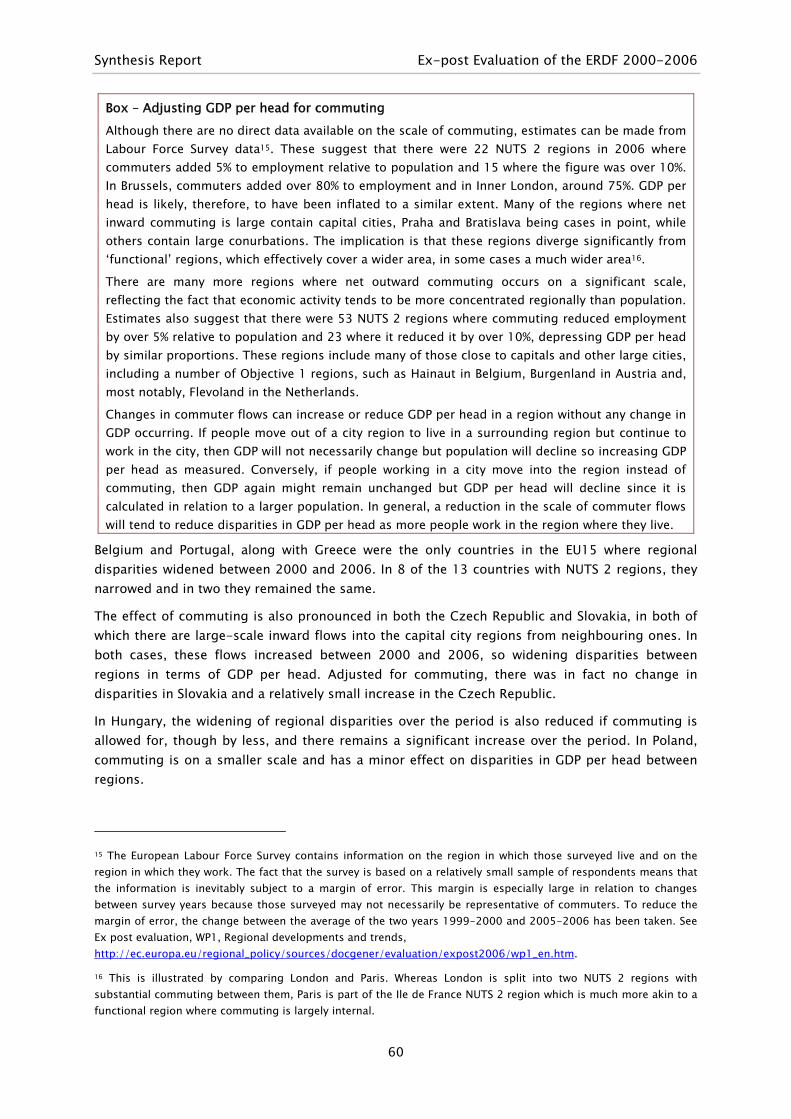
Synthesis Report Ex-post Evaluation of the ERDF 2000-2006
60
Box – Adjusting GDP per head for commuting Although there are no direct data available on the scale of commuting, estimates can be made from Labour Force Survey data15. These suggest that there were 22 NUTS 2 regions in 2006 where commuters added 5% to employment relative to population and 15 where the figure was over 10%. In Brussels, commuters added over 80% to employment and in Inner London, around 75%. GDP per head is likely, therefore, to have been inflated to a similar extent. Many of the regions where net inward commuting is large contain capital cities, Praha and Bratislava being cases in point, while others contain large conurbations. The implication is that these regions diverge significantly from ‘functional’ regions, which effectively cover a wider area, in some cases a much wider area16.
There are many more regions where net outward commuting occurs on a significant scale, reflecting the fact that economic activity tends to be more concentrated regionally than population. Estimates also suggest that there were 53 NUTS 2 regions where commuting reduced employment by over 5% relative to population and 23 where it reduced it by over 10%, depressing GDP per head by similar proportions. These regions include many of those close to capitals and other large cities, including a number of Objective 1 regions, such as Hainaut in Belgium, Burgenland in Austria and, most notably, Flevoland in the Netherlands.
Changes in commuter flows can increase or reduce GDP per head in a region without any change in GDP occurring. If people move out of a city region to live in a surrounding region but continue to work in the city, then GDP will not necessarily change but population will decline so increasing GDP per head as measured. Conversely, if people working in a city move into the region instead of commuting, then GDP again might remain unchanged but GDP per head will decline since it is calculated in relation to a larger population. In general, a reduction in the scale of commuter flows will tend to reduce disparities in GDP per head as more people work in the region where they live.
Belgium and Portugal, along with Greece were the only countries in the EU15 where regional disparities widened between 2000 and 2006. In 8 of the 13 countries with NUTS 2 regions, they narrowed and in two they remained the same.
The effect of commuting is also pronounced in both the Czech Republic and Slovakia, in both of which there are large-scale inward flows into the capital city regions from neighbouring ones. In both cases, these flows increased between 2000 and 2006, so widening disparities between regions in terms of GDP per head. Adjusted for commuting, there was in fact no change in disparities in Slovakia and a relatively small increase in the Czech Republic.
In Hungary, the widening of regional disparities over the period is also reduced if commuting is allowed for, though by less, and there remains a significant increase over the period. In Poland, commuting is on a smaller scale and has a minor effect on disparities in GDP per head between regions.
15 The European Labour Force Survey contains information on the region in which those surveyed live and on the region in which they work. The fact that the survey is based on a relatively small sample of respondents means that the information is inevitably subject to a margin of error. This margin is especially large in relation to changes between survey years because those surveyed may not necessarily be representative of commuters. To reduce the margin of error, the change between the average of the two years 1999-2000 and 2005-2006 has been taken. See Ex post evaluation, WP1, Regional developments and trends, http://ec.europa.eu/regional_policy/sources/docgener/evaluation/expost2006/wp1_en.htm.
16 This is illustrated by comparing London and Paris. Whereas London is split into two NUTS 2 regions with substantial commuting between them, Paris is part of the Ile de France NUTS 2 region which is much more akin to a functional region where commuting is largely internal.
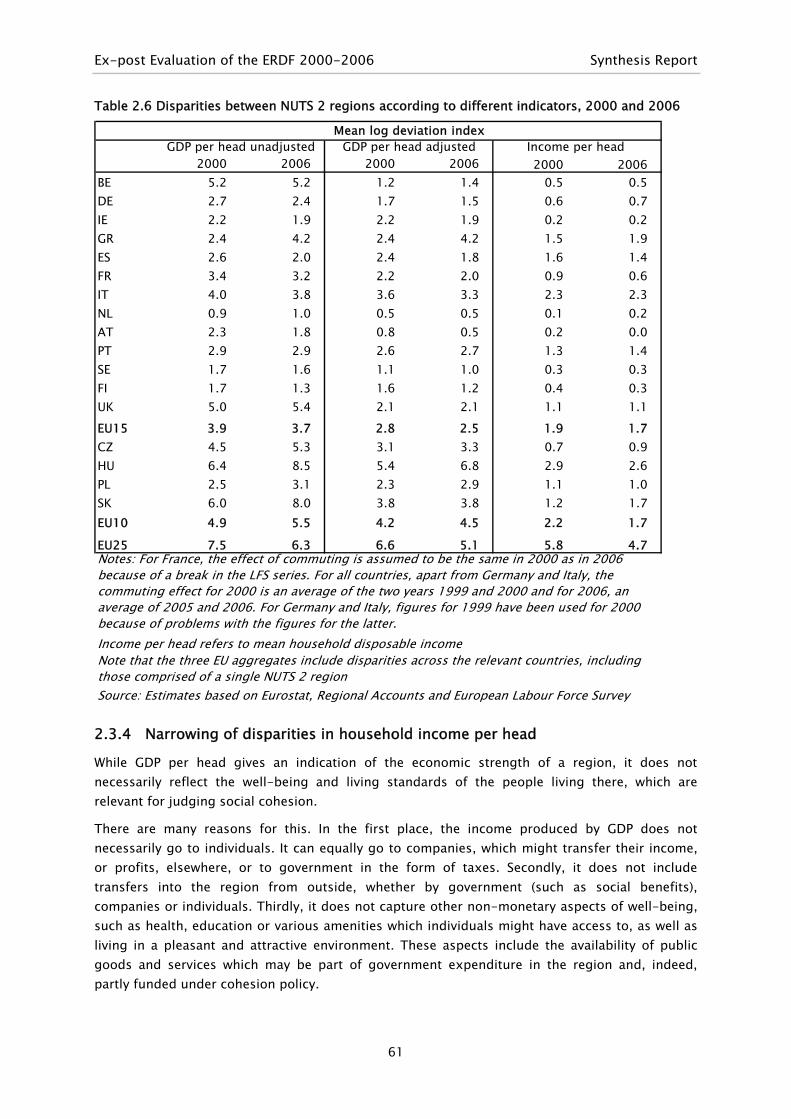
Ex-post Evaluation of the ERDF 2000-2006 Synthesis Report
61
Table 2.6 Disparities between NUTS 2 regions according to different indicators, 2000 and 2006
2000 2006 2000 2006 2000 2006BE 5.2 5.2 1.2 1.4 0.5 0.5DE 2.7 2.4 1.7 1.5 0.6 0.7IE 2.2 1.9 2.2 1.9 0.2 0.2GR 2.4 4.2 2.4 4.2 1.5 1.9ES 2.6 2.0 2.4 1.8 1.6 1.4FR 3.4 3.2 2.2 2.0 0.9 0.6IT 4.0 3.8 3.6 3.3 2.3 2.3NL 0.9 1.0 0.5 0.5 0.1 0.2AT 2.3 1.8 0.8 0.5 0.2 0.0PT 2.9 2.9 2.6 2.7 1.3 1.4SE 1.7 1.6 1.1 1.0 0.3 0.3FI 1.7 1.3 1.6 1.2 0.4 0.3UK 5.0 5.4 2.1 2.1 1.1 1.1EU15 3.9 3.7 2.8 2.5 1.9 1.7CZ 4.5 5.3 3.1 3.3 0.7 0.9HU 6.4 8.5 5.4 6.8 2.9 2.6PL 2.5 3.1 2.3 2.9 1.1 1.0SK 6.0 8.0 3.8 3.8 1.2 1.7EU10 4.9 5.5 4.2 4.5 2.2 1.7
EU25 7.5 6.3 6.6 5.1 5.8 4.7
Income per head refers to mean household disposable income
Source: Estimates based on Eurostat, Regional Accounts and European Labour Force Survey
Income per head Mean log deviation index
Notes: For France, the effect of commuting is assumed to be the same in 2000 as in 2006 because of a break in the LFS series. For all countries, apart from Germany and Italy, the commuting effect for 2000 is an average of the two years 1999 and 2000 and for 2006, an average of 2005 and 2006. For Germany and Italy, figures for 1999 have been used for 2000 because of problems with the figures for the latter.
Note that the three EU aggregates include disparities across the relevant countries, including those comprised of a single NUTS 2 region
GDP per head unadjusted GDP per head adjusted
2.3.4 Narrowing of disparities in household income per head
While GDP per head gives an indication of the economic strength of a region, it does not necessarily reflect the well-being and living standards of the people living there, which are relevant for judging social cohesion.
There are many reasons for this. In the first place, the income produced by GDP does not necessarily go to individuals. It can equally go to companies, which might transfer their income, or profits, elsewhere, or to government in the form of taxes. Secondly, it does not include transfers into the region from outside, whether by government (such as social benefits), companies or individuals. Thirdly, it does not capture other non-monetary aspects of well-being, such as health, education or various amenities which individuals might have access to, as well as living in a pleasant and attractive environment. These aspects include the availability of public goods and services which may be part of government expenditure in the region and, indeed, partly funded under cohesion policy.

Synthesis Report Ex-post Evaluation of the ERDF 2000-2006
62
It is difficult to capture the multiplicity of aspects which contribute to well-being, but it is possible to measure one major dimension at least, which is the income per head of people living in different regions. Since cohesion policy is concerned with social disparities as well as economic ones and with maintaining and strengthening social cohesion, it is important to consider disparities in income levels between regions and how they changed over the programming period. A key question, therefore, is how far the reduction in regional disparities in GDP per head noted above was accompanied by a similar reduction in disposable household income per head.
Unfortunately the data available at EU-level to investigate this question are not entirely satisfactory17. The figures presented in Table 2.6, therefore, should be regarded as indicative only and illustrative of the differences which exist between the series being compared. Moreover, it should be emphasised that the figures for disposable income per head do not take account of differences in the access of households to various services and amenities which are paid for out of taxes, such as childcare facilities as well as education, healthcare and so on. Such access tends to be much more similar across regions within countries, because they tend to share the same social protection systems and institutional arrangements, than across countries. Consequently, the figures in Table 2.6 are indicative of the changes in regional disparities in income per head, broadly defined, which occurred over the period but less so of the changes which occurred across the EU as a whole.
Leaving the uncertainty aside, the data suggest that there was indeed a parallel narrowing of disparities in income per head across regions in the EU15 between 2000 and 2006 in line with the reduction in disparities in GDP per head. It also suggests that there was equally a narrowing of disparities in household income per head in the EU10 countries over the period in contrast to the widening in terms of GDP per head.
2.3.5 Other aspects of well-being and territorial cohesion
While data on income per head give some insight into how one major aspect of social disparities changed between regions over the programming period, as noted above, they give only a partial insight. To obtain a fuller picture, there is a need to take account of other aspects of well being and living standards which are more difficult both to identify indicators for and to find the data required to attach values to these indicators.
One important aspect in this regard, as also noted above, is access to public goods and services, which governments across the EU have sought to make more equal between regions over the period and, indeed, have used financing from the Structural Funds for this purpose (as described in Chapter 4 below). No data exist, however, on the availability of various types of public good or on social benefits in kind (such as child or elderly care services) which could be used in order either to judge the achievements in this respect or to gauge the extent of regional disparities which exists in different countries18.
17 Although Eurostat compiles and publishes data on disposable household income per head for NUTS 2 regions, the fluctuations from year to year in the figures suggests that they are subject to a relatively high degree of uncertainty. This applies especially to changes over time.
18 There are data on government expenditure on goods and services of various kinds as well as on expenditure n social benefits in kind, but these exist only at the national level and, moreover, in the case of public goods, do not reflect the past investment which has been made in providing amenities of various kinds.
Ex-post Evaluation of the ERDF 2000-2006 Synthesis Report
63
Other, less tangible, aspects are even more difficult to find indicators for, such as the natural or physical environment or the quality of life which people living in different places enjoy, which were aspects that cohesion policy was aimed at evening up over the period. Measurement problems, however, should not mean that aspects of this kind are ignored when judging the performance of cohesion policy, even if they can only be taken into account in qualitative rather than quantitative terms.
The same applies to territorial cohesion which is equally difficult to find indicators for, though those used to assess social cohesion might also be relevant.. Since improving the territorial balance of development was an important aim of policy in many cases across the EU, the outcome in this regard also needs to be assessed in qualitative terms.
Both social cohesion and territorial balance are also relevant for assessing the sustainability of development which is a key objective of cohesion policy, since in the absence of the two, development is unlikely to be sustainable for any length of time. Equally, of course, sustainability implies that development is not at the expense of environmental damage, increased emissions, the loss of natural assets and the depletion of exhaustible resources. Indicators of these are just as important in assessing how far this objective is being achieved. As for the other aspects, they largely remain to be developed.
2.4 MAIN POINTS TO EMERGE The main points to arise from the analysis of regional developments over the programming period are:
• Growth of national economies which formed the context in which regional development in the EU15 took place over the period varied markedly; in particular, it was relatively high and, accordingly, favourable to development, in Greece and Spain, as well as Finland, Sweden and the UK, and relatively low, and less favourable in Germany, Italy and Portugal.
• The restrictive nature of budgetary policy was reflected in a significant reduction in public investment in Portugal over the period; in Germany, Austria, Belgium, and Italy, policy restriction meant that public investment was relatively low over most of the period. In Greece, public investment was expanded markedly up until the Games in 2004 and was then reduced.
• The continuing process of globalisation reinforced by EU enlargement led to increasing competitive pressure on producers in traditional industries in the EU15 as well as those specialising in labour-intensive activities more generally; many of these were located in lagging regions and others receiving funding under cohesion policy. Accordingly, growth in these regions might be expected to have been less than elsewhere over the period other things being equal.
• Growth of GDP per head over the period 2000-2006 was higher on average in Objective 1 regions in the EU15 than in non-assisted regions. This was also the case in all EU15 Member States, with the sole exception of Hainaut in Belgium. In the EU10 countries, the already high growth rates increased further after accession.
• Growth of GDP per head in regions receiving significant amounts of funding under Objective 2 was also slightly higher on average than in non-assisted regions over the period.

Synthesis Report Ex-post Evaluation of the ERDF 2000-2006
64
• The experience of the 2000-2006 period contrasts with that in the previous programming period when the growth of assisted regions in most countries was lower than in non-assisted regions. Since the great majority of the regions receiving assistance in 2000-2006 also received assistance in 1994-1999, this suggests that it might take time for Structural Fund support to be reflected in higher GDP growth.
• The relatively high rates of growth achieved by Objective 1 regions in the EU15 was accompanied by a marked narrowing of the gap in employment rates with other regions; this was especially so in Spain, Italy and Greece, where the gap had been particularly wide.
• The consequence of the better growth performance, on average, of regions receiving cohesion policy funding over the 2000-2006 period was a narrowing of disparities in GDP per head between regions in the EU15. This was the case in all countries, apart from Greece, the Netherlands and the UK, where disparities widened, and Belgium and Portugal where they remained the same. This contrasts with the 1995-2000 period when disparities widened in most countries.
• Adjusted for commuting, regional disparities in the EU15 narrowed by slightly more between 2000 and 2006 than the crude figure show. In the UK and the Netherlands, disparities remained unchanged instead of widening. Taking account of the increase in commuting reduces the widening of regional disparities in the EU10 countries and eliminates it completely in Slovakia.
• Household income per head is a better measure of well-being and of social cohesion than GDP per head; it also indicates a reduction in disparities over the programming period in both EU15 countries and EU10 countries.
• There are no accepted indicators available at EU level of the quality of life in different regions and territorial balance; both are important aims of cohesion policy, which are likely to become of increasing importance in the future.

Ex-post Evaluation of the ERDF 2000-2006 Synthesis Report
65
3 Chapter 3 – Policy outcomes and effects in main policy areas
As indicated at the outset, the evaluation did not attempt to cover all policy areas which were the target of Structural Fund support over the programming period. Instead, it concentrated on examining the main ones in some detail, in particular
• enterprise support, which covers innovation but only to a very limited extent, which is a gap in the evaluation19
• transport, which has historically been a major focus of EDRF support
• the environment, for which the evaluation was largely concentrated on infrastructure investment.
While support for making good deficiencies in infrastructure has been a traditional focus of cohesion policy in less developed regions since its inception, increasing attention over the years has turned to attempts to strengthen the competitiveness of businesses. This is particularly so as disparities in the endowment of infrastructure have narrowed in the EU15, not least as a result of policy efforts.
A number of other issues, including horizontal aspects which cut across policy areas were also examined in the evaluation. These are:
• the cost effectiveness of large projects, as reflected in their unit costs, which is an issue in particular in respect of transport and environmental infrastructure;
• climate change and sustainable development which became of increasing relevance over the period;
• the development of rural areas which were a specific target of EAGGF support but to which the ERDF contributed substantial resources;
• gender equality and demographic change, which were coupled together in the evaluation largely because the issues involved are similar, though it should be noted that only the first was specified as horizontal priority in the Structural Fund guidelines.
Taking account of these various aspects as well as the specific policy areas covered means that the evaluation considered almost all of the broad items of expenditure co-financed by the ERDF in one way or another. Though it did not directly include telecommunications, social infrastructure and energy, which were important areas of funding in some regions, these were covered to some extent by the horizontal studies.
The main findings of the studies carried out are examined in turn in each of the sectors below.
3.1 ENTERPRISE SUPPORT Support from the Structural Funds for businesses, both directly through grants or loans for investment and indirectly through the provision of specialised services and infrastructure, is the main direct measure for stimulating economic growth in the regions assisted. It is also the
19 Innovation was included with enterprise support as a policy area to be covered in the evaluation but the study commissioned failed to be completed.
Synthesis Report Ex-post Evaluation of the ERDF 2000-2006
66
measure which most needs careful justification. This is because the intervention involved is explicitly aimed at influencing the efficiency of firms and their ability to compete in both the internal market and markets in the rest of the world. As such, it potentially distorts competition by assisting some firms rather than others.
The rationale for enterprise support is that it is aimed at correcting market failure, that without it, businesses in lagging regions or in regions historically reliant on traditional industries would have little or no prospect of survival and expanding into new markets. If market forces were left free to operate, competition, it is argued, would drive firms out of business before they had the opportunity to invest and modernise. This argument applies, in particular, to SMEs which possess neither the resources to develop and expand nor the access to borrowing to do so because of gaps in the financial market and the reluctance of lenders to invest in small firms, especially if they wish to innovate and enter new, and uncertain, areas of business.
In the EU10, the argument applies more generally. In Poland, for example, the programming documents emphasise the problems facing Polish firms on accession to the EU, given their concentration in activities in which they can compete only in terms of cheap labour. Since this is a transitory comparative advantage, firms of all sizes need support in order to invest in new technology and more efficient methods of production.
In Objective 1 regions in the EU15, as well as in Objective 2 regions, the case is essentially to help bring about the restructuring of the economy which is unlikely to occur, or at least, not for a long time20, without intervention. The need is to provide SMEs with funding as well as various support services to assist them make the necessary changes in methods of production or in the kinds of product produced. It is equally to support the creation of new firms through similar means.
Once the case for intervention is accepted, it is still necessary to identify firms which not only need support but are capable of using that support productively to become profitable and grow. The risk is that the funding provided is either likely to be lost as the firms assisted eventually go out of business or it will lead to the continuing need for support to keep the firms in operation.
The opposite risk is that funding is given to firms which do not actually need it, that they would have made the investment concerned even without financial help. The funding provided in such cases, therefore, is a waste of public resources. This ‘deadweight’ cost, it is widely argued, is most likely to occur in respect of support to large enterprises, which can be expected to have greater access to financing opportunities as well as to business expertise.
A further consideration is that if the investment turns out to be successful, the profits that result will accrue to the firm and not to the public authority which provided the finance. For this reason, there has been an increasing concern – made explicit in the guidance to managing authorities at the beginning of the programming period – to shift support from (non-repayable) grants to (repayable) loans and equity finance. This has the further advantage of the firms concerned sharing in the risk of the venture, which should add to their incentive to make it a success.
In addition, in many cases, there were conflicts between the objective of maintaining and, if possible, expanding employment, which was a major concern when programmes were drawn up, and that of restructuring, which almost inevitably involved allowing traditional industries to
20 It is possible that market forces would eventually bring about the desired change without intervention, but these tend to be very slow working. The case for intervention can, therefore, be expressed in terms of accelerating the restructuring process rather than in term of market failure as such.
Ex-post Evaluation of the ERDF 2000-2006 Synthesis Report
67
decline. A further frequent problem was a lack of demand for support in the sectors which it was intended to stimulate, precisely because of the limited number of companies in the more technologically advanced, high value-added activities concerned.
3.1.1 The global context
Underlying market conditions and the general context in which business support was conducted changed over the programming period. As indicated in the previous chapter, there was an economic downturn in a number of Member States, including Portugal, Germany and Italy in particular, from 2001, soon after measures began to be implemented. This led to a decline in demand for assistance to expand and innovate and increased demand for support from firms to keep them in business and prevent job losses.
As the period went on, the process of globalisation and the industrialisation of developing countries, especially China and other South-East Asian economies, led to increased competitive pressure on firms in traditional labour-intensive activities. This took the form not only of increased imports into the internal market but the relocation by multinationals of such activities to low wage countries, a process reinforced by EU enlargement.
In both Objective 1 and Objective 2 regions, regional strategies to support businesses shifted in the second part of the period towards restructuring and the development of new growth sectors and away from supporting firms in traditional industries. This was aided by an increased rate of growth in most Member States and an expansion of employment which resulted in maintenance of jobs being less pressing. In Portugal, it was stimulated by the publication of Mid-term Evaluations which criticised the concentration of enterprise support on existing areas of specialisation.
3.1.2 What was the scale of ERDF support?
In total, ERDF-financed expenditure on enterprise support in Objective 1 regions in the EU15 over the programming period amounted to EUR 21.3 billion (total up to the end of 2008), equivalent to just over a quarter (26%) of total expenditure in these regions (Table 3.1). A further EUR 3.6 billion of expenditure (just over 4% of the total) went on support for tourism, much of it going to businesses in the industry as well as to improving the facilities available.
In addition, expenditure on enterprise support financed by the ERDF under Objective 2 amounted to some EUR 9 billion in the EU15 (Table 3.2). This was equivalent to 48% of the total spending from the ERDF, emphasising the weight attached to this in development strategies in the regions concerned. Support for tourism added a further EUR 2.4 billion, or 12% of total spending in these regions. Overall, therefore, some 60% of ERDF-financed expenditure in Objective 2 regions went on business support measures broadly defined.
In the EU10 countries, expenditure from the ERDF on business support amounted to EUR 1.6 billion, or just over 20% of the total, while support for tourism added a further EUR 0.5 billion (7% of total spending).
The relative weight given to business support in the allocation of the ERDF varied markedly between countries. In Objective 1 regions in the EU15, it ranged from around 87% of the total in Finland to 15% or less in Ireland, Greece and France (where, as noted above, the regions concerned were mostly the DOMs). In general, much less expenditure went on business support in the four Cohesion countries as well as in the South of Italy (31%) than in Objective 1 regions in

Synthesis Report Ex-post Evaluation of the ERDF 2000-2006
68
the rest of the EU15, partly reflecting the ongoing need of the former for infrastructure over the period.
Table 3.1 Expenditure from the ERDF on enterprise support in Objective 1 regions, 2000-2006
Large firms
SMEs RTDI Total support
Tourism Large firms
SMEs RTDI Total support
Tourism
BE 46 145 88 279 43 16.6 51.9 31.5 73.8 11.4DE 658 2,461 1,645 4,764 272 13.8 51.7 34.5 42.5 2.4IE 0 85 191 276 23 0.0 30.7 69.3 15.2 1.3GR 123 1,277 232 1,633 534 7.6 78.2 14.2 12.0 3.9ES 984 2,120 1,644 4,748 482 20.7 44.6 34.6 21.4 2.2FR 54 179 65 298 199 18.3 60.1 21.7 14.1 9.4IT 603 2,917 891 4,411 1,091 13.7 66.1 20.2 31.7 7.8NL 1 12 5 18 13 7.1 65.9 27.1 23.5 16.5AT 21 63 13 97 49 21.8 65.1 13.1 59.8 30.5PT 749 1,220 549 2,519 599 29.7 48.5 21.8 21.5 5.1FI 74 199 134 408 9 18.2 48.9 32.9 86.8 1.8SE 0 174 88 262 41 0.0 66.3 33.7 60.7 9.6UK 139 1,022 382 1,543 204 9.0 66.2 24.8 44.7 5.9
EU15 3,454 11,874 5,927 21,255 3,558 16.3 55.9 27.9 26.1 4.4
CZ 25 154 13 193 91 13.1 80.1 6.8 24.6 11.6EE 2 18 29 49 20 4.5 36.5 59.0 24.2 9.7LV 38 84 15 138 9 27.9 61.1 11.0 40.1 2.5LT 19 40 38 97 79 19.4 41.8 38.8 17.1 13.9HU 30 179 110 319 81 9.4 56.2 34.4 26.4 6.7MT 0 1 0 1 4 0.0 100.0 0.0 2.5 10.5PL 94 467 198 759 191 12.4 61.5 26.1 18.1 4.6SI 7 24 14 46 35 16.1 53.5 30.4 36.9 28.6SK 5 6 3 15 29 32.8 44.3 22.9 3.1 6.3
EU10 221 975 420 1,616 539 13.6 60.3 26.0 20.4 6.8
EU25 3,675 12,849 6,347 22,870 4,098 16.1 56.2 27.8 25.6 4.6Note: Expenditure up to end-2008Source: Estimates based on DG Regio data
EUR million % Total support % Total expend
Expenditure on business support in the EU10 countries accounted for less than a quarter of total ERDF funding in all apart from Hungary (26%), Slovenia (37%) and Latvia (40%). In Malta and Slovakia, it made up only around 3% of the total.

Ex-post Evaluation of the ERDF 2000-2006 Synthesis Report
69
Table 3.2 Expenditure from the ERDF on enterprise support in Objective 2 regions, 2000-2006
Large firms
SMEs RTDI Total support
Tourism Large firms
SMEs RTDI Total support
Tourism
BE 32 83 44 158 60 19.9 52.5 27.6 46.3 17.4DK 7 25 26 58 32 11.7 42.6 45.6 46.2 25.6DE 106 1,078 387 1,572 400 6.8 68.6 24.6 54.0 13.8ES 31 412 644 1,088 36 2.9 37.9 59.2 52.5 1.8FR 155 934 444 1,533 927 10.1 60.9 29.0 29.9 18.1IT 4 833 64 901 339 0.5 92.5 7.1 36.6 13.7LU 0 0 4 4 6 3.9 3.9 92.1 10.7 14.8NL 4 172 13 189 95 2.0 91.2 6.8 27.6 13.8AT 140 198 102 440 125 31.9 45.1 23.1 70.6 20.0FI 0 154 71 226 55 0.0 68.4 31.6 57.5 14.0SE 1 157 35 193 52 0.7 81.1 18.2 52.4 14.1UK 12 2,409 230 2,651 138 0.5 90.9 8.7 70.0 3.6
EU15 493 6,456 2,064 9,012 2,265 5.5 71.6 22.9 47.6 12.0
CZ 0 5 4 9 2 0.0 57.8 42.2 16.3 3.2CY 0 10 0 10 5 0.0 100.0 0.0 43.4 21.4SK 0 4 1 5 6 0.0 86.1 13.9 14.9 19.1EU10 0 19 4 23 13 0.0 81.2 18.8 21.6 11.7
EU25 493 6,474 2,069 9,036 2,277 5.5 71.7 22.9 47.4 12.0Note: Expenditure up to end-2008Source: Estimates based on DG Regio data
% Total support % Total expendEUR million
The overall funding of enterprise support which the ERDF contributed to was much larger as a result of national government co-financing and private sector contributions21. Overall, it amounted to an estimated EUR 89.7.billion in Objective 1 regions in the EU15 and to EUR 49.1 billion in Objective 2 regions (Table 3.3).
How far the ERDF was responsible for levering the substantial amount of private sector financing which it was associated with, is difficult to determine. It is almost certainly the case that some of the investment would have been undertaken anyway, even without ERDF financing. Equally, some would almost certainly not have been.
In the EU10, national government and private sector contributions were smaller, the overall amount of funding being estimated at just under EUR 4 billion, still substantially larger than the ERDF contribution alone.
21 The figures for private contributions included in Table 3.3 involves a good deal of estimation. See WP1, Task 2 of the ex post evaluation. Financial implementation of the Structural Funds, May 2009 – http://ec.europa.eu/regional_policy/sources/docgener/evaluation/pdf/expost2006/wp1_tsk2_report_final_29052009.pdf.

Synthesis Report Ex-post Evaluation of the ERDF 2000-2006
70
Table 3.3 Expenditure on enterprise support by source of funding, 2000-2006
EUR million
ERDF Total public Private ERDF Total public Private BE 279 569 1,085 158 389 337DK 58 142 35DE 4,764 8,457 9,112 1,572 3,346 4,710IE 276 800 323GR 1,633 2,544 3,152ES 4,748 7,126 22,301 1,088 2,243 5,237FR 298 646 715 1,533 4,422 4,113IT 4,411 8,596 7,864 901 2,435 7,212LU 4 19 5NL 18 62 22 189 478 650AT 97 140 241 440 931 2,026PT 2,519 5,163 3,653FI 408 870 989 226 576 826SE 262 556 379 193 465 291UK 1,543 2,879 1,445 2,651 6,601 1,612
EU15 21,255 38,408 51,283 9,012 22,049 27,053
CZ 193 258 156 9 18 32EE 49 69 22CY 10 21 36LV 138 206 18LT 97 181 21HU 319 449 573MT 1 2 1PL 759 1,051 766SI 46 68 78SK 15 27 20 5 11 34
EU10 1,616 2,312 1,654 23 49 103
EU25 22,870 40,720 52,937 9,036 22,098 27,156
Objective 1 Objective 2
Note: ERDF and total public expenditure up to end-2008. Figures for private expenditure involve a good deal of estimationSource; Estimates based on DG Regio data. See WP1, Task 2, Financial Implementation of the Structural Funds, May 2009
3.1.3 What was ERDF support spent on?
In Objective 1 regions in the EU15, well over half of the finance from the ERDF for business support went on assisting SMEs either directly through investment grants or indirectly through the provision of various services. Most of the rest went on support for RTDI (28% of the total) while a relatively small amount (16% - though still totalling some EUR 3.4 billion) went to support of large enterprises (see Table 3.1 above).
The broad division in Objective 2 regions was more concentrated on SMEs, support to these amounting to almost 72% of the total, with RTDI amounting to 23%. Only around 5-6% of total Objective 2 funding for business support, therefore, went on assisting large enterprises.
In the EU10 countries, the division was similar, though a slightly larger proportion went to SMEs (60%) than in the EU15 and a smaller proportion to large enterprises (14%).
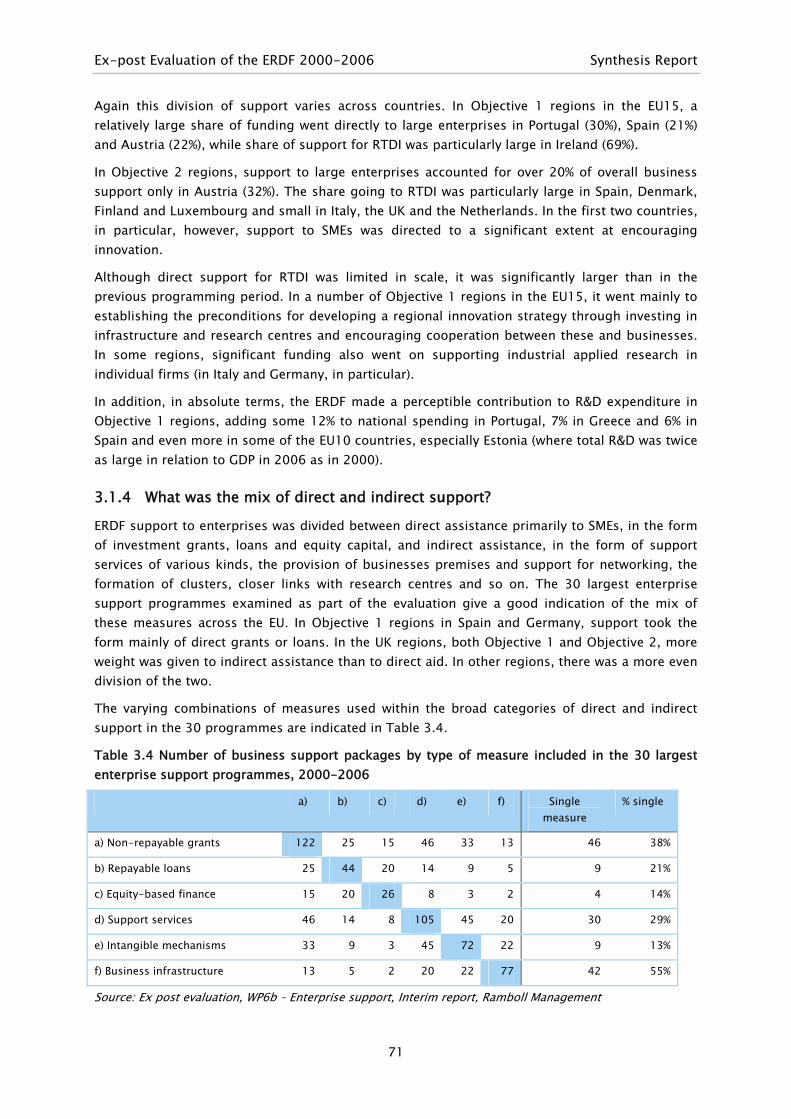
Ex-post Evaluation of the ERDF 2000-2006 Synthesis Report
71
Again this division of support varies across countries. In Objective 1 regions in the EU15, a relatively large share of funding went directly to large enterprises in Portugal (30%), Spain (21%) and Austria (22%), while share of support for RTDI was particularly large in Ireland (69%).
In Objective 2 regions, support to large enterprises accounted for over 20% of overall business support only in Austria (32%). The share going to RTDI was particularly large in Spain, Denmark, Finland and Luxembourg and small in Italy, the UK and the Netherlands. In the first two countries, in particular, however, support to SMEs was directed to a significant extent at encouraging innovation.
Although direct support for RTDI was limited in scale, it was significantly larger than in the previous programming period. In a number of Objective 1 regions in the EU15, it went mainly to establishing the preconditions for developing a regional innovation strategy through investing in infrastructure and research centres and encouraging cooperation between these and businesses. In some regions, significant funding also went on supporting industrial applied research in individual firms (in Italy and Germany, in particular).
In addition, in absolute terms, the ERDF made a perceptible contribution to R&D expenditure in Objective 1 regions, adding some 12% to national spending in Portugal, 7% in Greece and 6% in Spain and even more in some of the EU10 countries, especially Estonia (where total R&D was twice as large in relation to GDP in 2006 as in 2000).
3.1.4 What was the mix of direct and indirect support?
ERDF support to enterprises was divided between direct assistance primarily to SMEs, in the form of investment grants, loans and equity capital, and indirect assistance, in the form of support services of various kinds, the provision of businesses premises and support for networking, the formation of clusters, closer links with research centres and so on. The 30 largest enterprise support programmes examined as part of the evaluation give a good indication of the mix of these measures across the EU. In Objective 1 regions in Spain and Germany, support took the form mainly of direct grants or loans. In the UK regions, both Objective 1 and Objective 2, more weight was given to indirect assistance than to direct aid. In other regions, there was a more even division of the two.
The varying combinations of measures used within the broad categories of direct and indirect support in the 30 programmes are indicated in Table 3.4.
Table 3.4 Number of business support packages by type of measure included in the 30 largest enterprise support programmes, 2000-2006
a) b) c) d) e) f) Single measure
% single
a) Non-repayable grants 122 25 15 46 33 13 46 38%
b) Repayable loans 25 44 20 14 9 5 9 21%
c) Equity-based finance 15 20 26 8 3 2 4 14%
d) Support services 46 14 8 105 45 20 30 29%
e) Intangible mechanisms 33 9 3 45 72 22 9 13%
f) Business infrastructure 13 5 2 20 22 77 42 55%
Source: Ex post evaluation, WP6b – Enterprise support, Interim report, Ramboll Management
Synthesis Report Ex-post Evaluation of the ERDF 2000-2006
72
‘Intangible mechanisms’ in the table refer to support for technology transfer, collaboration between firms and with research centres, and for clusters or ‘poles’ of excellence. The shaded figures show the total business support packages which include the measure in question (in the case of non-repayable grants, 122) while the other figures show the number of instances where the measure was combined with others (the figures do not sum to the total since a combination of more than two measures were often used). The last two columns show the number of instances of the measure being used on its own and the proportion of instances where this was the case.
Non-repayable grants were, therefore, the most frequently used measure over the period, these often being used in combination with support services or with intangible mechanisms. There was a clear tendency to focus non-repayable grants on selected sectors, rather than making them generally available for investment, as the period went on.
Support services were the next most frequently used (in 105 cases). Their focus varied across regions. In some cases, for example, they were directed towards helping firms gain access to export markets (in Objective 1 regions in Spain and Eastern Germany), in others, especially the UK regions, they were concentrated on increasing the rate of business start-ups.
Equity-based finance was the least used measure. They were employed most in the UK, where they were included in all regional programmes, and to a significant extent in Germany (in 5 of the 7 programmes examined).
In the case of nearly all programmes, there was a clear tendency over the period to move to loans and equity finance. This was partly to meet the need for support at lower cost. Problems arose, however, in the implementation of equity financing both because of a lack of experience in setting up the funds and because of the difficulties of finding suitable projects to invest in. On the other hand, the contribution of equity finance to business performance was reported as being significant in a number of regions (including in the Objective 2 regions of Scotland and the North East of England according to the analysis of their equity funds carried out).
3.1.5 What were the results of enterprise support?
The difficulties of estimating the effects of enterprise support are compounded by the mix of indicators used and the various methods applied to putting values on them, which in most cases were not made explicit.
The central indicator which managing authorities were intended to use was the net number of new jobs created and safeguarded as a result of support measures, which was supposed to make explicit allowance for deadweight and displacement effects. In practice, partly because of the significant difficulties of estimating such effects, the figures produced were often in gross terms and sometimes related to the total number employed in a firm rather than the additional number of jobs created as a result of the measure. Where estimates in net terms were made, the techniques used were rarely explained or justified22.
22 This was less so in UK regions, where in most cases, serious attempts were made to estimate net job creation. In South Yorkshire, for example, an elaborate econometric model, constructed by an external consultancy and incorporating explicit estimates of deadweight effects, was used to compare actual employment growth with that which would have occurred without the support of the programme.

Ex-post Evaluation of the ERDF 2000-2006 Synthesis Report
73
Moreover, in many cases, employment creation or maintenance was not the main aim of the support provided. Instead, the immediate purpose was to increase business efficiency and competitiveness which might well imply a reduction in employment, or at least no increase. Accordingly, the lack of job creation, or a low rate of creation, cannot be taken as evidence of a lack of success.
Bearing in mind these qualifications, enterprise support co-financed by the ERDF in the 30 largest enterprise support programmes across the EU, encompassing both Objective 1 and Objective 2 regions, is reported to have led to the creation of just under 640,000 jobs over the 2000-2006 period. This is slightly more than the aggregate target set across the regions concerned, which does not mean that all targets were achieved – in some cases, the outcome fell well short of the target, in some, it exceeded it by some way.
The implication from the programmes examined is that over the EU as a whole, at least 1 million new jobs were created in Objective 1 and Objective 2 regions as a result of enterprise support according to the estimates of the authorities concerned.
This total is based on estimates from less than half of the business support measures identified in the evaluation (130 out of 272). The rest did not report figures for job creation, either because of the difficulties of doing so or because direct employment creation was not a central aim of the support provided.
Whatever the shortcomings of the estimates, they suggest that ERDF made a substantial contribution to employment creation in the regions assisted over the period.
3.1.6 Reflections on the results
Perhaps the most relevant indicator to use to measure the effects of enterprise support is the increase in productivity which resulted from the assistance received. This is linked in some degree with competitiveness, which to a large extent was a major aim of policy in most if not all regions, especially in the later years of the programming period. In some regions, attempts were made to measure this, but in none of them were these considered to have been successful.
According to the evaluation, enterprise support undoubtedly led to increased employment and, in some cases, to increased productivity, though precisely how much in each case is uncertain because of measurement problems.
3.2 EVALUATING ENTERPRISE SUPPORT IN EASTERN GERMANY USING COUNTERFACTUAL
METHODS As indicated above, there is an acute problem of assessing the effects of enterprise support from the evidence available. In particular, the methods used to evaluate programmes across the EU over the period tended to be relatively crude, in few cases attempting to make any allowance for what would have happened in the absence of funding. Partly to encourage more studies to be undertaken of a rigorous kind in this important area, a pilot study was commissioned as part of the evaluation to explore the possibilities of applying counterfactual methods to micro-data on enterprise performance. The results are summarised below and although they give only a limited view of the results of the funding provided by the ERDF, they represent an important start to the task of assessing the real effects of enterprise support and an example of the type of method which should be used to do this.

Synthesis Report Ex-post Evaluation of the ERDF 2000-2006
74
The study concerned was aimed at measuring the effects, first, of grants for investment in the Eastern German Länder, all of which were Objective 1 regions in the period, and, secondly, of support of R&D expenditure in one of these regions, Thüringen. In both cases, the basis of the analysis was a survey of enterprises, the first covering all of the Eastern German Länder for the period 1997-2007 and the second, enterprises in Thüringen over the period 2000-2003. The data collected allowed a comparison of performance between firms which received grants and similar firms which did not Specifically, the aim of the analysis was to estimate, in the first case, the effect of the grants in increasing investment per employee in the firms receiving support and, in the second, the effect in increasing R&D expenditure per employee.
The common element in the different techniques which were applied was the use of the firms not receiving grants as a comparison group, to estimate the expenditure on investment and R&D which the firms receiving grants would have carried out had they not been assisted in this way. In other words, attempts were made to estimate the counterfactual behaviour of the firms concerned in the absence of grant receipts 23.
In so doing, explicit account was taken of various characteristics of the firms which might have affected their investment and R&D behaviour – including, in particular, their size, age export share, ownership, the skill composition of the workforce, the sector of activity in which they operate, the capital intensity of production, and the age of plant and machinery.
In the case of the analysis of investment grants in the Eastern German Länder, the findings were that:
• investment per employee was around 2.4 to 2.5 times higher in firms receiving investment grants than in those not doing so;
• the difference in investment per employee, moreover, was significantly greater than the value of the grants themselves, so that the financial support led to firms making additional investment which was around a third larger than the value of the grant, so that grants can be regarded as a relatively efficient way of increasing investment per worker.
In the case of grants for R&D in Thüringen, the findings were that:
• firms receiving grants had a level of R&D expenditure per employee which averaged around EUR 11,500 as compared with EUR 4,000 for firms not receiving grants;
• as in the case of investment grants, the additional level of R&D expenditure per employee was greater than the value of grants, so again the measure can be regarded as relatively efficient in increasing expenditure on R&D.
As indicated above, further analysis of this kind needs to be undertaken to assess enterprise support measures in different parts of the EU using data on individual firms to isolate the effects of such measures on aspects such as productivity or export performance which are indicators of competitiveness, which tends to be the main focus of policy.
23 The methods used included linear regression, controlled Difference-in-Difference, Propensity Score Matching and Instrumental variable.

Ex-post Evaluation of the ERDF 2000-2006 Synthesis Report
75
3.2.1 Other evidence of the effect of enterprise support
One other study which was carried out using similar methods was an evaluation of the ERDF support provided to firms in Southern Italy. This was undertaken in 2005 and was not part of the present evaluation but it reported relevant findings (see Box).
Box – Enterprise support in Italy24 In Italy, there were two national programmes for enterprise support covering all Objective 1 regions and co-financed by the ERDF. One was the PON Sil which provided investment grants to firms, partly for investment in environmentally-friendly technology and energy saving. The other was for support of RTD and higher education.
Overall expenditure funded by the PON Sil amounted to EUR 4.3 billion (up to end-2008), 90% of which went on investment grants. Of this, 70% went to SMEs, 20% to large companies and 8% to investment in environmentally-friendly technology25. Monitoring data indicated an increase of 36,193 in employment (an average of around 6 additional employees in each of the 6751 firms supported) as at April 2005, 60% more than the target.
Field research on 50% of the projects (some 4,051 firms), however, revealed that there were no evident effects on the sectoral structure of economic activity in the regions. Instead, direct grants reinforced the existing structure of low and medium tech sectors. Nevertheless, 9% more firms started to export and there was a significant increase in the average size of small firms.
In addition, analysis based on counterfactual methods (using statistical matching techniques) found that investment grants were associated with a deadweight effect of up to 50%. It was still the case, however, that sales growth in the recipient firms was 11-18% higher over the period than in the control group, growth of investment 36-49% higher and employment growth 28-49% higher. On the other hand, there was a negative effect on productivity, due to grants being heavily biased towards employment creation.
EU funding for the research and innovation programme amounted to EUR 1.3 billion, mostly from the ERDF, which mainly went on investment grants to SMEs and, to a lesser extent, to large firms to co-finance industrial applied research, research networks and university spin-offs.
Field research on over 250 firms receiving support found that over two-thirds (69%) of projects were of a high and medium-to-high tech nature, around 83% of research activities led to commercialisation of the results and 19% led to patents (26% in the case of SMEs). Some 92% of firms reported a positive effect on jobs, with an average increase of 15%. In addition, 87% of the projects led to the creation or strengthening of public-private collaboration, especially between businesses, universities and public research centres.
3.3 RESTRUCTURING IN OBJECTIVE 2 REGIONS The evaluation also included a study of restructuring in Objective 2 regions in the context of globalisation. This consisted, first, of an overall analysis of structural change over the period 1990-2005 across regions in the EU15 in order to try to detect differences in performance between regions with different sectoral specialisations, distinguishing between those specialising in traditional industries, those in capital-intensive – or heavy – industries and those in equipment, 24 See Ismeri Europa – Nova, Intermediate evaluation of NOP SIL, 2005 and Ismeri Europa – IZI, Intermediate evaluation of NOP Research.
25 The programme accounted for around 17% of total expenditure in the EU25 from the ERDF on this particular area of intervention and 15% of that on environmental technology.

Synthesis Report Ex-post Evaluation of the ERDF 2000-2006
76
or engineering, industries. The second, and main, part of the analysis consisted of case studies of 12 regions receiving Objective 2 funding. The aim in each case was to examine the efforts of the regions concerned to restructure in the face of increased competitive pressure from globalisation and the contribution of Objective 2 funding in this regard26.
The main findings of the analysis can be summarised as follows:
• A number of Objective 2 regions (defined at the NUTS 2 level) across the EU changed their specialisation over the period examined, shifting from traditional industries to capital intensive ones or from capital intensive to equipment industries. In both cases, this was associated with a positive economic performance and, in most cases, an improvement in their estimated international trade balance27.
• Of the 12 case study regions, only Steiermark (Austria) had succeeded over recent years in changing its area of specialisation, emphasising the difficulties of achieving this and breaking free from an historical development path on to a new one. The strategy adopted in the region succeeded in building up an automotive sector almost from scratch based on inward investment, with the regional agency pursuing a selective policy to attract suitable foreign companies given the end objective.
• The experience of Steiermark as compared with that of the Ruhr area of Nordrhein-Westfalen highlights two important aspects of restructuring. The first is that it takes many years, and even decades, to bring about an effective change in areas of specialisation, even with continuous support. The second is that, it is easier to accomplish if the area concerned is smaller rather than larger.
• Long-standing policy efforts to diversify the economies in many of the industrial Objective 2 regions have not led to the intended shifts in their sectoral pattern of economic activity. The pattern inherited from the past, and often in place for a century or more, has proved highly resistant to change. In Nordrhein-Westfalen, the Ruhr remains adversely affected by the past dominance of heavy industry, despite numerous policy initiatives and substantial investment aimed at developing and expanding new activities. Even in Steiermark, the case study found no evidence so far for the further diversification of the economy away from relative reliance on the automotive industry into higher-tech and more knowledge-intensive sectors.
• The case studies demonstrated that enterprise support focused on increasing the innovation capacity of firms, especially SMEs and their performance on international markets can strengthen competitiveness and assist restructuring, as in Steiermark, País Vasco and, to a lesser extent, Toscana. Measures that proved to be the most effective were those aimed at encouraging new clusters of activity in specific sectors and in particular areas of technology.
• In some case study regions (Bretagne and Rhône-Alpes, for example), the regional development strategy was not so much directed at structural change as at maintaining the internal territorial balance and safeguarding employment. Since the evaluation was
26 See the Annex to this report for a list of these.
27 Since no data exist on exports and imports at regional level, estimates were made for each region on the assumption that trade performance in each broad sector was the same in each region as at the national level.

Ex-post Evaluation of the ERDF 2000-2006 Synthesis Report
77
concerned explicitly with restructuring and with the development of regional economies, it did not investigate the effectiveness of this strategy.
• The evidence is that three regions which showed the clearest signs of restructuring were also the ones where the regional authorities were the earliest to be aware of the need for structural change. They accordingly reacted to the threat of globalisation sooner than those in other regions by promptly developing strategies for encouraging the diversification of their economies. This demonstrates the importance of looking ahead and trying to anticipate the need for change in areas of specialisation,
• Analysis of the relationship between Objective 2 programmes and the broader set of regional policy measures suggest that the most effective programmes were those which were in line with and, therefore, reinforced, the main thrust of development strategies being pursued in the regions. Support of the ERDF for ‘mainstream’ measures contributed more than where additional ‘complementary’ objectives were pursued.
• At the same time, the possibility of using ERDF finance to support these strategies was hampered in some regions by the ‘micro-zoning’ which concentrated funding on small areas with very specific territorial needs.
• The effectiveness of intervention was closely related to the competence and expertise of local institutions and their strategic vision. The evidence is that these attributes can change the path of development – and overcome historical ‘path dependency’ – by persistent, focussed and concentrated policy effort.
• The evidence from the evaluation is that, despite its small scale, the funding provided under Objective 2 was of major importance for the regions examined. A large majority of those interviewed in the course of the case studies confirmed that ERDF support was instrumental in encouraging the adoption of a long-term strategic view of development, which was vital for both designing and building effective support for restructuring. It, accordingly, played a key role in setting the agenda for change as well as providing valuable funding which could be used to lever larger-scale financial support. In short, it acted as a catalyst for change, encouraging regional authorities to prioritise and enabling them to innovate as well as to put in place long-term action programmes.
3.4 TRANSPORT Transport infrastructure is an important driver of regional development. An efficient transport network is essential for sustained economic growth as well as territorial balance. The problems of economic development faced by lagging regions stem partly from having inadequate transport systems and poor links with other regions in the countries concerned and in other parts of the EU. It is not a coincidence that most Objective 1 regions in the EU15 are located on the periphery of the EU, away from both the national and EU centres of economic activity.
Improvement of transport networks has, therefore, long been considered essential to increase the accessibility of lagging regions and of less economically central areas within regions. Efficient links between centres of economic activity and surrounding areas are vital if the growth generated in the former is to benefit these areas to the maximum. It is especially important for rural areas that there are good connections with the main regional centres both for businesses and individuals, to ensure that support services of various kinds and social and cultural amenities are within easy reach. The efficiency of transport systems in urban areas is equally important for business competitiveness and for limiting the time lost from travelling from one place to another.
Synthesis Report Ex-post Evaluation of the ERDF 2000-2006
78
At the same time, there has been a growing concern over the past decade to reduce the pollution and emissions from transport and to save energy. This has led to an increasing need to shift between modes of transport, in particular, from road to rail and, where possible, to shipping or waterways. It has also given rise to a need in cities to expand the public transport system in order to reduce the traffic on urban roads.
The Structural Funds have historically been a major source of finance for the investment needed to reduce imbalances in transport endowment in lagging regions across the EU. Despite substantial investment in Objective 1 regions in previous programming periods, there remained major disparities in endowment across the EU at the beginning of the 2000-2006 period as regards both fast means of travel between regions and efficient connections within regions. This was particularly the case in Greece, Ireland and parts of southern Italy. In addition, there were acute problems of congestion in major cities in the regions concerned, especially in Athens and Dublin but also in Lisbon, Thessaloniki and Naples.
The transport problems in the EU10 countries were even more pressing. Here the main deficiency was not so much gaps in the networks but the state of roads and railways. Journey times were typically much longer than they needed to be both because many roads and railways were in urgent need of repair after many years of neglect and because they were not designed for present-day traffic volumes. There were few dual carriageway roads and even fewer motorways. In Poland, for example, there were just 358 kms of motorway in 2000, only just over a third of those in Denmark, a country only one seventh its size in terms of both land area and population.
3.4.1 What were the policy objectives?
The deficiencies outlined above were reflected in the objectives of investment in transport as set out in the various Operational Programmes, especially in Objective 1 regions. The aim was essentially to alleviate problems as regards:
• the excessive use of roads for transporting goods and for individual travel
• congested major routes
• an inadequate rail network
• the poor quality of roads at regional and local level
• bottlenecks and missing links in transport networks especially between major national and European routes and local and regional networks
• a lack of intermodal transport links
• inadequate public transport, especially in urban areas.
This range of problems, which was common to many lagging regions, led to transport being the largest single policy area to which finance from the ERDF was allocated over the 2000-2006 period in Objective 1 regions. This was the case in the EU10 as well as in the EU15.
In general, ERDF support was used to further both national and regional transport strategies aimed at alleviating these problems, which were accorded differing levels of priority across the EU. In some cases, as in the EU10 countries, Greece or Portugal, the action taken regionally was determined nationally, in others, as in Spain or Italy, action was determined regionally but in line with national objectives. Overall, a reasonable degree of consistency was reported between regional and national policies.

Ex-post Evaluation of the ERDF 2000-2006 Synthesis Report
79
In Objective 1 regions in Spain, Greece and Ireland, the aim was primarily to build new roads and railway lines, to expand the network in order to establish efficient links between regions or centres of population and economic activity which did not exist before as well as to develop urban transport systems. Elsewhere, especially in the EU10 countries, the aim was mostly to upgrade and to improve existing roads and, to a much lesser extent, railway lines. This, in part, reflects the relatively short time which the EU10 countries had to plan and spend the finance they received, which inevitably limited the transport projects which could be undertaken, given their typically long duration. Because of the poor state of much of the road network, however, bringing this up to international standards was identified as a main priority in many of the countries and of key importance in furthering regional development.
3.4.2 What was the scale of funding?
Overall, some EUR 29.1 billion from the ERDF was allocated to transport in Objective 1 regions in EU15 countries over the 2000-2006 period, almost a third of the total amount of funding going to these regions (see Table 3.5). In addition, around EUR 1.5 billion went to Objective 2 regions, or only around 7% of the total amount of funding. This much smaller figure reflects the relatively small overall amount of funding available under Objective 2 combined with the fact that transport projects tend to involve large amounts of expenditure if they are to make an impact. It also, however, reflects the fact that in most Objective 2 regions, the transport system was already relatively efficient and was not, accordingly, a major constraint on development.
In the EU10 countries, some EUR 3.25 billion of the ERDF provided was allocated to transport once these countries became eligible for support, almost all of this going to Objective 1 regions. (Only around EUR 21 million went to transport in Praha under Objective 2 and just EUR 2 million in Cyprus, while in Bratislava, no funding was allocated to transport at all.)
Overall, therefore, some EUR 33.8 billion was allocated to transport from the ERDF over the programming period. Around half as much again was made available from the Cohesion Fund, a large proportion of this going to EU10 countries. To give an indication of the relative importance of funding from these two sources, the amounts involved can be compared with national funding for transport. Although the figures compiled in the evaluation relate to expenditure in the years 2000-2006 and, accordingly, do not cover spending in 2007 and 2008, which was significant as noted in Chapter 1, they should, nevertheless, be reasonably representative of the relative scale of the different sources.
In the EU15, the ERDF accounted for some 3% of the total investment on transport financed from public sources (i.e. most of it) over the period, while the Cohesion Fund was responsible for 1%, this mostly going on completing the trans-European transport network of major routes. The scale of funding in Objective 1 regions was, of course, considerably larger than this, since total investment covers all regions and not just the Objective 1 ones which at EU15 level undoubtedly accounted for only a minor part of overall investment. It is likely in fact that the ERDF alone was responsible for financing around 15% of investment in transport in Objective 1 regions in the EU15 over the period28.
28 This figure is based on the reasonable assumption that investment in transport funded from national sources over the period in the different regions was proportionate to GDP. Since the GDP of Objective 1 regions in the EU15 was around 18% of the total, this would imply a figure of 16% of investment being financed from the ERDF. A figure of 15% would, therefore, allow for investment in Objective 1 regions being slightly higher than in others.

Synthesis Report Ex-post Evaluation of the ERDF 2000-2006
80
Table 3.5 Public funding sources of investment in transport, 2000-2006
National Govt
ERDF Cohesion Fund
Total public
EIB National Govt
ERDF Cohesion Fund
EIB
BE 4,699 27 4,726 516 99.4 0.6 10.9 0.2402DK 8,271 3 8,274 1,705 100.0 0.0 20.6 0.61DE 147,326 2,953 150,279 4,080 98.0 2.0 2.7 0.98IE 15,335 1,096 294 16,725 681 91.7 6.6 1.8 4.1 1.71GR 6,583 4,185 1,490 12,258 4,286 53.7 34.1 12.2 35.0 1.02ES 83,968 9,523 4,814 98,305 15,403 85.4 9.7 4.9 15.7 1.77FR 109,481 774 110,254 5,934 99.3 0.7 5.4 0.98IT 134,071 2,652 136,722 7,638 98.1 1.9 5.6 1.46LU 1,024 2 1,026 386 99.8 0.2 37.6 0.55NL 74,155 96 74,251 624 99.9 0.1 0.8 2.21AT 13,894 3 13,897 871 100.0 0.0 6.3 0.87PT 4,903 2,592 1,635 9,130 5,987 53.7 28.4 17.9 65.6 0.94FI 15,422 23 15,445 410 99.9 0.1 2.7 1.49SE 13,304 63 13,367 1,277 99.5 0.5 9.6 0.68UK 158,182 416 158,599 4,259 99.7 0.3 2.7 1.30
EU15 790,618 24,408 8,233 823,258 54,057 96.0 3.0 1.0 6.6 1.21
CZ 9,371 95 546 10,012 2,039 93.6 0.9 5.5 20.4 3.63EE 414 20 213 647.6 8 63.9 3.1 32.9 1.2 2.08CY 1,073 - 25 1,098 84 97.7 2.3 7.7 2.95LV 439 56 353 848 52 51.8 6.6 41.6 6.1 2.30LT 727 82 126 935 75 77.8 8.8 13.5 8.0 1.62HU 63 145 724 976 1,516 6.5 14.9 74.2 155.3 0.41MT 229 4 9 243 94.2 1.6 3.7 0.0 1.86PL 11,046 539 2,694 14,279 2,389 77.4 3.8 18.9 16.7 2.17SI n.a. 4 122 n.a. 829 n.a. n.a. n.a. n.a.SK 3,036 100 381 3,523 275 86.2 2.8 10.8 7.8 3.30
EU10 26,398 1,041 5,071 32,562 7,267 81.1 3.2 15.6 22.3 2.24
EU25 817,016 25,449 13,304 855,819 61,324 95.5 3.0 1.6 7.2 1.23
Data for Greece for National Government expenditure is estimated (to be the same in relation to ERDF+Cohesion Fund as in Portugal)Source: Ex post Evaluation, Work Package 5a, Transport, Final Report, p.44
EUR million % Total
Total as % GDP
Note: Data up to the end of 2006. All data are in current price terms. Data for Belgium cover only one region. Data for Hungary and Lithuania relate only to the period from 2004
The ERDF was even more important in Greece and Portugal, in the former accounting for an estimated third of investment in transport over the period and in Portugal for around 28%. In both countries, the Cohesion Fund was also a significant source of finance, adding a further 12% in the former and 18% in the latter, so that together, EU funding was responsible for almost half of total investment between 2000 and 2006.
In Spain, where the ERDF provided the largest amount of finance for transport in absolute terms, it accounted for close to 10% of the overall investment funded from public sources and for around 20% of the investment in Objective 1 regions.

Ex-post Evaluation of the ERDF 2000-2006 Synthesis Report
81
In the other two countries where large-scale finance for transport was provided by the ERDF, it is estimated to have accounted for around 11-12% of investment in the Eastern Länder in Germany and around 9-10% of investment in the South of Italy29. Elsewhere, the ERDF was less important as a source of finance, though it was still responsible for almost 7% of total investment funded from public sources in Ireland over the period.
In all these countries, it should be noted that the contribution of the ERDF and the Cohesion Fund to transport investment was still less than loans from the European Investment Bank (EIB), which added just under 7% to overall funding and probably a much larger proportion to funding in Objective 1 regions.
The contribution of the ERDF and the Cohesion Fund helped to increase investment in transport to relatively high levels relative to GDP in both Spain and Ireland (to around 1.7-1.8% of GDP), more than in any other EU15 country apart from the Netherlands. EU funding added much more to investment in Greece and Portugal, though it still left overall spending on transport relative to GDP much less than in the UK or Finland and less than half that in the Netherlands.
In the EU10, investment in transport financed from public sources was almost twice as high in relation to GDP over the 2000-2006 period as in the EU15 (around 2.2% of GDP). It was particularly high in the Czech Republic and Slovakia, amounting to over 3% of GDP. In Hungary, on the other hand, investment in transport is estimated to have been lower than anywhere in the EU25 apart from Belgium, most of this coming from the Cohesion Fund.
The ERDF made a slightly smaller contribution to investment in transport in these countries than in the EU15. While it accounted for only just over 3% of total investment over the period, given the fact that it was operational only from May 2004, it was probably responsible for closer to 10% of the investment carried out from then until the end of 2006. The ERDF was particularly important in Latvia and Lithuania, as well as in Hungary, accounting for perhaps 15-20% of investment over the last two years of the period. It was also relatively important in Poland, accounting for perhaps close to 10% of investment over the latter period. In all three cases the Cohesion Fund added considerably to this.
The Cohesion Fund generally was much more important as a source of funding in EU10 countries, accounting for almost 16% of the total investment over the period 2000-2006 and probably over a third of the total carried out over the last two years of the period. Loans from the EIB, however, were again larger in scale than funding from the ERDF and the Cohesion Fund, adding around 22% to total public funding.
3.4.3 What was the funding spent on?
A large part of the finance from the ERDF allocated to transport over the programming period went on roads. In Objective 1 regions in the EU15, some 14% went on motorways and another 44% went on other roads, making almost 60% altogether (Table 3.6 – some 2% of expenditure was unclassified, much of it probably going on roads; it should be noted that the figures in the table relate to the total allocation of the ERDF to transport for the 2000-2006 programming period; the figures are, therefore, larger than in the previous table which relate to expenditure over the period 2000-2006 only).
29 These estimates as well as that for Spain are based on the same assumption as for the EU15 as a whole.
Synthesis Report Ex-post Evaluation of the ERDF 2000-2006
82
This is much larger than the share of funding going to rail, which because of environmental concerns was stressed as being important at the beginning of the period. Of the rest, 6% went on developing urban transport systems, 5% on ports, 3% on airports and 3% on intermodal links.
In Objective 2 regions in the EU15, a much smaller proportion of the ERDF than in Objective 1 regions went on roads (just 23% in total) and more went on modernising or expanding ports (18%) and intermodal links (16%), though the amounts involved were relatively small.
The share of the ERDF going to roads was especially large in the four Cohesion countries in the EU15, this amounting to almost 70% in Ireland, over 60% in Greece, most of it going on motorway construction, almost 60% in Spain and 54% in Portugal. The share going to investment in roads was even larger in Germany – over 75% - most of the investment occurring in Objective 1 regions.
In the other EU15 Member States, a smaller weight was given to roads, though except for Italy, the amounts involved were relatively small. In Italy, a slightly larger share of funding was devoted to investment in rail than roads (35% as against 31%). This was larger than in any other country, with only Spain and Austria of the other countries allocating over 30% of the ERDF to rail, though in the last, the amount involved was extremely small (only just over EUR 1 million).
Leaving aside Austria, of the other transport modes, the share of funding for transport going:
• to airports was less than 5% in all countries apart from Italy (8%) and the UK (5%);
• to ports, less than 10% in all apart from the UK (10%), France (23%) and the Netherlands (11% - where again the amount involved was very small);
• to urban transport, less than 10% in all except Ireland (31%), Portugal (16%0, the UK (20%) and the Netherlands (26%) and zero, or close to zero, in 8 of the 15 countries, including Spain and Germany;
• to intermodal links, less than 3% in all except Finland, Portugal, the UK, France, Italy and the Netherlands, and zero in 6 countries.
In the EU10 countries, the focus of funding on roads was equally marked and more general, though here improving the poor state of the road network had been accorded priority at the beginning of the programming period. Overall, some 52% of the ERDF was allocated to motorways or other roads - the latter, except in Poland – and only 16% to rail. In addition, 14% of funding went to urban transport and the same to waterways, but only very small shares to the other categories.
This overall division of funding, however, largely reflects the division in Poland, which accounted for around two-thirds of the total ERDF allocated to transport in the EU10 countries. In a number of the other countries, the division was very different, though in most, roads absorbed well over half of the funding going to transport and in all, it was by far the largest item.
Rail accounted for a significant share of funding only in the Czech Republic, Slovakia and Lithuania apart from in Poland.
Investment in ports was significant only in Estonia and Malta, and investment in urban transport only in the Czech Republic, Latvia and Lithuania, apart from in Poland. Other areas of investment were of minor importance in all countries, with the exception of waterways in Poland.

Ex-post Evaluation of the ERDF 2000-2006 Synthesis Report
83
Table 3.6 Division of ERDF allocated to transport by category of expenditure, 2000-2006 programming period
millionBE 2 3 0 0 0 1 2 0 92 46DK 0 0 0 0 0 0 0 0 100 4DE 20 60 16 0 1 0 0 1 1 3,513IE 0 69 0 0 0 31 0 0 0 1,134GR 24 19 43 2 5 5 0 1 1 6,736ES 31 56 2 3 5 1 1 0 0 10,307FR 5 32 1 4 23 2 11 2 21 1,078IT 35 22 9 8 9 8 7 0 2 3,810LU 0 0 0 0 0 0 0 0 100 2NL 6 14 0 0 11 26 14 31 0 46AT 33 0 0 32 32 0 2 0 0 4PT 5 54 0 0 2 16 15 1 6 3,229FI 0 43 0 0 0 0 22 0 35 31SE 0 0 0 0 0 0 0 0 100 75
UK 12 29 10 5 10 20 12 0 1 579EU15 23 43 13 3 5 6 3 1 2 30,594EU15 Obj 1 24 44 14 3 5 6 3 0 2 29,103
EU15 Obj 2 12 22 1 1 18 6 16 3 20 1,470
CZ 14 55 0 2 2 19 1 7 0 267EE 2 53 0 6 31 0 0 9 0 33CY 0 100 0 0 0 0 0 0 0 2LV 0 52 0 0 4 32 0 0 13 94LT 23 41 0 8 2 24 0 2 0 142HU 4 85 0 0 4 3 4 0 0 276MT 0 89 0 0 11 0 0 0 0 12PL 17 41 5 0 1 16 2 19 0 2,172
SI 0 0 0 0 0 0 0 0 100 8
SK 28 69 0 2 0 0 0 2 0 243EU10 16 49 3 1 2 14 2 14 1 3,250Obj 1 (€mn) 7487 14245 4205 884 1439 2113 923 562 495 32,353Obj 1 (%) 23 44 13 3 4 7 3 2 2Obj 2 (€mn) 183 350 12 14 263 90 240 42 296 1,491Obj 2 (%) 12 23 1 1 18 6 16 3 20Total (€mn) 7670 14594 4217 898 1702 2204 1163 604 791 33,844Total (%) 23 43 12 3 5 7 3 2 2Note: 'Other' includes waterways and intelligent transport systemsSource: Ex post Evaluation, Work Package 5a, Transport, Final Report, p.50
Air-ports
% of total ERDF allocated
Total EUR
PortsRail Urban Inter-modal
Other Unclas-sed
Motor-ways
Roads
3.4.4 What was the effect of ERDF support for transport?
The evidence compiled by the evaluation indicates that much of the investment in transport co-financed by the ERDF helped to alleviate some of the main problems in this area confronting

Synthesis Report Ex-post Evaluation of the ERDF 2000-2006
84
lagging regions in both the EU15 and the EU10, though to a lesser extent in the latter given the much shorter period involved30. The tangible outputs from the investment supported include:
• the co-financing of around 24% of the 8,509 kms of motorway, which were added to the EU transport network over the programming period, and of around 26% of the 7,734 kms constructed in the EU15;
• the co-financing of 1,512 kms of new motorway construction in Spain, or half of the total completed over the period;
• the co-financing of around 300 kms of motorway in Objective 1 regions in Germany;
• the co-financing of most of the Egnatia Odos motorway which extends for 680 kms from the port of Igoumenitsa in the west of Greece and the border with Turkey and which reduced travel time between the two by almost half (see Box);
• helping to begin the process of bringing the road network in EU10 countries up to international standards;
• the co-financing of 27% of new high-speed railway lines in Spain and 25% of those in Italy constructed over the period;
• the co-funding of the modernisation or upgrading of over 3,000 kms of standard railway line, or, more, specifically, of 20% of the rail network in Spain and Greece, 8% of the network in Portugal and 4% of that in Italy;
• the co-financing of the modernisation of 31 airports across the EU;
• the co-financing of 45 projects to improve or expand port facilities, 33 of them in Objective 1 regions.
Box – Egnatia Odos The Egnatia Odos project involved the construction of 680 kms of motorway between the port of Igoumenitsa in the west of Greece and the border with Turkey. This has served to reduce travel time between the two points from over 11 hours to just over 6 hours. In addition, it has taken traffic away from congested urban areas, so reducing pollution as well as travel times. The motorway has bought isolated regions such as Epirus and Western Macedonia closer to the rest of Macedonia and Thrace, linking 5 NUTS 2 regions, 10 cities, 332 towns and villages, 4 ports and 6 airports. The expectation is that it will boost trade and tourism in all the regions concerned, while helping to halt rural depopulation.
The result of these outputs was to improve links between regions, as well as between regional and local road networks and the main national routes, and to reduce journey times substantially in many cases. In Spain, for example, the new motorways constructed provided high-speed links between major centres across the country, especially in Andalucía and Galicia. Overall, time savings of 3.5 millions hours a year were reported by managing authorities. In Ireland, the
30 It should be noted that the initial intention was to include estimates by the Joint Research Centre in Seville of the impact of 107 major transport projects co-financed by the ERDF across the EU on the regions in which they took place on the basis of the changes in traffic resulting and the cost savings produced. This was to be done using the TRANSTOOLS model. However, on carrying out a preliminary analysis, it was concluded that TRANSTOOLS was not at present set up to undertake such an analysis, that while it could produce estimates of the overall network effects of transport projects it did not contain sufficient detail to estimate the impact on any particular region.

Ex-post Evaluation of the ERDF 2000-2006 Synthesis Report
85
completion of 5 major roads between Dublin and other main towns and cities in the country is estimated to have resulted in time savings of over 40%.
In Portugal as well as in Poland and Lithuania, the investment carried out is reported to have increased the capacity of the network and enabled speeds to be increased and journey times to be reduced.
In addition, and no less importantly, the ERDF helped to finance investment in urban transport systems in a number of large cities, again predominantly in lagging regions, so helping to relieve congestion and reduce traffic emissions as well as cutting journey times. The main examples are the Lisbon and Athens metros (see Box) and the LUAS light railway in Dublin.
Box – The Athens metro The construction of the Athens Metro, including the extensions co-financed by the ERDF over the 1000-2006 period, has served to reduce the number of car journeys in Athens by an estimated 120,000 a day. This has reduced congestion below what it otherwise would have been (cutting journey times by an average of 20 minutes) relieved pressure on car parking space in the city and cut traffic emissions (by an average of 25%).
The steady increase in car ownership, however, which continues to expand traffic, tends to conceal these gains. Nevertheless, as compared with what the situation would be without the metro, it has markedly improved the quality of life for those living in Athens. It has also added to tourist numbers, created, directly and indirectly, an estimated 600 permanent jobs and boosted the economic development of areas that were previously not accessible by public transport.
The co-financing of investment in regional airports in a number of Member States has helped to remove capacity constraints which limited traffic growth prior to the beginning of the programming period, as indicated by the case studies carried out as part of the evaluation. For example, in Merseyside, the expansion of John Lennon Airport, coupled with the construction of links with the surrounding areas, has led to an expansion of economic activity in the region. Even more so in Bari, the expansion has stimulated economic development by increasing the number of tourists visiting the region.
The case studies also highlighted the importance of intermodal links, of establishing good connections between ports and airports and the road and rail network. These include the Galicia study, which demonstrated the gains from creating a seamless transport system between ports in the region and the road network and removing a bottleneck which was hindering regional development. They also include the Haute-Normandie study which highlighted the use of ERDF financing to improve connections to the main port at Le Havre and the benefits to the regional economy which stemmed from this.
3.4.5 Issues raised by the evaluation
A number of issues emerged from the evaluation which have implications for future cohesion policy. First, it is evident that the main contribution of the ERDF over the period in respect of transport was to improve the road network As well as helping to construct new motorways, it also contributed to improving road links at regional and local level. It made less of a contribution to improving the rail network and despite the emphasis on bringing about a shift from road to rail at the beginning of the period, it achieved relatively little in this regard.
Moreover, most of the expenditure supported by the ERDF in the EU10 especially but also in the EU15 was on road improvements rather than on new construction. While, in many regions, this
Synthesis Report Ex-post Evaluation of the ERDF 2000-2006
86
was important to relieve congestion and to speed up journey times, in some cases, it was difficult to differentiate improvements, such as road widening, from maintenance in the data recorded.
In addition, a significant amount of funding in a number of regions went on improving local roads. Although these might have been in a poor state and the support provided might well have improved the quality of life for those living in the areas concerned, the projects undertaken were not always linked effectively into the planning of the wider regional and national network. Potential development opportunities were, therefore, lost as a result. This seems partly to be a consequence of funding spread across a large number of projects in order to distribute support across the region.
According to the evaluation, however, it is also a consequence of management and planning difficulties, stemming in part from a lack of expertise in the authorities concerned. These difficulties also contributed to the relative weight given to investment in roads as compared with rail and to the shift of funding from one to the other which occurred over the period.
The evidence from Italy and Spain as well as from Poland and in Lithuania is that it was usually easier to invest in road than in rail because of problems in implementing rail projects which included:
• a longer design, planning and approvals process than for roads projects, which made it difficult to complete the process within the programming period;
• the more complex nature of rail projects, because of the mix of different technologies – electrification, signalling, engineering and so on.
The length of time typically required for a large-scale transport projects had wider effects than just shifting funding from roads to rail. It also affected the quality of the projects undertaken and their capacity to alleviate transport problems in the most effective way. Since the construction of a new road or railways from planning to completion can take 10 years or more, this means that it tends to extend over more than one programming period. This can lead to authorities, in some cases, breaking up projects into smaller parts which can be completed within 7 years. In other cases, it can mean ERDF financing being used for smaller projects which are quicker to complete and easier to manage, though often less relevant in relation to the main transport problems.
The difficulties in this regard, compounded by the n+2 rule, led authorities in a number of countries, including Italy, to allocate ERDF financing during the period to what are termed “coherent” projects. These are projects which had already received funding from other sources and which in many cases had been completed. In other words, the ERDF was effectively used to cover expenditure which had already been carried out. While this could mean that national sources of finance were then used to undertake the projects for which the ERDF was initially intended, the evaluation was unable to find evidence of this occurring.
In addition, the case studies revealed that ongoing monitoring of programmes, particularly in terms of results, was limited. In some cases, such as in Andalucía, Galicia and Mazowieckie, this was due to the poor definition of the indicators to be monitored. In others, such in Attiki, Puglia and Lithuania, it was a result of a lack of sufficient effort being devoted to monitoring, reflecting the low importance attached to it by the authorities concerned.
Whatever the reasons for the relatively large allocation of funding to roads, the evaluation concluded that it led to the neglect of other areas, despite these being explicit aims at the start of the programming period. In particular, as indicated above, improvements in urban transport systems were confined to a small group of countries and even here the aim of reducing

Ex-post Evaluation of the ERDF 2000-2006 Synthesis Report
87
congestion was achieved only to a limited extent in the sense that they have not prevented a continuing growth in traffic.
Equally, at most only a relatively small amount of funding was devoted in most cases to improving intermodal links despite the common recognition of the environmental importance of those which take traffic and freight off of roads and onto rail, sea transport or waterways. Although examples of investment on such links emerged from the case studies – such as in Andalucía or Merseyside, in the form of Liverpool South Parkway railway station with improved links for bus and car users – the priority given to roads over the period tended to discourage investment in inter-modality.
Questions were also raised in the course of the evaluation about the case for allocating ERDF support to high-speed rail projects, which in some cases are of limited relevance for regional development, especially for intermediate points along the route where there are no stations. Moreover, it is argued that the reduction in journey time needs to be set against the high cost of construction as compared with investment in more standard railways. Equally account needs to be taken of the other sources of finance which might well be available, not least the Cohesion Fund and the TEN-T budget.
Similarly decisions to allocate funding to modernising regional airports need to give serious consideration to the question of whether they will lead to sufficiently larger numbers of passengers, who will in turn add to economic activity in the region, to justify the cost. They also have to consider whether there might be commercial as well as social returns which would attract private finance and obviate the need for public funding.
The same applies to the modernisation and expansion of ports, which tend to be competing in a commercial market for international freight and where the allocation of public funding might distort competition for no obvious social gain.
3.4.6 Concluding points
The evidence from the evaluation of the transport programmes undertaken in different countries and the case studies carried out is that ERDF funding of investment in transport made a major contribution to tackling the main problems identified at the beginning of the period. Nevertheless, many of the problems remain. In particular, it led at best to a minimal shift from road to rail in most regions, had a limited impact on urban congestion and established only a small number of intermodal links. These results together with other concerns identified by the evaluation raise a number of questions about the future funding of transport investment under cohesion policy:
• Given the growing concern with the environmental damage caused by road transport in particular, together with the substantial investment which the ERDF has co-financed over the past 20 years, should funding in future be provided for road construction or improvement in EU15 countries?
• Given the uncertain nature of the benefits for regional development stemming from investment in high-speed rail coupled with the alternative sources of funding available, should the ERDF be used to finance their construction in future?
• Given the expansion of airports in many regions across the EU and perhaps the limited scope for a significant net expansion of passenger numbers in future years, should funding any longer be allocated to their development, especially in the EU15?

Synthesis Report Ex-post Evaluation of the ERDF 2000-2006
88
• Given the commercial nature of the market in which ports compete and the profits which investment in them can often realise, is there any case for the ERDF being used to support their expansion or upgrading in future years?
In contrast to the questionmark over the use of the ERDF for these purposes, there is a strong case in terms of both economic and social gains as well as environmental considerations for greatly expanding the support given to investment in urban transport systems. The same applies to intermodal links, especially if they are designed to take traffic off roads.
3.5 UNIT COSTS OF MAJOR PROJECTS An issue examined in the evaluation, which is relevant for assessing the support provided to transport, was the unit costs of major construction projects co-financed by the ERDF. The aim was to compare these across different parts of the EU for similar types of project to gain not only an indication of the way that they varied but also an insight into the value for money they represented.
The investigation, which covered the construction of roads, railways, urban transport systems, infrastructure for water supply and treatment and energy supply, revealed, first, that major projects were prone to have a high incidence of delays in completion and of cost overruns. Some three-quarters of projects were subject to some delay, with the average time amounting to around 26% of the initially estimated period of completion. Just over half of the projects investigated exceeded their budget, with an average cost overrun of 21%.
These figures, however, are not unusual and are very much in line with the incidence and scale of delays and cost overruns of major projects funded from national sources across the EU or in other parts of the world. For the most part, they do not vary systematically between countries or different types of project. For the projects examined, however, some differences were evident:
• costs overruns were less of a problem in Germany then elsewhere and more of one in Poland (averaging 50% for the four projects investigated);
• delays were particularly lengthy in Portugal (averaging 85% of the initial estimates for the 5 projects covered);
• urban transport projects tended to be subject to larger cost overruns and delays than other types, average 45-50% in each case.
It is difficult to draw conclusions about efficiency from this evidence, since there are a wide range of potential reasons for both cost and time overruns, many of which are outside the control of contractors or contracting authorities. However, they clearly indicate the importance of building in sufficient allowance for contingencies and delays in the planning and budgeting of projects. This tended not to be done adequately for most of the projects investigated. Indeed, in most cases, there was a bias towards optimism which is typical for large-scale infrastructure projects.
The second point highlighted by the evaluation was that it is difficult to compare the unit costs of infrastructure projects across regions without a detailed breakdown of various features of the project and explicit consideration of the factors which affect costs. These include the terrain and other conditions which the project has to contend with, which can vary markedly and which can have a major effect on the cost of construction of roads or railways, Equally costs can vary significantly if projects differ in their features (a three-way motorway as opposed to a two-lane one, for example). A meaningful comparison of unit costs unavoidably entails having detailed data on the cost of the various elements involved in the construction process (in the case of

Ex-post Evaluation of the ERDF 2000-2006 Synthesis Report
89
motorways, not only bridges and tunnels as opposed to the carriageway itself but also different types of bridge and tunnel).
Such data, however, were not generally available from the authorities responsible for carrying out the projects in question, and the aggregate data which did exist did not enable meaningful comparisons of unit costs to be made31.
The third point to arise from the evaluation, therefore, is that there is a need for data on the unit costs of major projects to be available not only for making comparisons across the EU but also to provide a basis for judging value for money. In this regard, those responsible for the evaluation developed a prototype database with the information collected during the exercise and an indication of the other series which should be compiled once the data become available.
This database could not only serve as a basis for future evaluations but could also provide a set of benchmarks against which to assess the unit costs of constructing projects that are carried out or planned. As such, it could facilitate statistical analysis and make it possible to apply ‘reference class forecasting’ methods to assess planned projects (i.e. by providing the cost information required to compare these with completed projects with similar features). It, therefore, represents a potentially valuable output of the present evaluation and one which could potentially be put in place before the present programming period comes to an end.
A final point to emerge forcibly is the impossibility of comparing the unit costs of enterprise support projects in any meaningful way. This is not only because the projects concerned vary markedly in nature – a venture capital fund as against a non-repayable grant to a firm to encourage innovation or the adoption of environmentally-friendly methods of production. It is also more fundamentally because it is not possible to define a unit in many cases, still less a common unit the cost of which can be measured. While the number of jobs created or maintained has been used in the past for this purpose, estimates of this typically do not distinguish net job creation, or net jobs saved, which are the relevant concepts, from the gross figures. They, therefore, tend not to give meaningful indications of the overall effect on employment in the region concerned. More importantly, the purpose of many projects – encouraging innovation, for example – is not to create or maintain jobs, at least directly, but to strengthen competitiveness or export performance. Although employment might be increased in the long-term in the region concerned, the direct short-term effect on jobs in the firms supported is not a relevant indicator of the success or failure of such projects.
3.6 SUPPORT FOR THE ENVIRONMENT
3.6.1 What were the objectives of policy?
The increasing concern with environmental issues at EU level led to the Cohesion Fund, set up at the end of 1993, being specifically directed to financing the construction of environmental infrastructure, one of only two areas of investment in which the Fund could be used, the other being transport. It also led to the need to take account of the environmental implications of the projects supported by the Structural Funds being included as a horizontal requirement in the 2000-2006 programming period. In addition, the finance provided by the ERDF for this period
31 It should be noted that the collection and provision of unit cost data was not a requirement for managing authorities for the 2000-2006 programming period.

Synthesis Report Ex-post Evaluation of the ERDF 2000-2006
90
was equally used to support projects directly aimed at protecting the environment or cleaning it up.
The projects in question mainly covered two broad policy areas. The first was environmental infrastructure, where, along with the Cohesion Fund, the aim was to prevent pollution from occurring and improving living conditions in the areas concerned. The second was planning and rehabilitation, intended largely to clean up areas which had already become polluted.
The first, again like the Cohesion Fund, was very much concentrated on water supply and the treatment of wastewater, to increase the number of people with access both to clean drinking water and to main drainage systems, as well as, in the latter case, to sewage plants for treating the wastewater collected though these systems. Methods for improving the disposal of other kinds of waste were also included but, in practice, were given less priority. The second policy area covered measures to renovate rundown urban areas, to clean up old polluted industrial sites and to protect and improve the natural environment.
The first policy area was a particular focus in less developed regions receiving Objective 1 funding in both EU15 and EU10 countries, where water supply and main drainage systems together with the treatment of wastewater did not cover the whole country, especially rural areas. The second was an area to which funding was directed right across the EU, but most especially in Objective 2 regions and Objective 1 regions in the non Cohesion countries (i.e. those in the North rather than the South of the EU15). In addition, in these two areas of intervention, two other policy areas were important in a few Member States, namely, support for environmentally-friendly technology in firms, especially in SMEs, and for the development of renewable energy supplies.
While the immediate aim of policy was to further the protection of the environment and to make the areas where projects were carried out more attractive places to live and work, the rationale for directing funding to these ends was expressed very much in terms of its importance for economic development. According to the cohesion policy guidelines, therefore:
‘environmental infrastructure needs to be constructed or upgraded, especially in the less developed regions, not least because high quality environmental infrastructure constitutes an important factor for regional socio-economic development’
This assertion, however, was not expanded on.
In practice, the funding of environmental infrastructure was motivated to a large extent by a desire to assist Member States to comply with EU Directives relating to the need to ensure universal access to clean drinking water and connection to main drainage and wastewater treatment systems as well as to the effective management of waste. The ERDF was, therefore, used to supplement the Cohesion Fund for this purpose.
How far this represented an effective deployment of the Fund in the regions concerned at this particular stage of their development remains an open question. Although the sustainability of development over the long-term depends, almost by definition, on ensuring that it does not cause significant damage to the environment or the depletion of scarce resources, there is little or no empirical evidence that investment in infrastructure of the kind undertaken contributes to a major extent to economic development.
Nevertheless, there are arguments for using cohesion policy funding in this way. While there may be no empirical evidence of a direct link between investment in environmental protection and economic development, the lack of clean water or effective wastewater treatment systems or the presence of polluted or rundown areas, is almost certainly a deterrent to business location in the

Ex-post Evaluation of the ERDF 2000-2006 Synthesis Report
91
region or to people moving in. As such, helping to reduce disparities in infrastructure endowment of this kind across regions is a way of evening up the conditions in which businesses operate in different parts of the EU, of enabling them to compete on a more equal footing, if only in terms of being able to attract or retain workers. It also, of course, helps to even up living conditions and the quality of life at the same time.
The same arguments apply to the importance of reducing disparities between areas within regions in order to ensure balanced development – or, more accurately, to establish the conditions for balanced development, whether this is aimed at encouraging the growth of economic activity outside the main agglomerations or at increasing the attractiveness of other areas as places to live. Support for investment in clean water supply and in connecting households to main drainage systems is particularly significant in this respect since problems of access to these facilities primarily existed in rural areas rather than in the larger towns or cities.
The various arguments for directing the ERDF to protecting and improving the environment are reflected in the policy documents produced by Member States at the beginning of the programming period, setting out the plans for spending the funding received in the regions eligible for support. Among the regions selected as case studies in the evaluation, specific reference was made to:
• the importance of environmental infrastructure as a means of improving the attractiveness of a region so helping to retain or attract well-educated and skilled workers;
• the environment as a factor strengthening the competitiveness of firms;
• the preservation of natural resources as being crucial for the development of tourism;
• the need to respond to the growing pressure from the spread of urbanisation and economic activity on natural resources in rural areas if development was to be sustained.
The aim of improving territorial balance, specifically between urban areas and rural areas lagging behind and losing population, was an explicit focus of policy in four of the case study regions (Midi-Pyrénées, South Finland, Kentriki Makedonia and Podkarpackie). This was also a stated aim in Norte in Portugal, though here much of the funding was concentrated in the more populated areas, which was also the case in Valencia in Spain, where population in such areas was growing rapidly.
At the same time, there was explicit recognition of the need to comply with EU Directives on water and waste disposal in some cases (Kentriki Makedonia, Slovakia and Latvia).
3.6.2 The scale and source of funding
The scale of investment in environmental infrastructure relative to GDP over the period 2000-2006 varied between Member States, to some extent inversely with their GDP per head. It was larger, therefore, in the EU10 countries (where it averaged just over 0.8% of GDP) than in the EU15 (0.3%), while it was also larger in the four Cohesion countries (0.6% of GDP) than in the rest of the EU15 (just under 0.3%) (Table 3.7).
The relatively scale of the different sources also varied markedly, with the national government being much more important in some countries, such as France, the Netherlands or Belgium, than others, Austria and the Nordic counties in particular, where the private sector accounted for most of the funding. In the EU15 Member States, the ERDF was most important in the Cohesion

Synthesis Report Ex-post Evaluation of the ERDF 2000-2006
92
countries (accounting for 13% of funding on average as against under 3% in the remaining countries), especially in Greece, Spain and Portugal, which, of course, also received funding from the Cohesion Fund. This provided around 23% of finance for expenditure on average in the four countries concerned, so that these two EU sources together accounted for 35-36% of the total funding over the period. In addition, loans from the European Investment Bank (EIB) added another 4% on average to this, though this mostly went to Portugal. (The EBRD did not provide any loans to EU15 countries.)
Table 3.7 Expenditure on environmental infrastructure, 2000-2006
Total Nat govt ERDF ISPA Cohesn Fund EBRD+EIB Industry TotalEUR bn % GDP
BE 6.41 54.2 0.3 17.5 28.0 0.33DK 3.79 16.3 0.2 5.4 78.1 0.28DE 46.64 42.5 3.2 4.3 50.0 0.31IE 3.51 55.6 6.1 8.3 1.7 28.3 0.36EL 5.76 37.7 15.7 27.2 0.0 19.5 0.48ES 30.53 39.9 14.0 23.9 2.8 19.3 0.55FR 29.24 71.3 2.2 2.1 24.4 0.26IT 32.63 50.9 5.5 0.7 42.9 0.35LU 0.74 53.8 0.6 17.5 28.0 0.40NL 8.29 55.4 0.1 11.7 32.9 0.25AT 2.57 8.4 3.0 10.8 77.7 0.16PT 7.89 35.9 10.4 21.2 13.0 19.5 0.81FI 1.67 17.3 1.6 3.0 78.1 0.09SE 2.98 12.1 0.2 3.7 84.0 0.29UK 21.51 39.0 0.7 15.7 44.6 0.18
EU15 204.16 46.4 5.1 5.3 5.4 37.8 0.30CC4* 47.69 40.1 13.0 22.7 4.1 20.0 0.55EU11* 156.47 48.3 2.7 5.8 43.2 0.26
CZ 6.04 46.9 1.5 4.3 9.6 11.2 26.5 1.02EE 0.61 12.8 0.5 16.0 35.5 13.2 21.9 0.96CY 0.35 21.4 0.0 0.0 0.0 54.8 23.8 0.42LV 0.69 16.5 4.3 16.9 50.8 2.6 8.9 0.89LT 0.91 19.6 0.7 14.0 42.5 4.5 18.6 0.75HU 4.62 41.9 1.3 7.0 15.9 8.4 25.5 0.89PL 12.48 29.6 2.4 10.4 22.2 2.6 32.7 0.82SI 0.98 7.0 0.8 4.7 13.2 2.6 71.6 0.54SK 2.06 12.2 3.3 7.4 18.6 2.1 56.4 0.95
EU10 28.74 32.1 2.0 8.4 19.3 6.2 31.9 0.84EU25 232.90 44.7 4.7 1.0 7.0 5.5 37.0 0.33
* CC4 = the four EU15 Cohesion countries, Greece, Spain, Ireland and PortugalEU11 = the other 11 EU15 Member States.Source: Ex post evaluation, WP5b, Environment and Climate change, Final Report, p.21
Note: Data are taken from the Final Report of WP5b though they differ from those included there because instead of assuming that missing figures are zero (which they are known not to be), they have been estimated from the data for similar countries. These estimates are shown in italics. While the data for these countries are uncertain, they are likely to be closer to the actual ones than those ishown in the report.
% Total expenditure on environmental infrastructure

Ex-post Evaluation of the ERDF 2000-2006 Synthesis Report
93
In the EU10 countries, EU sources of finance for environmental infrastructure were slightly less important than in the four EU15 Cohesion countries over the period and national government sources, on average, slightly more important. This is largely because the ERDF only began to provide support from mid-2004. Up to then, funding was provided by ISPA, though in most cases on a smaller scale. It, nevertheless, accounted for around 14-17% of the total over the period 2000-2006. Over the period when the countries were eligible for ERDF support, this provided an estimated 5% or so of total finance for expenditure. The Cohesion Fund was a far larger source of finance from mid-2004 on, accounting perhaps for close to half of total support over this period and around 80-90% in the three Baltic States.
3.6.3 The division of funding between areas of intervention
Overall, expenditure on environmental protection and improvement accounted for around 20% of the support provided by the ERDF in Objective 1 regions in the EU15 over the programming period, the proportion varying from 37% in Flevoland in the Netherlands to only around 3% in the Finnish regions and just 1% in the Swedish ones (Table 3.8). These figures, which relate to expenditure as at the end of 2008, were slightly lower than initially planned in most countries, especially in Spain where the proportion was some 5 percentage points less than that initially allocated.
As indicated above, most of the support from the ERDF on environmental protection and improvement in Objective 1 regions in the EU15 over the period went on infrastructure to ensure increased access to clean drinking water, the treatment of wastewater and the management of other kinds of waste, on the one hand, and the rehabilitation of polluted or rundown areas, on the other hand. The former accounted, on average, for 48% of total environmental expenditure financed by the ERDF, the latter for around 44% if the restoration of historical buildings, monuments and other parts of the cultural heritage is included.
This division of expenditure varied markedly across countries. There was an especially high concentration of spending on infrastructure investment from the ERDF in Ireland, where all of the funding for the environment went on extending access to clean drinking water and the disposal of waste and waste water. In addition, in the Spanish and French Objective 1 regions – mostly those overseas in the French case – support for infrastructure accounted for 62-63% of ERDF financing. By contrast, there was more of a concentration of funding on cleaning up polluted areas in Portugal, where with the restoration of the cultural heritage, this also absorbed around 62% of total funding, and Greece, where the figure was around 55%, most of it going on restoring and maintaining the cultural heritage. Nevertheless, it was still the case that over 30% of the ERDF went to supporting infrastructure investment in both countries. There was even more concentration of funding in these broad areas in the Objective 1 regions in the UK and the single Objective 1 regions in Belgium and the Netherlands, the proportion rising to 86% in the last.
In Objective 1 regions in the EU10 countries, just over 18% of the ERDF received went on environmental projects on average, in this case the proportion varying from 45% in Malta to only 8% in Estonia, with only the Czech Republic and Slovakia having a proportion above 20% (see Table 3.9). In these countries, the share of funding going to environmental expenditure was broadly in line with what was initially planned, with only Malta (where the share of spending in this area fell short of plans by around 2.5 percentage points) and Slovakia (where spending exceeded plans by a similar amount) being exceptions.
Synthesis Report Ex-post Evaluation of the ERDF 2000-2006
94
The division of funding between different types of project varied just as much if not more than in the EU15. Overall some 36% of the ERDF directed to the environment went on infrastructure projects to extend access to clean drinking water and on waste and wastewater disposal and treatment, around 31% went on cleaning up polluted areas and maintaining the cultural heritage, while the rest was spread across other areas, such as developing renewable energy sources and combating air pollution.
Infrastructure investment accounted for a particularly large proportion of environmental expenditure in Slovakia (64%), Latvia (60%) and to a lesser extent in Malta (54%), while the cleaning up of polluted areas was more important in Hungary (absorbing 55% of the ERDF going to environmental projects), Slovenia (50%) and Estonia (48%). In both Latvia and Lithuania, in stark contrast to the other countries, 40% or more of the ERDF in this area went to projects for improving energy efficiency.
In Objective 2 regions in the EU15, 22% of the ERDF support provided went, on average, to environmental projects (Table 3.10). The proportion varied from 52% in Luxembourg and 31-32% in Italy and the Netherlands (where Objective 1 spending in this area was equally relatively high) to only around 9% in Sweden (where Objective 1 spending in this area was also relatively low) and 7% in Denmark.
In contrast to Objective 1 regions, relatively little of the ERDF going to this broad area went on supporting investment in environmental infrastructure (only around 20% of the total), reflecting the generally more developed nature of the regions assisted, though in Spain, a relatively large proportion of funding went on such support (43%). Most of the funding in most countries (around two-thirds overall) went on cleaning up polluted areas and maintaining the cultural heritage, though the last was important only in Spain and Italy. In the Netherlands and the UK, over 90% of the expenditure funded by the ERDF on environmental projects, was directed to this area together with preserving the natural landscape, while in Belgium, Germany, Luxembourg and Sweden, it was over 75%.
In Austria and Finland, on the other hand, a significant proportion of funding (52% and 44%, respectively) went on supporting the adoption of environmentally-friendly technology by SMEs. These were the only two countries in which this was the case and where, accordingly, where the ERDF was used for potentially commercial purposes, to the extent that such technology could offer the firms concerned a competitive edge (see below), as well as, of course, reducing the pollution or emissions they caused (and therefore, the social costs of their operations).
In the three EU10 regions receiving funding under Objective 2, a relatively large proportion of this went on environmental projects in both Praha and Bratislava (43% in the former, some 3 percentage points less than initially planned, and 35% in the latter, 4 percentage points more than planned). In both, all, or nearly all, of the funding went to cleaning up polluted or rundown areas, predominantly parts of the two cities. In Cyprus, on the other hand, relatively little funding was allocated to environmental projects (11%), most of it to supporting the adoption of environmentally-friendly technology in SMEs (70%).

Ex-p
ost E
valu
atio
n of
the
ERD
F 20
00-2
006
Sy
nthe
sis
Repo
rt
95
Tabl
e 3.
8 Ex
pend
iture
on
the
envi
ronm
ent f
inan
ced
by th
e ER
DF
by fi
eld
of in
terv
entio
n in
Obj
ectiv
e 1
regi
ons
in th
e EU
15, 2
000-
2006
% En
viro
nmen
tal e
xpen
ditu
re fi
nanc
ed b
y ER
DFBE
DE
IEEL
ESFR
ITN
LAT
PTFI
SEUK
EU15
Mai
ntai
ning
woo
dlan
ds
0.0
0.0
0.0
0.0
0.0
0.0
0.0
0.0
0.0
0.0
0.0
0.0
0.0
0.0
Pres
ervi
ng la
ndsc
ape,
fore
sts
0.0
0.0
0.0
0.0
0.0
0.2
3.0
3.7
0.0
0.2
0.0
0.0
0.3
0.6
Envi
ron-
frie
ndly
tech
(lar
ge fi
rms)
0.0
0.0
0.0
3.8
0.0
0.4
1.7
0.4
0.0
2.7
0.0
0.0
3.4
1.5
Envi
ron-
frie
ndly
tech
nolo
gy (S
MEs
)0.
09.
00.
05.
20.
30.
55.
26.
613
.11.
90.
00.
09.
34.
0Re
new
able
ene
rgy
sour
ces
4.2
0.6
0.0
0.3
0.8
2.7
1.8
0.4
51.2
1.2
50.0
0.0
2.0
1.1
Ener
gy e
ffic
ienc
y6.
30.
04.
11.
40.
60.
80.
62.
40.
00.
00.
00.
02.
30.
7En
viro
nmen
tal i
nfra
stru
ctur
e0.
04.
40.
00.
121
.711
.63.
00.
00.
02.
70.
048
.90.
07.
8Ai
r0.
00.
70.
00.
40.
20.
12.
10.
00.
00.
30.
00.
00.
00.
7N
oise
0.0
0.0
0.0
0.1
0.0
0.0
0.2
0.0
0.0
0.3
0.0
0.0
0.0
0.1
Urba
n an
d in
dust
rial w
aste
6.8
7.0
32.3
11.8
3.0
10.1
7.8
0.4
0.0
1.9
0.0
0.0
1.7
6.2
Drin
king
wat
er (i
ncl.
dist
rib)
9.2
7.4
27.3
10.6
17.3
31.6
15.9
0.0
35.7
9.9
0.0
0.0
9.8
13.5
Sew
erag
e an
d pu
rific
atio
n8.
234
.136
.211
.820
.010
.422
.90.
40.
016
.750
.00.
05.
820
.3Pl
anni
ng a
nd r
ehab
ilita
tion
0.0
0.0
0.0
0.2
0.2
3.1
0.1
0.0
0.0
3.8
0.0
51.1
5.1
1.0
Reha
bilit
atio
n of
indu
stria
l site
s 65
.312
.70.
02.
00.
62.
61.
311
.80.
05.
70.
00.
040
.45.
6Re
habi
litat
ion
of u
rban
are
as0.
022
.80.
016
.36.
123
.514
.874
.00.
034
.40.
00.
019
.917
.3Pr
otec
ting,
impr
ovin
g na
tura
l env
iron
0.0
0.7
0.0
3.6
23.6
1.9
8.9
0.0
0.0
12.9
0.0
0.0
0.0
10.5
Mai
ntai
ning
, res
torin
g cu
lturl
herit
age
0.0
0.6
0.0
32.4
5.6
0.7
10.5
0.0
0.0
5.4
0.0
0.0
0.0
9.2
Tota
l env
ironm
ent a
s %
Tota
l exp
end
11.2
23.0
11.2
17.5
19.1
24.2
21.3
36.7
6.4
20.9
3.5
1.3
19.6
19.8
Note
: Exp
endi
ture
as
at e
nd-2
008
Sour
ce: E
stim
ates
bas
ed o
n DG
Reg
io d
ata
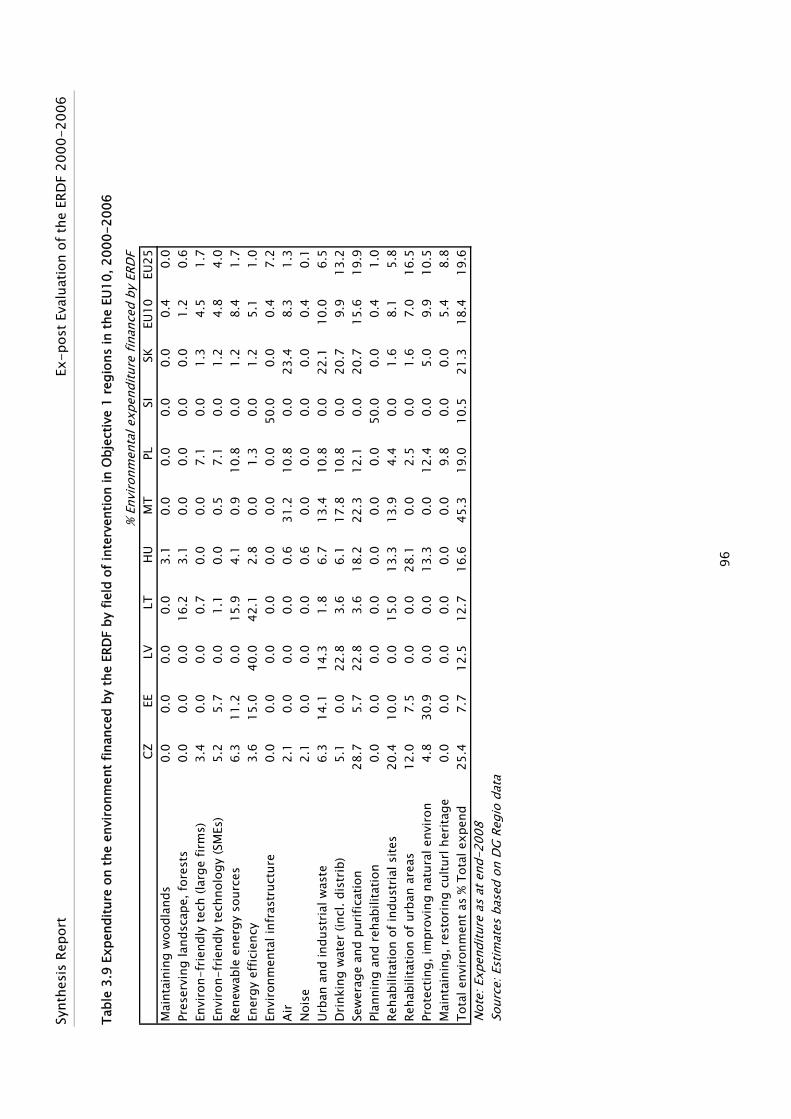
Synt
hesi
s Re
port
Ex-p
ost E
valu
atio
n of
the
ERD
F 20
00-2
006
96
Tabl
e 3.
9 Ex
pend
iture
on
the
envi
ronm
ent f
inan
ced
by th
e ER
DF
by fi
eld
of in
terv
entio
n in
Obj
ectiv
e 1
regi
ons
in th
e EU
10, 2
000-
2006
% En
viro
nmen
tal e
xpen
ditu
re fi
nanc
ed b
y ER
DFCZ
EELV
LTH
UM
TPL
SISK
EU10
EU25
Mai
ntai
ning
woo
dlan
ds
0.0
0.0
0.0
0.0
3.1
0.0
0.0
0.0
0.0
0.4
0.0
Pres
ervi
ng la
ndsc
ape,
fore
sts
0.0
0.0
0.0
16.2
3.1
0.0
0.0
0.0
0.0
1.2
0.6
Envi
ron-
frie
ndly
tech
(lar
ge fi
rms)
3.4
0.0
0.0
0.7
0.0
0.0
7.1
0.0
1.3
4.5
1.7
Envi
ron-
frie
ndly
tech
nolo
gy (S
MEs
)5.
25.
70.
01.
10.
00.
57.
10.
01.
24.
84.
0Re
new
able
ene
rgy
sour
ces
6.3
11.2
0.0
15.9
4.1
0.9
10.8
0.0
1.2
8.4
1.7
Ener
gy e
ffic
ienc
y3.
615
.040
.042
.12.
80.
01.
30.
01.
25.
11.
0En
viro
nmen
tal i
nfra
stru
ctur
e0.
00.
00.
00.
00.
00.
00.
050
.00.
00.
47.
2Ai
r2.
10.
00.
00.
00.
631
.210
.80.
023
.48.
31.
3N
oise
2.1
0.0
0.0
0.0
0.6
0.0
0.0
0.0
0.0
0.4
0.1
Urba
n an
d in
dust
rial w
aste
6.3
14.1
14.3
1.8
6.7
13.4
10.8
0.0
22.1
10.0
6.5
Drin
king
wat
er (i
ncl.
dist
rib)
5.1
0.0
22.8
3.6
6.1
17.8
10.8
0.0
20.7
9.9
13.2
Sew
erag
e an
d pu
rific
atio
n28
.75.
722
.83.
618
.222
.312
.10.
020
.715
.619
.9Pl
anni
ng a
nd r
ehab
ilita
tion
0.0
0.0
0.0
0.0
0.0
0.0
0.0
50.0
0.0
0.4
1.0
Reha
bilit
atio
n of
indu
stria
l site
s 20
.410
.00.
015
.013
.313
.94.
40.
01.
68.
15.
8Re
habi
litat
ion
of u
rban
are
as12
.07.
50.
00.
028
.10.
02.
50.
01.
67.
016
.5Pr
otec
ting,
impr
ovin
g na
tura
l env
iron
4.8
30.9
0.0
0.0
13.3
0.0
12.4
0.0
5.0
9.9
10.5
Mai
ntai
ning
, res
torin
g cu
lturl
herit
age
0.0
0.0
0.0
0.0
0.0
0.0
9.8
0.0
0.0
5.4
8.8
Tota
l env
ironm
ent a
s %
Tota
l exp
end
25.4
7.7
12.5
12.7
16.6
45.3
19.0
10.5
21.3
18.4
19.6
Note
: Exp
endi
ture
as
at e
nd-2
008
Sour
ce: E
stim
ates
bas
ed o
n DG
Reg
io d
ata
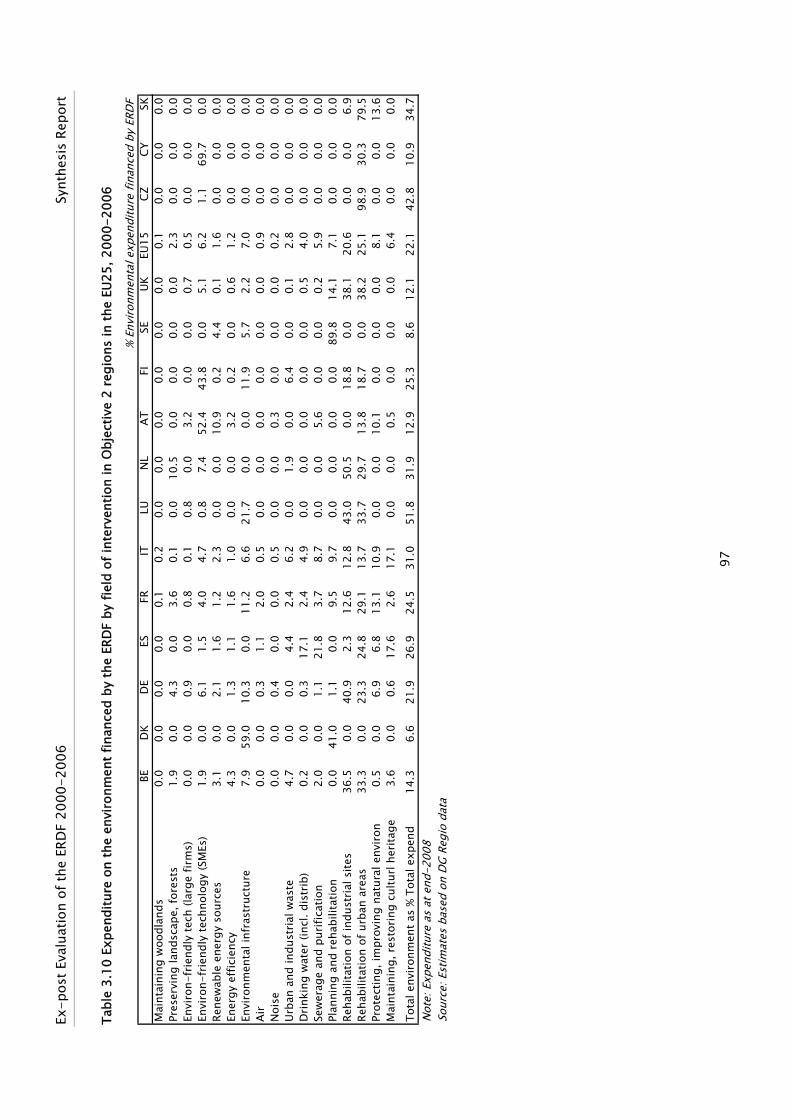
Ex-p
ost E
valu
atio
n of
the
ERD
F 20
00-2
006
Sy
nthe
sis
Repo
rt
97
Tabl
e 3.
10 E
xpen
ditu
re o
n th
e en
viro
nmen
t fin
ance
d by
the
ERD
F by
fiel
d of
inte
rven
tion
in O
bjec
tive
2 re
gion
s in
the
EU25
, 200
0-20
06
% En
viro
nmen
tal e
xpen
ditu
re fi
nanc
ed b
y ER
DFBE
DK
DE
ESFR
ITLU
NL
ATFI
SEUK
EU15
CZCY
SKM
aint
aini
ng w
oodl
ands
0.
00.
00.
00.
00.
10.
20.
00.
00.
00.
00.
00.
00.
10.
00.
00.
0Pr
eser
ving
land
scap
e, fo
rest
s1.
90.
04.
30.
03.
60.
10.
010
.50.
00.
00.
00.
02.
30.
00.
00.
0En
viro
n-fr
iend
ly te
ch (l
arge
firm
s)0.
00.
00.
90.
00.
80.
10.
80.
03.
20.
00.
00.
70.
50.
00.
00.
0En
viro
n-fr
iend
ly te
chno
logy
(SM
Es)
1.9
0.0
6.1
1.5
4.0
4.7
0.8
7.4
52.4
43.8
0.0
5.1
6.2
1.1
69.7
0.0
Rene
wab
le e
nerg
y so
urce
s3.
10.
02.
11.
61.
22.
30.
00.
010
.90.
24.
40.
11.
60.
00.
00.
0En
ergy
eff
icie
ncy
4.3
0.0
1.3
1.1
1.6
1.0
0.0
0.0
3.2
0.2
0.0
0.6
1.2
0.0
0.0
0.0
Envi
ronm
enta
l inf
rast
ruct
ure
7.9
59.0
10.3
0.0
11.2
6.6
21.7
0.0
0.0
11.9
5.7
2.2
7.0
0.0
0.0
0.0
Air
0.0
0.0
0.3
1.1
2.0
0.5
0.0
0.0
0.0
0.0
0.0
0.0
0.9
0.0
0.0
0.0
Noi
se0.
00.
00.
40.
00.
00.
50.
00.
00.
30.
00.
00.
00.
20.
00.
00.
0Ur
ban
and
indu
stria
l was
te4.
70.
00.
04.
42.
46.
20.
01.
90.
06.
40.
00.
12.
80.
00.
00.
0D
rinki
ng w
ater
(inc
l. di
strib
)0.
20.
00.
317
.12.
44.
90.
00.
00.
00.
00.
00.
54.
00.
00.
00.
0Se
wer
age
and
purif
icat
ion
2.0
0.0
1.1
21.8
3.7
8.7
0.0
0.0
5.6
0.0
0.0
0.2
5.9
0.0
0.0
0.0
Plan
ning
and
reh
abili
tatio
n0.
041
.01.
10.
09.
59.
70.
00.
00.
00.
089
.814
.17.
10.
00.
00.
0Re
habi
litat
ion
of in
dust
rial s
ites
36.5
0.0
40.9
2.3
12.6
12.8
43.0
50.5
0.0
18.8
0.0
38.1
20.6
0.0
0.0
6.9
Reha
bilit
atio
n of
urb
an a
reas
33.3
0.0
23.3
24.8
29.1
13.7
33.7
29.7
13.8
18.7
0.0
38.2
25.1
98.9
30.3
79.5
Prot
ectin
g, im
prov
ing
natu
ral e
nviro
n0.
50.
06.
96.
813
.110
.90.
00.
010
.10.
00.
00.
08.
10.
00.
013
.6M
aint
aini
ng, r
esto
ring
cultu
rl he
ritag
e3.
60.
00.
617
.62.
617
.10.
00.
00.
50.
00.
00.
06.
40.
00.
00.
0To
tal e
nviro
nmen
t as
% To
tal e
xpen
d14
.36.
621
.926
.924
.531
.051
.831
.912
.925
.38.
612
.122
.142
.810
.934
.7No
te: E
xpen
ditu
re a
s at
end
-200
8So
urce
: Est
imat
es b
ased
on
DG R
egio
dat
a
Synthesis Report Ex-post Evaluation of the ERDF 2000-2006
98
3.6.4 The effects of ERDF intervention
The main tangible result of the funding provided under cohesion policy over the period as regards the environment was to increase the number of households connected to main drainage and wastewater treatment systems as well as to clean drinking water. This was in Objective 1 regions in particular, though also in a number of Objective 2 regions in Spain and Italy. Accordingly, the funding helped the Member States concerned move closer to compliance with the EU Directives. One effect of this was to take the pressure off underground aquifers in a number of regions, so contributing to the preservation of water reserves and, accordingly, increasing the sustainability of economic development. A further effect was to improve the quality of life in the areas concerned. Since these are predominantly rural areas, this helped to further territorial cohesion by evening up living conditions in urban and rural areas, so potentially contributing to more balanced development of the two and perhaps slowing down, or even halting, the flow of population from the former to the latter.
How much of this was a result of ERDF intervention as opposed to support from the Cohesion Fund, however, is hard to tell since the two helped to finance projects in the same area, though according to the case studies, the two worked in reasonable harmony and tended to complement each other. In Portugal, for example, the Cohesion Fund was mainly used to finance ‘upstream’ facilities, the ERDF, ‘downstream’ ones, the connection to final consumers in particular.
Whatever the division of responsibility between the two, an additional 14 million people were connected to mains water supply over the period, almost all of them in Objective 1 regions. The largest effect was in Spain, where as noted above a significant amount of the ERDF was deployed for this purpose, with some 10.8 million people being connected. In Ireland, an additional 770,000 were connected, and on a smaller, though still significant, scale, in Kentriki Makedonia, some 8% of the population were connected between 2004 and 2008, bringing those connected to 95% of the total in the region. In Valencia, where a major aim was to relieve pressure on aquifers by reducing reliance on wells, water reserves were expanded though the construction of desalination plants, while some 405 kms of pipeline were completed to distribute water to final consumers. In addition, wastewater treatment plants were constructed to supply water to agriculture and irrigation channels were modernised to reduce leakages and improve the efficiency of the process.
The number of additional people connected to main drainage over the period across the EU was even larger: an estimated 20.5 million, again predominantly in Objective 1 regions, most of them in Spain (7.2 million) and Italy (7.4 million), though significant numbers as well in Ireland (almost 3 million, so increasing the proportion of the population covered from 25% to 90%), Germany (1.2 million) and Portugal (770,000). In the Norte region alone, the proportion of the population connected increased from 58% in 2000 to 78% in 2007, while the proportion covered by wastewater treatment plants rose from 43% to 58% between these two years. In Kentriki Makedonia, the proportion connected to such plants increased from 52% to 60% (though this was still short of the government target of 75%). At the same time, the effect of this was to remove sewage from highly polluted areas around the coast, especially in or close to large towns and cities. In addition, in the Podkarpackie region of Poland, the proportion of people connected to main drainage in rural areas rose from 23% in 2003 to 31% in 2007, the ERDF being responsible for around 50% of the investment involved.
In general, it is difficult to assess the effect of this investment on pollution, the quality of water in rivers and lakes or public health, since for the most part the data do not exist and if they did, it is hard to draw a direct link between the projects undertaken and improvements in these factors.

Ex-post Evaluation of the ERDF 2000-2006 Synthesis Report
99
A much smaller proportion of ERDF support across the EU went to waste management in the EU15 (only around 6% of the funding for environmental projects), though more in the EU10 (around 22%). Most of the funding went to waste management rather than prevention or recycling, taking the form of support for selective waste collection, new waste treatment facilities and new landfill sites allied to the closure of unauthorised sites, which in Spain, amounted to some 414 over the period and in Greece to 217, while in Brandenburg in Germany, the ERDF secured the closure of 60% of old sites.
So far as other areas of intervention are concerned, in West Wales and the Valleys, most of the finance from the ERDF allocated to environmental measures went to support for cleaning up and renovating old industrial sites left behind by the closure of mines, metal works and so on, together with the regeneration of rundown urban areas. (This was also the case in the other UK Objective 1 regions, these two areas together accounting for around 60% of the funding over the period.) The projects co-financed led to the improvement of 940 hectares of derelict and contaminated land and the rehabilitation of further 41 hectares (including the Felinfach development site and urban areas in towns such as Merthyr Tydfil).
In this region, a significant amount of funding (almost a third of the total going to environmental projects) also went to stimulating the adoption of environmentally-friendly technology in SMEs, much of it on encouraging the use of renewable energy. In South Finland, which received Objective 2 funding over the period, the finance was used for more strategic purposes, as ‘seed money’ for assisting the creation of new businesses in environmental technology and to support feasibility studies and pilot projects in the same area. The result was a significant expansion of environment-related business activity over the period, especially in clusters such as in Lahti but also in Kymenlaakso where the establishment of eco-parks have attracted SMEs specialising in these activities. This has been accompanied by increased awareness of environmental issues and research into these, coupled with greater cooperation within the sector.
3.6.5 Issues to emerge
A number of issues emerged from the case studies which are of wider relevance for cohesion policy. The first set of issues concerns the sustainability of the investment undertaken with ERDF support, especially in the EU10 countries. In Podkarpackie in Poland, a conclusion from the study was that many of the water treatment facilities constructed were both more sophisticated and larger in terms of capacity than were needed. This was partly a consequence of overestimating the population which would be connected to the facility in a context of considerable outward migration. It was also a consequence of over-estimating the number of people prepared to pay for the service provided. At the same time, however, it raises questions about the amount of consideration given to the cost effectiveness of the investment when deciding on the plant to be constructed and the degree of incentive which exists in the funding system to ensure value for money. The longer-term problem created is that of covering the costs of operating and maintaining the facility put in place.
The second broad issue concerns the spatial concentration of intervention which was a feature of Objective 2 in the 2000-2006 period. In South Finland, for example, this concentration led to the focus of policy on support for innovation in SMEs, since the main environmental problem for the region, both during the period and since, is the pollution of the Baltic Sea, the source of which lies outside the region, in this case in the wastewater and pollutants released into the sea from Russia. Although it can be argued that the spatial concentration of funding led to tangible results in the form of the development of the environmental technology industry, the general point is that environmental problems very often emanate from outside a region, especially if narrowly
Synthesis Report Ex-post Evaluation of the ERDF 2000-2006
100
defined but also in this case even if more widely defined. Tackling the problem effectively, therefore, typically requires cooperation across regional and even national boundaries.
A third and related issue is illustrated in particular by the experience in Midi-Pyrénées, where the emphasis was very much on giving local authorities the freedom to determine their own development strategies, which led to some lack of coherence between them, which in turn has led to environmental policy at least being centralised in the present programming period. Whereas, therefore, the authorities on the ground may know best which uses of funding are best suited to meeting local needs, there still needs to be some overall coordinating framework in place to ensure consistency between the measures implemented.
A fourth issue concerns the planning of environmental policy and the capacity of the authorities, especially at the regional level, to do this effectively, as well as integrating it into an overall strategy for regional development. Although, therefore, the importance of protecting and improving the environment was emphasised as being important for development at the beginning of the programming period, there was little attempt to relate the projects undertaken with other aspects of development policy in the case study regions over the period. Decisions on the construction of environmental infrastructure were, therefore largely taken independently of measures implemented in other policy areas, such as for example support of tourism. Accordingly, the environmental projects undertaken had less effect on economic development than they might potentially have done.
An exception to this, however, is the policy pursued in South Finland of concentrating support on the development of environmentally-related business activities. As indicated above, this was accompanied by the creation of clusters and is closely linked to a wider, long-term strategy of encouraging the growth of knowledge-based industries, which begins with ensuring a high level of education among working-age population. The use of Objective 2 support in South Finland also illustrates what can be done with a relatively small amount of funding, exemplifying the wider effects of investing in feasibility plans and innovative pilot projects.
3.6.6 Main findings
More generally, the main findings of the evaluation are that the funding provided by cohesion policy over the period was directed less to measures for stimulating economic development and more to improving living conditions and the standard of life in the parts of the EU assisted. Although in the short-term, the contribution to economic growth was in general limited, in the longer-term, the improvements brought about, especially in both more rural and more deprived urban areas, are likely to lead to more balanced as well as more sustainable development. As such, cohesion policy in this particular area served unquestionably to further social and territorial cohesion and may, ultimately, result in more sustained economic development.
Whether the funding, by being used to a significant extent to help Member States move closer to compliance with EU Directives on water and waste, was deployed in the most effective way given the objectives of cohesion policy is an open question. It is clear that the less developed parts of the EU had to move in this direction and so needed to find the finance for such a move. It is also clear that the investment undertaken and its results have helped to even up living and working conditions both between and within regions, so alleviating a possible constraint on to the development of the less favoured areas. At the same time, it is arguable that it would have been better to have a more thorough assessment of the potential effects of using the ERDF in this way at the beginning of the programming period rather than at the end.

Ex-post Evaluation of the ERDF 2000-2006 Synthesis Report
101
3.7 CLIMATE CHANGE AND SUSTAINABLE DEVELOPMENT
3.7.1 Climate change: a new challenge
Climate change, adapting to it and attempting to mitigate it, is high on the political agenda. Yet, this was not the case when Member States and regions prepared their programmes for the 2000-2006 period. Nevertheless, the study carried out as part of the evaluation32 found that altogether 120 operational programmes supported measures related to combating climate change, accounting for funding of EUR 2.3 billion in total, or 9% of ERDF spending on the environment. Of this, 60% went to the support of environmentally-friendly technologies in enterprises, 23% to renewable energy and 13% to energy efficiency.
A further interest was to explore whether cohesion policy programmes carried out over the period provide a useful guide to the design of interventions in this area. The study found some novel approaches (see Box on the Czech Republic) but also concluded that it is a significant challenge to design effective and efficient public interventions. These need to include a detailed understanding by the authorities responsible of issues like the revenue-raising capacity of renewable energy projects and appropriate methods for monitoring and evaluating climate relevant actions. Another part of the ex-post evaluation developed first elements for such a monitoring system33.
Box – Czech Republic In the Czech Republic a support scheme was introduced aimed at improving the energy efficiency of technologies used by SMEs. An independent energy audit was carried out before SMEs applied for support, the amount of which depended in part on the planned reduction in greenhouse gases (GHG), calculated on the basis of the energy production mix in the Czech Republic. The firms supported then had to report their energy consumption for three years after receiving the subsidy. The results of the scheme are positive and the costs involved are in line with those of other types of measure for reducing GHG emissions for a similar amount.
Box – Açores, Portugal The Açores region consists of 9 islands which because of their geographical features cannot easily be linked by an electricity grid. The main aim of the regional authorities was to improve the islands’ energy supply at the same time as reducing emission. In 2003, a decision was taken to invest in renewable energy to replace traditional, fossil fuel electricity generation. Although the islands' geography was highly suitable for wind and geothermal energy production, installing generating facilities and, more importantly, connecting them proved to be more difficult than anticipated. Both wind power and hydro electricity generation produce fluctuating amounts of energy which is hard to control and which cannot be distributed between islands to reduce mismatches between supply and demand. This illustrates the problem of using these means to produce electricity in a situation where this is a small market and a lack of an effective distribution system given the high cost of construction involved.
32 Ex post evaluation 2000-06, Work Package 5b: Environment and climate change, ADE. The evaluation carried out three case studies in Germany (Sachsen-Anhalt), the Czech Republic and Spain.
33 Ex post evaluation 2000-06, Work Package 2: Data feasibility study, ADE. The evaluation carried out three case studies in France (Corse), Germany (Rheinland-Pfalz) and the Czech Republic.

Synthesis Report Ex-post Evaluation of the ERDF 2000-2006
102
A third aim of the evaluation34 was to examine whether the management and implementation system for cohesion policy had the capacity to enable a strategy to be designed and pursued which was consistent with sustainable development, defined very broadly to encompass the many and various aspects which this involves. Based on ten case studies and a review of the literature, the evaluation demonstrated that the system, with programmes based on an analysis of the economic, social and environmental situation of a region, the setting of appropriate objectives and the involvement of relevant partners, is suitable for delivering sustainable regional development.
What emerged from the evaluation was evidence of the building of awareness and the testing of appropriate measures. The case studies undertaken provided a clear demonstration that the pursuit of a sustainable development strategy requires political commitment and consensus as well as the setting of clear and relevant targets. The establishment of suitable administrative procedures in itself is not enough.
An Integrated Sustainability Triangle for project assessment in Brandenburg, Germany In Brandenburg, discussion about assessing the sustainability of the ERDF funded projects was initiated by the European Commission which requested an assessment of the environmental effects of funding in the context of a planned programme modification after the mid-term evaluation. Since there were no adequate sustainable development (SD) indicators in the monitoring system, the Managing Authority used the opportunity to initiate a broader debate on the sustainability of the projects funded. Together with the investment bank of the Brandenburg Land (ILB), it developed a tool for project assessment which not only estimated the environmental effects but also the economic and social impacts – namely, the 'Integrated Sustainability Triangle' (IST). Based on the IST, every project is assessed for all three SD dimensions from two perspectives: first, design and implementation (‘how?’) and, secondly, the results and effects (with what outcome?).
3.7.2 Main issues arising
• In the 2000-2006 programming period, the ERDF supported interventions relevant for adaptation to climate change, even if on a relatively small scale.
• More guidance and development work are needed to design interventions that are effective and efficient and monitored and evaluated to a high standard. Support from the ERDF should only be provided where there is a clear case for public intervention.
• The programme based management system of cohesion policy has the capability of delivering integrated strategies for sustainable development, but political leadership and clear and agreed objectives are required for such strategies to be designed and implemented effectively.
3.8 RURAL DEVELOPMENT
3.8.1 What was the purpose of the evaluation?
It was not a specific objective of the ERDF over the 2000-2006 period to assist the development of rural areas as distinct from that of non-rural areas. This was left to the EAGGF. Instead, the ERDF was aimed at assisting the development of all problem regions, whether lagging behind (supported under Objective 1) or experiencing specific difficulties (supported under Objective 2) whatever their characteristics. Nevertheless, the growing policy concern with sustainability and
34 Ex post evaluation 2000-06, Work package 11: Management and implementation systems, EPRC.

Ex-post Evaluation of the ERDF 2000-2006 Synthesis Report
103
territorial balance and the depopulation of many of the more sparsely populated parts of the EU mean that there has been increasing interest in the fortunes of rural areas and the problems they face.
These areas, and the role of the ERDF in assisting their development, were included in the evaluation as a specific issue for investigation.
3.8.2 What are rural areas?
The first problem encountered when examining these issues is to identify rural areas. As indicated in Chapter 1, there is a widely accepted OECD definition of rural areas for research purposes, which relates to small areas, or local units, with a low population density (specifically below 150 per square km). Since, however, there are little if any data for areas this small, rural areas tend to be defined, as here, at the NUTS 3 regional level, the smallest areas for which there are at least some data for all EU Member States.
Accordingly, there may be rural local units even in NUTS 3 regions defined as being predominantly urban and even more so in intermediate regions. Indeed, as the evaluation revealed, the OECD definition does not necessarily correspond with what administrative authorities across the EU regard as being rural areas, which are often defined, if not very precisely, on a smaller scale than NUTS 335. Policy towards rural areas at national or regional level, therefore, may target slightly different regions than those defined as rural in the evaluation – or, indeed, by researchers generally. Nevertheless, these areas are usually small and most rural areas as commonly understood would tend to be in, or coincide with, NUTS 3 regions defined as being rural. Focusing on these regions, therefore, ought to give a reasonable indication of both the funding going to rural areas over the programming period and the types of project it helped to finance.
3.8.3 What were the policy objectives in rural area?
As the evaluation also revealed, there is no neat and simple economic theory which prescribes what development strategy should be adopted in rural areas as opposed to other types. Indeed, economic theories for the most part do not distinguish between types of region in this sense. At the same time, there is increasing emphasis on the need for policy to be tailored to the specific features of a region, to make the most of its endowment of resources or assets, widely defined, and to develop its areas of potential comparative advantage accordingly. Equally, the growing concern with on sustainability implies that the development path pursued should not give rise to significant damage to the environment or the region’s natural assets.
In practice, policy towards rural areas differed across the EU, though there was a common aim of trying to maintain population in the areas concerned and, therefore, economic activity. In some countries, however, such as Germany or Spain, this was regarded to a large extent as being coincident with supporting agriculture. In others, such as Sweden or France, a broader perspective was taken, though in neither country was there a specific focus on rural areas as such. Instead the concern was with the development of regions which happened to be rural. The difference mirrors that between the EAGGF, which was predominantly directed towards assisting the agricultural sector and closely related activities, and the ERDF, which was more focused on the development of the region as such, as indicated below.
35 These can be relatively large and populous regions – the whole ‘Communidad’ of Madrid, for example, is a single NUTS 3 region with a population of around 5.8 million.
Synthesis Report Ex-post Evaluation of the ERDF 2000-2006
104
Whatever the policy followed, there was at least an implicit recognition in most cases that development in rural areas was not the same as development in more urban area and that it was important to preserve the rural nature of the area concerned when formulating policy. A further point to note is that the maintenance of population in rural areas need not imply a need to stimulate economic development there, though it does imply that the people in the areas need to have access to sufficient income to be able to live there.
In view of this, a further distinction can usefully be made between rural areas which are reasonably close to a sizeable town or city and those which are further away (see Chapter 1 above). This can be expected to affect both their development prospects and their ability to retain population, on the one hand, and the extent to which they need to develop a more independent economic strategy, on the other. Cities which are within commuting distance, accordingly, provide a potential source of employment and income to help sustain population in the area concerned.
3.8.4 What was the scale of support for rural areas from the ERDF?
As indicated in Chapter 1 above, around 27% of total ERDF support under Objective 1 in the EU15 (around EUR 25 billion) went to rural areas over the 2000-2006 period. Moreover, there was a relative concentration of financing in rural areas within Objective 1 regions in the EU15, especially in those remote from a city, which tended to be peripheral, The amount of funding per head of population in these areas was around 40% larger than in other areas in Objective 1 regions. This relative concentration was evident in nearly all EU15 countries, especially in Finland and Sweden, though it was not the case in Italy or the UK,
In the EU10, only in Hungary was funding per head significantly larger in remote rural areas than in other types. In Poland, Latvia and Lithuania, funding per head was smaller than elsewhere. Taking account of areas close to a city as well, funding per head was also relatively large in rural areas in Slovakia, Slovenia, the Czech Republic as well as Hungary, In Poland, Latvia and Lithuania, it remained smaller than in other regions.
Around 21% of Objective 2 funding (around EUR 4.6) went to rural areas in the EU15 countries. As in Objective 1 regions, this was significantly more than their share of population – well over twice as large in the case of remote rural areas and around 1.6 times as large in those close to a city – indicating a relative concentration of funding in rural areas. This was the case in all Member States.
3.8.5 What was the funding spent on?
As also indicated in Chapter 1, the division of funding between policy areas in rural parts of Objective 1 regions differed markedly across countries in the EU15. Moreover, there was no systematic difference in the division of funding between rural areas and others, except that a smaller share went to RTDI than in urban areas. Accordingly, in most countries, the division of funding in rural areas broadly reflected that in other areas while not being precisely the same. In Greece, Spain and Ireland, a relatively large share went on improving transport networks, in Finland and Sweden, on enterprise support. In other countries, there was a more even distribution across policy areas. Very little of the ERDF was spent on the development of rural areas as such (under 2% of total funding) in any regions.
Much the same was the case in the EU10 Member States, with the division of funding in rural areas broadly reflecting that in other parts of the country.

Ex-post Evaluation of the ERDF 2000-2006 Synthesis Report
105
In sum, in both the EU15 and EU10, Objective 1 funding was deployed in different ways in rural areas across Member States, suggesting that if there was a rural development strategy, it was not a common one.
The extent of differences across countries in the division of Objective 2 funding in rural areas was equally wide. Nevertheless, there were more common features than in Objective 1 regions, with more spending on environmental infrastructure and tourism in particular in rural areas than elsewhere. The share of funding going to enterprise support, however, varied across countries, being relatively large in France, the Netherlands, Finland, Sweden and the UK, but not in Germany, Italy, Austria or Spain.
In both Objective 1 and Objective 2 regions, enterprise support accounted for a larger share of funding in remote rural areas than in those close to a city, so that there was more emphasis put on the development of economic activity in the former than the latter, where the nearby city might be a source of income and jobs.
The relatively dispersed nature of the financial support provided by the ERDF in rural areas contrasted with the concentration of the EAGGF on agriculture in such areas, though as indicated above, the areas concerned do not necessarily coincide.
3.8.6 What were the effects of ERDF support in rural areas?
The case studies carried out as part of the evaluation, together with more detailed examination of the expenditure financed by the ERDF, suggests that the relatively large amount of support for investment in transport – especially in Greece, Spain and Ireland – mainly went on improving the rural road network and linkages between towns in the areas as well as with towns and cities in neighbouring regions. Accordingly, it led to an increase in accessibility and helped to make it easier for people to live in rural areas and work elsewhere or take advantage of the amenities in larger cities outside the area. Equally, the investment in improvements in water supply and wastewater treatment helped to improve living conditions in the areas concerned.
Both sets of action are likely to have contributed to achieving more balanced territorial development as well as strengthening social cohesion, whatever the effects on economic growth. This applies as well to the support going to local communities over the period, such as on:
• the rehabilitation of rural villages in a number of areas across the EU;
• the restoration of historical buildings and monuments in rural towns in Italy co-financed under both Objective 1 and Objective 2;
• support for social infrastructure in rural areas in Portugal, in particular, and to a lesser extent in Greece;
• support for social infrastructure in the form, for example, of childcare centres and catering facilities in the Centre region of France;
• the support to social infrastructure in the EU10 countries in rural areas, especially in Estonia, where over 40% of the ERDF in remote rural areas was allocated to this, though also in Lithuania, where the proportion was over 20%, and Poland, where the figure was smaller (just over 9%) but still significantly larger than in more urban areas.
3.8.7 Issues to arise from the evaluation
As indicated above, in many rural areas, a significant part of ERDF co-financing went to local development projects, the main outcome of which – if not necessarily the expressed purpose –

Synthesis Report Ex-post Evaluation of the ERDF 2000-2006
106
was to improve living standards and the quality of life in the local areas concerned. While this may well have contributed to strengthening social cohesion as well as territorial balance by encouraging people to live in such areas, it raises a question over the extent to which such ‘bottom-up’ actions need to be coordinated within an overall development strategy. In the Centre region of France, for example, as the case study revealed, funding was distributed to local communities to do more or less as they wished, leading to some duplication of projects. It also raises a broader question over the role of regional authorities across the EU in the design and implementation of cohesion policy, given that in many countries, such authorities are essentially administrative arms of central government and the next political level down from central government are local authorities.
A related point is that while the emphasis of cohesion policy has tended historically to be on economic development – to enable all regions to develop their economic potential – economic development is not necessarily a suitable or appropriate aim for all regions and still less for all areas within regions, Accordingly, not only is it the case that development should be consistent with preserving the natural assets of a region but that in some areas this may mean little or no economic development at all, or at least one which is confined to particular activities. This need not mean depopulation so long as there is a sustainable source of income for the people concerned. In both the Sachsen region of Germany and the Świętokrzyskie region of Poland, therefore, the support given to enterprises in neighbouring urban areas benefited those living in rural areas by providing employment for them, even if not locally.
As the evaluation – and the above review of the division of funding – also emphasises, there is far from being a single development strategy which fits all rural areas. Such areas are no different from other types of area in terms of their wide range of different circumstances, resource endowments of various kinds, levels of economic development and political priorities, all of which affect the most appropriate strategy to pursue.
A further point to emerge is that although there were two other EU sources of funding for rural areas in addition to the ERDF, there was a reasonable degree of coordination between its activities and those of the EAGGF and ESF. The relatively narrow focus of the EAGGF on supporting the agricultural sector and closely related activities and that of the ESF on supporting education and training made it clear for the most part which fund was the relevant one for financing any particular project or measure. Nevertheless, there is scope for potential conflict, or lack of coordination, between the ERDF and the EAGGF, in particular. This is because the ERDF is primarily focused on restructuring so far as the economic development of rural areas is concerned, which implies diversification of activities away from agriculture, whereas the EAGGF is focused on attempting to increase the competitiveness of the sector and the scope of its activities. It is not clear, therefore, that the two Funds share the same strategic vision of development, which is essential not only to avoid potential conflict between the measures implemented but also to ensure that the policy itself is as effective as possible in pursuing the vision concerned.
3.9 GENDER EQUALITY AND DEMOGRAPHIC CHANGE Two related horizontal issues were also covered by the evaluation. The first, equal opportunities, was included in the cohesion policy guidelines as a priority which was to be explicitly taken into account in the design and implementation of projects co-financed by the Structural Funds over the period. The second, demographic change, was not an explicit cross-cutting issue as such but it became a more pressing challenge over the period. The growing number of people beyond retirement age focused attention on the importance of future growth to provide income support

Ex-post Evaluation of the ERDF 2000-2006 Synthesis Report
107
and on the implications for social services and communal amenities as well as on the potential consequences for patterns of consumption. At the same time, the significant migration flows both from developing countries outside the Union and from East to West inside the Union gave rise to concerns about integration and pressure on infrastructure (on housing, schools and so on), on the one hand, and about the loss of skilled and educated labour in the regions left behind, on the other.
The main interest as regards the first issue was to examine the extent to which the pursuit of gender equality was incorporated in development plans, and the form which projects took over the period, as well as the effect it had on outcomes. The concern was to see whether regulations were respected and the way in which gender equality was actually taken into account.
The interest as regards the second was to consider how far an issue which emerged over the period as having important effects on regions, both actual and prospective, was reflected in the way that the ERDF was deployed. The concern was, therefore, to see whether the allocation of funding was modified as the period went on and the implications of demographic trends became more apparent. The more general interest was in see how flexible systems for managing funding were in responding to a new challenge.
3.9.1 How could the use of the ERDF have responded to gender and demographic issues?
While gender equality and demographic change are separate issues, they are, in practice, closely related. Ensuring that women and men have equal opportunity to access a good education, get a decent job or pursue a fulfilling career is a goal in its own right and essential to securing a just and equitable society, but it is also important for economic reasons. Not only does it add to the work force but it also tends to increase the skills available and, accordingly, helps to raise the rate of growth and improve competitiveness. As such, it is potentially important to counter the effect of demographic trends. Moreover, as the evaluation revealed, the measures which improve the situation of women are also a means of responding to demographic change, in the form of an ageing society or increased numbers of migrants.
Although the issue of gender equality is more relevant for the ESF, which is concerned, in particular, with supporting education and training as well as employment and, therefore, with the areas in which equal opportunities are particularly important, the uses to which the ERDF is put can also have a gender dimension. They can equally affect the situation of older people or migrants. This can happen either directly, i.e. with projects being designed or adapted specifically with particular social groups in mind, or indirectly, as the side-effect of projects with a different main purpose.
The policy areas in which the projects undertaken could have the most direct effect are:
• the enterprise environment, where the support given to firms included in some regions measures to assist women entrepreneurs, but could also include support for older people or migrants to set up businesses;
• social infrastructure, such as, in particular, childcare facilities, community centres, healthcare and social services (see the Box on Castilla y Leon for an example);
• planning and rehabilitation, such as the renovation of rural villages or the regeneration of rundown urban centres, which can improve living conditions in the areas concerned, with particular benefit to migrant groups or the elderly who represent a large part of the population living in such areas.

Synthesis Report Ex-post Evaluation of the ERDF 2000-2006
108
The projects undertaken in other policy areas, however, can also have differential effects on the social groups concerned. Improving local roads, for example, or connections between rural areas and urban centres can make it easier for women to combine family responsibilities with working, as can improvements in public transport, which also tend to benefit the elderly in particular.
3.9.2 The main findings from the evaluation
Gender equality
Nearly all programming documents and development strategy statements made at the beginning of the programming period mentioned gender equality and its importance, as did many projects that were initiated.
In four of the case study regions (Southern and Eastern Ireland, East Scotland, Salzburg and Basilicata), special units were set up during the period to give guidance on the implementation of the gender equality guideline in project design. In Southern and Eastern Ireland, for example, a Gender Equality Unit was established with the aim of ensuring that:
• the issue was incorporated in the National Development Plan;
• monitoring committees took account of gender balance when assessing the operation of programmes;
• gender effects were considered in project selections
• equal opportunities were part of all evaluations.
Similar action was taken in the other three regions, so that gender equality, as was intended, became an integral part of the deployment of the Structural Funds.
It should be noted, in addition, as indicated in the national report, that all Spanish regions also created special bodies with responsibility for ensuring equal treatment of men and women. In 2007, the Red de Coordinación de Políticas de Igualdad was created to coordinate regional efforts in this regard36.
There is evidence from the case studies of concrete results from projects undertaken in improving the situation of women by helping them better to balance their family and working lives and avoid conflicts between the two. For example:
• in Southern and Eastern Ireland, support under Objective 1 contributed to increasing childcare places by over 25,000 over the programming period (in this case up to the end of 2007)
• in Salzburg, childcare facilities were also established, if on a far smaller scale because of the much smaller scale of funding under Objective 2.
Equally, there is more qualitative evidence of transport projects helping to reduce the isolation of rural communities and of rehabilitation projects improving living conditions in many urban and rural areas.
Only in a few cases, however, was there evidence of gender equality considerations affecting the policies carried out or being specifically taken into account in the design of projects or in their
36 The case study of Castilla y Leaon, however, did not find that such a unit played a prominent role over the 2000-2006 period in relation to the ERDF.
Ex-post Evaluation of the ERDF 2000-2006 Synthesis Report
109
implementation. Nor were there many attempts to monitor the effect of programmes in this regard or to set up an indicator system for doing so.
Moreover, the regions in which special units were set up specifically to deal with gender equality issues were a minority of the regions examined as part of the evaluation. The other regions had not put in place any machinery or procedures for integrating the issue into the planning or management process. Perhaps because of this, there was little evidence of awareness among regional and local authorities of the potentially important effect on women of the kinds of project listed above, except those which have a clear impact on them, the provision of childcare centres, in particular, despite them being the prime beneficiaries.
In consequence, little or no account was taken of the specific needs of women, so that the effect on them was less than it might have been.
More generally, the lack of indicators means that it is not possible to assess the extent to which the inclusion of gender equality as a horizontal issue in the cohesion policy guidelines had a tangible effect on the situation of women relative to men.
Box – Support for social infrastructure in Castilla y Leon In Castilla y Leon the ERDF supported the construction of 47 health centres and the enlargement and refurbishment of 91 health centres, 24-hour medical attention centres and hospitals providing services locally to the elderly, those with disabilities and other vulnerable groups. The projects were carried out in rural and urban locations, with small towns (with a population of less than 20,000) benefiting the most. The result was an improvement in the living conditions of rural populations by reducing the need to travel to larger towns to access health care services and receive medical treatment. The work-life balance of carers in rural areas, generally women, equally improved due to a reduction in their work-load. In addition, there was an increase in employment opportunities at local level, especially for women. The total budget was just under 9% of the total support from the ERDF.
Demographic trends
There is little or no evidence that demographic trends had any influence on the allocation of ERDF support over the period or that they were taken into account by the authorities across the EU in the selection of projects or their design.
As in the case of gender equality, while a number of transport projects, projects undertaken in planning and rehabilitation programmes and the construction of various kinds of social infrastructure particularly affected older age groups and/or migrants, there was little awareness of this. Accordingly, their specific needs were not explicitly considered.
Although an ageing population and the inflow, or outflow, of migrants have particularly important implications for some regions, no evidence of this affecting the pursuit of cohesion policy in the 12 case study regions came to light. The evaluation did, however, find evidence of growing awareness of the potential significance of demographic trends as well as evidence that the ERDF could contribute to the implementation of measures for responding to the effects of these trends.
3.9.3 The issues to arise
The evidence from the evaluation is that the inclusion of gender equality as a horizontal requirement when designing and implementing programmes had only limited effect on the projects undertaken over the period. This prompts the question of whether it is worthwhile including such cross-cutting priorities in the cohesion policy guidelines in future.

Synthesis Report Ex-post Evaluation of the ERDF 2000-2006
110
One point in favour is the fact that gender equality bodies were set up in a number of regions as a specific response to its inclusion and there is piecemeal evidence that it led to authorities across the EU paying more attention to the issue, if perhaps in limited ways. At the same time, it is arguable that the authorities which took the issue seriously and introduced specific arrangements to integrate it into the policy-making machinery did so because they regarded it as an important objective in their region or country. Those that did not do so attached relatively low priority to it, despite the guideline, and in many cases did the minimum amount to comply with the regulation. Simply including an issue a horizontal priority, therefore, does not ensure that it actually has a significant effect on policy unless it is perceived as being important,, in which case action would probably be taken irrespective of whether it is a horizontal priority or not.
As regards demographic change, there is little evidence at all that the issues concerned entered the policy agenda at regional or local level over the period. Although there are signs of increasing awareness of the potential importance of the issues, no specific examples were found of development policy been modified in response to them.
3.10 CONTRIBUTION OF THE MANAGEMENT AND IMPLEMENTATION SYSTEM TO DELIVERING
EFFECTIVE POLICIES A major element of the evaluation was the examination of management and implementation systems for the delivery of cohesion policy. A particular focus was on the EU10 countries, given that this was their first experience of carrying out cohesion policy programmes. Establishing appropriate systems for doing this, which would provide the basis for designing and implementing regional development strategies in future programming periods as well as in 2000-2006, was as much an objective as the achievement of significant results from the programmes undertaken themselves. Specific findings in relation to individual EU10 Member States are presented in Chapter 4 below. Here the concern is to review the evidence from the evaluation of management and implementation systems on the performance of the policy in different intervention areas. The evaluation did not examine audit processes which should be borne in mind when reading what follows.
A major conclusion of the evaluation was that, in many cases, insufficient attention was paid in delivering programmes to strategic management issues - i.e. the entire process of strategic programme design, project selection, monitoring, evaluation, reporting, financial management and partnership. This was case in both the EU10 (where this was understandable given the newness of the processes involved) and the EU15.
For the EU15 countries, implementing their second, third or fourth programmes, there was evidence of positive changes:
• in the quality of strategic planning, by improving the focus, coherence and credibility of strategies, involving more detailed analysis of development needs, greater consultation with partners and stronger ex ante evaluation;
• in the extent of partnership, including at local level;
• in the extent and quality of evaluation, which in several cases went beyond the regulatory requirements.
So far as monitoring is concerned, the conclusions of the evaluation were not so positive for both the EU10 and the EU15, with over-complex and inflexible indicator systems and associated data inconsistencies. This made it difficult in this evaluation to aggregate data across countries and to assess performance on the basis of the achievement of targets.

Ex-post Evaluation of the ERDF 2000-2006 Synthesis Report
111
For both the EU15 and the EU10 countries, the requirements of financial management, particularly the de-commitment rule, led to a strong focus on financial absorption, with less attention given in monitoring committees and other policy discussions to results and achievements and how they could be further improved.
These findings are confirmed by the points summarised earlier in this chapter as regards policy effectiveness in the different areas of intervention examined. In particular, evaluations highlighted the need to improve the monitoring of policy effects in enterprise support, transport and the construction of environmental infrastructure.
A further finding which emerged from the evaluation of management and implementation systems is that there is evidence of positive spill-overs from the systems established into the management of domestic policy, both in the EU10 and the EU15. In the EU10 countries, these related, in particular, to managerial practices for policy design and implementation, the training of staff and the development of institutions and procedures, including pressure for evidence-based policy making.
The Performance Reserve The performance reserve was an important innovation in the 2000-2006 programming period. It was not covered by this evaluation because it was examined by the Commission and the Member States in 2004 and a report on its impact was produced in the same year37. Under the performance reserve, 4% of resources were held back at the initial programming stage for allocation at the mid-term to programmes considered to be performing well. The main conclusion of the report was that its strength was in acting as an incentive for developing good management practices in relation to the absorption of funding, the production of evaluation reports on time, the development of monitoring and financial control systems and the introduction of more transparent project selection procedures.
Nevertheless, significant weaknesses were also noted, particularly in the use of performance indicators, with evidence of poor target setting (either too ambitious or too cautious), which made it difficult to use these to assess performance. In addition, a variety of methods were employed across Member States to determine how the reserve should be allocated. While there were examples of good practice, such as in Italy, where a group of experts were appointed as advisors to help assess performance, in others, more perfunctory methods were employed. Essentially, the reserve enhanced compliance with the regulations rather than increasing the focus on results. The obligatory performance reserve was replaced with an optional reserve for the 2007-2013 period.
In EU15 Member States, the evaluation found evidence of institutional innovations, the adoption of new procedures, improved skills in carrying out tasks and the spread of more positive attitudes towards evaluation. The spill-overs contributed to increased knowledge about policy outcomes and the progress achieved by the programmes implemented as a result of better monitoring, reporting and evaluation arrangements.
An interesting conclusion to emerge from the evaluation is that the learning effects from the establishment and use of cohesion policy management and implementation systems tend to be greatest in the second programming period, that it takes time for the full benefits to materialise. In countries where the key principles embedded in the system are far removed from prevailing practices, it can take longer still.
37 European Commission, Directorate General for Regional Policy (2004): A Report on the Performance Reserve and Mid Term Evaluation in Objective 1 and 2 Regions

Synthesis Report Ex-post Evaluation of the ERDF 2000-2006
112
4 Chapter 4 – The effect of cohesion policy on economic growth and regional development
This chapter is divided into two parts. The first part examines the effect of cohesion policy on the growth of the economies receiving assistance on the basis of two macroeconomic models which attempt to isolate these effects from other influences; the second part considers developments in the regions concerned in different Member States in more detail and relates these to the nature of support provided by the Structural Funds.
4.1 USING MACROECONOMIC MODELS TO ESTIMATE THE EFFECTS OF COHESION POLICY
4.1.1 Main points
• The use of macroeconomic models is the only feasible way to estimate the quantitative effect of cohesion policy on the economic development of the regions receiving Structural Fund support.
• At present, the models available can estimate the effect of the receipt of Structural Funds only at national level rather than in individual regions.
• These models attempt to represent the behaviour of economies as best they can, but there, of course, remains uncertainty, and debate, about how economies work in practice.
• Two different models constructed on somewhat different views about how economies work were used in the evaluation to estimate the effect of cohesion policy over the 2000-2006 programming period.
• According to both models, cohesion policy had significant effects in increasing economic growth in the countries receiving support.
• Although the timing of these effects differs between the two models, in both cases, there is a long-term increase in the productive potential of economies as a result of the support received.
• The QUEST model, which estimates the adverse effect of the higher taxes needed to fund cohesion policy as well as the beneficial effect of the additional expenditure financed, indicates that the net effect of policy is to increase the overall growth rate of the EU and not simply to transfer growth from one country to another.
4.1.2 Introduction
As emphasised above, it is not possible to observe a direct link between cohesion policy, and the funds made available to support this, and the development of the regions assisted, even if the latter happen to grow faster than those not assisted. The use of simulation models is, in practice, the only means of taking account of the very many factors which affect regional development and of explicitly allowing for these in order to isolate the effect of policy. Macroeconomic models have, therefore, been developed in an attempt to capture the way that economies work and to trace the effect on GDP, employment and so on of the increased public expenditure which the Structural Funds make possible. Such models have been used in the past to estimate the contribution of cohesion policy to economic growth in EU Member States in previous programming periods.

Ex-post Evaluation of the ERDF 2000-2006 Synthesis Report
113
These models have become more sophisticated over time. This applies to the way they represent both the support provided by the Structural Funds – by incorporating more accurately the time profile of payments as well as the types of expenditure being funded (infrastructure, business support and so on) – and the behaviour of the economy. Nevertheless, although they attempt to reflect the results of research into the way that economies behave and, in particular, into the effects of public expenditure of the kinds supported by cohesion policy on economic variables (GDP, employment, productivity, inflation, etc,), these effects remain open to debate. As the authors of one of the models emphasise: ‘the model, while drawing on and synthesising available theory and evidence, is still somewhat experimental’38.
The models which have been developed are limited to examining the effect of policy on national economies or, at best, macro regions of economies (southern Italy and eastern Germany, in particular), rather than on individual regions. As such they can provide only a partial indication of the effects of policy, which is concerned with regional disparities across countries as much as with disparities between countries.
Despite the limitations of models and the ongoing debate about the behavioural relationships which they incorporate, it is still useful to examine what the effects of the Structural Funds are estimated to be on the basis of the understanding of the way that economies work which they encapsulate.
4.1.3 The macroeconomic models used in the evaluation
Two different macroeconomic models were used in the evaluation to assess the effects of policy over the period 2000-2006. One is the QUEST model used in the European Commission for macro-economic policy analysis but especially adapted to examine the effects of structural reforms. The other is the HERMIN model (or more precisely the Cohesion System of HERMIN Models – CSHM), which has been specifically developed for examining the effects of cohesion policy. The two models incorporate different, though related, assumptions about the workings of the EU economies, though both reflecting prevailing strands of thought about how economies work39.
The main differences relate, first, to the effect which an increase in public expenditure financed by EU funding has in boosting demand, which in the QUEST model is smaller than in the HERMIN model, due to the nature of the interactions with private demand which are assumed. Secondly, they relate to the scale of the effect of investment in infrastructure, human resources and RDTI on productive potential (on the supply side of the economy), which is larger over the medium-term in QUEST than in HERMIN, due to the explicit incorporation in the model of endogenous growth effects (i.e. the effect of the investment concerned on growth of GDP). Accordingly, the funding provided has a quicker effect in stimulating economic growth in the latter than the former, while the longer-term consequences for productivity and, therefore, growth are larger in QUEST than in HERMIN.
38 John Bradley and Gerhard Untiedt, Analysis of Cohesion Policy 2000-2006 using the CSHM.
39 The very summary outline of the two models which follows is in no way intended to give a full description of the two models or of the differences between them but merely to indicate one or two features which affect the estimates they produce. For more details, see: John Bradley and Gerhand Untiedt, op cit. and Janos Varga and Jan in 't Veld, A model-based analysis of the impact o cohesion policy expenditure 2000-06: Simulations with the QUEST III endogenous R&D model

Synthesis Report Ex-post Evaluation of the ERDF 2000-2006
114
A third important difference between the two models is that QUEST attempts to estimate the effect of the Structural Funds plus the Cohesion Fund on all EU Member States, while HERMIN is confined to estimating the effect on those economies which are net recipients of funding. This, in practice, means the four EU15 Cohesion countries, together with the southern Objective 1 regions of Italy (the Mezzogiorno) and the Eastern Länder of Germany, plus the 10 countries which entered the EU in 2004.
QUEST also explicitly models the funding of cohesion policy as well as the expenditure it gives rise to, so that the effect of policy from countries receiving financial support tends to be offset either fully or in part if they also contribute to the funding of this support. It is assumed that, in the absence of cohesion policy, taxes to fund the Community Budget would be lower in the countries contributing to the Budget and, therefore, the effect of policy is to depress expenditure and GDP at the same time as policy adds to these as funding is received40. QUEST can, accordingly, be used to estimate the net effect of cohesion policy across the EU and not just its (gross) contribution to growth in the countries assisted.
Another major difference is that HERMIN is a collection of single country stand alone models and therefore does not capture the feedback of Structural Funds expenditure from recipient countries to others and the effects of this on the growth of the latter. QUEST on the other hand is a global model and does attempt to capture inter-country spillovers. This is potentially important since many of the countries receiving the largest amounts of funding are reliant on imports for development. A proportion of the expenditure financed by the Structural Funds, therefore, returns to the countries which are net contributors to the funding of cohesion policy in the form of imports from recipient countries. This to some extent offsets the effect of any additional taxes that they need to raise in order to fund cohesion policy.
4.1.4 The scale and timing of expenditure financed by the Structural Funds
To begin by examining the estimated effects of cohesion policy on the countries receiving the largest amounts of EU funding, the starting-point is the scale of support received and the timing of this. Note that it is not possible to distinguish the effect of the ERDF from the other EU sources of funding in the period, including the Cohesion Fund which went to just four countries in the EU15 – Greece, Spain, Portugal and Ireland (up to the end of 2003). .Note also that the term ‘Structural Funds’ is used here to include the Cohesion Fund.
The four EU15 Cohesion countries together with the Italian Mezzogiorno and the Eastern German Länder received a total of EUR 147.2 billion from the Structural Funds (the ESF, EAGGF, FIFG and ISPA as well as the ERDF) together with the Cohesion Fund for the 2000-2006 programming period, though this was paid over a slightly longer period up to the end of 2009 (Table 4.1 – data for 2008 and 2009 are preliminary, based on the figures as at Spring, 2009). This amounted to around 0.8% of the GDP of the economies in question. Portugal received the largest sum relative to its GDP (1.5%), followed by Greece (1.3%) and the Mezzogiorno (1.1%), while Ireland received the smallest sum (0.3%).
40 The alternative assumption that the part of the Community Budget which goes to finance cohesion policy is used for another purpose is not considered. The taxes in question are assumed to be taxes on wages, which means that the effect is to raise costs as well as prices and so reduce the demand for exports as well as internal demand.

Ex-post Evaluation of the ERDF 2000-2006 Synthesis Report
115
Table 4.1 The scale of payments from the Structural Funds and Cohesion Fund to the main recipient countries, 2000-2009
2000 2001 2002 2003 2004 2005 2006 2007 2008 2009 2000-09EU15PT 1.34 1.66 2.80 3.11 3.20 2.68 2.37 2.12 2.93 0.29 22.50GR 0.00 2.24 1.45 1.41 2.55 2.43 3.43 4.68 5.45 0.16 23.80MZ* 1.30 0.24 1.20 2.68 2.63 2.94 3.37 3.31 3.24 0.48 21.40GE* 0.68 2.24 2.50 2.43 2.92 3.03 2.85 2.61 2.10 0.02 21.39ES 0.30 5.33 7.93 8.22 8.10 7.63 5.51 5.46 5.44 0.40 54.30IE 0.21 0.46 0.61 0.55 0.54 0.43 0.41 0.24 0.30 0.01 3.76
Total 3.83 12.17 16.49 18.39 19.93 19.14 17.95 18.42 19.47 1.36 147.16
LV 0.01 0.02 0.02 0.09 0.17 0.17 0.39 0.26 0.01 1.14LT 0.01 0.03 0.03 0.11 0.19 0.23 0.39 0.48 0.03 1.49EE 0.01 0.01 0.02 0.06 0.10 0.16 0.16 0.15 0.00 0.66PL 0.05 0.16 0.17 1.06 1.00 2.13 3.37 3.15 0.29 11.37SK 0.00 0.02 0.03 0.15 0.20 0.30 0.43 0.51 0.00 1.65HU 0.03 0.04 0.05 0.24 0.40 0.75 0.85 0.42 0.04 2.82CZ 0.01 0.03 0.05 0.23 0.20 0.51 0.61 0.69 0.03 2.37MT 0.01 0.01 0.02 0.03 0.02 0.00 0.08SI 0.00 0.01 0.01 0.03 0.06 0.10 0.08 0.11 0.01 0.40CY 0.01 0.01 0.01 0.02 0.03 0.00 0.08
EU10 0.12 0.32 0.38 1.99 2.33 4.37 6.33 5.82 0.41 22.062000 2001 2002 2003 2004 2005 2006 2007 2008 2009 2000-09
PT 1.10 1.28 2.07 2.24 2.22 1.80 1.53 1.30 1.76 0.18 1.53GR 0.00 1.53 0.92 0.82 1.37 1.24 1.63 2.07 2.28 0.07 1.25MZ* 0.90 0.16 0.74 1.58 1.49 1.60 1.77 1.66 1.56 0.21 1.18GE* 0.22 0.73 0.79 0.77 0.90 0.93 0.85 0.75 0.58 0.01 0.65ES 0.05 0.78 1.09 1.05 0.96 0.84 0.56 0.52 0.50 0.04 0.62IE 0.20 0.39 0.47 0.40 0.36 0.27 0.23 0.13 0.16 0.01 0.25
Total 0.26 0.79 1.01 1.07 1.09 0.99 0.87 0.85 0.87 0.06 0.78
LV 0.11 0.18 0.23 0.79 1.28 1.09 1.83 1.14 0.06 0.81LT 0.09 0.20 0.17 0.60 0.89 0.94 1.36 1.50 0.10 0.72EE 0.11 0.13 0.18 0.63 0.90 1.20 1.04 0.91 0.00 0.61PL 0.02 0.07 0.09 0.52 0.41 0.78 1.08 0.87 0.09 0.45SK 0.02 0.09 0.11 0.45 0.52 0.67 0.78 0.78 0.00 0.41HU 0.05 0.06 0.06 0.29 0.45 0.83 0.84 0.40 0.05 0.35CZ 0.01 0.03 0.07 0.26 0.20 0.45 0.48 0.47 0.02 0.24MT 0.14 0.11 0.32 0.60 0.36 0.00 0.17SI 0.01 0.04 0.03 0.12 0.21 0.31 0.23 0.29 0.02 0.14CY 0.04 0.07 0.10 0.14 0.17 0.01 0.06
EU10 0.03 0.07 0.08 0.40 0.41 0.70 0.88 0.72 0.06 0.39
Note: Countries ordered by overall payments 2000-2009 relative to GDP
Source: Bradlley and Untiedt, An analysis of cohesion policy, 2000-2006, using the CSHM
* MZ, GE refer to the Mezzogiorno (i.e. the Objective 1 regions in Italy) and the Eastern German Länder, respectively.
EUR billion
% GDP
The payments of the amounts involved to the countries concerned did not follow an even pattern over the period - as indicated in Chapter 1 in respect of the ERDF – but instead gradually built up in the first few years before reaching a peak (shown by the figures in bold in the table) and then declining. The precise profile, however, as in the case of the ERDF, varied across countries
Synthesis Report Ex-post Evaluation of the ERDF 2000-2006
116
reflecting the timing of their expenditure on projects and how quickly they were able to initiate these. In Spain and Ireland, expenditure built up relatively quickly reaching a peak in 2002 and in Portugal, the build-up was only slightly slower, the peak being reached in 2003. In the Mezzogiorno, by contrast, the peak was not reached until 2006 and in Greece, not until 2008. In all countries, it should be noted, the payments received were above or close to the annual average for the period in both 2007 and 2008, i.e. after the period had formally come to an end.
In the EU10 countries, which received a total sum of EUR 22.1 billion over the period, the amount of funding going to them was relatively small until their entry into the Union in 2004. Expenditure then took three years to reach a peak in 2007, though as in the EU15 countries, most of the funding available was then spent in 2008 and relatively little remained to be spent in 2009. Much the same pattern of spending was true of most countries, though the peak occurred one year later, in 2008, in Lithuania, Slovenia and Cyprus and one year earlier in Estonia.
The implication of the timing of expenditure from the Structural Funds is that any effect on the economy tends to extend well beyond the programming period as defined and once lags in the effect of expenditure on the economy are taken into account, even further so.
4.1.5 The effect of the Structural Funds on GDP growth
As indicated above, the timing of the effect of cohesion policy on the economies assisted varies according to the two models. In both cases, however, the estimated effect on GDP is substantial, though the scale of the effect varies according to both the structure of the economy and the composition of the expenditure financed.
According to HERMIN, therefore, GDP in the 6 largest recipients of funding taken together was over 13% higher in 2009 as a result of the expenditure financed by the Structural Funds made available for the programming period. The largest effects were in Spain and Portugal, where Structural Fund support resulted in GDP being just under 17% higher than it otherwise would have been in the absence of support (Table 4.2).
In the Eastern part of Germany, by contrast, the addition to GDP in 2009 was estimated at only just over 5%, only a third of the effect in Spain despite the slightly larger amount of funding received relative to GDP. The difference is explained by the much bigger multiplier effects in Spain since much more of the additional expenditure remains within the economy than in the Eastern German Länder. In the latter, therefore, a large amount ‘leaks out’ to the Western part of the country where many of the goods and services purchased from the expenditure are produced. At the same time, the manufacturing sector is smaller than in Spain and gains less from increased productivity resulting from cohesion funding.
Much the same is true of Ireland, where a relatively small amount of financial support is also estimated to have a significant effect on GDP, increasing it by 7% in 2009 over what it otherwise would have been. Here as in Spain, therefore, the Structural Funds, according to the model, can be expected to have led to an increase in productivity in manufacturing which boosted exports and fed through into economic growth.
How far these estimated effects conform with reality, it should be emphasised, depends not only the structural characteristics of the model and its properties. It also depends on the critical assumption that the expenditure financed by the Structural Funds resulted in the outcome it was capable of achieving, that the support was used reasonably efficiently. This means, for example, that expenditure on transport infrastructure led to the savings in time and costs which experience and the empirical evidence available on similar expenditure indicate would be expected. Whether it did or not is to some extent indicated by the other parts of the evaluation summarised in
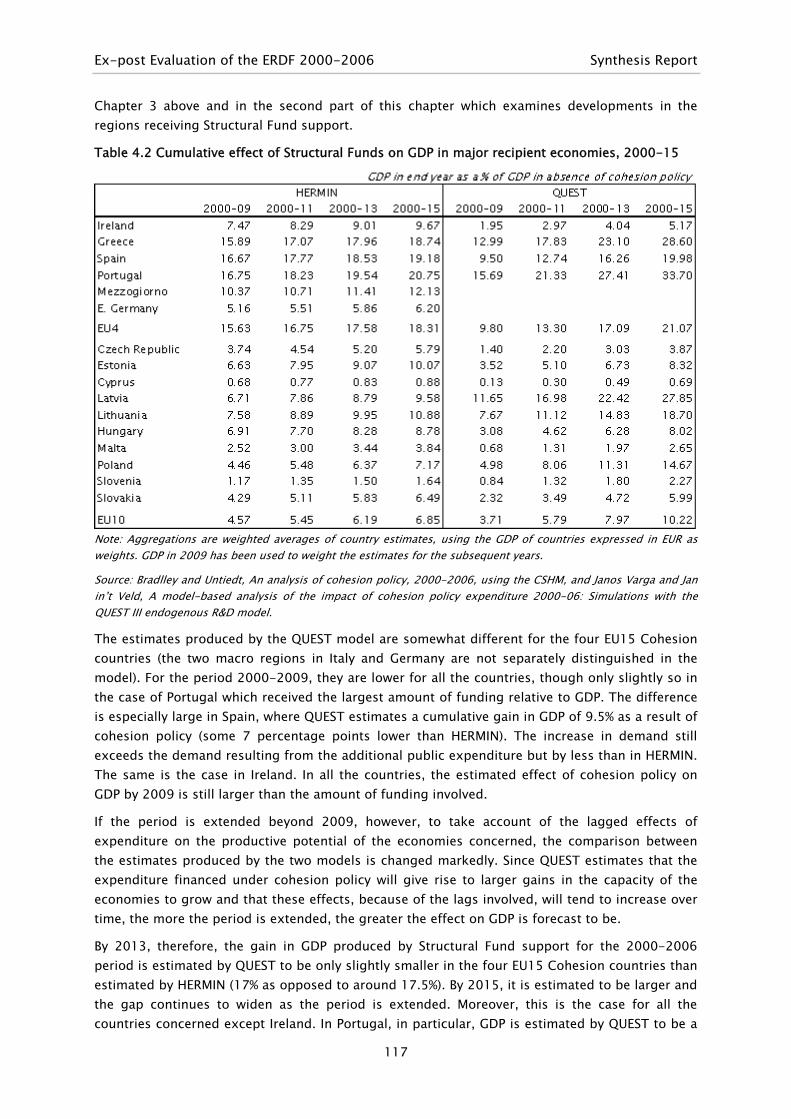
Ex-post Evaluation of the ERDF 2000-2006 Synthesis Report
117
Chapter 3 above and in the second part of this chapter which examines developments in the regions receiving Structural Fund support.
Table 4.2 Cumulative effect of Structural Funds on GDP in major recipient economies, 2000-15
Note: Aggregations are weighted averages of country estimates, using the GDP of countries expressed in EUR as weights. GDP in 2009 has been used to weight the estimates for the subsequent years.
Source: Bradlley and Untiedt, An analysis of cohesion policy, 2000-2006, using the CSHM, and Janos Varga and Jan in’t Veld, A model-based analysis of the impact of cohesion policy expenditure 2000-06: Simulations with the QUEST III endogenous R&D model.
The estimates produced by the QUEST model are somewhat different for the four EU15 Cohesion countries (the two macro regions in Italy and Germany are not separately distinguished in the model). For the period 2000-2009, they are lower for all the countries, though only slightly so in the case of Portugal which received the largest amount of funding relative to GDP. The difference is especially large in Spain, where QUEST estimates a cumulative gain in GDP of 9.5% as a result of cohesion policy (some 7 percentage points lower than HERMIN). The increase in demand still exceeds the demand resulting from the additional public expenditure but by less than in HERMIN. The same is the case in Ireland. In all the countries, the estimated effect of cohesion policy on GDP by 2009 is still larger than the amount of funding involved.
If the period is extended beyond 2009, however, to take account of the lagged effects of expenditure on the productive potential of the economies concerned, the comparison between the estimates produced by the two models is changed markedly. Since QUEST estimates that the expenditure financed under cohesion policy will give rise to larger gains in the capacity of the economies to grow and that these effects, because of the lags involved, will tend to increase over time, the more the period is extended, the greater the effect on GDP is forecast to be.
By 2013, therefore, the gain in GDP produced by Structural Fund support for the 2000-2006 period is estimated by QUEST to be only slightly smaller in the four EU15 Cohesion countries than estimated by HERMIN (17% as opposed to around 17.5%). By 2015, it is estimated to be larger and the gap continues to widen as the period is extended. Moreover, this is the case for all the countries concerned except Ireland. In Portugal, in particular, GDP is estimated by QUEST to be a

Synthesis Report Ex-post Evaluation of the ERDF 2000-2006
118
third higher in 2015 as a result of EU funding over the programming period and in Greece, almost 29% higher. Although the estimates produced by HERMIN are smaller, it is still the case that they are substantial – a gain to GDP by 2015 of around 19-21% in Greece and Portugal as well as in Spain.
A similar difference between the estimates produced by the two models is evident for the EU10 countries. For the 10 taken together, GDP is estimated by HERMIN to have been around 4.5% higher in 2009 as a result of Structural Fund support and by QUEST to have been just over 3.5% higher. If the period is extended to 2011, however, the two models generate similar estimates of the effect – the gain to GDP being around 5.5% in both cases. At the same time, for 6 of the 10 countries – all except Latvia, Lithuania, Poland and Slovenia (for which the estimates are much the same) – HERMIN estimates a larger gain than QUEST and this remains the case if the period is extended to 2015.
Again, despite the differences in scale and timing, according to both the models, the effect of cohesion policy in raising GDP is substantial in the countries receiving a relatively large amount of financial aid.
4.1.6 The net effect of cohesion policy on GDP across the EU
As noted above, the QUEST model enables estimates to be made of the effect of raising taxes to pay for cohesion policy as well as of the effect of the expenditure which it finances. These estimates indicate that, overall, the funding provided by policy for the 2000-2006 period had a positive effect on GDP growth in the EU even if account is taken of the depressing effect in countries which were net contributors to the funding of cohesion policy.
GDP in the EU25 as a whole, therefore, is estimated to have been 0.7% higher in 2009 as a result of cohesion policy over the 2000-2006 period, in the sense that the positive effect on countries which were net recipients of financial aid from the Structural Funds outweighed the adverse effects on the countries mainly responsible for raising the finance for the Funds (Table 4.3)41.
Moreover, the net beneficial effect on GDP tends to increase over time as the lagged effects on raising productive potential in recipient countries come through. By 2015, GDP in the EU25 is estimated to be 2.4% higher as a consequence of the support provided for the 2000-2006 period and in 2020, 4% higher.
The implication is, therefore, that, according to the QUEST model, the cohesion policy conducted over the 2000-2006 programming period is likely to add 0.2% a year to average GDP growth in the EU25 between 2000 and 2020 – i.e. effectively increasing the average growth rate of around 2% a year by 10%.
In overall terms, therefore, cohesion policy over the programming period is estimated not only to have boosted economic growth in the countries which received funding but to have strengthened the capacity for growth of the EU as a whole.
41 Bulgaria and Romania, which are included in the model estimates, are excluded here since they accounted for an extremely small amount of EU funding over the period (from ISPA).
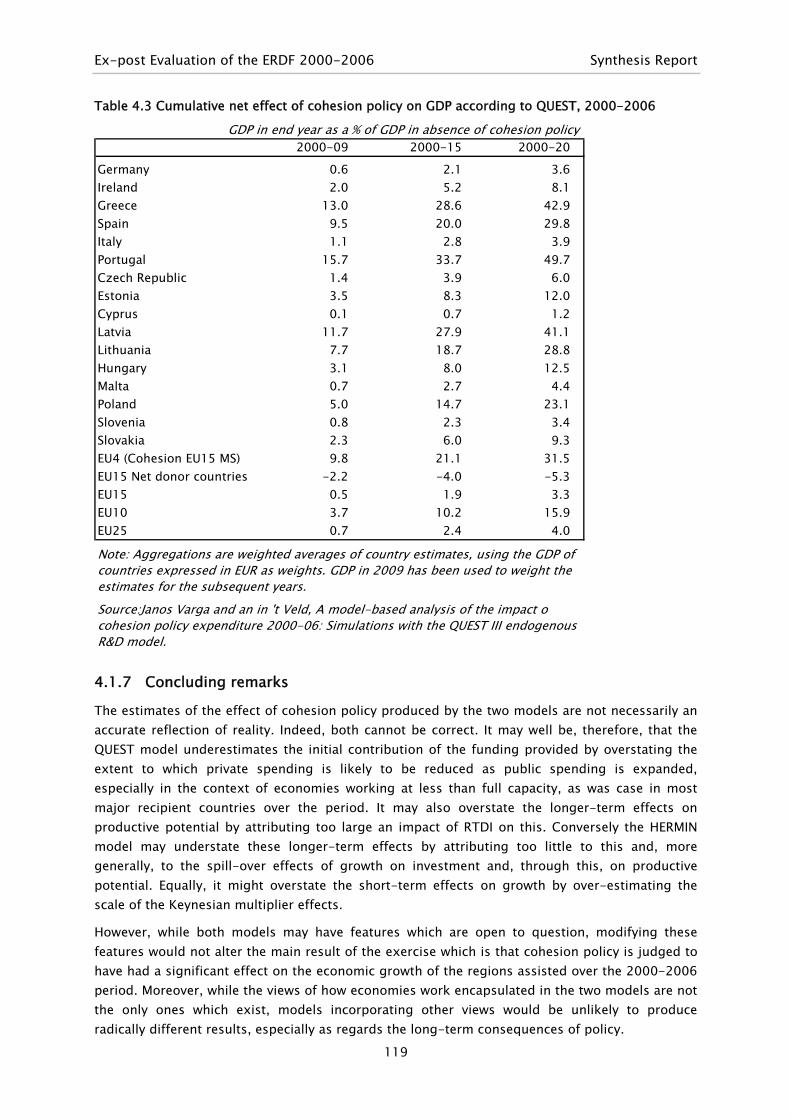
Ex-post Evaluation of the ERDF 2000-2006 Synthesis Report
119
Table 4.3 Cumulative net effect of cohesion policy on GDP according to QUEST, 2000-2006
GDP in end year as a % of GDP in absence of cohesion policy2000-09 2000-15 2000-20
Germany 0.6 2.1 3.6Ireland 2.0 5.2 8.1Greece 13.0 28.6 42.9Spain 9.5 20.0 29.8Italy 1.1 2.8 3.9Portugal 15.7 33.7 49.7Czech Republic 1.4 3.9 6.0Estonia 3.5 8.3 12.0Cyprus 0.1 0.7 1.2Latvia 11.7 27.9 41.1Lithuania 7.7 18.7 28.8Hungary 3.1 8.0 12.5Malta 0.7 2.7 4.4Poland 5.0 14.7 23.1Slovenia 0.8 2.3 3.4Slovakia 2.3 6.0 9.3EU4 (Cohesion EU15 MS) 9.8 21.1 31.5EU15 Net donor countries -2.2 -4.0 -5.3EU15 0.5 1.9 3.3EU10 3.7 10.2 15.9EU25 0.7 2.4 4.0
Source:Janos Varga and an in 't Veld, A model-based analysis of the impact o cohesion policy expenditure 2000-06: Simulations with the QUEST III endogenous R&D model.
Note: Aggregations are weighted averages of country estimates, using the GDP of countries expressed in EUR as weights. GDP in 2009 has been used to weight the estimates for the subsequent years.
4.1.7 Concluding remarks
The estimates of the effect of cohesion policy produced by the two models are not necessarily an accurate reflection of reality. Indeed, both cannot be correct. It may well be, therefore, that the QUEST model underestimates the initial contribution of the funding provided by overstating the extent to which private spending is likely to be reduced as public spending is expanded, especially in the context of economies working at less than full capacity, as was case in most major recipient countries over the period. It may also overstate the longer-term effects on productive potential by attributing too large an impact of RTDI on this. Conversely the HERMIN model may understate these longer-term effects by attributing too little to this and, more generally, to the spill-over effects of growth on investment and, through this, on productive potential. Equally, it might overstate the short-term effects on growth by over-estimating the scale of the Keynesian multiplier effects.
However, while both models may have features which are open to question, modifying these features would not alter the main result of the exercise which is that cohesion policy is judged to have had a significant effect on the economic growth of the regions assisted over the 2000-2006 period. Moreover, while the views of how economies work encapsulated in the two models are not the only ones which exist, models incorporating other views would be unlikely to produce radically different results, especially as regards the long-term consequences of policy.
Synthesis Report Ex-post Evaluation of the ERDF 2000-2006
120
The main area of uncertainty is not so much how economic forces responded to structural intervention over the period but more whether the intervention concerned produced the expected output and led to the expected results. This is the theme of the remainder of this chapter, which, in addition, considers the differences across regions in different parts of the EU and the effect of policy on territorial balance.
4.2 THE EFFECT OF COHESION POLICY ON THE REGIONS ASSISTED The concern here is to examine developments in the regions receiving assistance from the Structural Funds in more detail, focusing in particular on those which were in receipt of the most support and taking account of the national context in which the regions concerned were developing. This is intended to complement Chapter 3 above, which considered the achievements of policy across the EU in the main policy areas, and to extend the analysis in Chapter 2, which reviewed the growth performance of the regions assisted. It is also intended to add corroborating evidence to the results of the model simulations which suggest that the Structural Funds can be expected to have boosted productive potential considerably in the countries receiving a significant amount of support. The aim is not so much to review developments in the regions as such but to relate these to the results of the evaluations of particular policy programmes carried out in the Member States concerned as well as the findings of the various studies undertaken as part of the ex post evaluation.
The regions are considered in the following order:
• Objective 1 regions in EU15 Member States receiving most funding in relative terms – i.e. those in Portugal, Greece, Spain, Italy, Germany and Ireland, in that order;
• Objective 1 regions in EU15 countries receiving a smaller amount of support – i.e. those in the UK, France, Finland and Sweden;
• Single Objective 1 regions in EU15 countries – i.e. those in Belgium, the Netherlands and Austria);
• Objective 1 regions in the EU10 countries which received significant assistance only from mid-2004;
• Objective 2 regions across the EU15.
4.2.1 Policy outcomes in Objective 1 regions in the EU15
Portugal
Portugal received the largest amount of assistance from the Structural Funds – and the ERDF – relative to GDP over the 2000-2006 period. It is also the country where the effect of funding on growth is estimated to have been largest by the two macroeconomic models. In practice, as indicated in Chapter 2, growth of GDP per head in Portugal lagged behind the EU25 average over the period having significantly exceeded it over the preceding 5 years. Without EU funding, therefore, the evidence is that growth in Portugal would have lagged even further behind that in other parts of the Union.
A key factor underlying the slow growth was the decline of traditional export industries, especially textiles, coupled with the limited success of developing new growth sectors in the context of a work force with the lowest education levels in the EU. In addition, slow growth led to rising budget deficits which triggered fiscal restraint and substantial cutbacks in government investment (which was reduced from 4% of GDP in 2000 to only just over 2% of GDP in 2008).

Ex-post Evaluation of the ERDF 2000-2006 Synthesis Report
121
Cutbacks in public investment reinforced the importance of cohesion policy funding for development expenditure, a point explicitly recognised in a number of national evaluations. (For example, according to the Updated Mid-term evaluation in the Norte region – the centre of the textile industry and particularly badly affected by its decline – the availability of EU funding was decisive in supporting both public and private investment.)
In addition to supporting investment in improving education levels (which accounted for just over 21% of the total Structural Funds received), cohesion policy was directed to two main areas, transport and territorial development, combined with social infrastructure. Investment in transport continued to have the major role that it had in previous programming periods, on the grounds that there was still a need for further investment, partly to strengthen the economy in the context of globalisation, partly to restructure the urban system (as stated in CSF III).
According to evaluations42, the main achievements were:
• an improvement in the quality of transport systems in general and a decline in travel time, with a consequent increase in accessibility of the main concentrations of population and centres of economic activity, contributing to better spatial balance;
• the construction of by-passes around a number of cities which took traffic away from urban centres, so reducing environmental damage;
• the construction of the Oporto Metropolitan Surface Train System which had similar beneficial effects on the urban environment as well as reducing congestion and travel time.
In the territorial policy area, there was substantial investment in social infrastructure, mainly to further social cohesion but also territorial balance. As emphasised in policy documents (CSF III), ‘it is crucial to support interventions directed towards the reinforcement of social solidarity, that take the citizens needs into account, mainly the most deprived population groups’). The outcome was:
• the construction of facilities and the provision of support for children, young people, the elderly, people with disabilities and other vulnerable groups in a number of regions;
• the urban renewal of 28 cities across the country along with smaller measures in 12 other towns and cities, five of which were classified by UNESCO as World Heritage sites, which had the effect not only of increasing tourism but also improving the environment for those living there.
Support also went to investment in improving the natural environment, resulting in:
• the increased protection and cleaning-up of the coastal strip;
• an increase in water reserves;
• significant expansion in the number of people connected to clean drinking water and wastewater treatment systems, as indicated in the previous chapter.
Despite the positive achievements, the Updated Mid-term Evaluation pointed to a lack of coordination between different aspects of territorial policy, especially the absence of integrated strategies for cities, which could have further stimulated economic development.
42T he Updated Mid-term Evaluation, in particular.
Synthesis Report Ex-post Evaluation of the ERDF 2000-2006
122
Nevertheless, if Norte which suffered from special problems, is left to one side, the implementation of cohesion policy over the programming period was accompanied by a narrowing of regional disparities in GDP per head, following a widening over the preceding period. Growth in Centro, Alentejo and Açores, regions with the lowest levels of GDP per head in 2000 along with Norte, outstripped that in the rest of the country, especially in Lisboa, between 2000 and 2006, though, of course, this cannot necessarily be assumed to be the direct result of policy.
Beyond the economic, social and territorial effects, cohesion policy also led to more efficient policy-making, Substantial progress was made during the period in the monitoring, follow-up and evaluation of projects, which fed into the preparation of the plans for the 2007-2013 period and led to increased accountability, transparency and, consequently, more effective and efficient policy measures.
Greece
GDP per head in Greece converged towards the EU average over the programming period to a major extent, as indicated in Chapter 2. According to the macroeconomic models described above, the significant amount of assistance provided by the Structural Funds greatly contributed to this.
At the same time, growth was largely concentrated in the Attiki region, in Athens and the surrounding area. Regional disparities, therefore, widened over the period.
Growth was fuelled, in addition to EU funding, by an expansionary fiscal policy, to a large extent associated with preparing for the Olympic Games in Athens in 2004. The need to complete the stadiums and related infrastructure in time for the Games served to accelerate expenditure and to overcome the lengthy delays characteristic of the construction of large projects in the past. The expansion of spending led to a substantial budget deficit, which averaged almost 6% of GDP over the period43.
Cohesion policy contributed considerably to improvements in the transport network (mainly roads) which occurred over the period and which absorbed some 45% of total expenditure co-financed by the ERDF. This continued the emphasis on strengthening the transport system, evident in previous programming periods, which was regarded as a precondition for increasing access to markets in Central Europe and the Balkans as well as for improving internal connections between cities in the country.
The tangible outcome of this investment was:
• the construction of 2,115 kms of the trans-European road network, in particular the Patra-Athens-Evzonoi and Egnatia motorways, as well as road links on the islands of Kriti, Rodos, Lesvos and Kerkira;
• the time taken to travel between major cities was reduced by 16%;
• the capacity of the four main ports in the country was increased by 22% in terms of freight and by 1.5 million a year in terms of passengers;
• the completion of the Athens metro.
43 According to the Eurostat figures at the time the present evaluation was completed, though it may have been even larger. The large budget deficit was reflected in a balance of payments deficit which averaged 12% of GDP.

Ex-post Evaluation of the ERDF 2000-2006 Synthesis Report
123
In other policy areas, ERDF support helped to equip almost all primary and secondary schools with Internet connections and to install specialised ICT equipment in over two-thirds of special schools. In addition, funding contributed to the upgrading and modernisation of health services across the country.
Although much of the ERDF support went to Attiki (30% of the total), it was still less than the share of the region in total population (36%). The difference, however, was not large in relation to the substantial difference in prosperity between Attiki and the other Greek regions (GDP per head in Attiki was almost 50% higher than in the other regions taken together). Nevertheless, there was some attempt to improve regional balance by directing funding towards less-favoured rural areas (some 38% of the ERDF was spent in NUTS 3 regions classified as being remote, which accounted for 31% of population). This resulted in:
• some diversification of economic activities, such as the development of agri-tourism, and less dependence on agriculture;
• the increased connection of households to wastewater treatment systems;
• the revitalisation of cultural activities and social services that helped to maintain population in the areas concerned.
The physical features of the regions concerned, however, in particular the mountainous terrain and the fact that many of them are islands, as well as the lack of large towns or cities to act as growth centres, limited what was achieved in terms of economic development.
Cohesion policy is reported to have had a much wider effect than the simple provision of funding. In particular, in the absence of EU intervention, it is considered unlikely that attention would have been paid to gender equality and to developing integrated urban strategies or that there would have been the same focus on the structural problems of the economy.
In addition, cohesion policy helped to create a culture of programming and planning, mechanisms for the design and implementation of policy measures and encouragement for the involvement of local and regional authorities and other interested parties in the development process.
However, despite the improvements over previous periods, there remained a lack of a coherent overall development strategy and of effective means of coordinating the activities of various departments and authorities involved in development policy. Though the Ministry of Economy and Finance played a coordinating role, the approach adopted to planning and implementation was largely sectoral with responsibility divided between many different Ministries.
Monitoring and implementation systems were improved over the period, as reflected in the relatively high level of expenditure at the end of 2008 as compared with the allocation of funding. Nevertheless, despite the increased use of technical assistance, only limited evidence was compiled on the effectiveness of expenditure over the programming period which could inform the future design of policy. Few evaluations were carried out and, in many cases, those that were undertaken were limited, delayed and often not open to public scrutiny.
Moreover, the focus of monitoring programmes was largely on financial and contractual aspects rather than on physical indicators of progress, which tended to be inconsistent, unreliable and incomplete.
For the situation to improve, however, it is not simply a matter of devising more effective procedures and better indicators. There also needs to be a fundamental change in the official attitude towards evidence-based policy-making, which was unsympathetic throughout the programming period, and an acceptance of its critical importance.
Synthesis Report Ex-post Evaluation of the ERDF 2000-2006
124
Spain
The amount of EU funding going to Objective 1 regions in Spain over the 2000-2006 programming period was only slightly less than in Portugal or Greece in relation to the GDP of the regions concerned – just under 1% a year. Although their estimates of the scale differ, both macroeconomic models indicate that, together with the Objective 2 funding, this should have had a significant effect on economic growth.
In practice, GDP per head in Spain converged markedly towards the EU average over the period. At the same time, disparities in GDP per head narrowed as growth was higher, on average, in the Objective 1 regions than in the rest of the country. This contrasts with the experience in the previous period when disparities widened.
Much of the growth concerned stemmed from increased employment rather than increases in productivity, which remained almost unchanged over the period. This pattern of growth was much the same across regions. To some extent, it reflects the composition of growth which was heavily dependent on construction, partly due to the expansion of public investment in infrastructure, fuelled in turn by the Structural Funds.
Much of the investment went into rectifying deficiencies in the transport network, which had been a priority in the preceding programming period. The result was:
• an improvement in both links between regions and within them, leading to reductions in journey times and increased accessibility;
• progress in completing the Trans-European Networks;
• the construction of connections between these and regional networks;
• modernisation of the railways and the construction of high-speed rail lines, coupled with the expansion of port facilities.
The ERDF, in conjunction with the Cohesion Fund, also contributed to investment in environmental infrastructure, in extending mains water supply, in particular. This resulted in an expansion of water reserves and reduced pressure on groundwater supplies as well as an increase in the number of people connected to water mains, with benefits to agriculture and tourism in addition to people living in the regions concerned.
In addition, EU funding supported investment in wastewater treatment plants and the extension of main drainage. The number of such plants is estimated to have almost doubled over the period (from 1,326 to around 2,500), while, in 2006, some 98% of the population in Objective 1 regions was connected to main drainage as opposed to 79% in 1999.
The investment not only added to water reserves and reduced pollution, so improving the quality of life in these regions, especially in the more rural parts, but by so doing it strengthened their economies, dependent to a large extent on agriculture and tourism, as well as increasing the sustainability of development.
In general, according to evaluations, in addition to adding significantly to the financial resources available for both regional and local development, EU intervention has been largely responsible for the ‘modernisation’ of regional policy, by highlighting the importance of the business environment, RTDI, human resource development and protecting and improving the natural environment. All regions formulated their own RTDI plans, in some cases for the first time, during the programming period and carried out evaluations of regional policy prior to establishing new plans.

Ex-post Evaluation of the ERDF 2000-2006 Synthesis Report
125
Structural Fund support has also resulted in important national programmes being initiated which, it is considered, would otherwise not have been undertaken. These include:
• Programa AGUA (2004-2008), for improving the management of water reserves,
• Plan AVANZ@ (2005-2010), for reducing the digital divide between Spain and the rest of the EU;
• Torres Quevedo, for supporting research and technology in SMEs.
Moreover, there have also been wider consequences of EU support:
• the funding provided under cohesion policy helped attract foreign investment which increased from 11% of total investment in 1998 to an average of almost 18% by the end of the period in Objective 1 regions;
• multi-annual programming brought a more stable policy environment, encouraging longer-term planning in Spanish regions and reducing the effects of political changes on policy;
• the requirement for partnership resulted in a wider range of organisations becoming involved in development projects;
• the management model of Community policies, based on strategic planning and continuous monitoring and evaluation, has permeated into national policy-making resulting in a more effective use of public resources.
Italy
The finance from the Structural Funds in support of the Southern Italian Objective 1 regions was less than for the countries considered above primarily because they were not covered by the Cohesion Fund. Finance from the ERDF was also less in relation to GDP, though only slightly smaller than in Spain (0.8%). The macroeconomic model estimates indicate that this funding is likely to have added significantly to their growth over the programming period.
In fact, GDP per head increased by more in the regions concerned than in the rest of the country between 2000 and 2006, though the difference was marginal and the rate of growth in both the North and South of Italy was much below the EU average, at only around 1% a year.
This suggests, first, that economic growth in the Objective 1 regions would have been close to zero without support of EU funding; secondly, that the national context over the period was not conducive to their economic development. This is all the more the case since government investment was reduced over the period, along with the transfers to the Southern regions as part of a policy of increased regional autonomy.
Consequently, a major effect of EU funding in Objective 1 regions was to compensate, at least to some extent, for the reduction in national support and so avoid a widening of disparities with the rest of Italy. However, it had only limited success in tackling the wide-ranging factors at the root of their lagging development. Nevertheless, it did help in the pursuit of the two main aims of policy –to increase regional attractiveness through investment in infrastructure and to increase the efficiency and effectiveness of public administration through institution building.
EU funding, and more importantly the requirement for programming which went with it, also obliged national authorities to focus their attention on the drivers of development. Before 2000, there was no ICT or RTDI strategy in Objective 1 regions and cohesion policy forced the authorities to define these explicitly. In practice, the ERDF and the co-financing that went with it

Synthesis Report Ex-post Evaluation of the ERDF 2000-2006
126
accounted for around half of the total public resources devoted to RTDI in these regions over the period. Moreover, it had some success in the form of:
• fostering an increase in expenditure and involvement of enterprises in R&D activities;
• funding good quality projects, even if these were mainly aimed at encouraging the adoption of up-to-date, but already available, technology, rather than supporting new innovation;
• some 90% of the research projects funded resulting in the products concerned being produced or the processes being adopted;
• helping to establish new links between businesses and research centres, 50% of the projects funded leading to such links being formed.
The effectiveness of the programme, however, was marred by the length of administrative procedures (selection and contracting) and by a monitoring system limited to administration rather than the identification of results which could inform future project selection.
Other elements of enterprise support policy in Objective 1 regions were less successful. Evaluations point to the limited effects of investment grants, their large deadweight costs and a lack of a clear industrial policy against a background of globalisation which affected lagging regions disproportionately and gave rise to the need for shifts in the structure of economic activity.
Although local infrastructure was built and public services were generally improved over the period, with positive effects on the quality of life, the gap in these respects in relation to the North of Italy remained wide. Moreover, the improvements proved insufficient to attract new investment, partly because investment was fragmented, often on a small scale and not part of a wider strategic plan.
Nevertheless, in many rural areas, historical centres were saved from ruin, so increasing their tourist potential as well as improving the local quality of life. The projects concerned also encouraged local partnership and greater participation of local people in decision making.
At the same time, cohesion policy contributed to the fight against organised crime, which has long been a major obstacle to economic development in the South of Italy. While it was not the principal cause, it was one factor behind the growing refusal of businesses to put up with criminal extortion as in the past, which is gradually enabling a stronger market economy to emerge.
The attempt to improve the effectiveness of public administrations also had some success, if limited. Although the ‘n+2’ rule was almost fully respected and the funding available was spent, major reasons for this were:
• the widespread use of ‘pre-funded’ projects, or those which were already underway and, in some cases, nearing completion and had received funding from other sources (at the beginning of 2008, such projects accounted for over a third of the total value of the main Operational Programmes44);
• the prevalence of small projects, which were easier to manage or replace by others if problems arose, with a consequent fragmentation of intervention.
44 The largest use was in the Transport OP (71%) and the Campania OP (43%). See National report on ‘Freed resources’ in Objective 1, DPS, 2008.

Ex-post Evaluation of the ERDF 2000-2006 Synthesis Report
127
The preference of the administrative authorities for small projects was reinforced by the complicated nature of the bureaucracy, which discouraged large-scale projects from being initiated.
Equally, monitoring and evaluation increased in importance and all programmes were subject to both according to EC guidelines. However, while evaluations provided a large amount of information:
• this was often interpreted in a very formal and restricted way and was not put to constructive use;
• the evaluation units in the Ministries and regions spread a culture of evaluation but failed to increase true evaluation capacity, since many relatively simple and routine tasks were contracted out to technical assistance agencies, so preventing internal staff from gaining know-how and building capacity.
Germany
Support from the Structural Funds going to the Objective 1 regions in the East of Germany over the period 2000-2006 was slightly smaller in relation to their GDP than in the Southern Italian regions (at around 0.65%), most of it coming from the ERDF, though if Berlin (part of which received phasing-out funding under Objective 1 and part, Objective 2 funding) is excluded, the relative amount is increased closer to that in Italy.
Germany like Italy experienced relatively slow growth of GDP per head over the period, if not quite so slow (around 1.4% a year). Growth in the Objective 1 regions, excluding Berlin, however, was much faster than in the rest of the country (around 2.5% a year), so that regional disparities narrowed over the period. According to the HERMIN model, the Structural Funds are likely to have contributed significantly to this narrowing.
At the same time, there are marked differences across the Objective 1 regions, which tended to widen over the period, with the less prosperous regions in the North (Mecklenburg-Vorpommern and Brandenburg) growing at a much slower rate than the more prosperous ones further South (Halle, Dresden and Magdeburg).
Like in Italy too, EU funding compensated in some degree for the reduction over the period in national funds for investment, which remained small as compared with the amounts devoted to assisting the development of these regions in the first half of the 1990s. Nevertheless, national funds, made available under the ‘Joint Task’ (Gemeinschaftsaufgabe "Verbesserung der regionalen Wirtschaftsstruktur"), which is partly financed by the Structural Funds, represented the major source of support.
As compared with the Joint Task, which was focussed on investment grants to companies and infrastructure, the ERDF was wider in scope and gave the Länder receiving assistance45 the chance to formulate a reasonably comprehensive development strategy containing a wide-ranging package of measures. In most cases, there was a growing emphasis on clusters and growth poles, which was reflected in the concentration of support on specific sectors of activity or on major cities.
Much of the funding went to strengthening SMEs and supporting RTDI, which led to:
45 In Germany, the Länder, which correspond with NUTS 1 rather than NUTS 2 regions, represent the regional level of government responsible jointly with the Federal authorities for formulating development strategies.

Synthesis Report Ex-post Evaluation of the ERDF 2000-2006
128
• some 278,350 gross jobs being created or maintained between 2000 and 2004;
• around 8,460 SMEs in Berlin, Brandenburg, Mecklenburg-Vorpommern and Sachsen receiving investment support;
• some 1,022 business start-ups in Berlin, Brandenburg and Mecklenburg-Vorpommern;
• some 2,065 RTDI projects being funded in Brandenburg, Mecklenburg-Vorpommern and Saxony;
• the improvement of telecommunications and the provision of equipment in universities and research institutes in Thüringen;
• the development of institutes of applied research (Fraunhofer-institutes) in Sachsen, amounting to around 46,000 square metres of floor space and establishing cooperation with 380 enterprises.
At the same time, a significant though slightly smaller amount of funding went to improving transport networks, designed to bring the standard closer to that in the Western part of the country, and resulting in the construction or upgrading of several thousand kms of roads, motorways and railway lines, with the emphasis on the last (which accounted for over half of the ERDF going to transport).
In addition, a similar amount of support went to environmental projects, in particular to investment in wastewater treatment plants and sewage pipelines and to the clean-up and regeneration of urban areas (in Sachsen, for example, funding was provided to projects in 26 separate towns and cities), with the aim of increasing the attractiveness of the regions concerned and improving the quality of life.
Expert opinion is that that a large part of the investment in RTDI in Objective 1 regions would not have taken place without EU funding. It is also likely that experimentation with innovative measures would have been more limited.
While the Structural Funds in Germany are integrated into existing arrangements for supporting regional development, which reduces the potential for innovation, there were, nevertheless, some innovative aspects. These include:
• the pursuit of a strategy integrating the activities of different Departments, which is not the norm in Germany but which was enforced by the programming approach;
• the adoption of systems for monitoring and evaluating expenditure, which for the most part did not exist before in respect of regional policy.
Ireland
High and sustained growth in Ireland over the previous programming period meant that by 2000, GDP per head was considerably above the EU average. Much of the growth, however, had been concentrated in Dublin and the surrounding area as well as in the South-East of the country.
The disparity between these parts and the rest of Ireland was explicitly recognised by the division of the county into two NUTS 2 regions for the 2000-2006 programming period. The effect was that the Border, Midland and Western (BMW) region remained eligible for EU funding under Objective 1, while the Southern and Eastern (SE) region received phasing-out funding.
At the same time, the amount of funding from the ERDF and Cohesion Fund together was reduced significantly (to only around 0.2-0.3% of GDP). Accordingly, the ERDF accounted for only around
Ex-post Evaluation of the ERDF 2000-2006 Synthesis Report
129
10% of overall financial support going to regional development over the programming period, considerably less than before.
Growth of GDP per head in Ireland continued to be well above the EU average throughout the period. The rate was much the same in the two regions, so that the disparity between them in these terms also remained unchanged. This disparity, however, arises partly from commuting from the BMW region to the SE and partly from the relative concentration of multinational companies in the SE region. Since much of the profits of these companies go abroad, the difference in terms of income per head is much smaller. This difference seems also to have remained much the same over the period.
Cohesion policy very much supported national development policy over the programming period, the aim being to channel development away from Dublin and improve infrastructure and the business environment in less favoured areas, in large part to attract inward investment.
In practice, the ERDF was concentrated very much on improving transport links both within and around Dublin to ease congestion in the city and between towns and cities across the country to reduce travel time and increase the accessibility of the more remote areas. The result was:
• the completion of 555 kms of motorway, including between Dublin and Galway and between Kilkullen and Waterford, with significant savings in travel time;
• the upgrading and expansion of capacity on the mainline rail network, resulting in time savings of 38 minutes overall and much improved links to Dublin from Galway, Ballina and Sligo;
• the Dublin Port Tunnel road, relieving congestion in the city;
• the completion of the Dublin ring road, to avoid traffic having to go through the city;
• the completion of the LUAS light railway in Dublin, though the effect on travel times and congestion was reduced by the separation of the two lines;
• the completion of phase 1 of the DART upgrade around the coast in Dublin to take traffic off the roads;
• a Rural Transport Initiative which piloted local bus services for rural communities to improve their access to services and to encourage more people to remain in the areas concerned, so reducing depopulation.
The projects were carried out in the context of rapid population growth, stemming largely from inward migration, which led to a similarly rapid growth of traffic, fuelled in addition by rising real income levels. The observed easing of congestion and reduction in travel times were, therefore, relatively small, though there is no question that without the projects being undertaken, the situation would have worsened considerably in both respects.
Funding, though on a much smaller scale, also went to support investment in telecommunications which led to increased access to broadband for SMEs in rural areas in both the BMW and SE regions.
These areas were also the main target of support to environmental infrastructure which resulted in:
• some 770 thousand additional people being connected to clean drinking water supply;
• the construction and upgrading of wastewater treatment plants, adding sufficient capacity to meet the needs of over 3 million people.

Synthesis Report Ex-post Evaluation of the ERDF 2000-2006
130
In addition, a similar amount of funding from the ERDF went to RTDI intended to assist the development of specialist research centres across the country as well as the adoption of new technology by SMEs. This, however, was less effective in the BMW region than in the SE because of the more limited ability of the centres and firms concerned to absorb the funding.
Although there was no apparent narrowing of the disparity between the two regions between 2000 and 2006 as a result of these various measures, their effect may have been to prevent a further widening.
At the same time, it is difficult to say whether regional development became more balanced over the period in terms not only of the difference between the two regions but equally importantly of those between urban and rural areas within the two regions. This was a major objective of development policy but no coherent set of indicators were devised to monitor progress in this respect.
The main effects of cohesion policy, however, were arguably:
• to focus attention on the widening disparity between Dublin and the rest of the country and the concentration of economic growth in the former, which was unsustainable in the long-term, and so to encourage the adoption of a regional rather than a national strategy;
• to contribute to the development and expansion of multi-annual programming, the more extensive adoption of a partnership approach at national and local level and to more monitoring and evaluation of programmes..
UK
The UK was a net contributor to the funding of cohesion policy over the 2000-2006 period. Nevertheless, the four regions eligible for full funding under Objective 1 (Merseyside, South Yorkshire, Cornwall and Isles of Scilly and West Wales and the Valleys) and the two eligible for phasing-out funding (Highlands and Islands in Scotland and Northern Ireland) between them received an amount from the ERDF equivalent to around 0.4% of their GDP. Moreover, these regions together accounted for just under 12% of UK population, not so much less than Objective 1 regions in Germany (around 18%). Nevertheless, the amount of EU funding received was small in relation to that from the national government, though the ERDF was involved in a number of high profile projects, as indicated below.
The rate of growth of GDP per head of all 6 of regions assisted exceeded that of the non-assisted regions in the UK over the period (on average by 0.7% a year).
In all the regions, the main focus of development policy, to which the ERDF contributed, was on strengthening business competitiveness which was achieved through:
• supporting SMEs, both directly and indirectly through the provision of advice, services and access to finance, to assist them to modernise and diversify (by end- 2006, over 70,000 SMEs had received assistance);
• improving transport networks, such as by converting Newquay airport in Cornwall from military to civilian use and by completing the Liverpool South Parkway Interchange in Merseyside, which provides fast links to Liverpool John Lennon Airport as well as access to up to 11,000 planned jobs in the vicinity;
• improving telecommunications, including the provision of broadband to the whole of Cornwall and the Isles of Scilly;

Ex-post Evaluation of the ERDF 2000-2006 Synthesis Report
131
• regenerating urban areas, such as in market towns in Cornwall or the Sheffield city centre in South Yorkshire.
Most of the projects concerned were conceived to bring about long-term changes in the underlying economic structure and social capital of problem regions, so that the full effect will not become evident for some years.
In addition, the environmental implications of projects were explicitly taken into account in all programmes. Those for business support, for example, were encouraged to include measures to improve resource efficiency and waste management, while some programmes established Environmental Advisory Groups and others nominated “Environmental Champions” to be among those involved in project delivery.
Moreover, there are a number of examples of mobilising local involvement in projects, both to make use of and develop local know-how and capacity for action. Examples include:
• the formation of Local Strategic Partnerships, such as in the Sheffield City Centre regeneration programme in South Yorkshire or between the University of the Highlands and Islands and private sector organisations in the region;
• the assistance provided to 11,419 community groups in West Wales and the Valleys to engage in projects aimed at the regeneration of deprived areas;
• the financial support to community-based groups in the Highlands and Islands region to increase both the quality and scale of programmes, through the recruitment of skilled staff, and to enable them to attract additional matching funding.
According to the UK Government, the Structural Funds have been an important source of additional funding for local authorities, universities and the third sector. They have also:
• made it possible to plan economic development over a longer time-frame than most other funding sources allow;
• encouraged the direct involvement of a wide range of partner organisations;
• brought enhanced transparency, co-operation and co-ordination in the design and delivery of regional development policy, and better quality intervention as a result.
France
In France, the only regions receiving full Objective 1 funding over the 2000-2006 period were the four DOMs (the Overseas Departments) – Guadeloupe, Martinique, Guyane and Réunion – though Corse and parts of Nord Pas de Calais were in receipt of phasing-out support. While the latter two regions received only a relatively small amount of funding, support for the four DOMs amounted to around 1% of their GDP. Together, however, they account for under 3% of the population of France.
Their average GDP per head was only just over 60% of the EU25 average in 2000 and over 40% below the average for France, with the least prosperous region, Guyane, having a level only 50% of the EU average and the most prosperous Martinique, one of 70% of the average. Between 2000 and 2006, their GDP per head, on average, increased by more than in the rest of France, though by less in Guyane. Structural Fund support almost certainly contributed to the catching up in the three DOMs where this occurred.
Guyane is also the region with the smallest population (around 166,000 at the beginning of the period), but the one which grew most rapidly over the period (by 4% a year, so that by 2006).

Synthesis Report Ex-post Evaluation of the ERDF 2000-2006
132
Population increased in the other regions as well, but by much less – by well under 1% a year in Guadeloupe and Martinique and by just under 1.5% in Réunion – reflecting outward migration.
In the two Objective 1 phasing-out regions, growth of GDP per head was slightly higher than in non-assisted regions in France over the period.
All four DOMs have similar features which tend to inhibit development:
• geographical remoteness and so poor accessibility;
• relatively small populations and so a lack of critical mass;
• a sensitive ecological system and so environmental challenges;
• a heavy dependence on tourism and the public sector;
• a business sector mainly composed of service-related SMEs and micro enterprises, often family owned and neither export nor innovation oriented;
• a proportion of recipients of minimum income support six times the average in mainland France.
Corse shares all these features, except the last, if to a lesser extent.
The objectives of policy were also common:
• to modernise and restructure traditional sectors, especially tourism and agriculture;
• to diversify activities by supporting the development of new ones;
• to develop ICT for both individuals and businesses to improve the competitiveness of the latter and to open up new markets;
• to improve the environment and protect natural resources, in part by supporting public transport as an alternative to cars.
EU funding was, therefore, used in pursuit of these objectives. However, support was given to traditional activities and diversification was limited, as was the take-up of ICT, partly because of relatively high charges. The exception is Réunion, where growth of the ICT sector was stimulated, but only after telecommunication charges were cut significantly following the intervention of the regulatory authorities.
In the Objective 1 phasing-out part of Nord Pas-de-Calais, EU funding, in addition to supporting training to help the unemployed find work, was aimed at strengthening research capacity (in poles of excellence) but with only a limited effect on innovation in SMEs.
Although initiatives were taken to improve the management of programmes in Objective 1 regions, the effects on administrative capacity were limited. There was, however, an increase in the extent of partnership between the authorities and those involved in the implementation of programmes on the ground, which was one of the main results of EU intervention.
Finland and Sweden
Regions in Finland and Sweden which received funding under Objective 1 over the 2000-2006 period – Itä-Suomi and part of Pohjois-Suomi in the first and Mellersta Norrland and Övre Norrland in the second – share common features. In each case, they are in the North or Centre of the countries with a harsh climate for much of the year and very low population density. Although they make up most of the land mass in both countries, they account, in the case of the two Finnish regions, for only around 20% of the country’s population and, in the case of the Swedish
Ex-post Evaluation of the ERDF 2000-2006 Synthesis Report
133
regions, for just 10%. In both cases, population had been declining for some years before the beginning of the programming period.
ERDF funding amounted on average to just over 0.3% of the GDP of the regions concerned in Finland and just over 0.25% in the Swedish regions.
GDP per head in the regions in both countries is below the national average, though whereas in Sweden, it was only 8% below in 2006, in Finland, it was 21% below. In both cases, growth of GDP per head over the period was above the national average, whereas it has been significantly below the national average in the preceding 5 years. In both cases, population continued to decline over the period, but in the Swedish regions at a declining rate.
In both cases too, there were growing disparities within the regions, with a widening gap between the few urban centres and more rural and remote areas.
The development strategy co-financed by the Structural Funds was similar in the two countries:
• in Finland, to strengthen the competitiveness of local businesses through supporting innovation, investment in human capital and the local environment, as well as to provide public services on an equal basis across the country in pursuit of regional balance;
• in Sweden, to develop local industry through a knowledge-based growth strategy.
In Finland, support was mainly confined to well-managed and profitable SMEs. The evidence suggests that over 80% of the firms receiving investment grants grew as a result and new jobs were generated in about half. The aim, however, was not to expand output and create jobs directly but to do so indirectly and in a sustained way by increasing competitiveness and productivity. The evaluation evidence is that support for R&D achieved this in most cases and that R&D projects carried out jointly with research centres and large enterprises were a means for SMEs to have access to research without incurring excessive costs.
In practice, support for R&D activities in SMEs and in research centres in both Finland and Sweden contributed to raising the expenditure on R&D in Objective 1 regions in relation to GDP to well above the level in most other regions of the EU. According to Eurostat data:
• in Pohjois-Suomi, R&D expenditure amounted to 4.8% of GDP in 2006 as against a national average of 3.5% and an EU average of 1.9%;
• in Övre Norrland, it amounted to 4.5% of GDP in 2006 as compared with a national average of 3.6% and a figure of just 2.5% in 2000.
In Sweden as well as Finland, the evaluations carried out concluded that structural intervention in Objective 1 regions had succeeded not only in improving the competitiveness of SMEs but in increasing cooperation between them, including those in rural areas. It also strengthened local partnership and the willingness of people and organisations to work together and to adapt to structural change (see Box on forestry in Sweden).
The decline in agriculture and forestry and the traditional industries based on the latter, together with an ageing and declining population, has made it difficult to narrow the gap between the more remote rural areas and the rest of the country. Nevertheless, EU funding and the projects supported helped to prevent it from widening, as well as creating the potential for altering the trends over the longer-term.
Synthesis Report Ex-post Evaluation of the ERDF 2000-2006
134
Cooperation in the forestry industry in Mellersta Norrland Forestry is of major importance in the region and much of the ERDF funding went to supporting the industry. An example is the SÅGAB trade association which acted as a coordinator for projects to improve the market potential of the small and medium sized sawmills in the region. The result was the creation of a website bringing sellers and buyers of wood together, which has led to extensive networks being established between sawmills as well as with local authorities. Although the financial support provided under Objective 1 was relatively small, the results have been substantial for small firms in the industry.
In both countries, the funding received was reported to have been key to projects being carried out, with many unlikely to have been undertaken either at all or on the same scale. In the evaluation report for Södra (Mellersta Norrland), for example, it is explicitly stated that ‘the contribution from the EU and the Structural Funds is very important for actually being able to realise ideas through different initiatives.’
In addition, cohesion policy led to improvements in policy-making and the increased local involvement in the development strategy. According to evaluations, in Finland:
• the programme based approach has increased the openness and efficiency of regional policy and given more powers to the regional level;
• EU-type systems of monitoring and evaluation have become a standard tool in national regional development programmes.
In Sweden:
• EU funding has resulted in improved organisational skills in administrative units in the regions, with consequent improvements in the selection and control of projects.
Austria, Belgium and the Netherlands
There was a single region receiving support under Objective 1 in each of Austria, Belgium and the Netherlands over the period 2000-2006. Burgenland in Austria was eligible for full funding, Hainaut in Belgium and Flevoland in the Netherlands for phasing-out support. The amount of funding going to Burgenland was, therefore, larger than in the other two, representing around 0.5% of its GDP. For Hainaut, it was only around half as large and for Flevoland, less than a third as a large.
Both Burgenland and Flevoland are relatively small regions in terms of population – just under 300,000 at the beginning of the period in the first case and just over this in the second, only 2-3% of their respective country’s total – though Flevoland is growing rapidly (by around 2.5% a year over the programming period). Hainaut is much bigger, with a population of around 1.3 million, almost 13% of the population of Belgium.
The regions are very different in terms of their characteristics – Burgenland is predominantly a rural region, Hainaut, an old industrial coal mining and steel-making region, with many people living in or around Charleroi or in other urban areas, Flevoland, a relatively new region largely reclaimed from the sea and close to Amsterdam and other centres of economic activity. All three, however, have one feature in common: all have substantial outward commuting to neighbouring regions, Flevoland most especially. This serves to reduce their GDP per head significantly since many people contribute to the GDP of other regions rather than to that of the region in which they live. GDP per head, therefore, does not reflect income levels which are much higher in all three cases.

Ex-post Evaluation of the ERDF 2000-2006 Synthesis Report
135
GDP per head in both Burgenland and Flevoland increased by more than the national average over the period (by around 0.5% or so), even after adjusting for the effect of commuting, while in Hainaut, it rose by slightly less. This, however, was an improvement over the preceding period when the gap in GDP per head between the region and the rest of the country widened appreciably.
In all three regions, especially in Burgenland and Hainaut, a central aim was to expand business activity, in Flevoland, to encourage people to work in the region rather than outside, in Burgenland and Hainaut, to replace the jobs being lost in declining sectors. The measures involved were similar but the focus differed slightly.
In Burgenland, funding was given to a broad mix of measures aimed at supporting business start-ups, the construction of new industrial sites and the expansion of business parks, the provision of risk capital to SMEs, R&D projects and the development of technology and research centres.
In Hainaut, the focus was on creating ‘hubs of competitiveness’ by supporting a limited number of sectors (aerospace, the agri-food industry, logistics and mechanical engineering) through direct support of SMEs, centres of technology and research and links between the two. The aim was to develop sufficient critical mass for the businesses concerned to be able to compete on world markets.
Among the achievements were:
• an increase in the number of business establishments by 4,400 by mid-2005 in Flevoland, implying that the target of 5,500 over the programming period would be met;
• support for around 1,600 business start-ups in Burgenland as against a target of 700.
In all three regions, EU funding also went to supporting tourism and renovating and regenerating both urban areas and rural villages. In Burgenland, this was part of an attempt to ensure a more balanced pattern of development between the North of the region, which is close to Vienna, and the South and Centre. By the end of 2006, the number of beds in the higher quality end of the tourist industry had been increased by 2,500, 500 more than the target, through support directed at spa locations in the South and Centre.
However, in all three regions difficulties were encountered in pursuit of the development strategies, especially as regards stimulating the growth of SMEs in problem regions in more technologically advanced activities:
• in Burgenland, evaluations reported the problems of developing of research centres in structurally weak regions, where the potential to initiate innovation-oriented projects is limited;
• in Hainaut, because of the limited take-up, only 15% of risk capital was, in practice, allocated to innovation activities, while wholesaling, retailing, restaurants and hotels together accounted for 70% of the funds made available;
• in Hainaut again, despite the aim of increasing the capacity of SMEs to absorb new technology, according to the updated mid-term evaluation, the main recipients of R&D support were not small but large enterprises, which to a large extent would probably have undertaken the expenditure concerned anyway.
In Flevoland, where there was less emphasis on RTDI, funding stimulated the creation of new businesses and led to growth in local employment, so contributing to more balanced development.

Synthesis Report Ex-post Evaluation of the ERDF 2000-2006
136
In all three cases, the evaluations carried out emphasised the beneficial effect of EU funding, and the delivery system associated with it, on the policies implemented as regards not only the development of the regions concerned but also more widely.
In Burgenland, it was reported that despite the high administrative costs and deterrent effect on SMEs, cohesion policy:
• enabled forward planning to be undertaken with clear aims and certainty of finance and, accordingly, facilitated integrated development programmes with long-term objectives to be formulated;
• encouraged closer coordination between national and regional authorities as well as local involvement;
• increased the importance attached to evaluation;
• facilitated the establishment of inter-regional networks to exchange information and experience
In Hainaut, according to evaluation reports, EU support:
• enabled projects to be implemented which would not otherwise have been possible;
• enabled those which would have been undertaken to be carried out on a larger scale, so helping to achieve critical mass and, accordingly, increased effectiveness. An illustrative example is the Centre for promotion of R&D (CeRDT), set up to encourage SMEs to take innovative initiatives, which helped to create a critical mass of expertise by bringing experts together and integrating the services they provide;
• encouraged regional authorities to develop a capacity for strategic thinking, as illustrated by the creation of a task force in Région Wallonne for evaluating projects, which has helped focus attention on the overall development strategy of the region and on the measures which have the most effect on restructuring the economy in the long-run.
In Flevoland, reports point to the widespread evaluation of co-financed projects, which has encouraged the development of an evaluation culture and has led, in turn, to similar arrangements being applied to other programmes in the Netherlands.
4.2.2 Policy outcomes in Objective 1 regions in EU10 countries
Growth along with widening regional disparities
Growth of GDP per head in nearly all of the EU10 countries was relatively high from the late 1990s onwards before entry into the Union in mid-2004. After entry up until the onset of the global recession, the rate of growth increased further, fuelled in part by financial support from the Structural Funds, which was expanded considerably once they became eligible for the ERDF and the Cohesion Fund.
This was particularly the case in the Baltic States, where growth was especially rapid. Indeed, the question has been raised as to whether the financial injection involved, amounting to 1-2% of GDP a year in the three years 2006-2008 led to overheating of these economies and, accordingly, to the financial crisis which struck them in 2008 and which led, in turn, to a sharp decline in their GDP. As indicated below, however, while the funding they received added to demand, it also financed investment in infrastructure and business support which increased their capacity to sustain economic growth over the longer-term

Ex-post Evaluation of the ERDF 2000-2006 Synthesis Report
137
At the same time, high growth was associated in all countries with widening disparities in GDP per head between the urban centres, especially the capital cities, and rural areas, particularly the more peripheral ones, as economic activity, and the inward flow of foreign direct investment (FDI), was concentrated in the former.
This was as much the case in the smaller countries which were single NUTS 2 regions as the in the larger ones. In Lithuania, therefore, the difference in GDP per head between the richest county (Vilnius district) and the poorest (Taurage district) had increased to 2.6 times by the time of entry into the EU. In Latvia, the continuing widening of regional disparities between the capital, Riga, and the other regions was explained as follows:
‘due to the backwardness of the regions, educated and qualified people leave to go to Riga’ and ‘the drawbacks of the infrastructure significantly diminish the interest of entrepreneurs in developing production in the regions’46)
The effect of the Structural Funds on regional disparities
Such disparities were, therefore, of increasing concern as the plans for the 2004-2006 programming period were being prepared. These plans in nearly all countries were focused in particular on strengthening the competitiveness of businesses both directly through support for investment – and more especially, for innovation – and indirectly through improving infrastructure and the underlying conditions for enterprise development. Funding, however, was directed not only at sustaining growth of the economy as a whole but also at trying to achieve a more balanced spatial pattern of development.
The aim was, therefore, to spend relatively more in the less developed parts than in more developed ones in an attempt to reduce disparities in infrastructure, and resource endowment generally, so as to even out the capacity for growth. At the same time, it was also to provide more support to local businesses to help them to become more competitive.
This aim, however, was not always realised because of the differential capacity of regions, and the firms located there, to absorb the funding made available. In Latvia, therefore despite the aim of allocating more funding per head of population to the weaker regions, a larger share of finance went to Vidzeme, a relatively prosperous region surrounding Riga, than to Latgale, a region with one of the lowest levels of GDP per head.
In Estonia, where the aim was similar, the national report concluded that implementation was most effective in the most developed regions and attributed this to their greater preparedness to take up the measures introduced.
This was also the case in Hungary, where it is reported that the emphasis on innovation and R&D policies in the development strategy led to Közép-Magyarország, the most developed region where Budapest is situated and where research capacity is predominantly concentrated, gaining much more than others.
The higher take-up of funding by the more developed regions was reinforced by the shortness of the programming period, together with the limited experience of the authorities concerned either of managing a large volume of EU funding, and the administrative requirements which go with it, or of implementing a regional development strategy. In Poland, therefore, it was reported that, because of time pressure, most of the attention of policy-makers during the process of preparation for accession was taken up by the capacity to absorb EU support. In Hungary, the
46 Single Programming Document for the period 2004-2006.
Synthesis Report Ex-post Evaluation of the ERDF 2000-2006
138
programmes implemented tended to favour the more developed regions where there was less risk of budgets not being spent.
Nevertheless, despite the difficulties of absorption, which applied most to business support, it was still the case in Hungary that EU funding helped to reduce differences in the endowment of physical infrastructure, through construction of motorways in the lagging regions.
In the Czech Republic, the ERDF financed improvements in infrastructure in regions outside Praha, the expansion of industrial zones, science and technology parks and innovation centres and the cultivation of the business environment. This served to increase the attractiveness of the regions concerned to foreign investors, so contributing to the marked increase in FDI going to regions other than Praha over the period.
In the Czech Republic, therefore, the Structural Funds over the period 2004-2006 contributed to stabilising the disparity between the capital city region and others, which had widened appreciably in earlier years.
The development policies supported
The main programmes financed by the ERDF, as noted above, were support both to businesses, especially SMEs, aimed at strengthening their competitiveness, and to investment in infrastructure, especially in transport networks, aimed at alleviating the constraints on growth as well as at improving the environment.
SME support
Support for SMEs was a common feature in all the countries, for example:
• in Poland, the main achievement in respect of business support was the establishment of services for SMEs, to provide technical information and advice as well as loans and credit guarantees;
• in the Czech Republic, support of SMEs to encourage them to innovate resulted in the value-added of the firms assisted increasing by over 30% as against a target of 10%; in addition some 38% of business start-ups supported were run by women as against a target of 25%;
• in Slovenia, support was mainly focussed on the creation of networks of technology and centres of excellence and on promoting links between these and businesses; up to the end of 2007, 28 centres were established to act as intermediaries between business and research and of these, 10 were centres of excellence.
At the same time, the aims set of assisting SMEs, especially in the weakest regions, and increasing the extent of innovation in businesses were not always achieved:
• in Hungary, most of the additional value-added generated by enterprise support -some three-quarters of the total increase – was in the strongest region, Közép-Magyarország; moreover, according to independent evaluation, in the case of support for the larger companies, typically competing in international markets, the deadweight loss was close to 90%, while on specific programmes supporting SMEs, the crowding-out effect was estimated to be close to 50% and the deadweight loss, around 80%;
• in Lithuania, the aim of strengthening links between business and the research community had limited success, partly because of the large-scale emigration of scientists and other highly qualified people over the transition period and especially after accession to the EU.

Ex-post Evaluation of the ERDF 2000-2006 Synthesis Report
139
Investment in transport
The transport system in all the mainland EU10 countries was in a poor state of repair and in need of modernisation when the transition began and was, accordingly, a focus for EU funding in many of the countries:
• in Poland, particular importance was attached to tackling the outdated and worn out transport network, inherited from the communist years. However, funding was excessively dispersed and there was an evident propensity to support small projects of local importance, which were considered unlikely to improve the transport system as a whole significantly;
• in the Czech Republic, ERDF support was concentrated on improving regional road networks and the development of public transport; given the substantial need to upgrade existing transport links and establish new ones, there was no problem absorbing the funds allocated;
• in Slovakia, most of the funding for transport infrastructure went on financing the reconstruction and electrification of selected railway lines and the repair of existing roads as well as the construction of a few new ones. As a result, a start was made on improving the rail network, modernising stations, upgrading inter-regional lines and increasing the speed of service as well safety and reliability. At the same time, the focus on railways served to reduce the environmental impact of transport;
• in Lithuania, a large number of projects were initiated, aimed as improving traffic conditions, linking up local road networks with the main transport routes and renewing railway lines. While most of investment went into improving existing roads rather than constructing new ones, it also went into building a by-pass in Vilnius around the old city, which has reduced traffic jams, road accidents and pollution.
Environmental investment
Protection of the environment had also been largely neglected during the communist era and projects were undertaken in a number of the countries with a view to both cleaning up the environment and safeguarding it against further damage:
• in Slovakia, the Structural Funds were used to co-finance investment in environmental infrastructure to tackle the legacy of decades of damage caused by heavy industry and other factors, which could not have taken place on the same scale without EU support;
• in Lithuania, support was aimed at improving the quality of drinking water, cleaning up contaminated sites, protecting vulnerable areas, strengthening the monitoring of environmental indicators and cleaning up the Baltic Sea coastline as well as modernising electricity and natural gas distribution networks. As a result, both energy losses and pollution were reduced, CO2 emissions, for example, being cut by 2.5%.
• in Malta, where, though the history was different, the environment had also tended to be neglected, cohesion policy and EU influence encouraged a shift of public investment towards environmental measures and increased awareness of the issues involved; funding was, therefore, used to support the adoption of a less ‘invasive’, more sustainable model of tourism.

Synthesis Report Ex-post Evaluation of the ERDF 2000-2006
140
The institutional effects of support
In view of the relatively short time period over which support from the Structural Funds on any significant scale was provided to the EU10 countries, it is unrealistic to expect a great deal to have been achieved in increasing their capacity for sustained development. Nevertheless, important improvements are evident even in this short time in the institutional arrangements for pursuing a regional development strategy and for managing the EU funding received. These improvements occurred not only at the national level but also in the regions, which, in many cases, were newly created for the express purpose of making use of EU support.
The regionalisation of policy
• in Poland, an indirect effect of EU cohesion policy was to strengthen the economic powers of the regions and, although the funding received was managed by the national government, the regional authorities had some discretion over how they used the amounts allocated to them;
• in the Czech Republic, the formulation of a regional development strategy was accompanied by the establishment of a new institutional framework, with increased decentralisation and the regionalisation of responsibilities. Because of the need to distribute funds to the regions and to coordinate regional development, a new Territorial Development Policy was formulated, involving the formulation of a more coherent and coordinated policy approach, increased decentralisation and the regionalisation of administrative structures and responsibilities;
• in Hungary, the ‘achievement of a better environmental and more balanced regional development’ became a stated objective of policy. EU funding led to a strengthening of institutional capacity in all of the regions, so that in the future they will be better-placed to develop an autonomous and coherent development strategy in line with their needs and resource endowment;
• in Slovakia, accession to the EU was associated with a new regional division of the country, together with fiscal decentralisation. This division brought about a complete change in the structure of public administration, though it also led to a number of problems. The newly-formed regions were under pressure to formulate their own development strategies but lacked the necessary administrative capacity as well as management experience to do so. This complicated the development of coherent regional planning and was a source of delay in respect of the deployment of EU funding.
The management and implementation system
In all the EU10 countries, systems were set up to manage the implementation of cohesion policy, with support from the ERDF, which resulted not only in the finance made available being absorbed but also in the seeming extension of the methods involved into domestic policy areas.
• In Cyprus, the management and implementation system was integrated into the existing public administration system. The most important indirect effects were the transfer of cohesion policy management practices (strategic planning, partnership, monitoring and evaluation) to national development policy and the establishment of a medium-term budgetary framework.
• In the Czech Republic, substantial progress was made over the programming period in establishing many features of the cohesion policy management and implementation system (financial control, project generation, appraisal and selection as well as

Ex-post Evaluation of the ERDF 2000-2006 Synthesis Report
141
evaluation). Nevertheless, there was still need for improvement as regards coordination between Ministries and the quality of indicators used. Access to EU funding is reported to have had significant indirect effects by establishing a new programming and planning approach for the whole cycle of spending public money, involving more targeted - and so more effective – support of activities for fostering economic development, and by stimulating the formulation of national and regional development strategies.
• In Estonia, the main emphasis was on putting suitable institutions in place, which left limited time and resources for reviewing the projects undertaken and assessing their effects. A strong financial control system was put in place and a sufficient number of staff were recruited and trained. Cohesion policy is reported to have contributed to better coordination of policies between different Ministries and more of a focus on longer-term planning, partnership and evaluation.
• In Hungary, substantial improvements were made in the procedures for project selection, monitoring, reporting and evaluation over the period. However, the existence of dual procedural requirements for cohesion policy and domestic policy created an extra administrative burden for financial planning and staff management. Nevertheless, progress was made in building the necessary institutions and in spreading a new culture of cooperation among the various parties involved in domestic policy-making.
• In Latvia, priority was accorded to financial management and the establishment of well-defined procedures, though focused more on ensuring financial correctness and on monitoring and reporting spending than on physical outcomes. There were shortcomings in other aspects too, in the form of lengthy procedures and insufficient flexibility, which were partly overcome during the programming period. The requirements of cohesion policy led to more transparency and accountability, increased involvement of stakeholders in the decision-making process, more strategic planning at the national level and enhanced cross-ministerial cooperation. There were also signs of an evidence-based approach to policy-making beginning to emerge in other policy areas.
• In Lithuania, a centralised administrative system was established for the management of cohesion policy. This proved capable of reacting quickly to problems and deficiencies in procedures (e.g. in project selection). Cohesion policy had a tangible effect in initiating a culture of transparency and accountability in public administration and led to increased interest in strategic planning.
• In Malta, a number of important reforms to establish accountability, openness and transparency had already been introduced prior to EU accession. A significant challenge was the small pool of civil servants and the lack of project management skills. Cohesion policy helped to put in place more efficient arrangements for contracting and making payments and to establish a monitoring and evaluation system, both of which could be introduced into other policy areas.
• In Poland, considerable progress was made in establishing an effective management and implementation system for cohesion policy. However, the system was created and operated in isolation from the national administration system, which was still not fully compliant with EU standards of public management and governance. The effectiveness of cohesion policy was accordingly undermined. The major challenges remaining at the end of the programming period were to improve coordination, financial management and monitoring. Nevertheless, cohesion policy enforced the modernisation of public administration, in the form of multi-annual strategic planning, task-oriented budgets and

Synthesis Report Ex-post Evaluation of the ERDF 2000-2006
142
evaluation. The changes were more visible at the regional level – where the administration of cohesion policy and domestic policy was merged - than at the national level.
• In Slovenia, suitable institutional arrangements and procedures were set up for the management and implementation of cohesion policy. However, due to lack of staff and experience, the system encountered some difficulties, especially at the beginning of the period. Nevertheless, cohesion policy is reported to have been important in introducing new forms of management and in strengthening institutional capacity, as well as stimulating collective action for development and introducing new forms of intervention (industrial zones and in tourism). This was achieved through:
o intensive education of personnel in Ministries and associated bodies aimed at better planning of projects and at establishing clear and transparent means of implementation;
o closer cooperation between the Managing Authority and Ministries;
o better prepared policies, clearer instructions and guidelines and increased publication of information about the funding available.
• In Slovakia, a solid basis for the management and implementation of cohesion policy was established over the period. However, due to limited experience, the focus was primarily on contracting and reimbursement and less attention was paid to the qualitative aspects of implementation. High staff turnover and deficiencies in staff development undermined the overall effectiveness of policy. Although the establishment of the management and implementation system had some effects, major differences in the management of cohesion policy and in that of domestic policies remained at the end of the period.
4.2.3 Policy outcomes in Objective 2 regions
The expenditure financed by the ERDF under Objective 2 for the period 2000-2006 was, as indicated above, very much less than under Objective 1 – only around one-fifth of the amount (at just under EUR 19 billion up to the end of 2008). Partly because of this, funding was concentrated on small problem areas within countries, smaller – in many cases, much smaller – than NUTS 2 regions and mostly smaller even than NUTS 3 regions. Despite this spatial concentration, the amount of support provided in the areas assisted was considerably less than in Objective 1 regions, averaging only around 0.13% of GDP in the areas concerned.
What can reasonably be expected to have been achieved in these areas as a result of cohesion policy is, therefore, correspondingly less than in Objective 1 regions. Nevertheless, despite the policy aims set often being far in excess of what was feasible given the amount of financial support provided, the evidence from the evaluation is that in many of the regions assisted, the amount involved had a significant effect in furthering economic and social objectives. It, therefore, acted in a number of cases both as a catalyst for the formulation of development policies for tackling the problems confronting the regions concerned and as a means of levering more funding to carry out a more extensive, and effective, policy.
This is reflected in the performance of regions receiving Objective 2 funding over the programming period. As indicated in Chapter 2 above, growth of GDP per head in the regions concerned tended to be either higher or not significantly worse in the regions concerned than in non-assisted regions. This was especially the case in those receiving the most funding, despite these being the ones with the biggest structural problems whether arising from being overly

Ex-post Evaluation of the ERDF 2000-2006 Synthesis Report
143
dependent on traditional industries in decline, including fishing in some cases as well as manufacturing, or because of their rural nature.
At the same time, partly by being so spatially concentrated, it stimulated local involvement in projects for improving the situation in the areas targeted in social as well as economic terms. As such, it brought cohesion policy closer to local communities and raised awareness of the possibilities for locally-based action to improve both the underlying conditions for economic development and the quality of life.
In some countries, therefore, Objective 2 funding was associated with a visible improvement in growth performance over the period, though, of course, there may not be a direct, causal, connection between the two. In other countries, from the evidence collected during the evaluation, it helped to improve the conditions for growth and a more balanced pattern of development, which is expected to show up in the quantitative indicators in the coming years.
The remainder of this chapter summarises this evidence. It outlines some of the main examples of policies supported by the ERDF under Objective 2 in the regions receiving assistance over the period and indicates the outcomes according to both the present evaluation and those carried out in the countries concerned. It should be emphasised that no attempt is made to present a comprehensive coverage of the projects supported, still less of all the regions receiving funding.
The features of Objective 2 regions and the policies implemented
In practice, in most of the countries with regions receiving assistance under Objective 2, the development strategy pursued and the uses to which the funding was put were not very different from those in Objective 1 regions. This reflects the fact in many cases the features of regions concerned, especially in the Northern parts of the EU, were similar to those assisted under Objective 1.
In the UK, for example, the regions eligible for Objective 2 support were either urban areas or rural areas reasonably close to an urban centre but nearly all of them had been dependent on traditional industries in decline, with consequent low rates of economic growth and relatively high rates of unemployment. The primary aim of Objective 2 programmes was to increase GDP per head and employment levels closer to those in the rest of the UK. This was to be achieved through improving the performance of businesses located in the region. and most especially the SMEs, by direct aid and the development of business support services, coupled with the cleaning up of old industrial sites and the regeneration of urban areas to make the areas concerned more attractive as locations for investment.
In Italy, on the other hand, where there were more pronounced differences in the characteristics of Objective 2 and Objective 1 regions. The development strategy for the former was defined separately and greater autonomy was given to them. The main aims, however, were similar to those in the UK, to increase the competitiveness of businesses, including those in tourism, and to develop the growth potential of regions. This was to be done, again as in the UK, through improving the environment, both natural and physical, and making most use of its potential to attract tourists as well as business investment.
In both cases, while the focus was on increasing growth and business competitiveness, underlying this was an implicit recognition of the need for restructuring to achieve this aim, which became more explicit as the period progressed. This is reflected in the emphasis on innovation and the significant share of funding going to support this, not only in these two countries, but also in most others.
Synthesis Report Ex-post Evaluation of the ERDF 2000-2006
144
In Germany, structural change was an explicit central aim of Objective 2 programmes in a number of regions, such as in Berlin, or Saarland, where the concern was to reduce reliance on coal and steel industries, while in Niedersachsen, the focus was on developing indigenous potential and in Rheinland-Pfalz, on sustainable development.
In Belgium, while the ultimate goal in Objective 2 regions was to increase growth and employment, the immediate aim was explicitly to diversify the production system. The programmes implemented were all directed to varying degrees towards developing a broader and more diversified economy, especially one based on more knowledge-intensive activities and one which was attractive to outside investors
In Sweden, the aim in Objective 2 regions was equally to improve the business environment together with stimulating knowledge-driven development, much as in the case of Objective 1 regions.
In the Netherlands, the areas eligible for Objective 2 support were primarily those in the North of the country which were the only ones for which a specific regional development programme was implemented by the national authorities over the period 2000-2006. Here the aim, as elsewhere was to increase growth and employment but to do so in a way which was in line with spatial balance, with growth being concentrated in centres of economic activity and rural areas being preserved.
The three main policy areas in which support was concentrated in most countries were enterprise support, RTDI – which was closely related and in many cases an integral part of the support provided to businesses – and territorial development. Some of the actions taken in these areas, especially the first two, and their results have been described in earlier sections of this report. The focus here is on the overall outcomes in the regions concerned.
France
In France, expenditure financed under Objective 2 for the 2000-2006 period amounted to some EUR 5.1 billion up to the end of 2008. This was spread across the country in the sense that all NUTS 2 regions had at least one area which received assistance, just over 35% of the population outside of Objective 1 regions living in assisted areas (see Table 4.4).
Funding to assist businesses went to a significant extent to the provision of support services for SMEs, in the form of investment in new industrial zones tailored to the needs of local firms, business parks, incubators and premises in urban areas, which had visible results in terms of the infrastructure created.
Funding also went to increasing access to RTDI and, depending on the region, the focus of support was either on research centres and universities, or on centres of technology transfer to increase the diffusion of know-how or on improving the links between research centres and industry. According to evaluations, the funding provided contributed to bringing about a better culture of innovation across the country, leading to:
• increased expenditure on R&D by firms and the development of new markets (such as in Provence-Alpes-Cotes d’Azur and Languedoc-Roussillon, where a third of companies receiving support applied for a patent);
• the development of research centres, public-private partnerships, networks for the development of technology (Réseaux de développement technologique) and ‘technology platforms (as in Midi-Pyrénées);

Ex-post Evaluation of the ERDF 2000-2006 Synthesis Report
145
• the diversification of regional economies based on industry towards ICT-related services (as in Franche-Comté).
An even large part of the funding went to territorial policy to improve the attractiveness of regions both for people to live and businesses to locate. The projects undertaken included:
• the regeneration of derelict urban areas in traditional manufacturing regions (e.g.: in Lorraine, Picardie, and Haute-Normandie);
• the rehabilitation of industrial zones in rural areas and the creation of new ones together with support for the diversification of economic activity (such as into the agri-food industry in Picardie)
• the renovation of small rural towns (such as in Franche-Comté, Basse-Normandie and Rhône-Alpes);
• support for the tourist industry through the renovation and modernisation of accommodation, the better organisation of activities, the restoration of heritage sites and the creation of cultural events;
• improving accommodation and protection of the natural heritage in mountainous areas in order to encourage more tourism (such as in Auvergne and Midi-Pyrénées);
• the provision of main drainage and waste-water treatment plants in rural areas in a number of regions.
Although it is difficult to measure the effects of such measures, it is, nevertheless, the case that the population stabilised or even increased over the period in many of the areas concerned.
UK
In the UK, as in France, Objective 2 funding, which amounted to EUR 3.8 billion in total up to the end of 2008, was allocated to a large number of areas across the country. These together covered just over 31% of the population outside of Objective 1 regions. Although the amount involved was small in relation to national funding, it increased the resources available for the pursuit of development policy in problem regions.
EU funding, like that from national sources went predominantly to support of businesses, especially SMEs, the aim being to diversify the regional economy into new and expanding sectors and to encourage increased RTDI. It also, however, went into measures to improve the environment for both businesses and people. Examples include:
• the installation of broadband in a number of areas, including the ‘Switch on Shropshire’ project in the West Midlands which provided access to high-speed telecommunications to over 400 businesses and 35 local communities in the county;
• the Eliot Park Innovation Centre also in the West Midlands, where ERDF support enabled the installation of an electricity generation system based on solar power (which is expected to yield energy savings of over 50% as compared with typical offices of the same kind) and provided important lessons for the future construction of office buildings;
• the construction of the Ricoh Arena in Coventry in the West Midlands on an old industrial site with conference, exhibition, hotel, restaurant, entertainment and sports facilities;
• the renovation and expansion of community facilities in deprived parts of East Manchester.

Synthesis Report Ex-post Evaluation of the ERDF 2000-2006
146
In a number of the regions receiving assistance, according to evaluations, there was evidence of the restructuring of economies, in the form of a larger decline than elsewhere in the share of industry and a bigger rise in the share of business services and high tech activities. In the East of Scotland, for example, a bio-technology cluster was developed with the aid of EU funding around life science research institutes in Dundee, while funding supported the concentration of the electronics industry in West Lothian.
Table 4.4 ERDF-financed expenditure under Objective 2 in relation to population and GDP, 2000-2006
ERDF expenditure (EUR million)
Obj2 popn as % non-Obj1 popn
ERDF allocation as % non-Obj1
GDP
ERDF allocation as % of GDP in Obj 2
areasAT 623.8 29.8 0.04 0.15BE 342.1 16.3 0.02 0.13DE 2,908.9 18.9 0.02 0.12DK 125.1 12.5 0.01 0.07ES 2,070.1 52.1 0.07 0.13FI 392.6 40.7 0.04 0.11FR 5,129.8 35.6 0.05 0.15IT 2,464.5 22.3 0.03 0.17LU 40.4 25.6 0.02 0.08NL 685.2 18.5 0.02 0.11SE 368.4 17.6 0.02 0.14UK 3,785.7 31.0 0.03 0.12EU 15 18,936.8 27.4 0.03 0.13CY 22.5 28.7 0.06 0.20CZ 54.0 31.2 0.08 0.27SK 31.6 29.6 0.11 0.39EU 10 108.0 30.1 0.08 0.27EU 25 19,044.8 27.5 0.03 0.13
The figures relate to expenditure up to end-2008Source: Calculations based on DG Regio data.
Note: The figures include Objective 2 phasing-out support. These figures, however, have been weighted by the average amount of funding received per head of population in relation to the amount received in areas fully eligible for Objective 2 so as to be more comparable. On average, funding per head in phasing out areas was only around 20% of that in fully eligible areas.
Germany
In Germany, Objective 2 funding amounted to some EUR 3.2 billion up to end-2008 and went to areas located in all of the 11 Länder (NUTS 1 regions) in the Western part of Germany. Around 19% of the population in the Western part of the country (i.e. outside of Objective 1 regions) lived in such areas, though the size of the areas concerned varied markedly in terms of population, and, therefore, of the scale of the support provided. All of the areas were experiencing problems either of industrial decline or of lagging development because of their rural nature. As in the UK, a large part of funding went to support SMEs and the rehabilitation of polluted or rundown areas.
EU funding supplemented the support available under the Joint Task and enabled additional measures to be undertaken, such as in respect of RTDI, the environment and tourism, for example:
Ex-post Evaluation of the ERDF 2000-2006 Synthesis Report
147
• the construction of Logport, a logistics centre in Duisburg-Rheinhausen on the site of a former steel mill, with railway connections and a harbour with a container terminal, which makes use of the good transport network and logistics know-how of the old heavy industries. This has become one of Germany’s and Europe’s leading logistics locations and probably the world’s biggest inland container terminal;
• the establishment of the European Centre for Micro and Nanoreliability (EUCEMAN) in Berlin, coordinating a network of research institutes across Europe working at the forefront of nano-technology;
• the implementation of 390 projects in Niedersachsen to expand hotel and other accommodation and support for the creation of 112 new tourist facilities, and of 110 projects in Nordrhein-Westfalen to provide leisure and cultural activities
Although the evidence is relatively limited, it is reported that a large part of the programmes on RTDI would not have taken place without EU funding. In addition, the inclusion of the pursuit of equal opportunities and the sustainability of development as horizontal principles in EU cohesion policy put these issues on to the policy agenda, even if they were not necessarily incorporated as prominent features in national policies. Equally, the Structural Funds opened up the possibility of supporting the development of clusters and the adoption of other innovative measures for stimulating regional development.
Moreover, the regulations surrounding the receipt of EU funding also produced benefits in the form, for example of:
• the strengthening of existing mechanisms of financial control in a number of Länder, such as in Nordrhein-Westfalen where the adoption of competitive tendering was prompted by the deficiencies revealed by control mechanisms;
• the adoption of systems for monitoring and evaluating expenditure, which for the most part did not previously exist in respect of regional policy.
Italy
In Italy, expenditure under Objective 2 amounted to around EUR 2.5 billion up the end of 2008 and went to problem areas in all 14 NUTS 2 regions in the North and Centre of the country, the areas assisted accounting for around 22% of the population.
The programmes implemented were similar in nature, combining direct support to enterprises and for the provision of business services and infrastructure with improvements to the physical and natural environment. The form which business support took varied across regions:
• in some regions, the focus was on supporting the growth of existing industries (in Valle d’Aosta, Liguria and Lazio);
• in others, support was concentrated on creating the conditions for innovation and exporting (Piemonte and Umbria);
• in most, general investment grants were combined with specific measures to stimulate innovation and environmentally-friendly methods of production (Abruzzo, Marche, Toscana and Friuli Venezia Giulia).
Support for improving the environment was equally varied in focus:
• in some regions, funding helped to regenerate deprived areas and prevent natural disasters (in Liguria and Friuli Venezia Giulia);

Synthesis Report Ex-post Evaluation of the ERDF 2000-2006
148
• in others, to improve water supply, the disposal of urban waste and energy efficiency and to develop renewable sources (in Marche and Toscana)
• in yet others, to protect the environment and to take advantage of the tourist potential of natural assets (in Abruzzo and Lazio);
• in most regions, to reclaim and regenerate polluted and old industrial areas.
In addition, funding contributed to the diversification of tourism in regions specialising in particular activities (Valle d’Aosta, Bolzano, Umbria and Toscana) through co-financing new amenities and new services. The visible effects, however, were dampened by slow growth of the economy.
The effect of the environmental measures on regional development, however, was dissipated by the fact that they were generally small and fragmented and a response to specific needs, rather than being part of a coherent regional development strategy. Where environmental plans were more detailed and governance more structured (such as in Toscana), the small-scale projects were linked to a more explicit strategy and were more effective because of this.
Spain
In Spain, the finance provided under Objective 2 up to the end of 2008 amounted to some EUR 2.1 billion and covered just over half (52%) of the population outside of Objective 1 regions. As in the other major countries, all NUTS 2 regions had areas receiving Objective 2 support within their boundaries, the population covered ranging from 91% in País Vasco and 83% in Aragon to 25% in Madrid.
The funding provided generally helped the regions concerned pursue their development strategies and, in particular, to increase the resources devoted to RTDI, which accounted for almost a third of the ERDF support received. Indeed, with the exception of La Rioja (24%), all regions devoted more than 25% of funding to RTDI intervention, with Navarra investing around 43%. This heavy investment in RTDI was associated with expenditure on R&D in Objective 2 regions increasing from just over 1% of GDP in 2000 to almost 1.5% in 2006 and was reflected in a 60% increase in patent applications between 2004 and 2006.
RTD developments in two Objective 2 regions, Navarra and Illes Balears, are especially noteworthy. In Navarra, RTD expenditure increased from 0.9% of GDP in 2000 to 1.9% in 2006 while the number of patent applications tripled between 2001 and 2007. In Illes Balears, where expenditure on RTDI was historically very low, EU funding helped the region to establish a coherent policy in this regard, based on strengthening the links between businesses and research centres and on increasing public outlays (public expenditure on RTDI increased by three times between 2002 and 2006). Many firms engaged in RTDI activities for the first time in collaboration with public research centres. As in the country generally, this was reflected in a substantial increase in patent applications.
Although the funding provided under Objective 2 was, therefore, relatively small, it still played a major role in stimulating action and levering finance from other sources. In general, EU funding is considered to have been responsible for the ‘modernisation’ of regional policy, traditionally based only on infrastructure and training programmes. In a number of regions, the authorities reported that Objective 2 programmes had an important effect in facilitating the implementation of ‘advanced’ measures such as those promoting the knowledge society, protecting and improving the environment and increasing the employment of women, which would not necessarily have been given priority over the period.

Ex-post Evaluation of the ERDF 2000-2006 Synthesis Report
149
Moreover, the management model of cohesion policy has permeated into national and regional practices resulting in a more effective use of public resources.
In the remaining countries receiving Objective 2 funding, the sums involved were smaller in absolute terms than in the larger countries examined above but, in most cases, they were similar in amount in relation to GDP in the areas assisted.
Netherlands
In the Netherlands, expenditure under Objective 2 amounted to just under EUR 700 million up to the end of 2008. Most of this went to areas in the North and East of the country where income levels were lower than elsewhere and rates on unemployment higher. Just under 19% of the population outside of the Objective 1 region (Flevoland) lived in the areas concerned.
The primary goal in the northern regions in which funding was concentrated – Groningen, Friesland and Drenthe – was to generate 13,000-23,000 net additional jobs, which were considered to be needed to increase the employment rate in the regions and close the gap with that in the country as a whole. The measures funded in pursuit of this were the development of new business parks and office space as well as direct support to SMEs, including in the tourist industry.
Between 2000 and 2006, the gap between the regions and the national average closed by around 8,000 jobs. However, it is estimated that without support, employment in the regions assisted would have fallen by 8,000, so that from this perspective, the programme achieved its goal.
Business support measures were combined with funding for the regeneration of towns and villages in the areas assisted and for new amenities, which, accordingly, brought about an improvement in the quality of life in rural areas to go with the increased employment in the more urban parts.
The conscious policy was to concentrate job creation in centres of economic activity and to preserve rural areas as largely residential and places for leisure and recreation. The rationale was to realise the benefits from agglomeration and the externalities generated by such a concentration of businesses, which would then provide employment, and income, to those living in other parts of the region, while safeguarding the rural nature of the latter. The strategy was successful in the sense that job growth was concentrated over the period in the economic centres where business support was focused, while the Northern regions as a whole experienced employment growth in contrast to earlier years.
In general terms, therefore, the programme contributed to achieving a more balanced pattern of development as well as stimulating entrepreneurship on a local scale.
Austria
In Austria, expenditure financed under Objective 2 amounted to around EUR 620 million up to end-2008 and some 30% of people outside of the Objective 1 region (Burgenland) lived in areas receiving support.
As elsewhere, funding went primarily to business support programmes, which had the direct effect of creating around 18,000 new jobs, as well as another 2,000 in tourism. These jobs were to a large extent in growing, technology-oriented industries (such as in automobile manufacture) and only a small number were in traditional sectors (such as food and drink).
In the four NUTS 2 regions receiving most support over the period (Niederösterreich, Oberrösterreich, Kärnten and Steiermark), growth of GDP per head over the period was almost

Synthesis Report Ex-post Evaluation of the ERDF 2000-2006
150
twice the average in non-assisted regions. While it is hard to disentangle the influence of Objective 2 funding from other factors, especially given its relatively small scale, there are indications that programmes contributed to the modernisation of industry, including of tourism, by helping to fund business premises, advisory services, research and technology centres, the expansion of broadband networks and improvements in the environment as well as by encouraging the development of clusters. Accordingly, support was associated with a restructuring of regional economies away from low value-added sectors to more advanced activities.
In addition, the measures supported led to more integrated and innovative regional policies and increased participation in programmes at local and regional level.
Nevertheless, the evidence also is that, as regards innovation, the ambitious objectives were not fully achieved. In particular:
• cooperation between businesses and research centres lagged behind expectations because of a lack of suitable projects;
• the venture capital funds set up financed only a small number of projects;
• fewer innovation networks were created than planned.
It was reported, in addition, that experience over the period suggested that the potential for the development of research and technology infrastructure in structurally weak regions is limited by the low potential to absorb innovation-oriented projects.
Belgium
In Belgium, the ERDF under Objective 2 financed expenditure amounting to around EUR 340 million up to the end of 2008, with only 16% of the population outside of Objective 1 regions living in the areas assisted. Only in three NUTS 2 regions – Limburg in Flemish speaking part of the country and Liege and Namur in the French-speaking part – did funding cover more than 20% of the population. The areas in which funding was concentrated were either centres of heavy industry in the past or rural areas.
In all three regions, funding was divided mainly between business support, cleaning up old industrial sites in order to make them more attractive to investors and support for tourism and cultural activities.
In Limburg, the policy had some success in helping to develop sectors of activity in which the region had an actual or potential comparative advantage in terms of local expertise, such as, in particular, the automotive and transport equipment industry, logistics, ICT and new media activities.
In the other two regions, the policy was less successful in bringing about restructuring. In the Liege region, especially, investment grants did not produce the expected effects in terms of the diversification of the economy or stimulating the development of high tech activities. In rural areas, this was reported to be because of the low density of business services. Equally, in some areas, a large proportion of grants went to large rather small enterprises and were associated with significant deadweight effects, while relatively few projects involved collaboration between firms, so that the potential gains from clustering, which were a key part of policy, were not realised.
Ex-post Evaluation of the ERDF 2000-2006 Synthesis Report
151
Finland
In Finland, expenditure under Objective 2 amounted to just under over EUR 400 million up to the end of 2008 and went to areas in which some 40% of the population outside of Objective 1 regions lived.
The focus of support was similar to that in Objective 1 regions, much of it going to stimulate diversification and innovation in the business sector. As in Objective 1 regions, the policy was more successful in achieving its aims in larger urban areas with centres of higher education and research, which were best equipped to benefit from the significant support to R&D and other innovation activities. While in these areas, there tended to be several R&D and business development organisations capable of taking initiatives, obtaining funding and organising projects, this was not the case in rural areas.
According to evaluations, in the case of RDTI in particular, the funding received from the ERDF was vital for projects to have been undertaken.
Funding also went to improving the local environment in many of the areas assisted. Support for various measures of urban regeneration, involving partnership between local authorities and local organisations on the ground, for local public services and for social infrastructure helped to make the areas concerned more attractive places for people to live and for firms to locate. Such measures contributed to the growth of tourism as well as to the development of businesses in other sectors.
Sweden
In Sweden, Objective 2-financed expenditure over the period amounted to around EUR 370 million up to the end of 2008 and went to areas where only around 18% of the population outside of Objective 1 regions lived. The division of funding between broad policy areas was similar to that in Finland – or indeed in Objective 1 regions – with much of it going to support of SMEs, improvement of the environment and the development of tourism.
Although population continued to decline in the rural areas assisted, the growth of GDP per head over the period was slightly higher than in non-assisted regions and, according to evaluations, the policies followed have helped to adapt the development path to the requirements of global competition. In particular, they contributed to a substantial increase in expenditure on R&D (to an average of 4.6% of GDP in the regions receiving most support), to the development of advanced services and to the establishment of scientific and cultural exchanges.
Denmark
In Denmark, Objective 2 funding amounted to only some EUR 125 million up to end-2008 and only just over 12% of the population lived in areas receiving support. Funding was split mainly between three policy areas – support of SMEs, of RTDI and of tourism.
According to evaluations, funding acted as a catalyst to generate more financial assistance and improved the conditions for business in the areas concerned. The availability of business services was increased, networking and cooperation between companies was strengthened (in the form, for example, of joint marketing initiatives, especially in tourism) and better possibilities for the transfer of knowledge were established.
The more favourable business environment created in the areas assisted, together with the establishment of advisory services, led to a higher survival rate of small businesses. Evaluations indicate that in the case of funding to support businesses:

Synthesis Report Ex-post Evaluation of the ERDF 2000-2006
152
• over half of all projects contributed to restructuring and stronger competitiveness;
• some 64% of projects contributed to the development of new products;
• around 40% of projects helped to develop new markets both at home and abroad.
In addition, a large number of projects helped to improve the attractiveness of regions, widened the choice open to tourists and led to better marketing. As a result, funding contributed to the tourist season being extended in the regions concerned. (From the mid-term evaluation in 2003 to the end of the programming period, the total number of tourist weeks increased in Denmark by 300% and the number of overnight stays by 70%.)

Ex-post Evaluation of the ERDF 2000-2006 Synthesis Report
153
5 Chapter 5 – Conclusions and implications for future policy
This final chapter is divided into two parts. The first part draws out the main points to emerge from the results of the evaluation as set out in the previous chapters of this report. This covers a number of issues, in particular:
• an assessment of the effects of ERDF support under Objective 1 and Objective 2 over the 2000-2006 period on the economic performance of the regions assisted;
• consideration of the wider effects of the ERDF on the social and territorial objectives of cohesion policy and of the dispersion of funding linked to this;
• examination of the particular case of Objective 2 and its achievements given the small scale of funding allocated to it and the spatial concentration of this funding;
• a review of the contribution of the management and implementation system for the deployment of the Structural Funds to the policy-making process in the Member States and of the deficiencies which came to light during the evaluation.
The second part sets out the implications of the evaluation findings for the future design and implementation of cohesion policy, focusing specifically on the ERDF.
5.1 MAIN CONCLUSIONS The primary conclusion to emerge from the evaluation is that cohesion policy made a major contribution to the economic development of the regions assisted by the Structural Funds over the 2000-2006 programming period. This is especially so in Objective 1 regions but significant effects are also evident in regions receiving Objective 2 funding despite the relatively small amount of financing involved. At the same time, cohesion policy helped to further social cohesion and improve territorial balance across the EU.
5.1.1 The challenges facing the evaluation
The present report draws together the main points to emerge from the various Work Packages which made up the ex post evaluation of cohesion policy programmes financed by the ERDF across the EU in the 2000-2006 period and synthesises the findings.
As also indicated at the outset and as highlighted at various points in the analysis, the evaluation had to overcome the challenges posed by:
• the difficulties of distinguishing the effects of the measures financed by the ERDF from the many other influences, especially given the often lengthy time lags between policy measures being taken and their effects becoming apparent;
• the multiple nature of cohesion policy objectives, which are not confined to economic development as such but encompass the maintenance and strengthening of social and territorial cohesion as well;
• the lack of clarity in policy documents and official statements on the precise objectives which particular programmes and measures were intended to achieve and how their achievement was to be verified;
• the fact that, while accepted indicators exist to assess economic development, there are few indicators available which can be used to assess social and territorial cohesion, not least because of their intangible nature;

Synthesis Report Ex-post Evaluation of the ERDF 2000-2006
154
• the difficulties of both defining and measuring the ultimate goal of sustainable development, as opposed to economic development per se, and the long-term nature of the concept, which makes it hard to judge the appropriate balance between economic and other objectives in the short-term.
• The fact that in many Member States, the financial support provided by the Structural Funds is only a small part of the aid which went to Objective 1 and 2 regions. This means that, in the non-Cohesion countries in particular, national policy towards the development of the regions concerned can have a much greater effect on outcomes than EU cohesion policy. Although the above analysis has pointed to cutbacks in overall government investment in some Member States over the programming period, data are not readily available on nationally-financed development expenditure in the different regions and how it changed over the period.
• The fact that most regions receiving funding over the 2000-2006 period also received financial support in the preceding programming period and, in many cases, the one before that as well. This means that any effects which show up on regional economic performance over the period could well be a result of earlier funding as much as that received during the period itself, especially given sometimes lengthy lags in the effect of policy materialising. Accordingly, it is not possible to attribute developments observed over the period to the 2000-2006 funding alone.
The effect of the ERDF on the economic development of the regions assisted is considered first before going on to consider the other objectives of cohesion policy.
5.1.2 The effect of the ERDF on the economic development of regions
It is important to recognise that it is not inherently possible to draw a direct link between the financial support given to regions and changes in indicators of regional economic performance, such as growth of GDP per head in particular. What is possible is to draw together the various pieces of evidence which are relevant for judging the effect of the former on the latter, in this case, on:
• Whether the scale of funding was significant.
• Whether funding targeted the drivers of economic growth which economic theories – and the main international organisations – say should be targeted.
• Whether simulations of the funding provided and its division between policy areas, using macroeconomic models representing the workings of the economy as best they can, indicate that it should have had a positive effect on economic growth.
• Whether the growth performance over the period in regions receiving funding was better or worse than in other regions.
• Whether there is concrete evidence from national evaluations and the case studies that the funding had positive results in the areas of intervention.

Ex-post Evaluation of the ERDF 2000-2006 Synthesis Report
155
This is the approach which has been adopted in the evaluation. If the answers to these 5 questions are positive, this does not necessarily prove that funding had a positive effect on economic development but it is reasonable to suppose that it did47.
The evidence is as follows:
The scale of funding48
• The Structural Funds provided EUR 174 billion of financial support to regions across the EU for the 2000-2006 period. The ERDF was responsible for almost two-thirds of this, just under EUR 116 billion. In Objective 1 regions, in particular, to which well over 80% of the funding went, this was a significant amount in relation to GDP and even more in relation to investment.
• On average, ERDF support amounted to 2-3% of total fixed investment in Objective 1 regions in the EU15 and some 15% of government investment
• In Portugal and Greece, the ERDF amounted to well over 1% of GDP a year and was equivalent to around 40% of government investment over the period.
• In the EU10 countries, which became eligible for the ERDF only from May 2004, the scale of support was also significant from then on.
• In Objective 2 regions, funding was much smaller, though not negligible, equivalent to around 3% or so of government investment in the regions receiving support.
The policy areas targeted by EU intervention
• The largest part of the ERDF in Objective 1 regions in both the EU15 and the EU10 was allocated to two broad policy areas – transport, on the one hand, and enterprise support, on the other. These two areas accounted for around two-thirds of the total funding made available, if support for tourism is included in the latter.
• Such a focus of support is very much in line with economic theories of development which emphasise the importance for growth of both efficient communications in order to widen the market and save travel time and investment in productive capacity.
• The relative weight given to these policy areas in the funding allocated varied across regions, reflecting their needs and priorities. Greece, Spain and Ireland invested the funds more in transport than enterprise support, reflecting deficiencies in their communications networks; other EU15 countries with Objective 1 regions, more in enterprise support to strengthen businesses. Investment in the two together were complementary – the one aimed directly at increasing business competitiveness, the other indirectly by improving the conditions in which businesses operate.
• In regions receiving Objective 2 support, the ERDF was concentrated much more on enterprise support than in most Objective 1 regions. Together with tourism and including support for research and innovation, this accounted on average for around 60% of the total funds allocated. Much of the focus, therefore, was on one of the main drivers of economic growth.
47 It should be noted that the evaluation did not attempt to answer the question of whether the funds were used in the most effective way, or whether some other pattern of expenditure would have boosted GDP by more, which is virtually impossible to know given the differing circumstances and needs in the regions assisted.
48 Payments by the European Commission to Member States
Synthesis Report Ex-post Evaluation of the ERDF 2000-2006
156
• Much of the remaining part of funding was allocated to protecting and improving the natural and physical environment, which contributed to the sustainability of economic development as well as to social cohesion and territorial balance, as indicated below.
The simulation results of macroeconomic models
• The two macroeconomic models used both estimate that the expenditure financed from the Structural Funds is likely to have had a substantial effect on economic growth in the countries receiving more from the Funds than they contributed to their financing. This is the case, in the EU15, in Greece, Portugal, Spain and, to a lesser extent, Ireland, as well as in Southern Italy and Eastern Germany and all of the EU10 countries.
• In Portugal, GDP is estimated to have been around 16% higher in 2009 as a result of support from the Funds, turning a possible decline in GDP into growth, even if at a low rate. For Greece, GDP is estimated to have been 13-16% higher in 2009 as a result of funding and in Spain, 10-17% higher49.
• In the EU10 countries taken together, GDP in 2009 is estimated to have been almost 5% higher than it would have been without Structural Fund support, despite the short time this was available.
• According to the model designed to estimate the combined effect of levying the taxes to raise the necessary revenue as well as of the expenditure, the Structural Funds are estimated to have increased economic growth across the EU25 as a whole over the period. The boost to growth in lagging economies, therefore, outweighed any adverse effects in the countries which were net contributors to funding.
The growth performance in regions assisted by the ERDF
• Growth of GDP per head in Objective 1 regions in the EU15 was higher on average over the 2000-2006 period than in other regions (around 2% a year as opposed to 1.4%).
• Growth in Objective 1 regions in all EU15 countries apart from Belgium was higher than in non-assisted regions, and in all countries apart from Belgium, Italy and Portugal, higher than the EU25 average.
• Growth in GDP per head in all regions in EU10 countries, except Malta, was above the EU25 average over the period 2000-2006, in the run-up to their entry into the Union and, even more so, after it.
• Growth in regions receiving a significant amount of Objective 2 funding was either higher than that in non-assisted regions or much the same.
• Regional disparities in GDP per head, one of the main targets of cohesion policy, narrowed slightly in the EU15 as a whole over the 2000-2006 period having widened in the preceding 5 years. They also narrowed in most EU15 Member States. This is all the more the case if the effect of commuting on GDP per head is taken into account.
Evidence of the results of ERDF support
Tangible evidence of the positive effects of ERDF support in policy areas which represent key drivers of economic growth was compiled for all countries from the administrative data available
49 The ranges refer to the estimates of the two models.

Ex-post Evaluation of the ERDF 2000-2006 Synthesis Report
157
and from the many case studies carried out in the various Work Packages as well as from the national reports. To select just a few examples from Chapter 3:
Transport
• the ERDF co-financed around 26% of the 7.734 kms of motorway constructed in the EU15 over the 2000-2006 period, around the same proportion of new high-speed railway lines in Spain and Italy and the modernisation or upgrading of over 3,000 kms of standard railway lines across the EU;
• In Spain, Greece and Ireland, in particular, the support provided by the ERDF to investment in transport led to significant improvements in the links between major centres both between and within regions and to substantial savings in travel time.
• In Spain, the new motorways constructed, especially in the lagging regions of Andalucía and Galicia, resulted in overall time savings of 3.5 millions hours a year. In. Greece, the construction of the Egnatia Odos motorway which extends 680 kms from the West coast to the Turkish border reduced travel time by almost a half. In Ireland, the completion of 5 major roads between Dublin and other main towns and cities in the country led to journey time savings of over 40%.
• In a number of cities, Athens, Oporto, Lisbon and Dublin, especially, the expansion of public transport systems reduced congestion significantly below what it otherwise would have been, so cutting travel time as well emissions.
Enterprise support
• Almost 640,000 new jobs were reported to have been created as a result of enterprise support in programmes accounting for some 60% of total funding on such support, implying the creation of over 1 million new jobs overall across the EU..
• In Eastern Germany, detailed statistical analysis demonstrated that investment per worker in firms receiving aid was substantially larger than in firms not receiving aid, the extent of the difference being significantly greater than the amount of aid given.
• In Thüringen, similar analysis demonstrated that R&D expenditure per worker was also significantly larger in firms receiving aid for this than in those not doing so, with again the difference exceeding the amount of support given.
In brief, therefore, there is sufficient evidence available from the evaluation to conclude that, overall, the ERDF had a significant effect on the economic growth of the regions assisted, especially regions assisted under Objective 1.
5.1.3 Effects of the ERDF on social, territorial and environmental cohesion
As emphasised throughout this report, the ERDF was not only deployed to stimulate economic growth. It had wider objectives.
• The evaluation revealed that the objectives of social and territorial cohesion were not only important throughout the EU, but that, in many regions, they had a similar level of priority as growth and in some cases a higher level, reflecting the characteristics and needs of the regions in question as well as the political choices made.
• A large part of the financing provided by the ERDF, therefore, went to projects directly aimed at social objectives combined with territorial balance rather than economic growth as such. These projects include various kinds of social infrastructure and those covered

Synthesis Report Ex-post Evaluation of the ERDF 2000-2006
158
by the term ‘planning and rehabilitation’ – the clean-up of and renovation of rural villages, inner city areas, old industrial sites, historical monuments and so on.
• Projects of this kind, including those aimed at improving tourist facilities, absorbed almost a third of the total allocation of the ERDF to Objective 1 regions in both the EU15 and EU10 over the period. In Portugal and the French DOMs, they accounted for over 40% of the funding provided. In regions which received Objective 2 funding, they accounted for 36% of the total funding in the EU15, 47% in France and well over half in the Netherlands and Luxembourg.
• The projects concerned also included wastewater treatment and other kinds of environmental infrastructure. These had tangible results in terms of the substantial number of households in deprived regions across the EU which were connected to a supply of clean drinking water or main drainage.
• The projects equally led to many villages, towns and cities being made more attractive places to live in and the construction of social, cultural and sporting facilities. While the projects undoubtedly improved living standards and the quality of life, as well as territorial balance by encouraging more people to live in the places concerned and more businesses to locate there, unlike in the case of economic growth, there is no accepted set of indicators to quantify these effects.
• Moreover, while their immediate impact on economic growth was limited, they almost certainly strengthened the conditions for long-term sustainable development by reducing social disparities between regions and territorial imbalances as well as by protecting the environment.
5.1.4 Cross-cutting issues
A number of cross-cutting issues were examined in the course of the evaluation.
Gender equality
The evidence on gender equality, which was a horizontal priority in the guidelines, is that:
• most programmes made explicit mention of the need to take it into account, but that it had limited tangible effect on the projects actually carried out;
• only in four of the 12 case study regions was specific action taken to ensure that gender equality was specifically incorporated in programme design and project selection and implementation;
• making the issue a horizontal priority did not in itself, therefore, lead authorities across the EU to take it seriously when deciding policy but that it might have inspired those that regarded it as being of major importance to take concrete action.
Demographic change
Demographic change was not included as a specific horizontal priority in the Structural Fund guidelines at the beginning of the programming period. The evidence from the evaluation is that:
• it was increasingly recognised as an important issue in a number of regions as the period went on, though more in relation to projects financed by the ESF than the ERDF;

Ex-post Evaluation of the ERDF 2000-2006 Synthesis Report
159
• the ERDF can contribute to regional responses to demographic trends through co-financing appropriate projects, especially in relation to social infrastructure and enterprise support as well as education and training.
5.1.5 Multiple objectives and dispersed funding
As implied by the above, EU funding was spread across many different policy areas in most regions. Although there was usually emphasis on one or two areas, the average regional operational programme in Objective 1 regions in the EU15 contained 41 measures. This dispersion arises for a number of reasons:
• It reflects the fact that there are complementarities between policy areas, that, for example, support for enterprises should be accompanied by investment in infrastructure if there are deficiencies in this which harm business competitiveness. Indeed, it is the essence of an integrated approach to development that these complementarities are explicitly taken into account.
• It also reflects a tendency to spread funding widely, to try to tackle a range of problems at the same time and to pursue multiple objectives. The aim typically was not only to strengthen the capacity of regions for economic growth but also to try to ensure that growth was balanced across regions and that disparities in living conditions were reduced.
• The motivation for this may often have been political, to distribute funding across regions in relatively even way and to give local communities some discretion over how to use the funding. The effect in many cases was to improve territorial balance by reducing disparities in access to public goods and services and basic facilities, such as mains water supply and main drainage. It also made it more likely that the projects funded were in line with the features and natural assets of the local area concerned and, therefore, consistent with sustainable development.
• The dispersion of funding across policy areas equally reflects the fact that the most appropriate regional development strategy is not necessarily to stimulate economic activity everywhere, in rural as well as urban areas and that protection of the natural environment or improvements in living conditions sometimes have higher priority..
• Nevertheless, the dispersion of funding also meant that support was in some cases spread too widely to have a significant impact in any particular policy – or indeed geographical – area. At the same time, the pursuit of the different objectives was in a number of cases not sufficiently integrated into an overall development strategy, so that the potential complementarities – or synergies – were not adequately exploited.
5.1.6 The particular case of Objective 2
Most of the points made above apply to both Objective 1 and Objective 2 regions. Objective 2, however, needs to be considered separately both because of the much smaller amount of funding involved and because of the smaller geographical areas in which financing was concentrated. Both condition what the funding can be expected to have achieved over the period.
The expenditure co-financed by the ERDF under Objective 2 over the period amounted to just under EUR 265 per head in the EU15 over the 7 year period in the areas receiving aid at the full rate, or under EUR 40 per head a year. This was only just over a quarter of the funding per head

Synthesis Report Ex-post Evaluation of the ERDF 2000-2006
160
in Objective 1 regions. In regions receiving phasing-out support under Objective 2, the amount involved was considerably less – only around EUR 8 a year50.
This scale of support has to be assessed in relation to the problems confronting the areas concerned and the aims which were set for the funding to achieve.
• In many cases, the areas were reliant in the past on traditional industry and had been seeking to diversify into other activities for many years before 2000. As is evident from the case study evidence collected, it typically takes decades of concerted policy effort rather than years to bring about a fundamental change in areas of specialisation.
• Nevertheless, significant achievements were recorded in many Objective 2 areas. In these cases, ERDF support acted both as a catalyst to stimulate the formulation of a long-term strategy for restructuring and for developing new growth activities and as a means of levering larger amounts of funding
• The 7-year programming period, therefore, gave both an opportunity to plan ahead and an incentive to do so, while the relatively small amount of funding helped to focus attention on the most effective ways of deploying this. Moreover, the provision of EU funding lent credence to the strategy being followed and encouraged others to invest in it.
• The effectiveness of funding is reflected in the fact that, despite their economic problems, growth of GDP per head in the regions concerned was either higher or not significantly lower than in non-assisted regions. According to evaluations, funding both boosted growth and helped to improve the potential for future growth.
• Objective 2 funding also helped to further social cohesion and territorial balance especially at the local level. Partly as a result of the small areas on which funding was concentrated and the limited amount involved, much of it went to environmental and community projects which increased the attractiveness of areas as places in which to live.
• Funding also led to greater local involvement in the development of the local area as well as raising awareness of the potential for locally-based action.
In sum, Objective 2 produced positive results in a number of different policy areas across the EU which in many cases far outweighed the relatively small scale of funding made available.
A number of evaluations, however, pointed to the pitfalls of the spatial concentration of Objective 2 funding on small areas. In many cases, the most effective way of helping the areas to develop was to stimulate the growth of economic activity in neighbouring areas where businesses were already concentrated. These, however, were not designated as problem areas and so were not eligible for support.
5.1.7 The management and implementation system
The system which Member States and regions are required to put in place for managing and implementing cohesion policy and for receiving financial aid from the Structural Funds is intended to ensure that the policy implemented is effective. Although the system was already in place in EU15 Member States before the beginning of the 2000-2006 programming period, according to the evaluation, it, nevertheless, had important positive effects over the programming period.
50 See Table 2.3 in Chapter 2 above which shows the support provided by the ERDF in relation to GDP. Overall the level of support in areas assisted under Objective 2 was less than 20% of that in Objective 1 regions in the EU15.

Ex-post Evaluation of the ERDF 2000-2006 Synthesis Report
161
These include, in particular, spill-overs into other policy areas of the key principles involved – programming over a medium-to-long time horizon, partnership (involving stakeholders in the design and implementation of policy), transparency, monitoring and evaluation.
The spill-overs tended to be greatest where commitment to increasing the effectiveness of policies was strongest among decision makers and where the scale of funding was large in relation to national budgets.
Nevertheless, while the programming principle was firmly established, infrastructure projects, particularly for the environment though also for transport, were in many cases, not adequately integrated into an overall regional development strategy. The result was that they were less effective than they might have been in furthering the strategy concerned and in pursuing more than one objective at the same time.
A particular challenge is posed by the typically long duration of infrastructure projects, especially those for transport, which often extend beyond the time span of a single programming period. This, in many cases, is combined with long lead times because of the need for careful design of the project, obtaining planning approval, purchasing the land required and so on, as well as with a high level of uncertainty about the costs involved at various stages of the project. In addition, the bureaucratic procedures surrounding such projects, which vary markedly between countries in their complexity and the time needed to complete them, add a further element of uncertainty and potential delay.
The resulting difficulty in determining the expenditure profile of large-scale infrastructure projects led in a number of countries to funding being concentrated on smaller projects where commitments could more easily be translated into spending within a reasonable period of time, with less risk of infringing the n+2 rule (see below). These projects, however, tended to be less important for development.
In certain cases, funding was shifted to projects which had already been completed, or were in the process of so being, and had been financed from other sources. Accordingly, while the funding provided was spent in the same broad policy area as initially planned, it was not spent on new investment as such. The key issue this raises is whether the strategy initially agreed, and on which the funding provided was predicated, was implemented in practice. This question could not be answered during the evaluation.
A related feature to emerge from the evaluation was the tendency in a number of countries for expenditure to have built up only slowly over the programming period and to have been concentrated at the very end of the time allowed for spending to take place – in the years 2006-2008. This might reflect a particularly careful selection of projects to fund or, alternatively, excessively long administrative procedures, implying significant costs to those undertaking the projects. It also raises a question about the criteria applied to selecting projects towards the end of the period when a large proportion of the funds have to be spent relatively quickly. It equally implies an adverse effect on the implementation of programmes in the following programming period, given the likely preoccupation of the authorities with spending the remaining funding from the previous period. Indeed, the evidence is that a number of Member States have effectively shifted the programming period by two years, so that spending the funds available does not really begin seriously until two years have already elapsed.

Synthesis Report Ex-post Evaluation of the ERDF 2000-2006
162
Unit costs of major projects
A further issue which emerged from the evaluation was the lack of information available on major infrastructure projects which would enable their cost effectiveness, to be assessed. The study carried out as part of the evaluation on this issue concluded that:
• insufficient data exist at present to compare the unit costs of major projects and to assess differences in the costs of similar projects carried out in different parts of the EU in a meaningful way or to broach the question of how far the projects undertaken represented value for money;
• the lack of detailed data on unit costs is a major gap in the information available on the conduct of cohesion policy and the deployment of the Structural Funds;
• DG Regio is uniquely placed to maintain a database containing relevant detailed data on the unit costs of major projects of various kinds completed in different parts of the EU, which would enable both the cost of similar projects regions to be compared across regions and the costs of those planned to be assessed in advance.
Monitoring and evaluation
Considerable progress was made in establishing monitoring and evaluation systems which delivered much more information than ever before about the programmes funded and the expenditure carried out. Progress was particularly evident in countries like the UK, Germany and some regions of Italy where serious attempts were made to assess the effects of policy, such as in relation to enterprise support.
Nevertheless, weaknesses persisted in many Member States. In particular, the main focus tended to be on processes and financial implementation rather than on the actual results of the programmes and the effectiveness of the projects supported. In addition:
• monitoring and evaluation systems were often not integrated into the decision-making process;
• evaluations were not adequately supported by output and result indicators which were often missing, not well measured and sometimes not relevant;
• enterprise support programmes in particular, especially those involving non-repayable grants, were subject to evaluation only in a few Member States, despite the widely recognised problems of deadweight effects.
Criticisms were also made in a number of countries of the heavy administrative burden imposed by the Structural Fund financial regulations on managing authorities and funding recipients alike, which tended to deter SMEs in particular from applying for support.
The n+2 rule
While the changes introduced in the 2000-2006 period to ensure that funding was spent within a reasonable period of time – through the de-commitment regulation (the ‘n+2’ rule) – had the intended effect, mostly without the need for clawing back funding, there were some unintended, and unwanted, side-effects. In a number of countries, where managing authorities were less efficient or primarily concerned with not losing funding, priority was given to projects which were easier and quicker to carry out as opposed to larger and more ambitious projects which might have contributed more to regional development. This was not only the case for major infrastructure projects, as indicated above – though, as also indicated, these involve difficulties

Ex-post Evaluation of the ERDF 2000-2006 Synthesis Report
163
which are not directly linked to n+2 – but also for innovative projects where there was inevitably more uncertainty about the time they would take to complete.
Experience in the EU10 countries
The EU10 countries had only a short period of time in which to implement programmes and lack of experience of pursuing a regional development strategy and of managing large-scale financial aid from the Structural Funds. Nevertheless, the extension of cohesion policy to EU10 countries did not give rise to major problems during the period. Concerns, which were widely aired beforehand about their capacity to absorb the funding provided, proved mostly groundless. They largely succeeded in spending the financing they received in the policy areas intended.
At the same time, although the funding made available was absorbed, it was also reported that:
• In some cases, the short programming period left little time for any detailed assessment of the effects of programmes;
• the administration of policy was adversely affected in many countries by institutional deficiencies, in particular, the lack of an appropriate organisational structure, an overly-bureaucratic system and shortages of experienced staff, partly due to high staff turnover as a result of the higher pay available in the private sector.
Where needed, the EU10 Member States also succeeded in establishing a regional structure of administration. This was the case in all four of the countries (Poland, the Czech Republic, Hungary and Slovakia) with NUTS 2 regions, which formulated regional development strategies where in most cases none existed before. There is equally evidence of the principles embedded in the Structural Fund regulations being extended to other policy areas in a number of the countries.
5.2 IMPLICATIONS FOR COHESION POLICY IN THE FUTURE The findings which have emerged from the evaluation have a number of clear implications for the future design and conduct of cohesion policy, especially in relation to the ERDF, though many of the implications extend more widely to other parts of the Structural Funds.
5.2.1 The multiplicity of cohesion policy objectives
The evaluation has drawn attention forcibly to the multi-dimensional nature of cohesion policy objectives – the twin aims of social and territorial cohesion are as important as economic development and the reduction of economic disparities between regions.
The multiplicity of goals needs to be recognised explicitly in the design, implementation and evaluation of policy, which is not always the case at present and was even less for the 2000-2006 programming period.
A number of implications stem from this, in particular:
• the relative priority attached to the different objectives should be made clear when regional development programmes are determined in Member States or regions; they should be justified and opened up to debate;
• indicators need to be developed in order to cover, so far as possible, the different objectives to enable progress towards achieving them to be monitored;
• these indicators need to be developed at the same time as the objectives are determined and to be regarded as an integral part of the policy-making process.

Synthesis Report Ex-post Evaluation of the ERDF 2000-2006
164
5.2.2 The need for concentration of expenditure
As the report makes clear, funding over the 2000-2006 period under both Objective 1 and Objective 2 was in virtually all cases dispersed over a wide range of policy areas and measures.
• There is a strong case for concentrating funding in particular regions on a limited number of objectives in order to try to ensure that they have a tangible impact and achieve critical mass. This does not necessarily mean concentrating, in each case, solely on one of the multiple objectives of cohesion policy or neglecting complementarities between policy areas. But it does mean reducing the number of measures funded substantially.
• The objectives and the corresponding measured concerned cannot be specified a priori, since they should be in line with the needs of the regions in question and their priorities; these differ between regions because of their different characteristics, patterns of development and areas of potential comparative advantage.
• It should be up to regions to decide, within the constraints indicated below, on the objectives and measures on which to concentrate funding, since they are in the best position to determine the areas in which it would have the greatest effect.
• This choice should not be imposed externally but at the same time, it has to take account of, and be coherent with, the national strategy being pursued as well as with any commonly agreed EU-level strategy. Equally, where relevant (such as in relation to transport networks), it needs to be in line with the policy being followed in neighbouring regions, which implies a degree of central coordination.
• Whichever objectives and measures are chosen on which to concentrate funding, the choice needs to be justified and subject to open debate. It also needs to be subject to detailed and informed negotiations with the European Commission, which has not only to consider the rationale for the action being proposed but also to ensure a suitable concentration of funding, to act as a buffer against the strong tendency for ‘policy creep’ to occur as programmes are determined.
5.2.3 The spatial dimension of policy focus
This report has highlighted the lack of correspondence in many cases between NUTS 2 regions, which tend to be the focus of cohesion policy so far as the ERDF is concerned, and both administrative and functional, or economic, regions. It has also highlighted the interdependencies between regions. Both have implications for the formulation of policy and the assessment of the results.
• Policy needs to be determined, or at least coordinated, at an appropriate spatial level, which varies between policy areas, spanning regions and sometimes countries in some cases (transport networks, for example) and being confined to small areas in others (such as urban regeneration).
• Although there is a strong case for focusing cohesion policy on administrative regions, which is not the case in many Member States at present, the fact that the statistical system is built largely around NUTS 2 regions means that these have to remain at the centre of cohesion policy at EU level.
• Explicit account needs to be taken of the impact of commuting on GDP per head in NUTS 2 regions, in cases where the flows are significant, when designing policies and assessing them.

Ex-post Evaluation of the ERDF 2000-2006 Synthesis Report
165
• The fact that NUTS 2 regions do not always correspond with functional regions means that in some cases a wider perspective needs to be taken when assessing regional development policies which need to span more than one NUTS 2 region.
• The importance of territorial cohesion, as well as sustainable development, means that policy interest cannot stop at the NUTS 2 regional level but needs equally to be concerned with territorial balance within regions.
5.2.4 Indicators for determining and assessing policy
• There is a need to develop indicators of social cohesion which recognise the multi-dimensional nature of the concept both for assessing policy achievements and as an aid to programming. These could include household income per head as an indicator of living standards, though the data at present available on this need to be improved, as well as access to healthcare and education of reasonable standards, and to other essential services and facilities.
• Such indicators need to extend below the NUTS 2 level given the interest in territorial cohesion and achieving a suitable territorial balance of development, though account equally needs to be taken of the importance of ensuring that such development is in keeping with the features and natural assets of the areas concerned.
• Indicators of social and territorial cohesion are relevant for assessing the sustainability of regional development, since the two dimensions are integral aspects of this. There is equally a need to develop indicators which specifically allow for the effects of economic activity on the environment and on the depletion of exhaustible resources.
• Cohesion policy cannot, however, be satisfactorily assessed without reference to regional development policy at national level. Data on the expenditure funded from national sources should be readily available so that this can be examined in relation to spending financed by the Structural Funds. This is far from the case at present, despite the need for Member States to demonstrate that they are complying with the additionality requirement.
5.2.5 The spatial concentration of funding – the case of Objective 2
The issue of the territorial level at which cohesion policy should be implemented is especially relevant with regard to Objective 2, or what is now termed the Competitiveness and Employment Objective. In the 2000-2006 period, funding was targeted at relatively small areas in which there were perceived problems of economic development. In the present programming period, such narrow targeting – or zoning - was abandoned and Member States were left freer to determine where to locate financial support. The evaluation brought to light the problems inherent in the concentration of intervention in small geographical areas.
• Although there are merits in the concentration of funding, spatial concentration ignores interdependencies between areas and the fact that areas often benefit more from developments outside their borders than from those inside. Funding, therefore, should not be narrowly confined to small areas, since this may not only fail to achieve the objective of a more even distribution of economic activity and population but might even distort the spatial pattern of development.
• Concentration of funding does not necessarily imply spatial concentration. Impact can be achieved just as readily by focusing funding on a limited number of policy areas.

Synthesis Report Ex-post Evaluation of the ERDF 2000-2006
166
• The substantial proportion of Objective 2 funding which went to territorial development, to projects mainly of a local interest, but which were important for the communities concerned and attracted much local involvement, was highlighted in a number of the evaluations. The importance of such projects both in terms of the funding allocated to them and their effects on local development was not perceived at the beginning of the ex post evaluation but emerged strongly during the course of it. Accordingly, more research is needed on this policy area in order to learn more about the projects involved and their effects on social and territorial cohesion in particular.
• The spatial zoning of Objective 2 in the 2000-2006 period did achieve one important aim which was effectively to ration the relatively small amount of funding which was available. This evaluation has highlighted the significant positive effects which Objective 2 funding had in many areas over the period despite its small scale. Since the provision of funding can be justified in most areas in terms of the common interest in strengthening economic, social or territorial cohesion across the EU, some means needs to be found for allocating the resources available if it is not through zoning (see Box for an alternative way of concentrating funding).
• In order to determine the shape of Objective 2, or the Competitiveness and Employment Objective in future, there is need to evaluate how the funding is being used across Member States in the present programming period and what the effects are. This is particularly important given the different form of this part of cohesion policy as compared with the previous period.
Box – Policy objectives of common EU interest One way of concentrating funding is to target it specifically on policy objectives which are of common EU interest. This is the approach adopted in the 2007-2013 programming period and a similar approach could be adopted as part of the Europe 2020 strategy, which identifies a limited number of objectives to be achieved over the next 10 years. The problem with this approach is, first, that the objectives may have no precise meaning for any individual region (i.e. a target of raising R&D expenditure to 3% of GDP or the employment rate of those 20-64 does not mean that every region should seek to achieve these rates) and, secondly, if they are couched in general terms, they are objectives which regions will tend to pursue anyway (i.e. to increase R&D and employment).
For such an approach to be both meaningful and effective, it needs, first, to be translated into tangible policies on the ground. Secondly, such policies should not be imposed from above but have to start from the specific circumstances and needs of individual regions. In other words, they have to be ‘place-based’ to use the Barca report terminology and to be ‘bottom-up’ as much as ‘top-down’.
5.2.6 Policy implications in specific areas of intervention
A large number of points emerged from the evaluations of specific policy areas which have implications for future policy and deserve careful consideration. Some of the main ones are:
• In the case of enterprise support, there is need to consider whether the ERDF should be used any longer to finance aid to large enterprises given the real possibility of significant ‘deadweight’ effects.
• In the case of aid to SMEs, there is a need for careful targeting of support on strategic objectives.

Ex-post Evaluation of the ERDF 2000-2006 Synthesis Report
167
• There is a need for more evidence on the effectiveness of support to enterprises; such evidence can only satisfactorily be compiled from studies of the behaviour and performance of firms.
• As regards transport, the case for expanding support for investment in urban transport needs to be recognised given its major potential for reducing congestion and emissions.
• It is equally important to recognise the environmental importance of supporting investment in intermodal transport links, especially if they take traffic off roads.
• It should also be recognised that a great deal of investment is still needed to bring transport networks in the EU12 regions up to a satisfactory standard; it is important, however, that this is done in the most environmentally-friendly way possible.
• Consideration should be given to whether the ERDF should continue to finance:
o the construction of high-speed rail lines, given the cost involved, the alternative sources of finance and the often uncertain benefits to regional development; this is an issue where more research is required, focused on the regional effects of projects;
o the modernisation and extension of regional airports and ports, given both their commercial nature and the questionable effect in many cases on regional economic activity in view of the many which exist;
o the construction of new roads in the EU15, whenever it is not possible to demonstrate a clear reduction in traffic emissions (such as, for example, in the case of urban by-passes) or a clear increase in road safety.
o road maintenance, though this, in practice, can be difficult to distinguish from the upgrading of roads, which remains important in the EU12 regions.
• In the case of environmental projects, in particular – though also in some other policy areas – there is a need to spell out more clearly the case for intervention in terms of the objectives of cohesion policy and to justify funding in these terms; in addition, it is important to link investment in environmental infrastructure with regional development and to monitor this more closely.
• Consideration should be given as to whether it is useful to include horizontal priorities in the Structural Fund guidelines.
5.2.7 Policy implications for management and implementation
It be should be noted that, while concerns were raised in the course of the evaluation about the heavy administrative burden imposed by the Structural Fund regulations, especially in relation to the often very small amounts of funding involved, this was not a specific focus of the evaluation. The policy implications considered here relate to the key conclusion that the attention on financial implementation seems to have been at the expense of a focus on strategic objectives and the results achieved.
Much more monitoring of expenditure and many more evaluations were carried out over the 2000-2006 period than ever before. These, however, were not in many cases at the centre of policy-making and tended to be focused on processes and financial absorption rather than on strategic issues. Moreover, the indicators adopted, together with the targets set, were not sufficiently robust or linked to the objectives of programmes.

Synthesis Report Ex-post Evaluation of the ERDF 2000-2006
168
• There is a need in future for evaluations to be more focused on the effectiveness of programmes and different areas of intervention and on the physical outcomes and results rather than on process issues and absorption; in doing so, rigorous methods of evaluation should be used – making use of both qualitative and quantitative data – adapted to the policy area concerned.
• Indicators need to be directly, and transparently, related to the objectives of programmes. This needs to happen from the beginning of the process, when programmes are formulated, so that it is clear what they are attempting to achieve.
• Data on the indicators should be collected and published regularly to enable programme performance to be monitored.
• It is unrealistic to expect – or aim for – these indicators to be common across the EU; instead they should be specific to the objectives set in the particular regions concerned and enable progress in pursuing these objectives to be tracked
• Equally importantly, such a monitoring and evaluation system needs to be an integral part of the decision-making process. It should be recognised that the obstacles to the adoption of such a system are as much political as technical. There, therefore, has to be an acceptance on the part of Member States that a system of this kind is essential for improving the effectiveness of development policies.
• There also needs to be a willingness to make policy, and evaluations of it, more open to public scrutiny and to encourage debate on both the objectives of policy and the performance in meeting them. Such a debate is perhaps the only way of ensuring that the targets set are meaningful and that the authorities concerned are accountable for their achievement.
• The development of such a system would be facilitated by the concentration of funding on a limited number of priorities, as advocated above, which would make it easier both to set the objectives and to monitor performance towards achieving them.
• To put a system of this kind in place implies more detailed negotiation between the European Commission and the Member States about the content of policy.
• The ‘n+2’ rule should be reconsidered to determine whether there is a better way of ensuring that the funds made available are spent within a reasonable period of time. Such consideration should take specific account of the tendency in a number of countries for expenditure to be concentrated at the end of the programming period and beyond, to investigate whether there is a means of ensuring a more even profile of spending over the period.
• Special attention should be given to the practice of allocating funding to pre-financed projects both to examine whether there are ways of avoiding this – in particular, through investigating how Member States which do not use the method manage to avoid doing so – and to ensure that the funds effectively freed up by the practice are used in an appropriate and effective way.
• Member States should be obliged to produce data on the unit costs of large projects in sufficient detail to enable these to be compared across regions and the cost effectiveness of the projects concerned to be assessed.
• DG Regional Policy should construct and maintain a database containing information on the various elements of the costs of large projects as they are completed across the EU in

Ex-post Evaluation of the ERDF 2000-2006 Synthesis Report
169
the detail required so that the unit costs, which can be calculated from this, can serve as a benchmark for assessing the costs of similar planned projects.
• Arrangements should be established for exchanging information and experience between the authorities responsible for managing the ERDF and implementing cohesion policy in different parts of the EU. This would enable authorities to learn from each other. In particular, those with less experience could learn from those with more and the less successful from the more so, so serving to raise the level of performance across the EU. In addition, it would exploit the considerable amount of information and evidence (on, in particular, what works and what does not and the reasons why, as well as on practical evaluation methods) which has been built up and which is continuously being added to across the EU.
6
7

Synthesis Report Ex-post Evaluation of the ERDF 2000-2006
170
8 Annex – Case study regions
WP 2 Data feasibility
WP4 Structural change
WP 5a Transport
WP 5b Environment
AT Steiermark BE CZ National National DE Rheinland-Pfalz Nordrhein-Westfalen Mecklenburg-
Vorpommern Brandenburg
Bayern Bayern Sachsen-Anhalt
EL Attiki Kentriki Makedonia Kentriki Makedonia ES País Vasco Andalucía Comunidad
Valenciana Galicia Cataluña FI Etelä-Suomi Etelä-Suomi
FR Bretagne Haute Normandie Midi-Pyrenées Corse Rhône-Alpes HU National IE Southern & Eastern IT Toscana Puglia + Bari airport Lazio Lazio LT Lithuania LV Latvia NL Noord Nederland MT PL National Podkarpackie Mazowiekie
PT Lisboa e Vale do Tejo Norte National Açores SE Västra SI National SK Stredné Slovensko Východné Slovakia UK NW England Merseyside W Wales & Valleys NE England J.Lennon airport in
Merseyside

Ex-post Evaluation of the ERDF 2000-2006 Synthesis Report
171
9
WP 7 Demography
WP 9 Rural development
WP 11 Management
Salzburg Burgenland AT Limburg BE CZ Sachsen Sachsen Brandenburg DE
National EL Castilla y León Andalucía Cantabria ES Länsi-Suomi FI
Nord-Pas-de-Calais Centre National FR National HU National National IE Liguria Toscana IT Basilicata LT Latvia LV Gelderland Noord NL National MT Swietokrzyskie PL
Norte PT Norra Norrland Sydsverige Södra Skogslän SE SI SK East of Scotland South West UK East Scotland East Midlands
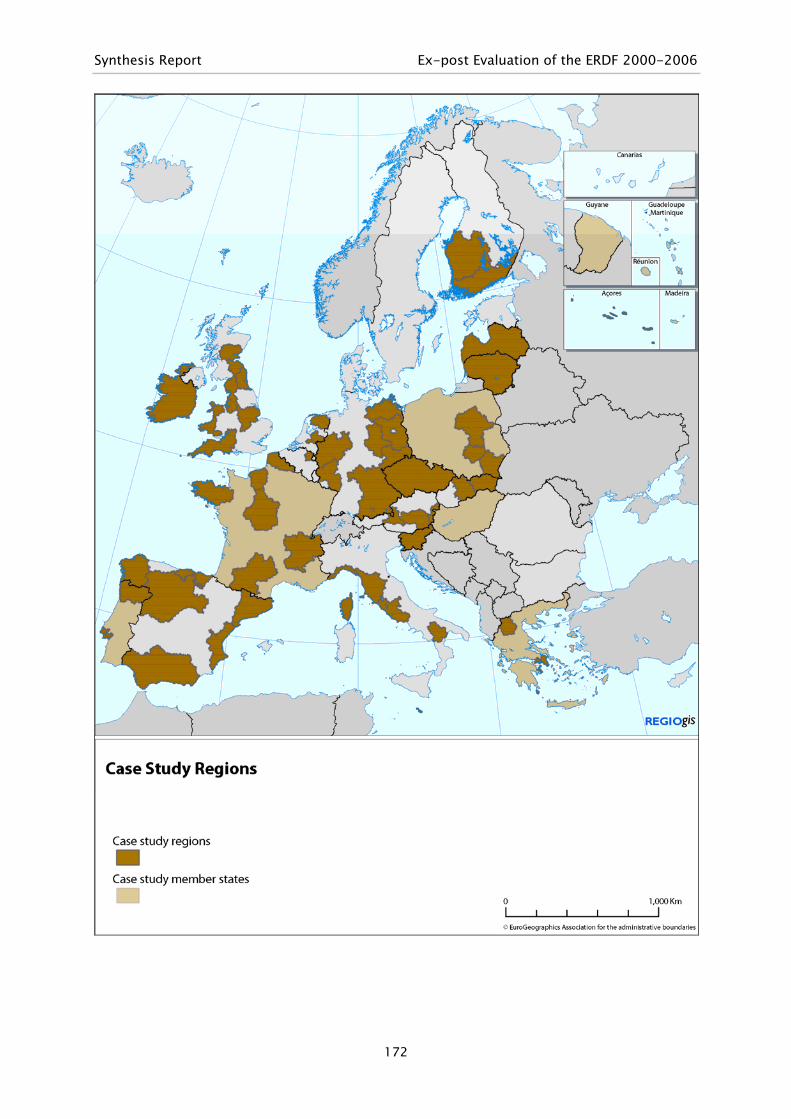
Synthesis Report Ex-post Evaluation of the ERDF 2000-2006
172

Cover page: Vermeer, Johannes: Woman Holding a Balance, Widener Collection.Image courtesy of the Board of Trustees, National Gallery of Art, Washington

Responsible editor: Veronica GAFFEY - European Commission, Regional Policy, Evaluation Unit
The texts of this publication do not bind the Commission
Consult this website for further information:
http://ec.europa.eu/regional_policy/sources/docgener/evaluation/evaluation_en.htm