coimbatore district” - information and library...
TRANSCRIPT

1
“A STUDY ON CONSUMER BRAND PREFERENCE OF
LUXURY CARS WITH PARTICULAR REFERENCE TO
COIMBATORE DISTRICT”
INTRODUCTION AND DESIGN OF THE STUDY
1. PREAMBLE
“The only thing permanent is change”. The world of today is changing fast
and India is no exemption to it. Motor car is one of the commonly used conveyances
by the upper, upper middle and middle class people. Especially after the opening up
of the economy, the pace of change that India and its people are experiencing in their
socio – culture is mind bugging. With the opening up of the Indian economy,
marketers today are facing a new challenges and opportunities.
Now a day‟s motor car is not only bought for social status, but becomes a
necessity one. As the population is in the increasing trend, the government and private
sector are not able to provide adequate conveyance for all the passengers, especially
the office going and the business people.
A lot of car manufacturing companies have come into cater to the needs of the
people, but the consumer preference for the particular brand depends not only the
internal factors, but also the price, appearance, after sales service, mileage,
maintenance etc.,
1.1 BRAND
To brand is to name or mark indelibly as proof of ownership. It means a sign
or symbol of quality. Branding is the best means to capture and retain the consumer
demand in a competitive market. The marketer can create brand equity, brand loyalty
and brand image for his products only through branding.
A product is what the company makes a brand is what a customer buys –
hopes – expectations – services. Branding is the practice of giving a specified name to
a product or group of products from one seller. The sole purpose of branding is to
distinguish your branded products for those of competitors. A well promoted brand
name which has earned reputation in the market is very difficult to compete with.
Trade mark is the legal term, others can‟t use it. The important of branding are

2
It enables national advertisement of a specific product and it is presold through
advertising. Repeat sales are stimulates and product substitution is not possible.
Branding by differentiating a product from its rivals enables the brand- owner to
establish his own price which cannot be easily compared with prices for competing
goods. If a firm has one or more lines of branded goods, it can add a new item to its
list easily and the new item can enjoy all the advantages of branding immediately.[4]
1.1.2 BRANDING
The process involved in creating a unique name and image for a product in the
consumers' mind, mainly through advertising campaigns with a consistent theme.
Branding aims to establish a significant and differentiated presence in the market that
attracts and retains loyal customers.
1.1.3BRANDING STRATEGIES
When a company manages its brands it has a number of strategies it can use to
further increase its brand value. These are:
1.1.4 LINE EXTENSION
This is where an organisation adds to its current product line by introducing
versions of its products with new features, an example could be a crisp/chips
manufacturer extending its line by adding more exotic flavours.
1.1.5 BRAND EXTENSION
If your current brand name is successful, you may use the brand name to
extend into new business areas. For example Virgin Group extending its brand from
records, to airlines, mobiles and banking.
1.1.6 MULTI BRANDING
The company decides to introduce more brands into an existing category.
Multi-branding can allow an organisation to maximise profits, but a company needs to
be weary over their own brands competing with each other over market share.

3
1.1.7 NEW BRANDS
An organisation may decide to launch a new brand into a market. A new brand
may be used to compete with existing rivals and may be marketed as something „new
and fresh‟.
1.1.8 REASON FOR BRANDING
When the supply is more than the demand, companies not only need to create
customers, but also keep them; and to keep customers, one needs to create customer
loyalty. For this one has to project a personality of a brand to which the customer will
be loyal. This personality is called a “BRAND”.
Branding is more powerful instrument of sales promotion due to ever
increasing competition, Branding and packing go hand – in – hand, Need for
advertising and publicity, Development of consumer brand consciousness as a brand
image to the mind.
1.1.9 ESSENTIALS OF A GOOD BRAND
Brand should suggest something about a product‟s benefit –its use quality,
products nature, purpose, performance or action. Example: Lijjat papad, vicco
vajradanti.
The name should be short, simple easy to pronounce, to spell and remember. It
should be capable of being registered. It should have a stable life and be unaffected by
time. It should create pleasant association. It should not be used as a general or
common name for all products. Example: Sunlight, Glowhite, Maggy, Boost, Gold
flake etc., International Global Marketing (1983)
Prof. Levitt‟s article on globalisation of markets points out that world markets
are being driven toward a converging commonality (i.e.) consumer demand round the
world tends to have similar needs, desires and expectations for the same product.
Example: Soni TV, Levy‟s jean, Arrow shirts, coca cola, Rayban glasses,
Toyota, Ford, Mc Donald‟s, Hamburger and so on(1)
.
4
1.2 TRANSPORTATION IN ANCIENT TIMES
Shanks pony (the human foot) was the first form of transport. Then eventually
invented the use of animals, in 4000 and 3000 B. C, meanwhile wheels were invented
in Iraq in 3500 B.C. First wheels were solid pieces of wood lashed in the form of
circle.
Egyptians used horses, some times through litters ( seats between two long
poles). Transportation in 16th
century is made by horses, during 18th
century tolls
system was introduced by England. In 1783 Balloon came in existence as the mode of
transport, in mid 19th
century railways revolutionized the travel, open in 1825 from
Liverpool to Manchester.
“Karl Benz and Gottlieb made the first car in 1885 and 1886. The electric car
heater was invented by Canadian Thomas Ahearn in 1890”.
1.2.1 TRANSPORTATION IN 20TH
CENTURY:
Because of the 1st world war the 19
th century car gone cheaper, greatly
improved in 20th
century. Slowly during 1930‟s and 1934, wind screen wipers,
automatic wipers were invented by Fred and William Folberth in 1921. Transportation
in 21st century got the flying wings.
1.2.3 HISTORY OF THE ANCIENT CARS:
In ancient times cars are named as Luxury because of its features inside it.
Cars are equipped with passenger comfort, safety parking and driving. The new
comforts are air conditioning, in car entertainment, internal combustion engine, fueled
by deflagration of gasoline (also known as petrol and diesel).
The cost of car usage includes the cost of vehicle, auto maintenance, driving
time, parking fee, taxes and insurance, includes the cost of society like, road,
maintenance, land use, pollution, public health and economy benefits.
1.2.4: ORIGIN:
1672 - China first introduces a steam powered vehicle – by Ferdinand Verbiest in.
1769 – Nicolas Joseph Cugnot invented self-propelied mechanical vehicle run by
steam power tricycle.

5
1801 – Richard Trevithick built puffing devil locomotive.
Karl Benz generally acknowledged as the inventor of the modern car in 1879.
1890 – Daimler and Mary Bach founded Daimler Modern Gaselisehaft.
In 1891, in France Envile Levassor and Armand Peugot began producing vehicles and
Daimler engines.
German Engineer Rudolph Diesel greeted an patent for “New rational combustion
engine in 1897”, he build first diesel engine.
1911, Henry Ford and others over tuned the car manufacturing.
Since 1920, mass production among all cars emerged to meet market needs, which
influenced heavily by car design.
Alfred P. Sloan who introduced different car production by one car company, in order
to satisfy the buyers fortunes.
1869 car facilitates was first documented by Mary Ward(2)
.
1.2.5 FUTURE CAR:
Plug in hybrids, battery electric vehicles, hydrogen cars, biofuels and other
alternatives fuels. New materials which may replace car bodies include duraluminium,
fiber glass, and carbon fiber and carbon nano tubes.
Pay as you go basis through telemeters technology and carpool schemes. No
driver or Driverless cars, which are commercially available around 2020, according to
Micheal E. Arth.
1.2.6 AUTOMOBILE INDUSTRY AND AUTOMOTIVE MARKET:
In 2007, 71.9 million cars were sold, 22.9 in Europe, 21.4 in Asia pacific
region and 19.4 in USA and Canada 4.4 in Latin America and 2.4 in Middle East and
1.4 million in Africa.
1.2.7 STATUS BUYERS
Car is bought primary as a status symbol. Brand image associated with the car is
very important. Quality of engineering and attention of finish are very important. In
general styling and looks are important. Multiple car owners and light users. Economy

6
of operation and cost of maintenance are irrelevant to the purchase of decision. The
Mercedes Benz E220 is the absolute top of the line model in this segment. Till a few
years ago Contessa and Maruti Esteem were slotted in this segment. Other models that
might make a dent in this segment are GM opel Astra and Toyota.[2]
1.2.8 LUXURY CAR BUYERS
This segment buyer is seeing the car as a measure of upper class living standard.
Recent entrants rather than high quality of engineering (or) brand image tend to be
viewed favourably. Emphasis on technology and add on feature. Cost of maintenance
and economy of operation are not major points to this class of buyers. The Opel Astra,
Cielo and Maruti Esteem would seem to be the preferred models in this category.[3]
1.2.9 FAMILY CAR BUYERS
These category buyers prefer comfortable and roomy cars. Luggage space would
be an important criterion. Costs of maintenance would be important. Because buyers
would typically be upper middle class. Cielo, Opel Astra and even the Maruti Omni
would probably be ideal candidates for this buyer.
1.2.10 SPORTS CAR BUYERS
Styling and ruggedness are very important. Car would be used extensively on high
ways. Open hooded cars would be preferred. The Maruti Gypsy has been particularly
the only model available to this buyer. However, this segment is expected to see some
new models like the Suzuki Vitara.
1.2.11 UTILITY / FUNCTION BUYERS
Operating economy, durability, easy driving and ruggedness are desired attributes.
Buyer is price sensitive. Wish to have enough facility in maintaining the car. The car
is used mainly for city driving. Among the existing cars Maruti 800, Ambassador,
Maruti Omni and Premier Padmini are the typical model, which satisfied the above
aspirations.
1.2.12 CAR RENTAL AGENCIES, TAXI AND TOURIST CAR OPERATORS
Frequent long distance travel. Comfort, minimum down time, low
maintenance cost, and speciousness are essential attributes. Ruggedness, reliability,
easy of repairs ad servicing are also desirable attributes. Car used very heavily and
7
frequently used in highways. Ambassador, Contessa classic, and Fiat cater to this
segment. The Indian passenger car industry is expected to grow to 2.4 million by the
year 2010 against 4,16,000 in 1997-98. This indicates the compounded annual growth
rate (CAGR) of 16% and an increase in its share of the total industry output to 37%
from the current 30%. In value terms the market is expected to touch Rs.68,000 crores
by 2010 to Rs. 12500 crores in 1997-98, increasing the penetration of passenger cars
to 20 per thousand from four per thousand. This will, however require and directed
thrust by the government to generate demand in this category. The projection is part
of the vision statement by association of Indian Automobile manufacture which sees
the Indian automobile industry growing faster then economy to reach 10% of
Industrial production in 2010.
Going by international brand in the same period (Multi Utility Vehicle) MUV
are expected to constitute 20% of the passenger car, market selling Rs.480000 units
amounting to Rs.19200 crores and two wheeler are expected to grow over 13 million
units a year, with the turn over likely to increase four times to Rs.34000 crores in
2010 implying and CAGR of 12%. Regarding commercial vehicles including light,
medium and heavy ones. The vision anticipates a CAGR of 7% to 6,00,000 from the
current level of 1,60,000. The component sector, with an average of 28% growth
during 92 to 97 is expected to grow at CAGR 22% in nominal terms.[3]
1.2.13 OTHER PLAYERS
General motors‟ India is trying to improve its share in the compact car
segment, which accounts for 70 percent of the total domestic sales of cars. Chevrolet
Beat has helped the company to improve its image. The price of Beat starts from 3,
55,000. The company is planning to offer consumers more fuel options with Beat and
has already launched its diesel version.
BMW India, one of the leaders in luxury car market, has set its eye on the
small car segment. It plans to introduce its hatchbacks and compact sedans I India to
maintain a steady growth. The company is planning to get products from its global
line up depending upon the local demand, based on the best of technology and new
concepts developed by the parent company.
Dailmer, the parent company of Mercedes – Benz, one of the world‟s largest
Luxury automaker, is planning to launch a compact car in India based on its smart
range, France‟s Renault and Japan‟s Nissan will provide technical assistance to alter

8
and modify the basis design of Dailmer‟ Smart – a two seater to suit Indian conditions
and needs.
Honda has developed Brio after five years of research of the Indian market.
Keeping in view the local conditions and specifically catering to the Indian families,
the compact designed car would accommodate five adults. It will be in the
government small car segment, as small cars are taxed at 10% against 22% for other
vehicles. Brio is expected to be under 5,00,000 cars under 4 meter length, and 122 cc
petrol and 1500 cc diesel engines full in the segment.
On May 3, 2011, Mercedes Benz launched two of its premium vehicles – SL
350 and GL 500 to strengthen its portfolio in the highly competitive Indian Luxury
car market. The German car maker is also planning to introduce it‟s A and B class
cars in India within the next four years, and assemble them locally to make them price
competitive.
1.3 CONCEPTUAL FRAME WORK
LUXURY CAR INDUSTRY IN INDIA
A luxury is something that you do not really need to live or survive, but is
enjoyable, nice, or relaxing to have. For example, it would be a luxury to go on a
vacation to Hawaii. The word ''luxury'' refers to products or services of a very high
standard. It is often used to describe something extraneous or expensive, usually
something that many people do not have, and use for leisure time. In cars, examples
of luxurious car manufacturers are: Aston-Martin, Peugeot, Cadillac, Porsche, and
Audi. Researchers agree that luxury goods are conducive to pleasure and comfort, are
difficult to obtain and bring esteem to the owner. Therefore, luxury goods satisfy
socio-psychological needs in greater form.

9
Table 1.1 Best Luxury Cars in India
S. No CARS
1 Audi Cars
2 Bently
3 BMW
4 Bugatti
5 Chevrolet
6 Datsun
7 Ferrari
8 Fiat
9 Force
10 Mitsubishi
11 Honda
12 Hyundai
13 Isuzu
14 Jaguar
15 Lamborghini
16 Land rover
17 Maruti Suzuki Kizashi
18 Mercedes Benz
19 Mini
20 Nissan
21 Porsche
22 Premier
23 Renault
24 Rolls Royce
25 Skoda
26 SSong yong
27 Toyota
28 Volkswagen
29 Volvo
30 Ford Endeavour
Source: www.zigwheels/luxurycarsindia.in
10
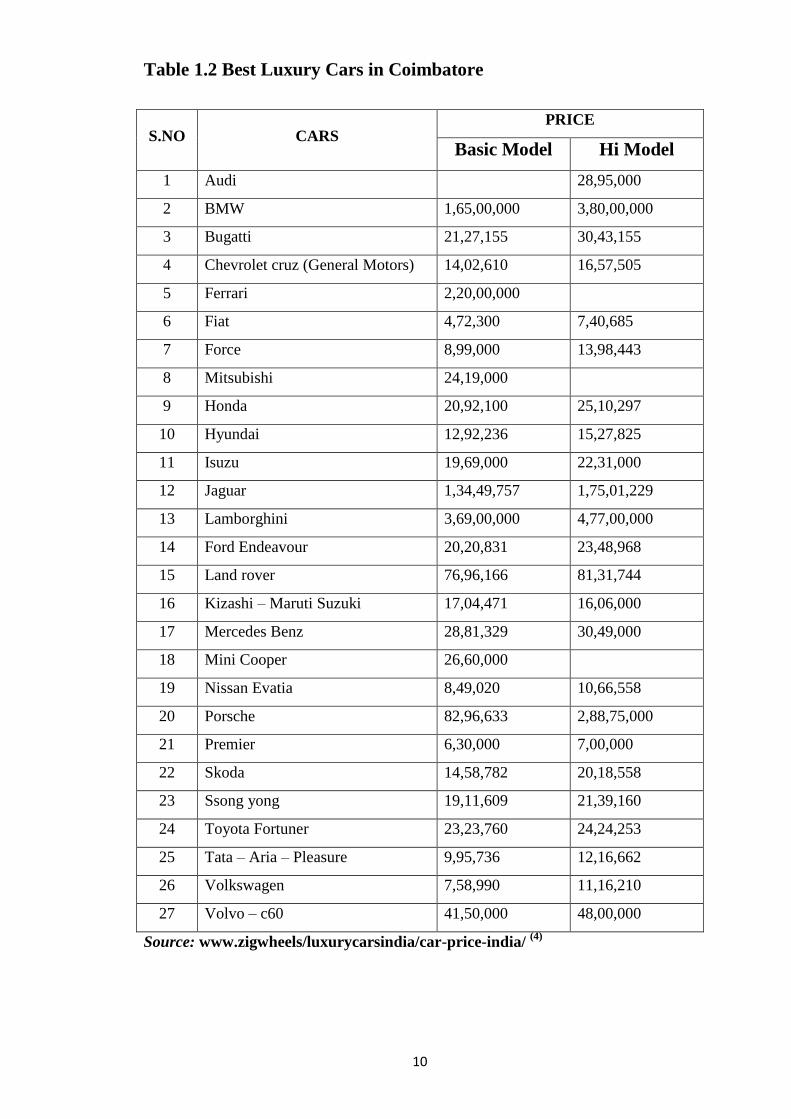
Table 1.2 Best Luxury Cars in Coimbatore
S.NO CARS PRICE
Basic Model Hi Model
1 Audi 28,95,000
2 BMW 1,65,00,000 3,80,00,000
3 Bugatti 21,27,155 30,43,155
4 Chevrolet cruz (General Motors) 14,02,610 16,57,505
5 Ferrari 2,20,00,000
6 Fiat 4,72,300 7,40,685
7 Force 8,99,000 13,98,443
8 Mitsubishi 24,19,000
9 Honda 20,92,100 25,10,297
10 Hyundai 12,92,236 15,27,825
11 Isuzu 19,69,000 22,31,000
12 Jaguar 1,34,49,757 1,75,01,229
13 Lamborghini 3,69,00,000 4,77,00,000
14 Ford Endeavour 20,20,831 23,48,968
15 Land rover 76,96,166 81,31,744
16 Kizashi – Maruti Suzuki 17,04,471 16,06,000
17 Mercedes Benz 28,81,329 30,49,000
18 Mini Cooper 26,60,000
19 Nissan Evatia 8,49,020 10,66,558
20 Porsche 82,96,633 2,88,75,000
21 Premier 6,30,000 7,00,000
22 Skoda 14,58,782 20,18,558
23 Ssong yong 19,11,609 21,39,160
24 Toyota Fortuner 23,23,760 24,24,253
25 Tata – Aria – Pleasure 9,95,736 12,16,662
26 Volkswagen 7,58,990 11,16,210
27 Volvo – c60 41,50,000 48,00,000
Source: www.zigwheels/luxurycarsindia/car-price-india/ (4)

11
1.4 STATEMENT OF PROBLEM
In India after independence, industrialization has paved the way for people to
have luxury items such as LCD‟s, Smart phones, home appliances, and Luxury cars
etc., In Coimbatore, of the increasing development is the growth of the industries.
Coimbatore district is the second largest in Tamilnadu both in area and population,
also known as Manchester of South India. Since it is a industrial area most of the
people and industrialist own cars. The car market has recently undergone a
phenomenal change with a entry of new car model as a result of collaboration with
different foreign car market.
Though there are many car manufacturing companies only a few are able to
sand in the market and earn profit and mostly the companies are not able to face the
competition to remain in the market. The reason is due to the entry of new
International cars which contribute to the luxury segment.
So, the researcher has developed an interest to study the reason behind in
preferring some brands and also a very few research studies in Luxury car segment
are available. My sincere aspirations to know the back ground of the Luxury car
industry in India and also which brand is dominated by the society in Coimbatore
District is studied.
1.5 OBJECTIVES OF THE STUDY
1. To study the growth, development and performance of automobile industry in
India.
2. To assess the awareness of buyers about the brands, products, special features and
accessories of Luxury cars.
3. To analyse the purchase patterns and the factors influencing the brand preference
of Luxury cars.
4. To examine the pre-purchase behaviour of buyer of Luxury cars.
5. To analyse the post – purchase behavior of buyers of Luxury cars.
6. To examine the level of satisfaction of buyers in using the Luxury cars.
7. To offer summary of findings, suggestions and conclusions.

12
1.6 HYPOTHESIS
The study is exploratory in nature and based on Primary and Secondary
information. Secondary information is collected from the different Journals, Internet,
Periodicals, and car manufacturing websites. Primary information can be gathered
using survey methods. To elicit the responses, a detailed questionnaire has been
designed and surveyed.[5]
The following Hypothesis has been framed
1. The sex of the respondents and brands are independent.
2. The age group of the consumer does not influence over the brand preference of the
respondents.
3. Marital status has no significant influence over the brand preference of the
respondents.
4. The occupation of the consumer does not influence the selection of a particular
brand.
5. The qualification of the respondents has no significant influence over the brand
preference.
6. There is no significant relationship between monthly income and brand preference
of the respondents.
7. There is no association between number of family members over brand preference
of the consumer.
1.7 METHODOLOGY
A preliminary questionnaire is developed using four point Likert scales. The
independent and dependent variables are identified. The questionnaire is pre tested
several times to arrive at appropriate wording, format, length and sequencing of the
questions. Pre – test feedback is used to refine the questionnaire until it is ready for
the data collection.
After fixing the questions for the independent and dependent variables based
on the type of questions different values are assigns to the Likert scale.
1.7.1 AREA OF THE STUDY
The study has been conducted in “Coimbatore District” of Tamilnadu state.
13
1.7.2 SAMPLE SIZE
A random sample of 600 persons has been selected through Convenient
Random Sampling.
1.7.3 SOURCE OF DATA
The study is based on primary and secondary data. The primary data are
collected through interview schedule, secondary data through the internet, journals,
periodicals and car manufacturing websites.
1.8 FRAME WORK ANALYSIS
Descriptive statistics is the discipline of quantitatively describing the main
features of a collection of information, or the quantitative description itself.
Descriptive statistics are distinguished from inferential statistics (or inductive
statistics), in that descriptive statistics aim to summarize a sample, rather than use the
data to learn about the population that the sample of data is thought to represent. This
generally means that descriptive statistics, unlike inferential statistics, are not
developed on the basis of probability theory. Even when a data analysis draws its
main conclusions using inferential statistics, descriptive statistics are generally also
presented. For example in a paper reporting on a study involving human subjects,
there typically appears a table giving the overall sample size, sample sizes in
important subgroups (e.g., for each treatment or exposure group), and demographic or
clinical characteristics such as the average age, the proportion of subjects of each sex,
and the proportion of subjects with related comorbidities.
Some measures that are commonly used to describe a data set are measures of central
tendency and measures of variability or dispersion. Measures of central tendency
include the mean, median and mode, while measures of variability include the
standard deviation (or variance), the minimum and maximum values of the variables,
kurtosis and skewness.
1.9 STATISTICAL TOOLS
Study of the collection, organization, analysis, interpretation and presentation
of data. It deals with all aspects of data including the planning of data collection in
terms of the design of surveys. Analyzing data, it is possible to use one or both of
statistics methodologies: descriptive and inferential statistics in the analysis data.

14
To analyse the data the following statistical tools were used. They are:
1. PERCENTAGE ANALYSIS 2. CHI-SQUARE ANALYSIS
3. ANOVA 4. F-TEST
5. T – TEST 6. FACTOR ANALYSIS
7. CORRELATION 8. DESCRIPTIVE ANALYSIS
9. RANKING. 10. MULTIPLE REGRESSIONS.
1.9.1 Percentage Analysis:
Percentage analysis is the method to represent raw streams of data as a
percentage a part in 100 percent, for better understanding of collected data
1.9.2 Chi Square Analysis:
The chi-squared distribution is used in the common chi-squared tests for
goodness of fit of an observed distribution to a theoretical one, the independence of
two criteria of classification of qualitative data, and in confidence interval estimation
for a population standard deviation of a normal distribution from a sample standard
deviation. Many other statistical tests also use this distribution, like Friedman's
analysis of variance by ranks. The chi-squared distribution (also chi-square or χ²-
distribution) with kdegrees of freedom is the distribution of a sum of the squares of
kindependentstandard normal random variables. It is one of the most widely used
probability distributions in inferential statistics.
1.9.3 Anova:
Analysis of variance (ANOVA) is a collection of statistical models used to
analyze the differences between group means and their associated procedures (such as
"variation" among and between groups). In ANOVA setting, the observed variance in
a particular variable is partitioned into components attributable to different sources of
variation. In its simplest form, ANOVA provides a statistical test of whether or not
the means of several groups are equal, and therefore generalizes the t-test to more
than two groups. Doing multiple two-sample t-tests would result in an increased
chance of committing a type I error. For this reason, ANOVAs are useful in
comparing (testing) three or more means (groups or variables) for statistical
significance.

15
1.9.4 F- Test:
An F-test is any statistical test in which the test statistic has an F-distribution
under the null hypothesis. It is most often used when comparing statistical models that
have been fitted to a data set, in order to identify the model that best fits the
population from which the data were sampled.
1.9.5 T- Test:
Percentage: To test for the significance of a difference between two
proportions or percentages. Input two observed proportions or two observed integer
numbers in the top two boxes and two numbers of cases in the number of cases boxes.
If you input a number it will be divided by the number of cases before the analysis to
obtain a proportion. For three or more percentages use the 2xr procedure.
Averages. To test for the significance of a difference between two normally
distributed averages. Input two observed real numbers in the top two boxes, two
numbers of cases in the number of cases boxes and two standard deviations in the
standard deviations boxes, so that there is a value in each box. For three or more
averages use the one way procedure.
1.9.6 Factor analysis:
Factor analysis is a method for investigating whether a number of variables
of interest Y1, Y2, : : :, Yl, are linearly related to a smaller number of unobservable
factors F1, F2, : : :, Fk .
1.9.7 Correlation:
Correlation refers to any of a broad class of statistical relationships involving
dependence. correlation can refer to any departure of two or more random variables
from independence, but technically it refers to any of several more specialized types
of relationship between mean values. There are several correlation coefficients, often
denoted ρ or r, measuring the degree of correlation. The most common of these is the
Pearson correlation coefficient, which is sensitive only to a linear relationship
between two variables (which may exist even if one is a nonlinear function of the
other). Other correlation coefficients have been developed to be more robust than the
Pearson correlation – that is, more sensitive to nonlinear relationships.Mutual
information can also be applied to measure dependence between two variables.

16
1.9.8 Descriptive analysis:
Descriptive statistics is the discipline of quantitatively describing the main
features of a collection of information, or the quantitative description itself.
Descriptive statistics are distinguished from inferential statistics (or inductive
statistics), in that descriptive statistics aim to summarize a sample, rather than use the
data to learn about the population that the sample of data is thought to represent.
This generally means that descriptive statistics, unlike inferential statistics, are
not developed on the basis of probability theory. Even when a data analysis draws its
main conclusions using inferential statistics, descriptive statistics are generally also
presented. For example in a paper reporting on a study involving human subjects,
there typically appears a table giving the overall sample size, sample sizes in
important subgroups (e.g., for each treatment or exposure group), and demographic or
clinical characteristics such as the average age, the proportion of subjects of each sex,
and the proportion of subjects with related comorbidities.
1.9.9 Ranking:
A ranking is a relationship between a set of items such that, for any two
items, the first is either 'ranked higher than', 'ranked lower than' or 'ranked equal to'
the second. In mathematics, this is known as a weak order or total preorder of objects.
It is not necessarily a total order of objects because two different objects can have the
same ranking. The rankings themselves are totally ordered.
1.10.10 Multiple Regressions:
The Multiple Regression Model, Many problems involve more than one
independent variable orfactor which aects the dependent or response variable. I Multi-
factor asset pricing models (beyond CAPM)I Demand for a product given prices of
competing brands, advertising, house hold attributes, etc.
I More than size to predict house price!
In SLR, the conditional mean of Y depends on X. The Multiple Linear Regression
(MLR) model extends this idea to include more than one independent variable.(4)
1.10 PERIOD OF STUDY
The study was conducted from 1st July 2011 to December 2013.
17
1.11 SIGNIFICANCE OF THE STUDY
In 2010, the emergence of over a dozen new cars made India a hot market
automobile and there is more to come. Global majors such as Honda and BMW are
expected to launch their Brio and Mini respectively. Intensifying competition in the
compact car market. In the last three to four years, the luxury car segment witnessed
a phenomenal 60 to 70 percent growth, and reported sales of 15,000 cars in 2010.
Assuming a growth rate of 20 to 30 percent over the next few years, the segment in
2020 is expected to have 1,50,000 cars, which is 10 times its size today.
Maruti Suzuki‟s sales in 2010 – 2011 rose by 26.24 percent at 9,66,447 units,
Hyundai motors sales increased by 13.95 percent to 3,58,904 units, and Tata motors
saw a rise of 27.21 percent at 2,56,202 units.
Government has announced a slow of measures to give impetus to electric
cars. In December 2010, the Ministry of New and Renewable Energy (MNRE)
announced 20% subsidy on electric cars. The finance minister announced setting up
of a national mission on hybrid and electric vehicles in the 2011 – 2012 budgets. In
May 2010, Mahindra took over the fillip to indigenous electric car. The Indian market
alone is estimated to have around one million electric vehicles by 2010.
Today, small cars constitute almost 72 percent of the Indian passenger car
industry, indicating its considerable popularity among consumers. Growing size of the
middle class is an important development.
This led to increase in investment in this segment. Also exports of small cars
from India are rising. Conservative estimates suggest that the Indian market will see
sales of 10 million cars and sports utility vehicles (SUV‟s) by 2020, from just over 2.5
million at present.
1.12 SCOPE OF THE STUDY
“Marketing is a total system of business, an ongoing process of: (i)
discovering and translating consumer needs and desire into products and services. (ii)
creating demand for these products and services. (iii) serving the consumer demand
with the help of marketing channels, and then, in turn, (iv) expanding the market even
in the face of keen competition.”

18
1.13 LIMITATIONS OF THE STUDY
1. It is a general study on luxury car. So this study not made for a specific
brand.
2. As the study is based on interview schedule the result would be varying
according to the opinion of the respondents.
3. The samples are drawn from a particular area. So the results are reliable to
that place only.
19
1.14 CHAPTER SCHEME
CHAPTER I
“Introduction and design of the study” presents the introduction of consumer
behaviour and brand preference, importance and usage of Luxury car in Coimbatore
District, need for the study, statement of the problem, objectives of the study,
limitations of the study, methodology and statistical tools used in the study.
CHAPTER II
This chapter represents “Review of literature” consists of studies conducted
and published by researcher with respect to consumer behaviour and brand preference
of the Luxury cars.
CHAPTER III
This chapter is given preference to the profile of the study area – Coimbatore
District; it includes Coimbatore, Pollachi and Mettupalayam; where the study is being
observed on the consumer behaviour and brand preference.
CHAPTER IV
This chapter denotes the analysis and interpretations of data has been obtained
from the various tools applied to attain the accurate results.
CHAPTER V
Fifth chapter deals with findings, suggestions and conclusions of the study.

20
Table 1.3 Production of Luxury Cars in India
Production of Cars
Year Production in number
1999 – 2000
2000 – 2001
2001 – 2002
2002 – 2003
2003 – 2004
2004 – 2005
2005 – 2006
2006 – 2007
2007 – 2008
2008 - 2009
2012 – 2013
5,74,369
5,17,907
5,64,052
6,08,851
8,43,235
1,027,858
1,112,542
1,322,723
1,521,813
1,620,469
1,575,777
January 15, 2013
Source: Over Drive, A Fortnightly Report
As per the information received from the Society of Indian Automobile
Manufacturers (SIAM), Passenger Car production in India was growing at a
rate of over 17% during the last 10 years. However, due to the increase in fuel
price, low GDP growth rate, exorbitant material cost, high interest rate, and
slow economic growth, the production growth has reduced to a marginal 1%
during April-Nov 2012-13 against its corresponding period of 2011-12. Out of
16 Car manufacturers, 9 companies have reported decreased production, three
more companies have reported only marginal growth (less than 4%) and only
four companies have been doing well. Company wise production of passenger
cars during April-November 2012 and April-November 2011 along with
growth rate is given below.
The samples drawn are confined to the particular area.

21
1.17 TOP TEN LUXURY CARS IN INDIA WITH THEIR PRICES
Table 1.4 Top Ten Luxury Cars in India with Their Prices
Cars Price
Mercedes Benz
Chrysler 300
Mercedes Benz C Class
Cedilla CTS
Audi A4
Lexus Es 350
Acura ILX
Hyundai Genesis
Audi A6
Audi A 5
Rs 54 L* – 92.4 L*
29.85 L* – 47.82 L*
35.55 L* – 62.33 L*
35.91 L* – 51.65 L*
32.5 L* -33.4 L*
36.10 L*
25.9 L* – 29.20 L*
34.20 L* – 46.80 L*
37.85* – 45.45 L*
37.86* – 45.45 L*
*Rupees in Lakhs
Source: Over Drive, A Fortnightly Report

22
1.18 PRODUCTION OF LUXURY CARS IN INDIA DURING APRIL AND
NOVEMBER 2013
TABLE 1.5
Category Production
(In Nos.) April November
BMW India Pvt Ltd 6,872 5,860 -14.73
Fiat India Automobiles Pvt Ltd 11,401 6,021 -47.19
Ford India Pvt Ltd 75,765 75,321 -0.59
General Motors India Pvt Ltd 59,375 45,293 -23.72
Hindustan Motors Ltd 1,912 1,535 -19.72
Honda Cars India Ltd 26,719 49,045 83.56
Hyundai Motor India Ltd 4,20,503 4,23,829 0.79
Mahindra & Mahindra Ltd 12,180 10,932 -10.25
Maruti Suzuki India Ltd 5,79,717 5,98,512 3.24
Mercedes-Benz India Pvt Ltd 4,931 3,605 -26.89
Nissan Motor India Pvt Ltd 83,343 94,345 13.2
Renault India Pvt Ltd 1,131 8,099 616.09
Skoda Auto India Pvt Ltd 20,447 21,259 3.97
Tata Motors Ltd 1,61,582 1,40,686 -12.93
Toyota Kirloskar Motor Pvt Ltd 52,807 63,268 19.81
Volkswagen India Pvt Ltd 57,092 43,828 -23.23
Total Cars 15,75,777 15,91,911 1.02
Source: Over Drive, A Fortnightly Report
Various steps have been taken in pursuance of Automotive Mission Plan
(2006-16) and the new Foreign Trade Policy provides additional incentives which will
expectedly boost the production of cars. The above data available in the written
answer to a question in the Parliament.

23
1.19 Luxury-Car Competition Intensifies in India
In a market dominated by small cars, the competition between luxury
automakers is now also heating up. India is the latest stage in the competition between
three German auto giants: BMW AG Audi AG and Mercedes-Benz. The luxury car
makers are introducing new models and offering customized interest rates in a bid to
lure buyers. They are also opening new showrooms in the country‟s smaller cities.
Globally, the race is neck-and-neck between BMW AG, which has the largest market
share, and Volkswagen AG‟s Audi. In third place is Daimler AG‟s Mercedes-Benz.
This pattern is mirrored in their performance in India, where sales for BMW
have been unchanged from last year at 7,389 cars from January to October. Audi India
sold a similar number of vehicles in this period: 7,267, a 55% increase from the same
period a year earlier. Mercedes-Benz India Pvt., saw sales drop 10% between April
and October to 3,651 cars, according to data issued by the Society of Indian
Automobile Manufacturers. The company declined to share figures from January.
Mercedes-Benz, which started its operations in India in 1990s, over the last
decade lost its dominance in the market to Audi and BMW. Now, the company is
trying to up its game by launching new models. In September, it launched the B-Class
hatchback, which, with a base price of 2.15 million rupees ($39,815) is the company‟s
lowest-priced vehicle in India. The company has already sold out this year‟s lot of
250 units.
Last week, BMW said it would debut the 1-Series in mid-2013, a hatchback
that is expected to compete with Mercedes‟ B-Class. The company also said it would
introduce a new version of its 7-Series sedan. Both cars will be assembled at the
company‟s plant near the southern Indian city of Chennai. Vehicles assembled in
India are cheaper for consumers, since they are taxed less.
Last month, Mercedes also began assembling its first sport utility vehicle in
India: the M-Class. Audi also began assembling an SUV, the Q7, in November, its
second made-in-India SUV after the Q5 model. BMW, which already assembles the
X1 and X3 SUVs in India, introduced a new version of the X6 crossover vehicle last
week.

24
1.20 SO WHO IS THE HERO No. 1 OF THE INDIA LUXURY CAR MARKET
Audi claims that in the month of June 2012 the company sold 759 vehicles.
BMW‟s numbers are 750. Mercedes Benz sold 622 cars. So with a lead of 9 vehicles,
Audi edges BMW to become India‟s No. 1 manufacturer of luxury cars. Not so fast,
says BMW.
BMW claims that Audi has reported wholesale numbers to Society of Indian
Automobile manufacturers (SIAM) while it has reported retail sales. So it is not an
apples to apples comparison.
Wholesale means cars that are billed to dealers. Retail sales mean cars which
have actually been sold to customers. BMW claims that Audi sold only 718 vehicles
(retail sales) compared to BMW‟s 750. Of course, exactly how BMW managed to get
Audi‟s retail sales number is bit of a mystery but its claim is that BMW is still the No.
1. Now add another twist to it. SIAM is the body responsible for collecting and
disseminating sales data of all car/two wheeler/commercial vehicle manufacturers in
India. And SIAM says that it never accepts anything but wholesale data from
manufacturers. And it wouldn‟t acknowledge or comment on whether BMW‟s sales
numbers are retail or wholesale.
Now if you are in the business of writing about/following the automotive
industry in India, you would know that this wholesale/retail number allegation game
has been on between these three German luxury car manufacturers for quite some
time now. Mercedes Benz says that it will stand by what SIAM recognizes and that‟s
wholesale data. BMW says that globally it reports retail sales, so it cannot make an
exception for India. I understand that Audi shares retail sales data too. Although I am
intrigued how the wholesale data for the month of June 2012 made it to the SIAM‟s
data sheet which has led to this confusion.
SIAM is absolutely miffed with all this. I spoke to a SIAM executive on this
matter about a month back and this is what he had to say. “This has become an
absolute joke. We have taken up the matter in the executive committee meeting and
sent a letter to all three manufacturers that they should wholesale numbers only. But
till now they have not done it,” he said. He went on to add that this confusion on the

25
numbers has led to many people questioning the sanctity of SIAM‟s data. I think
SIAM really needs to come out and clear the air over whether it is going to accept
retail numbers from BMW and Audi. If not then there is bound to be confusion and
endless instances of bragging rights to the No. 1 position.

26
REFERENCE
1. Branding and Packaging”‟ Marketing” Kathiresan and Dr. Radha,
Prasanna Publishers, 1999, Pp- 298 - 306
2. The motor cycle/ Auto mobile magazine, Nov vol1, No 2, 1895, pp 16-45.
3. The Mercedes Benz – book by victor Boesen, Doubleday 1981, P.2
ISBN – 0 385 – 12554 – 2.
4. Kothari. C. R “Research Methodology”, Methods and Techniques,
Wishwaprakasam (P) Ltd., New Delhi, Pp – 184, 233, 256 and 315.
5. www.zigwheels/luxurycarsindia/car-price-india/