coke characterization for an industrial pt–sn/γ-al2o3 reforming catalyst
TRANSCRIPT
Coke characterization for an industrial Pt–Sn/g-Al2O3
reforming catalyst
Nancy Martın a,*, Margarita Viniegra a, Rene Zarate b,Gabriela Espinosa c, Nikola Batina d
a Area de Catalisis, Departamento de Quımica, CBI, Universidad A. Metropolitana-Iztapalapa (UAM-I),
Av. San Rafael Atlixco 186, 09340 Mexico D.F., Mexicob Subdirecion de Transformacion Industrial, Gerencia de Catalizadores, Instituto Mexicano del Petroleo (IMP) and
GIDT-PEMEX-Refinacion, Mexico D.F., Mexicoc Programa de Ingenieria Molecular, Instituto Mexicano del Petroleo (IMP), Eje Central 156, 07730 Mexico D.F., Mexico
d Laboratorio de Nanotecnologıa e Ingenierıa Molecular, Area de Electroquımica, Departamento de Quımica,
CBI, UAM-I, Av. San Rafael Atlixco 186, 09340 Mexico D.F., Mexico
Available online 30 August 2005
Abstract
This work presents the characterization of carbon on deactivated Pt–Sn/Al2O3 industrial catalysts, with Pt–Sn (0.3–0.3 wt.%) and g-Al2O3
(with 0.9 wt.% Cl). The samples were deactivated in different cycles of industrial operation and compared with a catalyst deactivated in
methylcyclopentane (MCP) reaction under laboratory conditions. Different sets of samples were used: (a) PS0 (deactivation under laboratory
conditions); (b) PS1, with one cycle of industrial operation; and (c) PS2, with 106 cycles of industrial operation. Deactivated catalysts were
analyzed and characterized using a combination of different techniques: elemental analysis, atomic force microscopy (AFM), temperature-
programmed oxidation (TPO) and 13C nuclear magnetic resonance spectroscopy for solids (NMR). The 13C-CP/MAS NMR spectra were very
similar, indicating the presence of aromatic carbons. TPO profiles showed differences between the samples deactivated during industrial
operation and that deactivated in the MCP reaction. In the case of industrial catalysts, one type of carbon was detected. In contrast, the catalyst
deactivated under laboratory conditions showed two types of carbon or two types of adsorption sites. AFM images revealed two types of coke
morphology, granulate and laminate, which were characterized at the nanometer scale. Our results show that the characteristics of the coke
depend on the deactivation process, and that coke on the industrial catalyst could be successfully described and defined. However, to correlate
all the data obtained from different techniques and to understand the complete mechanism of coke formation, more detailed analysis should be
performed.
# 2005 Published by Elsevier B.V.
Keywords: Pt–Sn; Catalyst deactivation; Coke; Bimetallic catalyst; Industrial reforming catalysts
www.elsevier.com/locate/cattod
Catalysis Today 107–108 (2005) 719–725
1. Introduction
Deactivation of naphtha reforming catalysts by coke
deposition has been extensively studied during the last
decade, due to its important impact on production yields
* Corresponding author. Fax: +52 55 58044666.
E-mail addresses: [email protected] (N. Martın),
[email protected] (M. Viniegra), [email protected] (G. Espinosa),
[email protected] (N. Batina).
0920-5861/$ – see front matter # 2005 Published by Elsevier B.V.
doi:10.1016/j.cattod.2005.07.002
[1–4]. It is well established that coke formation depends on
the operating conditions, the type of catalyst and the reactor
feed composition. Catalytic reforming involves isomeriza-
tion and dehydrogenation. Catalysts used in such processes
are bifunctional, with the acidic function represented by
chlorinated alumina and the metal function represented
by Pt, with or without an alloying component. The acidic
function promotes cracking and isomerization, and the
metallic function promotes hydrogenation, dehydrogenation
and hydrogenolysis. Both functions are required for

N. Martın et al. / Catalysis Today 107–108 (2005) 719–725720
bifunctional isomerization, ring enlargement and dehydro-
cyclization. The catalyst used in our study (Pt–Sn/g-Al2O3
with 0.3–0.3 wt.% Pt–Sn and 0.9 wt.% Cl) is one of the most
frequently used industrial catalysts for reforming processes.
Concurrently with these reactions, coke is deposited over the
catalyst, decreasing its activity and modifying the selectivity
[5–9]. Therefore, it is very important to understand the
characteristics of coke and the mechanism of its formation,
as well as the process for regeneration of industrial catalysts.
For more data on the mechanisms involved in the
deactivation process of such catalysts, see the recent paper
of Sahoo et al. [10] and references therein.
For the deactivation and regeneration of reforming
catalysts, it has been reported [11,12] that metallic sites with
low coke concentrations lose their activity very quickly
towards isomerization reactions and hydrogenolysis, while
isomerization reactions controlled by the acidic function
diminish linearly with increasing coke quantity. This
opposed behavior was observed when the catalyst was
regenerated. The metallic function is re-established more
quickly after removing a small quantity of coke, but the
acidic function recovers slowly [11,12].
At the industrial level, typical naphtha reforming
catalysts such as Pt–Sn/Al2O3–Cl and Pt–Re/Al2O3–Cl
are used with complex feeds during hundred of cycles, with
operating cycles and regeneration treatments alternated. The
latter consist of exposing the spent catalyst to oxygen or air
at high temperature to burn off carbon produced during the
reforming process, followed by a reduction step that returns
the catalyst to the active (metallic) form. This decoking
process normally involves the combustion of coke with a low
concentration of oxygen in the first stage, with the oxygen
content increased as coke is gradually gasified. This regular
interval of operation is called a cycle, which has to be
extended as much as possible to increase catalyst efficiency.
However, the regeneration process has some impact on the
physical and chemical properties of the treated catalyst (both
metal and support). It slowly leads to global deterioration
and low efficiency of industrial catalysts [13–15]. Whatever
the industrial process, finding ways to limit or prevent
deactivation by carbonaceous deposits and to regenerate the
activity are important objectives. To this end, a great number
of techniques have been used for locating and identifying
carbonaceous deposits [16]. However, these deposits
generally consist of a large number of compounds, which
makes their identification difficult. Therefore, carbonaceous
deposits responsible for deactivation are still often
characterized in a simple manner, by their amount and
their bulk elemental composition. More recently, examples
using more sophisticated techniques for coke characteriza-
tion have been reported. Transmission electron microscopy
(TEM) coupled with electron energy loss spectroscopy
(EELS) showed that on HSZM-5 and H-offretite, the coke
structure was similar to that of coronene (pregraphitic),
while on USHY it was more similar to pentacene (linear
polyaromatic) [17]. X-ray diffraction (XRD) [18] and
Raman spectroscopy [19] analysis revealed features
characteristic of graphitic carbon. Scanning probe micro-
scopy (SPM), in particular atomic force microscopy (AFM),
provides the opportunity to extend this surface science
protocol to particles of carbon with nanometer scale
resolution.
The aim of this paper was to study coke deposited on a
Pt–Sn/g-Al2O3 catalyst after industrial operation in several
cycles to analyze the changes suffered by the catalyst under
different reaction conditions. As a reference, Pt–Sn/g-Al2O3
deactivated in the laboratory in the methylcyclopentane
reaction was used. The catalysts were characterized by
temperature-programmed oxidation (TPO), elemental ana-
lysis, nuclear magnetic resonance of 13C (13C-CP/MAS
NMR) and AFM. Our particular focus was on AFM results.
Although AFM is an established technique in materials and
surface science [20–24] as a powerful tool for nanometer
scale characterization, so far it has not been used as
frequently in the field of catalysis, especially for industrial
sample characterization. Among the many different and
possible reasons, visualization of the surface of the industrial
catalysts is undoubtedly a difficult process and interpretation
of such multi-composite and multi-crystalline or even
amorphous surfaces is still a very difficult task. The major
goal in our study was to find an easy and secure methodology
to identify coke in the AFM images and characterize it in
terms of the shape and the size of surface features. Further
intentions are to locate the exact position as the preferential
site for coke formation on the catalyst surface, and to
compare and support the visualization findings with data
obtained from the other techniques used in our study.
2. Experimental
2.1. Materials
The samples of industrial catalysts used, PS1 and PS2, are
commercially available Pt–Sn/g-Al2O3-based catalysts
(IMP, Mexico) used in the PEMEX industrial plant
for naphtha reforming (UOP) in the continuous catalyst
regeneration mode. The PS1 sample went through a single
operation cycle, whereas PS2 endured 106 cycles at the
industrial level. The reaction conditions in these cycles for
both samples were: pressure, 10.5 kg/cm2; LHSV, 2.2 h�1;
H2/Hc molar ratio, 3.7. The laboratory reference catalyst
(Pt–Sn/g-Al2O3–Cl; PS0), was prepared by coimpregnation
of the Al2O3 support with H2PtCl6�6H2O (Aldrich, 99%) and
SnCl4�5H2O (Aldrich, 99%). The impregnated sample was
dried at 393 K and calcined in air at 673 K for 3 h. It
was then reduced under H2 flow for 4 h at 673 K. The
hydrogenolysis of methylcyclopentane (MCP) (Aldrich,
99.7%) was conducted in a conventional flow-differential
reactor under the following conditions: reaction tempera-
ture, 500 8C; WHSV, 4.5 h�1; H2/MCP molar ratio, 2;
atmospheric pressure. The run length was typically 8 h.
N. Martın et al. / Catalysis Today 107–108 (2005) 719–725 721
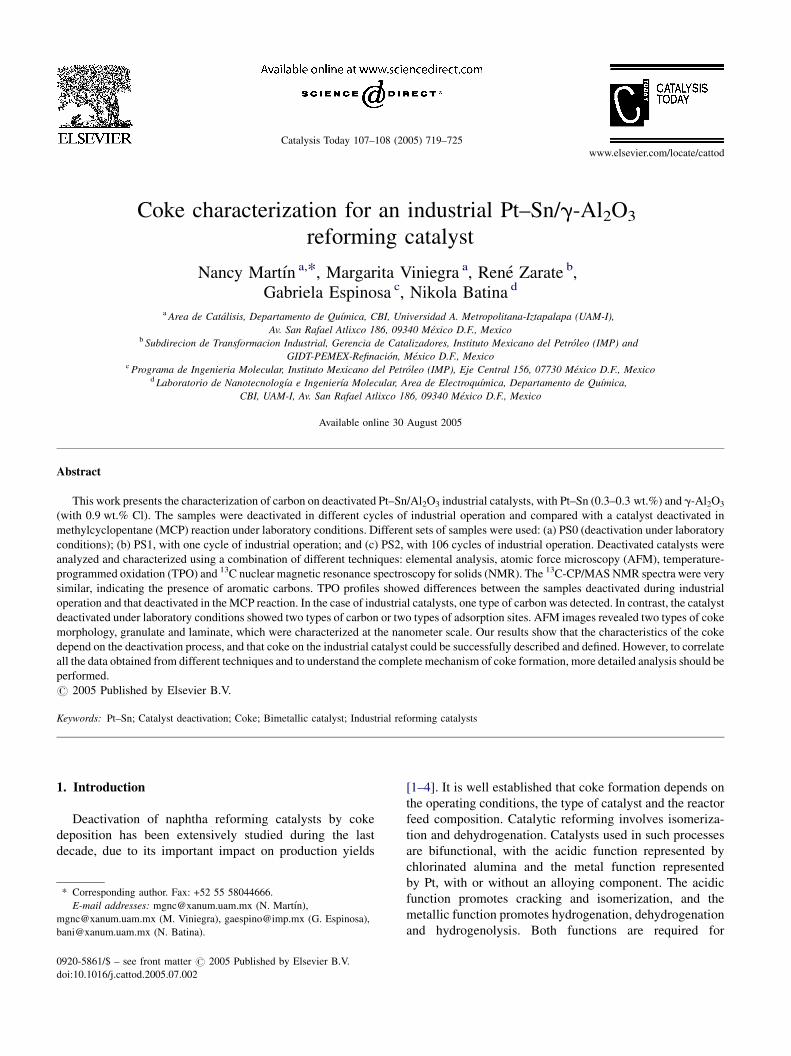
Table 1
The elemental analysis and general properties of the tested catalysts
Samples Pt (wt.%) Sn (wt.%) Cl (wt.%) BET surface area (m2/g) Pore volume (cm3/g) Carbon (wt.%)
PS0 0.37 0.37 0.93 212 0.50 5.9
PS1 0.27 0.26 1.12 182 0.78 5.4
PS2 0.32 0.30 0.86 133 0.82 6.0
2.2. Catalyst characterization
The BET specific area of the catalysts was determined by
nitrogen adsorption using a Micromeritics ASAP 2000
instrument. Samples were reactivated in vacuum (<10�2 Pa)
at 300 8C for 2 h. The main textural characteristics of the
catalysts are shown in Table 1.
Elemental analysis was performed on a Perkin-Elmer
CHNS/O PE-600 instrument to determine the amount of
carbon deposited.
TPO analysis of the deactivated samples was carried out
in an ISRI-RIG automatic reactor with a thermal con-
ductivity detector using a mixture of 5 mol% O2 in Ar, with a
heating rate of 5 8C/min from room temperature to 900 8Cand a flow rate of 60 cm3/min.
13C-CP/MAS NMR spectra were recorded on an ASX
300 Bruker spectrometer at 75.47 MHz with a contact time
of 1 ms at a spinning rate of 5 kHz and 908 pulses of 4 ms.
The surface morphology of the catalyst samples was
probed using a Nanoscope III AFM (Digital Instruments,
Santa Barbara, CA, USA). Imaging was performed ex situ
under laboratory atmosphere conditions. AFM was operated
in the so-called tapping mode (Digital Instruments, manual
for Nanoscope III-SPM) [22], which is less invasive and
recommended for surfaces with ‘‘soft’’ adsorbed material.
Commercial Si cantilevers (NanoSensors TESP, DI), were
used. An optical stereovideo-microscope was used to select
up to five different points for AFM probing on each sample
to allow for the statistical nature of AFM analysis. Images
presented in this paper are plotted as a combination of the
height and amplitude modes, which increases resolution,
but only partially represents the surface topography. All
quantitative evaluations, as measurement of the lateral
dimensions (size) and height of the observed surface
features, were based on the interpretation of AFM images
recorded in the pure height topographic mode.
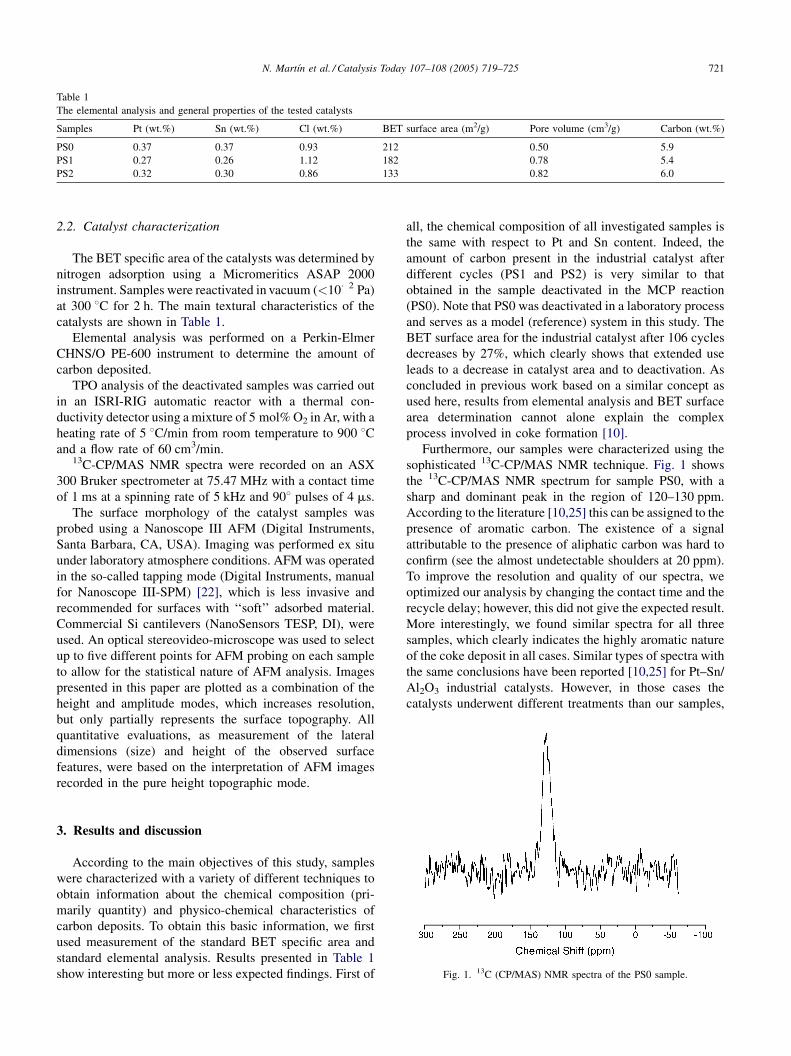
Fig. 1. 13C (CP/MAS) NMR spectra of the PS0 sample.
3. Results and discussion
According to the main objectives of this study, samples
were characterized with a variety of different techniques to
obtain information about the chemical composition (pri-
marily quantity) and physico-chemical characteristics of
carbon deposits. To obtain this basic information, we first
used measurement of the standard BET specific area and
standard elemental analysis. Results presented in Table 1
show interesting but more or less expected findings. First of
all, the chemical composition of all investigated samples is
the same with respect to Pt and Sn content. Indeed, the
amount of carbon present in the industrial catalyst after
different cycles (PS1 and PS2) is very similar to that
obtained in the sample deactivated in the MCP reaction
(PS0). Note that PS0 was deactivated in a laboratory process
and serves as a model (reference) system in this study. The
BET surface area for the industrial catalyst after 106 cycles
decreases by 27%, which clearly shows that extended use
leads to a decrease in catalyst area and to deactivation. As
concluded in previous work based on a similar concept as
used here, results from elemental analysis and BET surface
area determination cannot alone explain the complex
process involved in coke formation [10].
Furthermore, our samples were characterized using the
sophisticated 13C-CP/MAS NMR technique. Fig. 1 shows
the 13C-CP/MAS NMR spectrum for sample PS0, with a
sharp and dominant peak in the region of 120–130 ppm.
According to the literature [10,25] this can be assigned to the
presence of aromatic carbon. The existence of a signal
attributable to the presence of aliphatic carbon was hard to
confirm (see the almost undetectable shoulders at 20 ppm).
To improve the resolution and quality of our spectra, we
optimized our analysis by changing the contact time and the
recycle delay; however, this did not give the expected result.
More interestingly, we found similar spectra for all three
samples, which clearly indicates the highly aromatic nature
of the coke deposit in all cases. Similar types of spectra with
the same conclusions have been reported [10,25] for Pt–Sn/
Al2O3 industrial catalysts. However, in those cases the
catalysts underwent different treatments than our samples,
N. Martın et al. / Catalysis Today 107–108 (2005) 719–725722
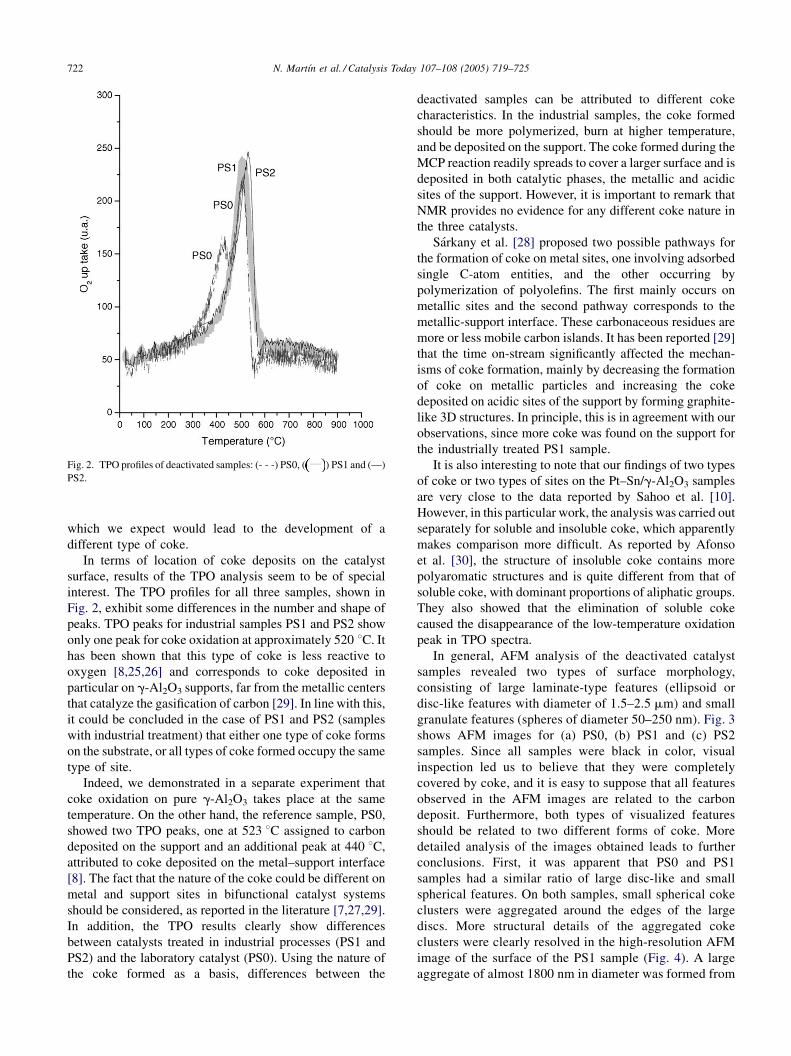
Fig. 2. TPO profiles of deactivated samples: (- - -) PS0, ( ) PS1 and (—)
PS2.
which we expect would lead to the development of a
different type of coke.
In terms of location of coke deposits on the catalyst
surface, results of the TPO analysis seem to be of special
interest. The TPO profiles for all three samples, shown in
Fig. 2, exhibit some differences in the number and shape of
peaks. TPO peaks for industrial samples PS1 and PS2 show
only one peak for coke oxidation at approximately 520 8C. It
has been shown that this type of coke is less reactive to
oxygen [8,25,26] and corresponds to coke deposited in
particular on g-Al2O3 supports, far from the metallic centers
that catalyze the gasification of carbon [29]. In line with this,
it could be concluded in the case of PS1 and PS2 (samples
with industrial treatment) that either one type of coke forms
on the substrate, or all types of coke formed occupy the same
type of site.
Indeed, we demonstrated in a separate experiment that
coke oxidation on pure g-Al2O3 takes place at the same
temperature. On the other hand, the reference sample, PS0,
showed two TPO peaks, one at 523 8C assigned to carbon
deposited on the support and an additional peak at 440 8C,
attributed to coke deposited on the metal–support interface
[8]. The fact that the nature of the coke could be different on
metal and support sites in bifunctional catalyst systems
should be considered, as reported in the literature [7,27,29].
In addition, the TPO results clearly show differences
between catalysts treated in industrial processes (PS1 and
PS2) and the laboratory catalyst (PS0). Using the nature of
the coke formed as a basis, differences between the
deactivated samples can be attributed to different coke
characteristics. In the industrial samples, the coke formed
should be more polymerized, burn at higher temperature,
and be deposited on the support. The coke formed during the
MCP reaction readily spreads to cover a larger surface and is
deposited in both catalytic phases, the metallic and acidic
sites of the support. However, it is important to remark that
NMR provides no evidence for any different coke nature in
the three catalysts.
Sarkany et al. [28] proposed two possible pathways for
the formation of coke on metal sites, one involving adsorbed
single C-atom entities, and the other occurring by
polymerization of polyolefins. The first mainly occurs on
metallic sites and the second pathway corresponds to the
metallic-support interface. These carbonaceous residues are
more or less mobile carbon islands. It has been reported [29]
that the time on-stream significantly affected the mechan-
isms of coke formation, mainly by decreasing the formation
of coke on metallic particles and increasing the coke
deposited on acidic sites of the support by forming graphite-
like 3D structures. In principle, this is in agreement with our
observations, since more coke was found on the support for
the industrially treated PS1 sample.
It is also interesting to note that our findings of two types
of coke or two types of sites on the Pt–Sn/g-Al2O3 samples
are very close to the data reported by Sahoo et al. [10].
However, in this particular work, the analysis was carried out
separately for soluble and insoluble coke, which apparently
makes comparison more difficult. As reported by Afonso
et al. [30], the structure of insoluble coke contains more
polyaromatic structures and is quite different from that of
soluble coke, with dominant proportions of aliphatic groups.
They also showed that the elimination of soluble coke
caused the disappearance of the low-temperature oxidation
peak in TPO spectra.
In general, AFM analysis of the deactivated catalyst
samples revealed two types of surface morphology,
consisting of large laminate-type features (ellipsoid or
disc-like features with diameter of 1.5–2.5 mm) and small
granulate features (spheres of diameter 50–250 nm). Fig. 3
shows AFM images for (a) PS0, (b) PS1 and (c) PS2
samples. Since all samples were black in color, visual
inspection led us to believe that they were completely
covered by coke, and it is easy to suppose that all features
observed in the AFM images are related to the carbon
deposit. Furthermore, both types of visualized features
should be related to two different forms of coke. More
detailed analysis of the images obtained leads to further
conclusions. First, it was apparent that PS0 and PS1
samples had a similar ratio of large disc-like and small
spherical features. On both samples, small spherical coke
clusters were aggregated around the edges of the large
discs. More structural details of the aggregated coke
clusters were clearly resolved in the high-resolution AFM
image of the surface of the PS1 sample (Fig. 4). A large
aggregate of almost 1800 nm in diameter was formed from

N. Martın et al. / Catalysis Today 107–108 (2005) 719–725 723
Fig. 3. AFM images of deactivated samples: PS0 (a), PS1 (b) and PS2 (c). Z-scale range in the images (a and c): 0–0.70 mm and in the image (b): between 0 and
1.50 mm.
approximately 220 much smaller spherical coke particles
of 55–59 nm in diameter. As seen in Fig. 3a and b, coke
aggregated preferentially around the edges of the large
discs. The reason for this could be a property of the
surface, e.g. the influence of surface roughness, or related
to the non-homogeneous distribution of metal particles on
the catalyst surface. We could not speculate further, since
our results do not show a level of detail sufficient to see
where the metallic centers are located on the catalyst
surface. However, we noted that images recorded in the
amplitude mode do not show great differences in contrast
between the small spherical and large disc-like features,
which means that images show a surface with similar
mechanical properties (hardness or elasticity of a single
type of material, i.e. carbon).
In contrast, from the image presented in Fig. 3c for the
PS2 sample, which passed through 106 cycles, it is evident
that prolonged use resulted in a decrease in the proportion of
small spherical coke particles, with carbon mainly present in
the form of large, smooth disc-like grains. According to the
elemental analysis results, all three samples have a very
similar carbon content (Table 1), which means that in the
N. Martın et al. / Catalysis Today 107–108 (2005) 719–725724
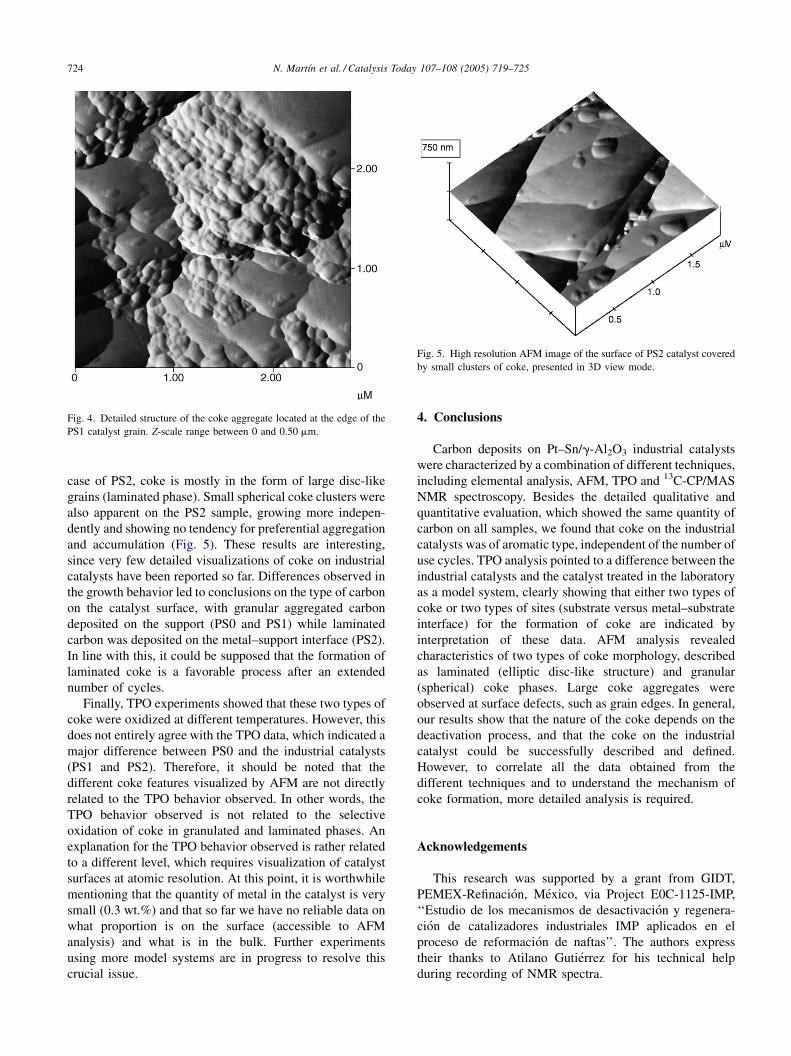
Fig. 4. Detailed structure of the coke aggregate located at the edge of the
PS1 catalyst grain. Z-scale range between 0 and 0.50 mm.
Fig. 5. High resolution AFM image of the surface of PS2 catalyst covered
by small clusters of coke, presented in 3D view mode.
case of PS2, coke is mostly in the form of large disc-like
grains (laminated phase). Small spherical coke clusters were
also apparent on the PS2 sample, growing more indepen-
dently and showing no tendency for preferential aggregation
and accumulation (Fig. 5). These results are interesting,
since very few detailed visualizations of coke on industrial
catalysts have been reported so far. Differences observed in
the growth behavior led to conclusions on the type of carbon
on the catalyst surface, with granular aggregated carbon
deposited on the support (PS0 and PS1) while laminated
carbon was deposited on the metal–support interface (PS2).
In line with this, it could be supposed that the formation of
laminated coke is a favorable process after an extended
number of cycles.
Finally, TPO experiments showed that these two types of
coke were oxidized at different temperatures. However, this
does not entirely agree with the TPO data, which indicated a
major difference between PS0 and the industrial catalysts
(PS1 and PS2). Therefore, it should be noted that the
different coke features visualized by AFM are not directly
related to the TPO behavior observed. In other words, the
TPO behavior observed is not related to the selective
oxidation of coke in granulated and laminated phases. An
explanation for the TPO behavior observed is rather related
to a different level, which requires visualization of catalyst
surfaces at atomic resolution. At this point, it is worthwhile
mentioning that the quantity of metal in the catalyst is very
small (0.3 wt.%) and that so far we have no reliable data on
what proportion is on the surface (accessible to AFM
analysis) and what is in the bulk. Further experiments
using more model systems are in progress to resolve this
crucial issue.
4. Conclusions
Carbon deposits on Pt–Sn/g-Al2O3 industrial catalysts
were characterized by a combination of different techniques,
including elemental analysis, AFM, TPO and 13C-CP/MAS
NMR spectroscopy. Besides the detailed qualitative and
quantitative evaluation, which showed the same quantity of
carbon on all samples, we found that coke on the industrial
catalysts was of aromatic type, independent of the number of
use cycles. TPO analysis pointed to a difference between the
industrial catalysts and the catalyst treated in the laboratory
as a model system, clearly showing that either two types of
coke or two types of sites (substrate versus metal–substrate
interface) for the formation of coke are indicated by
interpretation of these data. AFM analysis revealed
characteristics of two types of coke morphology, described
as laminated (elliptic disc-like structure) and granular
(spherical) coke phases. Large coke aggregates were
observed at surface defects, such as grain edges. In general,
our results show that the nature of the coke depends on the
deactivation process, and that the coke on the industrial
catalyst could be successfully described and defined.
However, to correlate all the data obtained from the
different techniques and to understand the mechanism of
coke formation, more detailed analysis is required.
Acknowledgements
This research was supported by a grant from GIDT,
PEMEX-Refinacion, Mexico, via Project E0C-1125-IMP,
‘‘Estudio de los mecanismos de desactivacion y regenera-
cion de catalizadores industriales IMP aplicados en el
proceso de reformacion de naftas’’. The authors express
their thanks to Atilano Gutierrez for his technical help
during recording of NMR spectra.

N. Martın et al. / Catalysis Today 107–108 (2005) 719–725 725
References
[1] J.K. Lee, H.K. Rhee, Catal. Today 38 (2) (1997) 235.
[2] H.Y. Chu, M.P. Rosynek, J.H. Lunsford, J. Catal. 178 (1998)
352.
[3] F. Vaudry, F. Di Renzo, F. Fajula, P. Shulz, J. Chem. Soc., Faraday
Trans. 94 (1998) 617.
[4] F.J. Maldonado-Hodar, M.F. Ribeiro, J.M. Silva, A.P. Antunes, F.R.
Ribeiro, J. Catal. 178 (1998) 1.
[5] J.M. Parera, R.J. Verderone, C.L. Pieck, E.M. Trafffano, Appl. Catal.
A 23 (1986) 15.
[6] C.L. Padro, S.R.O. Miguel, A.A. Castro, O.A. Scelza, Stud. Surf. Sci.
Catal. (1997) 191.
[7] N. Martın, M. Viniegra, E. Lima, G. Espinosa, Ind. Eng. Chem. Res. 43
(2004) 1206.
[8] J. Barbier, P. Marecot, N. Martin, A. Elassal, R. Maurel, Stud. Surf.
Sci. Catal. 40 (1980) 53.
[9] J. Beltramini, T.J. Wessel, R. Datta, AIChE J. 37 (6) (1991) 845.
[10] S.K. Sahoo, P.V.C. Rao, D. Rajeshwer, K.R. Krishnamurthy, I.D.
Singh, Appl. Catal. A. 244 (2003) 311.
[11] J.N. Beltramini, R. Datta, React. Kinet. Catal. Lett. 44 (2) (1991)
345.
[12] S.M. Stagg, C.A. Querini, W.E. Alvarez, D.E. Resasco, J. Catal. 168
(1997) 75.
[13] J. Barbier, in: B. Delmon, G.E. Froment (Eds.), Catalyst Deactivation,
Martin Nijhoff, 1982, p. 3.
[14] N.S. Figoli, J.N. Beltramini, C.A. Querini, J.M. Parera, Appl. Catal. A
26 (1986) 39.
[15] C.A. Querini, S.C. Fung, J. Catal. 141 (1993) 389.
[16] M. Guisnet, in: G. Ertl, H. Knozinger, J. Weitkamp (Eds.), Handbook
of Heterogeneous Catalysts, VCH Weinheum, 1997, p. 676.
[17] P. Gallezot, C. Leclercq, M. Guisnet, P. Magnoux, J. Catal. 114 (1988)
100.
[18] D. Espinat, E. Freund, H. Dexpert, G. Martino, J. Catal. 126 (1990)
496.
[19] J.P. Frank, G.P. Martino, in: J. Oudar, H. Wise (Eds.), Deactivation and
Poisoning of Catalysts, Marcel Dekker, New York, USA, 1985
(Chapter 6).
[20] R. Wiesendanger, Scanning Probe Microscopy and Spectroscopy:
Methods and Applications, Cambridge University Press, Cambridge,
UK, 1994.
[21] R.J. Colton, A. Engel, J.E. Frommer, H.E. Gaub, A.A. Gewirth, R.
Guckenberger, J. Rabe, W.M. Heckl, B. Parkinson, Procedures in
Scanning Probe Microscopies, John Wiley & Sons, Chichester, UK,
1998.
[22] D. Bonnell, Scanning Probe Microscopy and Spectroscopy: Theory
Techniques and Applications, Wiley-VCH, New York, USA, 2001 .
[23] S. Morita, R. Wiesendanger, E. Meyer, Noncontact Atomic Force
Microscopy, Springer-Verlag, Berlin, Germany, 2002.
[24] S.N. Maganov, M.-H. Whangbo, Surface Analysis with STM and
AFM, VCH, Weinheim, Germany, 1994.
[25] C.L. Li, O. Novaro, X. Bokhimi, E. Munoz, J.L. Boldu, J.A. Wang, T.
Lopez, R. Gomez, N. Batina, Catal. Lett. 65 (2000) 209.
[26] R.D. Srivastava, Heterogeneous Catalytic Science, CRC Press, Boca
Raton, FL, USA, 1998.
[27] J. Barbier, Stud. Surf. Sci. Catal. 34 (1987) 1.
[28] A. Sarkany, H. Lieske, T. Szilagyi, L. Toth, in: Proceedings of Eight
ICC, vol. 2, Berlin, 1984, p. 613.
[29] C.L. Li, O. Novaro, E. Munoz, J.L. Boldu, X. Bohhimi, J.A. Wang, R.
Gomez, Appl. Catal. A 199 (2000) 211.
[30] J.C. Afonso, M. Schmal, R. Frety, Fuel Process. Technol. 41 (1) (1994)
13.