coke zero research report - wix free website builder
TRANSCRIPT

Rebecca Bolding
josh Cantrell
matt Cleary
Kristen Eddleman
Sarah Gore
Katie Williams
COKE ZERO
RESEARCH REPORT
December 11, 2006

I LOVE MY GROUP.

Table of Contents
S ituation Analysis..................................................................................................... 2-11
C lient Profile and Competitor Analysis...............................................................11-27
C onsumer Insights.................................................................................................. 27-36
S urvey.............................................................................................................................37
R esults and Discussion..........................................................................................38-57
R ecommendations..................................................................................................58-60

IntroductionA
1
s an extension of the Coca-Cola portfolio launched in 2005, Coke Zero intended to become a mega-brand with a projected market share of 1.5%, although the brand has fallen short of its expected goal. Coke Zero, designed to taste like Coca-Cola Classic, but without the sugar content, failed to resonate in the minds of consum-ers due to failed marketing and advertising efforts. Coke Zero aims to attract young adults males 18-34 to the beverage who tend to shy away from diet colas, particularly Diet Coke. The analysis of Coke Zero and its compet-itors explores three main areas as to pro-vide further insight into the CSD industry. The first area of exploration is the In-dustry Overview, which catalogues the industry’s history, the industry size, advertising expenditures within the industry, growth potential and growth forecasts, competitors to Coke Zero, social and cultural con-siderations that influence soft drink con-sumption trends, the economic environment, regulatory and legal issues that affect manufactur-ing of soft drinks, and finally new developments in the industry. These sections will highlight the back ground knowledge essential for gaining further
insight into Coke Zero. Next, the Client Profile and Competi-tor Analysis provides information about Coke Zero and its key competitors, company and brand history for Coca-Cola and
Pepsi, sales of each competing beverage, and a marketing mix evaluation of Coke Zero and its competitors. Third,
the Consumer Analysis provides information about the target market size, demographic and psy-
chographic profiles of the target market, and other areas of consumer insight. The
Consumer Analysis illustrates purchasing behavior and other various factors that in-
fluence a person to choose one beverage over another. The Industry Overview, Client Pro-
file/Competitor Analysis, Consumer Analysis and Consumer Insights provide a summary of the pos-
sible reasons that Coke Zero has not met its projected market share.
Next, through qualitative and quantitative pri-mary research our group delved into the mind of the
consumer to try and understand purchasing and usage behavior with specific respect to Coke Zero. Through 27
qualitative interviews and 61 surveys from the target market, we obtained meaningful information about the target market for Coke Zero. After interpreting the data, our group formu-lated a list of recommendations as to guide Coke Zero in future marketing and communication strategy decisions.

Industry Overview
Carbonated beverages can trace their history back to mineral water found in natural springs. In 1767 the first man-made carbonated water beverage was developed by Dr. Joseph Priestly in England. This step paved the way for the carbonated soft drink industry. Three years later, in 1770, a Swedish chemist by the name of Torbern Berg-man discovered a way to make carbon-ated water with chalk by using sulfuric
acid. This invention made it possible to make carbonated water in large amounts. In 1810 the first U.S. patent was issued for the mass production of imitation carbonated mineral waters, opening up a new wave of interest in the world of carbonated beverages. The first carbonated beverage on the market was Dr. Pepper, which was developed in 1885 by Charles Aderton in Waco, Texas37. Shortly after the invention of Dr. Pepper, Coca-Cola was created by
pharmacist, Dr. Charles Pemberton, in Atlanta, Georgia23. In 1898 Pepsi- Cola was created by Caleb Bradham a phar-macist from North Carolina. From the early 1900s to the mid 1900s carbonated beverages continued to grow in popu-larity. In 1957 the first aluminum can was used when selling the carbonated beverages. In 1959 the first diet drink was introduced into the market. This was the first step in diversifying the carbonated beverage selection, which
History
2

set the precedent for years to follow. A few years later, in 1965 the first vend-ing machine was used to sell carbon-ated drinks. This was an enormous step in expanding the carbonated soft
drink market, allowing beverages to be more easily accessible. In 1970 the plastic bottle was first used for carbon-ated soft drinks. From the 1980s until now, the soft drink industry has con-tinued to grow and expand the market. The carbonated beverage industry is a highly competitive market, marked by large expenditures on advertising, new brands constantly infiltrating the market, and companies trying to better understand the consumer. Without the discoveries of the many
pioneering chemists, none of this would have been possible47.
Industry Size Graph 1 shows the trends in US per capita beverage consumption from 2000 to 2005. The chart shows that there has been an overall decrease in bever-age consumption in various categories including carbonated soft drinks, milk, cof-fee, and juices. The graph also shows the growing popular-ity of bottled water, and sports drinks over the past five years. Despite an ever changing mar-ket, tea consumption has remained at a constant level. Within the last five years sports drinks have become very popu-lar. Sports drinks raised their market share of non-carbon-
ated beverages to 38% in 2005. The top two sports drinks are Gatorade by PepsiCo and PowerAde by Coca-Cola. As a result of the increased consump-tion of sports drinks, juices are losing popularity. Like sports drinks, energy drinks are growing in popularity as well. Right now the top energy drinks are Red Bull, Hansen’s (Monster), and
In 1965 the !rst vending machine was used to sell carbonated drinks.
Graph 1 Source: Standard & Poor’s
3

Rock Star. The energy drink category is smaller than the sports drink category, but is growing rapidly. The increase in consumption of bottled water, sports drinks, and energy drinks has caused a market share loss for carbonated bever-age manufacturers in the total liquid refreshment beverage market. Coca-Cola, PepsiCo, and Cadbury Schweppes all lost market share in 2005 as a result of the loss.
Coca-Cola is the world’s largest beverage company and is more vulnerable to losing market shares to con-sumers that buy non-carbon-ated beverages. In attempts to challenge the market losses, Coca-Cola has added non-car-bonated beverages to its port-folio over the past few years, but this has not been complete-
ly successful yet. Coca-Cola’s Dasani water is number two in the leading water brands category with a volume growth of 26.9% in 200529. Coca-Cola is taking on Frappuccino with Godiva Bel-gium Blends, which is a blended bever-age that contains both coffee and choco-late. Coca-Cola has also added Coke Blak which is a blend of coffee and cola. Coke is hoping that some of these new products will help people understand that the soft drink business is constantly changing. PepsiCo has an extensive portfo-lio including Aquafina and Gatorade (s & p). Aquafina was the fastest growing brand in 2005 with a 29.6% growth in volume. PepsiCo’s Gatorade advanced 21.5% as well. In October 2006 PepsiCo will launch a new product called Dole Sparklers. This beverage will provide B-complex vitamins while containing lower sugar and calories than a typical juice drink57. Carbonated soft drink manufac-turers are aware of the decreasing
popularity of carbonated soft drinks and acknowledge that diet sodas are now the primary growth drivers. Diet Pepsi with Lime and Coke Zero are some new carbonated soft drinks that have been recently launched though these have not kept carbonated bever-ages from losing market share. Con-sumers may be surprised that carbon-ated soft drink manufacturers are incorporating alternative beverages into their portfolios and applying them to their core business. This will help the companies get a new outlook on what consumers want from a beverage. They are beginning to realize that consumers want more options. For example Cadbury Schweppes has reformulated 7-up using all natural ingredients. Cadbury Schweppes has learned that if the beverage tastes the same, but con-tains all natural ingredients then con-sumers will buy it. Wellness, weight control, and nutritional concerns re-main an important issue when choosing an
4

alternative drink57. Consumers are seeking potions versus thirst quenchers, and are more aware of ingredients in a product29. The CSD industry is in the maturity phase of the product life cycle because sales are about to decline and therefore companies are looking for new ways to spark the market.
Advertising
Spending
stagnant, many categories have in-creased spending. The most significant increase in spending was among sports drink advertisers, who spent more than $60 million more in 2005 than in the previous year. Nearly $900 million was spent on carbonated soft drinks, which was second to sports drinks in ad spending. There seens to be some correspondence between the amount of advertising dollars spent and the per
Graph 2 Source: Advertising Age Data Center
(Millions of Dollars)
Growth
Potential &
Forecasts The growth potential for the soft drink industry is promising although decreasing sales are becoming more prominent. Increasing social concern with obesity and personal health will continue to rise in the future, as a result, the soft drink industry should position
5
With the exception of energy drinks and ready to drink (RTD) coffees, ad-vertising spending among the various drink catego-ries has increased between 2004 and 2005. Ad spend-ing for energy drinks de-creased $5.9 million, while spending for RTD coffees remained exactly the same. Though these categories ei-ther decreased or remained
capita consumption for most drink cat-egories. For instance, the bottled water and sports drink categories show signif-icant increases in both advertising and per capita consumption, whereas coffee maintained relatively consistent levels of ad spending and consumption. Ad spending for RTD teas, however, dra-matically increased between the years 2004-2005, perhaps to combat stagnant sales over the past five years. The fruit juice category showed very minimal increase in ad sales, while the per capita consumption has declined over the five-year period.
Beverage Industry Ad Spending Per Drink

itself to minimize losses in CSD market and maximize profits on products po-sitioned for the health boom, such as diet drinks, juices, and low sugar/low calorie drinks. Boosts in new product contributions and multiplied efforts to expand product portfolios will help to position companies to better adapt to the volatile CSD industry. Tony Jacobs, director of Market-ing at Diet Rite says that his company sees the health trend as an opportu-nity to take advantage of a trend in the marketplace, not as a crisis. In an article called “Future of Diet Beverages” in Beverage World Magazine, the author states that the diet segment has been the “saving grace” of the CSD industry56.
While sales of regular soft drinks have dropped in previous years, sales of diet soft drinks have continued to increase. This trend is not expected to change at any point in the near future. In the article “Future of Diet Bever-ages,” the author states that “it’s likely that carb and calorie counting will continue ... especially since it looks like obesity concerns aren’t likely to abate in the near fu-ture56.” According to Standard and Poor’s Sub-Industry Review for 2006 “volume trends for carbonated beverages likely will remain slug-gish, with the exception of diet drinks and energy drinks, which should see good growth.” The Sub-In-dustry Review also states that in 2006 earnings and cash flow for the major beverage companies will show solid growth, as companies should see bene-
fits from pricing gains and new product contributions. Since consumers are likely to continue purchasing sugar-free, carbohydrate-
free and calorie-free bever-ages, William Pecoriello, of Morgan Stanley, expects increased innovation in the CSD market. “We see several potential op-portunities,” he says, “(some of which overlap) including: 1) healthier soft drinks, 2) all-natural soft drinks, and 3) soft drinks targeted to adult taste preferences. ...while Coke and Pepsi could leverage their ‘healthier’ non-carb brands in CSD, the other alternative would be to cre-ate new CSD brands from
scratch43.”The creation of new brands from scratch will reinvigorate the seem-ingly bland beverage market in order to stimulate growth for companies like Coca-Cola and PepsiCo.
6
"Volume trends for carbonated beverages likely will remain sluggish, with the exception of diet drinks and energy drinks, which should see good growth.# -Standard & Poor$s

Competitors
Table 1 Sources: PepsiWorld, Coca-Cola
7
PUT IN NEW GRAPH WITHOUT GREEN

Social/CulturalConsiderations Consumers make their beverage purchasing decisions based on several different criteria, such as household income, product prices and promo-tions, and individual preferences which can depend on age, education, race, and ethnicity24. Teens and young adults are impor-tant consumer seg-ments of the car-bonated soft drink industry. Drink-ing soft drinks for these age groups has become a so-cial norm even though it has shown to have a negative effect on some of their consumers. Today children have be-gun to drink more soft drinks and less milk as they get older. Parents becom-
ing more active in their children’s lives could potentially resolve this issue. The consumption of soft drinks can also be linked to children watching television, especially during the weekend. Adver-tising targeted at children has increased rapidly and portion sizes have grown. Beverage portions are extensive, rang-ing from 8 oz. cans to two liter bottles8.
Many schools across the United States have signed contracts with major beverage companies, which give the schools money as incentive to sell their bever-age. For exam-ple, a Houston School landed a
$5 million contract with Coca-Cola to sell Coke at their school. Some parents are not happy with these types of contracts and are trying to stop the beverage industry’s influence in
Economic
Enviroment Currently, the U.S. economic status is strong, however there is a small down-turn. The economy is seeing a decrease in consumer confidence, meaning that consumers are questioning their pur-chases because they are skeptical about the future. The Consumer Confidence Index is currently 99.6%, with the pres-ent situation reading 123.4% and the Expectations Index reading 83.8%. This is a very steep decline from a previous Consumer index reading of 107.0%, Present Situation reading of 134.2% and Expectations Index of 88.9% in July. However, any reading above 90% shows a good, strong outlook
8
school. A number of parents in Phila-delphia drew together to block a pro-posed 10 year, $43 million contract with Coca-Cola54. This has become a major social and cultural consideration be-cause of the effects it has on students as well as parents.

on the economy. Although the outlook is bright, this is the largest decline one month after Hurricane Katrina. The Consumer Research Center says that
consumers “are growing increas-ingly pessimistic about the short-term outlook58.” Another way to examine the cur-rent economy is by measuring the
change in the Consumer Price Index. The Consumer Price Index (CPI) takes the prices of commodities, fuel, oil, elec-tricity, utilities, telephone services, food, and energy and measures the change in prices. The CPI is usually expected to increase year to year. The CPI is cur-rently at a .4% increase from 2005. The CPI specifically for the Food and Bever-age industry is currently 195.6 which is an increase of 4.3 from the previous year53. Finally, a look at our current unem ployment rate will indicate how the economy is doing. The
Regulatory &
Legal Issues Coca-Cola, just like any other food or beverage company must abide by two main regulatory agencies, The Food and Drug Administration (FDA), and The Federal Trade Commission (FTC). The FDA regulates companies’ manufac-turing processes and the FTC oversees companies marketing and advertising processes. Coca-Cola must follow basic rules established by these two agencies when advertising their products. It must make sure their ads are not decep-
9
unemployment rate has decreased from the previous year however still remains what is considered average. The un-employment rate, which measures the number of working, age people who are looking for a job, is at 4.7 %53. The data shows that our economy is strong, however decreasing consumer confidence must be taken into account. This statistical decline is particularly important to Coca-Cola and the carbon-ated soft drink industry in general. A decrease in consumer confidence could cause consumers to monitor their pur-chases. As a result products and brands should fall into consumers’ needs and not just wants. The products must be positioned such that the consumer feels as if there is no replacement for it. The CPI shows that prices and infla-tion are about average. The Consumer Price Index specifically for food and beverages also demonstrates average growth. The unemployment rate is de-creasing which is statistically important because a lower unemployment rate reflects a strong economy. A lower un-employment rate coupled with a strong
economy also means that there is more disposable income among consumers. This is important because if consumers have more disposable income they are more willing to try new products, such as Coke Zero.

NewDevelopments
10
Coca-Cola recently released a new product, Vault, in response to high-en-ergy sports drinks. This new beverage is Coke’s version of Pepsi’s Mountain Dew. Their slogan is “Tastes like a soda kicks like an energy drink.” Coke also released Coke Blak to place a stake in the coffee drink category. Pepsi released Sobe Life Water in March of
tive. Coca-Cola must make sure that the claims it makes about their products are true. For example, if Coca-Cola claims that Coke Zero has zero calories, then it must really not have any calories, oth-erwise it is deceptive. Another issue Coke must address when advertising is comparisons to competitors. Coca-Cola must make sure that its claims are fair and most importantly, true. Claims such as a product containing zero calories must be scientifically proven in order to be fair and true. Companies must also make sure that their claims of less ingrediants are based in fact and that there is at least 25% less of given ingre-dient21. In the last few years Coke has been faced with legal issues. Most recently, the Coca-Cola Company has dealt with employees trying to steal Coke’s secret formula wishing to sell the formula to Pepsi. Coke alerted the FBI and is wait-ing to press charges16. Also, Coca-Cola has been in court with Wal-Mart. Their recent filings have come after Wal-Mart requested new distribution arrangements. Coca-Cola
had to submit to Wal-Mart’s request in order to prevent the possible loss of shelf space and sales14. Recently, a law suit was filed against the Coca-Cola Company for obesity issues surrounding products. The woman who filed the claim stated that the Coca-cola rewards program pro-motes childhood obesity. This incident may be ludicrous; however it does alert the industry to future suits dealing with obesity. These issues have been plagued the fast food industry in the past and The Coca-Cola Company is trying to learn from these issues25.
2006 as a drink that contains essen-tial vitamins B, C, and E. Coca-Cola has recently made progress to create a community between youth around the world through digital media outlets such as distinct websites. World Chill tries to instill a unity between Coke Zero users across the world through a working global map as well as screen savers and desktop applications. In the United Kingdom, Coke Zero has picked up this launch through campaigns with the message “Bloke Coke59.” Pepsi has also begun to incorporate a global community by targeting certain markets in China. Consumers are be-coming increasingly more health con-scious, putting more emphasis on what a certain drink will “do” for them ver-sus the taste. The future of the beverage industry
appears uncertain with a negative outlook for carbonated soft drinks with the exception of diet and energy drinks.

Coke Zero, a new zero calorie bever-age, is targeted at males 18-34 and is in direct competition with Pepsi One, the one calorie cola, produced by PepsiCo. Diet Pepsi and Diet Coke do not contain calories and are also key competitors to Coke Zero. Pepsi and Coke Classic are indirect competitors because these drinks are not diet drinks, but are still often chosen over the diet beverages36.
Client & Key
C
Competitors
Company & Brand History On May 8, 1886, Dr. John Pemberton, a pharmacist from Atlanta, Georgia, formulated the syrup for what is now known world-wide as Coca-Cola. After he created the syr-up, it was taken to Jacob’s Pharmacist, tested, then sold for five cents a glass as a fountain drink. Starting in 1888 Pemberton gradu-ally sold portions of his cola business to various people because he failed to see the potential of the drink. In the same year he sold the remain-ing interest in his cola to Asa G. Can-dler, who continued to buy additional rights to the beverage eventually gain-ing complete control of the business. In 1891 Candler gained sole ownership of Coke for twenty-three hundred dollars.
In 1892 The Coca-Cola Company was formed by Candler and three other as-sociates in Atlanta, Georgia, which would later become the corporate head-quarters. In 1894 the first syrup man-ufacturing plant
was opened outside of Atlanta in Dal-las, Texas. In 1899 Benjamin F. Thomas and Joseph B. Whitehead “secured exclusive rights to bottle and sell Coca-Cola in practically the entire United States23.” In attempts to make the brand stron-ger the contour bottle was created in 1916 to distinguish Coca-Cola from
In 1982 Diet Coke was launched as "the very !rst extension of the Coca-Cola trademark.#
11
lient Profile and Competitor Analysis
competitors. In 1919 Earnest Woodruff and W.C. Bradley purchased The Coca-Cola Company for $25 million, and the company was later reinstated as a Dela-ware Company. Following the purchase of the company, 500,000 shares of com-mon stock were sold for $40 a share, making Coca-Cola a public entity. The Coca-Cola brand continued to develop and in 1940 WWI sparked sales of Coca-Cola overseas. By the end of the war, over 5 million bottles of Coke were consumed. In 1955 a new package was created to give consumers a wider vari-ety to choose from. This concept paved the way for the rest of the industry for years to come. In 1982 Diet Coke was launched as “the very first extension of the Coca-Cola trademark23.” In 1985, for the first time in ninety-nine years, the flavor of Coca-Cola was reformulat-ed. The new formulas performed well in taste tests, but emotional connections were so strong that the new product did not do well. This reformulation attempt is considered by many to be “the big-gest marketing blunder ever”. Though this was a failed attempt to appeal to
the consumer, this did prompt the cre-ation of Coca-Cola Classic. During the 1990s and early 2000s Coca-Cola continued to expand its port-folio. In 1999 Dasani water was intro-duced into the market followed by Vanilla Coke in 2002. Vanilla Coke was “the first flavor extension in more than a decade23 .” Various other products such as Diet Coke with Splenda, Coke Blak, and Diet Coke with Lime, were also launched to expand their portfolio and appeal to the seg-mented market. In June 2005 Coke Zero was launched in the United States in attempts to appeal to the young health- conscious male market. Following the U.S. launch, Coke Zero was launched
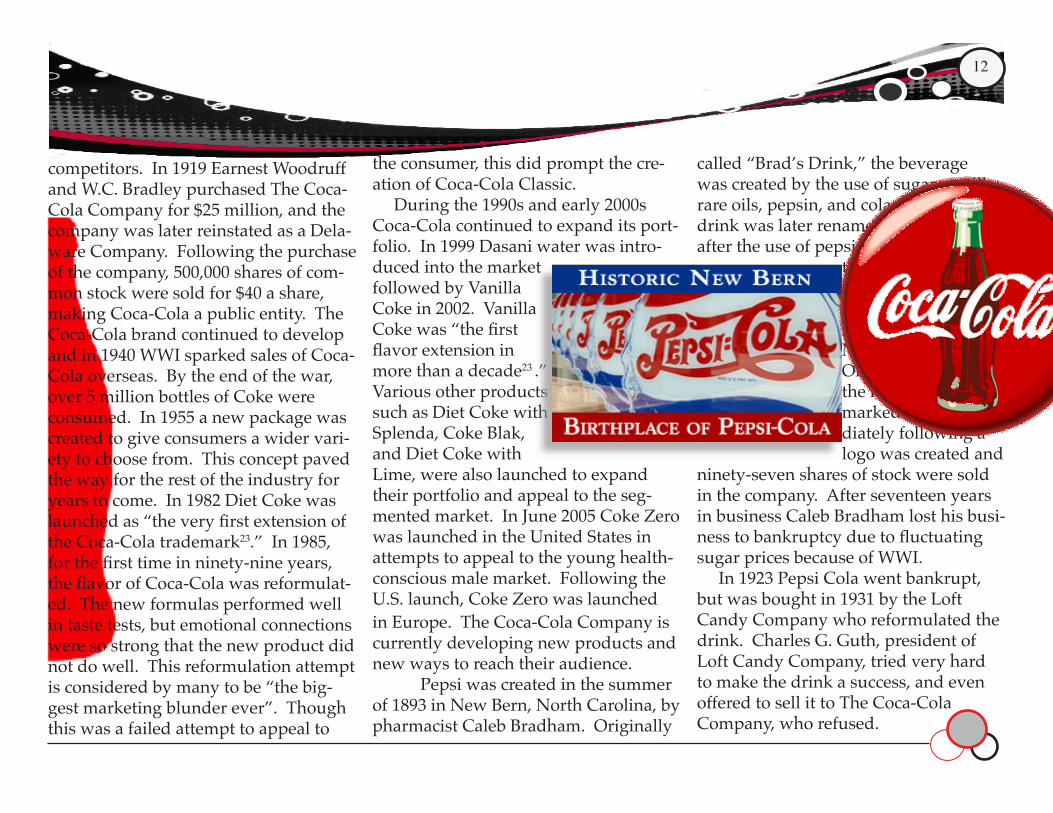
in Europe. The Coca-Cola Company is currently developing new products and new ways to reach their audience. Pepsi was created in the summer of 1893 in New Bern, North Carolina, by pharmacist Caleb Bradham. Originally
called “Brad’s Drink,” the beverage was created by the use of sugar, vanilla, rare oils, pepsin, and cola nuts. The drink was later renamed Pepsi in 1898 after the use of pepsin and cola nuts in
the recipe. In 1898 Bradham bought the name “Pep Cola” from a competitor in New Jersey for $100. On June 16, 1903 the name was trade-marked and imme-diately following a logo was created and
ninety-seven shares of stock were sold in the company. After seventeen years in business Caleb Bradham lost his busi-ness to bankruptcy due to fluctuating sugar prices because of WWI. In 1923 Pepsi Cola went bankrupt, but was bought in 1931 by the Loft Candy Company who reformulated the drink. Charles G. Guth, president of Loft Candy Company, tried very hard to make the drink a success, and even offered to sell it to The Coca-Cola Company, who refused.
12

Continuing to develop its portfolio, Diet Pepsi was launched in 1964. In 1965 PepsiCo was founded by a merger between Pepsi-Cola and Frito-Lay. In 1970 PepsiCo moved its headquarters to New York. In 1984 PepsiCo introduces Slice, the number one orange soda in the United States. In 1989 PepsiCo introduced Wild Cherry Pepsi and in 1990 Pepsi changed its logo for the first time in 93 years. In 2001 Pepsi Twist and Diet Pepsi Twist were launched with the aim to put a lemon-flavored spin on regular Pepsi. In 2004 Pepsi launched Pepsi EDGE a drink containing half the sugar, calories, and carbs as regular Pepsi. In 2005 Aquafina sparkling water, and a reformulated Pepsi One were launched. In attempts to expand its portfolio and stay competitive, Pepsi has launched various products in order to appeal to a larger market, just as Coke has32.
Sales As shown in Graphs 3 and 4 sales in units and market share for Diet Coke are steadily rising. Sales and market share for Diet Pepsi are increasing, but there is a slight decrease in 2005. Coke Zero and Diet Coke with Splenda are only about a year old, but Coke Zero
is doing better in sales than Diet Coke with Splenda by about ten million units. Diet Coke and Diet Pepsi are in a matu-rity stage because their sales are begin-ning to level off. Coke Zero and Diet Coke with Splenda are in the introduc-tion stage of the product life cycle, and this is because these products have only been in the market for less than a year.
Graph 3 Source: Beverage World, Beverage Industry, Beverage Digest
13

Graph 4Source: Beverage World, Beverage Industry, Beverage Digest
Marketing Mix Evaluations
Our group conducted a blind taste test of the following drinks: Coca-Cola Classic, Pepsi, Diet Coke, Diet Pepsi, Coke Zero and Pepsi One. The general consensus of the group was that the regular CSDs tasted better than either of the diet drinks or the newer alter-natives. The diet drinks, on the other hand, tasted lighter and had a distin-guishable chemical aftertaste. Some members perceived that Diet Coke left a “film” on their tongues. The evaluation of the two diet drinks leaned more in fa-vor of Diet Coke than Diet Pepsi, as Diet Pepsi “smells funny” and tasted “more like soda water” than an enjoyable cola drink. In the evaluation of Coke Zero and Pepsi One, group members per-ceived Pepsi One as “happier, tangier, sweeter and lighter” than Coke Zero. Overall perception of Coke Zero was negative, with some members saying it tasted “cough syrupy” and more use of chemicals as sweeteners.
14

Table 2 Sources: PepsiWorld, ONEIFY.com, Coca-Cola.com
15
Product

Beverage Pricing
At the Kroger grocery store visited, Coca-Cola products were more expen-sive than Pepsi products. Additionally, all Coca-Cola products were placed together on shelves, whereas regular Pepsi products were placed separate from healthier Pepsi products, such as Diet Pepsi and Pepsi One.
Physical Distribution
Price Evaluation
Coke Zero is available in supermar-kets, convenience stores, and mass re-tailers nationwide. Additionally, Coca-Coca products are available in various restaurants and fountains throughout the country; such as movie theatres, fast food restaurants, and ball parks.
Promotions Across all Coca-Cola trademark brands there are 4 billion unique re-demption codes worth a total of $50 million in rewards. The Cola-Cola My Rewards campaign begins with spe-cial rewards associated with NCAA® March Madness and The Academy Awards®. The rewards program was launched on 20 oz. packages and some of these unique codes can be found under the caps of 20 oz bottles of Coca-Cola Classic, Diet Coke, and Coca-Cola Zero. In attempts to promote brand aware-ness, Coca-Cola is holding a consumer kick off event for Coke Zero. The Rock N’ Roll Marathon is scheduled to have
20,000 runners, 40 live bands, and 2,000 high school cheerleaders. Coke will give away Coke Zero to the runners and other participants. The participants were some of the first people to try the product16. The Pepsi Champion challenge gives consumers the chance to win several au-tographed racing items. The Champion Grand Prize is a VIP weekend at Home-stead-Miami Speedway. The regular season Grand Prize will be a behind-the-scenes tour of the Hendrick Motors-ports Shop and Museum. Winnings are based on the drivers that the consumers choose33. Pepsi and Apple joined forces and launched a special promotion that kicked off with a Super Bowl Ad on February 1, 2004. 100 million codes were randomly placed on 20 oz bottles of Pepsi, Diet Pepsi, and Sierra Mist, legally giving away 100 million free songs to Mac and Windows users from Apple’s iTunes. This promotion corre-sponds with Pepsi’s long time history of using music in their marketing promo-tions such as Shakira, Michael Jackson, and Madonna4.
Table 3 Source: Kroger
16

The target market for Coke Zero is young adult males ages 18-34. These men are also health conscious consumers who do not want to sacrifice flavor as in drinks like Diet Coke which tastes distinctly different from Coca-Cola Classic. Research has shown that there are diet drinkers who want a “different brand and a completely different flavor profile26.” In response to this desire Coke has created Coke
Coca-Cola Senior Vice Presidents of North American Coke Brands said that “Zero was aimed at 18-34 year old males who have shied away from tradi-tional diet drinks such as Diet Coke27.” In accordance with the attempt to at-tract 18-34 year old males to the beverage, they have created a “hip white-and-gray back-ground [with a] splash of black lettering promising [a] ‘calo-rie free cola36.’” The modern graphics and masculine colors stray away from the tradition-ally feminine appearance of most diet drinks, which often deter male consumers. “The domi-nating use of black words works well, suggesting both an allusion to the sleek shape of an ipod Nano and a tounge-in-cheek nod to the 90’s Essex boy—bach-elor style chrome and black22.” Also, men often translate the word diet to mean “bad taste,” so by using the word Zero, the drink is still trying to target the right demo graphic26. Though the
packaging is a step in a new direction for Coke, the design still maintains the traditional Coke lettering and “coke curve” in hopes that it will remind consumers of the traditional Coca-Cola beverage. The combination of new design as well as the new product name
was a well formulated plan that will hopefully appeal to the male demographic more than a feminine diet drink. Pepsi One follows a very similar packaging and branding technique. Pepsi One uses black and gray graphics, and omits the word “diet” from the low-calorie drink. These techniques are
used in order to appeal to the same male demographic as Coke Zero. Diet Coke’s silver color is used to show the lightness of the drink, and Diet Pepsi uses light blue for the same reason, showing a lighter alternative to the royal blue regular Pepsi. Diet Pepsi also use it knowing that it will stand out among the other beverages on the market19.
17
Packaging/ Brand Name Advertising
Target Market
From 2000 to 2005 ad spending for Coca-Cola and Diet Coke has increased, though there was a slight decline be-tween 2001 and 2004. Pepsi and Diet Pepsi have also increased ad spending from 2000 to 2005. Although both enti-ties have increased spending Coca-Cola spent more historically than Pepsi. In terms of share of voice, the newest edition to Coke’s portfolio, Coke Zero, ended 2005 with a share of voice of .3%. In 2005 Coca-Cola had the largest share of voice totaling 35.4%, while Pepsi only had 29.3% share of voice.

18
Graph 5 Source: AdAge.com
Zero to try to satisfy the palates of their consumers. Pepsi One is also a zero calorie drink that is positioned towards overweight men who are deterred by the word “diet.” Although 46% of Diet Coke drinkers are male, it understands that it is female drinkers who really drive the brand. It has recently tried
to incorporate a male audience by introducing new flavors to Diet Coke such as Diet Coke with Lime. Diet Coke has also started targeting the “meterosexual” male. Metrosexual is a term describing men who enjoy hobbies designated as typical female hobbies. Diet Pepsi’s target market is very broad. Using ads featuring P.Diddy they
Coke Zero’s first attempt to reach clients came in the form of the Rooftop/Mountain Top ads. Coke Zero debuted with this advertising campaign reminis-cent of the 1970’s ad “I’d like to teach the world to Sing.” Shot on a rooftop in Philadelphia, the ad featured G.Love and Special Sauce singing “I’d like to teach the world to chill15.” This was the start of their
Recent Campaigns
are trying to appeal to male consumers and the hip- hop culture. Diet Pepsi has also become the first brand in the CSD category to target the homosexual markets using ads featuring Carson Kressley, a famous gay male featured on the show “Queer Eye for the Straight Guy37.” Diet Coke with Splenda targets a very general market, understanding that is not just one gender that prefers Splenda. As for the drinks Pepsi and Coke Classic the target markets are broad with specific focus on teens and pre-teens with the intentions of developing brand loyalty early on40.

19
CreativeStrategy Each beverage on the market has a distinctive creative strategy that appeals to different target markets. Diet Coke, Pepsi One, Diet Pepsi, Pepsi, Coke Clas-sic, and Coke Zero all have different position statements that elicit different reactions from different market seg-ments. Diet Coke’s strategy is to have a more natural and elegant appearance that appeals to a broader age range.
world chill theme . The Campaign failed and left consumers confused be-cause the younger generations did not understand the reference to the older ad campaign. Re-cently Coke has redefined its ad campaigns with an approach that exag-gerates the Coke Classic taste, while being extremely new. The slogan is “It’s Enjoy Coke-ness without the calories.” The new campaign features two men, one young and one old, arguing about how new the product is because it tastes like the original15. Pepsi One created the ONEIFY cam-paign in an attempt to unite the drinkers of Pepsi One by portraying specific taste attributes as different characters.
Each quality of the beverage has a cor-responding character. Light, poetic, and hairy, in reference to the taste, are just a few characteris-
tics of Pepsi One that are represented. The theme is to unite all Pepsi One drinkers even though they may drink the beverage for different reasons31. Diet Coke created the Light It Up campaign to spark interest in the bev-erage. The ad features people dancing, sing-ing and just enjoying
life while a trail of bubbles follows them. The overall idea is that drinking Diet Coke will make you feel lighter, happier, and in an overall good mood. The bubbles also represent the lighter, fizzier flavor of Diet Coke as opposed to the often heavy, filling feeling of
Coke Classic. The slogan for this campaing is “Live like you own the spotlight.”
Diet Pepsi started the “Light, Crisp, Refreshing” campaign to focus atten-tion on the unique qualities that Diet Pepsi contains. Also, Diet Pepsi has recently joined forces with the NFL and Reggie Bush. Diet Pepsi and Bush have teamed up to create several com-mercials based on the premise, Bush vs. the Machine, which features Bush chal-lenging a vending machine at various football related tasks. This ad appeals to NFL fans and sports fans alike34.
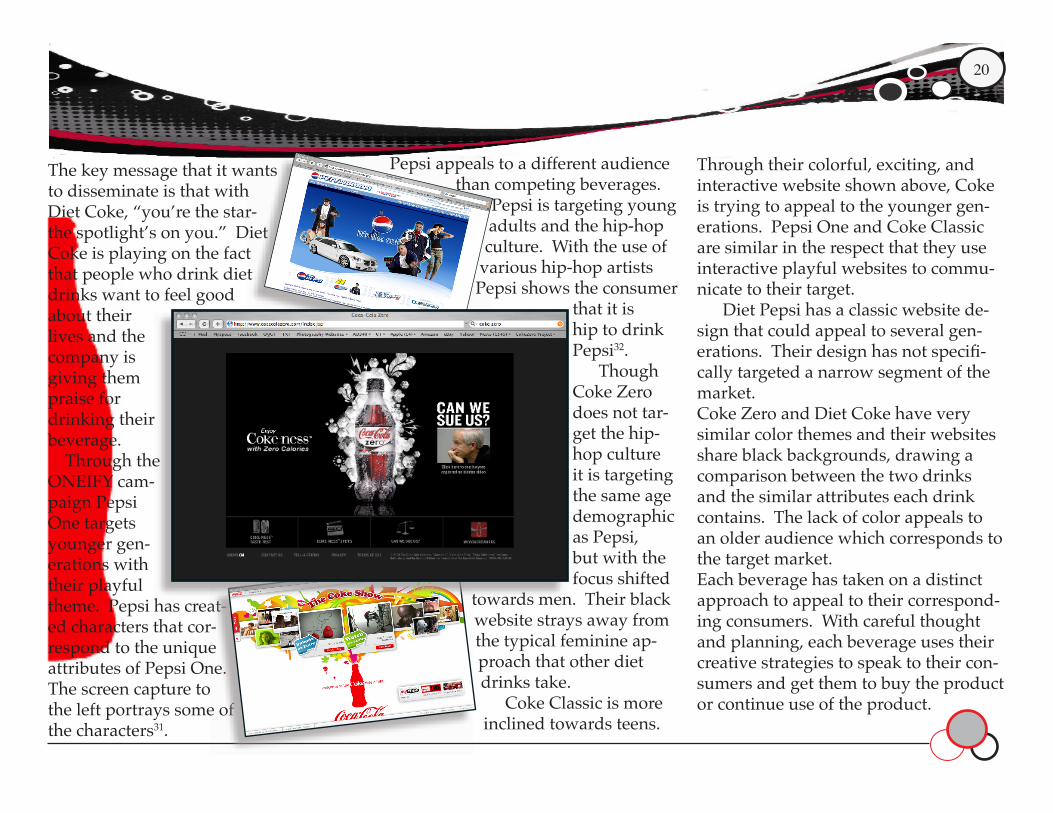
The key message that it wants to disseminate is that with Diet Coke, “you’re the star- the spotlight’s on you.” Diet Coke is playing on the fact that people who drink diet drinks want to feel good about their lives and the company is giving them praise for drinking their beverage. Through the ONEIFY cam-paign Pepsi One targets younger gen-erations with their playful theme. Pepsi has creat-ed characters that cor-respond to the unique attributes of Pepsi One. The screen capture to the left portrays some of the characters31.
Pepsi appeals to a different audience than competing beverages.
Pepsi is targeting young adults and the hip-hop culture. With the use of
various hip-hop artists Pepsi shows the consumer
that it is hip to drink Pepsi32. Though Coke Zero does not tar-get the hip-hop culture it is targeting the same age demographic as Pepsi, but with the focus shifted
towards men. Their black website strays away from the typical feminine ap-proach that other diet drinks take. Coke Classic is more inclined towards teens.
Through their colorful, exciting, and interactive website shown above, Coke is trying to appeal to the younger gen-erations. Pepsi One and Coke Classic are similar in the respect that they use interactive playful websites to commu-nicate to their target. Diet Pepsi has a classic website de-sign that could appeal to several gen-erations. Their design has not specifi-cally targeted a narrow segment of the market. Coke Zero and Diet Coke have very similar color themes and their websites share black backgrounds, drawing a comparison between the two drinks and the similar attributes each drink contains. The lack of color appeals to an older audience which corresponds to the target market.Each beverage has taken on a distinct approach to appeal to their correspond-ing consumers. With careful thought and planning, each beverage uses their creative strategies to speak to their con-sumers and get them to buy the product or continue use of the product.
20

The different beverages in the CSD market use different strategies and promote their unique benefits to target distinct segments of the market. Coke Zero, Pepsi One, Pepsi, Diet Pepsi, Diet Coke and Coke, all have different ways of communicating to their consumers. Since Coke Zero is positioned to-wards men, their creative strategy is masculine in nature and focuses on the tangible quality that Coke Zero has no calories. Their website is mostly black and the tag line, “Cokeness with no calories,” is very simple, and appeals to the male consumer. Pepsi One uses the ONEIFY cam-paign to illustrate two different types of benefits, tangible and intangible. The campaign characterizes the beverage as a one calorie soda, which appeals to those looking for low-calorie drinks. Next they show the intangible quality that various types of people who like Pepsi for the taste and people who like diet Pepsi products can come
together and unite to drink Pepsi One. Playing on the original cola flavor and the hip-hop generation, Pepsi makes it cool to drink their beverage by incorporating hip-hop artists into their advertisements. The artists display the beverage as refreshing and delicious. Diet Pepsi uses the slogan “Crisp, Light, Refreshing” to illustrate the unique taste and feel of the drink. The light blue on the website is used so the consumer will draw a comparison be-tween the light color and the light calo-rie content and light taste. The website has a calm feel, trying to get the con-sumer to associate it with the light/diet mindset. Diet Coke positions its product to a broader, trendy target audience. It wants the consumer to relate Diet Coke to being in the spotlight, being beauti-ful, and fulfilling the ultimate goals of drinking the Diet Coke. Finally, the Coke website is more in-teractive, lively, and fun than the other sites, targeting its products towards a younger audience. The site does pro-mote the classic Coke taste, but does not
The beverage industry is very active and uses Public Relations in many dif-ferent ways. Recently there has been a Public Relations offensive to fight child-hood obesity and the three major bev-erages companies, Coca-Cola, PepsiCo and Cadubry Schweppes, are all in-volved in the fight. One article entitled “Soft Drink Makers Start PR Offensive” explains how the sugary drinks are being pulled from schools by all three major beverage companies- PepsiCo, Coca-Cola, and Cadbury Schweppes. “The American Beverage Associa-tion, the trade group behind the new campaign, hopes the ads take the public relations battle to the next level. The campaign... will appear in newspapers
Public Relations
21
Benefits Used to Position the Brand
make reference to calories or content of the beverage. Visually, it promotes the original Coke bottle shape and the Coca-Cola logo. The creative strategy for Coke does not push or promote any of its tangible benefits; it merely pro-motes interaction with the brand.

Coke Zero’s unit sales are lower than the competitors’ sales, including its pri-mary competitor, Pepsi One. However, Pepsi One has been on the market sev-eral years longer than Coke Zero and the amount of unit sales reflects this. Therefore, the slight difference between unit sales of Coke Zero compared with Pepsi One is not significant and reflects a good outlook for Coke Zero. Both Pepsi One and Coke Zero have
22
Comparative Analysis
in order to appeal to men who are often deterred by diet drinks. Other competi-tors tend to market evenly towards gen-ders, except for Diet Coke who skews more towards women. Coke Zero is very strong in terms of promotion and obviously its tangible benefits of zero calories and classic taste. These strengths are two of the main reasons that it is set apart from other diet drinks. Coke Zero’s ties with The Coca-Cola company raises brand image, as well as brand awareness. Though new on the market, Coke Zero has won over consumers through various tangible and intangible benefits. The diet aspect of the beverage invites consumers to try the product, while the original Coke flavor keeps consumers wanting more.
and magazines. The goal is to win over policy-makers, educators and parents, along with informing those who don’t know about the changes39.” The need for the Public Relations campaign is due to “rising worries about the nation’s obesity epidemic” This campaign is essential because it marks a rare occurrence of the top three beverage companies working together under one main issue. “Until recently, such cooperation across the top three companies has been unusual39.”
the same market share of .03%. The similarity in market shares reflects strong competition from Coke Zero in the market, having only been on the market for less than a year. Consider-ing the stages of the product life cycles, Coke Zero’s market share is strong, es-pecially compared with Pepsi One, be-cause it is still in the introduction stage, whereas Pepsi One is in the growth stage, having been introduced in 1999. Considering current social trends and increasing popularity of diet drinks and non-carbonated beverages, Coke Zero has many outstanding features that set it apart from competitors. The diet aspect of the drink coincides with the increase in popularity of the diet drink segment in the market, while maintaining the original Coke flavor. The “tilt toward masculinity” can be considered an intangible benefit that only Coke Zero and Pepsi One share. As for promotion, Coke Zero and Pepsi have specifically designed their packaging to target male consumers. Coke Zero and Pepsi One have both moved toward black and gray graphics

The projected population of both males and females for the years 2006 through 2015 is almost 46.5 million people. There is a significant differ-ence in the projected population of men and women. The projected population for males and females are both at their lowest in 2006. They each peak dur-ing 2013. Projected population for both males and females grow and decline in proportion to one another even though the men’s projected population is sig-nificantly higher. The male population between 2006 and 2015 is between 23.5 and 24 million.
U.S. Population of 12-24
Year Olds
21500
22000
22500
23000
23500
24000
24500
2006 2007 2008 2009 2010 2011 2012 2013 2014 2015
Years
Thousands of
People
Men
Women
Graph 7 Source: U.S. Census Bureau
Graph 6 Source: U.S. Census Bureau
23

Demographic & Psychographic Profile
Table 4 Source: Simmons
Out of approximately 20 million teens ages 12-17, almost 83% consume regular soft drinks, and only 24% drink diet colas.
Young adults ages 18-24 represent almost 22 million of the market, and of these 80% drink regular colas, whereas only 44% prefer diet colas. Teens ages 12-17 drink 41.9% Coca-Cola Classic above all other beverage op-tions. They also drink more diet colas than young adults, which could be a potentially unexplored target segment for Coke Zero. Teens seem to prefer the classic Coke flavor, but prefer to drink diet drinks moreso than young adults.
24
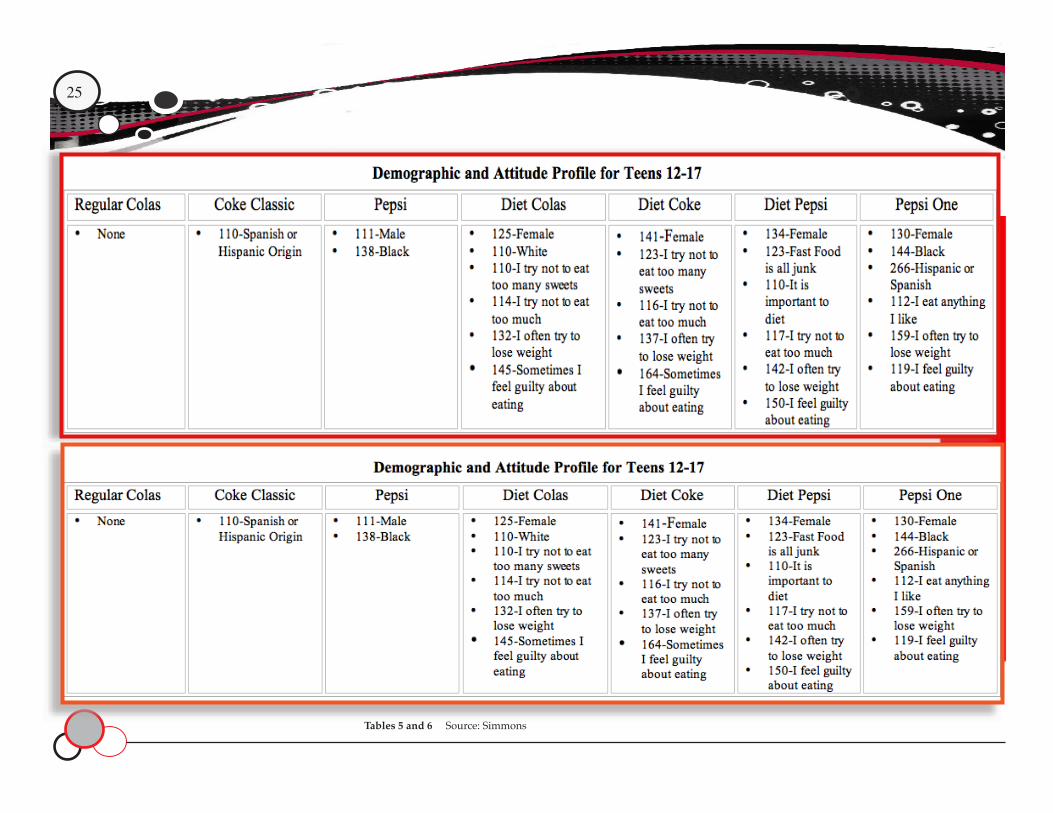
Tables 5 and 6 Source: Simmons
25

The only dis-tinctive charac-teristic for regular colas in the adult market is found in Coke classic. Of all adults, Hispanics are 15% more likely to choose a Coke classic than any other carbon-ated soft drink. Of all adults 18-24, males are 10% more likely to drink a Pepsi than any other carbonated soft drink. Also, Hispan-ics are 20% and African- Americans are 23% more likely to drink a Pepsi than any other carbonated soft drink. Fe-males dominate all of the diet soft drink brands mentioned, ranging from be-ing 25-30% more likely to choose their respective brands over all other adults. When looking at the attitudes of diet cola drinkers, you can see that they are
more likely to be health conscious and concerned about their eating habits. The teen market shares some of the same characteristics as the adult market. For this market, there are no distinctive characteristics for regular colas or Coke classic. Males are only slightly more likely to choose a Pepsi than all other adults in this market at 11%. Females again dominate the diet cola market
being 25-41% more likely to drink their respective brands than any other adults. The diet cola drinkers here tend to also be concerned with a healthy diet and eating habits. There are no striking differences between the two markets and could easily be considered one mar-ket of consumers 12-24. There seems to be a recurring attitude that comes with drinking diet
colas. The indexes may be a little off when comparing the two markets, but not enough to change its overall feel-ing. The charts show the same attitudes and most of the same demographics between the age groups, so much so that they could be combined into one market.
26

Overview In an effort to further describe the target market for Coke Zero, the fol-lowing section will detail the common themes throughout the interviews as well as contradictory opinions posed by consumers in the CSD market.To better understand the diet soft drink target market, specifically Coke Zero, psychographic data was needed to fur-ther define consumers. By defining the target audience by age, insightful quali-tative data was collected with respect to the various categories listed below: •Usage amount and occasion for soft drinks in general •Types of soft drinks regularly consumed, including favorite soft drink and why •Thoughts regarding sugar in regular soft drinks •Diet Cola brand images •Diet Cola brands trial •Perception of Coke Zero •Miscellaneous questions
A complete interview guide that portrays the types of interview ques-tions and categories can be found in Appendix 1. The questions detailed in the interview guide were specifi-cally designed to delve into the mind of the consumer to fur-ther understand consumption patterns, reasons for consump-tion, and brand perceptions. Each section of the interview encouraged participants to think about why they consume bev-erages on a different level than just taste preferences. In order to gain the information de-sired from the list above, each member of the class was required to obtain one qualitative interview from a member of
the target audience, which included all adults ages 18-24. Through a series of asking pre-planned questions, as well
as using an emer-gent design style of inter-view, our class was able to obtain 27 quali-tative in-terviews from the target market.
The participants included 6 male re-spondents all Caucasian, and 21 female respondents (insert race data here). Each member of the class then submit-ted his or her interview in order for the whole class to analyze the data and determine the common themes and key insights.
27
Consumer Insights

Results
Usage
28
After reviewing the participation data, the interviewees can be divided into three groups based on usage level. The three groups consist of heavy users who drink 3 or more carbonated soft drinks, medium users who consume between 1-2 soft drinks a day, and then light users who have less than 1 a day. There are a few common themes among the different usage categories. The light users tend to drink carbonated beverages either with a meal or with other people who are also drinking soft drinks as well. Obviously, it is not their first choice and they generally only consume car-bonation because it is readily available or because their friends or family are drinking it. Light users have a variety of times in which they would not drink carbonation, but after working out is a common theme among a many other obscure items.
The medium users make up the majority of the participants interviewed
and most likely represent the majority of consumers, and thus are vital to the success of the soft drink industry. It is necessary to understand why and when they drink and when they do not want to drink carbon-ation in order for us to market a soft drink to better fit their life-styles. The medium
us-ers tend
to fall between two categories in terms of when they consume soft drinks. A handful of us-ers only drink soft drinks with meals primarily because they believe that the taste often compliments the food they are having. Other users have soft drinks
not only for taste but for the “potion” of the drink, most notably the caffeine. These users tend to consume a majority of their servings either in the afternoon, during class, at night or in the morning. The specific reason for these times is to provide pep or to help them get through studying or class. In order to develop drinks that con-sumers will want at all times we need to know when the majority of consum-ers do not want a soft drink. A common theme among medium users is similar to light users. They do not like to drink
carbonation after work-ing out. Soft drinks tend to dehydrate participants and they want something more refreshing like water or Gatorade. We also find that many of the partici-pants that had soft drinks
with their meals would not like it in the morning or before bed. Inversely, a few of the consumers who did want it in the morning or at night for caffeine purpos-es did not want it with meals. Heavy users are harder to
"Soft drinks are not healthy,# said a
female participant.
gauge and their answers are much more diverse, however this variety of answers can be explained. Unlike medium and light users, heavy users drink it so fre-quently that it is difficult to specify one specific or common theme among them. Simi-larly, their reasons for drinking are also very random and dissimilar as they do not have any main reasons for drinking carbonated soft drinks, however they seem to not want them before bed or after exercising similar to me-dium and light users.
There were many common occa-sions that interview paticipants enjoyed drinking carbon-ated soft drinks. They preferred to consume them during holi days, parties, football games
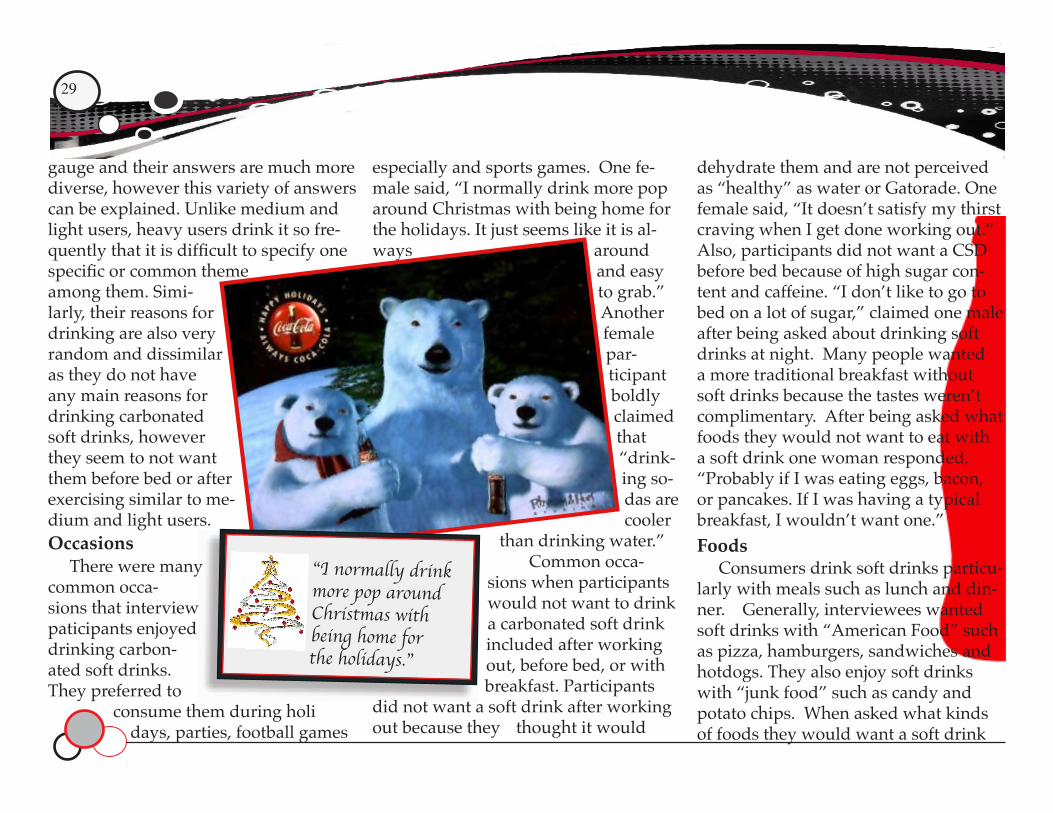
Occasions
especially and sports games. One fe-male said, “I normally drink more pop around Christmas with being home for the holidays. It just seems like it is al-ways around
and easy to grab.” Another female par-ticipant boldly claimed that “drink-ing so-das are cooler
than drinking water.” Common occa-sions when participants would not want to drink a carbonated soft drink included after working out, before bed, or with breakfast. Participants
did not want a soft drink after working out because they thought it would
Foods Consumers drink soft drinks particu-larly with meals such as lunch and din-ner. Generally, interviewees wanted soft drinks with “American Food” such as pizza, hamburgers, sandwiches and hotdogs. They also enjoy soft drinks with “junk food” such as candy and potato chips. When asked what kinds of foods they would want a soft drink
dehydrate them and are not perceived as “healthy” as water or Gatorade. One female said, “It doesn’t satisfy my thirst craving when I get done working out.” Also, participants did not want a CSD before bed because of high sugar con-tent and caffeine. “I don’t like to go to bed on a lot of sugar,” claimed one male after being asked about drinking soft drinks at night. Many people wanted a more traditional breakfast without soft drinks because the tastes weren’t complimentary. After being asked what foods they would not want to eat with a soft drink one woman responded, “Probably if I was eating eggs, bacon, or pancakes. If I was having a typical breakfast, I wouldn’t want one.”
"I normally drink more pop around Christmas with being home for the holidays.#
29

Junk Food Rage
Many consumers enjoy soft drinks with salty foods such as sandwiches and chips. A 20-year old female par-ticipant commented on her love of soft drinks with sandwiches. She drinks carbonated beverages with a, “…deli sandwich, tuna sandwich, any kind of sandwich and it’s just a thing. [She] likes a coke with …sandwiches,” she
Common themes concerning last usage in- clude availability, pric-
ing, routine, caffeine, and family get-togeth-ers. Participants last had a carbonated bev-erage while watching football, studying, or at family events such as bonfires, bar-
beques and dinners. Many reasons for having the soft drinks included pricing, habit, need for a caffeine boost, whatev-er was available in the fridge and “junk food rages.” Many people crave the caf-feine and many times treasure it. One woman said, “It was the last Diet Coke in my fridge so I treasured it. I saw it
Last Product Usage
Craving Caffeine Many consumers drink soft drinks in order to get a caffeine boost. While some drink them in the morning to wake up, others drink them at night to stay awake. A 20-year old Caucasian female said, “Diet Coke is my coffee.” Another 20-year old Caucasian female said she would drink carbonated bev-erages when “…studying for an exam, or writing a paper, or any time I need quick energy.” A 24-year old Caucasian female participant’s favorite drink is Diet Mountain Dew. “I like the taste of it and it has extra caffeine,” she
"It was the last Diet
Coke in my fridge, so I
treasured it,# said one
female.
with, one participant responded, “Any-thing greasy.” One female said after be-ing asked “Why would you drink with fast foods?” responded with, “because greasy foods and soft drinks go well together.” Most people agreed that they would not feel right about eating healthy food and drinking a soft drink. “When I am having a salad I am trying to be healthy and soft drinks are not healthy.” An-other female stated, “I wouldn’t drink coke with strawberries, you have to drink water with strawberries.”
last night, and I really wanted to drink it, but I knew I would need it when I woke up so I did not drink it.” She needed the caffeine boost and saved it for a time when she would need it most. Females stated that the caffeine “pumps [them] up.” Another reason for usage is availability. Many people commented on the ease of buying soft drinks, and how the fact that they are not difficult to find made them desirable to drink more often.
said. The same participant also said, “[A hamburger] just tastes really good with a Coke.” American food was another important theme in usage. A 20 year old Caucasian participant said she drinks carbonated drinks “…especially if it is with food that you grill like hamburgers and hotdogs.”
30

A Dentist’s Nightmare
Thin Is In
I Pledge Allegiance to the Brand… Many participants correlated Diet Coke’s brand image with young, trendy, business women, body conscious young females and “dieters.” Many thought of the “red and silver packaging” and associated it with being “slimming and refreshing.” A common theme concerning Diet Coke with Splenda was that it was for diabetics and there was a lack of knowl-
"Coke Zero just doesn$t sound like you$re on a diet,# said a 19-year old male.
Most women preferred Diet soft drinks, but for some Regular soft drinks were seen as an indulgence. There are two reasons women didn’t drink Regular carbonated beverages. First, some wom-en were health or body con-scious. Second, women chose Diet soft drinks because the taste was “crisp” and not “sugary” or “syrupy.” One woman stated, “I always drink diet. I feel like regular coke is too sweet. I just like the taste of Diet Coke more to be honest.” Some participants prefer non-colas because they
To Fizz or Not to Fizz A majority of participants understood the health risks of consuming high amounts of sugar. They were con-cerned with the high sugar content in soft drinks. Many cared because of their over-all health and appearance. Dental hygiene was also a common con-cern about sugar consumption of carbonated soft drinks. One per-
son said that “it’s bad for your teeth and overall health” demonstrating a common theme among interview participants.
said. Therefore, carbonated drinks are used when consumers need a jolt. However, another theme for light users was that many of them don’t like soft drinks in the morn-ing right after waking up. “I never crave something that sweet in the morning,” one participant said.
are more refreshing and appear health-ier because of their clear color and fruit flavors. Various juice drinks and
sports beverages were among the top alternatives mentioned when participants were asked what they would drink instead of a carbon-ataed beverage.
Whereas “Diet” drinks generally tar-get females and those who are weight-conscious or dieting, Coke Zero is try-ing a different route. “Coke Zero just doesn’t sound like you’re on a diet,” a 19-year old Caucasian male participant said. A 20-year old Caucasian female participant said that although adver-
tisements portray Diet Coke for skinny females, “In reality, however, I think an average student like myself drinks Diet Coke a lot.”
31

Taste of Home
"%Coke Zero is& just another product to try and boost sales,# said a male participant.
edge about the product. One person said, “My aunt is a diabetic and she drinks that because she thinks it’s bet-ter for her.” Another person stated they could see “someone who is worried about sugar or sugar substitutes” drink-ing this product. Consumers for the most part under-stand that Coke Zero is an alternative to Regular Coke, but without the calories. However, many consumers re-main extremely skeptical about the product. Surprisingly one person exclaimed, “Coke Zero has formaldehyde in it, which is the same kind of chemical used as an embalming fluid used in funeral homes to preserve bodies for funerals. It is used in the same fashion in animal dissection to replace the blood and keep the animal fresh long enough to dissect and inspect it.” This negative interpre-tation was followed by others includ-ing this statement made by one of the
participants, “I think it’s just another product to try and boost sales and I think of it as just another coke product.” Few people gathered that Coke Zero is “for people that like the taste of regular pop but don’t want all the calories and sugar.” Numerous interviewees associated Diet Pepsi with an older segment of the population. They also familiarized
this brand with certain fam-ily members or friends who drink the product on a regu-lar basis. One woman stated that, “I think of my Dad, it’s his favorite drink.” This quote is very indicative of the general perception of people
who drink Diet Pepsi. Brand awareness was very minimal even years after its launch. Consumers that had heard about Pepsi One were confused about the product and who would drink it. Consumers tended to equate Pepsi One with Coke Zero be-cause they are more familiar with Coke Zero. When one consumer was asked to describe her thoughts on Pepsi One as a
It is true that what a person grows up with influences purchasing decisions as an adult. One 19-year old male partici-pant commented, “I grew up drinking [A&W Root Beer].” Also, a 24-year old female when asked about her favorite drink, Diet Coke, she stated, “I grew up drinking it. It was my Mom’s favorite.”One 20-year old Caucasian female also said, “I have always
liked Coke because my family is affiliated with them…that’s what everyone al-ways drank.”
brand she replied, “Drawin’ a blank…I got nothin’.” Another female stated, “I have never heard of this one. Man I feel out of the loop now. I cannot believe Pepsi One has been out for about four years, and I have not even heard of it.” Most people were unaware of the prod-uct and one person questioned, “Do they even still sell that?”
32

Perception of Coke Zero Consumers were split on their per-ception of Coke Zero. Some consumers saw it as a great alternative to Classic Coke, while others saw it merely as a marketing ploy to deceive consum-ers and make profits. One interviewee positively said, “It’s a really good in between drink. It actually still has that Coke taste, but no calories like Diet Coke. It tastes more like a real Coke than Diet Coke.” An-other positive perception was that “it is a unique kind of soft drink since it doesn’t have that diet label.” Though there were many positive perception of Coke Zero, negative per-ceptions were still present. One woman said, “It’s like if I was looking for a date, Coke Zero would be the guy that looks good, but you just want to
stay away from.” This female was com-menting on how the can looks great, but the taste is just not there. Alternately, when asked the main difference be-tween Coke Zero and other carbonated beverages, one person said, “Marketing tool probably, I think Diet Coke just tastes better. What is the point when they all have zero everything? Coke Zero is just like all the other diet drinks I think.”
Many people often generalize what type of person drinks a specific beverage based on their personal experiences. When one 21-year old Caucasian female was asked what type of per-son drinks Diet Pepsi, she responded, “Men with
glasses…my Dad.” Another 20-year old Caucasian participant said Coke Zero made her think of her uncle because he is the only person she knows who drinks it. Therefore, consumer percep-tions of carbonated soft drinks are influenced by which members of their
"If I was looking for a date, Coke Zero would be the guy that looks good, but you just want to stay away from.#
33
A Rebel Without a “Cal” Mysterious, edgy, new on the scene: these are all words that can be used to describe the brand image or perceived brand image of Coke Zero. It has been positioned as a new edgier soft drink in comparison to more traditional Coke. A 20-year old Caucasian female said, “[Coke Zero is a] cool guy with sun-glasses with a black leather jacket who rides a motorcycle at night.” Coke Zero is the James Dean of the diet carbon-ated soft drink world. Consumers are intrigued by the cool appearance and seemingly good looks, but are wary to try the product. “Coolness” is also a fac-tor in what soft drinks consumers drink. For example, one 20-year old Caucasian participant said, “Pepsi just wasn’t cool at all when I was younger.” Therefore, if Coke Zero could play up the “cool” quality while downplaying the untrust-worthy bad boy image, it could gain a greater market share.
families or friends drank certain carbon-ated beverages.

34
"I guess I try to not drink as much of regular soft drinks if diet is available because of the sugar.#
Gender Analysis On average, the males that were interviewed drank two carbonated soft drinks per day. Men usually consumed soft drinks with food and at parties. For instance, one male interviewee said that he usually drank soft drinks on occasions “like birthday parties, [the] Super Bowl,[and] that type of thing. Sporting events, you always drink soft drinks when you’re watching football or basketball or anything.” This differs with the common themes among female consumers who said more often that they drink when “studying for an exam or writing a paper.” However, female participants also stated commonly that they drank soft drinks while eating or during meals. About half of the men that were interviewed stated they would not want to drink a carbonated soft drink with breakfast. Instead of a soft drink alter-natives included milk, juice and water. These drinks were chosen because they were perceived as healthier or because they went better with a particular food. One male interviewee stated that he
“[doesn’t] like them in the morning,” whereas, another participant stated that he “even drink[s] them with breakfast.” Both male and female participants were split in the number who like soft drink in the morning and the number who did not. Most men were not concerned with the amount of sugar in the soft drinks that they consumed, although some indicated they believed the cola com-panies “are overdoing it.” For instance, one male interviewee stated, “I’m not worried about the sugar in the drinks particularly because I’m not self-conscious about my weight and figure.” However, women were more concerned with the amount of sugar in soft drinks. When asked about her thoughts on sugar in soft drinks, one fe-male interviewee stated, “I guess I try to not drink as much of regular soft drinks
if diet is available because of the sugar.” Male participants preferred regular soft drinks, on average, more than the female participants did. However, fe-males who did prefer regular drinks over diet were just as likely to not care about the amount of sugar in soft drinks. Likewise, males who did drink diet more than regular soft drinks were trying to watch their weight and health.
Additionally there were no striking differ-ences in the perceptions of brand image between males and females. Among questions re-
garding brand trial, male participants had tried just as many of the brands as the females had. # Males more of-ten associated the diet drinks
with women, not with people like
themselves, whereas, females

were more inclined to associate drinks like Diet Coke to people like them-selves. For instance one female inter-viewee stated, “If you have like two or three Cokes a day, you are consuming a bunch of unnecessary calories. Well, that’s a reason why I like Diet Coke.” This par-ticipant also stated that her favorite drink was Diet Coke and that she considered it for someone like her. Regarding perception of Coke Zero, both male and female participants in-dicated commonly that Coke Zero was a drink for people who like the taste of regular Coke, but did not want to con-sume all the calories and want to distin-guish it from other diet products. Also, one male participant said, “Just the word diet means that someone is trying to lose weight, and Coke Zero just doesn’t sound like you’re
Upon the review of all the informa-tion, there are evident themes, as well as some areas of concern for The Coca-Cola Company regarding the newest addition to the Coke portfolio. First of all, the market seems to be divided on consumption patterns. One segment drinks soft drinks to compliment meals, primarily American foods that are considered “junk food,” such as piz-za and hamburgers. The other market
Key Insights
on a diet.” One female participant also said, “I personally feel that Coke Zero is different than other colas in a good way. It is supposed to have the taste of a regular soft drink, buy have less calories and sugar which in the end is healthier for you.” There was a general consen-
sus among male and female inter-viewees on perception of Coke Zero.
segment consumes soft drinks for the caffeine. The drink provides something other than just taste and refreshment, but also serves as an energy booster. There is not one common reason why the target market consumes soft drinks. Consumers also drank soft drinks most often at social events such as par-ties and holidays. A common theme among participants was that many of them did not want to drink a soft drink after working out or doing something healthy. Consumers are generally more concerned with calories rather than sugar and often did not draw a connec-tion between caloric intake and sugar content. In terms of brand image, consum-ers correlate Diet Coke with a younger, trendier female audience. Diet Pepsi is often more generational and many interviewees pictured their mother or grandmother as drinking this soda. Coke Zero’s image in the minds of the consumer may worry The Coca-Cola Company, as many consumers are very skeptical of the product. They feel that there is not much difference between
35

Coke Zero the other Coke products, and the product is more of a money making ploy rather than an entirely new product.
Table 7 Source: Qualitative Interviews
36

Through the convenience sampling technique our group targeted 18-24 year-olds who drink an average of one carbonated soft drink a day or roughly seven soft drinks a week. We gave a self-administered intercept survey to 61 people in attempt to fulfill the research objectives stated in the previous section. We did this to correct the ineffective efforts to convey Coke Zero’s product advantage. Through library, class and friend intercepts, our group individually surveyed the 61 participants. Each member of the group issued 10 surveys total to 5 females and 5 males. Those surveyed were asked to watch two Coke Zero television commercials and listen to one radio advertisement from a choice of four. This survey can be found in Appendix 2. We asked a range of questions to gather nominal, ordinal and interval data. Open-ended questions were asked to determine their attitudes.
Survey
Research Objectives
•To measure the target market’s current carbonated soft drink usage•To assess the target market’s attitudes/beliefs about carbonated soft drinks•To assess the target market’s attitudes/beliefs about Coke Zero•To measure the target market’s Coke Zero Trial•To assess the target market’s evaluation of Coke Zero’s current advertising•To identify if there are gender differences for the above measures
MethodSample Profile and Data Collection
Introduction
While secondary research was in-sightful, further primary research was necessary to understand the target mar-ket more conclusively. The following research objectives were the guides for assessing the data gathered.
Ordinal scales were used to determine product usage, while interval scales were used to understand various atti-tudes and beliefs about various aspects of carbonated soft drinks. Some of these aspects included taste, sugar con-tent, price and whether or not diet soft drinks have a bad aftertaste. After col-lecting the data, we entered it into SPSS software to gather statistical informa-tion pertaining to the survey responses.
37
Results
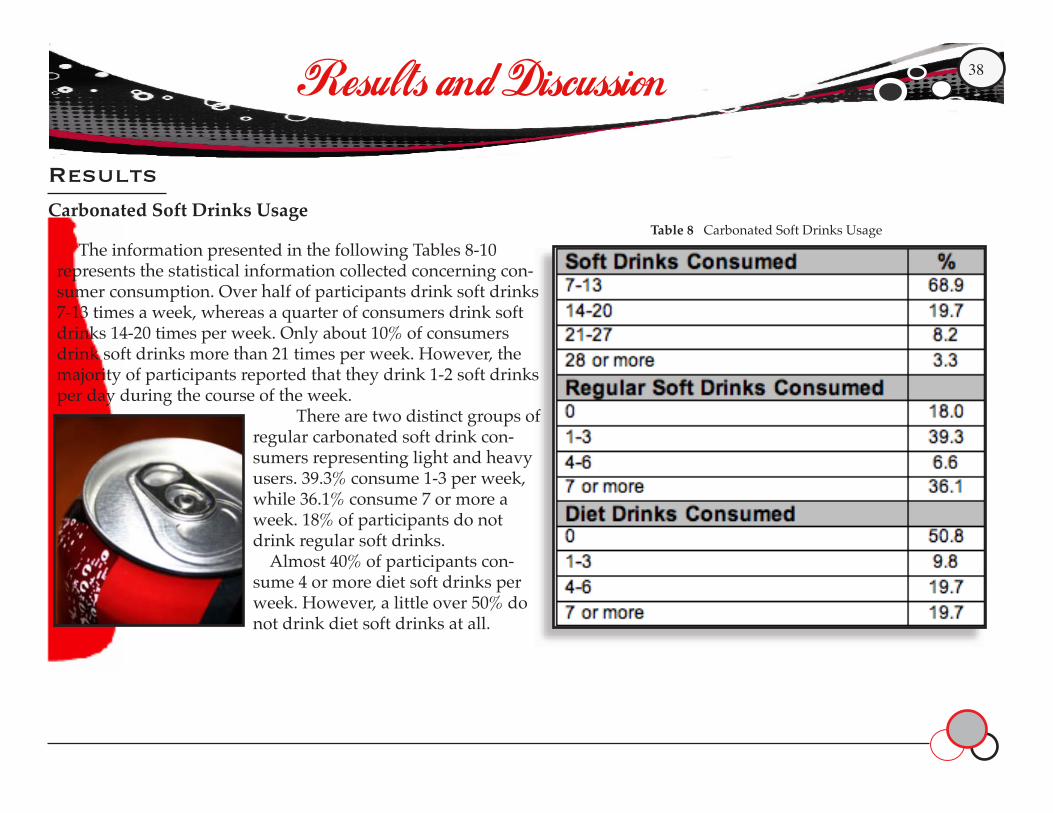
Table 8 Carbonated Soft Drinks Usage
Carbonated Soft Drinks Usage
The information presented in the following Tables 8-10 represents the statistical information collected concerning con-sumer consumption. Over half of participants drink soft drinks 7-13 times a week, whereas a quarter of consumers drink soft drinks 14-20 times per week. Only about 10% of consumers drink soft drinks more than 21 times per week. However, the majority of participants reported that they drink 1-2 soft drinks per day during the course of the week.
There are two distinct groups of regular carbonated soft drink con-sumers representing light and heavy users. 39.3% consume 1-3 per week, while 36.1% consume 7 or more a week. 18% of participants do not drink regular soft drinks. Almost 40% of participants con-sume 4 or more diet soft drinks per week. However, a little over 50% do not drink diet soft drinks at all.
Results and Discussion 38

Table 9 Most Popular Brands Consumed by Participants (N= 61) Table 10 Brand Consumed Most in Past 7 Days
N=61
As seen in Table 9, Coke Classic was the most popular brand consumed with 20.8% of people listing it as their favorite drink. In terms of major com-petitors, Coke products were by far the most popular as 49% of participants picked Coca-Cola prod-
ucts, while Cadburry Shweppes finished a distant second with 22.5% thanks to its leading brand of Dr. Pepper. PepsiCo finished in third with 17.77%. The remaining 10% are brands that only garnered one vote. For example, Diet Coke with Splenda and Diet Coke with Lime or very general responses such as Root Beer were re-sponses that were chosen, but did not fit the top three re-sponses. Only one person out of the 61 surveyed chose Diet Pepsi as one of their top three brands.
Coca-Cola was the most popular brand consumed according to our sample in the last seven days with 29.5% in Table 10. It has a ten percent advantage over Diet Coke, which is in second place. Other regular carbonated soft drinks come in third, with Coke Zero following it. This should be encouraging to Coke Zero, because although Client and Competitor Analysis information indicates a weak market share for Coke Zero it has an advantage over Diet Dr. Pepper, Diet Pepsi, and Diet Mountain Dew. Consumers recalled drinking Coke Zero before they recalled some of the industry’s most prominent brands. Another signifi-cant note is Coke Zero’s popularity among the target sample compared to Pepsi, Coke’s most prominent rival.
39

Table 11 Qualities to Consider When Purchasing a Caronated Soft Drink*On a scale from 1 to 5, with 1 being Very Unimportant to 6 being Very Important.
How important do you consider the following qualities when choosing a carbonated soft drink?
Attitudes/ Beliefs about Carbonated Soft Drinks
When interpreting the attitudes and beliefs of our sample as seen in Table 11 we compared the mean of each individ-ual quality of a carbonated soft drink in order to verify any and all trends, as well as to help better understand what the consumer is inherently looking for in a drink. Overall, individuals ranked
taste as the most important character-istic when choosing a soft drink with a 4.72 mean which ranks between impor-tant and very important swaying more towards very important. 83.6% of the sample ranked taste as very important and only 1.6% ranked it as very unim-portant. An interesting trend we found
while analyzing the data is that the sample is mixed in terms of sugar level,
with a mean of 3.02. It seems as though our sample was apathet-ic towards it, but at a more de-tailed glance we noticed we had completely split majorities. One side that thought it was either unimportant or very unimport-ant and then a completely equal side that thought the exact oppo-site, that sugar level was impor-tant and very important. This should affirm Coca-Cola that it is on track and there is a market segment concerned about the high sugar levels in soft drinks. Another trend we noticed that may be disheartening for Coke
Zero is that the majority of consumers are not concerned about the calories in their soft drink. 31.1% of the sample ranked calories as very unimportant when choosing a carbonated beverage. Along those same lines a vast majority of our sample also ranked carbohydrate count as very un-important with 44.3% of the
40

*On a scale from 1 to 5, with 1 being Strongly Disagree to 6 being Strongly Agree.Table 12 Attitudes/ Beliefs about Carbonated Soft Drinks
Please mark how much you agree or disagree with the following statements. samples voice. We also put many of our prelimi-nary hypotheses about why people drink the brands and the kind they drink to rest when we noticed that overall con-sumers are fairly apathetic when it comes to habit as well as reputation. This may show a growing trend that consumers are becoming more indepen-dent and less brand loyal. It should be noted that the least popular charac-teristic for choosing a soft drink was latest trend and popularity which had an overall mean of 1.77. This should comfort Coca-Cola to know that they may not lose precious Coke Classic market share to a “popu-lar or trendy drink.” However, Coke should be concerned with how to secure much needed market share for its new product Coke Zero.
In order to further understand the target consumer, it was necessary to an-alyze the target samples’ attitudes and beliefs about regular and diet drinks and their results can be seen in Table
12. The samples did not clearly indicate one way or the other whether “regular soft drinks taste too sugary.” Roughly 1/5 strongly agreed with the statement, however we also had 1/5 that strongly
41

disagreed with the statement, and there were 1/5 who neither agreed nor dis-agreed. With a resounding 45.9% of the sample strongly disagreeing with that statement and then the next larg-est majority of 32.8% disagreeing with the statement. It is clear that consumers do not think that diet soft drinks taste like the original bever-age. Overall the sample agreed that regular soft drinks do have a stronger flavor than diet soft drinks. Echo-ing the results from the quali-tative interviews, most of our sample agreed with the statement that “Regular Soft Drinks Taste Better Than Diet Soft Drinks.” An interesting note, there was not a clear consensus among our sample whether “Diet Soft
Drinks are Mainly for Females.” Con-trary to the belief, 32.8% of our sample strongly disagreed with the previous statement. Delving deeper into the statement we noticed that the next high-est majority neither agrees nor disagrees
with the statement. The sugar content in regular soft drinks does matter to many par-ticipants in our sample, as close to 50% of the sample either dis-agreed or strongly
disagreed with the statement that “the sugar content in regular soft drinks doesn’t matter to me.” This could indi-cate that there is a need for a low-sugar alternative to Coke Classic. Coke should take notice to this. There may not be a
prominent market for a “diet drink for males.” There may be a stronger male diet coke market than data has shown. Another interesting piece of data indi-cates that the sample does not neces-sarily feel healthier from choosing diet drinks. Only 3.3% of the sample strong-ly agreed with the statement “Drinking diet soft drinks helps me feel healthier.
Coke Zero Trial
• Never tried Coke Zero: 24
• Had tried Coke Zero: 37 and the average taste rating is 3.19.*
*On a scale where 1 is Very Bad and 5 is Very Good.
Twenty-four people out of 61 have never tried Coke Zero. Thirty-seven people had tried it but only thought it tasted mediocre.
42

Evaluation of Coke Zero AdvertisementsTable 13 Main Themes of Coke Zero Advertising
After the survey participants watched the ads, they were then asked what the main idea or message the ads were trying to convey. There were various responses that could be formed into five categories. An overwhelming majority of participants, 69.9%, as indi-cated by Table 13, recalled the likeness of Coke Zero to Coke Classic as the ads main idea. This should comfort Coke knowing that most con-
sumers are receiving the ads intended message. 16.4% of consumers also un-derstood the underlying message that Coke Zero has zero calories and 6.6% understood that Coke Zero is a healthy alternative to Coke Classic. Due to the 8.2% level of non-response there is not an excessive level of response catego-ries.
43

Table 14 Likes of Coke Zero Advertising
After seeing the ads, the participants were also asked what, if anything, they liked about the ads. The responses were again divided into categories based on the similarity between their reactions. 52.5% of respondents liked the ads because of the humor, 21.3% enjoyed the ads because of the ac-tors, while only 19.7% like the ads based on con-tent. There was also a 19.7% non-response rate that inhibited further interpretation of the data.
44

Tables 15 Dislikes of Coke Zero Advertising
46
Five participants stated that the acting in the commer-cials was a reason they disliked the ads. Annoying char-acters and a lack of certain types of characters were among the reasons for disliking the acting. Only 11.5% of the participants alluded to the humor as a reason they disliked the ad. A majority of participants dislike for Coke Zero ads, 24.6%, stemmed from the overall content of the ad. Responses ranged from “annoying” and “irritating” to “dumb.” Overall the radio ads tested the poorest as they were referred to 3 times as “dumb”, “annoying”, “and irritating”. One participant went as far to men-tion that the “radio ad missing calories was fairly irritating and the concept has been done, ad nauseum.” Other participants mentioned that they did not like the commercials because they claimed they tasted just like Coke Classic, however in the participants minds it did not. We were unable to find many themes among the answers because we had such a small response rate to this question. Only 52.5% of all of our participants answered these questions. Of the other 47.5 %, 21.3% were due to item non-response while the remaining 10 respondents an-swered with non-meaningful information such as “nothing” or “not much.”
45
The first question under the Coke Zero Trial section asked if the partici-pants had ever tried Coke Zero. 37 out of 61 people surveyed have tried Coke Zero and of those individuals who have tried the soft drink, 56.8% of them were men, while only 43.2% were women. Out of all of the men in our sample, 70% had tried Coke Zero while only 51.6% of women had tried it. However, accord-ing to our Pearson Chi-Square value of 0.142 all differences are merely due to chance and not significant. 24 people out of the 61 participants surveyed had not tried Coke Zero at the time of the survey. Of those 24, 15 of them were female, which means that almost half (48.4%) of the women sampled had not tried the beverage. Though there is a difference, no recommendations can be made since the differences are solely due to chance. Question 1 under the Carbonated Soft Drink usage category asks how many soft drinks the participants
The statistical information in the fol-lowing tables and accompanying dis-cussion extrapolate information gath-ered in qualitative interviews. Since Coke Zero’s target market is young males, it is essential that the survey results aid decisions regarding this gender, while the responses of women are equally as important for making decisions regarding the future position-ing of Coke Zero. The following tables indicate survey variables in which there were significant statistical differences between the responses of males and females. The tables show the average responses for the variable, the individ-ual means for men and women within the variable, and the results from the significance tests. Survey participants indicated how much they agreed on a scale from 1 to 5 with each statement. The information presented is useful because it shows the average response for individual variables, which indicates the average across both genders for agreement with particular statements. Also, it shows the mean for individual
genders’ agreement with particular statements, which is also useful; since the statements shown in these tables represent only those statements which indicate a significant difference between men and women’s responses, the dif-ferent averages show the degree to which one gender agreed significantly more than the other. Finally, the results from the t-tests conducted in SPSS are shown in the last column. These results are helpful, because in being less than .1, they indicate a significant difference in the average response between men and women for a particular statement. In other words, the “Sig. (2-tailed)” columns prove statistically that differ-ences in averages are not due to chance. This helps make valid any assumptions about differences between men and women drawn from qualitative infor-mation.
Gender Differences
Gender Differences in Soft Drink Usage
4746
Through the Chi-Squared analysis of the survey data, various conclusions can be drawn regarding specific gen-der differences in carbonated soft drink consumption. We analyzed three dif-
ferent questions in the survey to further understand these behaviors.

consumed within the last seven days of taking the survey. 68.9%, or 42 individ-uals consumed between 7-13 soft drinks within the last seven days. Of the 68.9%, 54.8% were female, and 45.2% were male. Twelve people, 19.7% of all participants, had consumed between 14-20 soft drinks in the last week. Out of all male participants, 16.1% had con-sumed between 14-20 carbonated bever-ages. Out of all the female participants 23.3% had consumed between 14-20 soft drinks in the last week. Five males and no females consumed between 21 and 27 beverages in the last week, which is only 8.2% of the total sample. The final consumption level, heavy usage of 28 or more beverages in the last week, contained only 2 males and no females, which is 3.3% of our sample. In conclu-sion, females are only light to moderate users of carbonated soft drinks, drink-ing only 7-20 soft drinks in the last week. 23 of those women drank 7-13 soft drinks, while only 7 drank 14-20. Nineteen males drank 7-13 soft drinks in the last week, 5 drank between 14 and 20, another 5 drank be-
tween 21 and 27 soft drinks, and only 2 males drank more than 28 drinks in the last week. Males tend to consume more carbonated soft drinks than women. These values represent a significant dif-ference between males and females with a Pearson significance level of 0.053. Question 2 under the Carbonated Soft Drink Usage section asked of the total number of soft drinks consumed in the past week, how many were regular soft drinks. Eight females and 3 males
0
5
10
15
20
25
Frequency
7 to 13 14 to 20 21 to 27 28 or more
Number of Drinks
Soft Drink Consumption in the Past 7 Days
Male
Female
Graph 8 Source: Primary Research Survey
did not have any regular soft drinks within the last week. This represents 18% of all participants. Sixteen males and 8 females consumed between 1 and 3 regular soft drinks within the last week, which is 39.3% of the total sample size. Only 1 female and 3 males had be-tween 4 and 6 regular soft drinks, which is only 6.6%. The highest consumers of regular soft drinks who drink 7 or more in a week were 17 males, which is 77.3%. Only 5 females were heavy consumers and drank 7 or more regular
soft drinks a week. The highest fre-quency of consumption by females was in the 1-3 category, which con-sisted of 16 women. Sev-enteen out of 31 males con-sumed 7 or more regular
47

soft drinks a week, which is almost 55% of the consumption pattern within the male segment. In conclusion, 28 males consumed regular soft drinks more than the 22 women who drank regular soft drinks. Males tended to consume more regular carbonated beverages than the women, who drank fewer regular drinks in a week. These differences are not due to chance with a Pearson Chi-Squared significance level of 0.006. Question 3 under the Carbonated Soft Drink Usage category asks how many diet soft drinks the participants
consumed with-in the last seven days of taking the survey. Not surprisingly 22 of the 31 males surveyed had not consumed any diet bever-ages in the last week. On the other hand, only 9 females did not drink
any diet drinks. Out of all survey par-ticipants 50.8% had not consumed any diet beverages. Within the 7-13 diet drinks per week category 4 females and 2 males con-sumed this amount, which is only 9.8% of the total sample. The first two divi-sions of diet soft drink consump-
tion, which goes from 0 to 13, make up almost 61% of the sample. Medium to heavy usage, from 14 to 27, of diet soft drinks only consists of about 39% of the sample. 33.3% of females consumed 14-20 diet drinks within the last week, while only 6.5% of males consumed the same amount. 23.3% of females consumed 21-27 diet drinks in the past seven days, while 16.1% of men drank 21-27 diet soft drinks in the last week. There is a significant difference in diet drink consumption between males and females with a Pearson Chi-Squared significance of 0.008.
0
5
10
15
20
25
Frequency
7 to 13 14 to 20 21 to 27 28 or more
Number of Drinks
Soft Drink Consumption in the Past 7 Days
Male
Female
Graph 9 Source: Primary Research Survey
Graph 10 Source: Primary Research Survey
48

Table 16 Most Popular Brands by Participants Broken Down by Gender
14.5% of men drink Coke Classic, while only 6.3% of women drink Coke even though it was the most popular brand consumed. Among women, the
most popular brand consumed was Dr. Pepper. 10.4% of women drank Dr. Pepper and was the second most popu-lar carbonated beverage for 8.10% of men.
49
Men and women differed in their choice of diet versus regular cola, with women scoring higher with the diet drinks. 6.9% of women drank Diet Coke most with men only drinking 2.8%. This trend is evident with Diet Dr. Pepper, and Diet Moun-tain Dew. Another interesting theme we found was that 1.15 % of men and women chose Coke Zero as the brand that they drank most often. Only 1 person out of the 61 surveyed chose Diet Pepsi as one of their top three brands. Surprisingly, the survey par-ticipant was a male.

Table 17 Significant Differences in Attitudes and Beliefs
*On a scale from 1-5, 1 meaning Very Unimportant to 5 meaning Very Important.
Gender Differences for Attitudes/ Beliefs about Carbonated Soft Drinks
51
The first question the survey uses to address the target’s attitudes and beliefs about Coke Zero was the ques-tion, “How important do you consider the following qualities when choosing a carbonated soft drink?” The respondent was then directed to indicate his or her opinion between the interval of Very Unimportant to Very Important, with a response of “1” meaning Very Unim-portant and “5” meaning Very Impor-tant. The qualities addressed were Taste, Sugar Level, Calories, Availability, Price, Reputation/Brand Image, Latest Trend/
Popularity, Display, Bottle/Can Design, Carbohydrate Count, and Habit/What I grew up with. The variables that indi-cated a statistically significant difference between males and females regarding the importance of
these qualities were Sugar Level, Calories, Reputation/Brand Im-age and Carbohydrate Count.It is evident that there is a significant difference between these qualities because they indicate characteristics that coincide with commonly held opinions or stereotypes concerning what genders prefer or should prefer. For instance, it is not surprising that there is a significant difference between men and women’s opinions on the importance of carbohy-
drate count, because females stereotypi-cally are more concerned the amount of carbohydrates in what they consume. However, there is no significant differ-ence between men and women in the importance of a taste when choosing a soft drink. The importance of taste showed the highest average response among all qualities addressed in ques-tion one with a mean of 4.72.
The statistics in Table 17 indi-cate a significant
difference between males
and females in their attitudes and beliefs about
carbonated soft drinks. After ana-lyzing SPSS fre-
quency and means charts, many conclu-
sions can be drawn from the data.
Consumer attitudes and beliefs about soft drink attributes show that there is a difference between male and female perceptions. For
50

Table 18 Significant Differences in Attitudes and Beliefs
example, sugar level averaged the highest with a mean of 3.02. However, women think that sugar level is signifi-cantly more important when choosing carbonated soft drinks than men, with a mean of 3.37, as compared with 2.68 for males. This coincides with information collected in the qualitative interviews. For instance, when asked “Are you concerned about the amount of sugar in regular soft drinks,” one male inter-viewee re-sponded, “I do not give a bit about the amount of sugar in the [soft drinks] I drink.” In con-trast, one female interviewee responded differ-ently stating, “I am concerned with the amount of sugar in regular soft drinks.” The amount of calories in soft drinks is skewed with 31.1%
of consumers rating the attribute Very Unimportant and 23% rating the at-tribute Very Important. This difference can partially be explained by the dif-ference between male and female perceptions of the importance of calories. The mean for females is 3.67, whereas
the mean for males is 2.00. Therefore, women find the amount of calories in soft drinks sig-nificantly more
important than men. Most consumers find Reputation/
Brand Image to be of little importance. Most consumers previously rated Reputation/Brand Image from Very Unimportant to Neither Important or
51

53
Unimportant. This shows that consum-ers believe that Reputation and Brand Image do not play a major part in their decision when purchasing soft drinks. However, there is a significant differ-ence between the perceptions of men and women regarding brand image and reputation when choosing a soft drink. This is shown by a mean of 2.23 for females, and a mean of 2.74 for males. Additionally, this shows that reputation and brand image is significantly more important to males than females. Carbohydrate count is also of little importance to consumers. Most previ-ously rated Carbohydrate Count from Very Unimportant to Neither Important or Unimportant. There was also a skew between males and females for carbohy-drate count. Women, significantly more than men, find the amount of Carbohy-drates in their soft drinks Very Impor-tant. For example, the mean for females is 2.70, compared to only 1.68 for males. Therefore, based on the Table 17, women find sugar level and calories in soft drinks more important than men, and reputation/brand image and carbo-
hydrate count is not very important to either males or females. However, repu-tation and brand image is significantly more important to men than women. Reputation/Brand Image is the only category that shows a significant dif-ference in which men agreed with the statement more than women. In Question Two, which assesses attitudes and beliefs about carbonated soft drinks, respondents indicated the amount to which they agreed with statements. Table 18 displays the state-ments that showed a significant differ-ence between the beliefs of males versus females. Women agree more than males with the statement “Regular Soft Drinks Are Too Sugary” than males. The mean for females is 3.37, compared to only 2.58 for males. Men tend towards neutrality and do not show much concern for the amount of sugar in regular soft drinks, whereas women care more than men, indicated by the higher mean. Women also agreed more with the state-ment, “Diet Soft Drinks Usually Taste Like The Original Beverage.” Though
females agreed more with the state-ment, the average for that gender is still below Neither Agree nor Disagree, which shows that females do not ex-pect a diet drink to taste like a regular. Also, this statement elicited the lowest response among all significant variables in this survey question. This shows that if most people in the sample frame were to choose to drink a diet soft drink, they would be conscious of the fact that they are not drinking something that tastes like the original drink. It also indicates a very strong consensus against the state-ment that diet sot drinks usually taste like the original. Consensus on the statement “Diet Soft Drinks Have A Bad Aftertaste” is just below a completely neutral re-sponse. Men, however, agree signifi-cantly more with this statement than women. The male mean is 3.32, whereas the female mean is 2.47. So, men aver-aged between Agree and Neither, and women averaged between Disagree and Neither. This shows that men, more than women, notably consider a diet drink’s
52

aftertaste a hindrance to their consump-tion. This is encouraging for Coke Zero, since the product is formulated to taste more like Coca-Cola Classic than Diet Coke. Men agree significantly more than women with the statement “The Sugar Content In Regular Soft Drinks Doesn’t Matter To Me.” The mean for men is 3.45, compared to only 2.10 for women. This shows that men agree more with the statement than wom-en. Men usually are not concerned with the sugar content of their carbonated soft drinks. This reinforc-es information gathered in qualitative interviews. For instance, one male inter-viewee stated, “I would sometimes rather have more sugar in soft drinks than anything.” Therefore, it is difficult to successfully mar ket the health benefits of
Coke Zero to a target market that isn’t concerned with the benefits of this sug-arless carbonated soft drink. Men also agree significantly more with the statement “Diet Soft Drinks
Are For Older Gen-erations.” The male mean is 2.71, whereas the female mean is 1.73. This shows that women more strongly disagree with the state-ment than men, who lean towards neutrality. This statement stresses the importance of relat-ing to the information gained in the previous question, “How impor-tant do you consider the following qualities when choosing a car-bonated soft drink?” Men believe that repu-tation and brand image are significantly more
important than women do. These two facts provide a strong basis for under-
standing that image is more important than health benefits of the drink. There-fore, a negative stigma surrounds diet drinks, which Coke Zero accurately in-tends to avoid by positioning Coke Zero as a “non-diet” drink. Nearly half of all participants Strongly Agree with the statement, “Regular Soft Drinks Taste Better Than Diet Soft Drinks.” However, men agree with this statement signifi-cantly more than women. This informa-tion pairs well with the previous state-ments, “Diet Soft Drinks Usually Taste Like the Original Beverage,” and “Diet Soft Drinks Have a Bad Aftertaste.” In these statements, the men had a mean response that indicated a considerable distaste for the flavor of diet drinks. Understandably, men agree with the statement, “Diet Drinks are Mainly for Females” significantly more than wom-en. However, because the mean for the variable and the lower means for the genders show that both men, who aver-aged 2.90, and women, who averaged 2.17, incline more toward disagreement with this statement than agreement. This is a surprising lack of agreement
53

Gender Differences for Coke Zero Trial
I’d like to buy the world a Coke
Surprisingly, women had tried Coke Zero more than men, even though Coke Zero’s intended target market is males ages 18-34. However, it is good that out of our sample size of 61, 60.7% of participants had tried Coke Zero. It is important to note that out of all of our male sample, almost half had not tried Coke Zero.
Table 19 Male and Female Differences in Coke Zero Trial
55
among males with this statement. It is notable that men do not more “Strongly Agree” with this statement because previous information would lead data analysis to conclude otherwise.
54

Evaluation of Coke Zero Advertisments by Gender Differences
Table 20 Main Ideas of Coke Zero Ads Source: Primary Survey
After the survey participants watched the ads, they were then asked what the main idea or message the ads were trying to convey. There were vari-ous responses that could be formed into five categories. After seeing the ads, most people commented on the like-ness of Coke Zero and Coke Classic, the lack of calories in Coke Zero, the notion that Coke Zero is a healthy alternative to Coke Classic, and the idea that Coke Zero is for all ages. The fifth category
was the non-response category. After reviewing the ads, 37.7% of women commented on the taste similarity be-tween Coke Zero and Coke Classic, and only 31.1% of men drew the same conclusion. The distractions due to the humor may have caused the misinter-pretation of the ads. One female com-mented that she liked the ads because “they didn’t necessarily relate directly to the product.” Out of 61 surveys, only 5 men and 5 women commented on the fact that Coke Zero has no calories.
The television ads did not focus on the fact that Coke Zero has no calories, they focus mainly on the similar-ity between Coke Zero and Coke Classic. The only reference made to calorie content in the television commercials was written at the end of the deli spot and shown for only a few seconds. The lack of emphasis on Coke Zero’s calorie con-
tent detracts from the main idea of the ads. In the next category 4 males out of 61 respondents thought that Coke Zero was a “healthy soda” or a healthier option than Coke Classic. The ads did not specifically state that Coke Zero was healthy, but these 4 males deducted that the lack of calories meant that it was healthy. One man said that the main idea of the ads was to demonstrate Coke Zero as a “healthy soda.” This as-sumption shows that when people hear “zero calories” they parallel that with health. Also, there is a certain level of
56
55

brand awareness and the knowledge that Coke Zero does not have any calo-ries may have also led these men to the conclusion that Coke Zero is healthy. In the last category, 3 men and 4 women mentioned age as an underlying theme after reviewing the ads. One man said that Coke Zero is “finally a Coke for the first generation.” Three of the 4 women that commented on age said that Coke Zero is “for everyone.” One other man said that it is “not just for younger peo-ple.” Again, the humor in the ad dis-tracted people from understanding the message behind the ad. Though people truly enjoyed watching the ads, the message was lost in translation. Last, 5 out of 61 people did not answer this question which is possibly due to over-sight or item non-response. There were a few responses that did not fit into the five categories above. We faced another form of survey er-ror with these participants because they did not satisfy the goals of survey research. Almost 5% of men did not catch on to
the meaning of the ads and gave nonsensical responses. One man said that the meaning behind the ads was that “old people are cool too.” Another man said that “the drink is good,” which is close to the meaning of the ad but fails to capture the true point of the ads.
Table 20 Significant Differencces between Genders About Advertisements
*On a scale from 1 to 5, 1 being I Disliked Them A Lot to 5 being I Liked Them A Lot.
Although Coke Zero’s ads are positioned to their target market of young adult males, more women like the ads than men. Females had a significantly better reac-tion to the ads than males. The mean for females is 4.00, which shows that most women indicated they liked the advertisements, compared to a mean of 3.52 for males. Overall most participants liked the advertisements, with a mean of 3.75. It is also notable that women liked the ads significantly more than men, which may promote a revamping of the advertisements.
Table 21 Why Men and Women Like Coke Zero Ad
5756

After seeing the ads, the participants were also asked, what if anything they liked about the ads. The responses were again divided into categories based on the similarity between their reactions. People liked the ads based on the hu-mor, the characters in the ads, and the content itself. Also, there was a large percent of non-response on this answer and it makes up another category. A total of 52.4% of the participants enjoyed the humor in the ads. A few people commented on the old man using the word Djibouti. One woman said, “I like it when people say Djibouti.” It is inter-esting that such a small portion of the ad made such an impact on the viewers. One man said that he enjoyed the fact that the ads “played on common cultural stereotypes,” such as the old man being senile and younger people assuming that they do not know what they are talking about. People also commented on how much they liked the characters. The
old man was a big hit among viewers. One female stated, “I thought the old man in the first commercial was cute.” The content of the ads composed a big portion of respondents. Participants commented on the music, the intel-ligence in the ads, the fact that the ads were not confusing, and that the ads were believable.
Over all men and women dislikes were fairly similar. A few points of inter-ests were that women disliked the ads more than men based on humor. In fact, two of the females both cited too much “guy humor” as a reason they disliked the ads. Another difference among the sexes was that women claimed content was a main reason for their aversion towards the Coke Zero ads. Again this could be due to the fact that the commercials were highly targeting males and may have included information that did not connect to the female consumer. 27.9% of women left this question to item non-response while the men only had 18% of item non-response.
Flag of Djibouti
57

Based on the information gathered about Coke Zero as a whole through the Situation Analysis, Consumer Insights, as well as the primary research obtained through surveys and interviews our as group has formulated a list of sug-gestions and recommendations to The Coca-Cola Company with regards to its newest product, Coke Zero. The rec-ommendations range from reassessing the target market, to repositioning the product entirely.
Coke Zero, an Equal Opportunity Marketer The first recommendation that Coke Zero should consider is to extend its target market to include women. In the qualitative and quantitative data represented in previous sections, it is clear that women are just as inclined to choose Coke Zero as men are. Based on Coke Zero trial, 34.4% of women had tried Coke Zero, while only 26.2% of men had tried the product. By trying to target a market that is equally diverse, Coke Zero should expect to gain market from two categories as opposed to one
category, men. Judging from the survey results, information shows that women and men chose Coke Zero as one of
their top three brands equally as much. Although targeted towards men,
women may be more susceptible to a zero calorie drink than men. The most popular brand overall was Coke Clas-sic followed closely by Diet Coke. By increasing Coke Zero’s overall target market it should expect an increase in market share based on The Coca-Cola Company’s prominence in the Carbon-ated Soft Drink industry.
Diet, but Different
One area of concern for Coke Zero is that it is directly competing with Diet Coke and Coca-Cola Classic for market share and consumers. Coke Zero as well as Diet Coke seems to attract the same
target market of healthy consumers looking for an alternative to Coke Clas-sic. Many people think that Coke Zero is Diet Coke with a makeover. One 20-year-old female stated, “Coke Zero really does taste like regular Coke, but since I have no problem drinking diet colas, I would rather just stick to [Diet Coke].” One male participant said, “I really don’t understand the point for Coke Zero, if you want a healthier soft drink made by Coca-Cola, drink Diet Coke, it’s classic.” People do not under-stand that there is a distinct difference between the two products and are hesi-tant to try a new product that seems no different than an old one. The skepticism towards Coke Zero warrants a change in its communicative strategy to make sure consumers under-stand that Coke Zero and Diet Coke are two separate products with different benefits. It is
Recommendations 58

60
necessary for Coke Zero to take a posi-tion as an alternative to a diet drink, rather than an alternative to a regular soft drink. An overwhelming amount of the survey sample disagreed with the statement, “Diet soft drinks usu-ally taste like the original beverage.” This alone should cause Coca-Cola to refocus its marketing strategy for Coke Zero. By comparing itself to Coke Clas-sic, Coke Zero is comparing itself to the number one soft drink in the target sample, when in fact it is inherently a “healthy alternative,” diet drink, and should be targeted as one because the target market already perceives it as one. The new idea of “Diet, but Differ-ent” is the best way for Coke Zero to extend its product and increase future market share.
What Are We Doing? The results from the copy testing sec-tion of the survey revealed an overall lack of brand awareness of Coke Zero. While the participants understood the message that Coke Zero tastes like regular Coke, there is skepti-
cism towards this claim based on the statements from the previous recom-mendation. Though the actors and humor were entertaining, the overall content of the ads was the main reason that many consumers did not like the ad. One male stated that the ads “did not make sense or say that Coke Zero was good, just that it tastes like Coke [Classic].” Another male consumer also had the same sentiments stating that, “It doesn’t explain why Coca-Cola would continue selling regular Coke if Coke Zero is the putative best new choice.” Due to the overwhelming misinterpre-tation of the content of the ad and the brand as a whole, Coke Zero, when further copy testing, should make sure people understand what the brand is as
Bad Ad Based on the misinterpretation of the brand due to the advertisement’s lack of brand information, as well as the less than outstanding overall reaction to the ads, this facilitates the need for a completely new campaign strategy. The recommendations for a new section of the target market necessitate a new campaign that tailors both to men and women. Many women stated that the ads contained too much “guy humor” and in order to attract a larger female segment, the ads must cater to both demographics. Another area of concern was that people did not feel as though they could relate to the ads as shown from the survey responses regarding Coke Zero’s advertising. Consumers may not feel an overwhelming connec-tion to the underlying theme of “Coke-ness” in the advertising. “Coke-ness without Calories” is irrelevant to some consumers because many people drink both Pepsi and Coke products and do
well as clarify that Coke Zero is in fact a “diet” drink that stands out among the plethora of unsavory diet beverages.
59

Look at Me After reviewing the survey, almost half of all males had not tried Coke Zero, while only 30% of females had not. In order to make sure that the brand succeeds, Coke Zero must find new outlets to promote the brand. In the fall of 2005 Coca-Cola introduced Vault. In order to ensure brand success, it gave out free samples at many venues such as football games, concerts, and other community events. Coke Zero may benefit from a marketing plan, similar to Vault. By giving out these samples, Coke Zero is inviting consumers to take interest in the brand and continue to purchase it. Hopefully, a promotional plan such as this will increase overall brand awareness and
not feel an emotional connection to Coke. Habit/What I grew up with had a neutral effect on purchasing decisions. The new campaign should focus on how Coke Zero is different from other diet drinks, instead of competing with regular Coke as stated in an earlier rec-ommendation.
purchase stimulation among the target markets. Promotion at places such as universities, will be the most beneficial in attaining the desired demographic. Possible sponsorship of sporting events and T.V. product placement may also promote brand awareness and spark in-terest among the desired demographics.
1. Target both men and women equally2. Market as diet alternative not as regular alternative3. Copy test further for more effective ads4. New campaign to promote new
position strategy5. Stimulate product trial to increase overall market share
Recommendations
60

Appen
dix
1
Consu
mer
Insi
ghts
Inte
rvie
w G
uid
e
Bac
kg
rou
nd
In
form
atio
n:
Gen
der
: A
ge:
R
ace/
Eth
nic
ity
:
Soft
Dri
nk
s
Usa
ge
Am
ou
nt
and
Usa
ge
Occ
asio
n:
Ab
ou
t h
ow
man
y s
oft
dri
nk
s d
o y
ou
dri
nk
eac
h d
ay?
Wh
en d
o y
ou
dri
nk
so
ft d
rin
ks?
Wit
h w
hat
ty
pes
of
foo
d?
Wh
y?
Wh
en m
igh
t y
ou
use
mo
re?
Las
t U
sag
eTe
ll m
e ab
ou
t th
e la
st t
ime
yo
u h
ad a
so
ft d
rin
k.
Is t
her
e an
y t
ime
wh
en y
ou
wo
uld
NO
T w
ant
a so
ft d
rin
k?
Dis
cuss
.
W
hy
wo
uld
yo
u n
ot
wan
t a
soft
dri
nk
th
en?
Wh
y?
Wh
at w
ou
ld y
ou
hav
e to
dri
nk
in
stea
d?
Wh
y?
Wh
at k
ind
s o
f so
ft d
rin
ks
do
yo
u d
rin
k r
egu
larl
y?
Reg
ula
r v.
Die
t.W
hy
do
yo
u d
rin
k t
hes
e ty
pes
? C
ola
v. N
on
-Co
laW
hy
do
yo
u d
rin
k t
hes
e ty
pes
?
Wh
at’s
yo
ur
fav
ori
te s
oft
dri
nk
? W
hy
? So
me
peo
ple
are
co
nce
rned
ab
ou
t th
e am
ou
nt
of
sug
ar i
n r
egu
lar
soft
dri
nk
s. W
hat
are
yo
ur
tho
ug
hts
? W
hy
?
Die
t C
ola
Bra
nd
sB
ran
d I
mag
e

I’m
go
ing
to
rea
d y
ou
th
e n
ame
of
a so
ft d
rin
k a
nd
I w
ant
yo
u t
o t
ell
me
the
imag
e o
r w
ord
th
at
com
es t
o m
ind
wh
en y
ou
hea
r th
at b
ran
d. W
hy
?
D
iet
Co
ke
D
iet
Co
ke
wit
h S
ple
nd
aC
ok
e Z
ero
Die
t P
epsi
P
epsi
On
e W
hat
kin
d o
f p
erso
n d
rin
ks
the
foll
ow
ing
bra
nd
s? W
hy
?
Die
t C
ok
e
Die
t C
ok
e w
ith
Sp
len
da
C
ok
e Z
ero
D
iet
Pep
si
Pep
si O
ne
Bra
nd
Tri
alH
ave
yo
u t
ried
th
e fo
llo
win
g b
ran
d?
Wh
y d
id y
ou
or
wh
y d
id y
ou
no
t tr
y t
he
bra
nd
?W
hat
did
yo
u t
hin
k o
f it
?W
as i
t fo
r so
meo
ne
lik
e y
ou
? W
hy
or
wh
y n
ot?
D
iet
Co
ke
D
iet
Co
ke
wit
h S
ple
nd
a
Co
ke
Zer
o
Die
t P
epsi
P
epsi
On
e
Per
cep
tio
n o
f C
ok
e Z
ero
Wh
at M
akes
Co
ke
Zer
o d
iffe
ren
t fr
om
oth
er c
ola
s? W
hy
do
yo
u t
hin
k t
hat
? H
ow
is
it l
ike
oth
er c
ola
s? W
hy
do
yo
u t
hin
k t
hat
?
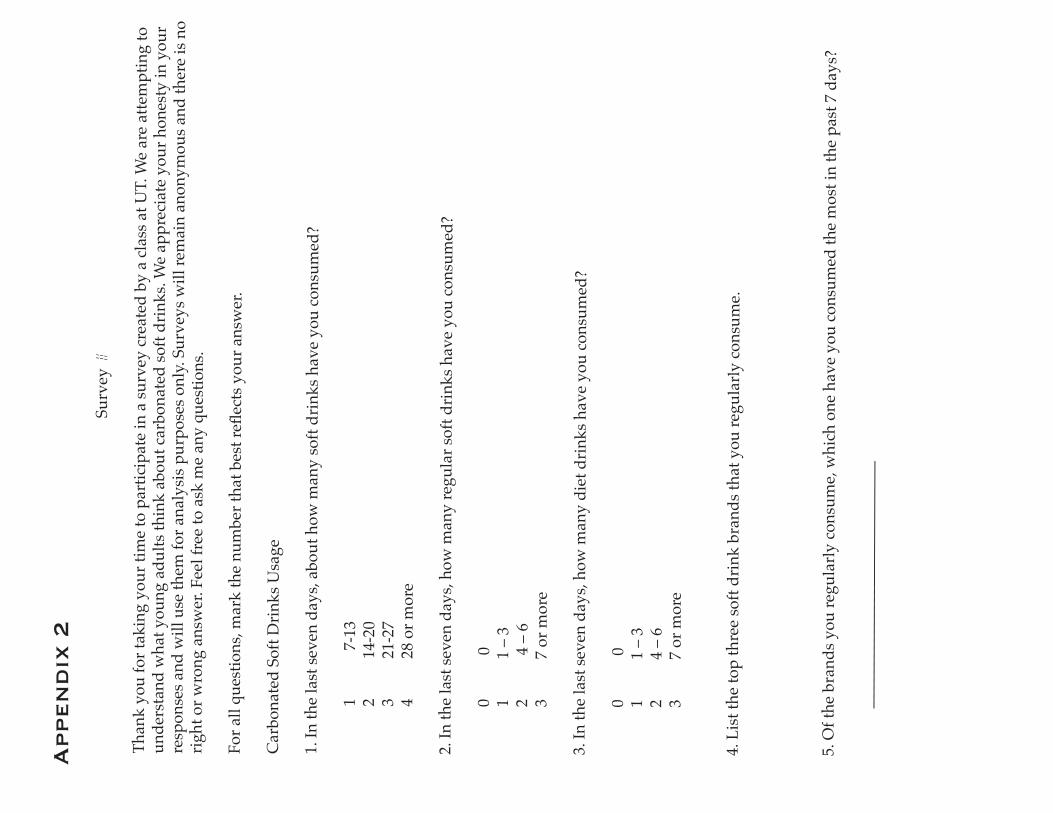
Appen
dix
2
Su
rvey
#
Th
ank
yo
u f
or
tak
ing
yo
ur
tim
e to
par
tici
pat
e in
a s
urv
ey c
reat
ed b
y a
cla
ss a
t U
T. W
e ar
e at
tem
pti
ng
to
u
nd
erst
and
wh
at y
ou
ng
ad
ult
s th
ink
ab
ou
t ca
rbo
nat
ed s
oft
dri
nk
s. W
e ap
pre
ciat
e y
ou
r h
on
esty
in
yo
ur
resp
on
ses
and
wil
l u
se t
hem
fo
r an
aly
sis
pu
rpo
ses
on
ly. S
urv
eys
wil
l re
mai
n a
no
ny
mo
us
and
th
ere
is n
o
rig
ht
or
wro
ng
an
swer
. Fee
l fr
ee t
o a
sk m
e an
y q
ues
tio
ns.
Fo
r al
l q
ues
tio
ns,
mar
k t
he
nu
mb
er t
hat
bes
t re
flec
ts y
ou
r an
swer
.
Car
bo
nat
ed S
oft
Dri
nk
s U
sag
e
1. I
n t
he
last
sev
en d
ays,
ab
ou
t h
ow
man
y s
oft
dri
nk
s h
ave
yo
u c
on
sum
ed?
1
7-1
3
2 14
-20
3
21-2
7
4 28
or
mo
re
2. I
n t
he
last
sev
en d
ays,
ho
w m
any
reg
ula
r so
ft d
rin
ks
hav
e y
ou
co
nsu
med
?
0
0
1 1
– 3
2
4 –
6
3 7
or
mo
re
3. I
n t
he
last
sev
en d
ays,
ho
w m
any
die
t d
rin
ks
hav
e y
ou
co
nsu
med
?
0
0
1 1
– 3
2
4 –
6
3 7
or
mo
re
4. L
ist
the
top
th
ree
soft
dri
nk
bra
nd
s th
at y
ou
reg
ula
rly
co
nsu
me.
5. O
f th
e b
ran
ds
yo
u r
egu
larl
y c
on
sum
e, w
hic
h o
ne
hav
e y
ou
co
nsu
med
th
e m
ost
in
th
e p
ast
7 d
ays?
____
____
____
____
____
____
____
___

Att
itu
des
/ B
elie
fs a
bo
ut
Car
bo
nat
ed S
oft
Dri
nk
s
1.
Ho
w i
mp
ort
ant
do
yo
u c
on
sid
er t
he
foll
ow
ing
qu
alit
ies
wh
en c
ho
osi
ng
a c
arb
on
ated
so
ft d
rin
k?
Ver
y
Ver
y
Un
imp
ort
ant
N
eith
er
Im
po
rtan
tTa
ste
1 2
3 4
5Su
gar
Lev
el
1
2 3
4 5
Cal
ori
es
1
2 3
4 5
Av
aila
bil
ity
1 2
3 4
5P
rice
1
2 3
4 5
Rep
uta
tio
n/
Bra
nd
Im
age
1
2 3
4 5
Lat
est
Tren
d/
Po
pu
lari
ty
1
2 3
4 5
Dis
pla
y
1
2 3
4 5
Bo
ttle
/C
an D
esig
n
1 2
3 4
5C
arb
oh
yd
rate
Co
un
t
1 2
3 4
5H
abit
/W
hat
I g
rew
up
wit
h
1 2
3 4
5
2.
Ple
ase
mar
k h
ow
mu
ch y
ou
ag
ree
or
dis
agre
e w
ith
th
e fo
llo
win
g s
tate
men
ts.
If y
ou
fee
l y
ou
ca
n’t
an
swer
a p
arti
cula
r q
ues
tio
n, s
kip
it
and
go
on
to
th
e n
ext.
Stro
ng
ly
S
tro
ng
ly
Dis
agre
e
N
eith
er
Ag
ree
Reg
ula
r so
ft d
rin
ks
tast
e to
o s
ug
ary.
1 2
3 4
5D
iet
soft
dri
nk
s u
sual
ly t
aste
lik
e th
e o
rig
inal
bev
erag
e.
1 2
3 4
5R
egu
lar
soft
dri
nk
s h
ave
a st
ron
ger
flav
or
than
die
t so
ft d
rin
ks.
1 2
3 4
5D
iet
soft
dri
nk
s h
ave
a b
ad a
fter
tas
te.
1
2 3
4 5
Th
e su
gar
co
nte
nt
in r
egu
lar
soft
dri
nk
s d
oes
n’t
mat
ter
to m
e.
1
2 3
4 5
Die
t so
ft d
rin
ks
are
for
old
er g
ener
atio
ns.
1
2 3
4 5
Reg
ula
r so
ft d
rin
ks
tast
e b
ette
r th
an d
iet
soft
dri
nk
s.
1
2 3
4 5
Die
t so
ft d
rin
ks
are
mai
nly
fo
r fe
mal
es.
1
2 3
4 5
Dri
nk
ing
die
t so
ft d
rin
ks
hel
ps
me
feel
hea
lth
ier.
1 2
3 4
5

Co
ke
Zer
o T
rial
1. H
ave
yo
u e
ver
tri
ed C
ok
e Z
ero
? 1
Yes
0 N
o (
Go
to
th
e se
ctio
n b
elo
w)
2.
Wh
at d
id y
ou
th
ink
ab
ou
t th
e ta
ste
of
Co
ke
Zer
o?
Ver
y
Ok
ay
V
ery
Bad
Go
od
1 2
3 4
5
Let
me
kn
ow
th
at y
ou
are
rea
dy
to
see
th
e C
ok
e Z
ero
co
mm
erci
als
in o
rder
to
co
mp
lete
th
e re
st o
f
the
surv
ey.
Yo
u w
ill
be
sho
wn
tw
o t
elev
isio
n a
dv
erti
sem
ents
an
d y
ou
wil
l h
ave
the
op
po
rtu
nit
y t
o
cho
ose
on
e o
f fo
ur
rad
io a
dv
erti
sem
ents
to
lis
ten
to
.
Ev
alu
atio
n o
f C
ok
e Z
ero
Ad
ver
tise
men
ts
Bas
ed o
n t
he
adv
erti
sem
ents
yo
u h
ave
seen
, ple
ase
answ
er t
he
foll
ow
ing
qu
esti
on
s.
1. A
fter
vie
win
g t
he
thre
e ad
ver
tise
men
ts f
or
Co
ke
Zer
o w
hat
was
th
e m
ain
id
ea/
mes
sag
e y
ou
thin
k t
he
ads
was
try
ing
to
co
nv
ey?
2. P
leas
e m
ark
ho
w m
uch
yo
u a
gre
e o
r d
isag
ree
wit
h t
he
foll
ow
ing
sta
tem
ents
.
St
ron
gly
Str
on
gly
Dis
agre
e
N
eith
er
Ag
ree
T
he
ads
des
crib
ed a
sit
uat
ion
yo
u c
an r
elat
e to
.
1
2 3
4 5
T
he
ads
wer
e ta
lkin
g t
o s
om
eon
e li
ke
me.
1
2 3
4 5
T
he
ads
wer
e ap
pro
pri
ate
for
Co
ca C
ola
.
1 2
3 4
5
T
he
ads
mak
e C
ok
e Z
ero
so
un
d d
iffe
ren
t fr
om
oth
er c
ola
s.
1 2
3 4
5
T
he
ads
targ
et a
sp
ecifi
c se
x.
1
2 3
4 5
C
ok
e Z
ero
tas
tes
lik
e re
gu
lar
Co
ke.
1
2 3
4 5
T
he
ads
wer
e b
elie
vab
le.
1
2 3
4 5
I
hav
e se
en t
he
ads
bef
ore
.
1 2
3 4
5
C
ok
e Z
ero
is
a “D
iet”
dri
nk
.
1 2
3 4
5
3. W
hat
was
yo
ur
ov
eral
l re
acti
on
to
th
e ad
s?

N
eith
erI
dis
lik
ed t
hem
a l
ot
1 2
3 4
5
I li
ked
th
em a
lo
t.
4. W
hat
, if
any
thin
g, d
id y
ou
esp
ecia
lly
lik
e ab
ou
t an
y o
f th
e ad
s?
5. W
hat
, if
any
thin
g, d
id y
ou
esp
ecia
lly
dis
lik
e ab
ou
t an
y o
f th
e ad
s?
6. H
ow
lik
ely
are
yo
u t
o c
ho
ose
Co
ke
Zer
o o
ver
V
ery
Ver
yU
nli
kel
y
May
be
L
ikel
yo
ther
reg
ula
r co
las?
1 2
3 4
5
o
ther
die
t co
las?
1
2 3
4 5
Are
yo
u:
1
Mal
e
0 F
emal
e
Th
ank
yo
u f
or
com
ple
tin
g m
y s
urv
ey!

REFERENCES
1.“100 Leading National Advertisers.” Advertising Age. 24
June 2002. 26 Sept. 2006 <www.adage.com>.
2.“100 Leading National Advertisers.” Advertising Age. 28 June
2004. 26 Sept. 2006 <www.adage.com>.
3.“All-Channel Carbonated Soft Drink Performance in 2005.”
Beverage Digest. 8 Mar. 2006. 12 Sept. 2006 <www.bev
erage-digest.com>.
4.“Apple and Pepsi to Give Away 100 Million Free Songs.”
Apple. 2003. 7 Oct. 2006 <www.apple.com>.
5.The Associated Press. “Coke to Launch New No-Calorie Soda.”
MSNBC. 13 Sept. 2006.
6.Bellis, Mary. “Introduction to Pop- The History of Soft Drinks.”
www.about.com. 7 Oct. 2006 <www.about.com>.
7.Bellis, Mary. “Food History-Beverages and Drinks.” About.
Com. 07 Oct. 2006 <www.about.com>.
8.“Beverage Consumption Among U.S. Children and Adoles
cents.” ERS Elsewhere. 2002. 17 Sept. 2006 <www.era.
usda.gov>.
9.“Bureau of Labor Statistics Data.” U.S. Department of Labor. 5
Sept. 2006 <www.data.bls.gov>.
10.Clark, Nicola. “Profile: Coke’s Local Interpreter- Cathryn
Sleight, Marketing Director GB, Coca-Cola.” (2006). 21
Sept. 2006.
11.“Coca-Cola Adds New Strand to Zero Brand to Reach Young
sters.” New Media Age. 28 July 2005. 10 Oct. 006.
12.“Coca-Cola Co. Starts New Campaign for Coke Zero.” Drug
Store News. 07 Nov. 2005. 01 Oct. 2006.
13.“Coca-Cola North America Announces Launch of “My Coke
Rewards”” The Coca-Cola Company. 28 Feb. 2006. 7 Oct.
2006 <www2.coca-cola.com/>.
14.“Coca-Cola Yields to Wal*Mart.” Private Label Buyer. 9 July
2006. 7 Sept. 2006.
15.“Coca-Cola Zero Invites Everybody to Chill.” The Coca-Cola Company.
7 Oct. 2006 <www2.coca-cola.com/>.
16.“Coke Staff Warned to Protect Secrets.” Knight-Ridder Tribune Business
News. 9 July 2006. 7 Sept. 2006.
17.“Coke Zero Beats Retail Intro on EBay.” AdWeek Southeast. 26 Apr.
2005. 7 Oct. 2006.
18.“CSDs Surf Through Rough Water.” Beverage Industry (2006). 13 Sept.
2006.
19.“Desperately Seeking Men with Extra Pounds to Shed; Cola Giants Try--
But So Far, Fail--to Mary Taste and Low Calories.” RDS Business &
Industry. 2006. 03 Oct. 2006.
20.“FAQs - Pepsi Brands.” PEPSI WORLD. 17 Sept. 2006 <www.pepsi
world.com>.
21.Hasslberger, Sepp. “Health Supreme.” News Media Explorer. 4 Sept.
2004. 5 Sept. 2006 <www.newmediaexplorer.org>.
22.Haywood, Adam. “Design Choice: Coke Zero.” Business Source Pre
mier. 26 July 2006. 29 Sept. 2006.
23.“Heritage.” The Coca-Cola Company. 7 Oct. 2006 <www2.coca-cola.
com/>.
24.“How Americans Quench Their Thirsts.” Amber Waves. Sept. 2005. 12
Sept. 2006 <www.amberwaves.com>.
25.“I Don’t Want to Sue Them. I Have No Choice.” Knight-Ridder Tribune
Business News. 15 July 2006. 7 Sept. 2006.
26.Leith, Scott. “Coca-Cola Zero Latest Entry in Diet Derby.” Knight-Rid
der Tribune Business News. 22 Mar. 2005. 1 Oct. 2006.
27.Leith, Scott. “Report: Coke Zero Likely to Have Successful Launch But
Faces Tough Environment.” Knight-Ridder Tribune Business News.
11 June 2005. 1 Oct. 2006.
28.Lovel, Jim. “Coke, Delta Decreased Ad Spending in 2002.” Atlanta
Business Chronicle. 11 Apr. 2003. 29 Sept. 2006 <www.atlanta.biz
journals.com>.
29.Macarthur, Kate. “New, Hard Reality Hits Soft Drinks.” Advertising Age.
26 June 2006. 7 Oct. 2006.
30.“News Release.” The Coca-Cola Company. 18 Sept. 2006 <www.
coca-cola.com>.
31.“ONEIFY Artist.” ONEIFY. 17 Sept. 2006 <www.oneify.com>.
32.“PEPSICO.” PepsiCo. 25 Sept. 2006 <www.pepsico.com>.
33.“Pepsi Fantasy Racing.” Pepsi Fantasy Racing. 7 Oct. 2006
<www.pepsifantasyracing.com>.
34.“Press Release: Pepsi Celebrates 20th Consecutive Super Bowl
with New Diet Pepsi Campaign.” Dow Jones Commodities
Service. 30 Jan. 2006. 16 Oct. 2006.
35.“Projection of the Total Resident Population.” U.S. Census Bu
reau. 28 Sept. 2006 <www.census.gov>.
36.Ravens, Andrew. “Coke Hopes Zero is No.1.” Knight-Ridder
Tribune Business News. 19 July 2005. 01 Oct. 2006.
37.Seckler, Valerie. “Diet Pepsi Ad Gets Image Award.” Women’s
Wear Daily. 25 May 2006. 8 Oct. 2006.
38.Sicher, John, ed. “All-Channel Carbonated Soft Drink Perfor
mance in 2005.” Beverage Digest 48 (2006). 08 Oct. 2006.
39.“Soft Drink Makers Start PR Offensive.” The Atlanta Journal-
Constitution. 2006. 1 Oct. 2006.
40.Scott, Leith. “Men Increasingly Popping Tops on Diet Sodas.”
Knight-Ridder Tribune Business News. 16 Feb. 2005. 8 Oct.
2006.
41.“Special Report: 100 Leading National Advertisers Supplement.”
Advertising Age. 26 June 2006. 16 Sept. 2006 <www.adage.
com>.
42.“Special Report: Soft Drinks.” Adweek. 25 Apr. 2005. 01 Oct.
2006.
43.“Survey: CSDs Losing Their Youthful Appeal.” Beverage World.
5 Oct. 2006 <www.beverageworld.com>.
44.“The 2006 Soft Drink Report.” Beverage Industry. 16 Mar. 2006.
7 Oct. 2006.
45.“The Candler Era.” The Coca-Cola Company. 10 Sept. 2006
<www2.coca-cola.com/>.
46.“The Coca-Cola Company.” DATAMONITOR. Apr. 2005. 28
Sept. 2006 <www.datamonitor.com>.
47.“Timeline.” About.Com. 7 Oct. 2006 <www.about.com>.
48.“Top 10 Soft Drink Review 2002 Edition.” Beverage World. 15 Mar.
2002. 7 Oct. 2006.
49.“Top 10 U.S.CSD Companies and Brands for 2003.” Beverage Digest. 5
Mar. 2004. 12 Sept. 2006 <www.beverage-digest.com>.
50.“Top 10 U.S. Soft Drink Companies and Brands for 2001.” Beverage
Digest. 28 Feb. 2002. 7 Oct. 2006 <www.beverage-digest.com>.
51.“Top Beverage Segments.” Advertising Age/Data Center. 2005. 05 Oct.
2006 <www.adage.com/datacenter>.
52.“US: Restructuring Hits CCE H1 Earnings.” (2006). 07 Oct. 2006
<www.Just-Drinks.com>.
53.“U.S. Economy At a Glance.” U.S. Department of Labor. 5 Sept. 2006
<www.bls.gov>.
54.“US Schools Hooked on Junk Food Proceeds.” Common Dreams News
Center. 27 Feb. 2001. 6 Sept. 2006 <www.commondreams.org>.
55.Wilbert, Caroline. “Coca-Cola Enterprises: Profit, Volume Increase Mod
estly.” The Atlanta Journal- Constitution 28 June 2006. 23 Sept.
2006.
56. “Future of Diet Beverages.” Beverage World. 09 Oct. 2006.
57. Cosgrove, Joanna. “Alternative beverages stay on the edge: unconven
tional flavors, formulations add flair to popular segment.” Beverage
Industry. 09 Oct. 2006.
58. “Latest Consumer Confidence Press Release.” Conference Board. 09
Oct. 2006.