coldwell banker commercial market comparison report ranks denver as top commercial real estate...
TRANSCRIPT

Top 2014
MARKETS COMPARED BY 5 FACTORS

The Coldwell Banker Commercial® brand took on the task of finding the
‘Top Markets’ for Commercial Real Estate.
Over 80 markets were ranked on
2 categories for each property sector (Office, Retail, Multi-Family),
Then 2 additional final categories:
% Change in Vacancy
from Q3 2013 and Q3 2014 within the market1
% Change in Rental Rates
from Q3 2013 and Q3 2014 within the market1
% Change in Population
from Q3 2013 and Q3 2014 within the market1
% Change in Unemployment
from Sep 2013 and Sep 2014 within the market2
1– source: Reis—market reports Q3 2014
2—source: Bureau of Labor Statistics—unemployment report Sep 2014

1. Denver, CO 2. San Francisco, CA
3. Houston, TX
4. Dallas, TX
5. San Jose, CA
6. Phoenix, AZ
7. San Antonio, TX
8. Las Vegas, NV
9. Austin, TX
10. Orange County, CA
11. Colorado Springs, CO
12. Miami, FL
12. Sacramento, CA
14. Palm Beach, FL
15. San Diego, CA
16. Fort Worth, TX
17. Fort Lauderdale, FL
18. Oakland-East Bay, CA
19. Orlando, FL
20. Atlanta, GA
21. Boston, MA
22. New York Metro, NY
23. Cincinnati, OH
23. Tampa-St. Petersburg, FL
25. Louisville, KY
26. Minneapolis, MN
27. San Bernardino/Riverside, CA
28. Los Angeles, CA
29. Dayton, OH
30. Charlotte, NC
31. Tulsa, OK
32. Omaha, NE
33. Chicago, IL
33. Seattle, WA
35. Portland, OR
36. Philadelphia, PA
37. Charleston, SC
37. Long Island, NY
39. Salt Lake City, UT
40. Columbus, OH
40. Oklahoma City, OK
42. Raleigh-Durham, NC
43. Hartford, CT
43. Nashville, TN
45. Central New Jersey, NJ
45. St. Louis, MO
47. Cleveland, OH
48. District of Columbia, DC
49. Baltimore, MD
50. Indianapolis, IN
50. Tacoma, WA
52. Pittsburgh, PA
53. Ventura County, CA
54. Knoxville, TN
55. Lexington, KY
56. Greensboro/Winston-Salem, NC
56. Suburban Virginia, VA
58. Little Rock, AR
58. Providence, RI
60. Columbia, SC
61. Memphis, TN
62. Birmingham, AL
63. Northern New Jersey, NJ
64. Westchester, NY
65. Jacksonville, FL
66. Suburban Maryland, MD
67. Detroit, MI
68. New Haven, CT
69. Syracuse, NY
70. Richmond, VA
71. Kansas City, MO
72. Buffalo, NY
73. Wichita, KS
74. Rochester, NY
75. Albuquerque, NM
76. Chattanooga, TN
77. Greenville, SC
78. Tucson, AZ
79. Milwaukee, WI
80. Fairfield County, CT
81. New Orleans, LA
82. Norfolk/Hampton Roads, VA
Top Commercial RE Markets Total

#1 Denver, CO
According to Ben Gilliam, of Coldwell Banker Commercial Alliance in Denver,
while economists downgraded expectations for the U.S. economy, Denver continues to
break records in job growth, construction and economic expansion in energy, healthcare
and technology. Additionally Denver’s multifamily market is skyrocketing in rent growth and
construction. The market is expected to exceed 9,000 new apartment units at the end of
2014.
Denver has recovered from the Great Recession and moved into expansion mode with
positive market absorption in every market segment including 1.6 million square feet in
retail, 2.7 million square feet in industrial and 1.6 million in office properties. Denver
continues to attract vigorous investment activity from the East and West Coast. It is
anticipated that with the recent grand opening of the new Union Station/Central transit hub,
Denver could see its first $1,000.00 or more per square foot investment sale around that
development in the Central Business District.
Investor confidence has led to a resurgence in development with 13 new office projects, 7
new industrial projects and 2 new retail projects in recent months. Several other projects
are in pre-leasing mode as developers continue to act in a more methodical manner to
help manage risk.
Denver expects to reach several “Rocky Mountain Highs” in real estate valuations, job
growth and development as it approaches 2015.
Ben Gilliam, Coldwell Banker Commercial Alliance, Denver, CO
Why Denver is Growing
Top Ranked Market
Office Rank
Retail Rank
MF Rank
Pop. Rank
Unemp. Rank
Cumulative Score
Final Rank
8 4 28 11 1 52 1

Metro Final
Rank
2013
Rank
Diff ‘13-
’14 Rank
Office
Rank
Retail
Rank
MF
Rank
Pop
Rank
Unemp
Rank
Cumulative
Score
Denver, CO 1 10 -9 8 4 28 11 1 52 View Listings
San Francisco, CA 2 22 -20 1 1 17 35 23 77 View Listings
Houston, TX 3 4 -1 26 13 2 8 30 79 View Listings
Dallas, TX 4 3 1 16 11 13 4 39 83 View Listings
San Jose, CA 5 14 -9 2 6 1 60 22 91 View Listings
Phoenix, AZ 6 19 -13 20 5 11 12 50 98 View Listings
San Antonio, TX 7 21 -14 21 27 41 6 20 115 View Listings
Las Vegas, NV 8 18 -10 59 18 25 7 7 116 View Listings
Austin, TX 9 7 2 10 26 55 1 31 123 View Listings
Orange County, CA 10 11 -1 5 23 16 40 43 127 View Listings
Colorado Springs, CO 11 30 -19 34 57 22 15 2 130 View Listings
Miami, FL 12 38 -26 7 15 5 52 52 131 View Listings
Sacramento, CA 12 46 -34 38 15 9 33 36 131 View Listings
Palm Beach, FL 14 15 -1 23 41 7 13 52 136 View Listings
San Diego, CA 15 6 9 14 35 30 25 33 137 View Listings
Fort Worth, TX 16 9 7 40 52 4 3 39 138 View Listings
Fort Lauderdale, FL 17 27 -10 49 2 19 20 52 142 View Listings
Oakland-East Bay, CA 18 20 -2 13 48 8 51 23 143 View Listings
Orlando, FL 19 1 18 32 10 50 2 58 152 View Listings
Atlanta, GA 20 25 -5 12 39 5 18 79 153 View Listings
Boston, MA 21 41 -20 3 20 48 28 56 155 View Listings
New York Metro, NY 22 48 -26 29 30 38 48 11 156 View Listings
Cincinnati, OH 23 51 -28 35 29 30 59 5 158 View Listings
Tampa-St. Petersburg, FL 23 31 -8 11 12 35 39 61 158 View Listings
Louisville, KY 25 47 -22 26 2 61 63 8 160 View Listings
Minneapolis, MN 26 5 21 25 30 55 34 19 163 View Listings
San Bernardino/Riverside, CA 27 43 -16 24 59 14 28 43 168 View Listings
Los Angeles, CA 28 42 -14 4 7 67 53 38 169 View Listings
Dayton, OH 29 81 -52 51 20 23 77 4 175 View Listings
Charlotte, NC 30 16 14 29 43 50 5 49 176 View Listings
Tulsa, OK 31 34 -3 53 23 30 31 41 178 View Listings
Omaha, NE 32 36 -4 26 64 3 20 69 182 View Listings
Chicago, IL 33 63 -30 21 73 19 64 6 183 View Listings
Seattle, WA 33 12 21 5 65 28 19 66 183 View Listings
Portland, OR 35 2 33 18 39 39 36 62 194 View Listings
Philadelphia, PA 36 75 -39 42 52 18 66 17 195 View Listings
Charleston, SC 37 13 24 29 23 45 23 77 197 View Listings
Long Island, NY 37 77 -40 42 33 45 66 11 197 View Listings
Salt Lake City, UT 39 17 22 46 76 41 16 26 205 View Listings
Columbus, OH 40 32 8 72 47 41 45 3 208 View Listings
Oklahoma City, OK 40 45 -5 58 52 45 22 31 208 View Listings
Top Markets: Rankings Source: Reis—market reports Q3 2014

The Dallas / Fort Worth (DFW) Metropolitan Statistical area is the fourth largest MSA in the country (behind NYC, LA, and Chicago), and over the last decade its population increased by over 1.3 million people, making it one of the fastest growing metropolitan areas in the United States. On top of this, experts project the DFW population to increase an additional 37% to over 9.2 million people by 2030. This population boom has mitigated the 2008 recession’s effect on real estate, and has provided steady business/job growth.
In late 2013, the Milken Institute ranked the DFW economy among the top 20 global economies in the world. This economy is diverse and consistently growing; it added 67,100 net new jobs last year. Also, 18 Fortune 500 companies are headquartered in the DFW Metroplex. With its steady job growth, low cost of living, broad variety of entertainment options, and rapidly growing public transportation system, the sprawling DFW Metroplex has become an attractive place to live and work.
Gary Walker, Coldwell Banker Commercial Alliance, Arlington, TX
Dallas, TX
Here are a few thoughts from independent professional agents affiliated with the Coldwell Banker
Commercial® organization on why their market is in the top 10.
San Antonio, as most of Texas, has been experiencing an unprecedented rate of domestic and foreign immigration over the past 5 years, which has helped shelter our economy from the worst effects of the downturn experienced by most of the country. The Texas political climate supports a ‘Pro-Business Environment’ encouraging business expansion and job growth.
The area has been able to maintain an unemployment rate below 6%, and now is hovering about 5.3%, for several years. A couple of the leading factors contributing to this growth are the U.S. Armed Forces, and the discovery and development of the Eagle Ford Shale, one of the leading Oil and Gas developments in recent history. San Antonio has also recently been identified as the number 1 tourist destination in Texas.
Nick Rispoli, Coldwell Banker Commercial Alamo City, San Antonio, TX
San Antonio, TX
Quotes from Top 10 Markets

Metro Final
Rank
2013
Rank
Diff ‘13-
’14 Rank
Office
Rank
Retail
Rank
MF
Rank
Pop
Rank
Unemp
Rank
Cumulative
Score
Raleigh-Durham, NC 42 8 34 36 56 52 9 57 210 View Listings
Hartford, CT 43 39 4 9 50 52 79 21 211 View Listings
Nashville, TN 43 26 17 61 67 11 30 42 211 View Listings
Central New Jersey, NJ 45 40 5 45 22 78 57 11 213 View Listings
St. Louis, MO 45 79 -34 18 28 25 72 70 213 View Listings
Cleveland, OH 47 80 -33 17 13 55 82 47 214 View Listings
District of Columbia, DC 48 66 -18 14 45 82 10 71 222 View Listings
Baltimore, MD 49 35 14 32 9 72 50 65 228 View Listings
Indianapolis, IN 50 37 13 70 74 55 24 10 233 View Listings
Tacoma, WA 50 28 22 64 37 21 45 66 233 View Listings
Pittsburgh, PA 52 67 -15 67 57 34 72 9 239 View Listings
Ventura County, CA 53 53 0 72 45 41 42 43 243 View Listings
Knoxville, TN 54 29 25 79 71 9 37 48 244 View Listings
Lexington, KY 55 72 -17 80 35 68 49 16 248 View Listings
Greensboro/Winston-Salem, NC 56 44 12 65 30 49 61 46 251 View Listings
Suburban Virginia, VA 56 58 -2 74 18 74 14 71 251 View Listings
Little Rock, AR 58 60 -2 66 37 80 40 29 252 View Listings
Providence, RI 58 69 -11 78 44 23 70 37 252 View Listings
Columbia, SC 60 55 5 38 52 68 17 78 253 View Listings
Memphis, TN 61 64 -3 46 50 62 43 55 256 View Listings
Birmingham, AL 62 62 0 76 17 35 55 74 257 View Listings
Northern New Jersey, NJ 63 52 11 41 78 66 62 11 258 View Listings
Westchester, NY 64 74 -10 69 49 75 58 11 262 View Listings
Jacksonville, FL 65 24 41 77 72 25 26 63 263 View Listings
Suburban Maryland, MD 66 71 -5 61 8 79 47 71 266 View Listings
Detroit, MI 67 61 6 42 41 39 81 64 267 View Listings
New Haven, CT 68 56 12 52 62 60 78 18 270 View Listings
Syracuse, NY 69 59 10 36 70 76 66 28 276 View Listings
Richmond, VA 70 33 37 56 59 52 38 80 285 View Listings
Kansas City, MO 71 57 14 48 80 35 44 82 289 View Listings
Buffalo, NY 72 54 18 81 34 68 74 35 292 View Listings
Wichita, KS 73 76 -3 60 82 15 76 60 293 View Listings
Rochester, NY 74 50 24 67 68 59 69 34 297 View Listings
Albuquerque, NM 75 78 -3 55 65 30 80 68 298 View Listings
Chattanooga, TN 76 82 -6 63 59 63 56 59 300 View Listings
Greenville, SC 77 23 54 54 75 71 26 76 302 View Listings
Tucson, AZ 78 68 10 81 77 63 32 51 304 View Listings
Milwaukee, WI 79 73 6 75 68 73 71 25 312 View Listings
Fairfield County, CT 80 65 15 57 79 76 75 26 313 View Listings
New Orleans, LA 81 70 11 50 81 65 65 81 342 View Listings
Norfolk/Hampton Roads, VA 82 49 33 71 63 81 54 75 344 View Listings
Top Markets: Rankings Source: Reis—market reports Q3 2014

By nearly all accounts, Greater New Orleans is a great place to live, work, and raise a family. In economic development, the area is at its highest point, in every economic ranking, in history. Recently, the state was ranked #2 Business Climate in the USA - the highest position ever. Encouragingly, talented people are voting with their feet, choosing this region to build a career and start a family.
In fact, Louisiana has enjoyed six straight years of net in-migration for the first time in decades, according to the U.S. Census Bureau. And as more and more people make New Orleans their home, their talents come with them, evidenced by the city's ranking as #1 for in-migration for workers in their prime, according to Forbes. Families can also do more with less in New Orleans, which was recently ranked in the top 5 most affordable households in the USA by Intuit as well as America's Favorite City by Travel and Leisure.
Mark Inman, JD, CCIM, Coldwell Banker Commercial TEC, New Orleans, LA
New Orleans, LA
With any survey, the results will depend on what variables you look at and how you look at them. That's why we spoke
to independent agents in a few markets ranked in the bottom 10 to get their views about the positives in their markets.
Greenville, SC is located equidistant between Atlanta and Charlotte, NC in the Charlanta Corridor, one of the mega corridors predicted to dominate future commercial activity in the US. This area is experiencing continued growth in the Office, Retail and Industrial sectors.
The Greenville/ Spartanburg markets enjoy the highest per capita foreign investment in North America as was named Top 50 Cities for Global Trade by Global Trade Magazine. This area has headquarters and manufacturing companies like Michelin, GE Energy, BMW (all X Models are produced here with 70% going abroad), Bosch and Flour, to name a few.
Greenville was named the 5th Fastest Growing U.S. City by CNN, Top Ten Best America Downtown by
Forbes and the 3rd
Strongest Job Market by Bloomberg Business. Trammell Crow has just announced a 400,000 SF mixed use project on Main Street which joins over 100 restaurants, the majority of which are unique and locally owned. Downtown Greenville is experiencing an explosion of multifamily with 1,000 units under construction and another 1,000 about to break ground. Condominiums are once again under construction along the river that bisects Main and heads over a 42 foot waterfall beneath a 380 ft. suspension bridge.
A sampling of new retail includes Anthropologie, Brooks Brothers, Orvis, Dave and Busters, Cabelas, Nordstrom Rack and Bass Pro Shops. With the completion of the Inland port, Greenville is now connected by rail to the Port of Charleston, SC and is becoming a major logistics center with truck service to 70% of the US population in one day. Currently demand exceeds supply for quality industrial space.
Brad Halter, GRI, Coldwell Banker Commercial Caine, Greenville, SC
Greenville, SC
Market Rebuttals

Office

26. Louisville, KY
26. Omaha, NE
29. Charleston, SC
29. Charlotte, NC
29. New York Metro, NY
32. Baltimore, MD
32. Orlando, FL
34. Colorado Springs, CO
35. Cincinnati, OH
36. Raleigh-Durham, NC
36. Syracuse, NY
38. Columbia, SC
38. Sacramento, CA
40. Fort Worth, TX
41. Northern New Jersey, NJ
42. Detroit, MI
42. Long Island, NY
42. Philadelphia, PA
45. Central New Jersey, NJ
46. Memphis, TN
46. Salt Lake City, UT
48. Kansas City, MO
49. Fort Lauderdale, FL
50. New Orleans, LA
51. Dayton, OH
52. New Haven, CT
53. Tulsa, OK
54. Greenville, SC
55. Albuquerque, NM
56. Richmond, VA
57. Fairfield County, CT
58. Oklahoma City, OK
59. Las Vegas, NV
60. Wichita, KS
61. Nashville, TN
62. Suburban Maryland, MD
63. Chattanooga, TN
64. Tacoma, WA
65. Greensboro/Winston-Salem, NC
66. Little Rock, AR
67. Pittsburgh, PA
67. Rochester, NY
69. Westchester, NY
70. Indianapolis, IN
71. Norfolk/Hampton Roads, VA
72. Columbus, OH
72. Ventura County, CA
74. Suburban Virginia, VA
75. Milwaukee, WI
76. Birmingham, AL
77. Jacksonville, FL
78. Providence, RI
79. Knoxville, TN
80. Lexington, KY
81. Buffalo, NY
81. Tucson, AZ
Top Commercial RE Markets OFFICE
1. San Francisco, CA 2. San Jose, CA
3. Boston, MA
4. Los Angeles, CA
5. Orange County, CA
5. Seattle, WA
7. Miami, FL
8. Denver, CO
9. Hartford, CT
10. Austin, TX
11. Tampa-St. Petersburg, FL
12. Atlanta, GA
13. Oakland-East Bay, CA
14. District of Columbia, DC
14. San Diego, CA
16. Dallas, TX
17. Cleveland, OH
18. Portland, OR
18. St. Louis, MO
20. Phoenix, AZ
21. Chicago, IL
21. San Antonio, TX
23. Palm Beach, FL
24. San Bernardino/Riverside, CA
25. Minneapolis, MN
26. Houston, TX

1) San Francisco, CA The 91-million-SF San Francisco West Bay general purpose, multi-tenant office market moved strongly ahead in Q2 of 2014. While Reis data supports the idea that the market is landlord favorable, it does not show the sort of manic conditions seen here in the past. The vacancy rate is still above 10.0%, compared with just 2.0% at year-end 1999, and rent gains over the past year have been just under 5.0%, compared with gains in excess of 50.0% in 2000 and in excess of 15.0% in 2007. Other market watchers, however, report frantic conditions. “The average asking commercial rent in San Francisco has jumped by 80.0% over the last four years and continues to grow at a very fast pace,” according to the San Francisco Business Times, making this the “hottest office real estate market by far in the Unites States and arguably in the world right now.”1 YTD $7.3 billion in sales 102 Transactions2
2) San Jose, CA Another tech boom is under way. A related boom in office development has followed in its wake. By Reis’ count, the delivery of 1.55 million SF of new competitive office product last year met with 1.78 million SF of net absorption. As the boom continued, demand fell arrears of new supply during the first half of 2014—957,000 absorbed net versus some 1.23 million SF of newly completed construction. July-August followed with 630,000 SF of new supply and 756,000 in net absorption. Included in the new supply were three buildings with a combined total of 581,400 SF completed in Sunnyvale in August for social media giant LinkedIn. A 125,000-SF fourth building at the same complex is under construction for the firm for completion in December. Other major recent deliveries include 465,800 SF in three projects at The Irvine Company’s Santa Clara Gateway in Santa Clara in April. A total of 466,000 SF completed in three phases of the development last year.1 YTD $2.0 billion in sales 59 Transactions2
3) Boston, MA The 128-million-SF Boston general purpose, multi-tenant office market paused in the second quarter of 2014, with slightly negative net absorption after a series of strongly positive quarters. Rents continued rising at a moderate pace. This market has never recovered the vitality of the 1980s and 1990s despite record employment levels, as structural trends, such as the decrease in space per worker, have offset the job gains. Limited new supply and the removal of inventory in office to residential conversions, however, have kept the market relatively healthy.1 YTD $7.3 billion in sales 131 Transactions2
4) Los Angeles, CA The 196-million-SF Los Angeles general purpose, multi-tenant office market continued to struggle forward in the second quarter. Rents showed solid quarterly growth, but vacancy remained in the double-digits, keeping the overall market performance down. The Class A rate of 14.1% is unchanged over the quarter and down 130 basis points over 12 months. The Class A space gives the appearance that the market is healthier than it is.1
YTD $6.3 billion in sales 214Transactions2
5) Orange County, CA The sluggish recent job growth seen in Orange County has been accompanied by a slowdown in demand for office space and a slow recovery overall for the market, which was badly mauled by the recession and its impacts on the large financial sector tenant base. Office-using firms have been adding employees, but at a slower pace in the last several quarters. The decline in the vacancy rate seen during the recent period has effectively stalled. Rents, however, show greater vigor, and investor acquisition of office properties has remained robust. Recent construction has consisted mainly of a couple of major build-to-suit projects; speculative development in significant volume has not returned—with the exception of a single major development under way in Newport Beach. Others, however, are moving forward.
1
YTD $1.4 billion in sales 81 Transactions2
5) Seattle, WA Citing the expanding presence of Amazon.com, a recent study by The Brookings Institution called the South Lake Union area “an example of an ‘Innovation District,’ where one major anchor tenant… draws hundreds of other businesses, retailers, residential, and commercial developments,” Moreover, a massive 3.1-millionsquare- foot, 38-story, three-tower campus is under development for the online retailer in the nearby Denny Triangle area. 1 YTD $1.2 billion in sales 56 Transactions2
Sources: 1-Reis; 2-Real Capital Analytics Top 5 Ranked Office Markets

Metro Q3 2014
Vac %
% Change
Q3 ‘13-Q3 ‘14
Vac
Rank
Asking
Rent $
%Change Rent
Q3 ‘13-Q3 ‘14
Rate
Rank
Final
Rank
San Francisco, CA 12.2 -8.27% 2 $45.92 5.10% 3 1
San Jose, CA 17.7 -4.84% 8 $33.76 6.53% 1 2
Boston, MA 13.2 -5.04% 7 $38.33 3.48% 7 3
Los Angeles, CA 14.9 -6.29% 5 $33.83 3.30% 10 4
Orange County, CA 16.7 -3.47% 15 $28.44 3.61% 6 5
Seattle, WA 13.2 -3.65% 13 $30.90 3.45% 8 5
Miami, FL 16.1 -4.73% 9 $30.92 1.54% 19 7
Denver, CO 16.9 -3.43% 16 $22.59 2.03% 13 8
Hartford, CT 20.3 -5.14% 6 $21.54 1.17% 28 9
Austin, TX 16.0 -2.44% 22 $27.11 1.99% 14 10
Tampa-St. Petersburg, FL 21.4 -3.60% 14 $21.63 1.41% 23 11
Atlanta, GA 19.7 -3.43% 16 $21.93 1.34% 24 12
Oakland-East Bay, CA 17.6 -1.68% 31 $26.81 2.09% 12 13
District of Columbia, DC 9.4 -2.08% 28 $50.99 1.74% 17 14
San Diego, CA 16.1 -1.23% 36 $29.55 3.36% 9 14
Dallas, TX 23.1 0.00% 45 $21.31 5.18% 2 16
Cleveland, OH 23.1 -3.75% 12 $18.84 0.80% 41 17
Portland, OR 13.5 -0.74% 38 $22.20 1.65% 18 18
St. Louis, MO 17.6 -1.68% 31 $20.81 1.27% 25 18
Phoenix, AZ 25.5 -0.39% 43 $22.95 1.91% 16 20
Chicago, IL 18.7 0.00% 45 $28.53 1.97% 15 21
San Antonio, TX 17.5 -3.31% 18 $20.42 0.79% 42 21
Palm Beach, FL 17.6 -7.85% 3 $28.56 0.56% 59 23
San Bernardino/Riverside, CA 23.6 -1.67% 33 $21.51 1.08% 30 24
Minneapolis, MN 16.8 -2.89% 20 $22.49 0.76% 45 25
Houston, TX 14.4 1.41% 62 $26.81 4.44% 4 26
Louisville, KY 15.5 -1.90% 30 $16.52 0.98% 36 26
Omaha, NE 15.2 -3.18% 19 $17.40 0.75% 47 26
Charleston, SC 14.3 -6.54% 4 $21.58 0.42% 66 29
Charlotte, NC 17.7 -0.56% 41 $22.16 1.14% 29 29
New York Metro, NY 9.9 2.06% 65 $63.51 3.84% 5 29
Baltimore, MD 16.5 0.00% 45 $23.68 1.20% 26 32
Orlando, FL 17.4 -4.40% 10 $21.54 0.51% 61 32
Colorado Springs, CO 18.7 -4.10% 11 $16.57 0.49% 63 34
Cincinnati, OH 20.4 -1.92% 29 $18.83 0.75% 47 35
Raleigh-Durham, NC 15.2 0.66% 58 $20.67 1.47% 21 36
Syracuse, NY 14.9 -8.59% 1 $15.97 0.00% 78 36
Columbia, SC 17.9 -2.19% 26 $16.04 0.63% 54 38
Sacramento, CA 20.8 -2.35% 23 $23.85 0.59% 57 38
Fort Worth, TX 16.5 1.23% 61 $19.92 1.48% 20 40
Northern New Jersey, NJ 18.7 0.00% 45 $28.08 0.97% 37 41
Top Markets: OFFICE RANKS Source: Reis—market reports Q3 2014

Metro Q3 2014
Vac %
% Change
Q3 ‘13-Q3 ‘14
Vac
Rank
Asking
Rent $
%Change Rent
Q3 ‘13-Q3 ‘14
Rate
Rank
Final
Rank
Detroit, MI 25.4 -1.55% 34 $19.13 0.74% 49 42
Long Island, NY 13.6 -2.16% 27 $26.97 0.60% 56 42
Philadelphia, PA 14.1 0.00% 45 $25.02 0.89% 38 42
Central New Jersey, NJ 21.7 -0.46% 42 $24.16 0.79% 42 45
Memphis, TN 23.8 0.42% 54 $18.43 1.04% 31 46
Salt Lake City, UT 17.7 1.72% 64 $18.68 1.47% 21 46
Kansas City, MO 17.4 1.16% 59 $19.51 1.19% 27 48
Fort Lauderdale, FL 19.8 0.51% 55 $25.78 1.02% 33 49
New Orleans, LA 13.4 -0.74% 38 $18.48 0.71% 51 50
Dayton, OH 26.7 0.38% 53 $14.76 0.82% 40 51
New Haven, CT 17.4 -2.25% 25 $20.91 0.38% 70 52
Tulsa, OK 16.8 -2.33% 24 $14.84 0.34% 72 53
Greenville, SC 19.5 1.56% 63 $17.02 1.01% 34 54
Albuquerque, NM 17.9 -1.10% 37 $16.33 0.49% 63 55
Richmond, VA 14.7 0.00% 45 $18.68 0.59% 57 56
Fairfield County, CT 22.2 -1.33% 35 $34.92 0.40% 69 57
Oklahoma City, OK 17.4 3.57% 72 $15.15 1.00% 35 58
Las Vegas, NV 25.8 -0.39% 43 $23.81 0.42% 66 59
Wichita, KS 17.7 0.00% 45 $14.39 0.42% 66 60
Nashville, TN 13.5 4.65% 74 $20.51 0.89% 38 61
Suburban Maryland, MD 16.3 7.24% 80 $28.52 1.03% 32 61
Chattanooga, TN 17.1 1.18% 60 $14.81 0.61% 55 63
Tacoma, WA 16.0 -0.62% 40 $20.20 0.15% 76 64
Greensboro/Winston-Salem, NC 21.9 4.78% 75 $16.55 0.79% 42 65
Little Rock, AR 12.0 0.00% 45 $15.81 0.19% 75 66
Pittsburgh, PA 16.7 6.37% 77 $21.29 0.76% 45 67
Rochester, NY 17.4 2.96% 69 $16.40 0.68% 53 67
Westchester, NY 19.2 2.67% 67 $28.72 0.56% 59 69
Indianapolis, IN 19.7 2.60% 66 $18.00 0.50% 62 70
Norfolk/Hampton Roads, VA 16.7 7.05% 79 $19.28 0.73% 50 71
Columbus, OH 18.8 0.53% 56 $18.13 0.22% 74 72
Ventura County, CA 18.5 6.94% 78 $24.42 0.70% 52 72
Suburban Virginia, VA 17.6 3.53% 71 $32.24 0.47% 65 74
Milwaukee, WI 18.9 0.53% 56 $18.98 -0.68% 83 75
Birmingham, AL 13.9 4.51% 73 $19.19 0.37% 71 76
Jacksonville, FL 21.4 2.88% 68 $18.50 -0.11% 79 77
Providence, RI 16.1 3.21% 70 $20.44 -0.63% 82 78
Knoxville, TN 15.0 4.90% 76 $16.03 0.06% 77 79
Lexington, KY 17.1 10.32% 81 $17.12 0.29% 73 80
Buffalo, NY 16.0 12.68% 82 $16.95 -0.41% 81 81
Tucson, AZ 17.5 15.13% 83 $21.36 -0.23% 80 81
Top Markets: OFFICE Cont. RANKS Source: Reis—market reports Q3 2014

Retail

27. San Antonio, TX
28. St. Louis, MO
29. Cincinnati, OH
30. Greensboro/Winston-Salem, NC
30. Minneapolis, MN
30. New York Metro, NY
33. Long Island, NY
34. Buffalo, NY
35. Lexington, KY
35. San Diego, CA
37. Little Rock, AR
37. Tacoma, WA
39. Atlanta, GA
39. Portland, OR
41. Detroit, MI
41. Palm Beach, FL
43. Charlotte, NC
44. Providence, RI
45. District of Columbia, DC
45. Ventura County, CA
47. Columbus, OH
48. Oakland-East Bay, CA
49. Westchester, NY
50. Hartford, CT
50. Memphis, TN
52. Columbia, SC
52. Fort Worth, TX
52. Oklahoma City, OK
53. Philadelphia, PA
56. Raleigh-Durham, NC
57. Colorado Springs, CO
57. Pittsburgh, PA
59. Chattanooga, TN
59. Richmond, VA
59. San Bernardino/Riverside, CA
62. New Haven, CT
63. Norfolk/Hampton Roads, VA
64. Omaha, NE
65. Albuquerque, NM
65. Seattle, WA
67. Nashville, TN
68. Milwaukee, WI
69. Rochester, NY
70. Syracuse, NY
71. Knoxville, TN
72. Jacksonville, FL
73. Chicago, IL
74. Indianapolis, IN
75. Greenville, SC
76. Salt Lake City, UT
77. Tucson, AZ
78. Northern New Jersey, NJ
79. Fairfield County, CT
80. Kansas City, MO
81. New Orleans, LA
82. Wichita, KS
Top Commercial RE Markets Retail
1. San Francisco, CA 2. Fort Lauderdale, FL
2. Louisville, KY
4. Denver, CO
5. Phoenix, AZ
6. San Jose, CA
7. Los Angeles, CA
8. Suburban Maryland, MD
9. Baltimore, MD
10. Orlando, FL
11. Dallas, TX
12. Tampa-St. Petersburg, FL
13. Cleveland, OH
13. Houston, TX
15. Miami, FL
15. Sacramento, CA
17. Birmingham, AL
18. Las Vegas, NV
18. Suburban Virginia, VA
20. Boston, MA
20. Dayton, OH
22. Central New Jersey, NJ
23. Charleston, SC
23. Orange County, CA
23. Tulsa, OK
26. Austin, TX

1) San Francisco, CA Rent gains have started to accelerate in both the West Bay’s small 9.7– million SF community-neighborhood shopping center market and the power center market, according to second quarter data from Reis. The vacancy rate is about as low as it can go, but new supply is picking up by the standards of this constricted market. Demand is currently being driven by retailers seeking either newly developed space or Class A product. The retail space added last year throughout the broader Bay Area was overwhelmingly pre-leased before completion and what little was vacant upon delivery didn’t stay empty for long.1 YTD $621million in sales 68 Transactions2
2) Fort Lauderdale, FL With favorable demand and a virtual lack of recent new construction, the health of the Broward County community-neighborhood shopping center retail market has continued to improve. With no new space delivering during the first half of 2014, net absorption ran at 162,000 SF The total for the second quarter alone was 20,000. July, also with no additions to supply, saw net absorption at 9,000 SF. Community-neighborhood sector vacancy ended the latest quarter at 10.1%, a decline of 10 basis points for the period, a loss of 60 year-over-year. The national second quarter same property rate, for the sake of perspective, was similar at 10.3%. Rent growth, running at about 2.0% per year on average over the past two years, is accelerating. At $19.57 psf and $16.64 psf, average asking and effective lease rates for the second quarter were up 0.8% each for the period, following gains at and near 1.0% the quarter before. July followed with increases of 0.1% for both mean rents and no change in the vacancy rate.1 YTD $601 million in sales 54 Transactions (Broward County) 2
2) Louisville, KY Rents posted another increase in the second quarter of 2014 in Louisville’s community neighborhood shopping center market. Reis reports asking and effective rents of $16.15 psf and $14.22 psf, up 0.8% and 0.9% from the previous quarter and up 1.3% and 1.5%, respectively, over 12 months. Monthly data from Reis show 0.3% and 0.4% asking and effective rent gains in July, followed by 0.1% gains for both measures in August. Asking and effective gains of 2.5% and 2.6% are forecast for 2014, followed by 2.9% gains by both measures in 2015. For 2016 Reis forecasts a notable 4.0% gain in asking rents1
3) Denver, CO The Denver area retail real estate market remains sluggish on the development front but is relatively healthy otherwise. Positive net absorption in the community-neighborhood shopping center market, through far from spectacular, is driving a downward trend in the vacancy rate. And power center vacancy now runs below the national same product rate. Rent growth has been mixed but substantially positive. Current and planned development, meanwhile, consist mainly of transit-oriented developments (TODs), retail components within mixed-use and residential projects, and residential expansions and redevelopment. The major exception is a 900,000-SF lifestyle center moving through the planning stages in south suburban Castle Rock. National retailers, such as Trader Joe’s and Cabela’s, have opened multiple stores in the region with more on the way—and international retailers, such as H&M and IKEA, have come as well. One observer expects an increase in speculative retail development.1
YTD $560 million in sales 71 Transactions2
4) Phoenix, AZ There may be no greater sign of the change that has taken place in the Phoenix area economy and its real estate markets than
the dramatic decline in development seen in the retail sector. Not long ago, millions of SF could be found under construction at
any given time as the expanding highway network spread through the region’s sprawling and expanding suburbs, bringing
eager and optimistic development in its wake. But barely half a million SF of retail space of all types came online last year. A
still smaller sum is expected for 2014. That said, the community-neighborhood shopping center and power center markets as
tracked by Reis show favorable, if unspectacular, trends. Vacancies are low to moderate and are declining, rent growth is
modest but positive, and construction activity is slowly (and prudently) increasing.1 YTD $707 million in sales 108 Transactions2
Sources: 1-Reis; 2-Real Capital Analytics Top 5 Ranked Retail Markets

Metro Q3 2014
Vac %
% Change
Q3 ‘13-Q3 ‘14
Vac
Rank
Asking
Rent $
%Change Rent
Q3 ‘13-Q3 ‘14
Rate
Rank
Final
Rank
San Francisco, CA 3.3 -15.38% 2 $34.12 2.90% 4 1
Fort Lauderdale, FL 10.0 -5.66% 15 $19.65 2.72% 10 2
Louisville, KY 9.3 -6.06% 14 $16.28 2.58% 11 2
Denver, CO 10.8 -7.69% 7 $17.45 2.05% 19 4
Phoenix, AZ 10.2 -6.42% 12 $19.24 2.18% 16 5
San Jose, CA 4.5 -21.05% 1 $31.89 1.69% 32 6
Los Angeles, CA 5.9 -4.84% 20 $30.22 2.44% 14 7
Suburban Maryland, MD 8.3 -6.74% 10 $25.91 1.97% 25 8
Baltimore, MD 6.4 -7.25% 8 $21.95 1.81% 29 9
Orlando, FL 12.3 -3.15% 33 $18.17 2.89% 6 10
Dallas, TX 12.8 -4.48% 22 $17.11 2.03% 21 11
Tampa-St. Petersburg, FL 11.0 -6.78% 9 $14.56 1.53% 36 12
Houston, TX 11.7 -2.50% 37 $16.86 2.80% 9 13
Cleveland, OH 14.7 -3.29% 29 $15.26 2.14% 17 13
Miami, FL 7.0 -1.41% 45 $25.18 2.90% 4 15
Sacramento, CA 11.2 -8.94% 5 $22.27 1.32% 44 15
Birmingham, AL 14.1 -6.62% 11 $14.98 1.42% 39 17
Las Vegas, NV 12.2 -2.40% 39 $21.65 2.51% 12 18
Suburban Virginia, VA 5.6 -15.15% 3 $28.23 1.18% 48 18
Boston, MA 6.5 -1.52% 44 $22.71 2.81% 8 20
Dayton, OH 15.7 -3.09% 34 $10.82 2.08% 18 20
Central New Jersey, NJ 9.8 -3.92% 23 $22.98 1.77% 31 22
Charleston, SC 10.9 0.00% 56 $13.92 2.96% 2 23
Orange County, CA 5.3 -5.36% 17 $31.56 1.35% 41 23
Tulsa, OK 15.5 -5.49% 16 $11.37 1.34% 42 23
Austin, TX 6.6 0.00% 55 $21.12 2.87% 7 26
San Antonio, TX 11.1 -1.77% 42 $15.23 2.01% 22 27
St. Louis, MO 12.2 -3.17% 32 $14.99 1.56% 35 28
Cincinnati, OH 12.5 -5.30% 18 $14.99 1.15% 50 29
Minneapolis, MN 10.9 0.00% 56 $18.31 2.40% 15 30
Greensboro/Winston-Salem, NC 11.5 -0.86% 51 $14.48 2.04% 20 30
New York Metro, NY 30
Long Island, NY 5.5 3.77% 73 $26.75 2.92% 3 33
Buffalo, NY 13.4 -3.60% 24 $12.15 1.08% 53 34
San Diego, CA 6.3 1.61% 65 $29.49 2.47% 13 35
Lexington, KY 8.3 -4.60% 21 $14.12 0.93% 57 35
Tacoma, WA 12.9 10.26% 78 $19.43 3.30% 1 37
Little Rock, AR 11.7 -7.87% 6 $12.71 0.08% 73 37
Portland, OR 7.9 -2.47% 38 $20.55 1.33% 43 39
Atlanta, GA 13.2 -5.04% 19 $17.47 0.75% 62 39
Detroit, MI 11.6 0.00% 56 $17.30 1.88% 26 41
Top Markets: Retail RANKS Source: Reis—market reports Q3 2014
Metro Q3 2014
Vac %
% Change
Q3 ‘13-Q3 ‘14
Vac
Rank
Asking
Rent $
%Change Rent
Q3 ‘13-Q3 ‘14
Rate
Rank
Final
Rank
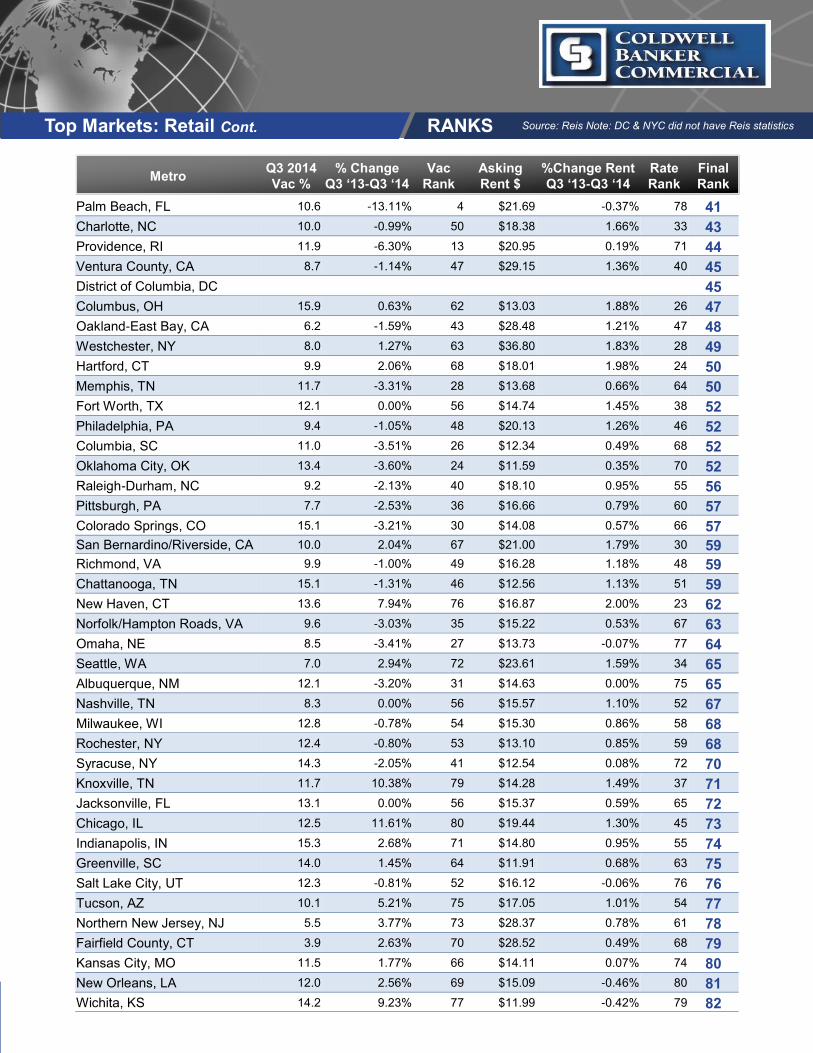
Palm Beach, FL 10.6 -13.11% 4 $21.69 -0.37% 78 41
Charlotte, NC 10.0 -0.99% 50 $18.38 1.66% 33 43
Providence, RI 11.9 -6.30% 13 $20.95 0.19% 71 44
Ventura County, CA 8.7 -1.14% 47 $29.15 1.36% 40 45
District of Columbia, DC 45
Columbus, OH 15.9 0.63% 62 $13.03 1.88% 26 47
Oakland-East Bay, CA 6.2 -1.59% 43 $28.48 1.21% 47 48
Westchester, NY 8.0 1.27% 63 $36.80 1.83% 28 49
Hartford, CT 9.9 2.06% 68 $18.01 1.98% 24 50
Memphis, TN 11.7 -3.31% 28 $13.68 0.66% 64 50
Fort Worth, TX 12.1 0.00% 56 $14.74 1.45% 38 52
Philadelphia, PA 9.4 -1.05% 48 $20.13 1.26% 46 52
Columbia, SC 11.0 -3.51% 26 $12.34 0.49% 68 52
Oklahoma City, OK 13.4 -3.60% 24 $11.59 0.35% 70 52
Raleigh-Durham, NC 9.2 -2.13% 40 $18.10 0.95% 55 56
Pittsburgh, PA 7.7 -2.53% 36 $16.66 0.79% 60 57
Colorado Springs, CO 15.1 -3.21% 30 $14.08 0.57% 66 57
San Bernardino/Riverside, CA 10.0 2.04% 67 $21.00 1.79% 30 59
Richmond, VA 9.9 -1.00% 49 $16.28 1.18% 48 59
Chattanooga, TN 15.1 -1.31% 46 $12.56 1.13% 51 59
New Haven, CT 13.6 7.94% 76 $16.87 2.00% 23 62
Norfolk/Hampton Roads, VA 9.6 -3.03% 35 $15.22 0.53% 67 63
Omaha, NE 8.5 -3.41% 27 $13.73 -0.07% 77 64
Seattle, WA 7.0 2.94% 72 $23.61 1.59% 34 65
Albuquerque, NM 12.1 -3.20% 31 $14.63 0.00% 75 65
Nashville, TN 8.3 0.00% 56 $15.57 1.10% 52 67
Milwaukee, WI 12.8 -0.78% 54 $15.30 0.86% 58 68
Rochester, NY 12.4 -0.80% 53 $13.10 0.85% 59 68
Syracuse, NY 14.3 -2.05% 41 $12.54 0.08% 72 70
Knoxville, TN 11.7 10.38% 79 $14.28 1.49% 37 71
Jacksonville, FL 13.1 0.00% 56 $15.37 0.59% 65 72
Chicago, IL 12.5 11.61% 80 $19.44 1.30% 45 73
Indianapolis, IN 15.3 2.68% 71 $14.80 0.95% 55 74
Greenville, SC 14.0 1.45% 64 $11.91 0.68% 63 75
Salt Lake City, UT 12.3 -0.81% 52 $16.12 -0.06% 76 76
Tucson, AZ 10.1 5.21% 75 $17.05 1.01% 54 77
Northern New Jersey, NJ 5.5 3.77% 73 $28.37 0.78% 61 78
Fairfield County, CT 3.9 2.63% 70 $28.52 0.49% 68 79
Kansas City, MO 11.5 1.77% 66 $14.11 0.07% 74 80
New Orleans, LA 12.0 2.56% 69 $15.09 -0.46% 80 81
Wichita, KS 14.2 9.23% 77 $11.99 -0.42% 79 82
Top Markets: Retail Cont. RANKS Source: Reis Note: DC & NYC did not have Reis statistics

Multi-Family

1. San Jose, CA 2. Houston, TX
3. Omaha, NE
4. Fort Worth, TX
5. Atlanta, GA
5. Miami, FL
7. Palm Beach, FL
8. Oakland-East Bay, CA
9. Knoxville, TN
9. Sacramento, CA
11. Nashville, TN
11. Phoenix, AZ
13. Dallas, TX
14. San Bernardino/Riverside, CA
15. Wichita, KS
16. Orange County, CA
17. San Francisco, CA
18. Philadelphia, PA
19. Chicago, IL
19. Fort Lauderdale, FL
21. Tacoma, WA
22. Colorado Springs, CO
23. Dayton, OH
23. Providence, RI
25. Jacksonville, FL
25. Las Vegas, NV
25. St. Louis, MO
28. Denver, CO
28. Seattle, WA
30. Albuquerque, NM
30. Cincinnati, OH
30. San Diego, CA
30. Tulsa, OK
34. Pittsburgh, PA
35. Birmingham, AL
35. Kansas City, MO
35. Tampa-St. Petersburg, FL
38. New York Metro, NY
39. Detroit, MI
39. Portland, OR
41. Columbus, OH
41. Salt Lake City, UT
41. San Antonio, TX
41. Ventura County, CA
45. Charleston, SC
45. Long Island, NY
45. Oklahoma City, OK
48. Boston, MA
49. Greensboro/Winston-Salem, NC
50. Charlotte, NC
50. Orlando, FL
52. Hartford, CT
52. Raleigh-Durham, NC
52. Richmond, VA
55. Austin, TX
55. Cleveland, OH
55. Indianapolis, IN
55. Minneapolis, MN
59. Rochester, NY
60. New Haven, CT
61. Louisville, KY
62. Memphis, TN
63. Chattanooga, TN
63. Tucson, AZ
65. New Orleans, LA
66. Northern New Jersey, NJ
67. Los Angeles, CA
68. Buffalo, NY
68. Columbia, SC
68. Lexington, KY
71. Greenville, SC
72. Baltimore, MD
73. Milwaukee, WI
74. Suburban Virginia, VA
75. Westchester, NY
76. Fairfield County, CT
76. Syracuse, NY
78. Central New Jersey, NJ
79. Suburban Maryland, MD
80. Little Rock, AR
81. Norfolk/Hampton Roads, VA
82. District of Columbia, DC
Top Commercial RE Markets Multi-Family

1) San Jose, CA A low development profile, an effect of land cost and approvals issues, a chronic shortage of affordable housing, and a deep reservoir of demand have for years been defining characteristics of the local apartment market. Accordingly, the unusually large market-rate completion total recorded for 2013—4,177 units—was not too much for the county’s renter base: net absorption for the year virtually duplicated the new supply total. Indeed, the market is in the midst of one of its periodic surges in development. The 578 units that completed construction in two projects through the first half of 2014 (one in San Jose, one in Mountain View) met with 1,034 units of net absorption. The recent surge of completions did little to alter the market’s longstanding low vacancy profile (indeed, vacancy barely reached 5.0% during the recession).1 YTD $1.3 billion in sales 57 Transactions2
2) Houston, TX The Houston area apartment market is in the throes of another of its heated construction cycles. In addition to the near-6,700 market-rate units that had completed construction to date in 2014 per the date of this report, more than 21,600 remained under construction. This is,
though, part of a larger picture—the robust expansion of the local economy, driven by the robust energy sector, high rates of population growth, and other demographic trends friendly to apartments. Such cycles are not new in Houston; and they tend to bring to mind the oversupply that often has followed in their wakes. While the possibility of oversupply cannot be altogether ruled out, its likelihood is not great: demand is multi-faceted and broad-based, development has been better attuned to demand, and energy sector activity, augmented by new sources of domestic extraction and other factors, seems less prone to severe volatility. Metro area vacancy is low. Rent growth is strong.1 YTD $3.3 billion in sales 185 Transactions2
3) Omaha, NE Declining for the past several years, the vacancy rate in the market-rate apartment sector slipped to 2.9% during the second quarter, the first sub- 3.0% rate recorded by Reis for this market since the 1999 inception of coverage. A quarter and four quarters prior, the rate was 30 and 10 basis points higher, respectively. Supporting the downward trend was the relative hiatus of construction deliveries seen during the first half of 2014. Thus, the 75 market-rate units that completed construction during the period (all in the 1501 Jackson Street project in May) met with 258 units of positive net absorption. Net absorption for the second quarter alone was 176 units. Rent growth reflects the tightness of the market and the strength of demand.1
4) Fort Worth, TX New supply still hasn’t caught up with strong demand in the 163,500- unit Fort Worth apartment market. The vacancy rate plunged from a peak of 11.1% in the first quarter of 2010 to just 4.9% at the end of 2013. New supply, slowed by the recession, has picked up with 778 new apartments completing construction year-to date in 2014. This includes the completion of the 306-unit Sagestone Village in Northeast Fort Worth in July and the 243-unit Enclave at Grapevine in September. But net absorption has already totaled 1,357 units year-to-date as of July. The second quarter vacancy rate was 4.4% for Class A properties, 4.5% for Class B/C, and 4.5% overall. The overall July rate was 4.4%.1
YTD $3.6 billion in sales 229 Transactions (Dallas/Ft Worth)2
5) Atlanta, GA The term “boom” is commonly employed by local observers of the present-day Atlanta apartment market. With a decided emphasis on luxury complexes and an additional emphasis on Midtown and Buckhead, under construction and planning totals continue to rise. Not surprisingly, the notion of a potential supply bubble also enters the conversation. To date, the data show no signs of weakness. Demand runs well ahead of same term new supply. Vacancy, while not dramatically low, is healthy and declining. And rents show hefty year-over-year gains. As with all construction cycles, however, the future, dependent on ongoing absorption, hangs in the balance. Stil l, while 2014’s construction completion total will be greater than that recorded for 2013, it will not be large by historical norms for this market.1 YTD $3.4 billion in sales 146 Transactions2
5) Miami, FL Running against the national grain, condo construction remains at the forefront of Miami-Dade multifamily development. Only recently—well past the 2010-2011 period in which a new and robust cycle of apartment development kicked off around the country—did Miami join the party. The 2,423 market-rate units that completed construction all told last year amounted to the largest single-year total recorded by Reis for this market since 1991. Demand, however, kept pace. With development numbers low and most of the recessionary pain felt by the ownership sectors, the apartment market continued to record satisfactory occupancy numbers levels during the downturn.1 YTD $436 million in sales 66 Transactions2
Sources: 1-Reis; 2-Real Capital Analytics Top 5 Ranked Multi-Family Markets

Metro Q3 2014
Vac %
% Change
Q3 ‘13-Q3 ‘14
Vac
Rank
Asking
Rent $
%Change Rent
Q3 ‘13-Q3 ‘14
Rate
Rank
Final
Rank
San Jose, CA 2.5 -16.67% 8 $1,910 9.02% 1 1
Houston, TX 5.6 -12.50% 18 $905 4.50% 10 2
Omaha, NE 2.6 -21.21% 2 $776 3.05% 35 3
Fort Worth, TX 4.4 -13.73% 15 $804 3.47% 23 4
Miami, FL 4.0 -4.76% 39 $1,238 6.63% 5 5
Atlanta, GA 5.5 -14.06% 14 $924 3.24% 30 5
Palm Beach, FL 5.0 -9.09% 25 $1,248 3.83% 20 7
Oakland-East Bay, CA 2.6 -3.70% 44 $1,603 8.46% 2 8
Knoxville, TN 4.2 -16.00% 11 $646 3.03% 36 9
Sacramento, CA 2.4 -31.43% 1 $999 2.78% 46 9
Nashville, TN 4.1 -4.65% 40 $865 4.47% 11 11
Phoenix, AZ 5.0 -7.41% 30 $825 3.51% 21 11
Dallas, TX 4.9 -3.92% 42 $936 4.46% 12 13
San Bernardino/Riverside, CA 3.0 -14.29% 13 $1,123 2.84% 44 14
Wichita, KS 3.5 -20.45% 4 $568 2.53% 54 15
Orange County, CA 2.5 -19.35% 5 $1,667 2.52% 55 16
San Francisco, CA 3.2 3.23% 59 $2,291 8.42% 3 17
Philadelphia, PA 3.4 -5.56% 36 $1,143 3.35% 27 18
Chicago, IL 3.5 -5.41% 38 $1,178 3.42% 26 19
Fort Lauderdale, FL 3.9 -7.14% 32 $1,215 3.14% 32 19
Tacoma, WA 3.6 -16.28% 9 $832 2.46% 56 21
Colorado Springs, CO 3.5 -7.89% 29 $780 2.90% 41 22
Providence, RI 2.6 -16.13% 10 $1,298 2.12% 62 23
Dayton, OH 4.9 -16.95% 7 $673 1.97% 65 23
Jacksonville, FL 6.7 -1.47% 50 $867 3.46% 24 25
St. Louis, MO 4.5 -10.00% 23 $790 2.73% 51 25
Las Vegas, NV 5.2 -13.33% 16 $873 2.34% 58 25
Denver, CO 4.0 11.11% 71 $1,065 7.36% 4 28
Seattle, WA 4.5 9.76% 69 $1,256 6.26% 6 28
San Diego, CA 2.5 -3.85% 43 $1,474 3.08% 34 30
Cincinnati, OH 3.3 -5.71% 35 $782 2.89% 42 30
Tulsa, OK 5.6 -8.20% 28 $636 2.75% 49 30
Albuquerque, NM 3.4 -20.93% 3 $764 1.60% 74 30
Pittsburgh, PA 3.2 3.23% 59 $931 4.02% 19 34
Birmingham, AL 6.1 5.17% 63 $797 4.18% 16 35
Kansas City, MO 4.4 0.00% 51 $775 3.33% 28 35
Tampa-St. Petersburg, FL 4.4 -6.38% 34 $914 2.81% 45 35
New York Metro, NY 2.7 12.50% 73 $3,282 5.16% 7 38
Portland, OR 3.3 6.45% 66 $958 4.24% 15 39
Detroit, MI 3.1 -18.42% 6 $894 1.59% 75 39
Columbus, OH 4.9 4.26% 62 $768 3.50% 22 41
Top Markets: Multi-Family RANKS Source: Reis—market reports Q3 2014

Metro Q3 2014
Vac %
% Change
Q3 ‘13-Q3 ‘14
Vac
Rank
Asking
Rent $
%Change Rent
Q3 ‘13-Q3 ‘14
Rate
Rank
Final
Rank
Salt Lake City, UT 4.1 0.00% 51 $828 3.11% 33 41
Ventura County, CA 2.8 -3.45% 46 $1,511 3.00% 38 41
San Antonio, TX 5.4 -3.57% 45 $803 2.95% 39 41
Charleston, SC 5.4 20.00% 77 $881 5.01% 8 45
Oklahoma City, OK 4.9 -10.91% 21 $606 2.02% 64 45
Long Island, NY 3.0 -11.76% 19 $1,680 1.88% 66 45
Boston, MA 4.2 10.53% 70 $1,957 4.15% 17 48
Greensboro/Winston-Salem, NC 5.3 -11.67% 20 $708 1.87% 68 49
Orlando, FL 5.3 6.00% 65 $957 3.46% 24 50
Charlotte, NC 4.9 2.08% 58 $897 3.22% 31 50
Raleigh-Durham, NC 6.4 56.10% 82 $915 4.57% 9 52
Richmond, VA 4.4 -4.35% 41 $862 2.74% 50 52
Hartford, CT 2.5 -10.71% 22 $1,061 1.82% 69 52
Austin, TX 5.3 23.26% 79 $1,015 4.42% 13 55
Minneapolis, MN 3.2 23.08% 78 $1,085 4.33% 14 55
Indianapolis, IN 6.0 -1.64% 49 $751 2.88% 43 55
Cleveland, OH 2.7 -15.63% 12 $787 1.42% 80 55
Rochester, NY 2.8 -6.67% 33 $843 2.18% 60 59
New Haven, CT 2.1 -8.70% 26 $1,190 1.80% 70 60
Louisville, KY 5.7 29.55% 80 $728 4.15% 17 61
Memphis, TN 8.5 0.00% 51 $742 2.77% 47 62
Tucson, AZ 5.8 0.00% 51 $708 2.76% 48 63
Chattanooga, TN 4.1 -12.77% 17 $687 1.03% 82 63
New Orleans, LA 5.6 -9.68% 24 $921 1.54% 76 65
Northern New Jersey, NJ 4.2 16.67% 74 $1,659 3.30% 29 66
Los Angeles, CA 3.2 0.00% 51 $1,521 2.70% 52 67
Buffalo, NY 3.0 0.00% 51 $797 2.57% 53 68
Columbia, SC 6.4 -7.25% 31 $770 1.72% 73 68
Lexington, KY 5.4 -8.47% 27 $696 1.46% 77 68
Greenville, SC 4.8 6.67% 68 $717 3.02% 37 71
Baltimore, MD 3.8 -2.56% 48 $1,121 2.19% 59 72
Milwaukee, WI 3.4 -5.56% 36 $906 1.46% 77 73
Suburban Virginia, VA 4.3 19.44% 75 $1,647 2.94% 40 74
Westchester, NY 3.0 -3.23% 47 $1,989 1.07% 81 75
Fairfield County, CT 5.5 12.24% 72 $1,942 2.37% 57 76
Syracuse, NY 3.3 6.45% 66 $756 2.02% 63 76
Central New Jersey, NJ 2.8 3.70% 61 $1,248 1.79% 72 78
Suburban Maryland, MD 4.0 5.26% 64 $1,417 1.80% 70 79
Little Rock, AR 6.7 1.52% 57 $704 1.44% 79 80
Norfolk/Hampton Roads, VA 4.9 19.51% 76 $951 2.15% 61 81
District of Columbia, DC 6.4 33.33% 81 $1,569 1.88% 66 82
Top Markets: Multi-Family Cont. RANKS Source: Reis—market reports Q3 2014

Population

26. Jacksonville, FL
28. Boston, MA
28. San Bernardino/Riverside, CA
30. Nashville, TN
31. Tulsa, OK
32. Tucson, AZ
33. Sacramento, CA
34. Minneapolis, MN
35. San Francisco, CA
36. Portland, OR
37. Knoxville, TN
38. Richmond, VA
39. Tampa-St. Petersburg, FL
40. Little Rock, AR
40. Orange County, CA
42. Ventura County, CA
43. Memphis, TN
44. Kansas City, MO
45. Columbus, OH
45. Tacoma, WA
47. Suburban Maryland, MD
48. New York Metro, NY
49. Lexington, KY
50. Baltimore, MD
51. Oakland-East Bay, CA
52. Miami, FL
53. Los Angeles, CA
54. Norfolk/Hampton Roads, VA
55. Birmingham, AL
56. Chattanooga, TN
57. Central New Jersey, NJ
58. Westchester, NY
59. Cincinnati, OH
60. San Jose, CA
61. Greensboro/Winston-Salem, NC
62. Northern New Jersey, NJ
63. Louisville, KY
64. Chicago, IL
65. New Orleans, LA
66. Long Island, NY
66. Philadelphia, PA
66. Syracuse, NY
69. Rochester, NY
70. Providence, RI
71. Milwaukee, WI
72. Pittsburgh, PA
72. St. Louis, MO
74. Buffalo, NY
75. Fairfield County, CT
76. Wichita, KS
77. Dayton, OH
78. New Haven, CT
79. Hartford, CT
80. Albuquerque, NM
81. Detroit, MI
82. Cleveland, OH
Top Commercial RE Markets Population
1. Austin, TX 2. Orlando, FL
3. Fort Worth, TX
4. Dallas, TX
5. Charlotte, NC
6. San Antonio, TX
7. Las Vegas, NV
8. Houston, TX
9. Raleigh-Durham, NC
10. District of Columbia, DC
11. Denver, CO
12. Phoenix, AZ
13. Palm Beach, FL
14. Suburban Virginia, VA
15. Colorado Springs, CO
16. Salt Lake City, UT
17. Columbia, SC
18. Atlanta, GA
19. Seattle, WA
20. Fort Lauderdale, FL
20. Omaha, NE
22. Oklahoma City, OK
23. Charleston, SC
24. Indianapolis, IN
25. San Diego, CA
26. Greenville, SC

Metro Population %Change Pop
Q3 ‘13-Q3 ‘14
Pop
Rank
Austin, TX 1,942,550 2.53% 1
Orlando, FL 2,327,570 2.15% 2
Fort Worth, TX 2,306,050 2.06% 3
Dallas, TX 4,618,350 2.01% 4
Charlotte, NC 1,911,050 1.93% 5
San Antonio, TX 2,331,740 1.91% 6
Las Vegas, NV 2,071,420 1.81% 7
Houston, TX 6,482,710 1.79% 8
Raleigh-Durham, NC 1,790,610 1.75% 9
District of Columbia, DC 660,830 1.74% 10
Denver, CO 2,757,390 1.73% 11
Phoenix, AZ 4,486,980 1.67% 12
Palm Beach, FL 1,399,080 1.65% 13
Suburban Virginia, VA 2,855,150 1.52% 14
Colorado Springs, CO 690,840 1.50% 15
Salt Lake City, UT 1,780,960 1.43% 16
Columbia, SC 807,490 1.39% 17
Atlanta, GA 5,591,260 1.32% 18
Seattle, WA 2,835,870 1.30% 19
Fort Lauderdale, FL 1,866,010 1.22% 20
Omaha, NE 908,640 1.22% 20
Oklahoma City, OK 1,339,490 1.19% 22
Charleston, SC 722,510 1.16% 23
Indianapolis, IN 1,849,750 1.15% 24
San Diego, CA 3,255,630 1.11% 25
Jacksonville, FL 1,411,660 1.00% 26
Greenville, SC 1,156,130 1.00% 26
Boston, MA 4,313,720 0.98% 28
San Bernardino/Riverside, CA 4,434,610 0.98% 28
Nashville, TN 1,695,110 0.98% 30
Tulsa, OK 973,560 0.97% 31
Tucson, AZ 1,003,830 0.95% 32
Sacramento, CA 2,241,940 0.94% 33
Minneapolis, MN 3,430,610 0.92% 34
San Francisco, CA 1,864,210 0.91% 35
Portland, OR 2,338,700 0.90% 36
Knoxville, TN 722,540 0.86% 37
Richmond, VA 1,310,660 0.85% 38
Tampa-St. Petersburg, FL 2,898,460 0.81% 39
Orange County, CA 3,145,690 0.80% 40
Little Rock, AR 731,590 0.80% 40
Top Markets: Population RANKS Source: Reis—market reports Q3 2014

Metro Population %Change Pop
Q3 ‘13-Q3 ‘14
Pop
Rank
Ventura County, CA 847,820 0.78% 42
Memphis, TN 1,345,920 0.76% 43
Kansas City, MO 2,099,340 0.74% 44
Columbus, OH 1,919,930 0.73% 45
Tacoma, WA 827,170 0.73% 45
Suburban Maryland, MD 2,405,750 0.72% 47
New York Metro, NY 8,899,040 0.71% 48
Lexington, KY 493,610 0.70% 49
Baltimore, MD 2,793,890 0.67% 50
Oakland-East Bay, CA 2,694,760 0.63% 51
Miami, FL 2,635,310 0.60% 52
Los Angeles, CA 10,091,810 0.59% 53
Norfolk/Hampton Roads, VA 1,714,980 0.59% 54
Birmingham, AL 1,148,420 0.58% 55
Chattanooga, TN 545,520 0.57% 56
Central New Jersey, NJ 2,762,630 0.56% 57
Westchester, NY 972,620 0.51% 58
Cincinnati, OH 2,166,640 0.50% 59
San Jose, CA 1,931,550 0.49% 60
Greensboro/Winston-Salem, NC 1,390,710 0.47% 61
Northern New Jersey, NJ 4,278,950 0.44% 62
Louisville, KY 1,317,640 0.36% 63
Chicago, IL 7,991,250 0.31% 64
New Orleans, LA 1,223,570 0.29% 65
Syracuse, NY 663,990 0.24% 66
Long Island, NY 2,860,910 0.24% 66
Philadelphia, PA 5,333,590 0.24% 66
Rochester, NY 1,060,580 0.19% 69
Providence, RI 1,607,470 0.16% 70
Milwaukee, WI 1,571,810 0.12% 71
St. Louis, MO 2,851,700 0.04% 72
Pittsburgh, PA 2,362,130 0.04% 72
Buffalo, NY 1,134,710 0.03% 74
Fairfield County, CT 939,960 0.01% 75
Wichita, KS 629,310 0.00% 76
Dayton, OH 980,170 -0.02% 77
New Haven, CT 862,120 -0.05% 78
Hartford, CT 1,214,710 -0.06% 79
Albuquerque, NM 900,490 -0.18% 80
Detroit, MI 4,434,180 -0.21% 81
Cleveland, OH 2,055,040 -0.37% 82
Top Markets: Population Cont. RANKS Source: Reis—market reports Q3 2014

Unemployment

26. Salt Lake City, UT
28. Syracuse, NY
29. Little Rock, AR
30. Houston, TX
31. Austin, TX
31. Oklahoma City, OK
33. San Diego, CA
34. Rochester, NY
35. Buffalo, NY
36. Sacramento, CA
37. Providence, RI
38. Los Angeles, CA
39. Dallas, TX
39. Fort Worth, TX
41. Tulsa, OK
42. Nashville, TN
43. Orange County, CA
43. San Bernardino/Riverside, CA
43. Ventura County, CA
46. Greensboro/Winston-Salem, NC
47. Cleveland, OH
48. Knoxville, TN
49. Charlotte, NC
50. Phoenix, AZ
51. Tucson, AZ
52. Fort Lauderdale, FL
52. Miami, FL
52. Palm Beach, FL
55. Memphis, TN
56. Boston, MA
57. Raleigh-Durham, NC
58. Orlando, FL
59. Chattanooga, TN
60. Wichita, KS
61. Tampa-St. Petersburg, FL
62. Portland, OR
63. Jacksonville, FL
64. Detroit, MI
65. Baltimore, MD
66. Seattle, WA
66. Tacoma, WA
68. Albuquerque, NM
69. Omaha, NE
70. St. Louis, MO
71. District of Columbia, DC
71. Suburban Maryland, MD
71. Suburban Virginia, VA
74. Birmingham, AL
75. Norfolk/Hampton Roads, VA
76. Greenville, SC
77. Charleston, SC
78. Columbia, SC
79. Atlanta, GA
80. Richmond, VA
81. New Orleans, LA
82. Kansas City, MO
Top Commercial RE Markets Unemployment
1. Denver, CO 2. Colorado Springs, CO
3. Columbus, OH
4. Dayton, OH
5. Cincinnati, OH
6. Chicago, IL
7. Las Vegas, NV
8. Louisville, KY
9. Pittsburgh, PA
10. Indianapolis, IN
11. Central New Jersey, NJ
11. Long Island, NY
11. New York Metro, NY
11. Northern New Jersey, NJ
11. Westchester, NY
16. Lexington, KY
17. Philadelphia, PA
18. New Haven, CT
19. Minneapolis, MN
20. San Antonio, TX
21. Hartford, CT
22. San Jose, CA
23. Oakland-East Bay, CA
23. San Francisco, CA
25. Milwaukee, WI
26. Fairfield County, CT

Metro MSA Sep 13
Unemp
Sep 14
Unemp
Change
in Unemp
Unemp
Rank
Denver, CO Denver-Aurora-Broomfield, CO 6.2 4 -35.48% 1
Colorado Springs, CO Colorado Springs, CO 7.5 5.1 -32.00% 2
Columbus, OH Columbus, OH 6.3 4.3 -31.75% 3
Dayton, OH Dayton, OH 7.5 5.2 -30.67% 4
Cincinnati, OH Cincinnati-Middletown, OH-KY-IN 6.9 4.8 -30.43% 5
Chicago, IL Chicago-Joliet-Naperville, IL-IN-WI 8.4 6.1 -27.38% 6
Las Vegas, NV Las Vegas-Paradise, NV 9.7 7.1 -26.80% 7
Louisville, KY Louisville-Jefferson County, KY-IN 7.4 5.5 -25.68% 8
Pittsburgh, PA Pittsburgh, PA 6.1 4.6 -24.59% 9
Indianapolis, IN Indianapolis-Carmel, IN 6.3 4.8 -23.81% 10
Central New Jersey, NJ New York-N. New Jersey-Long Island, NY-NJ-PA 7.6 5.8 -23.68% 11
Long Island, NY New York-N. New Jersey-Long Island, NY-NJ-PA 7.6 5.8 -23.68% 11
New York Metro, NY New York-N. New Jersey-Long Island, NY-NJ-PA 7.6 5.8 -23.68% 11
Northern New Jersey, NJ New York-N. New Jersey-Long Island, NY-NJ-PA 7.6 5.8 -23.68% 11
Westchester, NY New York-N. New Jersey-Long Island, NY-NJ-PA 7.6 5.8 -23.68% 11
Lexington, KY Lexington-Fayette, KY 6.5 5 -23.08% 16
Philadelphia, PA Philadelphia-Camden-Wilmington, PA-NJ-DE-MD 7.4 5.7 -22.97% 17
New Haven, CT New Haven, CT Metropolitan NECTA 7.8 6.1 -21.79% 18
Minneapolis, MN Minneapolis-St. Paul-Bloomington, MN-WI 4.6 3.6 -21.74% 19
San Antonio, TX San Antonio-New Braunfels, TX 6 4.7 -21.67% 20
Hartford, CT Hartford-West Hartford-East Hartford, CT NECTA 7.5 5.9 -21.33% 21
San Jose, CA San Jose-Sunnyvale-Santa Clara, CA 6.6 5.2 -21.21% 22
Oakland-East Bay, CA San Francisco-Oakland-Fremont, CA 6.3 5 -20.63% 23
San Francisco, CA San Francisco-Oakland-Fremont, CA 6.3 5 -20.63% 23
Milwaukee, WI Milwaukee-Waukesha-West Allis, WI 6.8 5.4 -20.59% 25
Fairfield County, CT Bridgeport-Stamford-Norwalk, CT NECTA 7 5.6 -20.00% 26
Salt Lake City, UT Salt Lake City, UT 4 3.2 -20.00% 26
Syracuse, NY Syracuse, NY 7.1 5.7 -19.72% 28
Little Rock, AR Little Rock-North Little Rock-Conway, AR 6.6 5.3 -19.70% 29
Houston, TX Houston-Sugar Land-Baytown, TX 6.1 4.9 -19.67% 30
Austin, TX Austin-Round Rock-San Marcos, TX 5.2 4.2 -19.23% 31
Oklahoma City, OK Oklahoma City, OK 5.2 4.2 -19.23% 31
San Diego, CA San Diego-Carlsbad-San Marcos, CA 7.3 5.9 -19.18% 33
Rochester, NY Rochester, NY 6.8 5.5 -19.12% 34
Buffalo, NY Buffalo-Niagara Falls, NY 7 5.7 -18.57% 35
Sacramento, CA Sacramento--Arden-Arcade--Roseville, CA 8.1 6.6 -18.52% 36
Providence, RI Providence-Fall River-Warwick, RI-MA NECTA 9.2 7.5 -18.48% 37
Los Angeles, CA Los Angeles-Long Beach-Santa Ana, CA 8.7 7.1 -18.39% 38
Dallas, TX Dallas-Fort Worth-Arlington, TX 6.1 5 -18.03% 39
Fort Worth, TX Dallas-Fort Worth-Arlington, TX 6.1 5 -18.03% 39
Tulsa, OK Tulsa, OK 5.6 4.6 -17.86% 41
Top Markets: Unemployment RANKS Source: Bureau of Labor Statistics—unemployment report Sep 2014

Metro MSA Sep 13
Unemp
Sep 14
Unemp
Change in Unemp
Unemp Rank
Nashville, TN Nashville-Davidson--Franklin, TN 6.4 5.3 -17.19% 42
Orange County, CA Riverside-San Bernardino-Ontario, CA 9.9 8.2 -17.17% 43
San Bernardino/Riverside, CA Riverside-San Bernardino-Ontario, CA 9.9 8.2 -17.17% 43
Ventura County, CA Riverside-San Bernardino-Ontario, CA 9.9 8.2 -17.17% 43 Greensboro/Winston-Salem, NC
Greensboro-High Point, NC 7.6 6.3 -17.11% 46
Cleveland, OH Cleveland-Elyria-Mentor, OH 7.3 6.1 -16.44% 47
Knoxville, TN Knoxville, TN 6.7 5.6 -16.42% 48
Charlotte, NC Charlotte-Gastonia-Rock Hill, NC-SC 7.4 6.2 -16.22% 49
Phoenix, AZ Phoenix-Mesa-Glendale, AZ 6.9 5.8 -15.94% 50
Tucson, AZ Tucson, AZ 7.1 6 -15.49% 51
Fort Lauderdale, FL Miami-Fort Lauderdale-Pompano Beach, FL 7.2 6.1 -15.28% 52
Miami, FL Miami-Fort Lauderdale-Pompano Beach, FL 7.2 6.1 -15.28% 52
Palm Beach, FL Miami-Fort Lauderdale-Pompano Beach, FL 7.2 6.1 -15.28% 52
Memphis, TN Memphis, TN-MS-AR 9.2 7.9 -14.13% 55
Boston, MA Boston-Cambridge-Quincy, MA-NH NECTA 6.5 5.6 -13.85% 56
Raleigh-Durham, NC Raleigh-Cary, NC 5.8 5 -13.79% 57
Orlando, FL Orlando-Kissimmee-Sanford, FL 6.6 5.7 -13.64% 58
Chattanooga, TN Chattanooga, TN-GA 7.4 6.4 -13.51% 59
Wichita, KS Wichita, KS 6 5.2 -13.33% 60
Tampa-St. Petersburg, FL Tampa-St. Petersburg-Clearwater, FL 7.1 6.2 -12.68% 61
Portland, OR Portland-Vancouver-Hillsboro, OR-WA 6.5 5.7 -12.31% 62
Jacksonville, FL Jacksonville, FL 6.6 5.8 -12.12% 63
Detroit, MI Detroit-Warren-Livonia, MI 9.1 8.1 -10.99% 64
Baltimore, MD Baltimore-Towson, MD 6.5 5.8 -10.77% 65
Seattle, WA Seattle-Tacoma-Bellevue, WA 5.7 5.1 -10.53% 66
Tacoma, WA Seattle-Tacoma-Bellevue, WA 5.7 5.1 -10.53% 66
Albuquerque, NM Albuquerque, NM 7 6.4 -8.57% 68
Omaha, NE Omaha-Council Bluffs, NE-IA 3.9 3.6 -7.69% 69
St. Louis, MO St. Louis, MO-IL 6.8 6.3 -7.35% 70
District of Columbia, DC Washington-Arlington-Alexandria, DC-VA-MD 5.3 5 -5.66% 71
Suburban Maryland, MD Washington-Arlington-Alexandria, DC-VA-MD 5.3 5 -5.66% 71
Suburban Virginia, VA Washington-Arlington-Alexandria, DC-VA-MD 5.3 5 -5.66% 71
Birmingham, AL Birmingham-Hoover, AL 5.7 5.4 -5.26% 74
Norfolk/Hampton Roads, VA Virginia Beach-Norfolk-Newport News, VA-NC 5.9 5.6 -5.08% 75
Greenville, SC Greenville-Mauldin-Easley, SC 6.1 5.8 -4.92% 76
Charleston, SC Charleston-North Charleston-Summerville, SC 6.2 5.9 -4.84% 77
Columbia, SC Columbia, SC 6.6 6.3 -4.55% 78
Atlanta, GA Atlanta-Sandy Springs-Marietta, GA 7.6 7.3 -3.95% 79
Richmond, VA Richmond, VA 5.7 5.5 -3.51% 80
New Orleans, LA New Orleans-Metairie-Kenner, LA 6.1 6.2 1.64% 81
Kansas City, MO Kansas City, MO-KS 5.9 6 1.69% 82
Top Markets: Unemployment Cont. RANKS Source: Bureau of Labor Statistics—unemployment report Sep 2014

© 2015 Coldwell Banker Real Estate LLC, dba Coldwell Banker Commercial Affiliates. All Rights Reserved. Coldwell Banker Real Estate LLC, dba Coldwell Banker Commercial Affiliates fully supports the princi-
ples of the Fair Housing Act and the Equal Opportunity Act. Each Office is Independently Owned and Operated. Coldwell Banker Commercial and the Coldwell Banker Commercial Logo are registered service
marks owned by Coldwell Banker Real Estate LLC, dba Coldwell Banker Commercial Affiliates. Each sales representative and broker is responsible for complying with any consumer disclosure laws or regulations.
Download at CBCWorldwide.com