coliban water’s vision · dm#3501131v7 page | i. ... • manages delivery and drainage in six...
TRANSCRIPT

DM#3501131V7 P a g e | i
Executive Summary .............................................................................................................. 1
Section 1 – G-MW Corporate Plan ........................................................................................ 3
Statement of Corporate Intent ............................................................................................... 4
Main Business Undertakings ................................................................................................. 4
Our profile ......................................................................................................................... 4
Risk Management ............................................................................................................. 5
Functions, Customers and Services ...................................................................................... 7
Functions Performed ......................................................................................................... 7
Our Customers .................................................................................................................. 9
Major Stakeholders ............................................................................................................... 9
Minister & Department of Sustainability and Environment.................................................. 9
Minister & Department of Treasury and Finance ................................................................ 9
Customer Committees ..................................................................................................... 10
Commonwealth ............................................................................................................... 10
Catchment Management Authorities ................................................................................ 10
Murray-Darling Basin Authority ........................................................................................ 10
Our Region ......................................................................................................................... 11
Our Strategic Focus ............................................................................................................ 11
Section 2 - Strategic Priorities ............................................................................................. 13
G-MW’s Strategic Priorities ................................................................................................. 14
1 Lean and Reliable Price Pathway ............................................................................. 14
2 Modernised, Fit for Purpose Infrastructure ................................................................ 15
3 G-MW Business Transformation ............................................................................... 16
4. G-MW’s Proposed Organisational Structure ............................................................. 18
Section 3 - Corporate Goals and Key Success Measures ................................................... 19
Our Corporate Goals ........................................................................................................... 20
1 Customer and Stakeholder Satisfaction .................................................................... 20
2 Operational Efficiency ............................................................................................... 21
3 Capital Investment Efficiency .................................................................................... 21
4 Employee Engagement ............................................................................................ 21
5 Financial Sustainability ............................................................................................. 22
Section 4 – GMW’s Connections Project ............................................................................. 23
Project Scope ..................................................................................................................... 24

DM#3501131V7 P a g e | ii
Objectives ....................................................................................................................... 25
Project Milestones ........................................................................................................... 25
Project Functions ............................................................................................................. 26
Key Strategies..................................................................................................................... 27
Integration ....................................................................................................................... 27
Risk Management ........................................................................................................... 27
Project Delivery ................................................................................................................... 29
Backbone ........................................................................................................................ 29
Connections .................................................................................................................... 30
Project Governance ............................................................................................................ 32
Revised Project Governance Arrangements .................................................................... 32
Ring Fencing of Connection Project activities .................................................................. 32
Connections Project Governance .................................................................................... 33
KPIs .................................................................................................................................... 34
Works Milestones ............................................................................................................ 34
Water Generation ............................................................................................................ 35
Section 5 - 2012/13 Financial Performance ......................................................................... 38
1 Financial Overview ....................................................................................................... 39
Financial Statements ....................................................................................................... 44
Statement of Financial Performance ................................................................................ 45
2 Capital Investment Program ......................................................................................... 48
3 Statement of Financial Position .................................................................................... 54
4 Statement of Cash Flows ............................................................................................. 56
DM#3501131V4 P a g e | 1
Executive Summary G-MW’s 2012/13 Corporate Plan, covering the five year period commencing 1 July 2012, commences a journey that will result in a significant change in the strategy, structure, operations and financial position of G-MW.
These changes are necessitated by the dynamic environment G-MW operates in:
• The need for G-MW to be customer centric and contribute to the viability of Northern Victorian communities.
• The $600 million investment (as part of the $2 billion NVIRP program) to modernise G-MW’s gravity irrigation system which will halve G-MW’s irrigation footprint and significantly enhance customer service levels.
• The integration of the Northern Victoria Irrigation Renewal Project (NVIRP) into G-MW effective 1 July 2012 including full project delivery and financial accountability.
• Impacts of the Murray Darling Basin Plan, particularly the reduction in water available for irrigation and the flow on effects for the viability of regional communities.
This Plan is the first following the appointment of a new Board of Directors and Managing Director in 2011. It is the combination of these changes in G-MW’s operating environment which has led the Board and Managing Director to draft G-MW’s strategy.
The following three strategic priorities have been identified to drive the business toward delivering on this strategy:
1. We are committed to delivering a lean and reliable price pathway allowing customers to make informed investment and lifestyle decisions with certainty.
2. We will contribute to a viable future for the rural communities of Northern Victoria through delivering a new, modernised, fit for purpose irrigation network by 2019.
Our strategy: To be respected by our customers and shareholder for managing water sustainably, delivering water efficiently, and building a modernised fit for purpose system.

DM#3501131V7 P a g e | 2
3. We will transform G-MW to ensure it is an efficient business, delivering on what’s important to our customers and shareholder.
A series of projects and initiatives have been developed and commenced to deliver on these three key strategic priorities. The financials incorporated in this Corporate Plan exclude the impacts of the transformation of G-MW, but include the integration of the Connections Project into G-MW.
Therefore the financial and operational information in this Corporate Plan must be read in consideration of the substantial structural and financial changes G-MW is currently working through.
Further to the interim Corporate Plan, this revised Corporate Plan reflects the material financial and operational changes as a result of the integration of NVIRP into GMW.
Llew Vale OAM Chairman
Gavin Hanlon Managing Director

DM#3501131V7 P a g e | 3
Section 1 – G-MW Corporate Plan

DM#3501131V7 P a g e | 4
Statement of Corporate Intent Main Business Undertakings Our profile Goulburn-Murray Rural Water Corporation, trading as Goulburn-Murray Water (G-MW), is a statutory corporation constituted under the provisions of the Victorian Water Act 1989, and is accountable to the Minister for Water. G-MW’s core business is to manage and deliver water to irrigators, communities, industry and the environment.
Our key responsibilities are:
• Managing the delivery of water to its irrigation and water districts and maintaining the infrastructure for these districts.
• Implementing Government’s regulations and policy for groundwater and surface water resource management in accordance with the delegated powers.
• Delivery of G-MW’s Connections Project (formally the NVIRP Program).
• Harvesting, storing and managing water in its reservoirs and dams.
In addition to the above, Goulburn-Murray Water also:
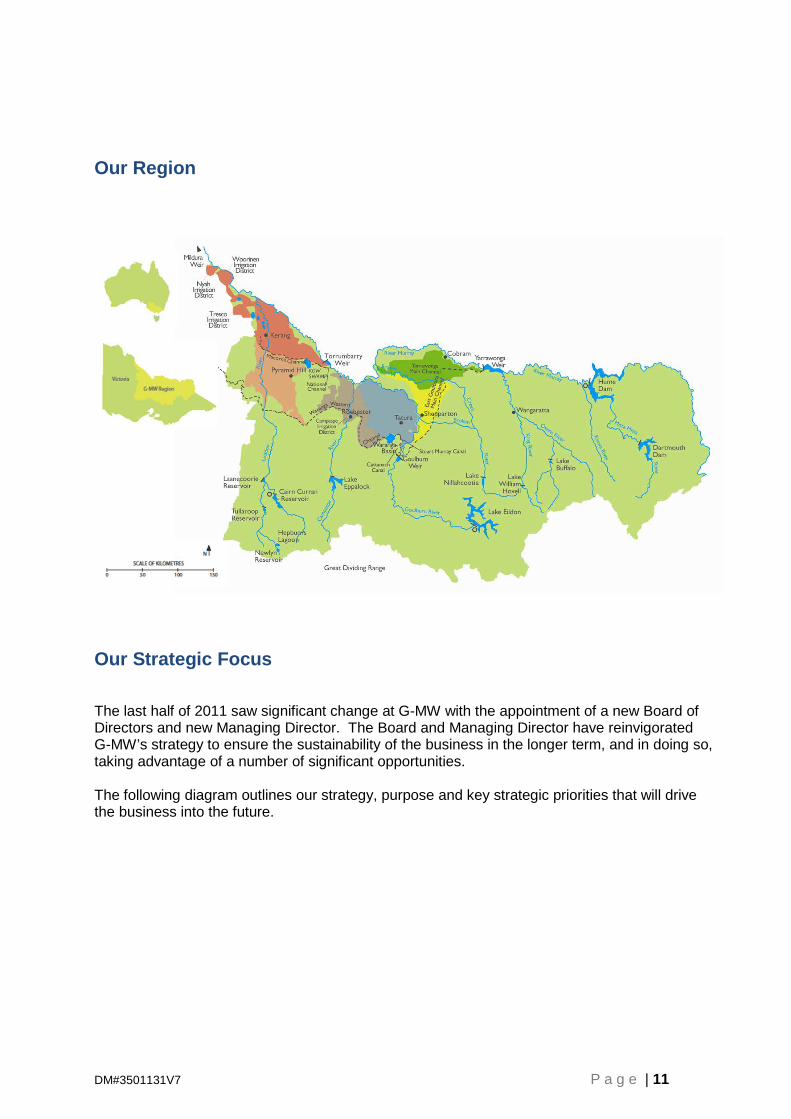
• Manages water-related services in a region of 68,000 square kilometres, bordered by the Great Dividing Range in the south and the River Murray in the north and from Corryong in the east downriver to Nyah.
• Manages delivery and drainage in six irrigation areas, constituting 50% of customers, 75% of water shares and 75% of all deliveries.
• Services over 30,000 customers through surface water, groundwater, unregulated rivers and streams.
• Harvests and stores water for urban water corporations and environment entitlement holders.
• Facilitates hydroelectricity generation and recreational use, including houseboats, at its storages.
• Delivers approximately 2,400,000 ML p.a. to urban water authorities, the environment, rural and irrigation users.
• Manages 16 dams with 12 million ML of storage (70% of Victoria’s water storage capacity).
• Operates salinity mitigation works on the Murray downstream of Nyah, delivers bulk water to supply points outside its region and is the Victorian Constructing Authority for the Murray-Darling Basin Authority (MDBA).
DM#3501131V7 P a g e | 5
• Is the DSE appointed Resource Manager for Northern Victoria Water Systems and has the responsibility for making the seasonal allocation determinations for all Victorian Murray entitlement holders.
• Is the Minister’s delegate for a range of functions including water share and allocation trading, water use licensing, works licensing and take and use licensing from unregulated streams and groundwater.
• Is a partner in the Victorian Water Register, using it to manage more than $4 billion of water entitlements and trade.
Our key stakeholders are the Commonwealth, the Victorian Government, our customers, and our community. Our vision is to be respected by our customers and shareholder as being efficient in the delivery of water to increase agricultural productivity, enable prosperous communities and have a sustainable environment. Risk Management The purpose of risk management is to manage and monitor risks that could have an adverse effect on the operation of G-MW’s business. G-MW recognises that effective application of risk management enables us to seize new opportunities and meet challenges to successfully achieve our corporate objectives, protect and improve service delivery and our reputation. Over the period of this Corporate Plan the focus on high quality risk management will remain a priority at all levels of G-MW, key objectives will include:
• Further developing a risk aware and proactive culture towards risk identification, analysis and reporting.
• Initiating key performance management indicators that reflect the progress of our risk aware culture.
• Maintaining a comprehensive register of Strategic and Operational Risks with mitigation controls that are tested and assured.
• Continuing to ensure that risk management is integrated into all strategic planning and decision making processes across all of G-MW’s business functions.
• Growing the level of risk capability across G-MW through more education, communication and awareness of risk issues.
As part of the implementation of a new risk management framework across all business functions in 2011/12, G-MW undertook a review of all potential strategic risks that could affect the objectives of the organisation. The following table outlines the key strategic risks and their corresponding mitigation controls for G-MW’s Water Storage and Delivery business. The key strategic risks and corresponding mitigation controls for the Connections Project are presented in Section 4 of this Corporate Plan. All strategic risks are controls and monitored to ensure further mitigation over the period of this plan.

DM#3501131V7 P a g e | 6
Risk Description Mitigation Controls
Safety incidents (staff/members of public/contractors)
G-MW maintains its safety management system standards to comply with Australian Standard AS4801, which is externally certified on a regular basis. It is compulsory for all G-MW employees to undertake safety inductions and training. Board and Management involvement in providing leadership in addressing safety issues setting safety strategy are key ongoing controls. Proactive key performance measures have been established for high risk work functions with regular monitoring and reporting. G-MW also undertakes public safety awareness programs annually.
Dam Safety A key mitigation control is G-MW’s compliance with ANCOLD (Australian National Commission on Large Dams) Guidelines for dam safety risk assessment, monitoring and surveillance programs. In support of internal dam safety inspections and surveillance, G-MW liaises with dam safety experts across Australia to ensure reviews have independent assessment and assurance. As a result of flooding events in Victoria and Queensland G-MW has had the opportunity to review all its operating procedures to ensure that it continues to reflect industry best of practice standards.
Security of G-MW Assets or Staff compromised due to serious criminal or terrorist events
G-MW has a comprehensive Terrorism Risk Management Plan that is compliant and externally audited on an annual basis against the Community Protection (Terrorism) Act 2006. We are also active participants at local, State and Federal level based water industry security forums and networks.
Interruption to Information and Communication Technology (ICT) systems
As the technological operating environment which G-MW operates in changes and advances, Business Continuity Plans are updated and improved. A key factor to this is expanding resilience capability to ICT infrastructure that supports critical business functions. G-MW is also implementing best of practice standards ISO 30001 to guide its Information Security Management System.
Water Plan 3 (2013 – 2016) - inability to deliver outcomes on time and meeting the future needs of G-MW
A thorough project management and governance structure has been established to manage the development process and content contained within this Water Plan. G-MW continues to engage and consult with its customers and key stakeholder on key aspects of its Water Plan.
Failure to engage customers to understand and meet their needs
By strengthening its relationship with customers, Water Service Committees and other stakeholders, combined with experienced staff with local knowledge, G-MW will continue to develop new and innovative ways to communicate with and receive feedback from its customers and key stakeholders. G-MW will continue to assess the effectiveness of its engagement strategies through ongoing customer survey feedback.

DM#3501131V7 P a g e | 7
Risk Description Mitigation Controls
Organisational culture and morale
G-MW has recently undertaken a staff engagement survey and established collaborative working teams involving all layers of staff across the business to define the values and traits which make G-MW a high functioning, customer centric employer of choice. In support of this initiative an updated performance appraisal system is being implemented, with a new capability framework aligning to performance objectives.
Lack of sufficient management of the economic regulatory regime which would threaten short and long term financial viability
G-MW has endorsed the pricing and consultation governance arrangements established around our financial process. As part of this process, financial metrics and targets have been established that are monitored and reported to Directors. G-MW is also developing long term forecasting models and engaging with customers to define future service levels and needs that provide data used to determine future pricing implications and directions. As part of the overall transformation of G-MW, the manner, method in which budgeting, price co-ordination and strategy is managed is a key consideration and focus.
Failure to deliver a transformed entity that is customer centric and meets a changing environment
Through introducing a structured and disciplined approach to this organisational change initiative G-MW has been proactive with introducing several key controls ensuring all alignment against guiding principals. These include delivery of key project milestones based on an endorsed implementation plan, established due diligence and governance arrangements and undertaking a consultative and collaborative approach to the project. Financial planning and modelling that guide economies of scale and operational synergy are key support mechanisms for this project.
Functions, Customers and Services
Functions Performed G-MW undertakes a limited number of core functions in its own right as a water authority established under the Water Act 1989:
• Irrigation districts (water delivery, drainage, salinity mitigation).
• Water districts (water supply).
• Waterway management (flood protection). G-MW is also a referral authority under the Planning and Environment Act 1987. Additionally, G-MW undertakes a range of functions as a delegate or appointee (mostly of the Minister of Water):
DM#3501131V7 P a g e | 8
• Delegate of the Minister of Water under Water Act 1989 – licensing activities (unregulated streams, groundwater, works on waterways, water use), approval of water share and allocation applications.
• Appointment by the Minister of Water under the Water Act 1989 – storage manager and resource manager for all declared water systems in Northern Victoria.
• Appointment by the Minister of Water under the Murray-Darling Basin Act 1993 – Victoria’s relevant water authority (constructing authority) for the MDBA.
• Appointment by the Water Register under the Water Act 1989 – recording of certain water share dealings.
G-MW also undertakes the following activities:
• Electricity generation at storages (long term commercial contracts).
• Amenity services at storages (houseboats, land leases, public access).
• Boating authority for lakes and waterways under G-MW management.
• Water savings delivery to government.
• Natural resource management service provision to Catchment Management Authorities (CMAs).
• Training service provider.
DM#3501131V7 P a g e | 9
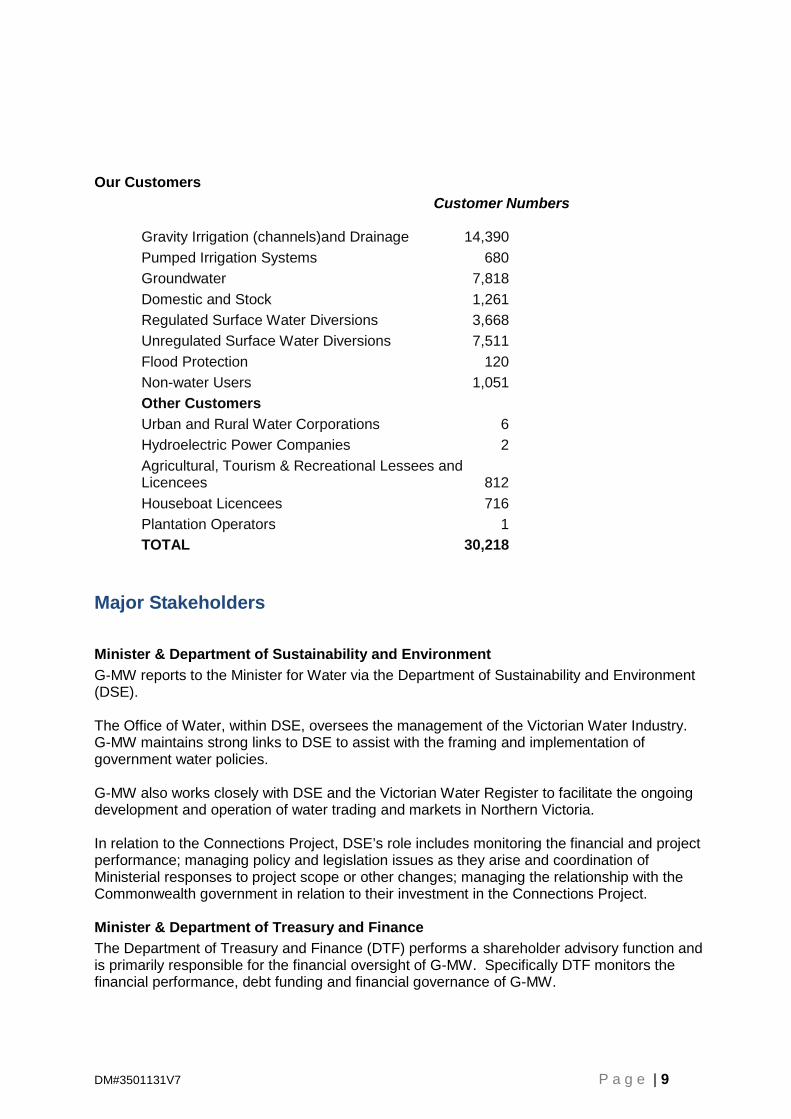
Our Customers
Customer Numbers Gravity Irrigation (channels)and Drainage 14,390
Pumped Irrigation Systems 680
Groundwater 7,818
Domestic and Stock 1,261
Regulated Surface Water Diversions 3,668
Unregulated Surface Water Diversions 7,511
Flood Protection 120
Non-water Users 1,051
Other Customers
Urban and Rural Water Corporations 6
Hydroelectric Power Companies 2
Agricultural, Tourism & Recreational Lessees and Licencees 812 Houseboat Licencees 716
Plantation Operators 1
TOTAL 30,218
Major Stakeholders
Minister & Department of Sustainability and Environment G-MW reports to the Minister for Water via the Department of Sustainability and Environment (DSE). The Office of Water, within DSE, oversees the management of the Victorian Water Industry. G-MW maintains strong links to DSE to assist with the framing and implementation of government water policies. G-MW also works closely with DSE and the Victorian Water Register to facilitate the ongoing development and operation of water trading and markets in Northern Victoria. In relation to the Connections Project, DSE’s role includes monitoring the financial and project performance; managing policy and legislation issues as they arise and coordination of Ministerial responses to project scope or other changes; managing the relationship with the Commonwealth government in relation to their investment in the Connections Project. Minister & Department of Treasury and Finance The Department of Treasury and Finance (DTF) performs a shareholder advisory function and is primarily responsible for the financial oversight of G-MW. Specifically DTF monitors the financial performance, debt funding and financial governance of G-MW.

DM#3501131V7 P a g e | 10
In addition as the Connections Project is categorised as a ‘High Value High Risk’ project under the Government’s revised reporting arrangements for major projects, the Treasurer has an ongoing role in monitoring project progress. DTF is also involved in monitoring the financial and performance of the Connections Project by providing an ongoing due diligence role in regard to commercial and project/financial risks through DTF’s Gateway High Value High Risk process. Customer Committees Customer Committees such as Water Services Committees and Regional Committees are G-MW’s primary source of customer advice and feedback. Committee representatives are appointed to provide advice and informed discussion in areas such as operations, pricing, service standards and asset management. Committees meet regularly and are comprised of customers chosen through a community nomination procedure and appointed by the G-MW Board. Commonwealth The Commonwealth has agreed to fund Stage 2 of the Connections project under the Water Management Partnerships Agreement. The Commonwealth funding contribution is $953 million as set out in the Stage 2 Project Schedule. In return the Commonwealth will receive 50 per cent of the project generated water or 102 GL LTCE. Catchment Management Authorities Victoria is divided into catchment regions with a Catchment Management Authority (CMA) established for each region which is responsible for coordinating catchment management activities in their region. G-MW has strong links to the North East, Goulburn Broken and North Central CMAs on water quality, river health and natural resources management programs. As well, there are operational interactions on delivery of environmental entitlements and catchment programs under the management of DSE and the CMAs. Murray-Darling Basin Authority The Murray-Darling Basin Authority (MDBA) is responsible for the integrated management of the Murray-Darling Basin and reports to the Federal Minister for Water. G-MW is the Victorian Constructing Authority for the MDBA which is a significant regional role. This role involves the management responsibility for the operation and maintenance of MDBA storages and salt interception works across Northern Victoria and the construction of new major environmental works under ‘The Living Murray’ program. G-MW also has an advisory role on the Water Liaison Working Group of the MDBA on water accounting, operational and water management matters. Other Forums Local communities across G-MW’s region are also represented by Local Government and there are a number of local and regional co-ordination forums across the region in which G-MW participates.
DM#3501131V7 P a g e | 11
Our Region
Our Strategic Focus
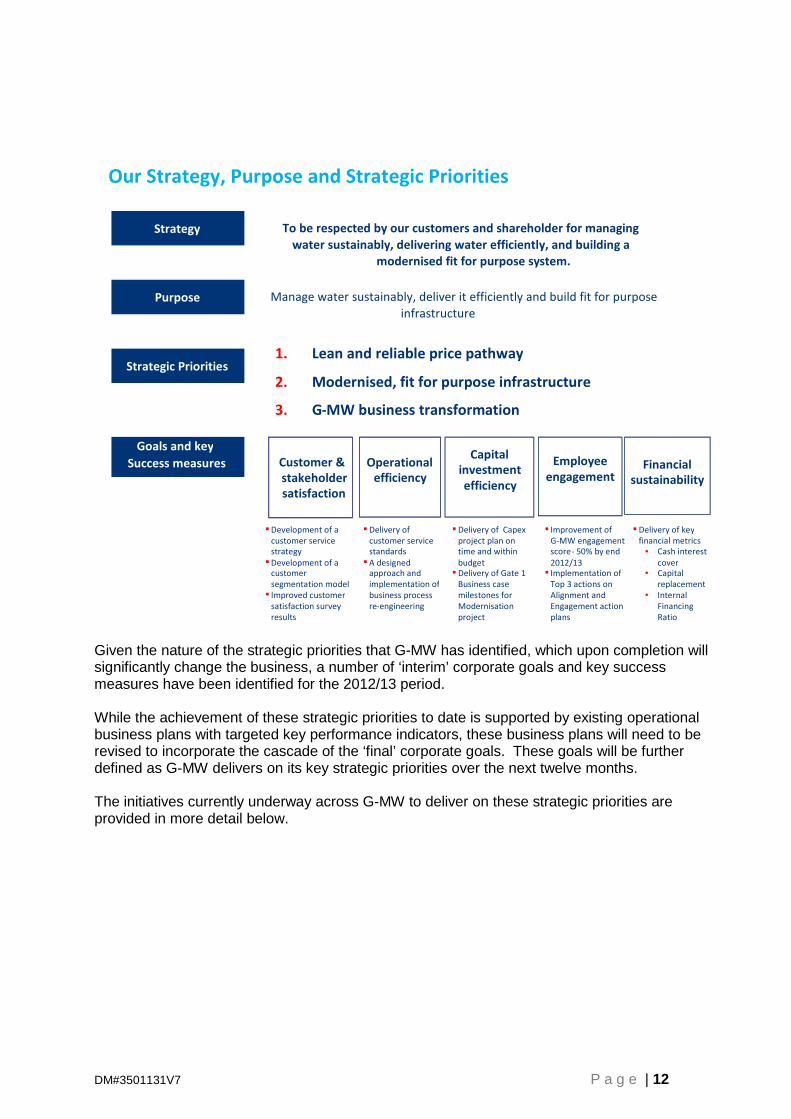
The last half of 2011 saw significant change at G-MW with the appointment of a new Board of Directors and new Managing Director. The Board and Managing Director have reinvigorated G-MW’s strategy to ensure the sustainability of the business in the longer term, and in doing so, taking advantage of a number of significant opportunities. The following diagram outlines our strategy, purpose and key strategic priorities that will drive the business into the future.
DM#3501131V7 P a g e | 12
Given the nature of the strategic priorities that G-MW has identified, which upon completion will significantly change the business, a number of ‘interim’ corporate goals and key success measures have been identified for the 2012/13 period. While the achievement of these strategic priorities to date is supported by existing operational business plans with targeted key performance indicators, these business plans will need to be revised to incorporate the cascade of the ‘final’ corporate goals. These goals will be further defined as G-MW delivers on its key strategic priorities over the next twelve months. The initiatives currently underway across G-MW to deliver on these strategic priorities are provided in more detail below.
Manage water sustainably, deliver it efficiently and build fit for purpose infrastructure
To be respected by our customers and shareholder for managing water sustainably, delivering water efficiently, and building a
modernised fit for purpose system.
Our Strategy, Purpose and Strategic Priorities
Operational efficiency
Employee engagement
Capital investment efficiency
Customer & stakeholder satisfaction
Financial sustainability
1. Lean and reliable price pathway
2. Modernised, fit for purpose infrastructure
3. G - MW business transformation
Development of a customer service strategy Development of a
customer segmentation model Improved customer
satisfaction survey results
Delivery of customer service standards A designed
approach and implementation of business process re - engineering
Delivery of Capex project plan on time and within budget Delivery of Gate 1
Business case milestones for Modernisation project
Improvement of G-MW engagement score - 50% by end 2012/13 Implementation of
Top 3 actions on Alignment and Engagement action plans
Delivery of key financial metrics
• Cash interest cover
• Capital replacement
• Internal Financing Ratio
Strategy
Purpose
Strategic Priorities
Goals and key Success measures

DM#3501131V7 P a g e | 13
Section 2 - Strategic Priorities

DM#3501131V7 P a g e | 14
G-MW’s Strategic Priorities
The context within which G-MW now operates has changed significantly and will continue to evolve over the coming Plan period. Driven by the changing needs of our customers, the modernisation of G-MW’s gravity irrigation system, which will result in a reduced irrigation footprint, and the potential implications of the Murray-Darling Basin Plan, G-MW’s new Board have undertaken to reinvigorate its strategy. With a focus on becoming a more customer centric organisation, G-MW engaged with its customers, stakeholders and staff and actively listened to their feedback with a view to transform the foundations of the business in order to deliver on its strategy. The following key strategic priorities have been developed to drive the business to deliver on our strategy: 1 Lean and Reliable Price Pathway
This is being achieved during the last year in Water Plan 2 (2012/13) and Water Plan 3 (and 4) development by: 2012/13 Pricing
• Consultation across our customer base on the principle of a lean and reliable price path including definition, application and measurement.
• Communication and acknowledgement by the Board to stakeholders and customers of the risk profile in delivering the 2012/13 pricing pathway and the impact on underlying assumptions.
• Engagement and briefing of all key stakeholders (Regulators, Minister, Department of Treasury & Finance, Department of Sustainability and Environment).
• Development of financial sustainability metrics to ensure G-MW’s long term viability.
Water Plan 3 Development
• Engagement with Board, stakeholders and customers on the development of assumptions and scenarios underpinning prices.
• Engagement and briefing of all key stakeholders (Regulators, Minister, Department of Treasury & Finance, Department of Sustainability and Environment).
G-MW is committed to delivering a lean and reliable price pathway allowing
customers to make informed investment and lifestyle decisions with certainty.

DM#3501131V7 P a g e | 15
• Review and interrogation of the principles, data sets and models underpinning the price development.
Key initiatives and major milestones for the 2012/13 year are: 2012/13 Pricing
• ESC and Board approval of pricing pathway.
Water Plan 3 Development
• Extensive and effective customer and stakeholder consultation on Water Plan 3.
• Validation of its core financial source data for Water Plan 3 including quality assurance program covering demand forecasts (water availability & volumes delivered), Capital Expenditure, Operating Expenditure, and financial modelling review.
• Ensuring all of the underlying model assumptions are understood and owned by G-MW.
• Validation and application of the principles, data sets and models underpinning the price development.
• Development of a measure(s) that validate the initial goal of ensuring that customers are able to base investment and lifestyle decisions on our price pathway.
Tariff Review
• Undertake a wide ranging tariff review incorporating ownership of customers and stakeholders.
• Consultation on tariff review principles to establish review process.
• Tariff review incorporates the changing systems and external realities.
• Tariff review scope, structure and timeframes established.
2 Modernised, Fit for Purpose Infrastructure
G-MW is in the process of transforming its delivery system by providing a modernised fit for purpose irrigation network. In doing so, it is essential that it also transforms its tariffs to meet the characteristics of the new system, and create a structure that will provide optimal outcomes into the future.
G-MW is contributing to a viable future for the rural communities of Northern Victoria through delivering a new, fit for purpose irrigation network by 2019.

DM#3501131V7 P a g e | 16
Progress in the 2011/12 year included:
NVIRP Integration • Submission on NVIRP integration signed off by both Boards and submitted to
Government. • G-MW manages staff integration in a seamless manner. • Program continues to be delivered without interruption. • Implementation of integration program is developed.
Tariff Review
• Consultation on tariff review principles and process to establish the scope of the tariff review.
• Consideration of the tariff review in light of external realities. • Tariff review scope, structure and timeframes established.
Key initiatives and major milestones for the 2012/13 year include: NVIRP Integration
• The G-MW executive team are in place in July 2012. • G-MW manages staff integration in a seamless manner. • Integration process is successfully completed.
Connections Project • Program continues to be delivered without interruption. • Operational synergies are being captured. • Project deliverables achieved in a well governed and controlled environment. • Connections implementation plan.
Tariff Review
• Commence tariff review with confirmation of scope and structure of project. • Consultation and engagement with key stakeholders will occur throughout the
tariff review process.
3 G-MW Business Transformation
G-MW is committed to putting our customers first and transforming our business to be more efficient, drive a culture of accountability and improve the ease of doing business for our customers.
G-MW is a lean, rewarding place to work, delivering on what’s important to our customers and shareholders.
DM#3501131V7 P a g e | 17
Progress in the 2011/12 year included: Culture & People
• Completed an engagement and alignment survey of all G-MW staff.
• Results of survey communicated around the business and workshops held to identify action plans of initiatives to be undertaken to improve results.
• Commence implementation of actions to improve results.
Transformation
• Mobilised the transformation team, made up of 10% of the current workforce (over 70 staff involved in the bottom up development of the functional model).
• Established the guiding principles of business transformation in order to:
1. Drive efficient and least cost provision of G-MW’s services.
2. Drive a culture of accountability.
3. Improve ease of doing business from a customer’s perspective.
4. Provide a clear and transparent method for identifying costs associated with the provision of services.
5. Eliminate cross subsidies that distort pricing and funding.
6. Be as simple as possible with minimal management layers.
7. Reduce cost while maintaining and improving the level of service over time.
• Build a functional organisational model, from the bottom up to meet the ‘New G-MW’ guiding principles as set by the Board and Managing Director.
• Extensively engaged with staff more broadly and sought staff consultation on the proposed ‘draft’ model.
• Developed a new functional structure for G-MW.

DM#3501131V7 P a g e | 18
4. G-MW’s Proposed Organisational Structure
Key Initiatives and major milestones for the 2012/13 year include: Culture and People
• Establish an Engagement Steering Committee to drive cultural engagement programs.
• Implementation of programs to improve engagement and alignment.
• Throughout the Corporate Plan period, initiatives targeted at improving the capability of our people will continue. Specifically these include:
Embedding competency models.
Building a customer centric culture.
Enhancing the approach to training and advocating a ‘customer first’ agenda.
• Development of corporate values and behaviours to be observed by all G-MW staff.
• Development of a core competency framework which will be compulsory for all managers and embedded within the performance management system.
Transformation
• Implementation of the new organisational structure.
• Recruitment and appointment of the G-MW executive team.
• Establish key corporate goals and key success measures and performance targets for the organisation.
• Cascade of Corporate Strategy, Purpose, Corporate Goals and key success measures throughout G-MW to provide clarity to all staff as to the organisations strategic direction and deliverables.
• Clearly define G-MW’s customer service proposition for each customer segment.
Embark on a program of business process improvement to ensure operational efficiencies are achieved. These priorities will be focused on processes relating to:
1. Customers.
2. Operational Service Standards.
3. Financial Sustainability.

DM#3501131V7 P a g e | 19
Section 3 - Corporate Goals and Key Success Measures
DM#3501131V7 P a g e | 20
Our Corporate Goals
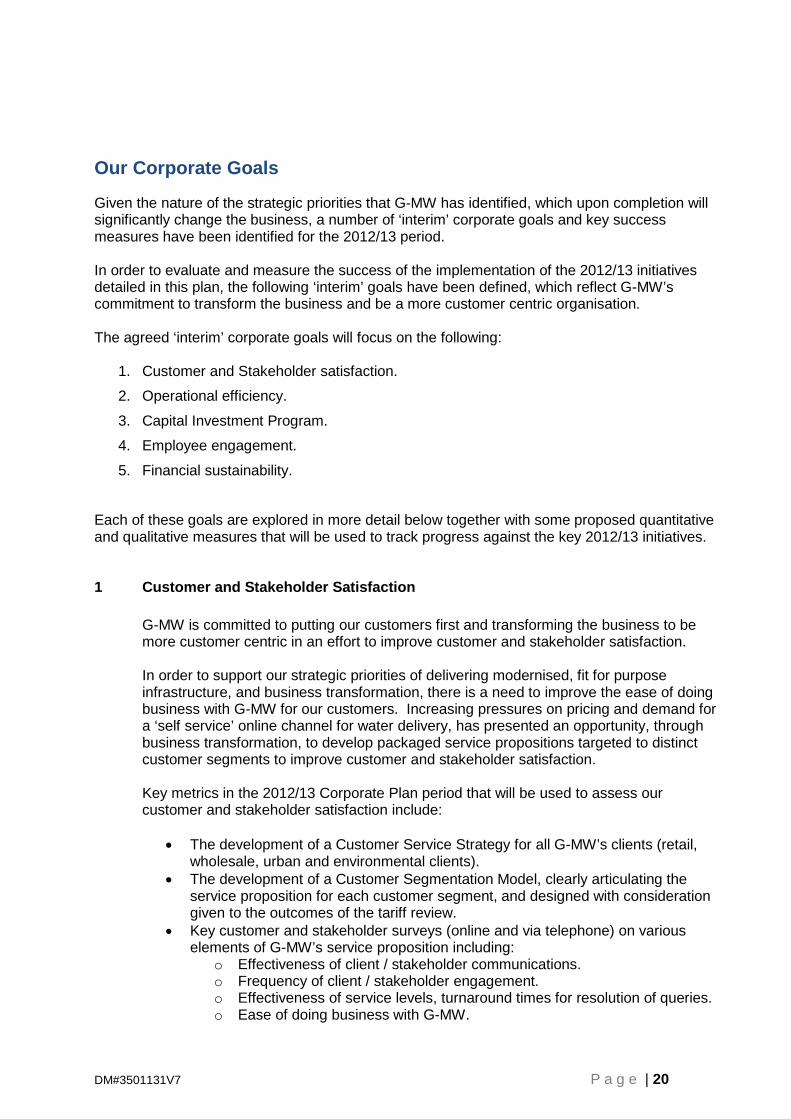
Given the nature of the strategic priorities that G-MW has identified, which upon completion will significantly change the business, a number of ‘interim’ corporate goals and key success measures have been identified for the 2012/13 period. In order to evaluate and measure the success of the implementation of the 2012/13 initiatives detailed in this plan, the following ‘interim’ goals have been defined, which reflect G-MW’s commitment to transform the business and be a more customer centric organisation. The agreed ‘interim’ corporate goals will focus on the following:
1. Customer and Stakeholder satisfaction.
2. Operational efficiency.
3. Capital Investment Program.
4. Employee engagement.
5. Financial sustainability.
Each of these goals are explored in more detail below together with some proposed quantitative and qualitative measures that will be used to track progress against the key 2012/13 initiatives. 1 Customer and Stakeholder Satisfaction
G-MW is committed to putting our customers first and transforming the business to be more customer centric in an effort to improve customer and stakeholder satisfaction. In order to support our strategic priorities of delivering modernised, fit for purpose infrastructure, and business transformation, there is a need to improve the ease of doing business with G-MW for our customers. Increasing pressures on pricing and demand for a ‘self service’ online channel for water delivery, has presented an opportunity, through business transformation, to develop packaged service propositions targeted to distinct customer segments to improve customer and stakeholder satisfaction. Key metrics in the 2012/13 Corporate Plan period that will be used to assess our customer and stakeholder satisfaction include:
• The development of a Customer Service Strategy for all G-MW’s clients (retail, wholesale, urban and environmental clients).
• The development of a Customer Segmentation Model, clearly articulating the service proposition for each customer segment, and designed with consideration given to the outcomes of the tariff review.
• Key customer and stakeholder surveys (online and via telephone) on various elements of G-MW’s service proposition including:
o Effectiveness of client / stakeholder communications. o Frequency of client / stakeholder engagement. o Effectiveness of service levels, turnaround times for resolution of queries. o Ease of doing business with G-MW.

DM#3501131V7 P a g e | 21
o Number of customer complaints and timeliness for resolutions of complaints.
2 Operational Efficiency
A key success measure underpinning all three of G-MW’s strategic priorities is achieving operational efficiencies. While a number of customer service standards currently exist which provide insights into the operational efficiencies of G-MW, over the planning period it is anticipated that a full end-to-end process improvement and infrastructure re-design will be a key driver for operational efficiency. A key initiative over the 2012/13 planning period is to design an approach for business process re-engineering across G-MW. This approach and complete scope of this initiative is still to be detailed. Key metrics anticipated to be used in the 2012/13 planning period to assess our operation efficiency include:
• Number of business processes reviewed.
• Number of redesigned and associated process improvements implemented.
• Reduction in the number of manual processes and human errors across G-MW reducing work load across the business and increasing the level of automation of manual business processes.
• Improved customer service standard metrics.
3 Capital Investment Efficiency
The successful delivery of the modernised fit for purpose infrastructure program directly impacts not only the materiality but also the significance of our capital expenditure program. The following key metrics will be used to assess the successful allocation of capital resources across G-MW to deliver on our strategic priorities:
• Delivery of capital projects on time.
• Completion of capital projects within agreed budget.
• Delivery of capital projects within agreed quality standards, and compliance to all capital project policies and standards (e.g. OH&S).
4 Employee Engagement
The success of our corporate strategy, centred heavily on customers, relies on having the right people with the right skills throughout our organisation. In building a
DM#3501131V7 P a g e | 22
functionally separated model for G-MW, and in delivering on our Business Transformation priority, it is important for G-MW to embed a culture of leadership and accountability throughout the business. The Engagement and Alignment survey completed in 2011 has provided a good base line for measuring the engagement of our staff. The following 2012/13 key metrics will be used to assess the successful delivery of our strategic priorities:
• Improved engagement and alignment survey score of 50% by the end of the 2012/13.
• Successful implementation of the “Top 3” actions arising from the Engagement and Alignment workshops.
Additional metrics such as the successful implementation of and participation, in future programs focused on Leadership, Training and Development program will also be useful indicators of the success of the Culture and People initiatives over the 2012/13 planning period.
5 Financial Sustainability
A key corporate goal underpinning the success of all of our Strategic Priorities is the financial sustainability of G-MW. Key financial metrics to be used over the 2012/13 planning period to assess the successful delivery of our strategic priorities include:
• Cash interest cover.
• Capital Replacement Ratio.
• Internal Financing Ratio.
Assessment against these criteria is included in Section 5 – Financial Performance. These three metrics have been adjusted to reflect the specific operating and regulatory settings of G-MW. They are a component of a broader financial reporting and performance measurement framework currently being developed by G-MW.

DM#3501131V7 P a g e | 23
Section 4 – GMW’s Connections Project

DM#3501131V7 P a g e | 24
Project Scope On 20 December 2007, the State Owned Enterprise for Irrigation Modernisation in Northern Victoria (NVIRP) was established to implement a project to modernise the GMID channel system as a key element of the Victorian Government Water Plan. Effective from 1 July 2012, NVIRP was integrated into G-MW.
The Project is separated into two stages:
• Stage 1: a State funded project for $1,004 million delivering 225 GL of water recovery supported by the Stage 1 Business Case. Stage 1 commenced in 2007/08 and is scheduled to be completed in the revised timeline of 2017-18 as endorsed through the Stage 1 Business Case Revision . To the 31January 2012, $648 million of the $1,004 million Stage 1 project budget has been expended, indicating that the project is well-advanced..
• Stage 2: a further project to deliver an estimated 204 GL of water recovery, with an agreement with the Commonwealth Government to contribute $953 million in return for the transfer of half the water recovered to the Commonwealth and the State to contribute $106 million. Stage 2 is supported by a project schedule that sets out the project scope, milestones and payment schedule. The Stage 2 project commenced in the second half of 2011-12 and is also due to be completed in 2017-18. In 2011-12 forecast expenditure on Stage 2 activities is $3.5 million.
For the Project, the GMID channel network has been divided into two sub-systems – backbone and non-backbone. The backbone comprises the larger capacity channels supplying the majority of the medium and large scale irrigation properties. The remaining channels are classified as non-backbone. The non-backbone consists primarily of small spur channels serving individuals or groups of customers. Because of the historic trend towards larger farm properties and outward water trade, non-backbone channels are often under-utilised.
Different modernisation strategies are employed in each of the backbone and non-backbone components of the system as:
• Backbone program: The backbone system is to be modernised to enhance service standards, reduce water losses, improve metering and measurement and enhance system operations. In the future the backbone will form the core of the irrigation network from which individual properties will be either directly serviced or connected via pipelines or optimised on-farm channels.
• Connections program: Non-backbone channels are to be decommissioned and water is
to be supplied to landholdings through new privately owned connections to the backbone. Where landowners wish to exit irrigation, the existing irrigation supply will be terminated. As a result of NVIRP (Stage 1 and Stage 2), the GMID channel system will be reduced to around 50 per cent of its current length but will service over 90 per cent of irrigation properties.

DM#3501131V7 P a g e | 25
The modernisation strategies are to be implemented in parallel but with emphasis on the backbone modernisation as an initial priority in Stage 1 followed by connection works to be completed in both Stage 1 and Stage 2.
Objectives
The objectives of the Connections Project are: • to create an efficient, best practice irrigation system by 2018 that:
o provides greatly enhanced service levels to support best practice on-farm irrigation; and
o delivers water efficiently;
• to recover 429 GL in accordance with overall targets;
• to deliver Stage 1 in alignment with the broader project to provide the flexibility needed in achieving Stage 2 objectives;
• achieve full project delivery by 30 June 2018 in accordance with budget approved through the Stage 1 Business Case and Addendum, the Stage 2 Project Schedule between the Commonwealth and the State and the Stage 2 Funding Agreement between the State and G-MW ;
• to support regional growth and prosperity through building on the region’s competitive advantages in supplying and processing food (food security); and
• to deliver the Connections Program in a transparent, fair and equitable manner.
Project Milestones
The Project works program is set out in the Stage 1 Business Case Addendum and Stage 2 Project Schedule. Milestones are defined in terms of units of work activity completed for each of the project’s two major programs. The milestone work activities are:
• Backbone program: o channel automation: installation of automated gates into backbone channel
regulators to facilitate TCC automation;
o channel remediation: lining of backbone channels to reduce leakage and seepage losses;
o backbone metering: installation of modernised meters to replace existing customer service point meters in the backbone;
o connection metering: installation of modernised meters onto new farm connections to the backbone; and
o complete construction of the special projects (Stage 2).
• Connection program: o channel rationalised: rationalising non-backbone channel;
o delivery share relocated to backbone: agreement from landowner to shift delivery share entitlement from a non-backbone to a backbone meter or to terminate the delivery share;

DM#3501131V7 P a g e | 26
o backbone gates rationalised: rationalisation of existing regulating structures in the backbone; and
o meters rationalised: rationalisation of backbone and non-backbone customer service point meters.
Table 0-1 below sets outs milestone targets for each Stage of the project and forecast outcomes at the 30 June 2012.
Table 0-1 Connection Project Milestone Targets – Stage 1 and Stage 2
Item Stage 1 Stage 2 Project Total
Backbone program Channel automation (no. of automated gates installed) 2,880 na 2,880
Channel remediation (kms of channel remediated) 142 77 218
Backbone metering (no. of meters installed) 4,540 924 5,464
Connections metering (no. of meters installed) 1,040 4,976 6,016
Connections program Channel rationalised (kms of channel rationalised) 759 2,259 3,018
Delivery share relocated to backbone (ML/day) 2,258 5,300 7,558
Backbone gates rationalised (no. of gates rationalised) 321 na 321
Backbone meters rationalised (no. of meters rationalised) 1,877 na 1,877
Connection meters rationalised (no. of meters rationalised) 2,077 5,457 7,534
Project Functions
The Project was established to plan, design and deliver the program of works and measures for modernising the channel system. Prior to integration with G-MW there were five main operational areas:
• Modernisation: plan design and delivery of the Connections program;
• Capital: plan design and delivery of the Backbone construction program;
• Planning: environmental and compliance planning;
• Finance and business services: finance, IT, HR and other support functions; and
• Board, CEO and governance.
DM#3501131V7 P a g e | 27
Key Strategies This section sets out the nature and scope of the business strategies to deliver the Connection Project through to completion in 2017-18.
Integration The functions of NVIRP and G-MW were integrated from 1 July 2012. G-MW has endorsed a new operating structure with the objective of:
• Delivering on government’s objectives of:
o generating greater value for the state and customers;
o maximising objectives of modernisation;
o streamlined decision making;
o more efficient delivery of capital programs; and
o proper management controls.
• ‘Ring fencing’ the project from an operational, financial and performance reporting perspective from other G-MW activities.
Key features of the merged entities in terms of the project delivery are: • the connections function is incorporated into a new G-MW business unit called
Connections, responsible for the delivery of the revised connections programs;
• a newly integrated construction/project delivery business unit will deliver the projects capital program as well as G-MW’s capital works program;
• support services such as finance, IT, HR and other services which support the Connections Project and all G-MW activities;
• a dedicated project director position has been established in the Managing Director’s office to oversee the project and ensure clear accountability and reporting on the delivery of the project within G-MW.
Risk Management Leading up to the merger on 30 June 2012, NVIRP had prepared a Transfer Risk Register & Top Ten Risks List. This has been supported by risk independent assessment in the 2012 Stage 1 Business Case. It is proposed that the Connection Project risk management activities be integrated into G-MW’s risk management framework. Table 0-1 below provides a summary of key strategic risks to the Project.

DM#3501131V7 P a g e | 28
Table 0-1 Strategic Risks and Mitigation
Risk Issue Mitigation Activities
Delivery of the Connections Program on time and to budget.
• Stage 1 Business Case Addendum establishes appropriate procurement, monitoring and reporting processes.
• Program is to be substantially ramped up with corresponding increase in capability and resourcing to meet the delivery date.
• Appropriate tools to attain landowner agreement, including ministerial intervention through direction.
• Communications plan to enable more effective communication with the irrigators.
• The expectation (of the irrigators) is to be managed at the outset through the provision of more information to irrigators.
Sufficient resources available to develop the necessary farm plans and connection designs.
• Informing the market of intended program of Stage 1 and Stage 2 through communications program.
• Promoting training opportunities and the development of strategies to attract people to the region and build capacity.
Special projects proposed in the Stage 1 business case fail to achieve the water savings and modernisation objectives.
• Incorporation of key learning’s into the Stage 1 Business Case Addendum supported by appropriate modelling of the option value.
• Ongoing reporting with the flexibility to explore and implement alternative programs.
Accountability for Stage 1 and Stage 2 delivery adequately separated from other business operations.
• That clear accountability for Stage 1 and Stage 2 programs is incorporated into the design of the integrated entity structure.
• That business units be structured to meet the functional requirements of the program incorporating appropriate management responsibilities with delegated authorities for ensuring the delivery of key activities.
• That performance of business units and management be monitored and reported through the executive to the Board.
• That appropriate business systems are in place including IT systems to support the integrated operations.
Post merger, continue to maintain appropriate construction safety related measures aimed at achieving zero safety risk tolerance.
• Consider all potentially effective methods of channel remediation to be incorporated into the program.
• Communicate with irrigation communities in relation to safety measures which they seek.
• Give every reasonable consideration to the Risk Appetite Statement where NVIRP must drive at zero risk tolerance on safety.
Establish clear priorities and coordinate work streams to avoid loss of focus on key project deliverables.
• Invite G-MW participation in the ERP project to promote opportunity for GMW to leverage off the project and increase G-MW awareness of importance of the ERP system to project deliverables.
• Work collegiately with G-MW to promote G-MW understanding of commitments made by State to Commonwealth for Stage 2 funding.
• Conduct an internal audit of the merger plan to provide assurance to NVRIP Board that process is comprehensive and able to be implemented by NVIRP.
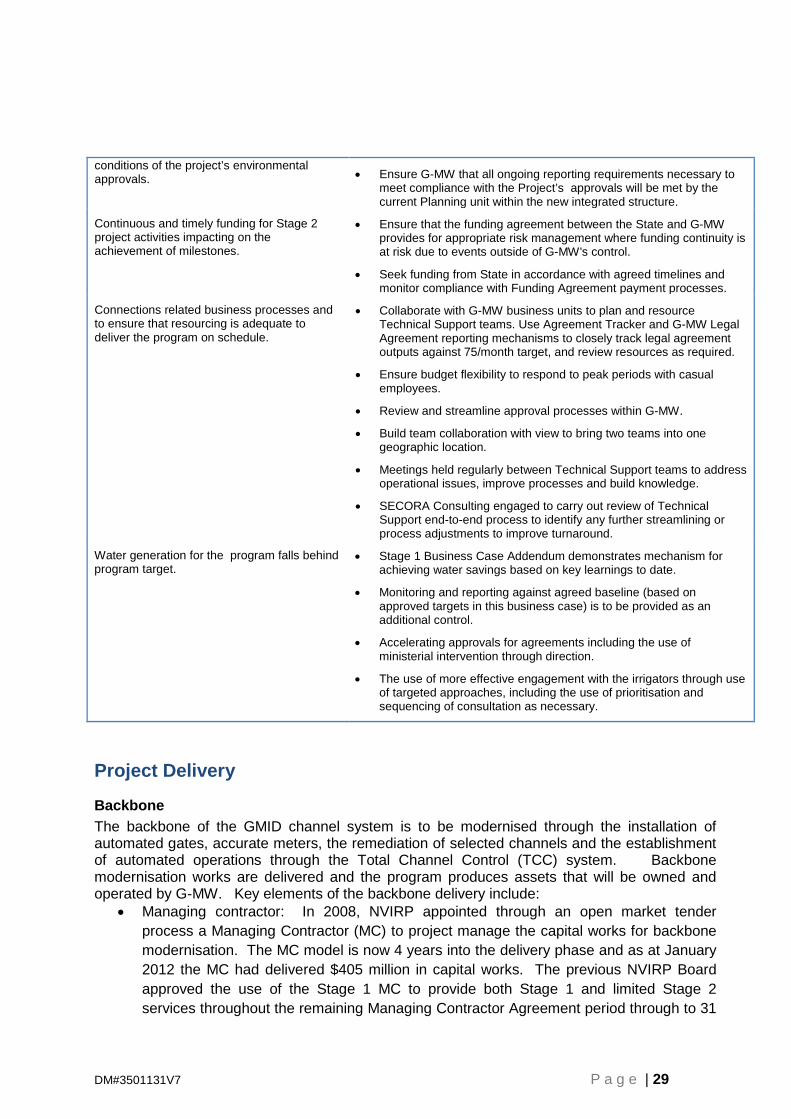
Failure of the integrated organisation to ensure continuity of compliance with the
• Inform appropriate management personnel within G-MW of the Projects environmental and planning approvals.
DM#3501131V7 P a g e | 29
conditions of the project’s environmental approvals. • Ensure G-MW that all ongoing reporting requirements necessary to
meet compliance with the Project’s approvals will be met by the current Planning unit within the new integrated structure.
Continuous and timely funding for Stage 2 project activities impacting on the achievement of milestones.
• Ensure that the funding agreement between the State and G-MW provides for appropriate risk management where funding continuity is at risk due to events outside of G-MW's control.
• Seek funding from State in accordance with agreed timelines and monitor compliance with Funding Agreement payment processes.
Connections related business processes and to ensure that resourcing is adequate to deliver the program on schedule.
• Collaborate with G-MW business units to plan and resource Technical Support teams. Use Agreement Tracker and G-MW Legal Agreement reporting mechanisms to closely track legal agreement outputs against 75/month target, and review resources as required.
• Ensure budget flexibility to respond to peak periods with casual employees.
• Review and streamline approval processes within G-MW.
• Build team collaboration with view to bring two teams into one geographic location.
• Meetings held regularly between Technical Support teams to address operational issues, improve processes and build knowledge.
• SECORA Consulting engaged to carry out review of Technical Support end-to-end process to identify any further streamlining or process adjustments to improve turnaround.
Water generation for the program falls behind program target.
• Stage 1 Business Case Addendum demonstrates mechanism for achieving water savings based on key learnings to date.
• Monitoring and reporting against agreed baseline (based on approved targets in this business case) is to be provided as an additional control.
• Accelerating approvals for agreements including the use of ministerial intervention through direction.
• The use of more effective engagement with the irrigators through use of targeted approaches, including the use of prioritisation and sequencing of consultation as necessary.
Project Delivery
Backbone The backbone of the GMID channel system is to be modernised through the installation of automated gates, accurate meters, the remediation of selected channels and the establishment of automated operations through the Total Channel Control (TCC) system. Backbone modernisation works are delivered and the program produces assets that will be owned and operated by G-MW. Key elements of the backbone delivery include:
• Managing contractor: In 2008, NVIRP appointed through an open market tender process a Managing Contractor (MC) to project manage the capital works for backbone modernisation. The MC model is now 4 years into the delivery phase and as at January 2012 the MC had delivered $405 million in capital works. The previous NVIRP Board approved the use of the Stage 1 MC to provide both Stage 1 and limited Stage 2 services throughout the remaining Managing Contractor Agreement period through to 31
DM#3501131V7 P a g e | 30
December 2012. G-MW confirmed the decision to retain the MC to 31 December 2012. The NVIRP Board (May 2012) endorsed the engagement of a modified Stage 2 Managing Contractor through a competitive tender process.
• Occupational health and safety: G-MW is committed to ensuring a healthy and safe working environment across all project activities. To this end, the organisation maintains OH&S which includes periodical reviews, appropriate training, provision of resources to ensure OH&S is integrated into all activities in the organisation, investigation of all risk incidents and ensuring all contractors comply with OH&S requirements.
• Value for money: the majority of the equipment and construction and planning services for the backbone project are sourced through competitive tendering processes to ensure value for money outcomes. For tendering purposes, repeatable works are aggregated into discrete works packages which provide the optimum flexibility and competiveness with the contracting work force. However, automation equipment (Total Channel Control TCC) used by the project is provided under a sole source arrangement. Price transparency measures and controls form part of the statement of works under this arrangement.
• Environmental management framework rigorous environmental policies have been established in accordance with the policy framework established by Government. This has enabled the environmental approval process to develop from one where each work site required separate external approval to a situation where separate approval is only required in high risk sites. .
Connections The expected outcome from the Connections Program is a 50 per cent reduction in the footprint of the public channel delivery system. The timing of delivery for both the connections programs has lagged relative to the targets for the program. In addition a range of issues specific to the connections program were raised in the 2011 Victorian Ombudsman’s report into the Foodbowl Modernisation Project and related matters. In response a range of initiatives have been implemented or identified to accelerate the delivery and improve the governance of the Connections program. Key initiatives include:
• Strategic Connections Projects (SCPs): SCPs is a revised approach to implementing the Connections Program with the focus on developing connection solutions with groups of landowners in contiguous channel area. This revised delivery framework commenced in July 2011 and involves the establishment of a landowner committee to represent the group and to provide customers with an active role in generating ideas and making decisions about their future water supply. The landholder-based structure for the SPC will also assist in the delivery of a range of initiatives including reconfiguration plans and rural residential strategies.
• Reconfiguration Plans: From 1 July 2012 each SCP will be managed as a Reconfiguration Plan, with the SCP process aligned with the reconfiguration requirements outlined in the Water Act 1989. The goal of each reconfiguration plan will be to achieve agreement, using Project funding to connect irrigation properties to the Backbone. However, at the end of this process when all options have been exhausted

DM#3501131V7 P a g e | 31
and the community and individuals have had the opportunity to present their views, if one person or a group of persons is holding out unnecessarily and preventing a good outcome for the irrigation area the mandatory reconfiguration powers under Part 7A of the Water Act, 1989 may be used.
• Advanced Project Manager Model: Proposed from 1 July 2012, Project funded on-farm works will be managed and implemented by suitably qualified project managers appointed to each SCP from a project manager panel established by the Connections Project. This will assist with the roll-out of on-farm works undertaken as part of the Connections program by addressing concerns raised about the quality of works, OH&S compliance and cost effectiveness.
• Farm Designer Panel: Proposed by August 2012 to re-tender the Panel with a view to increasing the amount of farm designer resources available. Tender criteria will include the outcomes of the Governments review of Farm Designer governance arrangements as recommended by the Ombudsman.
• Connections Program Implementation Plan: The approval of the 2012 Stage 1 Business Case Addendum was conditional on a Connections Program Implementation Plan being developed and endorsed by the Minister for Water and Treasurer.
• Independent Review Panel: An Independent Review Panel for the Connections Program was established in December 2011. The Independent Review Panel gives landowners involved in SCP’s the opportunity to seek an independent review of decisions taken by G-MW (NVIRP)which impact on them.
• Response to Ombudsman’s Review: On 24 November 2011 the Victorian Ombudsman tabled in Parliament his report “Victorian Ombudsman, Foodbowl Modernisation Project and related matters, November 2011” setting out his findings from his investigation into the Foodbowl Modernisation Project. A range of issues specific to the connections program were raised in the Ombudsman’s reports. The former NVIRP accepted the Ombudsman’s recommendations and developed action plans to deal with the identified issues. Post 1 July 2012, any outstanding actions were transitioned to G-WM following the integration.
• Response to Privacy Commissioner Review: In March 2012 the Victorian Privacy Commissioner found a number of breaches of the Information Privacy Act by NVIRP and G-MW to which it required rectification by 30 June 2012. A number of the actions required of NVIRP have already been implemented or progressed with the remainder targeted to be completed by 30 June 2012. Where NVIRP is unable to complete any actions by 30 June 2012 the Compliance Notice issued on G-MW requires that entity to complete those actions by 1 September 2012.

DM#3501131V7 P a g e | 32
Project Governance
Revised Project Governance Arrangements There are specific project governance arrangements that have been put into place as a response to issues identified during the delivery of Stage 1, recommendations from the Ombudsman’s Investigation, the Privacy Commissioner’s report and as a consequence of the Victorian Government’s agreement with the Commonwealth to deliver Stage 2. The primary project specific governance arrangements are:
• Project Governance Committee: There is a project governance committee to oversee the governance arrangements between the government and G-MW. The committee will include members from DSE, DTF and G-MW and be chaired by G-MW as the project owner. The committee will have a role in initially settling the detailed project reporting arrangements consistent with the funding agreements and then an ongoing role in project oversight.
• Government Project Reporting Requirements: The Connections Project is required to provide timely and detailed information that allows for the tracking of the State and Commonwealth government’s investment including audit reports and early identification of risks and issues impacting on the delivery of the project. The Project Governance Committee will be responsible for finalising the detail of these arrangements.
• Funding Agreements: Detailed project reporting requirements are outlined in the Connections Project Stage 1 and Stage 2 funding agreements.
• Project Variations: G-MW must notify government via the Government Project Committee prior to: making a material variation to the Stage 1 project and undertaking a new task outside the scope of the Business Case. A set of thresholds and processes to-manage project variations for the Stage 1 project have been defined and approved through the Stage 1 Business Case Addendum.
Ring Fencing of Connection Project activities Ring fencing of the Connections Project activities from G-MW’s “business-as-usual” will be required post integration to ensure that funding provided for Stage 1 and Stage 2 is used exclusively for the activities associated with each stage and is separated from G-MW operations. G-MW has implemented a range of initiatives to address ring fencing requirements:
• The Connections Project has configured its financial management and project management systems to ensure that funding, expenditure and physical works are tracked and reported separately for Stage 1 and Stage 2;
• a suite of business rules has been implemented to document and control how project activities and expenditure will be identified, tracked and reported as either Stage 1 or Stage 2; and
• Implementation of a new Enterprise Resource Planning system (ERP) from 1 July 2012 to support monitoring and reporting on activities, procurement and expenditures.

DM#3501131V7 P a g e | 33
G-MWs new organisational structure is designed to ring fence the Connections Project from G-MW’s “business as usual”. The key organisational structural elements include:
• the establishment of a new business unit within G-MW to deliver the connections program;
• a dedicated Connections Project Directors office has been established in the G-MW Managing Director’s office to oversee the project and ensure clear accountability for the delivery of the project within G-MW; and
• G-MW’s Construction/Project Delivery business includes the Project’s capital works team with clear lines of accountability established through to the Project Director and accounting separation.
Connections Project Governance Significant changes to the internal governance arrangements for the Connections project are proposed as an outcome of the 2012 Stage 1 Business Case Addendum. The proposed arrangements are:
• financial separation: greater levels of structured supervision and control over financial decision making within the Connections group is proposed including review and sign off the level of incentive rates and escalation of rates on an annual basis;
• baseline scheduling: a master schedule of the Connections project is under development which sets out a timeline, resource requirements and milestones for each of the phases or stages of the Connections project with monthly reporting against the baseline schedule; and
• Enhanced reporting: actuarial style reporting on financial exposure in relation to landholder agreements leveraging off the implementation of the ERP system including detailed reporting on expenditure by Connection’s program phase and landowner business case providing enhanced transparency.

DM#3501131V7 P a g e | 34
KPIs The Connections Project performance is assessed by reference to progress towards meeting milestone targets for the quantity of backbone and connections works, and the volume of project water generation.
Works Milestones
The table below shows the works milestone forecasts for Stage 1 from the 2011-12 Corporate Plan and the forecasts prepared for this 2012-13 Corporate Plan.
Table 0-1 Stage 1 Works Milestone Schedule – 2011/12 vs 2012/13 Corporate Plans
Project milestone
2011/12 2012/13 2013/14 2014/15 2015/16 2016/17 2017/18 Total2
11/12 Corp Plan
12/13 Corp Plan
11/12 Corp Plan
12/13 Corp Plan
11/12 Corp Plan
12/13 Corp Plan
11/12 Corp Plan
12/13 Corp Plan
11/12 Corp Plan
12/13 Corp Plan
11/12 Corp Plan
12/13 Corp Plan
11/12 Corp Plan
12/13 Corp Plan
11/12 Corp Plan
12/13 Corp Plan
Channel Automation (no. of automated gates installed)
265 188 61 93 0 71 na 0 na 0 na 0 na 0 2854
2880
Backbone and connections metering (no. of meters installed)
1012 812 136
7 496 0 360 na 260 na 260 na 260 na 78 5564
5580
Channel remediation (kms of channel remediated)
68 53 48 25 45 0 na 0 na 0 na 0 na 0 225 142
Channel rationalised (kms of channel rationalised)1
299 236 241 55 0 55 na 55 na 55 na 29 na 0 859 759
Delivery share relocated to backbone (ML/day)1
635 581 750 192 0 192 na 192 na 192 na 104 na 0 2258
2258
Notes: 1. this measure is not the actual length of channel decommissioned or delivery share relocated. Rather it is a measure of the ‘commitments’ based on executed legal agreements. The measure of ‘commitments’ is used as it aligns with the cash flow expenditure. NVIRP also reports to Goverenment and stakeholders on the actual length of channel decommissioned; 2. includes works completed from the commencement of the project in 2007/08.
The 2012-13 Corporate Plan milestone schedule for Stage 1 reflects the approved changes to project works scope endorsed through the 2012 Stage 1 Business Case Addendum. The material changes from the 2011-12 Corporate Plan are:
• an extension of the completion date for the Stage 1 project from 2014-15 to 2017-18 with consequent changes to the delivery schedule for each of the project milestones. This extension aligns the time frame for delivery of Stage 1 with Stage 2 in accordance with Government policy;
• a substantial reduction in the length of channel of channel remediation from 225 km to 142 km. This program has targeted high loss channels which were thought, at the time of the original Business Case for Stage 1, to comprise approximately 20 per cent of the total length of channel. Experience has shown that there are fewer high loss channels in

DM#3501131V7 P a g e | 35
the GMID system than originally expected and costs have been significantly higher than forecast; and
• Stage 1 channel rationalisation target has been reduced from 859 km to 759 km with the difference attributable to 100 km of backbone extensions. Over the course of the project it has been found that in a number of cases it is not cost effective to build long individual private connections to the backbone and it is more sensible to extend the backbone to shorten these connections.
• reduction in the number of automated gates installed in 20011-12 due installation being put on hold pending decisions on backbone extensions and execution of connection business cases. Also, a 6 gate site at Kow Swamp was put on hold in 2011-12 due to cultural heritage issues.
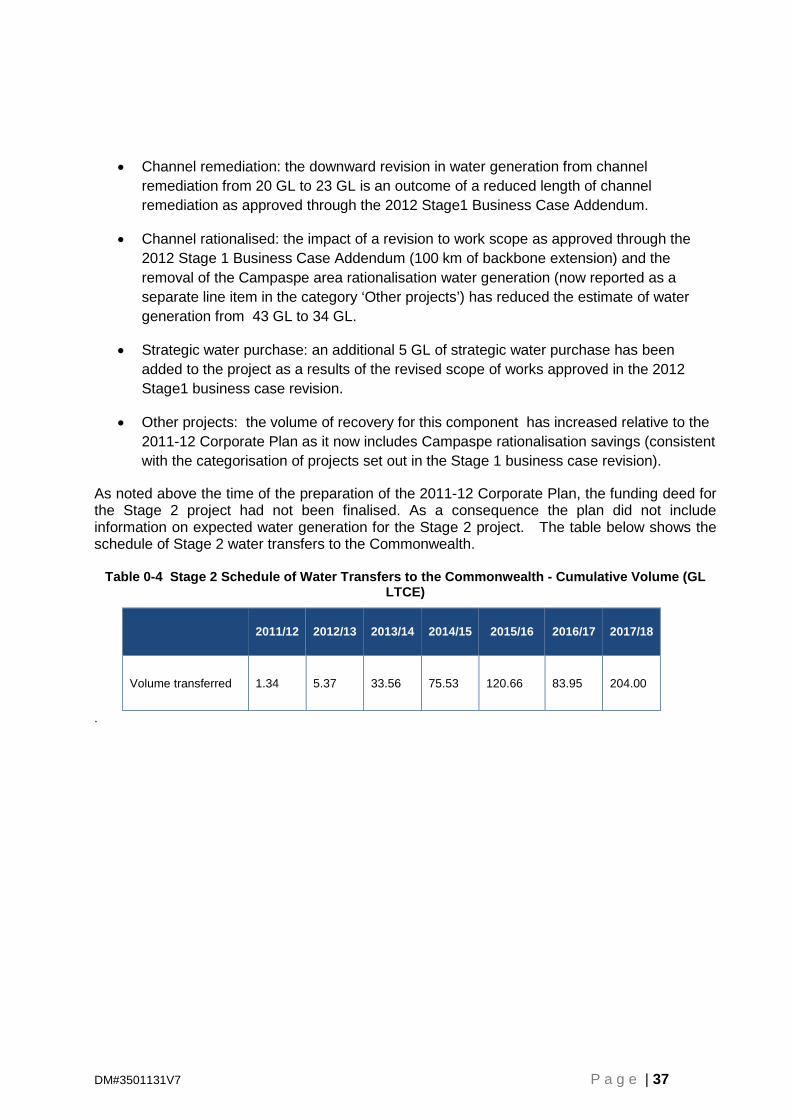
At the time of the preparation of the 2011-12 Corporate Plan, the funding deed for the Stage 2 project had not been finalised and as a consequence the plan did not include information on milestones of financials for the Stage 2 project. On this basis the table below shows the milestone forecasts for the Stage 2 project for this Corporate Plan only. These forecasts are from the NVIRP 2012-13 Annual Works Cashflow and Milestones submission and were approved by the NVIRP Board on the 25th of May 2012.
Table 0-2 Stage 2 Works Milestone Schedule –2012/13 Corporate Plan3
Project milestone 2011/12 2012/13 2013/14 2014/15 2015/16 2016/17 2017/18 Total
Channel Automation (no. of automated gates installed)
0 0 0 0 0 0 0 0
Backbone and connections metering (no. of meters installed)
0 385 1,007 1,493 1,201 1,181 633 5,900
Channel remediation (kms of channel remediated)
0 1 9 20 20 19 7 77
Channel rationalised (kms of channel rationalised)1
0 142 331 393 416 577 401 2,259
Delivery share relocated to backbone (ML/day)2
0 334 777 918 972 1,356 943 5,300
Notes: 1. based on actual completed works; 2 based on executed legal agreements; 3 based on reporting of milestones at 30 June each year
Water Generation
The Project aims to recover 429 GL in long-term cap equivalent (LTCE) water over the course of the project comprising 225 GL from Stage 1 and 204 GL from Stage 2. Project generated water will be sourced primarily from a reduction in the volume of water losses incurred in the GMID delivery system resulting from the implementation of the project works programs. Project

DM#3501131V7 P a g e | 36
water will also be sourced from the strategic acquisition of water entitlements complementing the delivery of the Connections works program. Water is generated progressively over the term of the project based upon completion of the works program. The table below shows the Stage 1 water generation estimates from the 2011-12 Corporate Plan (for 2011-12 and for the whole of project) and the revised forecast produced for this 2012-13 Corporate Plan for the years 2011-12 and 2012-13 and for the whole of project.
Table 0-3 Stage 1 Cumulative Volume of Project Water Generation - 2011/12 and 2012/13 Corporate Plans (GL LTCE)
Project component
2011/12 2012/13 Whole of Project Total
11/12 Corp Plan
12/13 Corp Plan
12/13 Corp Plan
11/12 Corp Plan
12/13 Corp Plan
Channel Automation 50 49 50 54 51
Backbone metering 43 50 56 58 65
Connection metering 11 7 12 28 31
Channel remediation 15 11 13 20 13
Channel rationalised 19 9 15 43 34 Strategic water purchase 19.6 19 20 19.6 24
Other projects 6.5 8 13 6.5 13 Total 164 154 180 229 232*
• Includes an amount of 7 GL as a risk allowance approved through the Stage 1 Business Case Addendum
The 2012-13 Corporate Plan schedule for Stage 1 water generation incorporate the approved changes to Stage 1 works scope endorsed through the 2012 Stage 1 business case revision. The material changes from the 2011-12 Corporate Plan in terms of the whole of project targets are:
• Channel automation: channel automation water recovery has been revised up relative to the original Stage 1 business case to reflect historic under-recording of outfalls. An initial estimate of the impact of outfall under-recording was incorporated into the 2011-12 Corporate Plan estimate of 54 GL.
• Backbone metering: the 58 GL estimate reported for backbone metering in the 2011-12 Corporate Plan was from the original Stage 1 business Case. G-MW has subsequently identified that a higher proportion of the losses in the base line water balance were attributed to unauthorised use. The installation of the new regulator gates and new magnetic meters or flume gate meters at customer service points by NVIRP are expected to lead to a significant reduction in unauthorised use across the GMID. This has resulted in a upward revision to the water generation forecast for backbone metering to 65 GL.
• Connections metering: the whole of project forecast is revised upward reflecting the revised assessment of unauthorised use.
DM#3501131V7 P a g e | 37
• Channel remediation: the downward revision in water generation from channel remediation from 20 GL to 23 GL is an outcome of a reduced length of channel remediation as approved through the 2012 Stage1 Business Case Addendum.
• Channel rationalised: the impact of a revision to work scope as approved through the 2012 Stage 1 Business Case Addendum (100 km of backbone extension) and the removal of the Campaspe area rationalisation water generation (now reported as a separate line item in the category ‘Other projects’) has reduced the estimate of water generation from 43 GL to 34 GL.
• Strategic water purchase: an additional 5 GL of strategic water purchase has been added to the project as a results of the revised scope of works approved in the 2012 Stage1 business case revision.
• Other projects: the volume of recovery for this component has increased relative to the 2011-12 Corporate Plan as it now includes Campaspe rationalisation savings (consistent with the categorisation of projects set out in the Stage 1 business case revision).
As noted above the time of the preparation of the 2011-12 Corporate Plan, the funding deed for the Stage 2 project had not been finalised. As a consequence the plan did not include information on expected water generation for the Stage 2 project. The table below shows the schedule of Stage 2 water transfers to the Commonwealth.
Table 0-4 Stage 2 Schedule of Water Transfers to the Commonwealth - Cumulative Volume (GL LTCE)
2011/12 2012/13 2013/14 2014/15 2015/16 2016/17 2017/18
Volume transferred 1.34 5.37 33.56 75.53 120.66 83.95 204.00
.

DM#3501131V7 P a g e | 38
Section 5 - 2012/13 Financial Performance

DM#3501131V7 P a g e | 39
1 Financial Overview
Overview Period of Financial Change Aligned with the strategic priorities and operational change, G-MW is also going through a period of significant financial change. This arises from:
• The integration of the NVIRP business on 1 July 2012 including full project delivery and financial accountability.
• Delivery of G-MW’s Water Plan 3 covering the period 2013/14 to 2015/16. • Movement into a period with improved water availability following a long period of
drought. • Roll out of the modernisation of G-MW’s gravity irrigation system. • Working through a number of regulatory and commercial matters affecting G-MW
revenue and expenditure. • Not yet quantified but potentially material financial impacts arising from the
outcomes of the water delivery volume reductions of the Murray Darling Basin Plan.
The financial information contained in this Corporate Plan excludes the impacts of :
• Organisational transformation which G-MW is currently undertaking and which is not expected to be completed until the second quarter of the 2013 calendar year.
• Review and approval processes with economic regulators in relation to Water Plan 3.
• Ongoing organisational transformation in the longer term.
• Tariff strategy.
As a result G-MW expects the financials presented in this plan to change over the forecast period.
Financial Sustainability With the appointment of a new Board and Managing Director a strong focus has been placed on maintaining the long term financial viability of G-MW. Reflecting this G-MW has extensively enhanced the Financial Reporting and Performance Measurement Framework (“Framework”) that provides the basis for assessing G-MW’s financial position and ensuring sustainability into the future. This Framework will continue to be developed over time but in particular reports and performance measures underpinning the framework will be developed and/or will be altered significantly over the next 12 months as the changes to G-MW’s operational and financial structure take place. These changes include the impact of the Connections
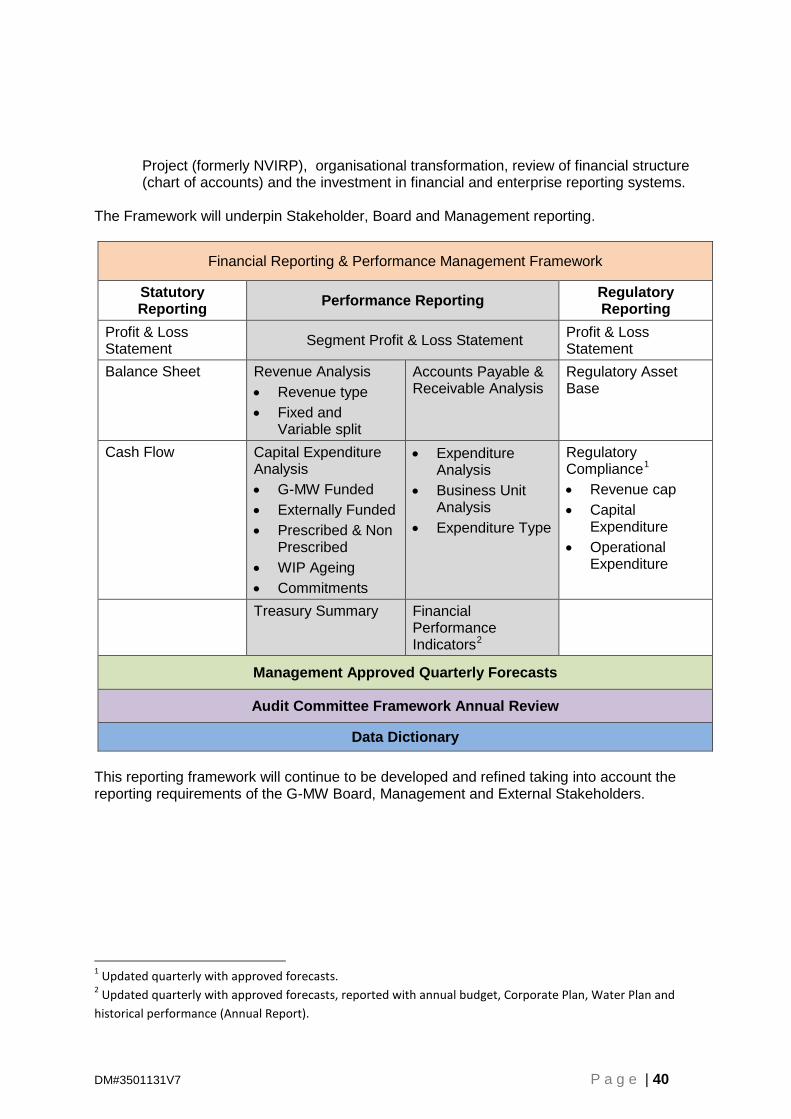
DM#3501131V7 P a g e | 40
Project (formerly NVIRP), organisational transformation, review of financial structure (chart of accounts) and the investment in financial and enterprise reporting systems.
The Framework will underpin Stakeholder, Board and Management reporting.
Financial Reporting & Performance Management Framework
Statutory Reporting Performance Reporting Regulatory
Reporting Profit & Loss Statement Segment Profit & Loss Statement Profit & Loss
Statement Balance Sheet Revenue Analysis
• Revenue type • Fixed and
Variable split
Accounts Payable & Receivable Analysis
Regulatory Asset Base
Cash Flow Capital Expenditure Analysis • G-MW Funded • Externally Funded • Prescribed & Non
Prescribed • WIP Ageing • Commitments
• Expenditure Analysis
• Business Unit Analysis
• Expenditure Type
Regulatory Compliance1 • Revenue cap • Capital
Expenditure • Operational
Expenditure
Treasury Summary Financial Performance Indicators2
Management Approved Quarterly Forecasts
Audit Committee Framework Annual Review
Data Dictionary This reporting framework will continue to be developed and refined taking into account the reporting requirements of the G-MW Board, Management and External Stakeholders.
1 Updated quarterly with approved forecasts. 2 Updated quarterly with approved forecasts, reported with annual budget, Corporate Plan, Water Plan and historical performance (Annual Report).

DM#3501131V7 P a g e | 41
Financial Performance Summary G-MW’s financial performance set out in this Corporate Plan has been determined based on securing G-MW’s long term financial sustainability. G-MW places a strong focus on ensuring the operations of the business and generation of operating cash flows are sufficient to sustain operations. Given the nature of the financial performance measures the financials of the Connections Project have been excluded from the relevant financial performance measures as it is likely to distort the financial measures making them less meaningful. As such the performance measures noted below are for the G-MW Water Storage and Delivery business only (G-MW prior to integration). Performance Measure (Water Storage & Delivery Business only)
Target Commentary
EBITDA3 Positive Positive EBITDA indicates business operations are sustainable
Operating cash flows Positive
Positive operating cash flows indicates business generates sufficient revenues to pay its expenditure
Underlying Cash Interest Cover Ratio 2.0 times
(Min 1.5 times)
Target ratio generates sufficient revenues to comfortably cover interest expense
(G-MW adjusts this ratio to exclude operating cash flows associated with revenue attributable to capital contributions)
Internal Financing Ratio
>40%
Target ratio indicates sufficient generation of revenue to fund a large portion of capital expenditure. Ensures that debt levels are not increasing unsustainably (G-MW adjusts this ratio to reflect equity capital contributions that are used to fund G-MW’s capital program)
Capital Investment Ratio
>1.0 times
Target indicates that the capital expenditure program is sufficient to renew the asset base
(As this ratio is affected by year on year fluctuations in a capital program, G-MW averages this over 10 year period consisting of historical and forecast data)
The ‘traffic light’ analysis in the following table highlights that the budgeted and forecast financial performance achieves the sustainability metrics in this Corporate Plan.
3 Earnings Before Interest, Tax, Depreciation & Amortisation (“EBITDA”) in the Statement of Financial Performance
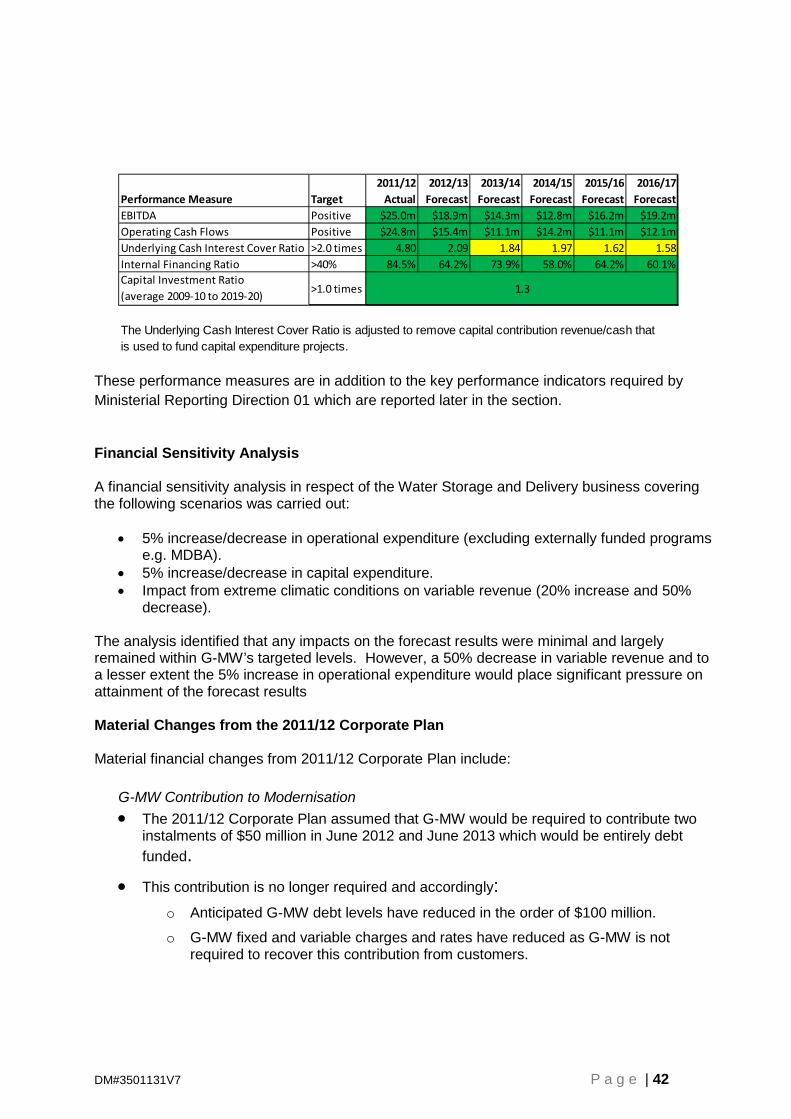
DM#3501131V7 P a g e | 42
2011/12 2012/13 2013/14 2014/15 2015/16 2016/17
Performance Measure Target Actual Forecast Forecast Forecast Forecast ForecastEBITDA Positive $25.0m $18.9m $14.3m $12.8m $16.2m $19.2mOperating Cash Flows Positive $24.8m $15.4m $11.1m $14.2m $11.1m $12.1mUnderlying Cash Interest Cover Ratio >2.0 times 4.80 2.09 1.84 1.97 1.62 1.58Internal Financing Ratio >40% 84.5% 64.2% 73.9% 58.0% 64.2% 60.1%Capital Investment Ratio(average 2009-10 to 2019-20) >1.0 times
The Underlying Cash Interest Cover Ratio is adjusted to remove capital contribution revenue/cash that is used to fund capital expenditure projects.
1.3
These performance measures are in addition to the key performance indicators required by Ministerial Reporting Direction 01 which are reported later in the section. Financial Sensitivity Analysis A financial sensitivity analysis in respect of the Water Storage and Delivery business covering the following scenarios was carried out:
• 5% increase/decrease in operational expenditure (excluding externally funded programs e.g. MDBA).
• 5% increase/decrease in capital expenditure. • Impact from extreme climatic conditions on variable revenue (20% increase and 50%
decrease). The analysis identified that any impacts on the forecast results were minimal and largely remained within G-MW’s targeted levels. However, a 50% decrease in variable revenue and to a lesser extent the 5% increase in operational expenditure would place significant pressure on attainment of the forecast results Material Changes from the 2011/12 Corporate Plan Material financial changes from 2011/12 Corporate Plan include:
G-MW Contribution to Modernisation • The 2011/12 Corporate Plan assumed that G-MW would be required to contribute two
instalments of $50 million in June 2012 and June 2013 which would be entirely debt funded.
• This contribution is no longer required and accordingly: o Anticipated G-MW debt levels have reduced in the order of $100 million.
o G-MW fixed and variable charges and rates have reduced as G-MW is not required to recover this contribution from customers.

DM#3501131V7 P a g e | 43
c Revaluation G-MW’s 2011-12 Corporate Plan was published prior to the revaluation of its infrastructure at 30 June 2011. The revaluation was significantly higher than estimated in the Corporate Plan. This has resulted in:
• Approximately $600 million increase in the opening value of infrastructure fixed assets.
• Higher annual depreciation expense of approximately $20 million incurred during the Plan period.
Connections Project Integration
As noted this financial information includes the Connections Project for the first time subsequent to its integration with G-MW on 1 July 2012.
The forecast results show increased losses for the G-MW business as a result of the integration of the Connections Project business. An improved Net Asset position is reported due to the higher asset base through the integration of the Connections Project which is financed by Contributions received from project funders.
The forecast results for the Connections Project have been based on the most recent budget which was approved by the NVIRP Board prior to integration. This budgeted position will be reviewed as part of the Connections Project review in December 2012.
Capital Expenditure
Summary of capital expenditure spend 2011/12 vs 2012/13 Corporate Plan2011/12 2012/13 2013/14 Total
Actual figures from Corporate Plans $'000s $'000s $'000s $'000s
2012/13 Corporate Plan 36,129 108,809 107,416 252,3542011/12 Corporate Plan 48,855 32,017 33,101 113,973Variance (12,726) 76,792 74,315 138,381The 2012/13 Corporate Plan figures include Connections Project capital expenditure.
G-MW has developed a 10 year capital expenditure plan in preparation for the 2012/13 budget and Water Plan development process. As a result of this process there have been changes in the priority, timing and value of projects which has resulted in the overall 7.8% decrease in total capital expenditure over the comparison period. In addition G-MW has assessed its performance against planned Water Plan 2 capital expenditure and will under spend by approximately $47 million due to a combination of drivers:
• Reduction in capital expenditure to take into account modernisation. • Impact of drought and floods.
DM#3501131V7 P a g e | 44
Financial Statements
The financial statements presented in this Corporate Plan cover the period from financial year 2012/13 to 2016/17. As discussed above it is important to note that:
• The current Water Plan only covers the period up until 2012/13 and beyond this period forecasts are based on G-MW’s unapproved Water Plan 3 and Water Plan 4.
• Material changes arising from G-MW transformation are excluded from these statements.
General Drivers of Financial Performance
This Corporate Plan has been derived using the following key assumptions:
• CPI rate has been assumed to be 2.5% for 2012/13 expenditure escalation calculations. This is based on the Victorian State Budget Paper 2 (Victorian Economic Projections) May 2012.
• 2012/13 – 2016/17 revenue and expenditure has assumed an index rate of 2.75% to convert to nominal dollars.
• Prescribed revenue is based on 2012/13 Price Submission which used the March 2012 CPI as directed by the ESC.
• Labour cost increases of 4% consistent with the Enterprise Agreement 2010. We note that staff numbers are currently budgeted to be around 813 Full Time Equivalents including the Connections Project. This number will be impacted by the transformation process, however the final impact is not known at this time.
• Depreciation and amortisation has been calculated based on the fair valuation at 30 June 2011 adjusted for disposal, additions and depreciation over the Corporate Plan period.
• Interest has been calculated using a weighted average interest rate of 7.0%
• The budgets assume that the Connections Project is completed on time, fully and successfully and progress is factored in.
• Service standards and water deliveries projections are used to set the foundations for operating and capital budgets and budgets were tested to ensure that there is clear linkage and alignment or are adjusted accordingly.
• The introduction of the Carbon Price will impact on G-MW’s business. This Corporate Plan includes an annual increase in electricity prices to reflect the likely impact of the Carbon Tax. No other financial impacts of the Carbon Tax have been factored in at this time as there is insufficient information available to accurately quantify the impacts.
• IT and labour costs are expected to increase in real terms, on average, by 2.4% and 1.3% per annum.
• Climatic Conditions & Supply and Demand

DM#3501131V7 P a g e | 45
o The two year La Nina event which has produced higher than average summer rainfalls in Northern Victoria has ended according to the Bureau of Meteorology’s (BoM) Season Climate Outlook for May to July 2012 issued on 24 April 2012.
o All the key climate indicators are now at neutral. The climate models surveyed by the BoM indicate neutral conditions are likely to continue in the short term. For the 2012/13 season, conditions are favourable for strong deliveries due to the high volumes of unused allocation which will be carried over and the full storages which will result in high seasonal determinations.
o In the longer term the water availability and demands have been adopted based on a climate change scenario which features reductions in autumn and winter rainfall and an increase in summer rainfall. We are currently forecasting for 100% of high reliability water entitlements albeit these entitlements are expected to decrease over the period.
• It is assumed that the modernisation program and general economic conditions will provide a sustainable economic platform for G-MW’s ongoing operations
Statement of Financial Performance
The EBITDA result over the Plan period highlights the focus on securing a financially sustainable position for G-MW. The key revenue drivers underpinning the EBITDA results for the Water Storage and Delivery business are:
• Increase in prescribed service and usages charges by approximately 1.5% per annum.
• Estimated government contributions based on existing and forecast project contributions.
• Estimated MDBA revenue based on the anticipated capital and operational programs.
The key expenditure drivers underpinning the EBITDA results for the Water Storage and Delivery business are:
• Increase in operations and maintenance expenditure reflecting the increased costs associated with modernisation and management of a hybrid modernised system over the Corporate Plan period.
• Expenditure associated with government contributions is matched with revenue expectations as set out above.
• Estimated MDBA expenditure is based on the anticipated capital and operational programs.
• Environmental levies are assumed to continue into time.
The key driver underpinning the Connections Project result is the timing of revenue compared with project expenditure.
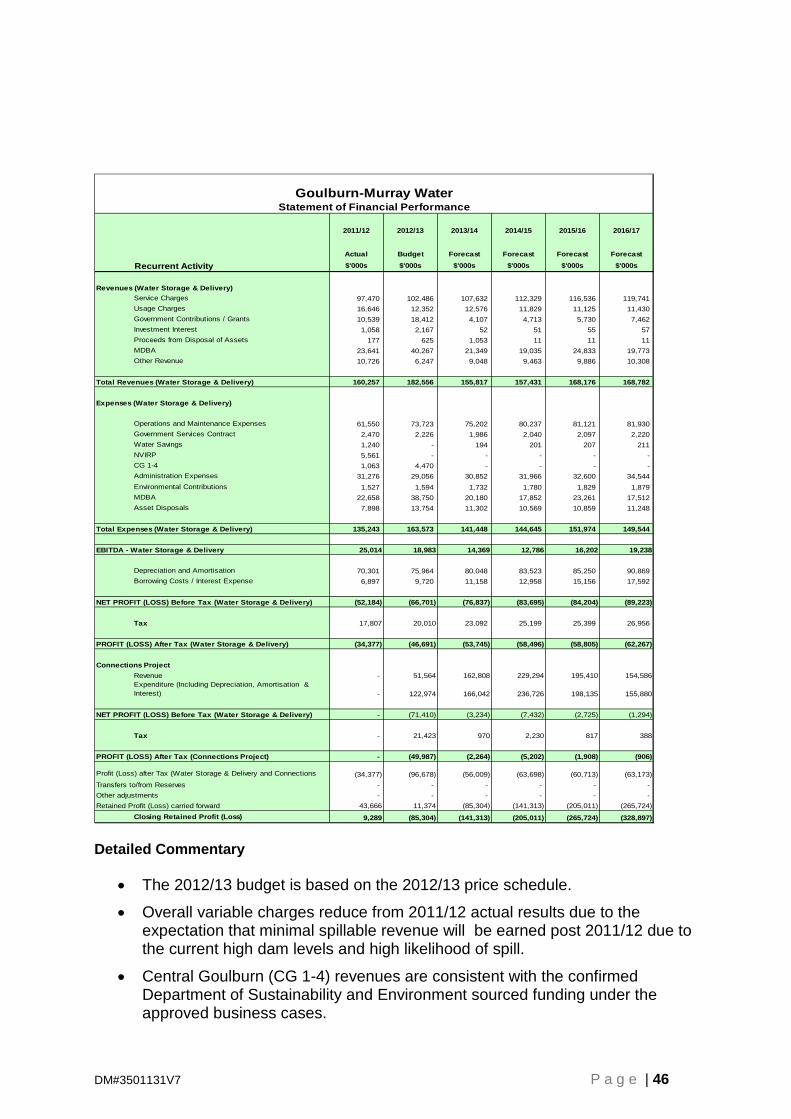
DM#3501131V7 P a g e | 46
2011/12 2012/13 2013/14 2014/15 2015/16 2016/17
Actual Budget Forecast Forecast Forecast Forecast
Recurrent Activity $'000s $'000s $'000s $'000s $'000s $'000s
Revenues (Water Storage & Delivery)Service Charges 97,470 102,486 107,632 112,329 116,536 119,741 Usage Charges 16,646 12,352 12,576 11,829 11,125 11,430 Government Contributions / Grants 10,539 18,412 4,107 4,713 5,730 7,462 Investment Interest 1,058 2,167 52 51 55 57 Proceeds from Disposal of Assets 177 625 1,053 11 11 11 MDBA 23,641 40,267 21,349 19,035 24,833 19,773 Other Revenue 10,726 6,247 9,048 9,463 9,886 10,308
Total Revenues (Water Storage & Delivery) 160,257 182,556 155,817 157,431 168,176 168,782
Expenses (Water Storage & Delivery)
Operations and Maintenance Expenses 61,550 73,723 75,202 80,237 81,121 81,930 Government Services Contract 2,470 2,226 1,986 2,040 2,097 2,220 Water Savings 1,240 - 194 201 207 211 NVIRP 5,561 - - - - -CG 1-4 1,063 4,470 - - - - Administration Expenses 31,276 29,056 30,852 31,966 32,600 34,544 Environmental Contributions 1,527 1,594 1,732 1,780 1,829 1,879 MDBA 22,658 38,750 20,180 17,852 23,261 17,512 Asset Disposals 7,898 13,754 11,302 10,569 10,859 11,248
Total Expenses (Water Storage & Delivery) 135,243 163,573 141,448 144,645 151,974 149,544
EBITDA - Water Storage & Delivery 25,014 18,983 14,369 12,786 16,202 19,238
Depreciation and Amortisation 70,301 75,964 80,048 83,523 85,250 90,869 Borrowing Costs / Interest Expense 6,897 9,720 11,158 12,958 15,156 17,592
NET PROFIT (LOSS) Before Tax (Water Storage & Delivery) (52,184) (66,701) (76,837) (83,695) (84,204) (89,223)
Tax 17,807 20,010 23,092 25,199 25,399 26,956
PROFIT (LOSS) After Tax (Water Storage & Delivery) (34,377) (46,691) (53,745) (58,496) (58,805) (62,267)
Connections ProjectRevenue - 51,564 162,808 229,294 195,410 154,586Expenditure (Including Depreciation, Amortisation & Interest) - 122,974 166,042 236,726 198,135 155,880
NET PROFIT (LOSS) Before Tax (Water Storage & Delivery) - (71,410) (3,234) (7,432) (2,725) (1,294)
Tax - 21,423 970 2,230 817 388
PROFIT (LOSS) After Tax (Connections Project) - (49,987) (2,264) (5,202) (1,908) (906)
(34,377) (96,678) (56,009) (63,698) (60,713) (63,173)- - - - - -- - - - - -
43,666 11,374 (85,304) (141,313) (205,011) (265,724)Closing Retained Profit (Loss) 9,289 (85,304) (141,313) (205,011) (265,724) (328,897)
Goulburn-Murray WaterStatement of Financial Performance
Profit (Loss) after Tax (Water Storage & Delivery and Connections
Transfers to/from ReservesOther adjustmentsRetained Profit (Loss) carried forward
Detailed Commentary
• The 2012/13 budget is based on the 2012/13 price schedule.
• Overall variable charges reduce from 2011/12 actual results due to the expectation that minimal spillable revenue will be earned post 2011/12 due to the current high dam levels and high likelihood of spill.
• Central Goulburn (CG 1-4) revenues are consistent with the confirmed Department of Sustainability and Environment sourced funding under the approved business cases.

DM#3501131V7 P a g e | 47
• The MDBA revenues have increased over the 2011/12 actual results due to the planned works which include Living Murray Construction (Hattah), Salinity Mitigation works, Dartmouth Water Storage & Supply Reduction.
• Interest revenue calculations are based on the latest available Treasury Corporation of Victoria rates.
• Other revenue is made up of the non-prescribed revenues which are estimated based on current levels and agreements.
Expenses
• Additional Fringe Benefit Tax liability associated with the recently announced changes in respect of motor vehicles has been included in the Operating and Maintenance and Administrative expenditure costs.
• Operations and Maintenance expense increases mainly as a result of additional costs associated with the roll out of the Modernisation Program.
• The CG 1-4 increased expense is consistent with the approved funding and business case.
• The MDBA increased expenditure is consistent with the works plan and is aligned to the revenue assumptions.
• Interest expense is generated based on forecast borrowings with a 7% interest rate.
• Depreciation and amortisation has been calculated based on the fair valuation at 30 June 2011 adjusted for disposals, additions and depreciation.

DM#3501131V7 P a g e | 48
2 Capital Investment Program
Capital Expenditure Program G-MW’s capital expenditure program over the Plan is budgeted at a total of $573 million at an average spend of $115 million per annum.
This includes the budgeted capital spend for the Connections Project of $376.8 million.
2.1 Water Storage & Delivery Capital Investment Plan The development of the capital programfor the Water Storage & delivery business is broken
into key stages, namely: 1. Program Development
Developing the program includes:
• Review of asset management policy and procedures for particular asset types and classes (channels/drains/fences)
• Review of existing program forward look, particularly spend in Water Plan 3.
• Consultation with relevant subject matter experts.
• Review of Connections Project works programs and targets to reduce the chance of duplicated effort and to remove works from the Water Storage & Delivery business program such as:
o No work on non back bone channels.
o No work on regulators.
o No work on channels targeted for plastic lining.
o No work on irrigation meter replacements.
2. Regulatory Requirements
• Inclusion of projects which must be completed to comply with regulations (OH&S, Safe Water Drinking Act).
• Inclusion of projects required to provide assurance Statement of Obligations are met.
3. Risk Review
• All projects are subject to G-MW Risk Review Process.
• All projects are assigned a risk score.
4. Multi Criteria Analysis
• All projects are reviewed and a score applied with emphasis on the following criteria:
o Return on Investment / Asset Intervention Strategy.
o Strategic Alignment.

DM#3501131V7 P a g e | 49
o Project Definition.
5. Project Delivery Review
• Relevant large projects are reviewed from an implementation perspective to consider potential project timelines and delivery. This provides assurance that budget provisions are correctly staged and assigned.
6. Cash Flow Review
• A cash flow is assigned to all projects (monthly and quarterly).
Expenditure Program Reasonableness Review There are a number of processes that ensure the Water Storage & Delivery capital program is prudent and efficient:
• Expenditure in 2012/13 (Water Plan 2) is based on the ESC approved Water Plan.
• The Water Storage & Delivery business undertakes analysis to assess whether the capital program is reasonable (from an order of magnitude) based on Capital Replacement Ratio (CRR) analysis.
CRR divides capital expenditure by statutory depreciation to provide an indicator of the extent to which the organisation is renewing its asset base. For a mature regulated infrastructure businesses with a predominantly renewals based capital expenditure program a CRR of around 1.00 on average is typical.
G-MW’s analysis indicates that the proposed levels of capital expenditure over the reporting period are in the order of magnitude reasonably expected.
• G-MW’s capital expenditure in Water Plan 3 has been consulted on with Water Service Committees and will be subject to further assessment by the regulator.
We note that the latter processes around Water Plan 3 will be completed over the next 6-9 months and therefore the capital program may be subject to change.
Connections Project – Capital Expenditure The capital expenditure budget for the Connections Project is based on the previous Corporate Plan approved by the NVIRP Board prior to the integration with G-MW. As previously noted the Connections Project is undertaking a detailed forecast for the project.
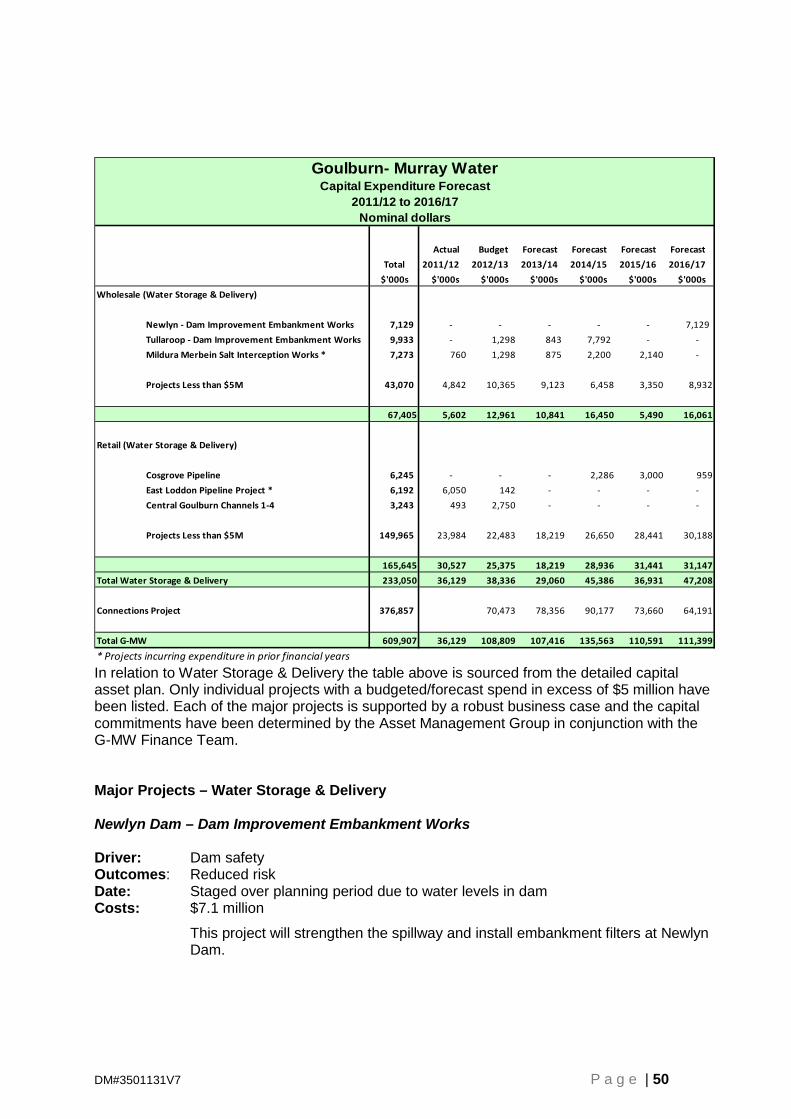
DM#3501131V7 P a g e | 50
Actual Budget Forecast Forecast Forecast ForecastTotal 2011/12 2012/13 2013/14 2014/15 2015/16 2016/17
$'000s $'000s $'000s $'000s $'000s $'000s $'000sWholesale (Water Storage & Delivery)
Newlyn - Dam Improvement Embankment Works 7,129 - - - - - 7,129 Tullaroop - Dam Improvement Embankment Works 9,933 - 1,298 843 7,792 - - Mildura Merbein Salt Interception Works * 7,273 760 1,298 875 2,200 2,140 -
Projects Less than $5M 43,070 4,842 10,365 9,123 6,458 3,350 8,932
67,405 5,602 12,961 10,841 16,450 5,490 16,061
Retail (Water Storage & Delivery)
Cosgrove Pipeline 6,245 - - - 2,286 3,000 959East Loddon Pipeline Project * 6,192 6,050 142 - - - - Central Goulburn Channels 1-4 3,243 493 2,750 - - - -
Projects Less than $5M 149,965 23,984 22,483 18,219 26,650 28,441 30,188
165,645 30,527 25,375 18,219 28,936 31,441 31,147Total Water Storage & Delivery 233,050 36,129 38,336 29,060 45,386 36,931 47,208
Connections Project 376,857 70,473 78,356 90,177 73,660 64,191
Total G-MW 609,907 36,129 108,809 107,416 135,563 110,591 111,399
* Projects incurring expenditure in prior financial years
Goulburn- Murray WaterCapital Expenditure Forecast
2011/12 to 2016/17Nominal dollars
In relation to Water Storage & Delivery the table above is sourced from the detailed capital asset plan. Only individual projects with a budgeted/forecast spend in excess of $5 million have been listed. Each of the major projects is supported by a robust business case and the capital commitments have been determined by the Asset Management Group in conjunction with the G-MW Finance Team. Major Projects – Water Storage & Delivery Newlyn Dam – Dam Improvement Embankment Works Driver: Dam safety Outcomes: Reduced risk Date: Staged over planning period due to water levels in dam Costs: $7.1 million
This project will strengthen the spillway and install embankment filters at Newlyn Dam.
DM#3501131V7 P a g e | 51
Tullaroop - Dam Improvement Embankment Works Driver: Dam safety Outcomes: Reduced risk Date: Staged over planning period due to water levels in dam Costs: $8.6 million
Due to ongoing issues associated with movement and subsidence in the dam, extensive works are planned to be undertaken to the dam over the planning period. The works involve the construction of a filter buttress across the main embankment section and upgrading the existing instrumentation. These works form part of the Dam Improvement Program.
Mildura Merbein Salt Interception Scheme Driver : Salinity mitigation Outcomes: Renewal of existing systems Date: Ongoing Costs: $8.8 million
This project is jointly funded by G-MW and the Murray-Darling Basin Authority to deal with salinity in the Murray River so as to improve the water quality for both the environment and irrigators.
Cosgrove Pipeline Driver : Increase in customer base Outcomes: Water savings Date: Start 2014/15 Costs: $6.2 million
As part of the water savings program this project will replace existing channels with a pressurised stock and domestic pipeline servicing the Cosgrove community. This project will be undertaken in conjunction with NVIRP and will be subject to commercial review by G-MW.
East Loddon Pipeline Project Driver: Increase in customer base Outcomes: Water savings Date: Finish 2012/13 Costs: $12.5 million
This project has been jointly funded by G-MW, Coliban Water, NVIRP and Regional Development Victoria. The project will be successfully completed in the 2012/13 financial year and will be under budget.

DM#3501131V7 P a g e | 52
Central Goulburn Channels 1 – 4 Driver: Improved customer service Outcomes: Water savings Date: Ongoing Costs: $7.3 million
This project has been funded by NVIRP and DSE and will provide enhanced levels of water supply service to our customers.
Other Capital Expenditure Capital expenditure over the planning period will see a continued commitment to programs that support the modernised irrigation program, the dam improvement program, renewal of infrastructure and ongoing commitment to modernising corporate systems. These programs include: Access Tracks and Fencing Driver: Reduced maintenance costs Outcomes: Reduces long term costs Date: Ongoing Costs: $25.9 million (program cost over Plan period)
As part of the NVIRP program it was acknowledged that in order to be able to maintain the modernised system, access to the system was a pivotal requirement. This project will provide assurance that the long term water savings and proposed increases in levels of service as a result of the NVIRP project can be achieved and maintained in perpetuity. The overall program of works is approximately $57 million dollars over the next decade, however in this planning period the costs are approximately $25.9 million This program during the planning period will provide G-MW with the ability to maintain the system to current standards and where NVIRP processes improve the levels of service, provide assurance that it can be maintained. The funding arrangements for this program are still being worked through with NVIRP.
Backbone Channel Remodelling Driver: Replacement at end of Life Outcomes: Maintains customer service Date: Ongoing Costs : $10.0 million (program cost over Plan period)
To provide irrigation network assets that maintain customer service standards, a program of work is undertaken to remodel (renew) earthen channel banks to a
DM#3501131V7 P a g e | 53
suitable condition. Utilising the Asset Condition Rating (ACR) from the Asset Management Information System (AMIS), channels are chosen based on location (backbone only), capacity and condition for inclusion into the program of works.
It should be noted that even with the NVIRP program a substantial volume of G-MW Channels remain in poor condition and will require ongoing remodelling into the future.
Backbone – Occupation Crossing Replacement Driver: Renewal of existing Outcomes: Replacement of existing structures Date: Ongoing Costs: $5.0 million (program cost over Plan period)
As part of the irrigation network, there are a substantial number of irrigation occupation crossings provided to customers to access their land over supply channels. The maturing of the NVIRP program and the stronger definition of the “back bone” will now allow the investment in these structures to be better targeted and there is an increase in spend forecast over the planning period. The replacement is to be undertaken to structures that have reached the end of their serviceable life, however prior to replacement each site will be considered for potential rationalisation or reconfiguration of access prior to any construction works commencing as part of the design process.
Backbone – Road Culvert Replacements Driver: Renewal of existing Outcomes: Replacement of existing structures Date: Ongoing Costs: $3.7 million (program cost over Plan period)
As part of the irrigation network, there are a substantial number of road culverts under supply channels. The maturing of the NVIRP program and the stronger definition of the “back bone” has now allowed the investment in these structures to be better targeted and there is an increase in spend forecast over the planning period. The replacement is to be undertaken to structures that have reached the end of their serviceable life, however, prior to replacement each site will be considered for potential rationalisation or reconfiguration of access prior to any construction works commencing as part of the design process.

DM#3501131V7 P a g e | 54
3 Statement of Financial Position
2011/12 2012/13 2013/14 2014/15 2015/16 2016/17
Actual Budget Forecast Forecast Forecast Forecast$'000s $'000s $'000s $'000s $'000s $'000s
Current AssetsCash and Cash Equivalents 32,900 1,703 1,703 1,703 1,703 7,741Receivables 27,142 32,341 34,703 30,603 31,126 31,873
Less Doubtful Debts (412) (214) (214) (214) (214) (214)Net Receivables 26,730 32,127 36,192 32,092 32,615 39,400Inventories 1,954 1,799 2,339 2,339 2,339 2,339
Total current assets 61,584 35,629 38,531 34,431 34,954 41,739
Non Current AssetsInfrastructure 4,065,846 4,097,083 4,215,420 4,308,960 4,919,756 4,651,922Capital Works in Progress 19,317 92,014 100,662 112,886 96,069 92,465Land and Buildings 78,773 78,605 84,765 89,323 89,539 94,882Plant, Equipment and Motor Vehicles 17,151 19,740 35,106 38,094 41,142 41,562Intangible Assets 19,476 8,350 26,596 26,982 26,273 25,610
Accumulated Depreciation (91,804) (154,320) (248,460) (327,997) (411,067) (131,517)
4,108,759 4,141,472 4,214,089 4,248,248 4,761,712 4,774,924Other Non-Current Assets 159 895 613 1,367
Total non-current assets 4,108,918 4,142,367 4,214,702 4,249,615 4,761,712 4,774,924
TOTAL ASSETS 4,170,502 4,177,996 4,253,233 4,284,046 4,796,666 4,816,663
Current LiabilitiesPayables 45,748 44,271 42,841 43,301 43,594 43,783Borrow ings 11,412 9,554 - - - -Employee Benefit Provision 16,664 17,359 17,690 17,746 17,803 17,861Other Current Liabilities 7,827 12,377 5,350 18,683 54,212
Total current liabilities 73,824 79,011 72,908 66,397 80,080 115,856
Non Current LiabilitiesBorrow ings 112,951 147,332 176,407 229,484 249,207 257,751Employee Benefit Provision 1,769 2,158 1,904 1,926 1,948 1,971Deferred Tax Liabilities 474,212 412,849 390,058 362,326 485,650 459,172
Total non-current liabilities 588,932 562,339 568,369 593,736 736,805 718,894
TOTAL LIABILITIES 662,756 641,350 641,277 660,133 816,885 834,750
NET ASSETS 3,507,746 3,536,646 3,611,956 3,623,913 3,979,781 3,981,913
EQUITYGovernment Equity Contributions 2,282,941 2,405,250 2,533,069 2,608,724 2,675,305 2,737,110Asset Revaluation Reserve 1,215,516 1,216,700 1,220,200 1,220,200 1,570,200 1,573,700Accumulated Funds (Losses) 9,289 (85,304) (141,313) (205,011) (265,724) (328,897)
TOTAL EQUITY 3,507,746 3,536,646 3,611,956 3,623,913 3,979,781 3,981,913
Goulburn-Murray WaterStatement of Financial Position
Detailed Commentary
• A revaluation of infrastructure is assumed in 2015/16 along with revaluations of Land and Buildings in 2016/17.
• Borrowings increase reflects part funding of the capital program.

DM#3501131V7 P a g e | 55
• Deferred tax liabilities are amortised annually due to increased book depreciation charges until 2015/16 where the revaluation again increases the deferred tax liability balance.
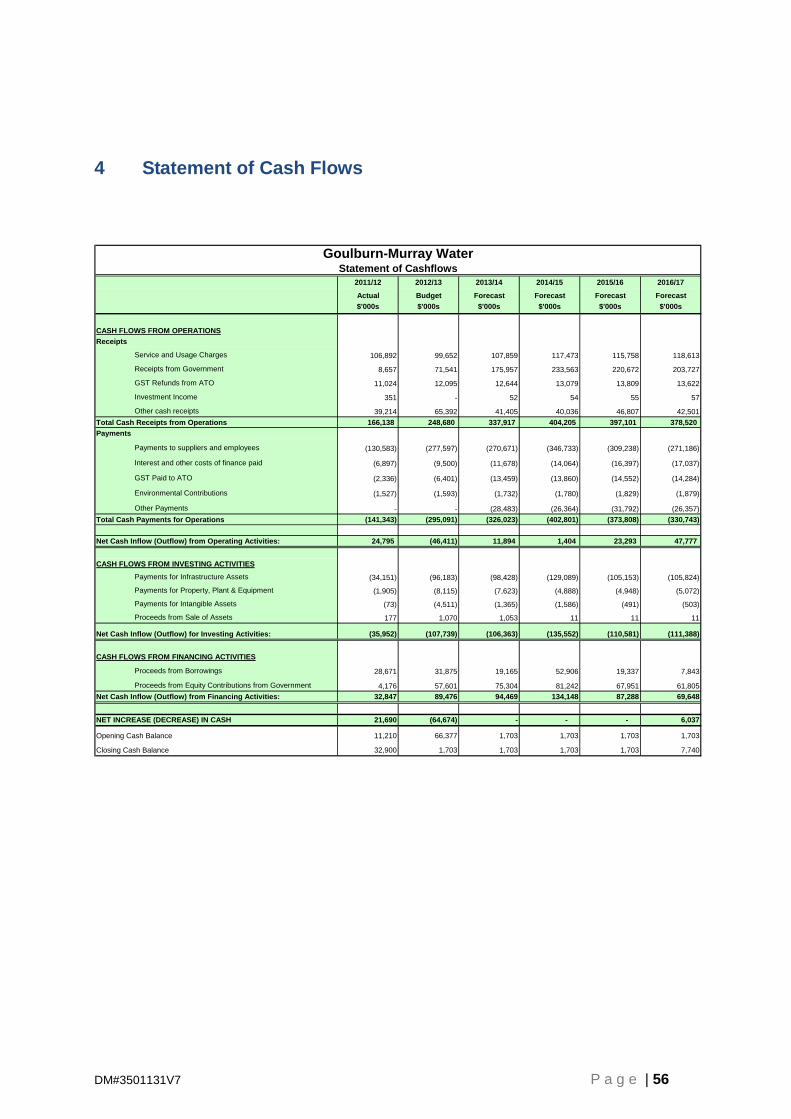
DM#3501131V7 P a g e | 56
4 Statement of Cash Flows
2011/12 2012/13 2013/14 2014/15 2015/16 2016/17
Actual Budget Forecast Forecast Forecast Forecast$'000s $'000s $'000s $'000s $'000s $'000s
CASH FLOWS FROM OPERATIONSReceipts
Service and Usage Charges 106,892 99,652 107,859 117,473 115,758 118,613
Receipts from Government 8,657 71,541 175,957 233,563 220,672 203,727
GST Refunds from ATO 11,024 12,095 12,644 13,079 13,809 13,622
Investment Income 351 - 52 54 55 57
Other cash receipts 39,214 65,392 41,405 40,036 46,807 42,501Total Cash Receipts from Operations 166,138 248,680 337,917 404,205 397,101 378,520
Payments to suppliers and employees (130,583) (277,597) (270,671) (346,733) (309,238) (271,186)
Interest and other costs of finance paid (6,897) (9,500) (11,678) (14,064) (16,397) (17,037)
GST Paid to ATO (2,336) (6,401) (13,459) (13,860) (14,552) (14,284)
Environmental Contributions (1,527) (1,593) (1,732) (1,780) (1,829) (1,879)
Other Payments - - (28,483) (26,364) (31,792) (26,357)Total Cash Payments for Operations (141,343) (295,091) (326,023) (402,801) (373,808) (330,743)
Net Cash Inflow (Outflow) from Operating Activities: 24,795 (46,411) 11,894 1,404 23,293 47,777
CASH FLOWS FROM INVESTING ACTIVITIESPayments for Infrastructure Assets (34,151) (96,183) (98,428) (129,089) (105,153) (105,824)
Payments for Property, Plant & Equipment (1,905) (8,115) (7,623) (4,888) (4,948) (5,072)
Payments for Intangible Assets (73) (4,511) (1,365) (1,586) (491) (503)
Proceeds from Sale of Assets 177 1,070 1,053 11 11 11
Net Cash Inflow (Outflow) for Investing Activities: (35,952) (107,739) (106,363) (135,552) (110,581) (111,388)
CASH FLOWS FROM FINANCING ACTIVITIES
Proceeds from Borrowings 28,671 31,875 19,165 52,906 19,337 7,843
Proceeds from Equity Contributions from Government 4,176 57,601 75,304 81,242 67,951 61,805Net Cash Inflow (Outflow) from Financing Activities: 32,847 89,476 94,469 134,148 87,288 69,648
NET INCREASE (DECREASE) IN CASH 21,690 (64,674) - - - 6,037
Opening Cash Balance 11,210 66,377 1,703 1,703 1,703 1,703
Closing Cash Balance 32,900 1,703 1,703 1,703 1,703 7,740
Payments
Goulburn-Murray WaterStatement of Cashflows
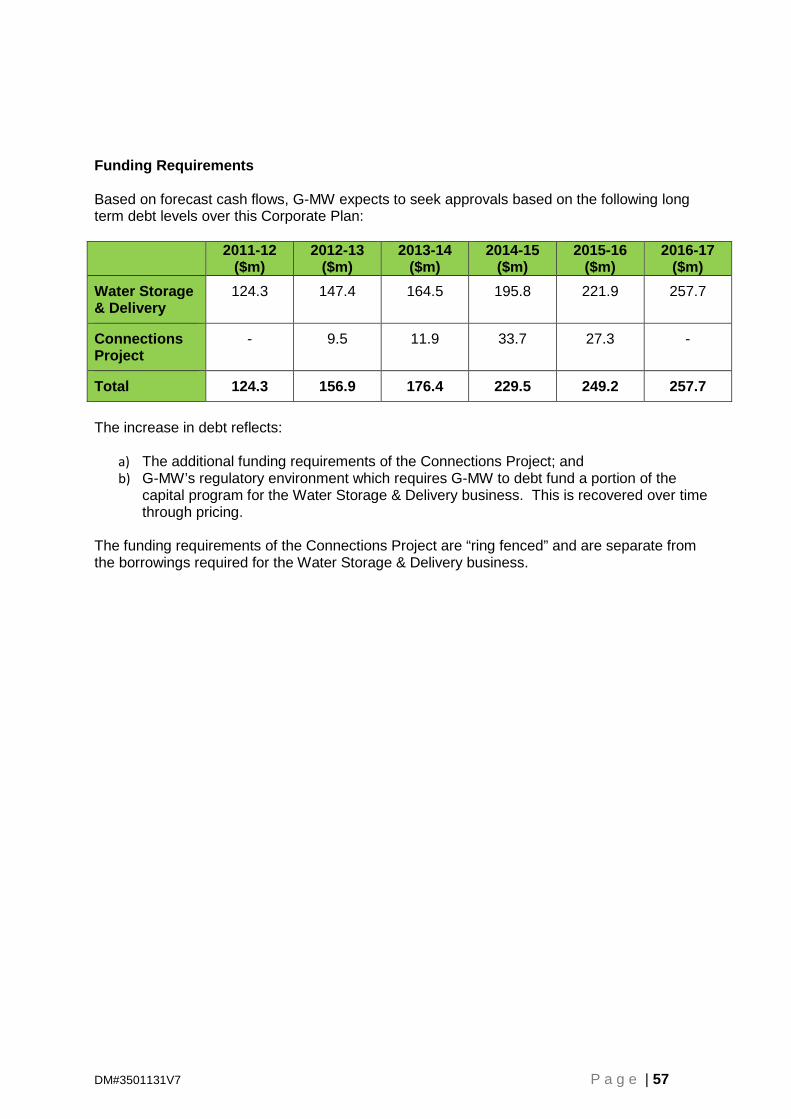
DM#3501131V7 P a g e | 57
Funding Requirements Based on forecast cash flows, G-MW expects to seek approvals based on the following long term debt levels over this Corporate Plan:
2011-12 ($m)
2012-13 ($m)
2013-14 ($m)
2014-15 ($m)
2015-16 ($m)
2016-17 ($m)
Water Storage & Delivery
124.3 147.4 164.5 195.8 221.9 257.7
Connections Project
- 9.5 11.9 33.7 27.3 -
Total 124.3 156.9 176.4 229.5 249.2 257.7 The increase in debt reflects:
a) The additional funding requirements of the Connections Project; and b) G-MW’s regulatory environment which requires G-MW to debt fund a portion of the
capital program for the Water Storage & Delivery business. This is recovered over time through pricing.
The funding requirements of the Connections Project are “ring fenced” and are separate from the borrowings required for the Water Storage & Delivery business.
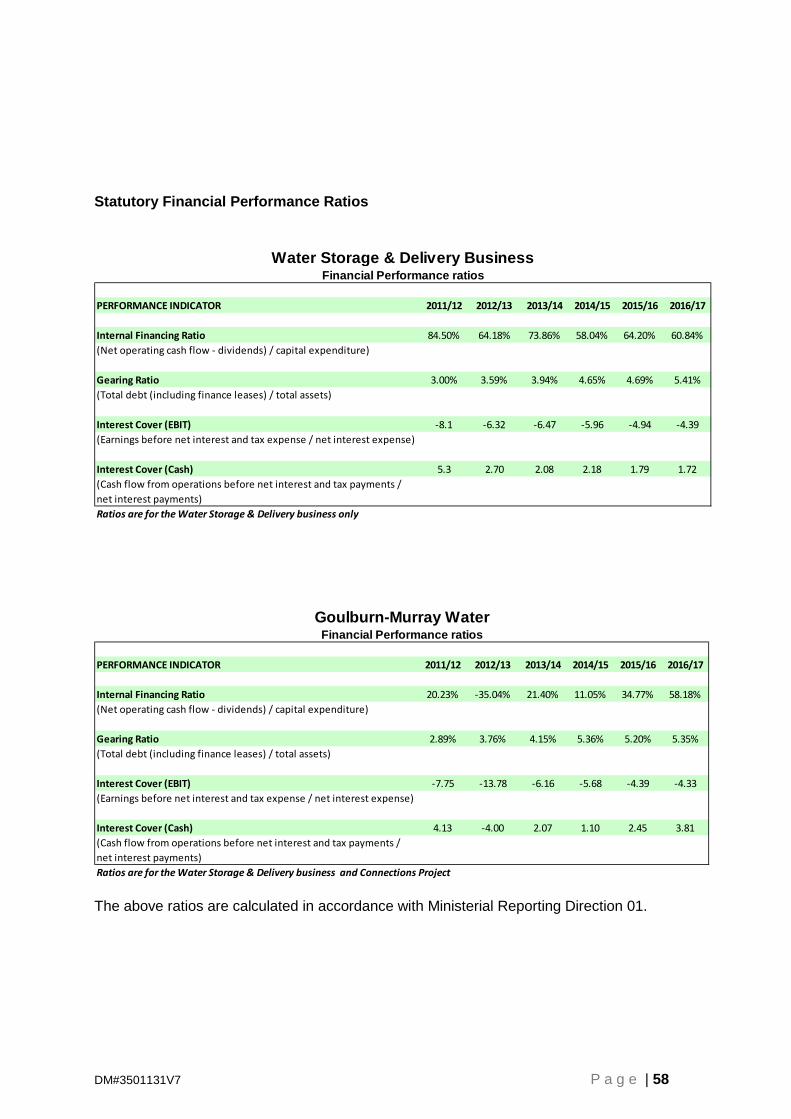
DM#3501131V7 P a g e | 58
Statutory Financial Performance Ratios
PERFORMANCE INDICATOR 2011/12 2012/13 2013/14 2014/15 2015/16 2016/17
Internal Financing Ratio 84.50% 64.18% 73.86% 58.04% 64.20% 60.84%(Net operating cash flow - dividends) / capital expenditure)
Gearing Ratio 3.00% 3.59% 3.94% 4.65% 4.69% 5.41%(Total debt (including finance leases) / total assets)
Interest Cover (EBIT) -8.1 -6.32 -6.47 -5.96 -4.94 -4.39(Earnings before net interest and tax expense / net interest expense)
Interest Cover (Cash) 5.3 2.70 2.08 2.18 1.79 1.72(Cash flow from operations before net interest and tax payments / net interest payments)Ratios are for the Water Storage & Delivery business only
Water Storage & Delivery BusinessFinancial Performance ratios
PERFORMANCE INDICATOR 2011/12 2012/13 2013/14 2014/15 2015/16 2016/17
Internal Financing Ratio 20.23% -35.04% 21.40% 11.05% 34.77% 58.18%(Net operating cash flow - dividends) / capital expenditure)
Gearing Ratio 2.89% 3.76% 4.15% 5.36% 5.20% 5.35%(Total debt (including finance leases) / total assets)
Interest Cover (EBIT) -7.75 -13.78 -6.16 -5.68 -4.39 -4.33(Earnings before net interest and tax expense / net interest expense)
Interest Cover (Cash) 4.13 -4.00 2.07 1.10 2.45 3.81(Cash flow from operations before net interest and tax payments / net interest payments)Ratios are for the Water Storage & Delivery business and Connections Project
Goulburn-Murray WaterFinancial Performance ratios
The above ratios are calculated in accordance with Ministerial Reporting Direction 01.
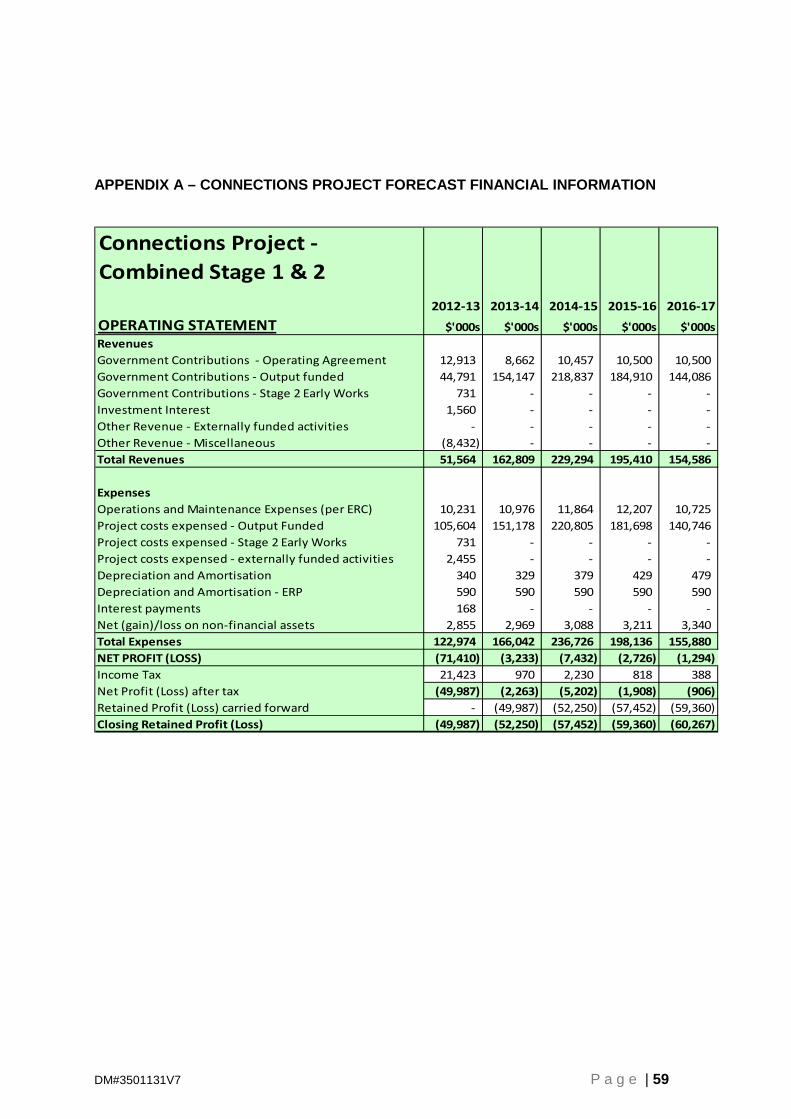
DM#3501131V7 P a g e | 59
APPENDIX A – CONNECTIONS PROJECT FORECAST FINANCIAL INFORMATION
Connections Project - Combined Stage 1 & 2
2012-13 2013-14 2014-15 2015-16 2016-17OPERATING STATEMENT $'000s $'000s $'000s $'000s $'000sRevenuesGovernment Contributions - Operating Agreement 12,913 8,662 10,457 10,500 10,500 Government Contributions - Output funded 44,791 154,147 218,837 184,910 144,086 Government Contributions - Stage 2 Early Works 731 - - - - Investment Interest 1,560 - - - - Other Revenue - Externally funded activities - - - - - Other Revenue - Miscellaneous (8,432) - - - - Total Revenues 51,564 162,809 229,294 195,410 154,586
ExpensesOperations and Maintenance Expenses (per ERC) 10,231 10,976 11,864 12,207 10,725 Project costs expensed - Output Funded 105,604 151,178 220,805 181,698 140,746 Project costs expensed - Stage 2 Early Works 731 - - - - Project costs expensed - externally funded activities 2,455 - - - - Depreciation and Amortisation 340 329 379 429 479 Depreciation and Amortisation - ERP 590 590 590 590 590 Interest payments 168 - - - - Net (gain)/loss on non-financial assets 2,855 2,969 3,088 3,211 3,340 Total Expenses 122,974 166,042 236,726 198,136 155,880 NET PROFIT (LOSS) (71,410) (3,233) (7,432) (2,726) (1,294) Income Tax 21,423 970 2,230 818 388 Net Profit (Loss) after tax (49,987) (2,263) (5,202) (1,908) (906) Retained Profit (Loss) carried forward - (49,987) (52,250) (57,452) (59,360) Closing Retained Profit (Loss) (49,987) (52,250) (57,452) (59,360) (60,267)

DM#3501131V7 P a g e | 60
Connections Project - Combined Stage 1 & 2
2012-13 2013-14 2014-15 2015-16 2016-17ASSET & LIABILITY STATEMENT $'000s $'000s $'000s $'000s $'000s
Current AssetsCash and Cash Equivalents - - - - 6,038 Receivables - - - - - Prepayments - - - - - Other Current Assets - - - - - Assets held for resale - - - - - Total current assets - - - - 6,038
Non Current AssetsCapital Works in Progress 54,546 71,601 67,500 59,137 45,257 Plant, Equipment and Motor Vehicles 1,017 1,073 894 665 386 Plant & Equipment - ERP 2,360 1,770 1,180 590 - Intangible Assets 3,660 3,660 3,660 3,660 3,660 Other Non-Current Assets 643 613 1,367 - - Total non-current assets 62,226 78,718 74,601 64,052 49,303
TOTAL ASSETS 62,226 78,718 74,601 64,052 55,341
Current LiabilitiesPayables 10,623 10,623 10,623 10,623 10,623 Employee Benefit Provision 582 606 930 965 681 Borrowings 9,553 11,874 33,672 27,283 (7) Defferred Tax Liability (21,424) (22,393) (24,623) (25,440) (25,829) Other Current Liabilities 4,694 7,694 1,249 15,009 50,900 Total current liabilities 4,030 8,405 21,851 28,440 36,368
Non Current LiabilitiesEmployee Benefit Provision 503 523 246 256 589 Other Non-Current Liabilities - - - - - Total non-current liabilities 503 523 246 256 589
TOTAL LIABILITIES 4,534 8,928 22,097 28,696 36,957
NET ASSETS 57,693 69,789 52,504 35,356 18,384

DM#3501131V7 P a g e | 61
Connections Project - Combined Stage 1 & 2
2012-13 2013-14 2014-15 2015-16 2016-17STATEMENT OF CASH FLOWS $'000s $'000s $'000s $'000s $'000s
CASH FLOWS FROM OPERATIONSReceiptsReceipts from Government - Operating Agreement 12,913 8,662 10,457 10,500 10,500 Receipts from Government - Output funded 43,962 157,147 212,392 198,669 179,977 Receipts from Government - Stage 2 Funding 1,012 - - - - Investment Income 1,560 - - - - Other receipts - externally funded activities 1,000 - - - - Other 379 - - - - Total Cash Receipts from Operations 60,826 165,809 222,849 209,169 190,477 PaymentsPayments to suppliers and employees - Operating Agreement (10,231) (10,186) (10,361) (10,354) (10,356) Payments for ouput funded expenditure (109,142) (154,102) (223,848) (184,864) (144,037) Payments for Stage 2 (731) - - - - Payments for externally funded expenditure (2,455) - - - - Interest and other costs of finance paid (168) (790) (1,503) (1,853) (370) Total Cash Payments for Operations (122,726) (165,078) (235,712) (197,071) (154,763) Net Cash Inflow (Outflow) from Operating Activities: (61,901) 730 (12,863) 12,098 35,714 CASH FLOWS FROM INVESTING ACTIVITIESPayment for capital of WIP (66,593) (77,357) (88,610) (73,460) (63,991) Payment for other capital contributed items (2,696) (613) (1,367) - - Payments for externally funded activities - - - - - Payment for PPE (400) (385) (200) (200) (200) Payment for ERP (783) - - - - Payments/receipts for assets held for resale 445 - - - - Net Cash Inflow (Outflow) for Investing Activities: (70,027) (78,356) (90,177) (73,660) (64,191) CASH FLOWS FROM FINANCING ACTIVITIESProceeds from Equity Contributions from Government 57,602 75,304 81,243 67,950 61,805 Proceeds/ Payments external borrowings 9,553 2,321 21,797 (6,388) (27,290) Net Cash Inflow (Outflow) from Financing Activities: 67,155 77,625 103,041 61,562 34,515
NET INCREASE (DECREASE) IN CASH (64,773) - - - 6,038