collaborate to innovate? teams and patent generation · pdf file3 innovation is critical for...
TRANSCRIPT

1
Collaborate to Innovate?
Teams and Patent Generation in a Global R&D Center
Martine R. Haas*
The Wharton School
University of Pennsylvania
3620 Locust Walk, Philadelphia, PA 19104, U.S.A.
tel: 215 746 1973
fax: 215 898 0401
Prithwiraj (Raj) Choudhury
Harvard Business School
Morgan Hall 497
Soldiers Field Road, Boston, MA 02163, U.S.A.
*corresponding author
Working paper, April 2016: Please do not circulate or cite without permission.
2
Collaborate to Innovate?
Teams and Patent Generation in a Global R&D Center
ABSTRACT
How should firms organize their employees to generate patents? Are larger teams better than
smaller teams, and should their members span formal and informal intra-firm boundaries? We
argue that larger teams face greater coordination costs and cooperation problems, and even
greater challenges if they span more intra-firm boundaries. Hence, the relationship between team
size and patent generation will be more negative if team members belong to more formal
organizational units but more positive if they belong to more overlapping informal communities.
We also predict that these moderating effects will be exponential rather than linear in form. We
test the hypotheses using a proprietary dataset that combines patent data with fine-grained
personnel data from the Indian R&D center of a Fortune 50 technology company.
Keywords: collaboration, teams, innovation, patenting, global R&D, boundary crossing, formal
structure, virtual communities

3
Innovation is critical for many firms, especially − though not only − in industries that rely on
patenting as a source of competitive advantage, such as technology, pharmaceuticals, and
chemicals (e.g., Teece, 1986; Dougherty and Hardy, 1996; Murmann, 2003). Recognizing this,
researchers have drawn attention to macro-level organizational arrangements that can facilitate
innovation in firms, such as ambidextrous structures (e.g., Gibson and Birkinshaw, 2004;
O’Reilly and Tushman, 2004), inter-unit networks (e.g., Hansen, 1999; Tsai, 2001), and open
innovation (e.g., Chesbrough, 2003). Yet the everyday work of producing patentable innovations
within firms is usually undertaken by individuals working deep inside the organization, often in
teams of varying size that span formal units and informal communities (e.g. Brown and Duguid,
1991; Cummings, 2004). This raises a fundamental question about the micro-level foundations of
innovation within firms (Felin and Foss, 2005): How should firms organize their employees to
generate patents? In particular, should employees work collaboratively, and if so, in smaller or
larger teams? And should they span formal and informal intra-firm boundaries, or not?
A central tenet of the literature on innovation is that new ideas emerge from the
recombination of existing knowledge in novel ways (e.g. Schumpeter, 1939; Nelson and Winter,
1982). This might suggest that larger teams have the potential to be more innovative than smaller
teams, since the pool of knowledge available for recombination will tend to be broader when
more individuals are working on a problem together (cf. Nonaka and Takeuchi, 1995; Grant,
1996). Yet despite the potential benefits of larger teams, there is reason to question whether they
will actually produce more innovations than smaller teams. An extensive literature on group
processes emphasizes that individuals face coordination costs and cooperation problems when
they work together (e.g. Guzzo and Dickson, 1996; Ilgen et al., 2005). These create “process
losses” for groups – inefficiencies that detract from their potential productivity (Steiner, 1972).
4
Larger groups face greater coordination costs and cooperation problems than smaller groups
(Brooks, 1995; Steiner, 1972), suggesting that larger teams may be less likely than smaller teams
to produce innovations. Furthermore, while larger teams may have access to an even broader
pool of knowledge if their members span more intra-firm boundaries (e.g., Reagans and
Zuckerman, 2001; Cummings, 2004), they are also likely to encounter even greater coordination
costs and cooperation problems (e.g., Dougherty, 1992; Carlile, 1994; Bechky, 2003).
For firms that value innovation, these tradeoffs suggest that careful attention should be
paid to the specific innovation outcome of interest. The eventual impact of a patent may be
greater for larger teams that have been able to recombine their knowledge effectively. But larger
teams may be less likely to generate a patent in the first place, since coordination and
cooperation are necessary for effective knowledge recombination. Indeed, large-scale studies of
millions of patents across industries and scientific fields show a positive association between
team size and patent impact in the form of citations, but a negative association between team size
and patent generation (e.g., Singh and Fleming, 2010; Wuchty, Jones, and Uzzi, 2007). Such
findings underscore the importance of specifying the innovation outcome of interest for
understanding the collaborative arrangements that facilitate it. Moreover, the tradeoffs facing
larger teams suggest that greater insight is needed into the conditions that enable larger teams to
innovate more successfully inside firms. Specifically, are larger teams more likely – or less likely
– to patent successfully if their members span intra-firm boundaries? Put differently, how does
spanning intra-firm boundaries affect the relationship between team size and patenting success?
We address this question by focusing on the generation of patents inside firms. Patent
generation is a precondition for patent impact. Moreover, firms engaged in global R&D often
value patent generation more highly than patent impact in the form of citations, since patenting

5
helps them to secure intellectual property protection in highly competitive global markets (e.g.,
Maskus, 2000). Building on the premise that coordination and cooperation are necessary for
patent generation, we expect to observe that larger teams generate fewer patents than smaller
teams inside firms. From this starting point, we examine how spanning both formal and informal
boundaries moderates the relationship between team size and patent generation. We argue that
this relationship will be more negative if the team members belong to more formal organizational
units (such as product divisions), due to the increased potential for coordination costs and
cooperation problems in the team. Conversely, the relationship between team size and patent
generation will be more positive if the team members belong to more overlapping informal
communities (such as technical interest groups), because such overlap reduces the challenges of
coordination and cooperation. Additionally, we argue that the challenges of coordination and
cooperation increase at an accelerating rate with team size, and consequently, the positive
moderating effect of spanning formal organizational units and the negative moderating effect of
overlapping informal communities will be exponential rather than linear in form.
We test the hypotheses using patent data combined with proprietary personnel data from
the Indian R&D center of a Fortune 50 technology-based multinational company. The patent data
include all 108 U.S. patent filings by all 1,315 employees in this R&D center prior to 2008. The
personnel data include confidential employment records for all these employees during the same
period, as well as data on their affiliations with the firm’s formal organizational units and
informal online communities. We first establish that there is a negative relationship between
team size and patent generation in this dataset, consistent with the data from large-scale patent
studies. We then test the moderating effects of spanning formal and informal intra-firm
boundaries by using a case-control matching approach with weighted exogenous sample

6
maximum likelihood estimation to match observed teams with two, three, or four members that
filed a patent with counterfactual teams of the same size that did not patent (cf. Singh, 2005;
Sorenson, Rivkin, and Fleming, 2006), and conducting marginal probability analyses to compare
the effects of boundary spanning on the likelihood of patenting across teams of varying size. We
check the robustness of our results using propensity score matching, bias-corrected nearest
neighbor matching, and coarsened exact matching techniques.
Our findings advance understanding of the micro-foundations of innovation by offering
insight into the arrangements that support patent generation by employees working together
inside firms. They also contribute to research on intra-organizational collaboration by
illuminating the implications of fundamental team design decisions. Finally, while many studies
have used large-scale patent datasets to examine innovation across industries and fields, our
study brings together patent data with intra-firm personnel data, and thus opens new avenues for
exploring the conditions that facilitate collaborative innovation within firms.
COLLABORATIVE INNOVATION IN A GLOBAL R&D CENTER
Team size and patent generation
Many large firms have set up global R&D centers to serve as innovation hubs in key regions
such as India, China, Europe, and the U.S. (Frost, Birkinshaw, and Ensign, 2002; Sarkar, 2011;
Holmes et al., 2015). These global R&D centers often value patenting highly (e.g., Phelps and
Kline, 2009; Kerr and Kerr, 2015). And since many employees work on related problems in the
same location, they offer rich opportunities for intensive collaboration in teams of two, three,
four or more members who work together for a limited time on a specific innovation project.
Recent research suggests that collaboration can be beneficial for the production of high-
impact innovations. For example, in a study of innovation in the comic book industry, Taylor and

7
Greve (2005) found that larger teams produced innovations with more extreme (both good and
bad) outcomes in the form of collectors’ valuations. In their large-scale study of more than 0.5
million patents granted by the USPTO, Singh and Fleming (2010) showed that collaborative
inventors produced a lower proportion of low-impact inventions and a higher of high-impact
inventions, as measured by citations received, than solo inventors.
Yet while larger teams may produce higher-impact innovations, they do not appear to
generate more innovations overall. Taylor and Greve’s study found that larger creative teams
were not positively associated with higher levels of innovation in comic books. And Singh and
Fleming’s data reveal that of the 0.5 million patents studied, 50% were generated by solo
inventors, 26% by dyads, 13% by triads, and only 11% by teams of four or more. Moreover,
extensive research on creativity has consistently found that groups are much less productive than
individuals working alone in terms of the quantity as well as quality of ideas generated (e.g.
Mullen, Johnson, and Salas, 1991). Similarly, Girotra, Terwiesch, and Ulrich (2010)
demonstrated that groups that worked individually and then together generated higher quality
best ideas than those that worked together throughout the idea generation process.
In the group creativity literature, such findings are commonly attributed to process losses
arising from the challenges of coordination and cooperation among group members (e.g., Paulus
and Nijstad, 2003). As research on interdependence in organizations points out, coordination
refers to alignment of actions, while cooperation refers to alignment of interests (e.g., Thompson,
1967; Kretschmer and Puranam, 2008). Thus, coordination is essentially about ability to
collaborate, while cooperation is about willingness to collaborate. Coordination costs are
incurred when interacting individuals are unable to anticipate each other’s actions and adjust
their own accordingly, while cooperation problems occur when their interests are not aligned.

8
In teams, coordination costs commonly arise from the complexity of assigning roles and
responsibilities (e.g., Hackman and Oldham, 1980) and integrating various components of the
task (e.g., Heath and Staudenmayer, 2000). They also arise from more micro processes such as
production blocking, which occurs when a group member does not have the opportunity to
express ideas because other group members have used up all the available time (Diehl and
Stroebe, 1987). Additional coordination challenges include developing routines, rules, and plans
that enable the work to run smoothly (e.g., Okhuysen and Bechky, 2009); facilitating direct
communication through scheduled meetings and spontaneous interactions (Hinds & Mortensen,
2005); interpreting, translating, and creating shared meaning around “boundary objects” that
convey technical and social information, such as technical drawings or prototypes (e.g., Carlile,
2002); learning and transferring knowledge, for example between senior and junior investigators
(e.g., Cummings and Kiesler, 2007); and sharing and leveraging common resources, such as
databases or technical instruments (e.g., Faraj and Xiao, 2006).
Meanwhile, cooperation problems often take the form of conflict (e.g., Williams and
O’Reilly, 1998), although teams sometimes fall prey to groupthink - the tendency to minimize
conflict by conforming to the opinion of the majority or of high status members (Janis, 1982).
Teams also often suffer from the failure of individuals to share their unique information (Stasser
and Titus, 1985); from a tendency to underweight outside information (Minson and Mueller,
2012); and from social loafing, the tendency of individuals to exert less effort when working in
groups than when working alone (Latane et al., 1979). In addition, team members sometimes
experience evaluation apprehension, in the form of reluctance to express ideas due to fear of a
negative reaction from others (Diehl and Stroebe, 1987) and expectations of low relational
support (Mueller, 2012). And there are cooperation problems that result from pressures external
9
to the group, such as exposure to different incentives (e.g. Wageman, 1995) or involvement in
different projects that compete for the members’ attention (e.g., Cummings and Haas, 2012).
Coordination costs and cooperation problems are not only greater for teams than for
individuals working alone, but they also increase with team size (Steiner, 1972; for more recent
studies see Mueller, 2012; Staats, Milkman, and Fox, 2012). For example, a four-member team
faces greater coordination and cooperation challenges than a three-member team, which in turn
faces greater challenges than a two-member team. In the context of collaborative innovation in a
global R&D center, the implication is that we should expect to observe a negative association
between team size and patent generation, much like the pattern observed in large-scale patent
studies. This could be due to both actual and anticipated coordination and cooperation
challenges: larger teams may be less likely to succeed at generating patents as a result of the
coordination costs and cooperation problems they experience, and also less likely to form in the
first place because employees (or their managers) anticipate that the difficulties of coordination
and cooperation in larger teams will outweigh their potential benefits.1
Furthermore, as the number of team members increases, the potential for coordination
costs and cooperation problems increases at an accelerating rate rather than at a linear rate
(Steiner, 1972; for more recent statements see Espinosa et al., 2007; Hackman, 2002). Brooks
(1995 [1975]) offered some qualitative evidence to support this argument in his study of IBM,
where he observed that adding collaborators to a late software engineering project to complete it
faster instead created further delays, a paradoxical effect he attributed to the fact that the number
of dyads that need to interact in a team increases exponentially with the number of collaborators.
1 There may also be reasons other than coordination costs and cooperation problems for observing a negative
association between team size and patenting. In particular, larger teams may be less likely to form because the level
of complexity of many patenting projects does not require them. We examine this possibility in our analyses.
10
For teams in a global R&D center, similarly, both coordination costs and cooperation problems
can be expected to increase with the number of collaborative relationships (or “links”) between
individuals rather than with the number of individuals (or “nodes”) in the team. A solo innovator
does not need to manage any collaborative relationships to generate a patent, but a two-person
team must manage one relationship (between members 1 and 2), while a three-person team must
manage three relationships (between members 1 and 2, 1 and 3, 2 and 3), a four-person team
must manage six (between members 1 and 2, 1 and 3, 1 and 4, 2 and 3, 2 and 4, 3 and 4), and so
on.2 Thus, the difference in the level of coordination and cooperation required by a four-person
team versus a three-person team is greater than the difference in the level of coordination and
cooperation required by a three-person team versus a two-person team. Since each relationship
requires coordination and cooperation, the potential for coordination costs and cooperation
problems increases at an accelerating rate with team size.
Building on the argument that larger teams face greater coordination costs and
cooperation problems than smaller teams, we turn now to examine two conditions that can
amplify or attenuate the levels of coordination costs and cooperation problems faced by larger
teams, and thus moderate the relationship between team size and patent generation: spanning
formal organizational units and belonging to overlapping informal organizational communities.
Spanning formal organizational units
Even when collaborators are co-located, as in an R&D center, they often span formal
organizational units to collaborate on a patenting project: for example, the members of a two-
2 More generally, a team of n members can have as many as n(n-2)/2 collaborative links. For clarity of theoretical
exposition, our arguments assume that every member of a team is linked to every other member in a collaborative
relationship. This is a reasonable assumption in research settings like ours where teams typically have less than five
members who all work together closely during a patenting project. Beyond such settings, we recognize that teams
may have difference governance structures (e.g., centralized v. decentralized), but expect that the argument that the
number of links between team members increases faster than the number of team members will still hold on average.

11
person team may belong to different product divisions; the members of a three-person team may
belong to two or three divisions; and so on. Larger teams may have access to a broader pool of
knowledge if their members span more formal organizational units (e.g. Bunderson and Sutcliffe,
2002; Cummings, 2004). However, the coordination and cooperation challenges facing larger
teams are even greater if the team members span more formal units within a firm, and these
challenges reduce their chances of generating a patent based on that knowledge.
A larger team faces greater coordination costs when its members span formal units
because individuals who belong to different units within a firm often have their own specialized
vocabularies and “thought worlds” that make it difficult for them to share knowledge and
translate insights across boundaries (e.g., Dougherty, 1992; Bechky, 2003; Carlile, 2004). For
example, engineers from the personal computer division might express their ideas in terms of
programming languages relevant to personal computers, while engineers from the mobile phone
division might talk and think in terms of languages relevant to mobile phones. Members of
different units often also have less regular exposure to each other in hallways, meetings, or other
projects, making it more difficult for them to coordinate their work through unplanned
interactions (e.g., Hinds and Mortensen 2005) and resulting in a lack of mutual knowledge (e.g.,
Krauss and Fussell, 1990). Likewise, a larger team also faces greater cooperation problems when
the team members span more formal units because members of different units within a firm often
have quite divergent agendas, interests, and incentives (e.g., Cyert and March 1963), and may
engage in territorial behaviors such as information withholding (e.g., Brown, Lawrence, and
Robinson, 2005). For example, collaborators who belong to different product divisions may be
inclined or feel pressure to prioritize different aspects of a technology, such as its compatibility
with a computing device, mobile device or gaming console.

12
In sum, while the potential for coordination costs and cooperation problems increases
with the number of team members, these challenges will be even greater if the team members
span more formal organizational units. Consequently, we predict:
H1a: Team size will be more negatively associated with patent generation if the team
members span more formal organizational units within the firm.
Furthermore, we expect that this negative moderating effect of spanning formal units will
be stronger for larger teams. With each one-unit linear increase in team size, the number of links
affected by a one-unit increase in the number of formal units spanned increases not just linearly, but
exponentially. For example, as shown in Figure 1, a two-person team whose members span a
boundary between two formal units faces increased coordination costs and cooperation problems in
one link compared to a two-person team whose members do not span a boundary. But a three-person
team faces increased coordination and cooperation challenges in two links. And a four-person team
faces increased challenges in either three or four links (i.e., in 3.5 links on average). Thus, comparing
teams with three versus two members, spanning one boundary versus none increases potential
difficulties in one additional link between collaborators (two links minus one link). But comparing
teams with four versus three members, spanning one boundary versus none increases potential
difficulties in an average of 1.5 additional links (3.5 links minus two links). This pattern continues
when comparing teams with four versus five members, and so on. That is, as the number of
collaborators increases by one, the number of links affected by spanning a boundary increases at a
growing rate. The same pattern also applies for each additional boundary spanned: each affects a
larger number of links on average in a larger team. Since spanning formal units not only
increases the potential for coordination costs and cooperation problems in larger teams but also
increases this potential more for larger teams than for smaller teams, we predict:
13
H1b: The negative moderating effect of spanning formal organizational units on the
relationship between team size and patent generation will be exponential in form.
----- Insert Figure 1 about here -----
Overlapping informal organizational communities
While spanning formal organizational units can amplify coordination costs and cooperation
problems for team members, belonging to overlapping informal organizational communities can
attenuate them. In many firms, employees belong to informal communities that take the form of
interest groups focused on specific technical topics (e.g., Brown and Duguid, 1991; Faraj et al.,
2011). Membership in such communities is voluntary; employees may choose to join a particular
community because they already have expertise in that area or because they wish to learn more
about it. For example, employees in a technology-based R&D center might join a community
that focuses on C++ language design, dotNET software architecture, or UNIX migration. Such
communities sometimes hold face-to-face meetings but often operate mostly virtually, relying on
platforms such as online discussion forums or databases to share knowledge about the topic (e.g.,
Haas et al., 2015; Hansen and Haas, 2001). As with spanning formal units, larger teams may
have access to more diverse knowledge if their members span more informal communities − but
they face lower coordination costs and cooperation problems if their members belong to more
overlapping communities, increasing their chances of generating a patent.
A larger team faces lower coordination costs and cooperation problems if its members
belong to more overlapping informal communities because such communities create common
ground between them that facilitates collaboration (cf. Gray, 1989; Hansen, 2009). In a global
R&D center where employees voluntarily join interest groups focused on specific technical
topics, this common ground can take the form of shared technical knowledge and specialist
14
vocabularies that reduce coordination costs by making communication between collaborators
easier (e.g., Krauss and Fussell, 1990). For example, two employees who both belong to a
community that focuses on digital rights management will be exposed to DRM terminology that
can help them to communicate about DRM issues even though they might work in different
formal units focused on laptops and mobile phone devices. Belonging to overlapping informal
communities can also create common ground in the form of shared perspectives that reduce
cooperation problems by encouraging collaborators to assume that they share the same task
agendas and priorities (e.g., Boland and Tenkasi, 1995; Bechky, 2003). For example, two
employees who both belong a community focused on emerging markets technology might
reasonably assume that they share an interest in developing technologies for consumers in
emerging markets. Thus, belonging to overlapping informal communities can increase
collaborators’ willingness as well as their ability to work together.
Accordingly, while the potential for coordination costs and cooperation problems
increases with the number of team members, coordination and cooperation are likely to be easier
if the members belong to more overlapping informal communities. We therefore predict:
H2a: Team size will be more positively associated with patent generation if the team
members belong to more overlapping informal communities within the firm.
In addition, we expect that this positive moderating effect of having members who belong
to more overlapping informal communities will be stronger for larger teams. With each one-unit
increase in team size, the number of links potentially affected by a one-unit increase in the level
of overlapping communities in the team increases exponentially rather than linearly. As
illustrated in Figure 2, a two-member team faces reduced coordination and cooperation
difficulties in one link if the level of overlapping communities in the team increases by one unit.

15
But a three-member team faces reduced difficulties in one or two or three links (i.e. 2 links on
average) and a four-member team faces reduced difficulties in one or two or three or four or five
or six links (i.e., 3.5 links on average). Comparing teams with three versus two members, a one-
unit increase in the level of overlapping communities in the team reduces the potential for
coordination costs and cooperation problems in an average of one additional link (2 links versus
1 link). But comparing teams with four versus three members, a one-unit increase reduces the
potential difficulties in an average of 1.5 additional links (3.5 links versus 2 links). This pattern
continues when comparing teams with four versus five members, and so on: that is, as the
number of members increases by one, the number of links positively affected by a one-unit
increase in the level of overlapping communities in the team increases at a growing rate. Since
overlapping informal communities not only reduce the difficulties of coordination and
cooperation in larger teams but also reduce these difficulties more for larger teams than for
smaller teams, we predict:
H2b: The positive moderating effect of overlapping informal communities on the
relationship between team size and patent generation will be exponential in form.
----- Insert Figure 2 about here -----
DATA AND METHODS
Empirical context
TechMNC is a Fortune 50 technology company that started its India R&D center in the
late 1990s. By the time of our data collection, in early 2008, the Indian R&D center had grown to
more than 1,300 employees, who had filed a total of 108 U.S. patents in the years 2006 and 2007
(prior to this time no patents were filed). To develop insight into how these patents were
generated, we conducted interviews with all 20 senior managers at the India R&D center as well

16
as with a sample of 25 mid- and entry-level R&D employees. These interviews shed light on
how the patenting process and collaboration on patenting projects unfolded in the firm.
Patenting process at TechMNC. The India R&D center’s employees primarily worked
on writing code for software products, but they could also choose to apply for funding to work
on patentable ideas related to generic technologies that might be relevant for the firm’s products.
For example, we interviewed an employee who was working on email-based products. This
employee had an interest in speech recognition, came up with a proof of concept based on this
technology, and eventually received funding for the project. The incentives for working on such
patentable ideas and filing patents were strong. TechMNC had a worldwide corporate policy of
patenting all significant innovation during the period of our study, in response to competition
from firms such as Red Hat, Novell, and others in the Open Source community, and the India
R&D center followed this policy. The incentives for inventors included pay raises and faster
promotions, as well as reputational benefits. One visible manifestation of the importance of such
benefits were the small inscribed plastic bricks awarded to inventors who successfully patented;
employees in the India R&D center displayed these proudly on their desks for all to see.
The funds for supporting the pre-patent development of an idea and taking it through the
patent process were centrally controlled by product managers located at TechMNC’s U.S.
headquarters. Inventors around the world could submit patentable ideas to the product managers
throughout the year via email; the product managers reviewed the ideas at quarterly business
meetings, and decided whether or not to fund them according to the fit with their strategic
priorities for their products. They had the freedom to invest in patentable ideas from outside their
product group as well as in ideas presented by inventors from their own product groups.

17
Collaboration on patenting projects at TechMNC. When submitting a patentable idea
to the product managers for funding, the lead inventor described the idea in detail, elucidated the
possible claims of the proposed patent, outlined the benefits of patenting the idea to one or more
product groups within TechMNC, and often submitted a prototype and/or other technological
details. The lead inventor also requested a dollar amount of funding, based on the estimated time
needed to develop the idea and the number and mix of collaborators needed to work on it. In
other words, a funding request was based on the resources required to buy out employees’ time
from their day-to-day projects and develop a proof of concept. Once funding was received, the
number and mix of collaborators could be changed provided the budget was not exceeded.
The lead inventors we interviewed indicated that they had autonomy in deciding whether
or not to include other collaborators on a patenting project, and that this decision was primarily
motivated by technological considerations rather than political or other concerns. As one lead
inventor noted, “No one forces you to add someone to the team. For example, my manager never
told me to add his name to a project team as this could give him a ‘free’ patent. You only add
other people to the project if they know something about the technology or a device that is
relevant for the proposed patent.” Additionally, once a patenting project was allocated funding,
there was no strict deadline for completing it, which meant that lead inventors did not feel
pressure to add more collaborators to a team in order to complete a project on time.
Our interviews also indicated that the incentives for patenting within TechMNC did not
clearly favor solo innovations over collaborative innovations, or vice versa. A solo patent meant
that one inventor could take all the credit, but that inventor also shouldered all the burden and
risk. In contrast, a collaborative patent meant sharing credit but could also require less from each
individual and enable participation in more patenting or other projects simultaneously. Thus, the

18
choice of whether to develop a patent alone or collaboratively was not governed by concerns
about the allocation of rewards in this setting (cf. Bikard, Murray, and Gans, 2015).
Analytic approach
Of the total 108 patents filed during our observation period, 50 patents were filed by a solo
individual, 24 patents were filed by two-member teams, 14 patents by three-member teams, 13
patents by four-member teams, and 7 patents by teams of five or more.3
To establish the baseline association between team size and patent generation, we examined
all 108 patents filed descriptively. To test H1a/b and H2a/b, however, we needed to be able to
compare these “real teams” that filed patents to a set of “control teams” that did not file patents.
Since we were not able to observe teams that tried but failed to file a patent in this setting, we used
case-control matching methods to construct counterfactual sets of control teams for the real teams
with two, three, and four members (we did not estimate models for teams of more than four
members due to the small number of such patents in our dataset).4 Following prior innovation
studies (e.g., Singh, 2005; Sorenson et al., 2006; Stolpe, 2002), we employed a choice-based
sampling procedure with WESML estimation to construct these sets of control teams.5 For each real
team of a given size, we randomly selected 10 control teams matched by size, i.e. 10 hypothetically
possible teams that did not file a patent. Thus, our final sample included 264 two-member teams (24
3 There were 3 patents filed by five inventors, 2 patents filed by six inventors, and 2 patents filed by seven inventors. 4 We did estimate models for teams with four or more members as a robustness check, and found substantively the
same results as for teams with four members. 5 The WESML estimation strategy enables us to sample a larger fraction of observations where a patent is observed
than a random sample draw would generate by weighting each sample observation by the number of population elements
it represents and thus ensuring that the choice-based sample simulates a random exogenous sample (Manski and Lerman,
1977). Following Singh (2005), we assigned a weight of 1 to each real team. This enabled us to include all the real teams
in the population in the sample and satisfied the informational motivation of implementing WESML. All possible control
teams of the same size as the real team had an equal probability α of being sampled. See Sorenson et al. (2006) for the
rationale for using such a case-control methodology vis-a-vis matching conditioning on observables.

19
real, 240 control); 154 three-member teams (14 real, 140 control); and 143 four-member teams (13
real, 130 control), resulting in a total sample size of 561 teams.
Because the ratio of real to control teams was constant for each team size (1:10), we could
not combine the subgroups of two-, three-, and four-member teams in a single empirical model
predicting patenting from team size and the moderator variables. Instead, we tested H1a/b and
H2a/b by using separate empirical models to estimate the effects of the moderator variables (formal
units spanned and informal community overlap) on the likelihood of patenting in each subgroup,
and then comparing the marginal probabilities estimated from the three separate sets of regressions
to test whether the likelihood of patenting by teams with two, three, or four members depended on
these moderators.
Data and variables
We collected employment data, administrative records, and interest group affiliations for all
1,315 employees of the Indian R&D center on the payroll as of December 2007, in addition to
the patenting data. The data came from multiple sources and needed cleaning and coding.
Dependent variable. Our unit of observation is a patent filed at the USPTO in years 2006
and 2007 by inventors at TechMNC’s India R&D center.6 Given the matching method we use to
generate a set of counterfactuals, our dependent variable is coded 1 for a real team that generated a
patent (patent=1), or 0 for a control team that did not generate a patent (patent=0).
Explanatory variables. For each real and control team, we counted the number of team
members based on the names of the inventors listed on the patent (team size).
6 All patents filed by members of the Indian R&D center were U.S. patents. TechMNC's patent-filing legal team
was located in the U.S., and all patents developed outside as well as inside the U.S. were first filed with the USPTO.
Our dependent variable is based on patent filings rather than patent grants because all of the Indian R&D center’s
patents were still under examination at the USPTO at the time of our study.

20
To measure the extent to which the team members spanned formal organizational units
within the firm, we constructed a variable that captured the number of product groups to which
the members belonged (formal units spanned). The higher the number of product groups
represented in the team, the higher the number of formal units the members had to span.
Employees at TechMNC’s Indian R&D center belonged to one of six possible product groups,
each of which focused on a particular product portfolio: ‘Client’, ‘Server and Tools’, ‘Business
Solutions, ‘Entertainment Devices’, ‘Online Services Business’ and ‘Corporate’.7
To measure the extent to which the team members had overlapping technical interests, we
used data on the employees’ voluntary memberships in TechMNC’s virtual online technical
communities. These online communities were used to post information and plan events on topics
of technical interest for the firm’s employees. Employees did not necessarily need to have
expertise in the topic of the community to become a member; indeed, employees often joined a
particular community to learn more about its topic. Thus, belonging to an online technical
community at TechMNC was an expression of active interest in that community, rather than an
indication of knowledge in its area. There was a cost to belonging to a community in which an
employee no longer had an interest in the form of unwanted emails and solicitations for
participation; as a result, employees usually cancelled their membership in such communities.
Employees of TechMNC’s India R&D center had access to 12,680 online communities,
of which we coded 9,456 as technical communities based on their names and descriptions (the
rest were social communities). Our coding was independently verified by two senior managers at
7 Employees also belonged to one of 39 possible functional areas, which reflected different technological
capabilities. For example, members of the ‘Structured Query Language’ area focused on a programming language
designed for managing data held in a relational database management system; members of the ‘Terminal Server’
area focused on technology that allowed devices to connect to a Local Area Network, etc. In robustness checks, we
use number of functional areas as an alternative measure of formal units spanned, and found consistent results.
21
TechMNC, and any discrepancies resolved. The technical communities covered a wide range of
specific technology topics: for example, ‘C/C++/VC++ Debugging’ was a community dedicated
to tips and help for debugging errors in programs written using the C, C++ or Visual C++
languages; ‘dotNET Developers Forum’ was for those with interests in .NET applications. On
average, each employee was a member of 67 technical communities. To measure the extent to
which team members belonged to overlapping informal communities (informal community
overlap), we identified all the technical communities to which each of the 1,315 employees
belonged, and then measured the extent of overlap between each pair of employees using the
methodology developed by innovation researchers to measure knowledge relatedness (e.g.,
Breschi et al., 2003; Jaffe, 1989). To do this, we first calculated the extent of overlap between
any two communities’ membership using a cosine index Sij which measures the angular
separation between the vectors representing the co-occurrences of technical communities i and j
with all the other technical communities.8 The vector of co-occurrences spanned all the 1315
employees. We then computed the average overlap measure for each pair of employees by
considering all pairs of technical communities they belonged to. In the final step, we computed
the average of the pairwise overlaps between all members of a team.9
Control variables. We included a number of additional variables in our models to control
for alternative mechanisms that might drive our results (we also explored another additional
mechanism, project complexity, in additional analyses reported at the end of the results).
First, we controlled for social ties between the team members (social ties). It is possible
that inventors search for collaborators primarily within their personal networks when assembling
8 The formula for the cosine index is Sij = ∑ 𝐶𝑖𝑘×𝐶𝑗𝑘9456𝑘=1
√∑𝐶𝑖𝑘2×√∑𝐶𝑗𝑘2
9 In robustness checks, we constructed a simpler alternative measure of informal community overlap based on the
fraction of communities that overlapped; the results were consistent with those reported here.

22
teams; as a result, they may be less likely to pick collaborators who span formal units or belong
to non-overlapping informal communities because they are less likely to know them. However,
our interviews indicated that relying on members of their own product groups or those with
overlapping technical interests was not a common search strategy in our research setting. Instead,
inventors typically assembled their teams by searching intranet-based directories and databases
of presentation material to find collaborators with the best expertise for the project. Nevertheless,
we include a control variable in our models to account for possible effects of social ties between
inventors. To construct this variable, we used data on the online social communities to which the
team members belonged. Employees of TechMNC’s India R&D center had access to 653 online
social communities (e.g., based ethnic networks, hometowns, alumni affiliations, and cricket
teams in TechMNC’s intra-firm league); on average each employee was a member of 11 social
communities. We coded the variable as the weighted average pairwise ties between team
members along the four dimensions of shared ethnicity, shared hometown, shared college, and
shared cricket league. If inventors were more likely to patent with others with whom they had
social ties, we would expect this control variable to be positively associated with patenting.10
Second, we controlled for the cost of resourcing a team, in terms of buying out the time
of employees to work on the patenting project (resource costs). It is possible that the U.S.-based
product managers were reluctant to fund larger teams to work on patenting projects because of
the higher resource costs involved. If this were the case, the real teams in our study might have
lower resource costs than the matched control teams, leading to a negative association between
resources costs and patenting in our models. Alternatively, higher resource costs might reflect
10 In robustness checks, we also tried an alternative control variable for search through personal networks. This variable,
cohort ties, was constructed using data on the organizational cohorts of the team members, which were job-level
classifications based on firm tenure and prior industry experience; cohort members also shared induction programs and
regular skill-building training sessions, and thus could be expected to know each other. All results remained robust.

23
higher-ranked or superior-quality team members, leading to a positive association between
resource costs and patenting. The employees at TechMNC’s India R&D center belonged to four
main salary bands, identified as ‘General Managers’, ‘Program or Project Managers’, ‘Software
Developers’ and ‘Others’ (including software code testers, documentation processors, etc.).
Though we did not have access to detailed salary data, we were able to obtain relative resource
costs for these four categories of employees, as well as the salary band category for each of the
1,315 employees in our dataset. We scaled resource costs for software developers (the majority
group) at 1, and used the relative resource costs for the other three categories of employees to
impute the total resource costs for both real and control teams.
We also controlled for whether the team members had previous collaboration experience
on prior patent grants (though patenting started at the Indian R&D center in 2006, some
inventors had filed patents earlier while working at the U.S. headquarters of TechMNC). For
each team, we constructed a dummy variable coded 1 if at least one of the members had
collaborated in their prior patent grants, or 0 otherwise (collaboration experience).11 This
variable will be positively associated with patenting if members with prior collaboration
experience were more able to help their team deal with coordination costs and cooperation
problems when working on a new patent. And we controlled for the total number of prior patents
granted to the team members (patenting experience). This variable will be positively associated
with patenting if a team whose members had a higher number of prior patent grants was a
higher-quality team, and/or better versed in navigating the process of securing R&D funds.
11 We were not able to construct a continuous measure because almost none of the teams in our dataset included more
than one member who had collaborated on previous patents, due to the relative newness of the India R&D center.

24
Finally, we included dummies for the product groups in TechMNC’s Indian R&D center,
to account for any underlying propensities or capabilities for patenting not otherwise captured in
our models (product group dummies).
RESULTS
Summary statistics for the full sample of 108 patents filed by inventors at TechMNC’s Indian
R&D center during the period of the study are reported in Table 1.
----- Insert Table 1 about here -----
We examine the baseline association between team size and patenting using this full
sample. In Figure 3, we plot the number of team members from 1 to 7 (a value of 1 reflects a solo
patent) against the log incidence ratio for ‘i’ team members, which is calculated by dividing the
number of observed patents that involved ‘i’ team members by the total number of possible
patents involving ‘i’ team members. For example, we observed 24 two-member teams that filed a
patent, and there were 863,955 possible two-member teams in the set of 1,315 employees that
could have filed a patent, giving a log incidence of ratio of -4.6. The figure shows a negative
association between team size and patent generation, consistent with prior findings from large-
scale patent datasets. Moreover, the linear decreases in the log incidence ratio with each one-
member increase in team size indicate that the likelihood of patenting fell at an exponential rate.
----- Insert Figure 3 about here -----
We now report the results of our tests for H1a/b and H2a/b. As explained earlier, we test
these hypotheses by first examining the effects of formal units spanned and informal community
overlap in the subgroups of teams with two, three and four members separately, and then
comparing these effects across the subgroups. Table 2 shows the summary statistics for the real
and control teams in each subgroup, and Table 3 presents the logit regression analysis predicting

25
whether a team filed a patent for the subgroups of two-, three-, and four-member teams
separately. The variance inflation factors for all models are below 10.
----- Insert Table 2 and Table 3 about here -----
Models 1-3 of Table 3 focus on the two-member teams. Model 1 reveals a negative and
significant relationship between spanning formal units and patenting (b= -1.90, p<0.01). Model 2
shows a positive and significant relationship between the level of informal community overlap
and patenting (b=18.82, p<0.01). Model 3 shows that both coefficients remain significant when
these variables are entered together. Models 4-6 show the same pattern for three-member teams,
and Models 7-9 show the same pattern of results for four-member teams. Among the control
variables, resources costs are positively and significantly related to patenting in most of the
models, indicating that real teams had higher resource costs than control teams, but there are
almost no significant effects for social ties, collaborative experience, or patenting experience.
The results reported so far reveal that there is a negative association between team size and
patenting in our sample, and also that teams with two, three, or four members all were less likely to
patent if they spanned more formal organizational units but more likely to patent if they belonged to
more overlapping informal communities. However, if H1a/H1b and H2a/H2b are to be supported,
we need to examine whether and how spanning formal units and overlapping informal communities
moderate the effect of team size on patenting. To conduct these tests, we compare the effects of
these moderator variables across the subgroups of two-, three-, and four-member teams using
marginal probability analyses, and plot the results in Figures 4 and 5.
Figure 4 shows the results for H1a and H1b. The horizontal axis plots team size and the
vertical axis plots the change in likelihood of patent generation based on the logit regression
results reported in the full models in Table 3 (Models 3, 6 and 9). Each of the vertical bars

26
represents the marginal change in the likelihood of patenting if one additional formal unit is
spanned, keeping all other covariates at their mean levels.12 These bars are negative for teams
with two, three, or four members: that is, when collaborators span one additional formal unit, the
probability of filing a patent decreases by 0.01 for a two-member team, by 0.07 for a three-
member team, and by 0.22 for a four-member team. These consistently negative effects indicate
that spanning formal units is negatively related to the likelihood of patenting holding team size
constant. However, Figure 4 also reveals two additional findings that directly address H1a and
H1b. First, the marginal probability bars are more negative for larger teams. If we denote the
bars for teams of size N=2, 3 and 4 as ‘a’, ‘b’ and ‘c’, we find that c<b<a. Given that a, b and c
are all negative, this indicates that |c|>|b|>|a|, and confidence intervals indicate that these
differences are significant at p<0.01. This confirms that there is a negative moderating effect of
spanning formal organizational units on the relationship between team size and patenting such
that an increase in the number of units spanned makes the relationship more negative, as
predicted by H1a. Second, the marginal probability bars become increasingly more negative for
larger teams. That is, |(c-b)|>|(b-a)|. The difference in the height of the bars for N=2 versus N=3
is -0.06, whereas the difference in the height of the bars for N=3 versus N=4 is -0.15. Confidence
intervals confirm that (c-b) is significantly greater than (b-a) at p<0.01. This indicates that the
negative moderating effect of spanning formal units on the relationship between team size and
patenting is exponential in form (i.e., stronger for larger teams), as predicted by H1b.
----- Insert Figure 4 about here -----
12 The marginal changes in probability and their confidence intervals are computed using the Stata user written
command ‘prvalue’ (http://www.stata-journal.com/sjpdf.html?articlenum=st0094).

27
Figure 5 shows the results for H2a and H2b. The horizontal axis plots team size and the
vertical axis plots the change in likelihood of patenting again based on the logit regression results
from the full models in Table 3. The two vertical bars for each team size represent the marginal
change in the likelihood of patenting if informal community overlap increases by 1 standard
deviation or 2 standard deviations over the mean, keeping all other covariates at their mean
levels. Figure 5 reveals that the marginal probability bars are all positive for teams with two,
three, or four members. That is, when the level of informal community overlap increases by 1
SD, the likelihood of patenting increases by 0.11, 0.13 and 0.23 respectively for teams with two,
three, and four members; when the level of informal community overlap increases by 2 SD, the
probability increases by 0.41, 0.51 and 0.71 respectively. These consistently positive effects
indicate that informal community overlap is positively related to the likelihood of patenting
holding team size constant. Beyond this, though, Figure 5 also reveals two additional findings
that directly address H2a and H2b. First, the marginal probability bars are more positive for
larger teams. If we denote the bars for teams of size N=2, 3 and 4 as ‘a’, ‘b’ and ‘c’, we find that
c>b>a (more specifically, c1>b1>a1 and c2>b2>a2). Confidence intervals indicate that these
differences are significant at p<0.1 for a 1SD increase and at p<0.05 for a 2SD increase over the
mean. This confirms that there is a positive moderating effect of informal community overlap on
the relationship between team size and patenting such that an increase in the level of overlap
makes the relationship more positive, as predicted by H2a. Second, the marginal probability bars
become increasingly more positive for larger teams. That is, (c-b)>(b-a) (or more specifically,
(c1-b1)>(b1-a1), and (c2-b2)>(b2-a2)). For a 1 SD increase in overlap over the mean, the
difference in the height of the bars for N=2 versus N=3 is 0.02, but for N=3 versus N=4 it is
0.10. For a 2 SD increase, the difference for N=2 versus N=3 is 0.10, but for N=3 versus N=4 it

28
is 0.20. Confidence intervals confirm that (c-b) is significantly greater than (b-a) at p<0.1 for a
1SD increase and at p<0.05 for a 2SD increase over the mean. These results indicate that the
positive moderating effect of informal community overlap on the relationship between team size
and patenting is exponential in form (i.e., stronger for larger teams), as predicted by H2b.
----- Insert Figure 5 about here -----
Additional analyses and robustness checks
As well as including control variables for alternative mechanisms in our models and examining
alternative measures for several of our variables (see footnotes), we also conducted robustness
tests using three alternative matching algorithms and explored one other alternative explanation
that could potentially drive some of our results: project complexity.
We conducted additional analyses to examine the possible role of project complexity
because it is possible that a baseline negative association between team size and patenting might
be observed because managers were less likely to fund larger teams or lead inventors were less
likely to assemble larger teams for projects that were not very complex. Also, teams may have
been less likely to add members who spanned formal units or informal communities for projects
that were less complex. In patenting studies, project complexity is typically measured by the
number of patent claims (e.g., Lanjouw and Schankerman, 1999; Wagner, 2007); the larger the
number of claims, the more complex the project. Ideally, we would include such a measure of
project complexity as a control variable in our main models, but we cannot observe project
complexity for the matched control teams that enable us to run these models since they are
hypothetical rather than real teams. We therefore conducted several exploratory analyses instead
(full tables available on request). First, we collected the full sample of 5,637 U.S. patents filed by
TechMNC worldwide between 1988 and 2006. Using this full sample, we found no significant

29
relationship between team size and project complexity as measured by the number of patent
claims, controlling for application year, type of patent class, and backward citations (r=0.13,
p=n.s.). Second, we examined the small subset of patents filed by TechMNC’s Indian R&D
center that had been granted by the USPTO as of 2014. By matching our hand-collected data on
patent filings by the Indian R&D center prior to 2008 against publicly available data on
subsequent USPTO patent grants, we were able to conclusively match 39 out of the 108 filed
patents to subsequently granted patents. In this subset of 39 matched patents, we again found no
significant relationship between team size and project complexity (r=-0.14, p=n.s.). Using this
same subset, we were also able to examine the relationship between project complexity and the
moderator variables. The findings revealed that project complexity was not significantly related
to either formal units spanned (r=1.05, p=n.s.) or informal community overlap (r=-6.73, p=n.s.)
in these teams. Thus, project complexity did not drive team size, formal unit spanning, or
informal community overlap in the teams we studied.
Turning to the robustness tests using alternative matching algorithms, we implemented
three alternative techniques for generating the subgroups of real and control teams: (i) coarsened
exact matching, (ii) full Mahalanobis propensity scores using nearest neighbor matching, and (iii)
bias-adjusted nearest neighbor matching. The aim here is to ensure that real teams are compared
to control teams as similar as possible not only in size but also in other observable dimensions.
First, we implemented a coarsened exact matching (CEM) model using the Stata ‘CEM’
command as well as Logit using iweights=cem weights. Prior studies have shown that CEM may
show better properties in achieving the multidimensional and unidimensional balance of
covariates and in reduction in estimation bias than other matching algorithms (Iacus et al., 2011).
We used a vector of covariates comprising social ties, resource cost, patenting experience,

30
collaboration experience, and product group dummies to conduct the matching. We also
conducted sensitivity analyses for the number of user-specified cut-points for each covariate and
the results remained robust. For two-member teams, the results replicated Models 1-3 in Table 3,
indicating that these models are robust to this matching technique. For three-member and four-
member teams, the results replicated Models 4-5 and 7-8, indicating that these results remain
robust, but we were not able to replicate Models 6 and 9 using CEM due to convergence issues
arising from the limited number of observations. To summarize, the CEM analyses indicated
robustness for all regressions that converged. We then computed marginal probabilities using the
CEM models that converged and found that the results reported in Figures 4 and 5 are robust.
Second, we implemented a more traditional full propensity scores matching analysis using
the nearest neighbor method (Abadie and Imbens, 2006; Rubin, 2006), utilizing the Stata ‘Psmatch2’
command. This technique performs a tighter match of real teams with control teams by using
observable covariates to compute a probability that any possible set of collaborators in the dataset
could have been a real team. This enables us to compare whether real teams and more closely
matched control teams had different levels of formal unit spanning or informal community overlap,
and how this varied with team size. In the base case, we used a nearest neighbor algorithm and set
the caliper to 0.05. Although this approach did not allow us to validate marginal probability analyses
across models, the results indicated that the number of formal units spanned and level of informal
community overlap were significantly different for real and control teams with two, three, and four
members, with the signs and statistical significance consistent with those in our main analyses.
Third, we improved on the general propensity scores results by implementing a bias-
corrected nearest neighbor matching algorithm (Abadie and Imbens, 2006), using the Stata

31
‘NNMatch’ command.13 Again, we could not conduct marginal probability analyses across
models with this approach, but the results indicated that the difference in formal units spanned
and in informal community overlap for treated and control teams with two, three, and four
members were again consistent in both sign and significance with our main analyses, using both
the average treatment effect (ATE) and the average treatment of the treated (ATT) effect.
Lastly, we conducted additional checks using Rosenbaum bounds to alleviate concerns about
omitted variable bias in the matching procedure (Rosenbaum, 2002). All results remained robust.
DISCUSSION
In recent years, many multinational companies have established global R&D centers with the
purpose of building centers of excellence where collaborative innovation can thrive. Yet the
question of whether employees should collaborative to innovate is not an obvious one. Focusing
on patent generation as the innovation outcome of interest, we observed a negative relationship
between team size and patenting in the Indian R&D center of the Fortune 50 MNC studied here,
and found that this relationship was more negative if team members spanned more formal
organizational units within the firm but more positive if team members belonged to more
overlapping informal communities. We also observed that the negative relationship between team
size and patenting was stronger for larger teams, and found that the moderating effects of both
spanning formal units and overlapping informal communities were exponential rather than linear
in form. These findings provide support for our argument that coordination and cooperation
challenges can impede patenting, and that the potential for coordination costs and cooperation
problems increases at an accelerating rate with team size. Taken together, the results of this study
13 The nnmatch algorithm allows for bias correction of the treatment effect, and estimation of either the sample or
population variance, with or without assuming a constant treatment effect (homoskedasticity). It also allows
observations to be used as a match more than once, thus making the order of matching irrelevant.
32
highlight the importance of understanding and managing the micro-foundations of innovation in a
patenting setting and suggest implications for scholarly and managerial understanding of
collaboration within firms.
Micro-foundations of collaborative innovation
Our study contributes to research on the management of innovation within firms generally, and
to research on multinational R&D in particular, by bringing together patent data with fine-
grained personnel data from inside a leading technology company’s global R&D center to
explore the conditions that facilitate collaborative innovation by employees. There is now an
extensive literature that examines patenting by populations or samples of firms within particular
industries (e.g. Hall and Ziedonis, 2001; Singh 2005), as well as by academic and scientific
communities (e.g. Azoulay, Ding, and Stuart, 2009; Henderson, Jaffe, and Trajtenberg, 1998).
Yet, with few exceptions (e.g. Choudhury, 2015), scholars of innovation have yet to venture
inside firms to examine what drives variation in patenting outcomes. Our study opens new
avenues for such research by showing that although it may be difficult to connect publicly
available patent data with proprietary intra-firm data, there are valuable insights to be gained.
Specifically, our findings heed calls to uncover the micro-foundations of innovation within firms
(e.g., Felin and Foss, 2005) by illuminating how spanning intra-firm boundaries affects the
relationship between team size and innovation within firms.
Prior research on the effects of team size has suggested that many groups face
diminishing returns because they are too large (e.g., Steiner, 1972; Mueller, 2012; Staats et al.,
2012). Accordingly, scholars often suggest that the optimal team size is somewhere in the range
of five to seven members (e.g., Curral et al., 2001; Hackman, 2002). However, the findings of
our study suggest that even this relatively small optimal team size seems to need revisiting in the

33
context of patent-oriented innovation. In contrast to laboratory and field settings in which
individuals are required to work in teams, most R&D settings do not mandate that employees
work in teams to generate patents, but instead allow them to choose whether or not to
collaborate. Consequently, they are likely to weigh the potential costs and benefits of
collaboration carefully. In the global R&D center studied here, we observed that the likelihood of
patenting declined at an increasing rate with each additional team member. For generating
patents, the optimal team size in this R&D center was two members (and solo innovation was
more optimal still). The implication here is that the optimal team size for producing innovations
in R&D settings may be substantially lower than research on team effectiveness usually assumes.
Our study also showed that the relationship between team size and patenting was
moderated by the extent to which members spanned formal and informal intra-firm boundaries. A
number of prior studies in the domain of academic science have suggested that coordinating and
cooperating across institutional boundaries can be difficult for scientists (e.g. Cummings and
Kiesler, 2007; Bercovitz and Feldman, 2011; Vural, Dahlander, and George, 2013); our findings
suggest that employees face similar difficulties when collaborating across intra-firm boundaries.
Given this, how can managers design collaborative innovation efforts in their firms in such a way
that the chances of patenting are increased? Within firms, it is unlikely that the negative effects of
spanning formal units could be counteracted by the positive effects of overlapping informal
communities, since team members who span formal units within a firm typically belong to less
overlapping informal communities. Additionally, since team size tends to be positively correlated
with formal units spanned and negatively correlated with informal community overlap, larger
teams will often be at an immediate coordination and cooperation disadvantage compared to
smaller teams. Still, our findings suggest some possible avenues for managers to pursue. For

34
example, they can try to reduce coordination costs and cooperation problems either by
encouraging inventors to work with others in the same formal unit or informal communities as
themselves, or by helping collaborators who span units and communities to recognize the
potential difficulties this creates and develop ways of reducing them, such as frequent face-to-face
meetings or regular briefings on each other’s priorities and concerns. It might seem easiest to take
the path of encouraging collaborations between individuals who share formal units and informal
communities. However, further research is needed to establish whether the more difficult path of
facilitating collaborations between individuals from different units and communities may
ultimately be more beneficial for increasing the impact, if not the likelihood, of innovation.
Limitations and directions for future research
Some limitations of our study should be noted. Since our data were collected from a single firm,
our findings should be confirmed in other organizational settings to ensure that they are
generalizable. We did not have access to the confidential records that would have enabled us to
follow teams that tried but failed to patent in our research setting, limiting our ability to
distinguish between two implications of coordination and cooperation challenges that likely both
contribute to our findings: that teams did not form in the first place because of anticipated
coordination costs and cooperation problems or that they formed but failed to patent because of
actual coordination costs and cooperation problems during their collaboration. While the findings
of our study support the argument that coordination and cooperation challenges result in less
patenting by larger teams whose members span more boundaries, future research could examine
the extent to which coordination and cooperation challenges prevent the formation of such
collaborations in the first place versus derail collaborations that are undertaken.

35
Additionally, our study relied on the names of the inventors listed on the patent filing to
ascertain the number of collaborators involved but future research could collect more detailed
information on how much time each collaborator allocated to the team, to better ascertain how
team size and patenting outcomes are affected by the utilization of full-time versus part-time
members (cf. Cummings and Haas, 2012). Also, employees at TechMNC’s India R&D center
did not have long track records of prior collaboration with the same or different collaborators at
the time of our study, but future research might usefully examine the effects of such different
types of prior familiarity, as these could attenuate the negative effects of coordination costs and
cooperation problems (cf. Espinosa et al., 2007; Huckman, Staats and Upton, 2009).
Finally, as previously noted, even if collaborative innovation is difficult, it may prove
worthwhile if it generates higher-impact patents. And indeed, there is strong evidence from
large-scale patenting studies that higher-impact patents are more likely to be generated by larger
teams (e.g., Singh and Fleming, 2010; Wuchty et al., 2007). In a supplementary analysis, we
explored whether our dataset has similar properties to these large-scale patent datasets by
examining the relationship between team size and the impact of patenting in our sample, as
measured by forward citation counts. To conduct this analysis, we examined the small subset of
39 patents filed by TechMNC’s India R&D center during the period of our study that had been
granted by the USPTO as of 2014. Using a Poisson model adjusted for quasi-maximum
likelihood estimation and robust standard errors, we found a positive significant relationship
between team size and the forward citation counts for these patents, controlling for the number of
claims and number of backward citations (b=0.21, p<0.01). We also ran a similar analysis using
the complete dataset of all 5,637 U.S. patents granted to the worldwide operations of TechMNC
between 1988 and 2006. Again, we found a positive significant relationship between the number

36
of collaborators and forward citations on the patent, controlling for number of claims, number of
backward citations, and dummies for the filing year (b=0.633, p<0.01). These findings indicate
that larger teams in the firm we studied delivered higher-impact patents, consistent with large-
scale patenting studies. Because data on patent impact is currently available only for 39 patents
on which we also have proprietary personnel data, we do not have enough observations to
examine the moderating effects of spanning intra-firm boundaries on the impact of patenting, but
this would be a valuable direction for future research, especially since the impact of approved
patents might be greater when team members span more intra-firm boundaries because they may
develop patents with wider applicability. Thus, while the present study sheds light on how the
potential for coordination costs and cooperation problems can impede patenting in a
multinational R&D setting, future research could go on to examine the benefits of overcoming
these challenges.
Conclusion
We started this study by asking how firms should organize their employees for
innovation. Our findings show that larger teams generated fewer patents even in an organization
setting highly conducive to collaboration, but that formal and informal intra-firm boundary
spanning moderated this effect. Taken together, our findings call attention to how the challenges
of coordination and cooperation can inhibit patent generation by teams. The corollary is that if
larger teams are able to overcome these challenges and generate patents, their patents may have
potential for greater impact. This paradox of collaborative innovation gives scholars as well as
managers some promising directions for further exploration and possible intervention.

37
REFERENCES
Abadie A, Imbens GW. 2006. Large sample properties of matching estimators for average
treatment effects. Econometrica 74(1): 235-267.
Azoulay P, Ding W, Stuart T. 2009. The impact of academic patenting on the rate, quality and
direction of (public) research output. The Journal of Industrial Economics 57(4): 637-676.
Bechky B. 2003. Sharing meaning across occupational communities: The transformation of
understanding on a production floor. Organization Science 14(3): 312-330.
Bercovitz J, Feldman M. 2011. The mechanisms of collaboration in inventive teams:
Composition, social networks, and geography. Research Policy 40(1): 81-93.
Bikard M, Murray FE, Gans J. 2015. Exploring tradeoffs in the organization of scientific work:
Collaboration and scientific reward. Management Science 61(7):1473-1495.
Boland Jr RJ, Tenkasi RV. 1995. Perspective making and perspective taking in communities of
knowing. Organization Science 6(4): 350-372.
Breschi S, Lissoni F, Malerba F. 2003. Knowledge-relatedness in firm technological
diversification. Research Policy 32(1): 69-87.
Brooks FP. 1995 [1975]. The Mythical Man-Month: Essays on Software Engineering
(Anniversary edition, 2nd ed). Addison-Wesley.
Brown G, Lawrence TB, Robinson SL. 2005. Territoriality in organizations. Academy of
Management Review 30(3): 577-594.
Brown JS, Duguid P. 1991. Organizational learning and communities-of-practice: Toward a
unified view of working, learning, and innovation. Organization Science 2(1): 40-57.
Bunderson JS, Sutcliffe KM. 2002. Comparing alternative conceptualizations of functional
diversity in management teams: Process and performance effects. Academy of Management
Journal 45(5): 875-893.
Carlile PR. 2002. A pragmatic view of knowledge and boundaries: Boundary objects in new
product development. Organization Science 13(4): 442-455.
Carlile PR. 2004. Transferring, translating, and transforming: An integrative framework for
managing knowledge across boundaries. Organization Science 15(5): 555-568.
Chesbrough HW. 2003. Open Innovation: The New Imperative for Creating and Profiting From
Technology. Boston, MA: Harvard Business School Press.
Choudhury P. 2015, Return migration and geography of innovation in MNEs: a natural
experiment of knowledge production by local workers reporting to return migrants. Journal of
Economic Geography, lbv025.
Cummings JN. 2004. Work groups, structural diversity, and knowledge sharing in a global
organization. Management Science 50(3): 352-364.
Cummings JN, Haas MR. 2012. So many teams, so little time: Time allocation matters in
geographically dispersed teams, Journal of Organizational Behavior 33: 316 - 341.
Cummings JN, Kiesler S. 2007. Coordination costs and project outcomes in multi-university
collaborations. Research Policy 36(10): 1620-1634.
Curral LA, Forrester RH, Dawson JF, West MA. 2001. It's what you do and the way that you do
it: Team task, team size, and innovation-related group processes. European Journal of Work
and Organizational Psychology 10(2): 187-204.
Cyert RM, March JG. 1963. A Behavioral Theory of the Firm. Englewood Cliffs, NJ: Wiley-
Blackwell.

38
Diehl M, Stroebe W. 1987. Productivity loss in brainstorming groups: Toward the solution of a
riddle. Journal of Personality and Social Psychology 53(3): 497-509.
Dougherty D, Hardy C. 1996. Sustained product innovation in large, mature organizations:
Overcoming innovation-to-organization problems. Academy of Management Journal 39(5): 1120-1153.
Dougherty D. 1992. Interpretive barriers to successful product innovation in large firms.
Organization Science 3(2): 179-202.
Doz Y, Santos J, Williamson P. 2001. From Global to Metanational: How Companies Win In
The Knowledge Economy. Boston, MA: Harvard Business Press.
Espinosa A, Slaughter S, Kraut R, Herbsleb J. 2007. Familiarity, complexity, and team performance
in geographically distributed software development. Organization Science 18(4): 613-630.
Faraj S, Xiao Y. 2006. Coordination in fast-response organizations. Management Science 52(8):
1155-1169.
Faraj S, Jarvenpaa SL, Majchrzak A. 2011. Knowledge collaboration in online communities.
Organization Science 22(5): 1224-1239.
Felin T, Foss NJ. 2005. Strategic organization: A field in search of micro-foundations. Strategic
Organization 3: 441-455.
Frost TS, Birkinshaw JM, Ensign PC. 2002. Centers of excellence in multinational corporations.
Strategic Management Journal 23(11): 997-1018.
Gibson CB, Birkinshaw J. 2004. The antecedents, consequences, and mediating role of
organizational ambidexterity. Academy of Management Journal 47(2): 209-226.
Girotra K, Terwiesch C, Ulrich KT. 2010. Idea generation and the quality of the best idea.
Management Science 56(4): 591-605.
Grant RM. 1996. Toward a knowledge-based theory of the firm. Strategic Management Journal
17(Winter Special Issue): 109-122.
Gray B. 1989. Collaborating: Finding Common Ground for Multiparty Problems. San Francisco,
CA: Jossey-Bass.
Guzzo RA, Dickson MW. 1996. Teams in organizations: recent research on performance and
effectiveness. Annual Review of Psychology 47:307–38.
Haas MR, Criscuolo P, George G. 2015. Which problems to solve? Online knowledge sharing
and attention allocation in organizations. Academy of Management Journal 58(3): 680-711.
Hackman JR. 2002. Leading Teams: Setting the Stage for Great Performances. Boston, MA: HBS Press.
Hackman JR, Oldham GR. 1980. Work Redesign. Reading, MA: Addison-Wesley.
Hall BH, Ziedonis RH. 2001. The patent paradox revisited: an empirical study of patenting in the
US semiconductor industry, 1979-1995. RAND Journal of Economics: 101-128.
Hansen MT. 1999. The search-transfer problem: The role of weak ties in sharing knowledge
across organization subunits. Administrative Science Quarterly 44(1): 82-111.
Hansen MT. 2009. Collaboration: How Leaders Avoid the Traps, Build Common Ground, and
Reap Big Results. Boston, MA: Harvard Business Press.
Hansen MT, Haas MR. 2001. Competing for attention in knowledge markets: Electronic document
dissemination in a management consulting company. Administrative Science Quarterly 46: 1-28
Heath C, Staudenmayer N. 2000. Coordination neglect: How lay theories of organizing
complicate coordination in organizations. Research in Organizational Behavior 22: 153-191.
Henderson R, Jaffe AB, Trajtenberg M. 1998. Universities as a source of commercial
technology: a detailed analysis of university patenting, 1965–1988. Review of Economics and
Statistics 80(1): 119-127.

39
Hinds PJ, Mortensen M. 2005. Understanding conflict in geographically distributed teams: The
moderating effects of shared identity, shared context, and spontaneous communication.
Organization Science 16(3): 290-307.
Holmes RM, Li H, Hitt MA, DeGhetto K, Sutton T. 2015. The effects of location and MNC
attributes on MNCs’ establishment of foreign R&D centers: Evidence from China. Long Range
Planning, forthcoming.
Huckman RS, Staats BR, Upton DM. 2009. Team familiarity, role experience, and performance:
Evidence from Indian software services. Management Science 55(1): 85-100.
Ilgen DR, Hollenbeck JR, Johnson M, Jundt D. 2005. Teams in Organizations: From Input-
Process-Output Models to IMOI Models. Annual Review of Psychology 56: 517-543.
Jaffe AB. 1989. Characterizing the “technological position” of firms, with application to
quantifying technological opportunity and research spillovers. Research Policy 18(2): 87-97.
Janis IL. 1982. Groupthink: Psychological Studies of Policy Decisions and Fiascoes. Boston,
MA: Cengage Learning.
Iacus SM, King G, Porro G. 2011. Causal inference without balance checking: Coarsened exact
matching. Political Analysis 20(1): 1047-1987.
Kerr SP, Kerr WR. 2015. Global collaborative patents. HBS Working Paper No. 16-059.
Krauss RM, Fussell SR. 1990. Mutual knowledge and communicative effectiveness. In
Intellectual teamwork: Social and technological foundations of cooperative work. Lawrence
Erlbaum Associates, Inc.: 111-146.
Kretschmer T, Puranam P. 2008. Integration through incentives within differentiated
organizations. Organization Science 19(6): 860-875.
Lanjouw JO, Schankerman M. 1999. The quality of ideas: measuring innovation with multiple
indicators. National Bureau of Economic Research, No. w7345.
Latane B, Williams K, Harkins S. 1979. Many hands make light the work: The causes and
consequences of social loafing. Journal of Personality and Social Psychology 37(6): 822.
Manski CF, Lerman SR. 1977. The estimation of choice probabilities from choice based
samples. Econometrica: Journal of the Econometric Society 45(8): 1977-1988.
Maskus KE. 2000. Intellectual Property Rights in the Global Economy. Peterson Institute.
Minson JA, Mueller JS. 2012. The cost of collaboration why joint decision making exacerbates
rejection of outside information. Psychological Science 23(3): 219-224.
Mueller, J. S. 2012. Why individuals in larger teams perform worse. Organizational Behavior
and Human Decision Processes, 117(1): 111-124.
Mullen B, Johnson C, Salas E. 1991. Productivity loss in brainstorming groups: A meta-analytic
integration. Basic and Applied Social Psychology 12(1): 3-23.
Murmann JP. 2003. Knowledge and Competitive Advantage: The Coevolution of Firms,
Technology, and National Institutions. Cambridge, UK: Cambridge University Press.
Nelson RR, Winter SG. 1982. An Evolutionary Theory of Economic Change. Cambridge, MA:
Harvard University Press.
Nonaka I, Takeuchi H. 1995. The Knowledge-Creating Company. Oxford: Oxford University Press.
Okhuysen GA, Bechky BA. 2009. Coordination in organizations: An integrative perspective. The
Academy of Management Annals 3(1): 463-502.
O’Reilly C, Tushman MT. 2004. The ambidextrous organization. Harvard Business Review 82:
74-81.
Paulus PB, Nijstad BA. 2003. Group Creativity: Innovation through Collaboration. Oxford, UK:
Oxford University Press.

40
Phelps M, Kline D. 2009. Burning the Ships: Intellectual Property and the Transformation of
Microsoft. Wiley.
Reagans R, Zuckerman EW. 2001. Networks, diversity, and productivity: The social capital of
corporate R&D teams. Organization Science 12(4): 502-517.
Rosenbaum PR. 2002. Observational Studies. New York: Springer.
Rubin DB. 2006. Matched Sampling for Causal Effects. Cambridge, UK: Cambridge University
Press.
Sarkar MB. 2001. Moving forward by going into reverse: Emerging trends in global innovation
and knowledge strategies. Global Strategy Journal 1 (3-4): 237–242.
Schumpeter JA. 1939. Business Cycles. Cambridge University Press.
Simon HA. 1962. The architecture of complexity. Proceedings of the American Philosophical
Society 106(6): 467-482.
Singh J. 2005. Collaborative networks as determinants of knowledge diffusion patterns.
Management Science 51(5): 756-770.
Singh J, Fleming L. 2010. Lone inventors as sources of breakthroughs: Myth or reality?
Management Science 56(1). 41-56.
Sorenson O, Rivkin JW, Fleming L. 2006. Complexity, networks and knowledge flow. Research
Policy 35: 994-1017.
Staats BR, Milkman KL, Fox C. 2012. The team scaling fallacy: Underestimating the declining
efficiency of larger teams. Organizational Behavior and Human Decision Processes 118(2).
132-142.
Stasser G, Titus W. 1985. Pooling of unshared information in group decision making: Biased
information sampling during discussion. Journal of Personality and Social Psychology 48(6):
1467-1478.
Steiner ID. 1972. Group Process and Productivity. New York: Academic Press.
Stolpe M. 2002. Determinants of knowledge diffusion as evidenced in patent debates: the case of
Liquid Crystal Display technology. Research Policy 31: 1181-1198.
Taylor A, Greve HR. 2006. Superman or the fantastic four? Knowledge combination and
experience in innovative teams. Academy of Management Journal 49(4): 723-740.
Teece DJ. 1986. Profiting from technological innovation: Implications for integration,
collaboration, licensing and public policy. Research Policy 15(6): 285-305.
Thompson JD. 1967. Organizations in Action. New York: McGraw-Hill.
Tsai W. 2001. Knowledge transfer in intraorganizational networks: effects of network position
and absorptive capacity on business unit innovation and performance. Academy of
Management Journal 44(5): 996-1004.
Vural MO, Dahlander L, George G. 2013 Collaborative benefits and coordination costs:
Learning and capability development in science. Strategic Entrepreneurship Journal 7(2): 122-
137.
Wageman R. 1995. Interdependence and group effectiveness. Administrative Science Quarterly
40(1): 145-180.
Wagner S. 2007. Economic Analyses of the European Patent System. Springer Science and
Business Media.
Williams KY, O’Reilly C. 1998. Demography and diversity in organizations. Research in
Organizational Behavior 20: 77-140.
Wuchty S, Jones BF, Uzzi B. 2007. The increasing dominance of teams in production of
knowledge. Science 316(5827): 1036-1039.

41
Table 1. Summary statistics for full sample of 108 patents filed by Tech MNC’s Indian R&D center
Variable Mean S.D. Min Max
Team size 2.15 1.41 1 7
Formal units spanned 1.16 0.42 1 3
Informal community overlap 0.78 0.24 0.11 1
Social ties 0.17 0.12 0 0.4
Resource costs 2.63 1.65 1.55 9
Collaboration experience 0.13 0.24 0 1
Patenting experience 0.82 1.74 0 16

42
Table 2. Summary statistics and correlation matrices for subgroups of real and control teams with 2, 3, or 4 members
Team size = 2 (N=264 real and control teams)
Mean SD Min Max 1 2 3 4 5 6
1 Formal units spanned 1.73 0.44 1 2 1.00
2 Informal community overlap 0.41 0.15 0 0.77 -0.21*** 1.00
3 Social ties 0.12 0.14 0 0.5 -0.06 0.03 1.00
4 Resource costs 1.92 0.52 1 4 -0.15** 0.12** 0.02 1.00
5 Collaboration experience 0.05 0.22 0 1 -0.09 0.02 -0.17*** 0.22*** 1.00
6 Patenting experience 0.27 1.47 0 16 -0.09 0.05 -0.14** 0.30*** 0.74*** 1.00
Team size = 3 (N=154 real and control teams)
Mean SD Min Max 1 2 3 4 5 6
1 Formal units spanned 2.31 0.63 1 3 1.00
2 Informal community overlap 0.42 0.10 0.12 0.67 -0.24*** 1.00
3 Social ties 0.13 0.10 0 0.39 -0.09 0.14 1.00
4 Resource costs 2.92 0.68 1.75 5.75 0.06 0.16** 0.02 1.00
5 Collaboration experience 0.10 0.31 0 1 0.07 0.02 -0.07 0.29*** 1.00
6 Patenting experience 0.49 2.13 0 16 -0.02 -0.04 -0.11 0.21** 0.63*** 1.00
Team size = 4 (N=163 real and control teams)
Mean SD Min Max 1 2 3 4 5 6
1 Formal units spanned 2.83 0.81 1 4 1.00
2 Informal community overlap 0.40 0.10 0.05 0.64 -0.32*** 1.00
3 Social ties 0.13 0.08 0 0.4 -0.06 ’-0.10 1.00
4 Resource costs 3.97 0.74 2.3 6 -0.10 0.12 -0.15* 1.00
5 Collaboration experience 0.13 0.34 0 1 0.08 0.00 0.09 0.15* 1.00
6 Patenting experience 0.56 2.18 0 17 0.05 -0.04 0.02 0.19** 0.62*** 1.00
*Denotes significance at the 10% level; **Denotes significance at the 5% level; ***Denotes significance at the 1% level.

43
Table 3. Logit regression analysis for subgroups of real and control teams with 2, 3, or 4 members, DV= likelihood of patent
generation
Team size = 2 Team size = 3 Team size = 4
1 2 3 4 5 6 7 8 9
Formal units spanned -1.90***
(0.61)
-3.39***
(0.93)
-8.11***
(2.67)
--10.03***
(3.37)
-5.77***
(1.51)
-5.22**
(1.40)
Informal community overlap 18.82***
(4.13)
26.90***
(5.61)
26.14**
(10.83)
34.16*
(18.29)
21.64**
(8.43)
28.50***
(9.98)
Social ties 3.03
(2.16)
3.49
(3.02)
2.35
(3.13)
-2.79
(6.70)
0.66
(3.96)
-9.30
(8.07)
-0.10
(7.40)
-5.29
(6.72)
1.02
(1.27)
Resource cost 1.15***
(0.40)
1.31**
(0.55)
2.10***
(0.78)
3.44***
(1.20)
0.83
(0.54)
4.33***
(1.51)
3.22**
(1.40)
1.72***
(0.34)
3.40**
(1.34)
Collaboration experience -0.25
(3.22)
1.29
(1.71)
0.21
(1.77)
-0.68
(2.44)
0.13
(1.13)
-4.08
(4.24)
4.10**
(2.00)
0.20
(1.95)
2.25
(2.40)
Patenting experience 0.19
(0.28)
-0.03
(0.15)
0.05
(0.15)
-1.76*
(1.01)
-0.14
(0.21)
-0.27**
(0.13)
0.06
(0.18)
0.08
(0.17)
-0.18
(0.17)
Product group dummies Yes Yes Yes Yes Yes Yes Yes Yes Yes
Pseudo R2 0.30 0.53 0.64 0.77 0.52 0.83 0.73 0.44 0.82
Observations 203 203 203 120 120 120 108 108 107
*Denotes significance at the 10% level; **Denotes significance at the 5% level; ***Denotes significance at the 1% level.
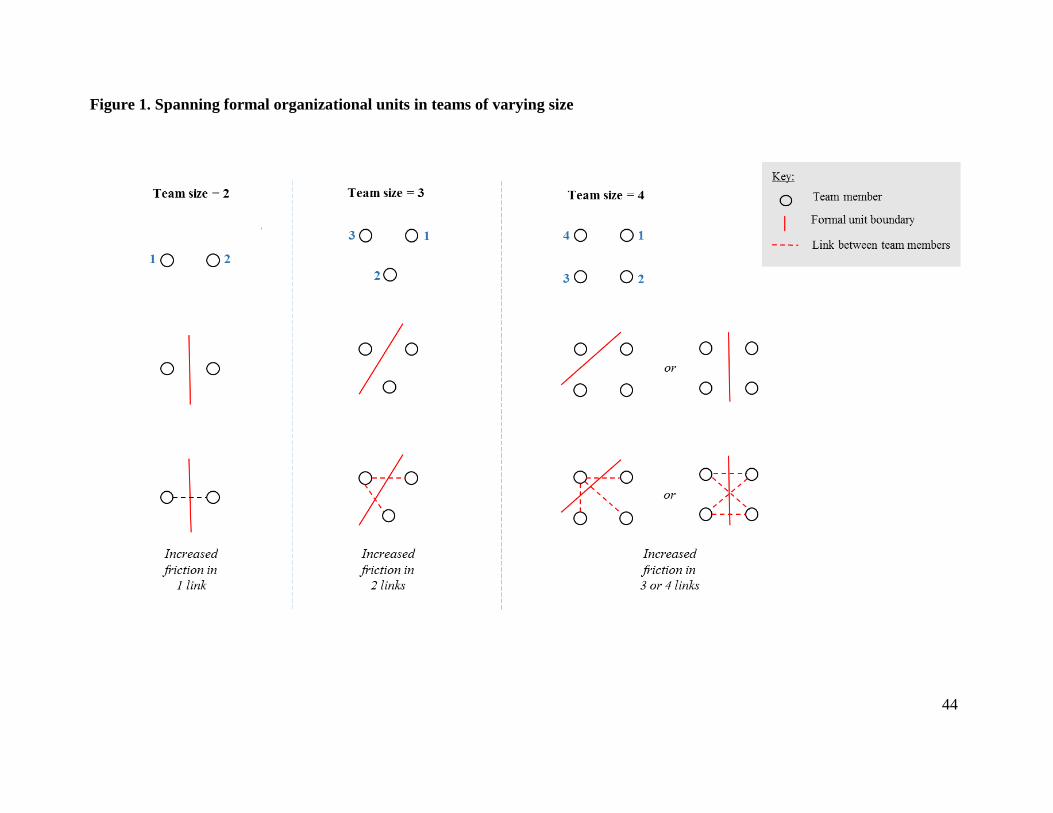
44
Figure 1. Spanning formal organizational units in teams of varying size

45
Figure 2. Overlapping informal communities in teams of varying size

46
Figure 3: Relationship between team size and patent generation
-20.00
-18.00
-16.00
-14.00
-12.00
-10.00
-8.00
-6.00
-4.00
-2.00
0.00
1 2 3 4 5 6 7
Log i
nci
den
ce r
atio
Team size

47
Figure 4: Moderating effect of spanning formal units on the relationship between team size and patent generation

48
Figure 5: Moderating effect of overlapping informal communities on the relationship between team size and patent generation