collaborative effectiveness studies for rares exposures finckh.pdf · collaborative effectiveness...
TRANSCRIPT
SSCQM
Collaborative effectiveness studiesfor rares exposures
Axel FinckhDiv. of Rheumatology & Epidemiology
University of GenevaUniversity of Geneva
Outline1. Rare exposures & cohort studies22. Practical examples of collaborative registry studies
Pan-EU Abatacept analysis Impact of obesity Impact of obesity
2DAG
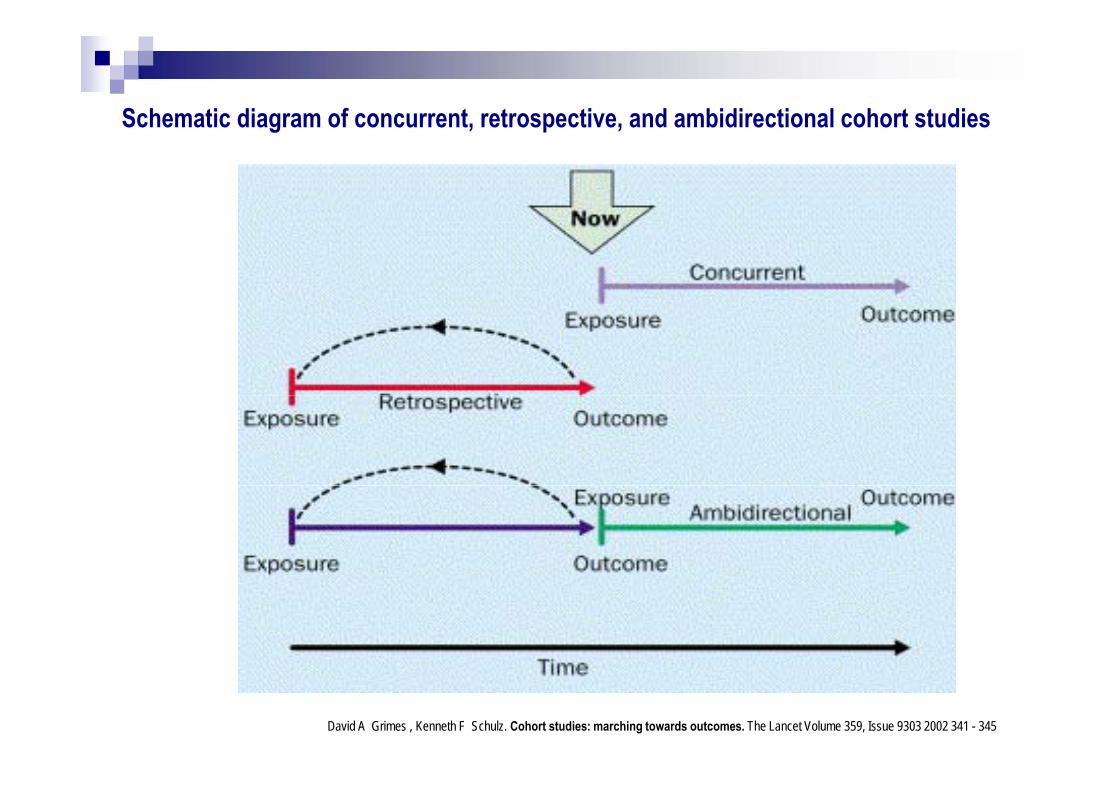
Schematic diagram of concurrent, retrospective, and ambidirectional cohort studiesSchematic diagram of concurrent, retrospective, and ambidirectional cohort studies
David A Grimes , Kenneth F Schulz. Cohort studies: marching towards outcomes. The Lancet Volume 359, Issue 9303 2002 341 - 345
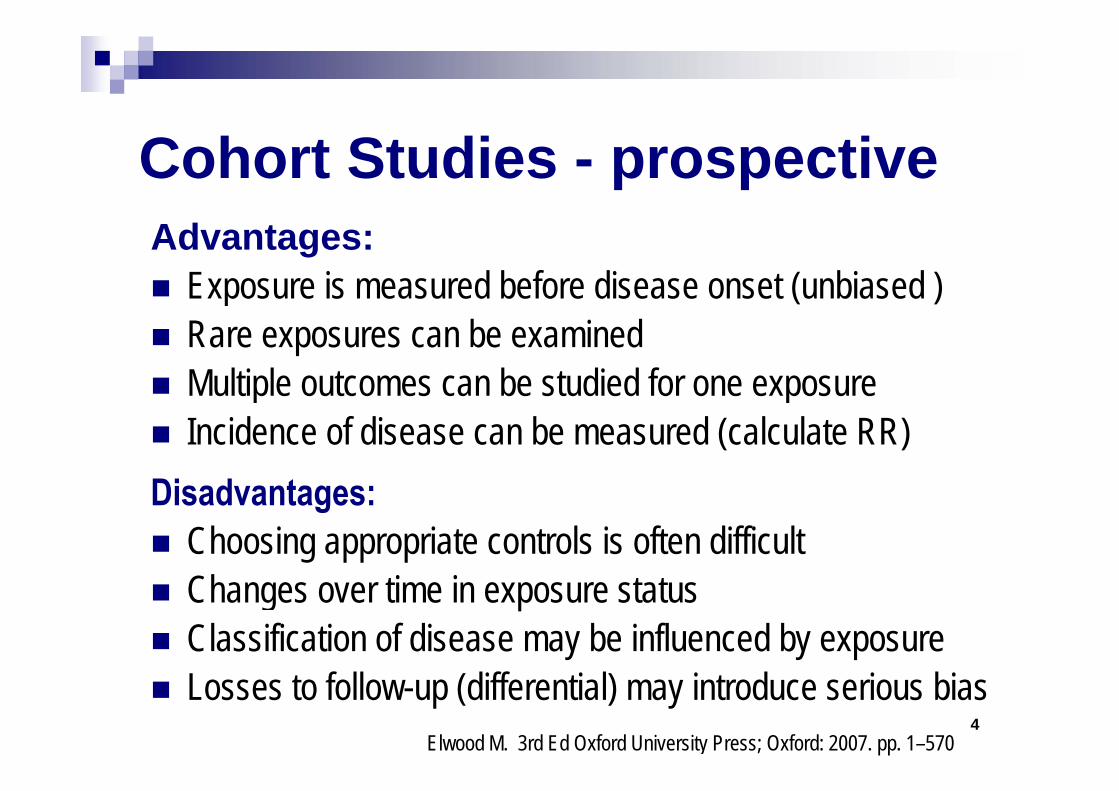
Cohort Studies - prospectiveAdvantages: Exposure is measured before disease onset (unbiased ) ( ) Rare exposures can be examined Multiple outcomes can be studied for one exposure Multiple outcomes can be studied for one exposure Incidence of disease can be measured (calculate RR) Di d t Disadvantages: Choosing appropriate controls is often difficult Changes over time in exposure status Classification of disease may be influenced by exposure Losses to follow-up (differential) may introduce serious bias
4Elwood M. 3rd Ed Oxford University Press; Oxford: 2007. pp. 1–570
David Neto, Axel Finckh, Florenzo Iannone, Estíbaliz Loza, Elisabeth Lie, Piet L.C. Van Riel, Merete L. Hetland, Karel Pavelka, Jacques-Eric Gottenberg Helena Canhão Xavier Mariette and Carl TuressonGottenberg, Helena Canhão, Xavier Mariette and Carl Turesson
Abstract N° 2910
Supported by an unrestricted research grant by Bristol Supported by an unrestricted research grant by Bristol-Myers SquibbI di id l i ti t Individual investigators:
DN: none AF : Abbvie BMS Pfizer Roche AF : Abbvie, BMS, Pfizer, Roche FI: BMS, Pfizer, Abbvie, UCB, Merck, Roche, Actelion E. Loza: Roche E. Lie: BMS, Pfizer, Abbvie, Roche KP: AbbVie, BMS, MSD, Pfizer, Roche PLC VR: None PLC VR: None MLH: Roche, MSD, Pfizer JEG: Abbvie, BMS, MSD, Pfizer, Roche
XM Pfi R h BMD GSK LFB XM: Pfizer, Roche, BMD, GSK, LFB CT: Abbvie, BMS, Janssen, MSD, Pfizer, Roche, UCB
? Are there differences among pts initiating Abatacept (ABA) across Europe
? What is the impact of these differences on drug effectiveness
A l t ti l h t it i t i iti ti Analyze potential heterogeneity in pts initiating ABA across different European countries and th i t f th h t it ll dthe impact of the heterogeneity on overall drug retention
NORDMARD
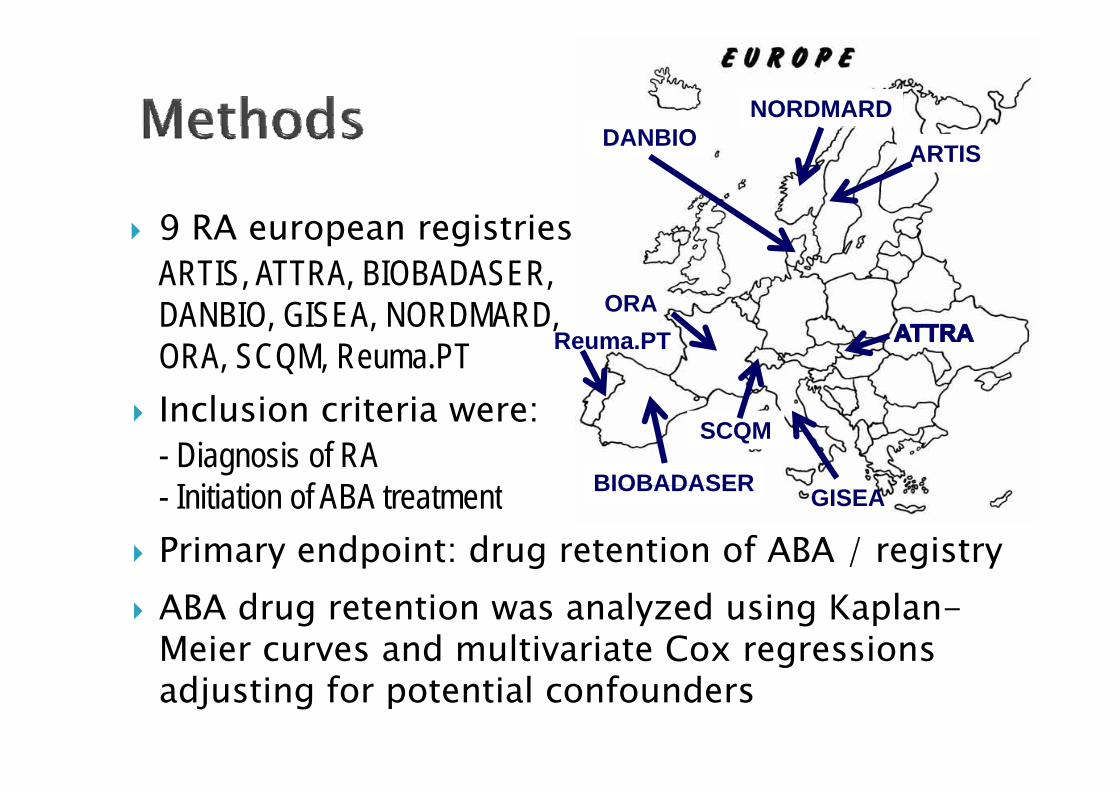
9 RA i i
ARTISDANBIO
9 RA european registries: ARTIS, ATTRA, BIOBADASER, DANBIO GISEA NORDMARD ORADANBIO, GISEA, NORDMARD, ORA, SCQM, Reuma.PT
l
ORAReuma.PT
Inclusion criteria were: - Diagnosis of RA
I iti ti f ABA t t t
SCQM
BIOBADASER- Initiation of ABA treatment Primary endpoint: drug retention of ABA / registry
GISEABIOBADASER
ABA drug retention was analyzed using Kaplan-Meier curves and multivariate Cox regressionsgadjusting for potential confounders
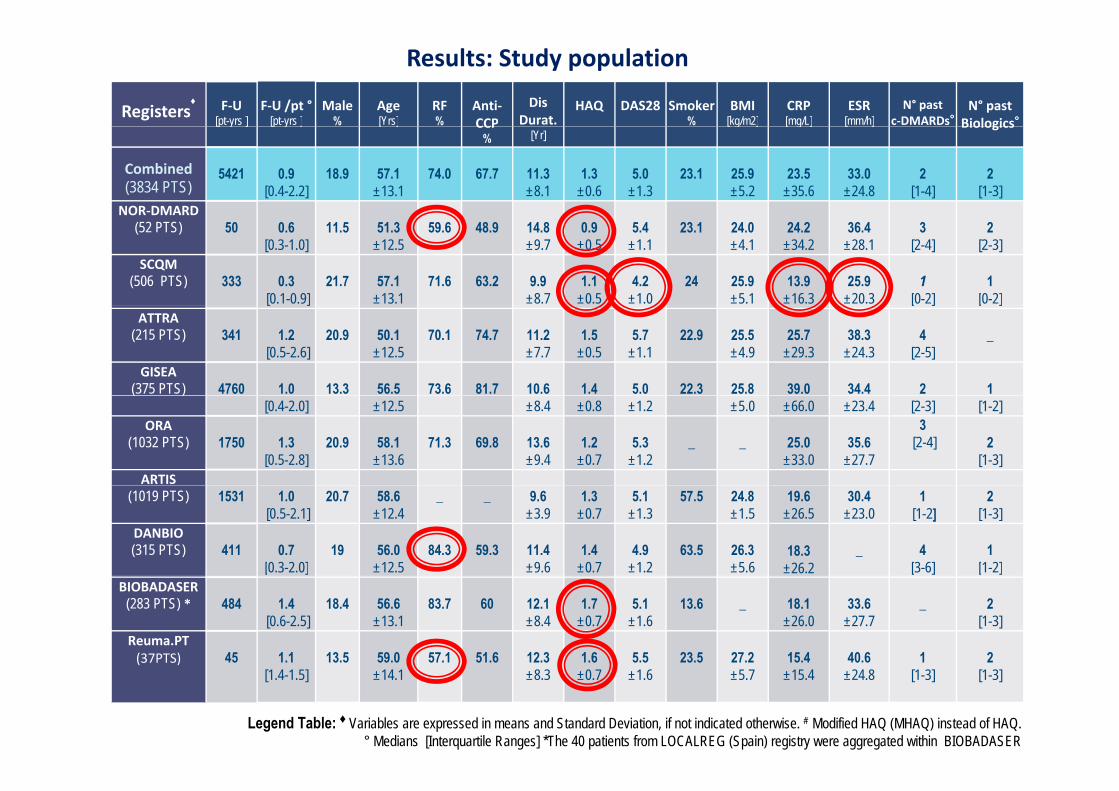
Results: Study population
Registers♦ F‐U
[pt-yrs ]F‐U /pt °
[pt-yrs ]Male
%Age [Yrs]
RF %
Anti‐CCP
Dis Durat.
HAQ DAS28 Smoker%
BMI[kg/m2]
CRP [mg/L]
ESR[mm/h]
N° pastc‐DMARDs°
N° pastBiologics°[p y ] [p y ] [ ] CCP
% [Yr][ g ] [ g ] [ ] Biologics
Combined(3834 PTS)
5421 0.9[0.4-2.2]
18.9 57.1±13.1
74.0 67.7 11.3±8.1
1.3±0.6
5.0±1.3
23.1 25.9±5.2
23.5±35.6
33.0±24.8
2 [1-4]
2 [1-3]
NOR‐DMARD (52 PTS) 50 0.6
[0.3-1.0]11.5 51.3
±12.559.6 48.9 14.8
±9.70.9
±0.55.4
±1.123.1 24.0
±4.124.2
±34.236.4
±28.13
[2-4]2
[2-3]SCQM
(506 PTS) 333 0.3[0.1-0.9]
21.7 57.1±13.1
71.6 63.2 9.9 ±8.7
1.1±0.5
4.2±1.0
24 25.9±5.1
13.9±16.3
25.9±20.3
1 [0-2]
1 [0-2][ ] [ ] [ ]
ATTRA(215 PTS) 341 1.2
[0.5-2.6]20.9 50.1
±12.570.1 74.7 11.2
±7.71.5
±0.55.7
±1.122.9 25.5
±4.925.7
±29.338.3
±24.34
[2-5]_
GISEA(375 PTS) 4760 1.0 13.3 56.5 73.6 81.7 10.6 1.4 5.0 22.3 25.8 39.0 34.4 2 1 ( )
[0.4-2.0] ±12.5 ±8.4 ±0.8 ±1.2 ±5.0 ±66.0 ±23.4 [2-3] [1-2]ORA
(1032 PTS) 1750 1.3[0.5-2.8]
20.9 58.1±13.6
71.3 69.8 13.6±9.4
1.2±0.7
5.3±1.2
_ _ 25.0±33.0
35.6±27.7
3[2-4] 2
[1-3]ARTIS
(1019 PTS) 1531 1.0[0.5-2.1]
20.7 58.6±12.4
_ _ 9.6±3.9
1.3 ±0.7
5.1±1.3
57.5 24.8±1.5
19.6±26.5
30.4±23.0
1[1-2]
2 [1-3]
DANBIO(315 PTS) 411 0.7
[0.3-2.0]19 56.0
±12.584.3 59.3 11.4
±9.61.4
±0.74.9
±1.263.5 26.3
±5.618.3
±26.2_ 4
[3-6]1
[1-2][ ] [ ] [ ]BIOBADASER
(283 PTS) * 484 1.4[0.6-2.5]
18.4 56.6±13.1
83.7 60 12.1±8.4
1.7±0.7
5.1±1.6
13.6 _ 18.1±26.0
33.6±27.7
_ 2 [1-3]
Reuma.PT(37PTS) 45 1.1 13.5 59.0 57.1 51.6 12.3 1.6 5.5 23.5 27.2 15.4 40.6 1 2 ( )
[1.4-1.5] ±14.1 ±8.3 ±0.7 ±1.6 ±5.7 ±15.4 ±24.8 [1-3] [1-3]
Legend Table: ♦ Variables are expressed in means and Standard Deviation, if not indicated otherwise. # Modified HAQ (MHAQ) instead of HAQ. ° Medians [Interquartile Ranges] *The 40 patients from LOCALREG (Spain) registry were aggregated within BIOBADASER
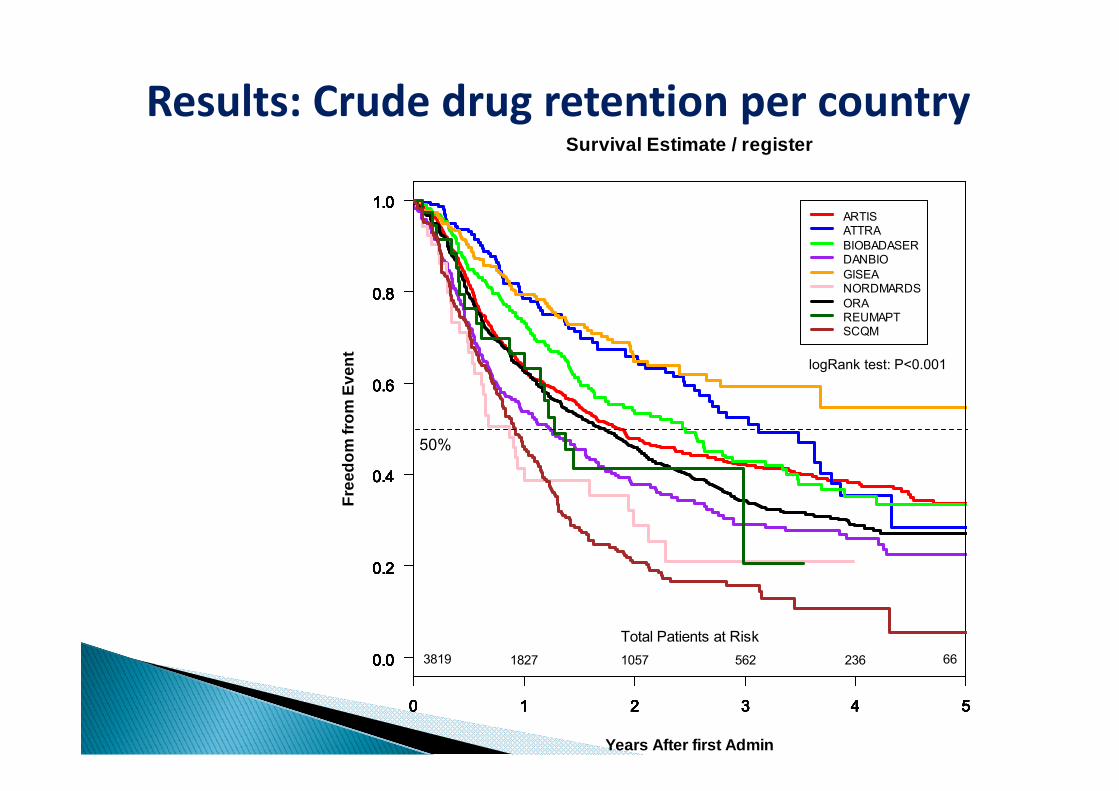
Results: Crude drug retention per country
1.0
Survival Estimate / register
1.01.01.01.01.01.01.01.0ARTIS
0.80.80.80.80.80.80.80.80.8
ARTISATTRABIOBADASERDANBIOGISEANORDMARDSORA
0.6Even
t
0.60.60.60.60.60.60.60.6
ORAREUMAPTSCQM
logRank test: P<0.001
0.4eedo
m fr
om
0.40.40.40.40.40.40.40.4
50%
0.2
Fre
0.20.20.20.20.20.20.20.2
0.00.00.00.00.00.00.00.00.0 3819 1827 1057 562 236 66Total Patients at Risk
0 1 2 3 4 5
0.0
Years After first Admin
0 1 2 3 4 5
0.0
0 1 2 3 4 5
0.0
0 1 2 3 4 5
0.0
0 1 2 3 4 5
0.0
0 1 2 3 4 5
0.0
0 1 2 3 4 5
0.0
0 1 2 3 4 5
0.0
0 1 2 3 4 5
0.0
R i t iMST
d dj dRegistriesPts Events
Med [IQR][yrs]
CrudeHR*
ARTIS 1019 4851.9
[1 6 2 2]1.0[ f]
AdjustedHR *°1.0[ f]ARTIS 1019 485 [1.6‐2.2] [ref]
ATTRA 215 753.1
[2.6‐3.9]0.68
[0.54 – 0.85]
2 5 0 87
[ref]
0.89[0.67 – 1.18]
0 81BIOBADASER 283 135
2.5[1.7 – 3.2]
0.87[0.73 – 1.05]
DANBIO 314 1821.2
[1.0 – 1.7]1.39
[1.17 – 1.67]
0.81[0.65 – 1.00]
1.40[1.16 – 1.69]
GISEA 375 90>5
[3.7 – . ]0.56
[0.44 ‐ 0.70]
NORDMARDS0.9 1.89
0.57[0.46 ‐ 0.72]
1.68NORDMARDS 52 33 [0.5 – 2.0] [1.30 – 2.75]
ORA 1018 6281.7
[1.5 – 1.9]1.13
[1.0 1– 1.28]
[1.16 – 2.44]
1.07[0.93 – 1.23]
0 9Reuma.PT 37 19
1.3[1.0 – .]
1.22[0.77 – 1.93]
SCQM 506 2340.9
[0 8 – 1 1]2.01
[1 73 – 2 35]
0.97[0.56 – 1.67]
2.12[1 79 – 2 51]Q 506 234 [0.8 1.1] [1.73 2.35] [1.79 2.51]
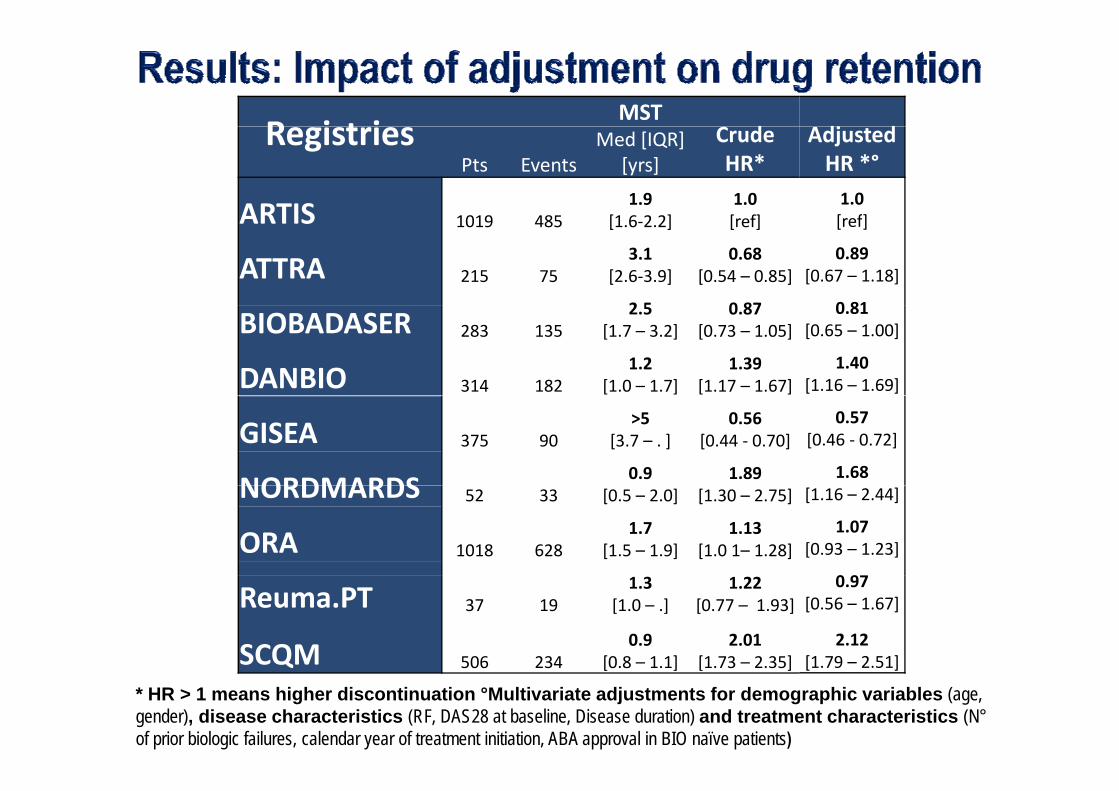
* HR > 1 means higher discontinuation °Multivariate adjustments for demographic variables (age, gender), disease characteristics (RF, DAS28 at baseline, Disease duration) and treatment characteristics (N°of prior biologic failures, calendar year of treatment initiation, ABA approval in BIO naïve patients)
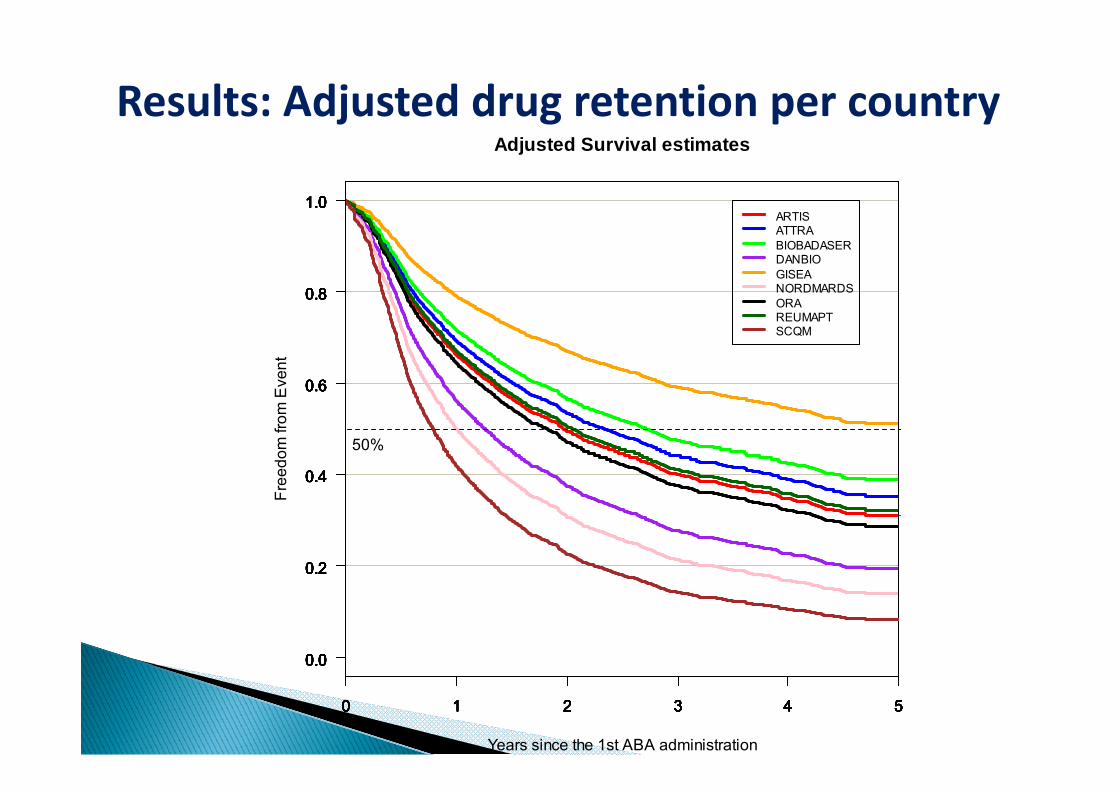
Results: Adjusted drug retention per country
1.01.0
Adjusted Survival estimates
1.01.01.01.01.01.01.01.0ARTIS
0.80.80.80.80.80.80.80.80.80.8
ARTISATTRABIOBADASERDANBIOGISEANORDMARDSORA
0.60.60.6Eve
nt
0.60.60.60.60.60.60.6
ORAREUMAPTSCQM
0.40.40.4reed
om fr
om E
0.40.40.40.40.40.40.4
50%
0.20.20.2
Fr
0.20.20.20.20.20.20.2
0.00.00.00.00.00.00.00.00.00.0
0 1 2 3 4 5
0.0
0 1 2 3 4 5
0.0
0 1 2 3 4 5
0.0
Years since the 1st ABA administration
0 1 2 3 4 5
0.0
0 1 2 3 4 5
0.0
0 1 2 3 4 5
0.0
0 1 2 3 4 5
0.0
0 1 2 3 4 5
0.0
0 1 2 3 4 5
0.0
0 1 2 3 4 5
0.0
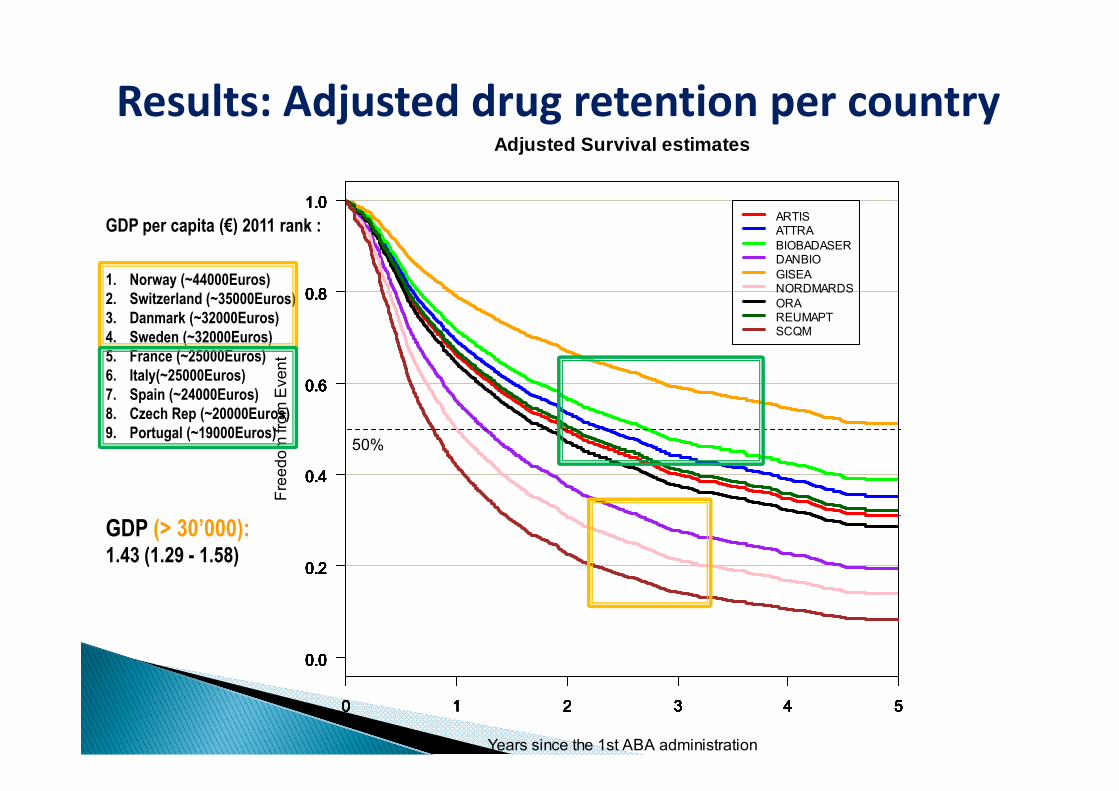
Results: Adjusted drug retention per country
1.01.0
Adjusted Survival estimates
1.01.01.01.01.01.01.01.0ARTIS
0.80.80.80.80.80.80.80.80.80.8
ARTISATTRABIOBADASERDANBIOGISEANORDMARDSORA
GDP per capita (€) 2011 rank :
1. Norway (~44000Euros)2. Switzerland (~35000Euros)
0.60.60.6Eve
nt
0.60.60.60.60.60.60.6
ORAREUMAPTSCQM
( )3. Danmark (~32000Euros)4. Sweden (~32000Euros)5. France (~25000Euros)6. Italy(~25000Euros)7 Spain (~24000Euros)
0.40.40.4reed
om fr
om E
0.40.40.40.40.40.40.4
50%
7. Spain (~24000Euros)8. Czech Rep (~20000Euros)9. Portugal (~19000Euros)
0.20.20.2
Fr
0.20.20.20.20.20.20.2
GDP (> 30’000):1.43 (1.29 - 1.58)
0.00.00.00.00.00.00.00.00.00.0
0 1 2 3 4 5
0.0
0 1 2 3 4 5
0.0
0 1 2 3 4 5
0.0
Years since the 1st ABA administration
0 1 2 3 4 5
0.0
0 1 2 3 4 5
0.0
0 1 2 3 4 5
0.0
0 1 2 3 4 5
0.0
0 1 2 3 4 5
0.0
0 1 2 3 4 5
0.0
0 1 2 3 4 5
0.0
Patient characteristics at ABA initiation varied Patient characteristics at ABA initiation varied across European countries, probably reflecting differences in eligibility criteria and g yprescription patterns
Large differences in ABA drug retention with a Large differences in ABA drug retention, with a trend to shorter ABA maintenance in countries with relatively liberal access to biologicswith relatively liberal access to biologics
National differences need to be accounted for h l l d d f lwhen analyzing pooled data from several
national registries
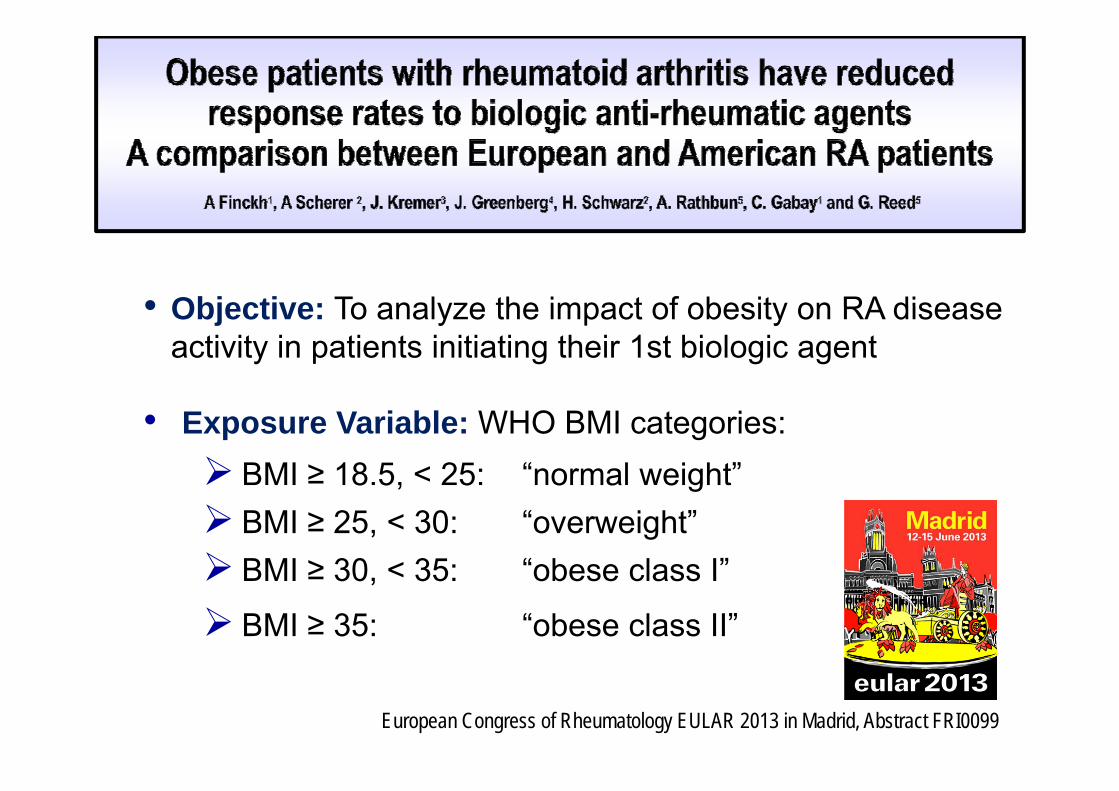
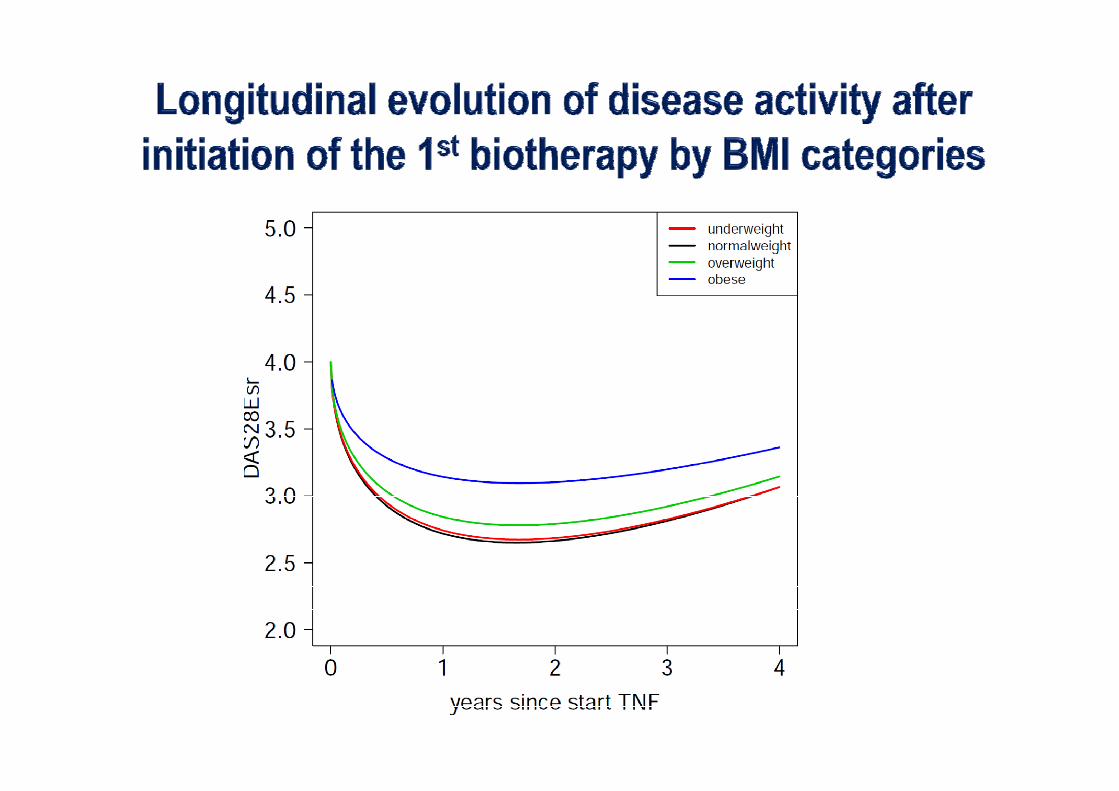
• Objective: To analyze the impact of obesity on RA disease• Objective: To analyze the impact of obesity on RA disease activity in patients initiating their 1st biologic agent
• Exposure Variable: WHO BMI categories: BMI ≥ 18.5, < 25: “normal weight” 8 5, 5 o a e g BMI ≥ 25, < 30: “overweight” BMI ≥ 30 < 35: “obese class I” BMI ≥ 30, < 35: obese class I
BMI ≥ 35: “obese class II”
European Congress of Rheumatology EULAR 2013 in Madrid, Abstract FRI0099
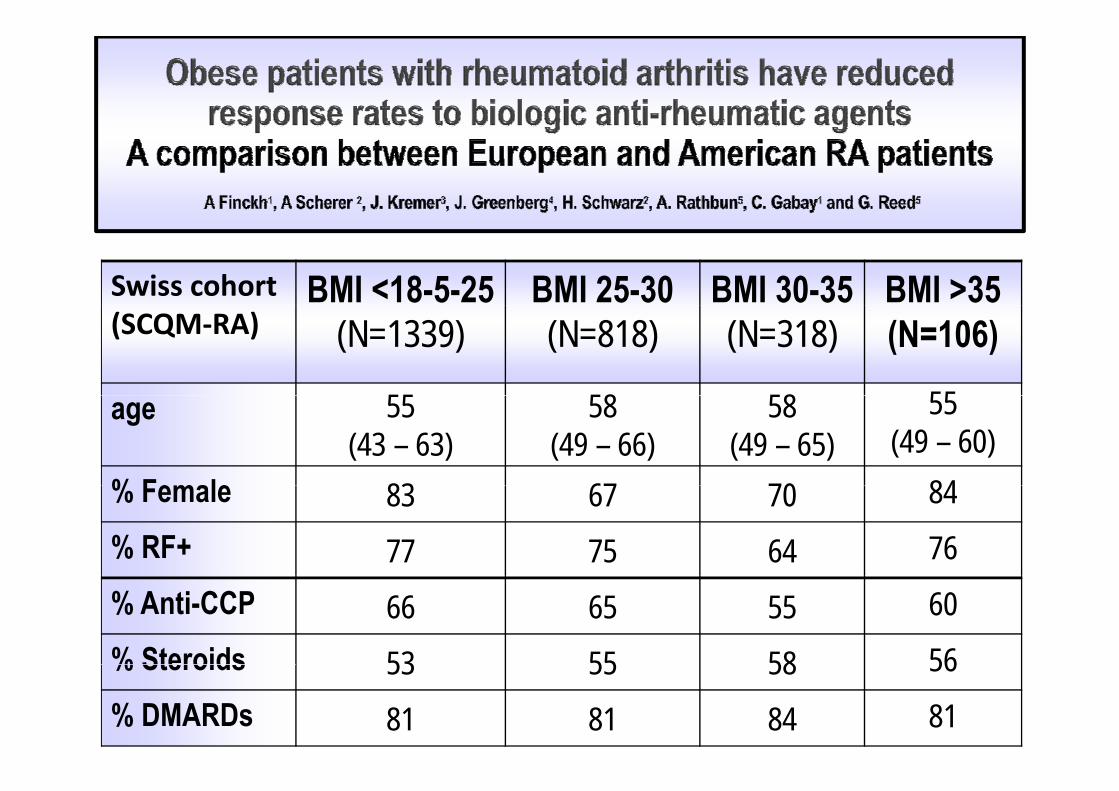
Swiss cohort BMI <18-5-25 BMI 25-30 BMI 30-35 BMI >35(SCQM‐RA) (N=1339) (N=818) (N=318) (N=106)
55 58 58 55age 55(43 – 63)
58(49 – 66)
58(49 – 65)
55(49 – 60)
% Female 83 67 70 84% Female 83 67 70 84% RF+ 77 75 64 76% Anti-CCP 66 65 55 60% Steroids 53 55 58 56% Steroids 53 55 58 56% DMARDs 81 81 84 81
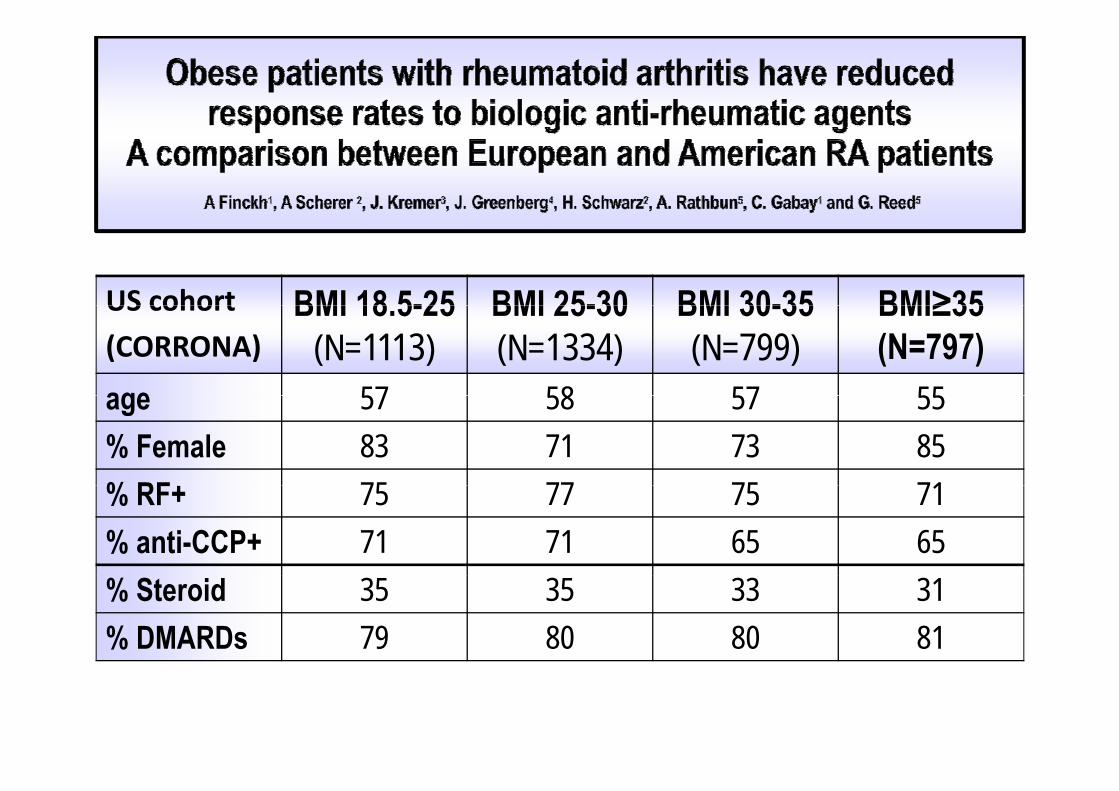
US cohort BMI 18 5-25 BMI 25-30 BMI 30-35 BMI≥35US cohort
(CORRONA)BMI 18.5-25
(N=1113)BMI 25-30(N=1334)
BMI 30-35(N=799)
BMI≥35(N=797)
age 57 58 57 55age 57 58 57 55% Female 83 71 73 85% RF 75 77 75 71% RF+ 75 77 75 71% anti-CCP+ 71 71 65 65% Steroid 35 35 33 31% DMARDs 79 80 80 81
1
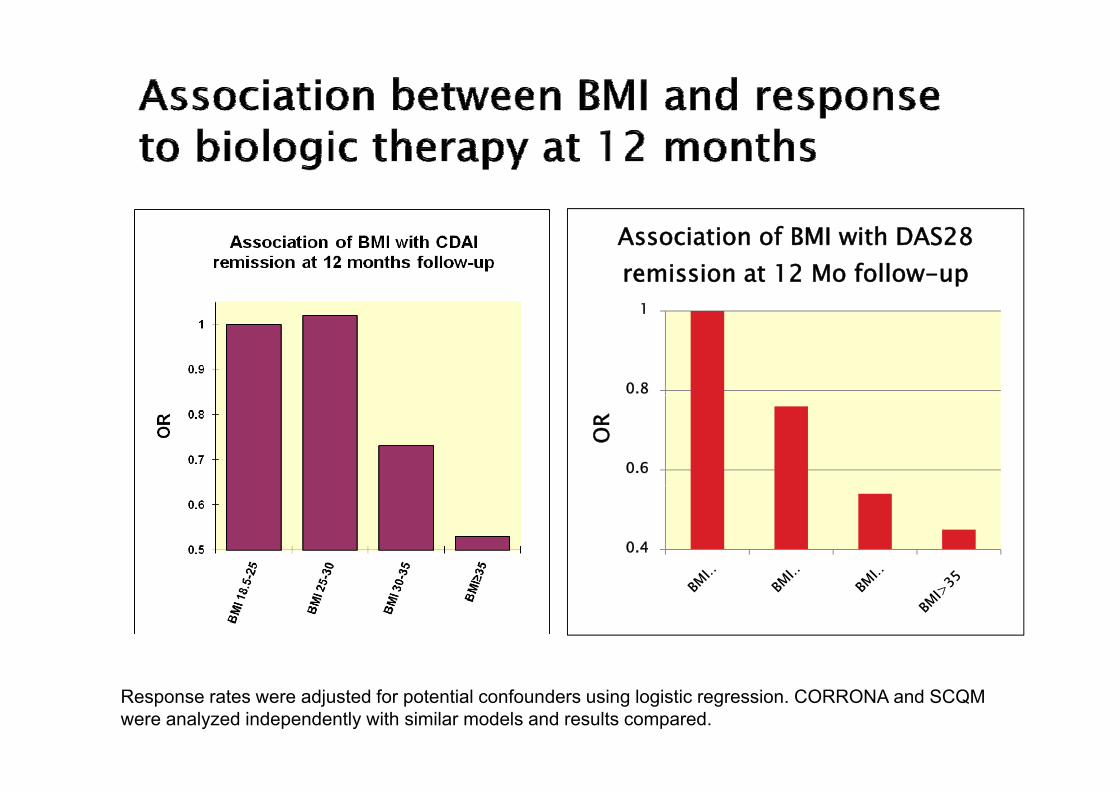
Association of BMI with DAS28 remission at 12 Mo follow-up
0.8
1
0.6
OR
0.4
Response rates were adjusted for potential confounders using logistic regression. CORRONA and SCQM were analyzed independently with similar models and results compared.
Conclusions
• Data from t o different pop lations indicate that• Data from two different populations indicate that obesity is a risk factor for inferior response to biologic
t d h t d t ti i ti t ithagents and shorter drug retention in patients with longstanding RA
• It is uncertain whether this is explained by suboptimal dosing of these therapies in obese patients or by adosing of these therapies in obese patients or by a true biologic effect of adipose tissue
20
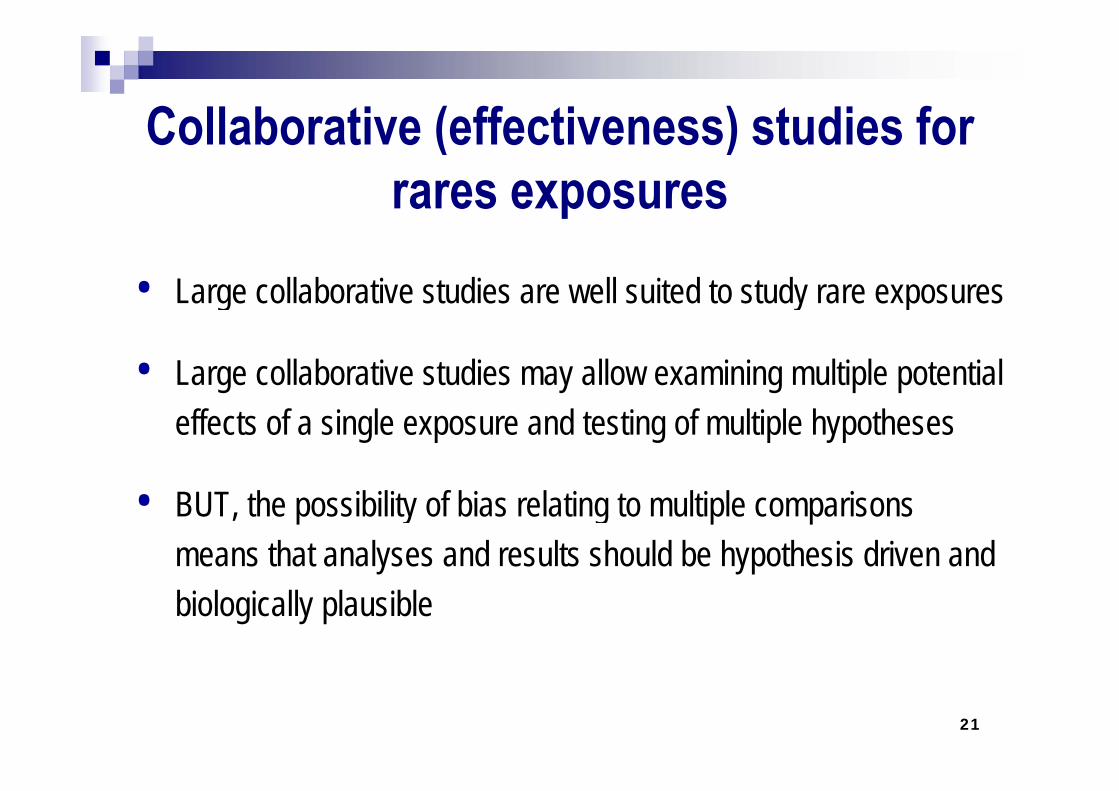
Collaborative (effectiveness) studies for Collaborative (effectiveness) studies for rares exposuresp
• Large collaborative studies are well suited to study rare exposuresg y p
• Large collaborative studies may allow examining multiple potential effects of a single exposure and testing of multiple hypotheses
• BUT, the possibility of bias relating to multiple comparisons means that analyses and results should be hypothesis driven and biologically plausible
21

Thank you !!!Thank you !!!
http://upload.wikimedia.org/wikipedia/commons/e/e6/Views_of_Geneva.jpg
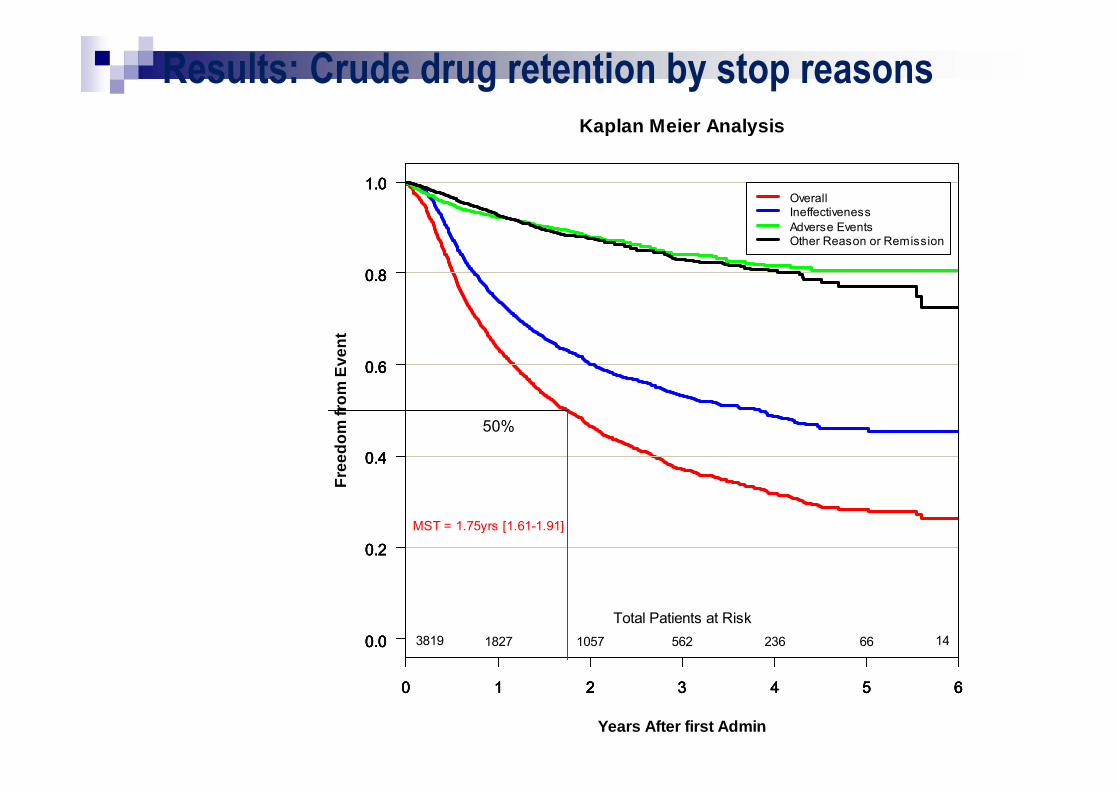
Results: Crude drug retention by stop reasonsKaplan Meier Analysis
1.0
Kaplan Meier Analysis
1.01.01.0OverallIneffectiveness
0.80.80.80.8
IneffectivenessAdverse EventsOther Reason or Remission
0.6m
Eve
nt0.60.60.6
0.4
Free
dom
fro
0.40.40.4
50%
0.2
F
0.20.20.2MST = 1.75yrs [1.61-1.91]
0.00.00.00.0 3819 1827 1057 562 236 66 14Total Patients at Risk
0 1 2 3 4 5 6
Years After first Admin
0 1 2 3 4 5 60 1 2 3 4 5 60 1 2 3 4 5 6
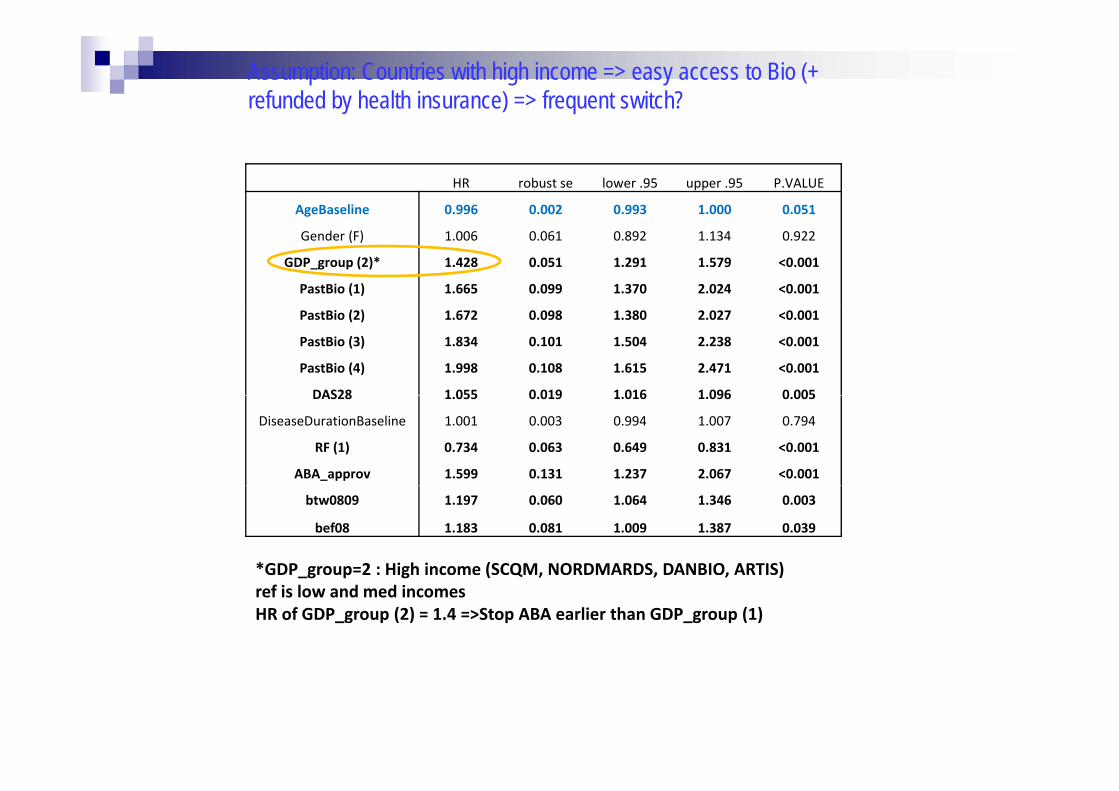
Assumption: Countries with high income => easy access to Bio (+ refunded by health insurance) => frequent switch?
HR robust se lower .95 upper .95 P.VALUE
AgeBaseline 0.996 0.002 0.993 1.000 0.051g
Gender (F) 1.006 0.061 0.892 1.134 0.922
GDP_group (2)* 1.428 0.051 1.291 1.579 <0.001
PastBio (1) 1.665 0.099 1.370 2.024 <0.001
PastBio (2) 1.672 0.098 1.380 2.027 <0.001
PastBio (3) 1.834 0.101 1.504 2.238 <0.001
PastBio (4) 1.998 0.108 1.615 2.471 <0.001
DAS28 1 055 0 019 1 016 1 096 0 005DAS28 1.055 0.019 1.016 1.096 0.005
DiseaseDurationBaseline 1.001 0.003 0.994 1.007 0.794
RF (1) 0.734 0.063 0.649 0.831 <0.001
ABA_approv 1.599 0.131 1.237 2.067 <0.001
btw0809 1.197 0.060 1.064 1.346 0.003
bef08 1.183 0.081 1.009 1.387 0.039
*GDP group=2 : High income (SCQM, NORDMARDS, DANBIO, ARTIS)_g p g ( Q , , , )ref is low and med incomesHR of GDP_group (2) = 1.4 =>Stop ABA earlier than GDP_group (1)