collaborative measurement of internet quality in lebanon
TRANSCRIPT
Collaborative Measurement of Internet Quality in Lebanon
Progress Report
Edition 01 20/06/2014
Collaborative Measurement of Internet Quality in Lebanon
Page 2 of 12
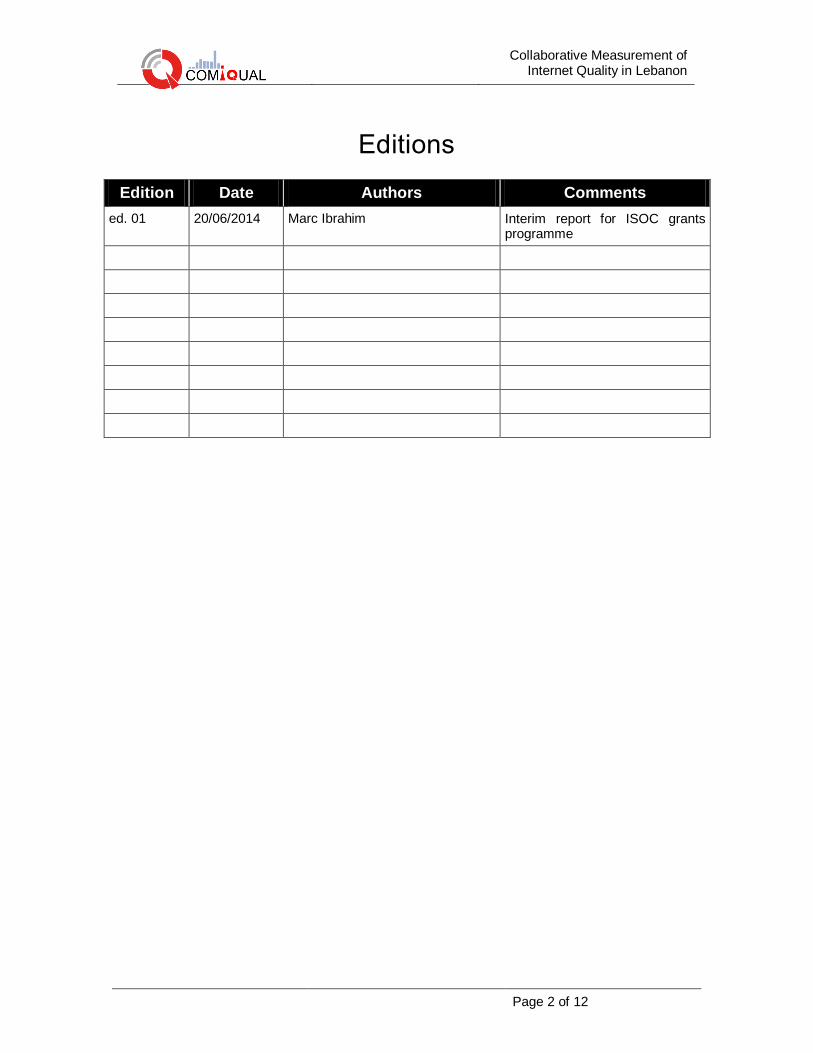
Editions
Edition Date Authors Comments
ed. 01 20/06/2014 Marc Ibrahim Interim report for ISOC grants programme
Collaborative Measurement of Internet Quality in Lebanon
Page 3 of 12
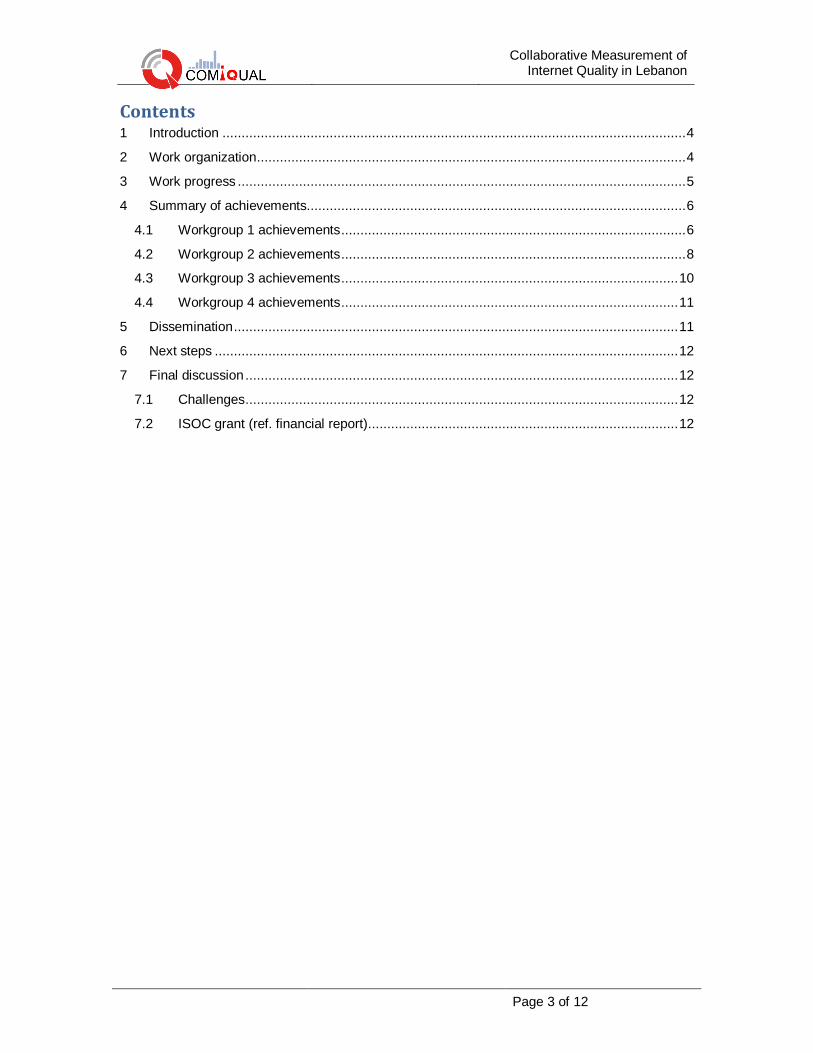
Contents 1 Introduction ......................................................................................................................... 4
2 Work organization ................................................................................................................ 4
3 Work progress ..................................................................................................................... 5
4 Summary of achievements................................................................................................... 6
4.1 Workgroup 1 achievements .......................................................................................... 6
4.2 Workgroup 2 achievements .......................................................................................... 8
4.3 Workgroup 3 achievements ........................................................................................ 10
4.4 Workgroup 4 achievements ........................................................................................ 11
5 Dissemination .................................................................................................................... 11
6 Next steps ......................................................................................................................... 12
7 Final discussion ................................................................................................................. 12
7.1 Challenges ................................................................................................................. 12
7.2 ISOC grant (ref. financial report) ................................................................................. 12
Collaborative Measurement of Internet Quality in Lebanon
Page 4 of 12
1 Introduction The CoMIQuaL project is a neutral, transparent, distributed and collaborative platform for
measuring the service quality of Internet access of mobile and ADSL users in Lebanon.
The CoMIQuaL project aims at building a platform for measuring the service quality of Internet
access of mobile and DSL users in Lebanon. This platform should be:
- Neutral: results are scientifically derived without bias toward any provider or operator.
- Transparent: Measurements methods and their implementation as well as results
computation are open.
- Collaborative: everyone can participate in measurements.
Such platform will:
- Be a tool for users to assess, compare, and choose.
- Constitute a valuable user feedback for mobile operators and ISPs.
- Contribute to the effort toward broadband Internet in Lebanon.
Since the platform will measure the user experience, the measurement agents are software
installed on end-user devices. A measurement center will control the action of the measurement
agents and receive back their measurement results. These results will be available for public
access.
2 Work organization The work is organized in 5 workgroups. A workgroup is led by a faculty professor who supervises
the technical work essentially done by students within their academic projects or trainings. The
first four workgroups are technical and work collaboratively in developing the CoMIQuaL platform.
The fifth workgroup is responsible of the project promotion. In brief:
- WG1 is responsible of defining the scope of the project and designing the global
architecture in the first phase. Then, this workgroup will supervise the software
integration and the functional test leading to the final deployment and launch.
- WG2 selects the measurements methods to implement (ping, UDP jitter, etc.) along with
their optimal parameters.
- WG3 coordinates the software development of the measurement platform (agents and
server).
- WG4 develops the project web site as well as all the visualization and statistical tools that
will be available on the site.
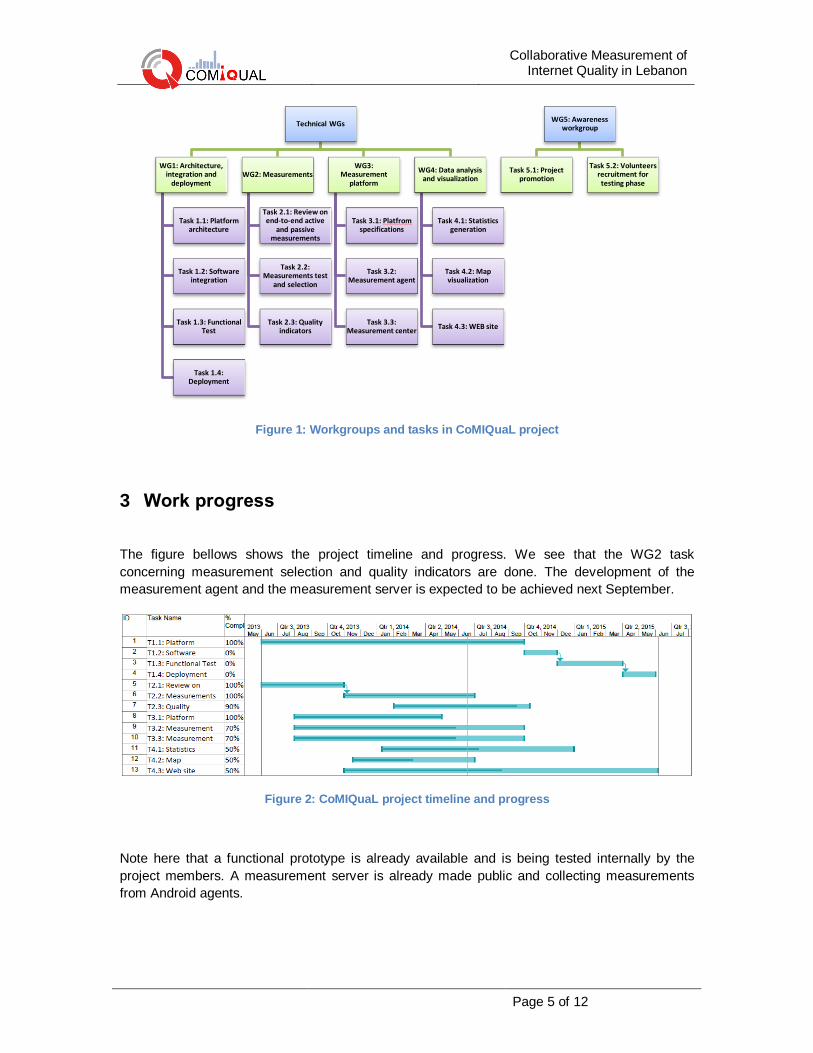
The following diagram shows all workgroups with their tasks. Note that there have been some
modifications in workgroups names and responsibilities since the project definition last year.
Collaborative Measurement of Internet Quality in Lebanon
Page 5 of 12
Figure 1: Workgroups and tasks in CoMIQuaL project
3 Work progress
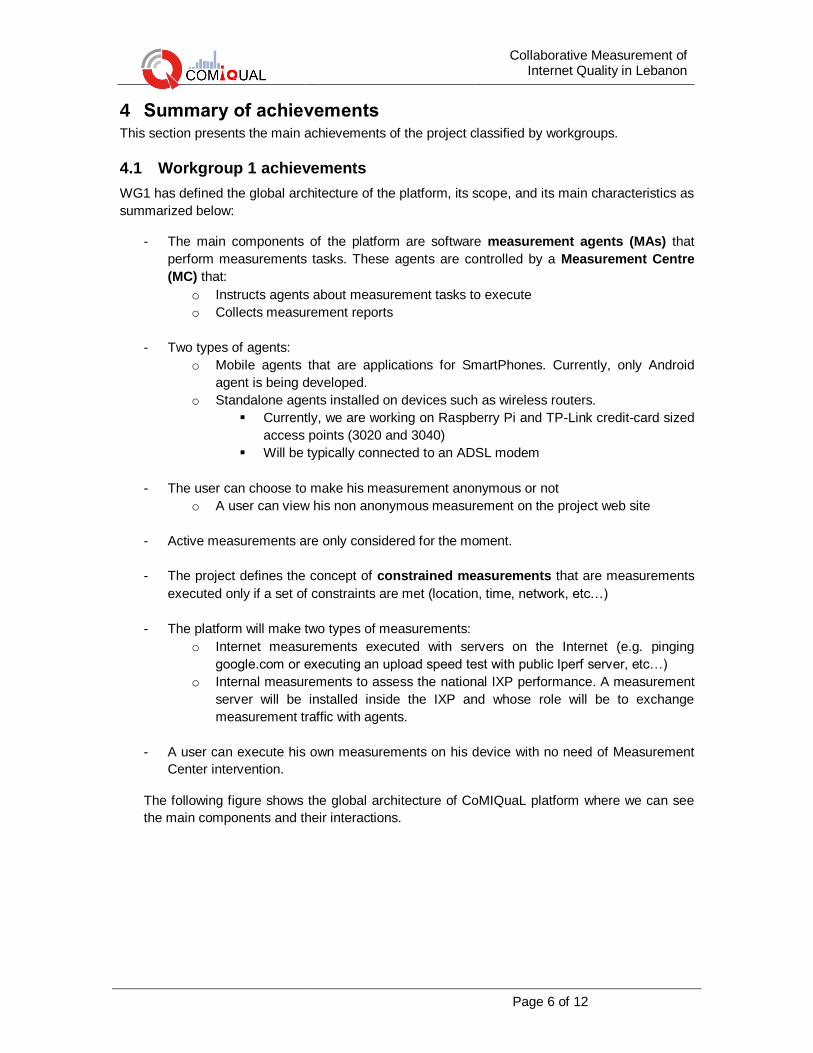
The figure bellows shows the project timeline and progress. We see that the WG2 task
concerning measurement selection and quality indicators are done. The development of the
measurement agent and the measurement server is expected to be achieved next September.
Figure 2: CoMIQuaL project timeline and progress
Note here that a functional prototype is already available and is being tested internally by the
project members. A measurement server is already made public and collecting measurements
from Android agents.
Technical WGs
WG1: Architecture, integration and
deployment
Task 1.1: Platform architecture
Task 1.2: Software integration
Task 1.3: Functional Test
Task 1.4: Deployment
WG2: Measurements
Task 2.1: Review on end-to-end active
and passive measurements
Task 2.2: Measurements test
and selection
Task 2.3: Quality indicators
WG3: Measurement
platform
Task 3.1: Platfrom specifications
Task 3.2: Measurement agent
Task 3.3: Measurement center
WG4: Data analysis and visualization
Task 4.1: Statistics generation
Task 4.2: Map visualization
Task 4.3: WEB site
WG5: Awareness workgroup
Task 5.1: Project promotion
Task 5.2: Volunteers recruitment for testing phase
Collaborative Measurement of Internet Quality in Lebanon
Page 6 of 12
4 Summary of achievements This section presents the main achievements of the project classified by workgroups.
4.1 Workgroup 1 achievements
WG1 has defined the global architecture of the platform, its scope, and its main characteristics as
summarized below:
- The main components of the platform are software measurement agents (MAs) that
perform measurements tasks. These agents are controlled by a Measurement Centre
(MC) that:
o Instructs agents about measurement tasks to execute
o Collects measurement reports
- Two types of agents:
o Mobile agents that are applications for SmartPhones. Currently, only Android
agent is being developed.
o Standalone agents installed on devices such as wireless routers.
Currently, we are working on Raspberry Pi and TP-Link credit-card sized
access points (3020 and 3040)
Will be typically connected to an ADSL modem
- The user can choose to make his measurement anonymous or not
o A user can view his non anonymous measurement on the project web site
- Active measurements are only considered for the moment.
- The project defines the concept of constrained measurements that are measurements
executed only if a set of constraints are met (location, time, network, etc…)
- The platform will make two types of measurements:
o Internet measurements executed with servers on the Internet (e.g. pinging
google.com or executing an upload speed test with public Iperf server, etc…)
o Internal measurements to assess the national IXP performance. A measurement
server will be installed inside the IXP and whose role will be to exchange
measurement traffic with agents.
- A user can execute his own measurements on his device with no need of Measurement
Center intervention.
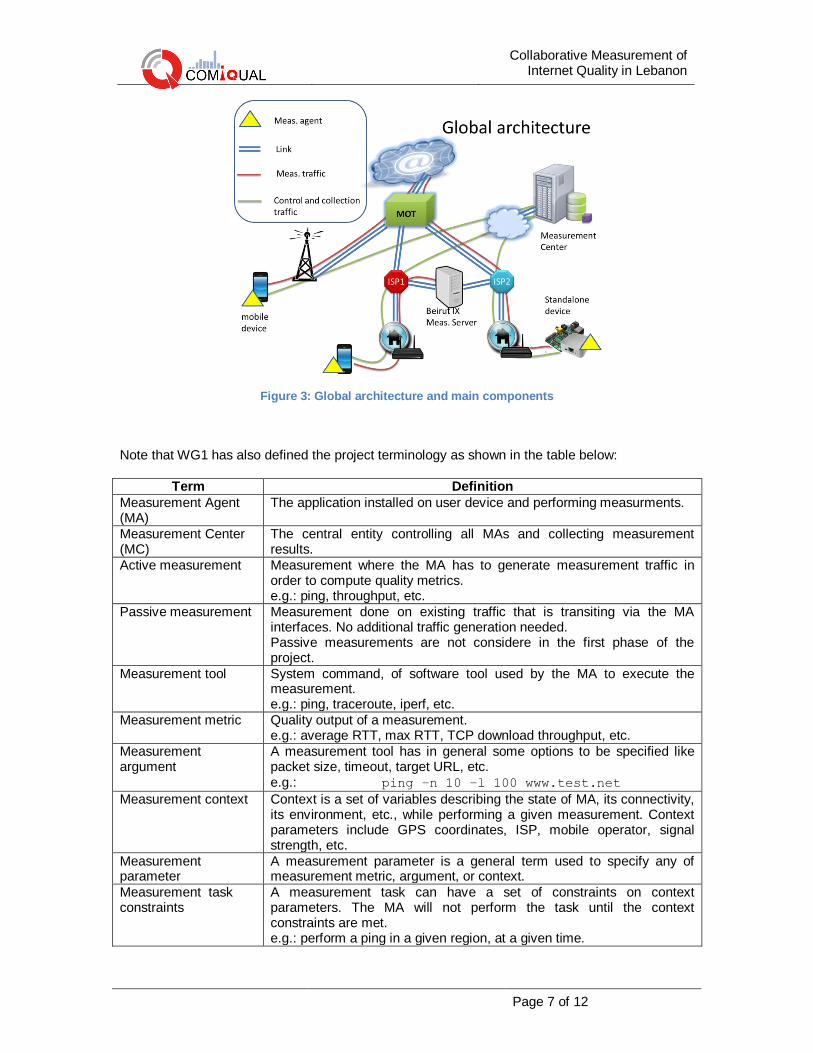
The following figure shows the global architecture of CoMIQuaL platform where we can see
the main components and their interactions.
Collaborative Measurement of Internet Quality in Lebanon
Page 7 of 12
Figure 3: Global architecture and main components
Note that WG1 has also defined the project terminology as shown in the table below:
Term Definition
Measurement Agent (MA)
The application installed on user device and performing measurments.
Measurement Center (MC)
The central entity controlling all MAs and collecting measurement results.
Active measurement Measurement where the MA has to generate measurement traffic in order to compute quality metrics. e.g.: ping, throughput, etc.
Passive measurement Measurement done on existing traffic that is transiting via the MA interfaces. No additional traffic generation needed. Passive measurements are not considere in the first phase of the project.
Measurement tool System command, of software tool used by the MA to execute the measurement. e.g.: ping, traceroute, iperf, etc.
Measurement metric Quality output of a measurement. e.g.: average RTT, max RTT, TCP download throughput, etc.
Measurement argument
A measurement tool has in general some options to be specified like packet size, timeout, target URL, etc. e.g.: ping –n 10 –l 100 www.test.net
Measurement context Context is a set of variables describing the state of MA, its connectivity, its environment, etc., while performing a given measurement. Context parameters include GPS coordinates, ISP, mobile operator, signal strength, etc.
Measurement parameter
A measurement parameter is a general term used to specify any of measurement metric, argument, or context.
Measurement task constraints
A measurement task can have a set of constraints on context parameters. The MA will not perform the task until the context constraints are met. e.g.: perform a ping in a given region, at a given time.
Collaborative Measurement of Internet Quality in Lebanon
Page 8 of 12
Measurement task A measurement that MA is asked to do. A task consists mainly of: - Creation and end dates of the task - A measurement to do - Arguments of the measurement - Metrics to be obtained by the measurement - Constraints
Instructed measurement tasks
Measurement task sent by MC to MA.
User defined measurement tasks
Measurement task initiated manually by the user.
Measurement Scenario
A set of measurement tasks defined by an administrator at the MC.
Measurement Scenario constraints
A set of context constraints that have to be met by a MA in order to receive the scenario from the MC.
Anonymous mode A measurement mode where the device user is not authenticated. The measurements will anonymously be uploaded to the MC.
Authenticated mode In this mode, a user is authenticated via the MA. Measurements done by the MA are related to that user and he can access them on the CoMIQuaL site by logging in with his credentials.
Table 1: Project terminology
4.2 Workgroup 2 achievements
At the beginning of the project, WG2 conducted an assessment of mobile Internet performance in
Lebanon. IP measurements were done in different places and times in order to derive the
compliance rates with the performance targets set by the Lebanese TRA (Telecom Regulation
Authority). Results can be found in:
https://drive.google.com/file/d/0B3xeO1JgxV53bzN4eUpCb0cxNlk/edit?usp=sharing
WG2 then worked on selecting and parameterizing the measurements that will be used in
CoMIQuaL. The achieved tasks are the following:
- Active measurement state of the art:
o A review of active measurements was done. The following was specifically
considered:
Measurement traffic and metrics calculation as defined in IPPM RFCs
Existing related tools
o A study on active measurements for the special case of mobile devices was also
conducted. It considered the specific problems due to mobile devices state
(IDLE, CONNECTED, etc.) and the the need for additional care to perform active
measurements one mobile devices.
- Passive measurement state of the art:
A review was made on passive measurements and the possible use of
passive traffic analysis on mobile devices. Nevertheless, mobile devices
need to be rooted (accessed in root mode) for passive measurements
and hence, passive measurements will not be tackled in the short term
See report at :
Collaborative Measurement of Internet Quality in Lebanon
Page 9 of 12
https://drive.google.com/file/d/0B25Kz4n9VRZoRUE1WWE2clNoNUk/edi
t?usp=sharing
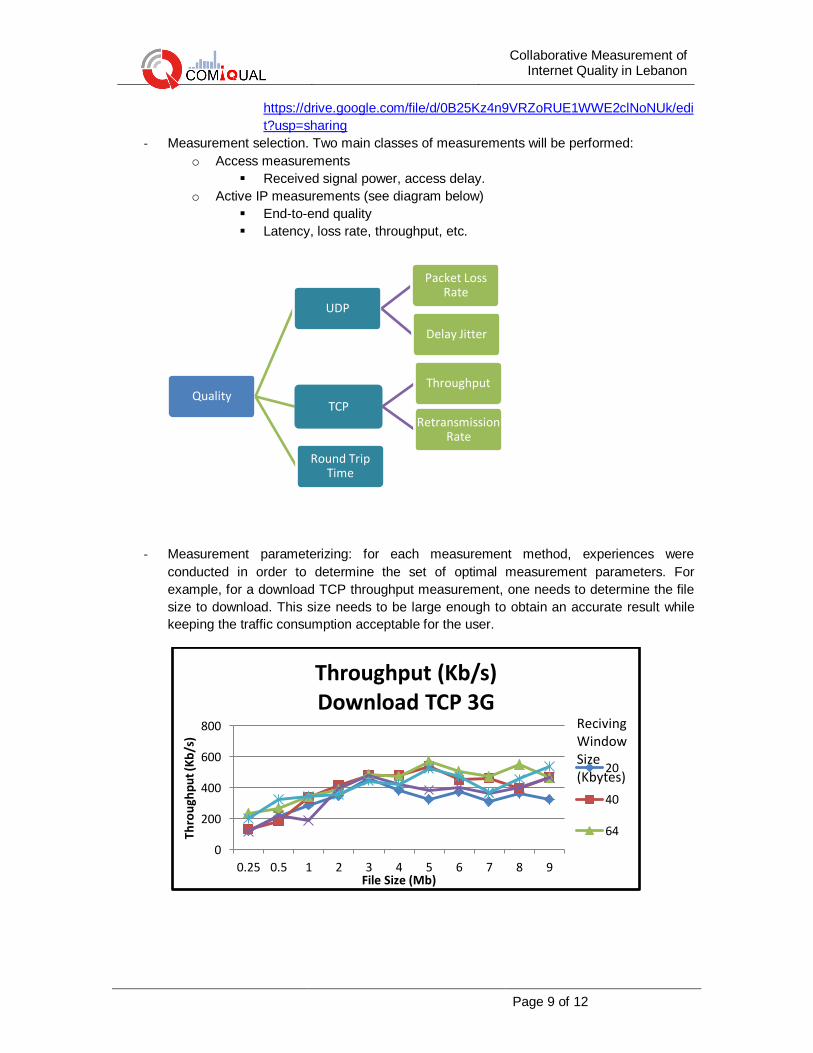
- Measurement selection. Two main classes of measurements will be performed:
o Access measurements
Received signal power, access delay.
o Active IP measurements (see diagram below)
End-to-end quality
Latency, loss rate, throughput, etc.
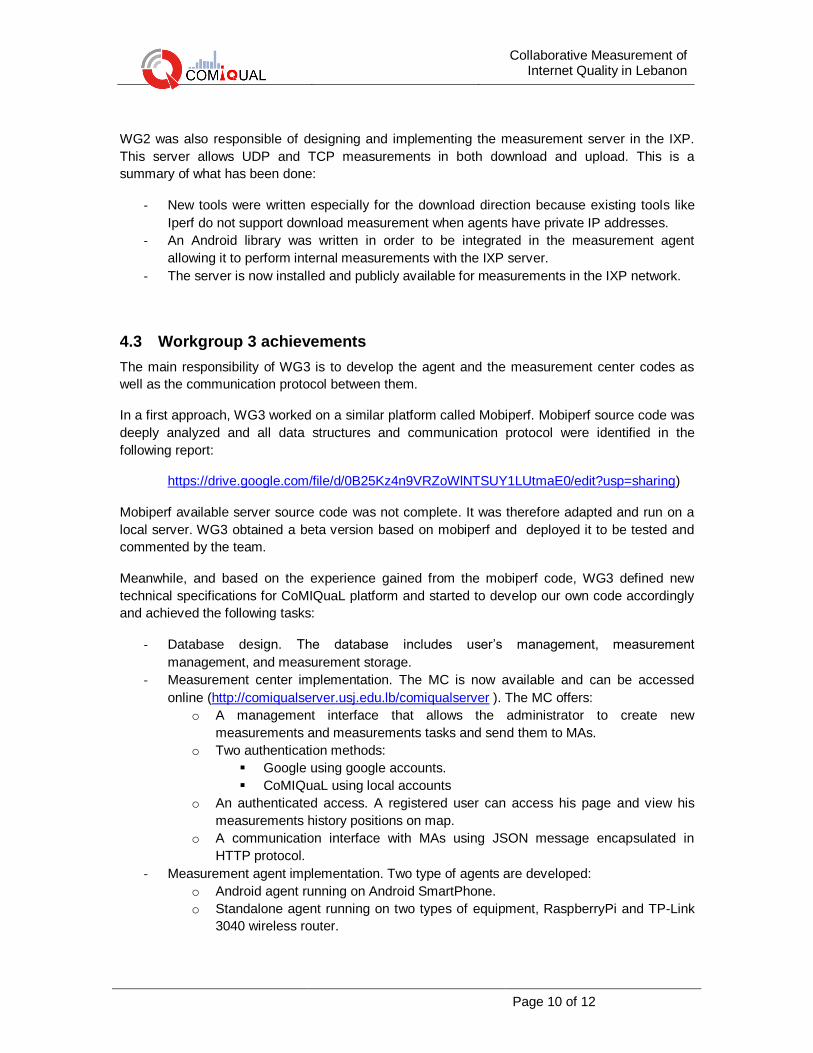
- Measurement parameterizing: for each measurement method, experiences were
conducted in order to determine the set of optimal measurement parameters. For
example, for a download TCP throughput measurement, one needs to determine the file
size to download. This size needs to be large enough to obtain an accurate result while
keeping the traffic consumption acceptable for the user.
Quality
UDP
Packet Loss Rate
Delay Jitter
TCP
Throughput
Retransmission Rate
Round Trip Time
0
200
400
600
800
0.25 0.5 1 2 3 4 5 6 7 8 9
Thro
ugh
pu
t (K
b/s
)
File Size (Mb)
Throughput (Kb/s) Download TCP 3G
20
40
64
Reciving Window Size (Kbytes)
Collaborative Measurement of Internet Quality in Lebanon
Page 10 of 12
WG2 was also responsible of designing and implementing the measurement server in the IXP.
This server allows UDP and TCP measurements in both download and upload. This is a
summary of what has been done:
- New tools were written especially for the download direction because existing tools like
Iperf do not support download measurement when agents have private IP addresses.
- An Android library was written in order to be integrated in the measurement agent
allowing it to perform internal measurements with the IXP server.
- The server is now installed and publicly available for measurements in the IXP network.
4.3 Workgroup 3 achievements
The main responsibility of WG3 is to develop the agent and the measurement center codes as
well as the communication protocol between them.
In a first approach, WG3 worked on a similar platform called Mobiperf. Mobiperf source code was
deeply analyzed and all data structures and communication protocol were identified in the
following report:
https://drive.google.com/file/d/0B25Kz4n9VRZoWlNTSUY1LUtmaE0/edit?usp=sharing)
Mobiperf available server source code was not complete. It was therefore adapted and run on a
local server. WG3 obtained a beta version based on mobiperf and deployed it to be tested and
commented by the team.
Meanwhile, and based on the experience gained from the mobiperf code, WG3 defined new
technical specifications for CoMIQuaL platform and started to develop our own code accordingly
and achieved the following tasks:
- Database design. The database includes user’s management, measurement
management, and measurement storage.
- Measurement center implementation. The MC is now available and can be accessed
online (http://comiqualserver.usj.edu.lb/comiqualserver ). The MC offers:
o A management interface that allows the administrator to create new
measurements and measurements tasks and send them to MAs.
o Two authentication methods:
Google using google accounts.
CoMIQuaL using local accounts
o An authenticated access. A registered user can access his page and view his
measurements history positions on map.
o A communication interface with MAs using JSON message encapsulated in
HTTP protocol.
- Measurement agent implementation. Two type of agents are developed:
o Android agent running on Android SmartPhone.
o Standalone agent running on two types of equipment, RaspberryPi and TP-Link
3040 wireless router.
Collaborative Measurement of Internet Quality in Lebanon
Page 11 of 12
With these results, WG3 has provided us with a working prototype that is functional and is being
tested by the team. This prototype version needs to be finalized, fine-tuned, and debugged.
4.4 Workgroup 4 achievements
The main achievements of WG4 are the following:
- Designing the project website (http://comiqual.usj.edu.lb ).
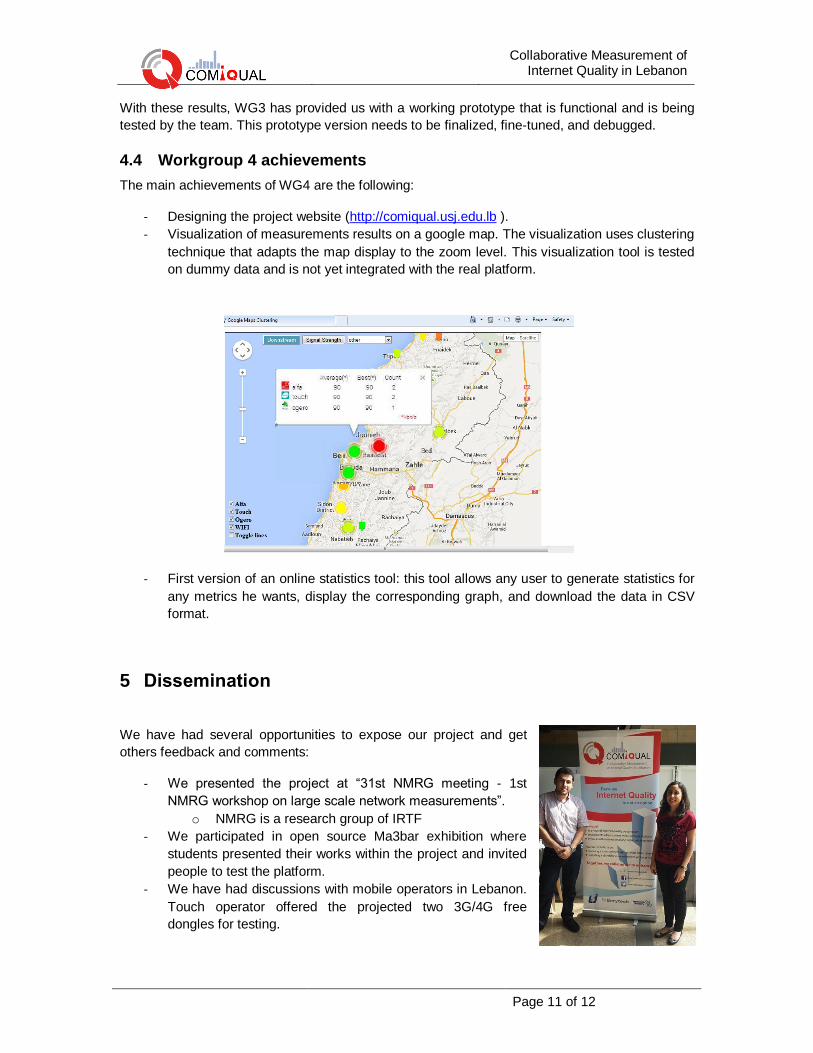
- Visualization of measurements results on a google map. The visualization uses clustering
technique that adapts the map display to the zoom level. This visualization tool is tested
on dummy data and is not yet integrated with the real platform.
- First version of an online statistics tool: this tool allows any user to generate statistics for
any metrics he wants, display the corresponding graph, and download the data in CSV
format.
5 Dissemination
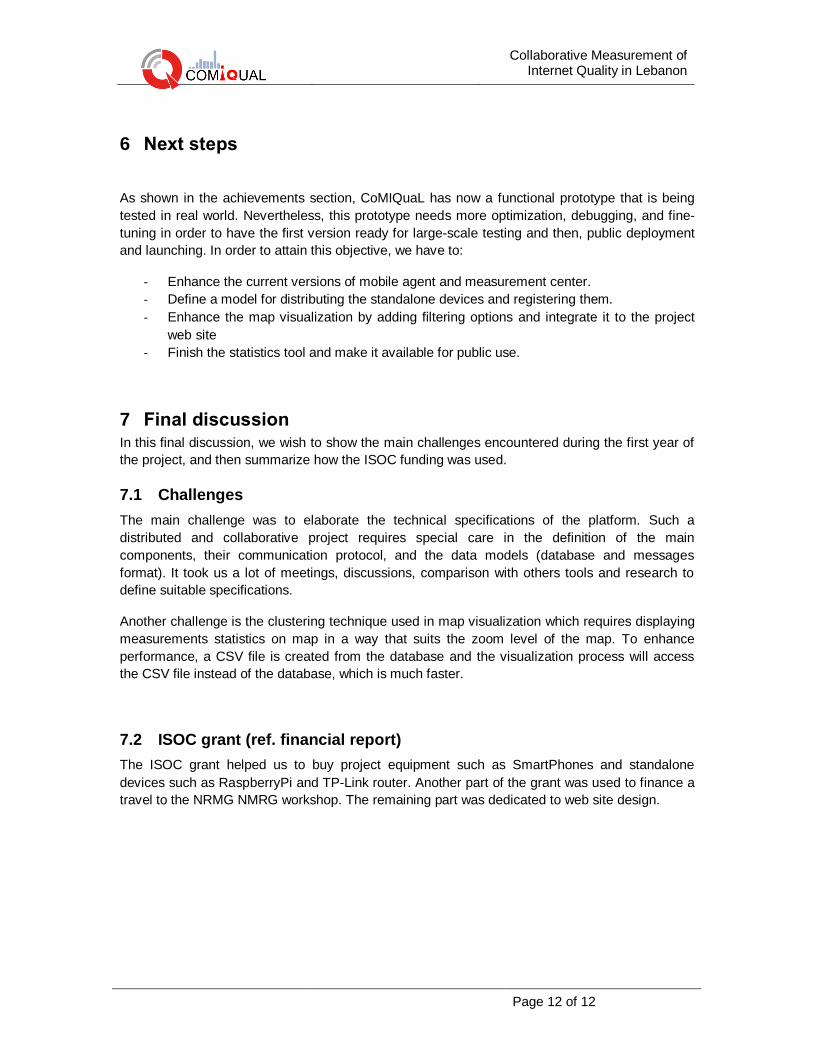
We have had several opportunities to expose our project and get
others feedback and comments:
- We presented the project at “31st NMRG meeting - 1st
NMRG workshop on large scale network measurements”.
o NMRG is a research group of IRTF
- We participated in open source Ma3bar exhibition where
students presented their works within the project and invited
people to test the platform.
- We have had discussions with mobile operators in Lebanon.
Touch operator offered the projected two 3G/4G free
dongles for testing.
Collaborative Measurement of Internet Quality in Lebanon
Page 12 of 12
6 Next steps
As shown in the achievements section, CoMIQuaL has now a functional prototype that is being
tested in real world. Nevertheless, this prototype needs more optimization, debugging, and fine-
tuning in order to have the first version ready for large-scale testing and then, public deployment
and launching. In order to attain this objective, we have to:
- Enhance the current versions of mobile agent and measurement center.
- Define a model for distributing the standalone devices and registering them.
- Enhance the map visualization by adding filtering options and integrate it to the project
web site
- Finish the statistics tool and make it available for public use.
7 Final discussion In this final discussion, we wish to show the main challenges encountered during the first year of
the project, and then summarize how the ISOC funding was used.
7.1 Challenges
The main challenge was to elaborate the technical specifications of the platform. Such a
distributed and collaborative project requires special care in the definition of the main
components, their communication protocol, and the data models (database and messages
format). It took us a lot of meetings, discussions, comparison with others tools and research to
define suitable specifications.
Another challenge is the clustering technique used in map visualization which requires displaying
measurements statistics on map in a way that suits the zoom level of the map. To enhance
performance, a CSV file is created from the database and the visualization process will access
the CSV file instead of the database, which is much faster.
7.2 ISOC grant (ref. financial report)
The ISOC grant helped us to buy project equipment such as SmartPhones and standalone
devices such as RaspberryPi and TP-Link router. Another part of the grant was used to finance a
travel to the NRMG NMRG workshop. The remaining part was dedicated to web site design.